UNITED STATES
SECURITIES AND EXCHANGE COMMISSION
Washington, D.C. 20549
FORM N-CSR
CERTIFIED SHAREHOLDER REPORT OF REGISTERED
MANAGEMENT INVESTMENT COMPANIES
Investment Company Act file number 811-3785
Fidelity Advisor Series I
(Exact name of registrant as specified in charter)
245 Summer St., Boston, Massachusetts 02210
(Address of principal executive offices) (Zip code)
Marc Bryant, Secretary
245 Summer St.
Boston, Massachusetts 02210
(Name and address of agent for service)
Registrant's telephone number, including area code:
617-563-7000
Date of fiscal year end: | November 30 |
|
|
Date of reporting period: | November 30, 2015 |
This report on Form N-CSR relates solely to the Registrant’s Fidelity Advisor Dividend Growth Fund, Fidelity Advisor Equity Growth Fund, Fidelity Advisor Equity Income Fund, Fidelity Advisor Equity Value Fund, Fidelity Advisor Growth & Income Fund, Fidelity Advisor Growth Opportunities Fund, Fidelity Advisor Large Cap Fund, Fidelity Advisor Series Equity Growth Fund, Fidelity Advisor Series Growth Opportunities Fund, Fidelity Advisor Series Small Cap Fund, Fidelity Advisor Small Cap Fund, Fidelity Advisor Stock Selector Mid Cap Fund, and Fidelity Advisor Value Strategies Fund series (each, a “Fund” and collectively, the “Funds”).
Item 1.
Reports to Stockholders
Fidelity® Value Strategies Fund - Class K Annual Report November 30, 2015 (A class of Fidelity Advisor® Value Strategies Fund) |
 |
Contents
Board Approval of Investment Advisory Contracts and Management Fees |
To view a fund's proxy voting guidelines and proxy voting record for the 12-month period ended June 30, visit http://www.fidelity.com/proxyvotingresults or visit the Securities and Exchange Commission's (SEC) web site at http://www.sec.gov.
You may also call 1-800-835-5092 to request a free copy of the proxy voting guidelines.
Standard & Poor's, S&P and S&P 500 are registered service marks of The McGraw-Hill Companies, Inc. and have been licensed for use by Fidelity Distributors Corporation.
Other third-party marks appearing herein are the property of their respective owners.
All other marks appearing herein are registered or unregistered trademarks or service marks of FMR LLC or an affiliated company. © 2016 FMR LLC. All rights reserved.
This report and the financial statements contained herein are submitted for the general information of the shareholders of the Fund. This report is not authorized for distribution to prospective investors in the Fund unless preceded or accompanied by an effective prospectus.
A fund files its complete schedule of portfolio holdings with the SEC for the first and third quarters of each fiscal year on Form N-Q. Forms N-Q are available on the SEC’s web site at http://www.sec.gov. A fund's Forms N-Q may be reviewed and copied at the SEC’s Public Reference Room in Washington, DC. Information regarding the operation of the SEC's Public Reference Room may be obtained by calling 1-800-SEC-0330.
For a complete list of a fund's portfolio holdings, view the most recent holdings listing, semiannual report, or annual report on Fidelity's web site at http://www.fidelity.com, http://www.advisor.fidelity.com, or http://www.401k.com, as applicable.
NOT FDIC INSURED •MAY LOSE VALUE •NO BANK GUARANTEE
Neither the Fund nor Fidelity Distributors Corporation is a bank.
Performance: The Bottom Line
Average annual total return reflects the change in the value of an investment, assuming reinvestment of distributions from dividend income and capital gains (the profits earned upon the sale of securities that have grown in value, if any) and assuming a constant rate of performance each year.
The hypothetical investment and the average annual total returns do not reflect the deduction of taxes that a shareholder would pay on fund distributions or the redemption of fund shares.
During periods of reimbursement by Fidelity, a fund’s total return will be greater than it would be had the reimbursement not occurred.
How a fund did yesterday is no guarantee of how it will do tomorrow.
Average Annual Total Returns
| For the periods ended November 30, 2015 | Past 1 year | Past 5 years | Past 10 years |
| Class K | 1.51% | 12.10% | 7.28% |
The initial offering of Fidelity® Value Strategies Fund - Class K shares took place on May 9, 2008. Returns prior to May 9, 2008 are those of Fidelity® Value Strategies Fund, the original class of the fund.
$10,000 Over 10 Years
Let's say hypothetically that $10,000 was invested in Fidelity® Value Strategies Fund - Class K on November 30, 2005.
The chart shows how the value of your investment would have changed, and also shows how the Russell Midcap® Value Index performed over the same period.
See previous page for additional information regarding the performance of Class K.
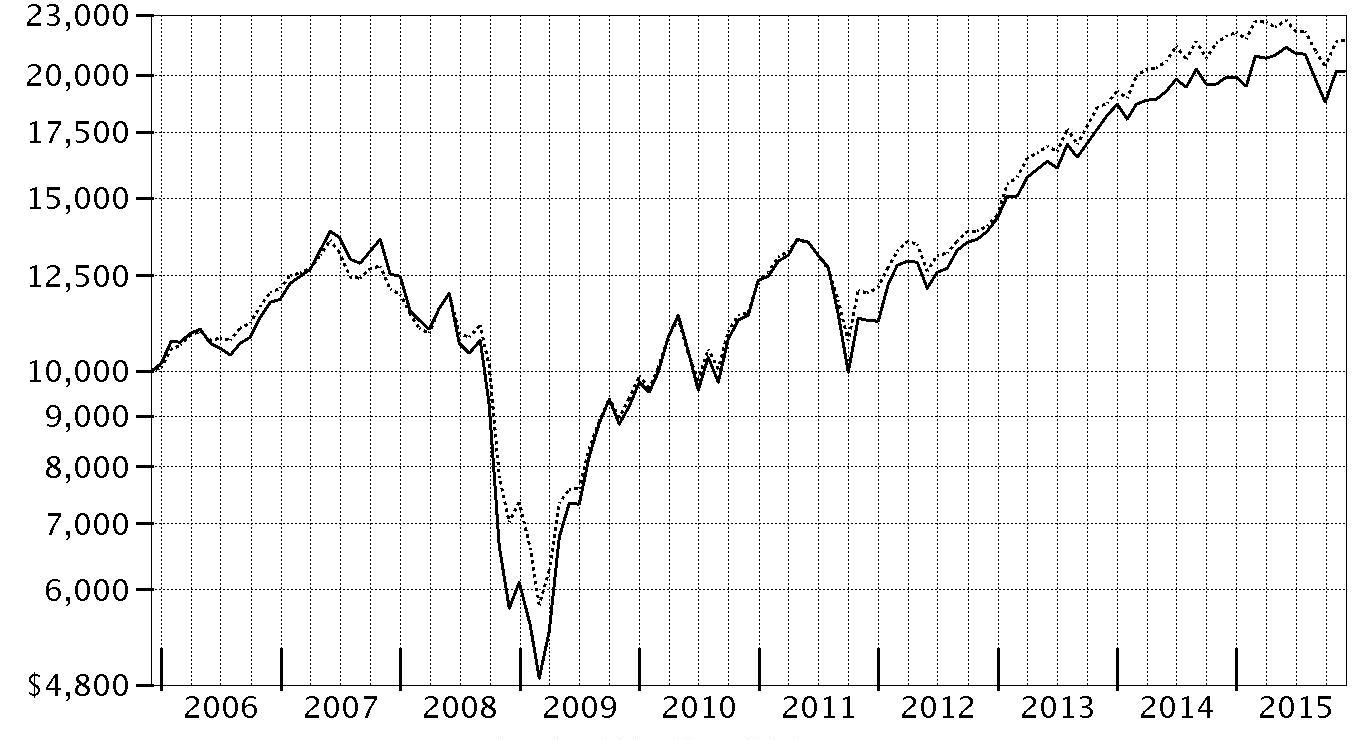
| Period Ending Values | ||
| $20,184 | Fidelity® Value Strategies Fund - Class K | |
| $21,688 | Russell Midcap® Value Index | |
Management's Discussion of Fund Performance
Market Recap: U.S. stocks gained modestly for the 12 months ending November 30, 2015, despite a steep decline in August and September on concern about slowing economic growth in China. The S&P 500® index rebounded in October and gained 2.75% for the year. Stocks benefited late in the period amid waning expectations for a near-term interest-rate hike by the U.S. Federal Reserve, more economic stimulus in Europe and an interest-rate cut in China. Growth stocks in the benchmark far outpaced their value counterparts, as investors continued to seek growth in a subpar economic environment. Sector performance varied widely, with more than 26 percentage points separating the leader from the laggard. Consumer discretionary (+14%) secured the top spot, benefiting from a combination of rising personal income and still-benign inflation. Information technology (+7%) and health care (+4%) also outpaced the broad market. Conversely, the energy sector (-12%) performed worst, stymied by depressed commodity prices that also hit materials (-5%). Telecommunication services (-5%) and utilities (-4%), considered defensive sectors less sensitive to the economy, also lost ground. At period end, investors remained focused on the potential global implications of a stronger U.S. dollar and how China’s transition toward a consumption-led economy may affect corporate earnings.Comments from Portfolio Manager Tom Soviero: For the year, the fund’s share classes (excluding sales charges, if applicable) gained modestly, beating the -1.00% return of the benchmark Russell Midcap® Value Index. Security selection drove performance versus the benchmark, especially picks in the consumer discretionary, materials and energy sectors. Underweighting energy also helped. Our biggest individual contributor was top holding LyondellBasell Industries, a Netherlands-based multinational plastics, chemicals and refining company dependent on natural-gas derivatives. Although Lyondell lost its cost advantage when oil prices plunged early in the period, the quality of its assets and strong free cash flow lifted the stock. Another standout was Cott, which bought a water company, diluting its dependence on carbonated beverages and boosting its earnings-growth prospects. Additionally, the fund’s foreign holdings bolstered performance despite the stronger U.S. dollar. By contrast, stock picks in information technology and health care, as well as a sizable underweighting in financials, detracted. Disappointments included Micron Technology, a semiconductor company hurt by more capacity coming online as industry demand slowed. Lastly, not owning for-profit health insurer and index component Cigna hurt. Lyondell, Cott and Micron were all non-index holdings.The views expressed above reflect those of the portfolio manager(s) only through the end of the period as stated on the cover of this report and do not necessarily represent the views of Fidelity or any other person in the Fidelity organization. Any such views are subject to change at any time based upon market or other conditions and Fidelity disclaims any responsibility to update such views. These views may not be relied on as investment advice and, because investment decisions for a Fidelity fund are based on numerous factors, may not be relied on as an indication of trading intent on behalf of any Fidelity fund.
Investment Summary (Unaudited)
Top Ten Stocks as of November 30, 2015
| % of fund's net assets | % of fund's net assets 6 months ago | |
| LyondellBasell Industries NV Class A | 6.5 | 5.3 |
| Bank of America Corp. | 4.1 | 3.6 |
| Apple, Inc. | 3.4 | 4.8 |
| General Motors Co. | 3.3 | 3.0 |
| Citigroup, Inc. | 3.0 | 0.8 |
| Delphi Automotive PLC | 3.0 | 4.1 |
| U.S. Bancorp | 2.7 | 2.4 |
| Cott Corp. | 2.6 | 2.2 |
| Universal Health Services, Inc. Class B | 2.4 | 2.3 |
| Boston Scientific Corp. | 2.3 | 2.1 |
| 33.3 |
Top Five Market Sectors as of November 30, 2015
| % of fund's net assets | % of fund's net assets 6 months ago | |
| Consumer Discretionary | 19.8 | 23.0 |
| Financials | 15.2 | 12.8 |
| Health Care | 14.5 | 16.3 |
| Materials | 10.0 | 8.6 |
| Information Technology | 8.1 | 13.7 |
Asset Allocation (% of fund's net assets)
| As of November 30, 2015 * | ||
| Stocks | 88.9% | |
| Bonds | 0.1% | |
| Short-Term Investments and Net Other Assets (Liabilities) | 11.0% | |

* Foreign investments - 15.9%
| As of May 31, 2015 * | ||
| Stocks | 97.1% | |
| Bonds | 0.5% | |
| Short-Term Investments and Net Other Assets (Liabilities) | 2.4% | |

* Foreign investments - 17.5%
Investments November 30, 2015
Showing Percentage of Net Assets
| Common Stocks - 88.9% | |||
| Shares | Value (000s) | ||
| CONSUMER DISCRETIONARY - 19.8% | |||
| Auto Components - 3.3% | |||
| Delphi Automotive PLC | 474,177 | $41,671 | |
| Tenneco, Inc. (a) | 90,224 | 4,861 | |
| 46,532 | |||
| Automobiles - 3.3% | |||
| General Motors Co. | 1,284,836 | 46,511 | |
| Diversified Consumer Services - 1.3% | |||
| Service Corp. International | 691,750 | 19,265 | |
| Hotels, Restaurants & Leisure - 2.0% | |||
| Cedar Fair LP (depositary unit) | 227,420 | 12,808 | |
| Wyndham Worldwide Corp. | 199,867 | 15,174 | |
| 27,982 | |||
| Household Durables - 4.1% | |||
| CalAtlantic Group, Inc. | 527,581 | 22,211 | |
| Lennar Corp. Class A (b) | 424,700 | 21,749 | |
| PulteGroup, Inc. | 744,504 | 14,503 | |
| 58,463 | |||
| Leisure Products - 3.1% | |||
| Hasbro, Inc. | 266,797 | 19,500 | |
| Vista Outdoor, Inc. (a) | 557,700 | 24,567 | |
| 44,067 | |||
| Media - 1.1% | |||
| Omnicom Group, Inc. | 120,112 | 8,879 | |
| Regal Entertainment Group Class A (b) | 330,800 | 6,203 | |
| 15,082 | |||
| Specialty Retail - 1.4% | |||
| Asbury Automotive Group, Inc. (a) | 111,241 | 8,354 | |
| GameStop Corp. Class A (b) | 313,213 | 10,972 | |
| 19,326 | |||
| Textiles, Apparel & Luxury Goods - 0.2% | |||
| PVH Corp. | 36,500 | 3,332 | |
| TOTAL CONSUMER DISCRETIONARY | 280,560 | ||
| CONSUMER STAPLES - 5.9% | |||
| Beverages - 2.6% | |||
| Cott Corp. | 3,511,564 | 36,787 | |
| Food & Staples Retailing - 1.6% | |||
| CVS Health Corp. | 237,100 | 22,309 | |
| Food Products - 0.9% | |||
| Calavo Growers, Inc. | 232,028 | 13,128 | |
| Household Products - 0.8% | |||
| Procter & Gamble Co. | 142,100 | 10,635 | |
| TOTAL CONSUMER STAPLES | 82,859 | ||
| ENERGY - 3.3% | |||
| Energy Equipment & Services - 0.5% | |||
| Halliburton Co. | 183,600 | 7,316 | |
| Oil, Gas & Consumable Fuels - 2.8% | |||
| ConocoPhillips Co. | 117,100 | 6,329 | |
| EP Energy Corp. (a)(b) | 274,600 | 1,554 | |
| HollyFrontier Corp. | 76,400 | 3,673 | |
| Kinder Morgan, Inc. | 170,400 | 4,016 | |
| Valero Energy Corp. | 327,300 | 23,520 | |
| 39,092 | |||
| TOTAL ENERGY | 46,408 | ||
| FINANCIALS - 15.2% | |||
| Banks - 13.9% | |||
| Bank of America Corp. | 3,355,213 | 58,481 | |
| CIT Group, Inc. | 157,349 | 6,760 | |
| Citigroup, Inc. | 796,323 | 43,073 | |
| JPMorgan Chase & Co. | 314,200 | 20,951 | |
| Regions Financial Corp. | 778,163 | 7,891 | |
| U.S. Bancorp | 862,484 | 37,854 | |
| Wells Fargo & Co. | 377,370 | 20,793 | |
| 195,803 | |||
| Capital Markets - 0.6% | |||
| PJT Partners, Inc. (a) | 6,685 | 157 | |
| The Blackstone Group LP | 267,400 | 8,351 | |
| 8,508 | |||
| Insurance - 0.7% | |||
| AFLAC, Inc. | 158,186 | 10,320 | |
| TOTAL FINANCIALS | 214,631 | ||
| HEALTH CARE - 14.5% | |||
| Health Care Equipment & Supplies - 5.5% | |||
| Alere, Inc. (a) | 172,283 | 7,110 | |
| Boston Scientific Corp. (a) | 1,785,400 | 32,637 | |
| St. Jude Medical, Inc. | 463,300 | 29,234 | |
| Zimmer Biomet Holdings, Inc. | 87,600 | 8,848 | |
| 77,829 | |||
| Health Care Providers & Services - 3.2% | |||
| DaVita HealthCare Partners, Inc. (a) | 158,496 | 11,577 | |
| Universal Health Services, Inc. Class B | 278,914 | 33,894 | |
| 45,471 | |||
| Life Sciences Tools & Services - 0.8% | |||
| PerkinElmer, Inc. | 207,500 | 11,031 | |
| Pharmaceuticals - 5.0% | |||
| Johnson & Johnson | 187,800 | 19,013 | |
| Merck & Co., Inc. | 390,800 | 20,716 | |
| Sanofi SA sponsored ADR | 720,344 | 31,854 | |
| 71,583 | |||
| TOTAL HEALTH CARE | 205,914 | ||
| INDUSTRIALS - 7.7% | |||
| Aerospace & Defense - 4.6% | |||
| Esterline Technologies Corp. (a) | 180,022 | 17,116 | |
| Honeywell International, Inc. | 139,500 | 14,501 | |
| Orbital ATK, Inc. | 278,850 | 23,956 | |
| Textron, Inc. | 223,717 | 9,546 | |
| 65,119 | |||
| Machinery - 1.8% | |||
| Deere & Co. (b) | 164,900 | 13,121 | |
| Ingersoll-Rand PLC | 208,100 | 12,209 | |
| 25,330 | |||
| Road & Rail - 0.6% | |||
| Hertz Global Holdings, Inc. (a) | 557,200 | 8,837 | |
| Trading Companies & Distributors - 0.7% | |||
| Aircastle Ltd. | 467,200 | 9,793 | |
| TOTAL INDUSTRIALS | 109,079 | ||
| INFORMATION TECHNOLOGY - 8.1% | |||
| IT Services - 0.7% | |||
| Fidelity National Information Services, Inc. | 165,730 | 10,552 | |
| Semiconductors & Semiconductor Equipment - 2.3% | |||
| Cypress Semiconductor Corp. (b) | 1,507,475 | 16,311 | |
| Micron Technology, Inc. (a) | 559,183 | 8,908 | |
| ON Semiconductor Corp. (a) | 646,970 | 7,091 | |
| 32,310 | |||
| Software - 1.7% | |||
| Microsoft Corp. | 429,324 | 23,334 | |
| Technology Hardware, Storage & Peripherals - 3.4% | |||
| Apple, Inc. | 407,860 | 48,250 | |
| TOTAL INFORMATION TECHNOLOGY | 114,446 | ||
| MATERIALS - 10.0% | |||
| Chemicals - 8.8% | |||
| Ashland, Inc. | 83,100 | 9,361 | |
| Axiall Corp. | 284,126 | 5,921 | |
| LyondellBasell Industries NV Class A | 965,892 | 92,551 | |
| PPG Industries, Inc. | 154,592 | 16,347 | |
| 124,180 | |||
| Containers & Packaging - 1.2% | |||
| WestRock Co. | 347,900 | 17,614 | |
| TOTAL MATERIALS | 141,794 | ||
| TELECOMMUNICATION SERVICES - 2.0% | |||
| Diversified Telecommunication Services - 2.0% | |||
| Level 3 Communications, Inc. (a) | 558,139 | 28,370 | |
| UTILITIES - 2.4% | |||
| Independent Power and Renewable Electricity Producers - 1.1% | |||
| Calpine Corp. (a) | 567,563 | 8,389 | |
| Dynegy, Inc. (a) | 441,400 | 7,115 | |
| 15,504 | |||
| Multi-Utilities - 1.3% | |||
| Sempra Energy | 179,639 | 17,826 | |
| TOTAL UTILITIES | 33,330 | ||
| TOTAL COMMON STOCKS | |||
| (Cost $794,484) | 1,257,391 | ||
| Principal Amount (000s) | Value (000s) | ||
| Nonconvertible Bonds - 0.1% | |||
| ENERGY - 0.1% | |||
| Oil, Gas & Consumable Fuels - 0.1% | |||
| Peabody Energy Corp. 6.25% 11/15/21 (Cost $14,230) | 15,405 | 2,426 | |
| Shares | Value (000s) | ||
| Money Market Funds - 3.8% | |||
| Fidelity Cash Central Fund, 0.18% (c) | 23,178,091 | 23,178 | |
| Fidelity Securities Lending Cash Central Fund, 0.22% (c)(d) | 30,384,778 | 30,385 | |
| TOTAL MONEY MARKET FUNDS | |||
| (Cost $53,563) | 53,563 | ||
| TOTAL INVESTMENT PORTFOLIO - 92.8% | |||
| (Cost $862,277) | 1,313,380 | ||
| NET OTHER ASSETS (LIABILITIES) - 7.2% | 101,256 | ||
| NET ASSETS - 100% | $1,414,636 |
Legend
(a) Non-income producing
(b) Security or a portion of the security is on loan at period end.
(c) Affiliated fund that is generally available only to investment companies and other accounts managed by Fidelity Investments. The rate quoted is the annualized seven-day yield of the fund at period end. A complete unaudited listing of the fund's holdings as of its most recent quarter end is available upon request. In addition, each Fidelity Central Fund's financial statements, which are not covered by the Fund's Report of Independent Registered Public Accounting Firm, are available on the SEC's website or upon request.
(d) Investment made with cash collateral received from securities on loan.
Affiliated Central Funds
Information regarding fiscal year to date income earned by the Fund from investments in Fidelity Central Funds is as follows:
| Fund | Income earned |
| (Amounts in thousands) | |
| Fidelity Cash Central Fund | $50 |
| Fidelity Securities Lending Cash Central Fund | 791 |
| Total | $841 |
Investment Valuation
The following is a summary of the inputs used, as of November 30, 2015, involving the Fund's assets and liabilities carried at fair value. The inputs or methodology used for valuing securities may not be an indication of the risk associated with investing in those securities. For more information on valuation inputs, and their aggregation into the levels used below, please refer to the Investment Valuation section in the accompanying Notes to Financial Statements.
| Valuation Inputs at Reporting Date: | ||||
| Description | Total | Level 1 | Level 2 | Level 3 |
| (Amounts in thousands) | ||||
| Investments in Securities: | ||||
| Equities: | ||||
| Consumer Discretionary | $280,560 | $280,560 | $-- | $-- |
| Consumer Staples | 82,859 | 82,859 | -- | -- |
| Energy | 46,408 | 46,408 | -- | -- |
| Financials | 214,631 | 214,631 | -- | -- |
| Health Care | 205,914 | 205,914 | -- | -- |
| Industrials | 109,079 | 109,079 | -- | -- |
| Information Technology | 114,446 | 114,446 | -- | -- |
| Materials | 141,794 | 141,794 | -- | -- |
| Telecommunication Services | 28,370 | 28,370 | -- | -- |
| Utilities | 33,330 | 33,330 | -- | -- |
| Corporate Bonds | 2,426 | -- | 2,426 | -- |
| Money Market Funds | 53,563 | 53,563 | -- | -- |
| Total Investments in Securities: | $1,313,380 | $1,310,954 | $2,426 | $-- |
Other Information
Distribution of investments by country or territory of incorporation, as a percentage of Total Net Assets, is as follows (Unaudited):
| United States of America | 84.1% |
| Netherlands | 6.5% |
| Bailiwick of Jersey | 3.0% |
| Canada | 2.6% |
| France | 2.2% |
| Others (Individually Less Than 1%) | 1.6% |
| 100.0% |
See accompanying notes which are an integral part of the financial statements.
Financial Statements
Statement of Assets and Liabilities
| Amounts in thousands (except per-share amounts) | November 30, 2015 | |
| Assets | ||
| Investment in securities, at value (including securities loaned of $29,334) — See accompanying schedule: Unaffiliated issuers (cost $808,714) | $1,259,817 | |
| Fidelity Central Funds (cost $53,563) | 53,563 | |
| Total Investments (cost $862,277) | $1,313,380 | |
| Receivable for investments sold | 379 | |
| Receivable for fund shares sold | 131,840 | |
| Dividends receivable | 2,389 | |
| Interest receivable | 43 | |
| Distributions receivable from Fidelity Central Funds | 52 | |
| Prepaid expenses | 3�� | |
| Other receivables | 13 | |
| Total assets | 1,448,099 | |
| Liabilities | ||
| Payable for fund shares redeemed | $2,215 | |
| Accrued management fee | 358 | |
| Distribution and service plan fees payable | 211 | |
| Other affiliated payables | 250 | |
| Other payables and accrued expenses | 44 | |
| Collateral on securities loaned, at value | 30,385 | |
| Total liabilities | 33,463 | |
| Net Assets | $1,414,636 | |
| Net Assets consist of: | ||
| Paid in capital | $1,086,894 | |
| Undistributed net investment income | 12,741 | |
| Accumulated undistributed net realized gain (loss) on investments and foreign currency transactions | (136,102) | |
| Net unrealized appreciation (depreciation) on investments and assets and liabilities in foreign currencies | 451,103 | |
| Net Assets | $1,414,636 | |
| Calculation of Maximum Offering Price | ||
| Class A: | ||
| Net Asset Value and redemption price per share ($215,141 ÷ 5,514.662 shares) | $39.01 | |
| Maximum offering price per share (100/94.25 of $39.01) | $41.39 | |
| Class T: | ||
| Net Asset Value and redemption price per share ($294,097 ÷ 7,279.753 shares) | $40.40 | |
| Maximum offering price per share (100/96.50 of $40.40) | $41.87 | |
| Class B: | ||
| Net Asset Value and offering price per share ($3,911 ÷ 110.061 shares)(a) | $35.53 | |
| Class C: | ||
| Net Asset Value and offering price per share ($49,140 ÷ 1,399.392 shares)(a) | $35.12 | |
| Fidelity Value Strategies Fund: | ||
| Net Asset Value, offering price and redemption price per share ($715,837 ÷ 16,373.120 shares) | $43.72 | |
| Class K: | ||
| Net Asset Value, offering price and redemption price per share ($71,635 ÷ 1,637.769 shares) | $43.74 | |
| Class I: | ||
| Net Asset Value, offering price and redemption price per share ($64,875 ÷ 1,555.559 shares) | $41.71 |
(a) Redemption price per share is equal to net asset value less any applicable contingent deferred sales charge.
See accompanying notes which are an integral part of the financial statements.
Statement of Operations
| Amounts in thousands | Year ended November 30, 2015 | |
| Investment Income | ||
| Dividends | $24,333 | |
| Interest | 1,276 | |
| Income from Fidelity Central Funds | 841 | |
| Total income | 26,450 | |
| Expenses | ||
| Management fee | ||
| Basic fee | $7,974 | |
| Performance adjustment | (1,933) | |
| Transfer agent fees | 2,877 | |
| Distribution and service plan fees | 2,725 | |
| Accounting and security lending fees | 465 | |
| Custodian fees and expenses | 15 | |
| Independent trustees' compensation | 6 | |
| Registration fees | 109 | |
| Audit | 65 | |
| Legal | 6 | |
| Miscellaneous | 11 | |
| Total expenses before reductions | 12,320 | |
| Expense reductions | (77) | 12,243 |
| Net investment income (loss) | 14,207 | |
| Realized and Unrealized Gain (Loss) | ||
| Net realized gain (loss) on: | ||
| Investment securities: | ||
| Unaffiliated issuers | 117,277 | |
| Foreign currency transactions | 14 | |
| Total net realized gain (loss) | 117,291 | |
| Change in net unrealized appreciation (depreciation) on: Investment securities | (113,534) | |
| Assets and liabilities in foreign currencies | 3 | |
| Total change in net unrealized appreciation (depreciation) | (113,531) | |
| Net gain (loss) | 3,760 | |
| Net increase (decrease) in net assets resulting from operations | $17,967 |
See accompanying notes which are an integral part of the financial statements.
Statement of Changes in Net Assets
| Amounts in thousands | Year ended November 30, 2015 | Year ended November 30, 2014 |
| Increase (Decrease) in Net Assets | ||
| Operations | ||
| Net investment income (loss) | $14,207 | $12,033 |
| Net realized gain (loss) | 117,291 | 6,319 |
| Change in net unrealized appreciation (depreciation) | (113,531) | 112,825 |
| Net increase (decrease) in net assets resulting from operations | 17,967 | 131,177 |
| Distributions to shareholders from net investment income | (11,929) | (10,331) |
| Distributions to shareholders from net realized gain | (1,090) | – |
| Total distributions | (13,019) | (10,331) |
| Share transactions - net increase (decrease) | (175,423) | (53,813) |
| Total increase (decrease) in net assets | (170,475) | 67,033 |
| Net Assets | ||
| Beginning of period | 1,585,111 | 1,518,078 |
| End of period (including undistributed net investment income of $12,741 and undistributed net investment income of $11,706, respectively) | $1,414,636 | $1,585,111 |
See accompanying notes which are an integral part of the financial statements.
Financial Highlights — Fidelity Advisor Value Strategies Fund Class A
| November 30, | |||||
| Years ended November 30, | 2015 | 2014 | 2013 | 2012 | 2011 |
| Selected Per–Share Data | |||||
| Net asset value, beginning of period | $38.91 | $36.02 | $27.62 | $22.71 | $23.11 |
| Income from Investment Operations | |||||
| Net investment income (loss)A | .35 | .25 | .23 | –B | .13C |
| Net realized and unrealized gain (loss) | .06 | 2.87 | 8.25 | 5.03 | (.49) |
| Total from investment operations | .41 | 3.12 | 8.48 | 5.03 | (.36) |
| Distributions from net investment income | (.28)D | (.23) | (.08) | (.12) | (.03)D |
| Distributions from net realized gain | (.03)D | – | – | – | (.01)D |
| Total distributions | (.31) | (.23) | (.08) | (.12) | (.04) |
| Net asset value, end of period | $39.01 | $38.91 | $36.02 | $27.62 | $22.71 |
| Total ReturnE,F | 1.07% | 8.74% | 30.77% | 22.29% | (1.57)% |
| Ratios to Average Net AssetsG,H | |||||
| Expenses before reductions | .93% | .96% | 1.04% | 1.21% | 1.18% |
| Expenses net of fee waivers, if any | .93% | .96% | 1.04% | 1.21% | 1.18% |
| Expenses net of all reductions | .93% | .96% | 1.03% | 1.21% | 1.17% |
| Net investment income (loss) | .89% | .68% | .73% | - %B | .51%C |
| Supplemental Data | |||||
| Net assets, end of period (in millions) | $215 | $233 | $243 | $203 | $190 |
| Portfolio turnover rateI | 9% | 6% | 22% | 23% | 34% |
A Calculated based on average shares outstanding during the period.
B Investment income per share reflects a large, non-recurring dividend which amounted to $.07 per share. Excluding this non-recurring dividend, the ratio of net investment income (loss) to average net assets would have been (.28) %.
C Investment income per share reflects a large, non-recurring dividend which amounted to $.16 per share. Excluding this non-recurring dividend, the ratio of net investment income (loss) to average net assets would have been (.11) %.
D The amounts shown reflect certain reclassifications related to book to tax differences that were made in the year shown.
E Total returns would have been lower if certain expenses had not been reduced during the applicable periods shown.
F Total returns do not include the effect of the sales charges.
G Fees and expenses of any underlying Fidelity Central Funds are not included in the Fund's expense ratio. The Fund indirectly bears its proportionate share of the expenses of any underlying Fidelity Central Funds.
H Expense ratios reflect operating expenses of the class. Expenses before reductions do not reflect amounts reimbursed by the investment adviser or reductions from brokerage service arrangements or reductions from other expense offset arrangements and do not represent the amount paid by the class during periods when reimbursements or reductions occur. Expenses net of fee waivers reflect expenses after reimbursement by the investment adviser but prior to reductions from brokerage service arrangements or other expense offset arrangements. Expenses net of all reductions represent the net expenses paid by the class.
I Amount does not include the portfolio activity of any underlying Fidelity Central Funds.
See accompanying notes which are an integral part of the financial statements.
Financial Highlights — Fidelity Advisor Value Strategies Fund Class T
| November 30, | |||||
| Years ended November 30, | 2015 | 2014 | 2013 | 2012 | 2011 |
| Selected Per–Share Data | |||||
| Net asset value, beginning of period | $40.28 | $37.28 | $28.58 | $23.48 | $23.90 |
| Income from Investment Operations | |||||
| Net investment income (loss)A | .28 | .18 | .18 | (.05)B | .08C |
| Net realized and unrealized gain (loss) | .06 | 2.98 | 8.54 | 5.22 | (.50) |
| Total from investment operations | .34 | 3.16 | 8.72 | 5.17 | (.42) |
| Distributions from net investment income | (.19)D | (.16) | (.02) | (.07) | – |
| Distributions from net realized gain | (.03)D | – | – | – | – |
| Total distributions | (.22) | (.16) | (.02) | (.07) | – |
| Net asset value, end of period | $40.40 | $40.28 | $37.28 | $28.58 | $23.48 |
| Total ReturnE,F | .86% | 8.51% | 30.52% | 22.08% | (1.76)% |
| Ratios to Average Net AssetsG,H | |||||
| Expenses before reductions | 1.15% | 1.17% | 1.23% | 1.38% | 1.35% |
| Expenses net of fee waivers, if any | 1.14% | 1.17% | 1.23% | 1.38% | 1.35% |
| Expenses net of all reductions | 1.14% | 1.17% | 1.22% | 1.38% | 1.35% |
| Net investment income (loss) | .68% | .47% | .54% | (.17)%B | .33%C |
| Supplemental Data | |||||
| Net assets, end of period (in millions) | $294 | $324 | $335 | $283 | $274 |
| Portfolio turnover rateI | 9% | 6% | 22% | 23% | 34% |
A Calculated based on average shares outstanding during the period.
B Investment income per share reflects a large, non-recurring dividend which amounted to $.07 per share. Excluding this non-recurring dividend, the ratio of net investment income (loss) to average net assets would have been (.45) %.
C Investment income per share reflects a large, non-recurring dividend which amounted to $.16 per share. Excluding this non-recurring dividend, the ratio of net investment income (loss) to average net assets would have been (.29) %.
D The amounts shown reflect certain reclassifications related to book to tax differences that were made in the year shown.
E Total returns would have been lower if certain expenses had not been reduced during the applicable periods shown.
F Total returns do not include the effect of the sales charges.
G Fees and expenses of any underlying Fidelity Central Funds are not included in the Fund's expense ratio. The Fund indirectly bears its proportionate share of the expenses of any underlying Fidelity Central Funds.
H Expense ratios reflect operating expenses of the class. Expenses before reductions do not reflect amounts reimbursed by the investment adviser or reductions from brokerage service arrangements or reductions from other expense offset arrangements and do not represent the amount paid by the class during periods when reimbursements or reductions occur. Expenses net of fee waivers reflect expenses after reimbursement by the investment adviser but prior to reductions from brokerage service arrangements or other expense offset arrangements. Expenses net of all reductions represent the net expenses paid by the class.
I Amount does not include the portfolio activity of any underlying Fidelity Central Funds.
See accompanying notes which are an integral part of the financial statements.
Financial Highlights — Fidelity Advisor Value Strategies Fund Class B
| Years ended November 30, | 2015 | 2014 | 2013 | 2012 | 2011 |
| Selected Per–Share Data | |||||
| Net asset value, beginning of period | $35.44 | $32.86 | $25.34 | $20.87 | $21.37 |
| Income from Investment Operations | |||||
| Net investment income (loss)A | .02 | (.05) | (.02) | (.18)B | (.06)C |
| Net realized and unrealized gain (loss) | .07 | 2.63 | 7.54 | 4.65 | (.44) |
| Total from investment operations | .09 | 2.58 | 7.52 | 4.47 | (.50) |
| Distributions from net investment income | – | – | – | – | – |
| Distributions from net realized gain | – | – | – | – | – |
| Total distributions | – | – | – | – | – |
| Net asset value, end of period | $35.53 | $35.44 | $32.86 | $25.34 | $20.87 |
| Total ReturnD,E | .25% | 7.85% | 29.68% | 21.42% | (2.34)% |
| Ratios to Average Net AssetsF,G | |||||
| Expenses before reductions | 1.77% | 1.78% | 1.83% | 1.97% | 1.93% |
| Expenses net of fee waivers, if any | 1.76% | 1.78% | 1.83% | 1.97% | 1.93% |
| Expenses net of all reductions | 1.76% | 1.78% | 1.82% | 1.97% | 1.93% |
| Net investment income (loss) | .06% | (.14)% | (.07)% | (.76)%B | (.25)%C |
| Supplemental Data | |||||
| Net assets, end of period (in millions) | $4 | $7 | $11 | $13 | $16 |
| Portfolio turnover rateH | 9% | 6% | 22% | 23% | 34% |
A Calculated based on average shares outstanding during the period.
B Investment income per share reflects a large, non-recurring dividend which amounted to $.06 per share. Excluding this non-recurring dividend, the ratio of net investment income (loss) to average net assets would have been (1.04) %.
C Investment income per share reflects a large, non-recurring dividend which amounted to $.16 per share. Excluding this non-recurring dividend, the ratio of net investment income (loss) to average net assets would have been (.87) %.
D Total returns would have been lower if certain expenses had not been reduced during the applicable periods shown.
E Total returns do not include the effect of the contingent deferred sales charge.
F Fees and expenses of any underlying Fidelity Central Funds are not included in the Fund's expense ratio. The Fund indirectly bears its proportionate share of the expenses of any underlying Fidelity Central Funds.
G Expense ratios reflect operating expenses of the class. Expenses before reductions do not reflect amounts reimbursed by the investment adviser or reductions from brokerage service arrangements or reductions from other expense offset arrangements and do not represent the amount paid by the class during periods when reimbursements or reductions occur. Expenses net of fee waivers reflect expenses after reimbursement by the investment adviser but prior to reductions from brokerage service arrangements or other expense offset arrangements. Expenses net of all reductions represent the net expenses paid by the class.
H Amount does not include the portfolio activity of any underlying Fidelity Central Funds.
See accompanying notes which are an integral part of the financial statements.
Financial Highlights — Fidelity Advisor Value Strategies Fund Class C
| November 30, | |||||
| Years ended November 30, | 2015 | 2014 | 2013 | 2012 | 2011 |
| Selected Per–Share Data | |||||
| Net asset value, beginning of period | $35.07 | $32.52 | $25.06 | $20.64 | $21.13 |
| Income from Investment Operations | |||||
| Net investment income (loss)A | .05 | (.03) | (.01) | (.17)B | (.05)C |
| Net realized and unrealized gain (loss) | .07 | 2.60 | 7.47 | 4.59 | (.44) |
| Total from investment operations | .12 | 2.57 | 7.46 | 4.42 | (.49) |
| Distributions from net investment income | (.04)D | (.02) | – | – | – |
| Distributions from net realized gain | (.03)D | – | – | – | – |
| Total distributions | (.07) | (.02) | – | – | – |
| Net asset value, end of period | $35.12 | $35.07 | $32.52 | $25.06 | $20.64 |
| Total ReturnE,F | .33% | 7.91% | 29.77% | 21.41% | (2.32)% |
| Ratios to Average Net AssetsG,H | |||||
| Expenses before reductions | 1.70% | 1.72% | 1.78% | 1.95% | 1.92% |
| Expenses net of fee waivers, if any | 1.69% | 1.72% | 1.78% | 1.95% | 1.92% |
| Expenses net of all reductions | 1.69% | 1.72% | 1.77% | 1.95% | 1.92% |
| Net investment income (loss) | .13% | (.08)% | (.02)% | (.75)%B | (.24)%C |
| Supplemental Data | |||||
| Net assets, end of period (in millions) | $49 | $53 | $54 | $43 | $40 |
| Portfolio turnover rateI | 9% | 6% | 22% | 23% | 34% |
A Calculated based on average shares outstanding during the period.
B Investment income per share reflects a large, non-recurring dividend which amounted to $.06 per share. Excluding this non-recurring dividend, the ratio of net investment income (loss) to average net assets would have been (1.02) %.
C Investment income per share reflects a large, non-recurring dividend which amounted to $.16 per share. Excluding this non-recurring dividend, the ratio of net investment income (loss) to average net assets would have been (.86) %.
D The amounts shown reflect certain reclassifications related to book to tax differences that were made in the year shown.
E Total returns would have been lower if certain expenses had not been reduced during the applicable periods shown.
F Total returns do not include the effect of the contingent deferred sales charge.
G Fees and expenses of any underlying Fidelity Central Funds are not included in the Fund's expense ratio. The Fund indirectly bears its proportionate share of the expenses of any underlying Fidelity Central Funds.
H Expense ratios reflect operating expenses of the class. Expenses before reductions do not reflect amounts reimbursed by the investment adviser or reductions from brokerage service arrangements or reductions from other expense offset arrangements and do not represent the amount paid by the class during periods when reimbursements or reductions occur. Expenses net of fee waivers reflect expenses after reimbursement by the investment adviser but prior to reductions from brokerage service arrangements or other expense offset arrangements. Expenses net of all reductions represent the net expenses paid by the class.
I Amount does not include the portfolio activity of any underlying Fidelity Central Funds.
See accompanying notes which are an integral part of the financial statements.
Financial Highlights — Fidelity Advisor Value Strategies Fund
| November 30, | |||||
| Years ended November 30, | 2015 | 2014 | 2013 | 2012 | 2011 |
| Selected Per–Share Data | |||||
| Net asset value, beginning of period | $43.56 | $40.28 | $30.89 | $25.37 | $25.80 |
| Income from Investment Operations | |||||
| Net investment income (loss)A | .51 | .40 | .37 | .09B | .22C |
| Net realized and unrealized gain (loss) | .07 | 3.21 | 9.20 | 5.62 | (.54) |
| Total from investment operations | .58 | 3.61 | 9.57 | 5.71 | (.32) |
| Distributions from net investment income | (.39)D | (.33) | (.18) | (.19) | (.10)D |
| Distributions from net realized gain | (.03)D | – | – | – | (.01)D |
| Total distributions | (.42) | (.33) | (.18) | (.19) | (.11) |
| Net asset value, end of period | $43.72 | $43.56 | $40.28 | $30.89 | $25.37 |
| Total ReturnE | 1.35% | 9.05% | 31.14% | 22.69% | (1.29)% |
| Ratios to Average Net AssetsF,G | |||||
| Expenses before reductions | .67% | .69% | .73% | .89% | .88% |
| Expenses net of fee waivers, if any | .67% | .69% | .73% | .89% | .88% |
| Expenses net of all reductions | .66% | .69% | .72% | .89% | .88% |
| Net investment income (loss) | 1.16% | .95% | 1.03% | .31%B | .80%C |
| Supplemental Data | |||||
| Net assets, end of period (in millions) | $716 | $786 | $681 | $396 | $284 |
| Portfolio turnover rateH | 9% | 6% | 22% | 23% | 34% |
A Calculated based on average shares outstanding during the period.
B Investment income per share reflects a large, non-recurring dividend which amounted to $.08 per share. Excluding this non-recurring dividend, the ratio of net investment income (loss) to average net assets would have been .04%.
C Investment income per share reflects a large, non-recurring dividends which amounted to $.16 per share. Excluding this non-recurring dividend, the ratio of net investment income (loss) to average net assets would have been .18%.
D The amounts shown reflect certain reclassifications related to book to tax differences that were made in the year shown.
E Total returns would have been lower if certain expenses had not been reduced during the applicable periods shown.
F Fees and expenses of any underlying Fidelity Central Funds are not included in the Fund's expense ratio. The Fund indirectly bears its proportionate share of the expenses of any underlying Fidelity Central Funds.
G Expense ratios reflect operating expenses of the class. Expenses before reductions do not reflect amounts reimbursed by the investment adviser or reductions from brokerage service arrangements or reductions from other expense offset arrangements and do not represent the amount paid by the class during periods when reimbursements or reductions occur. Expenses net of fee waivers reflect expenses after reimbursement by the investment adviser but prior to reductions from brokerage service arrangements or other expense offset arrangements. Expenses net of all reductions represent the net expenses paid by the class.
H Amount does not include the portfolio activity of any underlying Fidelity Central Funds.
See accompanying notes which are an integral part of the financial statements.
Financial Highlights — Fidelity Advisor Value Strategies Fund Class K
| November 30, | |||||
| Years ended November 30, | 2015 | 2014 | 2013 | 2012 | 2011 |
| Selected Per–Share Data | |||||
| Net asset value, beginning of period | $43.57 | $40.28 | $30.89 | $25.38 | $25.82 |
| Income from Investment Operations | |||||
| Net investment income (loss)A | .58 | .47 | .43 | .14B | .28C |
| Net realized and unrealized gain (loss) | .07 | 3.20 | 9.18 | 5.61 | (.55) |
| Total from investment operations | .65 | 3.67 | 9.61 | 5.75 | (.27) |
| Distributions from net investment income | (.45)D | (.38) | (.22) | (.24) | (.16)D |
| Distributions from net realized gain | (.03)D | – | – | – | (.01)D |
| Total distributions | (.48) | (.38) | (.22) | (.24) | (.17) |
| Net asset value, end of period | $43.74 | $43.57 | $40.28 | $30.89 | $25.38 |
| Total ReturnE | 1.51% | 9.21% | 31.34% | 22.93% | (1.11)% |
| Ratios to Average Net AssetsF,G | |||||
| Expenses before reductions | .51% | .53% | .58% | .71% | .68% |
| Expenses net of fee waivers, if any | .51% | .53% | .58% | .71% | .68% |
| Expenses net of all reductions | .51% | .53% | .57% | .71% | .68% |
| Net investment income (loss) | 1.31% | 1.11% | 1.18% | .50%B | 1.00%C |
| Supplemental Data | |||||
| Net assets, end of period (in millions) | $72 | $97 | $119 | $70 | $47 |
| Portfolio turnover rateH | 9% | 6% | 22% | 23% | 34% |
A Calculated based on average shares outstanding during the period.
B Investment income per share reflects a large, non-recurring dividend which amounted to $.08 per share. Excluding this non-recurring dividend, the ratio of net investment income (loss) to average net assets would have been .22%.
C Investment income per share reflects a large, non-recurring dividend which amounted to $.16 per share. Excluding this non-recurring dividend, the ratio of net investment income (loss) to average net assets would have been .38%.
D The amounts shown reflect certain reclassifications related to book to tax differences that were made in the year shown.
E Total returns would have been lower if certain expenses had not been reduced during the applicable periods shown.
F Fees and expenses of any underlying Fidelity Central Funds are not included in the Fund's expense ratio. The Fund indirectly bears its proportionate share of the expenses of any underlying Fidelity Central Funds.
G Expense ratios reflect operating expenses of the class. Expenses before reductions do not reflect amounts reimbursed by the investment adviser or reductions from brokerage service arrangements or reductions from other expense offset arrangements and do not represent the amount paid by the class during periods when reimbursements or reductions occur. Expenses net of fee waivers reflect expenses after reimbursement by the investment adviser but prior to reductions from brokerage service arrangements or other expense offset arrangements. Expenses net of all reductions represent the net expenses paid by the class.
H Amount does not include the portfolio activity of any underlying Fidelity Central Funds.
See accompanying notes which are an integral part of the financial statements.
Financial Highlights — Fidelity Advisor Value Strategies Fund Class I
| November 30, | |||||
| Years ended November 30, | 2015 | 2014 | 2013 | 2012 | 2011 |
| Selected Per–Share Data | |||||
| Net asset value, beginning of period | $41.57 | $38.46 | $29.51 | $24.26 | $24.69 |
| Income from Investment Operations | |||||
| Net investment income (loss)A | .48 | .37 | .34 | .08B | .22C |
| Net realized and unrealized gain (loss) | .08 | 3.06 | 8.79 | 5.37 | (.53) |
| Total from investment operations | .56 | 3.43 | 9.13 | 5.45 | (.31) |
| Distributions from net investment income | (.39)D | (.32) | (.18) | (.20) | (.11)D |
| Distributions from net realized gain | (.03)D | – | – | – | (.01)D |
| Total distributions | (.42) | (.32) | (.18) | (.20) | (.12) |
| Net asset value, end of period | $41.71 | $41.57 | $38.46 | $29.51 | $24.26 |
| Total ReturnE | 1.36% | 9.01% | 31.11% | 22.67% | (1.30)% |
| Ratios to Average Net AssetsF,G | |||||
| Expenses before reductions | .68% | .71% | .76% | .90% | .86% |
| Expenses net of fee waivers, if any | .68% | .71% | .76% | .90% | .86% |
| Expenses net of all reductions | .68% | .71% | .75% | .90% | .86% |
| Net investment income (loss) | 1.14% | .93% | 1.00% | .31%B | .82%C |
| Supplemental Data | |||||
| Net assets, end of period (in millions) | $65 | $86 | $74 | $66 | $52 |
| Portfolio turnover rateH | 9% | 6% | 22% | 23% | 34% |
A Calculated based on average shares outstanding during the period.
B Investment income per share reflects a large, non-recurring dividend which amounted to $.08 per share. Excluding this non-recurring dividend, the ratio of net investment income (loss) to average net assets would have been .03%.
C Investment income per share reflects a large, non-recurring dividend which amounted to $.16 per share. Excluding this non-recurring dividend, the ratio of net investment income (loss) to average net assets would have been .20%.
D The amounts shown reflect certain reclassifications related to book to tax differences that were made in the year shown.
E Total returns would have been lower if certain expenses had not been reduced during the applicable periods shown.
F Fees and expenses of any underlying Fidelity Central Funds are not included in the Fund's expense ratio. The Fund indirectly bears its proportionate share of the expenses of any underlying Fidelity Central Funds.
G Expense ratios reflect operating expenses of the class. Expenses before reductions do not reflect amounts reimbursed by the investment adviser or reductions from brokerage service arrangements or reductions from other expense offset arrangements and do not represent the amount paid by the class during periods when reimbursements or reductions occur. Expenses net of fee waivers reflect expenses after reimbursement by the investment adviser but prior to reductions from brokerage service arrangements or other expense offset arrangements. Expenses net of all reductions represent the net expenses paid by the class.
H Amount does not include the portfolio activity of any underlying Fidelity Central Funds.
See accompanying notes which are an integral part of the financial statements.
Notes to Financial Statements
For the period ended November 30, 2015
(Amounts in thousands except percentages)
1. Organization.
Fidelity Advisor Value Strategies Fund (the Fund) is a fund of Fidelity Advisor Series I (the Trust) and is authorized to issue an unlimited number of shares. The Trust is registered under the Investment Company Act of 1940, as amended (the 1940 Act), as an open-end management investment company organized as a Massachusetts business trust. The Fund offers Class A, Class T, Class C, Fidelity Value Strategies Fund, Class K and Class I (formerly Institutional Class) shares, each of which, along with Class B shares, has equal rights as to assets and voting privileges. Class B shares are closed to new accounts and additional purchases, except for exchanges and reinvestments. Each class has exclusive voting rights with respect to matters that affect that class. Class B shares will automatically convert to Class A shares after a holding period of seven years from the initial date of purchase.
2. Investments in Fidelity Central Funds.
The Fund invests in Fidelity Central Funds, which are open-end investment companies generally available only to other investment companies and accounts managed by the investment adviser and its affiliates. The Fund's Schedule of Investments lists each of the Fidelity Central Funds held as of period end, if any, as an investment of the Fund, but does not include the underlying holdings of each Fidelity Central Fund. As an Investing Fund, the Fund indirectly bears its proportionate share of the expenses of the underlying Fidelity Central Funds.
The Money Market Central Funds seek preservation of capital and current income and are managed by Fidelity Investments Money Management, Inc. (FIMM), an affiliate of the investment adviser. Annualized expenses of the Money Market Central Funds as of their most recent shareholder report date are less than .005%.
A complete unaudited list of holdings for each Fidelity Central Fund is available upon request or at the Securities and Exchange Commission (the SEC) website at www.sec.gov. In addition, the financial statements of the Fidelity Central Funds, which are not covered by the Fund's Report of Independent Registered Public Accounting Firm, are available on the SEC website or upon request.
3. Significant Accounting Policies.
The financial statements have been prepared in conformity with accounting principles generally accepted in the United States of America (GAAP), which require management to make certain estimates and assumptions at the date of the financial statements. Actual results could differ from those estimates. Subsequent events, if any, through the date that the financial statements were issued have been evaluated in the preparation of the financial statements. The following summarizes the significant accounting policies of the Fund:
Investment Valuation. Investments are valued as of 4:00 p.m. Eastern time on the last calendar day of the period. The Board of Trustees (the Board) has delegated the day to day responsibility for the valuation of the Fund's investments to the Fidelity Management & Research Company (FMR) Fair Value Committee (the Committee). In accordance with valuation policies and procedures approved by the Board, the Fund attempts to obtain prices from one or more third party pricing vendors or brokers to value its investments. When current market prices, quotations or currency exchange rates are not readily available or reliable, investments will be fair valued in good faith by the Committee, in accordance with procedures adopted by the Board. Factors used in determining fair value vary by investment type and may include market or investment specific events, changes in interest rates and credit quality. The frequency with which these procedures are used cannot be predicted and they may be utilized to a significant extent. The Committee oversees the Fund's valuation policies and procedures and reports to the Board on the Committee's activities and fair value determinations. The Board monitors the appropriateness of the procedures used in valuing the Fund's investments and ratifies the fair value determinations of the Committee.
The Fund categorizes the inputs to valuation techniques used to value its investments into a disclosure hierarchy consisting of three levels as shown below:
- Level 1 – quoted prices in active markets for identical investments
- Level 2 – other significant observable inputs (including quoted prices for similar investments, interest rates, prepayment speeds, etc.)
- Level 3 – unobservable inputs (including the Fund's own assumptions based on the best information available)
Valuation techniques used to value the Fund's investments by major category are as follows:
Equity securities, including restricted securities, for which market quotations are readily available, are valued at the last reported sale price or official closing price as reported by a third party pricing vendor on the primary market or exchange on which they are traded and are categorized as Level 1 in the hierarchy. In the event there were no sales during the day or closing prices are not available, securities are valued at the last quoted bid price or may be valued using the last available price and are generally categorized as Level 2 in the hierarchy. For foreign equity securities, when market or security specific events arise, comparisons to the valuation of American Depositary Receipts (ADRs), futures contracts, Exchange-Traded Funds (ETFs) and certain indexes as well as quoted prices for similar securities may be used and would be categorized as Level 2 in the hierarchy. Utilizing these techniques may result in transfers between Level 1 and Level 2. For equity securities, including restricted securities, where observable inputs are limited, assumptions about market activity and risk are used and these securities may be categorized as Level 3 in the hierarchy.
Debt securities, including restricted securities, are valued based on evaluated prices received from third party pricing vendors or from brokers who make markets in such securities. Corporate bonds are valued by pricing vendors who utilize matrix pricing which considers yield or price of bonds of comparable quality, coupon, maturity and type or by broker-supplied prices. When independent prices are unavailable or unreliable, debt securities may be valued utilizing pricing methodologies which consider similar factors that would be used by third party pricing vendors. Debt securities are generally categorized as Level 2 in the hierarchy but may be Level 3 depending on the circumstances.
Investments in open-end mutual funds, including the Fidelity Central Funds, are valued at their closing net asset value (NAV) each business day and are categorized as Level 1 in the hierarchy.
Changes in valuation techniques may result in transfers in or out of an assigned level within the disclosure hierarchy. The aggregate value of investments by input level as of November 30, 2015, is included at the end of the Fund's Schedule of Investments.
Foreign Currency. The Fund may use foreign currency contracts to facilitate transactions in foreign-denominated securities. Gains and losses from these transactions may arise from changes in the value of the foreign currency or if the counterparties do not perform under the contracts' terms.
Foreign-denominated assets, including investment securities, and liabilities are translated into U.S. dollars at the exchange rates at period end. Purchases and sales of investment securities, income and dividends received and expenses denominated in foreign currencies are translated into U.S. dollars at the exchange rate in effect on the transaction date.
The effects of exchange rate fluctuations on investments are included with the net realized and unrealized gain (loss) on investment securities. Other foreign currency transactions resulting in realized and unrealized gain (loss) are disclosed separately.
Investment Transactions and Income. For financial reporting purposes, the Fund's investment holdings and NAV include trades executed through the end of the last business day of the period. The NAV per share for processing shareholder transactions is calculated as of the close of business of the New York Stock Exchange (NYSE), normally 4:00 p.m. Eastern time and includes trades executed through the end of the prior business day. Gains and losses on securities sold are determined on the basis of identified cost and may include proceeds received from litigation. Dividend income is recorded on the ex-dividend date, except for certain dividends from foreign securities where the ex-dividend date may have passed, which are recorded as soon as the Fund is informed of the ex-dividend date. Non-cash dividends included in dividend income, if any, are recorded at the fair market value of the securities received. Income and capital gain distributions from Fidelity Central Funds, if any, are recorded on the ex-dividend date. Distributions received on securities that represent a return of capital or capital gain are recorded as a reduction of cost of investments and/or as a realized gain. Subsequent to ex-dividend date the Fund determines the components of these distributions, based upon receipt of tax filings or other correspondence relating to the underlying investment. Interest income is accrued as earned and includes coupon interest and amortization of premium and accretion of discount on debt securities as applicable. Investment income is recorded net of foreign taxes withheld where recovery of such taxes is uncertain.
Class Allocations and Expenses. Investment income, realized and unrealized capital gains and losses, common expenses of the Fund, and certain fund-level expense reductions, if any, are allocated daily on a pro-rata basis to each class based on the relative net assets of each class to the total net assets of the Fund. Each class differs with respect to transfer agent and distribution and service plan fees incurred. Certain expense reductions may also differ by class. For the reporting period, the allocated portion of income and expenses to each class as a percent of its average net assets may vary due to the timing of recording these transactions in relation to fluctuating net assets of the classes. Expenses directly attributable to a fund are charged to that fund. Expenses attributable to more than one fund are allocated among the respective funds on the basis of relative net assets or other appropriate methods. Expense estimates are accrued in the period to which they relate and adjustments are made when actual amounts are known.
Income Tax Information and Distributions to Shareholders. Each year, the Fund intends to qualify as a regulated investment company under Subchapter M of the Internal Revenue Code, including distributing substantially all of its taxable income and realized gains. As a result, no provision for U.S. Federal income taxes is required. As of November 30, 2015, the Fund did not have any unrecognized tax benefits in the financial statements; nor is the Fund aware of any tax positions for which it is reasonably possible that the total amounts of unrecognized tax benefits will significantly change in the next twelve months. The Fund files a U.S. federal tax return, in addition to state and local tax returns as required. The Fund's federal income tax returns are subject to examination by the Internal Revenue Service (IRS) for a period of three fiscal years after they are filed. State and local tax returns may be subject to examination for an additional fiscal year depending on the jurisdiction. Foreign taxes are provided for based on the Fund's understanding of the tax rules and rates that exist in the foreign markets in which it invests.
Distributions are declared and recorded on the ex-dividend date. Income dividends and capital gain distributions are declared separately for each class. Income and capital gain distributions are determined in accordance with income tax regulations, which may differ from GAAP. These differences resulted in distribution reclassifications.
Capital accounts within the financial statements are adjusted for permanent book-tax differences. These adjustments have no impact on net assets or the results of operations. Capital accounts are not adjusted for temporary book-tax differences which will reverse in a subsequent period.
Book-tax differences are primarily due to foreign currency transactions, passive foreign investment companies (PFIC), partnerships, market discount, deferred trustees compensation, capital loss carryforwards and losses deferred due to wash sales and tax regulations.
The federal tax cost of investment securities and unrealized appreciation (depreciation) as of period end were as follows:
| Gross unrealized appreciation | $487,259 |
| Gross unrealized depreciation | (37,739) |
| Net unrealized appreciation (depreciation) on securities | $449,520 |
| Tax Cost | $863,860 |
The tax-based components of distributable earnings as of period end were as follows:
| Undistributed ordinary income | $12,594 |
| Capital loss carryforward | $(133,637) |
| Net unrealized appreciation (depreciation) on securities and other investments | $449,520 |
Capital loss carryforwards are only available to offset future capital gains of the Fund to the extent provided by regulations and may be limited. Under the Regulated Investment Company Modernization Act of 2010 (the Act), the Fund is permitted to carry forward capital losses incurred in taxable years beginning after December 22, 2010 for an unlimited period and such capital losses are required to be used prior to any losses that expire. The capital loss carryforward information presented below, including any applicable limitation, is estimated as of fiscal period end and is subject to adjustment.
| Fiscal year of expiration | |
| 2017 | $(133,637) |
The Fund intends to elect to defer to its next fiscal year $734 of capital losses recognized during the period November 1, 2015 to November 30, 2015.
The tax character of distributions paid was as follows:
| November 30, 2015 | November 30, 2014 | |
| Ordinary Income | $13,019 | $ 10,331 |
4. Purchases and Sales of Investments.
Purchases and sales of securities, other than short-term securities, aggregated $129,951 and $350,153, respectively.
5. Fees and Other Transactions with Affiliates.
Management Fee. Fidelity Management & Research Company (the investment adviser) and its affiliates provide the Fund with investment management related services for which the Fund pays a monthly management fee. The management fee is the sum of an individual fund fee rate that is based on an annual rate of .30% of the Fund's average net assets and an annualized group fee rate that averaged .25% during the period. The group fee rate is based upon the average net assets of all the mutual funds advised by the investment adviser, including any mutual funds previously advised by the investment adviser that are currently advised by Fidelity SelectCo, LLC, an affiliate of the investment adviser. The group fee rate decreases as assets under management increase and increases as assets under management decrease. In addition, the management fee is subject to a performance adjustment (up to a maximum of +/- .20% of the Fund's average net assets over a 36 month performance period). The upward or downward adjustment to the management fee is based on the relative investment performance of Fidelity Value Strategies Fund as compared to its benchmark index, the Russell Midcap Value Index, over the same 36 month performance period. For the reporting period, the total annual management fee rate, including the performance adjustment, was .42% of the Fund's average net assets. The performance adjustment included in the management fee rate may be higher or lower than the maximum performance adjustment rate due to the difference between the average net assets for the reporting and performance periods.
Distribution and Service Plan Fees. In accordance with Rule 12b-1 of the 1940 Act, the Fund has adopted separate Distribution and Service Plans for each class of shares. Certain classes pay Fidelity Distributors Corporation (FDC), an affiliate of the investment adviser, separate Distribution and Service Fees, each of which is based on an annual percentage of each class' average net assets. In addition, FDC may pay financial intermediaries for selling shares of the Fund and providing shareholder support services. For the period, the Distribution and Service Fee rates, total fees and amounts retained by FDC were as follows:
| Distribution Fee | Service Fee | Total Fees | Retained by FDC | |
| Class A | -% | .25% | $573 | $5 |
| Class T | .25% | .25% | 1,574 | 12 |
| Class B | .75% | .25% | 56 | 42 |
| Class C | .75% | .25% | 522 | 24 |
| $2,725 | $83 |
Sales Load. FDC may receive a front-end sales charge of up to 5.75% for selling Class A shares and 3.50% for selling Class T shares, some of which is paid to financial intermediaries for selling shares of the Fund. Depending on the holding period, FDC may receive contingent deferred sales charges levied on Class A, Class T, Class B, and Class C redemptions. The deferred sales charges range from 5.00% to 1.00% for Class B shares, 1.00% for Class C shares, 1.00% for certain purchases of Class A shares and .25% for certain purchases of Class T shares.
For the period, sales charge amounts retained by FDC were as follows:
| Retained by FDC | |
| Class A | $21 |
| Class T | 8 |
| Class B(a) | 2 |
| Class C(a) | 2 |
| $33 |
(a) When Class B and Class C shares are initially sold, FDC pays commissions from its own resources to financial intermediaries through which the sales are made.
Transfer Agent Fees. Fidelity Investments Institutional Operations Company, Inc., (FIIOC), an affiliate of the investment adviser, is the transfer, dividend disbursing and shareholder servicing agent for each class of the Fund. FIIOC receives account fees and asset-based fees that vary according to the account size and type of account of the shareholders of the respective classes of the Fund, except for Class K. FIIOC receives an asset-based fee of Class K's average net assets. FIIOC pays for typesetting, printing and mailing of shareholder reports, except proxy statements.
For the period, transfer agent fees for each class were as follows:
| Amount | % of Class-Level Average Net Assets | |
| Class A | $508 | .22 |
| Class T | 583 | .19 |
| Class B | 17 | .30 |
| Class C | 122 | .23 |
| Fidelity Value Strategies Fund | 1,437 | .21 |
| Class K | 37 | .05 |
| Class I | 173 | .22 |
| $2,877 |
Accounting and Security Lending Fees. Fidelity Service Company, Inc. (FSC), an affiliate of the investment adviser, maintains the Fund's accounting records. The accounting fee is based on the level of average net assets for each month. Under a separate contract, FSC administers the security lending program. The security lending fee is based on the number and duration of lending transactions.
Brokerage Commissions. The Fund placed a portion of its portfolio transactions with brokerage firms which are affiliates of the investment adviser. Brokerage commissions are included in net realized gain (loss) and change in net unrealized appreciation (depreciation) in the Statement of Operations. The commissions paid to these affiliated firms were $5 for the period.
6. Committed Line of Credit.
The Fund participates with other funds managed by the investment adviser or an affiliate in a $4.25 billion credit facility (the "line of credit") to be utilized for temporary or emergency purposes to fund shareholder redemptions or for other short-term liquidity purposes. The Fund has agreed to pay commitment fees on its pro-rata portion of the line of credit, which amounted to $2 and is reflected in Miscellaneous expenses on the Statement of Operations. During the period, the Fund did not borrow on this line of credit.
7. Security Lending.
The Fund lends portfolio securities through a lending agent from time to time in order to earn additional income. For equity securities, a lending agent is used and may loan securities to certain qualified borrowers, including Fidelity Capital Markets (FCM), a broker-dealer affiliated with the Fund. On the settlement date of the loan, the Fund receives collateral (in the form of U.S. Treasury obligations, letters of credit and/or cash) against the loaned securities and maintains collateral in an amount not less than 100% of the market value of the loaned securities during the period of the loan. The market value of the loaned securities is determined at the close of business of the Fund and any additional required collateral is delivered to the Fund on the next business day. The Fund or borrower may terminate the loan at any time, and if the borrower defaults on its obligation to return the securities loaned because of insolvency or other reasons, the Fund may apply collateral received from the borrower against the obligation. The Fund may experience delays and costs in recovering the securities loaned. Any cash collateral received is invested in the Fidelity Securities Lending Cash Central Fund. The value of loaned securities and cash collateral at period end are disclosed on the Fund's Statement of Assets and Liabilities. At period end, there were no security loans outstanding with FCM. Security lending income represents the income earned on investing cash collateral, less rebates paid to borrowers and any lending agent fees associated with the loan, plus any premium payments received for lending certain types of securities. Security lending income is presented in the Statement of Operations as a component of income from Fidelity Central Funds. Total security lending income during the period amounted to $791, including $3 from securities loaned to FCM.
8. Expense Reductions.
Commissions paid to certain brokers with whom the investment adviser, or its affiliates, places trades on behalf of the Fund include an amount in addition to trade execution, which may be rebated back to the Fund to offset certain expenses. This amount totaled $39 for the period.
In addition, during the period the investment adviser reimbursed and/or waived a portion of fund-level operating expenses in the amount of $6 and a portion of class-level operating expenses as follows:
| Amount | |
| Class A | $5 |
| Class T | 8 |
| Class B | –(a) |
| Class C | 1 |
| Fidelity Value Strategies Fund | 17 |
| Class I | 1 |
| $32 |
(a) In the amount of less than five hundred dollars.
9. Distributions to Shareholders.
Distributions to shareholders of each class were as follows:
| Years ended November 30, | 2015 | 2014 |
| From net investment income | ||
| Class A | $1,691 | $1,567 |
| Class T | 1,553 | 1,415 |
| Class C | 56 | 32 |
| Fidelity Value Strategies Fund | 6,934 | 5,578 |
| Class K | 896 | 1,131 |
| Class I | 799 | 608 |
| Total | $11,929 | $10,331 |
| From net realized gain | ||
| Class A | $174 | $– |
| Class T | 234 | – |
| Class C | 44 | – |
| Fidelity Value Strategies Fund | 520 | – |
| Class K | 58 | – |
| Class I | 60 | – |
| Total | $1,090 | $– |
10. Share Transactions.
Share transactions for each class were as follows and may contain automatic conversions between classes or exchanges between funds:
| Shares | Shares | Dollars | Dollars | |
| Years ended November 30, | 2015 | 2014 | 2015 | 2014 |
| Class A | ||||
| Shares sold | 391 | 546 | $15,470 | $20,399 |
| Reinvestment of distributions | 46 | 41 | 1,760 | 1,447 |
| Shares redeemed | (904) | (1,342) | (35,567) | (50,201) |
| Net increase (decrease) | (467) | (755) | $(18,337) | $(28,355) |
| Class T | ||||
| Shares sold | 486 | 435 | $19,926 | $16,774 |
| Reinvestment of distributions | 41 | 35 | 1,646 | 1,293 |
| Shares redeemed | (1,296) | (1,420) | (52,610) | (54,916) |
| Net increase (decrease) | (769) | (950) | $(31,038) | $(36,849) |
| Class B | ||||
| Shares sold | – | 1 | $12 | $30 |
| Reinvestment of distributions | – | – | – | – |
| Shares redeemed | (95) | (140) | (3,438) | (4,799) |
| Net increase (decrease) | (95) | (139) | $(3,426) | $(4,769) |
| Class C | ||||
| Shares sold | 131 | 125 | $4,724 | $4,210 |
| Reinvestment of distributions | 3 | 1 | 95 | 29 |
| Shares redeemed | (237) | (282) | (8,407) | (9,502) |
| Net increase (decrease) | (103) | (156) | $(3,588) | $(5,263) |
| Fidelity Value Strategies Fund | ||||
| Shares sold | 3,980 | 7,626 | $174,437 | $315,612 |
| Reinvestment of distributions | 106 | 127 | 4,551 | 4,998 |
| Shares redeemed | (5,750) | (6,627) | (250,149) | (273,372) |
| Net increase (decrease) | (1,664) | 1,126 | $(71,161) | $47,238 |
| Class K | ||||
| Shares sold | 390 | 669 | $17,106 | $27,831 |
| Reinvestment of distributions | 22 | 29 | 954 | 1,131 |
| Shares redeemed | (1,001) | (1,437) | (44,142) | (60,236) |
| Net increase (decrease) | (589) | (739) | $(26,082) | $(31,274) |
| Class I | ||||
| Shares sold | 288 | 522 | $12,081 | $20,905 |
| Reinvestment of distributions | 18 | 14 | 748 | 523 |
| Shares redeemed | (809) | (403) | (34,620) | (15,969) |
| Net increase (decrease) | (503) | 133 | $(21,791) | $5,459 |
11. Other.
The Fund's organizational documents provide former and current trustees and officers with a limited indemnification against liabilities arising in connection with the performance of their duties to the Fund. In the normal course of business, the Fund may also enter into contracts that provide general indemnifications. The Fund's maximum exposure under these arrangements is unknown as this would be dependent on future claims that may be made against the Fund. The risk of material loss from such claims is considered remote.
Report of Independent Registered Public Accounting Firm
To the Trustees of Fidelity Advisor Series I and Shareholders of Fidelity Advisor® Value Strategies Fund:
We have audited the accompanying statement of assets and liabilities of Fidelity Advisor® Value Strategies Fund (the Fund), a fund of Fidelity Advisor Series I, including the schedule of investments, as of November 30, 2015, and the related statement of operations for the year then ended, the statement of changes in net assets for each of the two years in the period then ended, and the financial highlights for each of the five years in the period then ended. These financial statements and financial highlights are the responsibility of the Fund's management. Our responsibility is to express an opinion on these financial statements and financial highlights based on our audits.
We conducted our audits in accordance with the standards of the Public Company Accounting Oversight Board (United States). Those standards require that we plan and perform the audit to obtain reasonable assurance about whether the financial statements and financial highlights are free of material misstatement. The Fund is not required to have, nor were we engaged to perform, an audit of its internal control over financial reporting. Our audits included consideration of internal control over financial reporting as a basis for designing audit procedures that are appropriate in the circumstances, but not for the purpose of expressing an opinion on the effectiveness of the Fund's internal control over financial reporting. Accordingly, we express no such opinion. An audit also includes examining, on a test basis, evidence supporting the amounts and disclosures in the financial statements, assessing the accounting principles used and significant estimates made by management, as well as evaluating the overall financial statement presentation. Our procedures included confirmation of securities owned as of November 30, 2015, by correspondence with the custodians and brokers. We believe that our audits provide a reasonable basis for our opinion.
In our opinion, such financial statements and financial highlights referred to above present fairly, in all material respects, the financial position of Fidelity Advisor® Value Strategies Fund as of November 30, 2015, the results of its operations for the year then ended, the changes in its net assets for each of the two years in the period then ended, and the financial highlights for each of the five years in the period then ended, in conformity with accounting principles generally accepted in the United States of America.
DELOITTE & TOUCHE LLP
Boston, Massachusetts
January 15, 2016
Trustees and Officers
The Trustees, Members of the Advisory Board (if any), and officers of the trust and fund, as applicable, are listed below. The Board of Trustees governs the fund and is responsible for protecting the interests of shareholders. The Trustees are experienced executives who meet periodically throughout the year to oversee the fund's activities, review contractual arrangements with companies that provide services to the fund, oversee management of the risks associated with such activities and contractual arrangements, and review the fund's performance. Each of the Trustees oversees 170 funds.
The Trustees hold office without limit in time except that (a) any Trustee may resign; (b) any Trustee may be removed by written instrument, signed by at least two-thirds of the number of Trustees prior to such removal; (c) any Trustee who requests to be retired or who has become incapacitated by illness or injury may be retired by written instrument signed by a majority of the other Trustees; and (d) any Trustee may be removed at any special meeting of shareholders by a two-thirds vote of the outstanding voting securities of the trust. Each Trustee who is not an interested person (as defined in the 1940 Act) of the trust and the fund is referred to herein as an Independent Trustee. Each Independent Trustee shall retire not later than the last day of the calendar year in which his or her 75th birthday occurs. The Independent Trustees may waive this mandatory retirement age policy with respect to individual Trustees. Officers and Advisory Board Members hold office without limit in time, except that any officer or Advisory Board Member may resign or may be removed by a vote of a majority of the Trustees at any regular meeting or any special meeting of the Trustees. Except as indicated, each individual has held the office shown or other offices in the same company for the past five years.
The fund’s Statement of Additional Information (SAI) includes more information about the Trustees. To request a free copy, call Fidelity at 1-800-835-5092.
Experience, Skills, Attributes, and Qualifications of the Trustees. The Governance and Nominating Committee has adopted a statement of policy that describes the experience, qualifications, attributes, and skills that are necessary and desirable for potential Independent Trustee candidates (Statement of Policy). The Board believes that each Trustee satisfied at the time he or she was initially elected or appointed a Trustee, and continues to satisfy, the standards contemplated by the Statement of Policy. The Governance and Nominating Committee also engages professional search firms to help identify potential Independent Trustee candidates who have the experience, qualifications, attributes, and skills consistent with the Statement of Policy. From time to time, additional criteria based on the composition and skills of the current Independent Trustees, as well as experience or skills that may be appropriate in light of future changes to board composition, business conditions, and regulatory or other developments, have also been considered by the professional search firms and the Governance and Nominating Committee. In addition, the Board takes into account the Trustees' commitment and participation in Board and committee meetings, as well as their leadership of standing and ad hoc committees throughout their tenure.
In determining that a particular Trustee was and continues to be qualified to serve as a Trustee, the Board has considered a variety of criteria, none of which, in isolation, was controlling. The Board believes that, collectively, the Trustees have balanced and diverse experience, qualifications, attributes, and skills, which allow the Board to operate effectively in governing the fund and protecting the interests of shareholders. Information about the specific experience, skills, attributes, and qualifications of each Trustee, which in each case led to the Board's conclusion that the Trustee should serve (or continue to serve) as a trustee of the fund, is provided below.
Board Structure and Oversight Function. James C. Curvey is an interested person and currently serves as Chairman. The Trustees have determined that an interested Chairman is appropriate and benefits shareholders because an interested Chairman has a personal and professional stake in the quality and continuity of services provided to the fund. Independent Trustees exercise their informed business judgment to appoint an individual of their choosing to serve as Chairman, regardless of whether the Trustee happens to be independent or a member of management. The Independent Trustees have determined that they can act independently and effectively without having an Independent Trustee serve as Chairman and that a key structural component for assuring that they are in a position to do so is for the Independent Trustees to constitute a substantial majority for the Board. The Independent Trustees also regularly meet in executive session. Ned C. Lautenbach serves as Chairman of the Independent Trustees and as such (i) acts as a liaison between the Independent Trustees and management with respect to matters important to the Independent Trustees and (ii) with management prepares agendas for Board meetings.
Fidelity® funds are overseen by different Boards of Trustees. The fund's Board oversees Fidelity's high income and certain equity funds, and other Boards oversee Fidelity's investment-grade bond, money market, asset allocation, and sector funds. The asset allocation funds may invest in Fidelity® funds overseen by the fund's Board. The use of separate Boards, each with its own committee structure, allows the Trustees of each group of Fidelity® funds to focus on the unique issues of the funds they oversee, including common research, investment, and operational issues. On occasion, the separate Boards establish joint committees to address issues of overlapping consequences for the Fidelity® funds overseen by each Board.
The Trustees operate using a system of committees to facilitate the timely and efficient consideration of all matters of importance to the Trustees, the fund, and fund shareholders and to facilitate compliance with legal and regulatory requirements and oversight of the fund's activities and associated risks. The Board, acting through its committees, has charged FMR and its affiliates with (i) identifying events or circumstances the occurrence of which could have demonstrably adverse effects on the fund's business and/or reputation; (ii) implementing processes and controls to lessen the possibility that such events or circumstances occur or to mitigate the effects of such events or circumstances if they do occur; and (iii) creating and maintaining a system designed to evaluate continuously business and market conditions in order to facilitate the identification and implementation processes described in (i) and (ii) above. Because the day-to-day operations and activities of the fund are carried out by or through FMR, its affiliates, and other service providers, the fund's exposure to risks is mitigated but not eliminated by the processes overseen by the Trustees. While each of the Board's committees has responsibility for overseeing different aspects of the fund's activities, oversight is exercised primarily through the Operations, Audit, and Compliance Committees. In addition, the Independent Trustees have worked with FMR to enhance the Board's oversight of investment and financial risks, legal and regulatory risks, technology risks, and operational risks, including the development of additional risk reporting to the Board. For example, a working group comprised of Independent Trustees and FMR has worked and continues to work to review the Fidelity® funds' valuation-related activities, reporting and risk management. Appropriate personnel, including but not limited to the fund's Chief Compliance Officer (CCO), FMR's internal auditor, the independent accountants, the fund's Treasurer and portfolio management personnel, make periodic reports to the Board's committees, as appropriate, including an annual review of Fidelity's risk management program for the Fidelity® funds. The responsibilities of each standing committee, including their oversight responsibilities, are described further under "Standing Committees of the Trustees."
Interested Trustees*:
Correspondence intended for a Trustee who is an interested person may be sent to Fidelity Investments, 245 Summer Street, Boston, Massachusetts 02210.
Name, Year of Birth; Principal Occupations and Other Relevant Experience+
James C. Curvey (1935)
Year of Election or Appointment: 2007
Trustee
Chairman of the Board of Trustees
Mr. Curvey also serves as Trustee of other Fidelity® funds. Mr. Curvey is a Director of Fidelity Research & Analysis Co. (investment adviser firm, 2009-present), and Vice Chairman (2007-present) and Director of FMR LLC (diversified financial services company). In addition, Mr. Curvey serves as an Overseer for the Boston Symphony Orchestra and a member of the board of Artis-Naples, Naples, Florida, and as a Trustee for Brewster Academy, Wolfeboro, New Hampshire. Previously, Mr. Curvey served as a Director of Fidelity Investments Money Management, Inc. (investment adviser firm, 2009-2014) and a Director of FMR and FMR Co., Inc. (investment adviser firms, 2007-2014).
Charles S. Morrison (1960)
Year of Election or Appointment: 2014
Trustee
Mr. Morrison also serves as Trustee of other funds. He serves as a Director of Fidelity Investments Money Management, Inc. (FIMM) (investment adviser firm, 2014-present), Director of Fidelity SelectCo, LLC (investment adviser firm, 2014-present), President, Asset Management (2014-present), and is an employee of Fidelity Investments. Previously, Mr. Morrison served as Vice President of Fidelity's Fixed Income and Asset Allocation Funds (2012-2014), President, Fixed Income (2011-2014), Vice President of Fidelity's Money Market Funds (2005-2009), President, Money Market Group Leader of FMR (investment adviser firm, 2009), and Senior Vice President, Money Market Group of FMR (2004-2009). Mr. Morrison also served as Vice President of Fidelity's Bond Funds (2002-2005), certain Balanced Funds (2002-2005), and certain Asset Allocation Funds (2002-2007), and as Senior Vice President (2002-2005) of Fidelity's Bond Division.
* Determined to be an “Interested Trustee” by virtue of, among other things, his or her affiliation with the trust or various entities under common control with FMR.
+ The information includes the Trustee's principal occupation during the last five years and other information relating to the experience, attributes, and skills relevant to the Trustee's qualifications to serve as a Trustee, which led to the conclusion that the Trustee should serve as a Trustee for the fund.
Independent Trustees:
Correspondence intended for an Independent Trustee may be sent to Fidelity Investments, P.O. Box 55235, Boston, Massachusetts 02205-5235.
Name, Year of Birth; Principal Occupations and Other Relevant Experience+
Dennis J. Dirks (1948)
Year of Election or Appointment: 2005
Trustee
Mr. Dirks also serves as Trustee of other Fidelity® funds. Prior to his retirement in May 2003, Mr. Dirks was Chief Operating Officer and a member of the Board of The Depository Trust & Clearing Corporation (DTCC). He also served as President, Chief Operating Officer, and Board member of The Depository Trust Company (DTC) and President and Board member of the National Securities Clearing Corporation (NSCC). In addition, Mr. Dirks served as Chief Executive Officer and Board member of the Government Securities Clearing Corporation, Chief Executive Officer and Board member of the Mortgage-Backed Securities Clearing Corporation, as a Trustee and a member of the Finance Committee of Manhattan College (2005-2008), as a Trustee and a member of the Finance Committee of AHRC of Nassau County (2006-2008), and as a member of the Independent Directors Council (IDC) Governing Council (2010-2015). Mr. Dirks is a member of the Board of Directors for The Brookville Center for Children's Services, Inc. (2009-present).
Alan J. Lacy (1953)
Year of Election or Appointment: 2008
Trustee
Mr. Lacy also serves as Trustee of other Fidelity® funds. Mr. Lacy serves as a member of the Board of Directors of Dave & Buster's Entertainment, Inc. (restaurant and entertainment complexes, 2010-present) and Bristol-Myers Squibb Company (global pharmaceuticals, 2008-present). In addition, Mr. Lacy served as Senior Adviser (2007-2014) of Oak Hill Capital Partners, L.P. (private equity) and also served as Chief Executive Officer (2000-2005) and Vice Chairman (2005-2006) of Sears Holdings Corporation and Sears, Roebuck and Co. (retail). Mr. Lacy is a member of the Board of Trustees of The National Parks Conservation Association (2006-present). Previously, Mr. Lacy served as Chairman of the Board of Trustees of the National Parks Conservation Association (2008-2011) and as a member of the Board of Directors for The Western Union Company (global money transfer, 2006-2011), The Hillman Companies, Inc. (hardware wholesalers, 2010-2014), and Earth Fare, Inc. (retail grocery, 2010-2014).
Ned C. Lautenbach (1944)
Year of Election or Appointment: 2000
Trustee
Chairman of the Independent Trustees
Mr. Lautenbach also serves as Trustee of other Fidelity® funds. Mr. Lautenbach currently serves as the Lead Director of the Eaton Corporation Board of Directors (diversified industrial, 1997-present). Mr. Lautenbach is Chairman of the Board of Directors of Artis-Naples in Naples, Florida (2012-present), a member of the Council on Foreign Relations (1994-present), and a member of the Board of Governors, State University System of Florida (2013-present). Previously, Mr. Lautenbach was a Partner/Advisory Partner at Clayton, Dubilier & Rice, LLC (private equity investment, 1998-2010), as well as a Director of Sony Corporation (2006-2007).
Joseph Mauriello (1944)
Year of Election or Appointment: 2008
Trustee
Mr. Mauriello also serves as Trustee of other Fidelity® funds. Prior to his retirement in January 2006, Mr. Mauriello served in numerous senior management positions including Deputy Chairman and Chief Operating Officer (2004-2005), and Vice Chairman of Financial Services (2002-2004) of KPMG LLP US (professional services, 1965-2005). Mr. Mauriello currently serves as a member of the Board of Directors of XL Group plc. (global insurance and re-insurance, 2006-present) and the Independent Directors Council (IDC) Governing Council (2015-present). Previously, Mr. Mauriello served as a Director of the Hamilton Funds of the Bank of New York (2006-2007) and of Arcadia Resources Inc. (health care services and products, 2007-2012).
Robert W. Selander (1950)
Year of Election or Appointment: 2011
Trustee
Mr. Selander also serves as Trustee of other Fidelity® funds. Mr. Selander serves as a Director of The Western Union Company (global money transfer, 2014-present). Previously, Mr. Selander served as a Member of the Advisory Board of other Fidelity® funds (2011), and Executive Vice Chairman (2010), Chief Executive Officer (2009-2010), and President and Chief Executive Officer (1997-2009) of Mastercard, Inc.
Cornelia M. Small (1944)
Year of Election or Appointment: 2005
Trustee
Ms. Small also serves as Trustee of other Fidelity® funds. Ms. Small is a member of the Board of Directors (2009-present) and Chair of the Investment Committee (2010-present) of the Teagle Foundation. Ms. Small also serves on the Investment Committee of the Berkshire Taconic Community Foundation (2008-present). Previously, Ms. Small served as Chairperson (2002-2008) and a member of the Investment Committee and Chairperson (2008-2012) and a member of the Board of Trustees of Smith College. In addition, Ms. Small served as Chief Investment Officer, Director of Global Equity Investments, and a member of the Board of Directors of Scudder, Stevens & Clark and Scudder Kemper Investments.
William S. Stavropoulos (1939)
Year of Election or Appointment: 2002
Trustee
Vice Chairman of the Independent Trustees
Mr. Stavropoulos also serves as Trustee of other Fidelity® funds. Mr. Stavropoulos serves as President and Founder of the Michigan Baseball Foundation, the Great Lakes Loons (2007-present). Mr. Stavropoulos is Chairman Emeritus of the Board of Directors of The Dow Chemical Company, where he previously served in numerous senior management positions, including President, CEO (1995-2000; 2002-2004), Chairman of the Executive Committee (2000-2006), and as a member of the Board of Directors (1990-2006). Currently, Mr. Stavropoulos is Chairman of the Board of Directors of Univar Inc. (global distributor of commodity and specialty chemicals), a Director of Teradata Corporation (data warehousing and technology solutions), and Maersk Inc. (industrial conglomerate), and a member of the Advisory Board for Metalmark Capital LLC (private equity investment, 2005-present). Mr. Stavropoulos is an operating advisor to Clayton, Dubilier & Rice, LLC (private equity investment). In addition, Mr. Stavropoulos is a member of the University of Notre Dame Advisory Council for the College of Science, a Trustee of the Rollin L. Gerstacker Foundation, and a Director of the Naples Philharmonic Center for the Arts. Previously, Mr. Stavropoulos served as a Director of Chemical Financial Corporation (bank holding company, 1993-2012) and Tyco International, Ltd. (multinational manufacturing and services, 2007-2012).
David M. Thomas (1949)
Year of Election or Appointment: 2008
Trustee
Mr. Thomas also serves as Trustee of other Fidelity® funds. Mr. Thomas serves as Non-Executive Chairman of the Board of Directors of Fortune Brands Home and Security (home and security products, 2011-present), as a member of the Board of Directors (2004-present) and Presiding Director (2013-present) of Interpublic Group of Companies, Inc. (marketing communication), and as a member of the Board of Trustees of the University of Florida (2013-present). Previously, Mr. Thomas served as Executive Chairman (2005-2006) and Chairman and Chief Executive Officer (2000-2005) of IMS Health, Inc. (pharmaceutical and healthcare information solutions), and a Director of Fortune Brands, Inc. (consumer products, 2000-2011).
+ The information includes the Trustee's principal occupation during the last five years and other information relating to the experience, attributes, and skills relevant to the Trustee's qualifications to serve as a Trustee, which led to the conclusion that the Trustee should serve as a Trustee for the fund.
Advisory Board Members and Officers:
Correspondence intended for an officer or Peter S. Lynch may be sent to Fidelity Investments, 245 Summer Street, Boston, Massachusetts 02210. Officers appear below in alphabetical order.
Name, Year of Birth; Principal Occupation
Peter S. Lynch (1944)
Year of Election or Appointment: 2003
Member of the Advisory Board
Mr. Lynch also serves as Member of the Advisory Board of other Fidelity® funds. Mr. Lynch is Vice Chairman and a Director of FMR (investment adviser firm) and FMR Co., Inc. (investment adviser firm). In addition, Mr. Lynch serves as a Trustee of Boston College and as the Chairman of the Inner-City Scholarship Fund. Previously, Mr. Lynch served on the Special Olympics International Board of Directors (1997-2006).
Elizabeth Paige Baumann (1968)
Year of Election or Appointment: 2012
Anti-Money Laundering (AML) Officer
Ms. Baumann also serves as AML Officer of other funds. She is Chief AML Officer of FMR LLC (diversified financial services company, 2012-present) and is an employee of Fidelity Investments. Previously, Ms. Baumann served as Vice President and Deputy Anti-Money Laundering Officer (2007-2012).
Marc R. Bryant (1966)
Year of Election or Appointment: 2015
Secretary and Chief Legal Officer (CLO)
Mr. Bryant also serves as Secretary and CLO of other funds. Mr. Bryant serves as CLO, Secretary, and Senior Vice President of Fidelity Management & Research Company (investment adviser firm, 2015-present) and FMR Co., Inc. (investment adviser firm, 2015-present); Secretary of Fidelity SelectCo, LLC (investment adviser firm, 2015-present) and Fidelity Investments Money Management, Inc. (investment adviser firm, 2015-present); and CLO of Fidelity Management & Research (Hong Kong) Limited (investment adviser firm, 2015-present). He is Senior Vice President and Deputy General Counsel of FMR LLC (diversified financial services company). Previously, Mr. Bryant served as Secretary and CLO of Fidelity Rutland Square Trust II (2010-2014) and Assistant Secretary of Fidelity's Fixed Income and Asset Allocation Funds (2013-2015). Prior to joining Fidelity Investments, Mr. Bryant served as a Senior Vice President and the Head of Global Retail Legal for AllianceBernstein L.P. (2006-2010), and as the General Counsel for ProFund Advisors LLC (2001-2006).
William C. Coffey (1969)
Year of Election or Appointment: 2009
Assistant Secretary
Mr. Coffey also serves as Assistant Secretary of other funds. He is Senior Vice President and Deputy General Counsel of FMR LLC (diversified financial services company, 2010-present), and is an employee of Fidelity Investments. Previously, Mr. Coffey served as Vice President and Associate General Counsel of FMR LLC (2005-2009).
Jonathan Davis (1968)
Year of Election or Appointment: 2010
Assistant Treasurer
Mr. Davis also serves as Assistant Treasurer of other funds, and is an employee of Fidelity Investments. Previously, Mr. Davis served as Vice President and Associate General Counsel of FMR LLC (diversified financial services company, 2003-2010).
Adrien E. Deberghes (1967)
Year of Election or Appointment: 2008
Deputy Treasurer
Mr. Deberghes also serves as an officer of other funds. He is an employee of Fidelity Investments (2008-present). Prior to joining Fidelity Investments, Mr. Deberghes was Senior Vice President of Mutual Fund Administration at State Street Corporation (2007-2008), Senior Director of Mutual Fund Administration at Investors Bank & Trust (2005-2007), and Director of Finance for Dunkin' Brands (2000-2005).
Stephanie J. Dorsey (1969)
Year of Election or Appointment: 2010
Assistant Treasurer
Ms. Dorsey also serves as an officer of other funds. She is an employee of Fidelity Investments (2008-present) and has served in other fund officer roles. Prior to joining Fidelity Investments, Ms. Dorsey served as Treasurer (2004-2008) of the JPMorgan Mutual Funds and Vice President (2004-2008) of JPMorgan Chase Bank.
Howard J. Galligan III (1966)
Year of Election or Appointment: 2014
Chief Financial Officer
Mr. Galligan also serves as Chief Financial Officer of other funds. Mr. Galligan serves as President of Fidelity Pricing and Cash Management Services (FPCMS) (2014-present) and as a Director of Strategic Advisers, Inc. (investment adviser firm, 2008-present). Previously, Mr. Galligan served as Chief Administrative Officer of Asset Management (2011-2014) and Chief Operating Officer and Senior Vice President of Investment Support for Strategic Advisers, Inc. (2003-2011).
Scott C. Goebel (1968)
Year of Election or Appointment: 2015
Vice President
Mr. Goebel serves as Vice President of other funds and is an employee of Fidelity Investments (2001-present). Previously, Mr. Goebel served as Secretary of Fidelity SelectCo, LLC (investment adviser firm, 2013-2015), Fidelity Investments Money Management, Inc. (FIMM) (investment adviser firm, 2010-2015), and Fidelity Research and Analysis Company (FRAC) (investment adviser firm, 2010-2015); General Counsel, Secretary, and Senior Vice President of Fidelity Management & Research Company (investment adviser firm, 2008-2015) and FMR Co., Inc. (investment adviser firm, 2008-2015); Assistant Secretary of Fidelity Management & Research (Japan) Limited (investment adviser firm, 2008-2015) and FMR Investment Management (U.K.) Limited (investment adviser firm, 2008-2015); Chief Legal Officer (CLO) of Fidelity Management & Research (Hong Kong) Limited (investment adviser firm, 2008-2015); Secretary and CLO of certain Fidelity® funds (2008-2015); Assistant Secretary of FIMM (2008-2010), FRAC (2008-2010), and certain funds (2007-2008); and as Vice President and Secretary of Fidelity Distributors Corporation (FDC) (2005-2007).
Thomas C. Hense (1964)
Year of Election or Appointment: 2008, 2010, or 2015
Vice President
Mr. Hense serves as Vice President of Fidelity Advisor® Multi-Asset Income Fund (2015) and other funds (High Income (2008), Small Cap (2008), and Value (2010) funds), and is an employee of Fidelity Investments (1993-present). Previously, Mr. Hense served as a portfolio manager for Fidelity's Institutional Money Management Group (Pyramis) (2003-2008).
Brian B. Hogan (1964)
Year of Election or Appointment: 2009
Vice President
Mr. Hogan also serves as Trustee or Vice President of other funds. Mr. Hogan serves as a Director of Fidelity SelectCo, LLC (investment adviser firm, 2014-present) and President of the Equity Division of FMR (investment adviser firm, 2009-present). Previously, Mr. Hogan served as Senior Vice President, Equity Research of FMR (2006-2009) and as a portfolio manager.
Chris Maher (1972)
Year of Election or Appointment: 2013
Assistant Treasurer
Mr. Maher serves as Assistant Treasurer of other funds. Mr. Maher is Vice President of Valuation Oversight and is an employee of Fidelity Investments. Previously, Mr. Maher served as Vice President of Asset Management Compliance (2013), Vice President of the Program Management Group of FMR (investment adviser firm, 2010-2013), and Vice President of Valuation Oversight (2008-2010).
Kenneth B. Robins (1969)
Year of Election or Appointment: 2008
President and Treasurer
Mr. Robins also serves as an officer of other funds. Mr. Robins serves as Executive Vice President of Fidelity Investments Money Management, Inc. (FIMM) (investment adviser firm, 2013-present) and is an employee of Fidelity Investments (2004-present). Previously, Mr. Robins served in other fund officer roles.
Stacie M. Smith (1974)
Year of Election or Appointment: 2013
Deputy Treasurer
Ms. Smith also serves as an officer of other funds. She is an employee of Fidelity Investments (2009-present) and has served in other fund officer roles. Prior to joining Fidelity Investments, Ms. Smith served as Senior Audit Manager of Ernst & Young LLP (1996-2009).
Renee Stagnone (1975)
Year of Election or Appointment: 2013
Deputy Treasurer
Ms. Stagnone also serves as Deputy Treasurer of other funds. Ms. Stagnone is an employee of Fidelity Investments (1997-present).
Linda J. Wondrack (1964)
Year of Election or Appointment: 2014
Chief Compliance Officer
Ms. Wondrack also serves as Chief Compliance Officer of other funds. Ms. Wondrack is Executive Vice President and head of the Ethics Office and Asset Management Compliance for Fidelity Investments (2012-present). Ms. Wondrack also serves as Chief Compliance Officer of Fidelity SelectCo, LLC (investment adviser firm, 2014-present); Chief Compliance Officer of Impresa Management LLC (2013-present); and Chief Compliance Officer of FMR Co., Inc. (investment adviser firm), Fidelity Investments Money Management, Inc. (investment adviser firm), Fidelity Management & Research (Japan) Limited (investment adviser firm), FMR Investment Management (U.K.) Limited (investment adviser firm), Fidelity Management & Research (Hong Kong) (investment adviser firm), Fidelity Management & Research Company (investment adviser firm), FIAM LLC (investment adviser firm), and Strategic Advisers, Inc. (investment adviser firm), Ballyrock Investment Advisors LLC, and Northern Neck Investors LLC (2012-present). Previously, Ms. Wondrack served as Senior Vice President and Chief Compliance Officer for Columbia Management Investment Advisers, LLC (2005-2012); Chief Compliance Officer for certain funds within the Columbia Family of Funds (2007-2012); and Senior Vice President of Compliance Risk Management at Bank of America (2005-2010).
Joseph F. Zambello (1957)
Year of Election or Appointment: 2011
Deputy Treasurer
Mr. Zambello also serves as Deputy Treasurer of other funds. Mr. Zambello is an employee of Fidelity Investments (1991-present). Previously, Mr. Zambello served as Vice President of the Program Management Group of FMR (investment adviser firm, 2009-2011) and Vice President of the Transfer Agent Oversight Group (2005-2009).
Shareholder Expense Example
As a shareholder of the Fund, you incur two types of costs: (1) transaction costs, including sales charges (loads) on purchase payments or redemption proceeds, and (2) ongoing costs, including management fees, distribution and/or service (12b-1) fees and other Fund expenses. This Example is intended to help you understand your ongoing costs (in dollars) of investing in the Fund and to compare these costs with the ongoing costs of investing in other mutual funds.
The Example is based on an investment of $1,000 invested at the beginning of the period and held for the entire period (June 1, 2015 to November 30, 2015).
Actual Expenses
The first line of the accompanying table for each class of the Fund provides information about actual account values and actual expenses. You may use the information in this line, together with the amount you invested, to estimate the expenses that you paid over the period. Simply divide your account value by $1,000.00 (for example, an $8,600 account value divided by $1,000.00 = 8.6), then multiply the result by the number in the first line for a class of the Fund under the heading entitled "Expenses Paid During Period" to estimate the expenses you paid on your account during this period. A small balance maintenance fee of $12.00 that is charged once a year may apply for certain accounts with a value of less than $2,000. This fee is not included in the table below. If it was, the estimate of expenses you paid during the period would be higher, and your ending account value lower, by this amount. In addition, the Fund, as a shareholder in the underlying Fidelity Central Funds, will indirectly bear its pro-rata share of the fees and expenses incurred by the underlying Fidelity Central Funds. These fees and expenses are not included in the Fund's annualized expense ratio used to calculate the expense estimate in the table below.
Hypothetical Example for Comparison Purposes
The second line of the accompanying table for each class of the Fund provides information about hypothetical account values and hypothetical expenses based on a Class' actual expense ratio and an assumed rate of return of 5% per year before expenses, which is not the Class' actual return. The hypothetical account values and expenses may not be used to estimate the actual ending account balance or expenses you paid for the period. You may use this information to compare the ongoing costs of investing in the Fund and other funds. To do so, compare this 5% hypothetical example with the 5% hypothetical examples that appear in the shareholder reports of the other funds. A small balance maintenance fee of $12.00 that is charged once a year may apply for certain accounts with a value of less than $2,000. This fee is not included in the table below. If it was, the estimate of expenses you paid during the period would be higher, and your ending account value lower, by this amount. In addition, the Fund, as a shareholder in the underlying Fidelity Central Funds, will indirectly bear its pro-rata share of the fees and expenses incurred by the underlying Fidelity Central Funds. These fees and expenses are not included in the Fund's annualized expense ratio used to calculate the expense estimate in the table below.
Please note that the expenses shown in the table are meant to highlight your ongoing costs only and do not reflect any transaction costs. Therefore, the second line of the table is useful in comparing ongoing costs only, and will not help you determine the relative total costs of owning different funds. In addition, if these transactional costs were included, your costs would have been higher.
| Annualized Expense Ratio-A | Beginning Account Value June 1, 2015 | Ending Account Value November 30, 2015 | Expenses Paid During Period-B June 1, 2015 to November 30, 2015 | |
| Class A | .91% | |||
| Actual | $1,000.00 | $943.40 | $4.43 | |
| Hypothetical-C | $1,000.00 | $1,020.51 | $4.61 | |
| Class T | 1.12% | |||
| Actual | $1,000.00 | $942.60 | $5.45 | |
| Hypothetical-C | $1,000.00 | $1,019.45 | $5.67 | |
| Class B | 1.73% | |||
| Actual | $1,000.00 | $939.70 | $8.41 | |
| Hypothetical-C | $1,000.00 | $1,016.39 | $8.74 | |
| Class C | 1.67% | |||
| Actual | $1,000.00 | $940.00 | $8.12 | |
| Hypothetical-C | $1,000.00 | $1,016.70 | $8.44 | |
| Fidelity Value Strategies Fund | .65% | |||
| Actual | $1,000.00 | $944.70 | $3.17 | |
| Hypothetical-C | $1,000.00 | $1,021.81 | $3.29 | |
| Class K | .49% | |||
| Actual | $1,000.00 | $945.50 | $2.39 | |
| Hypothetical-C | $1,000.00 | $1,022.61 | $2.48 | |
| Class I | .66% | |||
| Actual | $1,000.00 | $944.70 | $3.22 | |
| Hypothetical-C | $1,000.00 | $1,021.76 | $3.35 |
A Annualized expense ratio reflects expenses net of applicable fee waivers.
B Expenses are equal to each Class' annualized expense ratio, multiplied by the average account value over the period, multiplied by 183/365 (to reflect the one-half year period).
C 5% return per year before expenses
Distributions (Unaudited)
Class K designates 100% of the dividends distributed during the fiscal year as qualifying for the dividends–received deduction for corporate shareholders.
Class K designates 100% of the dividends distributed during the fiscal year as amounts which may be taken into account as a dividend for purposes of the maximum rate under section 1(h)(11) of the Internal Revenue Code.
The fund will notify shareholders in January 2016 of amounts for use in preparing 2015 income tax returns.
Board Approval of Investment Advisory Contracts and Management Fees
Fidelity Advisor Value Strategies Fund
Each year, the Board of Trustees, including the Independent Trustees (together, the Board), votes on the renewal of the management contract with Fidelity Management & Research Company (FMR) and the sub-advisory agreements (together, the Advisory Contracts) for the fund. The Board, assisted by the advice of fund counsel and Independent Trustees' counsel, requests and considers a broad range of information relevant to the renewal of the Advisory Contracts throughout the year.
The Board meets regularly and, at each of its meetings, covers an extensive agenda of topics and materials and considers factors that are relevant to its annual consideration of the renewal of the fund's Advisory Contracts, including the services and support provided to the fund and its shareholders. The Board has established various standing committees (Committees), each composed of and chaired by Independent Trustees with varying backgrounds, to which the Board has assigned specific subject matter responsibilities in order to enhance effective decision-making by the Board. The Board, acting directly and through its Committees, requests and receives information concerning the annual consideration of the renewal of the fund's Advisory Contracts. The Board also meets as needed to consider matters specifically related to the Board's annual consideration of the renewal of the Advisory Contracts. Members of the Board may also meet with trustees of other Fidelity funds through ad hoc joint committees to discuss certain matters relevant to all of the Fidelity funds.
At its July 2015 meeting, the Board unanimously determined to renew the fund's Advisory Contracts. In reaching its determination, the Board considered all factors it believed relevant, including (i) the nature, extent, and quality of the services to be provided to the fund and its shareholders (including the investment performance of the fund); (ii) the competitiveness of the fund's management fee and total expense ratio relative to peer funds; (iii) the total costs of the services to be provided by and the profits to be realized by Fidelity from its relationship with the fund; and (iv) the extent to which (if any) economies of scale exist and would be realized as the fund grows, and whether any economies of scale are appropriately shared with fund shareholders.
In considering whether to renew the Advisory Contracts for the fund, the Board reached a determination, with the assistance of fund counsel and Independent Trustees' counsel and through the exercise of its business judgment, that the renewal of the Advisory Contracts was in the best interests of the fund and its shareholders and that the compensation payable under the Advisory Contracts was fair and reasonable. The Board's decision to renew the Advisory Contracts was not based on any single factor, but rather was based on a comprehensive consideration of all the information provided to the Board at its meetings throughout the year. The Board, in reaching its determination to renew the Advisory Contracts, was aware that shareholders of the fund have a broad range of investment choices available to them, including a wide choice among funds offered by Fidelity's competitors, and that the fund's shareholders, who have the opportunity to review and weigh the disclosure provided by the fund in its prospectus and other public disclosures, have chosen to invest in this fund, which is part of the Fidelity family of funds.
Nature, Extent, and Quality of Services Provided. The Board considered Fidelity's staffing as it relates to the fund, including the backgrounds of investment personnel of Fidelity, and also considered the fund's investment objective, strategies, and related investment philosophy. The Independent Trustees also had discussions with senior management of Fidelity's investment operations and investment groups. The Board considered the structure of the portfolio manager compensation program and whether this structure provides appropriate incentives to act in the best interests of the fund. Additionally, the Board considered the portfolio managers' investments, if any, in the funds that they manage.Resources Dedicated to Investment Management and Support Services. The Board and the Fund Oversight and Research Committees reviewed the general qualifications and capabilities of Fidelity's investment staff, including its size, education, experience, and resources, as well as Fidelity's approach to recruiting, training, managing, and compensating investment personnel. The Board noted that Fidelity has continued to increase the resources devoted to non-U.S. offices, including expansion of Fidelity's global investment organization. The Board also noted that Fidelity's analysts have extensive resources, tools and capabilities that allow them to conduct sophisticated quantitative and fundamental analysis, as well as credit analysis of issuers, counterparties and guarantors. Further, the Board considered that Fidelity's investment professionals have sufficient access to global information and data so as to provide competitive investment results over time, and that those professionals also have access to sophisticated tools that permit them to assess portfolio construction and risk and performance attribution characteristics continuously, as well as to transmit new information and research conclusions rapidly around the world. Additionally, in its deliberations, the Board considered Fidelity's trading, risk management, and compliance capabilities and resources, which are integral parts of the investment management process.Shareholder and Administrative Services. The Board considered (i) the nature, extent, quality, and cost of advisory, administrative, and shareholder services performed by FMR, the sub-advisers (together with FMR, the Investment Advisers), and their affiliates under the Advisory Contracts and under separate agreements covering transfer agency, pricing and bookkeeping, and securities lending services for the fund; (ii) the nature and extent of the supervision of third party service providers, principally custodians and subcustodians; and (iii) the resources devoted to, and the record of compliance with, the fund's compliance policies and procedures. The Board also reviewed the allocation of fund brokerage, including allocations to brokers affiliated with the Investment Advisers, the use of brokerage commissions to pay fund expenses, and the use of "soft" commission dollars to pay for research services.The Board noted that the growth of fund assets over time across the complex allows Fidelity to reinvest in the development of services designed to enhance the value or convenience of the Fidelity funds as investment vehicles. These services include 24-hour access to account information and market information through telephone representatives and over the Internet, investor education materials and asset allocation tools, and the expanded availability of Fidelity Investor Centers.In 2014, the Board formed an ad hoc Committee on Transfer Agency Fees to review the variety of transfer agency fee structures throughout the industry and Fidelity's competitive positioning with respect to industry participants.Investment in a Large Fund Family. The Board considered the benefits to shareholders of investing in a Fidelity fund, including the benefits of investing in a fund that is part of a large family of funds offering a variety of investment disciplines and providing a large variety of mutual fund investor services. The Board noted that Fidelity had taken, or had made recommendations that resulted in the Fidelity funds taking, a number of actions over the previous year that benefited particular funds, including (i) continuing to dedicate additional resources to investment research and to the support of the senior management team that oversees asset management; (ii) continuing efforts to enhance Fidelity's global research capabilities; (iii) launching new funds and making other enhancements to meet client needs; (iv) reducing management fees and total expenses for certain index funds and diversified international funds; (v) continuing to launch dedicated lower cost underlying funds to meet portfolio construction needs related to expanding underlying fund options for Fidelity funds of funds, specifically for the Freedom Fund product lines; (vi) rationalizing product lines and gaining increased efficiencies through fund mergers; (vii) launching active fixed-income exchange-traded funds; (viii) continuing to develop, acquire and implement systems and technology to improve services to the funds and information security and to increase efficiency; (ix) implementing investment enhancements to further strengthen Fidelity's target date product line to increase investors' probability of success in achieving their goals; (x) modifying the eligibility criteria for certain share classes to accommodate roll-over assets from employer-sponsored retirement plans; (xi) launching a new Class W of the Freedom Index Funds to attract and retain Fidelity record-kept retirement plan assets; and (xii) implementing changes to Fidelity's money market product line in response to recent money market regulatory reforms.Investment Performance. The Board considered whether the fund has operated in accordance with its investment objective, as well as its record of compliance with its investment restrictions and its performance history.The Board took into account discussions with representatives of the Investment Advisers about fund investment performance that occur at Board meetings throughout the year. In this regard the Board noted that as part of regularly scheduled fund reviews and other reports to the Board on fund performance, the Board considers annualized return information for the fund, for different time periods, measured against a securities market index ("benchmark index") and a peer group of funds with similar objectives ("peer group"), if any. In its evaluation of fund investment performance, the Board gave particular attention to information indicating changes in performance of certain Fidelity funds for specific time periods and discussed with the Investment Advisers the reasons for any overperformance or underperformance.In addition to reviewing absolute and relative fund performance, the Independent Trustees periodically consider the appropriateness of fund performance metrics in evaluating the results achieved. In general, the Independent Trustees believe that fund performance should be evaluated based on net performance (after fees and expenses) of both the highest performing and lowest performing fund share classes, where applicable, compared to appropriate benchmark indices, over appropriate time periods that may include full market cycles, and compared to peer groups, as applicable, over the same periods, taking into account relevant factors including the following: general market conditions; issuer-specific information; and fund cash flows and other factors.The Independent Trustees recognize that shareholders evaluate performance on a net basis over their own holding periods, for which one-, three-, and five-year periods are often used as a proxy. For this reason, the performance information reviewed by the Board also included net cumulative calendar year total return information for the fund and an appropriate benchmark index and peer group for the most recent one-, three-, and five-year periods, as shown below. Returns are shown compared to the 25th percentile (top of box, 75% beaten) and 75th percentile (bottom of box, 25% beaten) of the peer universe.Fidelity Advisor Value Strategies Fund
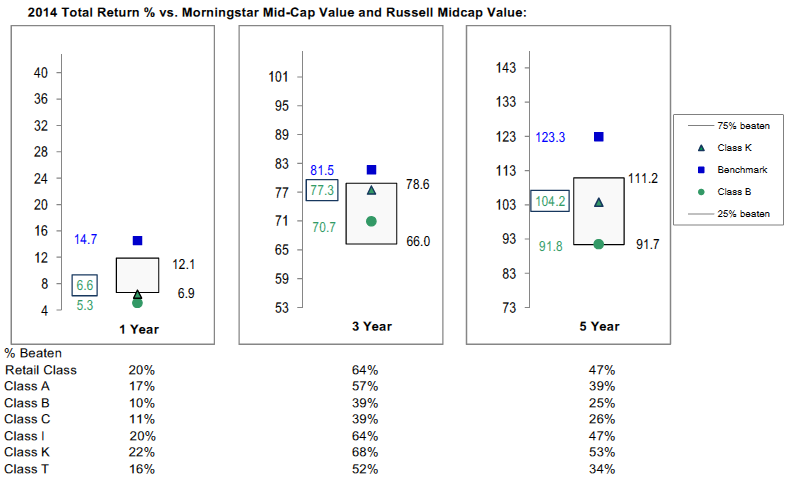
Fidelity Advisor Value Strategies Fund
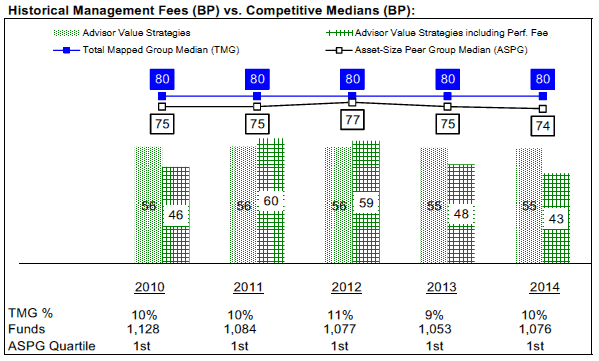
![]()
Corporate Headquarters
245 Summer St.
Boston, MA 02210
www.fidelity.com
SOI-K-ANN-0116
1.863336.107
Fidelity Advisor® Equity Value Fund Class I (formerly Institutional Class) Annual Report November 30, 2015 |
|
Contents
Board Approval of Investment Advisory Contracts and Management Fees |
To view a fund's proxy voting guidelines and proxy voting record for the 12-month period ended June 30, visit http://www.fidelity.com/proxyvotingresults or visit the Securities and Exchange Commission's (SEC) web site at http://www.sec.gov.
You may also call 1-877-208-0098 to request a free copy of the proxy voting guidelines.
Standard & Poor's, S&P and S&P 500 are registered service marks of The McGraw-Hill Companies, Inc. and have been licensed for use by Fidelity Distributors Corporation.
Other third-party marks appearing herein are the property of their respective owners.
All other marks appearing herein are registered or unregistered trademarks or service marks of FMR LLC or an affiliated company. © 2016 FMR LLC. All rights reserved.
This report and the financial statements contained herein are submitted for the general information of the shareholders of the Fund. This report is not authorized for distribution to prospective investors in the Fund unless preceded or accompanied by an effective prospectus.
A fund files its complete schedule of portfolio holdings with the SEC for the first and third quarters of each fiscal year on Form N-Q. Forms N-Q are available on the SEC’s web site at http://www.sec.gov. A fund's Forms N-Q may be reviewed and copied at the SEC’s Public Reference Room in Washington, DC. Information regarding the operation of the SEC's Public Reference Room may be obtained by calling 1-800-SEC-0330.
For a complete list of a fund's portfolio holdings, view the most recent holdings listing, semiannual report, or annual report on Fidelity's web site at http://www.fidelity.com, http://www.advisor.fidelity.com, or http://www.401k.com, as applicable.
NOT FDIC INSURED •MAY LOSE VALUE •NO BANK GUARANTEE
Neither the Fund nor Fidelity Distributors Corporation is a bank.
Performance: The Bottom Line
Average annual total return reflects the change in the value of an investment, assuming reinvestment of distributions from dividend income and capital gains (the profits earned upon the sale of securities that have grown in value, if any) and assuming a constant rate of performance each year.
The hypothetical investment and the average annual total returns do not reflect the deduction of taxes that a shareholder would pay on fund distributions or the redemption of fund shares.
During periods of reimbursement by Fidelity, a fund’s total return will be greater than it would be had the reimbursement not occurred.
How a fund did yesterday is no guarantee of how it will do tomorrow.
Average Annual Total Returns
| For the periods ended November 30, 2015 | Past 1 year | Past 5 years | Past 10 years |
| Class I | (0.60)% | 13.53% | 6.35% |
$10,000 Over 10 Years
Let's say hypothetically that $10,000 was invested in Fidelity Advisor® Equity Value Fund - Class I on November 30, 2005.
The chart shows how the value of your investment would have changed, and also shows how the Russell 3000® Value Index performed over the same period.
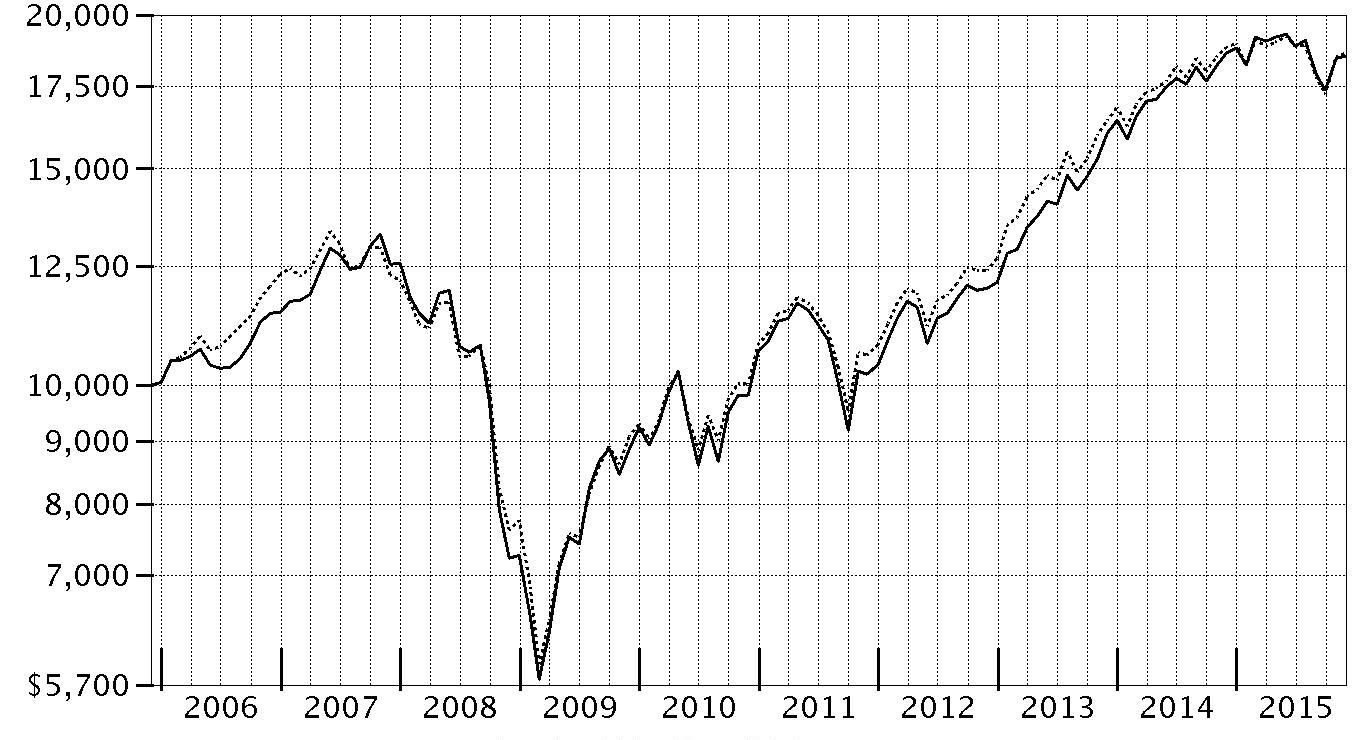
| Period Ending Values | ||
| $18,504 | Fidelity Advisor® Equity Value Fund - Class I | |
| $18,627 | Russell 3000® Value Index | |
Management's Discussion of Fund Performance
Market Recap: U.S. stocks gained modestly for the 12 months ending November 30, 2015, despite a steep decline in August and September on concern about slowing economic growth in China. The S&P 500® index rebounded in October and gained 2.75% for the year. Stocks benefited late in the period amid waning expectations for a near-term interest-rate hike by the U.S. Federal Reserve, more economic stimulus in Europe and an interest-rate cut in China. Growth stocks in the benchmark far outpaced their value counterparts, as investors continued to seek growth in a subpar economic environment. Sector performance varied widely, with more than 26 percentage points separating the leader from the laggard. Consumer discretionary (+14%) secured the top spot, benefiting from a combination of rising personal income and still-benign inflation. Information technology (+7%) and health care (+4%) also outpaced the broad market. Conversely, the energy sector (-12%) performed worst, stymied by depressed commodity prices that also hit materials (-5%). Telecommunication services (-5%) and utilities (-4%), considered defensive sectors less sensitive to the economy, also lost ground. At period end, investors remained focused on the potential global implications of a stronger U.S. dollar and how China's transition toward a consumption-led economy may affect corporate earnings.Comments from Portfolio Manager Sean Gavin: For the year, the fund's share classes (excluding sales charges, if applicable) declined modestly, roughly in line with the -1.01% return of the benchmark Russell 3000® Value Index. Versus the benchmark, the fund benefited from strong security selection in information technology and favorable positioning in energy. In contrast, the fund was hurt by stock picking in financials and consumer discretionary. Our top individual contributor was Internet search provider Google. In October, Google changed its name to Alphabet, which became the parent company of Google and the firm's various other businesses. Also lifting results was health insurance provider Cigna, whose shares produced a strong gain. Another notable contributor was auto-parts retailer Autozone. The company continued to increase its operating margins and produce healthy free cash flow. Eventually, the stock exceeded my target price, and I sold the fund's stake. In contrast, various energy holdings struggled, especially BW Offshore, a supplier of equipment to offshore oil drillers. Another meaningful detractor was media company Viacom, which at period end continued to meet my valuation and quality criteria. During the period, however, the company faced a number of business challenges – all of them short term, in my view.The views expressed above reflect those of the portfolio manager(s) only through the end of the period as stated on the cover of this report and do not necessarily represent the views of Fidelity or any other person in the Fidelity organization. Any such views are subject to change at any time based upon market or other conditions and Fidelity disclaims any responsibility to update such views. These views may not be relied on as investment advice and, because investment decisions for a Fidelity fund are based on numerous factors, may not be relied on as an indication of trading intent on behalf of any Fidelity fund.
Investment Summary (Unaudited)
Top Ten Stocks as of November 30, 2015
| % of fund's net assets | % of fund's net assets 6 months ago | |
| JPMorgan Chase & Co. | 4.0 | 4.1 |
| Johnson & Johnson | 3.8 | 3.1 |
| General Electric Co. | 3.4 | 2.5 |
| Wells Fargo & Co. | 3.3 | 3.4 |
| Berkshire Hathaway, Inc. Class B | 3.0 | 2.9 |
| Oracle Corp. | 2.7 | 1.7 |
| Chevron Corp. | 2.5 | 2.3 |
| Teva Pharmaceutical Industries Ltd. sponsored ADR | 2.4 | 2.0 |
| EMC Corp. | 2.4 | 1.2 |
| U.S. Bancorp | 1.9 | 1.9 |
| 29.4 |
Top Five Market Sectors as of November 30, 2015
| % of fund's net assets | % of fund's net assets 6 months ago | |
| Financials | 25.3 | 28.9 |
| Information Technology | 16.4 | 15.6 |
| Health Care | 15.1 | 14.2 |
| Consumer Discretionary | 10.0 | 11.8 |
| Energy | 9.3 | 7.6 |
Asset Allocation (% of fund's net assets)
| As of November 30, 2015* | ||
| Stocks | 94.7% | |
| Short-Term Investments and Net Other Assets (Liabilities) | 5.3% | |

* Foreign investments - 13.9%
| As of May 31, 2015* | ||
| Stocks | 94.8% | |
| Short-Term Investments and Net Other Assets (Liabilities) | 5.2% | |

* Foreign investments - 18.0%
Investments November 30, 2015
Showing Percentage of Net Assets
| Common Stocks - 94.7% | |||
| Shares | Value | ||
| CONSUMER DISCRETIONARY - 10.0% | |||
| Auto Components - 0.5% | |||
| Hyundai Mobis | 3,889 | $836,485 | |
| Diversified Consumer Services - 0.1% | |||
| Steiner Leisure Ltd. (a) | 2,600 | 163,488 | |
| Media - 7.8% | |||
| Cablevision Systems Corp. - NY Group Class A | 30,000 | 915,000 | |
| CBS Corp. Class B | 32,300 | 1,630,504 | |
| Corus Entertainment, Inc. Class B (non-vtg.) (b) | 48,700 | 382,175 | |
| John Wiley & Sons, Inc. Class A | 17,615 | 908,758 | |
| Starz Series A (a) | 45,700 | 1,612,296 | |
| Time Warner Cable, Inc. | 13,900 | 2,568,303 | |
| Twenty-First Century Fox, Inc. Class A | 63,500 | 1,873,885 | |
| Viacom, Inc. Class B (non-vtg.) | 48,700 | 2,424,773 | |
| 12,315,694 | |||
| Multiline Retail - 0.5% | |||
| Macy's, Inc. | 20,147 | 787,345 | |
| Specialty Retail - 1.1% | |||
| Bed Bath & Beyond, Inc. (a) | 9,900 | 539,748 | |
| GNC Holdings, Inc. | 37,900 | 1,129,799 | |
| 1,669,547 | |||
| TOTAL CONSUMER DISCRETIONARY | 15,772,559 | ||
| CONSUMER STAPLES - 3.8% | |||
| Beverages - 0.6% | |||
| C&C Group PLC | 232,281 | 900,679 | |
| Food & Staples Retailing - 2.0% | |||
| Rite Aid Corp. (a) | 125,200 | 986,576 | |
| Wal-Mart Stores, Inc. | 36,000 | 2,118,240 | |
| 3,104,816 | |||
| Food Products - 1.2% | |||
| Seaboard Corp. (a) | 300 | 990,000 | |
| The J.M. Smucker Co. | 7,779 | 942,737 | |
| 1,932,737 | |||
| TOTAL CONSUMER STAPLES | 5,938,232 | ||
| ENERGY - 9.3% | |||
| Energy Equipment & Services - 2.1% | |||
| Baker Hughes, Inc. | 38,500 | 2,081,695 | |
| BW Offshore Ltd. | 1,534,900 | 522,787 | |
| National Oilwell Varco, Inc. | 17,700 | 660,918 | |
| 3,265,400 | |||
| Oil, Gas & Consumable Fuels - 7.2% | |||
| Chevron Corp. | 42,897 | 3,917,354 | |
| Exxon Mobil Corp. | 28,272 | 2,308,692 | |
| Marathon Petroleum Corp. | 25,400 | 1,483,614 | |
| Niska Gas Storage Partners LLC | 5,200 | 16,640 | |
| Phillips 66 Co. | 15,700 | 1,437,021 | |
| Suncor Energy, Inc. | 81,900 | 2,262,990 | |
| 11,426,311 | |||
| TOTAL ENERGY | 14,691,711 | ||
| FINANCIALS - 25.3% | |||
| Banks - 10.7% | |||
| JPMorgan Chase & Co. | 93,952 | 6,264,718 | |
| Regions Financial Corp. | 110,500 | 1,120,470 | |
| SunTrust Banks, Inc. | 29,500 | 1,280,890 | |
| U.S. Bancorp | 68,666 | 3,013,751 | |
| Wells Fargo & Co. | 93,732 | 5,164,633 | |
| 16,844,462 | |||
| Capital Markets - 0.2% | |||
| GP Investments Ltd. Class A (depositary receipt) (a) | 183,300 | 369,537 | |
| Consumer Finance - 2.8% | |||
| American Express Co. | 9,200 | 659,088 | |
| Capital One Financial Corp. | 28,818 | 2,262,501 | |
| Discover Financial Services | 26,100 | 1,481,436 | |
| 4,403,025 | |||
| Diversified Financial Services - 3.0% | |||
| Berkshire Hathaway, Inc. Class B (a) | 34,769 | 4,662,175 | |
| Insurance - 5.2% | |||
| ACE Ltd. | 14,700 | 1,688,295 | |
| Allied World Assurance Co. Holdings AG | 21,400 | 777,248 | |
| Allstate Corp. | 22,900 | 1,437,204 | |
| FNF Group | 28,480 | 1,021,008 | |
| FNFV Group (a) | 37,692 | 421,773 | |
| Prudential PLC | 34,419 | 797,892 | |
| The Travelers Companies, Inc. | 17,987 | 2,060,771 | |
| 8,204,191 | |||
| Real Estate Investment Trusts - 3.4% | |||
| American Capital Agency Corp. | 88,601 | 1,590,388 | |
| Annaly Capital Management, Inc. | 203,805 | 1,952,452 | |
| MFA Financial, Inc. | 262,536 | 1,832,501 | |
| 5,375,341 | |||
| TOTAL FINANCIALS | 39,858,731 | ||
| HEALTH CARE - 15.1% | |||
| Biotechnology - 1.9% | |||
| Amgen, Inc. | 16,900 | 2,722,590 | |
| Dyax Corp. (a) | 9,200 | 309,672 | |
| 3,032,262 | |||
| Health Care Providers & Services - 4.0% | |||
| Aetna, Inc. | 4,100 | 421,275 | |
| Anthem, Inc. | 3,200 | 417,216 | |
| Cigna Corp. | 14,700 | 1,984,206 | |
| Express Scripts Holding Co. (a) | 22,199 | 1,897,571 | |
| Laboratory Corp. of America Holdings (a) | 13,000 | 1,580,020 | |
| 6,300,288 | |||
| Pharmaceuticals - 9.2% | |||
| Allergan PLC (a) | 7,600 | 2,385,564 | |
| Johnson & Johnson | 58,992 | 5,972,350 | |
| Sanofi SA sponsored ADR | 52,300 | 2,312,706 | |
| Teva Pharmaceutical Industries Ltd. sponsored ADR | 61,132 | 3,847,037 | |
| 14,517,657 | |||
| TOTAL HEALTH CARE | 23,850,207 | ||
| INDUSTRIALS - 8.3% | |||
| Aerospace & Defense - 2.1% | |||
| BWX Technologies, Inc. | 43,500 | 1,324,575 | |
| Precision Castparts Corp. | 700 | 162,078 | |
| United Technologies Corp. | 18,700 | 1,796,135 | |
| 3,282,788 | |||
| Industrial Conglomerates - 3.4% | |||
| General Electric Co. | 178,200 | 5,335,308 | |
| Machinery - 1.7% | |||
| Deere & Co. | 33,810 | 2,690,262 | |
| Professional Services - 1.1% | |||
| Dun & Bradstreet Corp. | 16,300 | 1,756,977 | |
| TOTAL INDUSTRIALS | 13,065,335 | ||
| INFORMATION TECHNOLOGY - 16.4% | |||
| Communications Equipment - 3.3% | |||
| Cisco Systems, Inc. | 97,682 | 2,661,835 | |
| Harris Corp. | 29,900 | 2,485,587 | |
| 5,147,422 | |||
| Electronic Equipment & Components - 1.0% | |||
| Keysight Technologies, Inc. (a) | 22,200 | 683,982 | |
| TE Connectivity Ltd. | 13,898 | 932,417 | |
| 1,616,399 | |||
| Internet Software & Services - 1.5% | |||
| Alphabet, Inc. Class A (a) | 3,100 | 2,364,835 | |
| IT Services - 0.9% | |||
| The Western Union Co. | 72,800 | 1,373,008 | |
| Semiconductors & Semiconductor Equipment - 0.1% | |||
| Altera Corp. | 3,000 | 158,400 | |
| Software - 4.3% | |||
| Microsoft Corp. | 47,800 | 2,597,930 | |
| Oracle Corp. | 107,387 | 4,184,871 | |
| 6,782,801 | |||
| Technology Hardware, Storage & Peripherals - 5.3% | |||
| Apple, Inc. | 14,200 | 1,679,860 | |
| EMC Corp. | 147,500 | 3,737,650 | |
| Samsung Electronics Co. Ltd. | 1,774 | 1,963,668 | |
| SanDisk Corp. | 13,500 | 997,245 | |
| 8,378,423 | |||
| TOTAL INFORMATION TECHNOLOGY | 25,821,288 | ||
| MATERIALS - 2.9% | |||
| Chemicals - 2.4% | |||
| CF Industries Holdings, Inc. | 45,275 | 2,088,989 | |
| LyondellBasell Industries NV Class A | 17,500 | 1,676,850 | |
| 3,765,839 | |||
| Paper & Forest Products - 0.5% | |||
| Schweitzer-Mauduit International, Inc. | 19,200 | 802,944 | |
| TOTAL MATERIALS | 4,568,783 | ||
| UTILITIES - 3.6% | |||
| Electric Utilities - 3.5% | |||
| American Electric Power Co., Inc. | 21,300 | 1,193,013 | |
| Cleco Corp. | 9,500 | 476,045 | |
| Edison International | 12,593 | 747,520 | |
| Exelon Corp. | 74,500 | 2,034,595 | |
| Xcel Energy, Inc. | 30,100 | 1,073,366 | |
| 5,524,539 | |||
| Independent Power and Renewable Electricity Producers - 0.1% | |||
| Vivint Solar, Inc. (a)(b) | 22,326 | 180,617 | |
| TOTAL UTILITIES | 5,705,156 | ||
| TOTAL COMMON STOCKS | |||
| (Cost $143,727,545) | 149,272,002 | ||
| Money Market Funds - 4.0% | |||
| Fidelity Cash Central Fund, 0.18% (c) | 5,828,326 | 5,828,326 | |
| Fidelity Securities Lending Cash Central Fund, 0.22% (c)(d) | 492,718 | 492,718 | |
| TOTAL MONEY MARKET FUNDS | |||
| (Cost $6,321,044) | 6,321,044 | ||
| TOTAL INVESTMENT PORTFOLIO - 98.7% | |||
| (Cost $150,048,589) | 155,593,046 | ||
| NET OTHER ASSETS (LIABILITIES) - 1.3% | 2,110,293 | ||
| NET ASSETS - 100% | $157,703,339 |
Legend
(a) Non-income producing
(b) Security or a portion of the security is on loan at period end.
(c) Affiliated fund that is generally available only to investment companies and other accounts managed by Fidelity Investments. The rate quoted is the annualized seven-day yield of the fund at period end. A complete unaudited listing of the fund's holdings as of its most recent quarter end is available upon request. In addition, each Fidelity Central Fund's financial statements, which are not covered by the Fund's Report of Independent Registered Public Accounting Firm, are available on the SEC's website or upon request.
(d) Investment made with cash collateral received from securities on loan.
Affiliated Central Funds
Information regarding fiscal year to date income earned by the Fund from investments in Fidelity Central Funds is as follows:
| Fund | Income earned |
| Fidelity Cash Central Fund | $13,226 |
| Fidelity Securities Lending Cash Central Fund | 10,163 |
| Total | $23,389 |
Investment Valuation
The following is a summary of the inputs used, as of November 30, 2015, involving the Fund's assets and liabilities carried at fair value. The inputs or methodology used for valuing securities may not be an indication of the risk associated with investing in those securities. For more information on valuation inputs, and their aggregation into the levels used below, please refer to the Investment Valuation section in the accompanying Notes to Financial Statements.
| Valuation Inputs at Reporting Date: | ||||
| Description | Total | Level 1 | Level 2 | Level 3 |
| Investments in Securities: | ||||
| Equities: | ||||
| Consumer Discretionary | $15,772,559 | $15,772,559 | $-- | $-- |
| Consumer Staples | 5,938,232 | 5,938,232 | -- | -- |
| Energy | 14,691,711 | 14,691,711 | -- | -- |
| Financials | 39,858,731 | 39,060,839 | 797,892 | -- |
| Health Care | 23,850,207 | 23,850,207 | -- | -- |
| Industrials | 13,065,335 | 13,065,335 | -- | -- |
| Information Technology | 25,821,288 | 25,821,288 | -- | -- |
| Materials | 4,568,783 | 4,568,783 | -- | -- |
| Utilities | 5,705,156 | 5,705,156 | -- | -- |
| Money Market Funds | 6,321,044 | 6,321,044 | -- | -- |
| Total Investments in Securities: | $155,593,046 | $154,795,154 | $797,892 | $-- |
Other Information
Distribution of investments by country or territory of incorporation, as a percentage of Total Net Assets, is as follows (Unaudited):
| United States of America | 86.1% |
| Israel | 2.4% |
| Switzerland | 2.2% |
| Ireland | 2.1% |
| Korea (South) | 1.7% |
| Canada | 1.7% |
| France | 1.5% |
| Netherlands | 1.1% |
| Others (Individually Less Than 1%) | 1.2% |
| 100.0% |
See accompanying notes which are an integral part of the financial statements.
Financial Statements
Statement of Assets and Liabilities
| November 30, 2015 | ||
| Assets | ||
| Investment in securities, at value (including securities loaned of $477,459) — See accompanying schedule: Unaffiliated issuers (cost $143,727,545) | $149,272,002 | |
| Fidelity Central Funds (cost $6,321,044) | 6,321,044 | |
| Total Investments (cost $150,048,589) | $155,593,046 | |
| Foreign currency held at value (cost $17) | 17 | |
| Receivable for investments sold | 3,483,284 | |
| Receivable for fund shares sold | 184,546 | |
| Dividends receivable | 402,669 | |
| Distributions receivable from Fidelity Central Funds | 1,688 | |
| Prepaid expenses | 364 | |
| Other receivables | 9 | |
| Total assets | 159,665,623 | |
| Liabilities | ||
| Payable for investments purchased | $1,094,746 | |
| Payable for fund shares redeemed | 159,173 | |
| Accrued management fee | 82,803 | |
| Distribution and service plan fees payable | 53,252 | |
| Other affiliated payables | 33,697 | |
| Other payables and accrued expenses | 45,895 | |
| Collateral on securities loaned, at value | 492,718 | |
| Total liabilities | 1,962,284 | |
| Net Assets | $157,703,339 | |
| Net Assets consist of: | ||
| Paid in capital | $150,741,271 | |
| Undistributed net investment income | 1,900,740 | |
| Accumulated undistributed net realized gain (loss) on investments and foreign currency transactions | (482,793) | |
| Net unrealized appreciation (depreciation) on investments and assets and liabilities in foreign currencies | 5,544,121 | |
| Net Assets | $157,703,339 | |
| Calculation of Maximum Offering Price | ||
| Class A: | ||
| Net Asset Value and redemption price per share ($67,005,063 ÷ 4,277,848 shares) | $15.66 | |
| Maximum offering price per share (100/94.25 of $15.66) | $16.62 | |
| Class T: | ||
| Net Asset Value and redemption price per share ($34,643,301 ÷ 2,217,267 shares) | $15.62 | |
| Maximum offering price per share (100/96.50 of $15.62) | $16.19 | |
| Class B: | ||
| Net Asset Value and offering price per share ($1,776,241 ÷ 114,688 shares)(a) | $15.49 | |
| Class C: | ||
| Net Asset Value and offering price per share ($28,294,528 ÷ 1,852,841 shares)(a) | $15.27 | |
| Class I: | ||
| Net Asset Value, offering price and redemption price per share ($25,984,206 ÷ 1,630,985 shares) | $15.93 |
(a) Redemption price per share is equal to net asset value less any applicable contingent deferred sales charge.
See accompanying notes which are an integral part of the financial statements.
Statement of Operations
| Year ended November 30, 2015 | ||
| Investment Income | ||
| Dividends | $3,590,922 | |
| Special dividends | 1,294,732 | |
| Interest | 15 | |
| Income from Fidelity Central Funds | 23,389 | |
| Total income | 4,909,058 | |
| Expenses | ||
| Management fee | ||
| Basic fee | $778,511 | |
| Performance adjustment | 100,788 | |
| Transfer agent fees | 322,377 | |
| Distribution and service plan fees | 613,119 | |
| Accounting and security lending fees | 55,551 | |
| Custodian fees and expenses | 12,314 | |
| Independent trustees' compensation | 585 | |
| Registration fees | 72,420 | |
| Audit | 59,867 | |
| Legal | 549 | |
| Miscellaneous | 979 | |
| Total expenses before reductions | 2,017,060 | |
| Expense reductions | (9,176) | 2,007,884 |
| Net investment income (loss) | 2,901,174 | |
| Realized and Unrealized Gain (Loss) | ||
| Net realized gain (loss) on: | ||
| Investment securities: | ||
| Unaffiliated issuers | 3,857,704 | |
| Foreign currency transactions | 2,222 | |
| Futures contracts | (132,655) | |
| Total net realized gain (loss) | 3,727,271 | |
| Change in net unrealized appreciation (depreciation) on: Investment securities | (9,228,349) | |
| Assets and liabilities in foreign currencies | (351) | |
| Total change in net unrealized appreciation (depreciation) | (9,228,700) | |
| Net gain (loss) | (5,501,429) | |
| Net increase (decrease) in net assets resulting from operations | $(2,600,255) |
See accompanying notes which are an integral part of the financial statements.
Statement of Changes in Net Assets
| Year ended November 30, 2015 | Year ended November 30, 2014 | |
| Increase (Decrease) in Net Assets | ||
| Operations | ||
| Net investment income (loss) | $2,901,174 | $904,007 |
| Net realized gain (loss) | 3,727,271 | 15,072,334 |
| Change in net unrealized appreciation (depreciation) | (9,228,700) | (1,986,549) |
| Net increase (decrease) in net assets resulting from operations | (2,600,255) | 13,989,792 |
| Distributions to shareholders from net investment income | (1,112,123) | (521,742) |
| Share transactions - net increase (decrease) | 52,856,883 | 9,971,359 |
| Total increase (decrease) in net assets | 49,144,505 | 23,439,409 |
| Net Assets | ||
| Beginning of period | 108,558,834 | 85,119,425 |
| End of period (including undistributed net investment income of $1,900,740 and undistributed net investment income of $953,800, respectively) | $157,703,339 | $108,558,834 |
See accompanying notes which are an integral part of the financial statements.
Financial Highlights — Fidelity Advisor Equity Value Fund Class A
| Years ended November 30, | 2015 | 2014 | 2013 | 2012 | 2011 |
| Selected Per–Share Data | |||||
| Net asset value, beginning of period | $16.00 | $13.93 | $10.60 | $9.09 | $8.85 |
| Income from Investment Operations | |||||
| Net investment income (loss)A | .35B | .17 | .13 | .12 | .06 |
| Net realized and unrealized gain (loss) | (.50)C | 2.01 | 3.33 | 1.44 | .27 |
| Total from investment operations | (.15) | 2.18 | 3.46 | 1.56 | .33 |
| Distributions from net investment income | (.19) | (.11) | (.13) | (.05) | (.09) |
| Net asset value, end of period | $15.66 | $16.00 | $13.93 | $10.60 | $9.09 |
| Total ReturnD,E | (.91)%C | 15.79% | 33.09% | 17.27% | 3.72% |
| Ratios to Average Net AssetsF,G | |||||
| Expenses before reductions | 1.24% | 1.23% | 1.22% | 1.30% | 1.27% |
| Expenses net of fee waivers, if any | 1.23% | 1.23% | 1.22% | 1.25% | 1.25% |
| Expenses net of all reductions | 1.23% | 1.23% | 1.20% | 1.25% | 1.25% |
| Net investment income (loss) | 2.23%B | 1.15% | 1.07% | 1.20% | .59% |
| Supplemental Data | |||||
| Net assets, end of period (000 omitted) | $67,005 | $50,957 | $39,538 | $29,282 | $27,910 |
| Portfolio turnover rateH | 49% | 68% | 68% | 77% | 65% |
A Calculated based on average shares outstanding during the period.
B Investment income per share reflects a large, non-recurring dividend which amounted to $.14 per share. Excluding this non-recurring dividend, the ratio of net investment income (loss) to average net assets would have been 1.31%.
C Net realized and unrealized gain (loss) per share reflects proceeds from litigation which amounted to $0.01 per share. Excluding these litigation proceeds, the total return would have been (.99)%.
D Total returns would have been lower if certain expenses had not been reduced during the applicable periods shown.
E Total returns do not include the effect of the sales charges.
F Fees and expenses of any underlying Fidelity Central Funds are not included in the Fund's expense ratio. The Fund indirectly bears its proportionate share of the expenses of any underlying Fidelity Central Funds.
G Expense ratios reflect operating expenses of the class. Expenses before reductions do not reflect amounts reimbursed by the investment adviser or reductions from brokerage service arrangements or reductions from other expense offset arrangements and do not represent the amount paid by the class during periods when reimbursements or reductions occur. Expenses net of fee waivers reflect expenses after reimbursement by the investment adviser but prior to reductions from brokerage service arrangements or other expense offset arrangements. Expenses net of all reductions represent the net expenses paid by the class.
H Amount does not include the portfolio activity of any underlying Fidelity Central Funds.
See accompanying notes which are an integral part of the financial statements.
Financial Highlights — Fidelity Advisor Equity Value Fund Class T
| Years ended November 30, | 2015 | 2014 | 2013 | 2012 | 2011 |
| Selected Per–Share Data | |||||
| Net asset value, beginning of period | $15.96 | $13.90 | $10.57 | $9.06 | $8.81 |
| Income from Investment Operations | |||||
| Net investment income (loss)A | .31B | .13 | .10 | .09 | .03 |
| Net realized and unrealized gain (loss) | (.50)C | 2.01 | 3.34 | 1.44 | .28 |
| Total from investment operations | (.19) | 2.14 | 3.44 | 1.53 | .31 |
| Distributions from net investment income | (.15) | (.08) | (.11) | (.02) | (.06) |
| Net asset value, end of period | $15.62 | $15.96 | $13.90 | $10.57 | $9.06 |
| Total ReturnD,E | (1.19)%C | 15.46% | 32.82% | 16.94% | 3.53% |
| Ratios to Average Net AssetsF,G | |||||
| Expenses before reductions | 1.50% | 1.49% | 1.48% | 1.55% | 1.53% |
| Expenses net of fee waivers, if any | 1.50% | 1.49% | 1.48% | 1.50% | 1.50% |
| Expenses net of all reductions | 1.50% | 1.49% | 1.46% | 1.50% | 1.50% |
| Net investment income (loss) | 1.96%B | .88% | .81% | .95% | .34% |
| Supplemental Data | |||||
| Net assets, end of period (000 omitted) | $34,643 | $31,087 | $27,241 | $21,212 | $21,319 |
| Portfolio turnover rateH | 49% | 68% | 68% | 77% | 65% |
A Calculated based on average shares outstanding during the period.
B Investment income per share reflects a large, non-recurring dividend which amounted to $.14 per share. Excluding this non-recurring dividend, the ratio of net investment income (loss) to average net assets would have been 1.05%.
C Net realized and unrealized gain (loss) per share reflects proceeds from litigation which amounted to $0.01 per share. Excluding these litigation proceeds, the total return would have been (1.27)%.
D Total returns would have been lower if certain expenses had not been reduced during the applicable periods shown.
E Total returns do not include the effect of the sales charges.
F Fees and expenses of any underlying Fidelity Central Funds are not included in the Fund's expense ratio. The Fund indirectly bears its proportionate share of the expenses of any underlying Fidelity Central Funds.
G Expense ratios reflect operating expenses of the class. Expenses before reductions do not reflect amounts reimbursed by the investment adviser or reductions from brokerage service arrangements or reductions from other expense offset arrangements and do not represent the amount paid by the class during periods when reimbursements or reductions occur. Expenses net of fee waivers reflect expenses after reimbursement by the investment adviser but prior to reductions from brokerage service arrangements or other expense offset arrangements. Expenses net of all reductions represent the net expenses paid by the class.
H Amount does not include the portfolio activity of any underlying Fidelity Central Funds.
See accompanying notes which are an integral part of the financial statements.
Financial Highlights — Fidelity Advisor Equity Value Fund Class B
| Years ended November 30, | 2015 | 2014 | 2013 | 2012 | 2011 |
| Selected Per–Share Data | |||||
| Net asset value, beginning of period | $15.81 | $13.76 | $10.45 | $8.98 | $8.73 |
| Income from Investment Operations | |||||
| Net investment income (loss)A | .23B | .06 | .04 | .04 | (.01) |
| Net realized and unrealized gain (loss) | (.49)C | 1.99 | 3.31 | 1.43 | .27 |
| Total from investment operations | (.26) | 2.05 | 3.35 | 1.47 | .26 |
| Distributions from net investment income | (.06) | – | (.04) | – | (.01) |
| Net asset value, end of period | $15.49 | $15.81 | $13.76 | $10.45 | $8.98 |
| Total ReturnD,E | (1.65)%C | 14.90% | 32.13% | 16.37% | 2.96% |
| Ratios to Average Net AssetsF,G | |||||
| Expenses before reductions | 2.08% | 2.04% | 1.99% | 2.06% | 2.02% |
| Expenses net of fee waivers, if any | 2.00% | 2.00% | 1.99% | 2.00% | 2.00% |
| Expenses net of all reductions | 2.00% | 1.99% | 1.97% | 2.00% | 2.00% |
| Net investment income (loss) | 1.46%B | .38% | .30% | .45% | (.16)% |
| Supplemental Data | |||||
| Net assets, end of period (000 omitted) | $1,776 | $2,738 | $2,886 | $2,981 | $3,884 |
| Portfolio turnover rateH | 49% | 68% | 68% | 77% | 65% |
A Calculated based on average shares outstanding during the period.
B Investment income per share reflects a large, non-recurring dividend which amounted to $.14 per share. Excluding this non-recurring dividend, the ratio of net investment income (loss) to average net assets would have been .55%.
C Net realized and unrealized gain (loss) per share reflects proceeds from litigation which amounted to $0.01 per share. Excluding these litigation proceeds, the total return would have been (1.73)%.
D Total returns would have been lower if certain expenses had not been reduced during the applicable periods shown.
E Total returns do not include the effect of the contingent deferred sales charge.
F Fees and expenses of any underlying Fidelity Central Funds are not included in the Fund's expense ratio. The Fund indirectly bears its proportionate share of the expenses of any underlying Fidelity Central Funds.
G Expense ratios reflect operating expenses of the class. Expenses before reductions do not reflect amounts reimbursed by the investment adviser or reductions from brokerage service arrangements or reductions from other expense offset arrangements and do not represent the amount paid by the class during periods when reimbursements or reductions occur. Expenses net of fee waivers reflect expenses after reimbursement by the investment adviser but prior to reductions from brokerage service arrangements or other expense offset arrangements. Expenses net of all reductions represent the net expenses paid by the class.
H Amount does not include the portfolio activity of any underlying Fidelity Central Funds.
See accompanying notes which are an integral part of the financial statements.
Financial Highlights — Fidelity Advisor Equity Value Fund Class C
| Years ended November 30, | 2015 | 2014 | 2013 | 2012 | 2011 |
| Selected Per–Share Data | |||||
| Net asset value, beginning of period | $15.63 | $13.63 | $10.37 | $8.91 | $8.67 |
| Income from Investment Operations | |||||
| Net investment income (loss)A | .23B | .06 | .04 | .04 | (.01) |
| Net realized and unrealized gain (loss) | (.49)C | 1.97 | 3.28 | 1.42 | .27 |
| Total from investment operations | (.26) | 2.03 | 3.32 | 1.46 | .26 |
| Distributions from net investment income | (.10) | (.03) | (.06) | – | (.02) |
| Net asset value, end of period | $15.27 | $15.63 | $13.63 | $10.37 | $8.91 |
| Total ReturnD,E | (1.68)%C | 14.90% | 32.16% | 16.39% | 2.95% |
| Ratios to Average Net AssetsF,G | |||||
| Expenses before reductions | 2.00% | 2.00% | 1.97% | 2.05% | 2.02% |
| Expenses net of fee waivers, if any | 2.00% | 2.00% | 1.97% | 2.00% | 2.00% |
| Expenses net of all reductions | 2.00% | 1.99% | 1.96% | 2.00% | 2.00% |
| Net investment income (loss) | 1.46%B | .38% | .32% | .45% | (.16)% |
| Supplemental Data | |||||
| Net assets, end of period (000 omitted) | $28,295 | $18,614 | $12,329 | $8,785 | $8,922 |
| Portfolio turnover rateH | 49% | 68% | 68% | 77% | 65% |
A Calculated based on average shares outstanding during the period.
B Investment income per share reflects a large, non-recurring dividend which amounted to $.14 per share. Excluding this non-recurring dividend, the ratio of net investment income (loss) to average net assets would have been .55%.
C Net realized and unrealized gain (loss) per share reflects proceeds from litigation which amounted to $0.01 per share. Excluding these litigation proceeds, the total return would have been (1.76)%.
D Total returns would have been lower if certain expenses had not been reduced during the applicable periods shown.
E Total returns do not include the effect of the contingent deferred sales charge.
F Fees and expenses of any underlying Fidelity Central Funds are not included in the Fund's expense ratio. The Fund indirectly bears its proportionate share of the expenses of any underlying Fidelity Central Funds.
G Expense ratios reflect operating expenses of the class. Expenses before reductions do not reflect amounts reimbursed by the investment adviser or reductions from brokerage service arrangements or reductions from other expense offset arrangements and do not represent the amount paid by the class during periods when reimbursements or reductions occur. Expenses net of fee waivers reflect expenses after reimbursement by the investment adviser but prior to reductions from brokerage service arrangements or other expense offset arrangements. Expenses net of all reductions represent the net expenses paid by the class.
H Amount does not include the portfolio activity of any underlying Fidelity Central Funds.
See accompanying notes which are an integral part of the financial statements.
Financial Highlights — Fidelity Advisor Equity Value Fund Class I
| Years ended November 30, | 2015 | 2014 | 2013 | 2012 | 2011 |
| Selected Per–Share Data | |||||
| Net asset value, beginning of period | $16.27 | $14.16 | $10.75 | $9.22 | $8.97 |
| Income from Investment Operations | |||||
| Net investment income (loss)A | .40B | .22 | .17 | .15 | .08 |
| Net realized and unrealized gain (loss) | (.50)C | 2.04 | 3.39 | 1.45 | .29 |
| Total from investment operations | (.10) | 2.26 | 3.56 | 1.60 | .37 |
| Distributions from net investment income | (.24) | (.15) | (.15) | (.07) | (.12) |
| Net asset value, end of period | $15.93 | $16.27 | $14.16 | $10.75 | $9.22 |
| Total ReturnD | (.60)%C | 16.16% | 33.61% | 17.49% | 4.05% |
| Ratios to Average Net AssetsE,F | |||||
| Expenses before reductions | .93% | .91% | .89% | .96% | 1.01% |
| Expenses net of fee waivers, if any | .93% | .91% | .89% | .96% | 1.00% |
| Expenses net of all reductions | .93% | .91% | .87% | .96% | 1.00% |
| Net investment income (loss) | 2.53%B | 1.46% | 1.40% | 1.49% | .84% |
| Supplemental Data | |||||
| Net assets, end of period (000 omitted) | $25,984 | $5,162 | $3,126 | $2,123 | $3,381 |
| Portfolio turnover rateG | 49% | 68% | 68% | 77% | 65% |
A Calculated based on average shares outstanding during the period.
B Investment income per share reflects a large, non-recurring dividend which amounted to $.15 per share. Excluding this non-recurring dividend, the ratio of net investment income (loss) to average net assets would have been 1.61%.
C Net realized and unrealized gain (loss) per share reflects proceeds from litigation which amounted to $0.01 per share. Excluding these litigation proceeds, the total return would have been (.68)%.
D Total returns would have been lower if certain expenses had not been reduced during the applicable periods shown.
E Fees and expenses of any underlying Fidelity Central Funds are not included in the Fund's expense ratio. The Fund indirectly bears its proportionate share of the expenses of any underlying Fidelity Central Funds.
F Expense ratios reflect operating expenses of the class. Expenses before reductions do not reflect amounts reimbursed by the investment adviser or reductions from brokerage service arrangements or reductions from other expense offset arrangements and do not represent the amount paid by the class during periods when reimbursements or reductions occur. Expenses net of fee waivers reflect expenses after reimbursement by the investment adviser but prior to reductions from brokerage service arrangements or other expense offset arrangements. Expenses net of all reductions represent the net expenses paid by the class.
G Amount does not include the portfolio activity of any underlying Fidelity Central Funds.
See accompanying notes which are an integral part of the financial statements.
Notes to Financial Statements
For the period ended November 30, 2015
1. Organization.
Fidelity Advisor Equity Value Fund (the Fund) is a fund of Fidelity Advisor Series I (the Trust) and is authorized to issue an unlimited number of shares. The Trust is registered under the Investment Company Act of 1940, as amended (the 1940 Act), as an open-end management investment company organized as a Massachusetts business trust. The Fund offers Class A, Class T, Class C, and Class I (formerly Institutional Class) shares, each of which, along with Class B shares, has equal rights as to assets and voting privileges. Class B shares are closed to new accounts and additional purchases, except for exchanges and reinvestments. Each class has exclusive voting rights with respect to matters that affect that class. Class B shares will automatically convert to Class A shares after a holding period of seven years from the initial date of purchase.
2. Investments in Fidelity Central Funds.
The Fund invests in Fidelity Central Funds, which are open-end investment companies generally available only to other investment companies and accounts managed by the investment adviser and its affiliates. The Fund's Schedule of Investments lists each of the Fidelity Central Funds held as of period end, if any, as an investment of the Fund, but do not include the underlying holdings of each Fidelity Central Fund. As an Investing Fund, the Fund indirectly bears its proportionate share of the expenses of the underlying Fidelity Central Funds.
The Money Market Central Funds seek preservation of capital and current income and are managed by Fidelity Investments Money Management, Inc. (FIMM), an affiliate of the investment adviser. Annualized expenses of the Money Market Central Funds as of their most recent shareholder report date are less than .005%.
A complete unaudited list of holdings for each Fidelity Central Fund is available upon request or at the Securities and Exchange Commission (the SEC) website at www.sec.gov. In addition, the financial statements of the Fidelity Central Funds, which are not covered by the Fund's Report of Independent Registered Public Accounting Firm, are available on the SEC website or upon request.
3. Significant Accounting Policies.
The financial statements have been prepared in conformity with accounting principles generally accepted in the United States of America (GAAP), which require management to make certain estimates and assumptions at the date of the financial statements. Actual results could differ from those estimates. Subsequent events, if any, through the date that the financial statements were issued have been evaluated in the preparation of the financial statements. The following summarizes the significant accounting policies of the Fund:
Investment Valuation. Investments are valued as of 4:00 p.m. Eastern time on the last calendar day of the period. The Board of Trustees (the Board) has delegated the day to day responsibility for the valuation of the Fund's investments to the Fidelity Management & Research Company (FMR) Fair Value Committee (the Committee). In accordance with valuation policies and procedures approved by the Board, the Fund attempts to obtain prices from one or more third party pricing vendors or brokers to value its investments. When current market prices, quotations or currency exchange rates are not readily available or reliable, investments will be fair valued in good faith by the Committee, in accordance with procedures adopted by the Board. Factors used in determining fair value vary by investment type and may include market or investment specific events. The frequency with which these procedures are used cannot be predicted and they may be utilized to a significant extent. The Committee oversees the Fund's valuation policies and procedures and reports to the Board on the Committee's activities and fair value determinations. The Board monitors the appropriateness of the procedures used in valuing the Fund's investments and ratifies the fair value determinations of the Committee.
The Fund categorizes the inputs to valuation techniques used to value its investments into a disclosure hierarchy consisting of three levels as shown below:
- Level 1 – quoted prices in active markets for identical investments
- Level 2 – other significant observable inputs (including quoted prices for similar investments, interest rates, prepayment speeds, etc.)
- Level 3 – unobservable inputs (including the Fund's own assumptions based on the best information available)
Valuation techniques used to value the Fund's investments by major category are as follows:
Equity securities, including restricted securities, for which market quotations are readily available, are valued at the last reported sale price or official closing price as reported by a third party pricing vendor on the primary market or exchange on which they are traded and are categorized as Level 1 in the hierarchy. In the event there were no sales during the day or closing prices are not available, securities are valued at the last quoted bid price or may be valued using the last available price and are generally categorized as Level 2 in the hierarchy. For foreign equity securities, when market or security specific events arise, comparisons to the valuation of American Depositary Receipts (ADRs), futures contracts, Exchange-Traded Funds (ETFs) and certain indexes as well as quoted prices for similar securities may be used and would be categorized as Level 2 in the hierarchy. Utilizing these techniques may result in transfers between Level 1 and Level 2. For equity securities, including restricted securities, where observable inputs are limited, assumptions about market activity and risk are used and these securities may be categorized as Level 3 in the hierarchy.
Investments in open-end mutual funds, including the Fidelity Central Funds, are valued at their closing net asset value (NAV) each business day and are categorized as Level 1 in the hierarchy.
Changes in valuation techniques may result in transfers in or out of an assigned level within the disclosure hierarchy. The aggregate value of investments by input level as of November 30, 2015 is included at the end of the Fund's Schedule of Investments.
Foreign Currency. The Fund may use foreign currency contracts to facilitate transactions in foreign-denominated securities. Gains and losses from these transactions may arise from changes in the value of the foreign currency or if the counterparties do not perform under the contracts' terms.
Foreign-denominated assets, including investment securities, and liabilities are translated into U.S. dollars at the exchange rates at period end. Purchases and sales of investment securities, income and dividends received and expenses denominated in foreign currencies are translated into U.S. dollars at the exchange rate in effect on the transaction date.
The effects of exchange rate fluctuations on investments are included with the net realized and unrealized gain (loss) on investment securities. Other foreign currency transactions resulting in realized and unrealized gain (loss) are disclosed separately.
Investment Transactions and Income. For financial reporting purposes, the Fund's investment holdings and NAV include trades executed through the end of the last business day of the period. The NAV per share for processing shareholder transactions is calculated as of the close of business of the New York Stock Exchange (NYSE), normally 4:00 p.m. Eastern time and includes trades executed through the end of the prior business day. Gains and losses on securities sold are determined on the basis of identified cost and may include proceeds received from litigation. Dividend income is recorded on the ex-dividend date, except for certain dividends from foreign securities where the ex-dividend date may have passed, which are recorded as soon as the Fund is informed of the ex-dividend date. Non-cash dividends included in dividend income, if any, are recorded at the fair market value of the securities received. Income and capital gain distributions from Fidelity Central Funds, if any, are recorded on the ex-dividend date. Distributions received on securities that represent a return of capital or capital gain are recorded as a reduction of cost of investments and/or as a realized gain. Subsequent to ex-dividend date the Fund determines the components of these distributions, based upon receipt of tax filings or other correspondence relating to the underlying investment. Large, non-recurring dividends recognized by the Fund are presented separately on the Statement of Operations as "Special Dividends" and the impact of these dividends is presented in the Financial Highlights. Interest income is accrued as earned and includes coupon interest and amortization of premium and accretion of discount on debt securities as applicable. Investment income is recorded net of foreign taxes withheld where recovery of such taxes is uncertain.
Class Allocations and Expenses. Investment income, realized and unrealized capital gains and losses, common expenses of the Fund, and certain fund-level expense reductions, if any, are allocated daily on a pro-rata basis to each class based on the relative net assets of each class to the total net assets of the Fund. Each class differs with respect to transfer agent and distribution and service plan fees incurred. Certain expense reductions may also differ by class. For the reporting period, the allocated portion of income and expenses to each class as a percent of its average net assets may vary due to the timing of recording these transactions in relation to fluctuating net assets of the classes. Expenses directly attributable to a fund are charged to that fund. Expenses attributable to more than one fund are allocated among the respective funds on the basis of relative net assets or other appropriate methods. Expense estimates are accrued in the period to which they relate and adjustments are made when actual amounts are known.
Income Tax Information and Distributions to Shareholders. Each year, the Fund intends to qualify as a regulated investment company under Subchapter M of the Internal Revenue Code, including distributing substantially all of its taxable income and realized gains. As a result, no provision for U.S. Federal income taxes is required. As of November 30, 2015, the Fund did not have any unrecognized tax benefits in the financial statements; nor is the Fund aware of any tax positions for which it is reasonably possible that the total amounts of unrecognized tax benefits will significantly change in the next twelve months. The Fund files a U.S. federal tax return, in addition to state and local tax returns as required. The Fund's federal income tax returns are subject to examination by the Internal Revenue Service (IRS) for a period of three fiscal years after they are filed. State and local tax returns may be subject to examination for an additional fiscal year depending on the jurisdiction. Foreign taxes are provided for based on the Fund's understanding of the tax rules and rates that exist in the foreign markets in which it invests.
Distributions are declared and recorded on the ex-dividend date. Income dividends and capital gain distributions are declared separately for each class. Income and capital gain distributions are determined in accordance with income tax regulations, which may differ from GAAP. In addition, the fund claimed a portion of the payment made to redeeming shareholders as a distribution for income tax purposes.
Capital accounts within the financial statements are adjusted for permanent book-tax differences. These adjustments have no impact on net assets or the results of operations. Capital accounts are not adjusted for temporary book-tax differences which will reverse in a subsequent period.
Book-tax differences are primarily due to foreign currency transactions, market discount, passive foreign investment companies (PFIC), partnerships, capital loss carryforwards and losses deferred due to wash sales and excise tax regulations.
The federal tax cost of investment securities and unrealized appreciation (depreciation) as of period end were as follows:
| Gross unrealized appreciation | $13,603,727 |
| Gross unrealized depreciation | (8,406,466) |
| Net unrealized appreciation (depreciation) on securities | $5,197,261 |
| Tax Cost | $150,395,785 |
The tax-based components of distributable earnings as of period end were as follows:
| Undistributed ordinary income | $1,900,739 |
| Undistributed long-term capital gain | $1,374,604 |
| Net unrealized appreciation (depreciation) on securities and other investments | $5,196,925 |
The Fund intends to elect to defer to its next fiscal year $1,510,201 of capital losses recognized during the period November 1, 2015 to November 30, 2015.
The tax character of distributions paid was as follows:
| November 30, 2015 | November 30, 2014 | |
| Ordinary Income | $1,112,123 | $ 521,742 |
4. Derivative Instruments.
Risk Exposures and the Use of Derivative Instruments. The Fund's investment objective allows the Fund to enter into various types of derivative contracts, including futures contracts. Derivatives are investments whose value is primarily derived from underlying assets, indices or reference rates and may be transacted on an exchange or over-the-counter (OTC). Derivatives may involve a future commitment to buy or sell a specified asset based on specified terms, to exchange future cash flows at periodic intervals based on a notional principal amount, or for one party to make one or more payments upon the occurrence of specified events in exchange for periodic payments from the other party.
The Fund used derivatives to increase returns and to manage exposure to certain risks as defined below. The success of any strategy involving derivatives depends on analysis of numerous economic factors, and if the strategies for investment do not work as intended, the Fund may not achieve its objectives.
The Fund's use of derivatives increased or decreased its exposure to the following risk:
| Equity Risk | Equity risk relates to the fluctuations in the value of financial instruments as a result of changes in market prices (other than those arising from interest rate risk or foreign exchange risk), whether caused by factors specific to an individual investment, its issuer, or all factors affecting all instruments traded in a market or market segment. |
The Fund is also exposed to additional risks from investing in derivatives, such as liquidity risk and counterparty credit risk. Liquidity risk is the risk that the Fund will be unable to close out the derivative in the open market in a timely manner. Counterparty credit risk is the risk that the counterparty will not be able to fulfill its obligation to the Fund. Counterparty credit risk related to exchange-traded futures contracts may be mitigated by the protection provided by the exchange on which they trade.
Investing in derivatives may involve greater risks than investing in the underlying assets directly and, to varying degrees, may involve risk of loss in excess of any initial investment and collateral received and amounts recognized in the Statement of Assets and Liabilities. In addition, there may be the risk that the change in value of the derivative contract does not correspond to the change in value of the underlying instrument.
Futures Contracts. A futures contract is an agreement between two parties to buy or sell a specified underlying instrument for a fixed price at a specified future date. The Fund used futures contracts to manage its exposure to the stock market.
Upon entering into a futures contract, a fund is required to deposit either cash or securities (initial margin) with a clearing broker in an amount equal to a certain percentage of the face value of the contract. Futures contracts are marked-to-market daily and subsequent daily payments (variation margin) are made or received by a fund depending on the daily fluctuations in the value of the futures contracts and are recorded as unrealized appreciation or (depreciation). This receivable and/or payable, if any, is included in daily variation margin for derivative instruments in the Statement of Assets and Liabilities. Realized gain or (loss) is recorded upon the expiration or closing of a futures contract.
Any open futures contracts at period end are presented in the Schedule of Investments under the caption "Futures Contracts". The underlying face amount at value reflects each contract's exposure to the underlying instrument or index at period end.
During the period the Fund recognized net realized gain (loss) of $(132,655) related to its investment in futures contracts. This amount is included in the Statement of Operations.
5. Purchases and Sales of Investments.
Purchases and sales of securities, other than short-term securities, aggregated $114,194,087 and $65,358,664, respectively.
6. Fees and Other Transactions with Affiliates.
Management Fee. Fidelity Management & Research Company (the investment adviser) and its affiliates provide the Fund with investment management related services for which the Fund pays a monthly management fee. The management fee is the sum of an individual fund fee rate that is based on an annual rate of .30% of the Fund's average net assets and an annualized group fee rate that averaged .25% during the period. The group fee rate is based upon the average net assets of all the mutual funds advised by the investment adviser, including any mutual funds previously advised by the investment adviser that are currently advised by Fidelity SelectCo, LLC, an affiliate of the investment adviser. The group fee rate decreases as assets under management increase and increases as assets under management decrease. In addition, the management fee is subject to a performance adjustment (up to a maximum of +/- .20% of the Fund's average net assets over a 36 month performance period). The upward or downward adjustment to the management fee is based on the relative investment performance of Class I of the Fund as compared to its benchmark index, the Russell 3000 Value Index, over the same 36 month performance period. For the reporting period, the total annual management fee rate, including the performance adjustment, was .62% of the Fund's average net assets. The performance adjustment included in the management fee rate may be higher or lower than the maximum performance adjustment rate due to the difference between the average net assets for the reporting and performance periods.
Distribution and Service Plan Fees. In accordance with Rule 12b-1 of the 1940 Act, the Fund has adopted separate Distribution and Service Plans for each class of shares. Certain classes pay Fidelity Distributors Corporation (FDC), an affiliate of the investment adviser, separate Distribution and Service Fees, each of which is based on an annual percentage of each class' average net assets. In addition, FDC may pay financial intermediaries for selling shares of the Fund and providing shareholder support services. For the period, the Distribution and Service Fee rates, total fees and amounts retained by FDC were as follows:
| Distribution Fee | Service Fee | Total Fees | Retained by FDC | |
| Class A | -% | .25% | $154,435 | $2,800 |
| Class T | .25% | .25% | 173,996 | 4 |
| Class B | .75% | .25% | 23,617 | 17,726 |
| Class C | .75% | .25% | 261,071 | 47,750 |
| $613,119 | $68,280 |
Sales Load. FDC may receive a front-end sales charge of up to 5.75% for selling Class A shares and 3.50% for selling Class T shares, some of which is paid to financial intermediaries for selling shares of the Fund. Depending on the holding period, FDC may receive contingent deferred sales charges levied on Class A, Class T, Class B, and Class C redemptions. The deferred sales charges range from 5.00% to 1.00% for Class B shares, 1.00% for Class C shares, 1.00% for certain purchases of Class A shares and .25% for certain purchases of Class T shares.
For the period, sales charge amounts retained by FDC were as follows:
| Retained by FDC | |
| Class A | $44,961 |
| Class T | 8,330 |
| Class B(a) | 406 |
| Class C(a) | 4,176 |
| $57,873 |
(a) When Class B and Class C shares are initially sold, FDC pays commissions from its own resources to financial intermediaries through which the sales are made.
Transfer Agent Fees. Fidelity Investments Institutional Operations Company, Inc., (FIIOC), an affiliate of the investment adviser, is the transfer, dividend disbursing and shareholder servicing agent for each class of the Fund. FIIOC receives account fees and asset-based fees that vary according to the account size and type of account of the shareholders of the respective classes of the Fund. FIIOC pays for typesetting, printing and mailing of shareholder reports, except proxy statements.
For the period, transfer agent fees for each class were as follows:
| Amount | % of Class-Level Average Net Assets | |
| Class A | $138,529 | .22 |
| Class T | 83,959 | .24 |
| Class B | 7,234 | .31 |
| Class C | 61,424 | .24 |
| Class I | 31,231 | .18 |
| $322,377 |
Accounting and Security Lending Fees. Fidelity Service Company, Inc. (FSC), an affiliate of the investment adviser, maintains the Fund's accounting records. The accounting fee is based on the level of average net assets for each month. Under a separate contract, FSC administers the security lending program. The security lending fee is based on the number and duration of lending transactions.
Brokerage Commissions. The Fund placed a portion of its portfolio transactions with brokerage firms which are affiliates of the investment adviser. Brokerage commissions are included in net realized gain (loss) and change in net unrealized appreciation (depreciation) in the Statement of Operations. The commissions paid to these affiliated firms were $1,208 for the period.
7. Committed Line of Credit.
The Fund participates with other funds managed by the investment adviser or an affiliate in a $4.25 billion credit facility (the "line of credit") to be utilized for temporary or emergency purposes to fund shareholder redemptions or for other short-term liquidity purposes. The Fund has agreed to pay commitment fees on its pro-rata portion of the line of credit, which amounted to $189 and is reflected in Miscellaneous expenses on the Statement of Operations. During the period, the Fund did not borrow on this line of credit.
8. Security Lending.
The Fund lends portfolio securities through a lending agent from time to time in order to earn additional income. For equity securities, a lending agent is used and may loan securities to certain qualified borrowers, including Fidelity Capital Markets (FCM), a broker-dealer affiliated with the Fund. On the settlement date of the loan, the Fund receives collateral (in the form of U.S. Treasury obligations, letters of credit and/or cash) against the loaned securities and maintains collateral in an amount not less than 100% of the market value of the loaned securities during the period of the loan. The market value of the loaned securities is determined at the close of business of the Fund and any additional required collateral is delivered to the Fund on the next business day. The Fund or borrower may terminate the loan at any time, and if the borrower defaults on its obligation to return the securities loaned because of insolvency or other reasons, the Fund may apply collateral received from the borrower against the obligation. The Fund may experience delays and costs in recovering the securities loaned. Any cash collateral received is invested in the Fidelity Securities Lending Cash Central Fund. The value of loaned securities and cash collateral at period end are disclosed on the Fund's Statement of Assets and Liabilities. Security lending income represents the income earned on investing cash collateral, less rebates paid to borrowers and any lending agent fees associated with the loan, plus any premium payments received for lending certain types of securities. Security lending income is presented in the Statement of Operations as a component of income from Fidelity Central Funds. Total security lending income during the period amounted to $10,163. During the period, there were no securities loaned to FCM.
9. Expense Reductions.
The investment adviser voluntarily agreed to reimburse each class to the extent annual operating expenses exceeded certain levels of average net assets as noted in the table below. Some expenses, for example interest expense, including commitment fees, are excluded from this reimbursement.
The following classes were in reimbursement during the period:
| Expense Limitations | Reimbursement | |
| Class T | 1.50% | 1,511 |
| Class B | 2.00% | 1,810 |
| Class C | 2.00% | 801 |
| $4,122 |
In addition, during the period the investment adviser reimbursed and/or waived a portion of fund-level operating expenses in the amount of $622 and a portion of class-level operating expenses as follows:
| Amount | |
| Class A | $1,005 |
| Class T | 634 |
| Class B | 6 |
| Class C | 351 |
| Class I | 121 |
| $2,117 |
Commissions paid to certain brokers with whom the investment adviser, or its affiliates, places trades on behalf of the Fund include an amount in addition to trade execution, which may be rebated back to the Fund to offset certain expenses. This amount totaled $2,315 for the period
10. Distributions to Shareholders.
Distributions to shareholders of each class were as follows:
| Years ended November 30, | 2015 | 2014 |
| From net investment income | ||
| Class A | $615,978 | $313,844 |
| Class T | 290,749 | 150,475 |
| Class B | 10,041 | – |
| Class C | 117,971 | 23,680 |
| Class I | 77,384 | 33,743 |
| Total | $1,112,123 | $521,742 |
11. Share Transactions.
Share transactions for each class were as follows and may contain automatic conversions between classes or exchanges between funds:
| Shares | Shares | Dollars | Dollars | |
| Years ended November 30, | 2015 | 2014 | 2015 | 2014 |
| Class A | ||||
| Shares sold | 2,015,005 | 970,744 | $32,448,584 | $14,424,123 |
| Reinvestment of distributions | 38,605 | 21,597 | 595,591 | 293,073 |
| Shares redeemed | (960,120) | (645,902) | (15,261,622) | (9,642,824) |
| Net increase (decrease) | 1,093,490 | 346,439 | $17,782,553 | $5,074,372 |
| Class T | ||||
| Shares sold | 826,030 | 455,273 | $13,376,322 | $6,703,728 |
| Reinvestment of distributions | 18,532 | 10,805 | 286,169 | 146,522 |
| Shares redeemed | (575,170) | (478,458) | (9,138,418) | (7,047,321) |
| Net increase (decrease) | 269,392 | (12,380) | $4,524,073 | $(197,071) |
| Class B | ||||
| Shares sold | 35,557 | 32,366 | $577,356 | $476,104 |
| Reinvestment of distributions | 629 | – | 9,736 | – |
| Shares redeemed | (94,699) | (68,915) | (1,497,315) | (1,011,558) |
| Net increase (decrease) | (58,513) | (36,549) | $(910,223) | $(535,454) |
| Class C | ||||
| Shares sold | 1,023,935 | 474,669 | $15,818,813 | $6,945,091 |
| Reinvestment of distributions | 7,049 | 1,582 | 107,103 | 21,115 |
| Shares redeemed | (369,314) | (189,954) | (5,731,970) | (2,772,301) |
| Net increase (decrease) | 661,670 | 286,297 | $10,193,946 | $4,193,905 |
| Class I | ||||
| Shares sold | 1,650,138 | 213,556 | $26,551,745 | $3,228,875 |
| Reinvestment of distributions | 4,819 | 2,352 | 75,344 | 32,366 |
| Shares redeemed | (341,188) | (119,400) | (5,360,555) | (1,825,634) |
| Net increase (decrease) | 1,313,769 | 96,508 | $21,266,534 | $1,435,607 |
12. Other.
The Fund's organizational documents provide former and current trustees and officers with a limited indemnification against liabilities arising in connection with the performance of their duties to the Fund. In the normal course of business, the Fund may also enter into contracts that provide general indemnifications. The Fund's maximum exposure under these arrangements is unknown as this would be dependent on future claims that may be made against the Fund. The risk of material loss from such claims is considered remote.
Report of Independent Registered Public Accounting Firm
To the Trustees of Fidelity Advisor Series I and Shareholders of Fidelity Advisor® Equity Value Fund:
We have audited the accompanying statement of assets and liabilities of Fidelity Advisor® Equity Value Fund (the Fund), a fund of Fidelity Advisor Series I, including the schedule of investments, as of November 30, 2015, and the related statement of operations year then ended, the statement of changes in net assets for each of the two years in the period then ended, and the financial highlights for each of the five years in the period then ended. These financial statements and financial highlights are the responsibility of the Fund's management, Our responsibility is to express an opinion on these financial statements and financial highlights based on our audits.
We conducted our audits in accordance with the standards of the Public Company Accounting Oversight Board (United States). Those standards require that we plan and perform the audit to obtain reasonable assurance about whether the financial statements and financial highlights are free of material misstatement. The Fund is not required to have, nor were we engaged to perform, an audit of its internal control over financial reporting. Our audits included consideration of internal control over financial reporting as a basis for designing audit procedures that are appropriate in the circumstances, but not for the purpose of expressing an opinion on the effectiveness of the Fund's internal control over financial reporting. Accordingly, we express no such opinion. An audit also includes examining, on a test basis, evidence supporting the amounts and disclosures in the financial statements, assessing the accounting principles used and significant estimates made by management, as well as evaluating the overall financial statement presentation. Our procedures included confirmation of securities owned as of November 30, 2015, by correspondence with the custodians and brokers; when replies were not received from brokers, we performed other auditing procedures. We believe our audits provide a reasonable basis for our opinion.
In our opinion, such financial statements and financial highlights referred to above present fairly, in all material respects, the financial position of Fidelity Advisor® Equity Value Fund as of November 30, 2015, the results of its operations for the year then ended, the changes in its net assets for each of the two years in the period then ended, and the financial highlights for each of the five years in the period then ended in conformity with accounting principles generally accepted in the United States of America.
DELOITTE & TOUCHE LLP
Boston, Massachusetts
January 15, 2016
Trustees and Officers
The Trustees, Members of the Advisory Board (if any), and officers of the trust and fund, as applicable, are listed below. The Board of Trustees governs the fund and is responsible for protecting the interests of shareholders. The Trustees are experienced executives who meet periodically throughout the year to oversee the fund's activities, review contractual arrangements with companies that provide services to the fund, oversee management of the risks associated with such activities and contractual arrangements, and review the fund's performance. Each of the Trustees oversees 170 funds.
The Trustees hold office without limit in time except that (a) any Trustee may resign; (b) any Trustee may be removed by written instrument, signed by at least two-thirds of the number of Trustees prior to such removal; (c) any Trustee who requests to be retired or who has become incapacitated by illness or injury may be retired by written instrument signed by a majority of the other Trustees; and (d) any Trustee may be removed at any special meeting of shareholders by a two-thirds vote of the outstanding voting securities of the trust. Each Trustee who is not an interested person (as defined in the 1940 Act) of the trust and the fund is referred to herein as an Independent Trustee. Each Independent Trustee shall retire not later than the last day of the calendar year in which his or her 75th birthday occurs. The Independent Trustees may waive this mandatory retirement age policy with respect to individual Trustees. Officers and Advisory Board Members hold office without limit in time, except that any officer or Advisory Board Member may resign or may be removed by a vote of a majority of the Trustees at any regular meeting or any special meeting of the Trustees. Except as indicated, each individual has held the office shown or other offices in the same company for the past five years.
The fund’s Statement of Additional Information (SAI) includes more information about the Trustees. To request a free copy, call Fidelity at 1-877-208-0098.
Experience, Skills, Attributes, and Qualifications of the Trustees. The Governance and Nominating Committee has adopted a statement of policy that describes the experience, qualifications, attributes, and skills that are necessary and desirable for potential Independent Trustee candidates (Statement of Policy). The Board believes that each Trustee satisfied at the time he or she was initially elected or appointed a Trustee, and continues to satisfy, the standards contemplated by the Statement of Policy. The Governance and Nominating Committee also engages professional search firms to help identify potential Independent Trustee candidates who have the experience, qualifications, attributes, and skills consistent with the Statement of Policy. From time to time, additional criteria based on the composition and skills of the current Independent Trustees, as well as experience or skills that may be appropriate in light of future changes to board composition, business conditions, and regulatory or other developments, have also been considered by the professional search firms and the Governance and Nominating Committee. In addition, the Board takes into account the Trustees' commitment and participation in Board and committee meetings, as well as their leadership of standing and ad hoc committees throughout their tenure.
In determining that a particular Trustee was and continues to be qualified to serve as a Trustee, the Board has considered a variety of criteria, none of which, in isolation, was controlling. The Board believes that, collectively, the Trustees have balanced and diverse experience, qualifications, attributes, and skills, which allow the Board to operate effectively in governing the fund and protecting the interests of shareholders. Information about the specific experience, skills, attributes, and qualifications of each Trustee, which in each case led to the Board's conclusion that the Trustee should serve (or continue to serve) as a trustee of the fund, is provided below.
Board Structure and Oversight Function. James C. Curvey is an interested person and currently serves as Chairman. The Trustees have determined that an interested Chairman is appropriate and benefits shareholders because an interested Chairman has a personal and professional stake in the quality and continuity of services provided to the fund. Independent Trustees exercise their informed business judgment to appoint an individual of their choosing to serve as Chairman, regardless of whether the Trustee happens to be independent or a member of management. The Independent Trustees have determined that they can act independently and effectively without having an Independent Trustee serve as Chairman and that a key structural component for assuring that they are in a position to do so is for the Independent Trustees to constitute a substantial majority for the Board. The Independent Trustees also regularly meet in executive session. Ned C. Lautenbach serves as Chairman of the Independent Trustees and as such (i) acts as a liaison between the Independent Trustees and management with respect to matters important to the Independent Trustees and (ii) with management prepares agendas for Board meetings.
Fidelity® funds are overseen by different Boards of Trustees. The fund's Board oversees Fidelity's high income and certain equity funds, and other Boards oversee Fidelity's investment-grade bond, money market, asset allocation, and sector funds. The asset allocation funds may invest in Fidelity® funds overseen by the fund's Board. The use of separate Boards, each with its own committee structure, allows the Trustees of each group of Fidelity® funds to focus on the unique issues of the funds they oversee, including common research, investment, and operational issues. On occasion, the separate Boards establish joint committees to address issues of overlapping consequences for the Fidelity® funds overseen by each Board.
The Trustees operate using a system of committees to facilitate the timely and efficient consideration of all matters of importance to the Trustees, the fund, and fund shareholders and to facilitate compliance with legal and regulatory requirements and oversight of the fund's activities and associated risks. The Board, acting through its committees, has charged FMR and its affiliates with (i) identifying events or circumstances the occurrence of which could have demonstrably adverse effects on the fund's business and/or reputation; (ii) implementing processes and controls to lessen the possibility that such events or circumstances occur or to mitigate the effects of such events or circumstances if they do occur; and (iii) creating and maintaining a system designed to evaluate continuously business and market conditions in order to facilitate the identification and implementation processes described in (i) and (ii) above. Because the day-to-day operations and activities of the fund are carried out by or through FMR, its affiliates, and other service providers, the fund's exposure to risks is mitigated but not eliminated by the processes overseen by the Trustees. While each of the Board's committees has responsibility for overseeing different aspects of the fund's activities, oversight is exercised primarily through the Operations, Audit, and Compliance Committees. In addition, the Independent Trustees have worked with FMR to enhance the Board's oversight of investment and financial risks, legal and regulatory risks, technology risks, and operational risks, including the development of additional risk reporting to the Board. For example, a working group comprised of Independent Trustees and FMR has worked and continues to work to review the Fidelity® funds' valuation-related activities, reporting and risk management. Appropriate personnel, including but not limited to the fund's Chief Compliance Officer (CCO), FMR's internal auditor, the independent accountants, the fund's Treasurer and portfolio management personnel, make periodic reports to the Board's committees, as appropriate, including an annual review of Fidelity's risk management program for the Fidelity® funds. The responsibilities of each standing committee, including their oversight responsibilities, are described further under "Standing Committees of the Trustees."
Interested Trustees*:
Correspondence intended for a Trustee who is an interested person may be sent to Fidelity Investments, 245 Summer Street, Boston, Massachusetts 02210.
Name, Year of Birth; Principal Occupations and Other Relevant Experience+
James C. Curvey (1935)
Year of Election or Appointment: 2007
Trustee
Chairman of the Board of Trustees
Mr. Curvey also serves as Trustee of other Fidelity® funds. Mr. Curvey is a Director of Fidelity Research & Analysis Co. (investment adviser firm, 2009-present), and Vice Chairman (2007-present) and Director of FMR LLC (diversified financial services company). In addition, Mr. Curvey serves as an Overseer for the Boston Symphony Orchestra and a member of the board of Artis-Naples, Naples, Florida, and as a Trustee for Brewster Academy, Wolfeboro, New Hampshire. Previously, Mr. Curvey served as a Director of Fidelity Investments Money Management, Inc. (investment adviser firm, 2009-2014) and a Director of FMR and FMR Co., Inc. (investment adviser firms, 2007-2014).
Charles S. Morrison (1960)
Year of Election or Appointment: 2014
Trustee
Mr. Morrison also serves as Trustee of other funds. He serves as a Director of Fidelity Investments Money Management, Inc. (FIMM) (investment adviser firm, 2014-present), Director of Fidelity SelectCo, LLC (investment adviser firm, 2014-present), President, Asset Management (2014-present), and is an employee of Fidelity Investments. Previously, Mr. Morrison served as Vice President of Fidelity's Fixed Income and Asset Allocation Funds (2012-2014), President, Fixed Income (2011-2014), Vice President of Fidelity's Money Market Funds (2005-2009), President, Money Market Group Leader of FMR (investment adviser firm, 2009), and Senior Vice President, Money Market Group of FMR (2004-2009). Mr. Morrison also served as Vice President of Fidelity's Bond Funds (2002-2005), certain Balanced Funds (2002-2005), and certain Asset Allocation Funds (2002-2007), and as Senior Vice President (2002-2005) of Fidelity's Bond Division.
* Determined to be an “Interested Trustee” by virtue of, among other things, his or her affiliation with the trust or various entities under common control with FMR.
+ The information includes the Trustee's principal occupation during the last five years and other information relating to the experience, attributes, and skills relevant to the Trustee's qualifications to serve as a Trustee, which led to the conclusion that the Trustee should serve as a Trustee for the fund.
Independent Trustees:
Correspondence intended for an Independent Trustee may be sent to Fidelity Investments, P.O. Box 55235, Boston, Massachusetts 02205-5235.
Name, Year of Birth; Principal Occupations and Other Relevant Experience+
Dennis J. Dirks (1948)
Year of Election or Appointment: 2005
Trustee
Mr. Dirks also serves as Trustee of other Fidelity® funds. Prior to his retirement in May 2003, Mr. Dirks was Chief Operating Officer and a member of the Board of The Depository Trust & Clearing Corporation (DTCC). He also served as President, Chief Operating Officer, and Board member of The Depository Trust Company (DTC) and President and Board member of the National Securities Clearing Corporation (NSCC). In addition, Mr. Dirks served as Chief Executive Officer and Board member of the Government Securities Clearing Corporation, Chief Executive Officer and Board member of the Mortgage-Backed Securities Clearing Corporation, as a Trustee and a member of the Finance Committee of Manhattan College (2005-2008), as a Trustee and a member of the Finance Committee of AHRC of Nassau County (2006-2008), and as a member of the Independent Directors Council (IDC) Governing Council (2010-2015). Mr. Dirks is a member of the Board of Directors for The Brookville Center for Children's Services, Inc. (2009-present).
Alan J. Lacy (1953)
Year of Election or Appointment: 2008
Trustee
Mr. Lacy also serves as Trustee of other Fidelity® funds. Mr. Lacy serves as a member of the Board of Directors of Dave & Buster's Entertainment, Inc. (restaurant and entertainment complexes, 2010-present) and Bristol-Myers Squibb Company (global pharmaceuticals, 2008-present). In addition, Mr. Lacy served as Senior Adviser (2007-2014) of Oak Hill Capital Partners, L.P. (private equity) and also served as Chief Executive Officer (2000-2005) and Vice Chairman (2005-2006) of Sears Holdings Corporation and Sears, Roebuck and Co. (retail). Mr. Lacy is a member of the Board of Trustees of The National Parks Conservation Association (2006-present). Previously, Mr. Lacy served as Chairman of the Board of Trustees of the National Parks Conservation Association (2008-2011) and as a member of the Board of Directors for The Western Union Company (global money transfer, 2006-2011), The Hillman Companies, Inc. (hardware wholesalers, 2010-2014), and Earth Fare, Inc. (retail grocery, 2010-2014).
Ned C. Lautenbach (1944)
Year of Election or Appointment: 2000
Trustee
Chairman of the Independent Trustees
Mr. Lautenbach also serves as Trustee of other Fidelity® funds. Mr. Lautenbach currently serves as the Lead Director of the Eaton Corporation Board of Directors (diversified industrial, 1997-present). Mr. Lautenbach is Chairman of the Board of Directors of Artis-Naples in Naples, Florida (2012-present), a member of the Council on Foreign Relations (1994-present), and a member of the Board of Governors, State University System of Florida (2013-present). Previously, Mr. Lautenbach was a Partner/Advisory Partner at Clayton, Dubilier & Rice, LLC (private equity investment, 1998-2010), as well as a Director of Sony Corporation (2006-2007).
Joseph Mauriello (1944)
Year of Election or Appointment: 2008
Trustee
Mr. Mauriello also serves as Trustee of other Fidelity® funds. Prior to his retirement in January 2006, Mr. Mauriello served in numerous senior management positions including Deputy Chairman and Chief Operating Officer (2004-2005), and Vice Chairman of Financial Services (2002-2004) of KPMG LLP US (professional services, 1965-2005). Mr. Mauriello currently serves as a member of the Board of Directors of XL Group plc. (global insurance and re-insurance, 2006-present) and the Independent Directors Council (IDC) Governing Council (2015-present). Previously, Mr. Mauriello served as a Director of the Hamilton Funds of the Bank of New York (2006-2007) and of Arcadia Resources Inc. (health care services and products, 2007-2012).
Robert W. Selander (1950)
Year of Election or Appointment: 2011
Trustee
Mr. Selander also serves as Trustee of other Fidelity® funds. Mr. Selander serves as a Director of The Western Union Company (global money transfer, 2014-present). Previously, Mr. Selander served as a Member of the Advisory Board of other Fidelity® funds (2011), and Executive Vice Chairman (2010), Chief Executive Officer (2009-2010), and President and Chief Executive Officer (1997-2009) of Mastercard, Inc.
Cornelia M. Small (1944)
Year of Election or Appointment: 2005
Trustee
Ms. Small also serves as Trustee of other Fidelity® funds. Ms. Small is a member of the Board of Directors (2009-present) and Chair of the Investment Committee (2010-present) of the Teagle Foundation. Ms. Small also serves on the Investment Committee of the Berkshire Taconic Community Foundation (2008-present). Previously, Ms. Small served as Chairperson (2002-2008) and a member of the Investment Committee and Chairperson (2008-2012) and a member of the Board of Trustees of Smith College. In addition, Ms. Small served as Chief Investment Officer, Director of Global Equity Investments, and a member of the Board of Directors of Scudder, Stevens & Clark and Scudder Kemper Investments.
William S. Stavropoulos (1939)
Year of Election or Appointment: 2002
Trustee
Vice Chairman of the Independent Trustees
Mr. Stavropoulos also serves as Trustee of other Fidelity® funds. Mr. Stavropoulos serves as President and Founder of the Michigan Baseball Foundation, the Great Lakes Loons (2007-present). Mr. Stavropoulos is Chairman Emeritus of the Board of Directors of The Dow Chemical Company, where he previously served in numerous senior management positions, including President, CEO (1995-2000; 2002-2004), Chairman of the Executive Committee (2000-2006), and as a member of the Board of Directors (1990-2006). Currently, Mr. Stavropoulos is Chairman of the Board of Directors of Univar Inc. (global distributor of commodity and specialty chemicals), a Director of Teradata Corporation (data warehousing and technology solutions), and Maersk Inc. (industrial conglomerate), and a member of the Advisory Board for Metalmark Capital LLC (private equity investment, 2005-present). Mr. Stavropoulos is an operating advisor to Clayton, Dubilier & Rice, LLC (private equity investment). In addition, Mr. Stavropoulos is a member of the University of Notre Dame Advisory Council for the College of Science, a Trustee of the Rollin L. Gerstacker Foundation, and a Director of the Naples Philharmonic Center for the Arts. Previously, Mr. Stavropoulos served as a Director of Chemical Financial Corporation (bank holding company, 1993-2012) and Tyco International, Ltd. (multinational manufacturing and services, 2007-2012).
David M. Thomas (1949)
Year of Election or Appointment: 2008
Trustee
Mr. Thomas also serves as Trustee of other Fidelity® funds. Mr. Thomas serves as Non-Executive Chairman of the Board of Directors of Fortune Brands Home and Security (home and security products, 2011-present), as a member of the Board of Directors (2004-present) and Presiding Director (2013-present) of Interpublic Group of Companies, Inc. (marketing communication), and as a member of the Board of Trustees of the University of Florida (2013-present). Previously, Mr. Thomas served as Executive Chairman (2005-2006) and Chairman and Chief Executive Officer (2000-2005) of IMS Health, Inc. (pharmaceutical and healthcare information solutions), and a Director of Fortune Brands, Inc. (consumer products, 2000-2011).
+ The information includes the Trustee's principal occupation during the last five years and other information relating to the experience, attributes, and skills relevant to the Trustee's qualifications to serve as a Trustee, which led to the conclusion that the Trustee should serve as a Trustee for the fund.
Advisory Board Members and Officers:
Correspondence intended for an officer or Peter S. Lynch may be sent to Fidelity Investments, 245 Summer Street, Boston, Massachusetts 02210. Officers appear below in alphabetical order.
Name, Year of Birth; Principal Occupation
Peter S. Lynch (1944)
Year of Election or Appointment: 2003
Member of the Advisory Board
Mr. Lynch also serves as Member of the Advisory Board of other Fidelity® funds. Mr. Lynch is Vice Chairman and a Director of FMR (investment adviser firm) and FMR Co., Inc. (investment adviser firm). In addition, Mr. Lynch serves as a Trustee of Boston College and as the Chairman of the Inner-City Scholarship Fund. Previously, Mr. Lynch served on the Special Olympics International Board of Directors (1997-2006).
Elizabeth Paige Baumann (1968)
Year of Election or Appointment: 2012
Anti-Money Laundering (AML) Officer
Ms. Baumann also serves as AML Officer of other funds. She is Chief AML Officer of FMR LLC (diversified financial services company, 2012-present) and is an employee of Fidelity Investments. Previously, Ms. Baumann served as Vice President and Deputy Anti-Money Laundering Officer (2007-2012).
Marc R. Bryant (1966)
Year of Election or Appointment: 2015
Secretary and Chief Legal Officer (CLO)
Mr. Bryant also serves as Secretary and CLO of other funds. Mr. Bryant serves as CLO, Secretary, and Senior Vice President of Fidelity Management & Research Company (investment adviser firm, 2015-present) and FMR Co., Inc. (investment adviser firm, 2015-present); Secretary of Fidelity SelectCo, LLC (investment adviser firm, 2015-present) and Fidelity Investments Money Management, Inc. (investment adviser firm, 2015-present); and CLO of Fidelity Management & Research (Hong Kong) Limited (investment adviser firm, 2015-present). He is Senior Vice President and Deputy General Counsel of FMR LLC (diversified financial services company). Previously, Mr. Bryant served as Secretary and CLO of Fidelity Rutland Square Trust II (2010-2014) and Assistant Secretary of Fidelity's Fixed Income and Asset Allocation Funds (2013-2015). Prior to joining Fidelity Investments, Mr. Bryant served as a Senior Vice President and the Head of Global Retail Legal for AllianceBernstein L.P. (2006-2010), and as the General Counsel for ProFund Advisors LLC (2001-2006).
William C. Coffey (1969)
Year of Election or Appointment: 2009
Assistant Secretary
Mr. Coffey also serves as Assistant Secretary of other funds. He is Senior Vice President and Deputy General Counsel of FMR LLC (diversified financial services company, 2010-present), and is an employee of Fidelity Investments. Previously, Mr. Coffey served as Vice President and Associate General Counsel of FMR LLC (2005-2009).
Jonathan Davis (1968)
Year of Election or Appointment: 2010
Assistant Treasurer
Mr. Davis also serves as Assistant Treasurer of other funds, and is an employee of Fidelity Investments. Previously, Mr. Davis served as Vice President and Associate General Counsel of FMR LLC (diversified financial services company, 2003-2010).
Adrien E. Deberghes (1967)
Year of Election or Appointment: 2008
Deputy Treasurer
Mr. Deberghes also serves as an officer of other funds. He is an employee of Fidelity Investments (2008-present). Prior to joining Fidelity Investments, Mr. Deberghes was Senior Vice President of Mutual Fund Administration at State Street Corporation (2007-2008), Senior Director of Mutual Fund Administration at Investors Bank & Trust (2005-2007), and Director of Finance for Dunkin' Brands (2000-2005).
Stephanie J. Dorsey (1969)
Year of Election or Appointment: 2010
Assistant Treasurer
Ms. Dorsey also serves as an officer of other funds. She is an employee of Fidelity Investments (2008-present) and has served in other fund officer roles. Prior to joining Fidelity Investments, Ms. Dorsey served as Treasurer (2004-2008) of the JPMorgan Mutual Funds and Vice President (2004-2008) of JPMorgan Chase Bank.
Howard J. Galligan III (1966)
Year of Election or Appointment: 2014
Chief Financial Officer
Mr. Galligan also serves as Chief Financial Officer of other funds. Mr. Galligan serves as President of Fidelity Pricing and Cash Management Services (FPCMS) (2014-present) and as a Director of Strategic Advisers, Inc. (investment adviser firm, 2008-present). Previously, Mr. Galligan served as Chief Administrative Officer of Asset Management (2011-2014) and Chief Operating Officer and Senior Vice President of Investment Support for Strategic Advisers, Inc. (2003-2011).
Scott C. Goebel (1968)
Year of Election or Appointment: 2015
Vice President
Mr. Goebel serves as Vice President of other funds and is an employee of Fidelity Investments (2001-present). Previously, Mr. Goebel served as Secretary of Fidelity SelectCo, LLC (investment adviser firm, 2013-2015), Fidelity Investments Money Management, Inc. (FIMM) (investment adviser firm, 2010-2015), and Fidelity Research and Analysis Company (FRAC) (investment adviser firm, 2010-2015); General Counsel, Secretary, and Senior Vice President of Fidelity Management & Research Company (investment adviser firm, 2008-2015) and FMR Co., Inc. (investment adviser firm, 2008-2015); Assistant Secretary of Fidelity Management & Research (Japan) Limited (investment adviser firm, 2008-2015) and FMR Investment Management (U.K.) Limited (investment adviser firm, 2008-2015); Chief Legal Officer (CLO) of Fidelity Management & Research (Hong Kong) Limited (investment adviser firm, 2008-2015); Secretary and CLO of certain Fidelity® funds (2008-2015); Assistant Secretary of FIMM (2008-2010), FRAC (2008-2010), and certain funds (2007-2008); and as Vice President and Secretary of Fidelity Distributors Corporation (FDC) (2005-2007).
Thomas C. Hense (1964)
Year of Election or Appointment: 2008, 2010, or 2015
Vice President
Mr. Hense serves as Vice President of Fidelity Advisor® Multi-Asset Income Fund (2015) and other funds (High Income (2008), Small Cap (2008), and Value (2010) funds), and is an employee of Fidelity Investments (1993-present). Previously, Mr. Hense served as a portfolio manager for Fidelity's Institutional Money Management Group (Pyramis) (2003-2008).
Brian B. Hogan (1964)
Year of Election or Appointment: 2009
Vice President
Mr. Hogan also serves as Trustee or Vice President of other funds. Mr. Hogan serves as a Director of Fidelity SelectCo, LLC (investment adviser firm, 2014-present) and President of the Equity Division of FMR (investment adviser firm, 2009-present). Previously, Mr. Hogan served as Senior Vice President, Equity Research of FMR (2006-2009) and as a portfolio manager.
Chris Maher (1972)
Year of Election or Appointment: 2013
Assistant Treasurer
Mr. Maher serves as Assistant Treasurer of other funds. Mr. Maher is Vice President of Valuation Oversight and is an employee of Fidelity Investments. Previously, Mr. Maher served as Vice President of Asset Management Compliance (2013), Vice President of the Program Management Group of FMR (investment adviser firm, 2010-2013), and Vice President of Valuation Oversight (2008-2010).
Kenneth B. Robins (1969)
Year of Election or Appointment: 2008
President and Treasurer
Mr. Robins also serves as an officer of other funds. Mr. Robins serves as Executive Vice President of Fidelity Investments Money Management, Inc. (FIMM) (investment adviser firm, 2013-present) and is an employee of Fidelity Investments (2004-present). Previously, Mr. Robins served in other fund officer roles.
Stacie M. Smith (1974)
Year of Election or Appointment: 2013
Deputy Treasurer
Ms. Smith also serves as an officer of other funds. She is an employee of Fidelity Investments (2009-present) and has served in other fund officer roles. Prior to joining Fidelity Investments, Ms. Smith served as Senior Audit Manager of Ernst & Young LLP (1996-2009).
Renee Stagnone (1975)
Year of Election or Appointment: 2013
Deputy Treasurer
Ms. Stagnone also serves as Deputy Treasurer of other funds. Ms. Stagnone is an employee of Fidelity Investments (1997-present).
Linda J. Wondrack (1964)
Year of Election or Appointment: 2014
Chief Compliance Officer
Ms. Wondrack also serves as Chief Compliance Officer of other funds. Ms. Wondrack is Executive Vice President and head of the Ethics Office and Asset Management Compliance for Fidelity Investments (2012-present). Ms. Wondrack also serves as Chief Compliance Officer of Fidelity SelectCo, LLC (investment adviser firm, 2014-present); Chief Compliance Officer of Impresa Management LLC (2013-present); and Chief Compliance Officer of FMR Co., Inc. (investment adviser firm), Fidelity Investments Money Management, Inc. (investment adviser firm), Fidelity Management & Research (Japan) Limited (investment adviser firm), FMR Investment Management (U.K.) Limited (investment adviser firm), Fidelity Management & Research (Hong Kong) (investment adviser firm), Fidelity Management & Research Company (investment adviser firm), FIAM LLC (investment adviser firm), and Strategic Advisers, Inc. (investment adviser firm), Ballyrock Investment Advisors LLC, and Northern Neck Investors LLC (2012-present). Previously, Ms. Wondrack served as Senior Vice President and Chief Compliance Officer for Columbia Management Investment Advisers, LLC (2005-2012); Chief Compliance Officer for certain funds within the Columbia Family of Funds (2007-2012); and Senior Vice President of Compliance Risk Management at Bank of America (2005-2010).
Joseph F. Zambello (1957)
Year of Election or Appointment: 2011
Deputy Treasurer
Mr. Zambello also serves as Deputy Treasurer of other funds. Mr. Zambello is an employee of Fidelity Investments (1991-present). Previously, Mr. Zambello served as Vice President of the Program Management Group of FMR (investment adviser firm, 2009-2011) and Vice President of the Transfer Agent Oversight Group (2005-2009).
Shareholder Expense Example
As a shareholder of the Fund, you incur two types of costs: (1) transaction costs, including sales charges (loads) on purchase payments or redemption proceeds, and (2) ongoing costs, including management fees, distribution and/or service (12b-1) fees and other Fund expenses. This Example is intended to help you understand your ongoing costs (in dollars) of investing in the Fund and to compare these costs with the ongoing costs of investing in other mutual funds.
The Example is based on an investment of $1,000 invested at the beginning of the period and held for the entire period (June 1, 2015 to November 30, 2015).
Actual Expenses
The first line of the accompanying table for each class of the Fund provides information about actual account values and actual expenses. You may use the information in this line, together with the amount you invested, to estimate the expenses that you paid over the period. Simply divide your account value by $1,000.00 (for example, an $8,600 account value divided by $1,000.00 = 8.6), then multiply the result by the number in the first line for a class of the Fund under the heading entitled "Expenses Paid During Period" to estimate the expenses you paid on your account during this period. In addition, the Fund, as a shareholder in the underlying Fidelity Central Funds, will indirectly bear its pro-rata share of the fees and expenses incurred by the underlying Fidelity Central Funds. These fees and expenses are not included in the Fund's annualized expense ratio used to calculate the expense estimate in the table below.
Hypothetical Example for Comparison Purposes
The second line of the accompanying table for each class of the Fund provides information about hypothetical account values and hypothetical expenses based on a Class' actual expense ratio and an assumed rate of return of 5% per year before expenses, which is not the Class' actual return. The hypothetical account values and expenses may not be used to estimate the actual ending account balance or expenses you paid for the period. You may use this information to compare the ongoing costs of investing in the Fund and other funds. To do so, compare this 5% hypothetical example with the 5% hypothetical examples that appear in the shareholder reports of the other funds. In addition, the Fund, as a shareholder in the underlying Fidelity Central Funds, will indirectly bear its pro-rata share of the fees and expenses incurred by the underlying Fidelity Central Funds. These fees and expenses are not included in the Fund's annualized expense ratio used to calculate the expense estimate in the table below.
Please note that the expenses shown in the table are meant to highlight your ongoing costs only and do not reflect any transaction costs. Therefore, the second line of the table is useful in comparing ongoing costs only, and will not help you determine the relative total costs of owning different funds. In addition, if these transactional costs were included, your costs would have been higher.
| Annualized Expense Ratio-A | Beginning Account Value June 1, 2015 | Ending Account Value November 30, 2015 | Expenses Paid During Period-B June 1, 2015 to November 30, 2015 | |
| Class A | 1.22% | |||
| Actual | $1,000.00 | $958.40 | $5.99 | |
| Hypothetical-C | $1,000.00 | $1,018.95 | $6.17 | |
| Class T | 1.50% | |||
| Actual | $1,000.00 | $956.50 | $7.36 | |
| Hypothetical-C | $1,000.00 | $1,017.55 | $7.59 | |
| Class B | 2.00% | |||
| Actual | $1,000.00 | $955.00 | $9.80 | |
| Hypothetical-C | $1,000.00 | $1,015.04 | $10.10 | |
| Class C | 2.00% | |||
| Actual | $1,000.00 | $954.40 | $9.80 | |
| Hypothetical-C | $1,000.00 | $1,015.04 | $10.10 | |
| Class I | .91% | |||
| Actual | $1,000.00 | $959.60 | $4.47 | |
| Hypothetical-C | $1,000.00 | $1,020.51 | $4.61 |
A Annualized expense ratio reflects expenses net of applicable fee waivers.
B Expenses are equal to each Class' annualized expense ratio, multiplied by the average account value over the period, multiplied by 183/365 (to reflect the one-half year period).
C 5% return per year before expenses
Distributions (Unaudited)
The Board of Trustees of Fidelity Advisor Value Growth Fund voted to pay to shareholders of record at the opening of business on record date, the following distributions per share derived from capital gains realized from sales of portfolio securities, and dividends derived from net investment income:
| Pay Date | Record Date | Dividends | Capital Gains | |
| Class I | 12/14/15 | 12/11/15 | $0.279 | $0.140 |
The fund hereby designates as a capital gain dividend with respect to the taxable year ended November 30, 2015, $1,943,993, or, if subsequently determined to be different, the net capital gain of such year.
Class I designates 79% and 65% of the dividends distributed during the fiscal year as qualifying for the dividends–received deduction for corporate shareholders.
Class I designates 100% of the dividends distributed during the fiscal year as amounts which may be taken into account as a dividend for purposes of the maximum rate under section 1(h)(11) of the Internal Revenue Code.
The fund will notify shareholders in January 2016 of amounts for use in preparing 2015 income tax returns.
Board Approval of Investment Advisory Contracts and Management Fees
Fidelity Advisor Equity Value Fund
Each year, the Board of Trustees, including the Independent Trustees (together, the Board), votes on the renewal of the management contract with Fidelity Management & Research Company (FMR) and the sub-advisory agreements (together, the Advisory Contracts) for the fund. The Board, assisted by the advice of fund counsel and Independent Trustees' counsel, requests and considers a broad range of information relevant to the renewal of the Advisory Contracts throughout the year.
The Board meets regularly and, at each of its meetings, covers an extensive agenda of topics and materials and considers factors that are relevant to its annual consideration of the renewal of the fund's Advisory Contracts, including the services and support provided to the fund and its shareholders. The Board has established various standing committees (Committees), each composed of and chaired by Independent Trustees with varying backgrounds, to which the Board has assigned specific subject matter responsibilities in order to enhance effective decision-making by the Board. The Board, acting directly and through its Committees, requests and receives information concerning the annual consideration of the renewal of the fund's Advisory Contracts. The Board also meets as needed to consider matters specifically related to the Board's annual consideration of the renewal of the Advisory Contracts. Members of the Board may also meet with trustees of other Fidelity funds through ad hoc joint committees to discuss certain matters relevant to all of the Fidelity funds.
At its July 2015 meeting, the Board unanimously determined to renew the fund's Advisory Contracts. In reaching its determination, the Board considered all factors it believed relevant, including (i) the nature, extent, and quality of the services to be provided to the fund and its shareholders (including the investment performance of the fund); (ii) the competitiveness of the fund's management fee and total expense ratio relative to peer funds; (iii) the total costs of the services to be provided by and the profits to be realized by Fidelity from its relationship with the fund; and (iv) the extent to which (if any) economies of scale exist and would be realized as the fund grows, and whether any economies of scale are appropriately shared with fund shareholders.
In considering whether to renew the Advisory Contracts for the fund, the Board reached a determination, with the assistance of fund counsel and Independent Trustees' counsel and through the exercise of its business judgment, that the renewal of the Advisory Contracts was in the best interests of the fund and its shareholders and that the compensation payable under the Advisory Contracts was fair and reasonable. The Board's decision to renew the Advisory Contracts was not based on any single factor, but rather was based on a comprehensive consideration of all the information provided to the Board at its meetings throughout the year. The Board, in reaching its determination to renew the Advisory Contracts, was aware that shareholders of the fund have a broad range of investment choices available to them, including a wide choice among funds offered by Fidelity's competitors, and that the fund's shareholders, who have the opportunity to review and weigh the disclosure provided by the fund in its prospectus and other public disclosures, have chosen to invest in this fund, which is part of the Fidelity family of funds.
Nature, Extent, and Quality of Services Provided. The Board considered Fidelity's staffing as it relates to the fund, including the backgrounds of investment personnel of Fidelity, and also considered the fund's investment objective, strategies, and related investment philosophy. The Independent Trustees also had discussions with senior management of Fidelity's investment operations and investment groups. The Board considered the structure of the portfolio manager compensation program and whether this structure provides appropriate incentives to act in the best interests of the fund. Additionally, the Board considered the portfolio managers' investments, if any, in the funds that they manage.Resources Dedicated to Investment Management and Support Services. The Board and the Fund Oversight and Research Committees reviewed the general qualifications and capabilities of Fidelity's investment staff, including its size, education, experience, and resources, as well as Fidelity's approach to recruiting, training, managing, and compensating investment personnel. The Board noted that Fidelity has continued to increase the resources devoted to non-U.S. offices, including expansion of Fidelity's global investment organization. The Board also noted that Fidelity's analysts have extensive resources, tools and capabilities that allow them to conduct sophisticated quantitative and fundamental analysis, as well as credit analysis of issuers, counterparties and guarantors. Further, the Board considered that Fidelity's investment professionals have sufficient access to global information and data so as to provide competitive investment results over time, and that those professionals also have access to sophisticated tools that permit them to assess portfolio construction and risk and performance attribution characteristics continuously, as well as to transmit new information and research conclusions rapidly around the world. Additionally, in its deliberations, the Board considered Fidelity's trading, risk management, and compliance capabilities and resources, which are integral parts of the investment management process.Shareholder and Administrative Services. The Board considered (i) the nature, extent, quality, and cost of advisory, administrative, and shareholder services performed by FMR, the sub-advisers (together with FMR, the Investment Advisers), and their affiliates under the Advisory Contracts and under separate agreements covering transfer agency, pricing and bookkeeping, and securities lending services for the fund; (ii) the nature and extent of the supervision of third party service providers, principally custodians and subcustodians; and (iii) the resources devoted to, and the record of compliance with, the fund's compliance policies and procedures. The Board also reviewed the allocation of fund brokerage, including allocations to brokers affiliated with the Investment Advisers, the use of brokerage commissions to pay fund expenses, and the use of "soft" commission dollars to pay for research services.The Board noted that the growth of fund assets over time across the complex allows Fidelity to reinvest in the development of services designed to enhance the value or convenience of the Fidelity funds as investment vehicles. These services include 24-hour access to account information and market information through telephone representatives and over the Internet, investor education materials and asset allocation tools, and the expanded availability of Fidelity Investor Centers.In 2014, the Board formed an ad hoc Committee on Transfer Agency Fees to review the variety of transfer agency fee structures throughout the industry and Fidelity's competitive positioning with respect to industry participants.Investment in a Large Fund Family. The Board considered the benefits to shareholders of investing in a Fidelity fund, including the benefits of investing in a fund that is part of a large family of funds offering a variety of investment disciplines and providing a large variety of mutual fund investor services. The Board noted that Fidelity had taken, or had made recommendations that resulted in the Fidelity funds taking, a number of actions over the previous year that benefited particular funds, including (i) continuing to dedicate additional resources to investment research and to the support of the senior management team that oversees asset management; (ii) continuing efforts to enhance Fidelity's global research capabilities; (iii) launching new funds and making other enhancements to meet client needs; (iv) reducing management fees and total expenses for certain index funds and diversified international funds; (v) continuing to launch dedicated lower cost underlying funds to meet portfolio construction needs related to expanding underlying fund options for Fidelity funds of funds, specifically for the Freedom Fund product lines; (vi) rationalizing product lines and gaining increased efficiencies through fund mergers; (vii) launching active fixed-income exchange-traded funds; (viii) continuing to develop, acquire and implement systems and technology to improve services to the funds and information security and to increase efficiency; (ix) implementing investment enhancements to further strengthen Fidelity's target date product line to increase investors' probability of success in achieving their goals; (x) modifying the eligibility criteria for certain share classes to accommodate roll-over assets from employer-sponsored retirement plans; (xi) launching a new Class W of the Freedom Index Funds to attract and retain Fidelity record-kept retirement plan assets; and (xii) implementing changes to Fidelity's money market product line in response to recent money market regulatory reforms.Investment Performance. The Board considered whether the fund has operated in accordance with its investment objective, as well as its record of compliance with its investment restrictions and its performance history.The Board took into account discussions with representatives of the Investment Advisers about fund investment performance that occur at Board meetings throughout the year. In this regard the Board noted that as part of regularly scheduled fund reviews and other reports to the Board on fund performance, the Board considers annualized return information for the fund, for different time periods, measured against a securities market index ("benchmark index") and a peer group of funds with similar objectives ("peer group"), if any. In its evaluation of fund investment performance, the Board gave particular attention to information indicating changes in performance of certain Fidelity funds for specific time periods and discussed with the Investment Advisers the reasons for any overperformance or underperformance.In addition to reviewing absolute and relative fund performance, the Independent Trustees periodically consider the appropriateness of fund performance metrics in evaluating the results achieved. In general, the Independent Trustees believe that fund performance should be evaluated based on net performance (after fees and expenses) of both the highest performing and lowest performing fund share classes, where applicable, compared to appropriate benchmark indices, over appropriate time periods that may include full market cycles, and compared to peer groups, as applicable, over the same periods, taking into account relevant factors including the following: general market conditions; issuer-specific information; and fund cash flows and other factors.The Independent Trustees recognize that shareholders evaluate performance on a net basis over their own holding periods, for which one-, three-, and five-year periods are often used as a proxy. For this reason, the performance information reviewed by the Board also included net cumulative calendar year total return information for the fund and an appropriate benchmark index and peer group for the most recent one-, three-, and five-year periods, as shown below. Returns are shown compared to the 25th percentile (top of box, 75% beaten) and 75th percentile (bottom of box, 25% beaten) of the peer universe.Fidelity Advisor Equity Value Fund
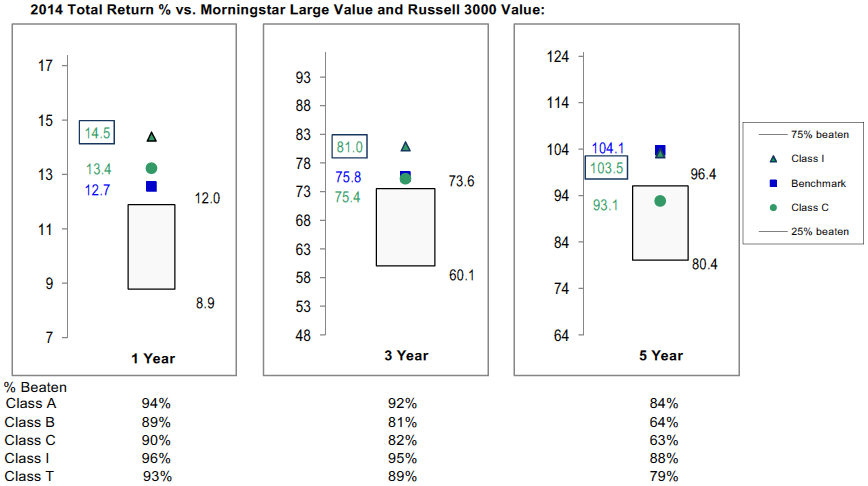
Fidelity Advisor Equity Value Fund
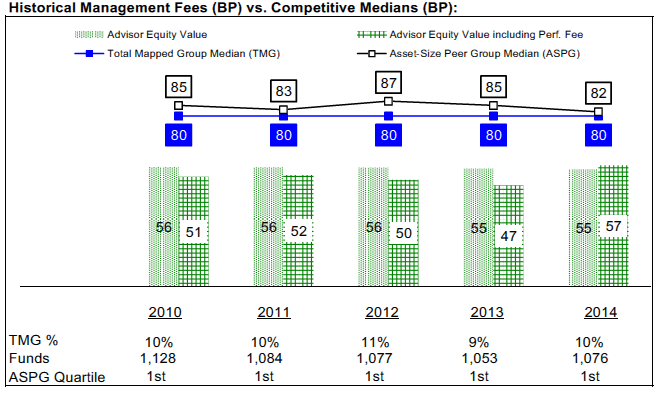
![]()
AEVI-ANN-0116
1.767074.114
Fidelity Advisor® Equity Growth Fund Class A, Class T, Class B and Class C Annual Report November 30, 2015 |
|
Contents
Board Approval of Investment Advisory Contracts and Management Fees |
To view a fund's proxy voting guidelines and proxy voting record for the 12-month period ended June 30, visit http://www.fidelity.com/proxyvotingresults or visit the Securities and Exchange Commission's (SEC) web site at http://www.sec.gov.
You may also call 1-877-208-0098 to request a free copy of the proxy voting guidelines.
Standard & Poor's, S&P and S&P 500 are registered service marks of The McGraw-Hill Companies, Inc. and have been licensed for use by Fidelity Distributors Corporation.
Other third-party marks appearing herein are the property of their respective owners.
All other marks appearing herein are registered or unregistered trademarks or service marks of FMR LLC or an affiliated company. © 2016 FMR LLC. All rights reserved.
This report and the financial statements contained herein are submitted for the general information of the shareholders of the Fund. This report is not authorized for distribution to prospective investors in the Fund unless preceded or accompanied by an effective prospectus.
A fund files its complete schedule of portfolio holdings with the SEC for the first and third quarters of each fiscal year on Form N-Q. Forms N-Q are available on the SEC’s web site at http://www.sec.gov. A fund's Forms N-Q may be reviewed and copied at the SEC’s Public Reference Room in Washington, DC. Information regarding the operation of the SEC's Public Reference Room may be obtained by calling 1-800-SEC-0330.
For a complete list of a fund's portfolio holdings, view the most recent holdings listing, semiannual report, or annual report on Fidelity's web site at http://www.fidelity.com, http://www.advisor.fidelity.com, or http://www.401k.com, as applicable.
NOT FDIC INSURED •MAY LOSE VALUE •NO BANK GUARANTEE
Neither the Fund nor Fidelity Distributors Corporation is a bank.
Performance: The Bottom Line
Average annual total return reflects the change in the value of an investment, assuming reinvestment of distributions from dividend income and capital gains (the profits earned upon the sale of securities that have grown in value, if any) and assuming a constant rate of performance each year.
The hypothetical investment and the average annual total returns do not reflect the deduction of taxes that a shareholder would pay on fund distributions or the redemption of fund shares.
During periods of reimbursement by Fidelity, a fund’s total return will be greater than it would be had the reimbursement not occurred.
How a fund did yesterday is no guarantee of how it will do tomorrow.
Returns reflect the conversion of Class B shares to Class A shares after a maximum of seven years.
Average Annual Total Returns
| For the periods ended November 30, 2015 | Past 1 year | Past 5 years | Past 10 years |
| Class A (incl. 5.75% sales charge) | (0.71)% | 12.97% | 6.90% |
| Class T (incl. 3.50% sales charge) | 1.42% | 13.29% | 6.95% |
| Class B (incl. contingent deferred sales charge) | (0.54)% | 13.17% | 6.96% |
| Class C (incl. contingent deferred sales charge) | 3.55% | 13.48% | 6.73% |
Class B shares' contingent deferred sales charges included in the past one year, past five years and past ten years total return figures are 5%, 2% and 0%, respectively.
Class C shares' contingent deferred sales charges included in the past one year, past five years and past ten years total return figures are 1%, 0% and 0%, respectively.
$10,000 Over 10 Years
Let's say hypothetically that $10,000 was invested in Fidelity Advisor® Equity Growth Fund - Class A on November 30, 2005, and the current 5.75% sales charge was paid.
The chart shows how the value of your investment would have changed, and also shows how the Russell 3000® Growth Index performed over the same period.

| Period Ending Values | ||
| $19,483 | Fidelity Advisor® Equity Growth Fund - Class A | |
| $22,916 | Russell 3000® Growth Index | |
Management's Discussion of Fund Performance
Market Recap: U.S. stocks gained modestly for the 12 months ending November 30, 2015, despite a steep decline in August and September on concern about slowing economic growth in China. The S&P 500® index rebounded in October and gained 2.75% for the year. Stocks benefited late in the period amid waning expectations for a near-term interest-rate hike by the U.S. Federal Reserve, more economic stimulus in Europe and an interest-rate cut in China. Growth stocks in the benchmark far outpaced their value counterparts, as investors continued to seek growth in a subpar economic environment. Sector performance varied widely, with more than 26 percentage points separating the leader from the laggard. Consumer discretionary (+14%) secured the top spot, benefiting from a combination of rising personal income and still-benign inflation. Information technology (+7%) and health care (+4%) also outpaced the broad market. Conversely, the energy sector (-12%) performed worst, stymied by depressed commodity prices that also hit materials (-5%). Telecommunication services (-5%) and utilities (-4%), considered defensive sectors less sensitive to the economy, also lost ground. At period end, investors remained focused on the potential global implications of a stronger U.S. dollar and how China’s transition toward a consumption-led economy may affect corporate earnings.Comments from Portfolio Manager Jason Weiner: For the year, the fund’s share classes (excluding sales charges, if applicable) saw gains in the mid-single digits, lagging the 6.14% advance of the benchmark Russell 3000® Growth Index. Versus the benchmark, picks in food, beverage & tobacco, part of the consumer staples sector, weighed most on the fund's performance, largely due to the fund’s overweighting in Keurig Green Mountain – by far the largest individual detractor the past year. Keurig shares suffered partly due to the firm’s disappointing December 2014 launch of its second-generation brewing machine and subsequent consecutive quarters of lower-than-expected earnings and revenue. In November, the stock hit a nearly three-year low when an influential analyst reduced its forecast for Keurig’s sales due to lowered prices on its coffee brewers, decreased K-Cup volumes and weak demand for its new Kold machine. On the plus side, positioning in information technology's software & services industry was a big plus. From this group, the fund’s position in Facebook – the largest holding – was its biggest individual contributor by a wide margin. Facebook outperformed, partly in anticipation of second-quarter earnings that reflected a strong rise in advertising revenue and growth in the number of subscribers accessing its services on mobile devices. The firm continued to make progress with video advertising and announced new features geared toward small and medium-sized businesses.The views expressed above reflect those of the portfolio manager(s) only through the end of the period as stated on the cover of this report and do not necessarily represent the views of Fidelity or any other person in the Fidelity organization. Any such views are subject to change at any time based upon market or other conditions and Fidelity disclaims any responsibility to update such views. These views may not be relied on as investment advice and, because investment decisions for a Fidelity fund are based on numerous factors, may not be relied on as an indication of trading intent on behalf of any Fidelity fund.
Investment Summary (Unaudited)
Top Ten Stocks as of November 30, 2015
| % of fund's net assets | % of fund's net assets 6 months ago | |
| Facebook, Inc. Class A | 11.3 | 8.5 |
| Alphabet, Inc. Class A | 6.5 | 3.3 |
| Gilead Sciences, Inc. | 5.1 | 5.8 |
| Apple, Inc. | 2.9 | 6.9 |
| Amazon.com, Inc. | 2.7 | 0.5 |
| Salesforce.com, Inc. | 2.6 | 2.1 |
| Starbucks Corp. | 2.5 | 1.9 |
| Home Depot, Inc. | 2.4 | 1.8 |
| Avago Technologies Ltd. | 2.4 | 0.1 |
| Danaher Corp. | 2.3 | 1.8 |
| 40.7 |
Top Five Market Sectors as of November 30, 2015
| % of fund's net assets | % of fund's net assets 6 months ago | |
| Information Technology | 41.6 | 36.2 |
| Consumer Discretionary | 16.3 | 15.0 |
| Health Care | 15.7 | 18.5 |
| Industrials | 10.3 | 11.7 |
| Financials | 6.7 | 7.6 |
Asset Allocation (% of fund's net assets)
| As of November 30, 2015* | ||
| Stocks | 93.6% | |
| Convertible Securities | 0.9% | |
| Short-Term Investments and Net Other Assets (Liabilities) | 5.5% | |

* Foreign investments - 14.5%
| As of May 31, 2015* | ||
| Stocks | 96.5% | |
| Convertible Securities | 0.9% | |
| Short-Term Investments and Net Other Assets (Liabilities) | 2.6% | |

* Foreign investments - 14.1%
Investments November 30, 2015
Showing Percentage of Net Assets
| Common Stocks - 93.6% | |||
| Shares | Value (000s) | ||
| CONSUMER DISCRETIONARY - 16.2% | |||
| Automobiles - 0.7% | |||
| Tesla Motors, Inc. (a) | 91,300 | $21,023 | |
| Diversified Consumer Services - 1.3% | |||
| Bright Horizons Family Solutions, Inc. (a) | 166,600 | 11,051 | |
| Houghton Mifflin Harcourt Co. (a) | 221,900 | 4,385 | |
| Nord Anglia Education, Inc. (a) | 134,321 | 2,852 | |
| ServiceMaster Global Holdings, Inc. (a) | 487,300 | 18,264 | |
| 36,552 | |||
| Hotels, Restaurants & Leisure - 3.8% | |||
| Buffalo Wild Wings, Inc. (a) | 52,400 | 8,397 | |
| Chipotle Mexican Grill, Inc. (a) | 15,185 | 8,800 | |
| Domino's Pizza, Inc. | 184,800 | 19,860 | |
| Jubilant Foodworks Ltd. | 52,463 | 1,218 | |
| Starbucks Corp. | 1,161,402 | 71,298 | |
| 109,573 | |||
| Household Durables - 0.9% | |||
| Harman International Industries, Inc. | 185,100 | 19,095 | |
| Toll Brothers, Inc. (a) | 205,800 | 7,652 | |
| 26,747 | |||
| Internet & Catalog Retail - 3.6% | |||
| Amazon.com, Inc. (a) | 117,800 | 78,313 | |
| Netflix, Inc. (a) | 150,700 | 18,586 | |
| NutriSystem, Inc. | 122,400 | 2,808 | |
| Travelport Worldwide Ltd. | 143,600 | 1,911 | |
| 101,618 | |||
| Leisure Products - 0.0% | |||
| NJOY, Inc. (a)(b) | 202,642 | 0 | |
| Specialty Retail - 4.2% | |||
| AutoZone, Inc. (a) | 11,100 | 8,700 | |
| Five Below, Inc. (a)(c) | 335,100 | 9,386 | |
| Home Depot, Inc. | 518,244 | 69,383 | |
| L Brands, Inc. | 87,200 | 8,320 | |
| Lowe's Companies, Inc. | 152,700 | 11,697 | |
| MarineMax, Inc. (a) | 209,400 | 3,801 | |
| Restoration Hardware Holdings, Inc. (a) | 2,800 | 252 | |
| Ulta Salon, Cosmetics & Fragrance, Inc. (a) | 58,274 | 9,732 | |
| 121,271 | |||
| Textiles, Apparel & Luxury Goods - 1.7% | |||
| Kate Spade & Co. (a) | 1,104,724 | 22,139 | |
| NIKE, Inc. Class B | 209,257 | 27,681 | |
| 49,820 | |||
| TOTAL CONSUMER DISCRETIONARY | 466,604 | ||
| CONSUMER STAPLES - 3.2% | |||
| Beverages - 0.5% | |||
| Kweichow Moutai Co. Ltd. | 64,130 | 2,148 | |
| The Coca-Cola Co. | 317,626 | 13,537 | |
| 15,685 | |||
| Food & Staples Retailing - 0.7% | |||
| CVS Health Corp. | 135,900 | 12,787 | |
| Whole Foods Market, Inc. | 248,083 | 7,232 | |
| 20,019 | |||
| Food Products - 0.4% | |||
| Keurig Green Mountain, Inc. | 240,691 | 12,612 | |
| Household Products - 0.3% | |||
| Procter & Gamble Co. | 104,691 | 7,835 | |
| Personal Products - 1.3% | |||
| Avon Products, Inc. | 287,500 | 992 | |
| Estee Lauder Companies, Inc. Class A | 101,200 | 8,513 | |
| Herbalife Ltd. (a) | 466,166 | 26,912 | |
| 36,417 | |||
| TOTAL CONSUMER STAPLES | 92,568 | ||
| ENERGY - 0.3% | |||
| Oil, Gas & Consumable Fuels - 0.3% | |||
| Golar LNG Ltd. | 264,848 | 7,244 | |
| FINANCIALS - 6.7% | |||
| Banks - 0.9% | |||
| First Republic Bank | 302,800 | 20,851 | |
| HDFC Bank Ltd. (a) | 68,446 | 1,319 | |
| M&T Bank Corp. | 25,400 | 3,183 | |
| 25,353 | |||
| Capital Markets - 2.8% | |||
| BlackRock, Inc. Class A | 42,000 | 15,276 | |
| E*TRADE Financial Corp. (a) | 850,445 | 25,879 | |
| HFF, Inc. | 199,700 | 6,864 | |
| Invesco Ltd. | 282,523 | 9,518 | |
| JMP Group, Inc. | 141,100 | 872 | |
| PJT Partners, Inc. (a) | 21,880 | 513 | |
| The Blackstone Group LP | 451,933 | 14,114 | |
| Virtus Investment Partners, Inc. | 51,400 | 7,003 | |
| 80,039 | |||
| Diversified Financial Services - 1.4% | |||
| Berkshire Hathaway, Inc. Class B (a) | 55,800 | 7,482 | |
| McGraw Hill Financial, Inc. | 246,875 | 23,816 | |
| MSCI, Inc. Class A | 114,600 | 8,036 | |
| 39,334 | |||
| Real Estate Investment Trusts - 0.6% | |||
| American Tower Corp. | 174,400 | 17,332 | |
| Real Estate Management & Development - 0.8% | |||
| Realogy Holdings Corp. (a) | 594,918 | 24,576 | |
| Thrifts & Mortgage Finance - 0.2% | |||
| Essent Group Ltd. (a) | 229,300 | 5,668 | |
| TOTAL FINANCIALS | 192,302 | ||
| HEALTH CARE - 15.7% | |||
| Biotechnology - 9.9% | |||
| Amgen, Inc. | 178,100 | 28,692 | |
| BioMarin Pharmaceutical, Inc. (a) | 161,679 | 15,419 | |
| Celgene Corp. (a) | 161,600 | 17,687 | |
| Cytokinetics, Inc. warrants 6/25/17 (a) | 856,620 | 974 | |
| Gilead Sciences, Inc. | 1,388,047 | 147,077 | |
| Insmed, Inc. (a) | 744,220 | 12,138 | |
| Medivation, Inc. (a) | 794,600 | 33,596 | |
| Vertex Pharmaceuticals, Inc. (a) | 231,700 | 29,973 | |
| 285,556 | |||
| Health Care Equipment & Supplies - 0.6% | |||
| Medtronic PLC | 138,800 | 10,457 | |
| Novadaq Technologies, Inc. (a) | 575,300 | 7,007 | |
| 17,464 | |||
| Health Care Providers & Services - 0.3% | |||
| Express Scripts Holding Co. (a) | 111,500 | 9,531 | |
| Pharmaceuticals - 4.9% | |||
| Astellas Pharma, Inc. | 3,065,000 | 43,137 | |
| Teva Pharmaceutical Industries Ltd. sponsored ADR | 533,300 | 33,561 | |
| Valeant Pharmaceuticals International, Inc. (Canada) (a) | 701,100 | 63,183 | |
| 139,881 | |||
| TOTAL HEALTH CARE | 452,432 | ||
| INDUSTRIALS - 10.3% | |||
| Aerospace & Defense - 1.3% | |||
| Textron, Inc. | 340,200 | 14,516 | |
| TransDigm Group, Inc. (a) | 102,177 | 23,974 | |
| 38,490 | |||
| Air Freight & Logistics - 0.7% | |||
| United Parcel Service, Inc. Class B | 178,600 | 18,398 | |
| Airlines - 0.7% | |||
| Ryanair Holdings PLC sponsored ADR | 262,060 | 20,152 | |
| Building Products - 0.8% | |||
| A.O. Smith Corp. | 138,138 | 11,018 | |
| Caesarstone Sdot-Yam Ltd. | 258,500 | 10,567 | |
| 21,585 | |||
| Electrical Equipment - 0.8% | |||
| Acuity Brands, Inc. | 52,200 | 12,052 | |
| AMETEK, Inc. | 199,955 | 11,289 | |
| 23,341 | |||
| Industrial Conglomerates - 3.1% | |||
| Danaher Corp. | 674,214 | 64,987 | |
| Roper Industries, Inc. | 126,169 | 24,412 | |
| 89,399 | |||
| Professional Services - 1.6% | |||
| CEB, Inc. | 42,300 | 3,269 | |
| Equifax, Inc. | 48,900 | 5,452 | |
| Resources Connection, Inc. | 311,700 | 5,689 | |
| Robert Half International, Inc. | 287,800 | 14,730 | |
| WageWorks, Inc. (a) | 392,900 | 16,714 | |
| 45,854 | |||
| Road & Rail - 0.0% | |||
| Swift Transporation Co. (a) | 43,100 | 688 | |
| Trading Companies & Distributors - 1.3% | |||
| HD Supply Holdings, Inc. (a) | 1,084,400 | 34,300 | |
| Summit Ascent Holdings Ltd. (a) | 5,330,000 | 2,530 | |
| 36,830 | |||
| TOTAL INDUSTRIALS | 294,737 | ||
| INFORMATION TECHNOLOGY - 40.8% | |||
| Communications Equipment - 0.1% | |||
| QUALCOMM, Inc. | 74,400 | 3,630 | |
| Electronic Equipment & Components - 0.2% | |||
| CDW Corp. | 100,000 | 4,317 | |
| TE Connectivity Ltd. | 19,423 | 1,303 | |
| 5,620 | |||
| Internet Software & Services - 21.5% | |||
| 58.com, Inc. ADR (a) | 99,200 | 5,973 | |
| Alibaba Group Holding Ltd. sponsored ADR (a) | 335,700 | 28,226 | |
| Alphabet, Inc.: | |||
| Class A (a) | 244,150 | 186,250 | |
| Class C | 42,136 | 31,290 | |
| Cvent, Inc. (a) | 324,878 | 11,738 | |
| Demandware, Inc. (a)(c) | 155,704 | 7,964 | |
| Facebook, Inc. Class A (a) | 3,112,400 | 324,433 | |
| Just Dial Ltd. | 139,013 | 1,965 | |
| JUST EAT Ltd. (a) | 825,555 | 5,478 | |
| Shopify, Inc. Class A (c) | 3,600 | 95 | |
| Textura Corp. (a) | 409,489 | 9,889 | |
| Zillow Group, Inc. (a)(c) | 69,800 | 1,817 | |
| Zillow Group, Inc. Class C (a)(c) | 139,600 | 3,441 | |
| 618,559 | |||
| IT Services - 3.3% | |||
| Cognizant Technology Solutions Corp. Class A (a) | 445,300 | 28,757 | |
| Global Payments, Inc. | 75,200 | 5,328 | |
| MasterCard, Inc. Class A | 81,000 | 7,932 | |
| Visa, Inc. Class A | 672,532 | 53,137 | |
| 95,154 | |||
| Semiconductors & Semiconductor Equipment - 3.0% | |||
| Avago Technologies Ltd. | 518,300 | 67,612 | |
| Maxim Integrated Products, Inc. | 168,728 | 6,542 | |
| Monolithic Power Systems, Inc. | 162,432 | 11,099 | |
| 85,253 | |||
| Software - 9.8% | |||
| Activision Blizzard, Inc. | 246,600 | 9,287 | |
| Adobe Systems, Inc. (a) | 432,300 | 39,538 | |
| Computer Modelling Group Ltd. | 627,900 | 4,885 | |
| CyberArk Software Ltd. (a)(c) | 214,800 | 9,299 | |
| Electronic Arts, Inc. (a) | 767,645 | 52,039 | |
| Fleetmatics Group PLC (a) | 308,600 | 18,423 | |
| HubSpot, Inc. (a) | 176,800 | 9,584 | |
| Intuit, Inc. | 56,500 | 5,661 | |
| Mobileye NV (a)(c) | 416,200 | 18,146 | |
| Red Hat, Inc. (a) | 280,800 | 22,860 | |
| Salesforce.com, Inc. (a) | 928,292 | 73,976 | |
| ServiceNow, Inc. (a) | 215,100 | 18,716 | |
| 282,414 | |||
| Technology Hardware, Storage & Peripherals - 2.9% | |||
| Apple, Inc. | 693,427 | 82,032 | |
| TOTAL INFORMATION TECHNOLOGY | 1,172,662 | ||
| MATERIALS - 0.2% | |||
| Chemicals - 0.2% | |||
| CF Industries Holdings, Inc. | 134,100 | 6,187 | |
| TELECOMMUNICATION SERVICES - 0.2% | |||
| Wireless Telecommunication Services - 0.2% | |||
| SBA Communications Corp. Class A (a) | 53,500 | 5,626 | |
| TOTAL COMMON STOCKS | |||
| (Cost $2,142,764) | 2,690,362 | ||
| Convertible Preferred Stocks - 0.9% | |||
| CONSUMER DISCRETIONARY - 0.1% | |||
| Household Durables - 0.1% | |||
| Blu Homes, Inc. Series A, 5.00% (a)(b) | 875,350 | 3,782 | |
| INFORMATION TECHNOLOGY - 0.8% | |||
| Internet Software & Services - 0.7% | |||
| Uber Technologies, Inc. Series D, 8.00% (a)(b) | 485,012 | 19,226 | |
| IT Services - 0.1% | |||
| AppNexus, Inc. Series E (a)(b) | 105,425 | 2,116 | |
| TOTAL INFORMATION TECHNOLOGY | 21,342 | ||
| TOTAL CONVERTIBLE PREFERRED STOCKS | |||
| (Cost $13,680) | 25,124 | ||
| Money Market Funds - 6.5% | |||
| Fidelity Cash Central Fund, 0.18% (d) | 159,225,900 | 159,226 | |
| Fidelity Securities Lending Cash Central Fund, 0.22% (d)(e) | 28,009,728 | 28,010 | |
| TOTAL MONEY MARKET FUNDS | |||
| (Cost $187,236) | 187,236 | ||
| TOTAL INVESTMENT PORTFOLIO - 101.0% | |||
| (Cost $2,343,680) | 2,902,722 | ||
| NET OTHER ASSETS (LIABILITIES) - (1.0)% | (27,550) | ||
| NET ASSETS - 100% | $2,875,172 |
Values shown as $0 may reflect amounts less than $500.
Legend
(a) Non-income producing
(b) Restricted securities - Investment in securities not registered under the Securities Act of 1933 (excluding 144A issues). At the end of the period, the value of restricted securities (excluding 144A issues) amounted to $25,123,000 or 0.9% of net assets.
(c) Security or a portion of the security is on loan at period end.
(d) Affiliated fund that is generally available only to investment companies and other accounts managed by Fidelity Investments. The rate quoted is the annualized seven-day yield of the fund at period end. A complete unaudited listing of the fund's holdings as of its most recent quarter end is available upon request. In addition, each Fidelity Central Fund's financial statements, which are not covered by the Fund's Report of Independent Registered Public Accounting Firm, are available on the SEC's website or upon request.
(e) Investment made with cash collateral received from securities on loan.
Additional information on each restricted holding is as follows:
| Security | Acquisition Date | Acquisition Cost (000s) |
| AppNexus, Inc. Series E | 8/1/14 | $2,112 |
| Blu Homes, Inc. Series A, 5.00% | 6/21/13 | $4,044 |
| NJOY, Inc. | 9/11/13 | $1,637 |
| Uber Technologies, Inc. Series D, 8.00% | 6/6/14 | $7,524 |
Affiliated Central Funds
Information regarding fiscal year to date income earned by the Fund from investments in Fidelity Central Funds is as follows:
| Fund | Income earned |
| (Amounts in thousands) | |
| Fidelity Cash Central Fund | $222 |
| Fidelity Securities Lending Cash Central Fund | 515 |
| Total | $737 |
Investment Valuation
The following is a summary of the inputs used, as of November 30, 2015, involving the Fund's assets and liabilities carried at fair value. The inputs or methodology used for valuing securities may not be an indication of the risk associated with investing in those securities. For more information on valuation inputs, and their aggregation into the levels used below, please refer to the Investment Valuation section in the accompanying Notes to Financial Statements.
| Valuation Inputs at Reporting Date: | ||||
| Description | Total | Level 1 | Level 2 | Level 3 |
| (Amounts in thousands) | ||||
| Investments in Securities: | ||||
| Equities: | ||||
| Consumer Discretionary | $470,386 | $466,604 | $-- | $3,782 |
| Consumer Staples | 92,568 | 92,568 | -- | -- |
| Energy | 7,244 | 7,244 | -- | -- |
| Financials | 192,302 | 190,983 | 1,319 | -- |
| Health Care | 452,432 | 408,321 | 44,111 | -- |
| Industrials | 294,737 | 294,737 | -- | -- |
| Information Technology | 1,194,004 | 1,172,662 | -- | 21,342 |
| Materials | 6,187 | 6,187 | -- | -- |
| Telecommunication Services | 5,626 | 5,626 | -- | -- |
| Money Market Funds | 187,236 | 187,236 | -- | -- |
| Total Investments in Securities: | $2,902,722 | $2,832,168 | $45,430 | $25,124 |
Other Information
Distribution of investments by country or territory of incorporation, as a percentage of Total Net Assets, is as follows (Unaudited):
| United States of America | 85.5% |
| Canada | 2.6% |
| Singapore | 2.4% |
| Cayman Islands | 2.3% |
| Israel | 1.9% |
| Ireland | 1.7% |
| Japan | 1.5% |
| Bermuda | 1.0% |
| Others (Individually Less Than 1%) | 1.1% |
| 100.0% |
See accompanying notes which are an integral part of the financial statements.
Financial Statements
Statement of Assets and Liabilities
| Amounts in thousands (except per-share amounts) | November 30, 2015 | |
| Assets | ||
| Investment in securities, at value (including securities loaned of $27,374) — See accompanying schedule: Unaffiliated issuers (cost $2,156,444) | $2,715,486 | |
| Fidelity Central Funds (cost $187,236) | 187,236 | |
| Total Investments (cost $2,343,680) | $2,902,722 | |
| Receivable for investments sold | 3,674 | |
| Receivable for fund shares sold | 2,258 | |
| Dividends receivable | 1,468 | |
| Distributions receivable from Fidelity Central Funds | 73 | |
| Prepaid expenses | 7 | |
| Other receivables | 153 | |
| Total assets | 2,910,355 | |
| Liabilities | ||
| Payable for fund shares redeemed | $4,250 | |
| Accrued management fee | 1,312 | |
| Distribution and service plan fees payable | 888 | |
| Other affiliated payables | 525 | |
| Other payables and accrued expenses | 198 | |
| Collateral on securities loaned, at value | 28,010 | |
| Total liabilities | 35,183 | |
| Net Assets | $2,875,172 | |
| Net Assets consist of: | ||
| Paid in capital | $2,258,565 | |
| Accumulated net investment loss | (9,672) | |
| Accumulated undistributed net realized gain (loss) on investments and foreign currency transactions | 67,246 | |
| Net unrealized appreciation (depreciation) on investments and assets and liabilities in foreign currencies | 559,033 | |
| Net Assets | $2,875,172 | |
| Calculation of Maximum Offering Price | ||
| Class A: | ||
| Net Asset Value and redemption price per share ($887,025 ÷ 8,979.10 shares) | $98.79 | |
| Maximum offering price per share (100/94.25 of $98.79) | $104.82 | |
| Class T: | ||
| Net Asset Value and redemption price per share ($1,305,911 ÷ 13,369.18 shares) | $97.68 | |
| Maximum offering price per share (100/96.50 of $97.68) | $101.22 | |
| Class B: | ||
| Net Asset Value and offering price per share ($10,751 ÷ 124.43 shares)(a) | $86.40 | |
| Class C: | ||
| Net Asset Value and offering price per share ($183,004 ÷ 2,079.42 shares)(a) | $88.01 | |
| Class I: | ||
| Net Asset Value, offering price and redemption price per share ($462,843 ÷ 4,364.12 shares) | $106.06 | |
| Class Z: | ||
| Net Asset Value, offering price and redemption price per share ($25,638 ÷ 240.98 shares) | $106.39 |
(a) Redemption price per share is equal to net asset value less any applicable contingent deferred sales charge.
See accompanying notes which are an integral part of the financial statements.
Statement of Operations
| Amounts in thousands | Year ended November 30, 2015 | |
| Investment Income | ||
| Dividends | $25,162 | |
| Income from Fidelity Central Funds | 737 | |
| Total income | 25,899 | |
| Expenses | ||
| Management fee | $15,573 | |
| Transfer agent fees | 5,535 | |
| Distribution and service plan fees | 10,779 | |
| Accounting and security lending fees | 844 | |
| Custodian fees and expenses | 54 | |
| Independent trustees' compensation | 13 | |
| Registration fees | 133 | |
| Audit | 76 | |
| Legal | 20 | |
| Miscellaneous | 20 | |
| Total expenses before reductions | 33,047 | |
| Expense reductions | (173) | 32,874 |
| Net investment income (loss) | (6,975) | |
| Realized and Unrealized Gain (Loss) | ||
| Net realized gain (loss) on: | ||
| Investment securities: | ||
| Unaffiliated issuers | 205,402 | |
| Foreign currency transactions | (81) | |
| Total net realized gain (loss) | 205,321 | |
| Change in net unrealized appreciation (depreciation) on: Investment securities | (53,555) | |
| Assets and liabilities in foreign currencies | (2) | |
| Total change in net unrealized appreciation (depreciation) | (53,557) | |
| Net gain (loss) | 151,764 | |
| Net increase (decrease) in net assets resulting from operations | $144,789 |
See accompanying notes which are an integral part of the financial statements.
Statement of Changes in Net Assets
| Amounts in thousands | Year ended November 30, 2015 | Year ended November 30, 2014 |
| Increase (Decrease) in Net Assets | ||
| Operations | ||
| Net investment income (loss) | $(6,975) | $(4,201) |
| Net realized gain (loss) | 205,321 | 701,406 |
| Change in net unrealized appreciation (depreciation) | (53,557) | (219,078) |
| Net increase (decrease) in net assets resulting from operations | 144,789 | 478,127 |
| Share transactions - net increase (decrease) | (115,712) | (1,134,005) |
| Total increase (decrease) in net assets | 29,077 | (655,878) |
| Net Assets | ||
| Beginning of period | 2,846,095 | 3,501,973 |
| End of period (including accumulated net investment loss of $9,672 and accumulated net investment loss of $7,916, respectively) | $2,875,172 | $2,846,095 |
See accompanying notes which are an integral part of the financial statements.
Financial Highlights — Fidelity Advisor Equity Growth Fund Class A
| Years ended November 30, | 2015 | 2014 | 2013 | 2012 | 2011 |
| Selected Per–Share Data | |||||
| Net asset value, beginning of period | $93.78 | $80.87 | $61.77 | $54.56 | $50.75 |
| Income from Investment Operations | |||||
| Net investment income (loss)A | (.13) | (.07) | (.05) | .02 | (.04) |
| Net realized and unrealized gain (loss) | 5.14 | 12.98 | 19.15 | 7.30 | 3.90 |
| Total from investment operations | 5.01 | 12.91 | 19.10 | 7.32 | 3.86 |
| Distributions from net realized gain | – | – | – | (.11) | (.05) |
| Net asset value, end of period | $98.79 | $93.78 | $80.87 | $61.77 | $54.56 |
| Total ReturnB,C | 5.34% | 15.96% | 30.92% | 13.45% | 7.61% |
| Ratios to Average Net AssetsD,E | |||||
| Expenses before reductions | 1.05% | 1.07% | 1.11% | 1.14% | 1.15% |
| Expenses net of fee waivers, if any | 1.05% | 1.07% | 1.11% | 1.14% | 1.15% |
| Expenses net of all reductions | 1.04% | 1.07% | 1.10% | 1.14% | 1.14% |
| Net investment income (loss) | (.13)% | (.08)% | (.07)% | .04% | (.08)% |
| Supplemental Data | |||||
| Net assets, end of period (in millions) | $887 | $853 | $772 | $632 | $609 |
| Portfolio turnover rateF | 63% | 49%G | 81% | 73% | 70% |
A Calculated based on average shares outstanding during the period.
B Total returns would have been lower if certain expenses had not been reduced during the applicable periods shown.
C Total returns do not include the effect of the sales charges.
D Fees and expenses of any underlying Fidelity Central Funds are not included in the Fund's expense ratio. The Fund indirectly bears its proportionate share of the expenses of any underlying Fidelity Central Funds.
E Expense ratios reflect operating expenses of the class. Expenses before reductions do not reflect amounts reimbursed by the investment adviser or reductions from brokerage service arrangements or reductions from other expense offset arrangements and do not represent the amount paid by the class during periods when reimbursements or reductions occur. Expenses net of fee waivers reflect expenses after reimbursement by the investment adviser but prior to reductions from brokerage service arrangements or other expense offset arrangements. Expenses net of all reductions represent the net expenses paid by the class.
F Amount does not include the portfolio activity of any underlying Fidelity Central Funds.
G Portfolio turnover rate excludes securities received or delivered in-kind.
See accompanying notes which are an integral part of the financial statements.
Financial Highlights — Fidelity Advisor Equity Growth Fund Class T
| Years ended November 30, | 2015 | 2014 | 2013 | 2012 | 2011 |
| Selected Per–Share Data | |||||
| Net asset value, beginning of period | $92.94 | $80.31 | $61.45 | $54.26 | $50.51 |
| Income from Investment Operations | |||||
| Net investment income (loss)A | (.34) | (.25) | (.17) | (.08) | (.14) |
| Net realized and unrealized gain (loss) | 5.08 | 12.88 | 19.03 | 7.27 | 3.89 |
| Total from investment operations | 4.74 | 12.63 | 18.86 | 7.19 | 3.75 |
| Net asset value, end of period | $97.68 | $92.94 | $80.31 | $61.45 | $54.26 |
| Total ReturnB,C | 5.10% | 15.73% | 30.69% | 13.25% | 7.42% |
| Ratios to Average Net AssetsD,E | |||||
| Expenses before reductions | 1.27% | 1.28% | 1.29% | 1.31% | 1.32% |
| Expenses net of fee waivers, if any | 1.27% | 1.28% | 1.29% | 1.31% | 1.32% |
| Expenses net of all reductions | 1.27% | 1.28% | 1.28% | 1.31% | 1.31% |
| Net investment income (loss) | (.36)% | (.29)% | (.25)% | (.13)% | (.25)% |
| Supplemental Data | |||||
| Net assets, end of period (in millions) | $1,306 | $1,368 | $1,283 | $1,108 | $1,139 |
| Portfolio turnover rateF | 63% | 49%G | 81% | 73% | 70% |
A Calculated based on average shares outstanding during the period.
B Total returns would have been lower if certain expenses had not been reduced during the applicable periods shown.
C Total returns do not include the effect of the sales charges.
D Fees and expenses of any underlying Fidelity Central Funds are not included in the Fund's expense ratio. The Fund indirectly bears its proportionate share of the expenses of any underlying Fidelity Central Funds.
E Expense ratios reflect operating expenses of the class. Expenses before reductions do not reflect amounts reimbursed by the investment adviser or reductions from brokerage service arrangements or reductions from other expense offset arrangements and do not represent the amount paid by the class during periods when reimbursements or reductions occur. Expenses net of fee waivers reflect expenses after reimbursement by the investment adviser but prior to reductions from brokerage service arrangements or other expense offset arrangements. Expenses net of all reductions represent the net expenses paid by the class.
F Amount does not include the portfolio activity of any underlying Fidelity Central Funds.
G Portfolio turnover rate excludes securities received or delivered in-kind.
See accompanying notes which are an integral part of the financial statements.
Financial Highlights — Fidelity Advisor Equity Growth Fund Class B
| Years ended November 30, | 2015 | 2014 | 2013 | 2012 | 2011 |
| Selected Per–Share Data | |||||
| Net asset value, beginning of period | $82.71 | $71.91 | $55.36 | $49.17 | $46.04 |
| Income from Investment Operations | |||||
| Net investment income (loss)A | (.82) | (.70) | (.52) | (.39) | (.42) |
| Net realized and unrealized gain (loss) | 4.51 | 11.50 | 17.07 | 6.58 | 3.55 |
| Total from investment operations | 3.69 | 10.80 | 16.55 | 6.19 | 3.13 |
| Net asset value, end of period | $86.40 | $82.71 | $71.91 | $55.36 | $49.17 |
| Total ReturnB,C | 4.46% | 15.02% | 29.90% | 12.59% | 6.80% |
| Ratios to Average Net AssetsD,E | |||||
| Expenses before reductions | 1.89% | 1.89% | 1.89% | 1.90% | 1.90% |
| Expenses net of fee waivers, if any | 1.89% | 1.89% | 1.89% | 1.90% | 1.90% |
| Expenses net of all reductions | 1.89% | 1.89% | 1.88% | 1.90% | 1.90% |
| Net investment income (loss) | (.98)% | (.91)% | (.85)% | (.72)% | (.83)% |
| Supplemental Data | |||||
| Net assets, end of period (in millions) | $11 | $18 | $23 | $26 | $35 |
| Portfolio turnover rateF | 63% | 49%G | 81% | 73% | 70% |
A Calculated based on average shares outstanding during the period.
B Total returns would have been lower if certain expenses had not been reduced during the applicable periods shown.
C Total returns do not include the effect of the contingent deferred sales charge.
D Fees and expenses of any underlying Fidelity Central Funds are not included in the Fund's expense ratio. The Fund indirectly bears its proportionate share of the expenses of any underlying Fidelity Central Funds.
E Expense ratios reflect operating expenses of the class. Expenses before reductions do not reflect amounts reimbursed by the investment adviser or reductions from brokerage service arrangements or reductions from other expense offset arrangements and do not represent the amount paid by the class during periods when reimbursements or reductions occur. Expenses net of fee waivers reflect expenses after reimbursement by the investment adviser but prior to reductions from brokerage service arrangements or other expense offset arrangements. Expenses net of all reductions represent the net expenses paid by the class.
F Amount does not include the portfolio activity of any underlying Fidelity Central Funds.
G Portfolio turnover rate excludes securities received or delivered in-kind.
See accompanying notes which are an integral part of the financial statements.
Financial Highlights — Fidelity Advisor Equity Growth Fund Class C
| Years ended November 30, | 2015 | 2014 | 2013 | 2012 | 2011 |
| Selected Per–Share Data | |||||
| Net asset value, beginning of period | $84.18 | $73.13 | $56.27 | $49.96 | $46.77 |
| Income from Investment Operations | |||||
| Net investment income (loss)A | (.77) | (.66) | (.50) | (.37) | (.41) |
| Net realized and unrealized gain (loss) | 4.60 | 11.71 | 17.36 | 6.68 | 3.60 |
| Total from investment operations | 3.83 | 11.05 | 16.86 | 6.31 | 3.19 |
| Net asset value, end of period | $88.01 | $84.18 | $73.13 | $56.27 | $49.96 |
| Total ReturnB,C | 4.55% | 15.11% | 29.96% | 12.63% | 6.82% |
| Ratios to Average Net AssetsD,E | |||||
| Expenses before reductions | 1.81% | 1.81% | 1.84% | 1.86% | 1.88% |
| Expenses net of fee waivers, if any | 1.81% | 1.81% | 1.84% | 1.86% | 1.88% |
| Expenses net of all reductions | 1.80% | 1.81% | 1.83% | 1.86% | 1.87% |
| Net investment income (loss) | (.89)% | (.83)% | (.79)% | (.68)% | (.81)% |
| Supplemental Data | |||||
| Net assets, end of period (in millions) | $183 | $175 | $157 | $133 | $136 |
| Portfolio turnover rateF | 63% | 49%G | 81% | 73% | 70% |
A Calculated based on average shares outstanding during the period.
B Total returns would have been lower if certain expenses had not been reduced during the applicable periods shown.
C Total returns do not include the effect of the contingent deferred sales charge.
D Fees and expenses of any underlying Fidelity Central Funds are not included in the Fund's expense ratio. The Fund indirectly bears its proportionate share of the expenses of any underlying Fidelity Central Funds.
E Expense ratios reflect operating expenses of the class. Expenses before reductions do not reflect amounts reimbursed by the investment adviser or reductions from brokerage service arrangements or reductions from other expense offset arrangements and do not represent the amount paid by the class during periods when reimbursements or reductions occur. Expenses net of fee waivers reflect expenses after reimbursement by the investment adviser but prior to reductions from brokerage service arrangements or other expense offset arrangements. Expenses net of all reductions represent the net expenses paid by the class.
F Amount does not include the portfolio activity of any underlying Fidelity Central Funds.
G Portfolio turnover rate excludes securities received or delivered in-kind.
See accompanying notes which are an integral part of the financial statements.
Financial Highlights — Fidelity Advisor Equity Growth Fund Class I
| Years ended November 30, | 2015 | 2014 | 2013 | 2012 | 2011 |
| Selected Per–Share Data | |||||
| Net asset value, beginning of period | $100.40 | $86.32 | $65.92 | $58.24 | $54.14 |
| Income from Investment Operations | |||||
| Net investment income (loss)A | .15 | .20 | .20 | .25 | .16 |
| Net realized and unrealized gain (loss) | 5.51 | 13.88 | 20.40 | 7.75 | 4.16 |
| Total from investment operations | 5.66 | 14.08 | 20.60 | 8.00 | 4.32 |
| Distributions from net investment income | – | – | (.20) | – | – |
| Distributions from net realized gain | – | – | – | (.32) | (.22) |
| Total distributions | – | – | (.20) | (.32) | (.22) |
| Net asset value, end of period | $106.06 | $100.40 | $86.32 | $65.92 | $58.24 |
| Total ReturnB | 5.64% | 16.31% | 31.36% | 13.83% | 7.99% |
| Ratios to Average Net AssetsC,D | |||||
| Expenses before reductions | .78% | .77% | .78% | .80% | .80% |
| Expenses net of fee waivers, if any | .77% | .77% | .78% | .80% | .80% |
| Expenses net of all reductions | .77% | .77% | .77% | .79% | .79% |
| Net investment income (loss) | .14% | .21% | .27% | .39% | .27% |
| Supplemental Data | |||||
| Net assets, end of period (in millions) | $463 | $432 | $1,266 | $1,063 | $897 |
| Portfolio turnover rateE | 63% | 49%F | 81% | 73% | 70% |
A Calculated based on average shares outstanding during the period.
B Total returns would have been lower if certain expenses had not been reduced during the applicable periods shown.
C Fees and expenses of any underlying Fidelity Central Funds are not included in the Fund's expense ratio. The Fund indirectly bears its proportionate share of the expenses of any underlying Fidelity Central Funds.
D Expense ratios reflect operating expenses of the class. Expenses before reductions do not reflect amounts reimbursed by the investment adviser or reductions from brokerage service arrangements or reductions from other expense offset arrangements and do not represent the amount paid by the class during periods when reimbursements or reductions occur. Expenses net of fee waivers reflect expenses after reimbursement by the investment adviser but prior to reductions from brokerage service arrangements or other expense offset arrangements. Expenses net of all reductions represent the net expenses paid by the class.
E Amount does not include the portfolio activity of any underlying Fidelity Central Funds.
F Portfolio turnover rate excludes securities received or delivered in-kind.
See accompanying notes which are an integral part of the financial statements.
Financial Highlights — Fidelity Advisor Equity Growth Fund Class Z
| Years ended November 30, | 2015 | 2014 | 2013 A |
| Selected Per–Share Data | |||
| Net asset value, beginning of period | $100.59 | $86.36 | $78.49 |
| Income from Investment Operations | |||
| Net investment income (loss)B | .29 | .33 | .09 |
| Net realized and unrealized gain (loss) | 5.51 | 13.90 | 7.78 |
| Total from investment operations | 5.80 | 14.23 | 7.87 |
| Net asset value, end of period | $106.39 | $100.59 | $86.36 |
| Total ReturnC,D | 5.77% | 16.48% | 10.03% |
| Ratios to Average Net AssetsE,F | |||
| Expenses before reductions | .64% | .64% | .64%G |
| Expenses net of fee waivers, if any | .64% | .64% | .64%G |
| Expenses net of all reductions | .63% | .64% | .63%G |
| Net investment income (loss) | .28% | .35% | .38%G |
| Supplemental Data | |||
| Net assets, end of period (000 omitted) | $25,638 | $122 | $110 |
| Portfolio turnover rateH | 63% | 49%I | 81% |
A For the period August 13, 2013 (commencement of sale of shares) to November 30, 2013.
B Calculated based on average shares outstanding during the period.
C Total returns for periods of less than one year are not annualized.
D Total returns would have been lower if certain expenses had not been reduced during the applicable periods shown.
E Fees and expenses of any underlying Fidelity Central Funds are not included in the Fund's expense ratio. The Fund indirectly bears its proportionate share of the expenses of any underlying Fidelity Central Funds.
F Expense ratios reflect operating expenses of the class. Expenses before reductions do not reflect amounts reimbursed by the investment adviser or reductions from brokerage service arrangements or reductions from other expense offset arrangements and do not represent the amount paid by the class during periods when reimbursements or reductions occur. Expense ratios before reductions for start-up periods may not be representative of longer-term operating periods. Expenses net of fee waivers reflect expenses after reimbursement by the investment adviser but prior to reductions from brokerage service arrangements or other expense offset arrangements. Expenses net of all reductions represent the net expenses paid by the class.
G Annualized
H Amount does not include the portfolio activity of any underlying Fidelity Central Funds.
I Portfolio turnover rate excludes securities received or delivered in-kind.
See accompanying notes which are an integral part of the financial statements.
Notes to Financial Statements
For the period ended November 30, 2015
(Amounts in thousands except percentages)
1. Organization.
Fidelity Advisor Equity Growth Fund (the Fund) is a fund of Fidelity Advisor Series I (the Trust) and is authorized to issue an unlimited number of shares. The Trust is registered under the Investment Company Act of 1940, as amended (the 1940 Act), as an open-end management investment company organized as a Massachusetts business trust. The Fund offers Class A, Class T, Class C, Class I (formerly Institutional Class) and Class Z shares, each of which, along with Class B shares, has equal rights as to assets and voting privileges. Class B shares are closed to new accounts and additional purchases, except for exchanges and reinvestments. Each class has exclusive voting rights with respect to matters that affect that class. Class B shares will automatically convert to Class A shares after a holding period of seven years from the initial date of purchase.
2. Investments in Fidelity Central Funds.
The Fund invests in Fidelity Central Funds, which are open-end investment companies generally available only to other investment companies and accounts managed by the investment adviser and its affiliates. The Fund's Schedule of Investments lists each of the Fidelity Central Funds held as of period end, if any, as an investment of the Fund, but does not include the underlying holdings of each Fidelity Central Fund. As an Investing Fund, the Fund indirectly bears its proportionate share of the expenses of the underlying Fidelity Central Funds.
The Money Market Central Funds seek preservation of capital and current income and are managed by Fidelity Investments Money Management, Inc. (FIMM), an affiliate of the investment adviser. Annualized expenses of the Money Market Central Funds as of their most recent shareholder report date are less than .005%.
A complete unaudited list of holdings for each Fidelity Central Fund is available upon request or at the Securities and Exchange Commission (the SEC) website at www.sec.gov. In addition, the financial statements of the Fidelity Central Funds, which are not covered by the Fund's Report of Independent Registered Public Accounting Firm, are available on the SEC website or upon request.
3. Significant Accounting Policies.
The financial statements have been prepared in conformity with accounting principles generally accepted in the United States of America (GAAP), which require management to make certain estimates and assumptions at the date of the financial statements. Actual results could differ from those estimates. Subsequent events, if any, through the date that the financial statements were issued have been evaluated in the preparation of the financial statements. The following summarizes the significant accounting policies of the Fund:
Investment Valuation. Investments are valued as of 4:00 p.m. Eastern time on the last calendar day of the period. The Board of Trustees (the Board) has delegated the day to day responsibility for the valuation of the Fund's investments to the Fidelity Management & Research Company (FMR) Fair Value Committee (the Committee). In accordance with valuation policies and procedures approved by the Board, the Fund attempts to obtain prices from one or more third party pricing vendors or brokers to value its investments. When current market prices, quotations or currency exchange rates are not readily available or reliable, investments will be fair valued in good faith by the Committee, in accordance with procedures adopted by the Board. Factors used in determining fair value vary by investment type and may include market or investment specific events. The frequency with which these procedures are used cannot be predicted and they may be utilized to a significant extent. The Committee oversees the Fund's valuation policies and procedures and reports to the Board on the Committee's activities and fair value determinations. The Board monitors the appropriateness of the procedures used in valuing the Fund's investments and ratifies the fair value determinations of the Committee.
The Fund categorizes the inputs to valuation techniques used to value its investments into a disclosure hierarchy consisting of three levels as shown below:
- Level 1 – quoted prices in active markets for identical investments
- Level 2 – other significant observable inputs (including quoted prices for similar investments, interest rates, prepayment speeds, etc.)
- Level 3 – unobservable inputs (including the Fund's own assumptions based on the best information available)
Valuation techniques used to value the Fund's investments by major category are as follows:
Equity securities, including restricted securities, for which market quotations are readily available, are valued at the last reported sale price or official closing price as reported by a third party pricing vendor on the primary market or exchange on which they are traded and are categorized as Level 1 in the hierarchy. In the event there were no sales during the day or closing prices are not available, securities are valued at the last quoted bid price or may be valued using the last available price and are generally categorized as Level 2 in the hierarchy. For foreign equity securities, when market or security specific events arise, comparisons to the valuation of American Depositary Receipts (ADRs), futures contracts, Exchange-Traded Funds (ETFs) and certain indexes as well as quoted prices for similar securities may be used and would be categorized as Level 2 in the hierarchy. Utilizing these techniques may result in transfers between Level 1 and Level 2. For equity securities, including restricted securities, where observable inputs are limited, assumptions about market activity and risk are used and these securities may be categorized as Level 3 in the hierarchy.
Investments in open-end mutual funds, including the Fidelity Central Funds, are valued at their closing net asset value (NAV) each business day and are categorized as Level 1 in the hierarchy.
Changes in valuation techniques may result in transfers in or out of an assigned level within the disclosure hierarchy. The aggregate value of investments by input level as of November 30, 2015 is included at the end of the Fund's Schedule of Investments.
Foreign Currency. The Fund may use foreign currency contracts to facilitate transactions in foreign-denominated securities. Gains and losses from these transactions may arise from changes in the value of the foreign currency or if the counterparties do not perform under the contracts' terms.
Foreign-denominated assets, including investment securities, and liabilities are translated into U.S. dollars at the exchange rates at period end. Purchases and sales of investment securities, income and dividends received and expenses denominated in foreign currencies are translated into U.S. dollars at the exchange rate in effect on the transaction date.
The effects of exchange rate fluctuations on investments are included with the net realized and unrealized gain (loss) on investment securities. Other foreign currency transactions resulting in realized and unrealized gain (loss) are disclosed separately.
Investment Transactions and Income. For financial reporting purposes, the Fund's investment holdings and NAV include trades executed through the end of the last business day of the period. The NAV per share for processing shareholder transactions is calculated as of the close of business of the New York Stock Exchange (NYSE), normally 4:00 p.m. Eastern time and includes trades executed through the end of the prior business day. Gains and losses on securities sold are determined on the basis of identified cost and may include proceeds received from litigation. Dividend income is recorded on the ex-dividend date, except for certain dividends from foreign securities where the ex-dividend date may have passed, which are recorded as soon as the Fund is informed of the ex-dividend date. Non-cash dividends included in dividend income, if any, are recorded at the fair market value of the securities received. Income and capital gain distributions from Fidelity Central Funds, if any, are recorded on the ex-dividend date. Distributions received on securities that represent a return of capital or capital gain are recorded as a reduction of cost of investments and/or as a realized gain. Subsequent to ex-dividend date the Fund determines the components of these distributions, based upon receipt of tax filings or other correspondence relating to the underlying investment. Investment income is recorded net of foreign taxes withheld where recovery of such taxes is uncertain.
Class Allocations and Expenses. Investment income, realized and unrealized capital gains and losses, common expenses of the Fund, and certain fund-level expense reductions, if any, are allocated daily on a pro-rata basis to each class based on the relative net assets of each class to the total net assets of the Fund. Each class differs with respect to transfer agent and distribution and service plan fees incurred. Certain expense reductions may also differ by class. For the reporting period, the allocated portion of income and expenses to each class as a percent of its average net assets may vary due to the timing of recording these transactions in relation to fluctuating net assets of the classes. Expenses directly attributable to a fund are charged to that fund. Expenses attributable to more than one fund are allocated among the respective funds on the basis of relative net assets or other appropriate methods. Expense estimates are accrued in the period to which they relate and adjustments are made when actual amounts are known.
Deferred Trustee Compensation. Under a Deferred Compensation Plan (the Plan), independent Trustees may elect to defer receipt of a portion of their annual compensation. Deferred amounts are invested in a cross-section of Fidelity funds, are marked-to-market and remain in the Fund until distributed in accordance with the Plan. The investment of deferred amounts and the offsetting payable to the Trustees are included in the accompanying Statement of Assets and Liabilities.
Income Tax Information and Distributions to Shareholders. Each year, the Fund intends to qualify as a regulated investment company under Subchapter M of the Internal Revenue Code, including distributing substantially all of its taxable income and realized gains. As a result, no provision for U.S. Federal income taxes is required. As of November 30, 2015, the Fund did not have any unrecognized tax benefits in the financial statements; nor is the Fund aware of any tax positions for which it is reasonably possible that the total amounts of unrecognized tax benefits will significantly change in the next twelve months. The Fund files a U.S. federal tax return, in addition to state and local tax returns as required. The Fund's federal income tax returns are subject to examination by the Internal Revenue Service (IRS) for a period of three fiscal years after they are filed. State and local tax returns may be subject to examination for an additional fiscal year depending on the jurisdiction. Foreign taxes are provided for based on the Fund's understanding of the tax rules and rates that exist in the foreign markets in which it invests.
Distributions are declared and recorded on the ex-dividend date. Income dividends and capital gain distributions are declared separately for each class. Income and capital gain distributions are determined in accordance with income tax regulations, which may differ from GAAP.
Capital accounts within the financial statements are adjusted for permanent book-tax differences. These adjustments have no impact on net assets or the results of operations. Capital accounts are not adjusted for temporary book-tax differences which will reverse in a subsequent period.
Book-tax differences are primarily due to foreign currency transactions, partnerships, deferred trustees compensation, net operating losses, capital loss carryforwards and losses deferred due to wash sales and excise tax regulations.
The federal tax cost of investment securities and unrealized appreciation (depreciation) as of period end were as follows:
| Gross unrealized appreciation | $676,173 |
| Gross unrealized depreciation | (119,104) |
| Net unrealized appreciation (depreciation) on securities | $557,069 |
| Tax Cost | $2,345,653 |
The tax-based components of distributable earnings as of period end were as follows:
| Undistributed long-term capital gain | $69,219 |
| Net unrealized appreciation (depreciation) on securities and other investments | $557,059 |
The Fund intends to elect to defer to its next fiscal year $9,526 of ordinary losses recognized during the period January 1, 2015 to November 30, 2015.
Restricted Securities. The Fund may invest in securities that are subject to legal or contractual restrictions on resale. These securities generally may be resold in transactions exempt from registration or to the public if the securities are registered. Disposal of these securities may involve time-consuming negotiations and expense, and prompt sale at an acceptable price may be difficult. Information regarding restricted securities is included at the end of the Fund's Schedule of Investments.
4. Purchases and Sales of Investments.
Purchases and sales of securities, other than short-term securities, aggregated $1,698,266 and $1,920,732, respectively.
5. Fees and Other Transactions with Affiliates.
Management Fee. Fidelity Management & Research Company (the investment adviser) and its affiliates provide the Fund with investment management related services for which the Fund pays a monthly management fee. The management fee is the sum of an individual fund fee rate that is based on an annual rate of .30% of the Fund's average net assets and an annualized group fee rate that averaged .25% during the period. The group fee rate is based upon the average net assets of all the mutual funds advised by the investment adviser, including any mutual funds previously advised by the investment adviser that are currently advised by Fidelity SelectCo, LLC, an affiliate of the investment adviser. The group fee rate decreases as assets under management increase and increases as assets under management decrease. For the reporting period, the total annual management fee rate was .55% of the Fund's average net assets.
Distribution and Service Plan Fees. In accordance with Rule 12b-1 of the 1940 Act, the Fund has adopted separate Distribution and Service Plans for each class of shares. Certain classes pay Fidelity Distributors Corporation (FDC), an affiliate of the investment adviser, separate Distribution and Service Fees, each of which is based on an annual percentage of each class' average net assets. In addition, FDC may pay financial intermediaries for selling shares of the Fund and providing shareholder support services. For the period, the Distribution and Service Fee rates, total fees and amounts retained by FDC were as follows:
| Distribution Fee | Service Fee | Total Fees | Retained by FDC | |
| Class A | -% | .25% | $2,163 | $30 |
| Class T | .25% | .25% | 6,697 | 14 |
| Class B | .75% | .25% | 140 | 106 |
| Class C | .75% | .25% | 1,779 | 118 |
| $10,779 | $268 |
Sales Load. FDC may receive a front-end sales charge of up to 5.75% for selling Class A shares and 3.50% for selling Class T shares, some of which is paid to financial intermediaries for selling shares of the Fund. Depending on the holding period, FDC may receive contingent deferred sales charges levied on Class A, Class T, Class B, and Class C redemptions. The deferred sales charges range from 5.00% to 1.00% for Class B shares, 1.00% for Class C shares, 1.00% for certain purchases of Class A shares and .25% for certain purchases of Class T shares.
For the period, sales charge amounts retained by FDC were as follows:
| Retained by FDC | |
| Class A | $103 |
| Class T | 39 |
| Class B(a) | 3 |
| Class C(a) | 11 |
| $156 |
(a) When Class B and Class C shares are initially sold, FDC pays commissions from its own resources to financial intermediaries through which the sales are made.
Transfer Agent Fees. Fidelity Investments Institutional Operations Company, Inc., (FIIOC), an affiliate of the investment adviser, is the transfer, dividend disbursing and shareholder servicing agent for each class of the Fund. FIIOC receives account fees and asset-based fees that vary according to the account size and type of account of the shareholders of the respective classes of the Fund, except for Class Z. FIIOC receives an asset-based fee of Class Z's average net assets. FIIOC pays for typesetting, printing and mailing of shareholder reports, except proxy statements.
For the period, transfer agent fees for each class were as follows:
| Amount | % of Class-Level Average Net Assets | |
| Class A | $1,822 | .21 |
| Class T | 2,478 | .19 |
| Class B | 42 | .30 |
| Class C | 390 | .22 |
| Class I | 795 | .19 |
| Class Z | 8 | .05 |
| $5,535 |
Accounting and Security Lending Fees. Fidelity Service Company, Inc. (FSC), an affiliate of the investment adviser, maintains the Fund's accounting records. The accounting fee is based on the level of average net assets for each month. Under a separate contract, FSC administers the security lending program. The security lending fee is based on the number and duration of lending transactions.
Brokerage Commissions. The Fund placed a portion of its portfolio transactions with brokerage firms which are affiliates of the investment adviser. Brokerage commissions are included in net realized gain (loss) and change in net unrealized appreciation (depreciation) in the Statement of Operations. The commissions paid to these affiliated firms were $21 for the period.
6. Committed Line of Credit.
The Fund participates with other funds managed by the investment adviser or an affiliate in a $4.25 billion credit facility (the "line of credit") to be utilized for temporary or emergency purposes to fund shareholder redemptions or for other short-term liquidity purposes. The Fund has agreed to pay commitment fees on its pro-rata portion of the line of credit, which amounted to $4 and is reflected in Miscellaneous expenses on the Statement of Operations. During the period, the Fund did not borrow on this line of credit.
7. Security Lending.
The Fund lends portfolio securities through a lending agent from time to time in order to earn additional income. For equity securities, a lending agent is used and may loan securities to certain qualified borrowers, including Fidelity Capital Markets (FCM), a broker-dealer affiliated with the Fund. On the settlement date of the loan, the Fund receives collateral (in the form of U.S. Treasury obligations, letters of credit and/or cash) against the loaned securities and maintains collateral in an amount not less than 100% of the market value of the loaned securities during the period of the loan. The market value of the loaned securities is determined at the close of business of the Fund and any additional required collateral is delivered to the Fund on the next business day. The Fund or borrower may terminate the loan at any time, and if the borrower defaults on its obligation to return the securities loaned because of insolvency or other reasons, the Fund may apply collateral received from the borrower against the obligation. The Fund may experience delays and costs in recovering the securities loaned. Any cash collateral received is invested in the Fidelity Securities Lending Cash Central Fund. The value of loaned securities and cash collateral at period end are disclosed on the Fund's Statement of Assets and Liabilities. The value of securities loaned to FCM at period end was $3,416. Security lending income represents the income earned on investing cash collateral, less rebates paid to borrowers and any lending agent fees associated with the loan, plus any premium payments received for lending certain types of securities. Security lending income is presented in the Statement of Operations as a component of income from Fidelity Central Funds. Total security lending income during the period amounted to $515, including $35 from securities loaned to FCM.
8. Expense Reductions.
Commissions paid to certain brokers with whom the investment adviser, or its affiliates, places trades on behalf of the Fund include an amount in addition to trade execution, which may be rebated back to the Fund to offset certain expenses. This amount totaled $89 for the period
In addition, during the period the investment adviser reimbursed and/or waived a portion of fund-level operating expenses in the amount of $11 and a portion of class-level operating expenses as follows:
| Amount | |
| Class A | $18 |
| Class T | 30 |
| Class B | –(a) |
| Class C | 4 |
| Class I | 21 |
| $73 |
(a) In the amount of less than five hundred dollars.
9. Share Transactions.
Share transactions for each class were as follows and may contain automatic conversions between classes or exchanges between funds:
| Shares | Shares | Dollars | Dollars | |
| Years ended November 30, | 2015 | 2014 | 2015 | 2014 |
| Class A | ||||
| Shares sold | 1,688 | 1,501 | $162,907 | $132,626 |
| Shares redeemed | (1,807) | (1,946) | (173,253) | (170,229) |
| Net increase (decrease) | (119) | (445) | $(10,346) | $(37,603) |
| Class T | ||||
| Shares sold | 1,492 | 1,656 | $141,497 | $144,112 |
| Shares redeemed | (2,839) | (2,920) | (269,251) | (253,312) |
| Net increase (decrease) | (1,347) | (1,264) | $(127,754) | $(109,200) |
| Class B | ||||
| Shares sold | 2 | 3 | $164 | $258 |
| Shares redeemed | (95) | (107) | (7,987) | (8,283) |
| Net increase (decrease) | (93) | (104) | $(7,823) | $(8,025) |
| Class C | ||||
| Shares sold | 365 | 262 | $31,362 | $20,995 |
| Shares redeemed | (360) | (341) | (30,838) | (26,719) |
| Net increase (decrease) | 5 | (79) | $524 | $(5,724) |
| Class I | ||||
| Shares sold | 1,565 | 2,450 | $159,813 | $230,126 |
| Shares redeemed | (1,508) | (12,811)(a) | (155,242) | (1,203,573)(a) |
| Net increase (decrease) | 57 | (10,361) | $4,571 | $(973,447) |
| Class Z | ||||
| Shares sold | 259 | – | $27,086 | $– |
| Shares redeemed | (19) | –(b) | (1,970) | (6) |
| Net increase (decrease) | 240 | –(b) | $25,116 | $(6) |
(a) Amount includes in-kind redemptions.
(b) In the amount of less than five hundred dollars.
10. Other.
The Fund's organizational documents provide former and current trustees and officers with a limited indemnification against liabilities arising in connection with the performance of their duties to the Fund. In the normal course of business, the Fund may also enter into contracts that provide general indemnifications. The Fund's maximum exposure under these arrangements is unknown as this would be dependent on future claims that may be made against the Fund. The risk of material loss from such claims is considered remote.
Report of Independent Registered Public Accounting Firm
To the Trustees of Fidelity Advisor Series I and Shareholders of Fidelity Advisor® Equity Growth Fund:
We have audited the accompanying statement of assets and liabilities of Fidelity Advisor® Equity Growth Fund (the Fund), a fund of Fidelity Advisor Series I, including the schedule of investments, as of November 30, 2015, and the related statement of operations for the year then ended, the statement of changes in net assets for each of the two years in the period then ended, and the financial highlights for each of the five years in the period then ended. These financial statements and financial highlights are the responsibility of the Fund's management. Our responsibility is to express an opinion on these financial statements and financial highlights based on our audits.
We conducted our audits in accordance with the standards of the Public Company Accounting Oversight Board (United States). Those standards require that we plan and perform the audit to obtain reasonable assurance about whether the financial statements and financial highlights are free of material misstatement. The Fund is not required to have, nor were we engaged to perform, an audit of its internal control over financial reporting. Our audits included consideration of internal control over financial reporting as a basis for designing audit procedures that are appropriate in the circumstances, but not for the purpose of expressing an opinion on the effectiveness of the Fund's internal control over financial reporting. Accordingly, we express no such opinion. An audit also includes examining, on a test basis, evidence supporting the amounts and disclosures in the financial statements, assessing the accounting principles used and significant estimates made by management, as well as evaluating the overall financial statement presentation. Our procedures included confirmation of securities owned as of November 30, 2015, by correspondence with the custodians and brokers; when replies were not received from brokers, we performed other auditing procedures. We believe our audits provide a reasonable basis for our opinion.
In our opinion, such financial statements and financial highlights referred to above present fairly, in all material respects, the financial position of Fidelity Advisor® Equity Growth Fund as of November 30, 2015, the results of its operations for the year then ended, the changes in its net assets for each of the two years in the period then ended, and the financial highlights for each of the five years in the period then ended in conformity with accounting principles generally accepted in the United States of America.
DELOITTE & TOUCHE LLP
Boston, Massachusetts
January 14, 2016
Trustees and Officers
The Trustees, Members of the Advisory Board (if any), and officers of the trust and fund, as applicable, are listed below. The Board of Trustees governs the fund and is responsible for protecting the interests of shareholders. The Trustees are experienced executives who meet periodically throughout the year to oversee the fund's activities, review contractual arrangements with companies that provide services to the fund, oversee management of the risks associated with such activities and contractual arrangements, and review the fund's performance. Each of the Trustees oversees 170 funds.
The Trustees hold office without limit in time except that (a) any Trustee may resign; (b) any Trustee may be removed by written instrument, signed by at least two-thirds of the number of Trustees prior to such removal; (c) any Trustee who requests to be retired or who has become incapacitated by illness or injury may be retired by written instrument signed by a majority of the other Trustees; and (d) any Trustee may be removed at any special meeting of shareholders by a two-thirds vote of the outstanding voting securities of the trust. Each Trustee who is not an interested person (as defined in the 1940 Act) of the trust and the fund is referred to herein as an Independent Trustee. Each Independent Trustee shall retire not later than the last day of the calendar year in which his or her 75th birthday occurs. The Independent Trustees may waive this mandatory retirement age policy with respect to individual Trustees. Officers and Advisory Board Members hold office without limit in time, except that any officer or Advisory Board Member may resign or may be removed by a vote of a majority of the Trustees at any regular meeting or any special meeting of the Trustees. Except as indicated, each individual has held the office shown or other offices in the same company for the past five years.
The fund’s Statement of Additional Information (SAI) includes more information about the Trustees. To request a free copy, call Fidelity at 1-877-208-0098.
Experience, Skills, Attributes, and Qualifications of the Trustees. The Governance and Nominating Committee has adopted a statement of policy that describes the experience, qualifications, attributes, and skills that are necessary and desirable for potential Independent Trustee candidates (Statement of Policy). The Board believes that each Trustee satisfied at the time he or she was initially elected or appointed a Trustee, and continues to satisfy, the standards contemplated by the Statement of Policy. The Governance and Nominating Committee also engages professional search firms to help identify potential Independent Trustee candidates who have the experience, qualifications, attributes, and skills consistent with the Statement of Policy. From time to time, additional criteria based on the composition and skills of the current Independent Trustees, as well as experience or skills that may be appropriate in light of future changes to board composition, business conditions, and regulatory or other developments, have also been considered by the professional search firms and the Governance and Nominating Committee. In addition, the Board takes into account the Trustees' commitment and participation in Board and committee meetings, as well as their leadership of standing and ad hoc committees throughout their tenure.
In determining that a particular Trustee was and continues to be qualified to serve as a Trustee, the Board has considered a variety of criteria, none of which, in isolation, was controlling. The Board believes that, collectively, the Trustees have balanced and diverse experience, qualifications, attributes, and skills, which allow the Board to operate effectively in governing the fund and protecting the interests of shareholders. Information about the specific experience, skills, attributes, and qualifications of each Trustee, which in each case led to the Board's conclusion that the Trustee should serve (or continue to serve) as a trustee of the fund, is provided below.
Board Structure and Oversight Function. James C. Curvey is an interested person and currently serves as Chairman. The Trustees have determined that an interested Chairman is appropriate and benefits shareholders because an interested Chairman has a personal and professional stake in the quality and continuity of services provided to the fund. Independent Trustees exercise their informed business judgment to appoint an individual of their choosing to serve as Chairman, regardless of whether the Trustee happens to be independent or a member of management. The Independent Trustees have determined that they can act independently and effectively without having an Independent Trustee serve as Chairman and that a key structural component for assuring that they are in a position to do so is for the Independent Trustees to constitute a substantial majority for the Board. The Independent Trustees also regularly meet in executive session. Ned C. Lautenbach serves as Chairman of the Independent Trustees and as such (i) acts as a liaison between the Independent Trustees and management with respect to matters important to the Independent Trustees and (ii) with management prepares agendas for Board meetings.
Fidelity® funds are overseen by different Boards of Trustees. The fund's Board oversees Fidelity's high income and certain equity funds, and other Boards oversee Fidelity's investment-grade bond, money market, asset allocation, and sector funds. The asset allocation funds may invest in Fidelity® funds overseen by the fund's Board. The use of separate Boards, each with its own committee structure, allows the Trustees of each group of Fidelity® funds to focus on the unique issues of the funds they oversee, including common research, investment, and operational issues. On occasion, the separate Boards establish joint committees to address issues of overlapping consequences for the Fidelity® funds overseen by each Board.
The Trustees operate using a system of committees to facilitate the timely and efficient consideration of all matters of importance to the Trustees, the fund, and fund shareholders and to facilitate compliance with legal and regulatory requirements and oversight of the fund's activities and associated risks. The Board, acting through its committees, has charged FMR and its affiliates with (i) identifying events or circumstances the occurrence of which could have demonstrably adverse effects on the fund's business and/or reputation; (ii) implementing processes and controls to lessen the possibility that such events or circumstances occur or to mitigate the effects of such events or circumstances if they do occur; and (iii) creating and maintaining a system designed to evaluate continuously business and market conditions in order to facilitate the identification and implementation processes described in (i) and (ii) above. Because the day-to-day operations and activities of the fund are carried out by or through FMR, its affiliates, and other service providers, the fund's exposure to risks is mitigated but not eliminated by the processes overseen by the Trustees. While each of the Board's committees has responsibility for overseeing different aspects of the fund's activities, oversight is exercised primarily through the Operations, Audit, and Compliance Committees. In addition, the Independent Trustees have worked with FMR to enhance the Board's oversight of investment and financial risks, legal and regulatory risks, technology risks, and operational risks, including the development of additional risk reporting to the Board. For example, a working group comprised of Independent Trustees and FMR has worked and continues to work to review the Fidelity® funds' valuation-related activities, reporting and risk management. Appropriate personnel, including but not limited to the fund's Chief Compliance Officer (CCO), FMR's internal auditor, the independent accountants, the fund's Treasurer and portfolio management personnel, make periodic reports to the Board's committees, as appropriate, including an annual review of Fidelity's risk management program for the Fidelity® funds. The responsibilities of each standing committee, including their oversight responsibilities, are described further under "Standing Committees of the Trustees."
Interested Trustees*:
Correspondence intended for a Trustee who is an interested person may be sent to Fidelity Investments, 245 Summer Street, Boston, Massachusetts 02210.
Name, Year of Birth; Principal Occupations and Other Relevant Experience+
James C. Curvey (1935)
Year of Election or Appointment: 2007
Trustee
Chairman of the Board of Trustees
Mr. Curvey also serves as Trustee of other Fidelity® funds. Mr. Curvey is a Director of Fidelity Research & Analysis Co. (investment adviser firm, 2009-present), and Vice Chairman (2007-present) and Director of FMR LLC (diversified financial services company). In addition, Mr. Curvey serves as an Overseer for the Boston Symphony Orchestra and a member of the board of Artis-Naples, Naples, Florida, and as a Trustee for Brewster Academy, Wolfeboro, New Hampshire. Previously, Mr. Curvey served as a Director of Fidelity Investments Money Management, Inc. (investment adviser firm, 2009-2014) and a Director of FMR and FMR Co., Inc. (investment adviser firms, 2007-2014).
Charles S. Morrison (1960)
Year of Election or Appointment: 2014
Trustee
Mr. Morrison also serves as Trustee of other funds. He serves as a Director of Fidelity Investments Money Management, Inc. (FIMM) (investment adviser firm, 2014-present), Director of Fidelity SelectCo, LLC (investment adviser firm, 2014-present), President, Asset Management (2014-present), and is an employee of Fidelity Investments. Previously, Mr. Morrison served as Vice President of Fidelity's Fixed Income and Asset Allocation Funds (2012-2014), President, Fixed Income (2011-2014), Vice President of Fidelity's Money Market Funds (2005-2009), President, Money Market Group Leader of FMR (investment adviser firm, 2009), and Senior Vice President, Money Market Group of FMR (2004-2009). Mr. Morrison also served as Vice President of Fidelity's Bond Funds (2002-2005), certain Balanced Funds (2002-2005), and certain Asset Allocation Funds (2002-2007), and as Senior Vice President (2002-2005) of Fidelity's Bond Division.
* Determined to be an “Interested Trustee” by virtue of, among other things, his or her affiliation with the trust or various entities under common control with FMR.
+ The information includes the Trustee's principal occupation during the last five years and other information relating to the experience, attributes, and skills relevant to the Trustee's qualifications to serve as a Trustee, which led to the conclusion that the Trustee should serve as a Trustee for the fund.
Independent Trustees:
Correspondence intended for an Independent Trustee may be sent to Fidelity Investments, P.O. Box 55235, Boston, Massachusetts 02205-5235.
Name, Year of Birth; Principal Occupations and Other Relevant Experience+
Dennis J. Dirks (1948)
Year of Election or Appointment: 2005
Trustee
Mr. Dirks also serves as Trustee of other Fidelity® funds. Prior to his retirement in May 2003, Mr. Dirks was Chief Operating Officer and a member of the Board of The Depository Trust & Clearing Corporation (DTCC). He also served as President, Chief Operating Officer, and Board member of The Depository Trust Company (DTC) and President and Board member of the National Securities Clearing Corporation (NSCC). In addition, Mr. Dirks served as Chief Executive Officer and Board member of the Government Securities Clearing Corporation, Chief Executive Officer and Board member of the Mortgage-Backed Securities Clearing Corporation, as a Trustee and a member of the Finance Committee of Manhattan College (2005-2008), as a Trustee and a member of the Finance Committee of AHRC of Nassau County (2006-2008), and as a member of the Independent Directors Council (IDC) Governing Council (2010-2015). Mr. Dirks is a member of the Board of Directors for The Brookville Center for Children's Services, Inc. (2009-present).
Alan J. Lacy (1953)
Year of Election or Appointment: 2008
Trustee
Mr. Lacy also serves as Trustee of other Fidelity® funds. Mr. Lacy serves as a member of the Board of Directors of Dave & Buster's Entertainment, Inc. (restaurant and entertainment complexes, 2010-present) and Bristol-Myers Squibb Company (global pharmaceuticals, 2008-present). In addition, Mr. Lacy served as Senior Adviser (2007-2014) of Oak Hill Capital Partners, L.P. (private equity) and also served as Chief Executive Officer (2000-2005) and Vice Chairman (2005-2006) of Sears Holdings Corporation and Sears, Roebuck and Co. (retail). Mr. Lacy is a member of the Board of Trustees of The National Parks Conservation Association (2006-present). Previously, Mr. Lacy served as Chairman of the Board of Trustees of the National Parks Conservation Association (2008-2011) and as a member of the Board of Directors for The Western Union Company (global money transfer, 2006-2011), The Hillman Companies, Inc. (hardware wholesalers, 2010-2014), and Earth Fare, Inc. (retail grocery, 2010-2014).
Ned C. Lautenbach (1944)
Year of Election or Appointment: 2000
Trustee
Chairman of the Independent Trustees
Mr. Lautenbach also serves as Trustee of other Fidelity® funds. Mr. Lautenbach currently serves as the Lead Director of the Eaton Corporation Board of Directors (diversified industrial, 1997-present). Mr. Lautenbach is Chairman of the Board of Directors of Artis-Naples in Naples, Florida (2012-present), a member of the Council on Foreign Relations (1994-present), and a member of the Board of Governors, State University System of Florida (2013-present). Previously, Mr. Lautenbach was a Partner/Advisory Partner at Clayton, Dubilier & Rice, LLC (private equity investment, 1998-2010), as well as a Director of Sony Corporation (2006-2007).
Joseph Mauriello (1944)
Year of Election or Appointment: 2008
Trustee
Mr. Mauriello also serves as Trustee of other Fidelity® funds. Prior to his retirement in January 2006, Mr. Mauriello served in numerous senior management positions including Deputy Chairman and Chief Operating Officer (2004-2005), and Vice Chairman of Financial Services (2002-2004) of KPMG LLP US (professional services, 1965-2005). Mr. Mauriello currently serves as a member of the Board of Directors of XL Group plc. (global insurance and re-insurance, 2006-present) and the Independent Directors Council (IDC) Governing Council (2015-present). Previously, Mr. Mauriello served as a Director of the Hamilton Funds of the Bank of New York (2006-2007) and of Arcadia Resources Inc. (health care services and products, 2007-2012).
Robert W. Selander (1950)
Year of Election or Appointment: 2011
Trustee
Mr. Selander also serves as Trustee of other Fidelity® funds. Mr. Selander serves as a Director of The Western Union Company (global money transfer, 2014-present). Previously, Mr. Selander served as a Member of the Advisory Board of other Fidelity® funds (2011), and Executive Vice Chairman (2010), Chief Executive Officer (2009-2010), and President and Chief Executive Officer (1997-2009) of Mastercard, Inc.
Cornelia M. Small (1944)
Year of Election or Appointment: 2005
Trustee
Ms. Small also serves as Trustee of other Fidelity® funds. Ms. Small is a member of the Board of Directors (2009-present) and Chair of the Investment Committee (2010-present) of the Teagle Foundation. Ms. Small also serves on the Investment Committee of the Berkshire Taconic Community Foundation (2008-present). Previously, Ms. Small served as Chairperson (2002-2008) and a member of the Investment Committee and Chairperson (2008-2012) and a member of the Board of Trustees of Smith College. In addition, Ms. Small served as Chief Investment Officer, Director of Global Equity Investments, and a member of the Board of Directors of Scudder, Stevens & Clark and Scudder Kemper Investments.
William S. Stavropoulos (1939)
Year of Election or Appointment: 2002
Trustee
Vice Chairman of the Independent Trustees
Mr. Stavropoulos also serves as Trustee of other Fidelity® funds. Mr. Stavropoulos serves as President and Founder of the Michigan Baseball Foundation, the Great Lakes Loons (2007-present). Mr. Stavropoulos is Chairman Emeritus of the Board of Directors of The Dow Chemical Company, where he previously served in numerous senior management positions, including President, CEO (1995-2000; 2002-2004), Chairman of the Executive Committee (2000-2006), and as a member of the Board of Directors (1990-2006). Currently, Mr. Stavropoulos is Chairman of the Board of Directors of Univar Inc. (global distributor of commodity and specialty chemicals), a Director of Teradata Corporation (data warehousing and technology solutions), and Maersk Inc. (industrial conglomerate), and a member of the Advisory Board for Metalmark Capital LLC (private equity investment, 2005-present). Mr. Stavropoulos is an operating advisor to Clayton, Dubilier & Rice, LLC (private equity investment). In addition, Mr. Stavropoulos is a member of the University of Notre Dame Advisory Council for the College of Science, a Trustee of the Rollin L. Gerstacker Foundation, and a Director of the Naples Philharmonic Center for the Arts. Previously, Mr. Stavropoulos served as a Director of Chemical Financial Corporation (bank holding company, 1993-2012) and Tyco International, Ltd. (multinational manufacturing and services, 2007-2012).
David M. Thomas (1949)
Year of Election or Appointment: 2008
Trustee
Mr. Thomas also serves as Trustee of other Fidelity® funds. Mr. Thomas serves as Non-Executive Chairman of the Board of Directors of Fortune Brands Home and Security (home and security products, 2011-present), as a member of the Board of Directors (2004-present) and Presiding Director (2013-present) of Interpublic Group of Companies, Inc. (marketing communication), and as a member of the Board of Trustees of the University of Florida (2013-present). Previously, Mr. Thomas served as Executive Chairman (2005-2006) and Chairman and Chief Executive Officer (2000-2005) of IMS Health, Inc. (pharmaceutical and healthcare information solutions), and a Director of Fortune Brands, Inc. (consumer products, 2000-2011).
+ The information includes the Trustee's principal occupation during the last five years and other information relating to the experience, attributes, and skills relevant to the Trustee's qualifications to serve as a Trustee, which led to the conclusion that the Trustee should serve as a Trustee for the fund.
Advisory Board Members and Officers:
Correspondence intended for an officer or Peter S. Lynch may be sent to Fidelity Investments, 245 Summer Street, Boston, Massachusetts 02210. Officers appear below in alphabetical order.
Name, Year of Birth; Principal Occupation
Peter S. Lynch (1944)
Year of Election or Appointment: 2003
Member of the Advisory Board
Mr. Lynch also serves as Member of the Advisory Board of other Fidelity® funds. Mr. Lynch is Vice Chairman and a Director of FMR (investment adviser firm) and FMR Co., Inc. (investment adviser firm). In addition, Mr. Lynch serves as a Trustee of Boston College and as the Chairman of the Inner-City Scholarship Fund. Previously, Mr. Lynch served on the Special Olympics International Board of Directors (1997-2006).
Elizabeth Paige Baumann (1968)
Year of Election or Appointment: 2012
Anti-Money Laundering (AML) Officer
Ms. Baumann also serves as AML Officer of other funds. She is Chief AML Officer of FMR LLC (diversified financial services company, 2012-present) and is an employee of Fidelity Investments. Previously, Ms. Baumann served as Vice President and Deputy Anti-Money Laundering Officer (2007-2012).
Marc R. Bryant (1966)
Year of Election or Appointment: 2015
Secretary and Chief Legal Officer (CLO)
Mr. Bryant also serves as Secretary and CLO of other funds. Mr. Bryant serves as CLO, Secretary, and Senior Vice President of Fidelity Management & Research Company (investment adviser firm, 2015-present) and FMR Co., Inc. (investment adviser firm, 2015-present); Secretary of Fidelity SelectCo, LLC (investment adviser firm, 2015-present) and Fidelity Investments Money Management, Inc. (investment adviser firm, 2015-present); and CLO of Fidelity Management & Research (Hong Kong) Limited (investment adviser firm, 2015-present). He is Senior Vice President and Deputy General Counsel of FMR LLC (diversified financial services company). Previously, Mr. Bryant served as Secretary and CLO of Fidelity Rutland Square Trust II (2010-2014) and Assistant Secretary of Fidelity's Fixed Income and Asset Allocation Funds (2013-2015). Prior to joining Fidelity Investments, Mr. Bryant served as a Senior Vice President and the Head of Global Retail Legal for AllianceBernstein L.P. (2006-2010), and as the General Counsel for ProFund Advisors LLC (2001-2006).
William C. Coffey (1969)
Year of Election or Appointment: 2009
Assistant Secretary
Mr. Coffey also serves as Assistant Secretary of other funds. He is Senior Vice President and Deputy General Counsel of FMR LLC (diversified financial services company, 2010-present), and is an employee of Fidelity Investments. Previously, Mr. Coffey served as Vice President and Associate General Counsel of FMR LLC (2005-2009).
Jonathan Davis (1968)
Year of Election or Appointment: 2010
Assistant Treasurer
Mr. Davis also serves as Assistant Treasurer of other funds, and is an employee of Fidelity Investments. Previously, Mr. Davis served as Vice President and Associate General Counsel of FMR LLC (diversified financial services company, 2003-2010).
Adrien E. Deberghes (1967)
Year of Election or Appointment: 2008
Deputy Treasurer
Mr. Deberghes also serves as an officer of other funds. He is an employee of Fidelity Investments (2008-present). Prior to joining Fidelity Investments, Mr. Deberghes was Senior Vice President of Mutual Fund Administration at State Street Corporation (2007-2008), Senior Director of Mutual Fund Administration at Investors Bank & Trust (2005-2007), and Director of Finance for Dunkin' Brands (2000-2005).
Stephanie J. Dorsey (1969)
Year of Election or Appointment: 2010
Assistant Treasurer
Ms. Dorsey also serves as an officer of other funds. She is an employee of Fidelity Investments (2008-present) and has served in other fund officer roles. Prior to joining Fidelity Investments, Ms. Dorsey served as Treasurer (2004-2008) of the JPMorgan Mutual Funds and Vice President (2004-2008) of JPMorgan Chase Bank.
Howard J. Galligan III (1966)
Year of Election or Appointment: 2014
Chief Financial Officer
Mr. Galligan also serves as Chief Financial Officer of other funds. Mr. Galligan serves as President of Fidelity Pricing and Cash Management Services (FPCMS) (2014-present) and as a Director of Strategic Advisers, Inc. (investment adviser firm, 2008-present). Previously, Mr. Galligan served as Chief Administrative Officer of Asset Management (2011-2014) and Chief Operating Officer and Senior Vice President of Investment Support for Strategic Advisers, Inc. (2003-2011).
Scott C. Goebel (1968)
Year of Election or Appointment: 2015
Vice President
Mr. Goebel serves as Vice President of other funds and is an employee of Fidelity Investments (2001-present). Previously, Mr. Goebel served as Secretary of Fidelity SelectCo, LLC (investment adviser firm, 2013-2015), Fidelity Investments Money Management, Inc. (FIMM) (investment adviser firm, 2010-2015), and Fidelity Research and Analysis Company (FRAC) (investment adviser firm, 2010-2015); General Counsel, Secretary, and Senior Vice President of Fidelity Management & Research Company (investment adviser firm, 2008-2015) and FMR Co., Inc. (investment adviser firm, 2008-2015); Assistant Secretary of Fidelity Management & Research (Japan) Limited (investment adviser firm, 2008-2015) and FMR Investment Management (U.K.) Limited (investment adviser firm, 2008-2015); Chief Legal Officer (CLO) of Fidelity Management & Research (Hong Kong) Limited (investment adviser firm, 2008-2015); Secretary and CLO of certain Fidelity® funds (2008-2015); Assistant Secretary of FIMM (2008-2010), FRAC (2008-2010), and certain funds (2007-2008); and as Vice President and Secretary of Fidelity Distributors Corporation (FDC) (2005-2007).
Brian B. Hogan (1964)
Year of Election or Appointment: 2009
Vice President
Mr. Hogan also serves as Trustee or Vice President of other funds. Mr. Hogan serves as a Director of Fidelity SelectCo, LLC (investment adviser firm, 2014-present) and President of the Equity Division of FMR (investment adviser firm, 2009-present). Previously, Mr. Hogan served as Senior Vice President, Equity Research of FMR (2006-2009) and as a portfolio manager.
Chris Maher (1972)
Year of Election or Appointment: 2013
Assistant Treasurer
Mr. Maher serves as Assistant Treasurer of other funds. Mr. Maher is Vice President of Valuation Oversight and is an employee of Fidelity Investments. Previously, Mr. Maher served as Vice President of Asset Management Compliance (2013), Vice President of the Program Management Group of FMR (investment adviser firm, 2010-2013), and Vice President of Valuation Oversight (2008-2010).
Melissa M. Reilly (1971)
Year of Election or Appointment: 2014
Vice President of certain Equity Funds
Ms. Reilly also serves as Vice President of other funds. Ms. Reilly is an employee of Fidelity Investments (2004-present).
Kenneth B. Robins (1969)
Year of Election or Appointment: 2008
President and Treasurer
Mr. Robins also serves as an officer of other funds. Mr. Robins serves as Executive Vice President of Fidelity Investments Money Management, Inc. (FIMM) (investment adviser firm, 2013-present) and is an employee of Fidelity Investments (2004-present). Previously, Mr. Robins served in other fund officer roles.
Stacie M. Smith (1974)
Year of Election or Appointment: 2013
Deputy Treasurer
Ms. Smith also serves as an officer of other funds. She is an employee of Fidelity Investments (2009-present) and has served in other fund officer roles. Prior to joining Fidelity Investments, Ms. Smith served as Senior Audit Manager of Ernst & Young LLP (1996-2009).
Renee Stagnone (1975)
Year of Election or Appointment: 2013
Deputy Treasurer
Ms. Stagnone also serves as Deputy Treasurer of other funds. Ms. Stagnone is an employee of Fidelity Investments (1997-present).
Linda J. Wondrack (1964)
Year of Election or Appointment: 2014
Chief Compliance Officer
Ms. Wondrack also serves as Chief Compliance Officer of other funds. Ms. Wondrack is Executive Vice President and head of the Ethics Office and Asset Management Compliance for Fidelity Investments (2012-present). Ms. Wondrack also serves as Chief Compliance Officer of Fidelity SelectCo, LLC (investment adviser firm, 2014-present); Chief Compliance Officer of Impresa Management LLC (2013-present); and Chief Compliance Officer of FMR Co., Inc. (investment adviser firm), Fidelity Investments Money Management, Inc. (investment adviser firm), Fidelity Management & Research (Japan) Limited (investment adviser firm), FMR Investment Management (U.K.) Limited (investment adviser firm), Fidelity Management & Research (Hong Kong) (investment adviser firm), Fidelity Management & Research Company (investment adviser firm), FIAM LLC (investment adviser firm), and Strategic Advisers, Inc. (investment adviser firm), Ballyrock Investment Advisors LLC, and Northern Neck Investors LLC (2012-present). Previously, Ms. Wondrack served as Senior Vice President and Chief Compliance Officer for Columbia Management Investment Advisers, LLC (2005-2012); Chief Compliance Officer for certain funds within the Columbia Family of Funds (2007-2012); and Senior Vice President of Compliance Risk Management at Bank of America (2005-2010).
Joseph F. Zambello (1957)
Year of Election or Appointment: 2011
Deputy Treasurer
Mr. Zambello also serves as Deputy Treasurer of other funds. Mr. Zambello is an employee of Fidelity Investments (1991-present). Previously, Mr. Zambello served as Vice President of the Program Management Group of FMR (investment adviser firm, 2009-2011) and Vice President of the Transfer Agent Oversight Group (2005-2009).
Shareholder Expense Example
As a shareholder of the Fund, you incur two types of costs: (1) transaction costs, including sales charges (loads) on purchase payments or redemption proceeds, and (2) ongoing costs, including management fees, distribution and/or service (12b-1) fees and other Fund expenses. This Example is intended to help you understand your ongoing costs (in dollars) of investing in the Fund and to compare these costs with the ongoing costs of investing in other mutual funds.
The Example is based on an investment of $1,000 invested at the beginning of the period and held for the entire period (June 1, 2015 to November 30, 2015).
Actual Expenses
The first line of the accompanying table for each class of the Fund provides information about actual account values and actual expenses. You may use the information in this line, together with the amount you invested, to estimate the expenses that you paid over the period. Simply divide your account value by $1,000.00 (for example, an $8,600 account value divided by $1,000.00 = 8.6), then multiply the result by the number in the first line for a class of the Fund under the heading entitled "Expenses Paid During Period" to estimate the expenses you paid on your account during this period. In addition, the Fund, as a shareholder in the underlying Fidelity Central Funds, will indirectly bear its pro-rata share of the fees and expenses incurred by the underlying Fidelity Central Funds. These fees and expenses are not included in the Fund's annualized expense ratio used to calculate the expense estimate in the table below.
Hypothetical Example for Comparison Purposes
The second line of the accompanying table for each class of the Fund provides information about hypothetical account values and hypothetical expenses based on a Class' actual expense ratio and an assumed rate of return of 5% per year before expenses, which is not the Class' actual return. The hypothetical account values and expenses may not be used to estimate the actual ending account balance or expenses you paid for the period. You may use this information to compare the ongoing costs of investing in the Fund and other funds. To do so, compare this 5% hypothetical example with the 5% hypothetical examples that appear in the shareholder reports of the other funds. In addition, the Fund, as a shareholder in the underlying Fidelity Central Funds, will indirectly bear its pro-rata share of the fees and expenses incurred by the underlying Fidelity Central Funds. These fees and expenses are not included in the Fund's annualized expense ratio used to calculate the expense estimate in the table below.
Please note that the expenses shown in the table are meant to highlight your ongoing costs only and do not reflect any transaction costs. Therefore, the second line of the table is useful in comparing ongoing costs only, and will not help you determine the relative total costs of owning different funds. In addition, if these transactional costs were included, your costs would have been higher.
| Annualized Expense Ratio-A | Beginning Account Value June 1, 2015 | Ending Account Value November 30, 2015 | Expenses Paid During Period-B June 1, 2015 to November 30, 2015 | |
| Class A | 1.04% | |||
| Actual | $1,000.00 | $1,012.80 | $5.25 | |
| Hypothetical-C | $1,000.00 | $1,019.85 | $5.27 | |
| Class T | 1.27% | |||
| Actual | $1,000.00 | $1,011.60 | $6.40 | |
| Hypothetical-C | $1,000.00 | $1,018.70 | $6.43 | |
| Class B | 1.88% | |||
| Actual | $1,000.00 | $1,008.50 | $9.47 | |
| Hypothetical-C | $1,000.00 | $1,015.64 | $9.50 | |
| Class C | 1.80% | |||
| Actual | $1,000.00 | $1,008.90 | $9.06 | |
| Hypothetical-C | $1,000.00 | $1,016.04 | $9.10 | |
| Class I | .77% | |||
| Actual | $1,000.00 | $1,014.20 | $3.89 | |
| Hypothetical-C | $1,000.00 | $1,021.21 | $3.90 | |
| Class Z | .64% | |||
| Actual | $1,000.00 | $1,014.90 | $3.23 | |
| Hypothetical-C | $1,000.00 | $1,021.86 | $3.24 |
A Annualized expense ratio reflects expenses net of applicable fee waivers.
B Expenses are equal to each Class' annualized expense ratio, multiplied by the average account value over the period, multiplied by 183/365 (to reflect the one-half year period).
C 5% return per year before expenses
Distributions (Unaudited)
The Board of Trustees of Fidelity Advisor Equity Growth Fund voted to pay to shareholders of record at the opening of business on record date, the following distributions per share derived from capital gains realized from sales of portfolio securities:
| Pay Date | Record Date | Capital Gains | ||
| Class A | 12/07/15 | 12/04/15 | $2.288 | |
| 01/11/16 | 01/08/16 | $0.092 | ||
| Class T | 12/07/15 | 12/04/15 | $2.288 | |
| 01/11/16 | 01/08/16 | $0.092 | ||
| Class B | 12/07/15 | 12/04/15 | $2.288 | |
| 01/11/16 | 01/08/16 | $0.092 | ||
| Class C | 12/07/15 | 12/04/15 | $2.288 | |
| 01/11/16 | 01/08/16 | $0.092 |
The fund hereby designates as a capital gain dividend with respect to the taxable year ended November 30, 2015, $69,219,051, or, if subsequently determined to be different, the net capital gain of such year.
The fund will notify shareholders in January 2016 of amounts for use in preparing 2015 income tax returns.
Board Approval of Investment Advisory Contracts and Management Fees
Fidelity Advisor Equity Growth Fund
Each year, the Board of Trustees, including the Independent Trustees (together, the Board), votes on the renewal of the management contract with Fidelity Management & Research Company (FMR) and the sub-advisory agreements (together, the Advisory Contracts) for the fund. The Board, assisted by the advice of fund counsel and Independent Trustees' counsel, requests and considers a broad range of information relevant to the renewal of the Advisory Contracts throughout the year.
The Board meets regularly and, at each of its meetings, covers an extensive agenda of topics and materials and considers factors that are relevant to its annual consideration of the renewal of the fund's Advisory Contracts, including the services and support provided to the fund and its shareholders. The Board has established various standing committees (Committees), each composed of and chaired by Independent Trustees with varying backgrounds, to which the Board has assigned specific subject matter responsibilities in order to enhance effective decision-making by the Board. The Board, acting directly and through its Committees, requests and receives information concerning the annual consideration of the renewal of the fund's Advisory Contracts. The Board also meets as needed to consider matters specifically related to the Board's annual consideration of the renewal of the Advisory Contracts. Members of the Board may also meet with trustees of other Fidelity funds through ad hoc joint committees to discuss certain matters relevant to all of the Fidelity funds.
At its July 2015 meeting, the Board unanimously determined to renew the fund's Advisory Contracts. In reaching its determination, the Board considered all factors it believed relevant, including (i) the nature, extent, and quality of the services to be provided to the fund and its shareholders (including the investment performance of the fund); (ii) the competitiveness of the fund's management fee and total expense ratio relative to peer funds; (iii) the total costs of the services to be provided by and the profits to be realized by Fidelity from its relationship with the fund; and (iv) the extent to which (if any) economies of scale exist and would be realized as the fund grows, and whether any economies of scale are appropriately shared with fund shareholders.
In considering whether to renew the Advisory Contracts for the fund, the Board reached a determination, with the assistance of fund counsel and Independent Trustees' counsel and through the exercise of its business judgment, that the renewal of the Advisory Contracts was in the best interests of the fund and its shareholders and that the compensation payable under the Advisory Contracts was fair and reasonable. The Board's decision to renew the Advisory Contracts was not based on any single factor, but rather was based on a comprehensive consideration of all the information provided to the Board at its meetings throughout the year. The Board, in reaching its determination to renew the Advisory Contracts, was aware that shareholders of the fund have a broad range of investment choices available to them, including a wide choice among funds offered by Fidelity's competitors, and that the fund's shareholders, who have the opportunity to review and weigh the disclosure provided by the fund in its prospectus and other public disclosures, have chosen to invest in this fund, which is part of the Fidelity family of funds.
Nature, Extent, and Quality of Services Provided. The Board considered Fidelity's staffing as it relates to the fund, including the backgrounds of investment personnel of Fidelity, and also considered the fund's investment objective, strategies, and related investment philosophy. The Independent Trustees also had discussions with senior management of Fidelity's investment operations and investment groups. The Board considered the structure of the portfolio manager compensation program and whether this structure provides appropriate incentives to act in the best interests of the fund. Additionally, the Board considered the portfolio managers' investments, if any, in the funds that they manage.Resources Dedicated to Investment Management and Support Services. The Board and the Fund Oversight and Research Committees reviewed the general qualifications and capabilities of Fidelity's investment staff, including its size, education, experience, and resources, as well as Fidelity's approach to recruiting, training, managing, and compensating investment personnel. The Board noted that Fidelity has continued to increase the resources devoted to non-U.S. offices, including expansion of Fidelity's global investment organization. The Board also noted that Fidelity's analysts have extensive resources, tools and capabilities that allow them to conduct sophisticated quantitative and fundamental analysis, as well as credit analysis of issuers, counterparties and guarantors. Further, the Board considered that Fidelity's investment professionals have sufficient access to global information and data so as to provide competitive investment results over time, and that those professionals also have access to sophisticated tools that permit them to assess portfolio construction and risk and performance attribution characteristics continuously, as well as to transmit new information and research conclusions rapidly around the world. Additionally, in its deliberations, the Board considered Fidelity's trading, risk management, and compliance capabilities and resources, which are integral parts of the investment management process.Shareholder and Administrative Services. The Board considered (i) the nature, extent, quality, and cost of advisory, administrative, and shareholder services performed by FMR, the sub-advisers (together with FMR, the Investment Advisers), and their affiliates under the Advisory Contracts and under separate agreements covering transfer agency, pricing and bookkeeping, and securities lending services for the fund; (ii) the nature and extent of the supervision of third party service providers, principally custodians and subcustodians; and (iii) the resources devoted to, and the record of compliance with, the fund's compliance policies and procedures. The Board also reviewed the allocation of fund brokerage, including allocations to brokers affiliated with the Investment Advisers, the use of brokerage commissions to pay fund expenses, and the use of "soft" commission dollars to pay for research services.The Board noted that the growth of fund assets over time across the complex allows Fidelity to reinvest in the development of services designed to enhance the value or convenience of the Fidelity funds as investment vehicles. These services include 24-hour access to account information and market information through telephone representatives and over the Internet, investor education materials and asset allocation tools, and the expanded availability of Fidelity Investor Centers.In 2014, the Board formed an ad hoc Committee on Transfer Agency Fees to review the variety of transfer agency fee structures throughout the industry and Fidelity's competitive positioning with respect to industry participants.Investment in a Large Fund Family. The Board considered the benefits to shareholders of investing in a Fidelity fund, including the benefits of investing in a fund that is part of a large family of funds offering a variety of investment disciplines and providing a large variety of mutual fund investor services. The Board noted that Fidelity had taken, or had made recommendations that resulted in the Fidelity funds taking, a number of actions over the previous year that benefited particular funds, including (i) continuing to dedicate additional resources to investment research and to the support of the senior management team that oversees asset management; (ii) continuing efforts to enhance Fidelity's global research capabilities; (iii) launching new funds and making other enhancements to meet client needs; (iv) reducing management fees and total expenses for certain index funds and diversified international funds; (v) continuing to launch dedicated lower cost underlying funds to meet portfolio construction needs related to expanding underlying fund options for Fidelity funds of funds, specifically for the Freedom Fund product lines; (vi) rationalizing product lines and gaining increased efficiencies through fund mergers; (vii) launching active fixed-income exchange-traded funds; (viii) continuing to develop, acquire and implement systems and technology to improve services to the funds and information security and to increase efficiency; (ix) implementing investment enhancements to further strengthen Fidelity's target date product line to increase investors' probability of success in achieving their goals; (x) modifying the eligibility criteria for certain share classes to accommodate roll-over assets from employer-sponsored retirement plans; (xi) launching a new Class W of the Freedom Index Funds to attract and retain Fidelity record-kept retirement plan assets; and (xii) implementing changes to Fidelity's money market product line in response to recent money market regulatory reforms.Investment Performance. The Board considered whether the fund has operated in accordance with its investment objective, as well as its record of compliance with its investment restrictions and its performance history.The Board took into account discussions with representatives of the Investment Advisers about fund investment performance that occur at Board meetings throughout the year. In this regard the Board noted that as part of regularly scheduled fund reviews and other reports to the Board on fund performance, the Board considers annualized return information for the fund, for different time periods, measured against a securities market index ("benchmark index") and a peer group of funds with similar objectives ("peer group"), if any. In its evaluation of fund investment performance, the Board gave particular attention to information indicating changes in performance of certain Fidelity funds for specific time periods and discussed with the Investment Advisers the reasons for any overperformance or underperformance.In addition to reviewing absolute and relative fund performance, the Independent Trustees periodically consider the appropriateness of fund performance metrics in evaluating the results achieved. In general, the Independent Trustees believe that fund performance should be evaluated based on net performance (after fees and expenses) of both the highest performing and lowest performing fund share classes, where applicable, compared to appropriate benchmark indices, over appropriate time periods that may include full market cycles, and compared to peer groups, as applicable, over the same periods, taking into account relevant factors including the following: general market conditions; issuer-specific information; and fund cash flows and other factors.The Independent Trustees recognize that shareholders evaluate performance on a net basis over their own holding periods, for which one-, three-, and five-year periods are often used as a proxy. For this reason, the performance information reviewed by the Board also included net cumulative calendar year total return information for the fund and an appropriate benchmark index and peer group for the most recent one-, three-, and five-year periods, as shown below. Returns are shown compared to the 25th percentile (top of box, 75% beaten) and 75th percentile (bottom of box, 25% beaten) of the peer universe.Fidelity Advisor Equity Growth Fund
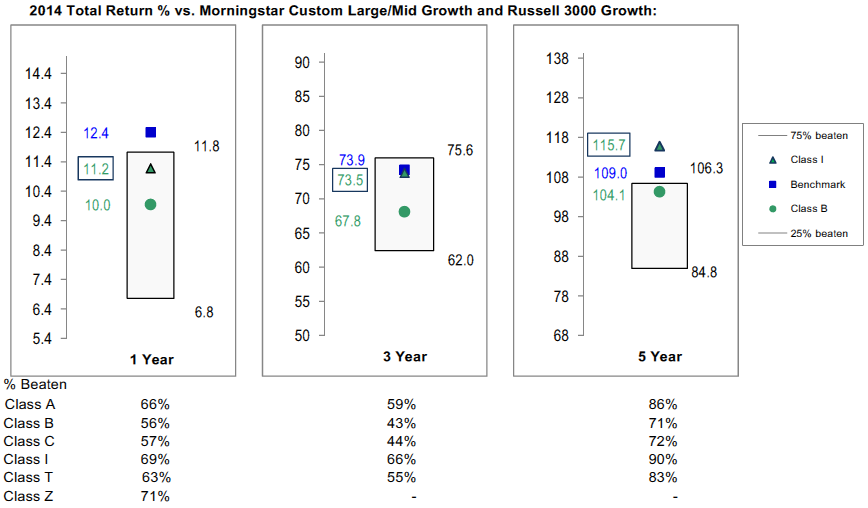
Fidelity Advisor Equity Growth Fund
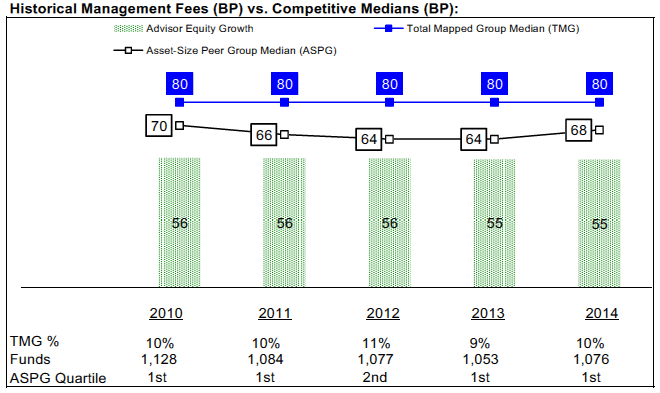
![]()
EPG-ANN-0116
1.539469.118
Fidelity Advisor® Growth & Income Fund Class I (formerly Institutional Class) Annual Report November 30, 2015 |
|
Contents
Board Approval of Investment Advisory Contracts and Management Fees |
To view a fund's proxy voting guidelines and proxy voting record for the 12-month period ended June 30, visit http://www.fidelity.com/proxyvotingresults or visit the Securities and Exchange Commission's (SEC) web site at http://www.sec.gov.
You may also call 1-877-208-0098 to request a free copy of the proxy voting guidelines.
Standard & Poor's, S&P and S&P 500 are registered service marks of The McGraw-Hill Companies, Inc. and have been licensed for use by Fidelity Distributors Corporation.
Other third-party marks appearing herein are the property of their respective owners.
All other marks appearing herein are registered or unregistered trademarks or service marks of FMR LLC or an affiliated company. © 2016 FMR LLC. All rights reserved.
This report and the financial statements contained herein are submitted for the general information of the shareholders of the Fund. This report is not authorized for distribution to prospective investors in the Fund unless preceded or accompanied by an effective prospectus.
A fund files its complete schedule of portfolio holdings with the SEC for the first and third quarters of each fiscal year on Form N-Q. Forms N-Q are available on the SEC’s web site at http://www.sec.gov. A fund's Forms N-Q may be reviewed and copied at the SEC’s Public Reference Room in Washington, DC. Information regarding the operation of the SEC's Public Reference Room may be obtained by calling 1-800-SEC-0330.
For a complete list of a fund's portfolio holdings, view the most recent holdings listing, semiannual report, or annual report on Fidelity's web site at http://www.fidelity.com, http://www.advisor.fidelity.com, or http://www.401k.com, as applicable.
NOT FDIC INSURED •MAY LOSE VALUE •NO BANK GUARANTEE
Neither the Fund nor Fidelity Distributors Corporation is a bank.
Performance: The Bottom Line
Average annual total return reflects the change in the value of an investment, assuming reinvestment of distributions from dividend income and capital gains (the profits earned upon the sale of securities that have grown in value, if any) and assuming a constant rate of performance each year.
The hypothetical investment and the average annual total returns do not reflect the deduction of taxes that a shareholder would pay on fund distributions or the redemption of fund shares.
During periods of reimbursement by Fidelity, a fund’s total return will be greater than it would be had the reimbursement not occurred.
How a fund did yesterday is no guarantee of how it will do tomorrow.
Average Annual Total Returns
| For the periods ended November 30, 2015 | Past 1 year | Past 5 years | Past 10 years |
| Class I | (0.70)% | 13.73% | 6.71% |
$10,000 Over 10 Years
Let's say hypothetically that $10,000 was invested in Fidelity Advisor® Growth & Income Fund - Class I on November 30, 2005.
The chart shows how the value of your investment would have changed, and also shows how the S&P 500® Index performed over the same period.

| Period Ending Values | ||
| $19,142 | Fidelity Advisor® Growth & Income Fund - Class I | |
| $20,574 | S&P 500® Index | |
Management's Discussion of Fund Performance
Market Recap: U.S. stocks gained modestly for the 12 months ending November 30, 2015, despite a steep decline in August and September on concern about slowing economic growth in China. The S&P 500® index rebounded in October and gained 2.75% for the year. Stocks benefited late in the period amid waning expectations for a near-term interest-rate hike by the U.S. Federal Reserve, more economic stimulus in Europe and an interest-rate cut in China. Growth stocks in the benchmark far outpaced their value counterparts, as investors continued to seek growth in a subpar economic environment. Sector performance varied widely, with more than 26 percentage points separating the leader from the laggard. Consumer discretionary (+14%) secured the top spot, benefiting from a combination of rising personal income and still-benign inflation. Information technology (+7%) and health care (+4%) also outpaced the broad market. Conversely, the energy sector (-12%) performed worst, stymied by depressed commodity prices that also hit materials (-5%). Telecommunication services (-5%) and utilities (-4%), considered defensive sectors less sensitive to the economy, also lost ground. At period end, investors remained focused on the potential global implications of a stronger U.S. dollar and how China's transition toward a consumption-led economy may affect corporate earnings.Comments from Portfolio Manager Matthew Fruhan: For the year, the fund's share classes (excluding sales charges, if applicable) declined modestly, meaningfully lagging the benchmark S&P 500®. Some unusual market challenges held back the fund. Most notably, investors seemingly favored stocks that offered secure near-term earnings, regardless of valuation. Versus the benchmark, stock picks in consumer discretionary disappointed, especially not owning online retailer and benchmark component Amazon.com. I declined to own Amazon because its stock traded at an extreme valuation and did not fit my investment approach. Security selection in energy also hampered results. Our foreign investments hurt as well, given a stronger dollar. In contrast, the fund benefited from picks among diversified financials stocks. Other individual detractors besides Amazon included social-networking company Facebook – an index member the fund did not hold – and QUALCOMM, a maker of communications equipment. On the positive side, the fund's top relative contributor was financial services giant JPMorgan Chase, which produced solid financial results, benefiting from its dominant competitive position. A stake in industrial conglomerate General Electric also added value, due to the company’s decision to exit most of its financial services businesses.The views expressed above reflect those of the portfolio manager(s) only through the end of the period as stated on the cover of this report and do not necessarily represent the views of Fidelity or any other person in the Fidelity organization. Any such views are subject to change at any time based upon market or other conditions and Fidelity disclaims any responsibility to update such views. These views may not be relied on as investment advice and, because investment decisions for a Fidelity fund are based on numerous factors, may not be relied on as an indication of trading intent on behalf of any Fidelity fund.
Investment Summary (Unaudited)
Top Ten Stocks as of November 30, 2015
| % of fund's net assets | % of fund's net assets 6 months ago | |
| JPMorgan Chase & Co. | 4.2 | 4.4 |
| General Electric Co. | 3.6 | 3.4 |
| Apple, Inc. | 3.4 | 3.7 |
| Microsoft Corp. | 3.2 | 3.0 |
| Bank of America Corp. | 2.9 | 2.5 |
| Citigroup, Inc. | 2.6 | 2.6 |
| Chevron Corp. | 2.2 | 2.0 |
| Procter & Gamble Co. | 2.1 | 1.8 |
| Johnson & Johnson | 2.0 | 1.7 |
| Target Corp. | 1.9 | 2.2 |
| 28.1 |
Top Five Market Sectors as of November 30, 2015
| % of fund's net assets | % of fund's net assets 6 months ago | |
| Financials | 22.3 | 22.3 |
| Information Technology | 21.3 | 21.4 |
| Industrials | 12.8 | 12.8 |
| Health Care | 11.7 | 10.5 |
| Energy | 9.7 | 8.9 |
Asset Allocation (% of fund's net assets)
| As of November 30, 2015* | ||
| Stocks | 98.1% | |
| Convertible Securities | 1.1% | |
| Short-Term Investments and Net Other Assets (Liabilities) | 0.8% | |

* Foreign investments - 11.7%
| As of May 31, 2015* | ||
| Stocks | 98.5% | |
| Convertible Securities | 1.1% | |
| Short-Term Investments and Net Other Assets (Liabilities) | 0.4% | |

* Foreign investments - 11.9%
Investments November 30, 2015
Showing Percentage of Net Assets
| Common Stocks - 98.1% | |||
| Shares | Value (000s) | ||
| CONSUMER DISCRETIONARY - 9.1% | |||
| Automobiles - 0.1% | |||
| Harley-Davidson, Inc. | 9,300 | $455 | |
| Diversified Consumer Services - 0.3% | |||
| H&R Block, Inc. | 25,397 | 932 | |
| ServiceMaster Global Holdings, Inc. (a) | 19,500 | 731 | |
| 1,663 | |||
| Hotels, Restaurants & Leisure - 0.9% | |||
| Dunkin' Brands Group, Inc. | 9,600 | 407 | |
| Las Vegas Sands Corp. | 30,100 | 1,326 | |
| Yum! Brands, Inc. | 40,961 | 2,970 | |
| 4,703 | |||
| Household Durables - 0.2% | |||
| Tupperware Brands Corp. | 21,500 | 1,221 | |
| Leisure Products - 0.2% | |||
| Mattel, Inc. (b) | 39,100 | 972 | |
| Media - 4.4% | |||
| Comcast Corp. Class A (special) (non-vtg.) | 157,229 | 9,597 | |
| Scripps Networks Interactive, Inc. Class A | 49,872 | 2,833 | |
| Sinclair Broadcast Group, Inc. Class A | 60,127 | 2,110 | |
| Time Warner, Inc. | 90,418 | 6,327 | |
| Viacom, Inc. Class B (non-vtg.) | 67,800 | 3,376 | |
| 24,243 | |||
| Multiline Retail - 1.9% | |||
| Dillard's, Inc. Class A | 2,000 | 150 | |
| Target Corp. | 137,999 | 10,005 | |
| 10,155 | |||
| Specialty Retail - 1.1% | |||
| Lowe's Companies, Inc. | 76,057 | 5,826 | |
| TOTAL CONSUMER DISCRETIONARY | 49,238 | ||
| CONSUMER STAPLES - 7.8% | |||
| Beverages - 2.7% | |||
| Diageo PLC | 101,447 | 2,910 | |
| PepsiCo, Inc. | 30,043 | 3,009 | |
| The Coca-Cola Co. | 212,084 | 9,039 | |
| 14,958 | |||
| Food & Staples Retailing - 1.0% | |||
| CVS Health Corp. | 33,651 | 3,166 | |
| Wal-Mart Stores, Inc. | 6,200 | 365 | |
| Walgreens Boots Alliance, Inc. | 22,182 | 1,864 | |
| 5,395 | |||
| Food Products - 0.1% | |||
| Mead Johnson Nutrition Co. Class A | 9,100 | 733 | |
| Household Products - 2.1% | |||
| Procter & Gamble Co. | 149,435 | 11,184 | |
| Personal Products - 0.1% | |||
| Estee Lauder Companies, Inc. Class A | 3,600 | 303 | |
| Tobacco - 1.8% | |||
| British American Tobacco PLC sponsored ADR | 30,776 | 3,562 | |
| Imperial Tobacco Group PLC | 16,815 | 909 | |
| Philip Morris International, Inc. | 63,338 | 5,535 | |
| 10,006 | |||
| TOTAL CONSUMER STAPLES | 42,579 | ||
| ENERGY - 9.6% | |||
| Energy Equipment & Services - 1.5% | |||
| Baker Hughes, Inc. | 7,500 | 406 | |
| Ensco PLC Class A | 105,241 | 1,802 | |
| Helmerich & Payne, Inc. | 9,300 | 542 | |
| National Oilwell Varco, Inc. | 29,400 | 1,098 | |
| Oceaneering International, Inc. | 50,900 | 2,226 | |
| Schlumberger Ltd. | 26,334 | 2,032 | |
| 8,106 | |||
| Oil, Gas & Consumable Fuels - 8.1% | |||
| Apache Corp. | 89,441 | 4,399 | |
| Cenovus Energy, Inc. | 53,300 | 789 | |
| Chevron Corp. | 128,863 | 11,768 | |
| ConocoPhillips Co. | 58,800 | 3,178 | |
| EQT Midstream Partners LP | 13,600 | 920 | |
| Foresight Energy LP | 19,500 | 84 | |
| Golar LNG Ltd. | 43,000 | 1,176 | |
| Imperial Oil Ltd. | 118,100 | 3,836 | |
| Kinder Morgan, Inc. | 92,800 | 2,187 | |
| Legacy Reserves LP | 89,800 | 280 | |
| Markwest Energy Partners LP | 41,505 | 1,992 | |
| PrairieSky Royalty Ltd. (b) | 42,100 | 809 | |
| PrairieSky Royalty Ltd. rights(a)(c) | 20,340 | 384 | |
| Suncor Energy, Inc. | 283,390 | 7,830 | |
| The Williams Companies, Inc. | 69,231 | 2,531 | |
| Williams Partners LP | 69,920 | 1,917 | |
| 44,080 | |||
| TOTAL ENERGY | 52,186 | ||
| FINANCIALS - 22.3% | |||
| Banks - 15.2% | |||
| Bank of America Corp. | 901,442 | 15,712 | |
| Citigroup, Inc. | 266,022 | 14,389 | |
| Comerica, Inc. | 47,200 | 2,188 | |
| Commerce Bancshares, Inc. | 17,325 | 796 | |
| Fifth Third Bancorp | 67,300 | 1,391 | |
| JPMorgan Chase & Co. | 342,043 | 22,810 | |
| Lloyds Banking Group PLC | 240,500 | 264 | |
| M&T Bank Corp. | 18,600 | 2,331 | |
| PNC Financial Services Group, Inc. | 32,616 | 3,115 | |
| Regions Financial Corp. | 274,500 | 2,783 | |
| Standard Chartered PLC: | |||
| rights 12/10/15 (a) | 37,296 | 51 | |
| (United Kingdom) | 130,536 | 1,095 | |
| SunTrust Banks, Inc. | 134,435 | 5,837 | |
| U.S. Bancorp | 149,330 | 6,554 | |
| UMB Financial Corp. | 9,200 | 485 | |
| Wells Fargo & Co. | 52,850 | 2,912 | |
| 82,713 | |||
| Capital Markets - 5.4% | |||
| Ashmore Group PLC | 36,000 | 137 | |
| Charles Schwab Corp. | 118,513 | 3,995 | |
| Franklin Resources, Inc. | 16,300 | 683 | |
| Invesco Ltd. | 35,700 | 1,203 | |
| KKR & Co. LP | 173,113 | 2,927 | |
| Morgan Stanley | 128,630 | 4,412 | |
| Northern Trust Corp. | 61,240 | 4,589 | |
| Oaktree Capital Group LLC Class A | 20,100 | 981 | |
| PJT Partners, Inc. (a) | 77 | 2 | |
| State Street Corp. | 120,570 | 8,751 | |
| T. Rowe Price Group, Inc. | 800 | 61 | |
| The Blackstone Group LP | 41,100 | 1,284 | |
| TPG Specialty Lending, Inc. | 6,553 | 113 | |
| 29,138 | |||
| Insurance - 1.2% | |||
| ACE Ltd. | 3,700 | 425 | |
| Marsh & McLennan Companies, Inc. | 21,966 | 1,215 | |
| MetLife, Inc. | 61,605 | 3,147 | |
| Principal Financial Group, Inc. | 34,300 | 1,765 | |
| 6,552 | |||
| Real Estate Investment Trusts - 0.3% | |||
| American Tower Corp. | 7,500 | 745 | |
| Crown Castle International Corp. | 4,600 | 395 | |
| First Potomac Realty Trust | 9,872 | 115 | |
| Sabra Health Care REIT, Inc. | 17,100 | 354 | |
| 1,609 | |||
| Thrifts & Mortgage Finance - 0.2% | |||
| Radian Group, Inc. | 83,790 | 1,194 | |
| TOTAL FINANCIALS | 121,206 | ||
| HEALTH CARE - 10.9% | |||
| Biotechnology - 1.8% | |||
| AbbVie, Inc. | 39,200 | 2,279 | |
| Amgen, Inc. | 23,692 | 3,817 | |
| Biogen, Inc. (a) | 10,500 | 3,012 | |
| Intercept Pharmaceuticals, Inc. (a) | 3,600 | 635 | |
| 9,743 | |||
| Health Care Equipment & Supplies - 2.0% | |||
| Abbott Laboratories | 54,526 | 2,449 | |
| Ansell Ltd. | 20,366 | 321 | |
| Medtronic PLC | 64,342 | 4,848 | |
| St. Jude Medical, Inc. | 11,700 | 738 | |
| Zimmer Biomet Holdings, Inc. | 24,090 | 2,433 | |
| 10,789 | |||
| Health Care Providers & Services - 1.4% | |||
| Cardinal Health, Inc. | 9,400 | 816 | |
| Express Scripts Holding Co. (a) | 9,900 | 846 | |
| McKesson Corp. | 24,833 | 4,702 | |
| Patterson Companies, Inc. | 27,300 | 1,244 | |
| 7,608 | |||
| Life Sciences Tools & Services - 0.2% | |||
| Agilent Technologies, Inc. | 33,600 | 1,405 | |
| Pharmaceuticals - 5.5% | |||
| Astellas Pharma, Inc. | 44,700 | 629 | |
| Bristol-Myers Squibb Co. | 13,700 | 918 | |
| GlaxoSmithKline PLC sponsored ADR | 188,209 | 7,624 | |
| Johnson & Johnson | 108,201 | 10,954 | |
| Novartis AG sponsored ADR | 1,201 | 102 | |
| Shire PLC sponsored ADR | 8,400 | 1,750 | |
| Teva Pharmaceutical Industries Ltd. sponsored ADR | 121,074 | 7,619 | |
| Theravance, Inc. (b) | 29,900 | 277 | |
| 29,873 | |||
| TOTAL HEALTH CARE | 59,418 | ||
| INDUSTRIALS - 12.8% | |||
| Aerospace & Defense - 2.2% | |||
| Meggitt PLC | 47,906 | 279 | |
| Rolls-Royce Group PLC | 71,700 | 654 | |
| The Boeing Co. | 51,094 | 7,432 | |
| United Technologies Corp. | 35,531 | 3,413 | |
| 11,778 | |||
| Air Freight & Logistics - 1.7% | |||
| C.H. Robinson Worldwide, Inc. | 5,100 | 344 | |
| PostNL NV (a) | 351,100 | 1,173 | |
| United Parcel Service, Inc. Class B | 76,179 | 7,847 | |
| 9,364 | |||
| Airlines - 0.2% | |||
| Copa Holdings SA Class A | 21,000 | 1,085 | |
| Building Products - 0.2% | |||
| Lennox International, Inc. | 7,500 | 1,019 | |
| Commercial Services & Supplies - 0.5% | |||
| ADT Corp. (b) | 74,383 | 2,638 | |
| Electrical Equipment - 1.0% | |||
| Eaton Corp. PLC | 21,400 | 1,245 | |
| Emerson Electric Co. | 49,200 | 2,460 | |
| Hubbell, Inc. Class B | 18,412 | 1,828 | |
| 5,533 | |||
| Industrial Conglomerates - 3.6% | |||
| General Electric Co. | 653,093 | 19,554 | |
| Machinery - 0.7% | |||
| Cummins, Inc. | 4,000 | 401 | |
| Deere & Co. | 16,600 | 1,321 | |
| Donaldson Co., Inc. | 23,500 | 738 | |
| IMI PLC | 22,600 | 325 | |
| Pentair PLC | 7,900 | 448 | |
| Xylem, Inc. | 19,200 | 717 | |
| 3,950 | |||
| Professional Services - 0.1% | |||
| Nielsen Holdings PLC | 8,500 | 397 | |
| Road & Rail - 2.2% | |||
| CSX Corp. | 154,033 | 4,379 | |
| J.B. Hunt Transport Services, Inc. | 42,820 | 3,350 | |
| Kansas City Southern | 17,605 | 1,601 | |
| Norfolk Southern Corp. | 19,608 | 1,864 | |
| Union Pacific Corp. | 7,600 | 638 | |
| 11,832 | |||
| Trading Companies & Distributors - 0.4% | |||
| W.W. Grainger, Inc. | 1,500 | 301 | |
| Watsco, Inc. | 16,464 | 2,093 | |
| 2,394 | |||
| TOTAL INDUSTRIALS | 69,544 | ||
| INFORMATION TECHNOLOGY - 21.2% | |||
| Communications Equipment - 3.1% | |||
| Cisco Systems, Inc. | 282,171 | 7,689 | |
| QUALCOMM, Inc. | 187,013 | 9,124 | |
| 16,813 | |||
| Internet Software & Services - 3.3% | |||
| Alphabet, Inc.: | |||
| Class A (a) | 11,858 | 9,046 | |
| Class C | 10,153 | 7,540 | |
| Yahoo!, Inc. (a) | 37,592 | 1,271 | |
| 17,857 | |||
| IT Services - 5.5% | |||
| First Data Corp. | 126,726 | 1,916 | |
| First Data Corp. Class A (a) | 18,800 | 316 | |
| IBM Corp. | 39,400 | 5,493 | |
| MasterCard, Inc. Class A | 59,390 | 5,815 | |
| Paychex, Inc. | 129,809 | 7,042 | |
| The Western Union Co. | 37,461 | 707 | |
| Unisys Corp. (a) | 77,900 | 1,002 | |
| Visa, Inc. Class A | 100,340 | 7,928 | |
| 30,219 | |||
| Semiconductors & Semiconductor Equipment - 0.7% | |||
| Analog Devices, Inc. | 5,400 | 333 | |
| Broadcom Corp. Class A | 20,236 | 1,105 | |
| Marvell Technology Group Ltd. | 71,400 | 633 | |
| Maxim Integrated Products, Inc. | 41,100 | 1,593 | |
| 3,664 | |||
| Software - 3.9% | |||
| Microsoft Corp. | 323,573 | 17,586 | |
| Oracle Corp. | 97,284 | 3,791 | |
| 21,377 | |||
| Technology Hardware, Storage & Peripherals - 4.7% | |||
| Apple, Inc. | 156,078 | 18,464 | |
| EMC Corp. | 211,900 | 5,370 | |
| HP, Inc. | 53,800 | 675 | |
| Western Digital Corp. | 13,800 | 861 | |
| 25,370 | |||
| TOTAL INFORMATION TECHNOLOGY | 115,300 | ||
| MATERIALS - 3.1% | |||
| Chemicals - 2.7% | |||
| CF Industries Holdings, Inc. | 20,800 | 960 | |
| E.I. du Pont de Nemours & Co. | 26,331 | 1,773 | |
| LyondellBasell Industries NV Class A | 13,400 | 1,284 | |
| Monsanto Co. | 62,601 | 5,957 | |
| Potash Corp. of Saskatchewan, Inc. | 86,100 | 1,743 | |
| Syngenta AG (Switzerland) | 7,447 | 2,743 | |
| Tronox Ltd. Class A | 17,751 | 103 | |
| 14,563 | |||
| Containers & Packaging - 0.3% | |||
| Packaging Corp. of America | 7,400 | 503 | |
| WestRock Co. | 19,000 | 962 | |
| 1,465 | |||
| Metals & Mining - 0.1% | |||
| Freeport-McMoRan, Inc. | 61,100 | 500 | |
| Paper & Forest Products - 0.0% | |||
| International Paper Co. | 4,200 | 176 | |
| TOTAL MATERIALS | 16,704 | ||
| TELECOMMUNICATION SERVICES - 0.9% | |||
| Diversified Telecommunication Services - 0.9% | |||
| Verizon Communications, Inc. | 110,709 | 5,032 | |
| UTILITIES - 0.4% | |||
| Electric Utilities - 0.4% | |||
| Exelon Corp. | 67,700 | 1,849 | |
| PPL Corp. | 8,400 | 286 | |
| 2,135 | |||
| TOTAL COMMON STOCKS | |||
| (Cost $439,298) | 533,342 | ||
| Preferred Stocks - 0.8% | |||
| Convertible Preferred Stocks - 0.8% | |||
| CONSUMER DISCRETIONARY - 0.0% | |||
| Leisure Products - 0.0% | |||
| NJOY, Inc. Series D (a)(d) | 5,350 | 3 | |
| HEALTH CARE - 0.8% | |||
| Health Care Equipment & Supplies - 0.8% | |||
| Alere, Inc. 3.00% (a) | 14,154 | 4,175 | |
| TOTAL CONVERTIBLE PREFERRED STOCKS | 4,178 | ||
| Nonconvertible Preferred Stocks - 0.0% | |||
| INDUSTRIALS - 0.0% | |||
| Aerospace & Defense - 0.0% | |||
| Rolls-Royce Group PLC | 2,679,030 | 4 | |
| TOTAL PREFERRED STOCKS | |||
| (Cost $4,022) | 4,182 | ||
| Principal Amount (000s) | Value (000s) | ||
| Convertible Bonds - 0.3% | |||
| CONSUMER DISCRETIONARY - 0.1% | |||
| Automobiles - 0.1% | |||
| Tesla Motors, Inc. 1.25% 3/1/21 | 270 | 245 | |
| ENERGY - 0.1% | |||
| Oil, Gas & Consumable Fuels - 0.1% | |||
| Amyris, Inc. 9.5% 4/15/19 (e) | 697 | 722 | |
| Peabody Energy Corp. 4.75% 12/15/41 | 590 | 34 | |
| 756 | |||
| INFORMATION TECHNOLOGY - 0.1% | |||
| Internet Software & Services - 0.1% | |||
| Twitter, Inc. 0.25% 9/15/19 | 790 | 684 | |
| TOTAL CONVERTIBLE BONDS | |||
| (Cost $2,089) | 1,685 | ||
| Shares | Value (000s) | ||
| Money Market Funds - 1.3% | |||
| Fidelity Cash Central Fund, 0.18% (f) | 3,067,306 | 3,067 | |
| Fidelity Securities Lending Cash Central Fund, 0.22% (f)(g) | 4,001,689 | 4,002 | |
| TOTAL MONEY MARKET FUNDS | |||
| (Cost $7,069) | 7,069 | ||
| TOTAL INVESTMENT PORTFOLIO - 100.5% | |||
| (Cost $452,478) | 546,278 | ||
| NET OTHER ASSETS (LIABILITIES) - (0.5)% | (2,811) | ||
| NET ASSETS - 100% | $543,467 |
Legend
(a) Non-income producing
(b) Security or a portion of the security is on loan at period end.
(c) Security or a portion of the security purchased on a delayed delivery or when-issued basis.
(d) Restricted securities - Investment in securities not registered under the Securities Act of 1933 (excluding 144A issues). At the end of the period, the value of restricted securities (excluding 144A issues) amounted to $3,000 or 0.0% of net assets.
(e) Security exempt from registration under Rule 144A of the Securities Act of 1933. These securities may be resold in transactions exempt from registration, normally to qualified institutional buyers. At the end of the period, the value of these securities amounted to $722,000 or 0.1% of net assets.
(f) Affiliated fund that is generally available only to investment companies and other accounts managed by Fidelity Investments. The rate quoted is the annualized seven-day yield of the fund at period end. A complete unaudited listing of the fund's holdings as of its most recent quarter end is available upon request. In addition, each Fidelity Central Fund's financial statements, which are not covered by the Fund's Report of Independent Registered Public Accounting Firm, are available on the SEC's website or upon request.
(g) Investment made with cash collateral received from securities on loan.
Additional information on each restricted holding is as follows:
| Security | Acquisition Date | Acquisition Cost (000s) |
| NJOY, Inc. Series D | 2/14/14 | $91 |
Affiliated Central Funds
Information regarding fiscal year to date income earned by the Fund from investments in Fidelity Central Funds is as follows:
| Fund | Income earned |
| (Amounts in thousands) | |
| Fidelity Cash Central Fund | $48 |
| Fidelity Securities Lending Cash Central Fund | 69 |
| Total | $117 |
Investment Valuation
The following is a summary of the inputs used, as of November 30, 2015, involving the Fund's assets and liabilities carried at fair value. The inputs or methodology used for valuing securities may not be an indication of the risk associated with investing in those securities. For more information on valuation inputs, and their aggregation into the levels used below, please refer to the Investment Valuation section in the accompanying Notes to Financial Statements.
| Valuation Inputs at Reporting Date: | ||||
| Description | Total | Level 1 | Level 2 | Level 3 |
| (Amounts in thousands) | ||||
| Investments in Securities: | ||||
| Equities: | ||||
| Consumer Discretionary | $49,241 | $49,238 | $-- | $3 |
| Consumer Staples | 42,579 | 39,669 | 2,910 | -- |
| Energy | 52,186 | 51,802 | 384 | -- |
| Financials | 121,206 | 120,942 | 264 | -- |
| Health Care | 63,593 | 62,964 | 629 | -- |
| Industrials | 69,548 | 68,615 | 933 | -- |
| Information Technology | 115,300 | 113,384 | 1,916 | -- |
| Materials | 16,704 | 13,961 | 2,743 | -- |
| Telecommunication Services | 5,032 | 5,032 | -- | -- |
| Utilities | 2,135 | 2,135 | -- | -- |
| Corporate Bonds | 1,685 | -- | 1,685 | -- |
| Money Market Funds | 7,069 | 7,069 | -- | -- |
| Total Investments in Securities: | $546,278 | $534,811 | $11,464 | $3 |
Other Information
Distribution of investments by country or territory of incorporation, as a percentage of Total Net Assets, is as follows (Unaudited):
| United States of America | 88.3% |
| United Kingdom | 3.7% |
| Canada | 2.7% |
| Israel | 1.4% |
| Ireland | 1.2% |
| Others (Individually Less Than 1%) | 2.7% |
| 100.0% |
See accompanying notes which are an integral part of the financial statements.
Financial Statements
Statement of Assets and Liabilities
| Amounts in thousands (except per-share amounts) | November 30, 2015 | |
| Assets | ||
| Investment in securities, at value (including securities loaned of $3,986) — See accompanying schedule: Unaffiliated issuers (cost $445,409) | $539,209 | |
| Fidelity Central Funds (cost $7,069) | 7,069 | |
| Total Investments (cost $452,478) | $546,278 | |
| Cash | 30 | |
| Receivable for investments sold | 1,972 | |
| Receivable for fund shares sold | 227 | |
| Dividends receivable | 1,541 | |
| Interest receivable | 33 | |
| Distributions receivable from Fidelity Central Funds | 2 | |
| Prepaid expenses | 1 | |
| Other receivables | 2 | |
| Total assets | 550,086 | |
| Liabilities | ||
| Payable for investments purchased | ||
| Regular delivery | $1,188 | |
| Delayed delivery | 384 | |
| Payable for fund shares redeemed | 480 | |
| Accrued management fee | 204 | |
| Distribution and service plan fees payable | 196 | |
| Other affiliated payables | 113 | |
| Other payables and accrued expenses | 52 | |
| Collateral on securities loaned, at value | 4,002 | |
| Total liabilities | 6,619 | |
| Net Assets | $543,467 | |
| Net Assets consist of: | ||
| Paid in capital | $413,267 | |
| Undistributed net investment income | 6,597 | |
| Accumulated undistributed net realized gain (loss) on investments and foreign currency transactions | 29,817 | |
| Net unrealized appreciation (depreciation) on investments and assets and liabilities in foreign currencies | 93,786 | |
| Net Assets | $543,467 | |
| Calculation of Maximum Offering Price | ||
| Class A: | ||
| Net Asset Value and redemption price per share ($243,615 ÷ 9,242.84 shares) | $26.36 | |
| Maximum offering price per share (100/94.25 of $26.36) | $27.97 | |
| Class T: | ||
| Net Asset Value and redemption price per share ($179,813 ÷ 6,831.12 shares) | $26.32 | |
| Maximum offering price per share (100/96.50 of $26.32) | $27.27 | |
| Class B: | ||
| Net Asset Value and offering price per share ($4,693 ÷ 187.25 shares)(a) | $25.06 | |
| Class C: | ||
| Net Asset Value and offering price per share ($79,016 ÷ 3,170.45 shares)(a) | $24.92 | |
| Class I: | ||
| Net Asset Value, offering price and redemption price per share ($36,330 ÷ 1,353.11 shares) | $26.85 |
(a) Redemption price per share is equal to net asset value less any applicable contingent deferred sales charge.
See accompanying notes which are an integral part of the financial statements.
Statement of Operations
| Amounts in thousands | Year ended November 30, 2015 | |
| Investment Income | ||
| Dividends | $14,489 | |
| Interest | 82 | |
| Income from Fidelity Central Funds | 117 | |
| Total income | 14,688 | |
| Expenses | ||
| Management fee | $2,581 | |
| Transfer agent fees | 1,233 | |
| Distribution and service plan fees | 2,515 | |
| Accounting and security lending fees | 217 | |
| Custodian fees and expenses | 48 | |
| Independent trustees' compensation | 2 | |
| Registration fees | 76 | |
| Audit | 65 | |
| Legal | 3 | |
| Interest | 1 | |
| Miscellaneous | 4 | |
| Total expenses before reductions | 6,745 | |
| Expense reductions | (28) | 6,717 |
| Net investment income (loss) | 7,971 | |
| Realized and Unrealized Gain (Loss) | ||
| Net realized gain (loss) on: | ||
| Investment securities: | ||
| Unaffiliated issuers | 33,819 | |
| Foreign currency transactions | (5) | |
| Total net realized gain (loss) | 33,814 | |
| Change in net unrealized appreciation (depreciation) on: Investment securities | (48,437) | |
| Assets and liabilities in foreign currencies | (6) | |
| Total change in net unrealized appreciation (depreciation) | (48,443) | |
| Net gain (loss) | (14,629) | |
| Net increase (decrease) in net assets resulting from operations | $(6,658) |
See accompanying notes which are an integral part of the financial statements.
Statement of Changes in Net Assets
| Amounts in thousands | Year ended November 30, 2015 | Year ended November 30, 2014 |
| Increase (Decrease) in Net Assets | ||
| Operations | ||
| Net investment income (loss) | $7,971 | $7,556 |
| Net realized gain (loss) | 33,814 | 44,197 |
| Change in net unrealized appreciation (depreciation) | (48,443) | 20,295 |
| Net increase (decrease) in net assets resulting from operations | (6,658) | 72,048 |
| Distributions to shareholders from net investment income | (6,678) | (1,555) |
| Distributions to shareholders from net realized gain | (40,365) | (4,023) |
| Total distributions | (47,043) | (5,578) |
| Share transactions - net increase (decrease) | (16,615) | (32,125) |
| Total increase (decrease) in net assets | (70,316) | 34,345 |
| Net Assets | ||
| Beginning of period | 613,783 | 579,438 |
| End of period (including undistributed net investment income of $6,597 and undistributed net investment income of $6,680, respectively) | $543,467 | $613,783 |
See accompanying notes which are an integral part of the financial statements.
Financial Highlights — Fidelity Advisor Growth & Income Fund Class A
| Years ended November 30, | 2015 | 2014 | 2013 | 2012 | 2011 |
| Selected Per–Share Data | |||||
| Net asset value, beginning of period | $28.95 | $25.87 | $19.67 | $17.00 | $16.05 |
| Income from Investment Operations | |||||
| Net investment income (loss)A | .42 | .40 | .37 | .33 | .21 |
| Net realized and unrealized gain (loss) | (.76)B | 2.97 | 5.88 | 2.90 | .78 |
| Total from investment operations | (.34) | 3.37 | 6.25 | 3.23 | .99 |
| Distributions from net investment income | (.36) | (.11) | (.05) | (.53) | (.04) |
| Distributions from net realized gain | (1.88) | (.18) | – | (.03) | – |
| Total distributions | (2.25)C | (.29) | (.05) | (.56) | (.04) |
| Net asset value, end of period | $26.36 | $28.95 | $25.87 | $19.67 | $17.00 |
| Total ReturnD,E | (.96)%B | 13.20% | 31.86% | 19.20% | 6.17% |
| Ratios to Average Net AssetsF,G | |||||
| Expenses before reductions | .99% | 1.01% | 1.02% | 1.05% | 1.06% |
| Expenses net of fee waivers, if any | .98% | 1.01% | 1.02% | 1.05% | 1.06% |
| Expenses net of all reductions | .98% | 1.01% | 1.00% | 1.04% | 1.05% |
| Net investment income (loss) | 1.57% | 1.48% | 1.61% | 1.75% | 1.22% |
| Supplemental Data | |||||
| Net assets, end of period (in millions) | $244 | $276 | $255 | $183 | $170 |
| Portfolio turnover rateH | 35% | 44% | 48% | 57% | 123% |
A Calculated based on average shares outstanding during the period.
B Net realized and unrealized gain (loss) per share reflects proceeds from litigation which amounted to $0.04 per share. Excluding these litigation proceeds, the total return would have been (1.10)%.
C Total distributions of $2.25 per share is comprised of distributions from net investment income of $.363 and distributions from net realized gain of $1.883 per share.
D Total returns would have been lower if certain expenses had not been reduced during the applicable periods shown.
E Total returns do not include the effect of the sales charges.
F Fees and expenses of any underlying Fidelity Central Funds are not included in the Fund's expense ratio. The Fund indirectly bears its proportionate share of the expenses of any underlying Fidelity Central Funds.
G Expense ratios reflect operating expenses of the class. Expenses before reductions do not reflect amounts reimbursed by the investment adviser or reductions from brokerage service arrangements or reductions from other expense offset arrangements and do not represent the amount paid by the class during periods when reimbursements or reductions occur. Expenses net of fee waivers reflect expenses after reimbursement by the investment adviser but prior to reductions from brokerage service arrangements or other expense offset arrangements. Expenses net of all reductions represent the net expenses paid by the class.
H Amount does not include the portfolio activity of any underlying Fidelity Central Funds.
See accompanying notes which are an integral part of the financial statements.
Financial Highlights — Fidelity Advisor Growth & Income Fund Class T
| Years ended November 30, | 2015 | 2014 | 2013 | 2012 | 2011 |
| Selected Per–Share Data | |||||
| Net asset value, beginning of period | $28.91 | $25.84 | $19.68 | $16.97 | $16.02 |
| Income from Investment Operations | |||||
| Net investment income (loss)A | .35 | .33 | .32 | .29 | .17 |
| Net realized and unrealized gain (loss) | (.76)B | 2.97 | 5.89 | 2.89 | .78 |
| Total from investment operations | (.41) | 3.30 | 6.21 | 3.18 | .95 |
| Distributions from net investment income | (.29) | (.05) | (.05) | (.44) | – |
| Distributions from net realized gain | (1.88) | (.18) | – | (.03) | – |
| Total distributions | (2.18)C | (.23) | (.05) | (.47) | – |
| Net asset value, end of period | $26.32 | $28.91 | $25.84 | $19.68 | $16.97 |
| Total ReturnD,E | (1.22)%B | 12.91% | 31.62% | 18.93% | 5.93% |
| Ratios to Average Net AssetsF,G | |||||
| Expenses before reductions | 1.23% | 1.25% | 1.25% | 1.27% | 1.29% |
| Expenses net of fee waivers, if any | 1.23% | 1.25% | 1.25% | 1.27% | 1.29% |
| Expenses net of all reductions | 1.23% | 1.24% | 1.23% | 1.26% | 1.28% |
| Net investment income (loss) | 1.32% | 1.24% | 1.38% | 1.53% | .99% |
| Supplemental Data | |||||
| Net assets, end of period (in millions) | $180 | $216 | $214 | $166 | $158 |
| Portfolio turnover rateH | 35% | 44% | 48% | 57% | 123% |
A Calculated based on average shares outstanding during the period.
B Net realized and unrealized gain (loss) per share reflects proceeds from litigation which amounted to $0.04 per share. Excluding these litigation proceeds, the total return would have been (1.36)%.
C Total distributions of $2.18 per share is comprised of distributions from net investment income of $.293 and distributions from net realized gain of $1.883 per share.
D Total returns would have been lower if certain expenses had not been reduced during the applicable periods shown.
E Total returns do not include the effect of the sales charges.
F Fees and expenses of any underlying Fidelity Central Funds are not included in the Fund's expense ratio. The Fund indirectly bears its proportionate share of the expenses of any underlying Fidelity Central Funds.
G Expense ratios reflect operating expenses of the class. Expenses before reductions do not reflect amounts reimbursed by the investment adviser or reductions from brokerage service arrangements or reductions from other expense offset arrangements and do not represent the amount paid by the class during periods when reimbursements or reductions occur. Expenses net of fee waivers reflect expenses after reimbursement by the investment adviser but prior to reductions from brokerage service arrangements or other expense offset arrangements. Expenses net of all reductions represent the net expenses paid by the class.
H Amount does not include the portfolio activity of any underlying Fidelity Central Funds.
See accompanying notes which are an integral part of the financial statements.
Financial Highlights — Fidelity Advisor Growth & Income Fund Class B
| Years ended November 30, | 2015 | 2014 | 2013 | 2012 | 2011 |
| Selected Per–Share Data | |||||
| Net asset value, beginning of period | $27.58 | $24.74 | $18.95 | $16.24 | $15.41 |
| Income from Investment Operations | |||||
| Net investment income (loss)A | .19 | .17 | .18 | .18 | .08 |
| Net realized and unrealized gain (loss) | (.74)B | 2.85 | 5.65 | 2.78 | .75 |
| Total from investment operations | (.55) | 3.02 | 5.83 | 2.96 | .83 |
| Distributions from net investment income | (.09) | – | (.04) | (.22) | – |
| Distributions from net realized gain | (1.88) | (.18) | – | (.03) | – |
| Total distributions | (1.97) | (.18) | (.04) | (.25) | – |
| Net asset value, end of period | $25.06 | $27.58 | $24.74 | $18.95 | $16.24 |
| Total ReturnC,D | (1.83)%B | 12.30% | 30.81% | 18.31% | 5.39% |
| Ratios to Average Net AssetsE,F | |||||
| Expenses before reductions | 1.82% | 1.83% | 1.81% | 1.81% | 1.81% |
| Expenses net of fee waivers, if any | 1.82% | 1.83% | 1.81% | 1.81% | 1.81% |
| Expenses net of all reductions | 1.82% | 1.83% | 1.80% | 1.81% | 1.80% |
| Net investment income (loss) | .73% | .65% | .82% | .99% | .47% |
| Supplemental Data | |||||
| Net assets, end of period (in millions) | $5 | $8 | $12 | $11 | $13 |
| Portfolio turnover rateG | 35% | 44% | 48% | 57% | 123% |
A Calculated based on average shares outstanding during the period.
B Net realized and unrealized gain (loss) per share reflects proceeds from litigation which amounted to $0.04 per share. Excluding these litigation proceeds, the total return would have been (1.97)%.
C Total returns would have been lower if certain expenses had not been reduced during the applicable periods shown.
D Total returns do not include the effect of the contingent deferred sales charge.
E Fees and expenses of any underlying Fidelity Central Funds are not included in the Fund's expense ratio. The Fund indirectly bears its proportionate share of the expenses of any underlying Fidelity Central Funds.
F Expense ratios reflect operating expenses of the class. Expenses before reductions do not reflect amounts reimbursed by the investment adviser or reductions from brokerage service arrangements or reductions from other expense offset arrangements and do not represent the amount paid by the class during periods when reimbursements or reductions occur. Expenses net of fee waivers reflect expenses after reimbursement by the investment adviser but prior to reductions from brokerage service arrangements or other expense offset arrangements. Expenses net of all reductions represent the net expenses paid by the class.
G Amount does not include the portfolio activity of any underlying Fidelity Central Funds.
See accompanying notes which are an integral part of the financial statements.
Financial Highlights — Fidelity Advisor Growth & Income Fund Class C
| Years ended November 30, | 2015 | 2014 | 2013 | 2012 | 2011 |
| Selected Per–Share Data | |||||
| Net asset value, beginning of period | $27.51 | $24.66 | $18.87 | $16.23 | $15.39 |
| Income from Investment Operations | |||||
| Net investment income (loss)A | .21 | .19 | .19 | .19 | .08 |
| Net realized and unrealized gain (loss) | (.73)B | 2.84 | 5.64 | 2.77 | .76 |
| Total from investment operations | (.52) | 3.03 | 5.83 | 2.96 | .84 |
| Distributions from net investment income | (.18) | – | (.04) | (.29) | – |
| Distributions from net realized gain | (1.88) | (.18) | – | (.03) | – |
| Total distributions | (2.07)C | (.18) | (.04) | (.32) | – |
| Net asset value, end of period | $24.92 | $27.51 | $24.66 | $18.87 | $16.23 |
| Total ReturnD,E | (1.74)%B | 12.38% | 30.95% | 18.33% | 5.46% |
| Ratios to Average Net AssetsF,G | |||||
| Expenses before reductions | 1.73% | 1.74% | 1.74% | 1.76% | 1.78% |
| Expenses net of fee waivers, if any | 1.73% | 1.74% | 1.74% | 1.76% | 1.78% |
| Expenses net of all reductions | 1.73% | 1.74% | 1.73% | 1.76% | 1.77% |
| Net investment income (loss) | .82% | .74% | .89% | 1.04% | .50% |
| Supplemental Data | |||||
| Net assets, end of period (in millions) | $79 | $85 | $74 | $58 | $53 |
| Portfolio turnover rateH | 35% | 44% | 48% | 57% | 123% |
A Calculated based on average shares outstanding during the period.
B Net realized and unrealized gain (loss) per share reflects proceeds from litigation which amounted to $0.04 per share. Excluding these litigation proceeds, the total return would have been (1.88)%.
C Total distributions of $2.07per share is comprised of distributions from net investment income of $.183 and distributions from net realized gain of $1.883 per share.
D Total returns would have been lower if certain expenses had not been reduced during the applicable periods shown.
E Total returns do not include the effect of the contingent deferred sales charge.
F Fees and expenses of any underlying Fidelity Central Funds are not included in the Fund's expense ratio. The Fund indirectly bears its proportionate share of the expenses of any underlying Fidelity Central Funds.
G Expense ratios reflect operating expenses of the class. Expenses before reductions do not reflect amounts reimbursed by the investment adviser or reductions from brokerage service arrangements or reductions from other expense offset arrangements and do not represent the amount paid by the class during periods when reimbursements or reductions occur. Expenses net of fee waivers reflect expenses after reimbursement by the investment adviser but prior to reductions from brokerage service arrangements or other expense offset arrangements. Expenses net of all reductions represent the net expenses paid by the class.
H Amount does not include the portfolio activity of any underlying Fidelity Central Funds.
See accompanying notes which are an integral part of the financial statements.
Financial Highlights — Fidelity Advisor Growth & Income Fund Class I
| Years ended November 30, | 2015 | 2014 | 2013 | 2012 | 2011 |
| Selected Per–Share Data | |||||
| Net asset value, beginning of period | $29.47 | $26.13 | $19.79 | $17.16 | $16.19 |
| Income from Investment Operations | |||||
| Net investment income (loss)A | .50 | .49 | .43 | .40 | .27 |
| Net realized and unrealized gain (loss) | (.78)B | 3.03 | 5.97 | 2.91 | .79 |
| Total from investment operations | (.28) | 3.52 | 6.40 | 3.31 | 1.06 |
| Distributions from net investment income | (.45) | – | (.06) | (.65) | (.09) |
| Distributions from net realized gain | (1.88) | (.18) | – | (.03) | – |
| Total distributions | (2.34)C | (.18) | (.06) | (.68) | (.09) |
| Net asset value, end of period | $26.85 | $29.47 | $26.13 | $19.79 | $17.16 |
| Total ReturnD | (.70)%B | 13.56% | 32.41% | 19.59% | 6.56% |
| Ratios to Average Net AssetsE,F | |||||
| Expenses before reductions | .71% | .70% | .70% | .71% | .72% |
| Expenses net of fee waivers, if any | .70% | .70% | .70% | .71% | .72% |
| Expenses net of all reductions | .70% | .70% | .68% | .70% | .71% |
| Net investment income (loss) | 1.86% | 1.78% | 1.93% | 2.09% | 1.56% |
| Supplemental Data | |||||
| Net assets, end of period (in millions) | $36 | $28 | $24 | $1,031 | $1,017 |
| Portfolio turnover rateG | 35% | 44% | 48% | 57% | 123% |
A Calculated based on average shares outstanding during the period.
B Net realized and unrealized gain (loss) per share reflects proceeds from litigation which amounted to $0.04 per share. Excluding these litigation proceeds, the total return would have been (.84)%.
C Total distributions of $2.34 per share is comprised of distributions from net investment income of $.454 and distributions from net realized gain of $1.883 per share.
D Total returns would have been lower if certain expenses had not been reduced during the applicable periods shown.
E Fees and expenses of any underlying Fidelity Central Funds are not included in the Fund's expense ratio. The Fund indirectly bears its proportionate share of the expenses of any underlying Fidelity Central Funds.
F Expense ratios reflect operating expenses of the class. Expenses before reductions do not reflect amounts reimbursed by the investment adviser or reductions from brokerage service arrangements or reductions from other expense offset arrangements and do not represent the amount paid by the class during periods when reimbursements or reductions occur. Expenses net of fee waivers reflect expenses after reimbursement by the investment adviser but prior to reductions from brokerage service arrangements or other expense offset arrangements. Expenses net of all reductions represent the net expenses paid by the class.
G Amount does not include the portfolio activity of any underlying Fidelity Central Funds.
See accompanying notes which are an integral part of the financial statements.
Notes to Financial Statements
For the period ended November 30, 2015
(Amounts in thousands except percentages)
1. Organization.
Fidelity Advisor Growth & Income Fund (the Fund) is a fund of Fidelity Advisor Series I (the Trust) and is authorized to issue an unlimited number of shares. The Trust is registered under the Investment Company Act of 1940, as amended (the 1940 Act), as an open-end management investment company organized as a Massachusetts business trust. The Fund offers Class A, Class T, Class C, and Class I (formerly Institutional Class) shares, each of which, along with Class B shares, has equal rights as to assets and voting privileges. Class B shares are closed to new accounts and additional purchases, except for exchanges and reinvestments. Each class has exclusive voting rights with respect to matters that affect that class. Class B shares will automatically convert to Class A shares after a holding period of seven years from the initial date of purchase.
2. Investments in Fidelity Central Funds.
The Fund invests in Fidelity Central Funds, which are open-end investment companies generally available only to other investment companies and accounts managed by the investment adviser and its affiliates. The Fund's Schedule of Investments lists each of the Fidelity Central Funds held as of period end, if any, as an investment of the Fund, but does not include the underlying holdings of each Fidelity Central Fund. As an Investing Fund, the Fund indirectly bears its proportionate share of the expenses of the underlying Fidelity Central Funds.
The Money Market Central Funds seek preservation of capital and current income and are managed by Fidelity Investments Money Management, Inc. (FIMM), an affiliate of the investment adviser. Annualized expenses of the Money Market Central Funds as of their most recent shareholder report date are less than .005%.
A complete unaudited list of holdings for each Fidelity Central Fund is available upon request or at the Securities and Exchange Commission (the SEC) website at www.sec.gov. In addition, the financial statements of the Fidelity Central Funds, which are not covered by the Fund's Report of Independent Registered Public Accounting Firm, are available on the SEC website or upon request.
3. Significant Accounting Policies.
The financial statements have been prepared in conformity with accounting principles generally accepted in the United States of America (GAAP), which require management to make certain estimates and assumptions at the date of the financial statements. Actual results could differ from those estimates. Subsequent events, if any, through the date that the financial statements were issued have been evaluated in the preparation of the financial statements. The following summarizes the significant accounting policies of the Fund:
Investment Valuation. Investments are valued as of 4:00 p.m. Eastern time on the last calendar day of the period. The Board of Trustees (the Board) has delegated the day to day responsibility for the valuation of the Fund's investments to the Fidelity Management & Research Company (FMR) Fair Value Committee (the Committee). In accordance with valuation policies and procedures approved by the Board, the Fund attempts to obtain prices from one or more third party pricing vendors or brokers to value its investments. When current market prices, quotations or currency exchange rates are not readily available or reliable, investments will be fair valued in good faith by the Committee, in accordance with procedures adopted by the Board. Factors used in determining fair value vary by investment type and may include market or investment specific events, changes in interest rates and credit quality. The frequency with which these procedures are used cannot be predicted and they may be utilized to a significant extent. The Committee oversees the Fund's valuation policies and procedures and reports to the Board on the Committee's activities and fair value determinations. The Board monitors the appropriateness of the procedures used in valuing the Fund's investments and ratifies the fair value determinations of the Committee.
The Fund categorizes the inputs to valuation techniques used to value its investments into a disclosure hierarchy consisting of three levels as shown below:
- Level 1 – quoted prices in active markets for identical investments
- Level 2 – other significant observable inputs (including quoted prices for similar investments, interest rates, prepayment speeds, etc.)
- Level 3 – unobservable inputs (including the Fund's own assumptions based on the best information available)
Valuation techniques used to value the Fund's investments by major category are as follows:
Equity securities, including restricted securities, for which market quotations are readily available, are valued at the last reported sale price or official closing price as reported by a third party pricing vendor on the primary market or exchange on which they are traded and are categorized as Level 1 in the hierarchy. In the event there were no sales during the day or closing prices are not available, securities are valued at the last quoted bid price or may be valued using the last available price and are generally categorized as Level 2 in the hierarchy. For foreign equity securities, when market or security specific events arise, comparisons to the valuation of American Depositary Receipts (ADRs), futures contracts, Exchange-Traded Funds (ETFs) and certain indexes as well as quoted prices for similar securities may be used and would be categorized as Level 2 in the hierarchy. Utilizing these techniques may result in transfers between Level 1 and Level 2. For equity securities, including restricted securities, where observable inputs are limited, assumptions about market activity and risk are used and these securities may be categorized as Level 3 in the hierarchy.
Debt securities, including restricted securities, are valued based on evaluated prices received from third party pricing vendors or from brokers who make markets in such securities. Corporate bonds are valued by pricing vendors who utilize matrix pricing which considers yield or price of bonds of comparable quality, coupon, maturity and type or by broker-supplied prices. When independent prices are unavailable or unreliable, debt securities may be valued utilizing pricing methodologies which consider similar factors that would be used by third party pricing vendors. Debt securities are generally categorized as Level 2 in the hierarchy but may be Level 3 depending on the circumstances.
Investments in open-end mutual funds, including the Fidelity Central Funds, are valued at their closing net asset value (NAV) each business day and are categorized as Level 1 in the hierarchy.
Changes in valuation techniques may result in transfers in or out of an assigned level within the disclosure hierarchy. The aggregate value of investments by input level as of November 30, 2015 is included at the end of the Fund's Schedule of Investments.
Foreign Currency. The Fund may use foreign currency contracts to facilitate transactions in foreign-denominated securities. Gains and losses from these transactions may arise from changes in the value of the foreign currency or if the counterparties do not perform under the contracts' terms.
Foreign-denominated assets, including investment securities, and liabilities are translated into U.S. dollars at the exchange rates at period end. Purchases and sales of investment securities, income and dividends received and expenses denominated in foreign currencies are translated into U.S. dollars at the exchange rate in effect on the transaction date.
The effects of exchange rate fluctuations on investments are included with the net realized and unrealized gain (loss) on investment securities. Other foreign currency transactions resulting in realized and unrealized gain (loss) are disclosed separately.
Investment Transactions and Income. For financial reporting purposes, the Fund's investment holdings and NAV include trades executed through the end of the last business day of the period. The NAV per share for processing shareholder transactions is calculated as of the close of business of the New York Stock Exchange (NYSE), normally 4:00 p.m. Eastern time and includes trades executed through the end of the prior business day. Gains and losses on securities sold are determined on the basis of identified cost and may include proceeds received from litigation. Dividend income is recorded on the ex-dividend date, except for certain dividends from foreign securities where the ex-dividend date may have passed, which are recorded as soon as the Fund is informed of the ex-dividend date. Non-cash dividends included in dividend income, if any, are recorded at the fair market value of the securities received. Income and capital gain distributions from Fidelity Central Funds, if any, are recorded on the ex-dividend date. Distributions received on securities that represent a return of capital or capital gain are recorded as a reduction of cost of investments and/or as a realized gain. Subsequent to ex-dividend date the Fund determines the components of these distributions, based upon receipt of tax filings or other correspondence relating to the underlying investment. Interest income is accrued as earned and includes coupon interest and amortization of premium and accretion of discount on debt securities as applicable. Investment income is recorded net of foreign taxes withheld where recovery of such taxes is uncertain.
Class Allocations and Expenses. Investment income, realized and unrealized capital gains and losses, common expenses of the Fund, and certain fund-level expense reductions, if any, are allocated daily on a pro-rata basis to each class based on the relative net assets of each class to the total net assets of the Fund. Each class differs with respect to transfer agent and distribution and service plan fees incurred. Certain expense reductions may also differ by class. For the reporting period, the allocated portion of income and expenses to each class as a percent of its average net assets may vary due to the timing of recording these transactions in relation to fluctuating net assets of the classes. Expenses directly attributable to a fund are charged to that fund. Expenses attributable to more than one fund are allocated among the respective funds on the basis of relative net assets or other appropriate methods. Expense estimates are accrued in the period to which they relate and adjustments are made when actual amounts are known.
Income Tax Information and Distributions to Shareholders. Each year, the Fund intends to qualify as a regulated investment company under Subchapter M of the Internal Revenue Code, including distributing substantially all of its taxable income and realized gains. As a result, no provision for U.S. Federal income taxes is required. As of November 30, 2015, the Fund did not have any unrecognized tax benefits in the financial statements; nor is the Fund aware of any tax positions for which it is reasonably possible that the total amounts of unrecognized tax benefits will significantly change in the next twelve months. The Fund files a U.S. federal tax return, in addition to state and local tax returns as required. The Fund's federal income tax returns are subject to examination by the Internal Revenue Service (IRS) for a period of three fiscal years after they are filed. State and local tax returns may be subject to examination for an additional fiscal year depending on the jurisdiction. Foreign taxes are provided for based on the Fund's understanding of the tax rules and rates that exist in the foreign markets in which it invests.
Distributions are declared and recorded on the ex-dividend date. Income dividends and capital gain distributions are declared separately for each class. Income and capital gain distributions are determined in accordance with income tax regulations, which may differ from GAAP. In addition, the fund will claim a portion of the payment made to redeeming shareholders as a distribution for income tax purposes.
Capital accounts within the financial statements are adjusted for permanent book-tax differences. These adjustments have no impact on net assets or the results of operations. Capital accounts are not adjusted for temporary book-tax differences which will reverse in a subsequent period.
Book-tax differences are primarily due to foreign currency transactions, market discount, partnerships, certain conversion ratio adjustments, and losses deferred due to wash sales.
The federal tax cost of investment securities and unrealized appreciation (depreciation) as of period end were as follows:
| Gross unrealized appreciation | $125,258 |
| Gross unrealized depreciation | (34,114) |
| Net unrealized appreciation (depreciation) on securities | $91,144 |
| Tax Cost | $455,134 |
The tax-based components of distributable earnings as of period end were as follows:
| Undistributed ordinary income | $6,575 |
| Undistributed long-term capital gain | $32,493 |
| Net unrealized appreciation (depreciation) on securities and other investments | $91,132 |
The tax character of distributions paid was as follows:
| November 30, 2015 | November 30, 2014 | |
| Ordinary Income | $10,140 | $ 1,555 |
| Long-term Capital Gains | 36,903 | 4,023 |
| Total | $47,043 | $ 5,578 |
Delayed Delivery Transactions and When-Issued Securities. During the period, the Fund transacted in securities on a delayed delivery or when-issued basis. Payment and delivery may take place after the customary settlement period for that security. The price of the underlying securities and the date when the securities will be delivered and paid for are fixed at the time the transaction is negotiated. The securities purchased on a delayed delivery or when-issued basis are identified as such in the Fund's Schedule of Investments. The Fund may receive compensation for interest forgone in the purchase of a delayed delivery or when-issued security. With respect to purchase commitments, the Fund identifies securities as segregated in its records with a value at least equal to the amount of the commitment. Losses may arise due to changes in the value of the underlying securities or if the counterparty does not perform under the contract's terms, or if the issuer does not issue the securities due to political, economic, or other factors.
Restricted Securities. The Fund may invest in securities that are subject to legal or contractual restrictions on resale. These securities generally may be resold in transactions exempt from registration or to the public if the securities are registered. Disposal of these securities may involve time-consuming negotiations and expense, and prompt sale at an acceptable price may be difficult. Information regarding restricted securities is included at the end of the Fund's Schedule of Investments.
4. Purchases and Sales of Investments.
Purchases and sales of securities, other than short-term securities, aggregated $202,351 and $257,454, respectively.
5. Fees and Other Transactions with Affiliates.
Management Fee. Fidelity Management & Research Company (the investment adviser) and its affiliates provide the Fund with investment management related services for which the Fund pays a monthly management fee. The management fee is the sum of an individual fund fee rate that is based on an annual rate of .20% of the Fund's average net assets and an annualized group fee rate that averaged .25% during the period. The group fee rate is based upon the average net assets of all the mutual funds advised by the investment adviser, including any mutual funds previously advised by the investment adviser that are currently advised by Fidelity SelectCo, LLC, an affiliate of the investment adviser. The group fee rate decreases as assets under management increase and increases as assets under management decrease. For the reporting period, the total annual management fee rate was .45% of the Fund's average net assets.
Distribution and Service Plan Fees. In accordance with Rule 12b-1 of the 1940 Act, the Fund has adopted separate Distribution and Service Plans for each class of shares. Certain classes pay Fidelity Distributors Corporation (FDC), an affiliate of the investment adviser, separate Distribution and Service Fees, each of which is based on an annual percentage of each class' average net assets. In addition, FDC may pay financial intermediaries for selling shares of the Fund and providing shareholder support services. For the period, the Distribution and Service Fee rates, total fees and amounts retained by FDC were as follows:
| Distribution Fee | Service Fee | Total Fees | Retained by FDC | |
| Class A | -% | .25% | $649 | $8 |
| Class T | .25% | .25% | 977 | 3 |
| Class B | .75% | .25% | 65 | 49 |
| Class C | .75% | .25% | 824 | 74 |
| $2,515 | $134 |
Sales Load. FDC may receive a front-end sales charge of up to 5.75% for selling Class A shares and 3.50% for selling Class T shares, some of which is paid to financial intermediaries for selling shares of the Fund. Depending on the holding period, FDC may receive contingent deferred sales charges levied on Class A, Class T, Class B, and Class C redemptions. The deferred sales charges range from 5.00% to 1.00% for Class B shares, 1.00% for Class C shares, 1.00% for certain purchases of Class A shares and .25% for certain purchases of Class T shares.
For the period, sales charge amounts retained by FDC were as follows:
| Retained by FDC | |
| Class A | $72 |
| Class T | 17 |
| Class B(a) | 2 |
| Class C(a) | 8 |
| $99 |
(a) When Class B and Class C shares are initially sold, FDC pays commissions from its own resources to financial intermediaries through which the sales are made.
Transfer Agent Fees. Fidelity Investments Institutional Operations Company, Inc., (FIIOC), an affiliate of the investment adviser, is the transfer, dividend disbursing and shareholder servicing agent for each class of the Fund. FIIOC receives account fees and asset-based fees that vary according to the account size and type of account of the shareholders of the respective classes of the Fund. FIIOC pays for typesetting, printing and mailing of shareholder reports, except proxy statements.
For the period, transfer agent fees for each class were as follows:
| Amount | % of Class-Level Average Net Assets | |
| Class A | $560 | .22 |
| Class T | 417 | .21 |
| Class B | 20 | .30 |
| Class C | 176 | .21 |
| Class I | 60 | .19 |
| $1,233 |
Accounting and Security Lending Fees. Fidelity Service Company, Inc. (FSC), an affiliate of the investment adviser, maintains the Fund's accounting records. The accounting fee is based on the level of average net assets for each month. Under a separate contract, FSC administers the security lending program. The security lending fee is based on the number and duration of lending transactions.
Brokerage Commissions. The Fund placed a portion of its portfolio transactions with brokerage firms which are affiliates of the investment adviser. Brokerage commissions are included in net realized gain (loss) and change in net unrealized appreciation (depreciation) in the Statement of Operations. The commissions paid to these affiliated firms were $4 for the period.
Interfund Lending Program. Pursuant to an Exemptive Order issued by the SEC, the Fund, along with other registered investment companies having management contracts with FMR or other affiliated entities of FMR, may participate in an interfund lending program. This program provides an alternative credit facility allowing the funds to borrow from, or lend money to, other participating affiliated funds. At period end, there were no interfund loans outstanding. The Fund's activity in this program during the period for which loans were outstanding was as follows:
| Borrower or Lender | Average Loan Balance | Weighted Average Interest Rate | Interest Expense |
| Borrower | $16,385 | .34% | $1 |
6. Committed Line of Credit.
The Fund participates with other funds managed by the investment adviser or an affiliate in a $4.25 billion credit facility (the "line of credit") to be utilized for temporary or emergency purposes to fund shareholder redemptions or for other short-term liquidity purposes. The Fund has agreed to pay commitment fees on its pro-rata portion of the line of credit, which amounted to $1 and is reflected in Miscellaneous expenses on the Statement of Operations. During the period, the Fund did not borrow on this line of credit.
7. Security Lending.
The Fund lends portfolio securities through a lending agent from time to time in order to earn additional income. For equity securities, a lending agent is used and may loan securities to certain qualified borrowers, including Fidelity Capital Markets (FCM), a broker-dealer affiliated with the Fund. On the settlement date of the loan, the Fund receives collateral (in the form of U.S. Treasury obligations, letters of credit and/or cash) against the loaned securities and maintains collateral in an amount not less than 100% of the market value of the loaned securities during the period of the loan. The market value of the loaned securities is determined at the close of business of the Fund and any additional required collateral is delivered to the Fund on the next business day. The Fund or borrower may terminate the loan at any time, and if the borrower defaults on its obligation to return the securities loaned because of insolvency or other reasons, the Fund may apply collateral received from the borrower against the obligation. The Fund may experience delays and costs in recovering the securities loaned. Any cash collateral received is invested in the Fidelity Securities Lending Cash Central Fund. The value of loaned securities and cash collateral at period end are disclosed on the Fund's Statement of Assets and Liabilities. At period end, there were no security loans outstanding with FCM. Security lending income represents the income earned on investing cash collateral, less rebates paid to borrowers and any lending agent fees associated with the loan, plus any premium payments received for lending certain types of securities. Security lending income is presented in the Statement of Operations as a component of income from Fidelity Central Funds. Total security lending income during the period amounted to $69, including $1 from securities loaned to FCM.
8. Expense Reductions.
Commissions paid to certain brokers with whom the investment adviser, or its affiliates, places trades on behalf of the Fund include an amount in addition to trade execution, which may be rebated back to the Fund to offset certain expenses. This amount totaled $10 for the period
In addition, during the period the investment adviser reimbursed and/or waived a portion of fund-level operating expenses in the amount of $2 and a portion of class-level operating expenses as follows:
| Amount | |
| Class A | $6 |
| Class T | 5 |
| Class B | –(a) |
| Class C | 2 |
| Class I | 3 |
| $16 |
(a) In the amount of less than five hundred dollars.
9. Distributions to Shareholders.
Distributions to shareholders of each class were as follows:
| Years ended November 30, | 2015 | 2014 |
| From net investment income | ||
| Class A | $3,464 | $1,111 |
| Class T | 2,191 | 444 |
| Class B | 27 | – |
| Class C | 567 | – |
| Class I | 429 | – |
| Total | $6,678 | $1,555 |
| From net realized gain | ||
| Class A | $18,027 | $1,766 |
| Class T | 14,122 | 1,470 |
| Class B | 575 | 82 |
| Class C | 5,855 | 550 |
| Class I | 1,786 | 155 |
| Total | $40,365 | $4,023 |
10. Share Transactions.
Share transactions for each class were as follows and may contain automatic conversions between classes or exchanges between funds:
| Shares | Shares | Dollars | Dollars | |
| Years ended November 30, | 2015 | 2014 | 2015 | 2014 |
| Class A | ||||
| Shares sold | 1,359 | 1,298 | $36,064 | $34,745 |
| Reinvestment of distributions | 778 | 102 | 19,973 | 2,583 |
| Shares redeemed | (2,428) | (1,724) | (64,761) | (46,421) |
| Net increase (decrease) | (291) | (324) | $(8,724) | $(9,093) |
| Class T | ||||
| Shares sold | 490 | 589 | $12,982 | $15,822 |
| Reinvestment of distributions | 618 | 73 | 15,887 | 1,855 |
| Shares redeemed | (1,760) | (1,477) | (46,877) | (39,516) |
| Net increase (decrease) | (652) | (815) | $(18,008) | $(21,839) |
| Class B | ||||
| Shares sold | 10 | 9 | $251 | $223 |
| Reinvestment of distributions | 23 | 3 | 570 | 76 |
| Shares redeemed | (153) | (174) | (3,905) | (4,437) |
| Net increase (decrease) | (120) | (162) | $(3,084) | $(4,138) |
| Class C | ||||
| Shares sold | 460 | 544 | $11,623 | $13,842 |
| Reinvestment of distributions | 231 | 19 | 5,657 | 475 |
| Shares redeemed | (620) | (478) | (15,418) | (12,168) |
| Net increase (decrease) | 71 | 85 | $1,862 | $2,149 |
| Class I | ||||
| Shares sold | 615 | 389 | $16,671 | $10,703 |
| Reinvestment of distributions | 71 | 5 | 1,846 | 137 |
| Shares redeemed | (272) | (375) | (7,178) | (10,044) |
| Net increase (decrease) | 414 | 19 | $11,339 | $796 |
11. Other.
The Fund's organizational documents provide former and current trustees and officers with a limited indemnification against liabilities arising in connection with the performance of their duties to the Fund. In the normal course of business, the Fund may also enter into contracts that provide general indemnifications. The Fund's maximum exposure under these arrangements is unknown as this would be dependent on future claims that may be made against the Fund. The risk of material loss from such claims is considered remote.
Report of Independent Registered Public Accounting Firm
To the Trustees of Fidelity Advisor Series I and Shareholders of Fidelity Advisor® Growth & Income Fund:
We have audited the accompanying statement of assets and liabilities of Fidelity Advisor® Growth & Income Fund (the Fund), a fund of Fidelity Advisor Series I, including the schedule of investments, as of November 30, 2015, and the related statement of operations for the year then ended, the statement of changes in net assets for each of the two years in the period then ended, and the financial highlights for each of the five years in the period then ended. These financial statements and financial highlights are the responsibility of the Fund's management. Our responsibility is to express an opinion on these financial statements and financial highlights based on our audits.
We conducted our audits in accordance with the standards of the Public Company Accounting Oversight Board (United States). Those standards require that we plan and perform the audit to obtain reasonable assurance about whether the financial statements and financial highlights are free of material misstatement. The Fund is not required to have, nor were we engaged to perform, an audit of its internal control over financial reporting. Our audits included consideration of internal control over financial reporting as a basis for designing audit procedures that are appropriate in the circumstances, but not for the purpose of expressing an opinion on the effectiveness of the Fund's internal control over financial reporting. Accordingly, we express no such opinion. An audit also includes examining, on a test basis, evidence supporting the amounts and disclosures in the financial statements, assessing the accounting principles used and significant estimates made by management, as well as evaluating the overall financial statement presentation. Our procedures included confirmation of securities owned as of November 30, 2015, by correspondence with the custodians and brokers; when replies were not received from brokers, we performed other auditing procedures. We believe that our audits provide a reasonable basis for our opinion.
In our opinion, such financial statements and financial highlights referred to above present fairly, in all material respects, the financial position of Fidelity Advisor® Growth & Income Fund as of November 30, 2015, the results of its operations for the year then ended, the changes in its net assets for each of the two years in the period then ended, and the financial highlights for each of the five years in the period then ended in conformity with accounting principles generally accepted in the United States of America.
DELOITTE & TOUCHE LLP
Boston, Massachusetts
January 14, 2016
Trustees and Officers
The Trustees, Members of the Advisory Board (if any), and officers of the trust and fund, as applicable, are listed below. The Board of Trustees governs the fund and is responsible for protecting the interests of shareholders. The Trustees are experienced executives who meet periodically throughout the year to oversee the fund's activities, review contractual arrangements with companies that provide services to the fund, oversee management of the risks associated with such activities and contractual arrangements, and review the fund's performance. Each of the Trustees oversees 170 funds.
The Trustees hold office without limit in time except that (a) any Trustee may resign; (b) any Trustee may be removed by written instrument, signed by at least two-thirds of the number of Trustees prior to such removal; (c) any Trustee who requests to be retired or who has become incapacitated by illness or injury may be retired by written instrument signed by a majority of the other Trustees; and (d) any Trustee may be removed at any special meeting of shareholders by a two-thirds vote of the outstanding voting securities of the trust. Each Trustee who is not an interested person (as defined in the 1940 Act) of the trust and the fund is referred to herein as an Independent Trustee. Each Independent Trustee shall retire not later than the last day of the calendar year in which his or her 75th birthday occurs. The Independent Trustees may waive this mandatory retirement age policy with respect to individual Trustees. Officers and Advisory Board Members hold office without limit in time, except that any officer or Advisory Board Member may resign or may be removed by a vote of a majority of the Trustees at any regular meeting or any special meeting of the Trustees. Except as indicated, each individual has held the office shown or other offices in the same company for the past five years.
The fund’s Statement of Additional Information (SAI) includes more information about the Trustees. To request a free copy, call Fidelity at 1-877-208-0098.
Experience, Skills, Attributes, and Qualifications of the Trustees. The Governance and Nominating Committee has adopted a statement of policy that describes the experience, qualifications, attributes, and skills that are necessary and desirable for potential Independent Trustee candidates (Statement of Policy). The Board believes that each Trustee satisfied at the time he or she was initially elected or appointed a Trustee, and continues to satisfy, the standards contemplated by the Statement of Policy. The Governance and Nominating Committee also engages professional search firms to help identify potential Independent Trustee candidates who have the experience, qualifications, attributes, and skills consistent with the Statement of Policy. From time to time, additional criteria based on the composition and skills of the current Independent Trustees, as well as experience or skills that may be appropriate in light of future changes to board composition, business conditions, and regulatory or other developments, have also been considered by the professional search firms and the Governance and Nominating Committee. In addition, the Board takes into account the Trustees' commitment and participation in Board and committee meetings, as well as their leadership of standing and ad hoc committees throughout their tenure.
In determining that a particular Trustee was and continues to be qualified to serve as a Trustee, the Board has considered a variety of criteria, none of which, in isolation, was controlling. The Board believes that, collectively, the Trustees have balanced and diverse experience, qualifications, attributes, and skills, which allow the Board to operate effectively in governing the fund and protecting the interests of shareholders. Information about the specific experience, skills, attributes, and qualifications of each Trustee, which in each case led to the Board's conclusion that the Trustee should serve (or continue to serve) as a trustee of the fund, is provided below.
Board Structure and Oversight Function. James C. Curvey is an interested person and currently serves as Chairman. The Trustees have determined that an interested Chairman is appropriate and benefits shareholders because an interested Chairman has a personal and professional stake in the quality and continuity of services provided to the fund. Independent Trustees exercise their informed business judgment to appoint an individual of their choosing to serve as Chairman, regardless of whether the Trustee happens to be independent or a member of management. The Independent Trustees have determined that they can act independently and effectively without having an Independent Trustee serve as Chairman and that a key structural component for assuring that they are in a position to do so is for the Independent Trustees to constitute a substantial majority for the Board. The Independent Trustees also regularly meet in executive session. Ned C. Lautenbach serves as Chairman of the Independent Trustees and as such (i) acts as a liaison between the Independent Trustees and management with respect to matters important to the Independent Trustees and (ii) with management prepares agendas for Board meetings.
Fidelity® funds are overseen by different Boards of Trustees. The fund's Board oversees Fidelity's high income and certain equity funds, and other Boards oversee Fidelity's investment-grade bond, money market, asset allocation, and sector funds. The asset allocation funds may invest in Fidelity® funds overseen by the fund's Board. The use of separate Boards, each with its own committee structure, allows the Trustees of each group of Fidelity® funds to focus on the unique issues of the funds they oversee, including common research, investment, and operational issues. On occasion, the separate Boards establish joint committees to address issues of overlapping consequences for the Fidelity® funds overseen by each Board.
The Trustees operate using a system of committees to facilitate the timely and efficient consideration of all matters of importance to the Trustees, the fund, and fund shareholders and to facilitate compliance with legal and regulatory requirements and oversight of the fund's activities and associated risks. The Board, acting through its committees, has charged FMR and its affiliates with (i) identifying events or circumstances the occurrence of which could have demonstrably adverse effects on the fund's business and/or reputation; (ii) implementing processes and controls to lessen the possibility that such events or circumstances occur or to mitigate the effects of such events or circumstances if they do occur; and (iii) creating and maintaining a system designed to evaluate continuously business and market conditions in order to facilitate the identification and implementation processes described in (i) and (ii) above. Because the day-to-day operations and activities of the fund are carried out by or through FMR, its affiliates, and other service providers, the fund's exposure to risks is mitigated but not eliminated by the processes overseen by the Trustees. While each of the Board's committees has responsibility for overseeing different aspects of the fund's activities, oversight is exercised primarily through the Operations, Audit, and Compliance Committees. In addition, the Independent Trustees have worked with FMR to enhance the Board's oversight of investment and financial risks, legal and regulatory risks, technology risks, and operational risks, including the development of additional risk reporting to the Board. For example, a working group comprised of Independent Trustees and FMR has worked and continues to work to review the Fidelity® funds' valuation-related activities, reporting and risk management. Appropriate personnel, including but not limited to the fund's Chief Compliance Officer (CCO), FMR's internal auditor, the independent accountants, the fund's Treasurer and portfolio management personnel, make periodic reports to the Board's committees, as appropriate, including an annual review of Fidelity's risk management program for the Fidelity® funds. The responsibilities of each standing committee, including their oversight responsibilities, are described further under "Standing Committees of the Trustees."
Interested Trustees*:
Correspondence intended for a Trustee who is an interested person may be sent to Fidelity Investments, 245 Summer Street, Boston, Massachusetts 02210.
Name, Year of Birth; Principal Occupations and Other Relevant Experience+
James C. Curvey (1935)
Year of Election or Appointment: 2007
Trustee
Chairman of the Board of Trustees
Mr. Curvey also serves as Trustee of other Fidelity® funds. Mr. Curvey is a Director of Fidelity Research & Analysis Co. (investment adviser firm, 2009-present), and Vice Chairman (2007-present) and Director of FMR LLC (diversified financial services company). In addition, Mr. Curvey serves as an Overseer for the Boston Symphony Orchestra and a member of the board of Artis-Naples, Naples, Florida, and as a Trustee for Brewster Academy, Wolfeboro, New Hampshire. Previously, Mr. Curvey served as a Director of Fidelity Investments Money Management, Inc. (investment adviser firm, 2009-2014) and a Director of FMR and FMR Co., Inc. (investment adviser firms, 2007-2014).
Charles S. Morrison (1960)
Year of Election or Appointment: 2014
Trustee
Mr. Morrison also serves as Trustee of other funds. He serves as a Director of Fidelity Investments Money Management, Inc. (FIMM) (investment adviser firm, 2014-present), Director of Fidelity SelectCo, LLC (investment adviser firm, 2014-present), President, Asset Management (2014-present), and is an employee of Fidelity Investments. Previously, Mr. Morrison served as Vice President of Fidelity's Fixed Income and Asset Allocation Funds (2012-2014), President, Fixed Income (2011-2014), Vice President of Fidelity's Money Market Funds (2005-2009), President, Money Market Group Leader of FMR (investment adviser firm, 2009), and Senior Vice President, Money Market Group of FMR (2004-2009). Mr. Morrison also served as Vice President of Fidelity's Bond Funds (2002-2005), certain Balanced Funds (2002-2005), and certain Asset Allocation Funds (2002-2007), and as Senior Vice President (2002-2005) of Fidelity's Bond Division.
* Determined to be an “Interested Trustee” by virtue of, among other things, his or her affiliation with the trust or various entities under common control with FMR.
+ The information includes the Trustee's principal occupation during the last five years and other information relating to the experience, attributes, and skills relevant to the Trustee's qualifications to serve as a Trustee, which led to the conclusion that the Trustee should serve as a Trustee for the fund.
Independent Trustees:
Correspondence intended for an Independent Trustee may be sent to Fidelity Investments, P.O. Box 55235, Boston, Massachusetts 02205-5235.
Name, Year of Birth; Principal Occupations and Other Relevant Experience+
Dennis J. Dirks (1948)
Year of Election or Appointment: 2005
Trustee
Mr. Dirks also serves as Trustee of other Fidelity® funds. Prior to his retirement in May 2003, Mr. Dirks was Chief Operating Officer and a member of the Board of The Depository Trust & Clearing Corporation (DTCC). He also served as President, Chief Operating Officer, and Board member of The Depository Trust Company (DTC) and President and Board member of the National Securities Clearing Corporation (NSCC). In addition, Mr. Dirks served as Chief Executive Officer and Board member of the Government Securities Clearing Corporation, Chief Executive Officer and Board member of the Mortgage-Backed Securities Clearing Corporation, as a Trustee and a member of the Finance Committee of Manhattan College (2005-2008), as a Trustee and a member of the Finance Committee of AHRC of Nassau County (2006-2008), and as a member of the Independent Directors Council (IDC) Governing Council (2010-2015). Mr. Dirks is a member of the Board of Directors for The Brookville Center for Children's Services, Inc. (2009-present).
Alan J. Lacy (1953)
Year of Election or Appointment: 2008
Trustee
Mr. Lacy also serves as Trustee of other Fidelity® funds. Mr. Lacy serves as a member of the Board of Directors of Dave & Buster's Entertainment, Inc. (restaurant and entertainment complexes, 2010-present) and Bristol-Myers Squibb Company (global pharmaceuticals, 2008-present). In addition, Mr. Lacy served as Senior Adviser (2007-2014) of Oak Hill Capital Partners, L.P. (private equity) and also served as Chief Executive Officer (2000-2005) and Vice Chairman (2005-2006) of Sears Holdings Corporation and Sears, Roebuck and Co. (retail). Mr. Lacy is a member of the Board of Trustees of The National Parks Conservation Association (2006-present). Previously, Mr. Lacy served as Chairman of the Board of Trustees of the National Parks Conservation Association (2008-2011) and as a member of the Board of Directors for The Western Union Company (global money transfer, 2006-2011), The Hillman Companies, Inc. (hardware wholesalers, 2010-2014), and Earth Fare, Inc. (retail grocery, 2010-2014).
Ned C. Lautenbach (1944)
Year of Election or Appointment: 2000
Trustee
Chairman of the Independent Trustees
Mr. Lautenbach also serves as Trustee of other Fidelity® funds. Mr. Lautenbach currently serves as the Lead Director of the Eaton Corporation Board of Directors (diversified industrial, 1997-present). Mr. Lautenbach is Chairman of the Board of Directors of Artis-Naples in Naples, Florida (2012-present), a member of the Council on Foreign Relations (1994-present), and a member of the Board of Governors, State University System of Florida (2013-present). Previously, Mr. Lautenbach was a Partner/Advisory Partner at Clayton, Dubilier & Rice, LLC (private equity investment, 1998-2010), as well as a Director of Sony Corporation (2006-2007).
Joseph Mauriello (1944)
Year of Election or Appointment: 2008
Trustee
Mr. Mauriello also serves as Trustee of other Fidelity® funds. Prior to his retirement in January 2006, Mr. Mauriello served in numerous senior management positions including Deputy Chairman and Chief Operating Officer (2004-2005), and Vice Chairman of Financial Services (2002-2004) of KPMG LLP US (professional services, 1965-2005). Mr. Mauriello currently serves as a member of the Board of Directors of XL Group plc. (global insurance and re-insurance, 2006-present) and the Independent Directors Council (IDC) Governing Council (2015-present). Previously, Mr. Mauriello served as a Director of the Hamilton Funds of the Bank of New York (2006-2007) and of Arcadia Resources Inc. (health care services and products, 2007-2012).
Robert W. Selander (1950)
Year of Election or Appointment: 2011
Trustee
Mr. Selander also serves as Trustee of other Fidelity® funds. Mr. Selander serves as a Director of The Western Union Company (global money transfer, 2014-present). Previously, Mr. Selander served as a Member of the Advisory Board of other Fidelity® funds (2011), and Executive Vice Chairman (2010), Chief Executive Officer (2009-2010), and President and Chief Executive Officer (1997-2009) of Mastercard, Inc.
Cornelia M. Small (1944)
Year of Election or Appointment: 2005
Trustee
Ms. Small also serves as Trustee of other Fidelity® funds. Ms. Small is a member of the Board of Directors (2009-present) and Chair of the Investment Committee (2010-present) of the Teagle Foundation. Ms. Small also serves on the Investment Committee of the Berkshire Taconic Community Foundation (2008-present). Previously, Ms. Small served as Chairperson (2002-2008) and a member of the Investment Committee and Chairperson (2008-2012) and a member of the Board of Trustees of Smith College. In addition, Ms. Small served as Chief Investment Officer, Director of Global Equity Investments, and a member of the Board of Directors of Scudder, Stevens & Clark and Scudder Kemper Investments.
William S. Stavropoulos (1939)
Year of Election or Appointment: 2002
Trustee
Vice Chairman of the Independent Trustees
Mr. Stavropoulos also serves as Trustee of other Fidelity® funds. Mr. Stavropoulos serves as President and Founder of the Michigan Baseball Foundation, the Great Lakes Loons (2007-present). Mr. Stavropoulos is Chairman Emeritus of the Board of Directors of The Dow Chemical Company, where he previously served in numerous senior management positions, including President, CEO (1995-2000; 2002-2004), Chairman of the Executive Committee (2000-2006), and as a member of the Board of Directors (1990-2006). Currently, Mr. Stavropoulos is Chairman of the Board of Directors of Univar Inc. (global distributor of commodity and specialty chemicals), a Director of Teradata Corporation (data warehousing and technology solutions), and Maersk Inc. (industrial conglomerate), and a member of the Advisory Board for Metalmark Capital LLC (private equity investment, 2005-present). Mr. Stavropoulos is an operating advisor to Clayton, Dubilier & Rice, LLC (private equity investment). In addition, Mr. Stavropoulos is a member of the University of Notre Dame Advisory Council for the College of Science, a Trustee of the Rollin L. Gerstacker Foundation, and a Director of the Naples Philharmonic Center for the Arts. Previously, Mr. Stavropoulos served as a Director of Chemical Financial Corporation (bank holding company, 1993-2012) and Tyco International, Ltd. (multinational manufacturing and services, 2007-2012).
David M. Thomas (1949)
Year of Election or Appointment: 2008
Trustee
Mr. Thomas also serves as Trustee of other Fidelity® funds. Mr. Thomas serves as Non-Executive Chairman of the Board of Directors of Fortune Brands Home and Security (home and security products, 2011-present), as a member of the Board of Directors (2004-present) and Presiding Director (2013-present) of Interpublic Group of Companies, Inc. (marketing communication), and as a member of the Board of Trustees of the University of Florida (2013-present). Previously, Mr. Thomas served as Executive Chairman (2005-2006) and Chairman and Chief Executive Officer (2000-2005) of IMS Health, Inc. (pharmaceutical and healthcare information solutions), and a Director of Fortune Brands, Inc. (consumer products, 2000-2011).
+ The information includes the Trustee's principal occupation during the last five years and other information relating to the experience, attributes, and skills relevant to the Trustee's qualifications to serve as a Trustee, which led to the conclusion that the Trustee should serve as a Trustee for the fund.
Advisory Board Members and Officers:
Correspondence intended for an officer or Peter S. Lynch may be sent to Fidelity Investments, 245 Summer Street, Boston, Massachusetts 02210. Officers appear below in alphabetical order.
Name, Year of Birth; Principal Occupation
Peter S. Lynch (1944)
Year of Election or Appointment: 2003
Member of the Advisory Board
Mr. Lynch also serves as Member of the Advisory Board of other Fidelity® funds. Mr. Lynch is Vice Chairman and a Director of FMR (investment adviser firm) and FMR Co., Inc. (investment adviser firm). In addition, Mr. Lynch serves as a Trustee of Boston College and as the Chairman of the Inner-City Scholarship Fund. Previously, Mr. Lynch served on the Special Olympics International Board of Directors (1997-2006).
Elizabeth Paige Baumann (1968)
Year of Election or Appointment: 2012
Anti-Money Laundering (AML) Officer
Ms. Baumann also serves as AML Officer of other funds. She is Chief AML Officer of FMR LLC (diversified financial services company, 2012-present) and is an employee of Fidelity Investments. Previously, Ms. Baumann served as Vice President and Deputy Anti-Money Laundering Officer (2007-2012).
Marc R. Bryant (1966)
Year of Election or Appointment: 2015
Secretary and Chief Legal Officer (CLO)
Mr. Bryant also serves as Secretary and CLO of other funds. Mr. Bryant serves as CLO, Secretary, and Senior Vice President of Fidelity Management & Research Company (investment adviser firm, 2015-present) and FMR Co., Inc. (investment adviser firm, 2015-present); Secretary of Fidelity SelectCo, LLC (investment adviser firm, 2015-present) and Fidelity Investments Money Management, Inc. (investment adviser firm, 2015-present); and CLO of Fidelity Management & Research (Hong Kong) Limited (investment adviser firm, 2015-present). He is Senior Vice President and Deputy General Counsel of FMR LLC (diversified financial services company). Previously, Mr. Bryant served as Secretary and CLO of Fidelity Rutland Square Trust II (2010-2014) and Assistant Secretary of Fidelity's Fixed Income and Asset Allocation Funds (2013-2015). Prior to joining Fidelity Investments, Mr. Bryant served as a Senior Vice President and the Head of Global Retail Legal for AllianceBernstein L.P. (2006-2010), and as the General Counsel for ProFund Advisors LLC (2001-2006).
William C. Coffey (1969)
Year of Election or Appointment: 2009
Assistant Secretary
Mr. Coffey also serves as Assistant Secretary of other funds. He is Senior Vice President and Deputy General Counsel of FMR LLC (diversified financial services company, 2010-present), and is an employee of Fidelity Investments. Previously, Mr. Coffey served as Vice President and Associate General Counsel of FMR LLC (2005-2009).
Jonathan Davis (1968)
Year of Election or Appointment: 2010
Assistant Treasurer
Mr. Davis also serves as Assistant Treasurer of other funds, and is an employee of Fidelity Investments. Previously, Mr. Davis served as Vice President and Associate General Counsel of FMR LLC (diversified financial services company, 2003-2010).
Adrien E. Deberghes (1967)
Year of Election or Appointment: 2008
Deputy Treasurer
Mr. Deberghes also serves as an officer of other funds. He is an employee of Fidelity Investments (2008-present). Prior to joining Fidelity Investments, Mr. Deberghes was Senior Vice President of Mutual Fund Administration at State Street Corporation (2007-2008), Senior Director of Mutual Fund Administration at Investors Bank & Trust (2005-2007), and Director of Finance for Dunkin' Brands (2000-2005).
Stephanie J. Dorsey (1969)
Year of Election or Appointment: 2010
Assistant Treasurer
Ms. Dorsey also serves as an officer of other funds. She is an employee of Fidelity Investments (2008-present) and has served in other fund officer roles. Prior to joining Fidelity Investments, Ms. Dorsey served as Treasurer (2004-2008) of the JPMorgan Mutual Funds and Vice President (2004-2008) of JPMorgan Chase Bank.
Howard J. Galligan III (1966)
Year of Election or Appointment: 2014
Chief Financial Officer
Mr. Galligan also serves as Chief Financial Officer of other funds. Mr. Galligan serves as President of Fidelity Pricing and Cash Management Services (FPCMS) (2014-present) and as a Director of Strategic Advisers, Inc. (investment adviser firm, 2008-present). Previously, Mr. Galligan served as Chief Administrative Officer of Asset Management (2011-2014) and Chief Operating Officer and Senior Vice President of Investment Support for Strategic Advisers, Inc. (2003-2011).
Scott C. Goebel (1968)
Year of Election or Appointment: 2015
Vice President
Mr. Goebel serves as Vice President of other funds and is an employee of Fidelity Investments (2001-present). Previously, Mr. Goebel served as Secretary of Fidelity SelectCo, LLC (investment adviser firm, 2013-2015), Fidelity Investments Money Management, Inc. (FIMM) (investment adviser firm, 2010-2015), and Fidelity Research and Analysis Company (FRAC) (investment adviser firm, 2010-2015); General Counsel, Secretary, and Senior Vice President of Fidelity Management & Research Company (investment adviser firm, 2008-2015) and FMR Co., Inc. (investment adviser firm, 2008-2015); Assistant Secretary of Fidelity Management & Research (Japan) Limited (investment adviser firm, 2008-2015) and FMR Investment Management (U.K.) Limited (investment adviser firm, 2008-2015); Chief Legal Officer (CLO) of Fidelity Management & Research (Hong Kong) Limited (investment adviser firm, 2008-2015); Secretary and CLO of certain Fidelity® funds (2008-2015); Assistant Secretary of FIMM (2008-2010), FRAC (2008-2010), and certain funds (2007-2008); and as Vice President and Secretary of Fidelity Distributors Corporation (FDC) (2005-2007).
Brian B. Hogan (1964)
Year of Election or Appointment: 2009
Vice President
Mr. Hogan also serves as Trustee or Vice President of other funds. Mr. Hogan serves as a Director of Fidelity SelectCo, LLC (investment adviser firm, 2014-present) and President of the Equity Division of FMR (investment adviser firm, 2009-present). Previously, Mr. Hogan served as Senior Vice President, Equity Research of FMR (2006-2009) and as a portfolio manager.
Chris Maher (1972)
Year of Election or Appointment: 2013
Assistant Treasurer
Mr. Maher serves as Assistant Treasurer of other funds. Mr. Maher is Vice President of Valuation Oversight and is an employee of Fidelity Investments. Previously, Mr. Maher served as Vice President of Asset Management Compliance (2013), Vice President of the Program Management Group of FMR (investment adviser firm, 2010-2013), and Vice President of Valuation Oversight (2008-2010).
Kenneth B. Robins (1969)
Year of Election or Appointment: 2008
President and Treasurer
Mr. Robins also serves as an officer of other funds. Mr. Robins serves as Executive Vice President of Fidelity Investments Money Management, Inc. (FIMM) (investment adviser firm, 2013-present) and is an employee of Fidelity Investments (2004-present). Previously, Mr. Robins served in other fund officer roles.
Stacie M. Smith (1974)
Year of Election or Appointment: 2013
Deputy Treasurer
Ms. Smith also serves as an officer of other funds. She is an employee of Fidelity Investments (2009-present) and has served in other fund officer roles. Prior to joining Fidelity Investments, Ms. Smith served as Senior Audit Manager of Ernst & Young LLP (1996-2009).
Renee Stagnone (1975)
Year of Election or Appointment: 2013
Deputy Treasurer
Ms. Stagnone also serves as Deputy Treasurer of other funds. Ms. Stagnone is an employee of Fidelity Investments (1997-present).
Linda J. Wondrack (1964)
Year of Election or Appointment: 2014
Chief Compliance Officer
Ms. Wondrack also serves as Chief Compliance Officer of other funds. Ms. Wondrack is Executive Vice President and head of the Ethics Office and Asset Management Compliance for Fidelity Investments (2012-present). Ms. Wondrack also serves as Chief Compliance Officer of Fidelity SelectCo, LLC (investment adviser firm, 2014-present); Chief Compliance Officer of Impresa Management LLC (2013-present); and Chief Compliance Officer of FMR Co., Inc. (investment adviser firm), Fidelity Investments Money Management, Inc. (investment adviser firm), Fidelity Management & Research (Japan) Limited (investment adviser firm), FMR Investment Management (U.K.) Limited (investment adviser firm), Fidelity Management & Research (Hong Kong) (investment adviser firm), Fidelity Management & Research Company (investment adviser firm), FIAM LLC (investment adviser firm), and Strategic Advisers, Inc. (investment adviser firm), Ballyrock Investment Advisors LLC, and Northern Neck Investors LLC (2012-present). Previously, Ms. Wondrack served as Senior Vice President and Chief Compliance Officer for Columbia Management Investment Advisers, LLC (2005-2012); Chief Compliance Officer for certain funds within the Columbia Family of Funds (2007-2012); and Senior Vice President of Compliance Risk Management at Bank of America (2005-2010).
Joseph F. Zambello (1957)
Year of Election or Appointment: 2011
Deputy Treasurer
Mr. Zambello also serves as Deputy Treasurer of other funds. Mr. Zambello is an employee of Fidelity Investments (1991-present). Previously, Mr. Zambello served as Vice President of the Program Management Group of FMR (investment adviser firm, 2009-2011) and Vice President of the Transfer Agent Oversight Group (2005-2009).
Shareholder Expense Example
As a shareholder of the Fund, you incur two types of costs: (1) transaction costs[[,]] including sales charges (loads) on purchase payments or redemption proceeds, and (2) ongoing costs, including management fees, distribution and/or service (12b-1) fees and other Fund expenses. This Example is intended to help you understand your ongoing costs (in dollars) of investing in the Fund and to compare these costs with the ongoing costs of investing in other mutual funds.
The Example is based on an investment of $1,000 invested at the beginning of the period and held for the entire period (June 1, 2015 to November 30, 2015).
Actual Expenses
The first line of the accompanying table for each class of the Fund provides information about actual account values and actual expenses. You may use the information in this line, together with the amount you invested, to estimate the expenses that you paid over the period. Simply divide your account value by $1,000.00 (for example, an $8,600 account value divided by $1,000.00 = 8.6), then multiply the result by the number in the first line for a class of the Fund under the heading entitled "Expenses Paid During Period" to estimate the expenses you paid on your account during this period. In addition, the Fund, as a shareholder in the underlying Fidelity Central Funds, will indirectly bear its pro-rata share of the fees and expenses incurred by the underlying Fidelity Central Funds. These fees and expenses are not included in the Fund's annualized expense ratio used to calculate the expense estimate in the table below.
Hypothetical Example for Comparison Purposes
The second line of the accompanying table for each class of the Fund provides information about hypothetical account values and hypothetical expenses based on a Class' actual expense ratio and an assumed rate of return of 5% per year before expenses, which is not the Class' actual return. The hypothetical account values and expenses may not be used to estimate the actual ending account balance or expenses you paid for the period. You may use this information to compare the ongoing costs of investing in the Fund and other funds. To do so, compare this 5% hypothetical example with the 5% hypothetical examples that appear in the shareholder reports of the other funds. In addition, the Fund, as a shareholder in the underlying Fidelity Central Funds, will indirectly bear its pro-rata share of the fees and expenses incurred by the underlying Fidelity Central Funds. These fees and expenses are not included in the Fund's annualized expense ratio used to calculate the expense estimate in the table below.
Please note that the expenses shown in the table are meant to highlight your ongoing costs only and do not reflect any transaction costs. Therefore, the second line of the table is useful in comparing ongoing costs only, and will not help you determine the relative total costs of owning different funds. In addition, if these transactional costs were included, your costs would have been higher.
| Annualized Expense Ratio-A | Beginning Account Value June 1, 2015 | Ending Account Value November 30, 2015 | Expenses Paid During Period-B June 1, 2015 to November 30, 2015 | |
| Class A | .98% | |||
| Actual | $1,000.00 | $965.20 | $4.83 | |
| Hypothetical-C | $1,000.00 | $1,020.16 | $4.96 | |
| Class T | 1.23% | |||
| Actual | $1,000.00 | $963.70 | $6.05 | |
| Hypothetical-C | $1,000.00 | $1,018.90 | $6.23 | |
| Class B | 1.81% | |||
| Actual | $1,000.00 | $960.90 | $8.90 | |
| Hypothetical-C | $1,000.00 | $1,015.99 | $9.15 | |
| Class C | 1.73% | |||
| Actual | $1,000.00 | $961.40 | $8.51 | |
| Hypothetical-C | $1,000.00 | $1,016.39 | $8.74 | |
| Class I | .70% | |||
| Actual | $1,000.00 | $966.50 | $3.45 | |
| Hypothetical-C | $1,000.00 | $1,021.56 | $3.55 |
A Annualized expense ratio reflects expenses net of applicable fee waivers.
B Expenses are equal to each Class' annualized expense ratio, multiplied by the average account value over the period, multiplied by 183/365 (to reflect the one-half year period).
C 5% return per year before expenses
Distributions (Unaudited)
The Board of Trustees of Fidelity Advisor Growth & Income Fund voted to pay to shareholders of record at the opening of business on record date, the following distributions per share derived from capital gains realized from sales of portfolio securities, and dividends derived from net investment income:
| Pay Date | Record Date | Dividends | Capital Gains | |
| Class I | 12/14/15 | 12/11/15 | $0.478 | $1.490 |
| 01/11/16 | 01/08/16 | $0.000 | $0.075 | |
The fund hereby designates as a capital gain dividend with respect to the taxable year ended November 30, 2015, $33,156,935, or, if subsequently determined to be different, the net capital gain of such year.
Class I designates 100% of the dividends distributed during the fiscal year as qualifying for the dividends-received deduction for corporate shareholders.
Class I designates 100% of dividends distributed during the fiscal year as amounts which may be taken into account as a dividend for purposes of the maximum rate under section 1(h)(11) of the Internal Revenue Code.
The fund will notify shareholders in January 2016 of amounts for use in preparing 2015 income tax returns.
Board Approval of Investment Advisory Contracts and Management Fees
Fidelity Advisor Growth & Income Fund
Each year, the Board of Trustees, including the Independent Trustees (together, the Board), votes on the renewal of the management contract with Fidelity Management & Research Company (FMR) and the sub-advisory agreements (together, the Advisory Contracts) for the fund. The Board, assisted by the advice of fund counsel and Independent Trustees' counsel, requests and considers a broad range of information relevant to the renewal of the Advisory Contracts throughout the year.
The Board meets regularly and, at each of its meetings, covers an extensive agenda of topics and materials and considers factors that are relevant to its annual consideration of the renewal of the fund's Advisory Contracts, including the services and support provided to the fund and its shareholders. The Board has established various standing committees (Committees), each composed of and chaired by Independent Trustees with varying backgrounds, to which the Board has assigned specific subject matter responsibilities in order to enhance effective decision-making by the Board. The Board, acting directly and through its Committees, requests and receives information concerning the annual consideration of the renewal of the fund's Advisory Contracts. The Board also meets as needed to consider matters specifically related to the Board's annual consideration of the renewal of the Advisory Contracts. Members of the Board may also meet with trustees of other Fidelity funds through ad hoc joint committees to discuss certain matters relevant to all of the Fidelity funds.
At its July 2015 meeting, the Board unanimously determined to renew the fund's Advisory Contracts. In reaching its determination, the Board considered all factors it believed relevant, including (i) the nature, extent, and quality of the services to be provided to the fund and its shareholders (including the investment performance of the fund); (ii) the competitiveness of the fund's management fee and total expense ratio relative to peer funds; (iii) the total costs of the services to be provided by and the profits to be realized by Fidelity from its relationship with the fund; and (iv) the extent to which (if any) economies of scale exist and would be realized as the fund grows, and whether any economies of scale are appropriately shared with fund shareholders.
In considering whether to renew the Advisory Contracts for the fund, the Board reached a determination, with the assistance of fund counsel and Independent Trustees' counsel and through the exercise of its business judgment, that the renewal of the Advisory Contracts was in the best interests of the fund and its shareholders and that the compensation payable under the Advisory Contracts was fair and reasonable. The Board's decision to renew the Advisory Contracts was not based on any single factor, but rather was based on a comprehensive consideration of all the information provided to the Board at its meetings throughout the year. The Board, in reaching its determination to renew the Advisory Contracts, was aware that shareholders of the fund have a broad range of investment choices available to them, including a wide choice among funds offered by Fidelity's competitors, and that the fund's shareholders, who have the opportunity to review and weigh the disclosure provided by the fund in its prospectus and other public disclosures, have chosen to invest in this fund, which is part of the Fidelity family of funds.
Nature, Extent, and Quality of Services Provided. The Board considered Fidelity's staffing as it relates to the fund, including the backgrounds of investment personnel of Fidelity, and also considered the fund's investment objective, strategies, and related investment philosophy. The Independent Trustees also had discussions with senior management of Fidelity's investment operations and investment groups. The Board considered the structure of the portfolio manager compensation program and whether this structure provides appropriate incentives to act in the best interests of the fund. Additionally, the Board considered the portfolio managers' investments, if any, in the funds that they manage.Resources Dedicated to Investment Management and Support Services. The Board and the Fund Oversight and Research Committees reviewed the general qualifications and capabilities of Fidelity's investment staff, including its size, education, experience, and resources, as well as Fidelity's approach to recruiting, training, managing, and compensating investment personnel. The Board noted that Fidelity has continued to increase the resources devoted to non-U.S. offices, including expansion of Fidelity's global investment organization. The Board also noted that Fidelity's analysts have extensive resources, tools and capabilities that allow them to conduct sophisticated quantitative and fundamental analysis, as well as credit analysis of issuers, counterparties and guarantors. Further, the Board considered that Fidelity's investment professionals have sufficient access to global information and data so as to provide competitive investment results over time, and that those professionals also have access to sophisticated tools that permit them to assess portfolio construction and risk and performance attribution characteristics continuously, as well as to transmit new information and research conclusions rapidly around the world. Additionally, in its deliberations, the Board considered Fidelity's trading, risk management, and compliance capabilities and resources, which are integral parts of the investment management process.Shareholder and Administrative Services. The Board considered (i) the nature, extent, quality, and cost of advisory, administrative, and shareholder services performed by FMR, the sub-advisers (together with FMR, the Investment Advisers), and their affiliates under the Advisory Contracts and under separate agreements covering transfer agency, pricing and bookkeeping, and securities lending services for the fund; (ii) the nature and extent of the supervision of third party service providers, principally custodians and subcustodians; and (iii) the resources devoted to, and the record of compliance with, the fund's compliance policies and procedures. The Board also reviewed the allocation of fund brokerage, including allocations to brokers affiliated with the Investment Advisers, the use of brokerage commissions to pay fund expenses, and the use of "soft" commission dollars to pay for research services.The Board noted that the growth of fund assets over time across the complex allows Fidelity to reinvest in the development of services designed to enhance the value or convenience of the Fidelity funds as investment vehicles. These services include 24-hour access to account information and market information through telephone representatives and over the Internet, investor education materials and asset allocation tools, and the expanded availability of Fidelity Investor Centers.In 2014, the Board formed an ad hoc Committee on Transfer Agency Fees to review the variety of transfer agency fee structures throughout the industry and Fidelity's competitive positioning with respect to industry participants.Investment in a Large Fund Family. The Board considered the benefits to shareholders of investing in a Fidelity fund, including the benefits of investing in a fund that is part of a large family of funds offering a variety of investment disciplines and providing a large variety of mutual fund investor services. The Board noted that Fidelity had taken, or had made recommendations that resulted in the Fidelity funds taking, a number of actions over the previous year that benefited particular funds, including (i) continuing to dedicate additional resources to investment research and to the support of the senior management team that oversees asset management; (ii) continuing efforts to enhance Fidelity's global research capabilities; (iii) launching new funds and making other enhancements to meet client needs; (iv) reducing management fees and total expenses for certain index funds and diversified international funds; (v) continuing to launch dedicated lower cost underlying funds to meet portfolio construction needs related to expanding underlying fund options for Fidelity funds of funds, specifically for the Freedom Fund product lines; (vi) rationalizing product lines and gaining increased efficiencies through fund mergers; (vii) launching active fixed-income exchange-traded funds; (viii) continuing to develop, acquire and implement systems and technology to improve services to the funds and information security and to increase efficiency; (ix) implementing investment enhancements to further strengthen Fidelity's target date product line to increase investors' probability of success in achieving their goals; (x) modifying the eligibility criteria for certain share classes to accommodate roll-over assets from employer-sponsored retirement plans; (xi) launching a new Class W of the Freedom Index Funds to attract and retain Fidelity record-kept retirement plan assets; and (xii) implementing changes to Fidelity's money market product line in response to recent money market regulatory reforms.Investment Performance. The Board considered whether the fund has operated in accordance with its investment objective, as well as its record of compliance with its investment restrictions and its performance history.The Board took into account discussions with representatives of the Investment Advisers about fund investment performance that occur at Board meetings throughout the year. In this regard the Board noted that as part of regularly scheduled fund reviews and other reports to the Board on fund performance, the Board considers annualized return information for the fund, for different time periods, measured against a securities market index ("benchmark index") and a peer group of funds with similar objectives ("peer group"), if any. In its evaluation of fund investment performance, the Board gave particular attention to information indicating changes in performance of certain Fidelity funds for specific time periods and discussed with the Investment Advisers the reasons for any overperformance or underperformance.In addition to reviewing absolute and relative fund performance, the Independent Trustees periodically consider the appropriateness of fund performance metrics in evaluating the results achieved. In general, the Independent Trustees believe that fund performance should be evaluated based on net performance (after fees and expenses) of both the highest performing and lowest performing fund share classes, where applicable, compared to appropriate benchmark indices, over appropriate time periods that may include full market cycles, and compared to peer groups, as applicable, over the same periods, taking into account relevant factors including the following: general market conditions; issuer-specific information; and fund cash flows and other factors.The Independent Trustees recognize that shareholders evaluate performance on a net basis over their own holding periods, for which one-, three-, and five-year periods are often used as a proxy. For this reason, the performance information reviewed by the Board also included net cumulative calendar year total return information for the fund and an appropriate benchmark index and peer group for the most recent one-, three-, and five-year periods, as shown below. Returns are shown compared to the 25th percentile (top of box, 75% beaten) and 75th percentile (bottom of box, 25% beaten) of the peer universe.Fidelity Advisor Growth & Income Fund
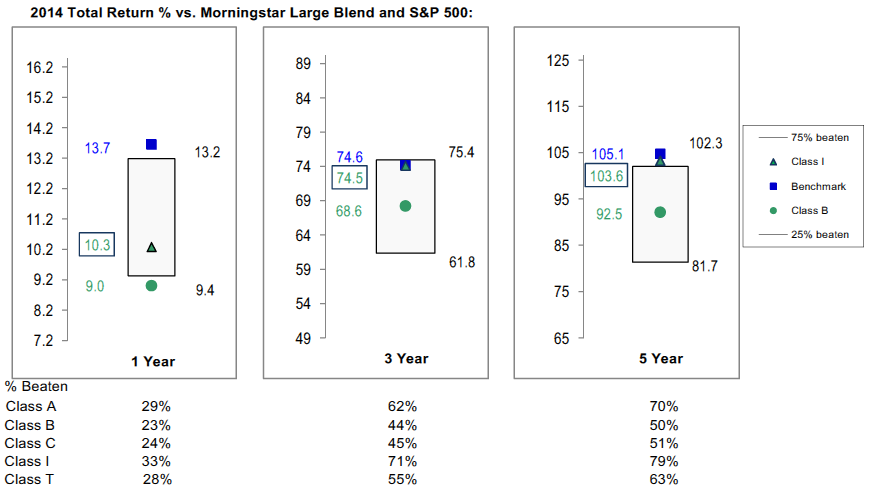
Fidelity Advisor Growth & Income Fund
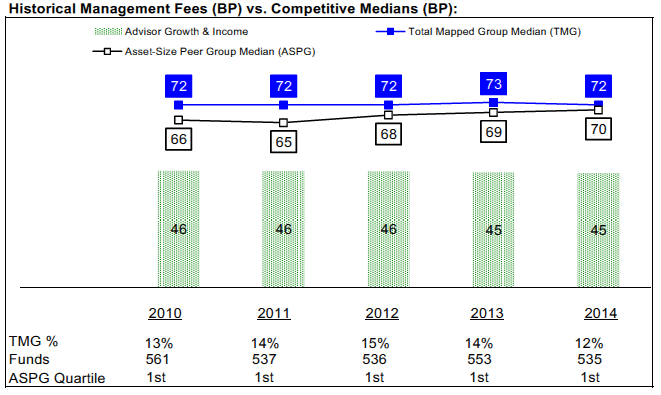
![]()
AGAII-ANN-0116
1.539474.118
Fidelity Advisor® Series Growth Opportunities Fund Annual Report November 30, 2015 |
|
Contents
Board Approval of Investment Advisory Contracts and Management Fees |
To view a fund's proxy voting guidelines and proxy voting record for the 12-month period ended June 30, visit http://www.fidelity.com/proxyvotingresults or visit the Securities and Exchange Commission's (SEC) web site at http://www.sec.gov.
You may also call 1-877-208-0098 to request a free copy of the proxy voting guidelines.
Standard & Poor's, S&P and S&P 500 are registered service marks of The McGraw-Hill Companies, Inc. and have been licensed for use by Fidelity Distributors Corporation.
Other third-party marks appearing herein are the property of their respective owners.
All other marks appearing herein are registered or unregistered trademarks or service marks of FMR LLC or an affiliated company. © 2016 FMR LLC. All rights reserved.
This report and the financial statements contained herein are submitted for the general information of the shareholders of the Fund. This report is not authorized for distribution to prospective investors in the Fund unless preceded or accompanied by an effective prospectus.
A fund files its complete schedule of portfolio holdings with the SEC for the first and third quarters of each fiscal year on Form N-Q. Forms N-Q are available on the SEC’s web site at http://www.sec.gov. A fund's Forms N-Q may be reviewed and copied at the SEC’s Public Reference Room in Washington, DC. Information regarding the operation of the SEC's Public Reference Room may be obtained by calling 1-800-SEC-0330.
For a complete list of a fund's portfolio holdings, view the most recent holdings listing, semiannual report, or annual report on Fidelity's web site at http://www.fidelity.com, http://www.advisor.fidelity.com, or http://www.401k.com, as applicable.
NOT FDIC INSURED •MAY LOSE VALUE •NO BANK GUARANTEE
Neither the Fund nor Fidelity Distributors Corporation is a bank.
Performance: The Bottom Line
Average annual total return reflects the change in the value of an investment, assuming reinvestment of distributions from dividend income and capital gains (the profits earned upon the sale of securities that have grown in value, if any) and assuming a constant rate of performance each year. The hypothetical investment and the average annual total returns do not reflect the deduction of taxes that a shareholder would pay on fund distributions or the redemption of fund shares. During periods of reimbursement by Fidelity, a fund’s total return will be greater than it would be had the reimbursement not occurred. How a fund did yesterday is no guarantee of how it will do tomorrow.
Average Annual Total Returns
| For the periods ended November 30, 2015 | Past 1 year | Life of fundA |
| Fidelity Advisor® Series Growth Opportunities Fund | 5.71% | 11.39% |
A From November 7, 2013
$10,000 Over Life of Fund
Let's say hypothetically that $10,000 was invested in Fidelity Advisor® Series Growth Opportunities Fund on November 7, 2013, when the fund started.
The chart shows how the value of your investment would have changed, and also shows how the Russell 3000® Growth Index performed over the same period.

| Period Ending Values | ||
| $12,491 | Fidelity Advisor® Series Growth Opportunities Fund | |
| $12,850 | Russell 3000® Growth Index | |
Management's Discussion of Fund Performance
Market Recap: U.S. stocks gained modestly for the 12 months ending November 30, 2015, despite a steep decline in August and September on concern about slowing economic growth in China. The S&P 500® index rebounded in October and gained 2.75% for the year. Stocks benefited late in the period amid waning expectations for a near-term interest-rate hike by the U.S. Federal Reserve, more economic stimulus in Europe and an interest-rate cut in China. Growth stocks in the benchmark far outpaced their value counterparts, as investors continued to seek growth in a subpar economic environment. Sector performance varied widely, with more than 26 percentage points separating the leader from the laggard. Consumer discretionary (+14%) secured the top spot, benefiting from a combination of rising personal income and still-benign inflation. Information technology (+7%) and health care (+4%) also outpaced the broad market. Conversely, the energy sector (-12%) performed worst, stymied by depressed commodity prices that also hit materials (-5%). Telecommunication services (-5%) and utilities (-4%), considered defensive sectors less sensitive to the economy, also lost ground. At period end, investors remained focused on the potential global implications of a stronger U.S. dollar and how China’s transition toward a consumption-led economy may affect corporate earnings.Comments from Lead Portfolio Manager Kyle Weaver: For the year, the fund posted a mid-single-digit gain that modestly lagged the 6.14% advance of the benchmark Russell 3000® Growth Index. Stock selection in the consumer staples, industrials and consumer discretionary sectors meaningfully detracted versus the benchmark. A large overweighting in Keurig Green Mountain, an innovator in single-serve beverage products, was our biggest relative detractor, as sales and profitability of the company’s products were pressured by cheaper knock-offs. I considerably reduced this position but remained overweighted at period end. Other noteworthy detractors included positions in Lumber Liquidators Holdings, which I sold, and Endurance International Group Holdings, a Web-hosting company. Conversely, my picks in health care and information technology added significant value. Regeneron Pharmaceuticals, the fund’s top relative contributor, is a biotechnology stock that strongly outperformed. Salesforce.com, a provider of cloud-based marketing and customer relationship management solutions, also was a standout performer this period. I reduced our stake in these two contributors but maintained overweightings in both cases.Note to shareholders: Kyle Weaver was named Lead Portfolio Manager of the fund and Steven Wymer Co-Manager on July 14, 2015, succeeding Gopal Reddy.The views expressed above reflect those of the portfolio manager(s) only through the end of the period as stated on the cover of this report and do not necessarily represent the views of Fidelity or any other person in the Fidelity organization. Any such views are subject to change at any time based upon market or other conditions and Fidelity disclaims any responsibility to update such views. These views may not be relied on as investment advice and, because investment decisions for a Fidelity fund are based on numerous factors, may not be relied on as an indication of trading intent on behalf of any Fidelity fund.
Investment Summary (Unaudited)
Top Ten Stocks as of November 30, 2015
| % of fund's net assets | % of fund's net assets 6 months ago | |
| Apple, Inc. | 6.9 | 6.4 |
| Alphabet, Inc. Class C | 3.0 | 2.1 |
| Alphabet, Inc. Class A | 3.0 | 2.2 |
| Facebook, Inc. Class A | 2.5 | 2.1 |
| Amazon.com, Inc. | 2.2 | 1.7 |
| American Tower Corp. | 2.1 | 0.0 |
| Visa, Inc. Class A | 2.0 | 1.7 |
| Salesforce.com, Inc. | 1.8 | 4.3 |
| Cognizant Technology Solutions Corp. Class A | 1.7 | 0.3 |
| Endurance International Group Holdings, Inc. | 1.5 | 0.0 |
| 26.7 |
Top Five Market Sectors as of November 30, 2015
| % of fund's net assets | % of fund's net assets 6 months ago | |
| Information Technology | 38.8 | 35.2 |
| Health Care | 17.9 | 22.2 |
| Consumer Discretionary | 16.9 | 16.4 |
| Industrials | 8.4 | 6.9 |
| Consumer Staples | 6.2 | 8.5 |
Asset Allocation (% of fund's net assets)
| As of November 30, 2015* | ||
| Stocks | 98.7% | |
| Convertible Securities | 0.8% | |
| Short-Term Investments and Net Other Assets (Liabilities) | 0.5% | |

* Foreign investments - 10.4%
| As of May 31, 2015* | ||
| Stocks | 97.8% | |
| Convertible Securities | 0.5% | |
| Short-Term Investments and Net Other Assets (Liabilities) | 1.7% | |

* Foreign investments - 6.0%
Percentages shown as 0.0% may reflect amounts less than 0.05%.
Investments November 30, 2015
Showing Percentage of Net Assets
| Common Stocks - 98.7% | |||
| Shares | Value | ||
| CONSUMER DISCRETIONARY - 16.9% | |||
| Auto Components - 0.4% | |||
| Tenneco, Inc. (a) | 51,800 | $2,790,984 | |
| Automobiles - 0.7% | |||
| Tesla Motors, Inc. (a) | 18,000 | 4,144,680 | |
| Diversified Consumer Services - 0.1% | |||
| ServiceMaster Global Holdings, Inc. (a) | 18,900 | 708,372 | |
| Hotels, Restaurants & Leisure - 2.8% | |||
| Buffalo Wild Wings, Inc. (a) | 12,500 | 2,003,000 | |
| Chipotle Mexican Grill, Inc. (a) | 9,700 | 5,621,635 | |
| Domino's Pizza, Inc. | 9,100 | 977,977 | |
| Dunkin' Brands Group, Inc. (b) | 30,100 | 1,276,842 | |
| Las Vegas Sands Corp. | 50,900 | 2,242,654 | |
| Starbucks Corp. | 79,100 | 4,855,949 | |
| Starwood Hotels & Resorts Worldwide, Inc. | 10,200 | 732,768 | |
| 17,710,825 | |||
| Internet & Catalog Retail - 3.7% | |||
| Amazon.com, Inc. (a) | 21,200 | 14,093,760 | |
| Netflix, Inc. (a) | 25,000 | 3,083,250 | |
| Priceline Group, Inc. (a) | 2,600 | 3,247,010 | |
| Travelport Worldwide Ltd. | 219,300 | 2,918,883 | |
| 23,342,903 | |||
| Media - 4.8% | |||
| AMC Networks, Inc. Class A (a) | 19,800 | 1,609,938 | |
| Charter Communications, Inc. Class A (a)(b) | 49,500 | 9,274,320 | |
| Comcast Corp. Class A | 122,500 | 7,455,350 | |
| Liberty Global PLC Class A (a) | 75,600 | 3,206,196 | |
| Lions Gate Entertainment Corp. (b) | 39,200 | 1,330,448 | |
| The Walt Disney Co. | 64,700 | 7,341,509 | |
| Twenty-First Century Fox, Inc. Class A | 2,500 | 73,775 | |
| 30,291,536 | |||
| Multiline Retail - 0.2% | |||
| Dollar General Corp. | 17,700 | 1,157,757 | |
| Specialty Retail - 1.3% | |||
| CarMax, Inc. (a) | 42,300 | 2,423,790 | |
| Home Depot, Inc. | 19,800 | 2,650,824 | |
| TJX Companies, Inc. | 49,100 | 3,466,460 | |
| 8,541,074 | |||
| Textiles, Apparel & Luxury Goods - 2.9% | |||
| lululemon athletica, Inc. (a) | 96,900 | 4,633,758 | |
| Michael Kors Holdings Ltd. (a) | 15,900 | 684,018 | |
| NIKE, Inc. Class B | 51,300 | 6,785,964 | |
| Skechers U.S.A., Inc. Class A (sub. vtg.) (a) | 87,000 | 2,627,400 | |
| Under Armour, Inc. Class A (sub. vtg.) (a) | 23,200 | 2,000,304 | |
| VF Corp. | 23,900 | 1,546,330 | |
| 18,277,774 | |||
| TOTAL CONSUMER DISCRETIONARY | 106,965,905 | ||
| CONSUMER STAPLES - 5.9% | |||
| Beverages - 1.7% | |||
| Monster Beverage Corp. | 23,100 | 3,571,491 | |
| PepsiCo, Inc. | 24,700 | 2,473,952 | |
| The Coca-Cola Co. | 101,700 | 4,334,454 | |
| 10,379,897 | |||
| Food & Staples Retailing - 2.5% | |||
| Costco Wholesale Corp. | 41,600 | 6,715,072 | |
| CVS Health Corp. | 60,600 | 5,701,854 | |
| Walgreens Boots Alliance, Inc. | 34,300 | 2,882,229 | |
| Whole Foods Market, Inc. | 19,700 | 574,255 | |
| 15,873,410 | |||
| Food Products - 0.6% | |||
| Keurig Green Mountain, Inc. | 32,400 | 1,697,760 | |
| Mead Johnson Nutrition Co. Class A | 15,200 | 1,224,968 | |
| Mondelez International, Inc. | 20,800 | 908,128 | |
| 3,830,856 | |||
| Household Products - 0.6% | |||
| Procter & Gamble Co. | 33,500 | 2,507,140 | |
| Svenska Cellulosa AB (SCA) (B Shares) | 43,600 | 1,254,783 | |
| 3,761,923 | |||
| Personal Products - 0.2% | |||
| Herbalife Ltd. (a) | 22,200 | 1,281,606 | |
| Tobacco - 0.3% | |||
| Altria Group, Inc. | 33,600 | 1,935,360 | |
| TOTAL CONSUMER STAPLES | 37,063,052 | ||
| ENERGY - 1.1% | |||
| Energy Equipment & Services - 0.5% | |||
| Dril-Quip, Inc. (a) | 20,500 | 1,293,755 | |
| Oceaneering International, Inc. | 38,100 | 1,666,494 | |
| 2,960,249 | |||
| Oil, Gas & Consumable Fuels - 0.6% | |||
| Cabot Oil & Gas Corp. | 146,300 | 2,754,829 | |
| PDC Energy, Inc. (a) | 24,400 | 1,378,356 | |
| 4,133,185 | |||
| TOTAL ENERGY | 7,093,434 | ||
| FINANCIALS - 5.3% | |||
| Banks - 1.5% | |||
| HDFC Bank Ltd. sponsored ADR | 46,800 | 2,720,016 | |
| JPMorgan Chase & Co. | 96,900 | 6,461,292 | |
| 9,181,308 | |||
| Capital Markets - 1.2% | |||
| BlackRock, Inc. Class A | 13,500 | 4,910,220 | |
| Charles Schwab Corp. | 82,800 | 2,791,188 | |
| 7,701,408 | |||
| Consumer Finance - 0.4% | |||
| American Express Co. | 9,700 | 694,908 | |
| Discover Financial Services | 33,300 | 1,890,108 | |
| 2,585,016 | |||
| Diversified Financial Services - 0.1% | |||
| MSCI, Inc. Class A | 9,300 | 652,116 | |
| Real Estate Investment Trusts - 2.1% | |||
| American Tower Corp. | 133,100 | 13,227,478 | |
| TOTAL FINANCIALS | 33,347,326 | ||
| HEALTH CARE - 17.9% | |||
| Biotechnology - 11.8% | |||
| AbbVie, Inc. | 104,500 | 6,076,675 | |
| ACADIA Pharmaceuticals, Inc. (a) | 34,335 | 1,303,013 | |
| Aduro Biotech, Inc. | 14,900 | 461,751 | |
| Agios Pharmaceuticals, Inc. (a) | 5,100 | 329,409 | |
| Alexion Pharmaceuticals, Inc. (a) | 23,600 | 4,211,184 | |
| Alkermes PLC (a) | 35,761 | 2,623,427 | |
| Alnylam Pharmaceuticals, Inc. (a) | 42,777 | 4,451,375 | |
| Amgen, Inc. | 39,000 | 6,282,900 | |
| Amicus Therapeutics, Inc. (a) | 123,400 | 1,324,082 | |
| Asterias Biotherapeutics, Inc. (a)(b) | 9,895 | 47,496 | |
| Avalanche Biotechnologies, Inc. (a) | 6,900 | 72,312 | |
| Baxalta, Inc. | 5,900 | 202,842 | |
| Biogen, Inc. (a) | 13,100 | 3,757,866 | |
| BioMarin Pharmaceutical, Inc. (a) | 30,900 | 2,946,933 | |
| BioTime, Inc. warrants 10/1/18 (a) | 26,180 | 21,729 | |
| bluebird bio, Inc. (a) | 20,200 | 1,792,750 | |
| Celgene Corp. (a) | 17,900 | 1,959,155 | |
| Celldex Therapeutics, Inc. (a) | 30,800 | 554,708 | |
| Edge Therapeutics, Inc. (a) | 32,800 | 455,264 | |
| Esperion Therapeutics, Inc. (a) | 13,500 | 383,535 | |
| Geron Corp. (a) | 11,400 | 58,140 | |
| Gilead Sciences, Inc. | 64,400 | 6,823,824 | |
| Insmed, Inc. (a) | 69,900 | 1,140,069 | |
| Intercept Pharmaceuticals, Inc. (a) | 2,900 | 511,879 | |
| Isis Pharmaceuticals, Inc. (a) | 111,256 | 6,791,066 | |
| Lexicon Pharmaceuticals, Inc. (a)(b) | 28,996 | 398,985 | |
| Merrimack Pharmaceuticals, Inc. (a) | 79,600 | 749,036 | |
| Novavax, Inc. (a) | 170,600 | 1,460,336 | |
| Ophthotech Corp. (a) | 28,100 | 1,786,317 | |
| Prothena Corp. PLC (a) | 32,300 | 2,278,442 | |
| Regeneron Pharmaceuticals, Inc. (a) | 16,200 | 8,820,900 | |
| Regulus Therapeutics, Inc. (a) | 8,700 | 87,609 | |
| Rigel Pharmaceuticals, Inc. (a) | 181,900 | 596,632 | |
| Seattle Genetics, Inc. (a)(b) | 27,700 | 1,162,846 | |
| Seres Therapeutics, Inc. | 5,500 | 197,065 | |
| Spark Therapeutics, Inc. | 900 | 52,011 | |
| Transition Therapeutics, Inc. (a) | 77,400�� | 145,512 | |
| Vertex Pharmaceuticals, Inc. (a) | 18,200 | 2,354,352 | |
| XOMA Corp. (a)(b) | 210,525 | 279,998 | |
| 74,953,425 | |||
| Health Care Equipment & Supplies - 0.4% | |||
| Boston Scientific Corp. (a) | 86,500 | 1,581,220 | |
| Penumbra, Inc. (a) | 800 | 40,256 | |
| Stryker Corp. | 6,600 | 636,636 | |
| 2,258,112 | |||
| Health Care Providers & Services - 2.0% | |||
| Express Scripts Holding Co. (a) | 20,100 | 1,718,148 | |
| McKesson Corp. | 46,100 | 8,729,035 | |
| UnitedHealth Group, Inc. | 18,100 | 2,040,051 | |
| 12,487,234 | |||
| Health Care Technology - 0.6% | |||
| athenahealth, Inc. (a)(b) | 22,100 | 3,707,275 | |
| Castlight Health, Inc. Class B (a) | 28,800 | 115,200 | |
| 3,822,475 | |||
| Pharmaceuticals - 3.1% | |||
| AcelRx Pharmaceuticals, Inc. (a)(b) | 128,978 | 737,754 | |
| Allergan PLC (a) | 10,660 | 3,346,067 | |
| Bristol-Myers Squibb Co. | 49,000 | 3,283,490 | |
| Endo Health Solutions, Inc. (a) | 51,900 | 3,190,812 | |
| Intra-Cellular Therapies, Inc. (a) | 9,605 | 512,235 | |
| Jazz Pharmaceuticals PLC (a) | 3,500 | 513,065 | |
| Mylan N.V. | 12,300 | 630,990 | |
| Teva Pharmaceutical Industries Ltd. sponsored ADR | 102,100 | 6,425,153 | |
| Theravance, Inc. (b) | 86,000 | 795,500 | |
| 19,435,066 | |||
| TOTAL HEALTH CARE | 112,956,312 | ||
| INDUSTRIALS - 8.4% | |||
| Aerospace & Defense - 0.9% | |||
| Honeywell International, Inc. | 20,700 | 2,151,765 | |
| The Boeing Co. | 25,000 | 3,636,250 | |
| 5,788,015 | |||
| Air Freight & Logistics - 0.4% | |||
| FedEx Corp. | 6,000 | 951,240 | |
| United Parcel Service, Inc. Class B | 15,000 | 1,545,150 | |
| 2,496,390 | |||
| Airlines - 2.7% | |||
| American Airlines Group, Inc. | 33,000 | 1,361,580 | |
| Controladora Vuela Compania de Aviacion S.A.B. de CV (a) | 207,400 | 365,678 | |
| Controladora Vuela Compania de Aviacion S.A.B. de CV ADR (a) | 19,700 | 348,493 | |
| Delta Air Lines, Inc. | 66,400 | 3,084,944 | |
| JetBlue Airways Corp. (a) | 12,500 | 309,250 | |
| Southwest Airlines Co. | 151,100 | 6,932,468 | |
| Spirit Airlines, Inc. (a) | 77,800 | 2,860,706 | |
| United Continental Holdings, Inc. (a) | 15,700 | 874,961 | |
| WestJet Airlines Ltd. | 37,400 | 594,838 | |
| 16,732,918 | |||
| Building Products - 0.1% | |||
| Caesarstone Sdot-Yam Ltd. | 9,100 | 372,008 | |
| Electrical Equipment - 1.2% | |||
| Acuity Brands, Inc. | 5,900 | 1,362,192 | |
| SolarCity Corp. (a)(b) | 206,800 | 5,947,568 | |
| Sunrun, Inc. (a)(b) | 45,300 | 301,245 | |
| 7,611,005 | |||
| Industrial Conglomerates - 0.9% | |||
| 3M Co. | 11,200 | 1,753,696 | |
| Danaher Corp. | 43,200 | 4,164,048 | |
| 5,917,744 | |||
| Professional Services - 0.6% | |||
| TriNet Group, Inc. (a) | 170,900 | 3,375,275 | |
| Verisk Analytics, Inc. (a) | 8,500 | 637,075 | |
| 4,012,350 | |||
| Road & Rail - 1.3% | |||
| Genesee & Wyoming, Inc. Class A (a) | 22,700 | 1,572,429 | |
| Hertz Global Holdings, Inc. (a) | 24,300 | 385,398 | |
| J.B. Hunt Transport Services, Inc. | 38,600 | 3,020,064 | |
| TransForce, Inc. | 53,600 | 1,021,468 | |
| Union Pacific Corp. | 29,700 | 2,493,315 | |
| 8,492,674 | |||
| Trading Companies & Distributors - 0.3% | |||
| HD Supply Holdings, Inc. (a) | 62,700 | 1,983,201 | |
| TOTAL INDUSTRIALS | 53,406,305 | ||
| INFORMATION TECHNOLOGY - 38.4% | |||
| Communications Equipment - 0.6% | |||
| Infinera Corp. (a) | 81,500 | 1,835,380 | |
| QUALCOMM, Inc. | 36,200 | 1,766,198 | |
| 3,601,578 | |||
| Electronic Equipment & Components - 0.0% | |||
| CDW Corp. | 7,200 | 310,824 | |
| Internet Software & Services - 13.4% | |||
| Alibaba Group Holding Ltd. sponsored ADR (a) | 73,300 | 6,163,064 | |
| Alphabet, Inc.: | |||
| Class A (a) | 24,500 | 18,689,825 | |
| Class C | 25,700 | 19,084,820 | |
| Demandware, Inc. (a) | 27,000 | 1,381,050 | |
| Endurance International Group Holdings, Inc. (a)(b) | 697,100 | 9,738,487 | |
| Facebook, Inc. Class A (a) | 150,800 | 15,719,392 | |
| GoDaddy, Inc. (a)(b) | 261,800 | 8,134,126 | |
| LinkedIn Corp. Class A (a) | 1,600 | 388,976 | |
| Rackspace Hosting, Inc. (a) | 33,300 | 953,046 | |
| Wix.com Ltd. (a) | 184,243 | 4,578,439 | |
| 84,831,225 | |||
| IT Services - 8.7% | |||
| Alliance Data Systems Corp. (a) | 20,700 | 5,937,795 | |
| Booz Allen Hamilton Holding Corp. Class A | 41,700 | 1,269,765 | |
| Cognizant Technology Solutions Corp. Class A (a) | 166,000 | 10,720,280 | |
| EPAM Systems, Inc. (a) | 82,700 | 6,510,971 | |
| Fidelity National Information Services, Inc. | 3,479 | 221,508 | |
| Gartner, Inc. Class A (a) | 14,400 | 1,343,520 | |
| MasterCard, Inc. Class A | 84,100 | 8,235,072 | |
| PayPal Holdings, Inc. (a) | 42,200 | 1,487,972 | |
| Sabre Corp. | 207,900 | 6,083,154 | |
| Square, Inc. | 24,100 | 290,164 | |
| Visa, Inc. Class A | 162,200 | 12,815,422 | |
| WEX, Inc. (a) | 5,100 | 480,777 | |
| 55,396,400 | |||
| Semiconductors & Semiconductor Equipment - 3.4% | |||
| Avago Technologies Ltd. | 31,200 | 4,070,040 | |
| Broadcom Corp. Class A | 59,100 | 3,228,633 | |
| Cypress Semiconductor Corp. (b) | 135,900 | 1,470,438 | |
| Micron Technology, Inc. (a) | 23,500 | 374,355 | |
| NVIDIA Corp. | 69,600 | 2,207,712 | |
| NXP Semiconductors NV (a) | 46,800 | 4,373,928 | |
| Qorvo, Inc. (a) | 80,000 | 4,645,600 | |
| SolarEdge Technologies, Inc. | 40,900 | 802,867 | |
| SunEdison, Inc. (a)(b) | 45,900 | 146,421 | |
| 21,319,994 | |||
| Software - 4.7% | |||
| Adobe Systems, Inc. (a) | 21,600 | 1,975,536 | |
| Electronic Arts, Inc. (a) | 22,700 | 1,538,833 | |
| Fortinet, Inc. (a) | 8,300 | 298,966 | |
| Interactive Intelligence Group, Inc. (a) | 33,700 | 1,161,302 | |
| Microsoft Corp. | 171,400 | 9,315,590 | |
| Oracle Corp. | 16,100 | 627,417 | |
| Red Hat, Inc. (a) | 8,200 | 667,562 | |
| Salesforce.com, Inc. (a) | 140,300 | 11,180,507 | |
| ServiceNow, Inc. (a) | 22,700 | 1,975,127 | |
| Workday, Inc. Class A (a) | 12,000 | 1,004,520 | |
| 29,745,360 | |||
| Technology Hardware, Storage & Peripherals - 7.6% | |||
| Apple, Inc. | 369,600 | 43,723,681 | |
| Electronics for Imaging, Inc. (a) | 63,900 | 3,136,212 | |
| Nimble Storage, Inc. (a)(b) | 90,300 | 945,441 | |
| Pure Storage, Inc. Class A (a) | 6,000 | 77,460 | |
| 47,882,794 | |||
| TOTAL INFORMATION TECHNOLOGY | 243,088,175 | ||
| MATERIALS - 3.4% | |||
| Chemicals - 3.0% | |||
| E.I. du Pont de Nemours & Co. | 22,700 | 1,528,618 | |
| Ecolab, Inc. | 5,500 | 655,380 | |
| LyondellBasell Industries NV Class A | 98,100 | 9,399,942 | |
| PPG Industries, Inc. | 47,900 | 5,064,946 | |
| The Chemours Co. LLC | 4,260 | 26,625 | |
| The Dow Chemical Co. | 43,200 | 2,252,016 | |
| 18,927,527 | |||
| Containers & Packaging - 0.4% | |||
| Sealed Air Corp. | 61,000 | 2,766,960 | |
| TOTAL MATERIALS | 21,694,487 | ||
| TELECOMMUNICATION SERVICES - 1.4% | |||
| Diversified Telecommunication Services - 0.2% | |||
| Verizon Communications, Inc. | 26,400 | 1,199,880 | |
| Wireless Telecommunication Services - 1.2% | |||
| SBA Communications Corp. Class A (a) | 21,200 | 2,229,392 | |
| T-Mobile U.S., Inc. (a) | 154,000 | 5,467,000 | |
| 7,696,392 | |||
| TOTAL TELECOMMUNICATION SERVICES | 8,896,272 | ||
| UTILITIES - 0.0% | |||
| Independent Power and Renewable Electricity Producers - 0.0% | |||
| Terraform Power, Inc. (b) | 27,300 | 188,370 | |
| TOTAL COMMON STOCKS | |||
| (Cost $516,645,467) | 624,699,638 | ||
| Convertible Preferred Stocks - 0.8% | |||
| CONSUMER STAPLES - 0.3% | |||
| Food & Staples Retailing - 0.1% | |||
| Blue Apron, Inc. Series D (c) | 56,277 | 749,998 | |
| Tobacco - 0.2% | |||
| PAX Labs, Inc. Series C (c) | 273,248 | 1,054,737 | |
| TOTAL CONSUMER STAPLES | 1,804,735 | ||
| FINANCIALS - 0.1% | |||
| Real Estate Management & Development - 0.1% | |||
| Redfin Corp. Series G (c) | 282,324 | 1,061,538 | |
| INFORMATION TECHNOLOGY - 0.4% | |||
| Internet Software & Services - 0.3% | |||
| Uber Technologies, Inc. Series D, 8.00% (a)(c) | 55,696 | 2,207,789 | |
| Software - 0.1% | |||
| Cloudera, Inc. Series F (a)(c) | 10,396 | 341,301 | |
| TOTAL INFORMATION TECHNOLOGY | 2,549,090 | ||
| TOTAL CONVERTIBLE PREFERRED STOCKS | |||
| (Cost $3,748,404) | 5,415,363 | ||
| Money Market Funds - 4.6% | |||
| Fidelity Cash Central Fund, 0.18% (d) | 3,321,451 | 3,321,451 | |
| Fidelity Securities Lending Cash Central Fund, 0.22% (d)(e) | 25,821,495 | 25,821,495 | |
| TOTAL MONEY MARKET FUNDS | |||
| (Cost $29,142,946) | 29,142,946 | ||
| TOTAL INVESTMENT PORTFOLIO - 104.1% | |||
| (Cost $549,536,817) | 659,257,947 | ||
| NET OTHER ASSETS (LIABILITIES) - (4.1)% | (26,149,140) | ||
| NET ASSETS - 100% | $633,108,807 |
Legend
(a) Non-income producing
(b) Security or a portion of the security is on loan at period end.
(c) Restricted securities - Investment in securities not registered under the Securities Act of 1933 (excluding 144A issues). At the end of the period, the value of restricted securities (excluding 144A issues) amounted to $5,415,364 or 0.9% of net assets.
(d) Affiliated fund that is generally available only to investment companies and other accounts managed by Fidelity Investments. The rate quoted is the annualized seven-day yield of the fund at period end. A complete unaudited listing of the fund's holdings as of its most recent quarter end is available upon request. In addition, each Fidelity Central Fund's financial statements, which are not covered by the Fund's Report of Independent Registered Public Accounting Firm, are available on the SEC's website or upon request.
(e) Investment made with cash collateral received from securities on loan.
Additional information on each restricted holding is as follows:
| Security | Acquisition Date | Acquisition Cost |
| Blue Apron, Inc. Series D | 5/18/15 | $749,998 |
| Cloudera, Inc. Series F | 2/5/14 | $151,366 |
| PAX Labs, Inc. Series C | 5/22/15 | $1,052,005 |
| Redfin Corp. Series G | 12/16/14 | $931,020 |
| Uber Technologies, Inc. Series D, 8.00% | 6/6/14 | $864,015 |
Affiliated Central Funds
Information regarding fiscal year to date income earned by the Fund from investments in Fidelity Central Funds is as follows:
| Fund | Income earned |
| Fidelity Cash Central Fund | $18,455 |
| Fidelity Securities Lending Cash Central Fund | 268,195 |
| Total | $286,650 |
Investment Valuation
The following is a summary of the inputs used, as of November 30, 2015, involving the Fund's assets and liabilities carried at fair value. The inputs or methodology used for valuing securities may not be an indication of the risk associated with investing in those securities. For more information on valuation inputs, and their aggregation into the levels used below, please refer to the Investment Valuation section in the accompanying Notes to Financial Statements.
| Valuation Inputs at Reporting Date: | ||||
| Description | Total | Level 1 | Level 2 | Level 3 |
| Investments in Securities: | ||||
| Equities: | ||||
| Consumer Discretionary | $106,965,905 | $106,965,905 | $-- | $-- |
| Consumer Staples | 38,867,787 | 35,808,269 | 1,254,783 | 1,804,735 |
| Energy | 7,093,434 | 7,093,434 | -- | -- |
| Financials | 34,408,864 | 33,347,326 | -- | 1,061,538 |
| Health Care | 112,956,312 | 112,956,312 | -- | -- |
| Industrials | 53,406,305 | 53,406,305 | -- | -- |
| Information Technology | 245,637,265 | 243,088,175 | -- | 2,549,090 |
| Materials | 21,694,487 | 21,694,487 | -- | -- |
| Telecommunication Services | 8,896,272 | 8,896,272 | -- | -- |
| Utilities | 188,370 | 188,370 | -- | -- |
| Money Market Funds | 29,142,946 | 29,142,946 | -- | -- |
| Total Investments in Securities: | $659,257,947 | $652,587,801 | $1,254,783 | $5,415,363 |
Other Information
Distribution of investments by country or territory of incorporation, as a percentage of Total Net Assets, is as follows (Unaudited):
| United States of America | 89.6% |
| Netherlands | 2.3% |
| Ireland | 1.9% |
| Israel | 1.8% |
| Cayman Islands | 1.2% |
| Others (Individually Less Than 1%) | 3.2% |
| 100.0% |
See accompanying notes which are an integral part of the financial statements.
Financial Statements
Statement of Assets and Liabilities
| November 30, 2015 | ||
| Assets | ||
| Investment in securities, at value (including securities loaned of $25,022,798) — See accompanying schedule: Unaffiliated issuers (cost $520,393,871) | $630,115,001 | |
| Fidelity Central Funds (cost $29,142,946) | 29,142,946 | |
| Total Investments (cost $549,536,817) | $659,257,947 | |
| Receivable for investments sold | 14,086,023 | |
| Receivable for fund shares sold | 19,083 | |
| Dividends receivable | 472,340 | |
| Distributions receivable from Fidelity Central Funds | 31,968 | |
| Prepaid expenses | 2,093 | |
| Other receivables | 4,482 | |
| Total assets | 673,873,936 | |
| Liabilities | ||
| Payable for investments purchased | $1,793,205 | |
| Payable for fund shares redeemed | 12,711,421 | |
| Accrued management fee | 273,418 | |
| Other affiliated payables | 114,346 | |
| Other payables and accrued expenses | 51,244 | |
| Collateral on securities loaned, at value | 25,821,495 | |
| Total liabilities | 40,765,129 | |
| Net Assets | $633,108,807 | |
| Net Assets consist of: | ||
| Paid in capital | $458,407,006 | |
| Undistributed net investment income | 3,441,800 | |
| Accumulated undistributed net realized gain (loss) on investments and foreign currency transactions | 61,538,878 | |
| Net unrealized appreciation (depreciation) on investments and assets and liabilities in foreign currencies | 109,721,123 | |
| Net Assets, for 51,776,719 shares outstanding | $633,108,807 | |
| Net Asset Value, offering price and redemption price per share ($633,108,807 ÷ 51,776,719 shares) | $12.23 |
See accompanying notes which are an integral part of the financial statements.
Statement of Operations
| Year ended November 30, 2015 | ||
| Investment Income | ||
| Dividends | $7,957,179 | |
| Special dividends | 1,880,260 | |
| Interest | 14 | |
| Income from Fidelity Central Funds | 286,650 | |
| Total income | 10,124,103 | |
| Expenses | ||
| Management fee | ||
| Basic fee | $4,722,511 | |
| Performance adjustment | (276,710) | |
| Transfer agent fees | 1,505,237 | |
| Accounting and security lending fees | 302,214 | |
| Custodian fees and expenses | 40,867 | |
| Independent trustees' compensation | 3,768 | |
| Audit | 63,720 | |
| Legal | 2,338 | |
| Interest | 18,795 | |
| Miscellaneous | 7,834 | |
| Total expenses before reductions | 6,390,574 | |
| Expense reductions | (33,344) | 6,357,230 |
| Net investment income (loss) | 3,766,873 | |
| Realized and Unrealized Gain (Loss) | ||
| Net realized gain (loss) on: | ||
| Investment securities: | ||
| Unaffiliated issuers | 61,583,245 | |
| Foreign currency transactions | 10,066 | |
| Total net realized gain (loss) | 61,593,311 | |
| Change in net unrealized appreciation (depreciation) on: Investment securities | (21,665,647) | |
| Assets and liabilities in foreign currencies | 415 | |
| Total change in net unrealized appreciation (depreciation) | (21,665,232) | |
| Net gain (loss) | 39,928,079 | |
| Net increase (decrease) in net assets resulting from operations | $43,694,952 |
See accompanying notes which are an integral part of the financial statements.
Statement of Changes in Net Assets
| Year ended November 30, 2015 | Year ended November 30, 2014 | |
| Increase (Decrease) in Net Assets | ||
| Operations | ||
| Net investment income (loss) | $3,766,873 | $1,437,377 |
| Net realized gain (loss) | 61,593,311 | 16,692,827 |
| Change in net unrealized appreciation (depreciation) | (21,665,232) | 113,648,526 |
| Net increase (decrease) in net assets resulting from operations | 43,694,952 | 131,778,730 |
| Distributions to shareholders from net investment income | (1,322,749) | (333,170) |
| Distributions to shareholders from net realized gain | (16,291,441) | (1,631,844) |
| Total distributions | (17,614,190) | (1,965,014) |
| Share transactions | ||
| Proceeds from sales of shares | 49,421,613 | 50,651,921 |
| Reinvestment of distributions | 17,614,189 | 1,965,014 |
| Cost of shares redeemed | (434,471,004) | (60,248,672) |
| Net increase (decrease) in net assets resulting from share transactions | (367,435,202) | (7,631,737) |
| Total increase (decrease) in net assets | (341,354,440) | 122,181,979 |
| Net Assets | ||
| Beginning of period | 974,463,247 | 852,281,268 |
| End of period (including undistributed net investment income of $3,441,800 and undistributed net investment income of $1,312,394, respectively) | $633,108,807 | $974,463,247 |
| Other Information | ||
| Shares | ||
| Sold | 4,216,771 | 4,789,638 |
| Issued in reinvestment of distributions | 1,574,182 | 187,502 |
| Redeemed | (36,674,390) | (5,664,379) |
| Net increase (decrease) | (30,883,437) | (687,239) |
See accompanying notes which are an integral part of the financial statements.
Financial Highlights — Fidelity Advisor Series Growth Opportunities Fund
| Years ended November 30, | 2015 | 2014 | 2013 A |
| Selected Per–Share Data | |||
| Net asset value, beginning of period | $11.79 | $10.23 | $10.00 |
| Income from Investment Operations | |||
| Net investment income (loss)B | .05C | .02 | –D |
| Net realized and unrealized gain (loss) | .60 | 1.56 | .23 |
| Total from investment operations | .65 | 1.58 | .23 |
| Distributions from net investment income | (.02) | –D | – |
| Distributions from net realized gain | (.20) | (.02) | – |
| Total distributions | (.21)E | (.02) | – |
| Net asset value, end of period | $12.23 | $11.79 | $10.23 |
| Total ReturnF | 5.71% | 15.51% | 2.30% |
| Ratios to Average Net AssetsG,H | |||
| Expenses before reductions | .74% | .77% | .85%I |
| Expenses net of fee waivers, if any | .74% | .77% | .85%I |
| Expenses net of all reductions | .74% | .77% | .85%I |
| Net investment income (loss) | .44%C | .16% | .38%I |
| Supplemental Data | |||
| Net assets, end of period (000 omitted) | $633,109 | $974,463 | $852,281 |
| Portfolio turnover rateJ | 50% | 16% | 65%K |
A For the period November 7, 2013 (commencement of operations) to November 30, 2013.
B Calculated based on average shares outstanding during the period.
C Investment income per share reflects a large, non-recurring dividend which amounted to $.03 per share. Excluding this non-recurring dividend, the ratio of net investment income (loss) to average net assets would have been .22%.
D Amount represents less than $.005 per share.
E Total distributions of $.21 per share is comprised of distributions from net investment income of $.016 and distributions from net realized gain of $.197 per share.
F Total returns for periods of less than one year are not annualized.
G Fees and expenses of any underlying Fidelity Central Funds are not included in the Fund's expense ratio. The Fund indirectly bears its proportionate share of the expenses of any underlying Fidelity Central Funds.
H Expense ratios reflect operating expenses of the Fund. Expenses before reductions do not reflect amounts reimbursed by the investment adviser or reductions from brokerage service arrangements or reductions from other expense offset arrangements and do not represent the amount paid by the Fund during periods when reimbursements or reductions occur. Expense ratios before reductions for start-up periods may not be representative of longer term operating periods. Expenses net of fee waivers reflect expenses after reimbursement by the investment adviser but prior to reductions from brokerage service arrangements or other expense offset arrangements. Expenses net of all reductions represent the net expenses paid by the Fund.
I Annualized
J Amount does not include the portfolio activity of any underlying Fidelity Central Funds.
K Amount not annualized.
See accompanying notes which are an integral part of the financial statements.
Notes to Financial Statements
For the period ended November 30, 2015
1. Organization.
Fidelity Advisor Series Growth Opportunities Fund (the Fund) is a fund of Fidelity Advisor Series I (the Trust) and is authorized to issue an unlimited number of shares. Shares of the Fund are only available for purchase by mutual funds for which Fidelity Management & Research Company (FMR) or an affiliate serves as an investment manager. The Trust is registered under the Investment Company Act of 1940, as amended (the 1940 Act), as an open-end management investment company organized as a Massachusetts business trust.
2. Investments in Fidelity Central Funds.
The Fund invests in Fidelity Central Funds, which are open-end investment companies generally available only to other investment companies and accounts managed by the investment adviser and its affiliates. The Fund's Schedule of Investments lists each of the Fidelity Central Funds held as of period end, if any, as an investment of the Fund, but does not include the underlying holdings of each Fidelity Central Fund. As an Investing Fund, the Fund indirectly bears its proportionate share of the expenses of the underlying Fidelity Central Funds.
The Money Market Central Funds seek preservation of capital and current income and are managed by Fidelity Investments Money Management, Inc. (FIMM), an affiliate of the investment adviser. Annualized expenses of the Money Market Central Funds as of their most recent shareholder report date are less than .005%.
A complete unaudited list of holdings for each Fidelity Central Fund is available upon request or at the Securities and Exchange Commission (the SEC) website at www.sec.gov. In addition, the financial statements of the Fidelity Central Funds, which are not covered by the Fund's Report of Independent Registered Public Accounting Firm, are available on the SEC website or upon request.
3. Significant Accounting Policies.
The financial statements have been prepared in conformity with accounting principles generally accepted in the United States of America (GAAP), which require management to make certain estimates and assumptions at the date of the financial statements. Actual results could differ from those estimates. Subsequent events, if any, through the date that the financial statements were issued have been evaluated in the preparation of the financial statements. The following summarizes the significant accounting policies of the Fund:
Investment Valuation. Investments are valued as of 4:00 p.m. Eastern time on the last calendar day of the period. The Board of Trustees (the Board) has delegated the day to day responsibility for the valuation of the Fund's investments to the FMR Fair Value Committee (the Committee). In accordance with valuation policies and procedures approved by the Board, the Fund attempts to obtain prices from one or more third party pricing vendors or brokers to value its investments. When current market prices, quotations or currency exchange rates are not readily available or reliable, investments will be fair valued in good faith by the Committee, in accordance with procedures adopted by the Board. Factors used in determining fair value vary by investment type and may include market or investment specific events. The frequency with which these procedures are used cannot be predicted and they may be utilized to a significant extent. The Committee oversees the Fund's valuation policies and procedures and reports to the Board on the Committee's activities and fair value determinations. The Board monitors the appropriateness of the procedures used in valuing the Fund's investments and ratifies the fair value determinations of the Committee.
The Fund categorizes the inputs to valuation techniques used to value its investments into a disclosure hierarchy consisting of three levels as shown below:
- Level 1 – quoted prices in active markets for identical investments
- Level 2 – other significant observable inputs (including quoted prices for similar investments, interest rates, prepayment speeds, etc.)
- Level 3 – unobservable inputs (including the Fund's own assumptions based on the best information available)
Valuation techniques used to value the Fund's investments by major category are as follows:
Equity securities, including restricted securities, for which market quotations are readily available, are valued at the last reported sale price or official closing price as reported by a third party pricing vendor on the primary market or exchange on which they are traded and are categorized as Level 1 in the hierarchy. In the event there were no sales during the day or closing prices are not available, securities are valued at the last quoted bid price or may be valued using the last available price and are generally categorized as Level 2 in the hierarchy. For foreign equity securities, when market or security specific events arise, comparisons to the valuation of American Depositary Receipts (ADRs), futures contracts, Exchange-Traded Funds (ETFs) and certain indexes as well as quoted prices for similar securities may be used and would be categorized as Level 2 in the hierarchy. Utilizing these techniques may result in transfers between Level 1 and Level 2. For equity securities, including restricted securities, where observable inputs are limited, assumptions about market activity and risk are used and these securities may be categorized as Level 3 in the hierarchy.
Investments in open-end mutual funds, including the Fidelity Central Funds, are valued at their closing net asset value (NAV) each business day and are categorized as Level 1 in the hierarchy.
Changes in valuation techniques may result in transfers in or out of an assigned level within the disclosure hierarchy. The aggregate value of investments by input level as of November 30, 2015 is included at the end of the Fund's Schedule of Investments.
Foreign Currency. The Fund may use foreign currency contracts to facilitate transactions in foreign-denominated securities. Gains and losses from these transactions may arise from changes in the value of the foreign currency or if the counterparties do not perform under the contracts' terms.
Foreign-denominated assets, including investment securities, and liabilities are translated into U.S. dollars at the exchange rates at period end. Purchases and sales of investment securities, income and dividends received and expenses denominated in foreign currencies are translated into U.S. dollars at the exchange rate in effect on the transaction date.
The effects of exchange rate fluctuations on investments are included with the net realized and unrealized gain (loss) on investment securities. Other foreign currency transactions resulting in realized and unrealized gain (loss) are disclosed separately.
Investment Transactions and Income. For financial reporting purposes, the Fund's investment holdings and NAV include trades executed through the end of the last business day of the period. The NAV per share for processing shareholder transactions is calculated as of the close of business of the New York Stock Exchange (NYSE), normally 4:00 p.m. Eastern time and includes trades executed through the end of the prior business day. Gains and losses on securities sold are determined on the basis of identified cost. Dividend income is recorded on the ex-dividend date, except for certain dividends from foreign securities where the ex-dividend date may have passed, which are recorded as soon as the Fund is informed of the ex-dividend date. Non-cash dividends included in dividend income, if any, are recorded at the fair market value of the securities received. Income and capital gain distributions from Fidelity Central Funds, if any, are recorded on the ex-dividend date. Distributions received on securities that represent a return of capital or capital gain are recorded as a reduction of cost of investments and/or as a realized gain. Subsequent to ex-dividend date the Fund determines the components of these distributions, based upon receipt of tax filings or other correspondence relating to the underlying investment. Large, non-recurring dividends recognized by the Fund are presented separately on the Statement of Operations as "Special Dividends" and the impact of these dividends is presented in the Financial Highlights. Interest income is accrued as earned and includes coupon interest and amortization of premium and accretion of discount on debt securities as applicable. Investment income is recorded net of foreign taxes withheld where recovery of such taxes is uncertain.
Expenses. Expenses directly attributable to a fund are charged to that fund. Expenses attributable to more than one fund are allocated among the respective funds on the basis of relative net assets or other appropriate methods. Expense estimates are accrued in the period to which they relate and adjustments are made when actual amounts are known.
Income Tax Information and Distributions to Shareholders. Each year, the Fund intends to qualify as a regulated investment company under Subchapter M of the Internal Revenue Code, including distributing substantially all of its taxable income and realized gains. As a result, no provision for U.S. Federal income taxes is required. As of November 30, 2015, the Fund did not have any unrecognized tax benefits in the financial statements; nor is the Fund aware of any tax positions for which it is reasonably possible that the total amounts of unrecognized tax benefits will significantly change in the next twelve months. The Fund files a U.S. federal tax return, in addition to state and local tax returns as required. The Fund's federal income tax returns are subject to examination by the Internal Revenue Service (IRS) for a period of three fiscal years after they are filed. State and local tax returns may be subject to examination for an additional fiscal year depending on the jurisdiction. Foreign taxes are provided for based on the Fund's understanding of the tax rules and rates that exist in the foreign markets in which it invests.
Distributions are declared and recorded on the ex-dividend date. Income and capital gain distributions are determined in accordance with income tax regulations, which may differ from GAAP.
Capital accounts within the financial statements are adjusted for permanent book-tax differences. These adjustments have no impact on net assets or the results of operations. Capital accounts are not adjusted for temporary book-tax differences which will reverse in a subsequent period.
Book-tax differences are primarily due to foreign currency transactions, partnerships, passive foreign investment companies (PFIC), and losses deferred due to wash sales.
The federal tax cost of investment securities and unrealized appreciation (depreciation) as of period end were as follows:
| Gross unrealized appreciation | $130,956,893 |
| Gross unrealized depreciation | (24,854,424) |
| Net unrealized appreciation (depreciation) on securities | $106,102,469 |
| Tax Cost | $553,155,478 |
The tax-based components of distributable earnings as of period end were as follows:
| Undistributed ordinary income | $3,441,802 |
| Undistributed long-term capital gain | $65,157,539 |
| Net unrealized appreciation (depreciation) on securities and other investments | $106,102,462 |
The tax character of distributions paid was as follows:
| November 30, 2015 | November 30, 2014 | |
| Ordinary Income | $17,366,174 | $ 1,230,684 |
| Long-term Capital Gains | 248,016 | 734,330 |
| Total | $17,614,190 | $ 1,965,014 |
Restricted Securities. The Fund may invest in securities that are subject to legal or contractual restrictions on resale. These securities generally may be resold in transactions exempt from registration or to the public if the securities are registered. Disposal of these securities may involve time-consuming negotiations and expense, and prompt sale at an acceptable price may be difficult. Information regarding restricted securities is included at the end of the Fund's Schedule of Investments.
4. Purchases and Sales of Investments.
Purchases and sales of securities, other than short-term securities, aggregated $423,287,996 and $787,027,621, respectively.
5. Fees and Other Transactions with Affiliates.
Management Fee. Fidelity Management & Research Company (the investment adviser) and its affiliates provide the Fund with investment management related services for which the Fund pays a monthly management fee. The management fee is the sum of an individual fund fee rate that is based on an annual rate of .30% of the Fund's average net assets and an annualized group fee rate that averaged .25% during the period. The group fee rate is based upon the average net assets of all the mutual funds advised by the investment adviser, including any mutual funds previously advised by the investment adviser that are currently advised by Fidelity SelectCo, LLC, an affiliate of the investment adviser. The group fee rate decreases as assets under management increase and increases as assets under management decrease. In addition, the management fee is subject to a performance adjustment (up to a maximum of +/- .20% of the Fund's average net assets over a 36 month performance period). The upward or downward adjustment to the management fee is based on the Fund's relative investment performance as compared to its benchmark index, the Russell 3000 Growth Index, over the same 36 month performance period. For the reporting period, the total annual management fee rate, including the performance adjustment, was .52% of the Fund's average net assets. The performance adjustment included in the management fee rate may be higher or lower than the maximum performance adjustment rate due to the difference between the average net assets for the reporting and performance periods.
Transfer Agent Fees. Fidelity Investments Institutional Operations Company, Inc. (FIIOC), an affiliate of the investment adviser, is the Fund's transfer, dividend disbursing and shareholder servicing agent. FIIOC receives account fees and asset-based fees that vary according to account size and type of account. FIIOC pays for typesetting, printing and mailing of shareholder reports, except proxy statements. For the period, the transfer agent fees were equivalent to an annual rate of .17% of average net assets.
Accounting and Security Lending Fees. Fidelity Service Company, Inc. (FSC), an affiliate of the investment adviser, maintains the Fund's accounting records. The accounting fee is based on the level of average net assets for each month. Under a separate contract, FSC administers the security lending program. The security lending fee is based on the number and duration of lending transactions.
Brokerage Commissions. The Fund placed a portion of its portfolio transactions with brokerage firms which are affiliates of the investment adviser. Brokerage commissions are included in net realized gain (loss) and change in net unrealized appreciation (depreciation) in the Statement of Operations. The commissions paid to these affiliated firms were $15,732 for the period.
Interfund Lending Program. Pursuant to an Exemptive Order issued by the SEC, the Fund, along with other registered investment companies having management contracts with FMR or other affiliated entities of FMR, may participate in an interfund lending program. This program provides an alternative credit facility allowing the funds to borrow from, or lend money to, other participating affiliated funds. At period end, there were no interfund loans outstanding. The Fund's activity in this program during the period for which loans were outstanding was as follows:
| Borrower or Lender | Average Loan Balance | Weighted Average Interest Rate | Interest Expense |
| Borrower | $30,427,545 | .36% | $3,305 |
6. Committed Line of Credit.
The Fund participates with other funds managed by the investment adviser or an affiliate in a $4.25 billion credit facility (the "line of credit") to be utilized for temporary or emergency purposes to fund shareholder redemptions or for other short-term liquidity purposes. The Fund has agreed to pay commitment fees on its pro-rata portion of the line of credit, which amounted to $1,314 and is reflected in Miscellaneous expenses on the Statement of Operations. During the period, the Fund did not borrow on this line of credit.
7. Security Lending.
The Fund lends portfolio securities through a lending agent from time to time in order to earn additional income. For equity securities, a lending agent is used and may loan securities to certain qualified borrowers, including Fidelity Capital Markets (FCM), a broker-dealer affiliated with the Fund. On the settlement date of the loan, the Fund receives collateral (in the form of U.S. Treasury obligations, letters of credit and/or cash) against the loaned securities and maintains collateral in an amount not less than 100% of the market value of the loaned securities during the period of the loan. The market value of the loaned securities is determined at the close of business of the Fund and any additional required collateral is delivered to the Fund on the next business day. The Fund or borrower may terminate the loan at any time, and if the borrower defaults on its obligation to return the securities loaned because of insolvency or other reasons, the Fund may apply collateral received from the borrower against the obligation. The Fund may experience delays and costs in recovering the securities loaned. Any cash collateral received is invested in the Fidelity Securities Lending Cash Central Fund. The value of loaned securities and cash collateral at period end are disclosed on the Fund's Statement of Assets and Liabilities. Security lending income represents the income earned on investing cash collateral, less rebates paid to borrowers and any lending agent fees associated with the loan, plus any premium payments received for lending certain types of securities. Security lending income is presented in the Statement of Operations as a component of income from Fidelity Central Funds. Total security lending income during the period amounted to $268,195. During the period, there were no securities loaned to FCM.
8. Bank Borrowings.
The Fund is permitted to have bank borrowings for temporary or emergency purposes to fund shareholder redemptions or for other short-term liquidity requirements. The Fund has established borrowing arrangements with certain banks. The interest rate on the borrowings is the bank's base rate, as revised from time to time. The average loan balance during the period for which loans were outstanding amounted to $174,261,000. The weighted average interest rate was .64%. The interest expense amounted to $15,490 under the bank borrowing program. At period end, there were no bank borrowings outstanding.
9. Expense Reductions.
Commissions paid to certain brokers with whom the investment adviser, or its affiliates, places trades on behalf of the Fund include an amount in addition to trade execution, which may be rebated back to the Fund to offset certain expenses. This amount totaled $16,146 for the period.
In addition, during the period the investment adviser reimbursed and/or waived a portion of operating expenses in the amount of $17,198.
10. Other.
The Fund's organizational documents provide former and current trustees and officers with a limited indemnification against liabilities arising in connection with the performance of their duties to the Fund. In the normal course of business, the Fund may also enter into contracts that provide general indemnifications. The Fund's maximum exposure under these arrangements is unknown as this would be dependent on future claims that may be made against the Fund. The risk of material loss from such claims is considered remote.
At the end of the period, mutual funds managed by the investment adviser or its affiliates were the owners of record of all the outstanding shares of the Fund.
Report of Independent Registered Public Accounting Firm
To the Trustees of Fidelity Advisor Series I and Shareholders of Fidelity Advisor® Series Growth Opportunities Fund:
We have audited the accompanying statement of assets and liabilities of Fidelity Advisor® Series Growth Opportunities Fund (the Fund), a fund of Fidelity Advisor Series I, including the schedule of investments, as of November 30, 2015, and the related statement of operations for the year then ended, the statement of changes in net assets for each of the two years in the period then ended, and the financial highlights for each of the two years in the period then ended and for the period from November 7, 2013 (commencement of operations) to November 30, 2013. These financial statements and financial highlights are the responsibility of the Fund's management. Our responsibility is to express an opinion on these financial statements and financial highlights based on our audits.
We conducted our audits in accordance with the standards of the Public Company Accounting Oversight Board (United States). Those standards require that we plan and perform the audit to obtain reasonable assurance about whether the financial statements and financial highlights are free of material misstatement. The Fund is not required to have, nor were we engaged to perform, an audit of its internal control over financial reporting. Our audits included consideration of internal control over financial reporting as a basis for designing audit procedures that are appropriate in the circumstances, but not for the purpose of expressing an opinion on the effectiveness of the Fund's internal control over financial reporting. Accordingly, we express no such opinion. An audit also includes examining, on a test basis, evidence supporting the amounts and disclosures in the financial statements, assessing the accounting principles used and significant estimates made by management, as well as evaluating the overall financial statement presentation. Our procedures included confirmation of securities owned as of November 30, 2015, by correspondence with the custodians and brokers; when replies were not received from brokers, we performed other auditing procedures. We believe that our audits provide a reasonable basis for our opinion.
In our opinion, such financial statements and financial highlights referred to above present fairly, in all material respects, the financial position of Fidelity Advisor® Series Growth Opportunities Fund as of November 30, 2015, the results of its operations for the year then ended, the changes in its net assets for each of the two years in the period then ended, and the financial highlights for each of the two years in the period then ended and for the period from November 7, 2013 (commencement of operations) to November 30, 2013 in conformity with accounting principles generally accepted in the United States of America.
DELOITTE & TOUCHE LLP
Boston, Massachusetts
January 20, 2016
Trustees and Officers
The Trustees, Members of the Advisory Board (if any), and officers of the trust and fund, as applicable, are listed below. The Board of Trustees governs the fund and is responsible for protecting the interests of shareholders. The Trustees are experienced executives who meet periodically throughout the year to oversee the fund's activities, review contractual arrangements with companies that provide services to the fund, oversee management of the risks associated with such activities and contractual arrangements, and review the fund's performance. Each of the Trustees oversees 170 funds.
The Trustees hold office without limit in time except that (a) any Trustee may resign; (b) any Trustee may be removed by written instrument, signed by at least two-thirds of the number of Trustees prior to such removal; (c) any Trustee who requests to be retired or who has become incapacitated by illness or injury may be retired by written instrument signed by a majority of the other Trustees; and (d) any Trustee may be removed at any special meeting of shareholders by a two-thirds vote of the outstanding voting securities of the trust. Each Trustee who is not an interested person (as defined in the 1940 Act) of the trust and the fund is referred to herein as an Independent Trustee. Each Independent Trustee shall retire not later than the last day of the calendar year in which his or her 75th birthday occurs. The Independent Trustees may waive this mandatory retirement age policy with respect to individual Trustees. Officers and Advisory Board Members hold office without limit in time, except that any officer or Advisory Board Member may resign or may be removed by a vote of a majority of the Trustees at any regular meeting or any special meeting of the Trustees. Except as indicated, each individual has held the office shown or other offices in the same company for the past five years.
The fund’s Statement of Additional Information (SAI) includes more information about the Trustees. To request a free copy, call Fidelity at 1-877-208-0098.
Experience, Skills, Attributes, and Qualifications of the Trustees. The Governance and Nominating Committee has adopted a statement of policy that describes the experience, qualifications, attributes, and skills that are necessary and desirable for potential Independent Trustee candidates (Statement of Policy). The Board believes that each Trustee satisfied at the time he or she was initially elected or appointed a Trustee, and continues to satisfy, the standards contemplated by the Statement of Policy. The Governance and Nominating Committee also engages professional search firms to help identify potential Independent Trustee candidates who have the experience, qualifications, attributes, and skills consistent with the Statement of Policy. From time to time, additional criteria based on the composition and skills of the current Independent Trustees, as well as experience or skills that may be appropriate in light of future changes to board composition, business conditions, and regulatory or other developments, have also been considered by the professional search firms and the Governance and Nominating Committee. In addition, the Board takes into account the Trustees' commitment and participation in Board and committee meetings, as well as their leadership of standing and ad hoc committees throughout their tenure.
In determining that a particular Trustee was and continues to be qualified to serve as a Trustee, the Board has considered a variety of criteria, none of which, in isolation, was controlling. The Board believes that, collectively, the Trustees have balanced and diverse experience, qualifications, attributes, and skills, which allow the Board to operate effectively in governing the fund and protecting the interests of shareholders. Information about the specific experience, skills, attributes, and qualifications of each Trustee, which in each case led to the Board's conclusion that the Trustee should serve (or continue to serve) as a trustee of the fund, is provided below.
Board Structure and Oversight Function. James C. Curvey is an interested person and currently serves as Chairman. The Trustees have determined that an interested Chairman is appropriate and benefits shareholders because an interested Chairman has a personal and professional stake in the quality and continuity of services provided to the fund. Independent Trustees exercise their informed business judgment to appoint an individual of their choosing to serve as Chairman, regardless of whether the Trustee happens to be independent or a member of management. The Independent Trustees have determined that they can act independently and effectively without having an Independent Trustee serve as Chairman and that a key structural component for assuring that they are in a position to do so is for the Independent Trustees to constitute a substantial majority for the Board. The Independent Trustees also regularly meet in executive session. Ned C. Lautenbach serves as Chairman of the Independent Trustees and as such (i) acts as a liaison between the Independent Trustees and management with respect to matters important to the Independent Trustees and (ii) with management prepares agendas for Board meetings.
Fidelity® funds are overseen by different Boards of Trustees. The fund's Board oversees Fidelity's high income and certain equity funds, and other Boards oversee Fidelity's investment-grade bond, money market, asset allocation, and sector funds. The asset allocation funds may invest in Fidelity® funds overseen by the fund's Board. The use of separate Boards, each with its own committee structure, allows the Trustees of each group of Fidelity® funds to focus on the unique issues of the funds they oversee, including common research, investment, and operational issues. On occasion, the separate Boards establish joint committees to address issues of overlapping consequences for the Fidelity® funds overseen by each Board.
The Trustees operate using a system of committees to facilitate the timely and efficient consideration of all matters of importance to the Trustees, the fund, and fund shareholders and to facilitate compliance with legal and regulatory requirements and oversight of the fund's activities and associated risks. The Board, acting through its committees, has charged FMR and its affiliates with (i) identifying events or circumstances the occurrence of which could have demonstrably adverse effects on the fund's business and/or reputation; (ii) implementing processes and controls to lessen the possibility that such events or circumstances occur or to mitigate the effects of such events or circumstances if they do occur; and (iii) creating and maintaining a system designed to evaluate continuously business and market conditions in order to facilitate the identification and implementation processes described in (i) and (ii) above. Because the day-to-day operations and activities of the fund are carried out by or through FMR, its affiliates, and other service providers, the fund's exposure to risks is mitigated but not eliminated by the processes overseen by the Trustees. While each of the Board's committees has responsibility for overseeing different aspects of the fund's activities, oversight is exercised primarily through the Operations, Audit, and Compliance Committees. In addition, the Independent Trustees have worked with FMR to enhance the Board's oversight of investment and financial risks, legal and regulatory risks, technology risks, and operational risks, including the development of additional risk reporting to the Board. For example, a working group comprised of Independent Trustees and FMR has worked and continues to work to review the Fidelity® funds' valuation-related activities, reporting and risk management. Appropriate personnel, including but not limited to the fund's Chief Compliance Officer (CCO), FMR's internal auditor, the independent accountants, the fund's Treasurer and portfolio management personnel, make periodic reports to the Board's committees, as appropriate, including an annual review of Fidelity's risk management program for the Fidelity® funds. The responsibilities of each standing committee, including their oversight responsibilities, are described further under "Standing Committees of the Trustees."
Interested Trustees*:
Correspondence intended for a Trustee who is an interested person may be sent to Fidelity Investments, 245 Summer Street, Boston, Massachusetts 02210.
Name, Year of Birth; Principal Occupations and Other Relevant Experience+
James C. Curvey (1935)
Year of Election or Appointment: 2007
Trustee
Chairman of the Board of Trustees
Mr. Curvey also serves as Trustee of other Fidelity® funds. Mr. Curvey is a Director of Fidelity Research & Analysis Co. (investment adviser firm, 2009-present), and Vice Chairman (2007-present) and Director of FMR LLC (diversified financial services company). In addition, Mr. Curvey serves as an Overseer for the Boston Symphony Orchestra and a member of the board of Artis-Naples, Naples, Florida, and as a Trustee for Brewster Academy, Wolfeboro, New Hampshire. Previously, Mr. Curvey served as a Director of Fidelity Investments Money Management, Inc. (investment adviser firm, 2009-2014) and a Director of FMR and FMR Co., Inc. (investment adviser firms, 2007-2014).
Charles S. Morrison (1960)
Year of Election or Appointment: 2014
Trustee
Mr. Morrison also serves as Trustee of other funds. He serves as a Director of Fidelity Investments Money Management, Inc. (FIMM) (investment adviser firm, 2014-present), Director of Fidelity SelectCo, LLC (investment adviser firm, 2014-present), President, Asset Management (2014-present), and is an employee of Fidelity Investments. Previously, Mr. Morrison served as Vice President of Fidelity's Fixed Income and Asset Allocation Funds (2012-2014), President, Fixed Income (2011-2014), Vice President of Fidelity's Money Market Funds (2005-2009), President, Money Market Group Leader of FMR (investment adviser firm, 2009), and Senior Vice President, Money Market Group of FMR (2004-2009). Mr. Morrison also served as Vice President of Fidelity's Bond Funds (2002-2005), certain Balanced Funds (2002-2005), and certain Asset Allocation Funds (2002-2007), and as Senior Vice President (2002-2005) of Fidelity's Bond Division.
* Determined to be an “Interested Trustee” by virtue of, among other things, his or her affiliation with the trust or various entities under common control with FMR.
+ The information includes the Trustee's principal occupation during the last five years and other information relating to the experience, attributes, and skills relevant to the Trustee's qualifications to serve as a Trustee, which led to the conclusion that the Trustee should serve as a Trustee for the fund.
Independent Trustees:
Correspondence intended for an Independent Trustee may be sent to Fidelity Investments, P.O. Box 55235, Boston, Massachusetts 02205-5235.
Name, Year of Birth; Principal Occupations and Other Relevant Experience+
Dennis J. Dirks (1948)
Year of Election or Appointment: 2005
Trustee
Mr. Dirks also serves as Trustee of other Fidelity® funds. Prior to his retirement in May 2003, Mr. Dirks was Chief Operating Officer and a member of the Board of The Depository Trust & Clearing Corporation (DTCC). He also served as President, Chief Operating Officer, and Board member of The Depository Trust Company (DTC) and President and Board member of the National Securities Clearing Corporation (NSCC). In addition, Mr. Dirks served as Chief Executive Officer and Board member of the Government Securities Clearing Corporation, Chief Executive Officer and Board member of the Mortgage-Backed Securities Clearing Corporation, as a Trustee and a member of the Finance Committee of Manhattan College (2005-2008), as a Trustee and a member of the Finance Committee of AHRC of Nassau County (2006-2008), and as a member of the Independent Directors Council (IDC) Governing Council (2010-2015). Mr. Dirks is a member of the Board of Directors for The Brookville Center for Children's Services, Inc. (2009-present).
Alan J. Lacy (1953)
Year of Election or Appointment: 2008
Trustee
Mr. Lacy also serves as Trustee of other Fidelity® funds. Mr. Lacy serves as a member of the Board of Directors of Dave & Buster's Entertainment, Inc. (restaurant and entertainment complexes, 2010-present) and Bristol-Myers Squibb Company (global pharmaceuticals, 2008-present). In addition, Mr. Lacy served as Senior Adviser (2007-2014) of Oak Hill Capital Partners, L.P. (private equity) and also served as Chief Executive Officer (2000-2005) and Vice Chairman (2005-2006) of Sears Holdings Corporation and Sears, Roebuck and Co. (retail). Mr. Lacy is a member of the Board of Trustees of The National Parks Conservation Association (2006-present). Previously, Mr. Lacy served as Chairman of the Board of Trustees of the National Parks Conservation Association (2008-2011) and as a member of the Board of Directors for The Western Union Company (global money transfer, 2006-2011), The Hillman Companies, Inc. (hardware wholesalers, 2010-2014), and Earth Fare, Inc. (retail grocery, 2010-2014).
Ned C. Lautenbach (1944)
Year of Election or Appointment: 2000
Trustee
Chairman of the Independent Trustees
Mr. Lautenbach also serves as Trustee of other Fidelity® funds. Mr. Lautenbach currently serves as the Lead Director of the Eaton Corporation Board of Directors (diversified industrial, 1997-present). Mr. Lautenbach is Chairman of the Board of Directors of Artis-Naples in Naples, Florida (2012-present), a member of the Council on Foreign Relations (1994-present), and a member of the Board of Governors, State University System of Florida (2013-present). Previously, Mr. Lautenbach was a Partner/Advisory Partner at Clayton, Dubilier & Rice, LLC (private equity investment, 1998-2010), as well as a Director of Sony Corporation (2006-2007).
Joseph Mauriello (1944)
Year of Election or Appointment: 2008
Trustee
Mr. Mauriello also serves as Trustee of other Fidelity® funds. Prior to his retirement in January 2006, Mr. Mauriello served in numerous senior management positions including Deputy Chairman and Chief Operating Officer (2004-2005), and Vice Chairman of Financial Services (2002-2004) of KPMG LLP US (professional services, 1965-2005). Mr. Mauriello currently serves as a member of the Board of Directors of XL Group plc. (global insurance and re-insurance, 2006-present) and the Independent Directors Council (IDC) Governing Council (2015-present). Previously, Mr. Mauriello served as a Director of the Hamilton Funds of the Bank of New York (2006-2007) and of Arcadia Resources Inc. (health care services and products, 2007-2012).
Robert W. Selander (1950)
Year of Election or Appointment: 2011
Trustee
Mr. Selander also serves as Trustee of other Fidelity® funds. Mr. Selander serves as a Director of The Western Union Company (global money transfer, 2014-present). Previously, Mr. Selander served as a Member of the Advisory Board of other Fidelity® funds (2011), and Executive Vice Chairman (2010), Chief Executive Officer (2009-2010), and President and Chief Executive Officer (1997-2009) of Mastercard, Inc.
Cornelia M. Small (1944)
Year of Election or Appointment: 2005
Trustee
Ms. Small also serves as Trustee of other Fidelity® funds. Ms. Small is a member of the Board of Directors (2009-present) and Chair of the Investment Committee (2010-present) of the Teagle Foundation. Ms. Small also serves on the Investment Committee of the Berkshire Taconic Community Foundation (2008-present). Previously, Ms. Small served as Chairperson (2002-2008) and a member of the Investment Committee and Chairperson (2008-2012) and a member of the Board of Trustees of Smith College. In addition, Ms. Small served as Chief Investment Officer, Director of Global Equity Investments, and a member of the Board of Directors of Scudder, Stevens & Clark and Scudder Kemper Investments.
William S. Stavropoulos (1939)
Year of Election or Appointment: 2002
Trustee
Vice Chairman of the Independent Trustees
Mr. Stavropoulos also serves as Trustee of other Fidelity® funds. Mr. Stavropoulos serves as President and Founder of the Michigan Baseball Foundation, the Great Lakes Loons (2007-present). Mr. Stavropoulos is Chairman Emeritus of the Board of Directors of The Dow Chemical Company, where he previously served in numerous senior management positions, including President, CEO (1995-2000; 2002-2004), Chairman of the Executive Committee (2000-2006), and as a member of the Board of Directors (1990-2006). Currently, Mr. Stavropoulos is Chairman of the Board of Directors of Univar Inc. (global distributor of commodity and specialty chemicals), a Director of Teradata Corporation (data warehousing and technology solutions), and Maersk Inc. (industrial conglomerate), and a member of the Advisory Board for Metalmark Capital LLC (private equity investment, 2005-present). Mr. Stavropoulos is an operating advisor to Clayton, Dubilier & Rice, LLC (private equity investment). In addition, Mr. Stavropoulos is a member of the University of Notre Dame Advisory Council for the College of Science, a Trustee of the Rollin L. Gerstacker Foundation, and a Director of the Naples Philharmonic Center for the Arts. Previously, Mr. Stavropoulos served as a Director of Chemical Financial Corporation (bank holding company, 1993-2012) and Tyco International, Ltd. (multinational manufacturing and services, 2007-2012).
David M. Thomas (1949)
Year of Election or Appointment: 2008
Trustee
Mr. Thomas also serves as Trustee of other Fidelity® funds. Mr. Thomas serves as Non-Executive Chairman of the Board of Directors of Fortune Brands Home and Security (home and security products, 2011-present), as a member of the Board of Directors (2004-present) and Presiding Director (2013-present) of Interpublic Group of Companies, Inc. (marketing communication), and as a member of the Board of Trustees of the University of Florida (2013-present). Previously, Mr. Thomas served as Executive Chairman (2005-2006) and Chairman and Chief Executive Officer (2000-2005) of IMS Health, Inc. (pharmaceutical and healthcare information solutions), and a Director of Fortune Brands, Inc. (consumer products, 2000-2011).
+ The information includes the Trustee's principal occupation during the last five years and other information relating to the experience, attributes, and skills relevant to the Trustee's qualifications to serve as a Trustee, which led to the conclusion that the Trustee should serve as a Trustee for the fund.
Advisory Board Members and Officers:
Correspondence intended for an officer or Peter S. Lynch may be sent to Fidelity Investments, 245 Summer Street, Boston, Massachusetts 02210. Officers appear below in alphabetical order.
Name, Year of Birth; Principal Occupation
Peter S. Lynch (1944)
Year of Election or Appointment: 2003
Member of the Advisory Board
Mr. Lynch also serves as Member of the Advisory Board of other Fidelity® funds. Mr. Lynch is Vice Chairman and a Director of FMR (investment adviser firm) and FMR Co., Inc. (investment adviser firm). In addition, Mr. Lynch serves as a Trustee of Boston College and as the Chairman of the Inner-City Scholarship Fund. Previously, Mr. Lynch served on the Special Olympics International Board of Directors (1997-2006).
Elizabeth Paige Baumann (1968)
Year of Election or Appointment: 2012
Anti-Money Laundering (AML) Officer
Ms. Baumann also serves as AML Officer of other funds. She is Chief AML Officer of FMR LLC (diversified financial services company, 2012-present) and is an employee of Fidelity Investments. Previously, Ms. Baumann served as Vice President and Deputy Anti-Money Laundering Officer (2007-2012).
Marc R. Bryant (1966)
Year of Election or Appointment: 2015
Secretary and Chief Legal Officer (CLO)
Mr. Bryant also serves as Secretary and CLO of other funds. Mr. Bryant serves as CLO, Secretary, and Senior Vice President of Fidelity Management & Research Company (investment adviser firm, 2015-present) and FMR Co., Inc. (investment adviser firm, 2015-present); Secretary of Fidelity SelectCo, LLC (investment adviser firm, 2015-present) and Fidelity Investments Money Management, Inc. (investment adviser firm, 2015-present); and CLO of Fidelity Management & Research (Hong Kong) Limited (investment adviser firm, 2015-present). He is Senior Vice President and Deputy General Counsel of FMR LLC (diversified financial services company). Previously, Mr. Bryant served as Secretary and CLO of Fidelity Rutland Square Trust II (2010-2014) and Assistant Secretary of Fidelity's Fixed Income and Asset Allocation Funds (2013-2015). Prior to joining Fidelity Investments, Mr. Bryant served as a Senior Vice President and the Head of Global Retail Legal for AllianceBernstein L.P. (2006-2010), and as the General Counsel for ProFund Advisors LLC (2001-2006).
William C. Coffey (1969)
Year of Election or Appointment: 2009
Assistant Secretary
Mr. Coffey also serves as Assistant Secretary of other funds. He is Senior Vice President and Deputy General Counsel of FMR LLC (diversified financial services company, 2010-present), and is an employee of Fidelity Investments. Previously, Mr. Coffey served as Vice President and Associate General Counsel of FMR LLC (2005-2009).
Jonathan Davis (1968)
Year of Election or Appointment: 2010
Assistant Treasurer
Mr. Davis also serves as Assistant Treasurer of other funds, and is an employee of Fidelity Investments. Previously, Mr. Davis served as Vice President and Associate General Counsel of FMR LLC (diversified financial services company, 2003-2010).
Adrien E. Deberghes (1967)
Year of Election or Appointment: 2008
Deputy Treasurer
Mr. Deberghes also serves as an officer of other funds. He is an employee of Fidelity Investments (2008-present). Prior to joining Fidelity Investments, Mr. Deberghes was Senior Vice President of Mutual Fund Administration at State Street Corporation (2007-2008), Senior Director of Mutual Fund Administration at Investors Bank & Trust (2005-2007), and Director of Finance for Dunkin' Brands (2000-2005).
Stephanie J. Dorsey (1969)
Year of Election or Appointment: 2010
Assistant Treasurer
Ms. Dorsey also serves as an officer of other funds. She is an employee of Fidelity Investments (2008-present) and has served in other fund officer roles. Prior to joining Fidelity Investments, Ms. Dorsey served as Treasurer (2004-2008) of the JPMorgan Mutual Funds and Vice President (2004-2008) of JPMorgan Chase Bank.
Howard J. Galligan III (1966)
Year of Election or Appointment: 2014
Chief Financial Officer
Mr. Galligan also serves as Chief Financial Officer of other funds. Mr. Galligan serves as President of Fidelity Pricing and Cash Management Services (FPCMS) (2014-present) and as a Director of Strategic Advisers, Inc. (investment adviser firm, 2008-present). Previously, Mr. Galligan served as Chief Administrative Officer of Asset Management (2011-2014) and Chief Operating Officer and Senior Vice President of Investment Support for Strategic Advisers, Inc. (2003-2011).
Scott C. Goebel (1968)
Year of Election or Appointment: 2015
Vice President
Mr. Goebel serves as Vice President of other funds and is an employee of Fidelity Investments (2001-present). Previously, Mr. Goebel served as Secretary of Fidelity SelectCo, LLC (investment adviser firm, 2013-2015), Fidelity Investments Money Management, Inc. (FIMM) (investment adviser firm, 2010-2015), and Fidelity Research and Analysis Company (FRAC) (investment adviser firm, 2010-2015); General Counsel, Secretary, and Senior Vice President of Fidelity Management & Research Company (investment adviser firm, 2008-2015) and FMR Co., Inc. (investment adviser firm, 2008-2015); Assistant Secretary of Fidelity Management & Research (Japan) Limited (investment adviser firm, 2008-2015) and FMR Investment Management (U.K.) Limited (investment adviser firm, 2008-2015); Chief Legal Officer (CLO) of Fidelity Management & Research (Hong Kong) Limited (investment adviser firm, 2008-2015); Secretary and CLO of certain Fidelity® funds (2008-2015); Assistant Secretary of FIMM (2008-2010), FRAC (2008-2010), and certain funds (2007-2008); and as Vice President and Secretary of Fidelity Distributors Corporation (FDC) (2005-2007).
Brian B. Hogan (1964)
Year of Election or Appointment: 2009
Vice President
Mr. Hogan also serves as Trustee or Vice President of other funds. Mr. Hogan serves as a Director of Fidelity SelectCo, LLC (investment adviser firm, 2014-present) and President of the Equity Division of FMR (investment adviser firm, 2009-present). Previously, Mr. Hogan served as Senior Vice President, Equity Research of FMR (2006-2009) and as a portfolio manager.
Chris Maher (1972)
Year of Election or Appointment: 2013
Assistant Treasurer
Mr. Maher serves as Assistant Treasurer of other funds. Mr. Maher is Vice President of Valuation Oversight and is an employee of Fidelity Investments. Previously, Mr. Maher served as Vice President of Asset Management Compliance (2013), Vice President of the Program Management Group of FMR (investment adviser firm, 2010-2013), and Vice President of Valuation Oversight (2008-2010).
Melissa M. Reilly (1971)
Year of Election or Appointment: 2014
Vice President of certain Equity Funds
Ms. Reilly also serves as Vice President of other funds. Ms. Reilly is an employee of Fidelity Investments (2004-present).
Kenneth B. Robins (1969)
Year of Election or Appointment: 2008
President and Treasurer
Mr. Robins also serves as an officer of other funds. Mr. Robins serves as Executive Vice President of Fidelity Investments Money Management, Inc. (FIMM) (investment adviser firm, 2013-present) and is an employee of Fidelity Investments (2004-present). Previously, Mr. Robins served in other fund officer roles.
Stacie M. Smith (1974)
Year of Election or Appointment: 2013
Deputy Treasurer
Ms. Smith also serves as an officer of other funds. She is an employee of Fidelity Investments (2009-present) and has served in other fund officer roles. Prior to joining Fidelity Investments, Ms. Smith served as Senior Audit Manager of Ernst & Young LLP (1996-2009).
Renee Stagnone (1975)
Year of Election or Appointment: 2013
Deputy Treasurer
Ms. Stagnone also serves as Deputy Treasurer of other funds. Ms. Stagnone is an employee of Fidelity Investments (1997-present).
Linda J. Wondrack (1964)
Year of Election or Appointment: 2014
Chief Compliance Officer
Ms. Wondrack also serves as Chief Compliance Officer of other funds. Ms. Wondrack is Executive Vice President and head of the Ethics Office and Asset Management Compliance for Fidelity Investments (2012-present). Ms. Wondrack also serves as Chief Compliance Officer of Fidelity SelectCo, LLC (investment adviser firm, 2014-present); Chief Compliance Officer of Impresa Management LLC (2013-present); and Chief Compliance Officer of FMR Co., Inc. (investment adviser firm), Fidelity Investments Money Management, Inc. (investment adviser firm), Fidelity Management & Research (Japan) Limited (investment adviser firm), FMR Investment Management (U.K.) Limited (investment adviser firm), Fidelity Management & Research (Hong Kong) (investment adviser firm), Fidelity Management & Research Company (investment adviser firm), FIAM LLC (investment adviser firm), and Strategic Advisers, Inc. (investment adviser firm), Ballyrock Investment Advisors LLC, and Northern Neck Investors LLC (2012-present). Previously, Ms. Wondrack served as Senior Vice President and Chief Compliance Officer for Columbia Management Investment Advisers, LLC (2005-2012); Chief Compliance Officer for certain funds within the Columbia Family of Funds (2007-2012); and Senior Vice President of Compliance Risk Management at Bank of America (2005-2010).
Joseph F. Zambello (1957)
Year of Election or Appointment: 2011
Deputy Treasurer
Mr. Zambello also serves as Deputy Treasurer of other funds. Mr. Zambello is an employee of Fidelity Investments (1991-present). Previously, Mr. Zambello served as Vice President of the Program Management Group of FMR (investment adviser firm, 2009-2011) and Vice President of the Transfer Agent Oversight Group (2005-2009).
Shareholder Expense Example
As a shareholder of the Fund, you incur two types of costs: (1) transaction costs, and (2) ongoing costs, including management fees and other Fund expenses. This Example is intended to help you understand your ongoing costs (in dollars) of investing in the Fund and to compare these costs with the ongoing costs of investing in other mutual funds.
The Example is based on an investment of $1,000 invested at the beginning of the period and held for the entire period (June 1, 2015 to November 30, 2015).
Actual Expenses
The first line of the accompanying table provides information about actual account values and actual expenses. You may use the information in this line, together with the amount you invested, to estimate the expenses that you paid over the period. Simply divide your account value by $1,000.00 (for example, an $8,600 account value divided by $1,000.00 = 8.6), then multiply the result by the number in the first line under the heading entitled "Expenses Paid During Period" to estimate the expenses you paid on your account during this period. In addition, the Fund, as a shareholder in the underlying Fidelity Central Funds, will indirectly bear its pro-rata share of the fees and expenses incurred by the underlying Fidelity Central Funds. These fees and expenses are not included in the Fund's annualized expense ratio used to calculate the expense estimate in the table below.
Hypothetical Example for Comparison Purposes
The second line of the accompanying table provides information about hypothetical account values and hypothetical expenses based on the Fund's actual expense ratio and an assumed rate of return of 5% per year before expenses, which is not the Fund's actual return. The hypothetical account values and expenses may not be used to estimate the actual ending account balance or expenses you paid for the period. You may use this information to compare the ongoing costs of investing in the Fund and other funds. To do so, compare this 5% hypothetical example with the 5% hypothetical examples that appear in the shareholder reports of the other funds. In addition, the Fund, as a shareholder in the underlying Fidelity Central Funds, will indirectly bear its pro-rata share of the fees and expenses incurred by the underlying Fidelity Central Funds. These fees and expenses are not included in the Fund's annualized expense ratio used to calculate the expense estimate in the table below.
Please note that the expenses shown in the table are meant to highlight your ongoing costs only and do not reflect any transaction costs. Therefore, the second line of the table is useful in comparing ongoing costs only, and will not help you determine the relative total costs of owning different funds.
| Annualized Expense Ratio-A | Beginning Account Value June 1, 2015 | Ending Account Value November 30, 2015 | Expenses Paid During Period-B June 1, 2015 to November 30, 2015 | |
| Actual | .74% | $1,000.00 | $1,009.10 | $3.73 |
| Hypothetical-C | $1,000.00 | $1,021.36 | $3.75 |
A Annualized expense ratio reflects expenses net of applicable fee waivers.
B Expenses are equal to the Fund's annualized expense ratio, multiplied by the average account value over the period, multiplied by 183/365 (to reflect the one-half year period).
C 5% return per year before expenses
Distributions (Unaudited)
The Board of Trustees of Fidelity Advisor Series Growth Opportunities voted to pay to shareholders of record at the opening of business on record date, the following distributions per share derived from capital gains realized from sales of portfolio securities, and dividends derived from net investment income:
| Pay Date | Record Date | Dividends | Capital Gains | |
| Fidelity Advisor Series Growth Opportunities | 12/14/15 | 12/11/15 | $0.070 | $1.206 |
| 01/19/16 | 01/15/16 | $0.000 | $0.060 |
The fund hereby designates as a capital gain with respect to the taxable year ended November 30, 2015 $65,183,099, or, if subsequently determined to be different, the net capital gain of such year.
The fund designates 45% of the dividends distributed, during the fiscal year as qualifying for the dividends received deduction for corporate shareholders.
The fund designates 46% of the dividends distributed, during the fiscal year as amounts which may be taken into account as a dividend for the purposes of the maximum rate under section l (h) (ll) of the Internal Revenue Code.
The fund will notify shareholders in January 2016 of amounts for use in preparing 2015 income tax returns.
Board Approval of Investment Advisory Contracts and Management Fees
Fidelity Advisor Series Growth Opportunities Fund
Each year, the Board of Trustees, including the Independent Trustees (together, the Board), votes on the renewal of the management contract with Fidelity Management & Research Company (FMR) and the sub-advisory agreements (together, the Advisory Contracts) for the fund. The Board, assisted by the advice of fund counsel and Independent Trustees' counsel, requests and considers a broad range of information relevant to the renewal of the Advisory Contracts throughout the year.
The Board meets regularly and, at each of its meetings, covers an extensive agenda of topics and materials and considers factors that are relevant to its annual consideration of the renewal of the fund's Advisory Contracts, including the services and support provided to the fund and its shareholders. The Board has established various standing committees (Committees), each composed of and chaired by Independent Trustees with varying backgrounds, to which the Board has assigned specific subject matter responsibilities in order to enhance effective decision-making by the Board. The Board, acting directly and through its Committees, requests and receives information concerning the annual consideration of the renewal of the fund's Advisory Contracts. The Board also meets as needed to consider matters specifically related to the Board's annual consideration of the renewal of the Advisory Contracts. Members of the Board may also meet with trustees of other Fidelity funds through ad hoc joint committees to discuss certain matters relevant to all of the Fidelity funds.
At its July 2015 meeting, the Board unanimously determined to renew the fund's Advisory Contracts. In reaching its determination, the Board considered all factors it believed relevant, including (i) the nature, extent, and quality of the services to be provided to the fund and its shareholders (including the investment performance of the fund); (ii) the competitiveness of the fund's management fee and total expense ratio relative to peer funds; (iii) the total costs of the services to be provided by and the profits to be realized by Fidelity from its relationship with the fund; and (iv) the extent to which (if any) economies of scale exist and would be realized as the fund grows, and whether any economies of scale are appropriately shared with fund shareholders.
In considering whether to renew the Advisory Contracts for the fund, the Board reached a determination, with the assistance of fund counsel and Independent Trustees' counsel and through the exercise of its business judgment, that the renewal of the Advisory Contracts was in the best interests of the fund and its shareholders and that the compensation payable under the Advisory Contracts was fair and reasonable. The Board's decision to renew the Advisory Contracts was not based on any single factor, but rather was based on a comprehensive consideration of all the information provided to the Board at its meetings throughout the year. The Board, in reaching its determination to renew the Advisory Contracts, was aware that shareholders of the fund have a broad range of investment choices available to them, including a wide choice among funds offered by Fidelity's competitors, and that the fund's shareholders, who have the opportunity to review and weigh the disclosure provided by the fund in its prospectus and other public disclosures, have chosen to invest in this fund, which is part of the Fidelity family of funds.
Nature, Extent, and Quality of Services Provided. The Board considered Fidelity's staffing as it relates to the fund, including the backgrounds of investment personnel of Fidelity, and also considered the fund's investment objective, strategies, and related investment philosophy. The Independent Trustees also had discussions with senior management of Fidelity's investment operations and investment groups. The Board considered the structure of the portfolio manager compensation program and whether this structure provides appropriate incentives to act in the best interests of the fund. Additionally, the Board considered the portfolio managers' investments, if any, in the funds that they manage.Resources Dedicated to Investment Management and Support Services. The Board and the Fund Oversight and Research Committees reviewed the general qualifications and capabilities of Fidelity's investment staff, including its size, education, experience, and resources, as well as Fidelity's approach to recruiting, training, managing, and compensating investment personnel. The Board noted that Fidelity has continued to increase the resources devoted to non-U.S. offices, including expansion of Fidelity's global investment organization. The Board also noted that Fidelity's analysts have extensive resources, tools and capabilities that allow them to conduct sophisticated quantitative and fundamental analysis, as well as credit analysis of issuers, counterparties and guarantors. Further, the Board considered that Fidelity's investment professionals have sufficient access to global information and data so as to provide competitive investment results over time, and that those professionals also have access to sophisticated tools that permit them to assess portfolio construction and risk and performance attribution characteristics continuously, as well as to transmit new information and research conclusions rapidly around the world. Additionally, in its deliberations, the Board considered Fidelity's trading, risk management, and compliance capabilities and resources, which are integral parts of the investment management process.Shareholder and Administrative Services. The Board considered (i) the nature, extent, quality, and cost of advisory, administrative, and shareholder services performed by FMR, the sub-advisers (together with FMR, the Investment Advisers), and their affiliates under the Advisory Contracts and under separate agreements covering transfer agency, pricing and bookkeeping, and securities lending services for the fund; (ii) the nature and extent of the supervision of third party service providers, principally custodians and subcustodians; and (iii) the resources devoted to, and the record of compliance with, the fund's compliance policies and procedures. The Board also reviewed the allocation of fund brokerage, including allocations to brokers affiliated with the Investment Advisers, the use of brokerage commissions to pay fund expenses, and the use of "soft" commission dollars to pay for research services.The Board noted that the growth of fund assets over time across the complex allows Fidelity to reinvest in the development of services designed to enhance the value or convenience of the Fidelity funds as investment vehicles. These services include 24-hour access to account information and market information through telephone representatives and over the Internet, investor education materials and asset allocation tools, and the expanded availability of Fidelity Investor Centers.In 2014, the Board formed an ad hoc Committee on Transfer Agency Fees to review the variety of transfer agency fee structures throughout the industry and Fidelity's competitive positioning with respect to industry participants.Investment in a Large Fund Family. The Board considered the benefits to shareholders of investing in a Fidelity fund, including the benefits of investing in a fund that is part of a large family of funds offering a variety of investment disciplines and providing a large variety of mutual fund investor services. The Board noted that Fidelity had taken, or had made recommendations that resulted in the Fidelity funds taking, a number of actions over the previous year that benefited particular funds, including (i) continuing to dedicate additional resources to investment research and to the support of the senior management team that oversees asset management; (ii) continuing efforts to enhance Fidelity's global research capabilities; (iii) launching new funds and making other enhancements to meet client needs; (iv) reducing management fees and total expenses for certain index funds and diversified international funds; (v) continuing to launch dedicated lower cost underlying funds to meet portfolio construction needs related to expanding underlying fund options for Fidelity funds of funds, specifically for the Freedom Fund product lines; (vi) rationalizing product lines and gaining increased efficiencies through fund mergers; (vii) launching active fixed-income exchange-traded funds; (viii) continuing to develop, acquire and implement systems and technology to improve services to the funds and information security and to increase efficiency; (ix) implementing investment enhancements to further strengthen Fidelity's target date product line to increase investors' probability of success in achieving their goals; (x) modifying the eligibility criteria for certain share classes to accommodate roll-over assets from employer-sponsored retirement plans; (xi) launching a new Class W of the Freedom Index Funds to attract and retain Fidelity record-kept retirement plan assets; and (xii) implementing changes to Fidelity's money market product line in response to recent money market regulatory reforms.Investment Performance. The Board considered whether the fund has operated in accordance with its investment objective, as well as its record of compliance with its investment restrictions and its performance history. The Board noted that there was a portfolio management change for the fund in March 2015.The Board took into account discussions with representatives of the Investment Advisers about fund investment performance that occur at Board meetings throughout the year. In this regard the Board noted that as part of regularly scheduled fund reviews and other reports to the Board on fund performance, the Board considers annualized return information for the fund, for different time periods, measured against a securities market index ("benchmark index") and a peer group of funds with similar objectives ("peer group"), if any. In its evaluation of fund investment performance, the Board gave particular attention to information indicating changes in performance of certain Fidelity funds for specific time periods and discussed with the Investment Advisers the reasons for any overperformance or underperformance.In addition to reviewing absolute and relative fund performance, the Independent Trustees periodically consider the appropriateness of fund performance metrics in evaluating the results achieved. In general, the Independent Trustees believe that fund performance should be evaluated based on net performance (after fees and expenses) of both the highest performing and lowest performing fund share classes, where applicable, compared to appropriate benchmark indices, over appropriate time periods that may include full market cycles, and compared to peer groups, as applicable, over the same periods, taking into account relevant factors including the following: general market conditions; issuer-specific information; and fund cash flows and other factors.The Independent Trustees recognize that shareholders evaluate performance on a net basis over their own holding periods, for which one-, three-, and five-year periods are often used as a proxy. For this reason, the performance information reviewed by the Board also included net cumulative calendar year total return information for the fund and an appropriate benchmark index and peer group for the most recent one-year period, as shown below. Returns are shown compared to the 25th percentile (top of box, 75% beaten) and 75th percentile (bottom of box, 25% beaten) of the peer universe.Fidelity Advisor Series Growth Opportunities Fund
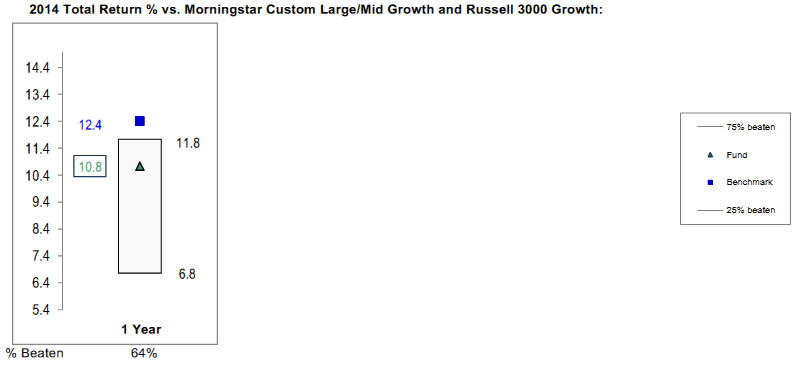
Fidelity Advisor Series Growth Opportunities Fund
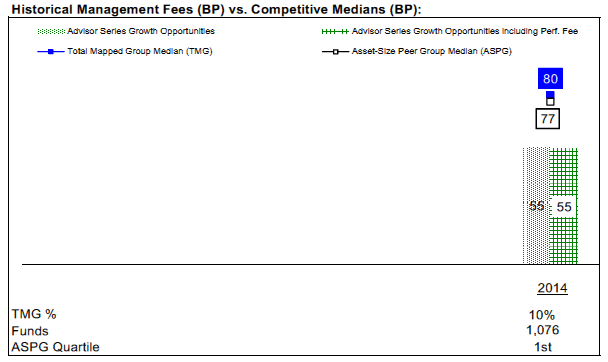
![]()
Corporate Headquarters
245 Summer St.
Boston, MA 02210
www.fidelity.com
AXS3-ANN-0116
1.967930.102
Fidelity Advisor® Stock Selector Mid Cap Fund Class I (formerly Institutional Class) Annual Report November 30, 2015 |
|
Contents
Board Approval of Investment Advisory Contracts and Management Fees |
To view a fund's proxy voting guidelines and proxy voting record for the 12-month period ended June 30, visit http://www.fidelity.com/proxyvotingresults or visit the Securities and Exchange Commission's (SEC) web site at http://www.sec.gov.
You may also call 1-877-208-0098 to request a free copy of the proxy voting guidelines.
Standard & Poor's, S&P and S&P 500 are registered service marks of The McGraw-Hill Companies, Inc. and have been licensed for use by Fidelity Distributors Corporation.
Other third-party marks appearing herein are the property of their respective owners.
All other marks appearing herein are registered or unregistered trademarks or service marks of FMR LLC or an affiliated company. © 2016 FMR LLC. All rights reserved.
This report and the financial statements contained herein are submitted for the general information of the shareholders of the Fund. This report is not authorized for distribution to prospective investors in the Fund unless preceded or accompanied by an effective prospectus.
A fund files its complete schedule of portfolio holdings with the SEC for the first and third quarters of each fiscal year on Form N-Q. Forms N-Q are available on the SEC’s web site at http://www.sec.gov. A fund's Forms N-Q may be reviewed and copied at the SEC’s Public Reference Room in Washington, DC. Information regarding the operation of the SEC's Public Reference Room may be obtained by calling 1-800-SEC-0330.
For a complete list of a fund's portfolio holdings, view the most recent holdings listing, semiannual report, or annual report on Fidelity's web site at http://www.fidelity.com, http://www.advisor.fidelity.com, or http://www.401k.com, as applicable.
NOT FDIC INSURED •MAY LOSE VALUE •NO BANK GUARANTEE
Neither the Fund nor Fidelity Distributors Corporation is a bank.
Performance: The Bottom Line
Average annual total return reflects the change in the value of an investment, assuming reinvestment of distributions from dividend income and capital gains (the profits earned upon the sale of securities that have grown in value, if any) and assuming a constant rate of performance each year.
The hypothetical investment and the average annual total returns do not reflect the deduction of taxes that a shareholder would pay on fund distributions or the redemption of fund shares.
During periods of reimbursement by Fidelity, a fund’s total return will be greater than it would be had the reimbursement not occurred.
How a fund did yesterday is no guarantee of how it will do tomorrow.
Average Annual Total Returns
| For the periods ended November 30, 2015 | Past 1 year | Past 5 years | Past 10 years |
| Class I | 0.80% | 11.32% | 6.16% |
$10,000 Over 10 Years
Let's say hypothetically that $10,000 was invested in Fidelity Advisor® Stock Selector Mid Cap Fund - Class I on November 30, 2005.
The chart shows how the value of your investment would have changed, and also shows how the S&P MidCap 400® Index performed over the same period.

| Period Ending Values | ||
| $18,188 | Fidelity Advisor® Stock Selector Mid Cap Fund - Class I | |
| $23,058 | S&P MidCap 400® Index | |
Management's Discussion of Fund Performance
Market Recap: U.S. stocks gained modestly for the 12 months ending November 30, 2015, helped by a strong October that largely erased a steep decline in August and September on concern about slowing economic growth emanating from China. Stocks benefited late in the period amid waning expectations for a near-term interest-rate hike by the U.S. Federal Reserve, additional economic stimulus in Europe and an interest-rate cut in China. The bellwether S&P 500® index advanced 2.75% for the period, with growth stocks in the benchmark far outpacing their value counterparts, as investors continued to seek growth in a subpar economic environment. Sector performance also varied widely, with more than 26 percentage points separating the leader from the laggard. Consumer discretionary (+14%) secured the top spot, benefiting from a combination of rising personal income and still-benign inflation. Information technology (+7%) and health care (+4%) also outpaced the broad market. Conversely, energy (-12%) performed worst, stymied by depressed commodity prices that also hit materials (-5%). Telecommunication services (-5%) and utilities (-4%), considered defensive sectors less sensitive to the economy, also lost ground. At period end, investors remained focused on the potential global implications of a stronger U.S. dollar and how China's transition toward a consumption-led economy may affect corporate earnings.Comments from Co-Portfolio Manager Shadman Riaz: For the year, most of the fund’s share classes (excluding sales charges, if applicable) delivered a modestly positive return, but lagged the 2.92% result of the benchmark S&P MidCap 400® Index. Stock selection was the primary source of the fund’s relative underperformance, especially in financials. Several out-of-index positions hurt performance, particularly mortgage servicer Ocwen Financial. We did not anticipate the severe impact of the New York Department of Financial Services’ regulatory action related to allegations of Ocwen’s financial irregularities. We eliminated the position by period end. Stock picks in information technology hurt, particularly within software & services. Out-of-benchmark semiconductor firm Marvell Technology Group, cloud-computing company Rackspace Holdings and semiconductor maker Skyworks Solutions all negatively affected the fund's return. Conversely, choices in the capital goods segment of industrials was beneficial, led by a stake in non-benchmark diversified technology company Roper Technologies. Interactive Brokers Group, an out-of-index global electronic broker, also helped on a relative basis.The views expressed above reflect those of the portfolio manager(s) only through the end of the period as stated on the cover of this report and do not necessarily represent the views of Fidelity or any other person in the Fidelity organization. Any such views are subject to change at any time based upon market or other conditions and Fidelity disclaims any responsibility to update such views. These views may not be relied on as investment advice and, because investment decisions for a Fidelity fund are based on numerous factors, may not be relied on as an indication of trading intent on behalf of any Fidelity fund.
Investment Summary (Unaudited)
Top Ten Stocks as of November 30, 2015
| % of fund's net assets | % of fund's net assets 6 months ago | |
| AMETEK, Inc. | 3.5 | 2.6 |
| Roper Technologies, Inc. | 3.2 | 2.5 |
| IDEX Corp. | 2.5 | 0.0 |
| Wabtec Corp. | 2.1 | 0.0 |
| PPG Industries, Inc. | 1.5 | 1.0 |
| Ecolab, Inc. | 1.5 | 1.6 |
| Jarden Corp. | 1.4 | 1.5 |
| Capital One Financial Corp. | 1.4 | 1.3 |
| NVR, Inc. | 1.3 | 0.9 |
| Teledyne Technologies, Inc. | 1.3 | 0.0 |
| 19.7 |
Top Five Market Sectors as of November 30, 2015
| % of fund's net assets | % of fund's net assets 6 months ago | |
| Financials | 24.8 | 22.9 |
| Information Technology | 16.9 | 17.1 |
| Industrials | 14.8 | 16.2 |
| Consumer Discretionary | 13.1 | 13.2 |
| Health Care | 8.3 | 8.5 |
Asset Allocation (% of fund's net assets)
| As of November 30, 2015 * | ||
| Stocks and Equity Futures | 96.8% | |
| Short-Term Investments and Net Other Assets (Liabilities) | 3.2% | |

* Foreign investments - 6.0%
| As of May 31, 2015 * | ||
| Stocks and Equity Futures | 98.4% | |
| Short-Term Investments and Net Other Assets (Liabilities) | 1.6% | |

* Foreign investments - 6.2%
Percentages shown as 0.0% may reflect amounts less than 0.05%.
Investments November 30, 2015
Showing Percentage of Net Assets
| Common Stocks - 96.3% | |||
| Shares | Value (000s) | ||
| CONSUMER DISCRETIONARY - 13.1% | |||
| Auto Components - 0.4% | |||
| Dorman Products, Inc. (a)(b) | 186,700 | $8,909 | |
| Automobiles - 0.7% | |||
| Harley-Davidson, Inc. | 337,800 | 16,525 | |
| Distributors - 0.4% | |||
| LKQ Corp. (a) | 313,300 | 9,239 | |
| Household Durables - 3.4% | |||
| Jarden Corp. (a) | 733,072 | 34,220 | |
| NVR, Inc. (a) | 18,900 | 31,799 | |
| Tupperware Brands Corp. | 264,500 | 15,016 | |
| 81,035 | |||
| Internet & Catalog Retail - 0.5% | |||
| Liberty Interactive Corp. QVC Group Series A (a) | 473,510 | 12,539 | |
| Media - 1.8% | |||
| AMC Networks, Inc. Class A (a) | 195,300 | 15,880 | |
| Liberty Broadband Corp. Class A (a) | 57,081 | 3,026 | |
| Scripps Networks Interactive, Inc. Class A | 222,200 | 12,621 | |
| Viacom, Inc. Class B (non-vtg.) | 266,100 | 13,249 | |
| 44,776 | |||
| Multiline Retail - 0.9% | |||
| Dollar General Corp. | 341,300 | 22,324 | |
| Specialty Retail - 4.5% | |||
| AutoNation, Inc. (a) | 341,200 | 21,810 | |
| Bed Bath & Beyond, Inc. (a) | 165,800 | 9,039 | |
| Best Buy Co., Inc. | 232,900 | 7,402 | |
| DSW, Inc. Class A | 295,800 | 6,792 | |
| Foot Locker, Inc. | 311,600 | 20,254 | |
| GameStop Corp. Class A | 234,900 | 8,229 | |
| Ross Stores, Inc. | 357,500 | 18,594 | |
| Sally Beauty Holdings, Inc. (a) | 617,400 | 15,966 | |
| 108,086 | |||
| Textiles, Apparel & Luxury Goods - 0.5% | |||
| Deckers Outdoor Corp. (a) | 12,700 | 622 | |
| Ralph Lauren Corp. | 90,000 | 11,179 | |
| 11,801 | |||
| TOTAL CONSUMER DISCRETIONARY | 315,234 | ||
| CONSUMER STAPLES - 4.2% | |||
| Beverages - 1.1% | |||
| Coca-Cola Enterprises, Inc. | 193,600 | 9,738 | |
| Dr. Pepper Snapple Group, Inc. | 77,900 | 6,992 | |
| Molson Coors Brewing Co. Class B | 93,300 | 8,586 | |
| 25,316 | |||
| Food & Staples Retailing - 0.4% | |||
| United Natural Foods, Inc. (a) | 169,200 | 7,430 | |
| Whole Foods Market, Inc. | 96,800 | 2,822 | |
| 10,252 | |||
| Food Products - 0.9% | |||
| Campbell Soup Co. | 158,900 | 8,301 | |
| ConAgra Foods, Inc. | 51,200 | 2,096 | |
| Mead Johnson Nutrition Co. Class A | 67,900 | 5,472 | |
| Nomad Foods Ltd. (a) | 62,478 | 775 | |
| The J.M. Smucker Co. | 40,903 | 4,957 | |
| 21,601 | |||
| Household Products - 1.0% | |||
| Church & Dwight Co., Inc. | 187,800 | 16,108 | |
| Energizer Holdings, Inc. | 232,700 | 7,870 | |
| 23,978 | |||
| Personal Products - 0.5% | |||
| Edgewell Personal Care Co. (a) | 154,700 | 12,453 | |
| Tobacco - 0.3% | |||
| Universal Corp. (b) | 102,200 | 5,778 | |
| TOTAL CONSUMER STAPLES | 99,378 | ||
| ENERGY - 3.2% | |||
| Energy Equipment & Services - 1.0% | |||
| Bristow Group, Inc. | 170,700 | 5,215 | |
| Dril-Quip, Inc. (a) | 168,800 | 10,653 | |
| Oil States International, Inc. (a) | 221,000 | 7,010 | |
| 22,878 | |||
| Oil, Gas & Consumable Fuels - 2.2% | |||
| Cabot Oil & Gas Corp. | 247,700 | 4,664 | |
| Cimarex Energy Co. | 56,600 | 6,737 | |
| Energen Corp. | 213,500 | 12,658 | |
| HollyFrontier Corp. | 366,300 | 17,612 | |
| PDC Energy, Inc. (a) | 75,100 | 4,242 | |
| Stone Energy Corp. (a) | 506,400 | 3,692 | |
| Whiting Petroleum Corp. (a) | 271,000 | 4,474 | |
| 54,079 | |||
| TOTAL ENERGY | 76,957 | ||
| FINANCIALS - 24.8% | |||
| Banks - 3.7% | |||
| Aldermore Group PLC | 2,108,400 | 7,462 | |
| Comerica, Inc. | 126,100 | 5,845 | |
| Huntington Bancshares, Inc. | 1,521,178 | 17,783 | |
| Prosperity Bancshares, Inc. | 151,100 | 8,372 | |
| Shawbrook Group PLC | 1,538,100 | 7,707 | |
| Signature Bank (a) | 118,700 | 18,772 | |
| Synovus Financial Corp. | 591,727 | 19,752 | |
| The Jammu & Kashmir Bank Ltd. | 2,642,702 | 3,377 | |
| 89,070 | |||
| Capital Markets - 1.9% | |||
| Fortress Investment Group LLC | 478,300 | 2,612 | |
| Interactive Brokers Group, Inc. | 571,967 | 24,800 | |
| KCG Holdings, Inc. Class A (a) | 315,344 | 4,071 | |
| MLP AG | 1,566,600 | 6,372 | |
| Oaktree Capital Group LLC Class A | 102,900 | 5,025 | |
| Vontobel Holdings AG | 81,403 | 3,659 | |
| 46,539 | |||
| Consumer Finance - 2.8% | |||
| Capital One Financial Corp. | 429,900 | 33,751 | |
| Enova International, Inc. (a) | 295,067 | 2,219 | |
| Navient Corp. | 593,916 | 7,074 | |
| OneMain Holdings, Inc. (a) | 227,080 | 11,004 | |
| SLM Corp. (a) | 1,781,916 | 12,037 | |
| 66,085 | |||
| Diversified Financial Services - 1.1% | |||
| Alexander Forbes Group Holding | 8,160,135 | 3,697 | |
| MSCI, Inc. Class A | 332,000 | 23,280 | |
| 26,977 | |||
| Insurance - 4.9% | |||
| Allied World Assurance Co. Holdings AG | 200,000 | 7,264 | |
| AmTrust Financial Services, Inc. | 194,200 | 12,139 | |
| Arthur J. Gallagher & Co. | 687,500 | 30,078 | |
| CNO Financial Group, Inc. | 665,900 | 13,471 | |
| Direct Line Insurance Group PLC | 3,189,858 | 19,784 | |
| Fairfax Financial Holdings Ltd. (sub. vtg.) | 20,400 | 9,794 | |
| Hanover Insurance Group, Inc. | 201,500 | 17,047 | |
| ProAssurance Corp. | 164,300 | 8,693 | |
| 118,270 | |||
| Real Estate Investment Trusts - 9.4% | |||
| Altisource Residential Corp. Class B | 432,521 | 5,727 | |
| Cousins Properties, Inc. | 595,858 | 5,857 | |
| DCT Industrial Trust, Inc. | 202,400 | 7,726 | |
| Empire State Realty Trust, Inc. | 367,100 | 6,751 | |
| Equity Lifestyle Properties, Inc. | 215,500 | 13,443 | |
| Essex Property Trust, Inc. | 42,000 | 9,693 | |
| Extra Space Storage, Inc. | 233,700 | 19,572 | |
| FelCor Lodging Trust, Inc. | 1,315,200 | 10,548 | |
| Healthcare Realty Trust, Inc. | 244,500 | 6,648 | |
| InfraReit, Inc. | 210,500 | 4,246 | |
| Liberty Property Trust (SBI) | 68,500 | 2,322 | |
| Mack-Cali Realty Corp. | 624,700 | 14,680 | |
| Mid-America Apartment Communities, Inc. | 212,250 | 18,797 | |
| Outfront Media, Inc. | 285,800 | 6,531 | |
| Parkway Properties, Inc. | 621,100 | 10,608 | |
| Potlatch Corp. | 190,900 | 6,380 | |
| Ramco-Gershenson Properties Trust (SBI) | 762,300 | 12,860 | |
| Redwood Trust, Inc. | 358,100 | 4,935 | |
| Sabra Health Care REIT, Inc. | 485,000 | 10,030 | |
| SL Green Realty Corp. | 29,965 | 3,538 | |
| Store Capital Corp. | 324,700 | 7,390 | |
| Taubman Centers, Inc. | 183,700 | 13,203 | |
| The GEO Group, Inc. | 138,450 | 4,059 | |
| Urban Edge Properties | 861,500 | 20,667 | |
| 226,211 | |||
| Real Estate Management & Development - 0.4% | |||
| CBRE Group, Inc. (a) | 239,650 | 8,980 | |
| Thrifts & Mortgage Finance - 0.6% | |||
| Essent Group Ltd. (a) | 330,800 | 8,177 | |
| LIC Housing Finance Ltd. (a) | 790,000 | 5,759 | |
| 13,936 | |||
| TOTAL FINANCIALS | 596,068 | ||
| HEALTH CARE - 8.3% | |||
| Biotechnology - 0.8% | |||
| AMAG Pharmaceuticals, Inc. (a) | 180,000 | 4,792 | |
| Puma Biotechnology, Inc. (a) | 50,000 | 3,765 | |
| Vertex Pharmaceuticals, Inc. (a) | 88,000 | 11,384 | |
| 19,941 | |||
| Health Care Equipment & Supplies - 3.4% | |||
| Boston Scientific Corp. (a) | 1,040,000 | 19,011 | |
| CONMED Corp. | 170,000 | 7,225 | |
| Nevro Corp. | 150,000 | 9,057 | |
| The Cooper Companies, Inc. | 140,000 | 20,475 | |
| Wright Medical Group NV (a) | 620,000 | 13,280 | |
| Zimmer Biomet Holdings, Inc. | 120,000 | 12,121 | |
| 81,169 | |||
| Health Care Providers & Services - 1.8% | |||
| Adeptus Health, Inc. Class A (a)(b) | 116,000 | 6,970 | |
| HCA Holdings, Inc. (a) | 128,000 | 8,712 | |
| MEDNAX, Inc. (a) | 270,000 | 19,270 | |
| Surgical Care Affiliates, Inc. (a) | 230,000 | 8,549 | |
| 43,501 | |||
| Life Sciences Tools & Services - 0.6% | |||
| Agilent Technologies, Inc. | 330,000 | 13,801 | |
| Pharmaceuticals - 1.7% | |||
| Catalent, Inc. (a) | 560,000 | 15,596 | |
| Endo Health Solutions, Inc. (a) | 255,000 | 15,677 | |
| Prestige Brands Holdings, Inc. (a) | 190,000 | 9,669 | |
| 40,942 | |||
| TOTAL HEALTH CARE | 199,354 | ||
| INDUSTRIALS - 14.8% | |||
| Aerospace & Defense - 1.3% | |||
| Teledyne Technologies, Inc. (a) | 338,336 | 31,299 | |
| Electrical Equipment - 3.5% | |||
| AMETEK, Inc. | 1,497,390 | 84,543 | |
| Industrial Conglomerates - 3.2% | |||
| Roper Technologies, Inc. | 404,220 | 78,213 | |
| Machinery - 5.7% | |||
| IDEX Corp. | 755,100 | 59,502 | |
| WABCO Holdings, Inc. (a) | 247,950 | 26,650 | |
| Wabtec Corp. | 630,100 | 50,484 | |
| 136,636 | |||
| Road & Rail - 0.8% | |||
| J.B. Hunt Transport Services, Inc. | 236,440 | 18,499 | |
| Trading Companies & Distributors - 0.3% | |||
| AerCap Holdings NV (a) | 146,500 | 6,657 | |
| TOTAL INDUSTRIALS | 355,847 | ||
| INFORMATION TECHNOLOGY - 16.9% | |||
| Communications Equipment - 0.4% | |||
| F5 Networks, Inc. (a) | 97,230 | 10,015 | |
| Electronic Equipment & Components - 2.4% | |||
| CDW Corp. | 445,700 | 19,241 | |
| IPG Photonics Corp. (a)(b) | 161,700 | 14,745 | |
| Trimble Navigation Ltd. (a) | 968,700 | 22,183 | |
| 56,169 | |||
| Internet Software & Services - 1.2% | |||
| IAC/InterActiveCorp | 123,600 | 7,761 | |
| Rackspace Hosting, Inc. (a) | 748,200 | 21,413 | |
| Velti PLC (a)(c) | 215,084 | 1 | |
| 29,175 | |||
| IT Services - 4.8% | |||
| Alliance Data Systems Corp. (a) | 88,900 | 25,501 | |
| Blackhawk Network Holdings, Inc. (a) | 170,000 | 8,050 | |
| Cognizant Technology Solutions Corp. Class A (a) | 367,600 | 23,740 | |
| Maximus, Inc. | 545,500 | 30,957 | |
| PayPal Holdings, Inc. (a) | 176,100 | 6,209 | |
| Total System Services, Inc. | 292,300 | 16,357 | |
| Virtusa Corp. (a) | 102,200 | 5,033 | |
| 115,847 | |||
| Semiconductors & Semiconductor Equipment - 3.4% | |||
| Cirrus Logic, Inc. (a) | 301,300 | 9,961 | |
| Cree, Inc. (a)(b) | 558,600 | 15,440 | |
| Cypress Semiconductor Corp. (b) | 918,500 | 9,938 | |
| Lam Research Corp. | 57,800 | 4,520 | |
| Marvell Technology Group Ltd. | 1,344,500 | 11,912 | |
| Micron Technology, Inc. (a) | 500,600 | 7,975 | |
| NXP Semiconductors NV (a) | 153,600 | 14,355 | |
| Skyworks Solutions, Inc. | 74,200 | 6,160 | |
| 80,261 | |||
| Software - 3.3% | |||
| Adobe Systems, Inc. (a) | 68,900 | 6,302 | |
| Citrix Systems, Inc. (a) | 198,000 | 15,181 | |
| CommVault Systems, Inc. (a) | 340,800 | 13,966 | |
| Fair Isaac Corp. | 209,600 | 19,964 | |
| Rovi Corp. (a) | 179,170 | 2,116 | |
| Salesforce.com, Inc. (a) | 134,600 | 10,726 | |
| Synchronoss Technologies, Inc. (a) | 25,100 | 988 | |
| VMware, Inc. Class A (a)(b) | 68,700 | 4,219 | |
| Workday, Inc. Class A (a) | 77,000 | 6,446 | |
| 79,908 | |||
| Technology Hardware, Storage & Peripherals - 1.4% | |||
| SanDisk Corp. | 144,200 | 10,652 | |
| Western Digital Corp. | 376,000 | 23,466 | |
| 34,118 | |||
| TOTAL INFORMATION TECHNOLOGY | 405,493 | ||
| MATERIALS - 6.5% | |||
| Chemicals - 5.9% | |||
| CF Industries Holdings, Inc. | 388,000 | 17,902 | |
| Eastman Chemical Co. | 217,800 | 15,823 | |
| Ecolab, Inc. | 297,579 | 35,460 | |
| PPG Industries, Inc. | 336,700 | 35,603 | |
| Sherwin-Williams Co. | 77,800 | 21,478 | |
| W.R. Grace & Co. (a) | 165,397 | 16,245 | |
| 142,511 | |||
| Containers & Packaging - 0.6% | |||
| WestRock Co. | 267,400 | 13,538 | |
| TOTAL MATERIALS | 156,049 | ||
| TELECOMMUNICATION SERVICES - 0.1% | |||
| Diversified Telecommunication Services - 0.1% | |||
| Cogent Communications Group, Inc. | 38,700 | 1,299 | |
| Zayo Group Holdings, Inc. (a) | 38,300 | 931 | |
| 2,230 | |||
| Wireless Telecommunication Services - 0.0% | |||
| T-Mobile U.S., Inc. (a) | 26,900 | 955 | |
| TOTAL TELECOMMUNICATION SERVICES | 3,185 | ||
| UTILITIES - 4.4% | |||
| Electric Utilities - 2.2% | |||
| Hawaiian Electric Industries, Inc. | 135,000 | 3,858 | |
| OGE Energy Corp. | 492,126 | 12,849 | |
| Pinnacle West Capital Corp. | 132,900 | 8,421 | |
| PNM Resources, Inc. | 656,600 | 19,041 | |
| Portland General Electric Co. | 95,300 | 3,518 | |
| Westar Energy, Inc. | 152,803 | 6,522 | |
| 54,209 | |||
| Gas Utilities - 1.5% | |||
| Atmos Energy Corp. | 210,940 | 13,144 | |
| National Fuel Gas Co. | 191,111 | 8,738 | |
| Questar Corp. | 279,900 | 5,304 | |
| Southwest Gas Corp. | 143,263 | 8,034 | |
| 35,220 | |||
| Independent Power and Renewable Electricity Producers - 0.7% | |||
| Black Hills Corp. (b) | 198,735 | 8,530 | |
| Calpine Corp. (a) | 500,300 | 7,394 | |
| 15,924 | |||
| TOTAL UTILITIES | 105,353 | ||
| TOTAL COMMON STOCKS | |||
| (Cost $2,306,814) | 2,312,918 | ||
| Principal Amount (000s) | Value (000s) | ||
| U.S. Treasury Obligations - 0.0% | |||
| U.S. Treasury Bills, yield at date of purchase 0.1% 1/28/16 (d) | |||
| (Cost $660) | 660 | 660 | |
| Shares | Value (000s) | ||
| Money Market Funds - 6.1% | |||
| Fidelity Cash Central Fund, 0.18% (e) | 91,429,328 | $91,429 | |
| Fidelity Securities Lending Cash Central Fund, 0.22% (e)(f) | 55,766,450 | 55,766 | |
| TOTAL MONEY MARKET FUNDS | |||
| (Cost $147,195) | 147,195 | ||
| TOTAL INVESTMENT PORTFOLIO - 102.4% | |||
| (Cost $2,454,669) | 2,460,773 | ||
| NET OTHER ASSETS (LIABILITIES) - (2.4)% | (57,656) | ||
| NET ASSETS - 100% | $2,403,117 |
| Futures Contracts | |||
| Expiration Date | Underlying Face Amount at Value (000s) | Unrealized Appreciation/(Depreciation) (000s) | |
| Purchased | |||
| Equity Index Contracts | |||
| 75 CME E-mini S&P MidCap 400 Index Contracts (United States) | Dec. 2015 | 10,951 | $219 |
The face value of futures purchased as a percentage of Net Assets is 0.5%
For the period, the average monthly underlying face amount at value for futures contracts in the aggregate was $6,856,000.
Legend
(a) Non-income producing
(b) Security or a portion of the security is on loan at period end.
(c) Restricted securities - Investment in securities not registered under the Securities Act of 1933 (excluding 144A issues). At the end of the period, the value of restricted securities (excluding 144A issues) amounted to $1,000 or 0.0% of net assets.
(d) Security or a portion of the security was pledged to cover margin requirements for futures contracts. At period end, the value of securities pledged amounted to $660,000.
(e) Affiliated fund that is generally available only to investment companies and other accounts managed by Fidelity Investments. The rate quoted is the annualized seven-day yield of the fund at period end. A complete unaudited listing of the fund's holdings as of its most recent quarter end is available upon request. In addition, each Fidelity Central Fund's financial statements , which are not covered by the Fund's Report of Independent Registered Public Accounting Firm, are available on the SEC's website or upon request.
(f) Investment made with cash collateral received from securities on loan.
Additional information on each restricted holding is as follows:
| Security | Acquisition Date | Acquisition Cost (000s) |
| Velti PLC | 4/19/13 | $323 |
Affiliated Central Funds
Information regarding fiscal year to date income earned by the Fund from investments in Fidelity Central Funds is as follows:
| Fund | Income earned |
| (Amounts in thousands) | |
| Fidelity Cash Central Fund | $88 |
| Fidelity Securities Lending Cash Central Fund | 295 |
| Total | $383 |
Investment Valuation
The following is a summary of the inputs used, as of November 30, 2015, involving the Fund's assets and liabilities carried at fair value. The inputs or methodology used for valuing securities may not be an indication of the risk associated with investing in those securities. For more information on valuation inputs, and their aggregation into the levels used below, please refer to the Investment Valuation section in the accompanying Notes to Financial Statements.
| Valuation Inputs at Reporting Date: | ||||
| Description | Total | Level 1 | Level 2 | Level 3 |
| (Amounts in thousands) | ||||
| Investments in Securities: | ||||
| Equities: | ||||
| Consumer Discretionary | $315,234 | $315,234 | $-- | $-- |
| Consumer Staples | 99,378 | 99,378 | -- | -- |
| Energy | 76,957 | 76,957 | -- | -- |
| Financials | 596,068 | 596,068 | -- | -- |
| Health Care | 199,354 | 199,354 | -- | -- |
| Industrials | 355,847 | 355,847 | -- | -- |
| Information Technology | 405,493 | 405,492 | 1 | -- |
| Materials | 156,049 | 156,049 | -- | -- |
| Telecommunication Services | 3,185 | 3,185 | -- | -- |
| Utilities | 105,353 | 105,353 | -- | -- |
| U.S. Government and Government Agency Obligations | 660 | -- | 660 | -- |
| Money Market Funds | 147,195 | 147,195 | -- | -- |
| Total Investments in Securities: | $2,460,773 | $2,460,112 | $661 | $-- |
| Derivative Instruments: | ||||
| Assets | ||||
| Futures Contracts | $219 | $219 | $-- | $-- |
| Total Assets | $219 | $219 | $-- | $-- |
| Total Derivative Instruments: | $219 | $219 | $-- | $-- |
Value of Derivative Instruments
The following table is a summary of the Fund's value of derivative instruments by primary risk exposure as of November 30, 2015. For additional information on derivative instruments, please refer to the Derivative Instruments section in the accompanying Notes to Financial Statements.
| Primary Risk Exposure / Derivative Type | Value | |
| (Amounts in thousands) | ||
| Asset | Liability | |
| Equity Risk | ||
| Futures Contracts(a) | $219 | $0 |
| Total Equity Risk | $219 | $0 |
| Total Value of Derivatives | $219 | $0 |
(a) Reflects gross cumulative appreciation (depreciation) on futures contracts as presented in the Schedule of Investments. Only the period end receivable or payable for daily variation margin and net unrealized appreciation (depreciation) are presented in the Statement of Assets and Liabilities.
See accompanying notes which are an integral part of the financial statements.
Financial Statements
Statement of Assets and Liabilities
| Amounts in thousands (except per-share amounts) | November 30, 2015 | |
| Assets | ||
| Investment in securities, at value (including securities loaned of $54,545) — See accompanying schedule: Unaffiliated issuers (cost $2,307,474) | $2,313,578 | |
| Fidelity Central Funds (cost $147,195) | 147,195 | |
| Total Investments (cost $2,454,669) | $2,460,773 | |
| Cash | 84 | |
| Receivable for investments sold | 5,727 | |
| Receivable for fund shares sold | 1,407 | |
| Dividends receivable | 1,423 | |
| Distributions receivable from Fidelity Central Funds | 40 | |
| Prepaid expenses | 6 | |
| Other receivables | 26 | |
| Total assets | 2,469,486 | |
| Liabilities | ||
| Payable for investments purchased | $4,256 | |
| Payable for fund shares redeemed | 4,322 | |
| Accrued management fee | 843 | |
| Distribution and service plan fees payable | 543 | |
| Payable for daily variation margin for derivative instruments | 82 | |
| Other affiliated payables | 498 | |
| Other payables and accrued expenses | 59 | |
| Collateral on securities loaned, at value | 55,766 | |
| Total liabilities | 66,369 | |
| Net Assets | $2,403,117 | |
| Net Assets consist of: | ||
| Paid in capital | $2,358,912 | |
| Undistributed net investment income | 1,101 | |
| Accumulated undistributed net realized gain (loss) on investments and foreign currency transactions | 36,800 | |
| Net unrealized appreciation (depreciation) on investments and assets and liabilities in foreign currencies | 6,304 | |
| Net Assets | $2,403,117 | |
| Calculation of Maximum Offering Price | ||
| Class A: | ||
| Net Asset Value and redemption price per share ($592,521 ÷ 18,511.05 shares) | $32.01 | |
| Maximum offering price per share (100/94.25 of $32.01) | $33.96 | |
| Class T: | ||
| Net Asset Value and redemption price per share ($681,417 ÷ 21,191.40 shares) | $32.16 | |
| Maximum offering price per share (100/96.50 of $32.16) | $33.33 | |
| Class B: | ||
| Net Asset Value and offering price per share ($9,548 ÷ 324.61 shares)(a) | $29.41 | |
| Class C: | ||
| Net Asset Value and offering price per share ($154,546 ÷ 5,242.53 shares)(a) | $29.48 | |
| Fidelity Stock Selector Mid Cap Fund: | ||
| Net Asset Value, offering price and redemption price per share ($486,252 ÷ 14,586.72 shares) | $33.34 | |
| Class I: | ||
| Net Asset Value, offering price and redemption price per share ($478,833 ÷ 14,339.82 shares) | $33.39 |
(a) Redemption price per share is equal to net asset value less any applicable contingent deferred sales charge.
See accompanying notes which are an integral part of the financial statements.
Statement of Operations
| Amounts in thousands | Year ended November 30, 2015 | |
| Investment Income | ||
| Dividends | $30,394 | |
| Interest | 1 | |
| Income from Fidelity Central Funds | 383 | |
| Total income | 30,778 | |
| Expenses | ||
| Management fee | ||
| Basic fee | $13,923 | |
| Performance adjustment | (1,608) | |
| Transfer agent fees | 5,607 | |
| Distribution and service plan fees | 7,168 | |
| Accounting and security lending fees | 771 | |
| Custodian fees and expenses | 69 | |
| Independent trustees' compensation | 11 | |
| Registration fees | 116 | |
| Audit | 62 | |
| Legal | 20 | |
| Miscellaneous | 17 | |
| Total expenses before reductions | 26,156 | |
| Expense reductions | (255) | 25,901 |
| Net investment income (loss) | 4,877 | |
| Realized and Unrealized Gain (Loss) | ||
| Net realized gain (loss) on: | ||
| Investment securities: | ||
| Unaffiliated issuers | 273,424 | |
| Foreign currency transactions | (26) | |
| Futures contracts | 1,414 | |
| Total net realized gain (loss) | 274,812 | |
| Change in net unrealized appreciation (depreciation) on: Investment securities (net of increase in deferred foreign taxes of $7) | (264,738) | |
| Assets and liabilities in foreign currencies | (7) | |
| Futures contracts | 243 | |
| Total change in net unrealized appreciation (depreciation) | (264,502) | |
| Net gain (loss) | 10,310 | |
| Net increase (decrease) in net assets resulting from operations | $15,187 |
See accompanying notes which are an integral part of the financial statements.
Statement of Changes in Net Assets
| Amounts in thousands | Year ended November 30, 2015 | Year ended November 30, 2014 |
| Increase (Decrease) in Net Assets | ||
| Operations | ||
| Net investment income (loss) | $4,877 | $3,875 |
| Net realized gain (loss) | 274,812 | 302,104 |
| Change in net unrealized appreciation (depreciation) | (264,502) | (34,271) |
| Net increase (decrease) in net assets resulting from operations | 15,187 | 271,708 |
| Distributions to shareholders from net investment income | (2,753) | (1,252) |
| Share transactions - net increase (decrease) | (166,510) | 147,034 |
| Total increase (decrease) in net assets | (154,076) | 417,490 |
| Net Assets | ||
| Beginning of period | 2,557,193 | 2,139,703 |
| End of period (including undistributed net investment income of $1,101 and undistributed net investment income of $708, respectively) | $2,403,117 | $2,557,193 |
See accompanying notes which are an integral part of the financial statements.
Financial Highlights — Fidelity Advisor Stock Selector Mid Cap Fund Class A
| November 30, | |||||
| Years ended November 30, | 2015 | 2014 | 2013 | 2012 | 2011 |
| Selected Per–Share Data | |||||
| Net asset value, beginning of period | $31.80 | $28.37 | $22.16 | $19.15 | $19.22 |
| Income from Investment Operations | |||||
| Net investment income (loss)A | .08 | .08 | .10 | .09 | .08B |
| Net realized and unrealized gain (loss) | .13 | 3.36 | 6.29 | 3.02 | (.15) |
| Total from investment operations | .21 | 3.44 | 6.39 | 3.11 | (.07) |
| Distributions from net investment income | – | (.01) | (.14) | (.10) | – |
| Distributions from net realized gain | – | – | (.04) | – | – |
| Total distributions | – | (.01) | (.18) | (.10) | – |
| Net asset value, end of period | $32.01 | $31.80 | $28.37 | $22.16 | $19.15 |
| Total ReturnC,D | .66% | 12.11% | 29.07% | 16.32% | (.36)% |
| Ratios to Average Net AssetsE,F | |||||
| Expenses before reductions | .98% | 1.05% | .95% | .94% | .92% |
| Expenses net of fee waivers, if any | .98% | 1.05% | .95% | .94% | .92% |
| Expenses net of all reductions | .97% | 1.05% | .92% | .94% | .91% |
| Net investment income (loss) | .24% | .26% | .39% | .41% | .39%B |
| Supplemental Data | |||||
| Net assets, end of period (in millions) | $593 | $652 | $692 | $593 | $644 |
| Portfolio turnover rateG | 109% | 89% | 79%H | 72% | 198% |
A Calculated based on average shares outstanding during the period.
B Investment income per share reflects a large, non-recurring dividend which amounted to $.05 per share. Excluding this non-recurring dividend, the ratio of net investment income (loss) to average net assets would have been .12%.
C Total returns would have been lower if certain expenses had not been reduced during the applicable periods shown.
D Total returns do not include the effect of the sales charges.
E Fees and expenses of any underlying Fidelity Central Funds are not included in the Fund's expense ratio. The Fund indirectly bears its proportionate share of the expenses of any underlying Fidelity Central Funds.
F Expense ratios reflect operating expenses of the class. Expenses before reductions do not reflect amounts reimbursed by the investment adviser or reductions from brokerage service arrangements or reductions from other expense offset arrangements and do not represent the amount paid by the class during periods when reimbursements or reductions occur. Expenses net of fee waivers reflect expenses after reimbursement by the investment adviser but prior to reductions from brokerage service arrangements or other expense offset arrangements. Expenses net of all reductions represent the net expenses paid by the class.
G Amount does not include the portfolio activity of any underlying Fidelity Central Funds.
H The portfolio turnover rate does not include the assets acquired in the merger.
See accompanying notes which are an integral part of the financial statements.
Financial Highlights — Fidelity Advisor Stock Selector Mid Cap Fund Class T
| November 30, | |||||
| Years ended November 30, | 2015 | 2014 | 2013 | 2012 | 2011 |
| Selected Per–Share Data | |||||
| Net asset value, beginning of period | $32.02 | $28.63 | $22.36 | $19.30 | $19.41 |
| Income from Investment Operations | |||||
| Net investment income (loss)A | – | .01 | .04 | .05 | .04B |
| Net realized and unrealized gain (loss) | .14 | 3.38 | 6.36 | 3.05 | (.15) |
| Total from investment operations | .14 | 3.39 | 6.40 | 3.10 | (.11) |
| Distributions from net investment income | – | – | (.09) | (.04) | – |
| Distributions from net realized gain | – | – | (.04) | – | – |
| Total distributions | – | – | (.13) | (.04) | – |
| Net asset value, end of period | $32.16 | $32.02 | $28.63 | $22.36 | $19.30 |
| Total ReturnC,D | .44% | 11.84% | 28.80% | 16.12% | (.57)% |
| Ratios to Average Net AssetsE,F | |||||
| Expenses before reductions | 1.22% | 1.28% | 1.16% | 1.14% | 1.11% |
| Expenses net of fee waivers, if any | 1.21% | 1.28% | 1.16% | 1.14% | 1.11% |
| Expenses net of all reductions | 1.21% | 1.27% | 1.13% | 1.13% | 1.10% |
| Net investment income (loss) | .01% | .03% | .17% | .22% | .20%B |
| Supplemental Data | |||||
| Net assets, end of period (in millions) | $681 | $794 | $817 | $755 | $871 |
| Portfolio turnover rateG | 109% | 89% | 79%H | 72% | 198% |
A Calculated based on average shares outstanding during the period.
B Investment income per share reflects a large, non-recurring dividend which amounted to $.05 per share. Excluding this non-recurring dividend, the ratio of net investment income (loss) to average net assets would have been (.07) %.
C Total returns would have been lower if certain expenses had not been reduced during the applicable periods shown.
D Total returns do not include the effect of the sales charges.
E Fees and expenses of any underlying Fidelity Central Funds are not included in the Fund's expense ratio. The Fund indirectly bears its proportionate share of the expenses of any underlying Fidelity Central Funds.
F Expense ratios reflect operating expenses of the class. Expenses before reductions do not reflect amounts reimbursed by the investment adviser or reductions from brokerage service arrangements or reductions from other expense offset arrangements and do not represent the amount paid by the class during periods when reimbursements or reductions occur. Expenses net of fee waivers reflect expenses after reimbursement by the investment adviser but prior to reductions from brokerage service arrangements or other expense offset arrangements. Expenses net of all reductions represent the net expenses paid by the class.
G Amount does not include the portfolio activity of any underlying Fidelity Central Funds.
H The portfolio turnover rate does not include the assets acquired in the merger.
See accompanying notes which are an integral part of the financial statements.
Financial Highlights — Fidelity Advisor Stock Selector Mid Cap Fund Class B
| November 30, | |||||
| Years ended November 30, | 2015 | 2014 | 2013 | 2012 | 2011 |
| Selected Per–Share Data | |||||
| Net asset value, beginning of period | $29.47 | $26.51 | $20.71 | $17.94 | $18.15 |
| Income from Investment Operations | |||||
| Net investment income (loss)A | (.18) | (.16) | (.10) | (.07) | (.07)B |
| Net realized and unrealized gain (loss) | .12 | 3.12 | 5.90 | 2.84 | (.14) |
| Total from investment operations | (.06) | 2.96 | 5.80 | 2.77 | (.21) |
| Distributions from net investment income | – | – | – | – | – |
| Distributions from net realized gain | – | – | – | – | – |
| Total distributions | – | – | – | – | – |
| Net asset value, end of period | $29.41 | $29.47 | $26.51 | $20.71 | $17.94 |
| Total ReturnC,D | (.20)% | 11.17% | 28.01% | 15.44% | (1.16)% |
| Ratios to Average Net AssetsE,F | |||||
| Expenses before reductions | 1.83% | 1.89% | 1.76% | 1.73% | 1.71% |
| Expenses net of fee waivers, if any | 1.83% | 1.89% | 1.76% | 1.73% | 1.71% |
| Expenses net of all reductions | 1.82% | 1.88% | 1.74% | 1.73% | 1.70% |
| Net investment income (loss) | (.61)% | (.58)% | (.43)% | (.38)% | (.40)%B |
| Supplemental Data | |||||
| Net assets, end of period (in millions) | $10 | $16 | $21 | $22 | $28 |
| Portfolio turnover rateG | 109% | 89% | 79%H | 72% | 198% |
A Calculated based on average shares outstanding during the period.
B Investment income per share reflects a large, non-recurring dividend which amounted to $.05 per share. Excluding this non-recurring dividend, the ratio of net investment income (loss) to average net assets would have been (.67) %.
C Total returns would have been lower if certain expenses had not been reduced during the applicable periods shown.
D Total returns do not include the effect of the contingent deferred sales charge.
E Fees and expenses of any underlying Fidelity Central Funds are not included in the Fund's expense ratio. The Fund indirectly bears its proportionate share of the expenses of any underlying Fidelity Central Funds.
F Expense ratios reflect operating expenses of the class. Expenses before reductions do not reflect amounts reimbursed by the investment adviser or reductions from brokerage service arrangements or reductions from other expense offset arrangements and do not represent the amount paid by the class during periods when reimbursements or reductions occur. Expenses net of fee waivers reflect expenses after reimbursement by the investment adviser but prior to reductions from brokerage service arrangements or other expense offset arrangements. Expenses net of all reductions represent the net expenses paid by the class.
G Amount does not include the portfolio activity of any underlying Fidelity Central Funds.
H The portfolio turnover rate does not include the assets acquired in the merger.
See accompanying notes which are an integral part of the financial statements.
Financial Highlights — Fidelity Advisor Stock Selector Mid Cap Fund Class C
| November 30, | |||||
| Years ended November 30, | 2015 | 2014 | 2013 | 2012 | 2011 |
| Selected Per–Share Data | |||||
| Net asset value, beginning of period | $29.51 | $26.52 | $20.73 | $17.95 | $18.15 |
| Income from Investment Operations | |||||
| Net investment income (loss)A | (.15) | (.14) | (.09) | (.06) | (.07)B |
| Net realized and unrealized gain (loss) | .12 | 3.13 | 5.91 | 2.84 | (.13) |
| Total from investment operations | (.03) | 2.99 | 5.82 | 2.78 | (.20) |
| Distributions from net investment income | – | – | (.02) | – | – |
| Distributions from net realized gain | – | – | (.01) | – | – |
| Total distributions | – | – | (.03) | – | – |
| Net asset value, end of period | $29.48 | $29.51 | $26.52 | $20.73 | $17.95 |
| Total ReturnC,D | (.10)% | 11.27% | 28.09% | 15.49% | (1.10)% |
| Ratios to Average Net AssetsE,F | |||||
| Expenses before reductions | 1.74% | 1.80% | 1.69% | 1.68% | 1.66% |
| Expenses net of fee waivers, if any | 1.73% | 1.80% | 1.69% | 1.68% | 1.66% |
| Expenses net of all reductions | 1.73% | 1.80% | 1.67% | 1.68% | 1.65% |
| Net investment income (loss) | (.51)% | (.49)% | (.36)% | (.33)% | (.35)%B |
| Supplemental Data | |||||
| Net assets, end of period (in millions) | $155 | $172 | $172 | $141 | $150 |
| Portfolio turnover rateG | 109% | 89% | 79%H | 72% | 198% |
A Calculated based on average shares outstanding during the period.
B Investment income per share reflects a large, non-recurring dividend which amounted to $.05 per share. Excluding this non-recurring dividend, the ratio of net investment income (loss) to average net assets would have been (.62) %.
C Total returns would have been lower if certain expenses had not been reduced during the applicable periods shown.
D Total returns do not include the effect of the contingent deferred sales charge.
E Fees and expenses of any underlying Fidelity Central Funds are not included in the Fund's expense ratio. The Fund indirectly bears its proportionate share of the expenses of any underlying Fidelity Central Funds.
F Expense ratios reflect operating expenses of the class. Expenses before reductions do not reflect amounts reimbursed by the investment adviser or reductions from brokerage service arrangements or reductions from other expense offset arrangements and do not represent the amount paid by the class during periods when reimbursements or reductions occur. Expenses net of fee waivers reflect expenses after reimbursement by the investment adviser but prior to reductions from brokerage service arrangements or other expense offset arrangements. Expenses net of all reductions represent the net expenses paid by the class.
G Amount does not include the portfolio activity of any underlying Fidelity Central Funds.
H The portfolio turnover rate does not include the assets acquired in the merger.
See accompanying notes which are an integral part of the financial statements.
Financial Highlights — Fidelity Stock Selector Mid Cap Fund
| November 30, | ||||
| Years ended November 30, | 2015 | 2014 | 2013 | 2012 A |
| Selected Per–Share Data | ||||
| Net asset value, beginning of period | $33.14 | $29.56 | $23.14 | $21.20 |
| Income from Investment Operations | ||||
| Net investment income (loss)B | .16 | .16 | .17 | .09 |
| Net realized and unrealized gain (loss) | .14 | 3.49 | 6.54 | 1.85 |
| Total from investment operations | .30 | 3.65 | 6.71 | 1.94 |
| Distributions from net investment income | (.10) | (.07) | (.25) | – |
| Distributions from net realized gain | – | – | (.04) | – |
| Total distributions | (.10) | (.07) | (.29) | – |
| Net asset value, end of period | $33.34 | $33.14 | $29.56 | $23.14 |
| Total ReturnC,D | .90% | 12.38% | 29.36% | 9.15% |
| Ratios to Average Net AssetsE,F | ||||
| Expenses before reductions | .75% | .81% | .71% | .59%G |
| Expenses net of fee waivers, if any | .74% | .81% | .71% | .59%G |
| Expenses net of all reductions | .74% | .81% | .69% | .58%G |
| Net investment income (loss) | .48% | .50% | .62% | .86%G |
| Supplemental Data | ||||
| Net assets, end of period (in millions) | $486 | $553 | $225 | $1 |
| Portfolio turnover rateH | 109% | 89% | 79%I | 72% |
A For the period June 6, 2012 (commencement of sale of shares) to November 30, 2012.
B Calculated based on average shares outstanding during the period.
C Total returns for periods of less than one year are not annualized.
D Total returns would have been lower if certain expenses had not been reduced during the applicable periods shown.
E Fees and expenses of any underlying Fidelity Central Funds are not included in the Fund's expense ratio. The Fund indirectly bears its proportionate share of the expenses of any underlying Fidelity Central Funds.
F Expense ratios reflect operating expenses of the class. Expenses before reductions do not reflect amounts reimbursed by the investment adviser or reductions from brokerage service arrangements or reductions from other expense offset arrangements and do not represent the amount paid by the class during periods when reimbursements or reductions occur. Expense ratios before reductions for start-up periods may not be representative of longer-term operating periods. Expenses net of fee waivers reflect expenses after reimbursement by the investment adviser but prior to reductions from brokerage service arrangements or other expense offset arrangements. Expenses net of all reductions represent the net expenses paid by the class.
G Annualized
H Amount does not include the portfolio activity of any underlying Fidelity Central Funds.
I The portfolio turnover rate does not include the assets acquired in the merger.
See accompanying notes which are an integral part of the financial statements.
Financial Highlights — Fidelity Advisor Stock Selector Mid Cap Fund Class I
| November 30, | |||||
| Years ended November 30, | 2015 | 2014 | 2013 | 2012 | 2011 |
| Selected Per–Share Data | |||||
| Net asset value, beginning of period | $33.22 | $29.64 | $23.14 | $20.01 | $20.02 |
| Income from Investment Operations | |||||
| Net investment income (loss)A | .13 | .16 | .18 | .15 | .14B |
| Net realized and unrealized gain (loss) | .14 | 3.50 | 6.56 | 3.15 | (.15) |
| Total from investment operations | .27 | 3.66 | 6.74 | 3.30 | (.01) |
| Distributions from net investment income | (.10) | (.08) | (.20) | (.17) | – |
| Distributions from net realized gain | – | – | (.04) | – | – |
| Total distributions | (.10) | (.08) | (.24) | (.17) | – |
| Net asset value, end of period | $33.39 | $33.22 | $29.64 | $23.14 | $20.01 |
| Total ReturnC | .80% | 12.39% | 29.44% | 16.66% | (.05)% |
| Ratios to Average Net AssetsD,E | |||||
| Expenses before reductions | .83% | .80% | .67% | .65% | .62% |
| Expenses net of fee waivers, if any | .83% | .80% | .67% | .65% | .62% |
| Expenses net of all reductions | .82% | .80% | .65% | .64% | .61% |
| Net investment income (loss) | .39% | .51% | .66% | .71% | .69%B |
| Supplemental Data | |||||
| Net assets, end of period (in millions) | $479 | $371 | $214 | $172 | $234 |
| Portfolio turnover rateF | 109% | 89% | 79%G | 72% | 198% |
A Calculated based on average shares outstanding during the period.
B Investment income per share reflects a large, non-recurring dividend which amounted to $.06 per share. Excluding this non-recurring dividend, the ratio of net investment income (loss) to average net assets would have been .42%.
C Total returns would have been lower if certain expenses had not been reduced during the applicable periods shown.
D Fees and expenses of any underlying Fidelity Central Funds are not included in the Fund's expense ratio. The Fund indirectly bears its proportionate share of the expenses of any underlying Fidelity Central Funds.
E Expense ratios reflect operating expenses of the class. Expenses before reductions do not reflect amounts reimbursed by the investment adviser or reductions from brokerage service arrangements or reductions from other expense offset arrangements and do not represent the amount paid by the class during periods when reimbursements or reductions occur. Expenses net of fee waivers reflect expenses after reimbursement by the investment adviser but prior to reductions from brokerage service arrangements or other expense offset arrangements. Expenses net of all reductions represent the net expenses paid by the class.
F Amount does not include the portfolio activity of any underlying Fidelity Central Funds.
G The portfolio turnover rate does not include the assets acquired in the merger.
See accompanying notes which are an integral part of the financial statements.
Notes to Financial Statements
For the period ended November 30, 2015
(Amounts in thousands except percentages)
1. Organization.
Fidelity Advisor Stock Selector Mid Cap Fund (the Fund) is a fund of Fidelity Advisor Series I (the Trust) and is authorized to issue an unlimited number of shares. The Trust is registered under the Investment Company Act of 1940, as amended (the 1940 Act), as an open-end management investment company organized as a Massachusetts business trust. The Fund offers Class A, Class T, Class C, Fidelity Stock Selector Mid Cap Fund and Class I (formerly Institutional Class) shares, each of which, along with Class B shares, has equal rights as to assets and voting privileges. Class B shares are closed to new accounts and additional purchases, except for exchanges and reinvestments. Each class has exclusive voting rights with respect to matters that affect that class. Class B shares will automatically convert to Class A shares after a holding period of seven years from the initial date of purchase.
2. Investments in Fidelity Central Funds.
The Fund invests in Fidelity Central Funds, which are open-end investment companies generally available only to other investment companies and accounts managed by the investment adviser and its affiliates. The Fund's Schedule of Investments lists each of the Fidelity Central Funds held as of period end, if any, as an investment of the Fund, but does not include the underlying holdings of each Fidelity Central Fund. As an Investing Fund, the Fund indirectly bears its proportionate share of the expenses of the underlying Fidelity Central Funds.
The Money Market Central Funds seek preservation of capital and current income and are managed by Fidelity Investments Money Management, Inc. (FIMM), an affiliate of the investment adviser. Annualized expenses of the Money Market Central Funds as of their most recent shareholder report date are less than .005%.
A complete unaudited list of holdings for each Fidelity Central Fund is available upon request or at the Securities and Exchange Commission (the SEC) website at www.sec.gov. In addition, the financial statements of the Fidelity Central Funds, which are not covered by the Fund's Report of Independent Registered Public Accounting Firm, are available on the SEC website or upon request.
3. Significant Accounting Policies.
The financial statements have been prepared in conformity with accounting principles generally accepted in the United States of America (GAAP), which require management to make certain estimates and assumptions at the date of the financial statements. Actual results could differ from those estimates. Subsequent events, if any, through the date that the financial statements were issued have been evaluated in the preparation of the financial statements. The following summarizes the significant accounting policies of the Fund:
Investment Valuation. Investments are valued as of 4:00 p.m. Eastern time on the last calendar day of the period. The Board of Trustees (the Board) has delegated the day to day responsibility for the valuation of the Fund's investments to the Fidelity Management & Research Company (FMR) Fair Value Committee (the Committee). In accordance with valuation policies and procedures approved by the Board, the Fund attempts to obtain prices from one or more third party pricing vendors or brokers to value its investments. When current market prices, quotations or currency exchange rates are not readily available or reliable, investments will be fair valued in good faith by the Committee, in accordance with procedures adopted by the Board. Factors used in determining fair value vary by investment type and may include market or investment specific events, changes in interest rates and credit quality. The frequency with which these procedures are used cannot be predicted and they may be utilized to a significant extent. The Committee oversees the Fund's valuation policies and procedures and reports to the Board on the Committee's activities and fair value determinations. The Board monitors the appropriateness of the procedures used in valuing the Fund's investments and ratifies the fair value determinations of the Committee.
The Fund categorizes the inputs to valuation techniques used to value its investments into a disclosure hierarchy consisting of three levels as shown below:
- Level 1 – quoted prices in active markets for identical investments
- Level 2 – other significant observable inputs (including quoted prices for similar investments, interest rates, prepayment speeds, etc.)
- Level 3 – unobservable inputs (including the Fund's own assumptions based on the best information available)
Valuation techniques used to value the Fund's investments by major category are as follows:
Equity securities, including restricted securities, for which market quotations are readily available, are valued at the last reported sale price or official closing price as reported by a third party pricing vendor on the primary market or exchange on which they are traded and are categorized as Level 1 in the hierarchy. In the event there were no sales during the day or closing prices are not available, securities are valued at the last quoted bid price or may be valued using the last available price and are generally categorized as Level 2 in the hierarchy. For foreign equity securities, when market or security specific events arise, comparisons to the valuation of American Depositary Receipts (ADRs), futures contracts, Exchange-Traded Funds (ETFs) and certain indexes as well as quoted prices for similar securities may be used and would be categorized as Level 2 in the hierarchy. Utilizing these techniques may result in transfers between Level 1 and Level 2. For equity securities, including restricted securities, where observable inputs are limited, assumptions about market activity and risk are used and these securities may be categorized as Level 3 in the hierarchy.
Debt securities, including restricted securities, are valued based on evaluated prices received from third party pricing vendors or from brokers who make markets in such securities. U.S. government and government agency obligations are valued by pricing vendors who utilize matrix pricing which considers prepayment speed assumptions, attributes of the collateral, yield or price of bonds of comparable quality, coupon, maturity and type or by broker-supplied prices. When independent prices are unavailable or unreliable, debt securities may be valued utilizing pricing methodologies which consider similar factors that would be used by third party pricing vendors. Debt securities are generally categorized as Level 2 in the hierarchy but may be Level 3 depending on the circumstances.
Futures contracts are valued at the settlement price established each day by the board of trade or exchange on which they are traded and are categorized as Level 1 in the hierarchy. Investments in open-end mutual funds, including the Fidelity Central Funds, are valued at their closing net asset value (NAV) each business day and are categorized as Level 1 in the hierarchy.
Changes in valuation techniques may result in transfers in or out of an assigned level within the disclosure hierarchy. The aggregate value of investments by input level as of November 30, 2015, is included at the end of the Fund's Schedule of Investments.
Foreign Currency. The Fund may use foreign currency contracts to facilitate transactions in foreign-denominated securities. Gains and losses from these transactions may arise from changes in the value of the foreign currency or if the counterparties do not perform under the contracts' terms.
Foreign-denominated assets, including investment securities, and liabilities are translated into U.S. dollars at the exchange rates at period end. Purchases and sales of investment securities, income and dividends received and expenses denominated in foreign currencies are translated into U.S. dollars at the exchange rate in effect on the transaction date.
The effects of exchange rate fluctuations on investments are included with the net realized and unrealized gain (loss) on investment securities. Other foreign currency transactions resulting in realized and unrealized gain (loss) are disclosed separately.
Investment Transactions and Income. For financial reporting purposes, the Fund's investment holdings and NAV include trades executed through the end of the last business day of the period. The NAV per share for processing shareholder transactions is calculated as of the close of business of the New York Stock Exchange (NYSE), normally 4:00 p.m. Eastern time and includes trades executed through the end of the prior business day. Gains and losses on securities sold are determined on the basis of identified cost and may include proceeds received from litigation. Dividend income is recorded on the ex-dividend date, except for certain dividends from foreign securities where the ex-dividend date may have passed, which are recorded as soon as the Fund is informed of the ex-dividend date. Non-cash dividends included in dividend income, if any, are recorded at the fair market value of the securities received. Income and capital gain distributions from Fidelity Central Funds, if any, are recorded on the ex-dividend date. Distributions received on securities that represent a return of capital or capital gain are recorded as a reduction of cost of investments and/or as a realized gain. Subsequent to ex-dividend date the Fund determines the components of these distributions, based upon receipt of tax filings or other correspondence relating to the underlying investment. Interest income is accrued as earned and includes coupon interest and amortization of premium and accretion of discount on debt securities as applicable. Investment income is recorded net of foreign taxes withheld where recovery of such taxes is uncertain.
Class Allocations and Expenses. Investment income, realized and unrealized capital gains and losses, common expenses of the Fund, and certain fund-level expense reductions, if any, are allocated daily on a pro-rata basis to each class based on the relative net assets of each class to the total net assets of the Fund. Each class differs with respect to transfer agent and distribution and service plan fees incurred. Certain expense reductions may also differ by class. For the reporting period, the allocated portion of income and expenses to each class as a percent of its average net assets may vary due to the timing of recording these transactions in relation to fluctuating net assets of the classes. Expenses directly attributable to a fund are charged to that fund. Expenses attributable to more than one fund are allocated among the respective funds on the basis of relative net assets or other appropriate methods. Expense estimates are accrued in the period to which they relate and adjustments are made when actual amounts are known.
Income Tax Information and Distributions to Shareholders. Each year, the Fund intends to qualify as a regulated investment company under Subchapter M of the Internal Revenue Code, including distributing substantially all of its taxable income and realized gains. As a result, no provision for U.S. Federal income taxes is required. As of November 30, 2015, the Fund did not have any unrecognized tax benefits in the financial statements; nor is the Fund aware of any tax positions for which it is reasonably possible that the total amounts of unrecognized tax benefits will significantly change in the next twelve months. The Fund files a U.S. federal tax return, in addition to state and local tax returns as required. The Fund's federal income tax returns are subject to examination by the Internal Revenue Service (IRS) for a period of three fiscal years after they are filed. State and local tax returns may be subject to examination for an additional fiscal year depending on the jurisdiction. Foreign taxes are provided for based on the Fund's understanding of the tax rules and rates that exist in the foreign markets in which it invests. The Fund is subject to a tax imposed on capital gains by certain countries in which it invests. An estimated deferred tax liability for net unrealized appreciation on the applicable securities is included in Other payables and accrued expenses on the Statement of Assets & Liabilities.
Distributions are declared and recorded on the ex-dividend date. Income dividends and capital gain distributions are declared separately for each class. Income and capital gain distributions are determined in accordance with income tax regulations, which may differ from GAAP. In addition, the Fund claimed a portion of the payment made to redeeming shareholders as a distribution for income tax purposes.
Capital accounts within the financial statements are adjusted for permanent book-tax differences. These adjustments have no impact on net assets or the results of operations. Capital accounts are not adjusted for temporary book-tax differences which will reverse in a subsequent period.
Book-tax differences are primarily due to futures contracts, market discount, foreign currency transactions, partnerships, deferred trustees compensation, capital loss carryforwards and losses deferred due to wash sales.
The federal tax cost of investment securities and unrealized appreciation (depreciation) as of period end were as follows:
| Gross unrealized appreciation | $219,576 |
| Gross unrealized depreciation | (215,300) |
| Net unrealized appreciation (depreciation) on securities | $4,276 |
| Tax Cost | $2,456,497 |
The tax-based components of distributable earnings as of period end were as follows:
| Undistributed ordinary income | $1,101 |
| Undistributed long-term capital gain | $39,098 |
| Net unrealized appreciation (depreciation) on securities and other investments | $4,263 |
Capital loss carryforwards are only available to offset future capital gains of the Fund to the extent provided by regulations and may be limited Under the Regulated Investment Company Modernization Act of 2010 (the Act), the Fund is permitted to carry forward capital losses incurred in taxable years beginning after December 22, 2010 for an unlimited period and such capital losses are required to be used prior to any losses that expire The capital loss carryforward information presented below, including any applicable limitation, is estimated as of fiscal period end and is subject to adjustment.
| Fiscal Year of expiration | |
| 2016 | $(250) |
The tax character of distributions paid was as follows:
| 2015 | 2014 | |
| Ordinary Income | $2,753 | $ 1,252 |
Restricted Securities. The Fund may invest in securities that are subject to legal or contractual restrictions on resale. These securities generally may be resold in transactions exempt from registration or to the public if the securities are registered. Disposal of these securities may involve time-consuming negotiations and expense, and prompt sale at an acceptable price may be difficult. Information regarding restricted securities is included at the end of the Fund's Schedule of Investments.
4. Derivative Instruments.
Risk Exposures and the Use of Derivative Instruments. The Fund's investment objective allows the Fund to enter into various types of derivative contracts, including futures contracts. Derivatives are investments whose value is primarily derived from underlying assets, indices or reference rates and may be transacted on an exchange or over-the-counter (OTC). Derivatives may involve a future commitment to buy or sell a specified asset based on specified terms, to exchange future cash flows at periodic intervals based on a notional principal amount, or for one party to make one or more payments upon the occurrence of specified events in exchange for periodic payments from the other party.
The Fund used derivatives to increase returns and to manage exposure to certain risks as defined below. The success of any strategy involving derivatives depends on analysis of numerous economic factors, and if the strategies for investment do not work as intended, the Fund may not achieve its objectives.
The Fund's use of derivatives increased or decreased its exposure to the following risk:
| Equity Risk | Equity risk relates to the fluctuations in the value of financial instruments as a result of changes in market prices (other than those arising from interest rate risk or foreign exchange risk), whether caused by factors specific to an individual investment, its issuer, or all factors affecting all instruments traded in a market or market segment. |
The Fund is also exposed to additional risks from investing in derivatives, such as liquidity risk and counterparty credit risk. Liquidity risk is the risk that the Fund will be unable to close out the derivative in the open market in a timely manner. Counterparty credit risk is the risk that the counterparty will not be able to fulfill its obligation to the Fund. Counterparty credit risk related to exchange-traded futures contracts may be mitigated by the protection provided by the exchange on which they trade.
Investing in derivatives may involve greater risks than investing in the underlying assets directly and, to varying degrees, may involve risk of loss in excess of any initial investment and collateral received and amounts recognized in the Statement of Assets and Liabilities. In addition, there may be the risk that the change in value of the derivative contract does not correspond to the change in value of the underlying instrument.
Futures Contracts. A futures contract is an agreement between two parties to buy or sell a specified underlying instrument for a fixed price at a specified future date. The Fund used futures contracts to manage its exposure to the stock market.
Upon entering into a futures contract, a fund is required to deposit either cash or securities (initial margin) with a clearing broker in an amount equal to a certain percentage of the face value of the contract. Futures contracts are marked-to-market daily and subsequent daily payments (variation margin) are made or received by a fund depending on the daily fluctuations in the value of the futures contracts and are recorded as unrealized appreciation or (depreciation). This receivable and/or payable, if any, is included in daily variation margin for derivative instruments in the Statement of Assets and Liabilities. Realized gain or (loss) is recorded upon the expiration or closing of a futures contract.
Any open futures contracts at period end are presented in the Schedule of Investments under the caption "Futures Contracts". The underlying face amount at value reflects each contract's exposure to the underlying instrument or index at period end. Securities deposited to meet initial margin requirements are identified in the Schedule of Investments.
During the period the Fund recognized net realized gain (loss) of $1,414 and a change in net unrealized appreciation (depreciation) of $243 related to its investment in futures contracts. These amounts are included in the Statement of Operations.
5. Purchases and Sales of Investments.
Purchases and sales of securities, other than short-term securities, aggregated $2,694,262 and $2,894,464, respectively.
6. Fees and Other Transactions with Affiliates.
Management Fee. Fidelity Management & Research Company (the investment adviser) and its affiliates provide the Fund with investment management related services for which the Fund pays a monthly management fee. The management fee is the sum of an individual fund fee rate that is based on an annual rate of .30% of the Fund's average net assets and an annualized group fee rate that averaged .25% during the period. The group fee rate is based upon the average net assets of all the mutual funds advised by the investment adviser, including any mutual funds previously advised by the investment adviser that are currently advised by Fidelity SelectCo, LLC, an affiliate of the investment adviser. The group fee rate decreases as assets under management increase and increases as assets under management decrease. In addition, the management fee is subject to a performance adjustment (up to a maximum of +/- .20% of the Fund's average net assets over a 36 month performance period). The upward or downward adjustment to the management fee is based on the relative investment performance of the Institutional Class of the Fund as compared to its benchmark index, the S&P MidCap 400 Index, over the same 36 month performance period. For the reporting period, the total annual management fee rate, including the performance adjustment, was .49% of the Fund's average net assets. The performance adjustment included in the management fee rate may be higher or lower than the maximum performance adjustment rate due to the difference between the average net assets for the reporting and performance periods.
Distribution and Service Plan Fees. In accordance with Rule 12b-1 of the 1940 Act, the Fund has adopted separate Distribution and Service Plans for each class of shares. Certain classes pay Fidelity Distributors Corporation (FDC), an affiliate of the investment adviser, separate Distribution and Service Fees, each of which is based on an annual percentage of each class' average net assets. In addition, FDC may pay financial intermediaries for selling shares of the Fund and providing shareholder support services. For the period, the Distribution and Service Fee rates, total fees and amounts retained by FDC were as follows:
| Distribution Fee | Service Fee | Total Fees | Retained by FDC | |
| Class A | -% | .25% | $1,588 | $4 |
| Class T | .25% | .25% | 3,773 | 8 |
| Class B | .75% | .25% | 130 | 98 |
| Class C | .75% | .25% | 1,677 | 26 |
| $7,168 | $136 |
Sales Load. FDC may receive a front-end sales charge of up to 5.75% for selling Class A shares and 3.50% for selling Class T shares, some of which is paid to financial intermediaries for selling shares of the Fund. Depending on the holding period, FDC may receive contingent deferred sales charges levied on Class A, Class T, Class B, and Class C redemptions. The deferred sales charges range from 5.00% to 1.00% for Class B shares, 1.00% for Class C shares, 1.00% for certain purchases of Class A shares and .25% for certain purchases of Class T shares.
For the period, sales charge amounts retained by FDC were as follows:
| Retained by FDC | |
| Class A | $37 |
| Class T | 19 |
| Class B(a) | 3 |
| Class C(a) | 7 |
| $66 |
(a) When Class B and Class C shares are initially sold, FDC pays commissions from its own resources to financial intermediaries through which the sales are made.
Transfer Agent Fees. Fidelity Investments Institutional Operations Company, Inc., (FIIOC), an affiliate of the investment adviser, is the transfer, dividend disbursing and shareholder servicing agent for each class of the Fund. FIIOC receives account fees and asset-based fees that vary according to the account size and type of account of the shareholders of the respective classes of the Fund. FIIOC pays for typesetting, printing and mailing of shareholder reports, except proxy statements.
For the period, transfer agent fees for each class were as follows:
| Amount | % of Class-Level Average Net Assets | |
| Class A | $1,304 | .21 |
| Class T | 1,431 | .19 |
| Class B | 39 | .30 |
| Class C | 350 | .21 |
| Fidelity Stock Selector Mid Cap Fund | 1,196 | .22 |
| Class I | 1,287 | .30 |
| $5,607 |
Accounting and Security Lending Fees. Fidelity Service Company, Inc. (FSC), an affiliate of the investment adviser, maintains the Fund's accounting records. The accounting fee is based on the level of average net assets for each month. Under a separate contract, FSC administers the security lending program. The security lending fee is based on the number and duration of lending transactions.
Brokerage Commissions. The Fund placed a portion of its portfolio transactions with brokerage firms which are affiliates of the investment adviser. Brokerage commissions are included in net realized gain (loss) and change in net unrealized appreciation (depreciation) in the Statement of Operations. The commissions paid to these affiliated firms were $42 for the period.
7. Committed Line of Credit.
The Fund participates with other funds managed by the investment adviser or an affiliate in a $4.25 billion credit facility (the "line of credit") to be utilized for temporary or emergency purposes to fund shareholder redemptions or for other short-term liquidity purposes. The Fund has agreed to pay commitment fees on its pro-rata portion of the line of credit, which amounted to $4 and is reflected in Miscellaneous expenses on the Statement of Operations. During the period, the Fund did not borrow on this line of credit.
8. Security Lending.
The Fund lends portfolio securities through a lending agent from time to time in order to earn additional income. For equity securities, a lending agent is used and may loan securities to certain qualified borrowers, including Fidelity Capital Markets (FCM), a broker-dealer affiliated with the Fund. On the settlement date of the loan, the Fund receives collateral (in the form of U.S. Treasury obligations, letters of credit and/or cash) against the loaned securities and maintains collateral in an amount not less than 100% of the market value of the loaned securities during the period of the loan. The market value of the loaned securities is determined at the close of business of the Fund and any additional required collateral is delivered to the Fund on the next business day. The Fund or borrower may terminate the loan at any time, and if the borrower defaults on its obligation to return the securities loaned because of insolvency or other reasons, the Fund may apply collateral received from the borrower against the obligation. The Fund may experience delays and costs in recovering the securities loaned. Any cash collateral received is invested in the Fidelity Securities Lending Cash Central Fund. The value of loaned securities and cash collateral at period end are disclosed on the Fund's Statement of Assets and Liabilities. The value of securities loaned to FCM at period end was $2,673. Security lending income represents the income earned on investing cash collateral, less rebates paid to borrowers and any lending agent fees associated with the loan, plus any premium payments received for lending certain types of securities. Security lending income is presented in the Statement of Operations as a component of income from Fidelity Central Funds. Total security lending income during the period amounted to $295, including $10 from securities loaned to FCM.
9. Expense Reductions.
Commissions paid to certain brokers with whom the investment adviser, or its affiliates, places trades on behalf of the Fund include an amount in addition to trade execution, which may be rebated back to the Fund to offset certain expenses. This amount totaled $195 for the period.
In addition, during the period the investment adviser reimbursed and/or waived a portion of fund-level operating expenses in the amount of $10 and a portion of class-level operating expenses as follows:
| Amount | |
| Class A | $15 |
| Class T | 19 |
| Class B | –(a) |
| Class C | 4 |
| Fidelity Stock Selector Mid Cap Fund | 8 |
| Class I | 4 |
| $50 |
(a) In the amount of less than five hundred dollars.
10. Distributions to Shareholders.
Distributions to shareholders of each class were as follows:
| Years ended November 30, | 2015 | 2014 |
| From net investment income | ||
| Class A | $– | $146 |
| Fidelity Stock Selector Mid Cap Fund | 1,667 | 530 |
| Class I | 1,086 | 576 |
| Total | $2,753 | $1,252 |
11. Share Transactions.
Share transactions for each class were as follows and may contain automatic conversions between classes or exchanges between funds:
| Shares | Shares | Dollars | Dollars | |
| Years ended November 30, | 2015 | 2014 | 2015 | 2014 |
| Class A | ||||
| Shares sold | 1,378 | 1,462 | $44,847 | $44,155 |
| Reinvestment of distributions | – | 5 | – | 134 |
| Shares redeemed | (3,369) | (5,341) | (109,342) | (162,259) |
| Net increase (decrease) | (1,991) | (3,874) | $(64,495) | $(117,970) |
| Class T | ||||
| Shares sold | 1,615 | 1,902 | $53,028 | $57,696 |
| Shares redeemed | (5,214) | (5,637) | (170,224) | (170,461) |
| Net increase (decrease) | (3,599) | (3,735) | $(117,196) | $(112,765) |
| Class B | ||||
| Shares sold | 2 | 3 | $36 | $76 |
| Shares redeemed | (219) | (244) | (6,583) | (6,801) |
| Net increase (decrease) | (217) | (241) | $(6,547) | $(6,725) |
| Class C | ||||
| Shares sold | 234 | 175 | $7,096 | $4,902 |
| Shares redeemed | (818) | (833) | (24,477) | (23,364) |
| Net increase (decrease) | (584) | (658) | $(17,381) | $(18,462) |
| Fidelity Stock Selector Mid Cap Fund | ||||
| Shares sold | 939 | 10,810 | $31,733 | $334,414 |
| Reinvestment of distributions | 49 | 18 | 1,651 | 518 |
| Shares redeemed | (3,087) | (1,745) | (101,545) | (54,485) |
| Net increase (decrease) | (2,099) | 9,083 | $(68,161) | $280,447 |
| Class I | ||||
| Shares sold | 5,194 | 5,585 | $175,072 | $173,899 |
| Reinvestment of distributions | 30 | 17 | 1,015 | 502 |
| Shares redeemed | (2,041) | (1,659) | (68,817) | (51,892) |
| Net increase (decrease) | 3,183 | 3,943 | $107,270 | $122,509 |
12. Other.
The Fund's organizational documents provide former and current trustees and officers with a limited indemnification against liabilities arising in connection with the performance of their duties to the Fund. In the normal course of business, the Fund may also enter into contracts that provide general indemnifications. The Fund's maximum exposure under these arrangements is unknown as this would be dependent on future claims that may be made against the Fund. The risk of material loss from such claims is considered remote.
At the end of the period, Strategic Advisers Small-Mid Cap Fund was the owner of record of approximately 11% of the total outstanding shares of the Fund.
Report of Independent Registered Public Accounting Firm
To the Trustees of Fidelity Advisor Series I and Shareholders of Fidelity Advisor® Stock Selector Mid Cap Fund:
We have audited the accompanying statement of assets and liabilities of Fidelity Advisor® Stock Selector Mid Cap Fund (the Fund), a fund of Fidelity Advisor Series I, including the schedule of investments, as of November 30, 2015, and the related statement of operations for the year then ended, the statement of changes in net assets for each of the two years in the period then ended, and the financial highlights for each of the five years in the period then ended. These financial statements and financial highlights are the responsibility of the Fund's management. Our responsibility is to express an opinion on these financial statements and financial highlights based on our audits.
We conducted our audits in accordance with the standards of the Public Company Accounting Oversight Board (United States). Those standards require that we plan and perform the audit to obtain reasonable assurance about whether the financial statements and financial highlights are free of material misstatement. The Fund is not required to have, nor were we engaged to perform, an audit of its internal control over financial reporting. Our audits included consideration of internal control over financial reporting as a basis for designing audit procedures that are appropriate in the circumstances, but not for the purpose of expressing an opinion on the effectiveness of the Fund's internal control over financial reporting. Accordingly, we express no such opinion. An audit also includes examining, on a test basis, evidence supporting the amounts and disclosures in the financial statements, assessing the accounting principles used and significant estimates made by management, as well as evaluating the overall financial statement presentation. Our procedures included confirmation of securities owned as of November 30, 2015, by correspondence with the custodians and brokers; when replies were not received from brokers, we performed other auditing procedures. We believe our audits provide a reasonable basis for our opinion.
In our opinion, such financial statements and financial highlights referred to above present fairly, in all material respects, the financial position of Fidelity Advisor® Stock Selector Mid Cap Fund as of November 30, 2015, the results of its operations for the year then ended, the changes in its net assets for each of the two years in the period then ended, and the financial highlights for each of the five years in the period then ended, in conformity with accounting principles generally accepted in the United States of America.
DELOITTE & TOUCHE LLP
Boston, Massachusetts
January 20, 2016
Trustees and Officers
The Trustees, Members of the Advisory Board (if any), and officers of the trust and fund, as applicable, are listed below. The Board of Trustees governs the fund and is responsible for protecting the interests of shareholders. The Trustees are experienced executives who meet periodically throughout the year to oversee the fund's activities, review contractual arrangements with companies that provide services to the fund, oversee management of the risks associated with such activities and contractual arrangements, and review the fund's performance. Each of the Trustees oversees 170 funds.
The Trustees hold office without limit in time except that (a) any Trustee may resign; (b) any Trustee may be removed by written instrument, signed by at least two-thirds of the number of Trustees prior to such removal; (c) any Trustee who requests to be retired or who has become incapacitated by illness or injury may be retired by written instrument signed by a majority of the other Trustees; and (d) any Trustee may be removed at any special meeting of shareholders by a two-thirds vote of the outstanding voting securities of the trust. Each Trustee who is not an interested person (as defined in the 1940 Act) of the trust and the fund is referred to herein as an Independent Trustee. Each Independent Trustee shall retire not later than the last day of the calendar year in which his or her 75th birthday occurs. The Independent Trustees may waive this mandatory retirement age policy with respect to individual Trustees. Officers and Advisory Board Members hold office without limit in time, except that any officer or Advisory Board Member may resign or may be removed by a vote of a majority of the Trustees at any regular meeting or any special meeting of the Trustees. Except as indicated, each individual has held the office shown or other offices in the same company for the past five years.
The fund’s Statement of Additional Information (SAI) includes more information about the Trustees. To request a free copy, call Fidelity at 1-877-208-0098.
Experience, Skills, Attributes, and Qualifications of the Trustees. The Governance and Nominating Committee has adopted a statement of policy that describes the experience, qualifications, attributes, and skills that are necessary and desirable for potential Independent Trustee candidates (Statement of Policy). The Board believes that each Trustee satisfied at the time he or she was initially elected or appointed a Trustee, and continues to satisfy, the standards contemplated by the Statement of Policy. The Governance and Nominating Committee also engages professional search firms to help identify potential Independent Trustee candidates who have the experience, qualifications, attributes, and skills consistent with the Statement of Policy. From time to time, additional criteria based on the composition and skills of the current Independent Trustees, as well as experience or skills that may be appropriate in light of future changes to board composition, business conditions, and regulatory or other developments, have also been considered by the professional search firms and the Governance and Nominating Committee. In addition, the Board takes into account the Trustees' commitment and participation in Board and committee meetings, as well as their leadership of standing and ad hoc committees throughout their tenure.
In determining that a particular Trustee was and continues to be qualified to serve as a Trustee, the Board has considered a variety of criteria, none of which, in isolation, was controlling. The Board believes that, collectively, the Trustees have balanced and diverse experience, qualifications, attributes, and skills, which allow the Board to operate effectively in governing the fund and protecting the interests of shareholders. Information about the specific experience, skills, attributes, and qualifications of each Trustee, which in each case led to the Board's conclusion that the Trustee should serve (or continue to serve) as a trustee of the fund, is provided below.
Board Structure and Oversight Function. James C. Curvey is an interested person and currently serves as Chairman. The Trustees have determined that an interested Chairman is appropriate and benefits shareholders because an interested Chairman has a personal and professional stake in the quality and continuity of services provided to the fund. Independent Trustees exercise their informed business judgment to appoint an individual of their choosing to serve as Chairman, regardless of whether the Trustee happens to be independent or a member of management. The Independent Trustees have determined that they can act independently and effectively without having an Independent Trustee serve as Chairman and that a key structural component for assuring that they are in a position to do so is for the Independent Trustees to constitute a substantial majority for the Board. The Independent Trustees also regularly meet in executive session. Ned C. Lautenbach serves as Chairman of the Independent Trustees and as such (i) acts as a liaison between the Independent Trustees and management with respect to matters important to the Independent Trustees and (ii) with management prepares agendas for Board meetings.
Fidelity® funds are overseen by different Boards of Trustees. The fund's Board oversees Fidelity's high income and certain equity funds, and other Boards oversee Fidelity's investment-grade bond, money market, asset allocation, and sector funds. The asset allocation funds may invest in Fidelity® funds overseen by the fund's Board. The use of separate Boards, each with its own committee structure, allows the Trustees of each group of Fidelity® funds to focus on the unique issues of the funds they oversee, including common research, investment, and operational issues. On occasion, the separate Boards establish joint committees to address issues of overlapping consequences for the Fidelity® funds overseen by each Board.
The Trustees operate using a system of committees to facilitate the timely and efficient consideration of all matters of importance to the Trustees, the fund, and fund shareholders and to facilitate compliance with legal and regulatory requirements and oversight of the fund's activities and associated risks. The Board, acting through its committees, has charged FMR and its affiliates with (i) identifying events or circumstances the occurrence of which could have demonstrably adverse effects on the fund's business and/or reputation; (ii) implementing processes and controls to lessen the possibility that such events or circumstances occur or to mitigate the effects of such events or circumstances if they do occur; and (iii) creating and maintaining a system designed to evaluate continuously business and market conditions in order to facilitate the identification and implementation processes described in (i) and (ii) above. Because the day-to-day operations and activities of the fund are carried out by or through FMR, its affiliates, and other service providers, the fund's exposure to risks is mitigated but not eliminated by the processes overseen by the Trustees. While each of the Board's committees has responsibility for overseeing different aspects of the fund's activities, oversight is exercised primarily through the Operations, Audit, and Compliance Committees. In addition, the Independent Trustees have worked with FMR to enhance the Board's oversight of investment and financial risks, legal and regulatory risks, technology risks, and operational risks, including the development of additional risk reporting to the Board. For example, a working group comprised of Independent Trustees and FMR has worked and continues to work to review the Fidelity® funds' valuation-related activities, reporting and risk management. Appropriate personnel, including but not limited to the fund's Chief Compliance Officer (CCO), FMR's internal auditor, the independent accountants, the fund's Treasurer and portfolio management personnel, make periodic reports to the Board's committees, as appropriate, including an annual review of Fidelity's risk management program for the Fidelity® funds. The responsibilities of each standing committee, including their oversight responsibilities, are described further under "Standing Committees of the Trustees."
Interested Trustees*:
Correspondence intended for a Trustee who is an interested person may be sent to Fidelity Investments, 245 Summer Street, Boston, Massachusetts 02210.
Name, Year of Birth; Principal Occupations and Other Relevant Experience+
James C. Curvey (1935)
Year of Election or Appointment: 2007
Trustee
Chairman of the Board of Trustees
Mr. Curvey also serves as Trustee of other Fidelity® funds. Mr. Curvey is a Director of Fidelity Research & Analysis Co. (investment adviser firm, 2009-present), and Vice Chairman (2007-present) and Director of FMR LLC (diversified financial services company). In addition, Mr. Curvey serves as an Overseer for the Boston Symphony Orchestra and a member of the board of Artis-Naples, Naples, Florida, and as a Trustee for Brewster Academy, Wolfeboro, New Hampshire. Previously, Mr. Curvey served as a Director of Fidelity Investments Money Management, Inc. (investment adviser firm, 2009-2014) and a Director of FMR and FMR Co., Inc. (investment adviser firms, 2007-2014).
Charles S. Morrison (1960)
Year of Election or Appointment: 2014
Trustee
Mr. Morrison also serves as Trustee of other funds. He serves as a Director of Fidelity Investments Money Management, Inc. (FIMM) (investment adviser firm, 2014-present), Director of Fidelity SelectCo, LLC (investment adviser firm, 2014-present), President, Asset Management (2014-present), and is an employee of Fidelity Investments. Previously, Mr. Morrison served as Vice President of Fidelity's Fixed Income and Asset Allocation Funds (2012-2014), President, Fixed Income (2011-2014), Vice President of Fidelity's Money Market Funds (2005-2009), President, Money Market Group Leader of FMR (investment adviser firm, 2009), and Senior Vice President, Money Market Group of FMR (2004-2009). Mr. Morrison also served as Vice President of Fidelity's Bond Funds (2002-2005), certain Balanced Funds (2002-2005), and certain Asset Allocation Funds (2002-2007), and as Senior Vice President (2002-2005) of Fidelity's Bond Division.
* Determined to be an “Interested Trustee” by virtue of, among other things, his or her affiliation with the trust or various entities under common control with FMR.
+ The information includes the Trustee's principal occupation during the last five years and other information relating to the experience, attributes, and skills relevant to the Trustee's qualifications to serve as a Trustee, which led to the conclusion that the Trustee should serve as a Trustee for the fund.
Independent Trustees:
Correspondence intended for an Independent Trustee may be sent to Fidelity Investments, P.O. Box 55235, Boston, Massachusetts 02205-5235.
Name, Year of Birth; Principal Occupations and Other Relevant Experience+
Dennis J. Dirks (1948)
Year of Election or Appointment: 2005
Trustee
Mr. Dirks also serves as Trustee of other Fidelity® funds. Prior to his retirement in May 2003, Mr. Dirks was Chief Operating Officer and a member of the Board of The Depository Trust & Clearing Corporation (DTCC). He also served as President, Chief Operating Officer, and Board member of The Depository Trust Company (DTC) and President and Board member of the National Securities Clearing Corporation (NSCC). In addition, Mr. Dirks served as Chief Executive Officer and Board member of the Government Securities Clearing Corporation, Chief Executive Officer and Board member of the Mortgage-Backed Securities Clearing Corporation, as a Trustee and a member of the Finance Committee of Manhattan College (2005-2008), as a Trustee and a member of the Finance Committee of AHRC of Nassau County (2006-2008), and as a member of the Independent Directors Council (IDC) Governing Council (2010-2015). Mr. Dirks is a member of the Board of Directors for The Brookville Center for Children's Services, Inc. (2009-present).
Alan J. Lacy (1953)
Year of Election or Appointment: 2008
Trustee
Mr. Lacy also serves as Trustee of other Fidelity® funds. Mr. Lacy serves as a member of the Board of Directors of Dave & Buster's Entertainment, Inc. (restaurant and entertainment complexes, 2010-present) and Bristol-Myers Squibb Company (global pharmaceuticals, 2008-present). In addition, Mr. Lacy served as Senior Adviser (2007-2014) of Oak Hill Capital Partners, L.P. (private equity) and also served as Chief Executive Officer (2000-2005) and Vice Chairman (2005-2006) of Sears Holdings Corporation and Sears, Roebuck and Co. (retail). Mr. Lacy is a member of the Board of Trustees of The National Parks Conservation Association (2006-present). Previously, Mr. Lacy served as Chairman of the Board of Trustees of the National Parks Conservation Association (2008-2011) and as a member of the Board of Directors for The Western Union Company (global money transfer, 2006-2011), The Hillman Companies, Inc. (hardware wholesalers, 2010-2014), and Earth Fare, Inc. (retail grocery, 2010-2014).
Ned C. Lautenbach (1944)
Year of Election or Appointment: 2000
Trustee
Chairman of the Independent Trustees
Mr. Lautenbach also serves as Trustee of other Fidelity® funds. Mr. Lautenbach currently serves as the Lead Director of the Eaton Corporation Board of Directors (diversified industrial, 1997-present). Mr. Lautenbach is Chairman of the Board of Directors of Artis-Naples in Naples, Florida (2012-present), a member of the Council on Foreign Relations (1994-present), and a member of the Board of Governors, State University System of Florida (2013-present). Previously, Mr. Lautenbach was a Partner/Advisory Partner at Clayton, Dubilier & Rice, LLC (private equity investment, 1998-2010), as well as a Director of Sony Corporation (2006-2007).
Joseph Mauriello (1944)
Year of Election or Appointment: 2008
Trustee
Mr. Mauriello also serves as Trustee of other Fidelity® funds. Prior to his retirement in January 2006, Mr. Mauriello served in numerous senior management positions including Deputy Chairman and Chief Operating Officer (2004-2005), and Vice Chairman of Financial Services (2002-2004) of KPMG LLP US (professional services, 1965-2005). Mr. Mauriello currently serves as a member of the Board of Directors of XL Group plc. (global insurance and re-insurance, 2006-present) and the Independent Directors Council (IDC) Governing Council (2015-present). Previously, Mr. Mauriello served as a Director of the Hamilton Funds of the Bank of New York (2006-2007) and of Arcadia Resources Inc. (health care services and products, 2007-2012).
Robert W. Selander (1950)
Year of Election or Appointment: 2011
Trustee
Mr. Selander also serves as Trustee of other Fidelity® funds. Mr. Selander serves as a Director of The Western Union Company (global money transfer, 2014-present). Previously, Mr. Selander served as a Member of the Advisory Board of other Fidelity® funds (2011), and Executive Vice Chairman (2010), Chief Executive Officer (2009-2010), and President and Chief Executive Officer (1997-2009) of Mastercard, Inc.
Cornelia M. Small (1944)
Year of Election or Appointment: 2005
Trustee
Ms. Small also serves as Trustee of other Fidelity® funds. Ms. Small is a member of the Board of Directors (2009-present) and Chair of the Investment Committee (2010-present) of the Teagle Foundation. Ms. Small also serves on the Investment Committee of the Berkshire Taconic Community Foundation (2008-present). Previously, Ms. Small served as Chairperson (2002-2008) and a member of the Investment Committee and Chairperson (2008-2012) and a member of the Board of Trustees of Smith College. In addition, Ms. Small served as Chief Investment Officer, Director of Global Equity Investments, and a member of the Board of Directors of Scudder, Stevens & Clark and Scudder Kemper Investments.
William S. Stavropoulos (1939)
Year of Election or Appointment: 2002
Trustee
Vice Chairman of the Independent Trustees
Mr. Stavropoulos also serves as Trustee of other Fidelity® funds. Mr. Stavropoulos serves as President and Founder of the Michigan Baseball Foundation, the Great Lakes Loons (2007-present). Mr. Stavropoulos is Chairman Emeritus of the Board of Directors of The Dow Chemical Company, where he previously served in numerous senior management positions, including President, CEO (1995-2000; 2002-2004), Chairman of the Executive Committee (2000-2006), and as a member of the Board of Directors (1990-2006). Currently, Mr. Stavropoulos is Chairman of the Board of Directors of Univar Inc. (global distributor of commodity and specialty chemicals), a Director of Teradata Corporation (data warehousing and technology solutions), and Maersk Inc. (industrial conglomerate), and a member of the Advisory Board for Metalmark Capital LLC (private equity investment, 2005-present). Mr. Stavropoulos is an operating advisor to Clayton, Dubilier & Rice, LLC (private equity investment). In addition, Mr. Stavropoulos is a member of the University of Notre Dame Advisory Council for the College of Science, a Trustee of the Rollin L. Gerstacker Foundation, and a Director of the Naples Philharmonic Center for the Arts. Previously, Mr. Stavropoulos served as a Director of Chemical Financial Corporation (bank holding company, 1993-2012) and Tyco International, Ltd. (multinational manufacturing and services, 2007-2012).
David M. Thomas (1949)
Year of Election or Appointment: 2008
Trustee
Mr. Thomas also serves as Trustee of other Fidelity® funds. Mr. Thomas serves as Non-Executive Chairman of the Board of Directors of Fortune Brands Home and Security (home and security products, 2011-present), as a member of the Board of Directors (2004-present) and Presiding Director (2013-present) of Interpublic Group of Companies, Inc. (marketing communication), and as a member of the Board of Trustees of the University of Florida (2013-present). Previously, Mr. Thomas served as Executive Chairman (2005-2006) and Chairman and Chief Executive Officer (2000-2005) of IMS Health, Inc. (pharmaceutical and healthcare information solutions), and a Director of Fortune Brands, Inc. (consumer products, 2000-2011).
+ The information includes the Trustee's principal occupation during the last five years and other information relating to the experience, attributes, and skills relevant to the Trustee's qualifications to serve as a Trustee, which led to the conclusion that the Trustee should serve as a Trustee for the fund.
Advisory Board Members and Officers:
Correspondence intended for an officer or Peter S. Lynch may be sent to Fidelity Investments, 245 Summer Street, Boston, Massachusetts 02210. Officers appear below in alphabetical order.
Name, Year of Birth; Principal Occupation
Peter S. Lynch (1944)
Year of Election or Appointment: 2003
Member of the Advisory Board
Mr. Lynch also serves as Member of the Advisory Board of other Fidelity® funds. Mr. Lynch is Vice Chairman and a Director of FMR (investment adviser firm) and FMR Co., Inc. (investment adviser firm). In addition, Mr. Lynch serves as a Trustee of Boston College and as the Chairman of the Inner-City Scholarship Fund. Previously, Mr. Lynch served on the Special Olympics International Board of Directors (1997-2006).
Elizabeth Paige Baumann (1968)
Year of Election or Appointment: 2012
Anti-Money Laundering (AML) Officer
Ms. Baumann also serves as AML Officer of other funds. She is Chief AML Officer of FMR LLC (diversified financial services company, 2012-present) and is an employee of Fidelity Investments. Previously, Ms. Baumann served as Vice President and Deputy Anti-Money Laundering Officer (2007-2012).
Marc R. Bryant (1966)
Year of Election or Appointment: 2015
Secretary and Chief Legal Officer (CLO)
Mr. Bryant also serves as Secretary and CLO of other funds. Mr. Bryant serves as CLO, Secretary, and Senior Vice President of Fidelity Management & Research Company (investment adviser firm, 2015-present) and FMR Co., Inc. (investment adviser firm, 2015-present); Secretary of Fidelity SelectCo, LLC (investment adviser firm, 2015-present) and Fidelity Investments Money Management, Inc. (investment adviser firm, 2015-present); and CLO of Fidelity Management & Research (Hong Kong) Limited (investment adviser firm, 2015-present). He is Senior Vice President and Deputy General Counsel of FMR LLC (diversified financial services company). Previously, Mr. Bryant served as Secretary and CLO of Fidelity Rutland Square Trust II (2010-2014) and Assistant Secretary of Fidelity's Fixed Income and Asset Allocation Funds (2013-2015). Prior to joining Fidelity Investments, Mr. Bryant served as a Senior Vice President and the Head of Global Retail Legal for AllianceBernstein L.P. (2006-2010), and as the General Counsel for ProFund Advisors LLC (2001-2006).
William C. Coffey (1969)
Year of Election or Appointment: 2009
Assistant Secretary
Mr. Coffey also serves as Assistant Secretary of other funds. He is Senior Vice President and Deputy General Counsel of FMR LLC (diversified financial services company, 2010-present), and is an employee of Fidelity Investments. Previously, Mr. Coffey served as Vice President and Associate General Counsel of FMR LLC (2005-2009).
Jonathan Davis (1968)
Year of Election or Appointment: 2010
Assistant Treasurer
Mr. Davis also serves as Assistant Treasurer of other funds, and is an employee of Fidelity Investments. Previously, Mr. Davis served as Vice President and Associate General Counsel of FMR LLC (diversified financial services company, 2003-2010).
Adrien E. Deberghes (1967)
Year of Election or Appointment: 2008
Deputy Treasurer
Mr. Deberghes also serves as an officer of other funds. He is an employee of Fidelity Investments (2008-present). Prior to joining Fidelity Investments, Mr. Deberghes was Senior Vice President of Mutual Fund Administration at State Street Corporation (2007-2008), Senior Director of Mutual Fund Administration at Investors Bank & Trust (2005-2007), and Director of Finance for Dunkin' Brands (2000-2005).
Stephanie J. Dorsey (1969)
Year of Election or Appointment: 2010
Assistant Treasurer
Ms. Dorsey also serves as an officer of other funds. She is an employee of Fidelity Investments (2008-present) and has served in other fund officer roles. Prior to joining Fidelity Investments, Ms. Dorsey served as Treasurer (2004-2008) of the JPMorgan Mutual Funds and Vice President (2004-2008) of JPMorgan Chase Bank.
Howard J. Galligan III (1966)
Year of Election or Appointment: 2014
Chief Financial Officer
Mr. Galligan also serves as Chief Financial Officer of other funds. Mr. Galligan serves as President of Fidelity Pricing and Cash Management Services (FPCMS) (2014-present) and as a Director of Strategic Advisers, Inc. (investment adviser firm, 2008-present). Previously, Mr. Galligan served as Chief Administrative Officer of Asset Management (2011-2014) and Chief Operating Officer and Senior Vice President of Investment Support for Strategic Advisers, Inc. (2003-2011).
Scott C. Goebel (1968)
Year of Election or Appointment: 2015
Vice President
Mr. Goebel serves as Vice President of other funds and is an employee of Fidelity Investments (2001-present). Previously, Mr. Goebel served as Secretary of Fidelity SelectCo, LLC (investment adviser firm, 2013-2015), Fidelity Investments Money Management, Inc. (FIMM) (investment adviser firm, 2010-2015), and Fidelity Research and Analysis Company (FRAC) (investment adviser firm, 2010-2015); General Counsel, Secretary, and Senior Vice President of Fidelity Management & Research Company (investment adviser firm, 2008-2015) and FMR Co., Inc. (investment adviser firm, 2008-2015); Assistant Secretary of Fidelity Management & Research (Japan) Limited (investment adviser firm, 2008-2015) and FMR Investment Management (U.K.) Limited (investment adviser firm, 2008-2015); Chief Legal Officer (CLO) of Fidelity Management & Research (Hong Kong) Limited (investment adviser firm, 2008-2015); Secretary and CLO of certain Fidelity® funds (2008-2015); Assistant Secretary of FIMM (2008-2010), FRAC (2008-2010), and certain funds (2007-2008); and as Vice President and Secretary of Fidelity Distributors Corporation (FDC) (2005-2007).
Thomas C. Hense (1964)
Year of Election or Appointment: 2008, 2010, or 2015
Vice President
Mr. Hense serves as Vice President of Fidelity Advisor® Multi-Asset Income Fund (2015) and other funds (High Income (2008), Small Cap (2008), and Value (2010) funds), and is an employee of Fidelity Investments (1993-present). Previously, Mr. Hense served as a portfolio manager for Fidelity's Institutional Money Management Group (Pyramis) (2003-2008).
Brian B. Hogan (1964)
Year of Election or Appointment: 2009
Vice President
Mr. Hogan also serves as Trustee or Vice President of other funds. Mr. Hogan serves as a Director of Fidelity SelectCo, LLC (investment adviser firm, 2014-present) and President of the Equity Division of FMR (investment adviser firm, 2009-present). Previously, Mr. Hogan served as Senior Vice President, Equity Research of FMR (2006-2009) and as a portfolio manager.
Chris Maher (1972)
Year of Election or Appointment: 2013
Assistant Treasurer
Mr. Maher serves as Assistant Treasurer of other funds. Mr. Maher is Vice President of Valuation Oversight and is an employee of Fidelity Investments. Previously, Mr. Maher served as Vice President of Asset Management Compliance (2013), Vice President of the Program Management Group of FMR (investment adviser firm, 2010-2013), and Vice President of Valuation Oversight (2008-2010).
Kenneth B. Robins (1969)
Year of Election or Appointment: 2008
President and Treasurer
Mr. Robins also serves as an officer of other funds. Mr. Robins serves as Executive Vice President of Fidelity Investments Money Management, Inc. (FIMM) (investment adviser firm, 2013-present) and is an employee of Fidelity Investments (2004-present). Previously, Mr. Robins served in other fund officer roles.
Stacie M. Smith (1974)
Year of Election or Appointment: 2013
Deputy Treasurer
Ms. Smith also serves as an officer of other funds. She is an employee of Fidelity Investments (2009-present) and has served in other fund officer roles. Prior to joining Fidelity Investments, Ms. Smith served as Senior Audit Manager of Ernst & Young LLP (1996-2009).
Renee Stagnone (1975)
Year of Election or Appointment: 2013
Deputy Treasurer
Ms. Stagnone also serves as Deputy Treasurer of other funds. Ms. Stagnone is an employee of Fidelity Investments (1997-present).
Linda J. Wondrack (1964)
Year of Election or Appointment: 2014
Chief Compliance Officer
Ms. Wondrack also serves as Chief Compliance Officer of other funds. Ms. Wondrack is Executive Vice President and head of the Ethics Office and Asset Management Compliance for Fidelity Investments (2012-present). Ms. Wondrack also serves as Chief Compliance Officer of Fidelity SelectCo, LLC (investment adviser firm, 2014-present); Chief Compliance Officer of Impresa Management LLC (2013-present); and Chief Compliance Officer of FMR Co., Inc. (investment adviser firm), Fidelity Investments Money Management, Inc. (investment adviser firm), Fidelity Management & Research (Japan) Limited (investment adviser firm), FMR Investment Management (U.K.) Limited (investment adviser firm), Fidelity Management & Research (Hong Kong) (investment adviser firm), Fidelity Management & Research Company (investment adviser firm), FIAM LLC (investment adviser firm), and Strategic Advisers, Inc. (investment adviser firm), Ballyrock Investment Advisors LLC, and Northern Neck Investors LLC (2012-present). Previously, Ms. Wondrack served as Senior Vice President and Chief Compliance Officer for Columbia Management Investment Advisers, LLC (2005-2012); Chief Compliance Officer for certain funds within the Columbia Family of Funds (2007-2012); and Senior Vice President of Compliance Risk Management at Bank of America (2005-2010).
Joseph F. Zambello (1957)
Year of Election or Appointment: 2011
Deputy Treasurer
Mr. Zambello also serves as Deputy Treasurer of other funds. Mr. Zambello is an employee of Fidelity Investments (1991-present). Previously, Mr. Zambello served as Vice President of the Program Management Group of FMR (investment adviser firm, 2009-2011) and Vice President of the Transfer Agent Oversight Group (2005-2009).
Shareholder Expense Example
As a shareholder of the Fund, you incur two types of costs: (1) transaction costs, including sales charges (loads) on purchase payments or redemption proceeds, and (2) ongoing costs, including management fees, distribution and/or service (12b-1) fees and other Fund expenses. This Example is intended to help you understand your ongoing costs (in dollars) of investing in the Fund and to compare these costs with the ongoing costs of investing in other mutual funds.
The Example is based on an investment of $1,000 invested at the beginning of the period and held for the entire period (June 1, 2015 to November 30, 2015).
Actual Expenses
The first line of the accompanying table for each class of the Fund provides information about actual account values and actual expenses. You may use the information in this line, together with the amount you invested, to estimate the expenses that you paid over the period. Simply divide your account value by $1,000.00 (for example, an $8,600 account value divided by $1,000.00 = 8.6), then multiply the result by the number in the first line for a class of the Fund under the heading entitled "Expenses Paid During Period" to estimate the expenses you paid on your account during this period. A small balance maintenance fee of $12.00 that is charged once a year may apply for certain accounts with a value of less than $2,000. This fee is not included in the table below. If it was, the estimate of expenses you paid during the period would be higher, and your ending account value lower, by this amount. In addition, the Fund, as a shareholder in the underlying Fidelity Central Funds, will indirectly bear its pro-rata share of the fees and expenses incurred by the underlying Fidelity Central Funds. These fees and expenses are not included in the Fund's annualized expense ratio used to calculate the expense estimate in the table below.
Hypothetical Example for Comparison Purposes
The second line of the accompanying table for each class of the Fund provides information about hypothetical account values and hypothetical expenses based on a Class' actual expense ratio and an assumed rate of return of 5% per year before expenses, which is not the Class' actual return. The hypothetical account values and expenses may not be used to estimate the actual ending account balance or expenses you paid for the period. You may use this information to compare the ongoing costs of investing in the Fund and other funds. To do so, compare this 5% hypothetical example with the 5% hypothetical examples that appear in the shareholder reports of the other funds. A small balance maintenance fee of $12.00 that is charged once a year may apply for certain accounts with a value of less than $2,000. This fee is not included in the table below. If it was, the estimate of expenses you paid during the period would be higher, and your ending account value lower, by this amount. In addition, the Fund, as a shareholder in the underlying Fidelity Central Funds, will indirectly bear its pro-rata share of the fees and expenses incurred by the underlying Fidelity Central Funds. These fees and expenses are not included in the Fund's annualized expense ratio used to calculate the expense estimate in the table below.
Please note that the expenses shown in the table are meant to highlight your ongoing costs only and do not reflect any transaction costs. Therefore, the second line of the table is useful in comparing ongoing costs only, and will not help you determine the relative total costs of owning different funds. In addition, if these transactional costs were included, your costs would have been higher.
| Annualized Expense Ratio-A | Beginning Account Value June 1, 2015 | Ending Account Value November 30, 2015 | Expenses Paid During Period-B June 1, 2015 to November 30, 2015 | |
| Class A | .94% | |||
| Actual | $1,000.00 | $951.50 | $4.60 | |
| Hypothetical-C | $1,000.00 | $1,020.36 | $4.76 | |
| Class T | 1.17% | |||
| Actual | $1,000.00 | $950.60 | $5.72 | |
| Hypothetical-C | $1,000.00 | $1,019.20 | $5.92 | |
| Class B | 1.78% | |||
| Actual | $1,000.00 | $947.20 | $8.69 | |
| Hypothetical-C | $1,000.00 | $1,016.14 | $9.00 | |
| Class C | 1.69% | |||
| Actual | $1,000.00 | $947.90 | $8.25 | |
| Hypothetical-C | $1,000.00 | $1,016.60 | $8.54 | |
| Fidelity Stock Selector Mid Cap Fund | .70% | |||
| Actual | $1,000.00 | $952.80 | $3.43 | |
| Hypothetical-C | $1,000.00 | $1,021.56 | $3.55 | |
| Class I | .80% | |||
| Actual | $1,000.00 | $952.10 | $3.91 | |
| Hypothetical-C | $1,000.00 | $1,021.06 | $4.05 |
A Annualized expense ratio reflects expenses net of applicable fee waivers.
B Expenses are equal to each Class' annualized expense ratio, multiplied by the average account value over the period, multiplied by 183/365 (to reflect the one-half year period).
C 5% return per year before expenses
Distributions (Unaudited)
The Board of Trustees of Fidelity Advisor Stock Selector Mid Cap Fund voted to pay to shareholders of record at the opening of business on record date, the following distributions per share derived from capital gains realized from sales of portfolio securities, and dividends derived from net investment income:
| Pay Date | Record Date | Dividends | Capital Gains | |
| Class I | 12/21/15 | 12/18/15 | $0.115 | $0.470 |
| 01/19/16 | 01/15/16 | $0.000 | $0.059 |
The fund hereby designates as a capital gain dividend with respect to the taxable year ended November 30, 2015 $41,177,168 or, if subsequently determined to be different, the net capital gain of such year.
A percentage of the dividends distributed during the fiscal year qualify for the dividends-received deduction for corporate shareholders:
| December 19, 2014 | December 29, 2014 | |
| Class I | 96% | 90% |
Class I designate 100% of the dividends distributed during the fiscal year as amounts which may be taken into account as a dividend for purposes of the maximum rate under section 1(h) (11) of the Internal Revenue Code.
The fund will notify shareholders in January 2016 of amounts for use in preparing 2015 income tax returns.
Board Approval of Investment Advisory Contracts and Management Fees
Fidelity Advisor Stock Selector Mid Cap Fund
Each year, the Board of Trustees, including the Independent Trustees (together, the Board), votes on the renewal of the management contract with Fidelity Management & Research Company (FMR) and the sub-advisory agreements (together, the Advisory Contracts) for the fund. The Board, assisted by the advice of fund counsel and Independent Trustees' counsel, requests and considers a broad range of information relevant to the renewal of the Advisory Contracts throughout the year.
The Board meets regularly and, at each of its meetings, covers an extensive agenda of topics and materials and considers factors that are relevant to its annual consideration of the renewal of the fund's Advisory Contracts, including the services and support provided to the fund and its shareholders. The Board has established various standing committees (Committees), each composed of and chaired by Independent Trustees with varying backgrounds, to which the Board has assigned specific subject matter responsibilities in order to enhance effective decision-making by the Board. The Board, acting directly and through its Committees, requests and receives information concerning the annual consideration of the renewal of the fund's Advisory Contracts. The Board also meets as needed to consider matters specifically related to the Board's annual consideration of the renewal of the Advisory Contracts. Members of the Board may also meet with trustees of other Fidelity funds through ad hoc joint committees to discuss certain matters relevant to all of the Fidelity funds.
At its July 2015 meeting, the Board unanimously determined to renew the fund's Advisory Contracts. In reaching its determination, the Board considered all factors it believed relevant, including (i) the nature, extent, and quality of the services to be provided to the fund and its shareholders (including the investment performance of the fund); (ii) the competitiveness of the fund's management fee and total expense ratio relative to peer funds; (iii) the total costs of the services to be provided by and the profits to be realized by Fidelity from its relationship with the fund; and (iv) the extent to which (if any) economies of scale exist and would be realized as the fund grows, and whether any economies of scale are appropriately shared with fund shareholders.
In considering whether to renew the Advisory Contracts for the fund, the Board reached a determination, with the assistance of fund counsel and Independent Trustees' counsel and through the exercise of its business judgment, that the renewal of the Advisory Contracts was in the best interests of the fund and its shareholders and that the compensation payable under the Advisory Contracts was fair and reasonable. The Board's decision to renew the Advisory Contracts was not based on any single factor, but rather was based on a comprehensive consideration of all the information provided to the Board at its meetings throughout the year. The Board, in reaching its determination to renew the Advisory Contracts, was aware that shareholders of the fund have a broad range of investment choices available to them, including a wide choice among funds offered by Fidelity's competitors, and that the fund's shareholders, who have the opportunity to review and weigh the disclosure provided by the fund in its prospectus and other public disclosures, have chosen to invest in this fund, which is part of the Fidelity family of funds.
Nature, Extent, and Quality of Services Provided. The Board considered Fidelity's staffing as it relates to the fund, including the backgrounds of investment personnel of Fidelity, and also considered the fund's investment objective, strategies, and related investment philosophy. The Independent Trustees also had discussions with senior management of Fidelity's investment operations and investment groups. The Board considered the structure of the portfolio manager compensation program and whether this structure provides appropriate incentives to act in the best interests of the fund. Additionally, the Board considered the portfolio managers' investments, if any, in the funds that they manage.Resources Dedicated to Investment Management and Support Services. The Board and the Fund Oversight and Research Committees reviewed the general qualifications and capabilities of Fidelity's investment staff, including its size, education, experience, and resources, as well as Fidelity's approach to recruiting, training, managing, and compensating investment personnel. The Board noted that Fidelity has continued to increase the resources devoted to non-U.S. offices, including expansion of Fidelity's global investment organization. The Board also noted that Fidelity's analysts have extensive resources, tools and capabilities that allow them to conduct sophisticated quantitative and fundamental analysis, as well as credit analysis of issuers, counterparties and guarantors. Further, the Board considered that Fidelity's investment professionals have sufficient access to global information and data so as to provide competitive investment results over time, and that those professionals also have access to sophisticated tools that permit them to assess portfolio construction and risk and performance attribution characteristics continuously, as well as to transmit new information and research conclusions rapidly around the world. Additionally, in its deliberations, the Board considered Fidelity's trading, risk management, and compliance capabilities and resources, which are integral parts of the investment management process.Shareholder and Administrative Services. The Board considered (i) the nature, extent, quality, and cost of advisory, administrative, and shareholder services performed by FMR, the sub-advisers (together with FMR, the Investment Advisers), and their affiliates under the Advisory Contracts and under separate agreements covering transfer agency, pricing and bookkeeping, and securities lending services for the fund; (ii) the nature and extent of the supervision of third party service providers, principally custodians and subcustodians; and (iii) the resources devoted to, and the record of compliance with, the fund's compliance policies and procedures. The Board also reviewed the allocation of fund brokerage, including allocations to brokers affiliated with the Investment Advisers, the use of brokerage commissions to pay fund expenses, and the use of "soft" commission dollars to pay for research services.The Board noted that the growth of fund assets over time across the complex allows Fidelity to reinvest in the development of services designed to enhance the value or convenience of the Fidelity funds as investment vehicles. These services include 24-hour access to account information and market information through telephone representatives and over the Internet, investor education materials and asset allocation tools, and the expanded availability of Fidelity Investor Centers.In 2014, the Board formed an ad hoc Committee on Transfer Agency Fees to review the variety of transfer agency fee structures throughout the industry and Fidelity's competitive positioning with respect to industry participants.Investment in a Large Fund Family. The Board considered the benefits to shareholders of investing in a Fidelity fund, including the benefits of investing in a fund that is part of a large family of funds offering a variety of investment disciplines and providing a large variety of mutual fund investor services. The Board noted that Fidelity had taken, or had made recommendations that resulted in the Fidelity funds taking, a number of actions over the previous year that benefited particular funds, including (i) continuing to dedicate additional resources to investment research and to the support of the senior management team that oversees asset management; (ii) continuing efforts to enhance Fidelity's global research capabilities; (iii) launching new funds and making other enhancements to meet client needs; (iv) reducing management fees and total expenses for certain index funds and diversified international funds; (v) continuing to launch dedicated lower cost underlying funds to meet portfolio construction needs related to expanding underlying fund options for Fidelity funds of funds, specifically for the Freedom Fund product lines; (vi) rationalizing product lines and gaining increased efficiencies through fund mergers; (vii) launching active fixed-income exchange-traded funds; (viii) continuing to develop, acquire and implement systems and technology to improve services to the funds and information security and to increase efficiency; (ix) implementing investment enhancements to further strengthen Fidelity's target date product line to increase investors' probability of success in achieving their goals; (x) modifying the eligibility criteria for certain share classes to accommodate roll-over assets from employer-sponsored retirement plans; (xi) launching a new Class W of the Freedom Index Funds to attract and retain Fidelity record-kept retirement plan assets; and (xii) implementing changes to Fidelity's money market product line in response to recent money market regulatory reforms.Investment Performance. The Board considered whether the fund has operated in accordance with its investment objective, as well as its record of compliance with its investment restrictions and its performance history. The Board noted that there was a portfolio management change for the fund in October 2012.The Board took into account discussions with representatives of the Investment Advisers about fund investment performance that occur at Board meetings throughout the year. In this regard the Board noted that as part of regularly scheduled fund reviews and other reports to the Board on fund performance, the Board considers annualized return information for the fund, for different time periods, measured against a securities market index ("benchmark index") and a peer group of funds with similar objectives ("peer group"), if any. In its evaluation of fund investment performance, the Board gave particular attention to information indicating changes in performance of certain Fidelity funds for specific time periods and discussed with the Investment Advisers the reasons for any overperformance or underperformance.In addition to reviewing absolute and relative fund performance, the Independent Trustees periodically consider the appropriateness of fund performance metrics in evaluating the results achieved. In general, the Independent Trustees believe that fund performance should be evaluated based on net performance (after fees and expenses) of both the highest performing and lowest performing fund share classes, where applicable, compared to appropriate benchmark indices, over appropriate time periods that may include full market cycles, and compared to peer groups, as applicable, over the same periods, taking into account relevant factors including the following: general market conditions; issuer-specific information; and fund cash flows and other factors.The Independent Trustees recognize that shareholders evaluate performance on a net basis over their own holding periods, for which one-, three-, and five-year periods are often used as a proxy. For this reason, the performance information reviewed by the Board also included net cumulative calendar year total return information for the fund and an appropriate benchmark index and peer group for the most recent one-, three-, and five-year periods, as shown below. Returns are shown compared to the 25th percentile (top of box, 75% beaten) and 75th percentile (bottom of box, 25% beaten) of the peer universe.Fidelity Advisor Stock Selector Mid Cap Fund
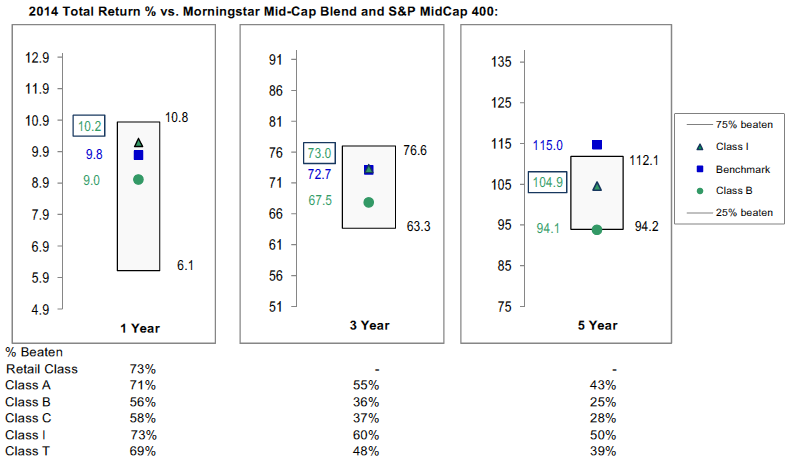
Fidelity Advisor Stock Selector Mid Cap Fund
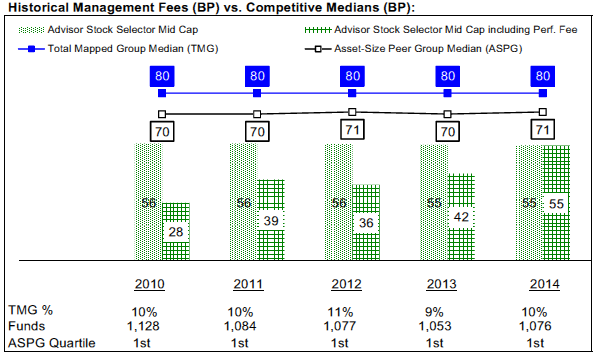
![]()
MCI-ANN-0116
1.539187.118
Fidelity Advisor® Dividend Growth Fund Class A, Class T, Class B and Class C Annual Report November 30, 2015 |
|
Contents
Board Approval of Investment Advisory Contracts and Management Fees |
To view a fund's proxy voting guidelines and proxy voting record for the 12-month period ended June 30, visit http://www.fidelity.com/proxyvotingresults or visit the Securities and Exchange Commission's (SEC) web site at http://www.sec.gov.
You may also call 1-877-208-0098 to request a free copy of the proxy voting guidelines.
Standard & Poor's, S&P and S&P 500 are registered service marks of The McGraw-Hill Companies, Inc. and have been licensed for use by Fidelity Distributors Corporation.
Other third-party marks appearing herein are the property of their respective owners.
All other marks appearing herein are registered or unregistered trademarks or service marks of FMR LLC or an affiliated company. © 2016 FMR LLC. All rights reserved.
This report and the financial statements contained herein are submitted for the general information of the shareholders of the Fund. This report is not authorized for distribution to prospective investors in the Fund unless preceded or accompanied by an effective prospectus.
A fund files its complete schedule of portfolio holdings with the SEC for the first and third quarters of each fiscal year on Form N-Q. Forms N-Q are available on the SEC’s web site at http://www.sec.gov. A fund's Forms N-Q may be reviewed and copied at the SEC’s Public Reference Room in Washington, DC. Information regarding the operation of the SEC's Public Reference Room may be obtained by calling 1-800-SEC-0330.
For a complete list of a fund's portfolio holdings, view the most recent holdings listing, semiannual report, or annual report on Fidelity's web site at http://www.fidelity.com, http://www.advisor.fidelity.com, or http://www.401k.com, as applicable.
NOT FDIC INSURED •MAY LOSE VALUE •NO BANK GUARANTEE
Neither the Fund nor Fidelity Distributors Corporation is a bank.
Performance: The Bottom Line
Average annual total return reflects the change in the value of an investment, assuming reinvestment of distributions from dividend income and capital gains (the profits earned upon the sale of securities that have grown in value, if any) and assuming a constant rate of performance each year.
The hypothetical investment and the average annual total returns do not reflect the deduction of taxes that a shareholder would pay on fund distributions or the redemption of fund shares.
During periods of reimbursement by Fidelity, a fund’s total return will be greater than it would be had the reimbursement not occurred.
How a fund did yesterday is no guarantee of how it will do tomorrow.
Returns reflect the conversion of Class B shares to Class A shares after a maximum of seven years.
Average Annual Total Returns
| For the periods ended November 30, 2015 | Past 1 year | Past 5 years | Past 10 years |
| Class A (incl. 5.75% sales charge) | (6.14)% | 10.16% | 6.01% |
| Class T (incl. 3.50% sales charge) | (4.14)% | 10.42% | 6.02% |
| Class B (incl. contingent deferred sales charge) | (5.61)% | 10.32% | 6.06% |
| Class C (incl. contingent deferred sales charge) | (2.04)% | 10.66% | 5.85% |
Class B shares' contingent deferred sales charges included in the past one year, past five years and past ten years total return figures are 5%, 2% and 0%, respectively.
Class C shares' contingent deferred sales charges included in the past one year, past five years and past ten years total return figures are 1%, 0% and 0%, respectively.
$10,000 Over 10 Years
Let's say hypothetically that $10,000 was invested in Fidelity Advisor® Dividend Growth Fund - Class A on November 30, 2005, and the current 5.75% sales charge was paid.
The chart shows how the value of your investment would have changed, and also shows how the S&P 500® Index performed over the same period.
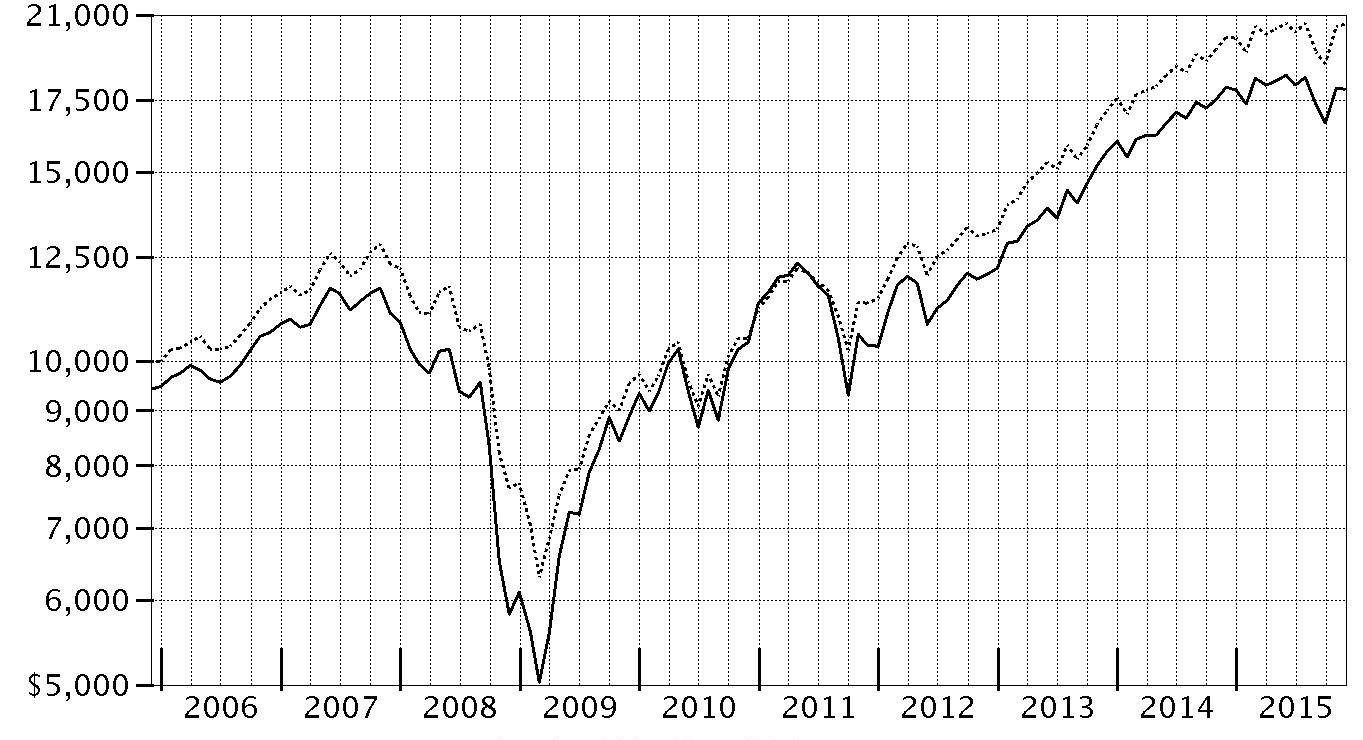
| Period Ending Values | ||
| $17,921 | Fidelity Advisor® Dividend Growth Fund - Class A | |
| $20,574 | S&P 500® Index | |
Management's Discussion of Fund Performance
Market Recap: U.S. stocks gained modestly for the 12 months ending November 30, 2015, despite a steep decline in August and September on concern about slowing economic growth in China. The S&P 500® index rebounded in October and gained 2.75% for the year. Stocks benefited late in the period amid waning expectations for a near-term interest-rate hike by the U.S. Federal Reserve, more economic stimulus in Europe and an interest-rate cut in China. Growth stocks in the benchmark far outpaced their value counterparts, as investors continued to seek growth in a subpar economic environment. Sector performance varied widely, with more than 26 percentage points separating the leader from the laggard. Consumer discretionary (+14%) secured the top spot, benefiting from a combination of rising personal income and still-benign inflation. Information technology (+7%) and health care (+4%) also outpaced the broad market. Conversely, the energy sector (-12%) performed worst, stymied by depressed commodity prices that also hit materials (-5%). Telecommunication services (-5%) and utilities (-4%), considered defensive sectors less sensitive to the economy, also lost ground. At period end, investors remained focused on the potential global implications of a stronger U.S. dollar and how China’s transition toward a consumption-led economy may affect corporate earnings.Comments from Portfolio Manager Ramona Persaud: For the year, the fund’s share classes (excluding sales charges, if applicable) declined modestly, lagging the benchmark S&P 500® index. The market's preference for growth-oriented names the past year made it a challenging environment for our value- and quality-focused stock-picking approach. Among sectors, positioning in consumer discretionary was by far the biggest relative detractor, followed by stock picking in information technology and health care. Looking at individual stocks, I avoided index component and e-commerce giant Amazon.com because it did not fit my investment philosophy. Unfortunately for the fund, the stock outperformed the past year, which dragged on the fund's relative result. Of note, the fund’s foreign holdings hurt against a rising dollar. Included was a non-index stake in Canada-based Potash Corp of Saskatchewan, which hurt as the stock tumbled amid lower demand and declining potash prices. Turning to positives, successful positioning in industrials contributed meaningfully to performance. The fund’s stake in videogame publisher Activision Blizzard contributed.The views expressed above reflect those of the portfolio manager(s) only through the end of the period as stated on the cover of this report and do not necessarily represent the views of Fidelity or any other person in the Fidelity organization. Any such views are subject to change at any time based upon market or other conditions and Fidelity disclaims any responsibility to update such views. These views may not be relied on as investment advice and, because investment decisions for a Fidelity fund are based on numerous factors, may not be relied on as an indication of trading intent on behalf of any Fidelity fund.
Investment Summary (Unaudited)
Top Ten Stocks as of November 30, 2015
| % of fund's net assets | % of fund's net assets 6 months ago | |
| Apple, Inc. | 4.8 | 4.6 |
| Microsoft Corp. | 3.1 | 2.4 |
| Johnson & Johnson | 3.0 | 2.5 |
| General Electric Co. | 3.0 | 2.1 |
| JPMorgan Chase & Co. | 2.8 | 2.6 |
| Wells Fargo & Co. | 2.5 | 2.3 |
| Exxon Mobil Corp. | 2.4 | 2.2 |
| Alphabet, Inc. Class C | 2.2 | 2.2 |
| Chevron Corp. | 2.1 | 2.2 |
| Bank of America Corp. | 1.8 | 1.7 |
| 27.7 |
Top Five Market Sectors as of November 30, 2015
| % of fund's net assets | % of fund's net assets 6 months ago | |
| Information Technology | 24.1 | 21.8 |
| Financials | 16.4 | 16.0 |
| Consumer Staples | 13.2 | 10.5 |
| Health Care | 12.9 | 16.4 |
| Industrials | 9.8 | 8.6 |
Asset Allocation (% of fund's net assets)
| As of November 30, 2015* | ||
| Stocks | 95.3% | |
| Convertible Securities | 0.1% | |
| Short-Term Investments and Net Other Assets (Liabilities) | 4.6% | |

* Foreign investments - 14.2%
| As of May 31, 2015* | ||
| Stocks | 97.8% | |
| Convertible Securities | 0.1% | |
| Short-Term Investments and Net Other Assets (Liabilities) | 2.1% | |

* Foreign investments - 16.3%
Investments November 30, 2015
Showing Percentage of Net Assets
| Common Stocks - 95.3% | |||
| Shares | Value (000s) | ||
| CONSUMER DISCRETIONARY - 7.8% | |||
| Diversified Consumer Services - 0.3% | |||
| H&R Block, Inc. | 95,806 | $3,515 | |
| Hotels, Restaurants & Leisure - 1.2% | |||
| Las Vegas Sands Corp. | 80,400 | 3,542 | |
| Wyndham Worldwide Corp. | 116,852 | 8,871 | |
| 12,413 | |||
| Leisure Products - 0.1% | |||
| Vista Outdoor, Inc. (a) | 33,900 | 1,493 | |
| Media - 1.7% | |||
| Altice NV Class A (a) | 195,300 | 3,000 | |
| Comcast Corp. Class A | 242,425 | 14,754 | |
| 17,754 | |||
| Multiline Retail - 2.1% | |||
| Dillard's, Inc. Class A | 91,400 | 6,855 | |
| Target Corp. | 199,100 | 14,435 | |
| 21,290 | |||
| Specialty Retail - 1.9% | |||
| AutoZone, Inc. (a) | 10,400 | 8,151 | |
| Foot Locker, Inc. | 156,391 | 10,165 | |
| Kingfisher PLC | 4,010 | 21 | |
| Staples, Inc. | 115,300 | 1,392 | |
| 19,729 | |||
| Textiles, Apparel & Luxury Goods - 0.5% | |||
| VF Corp. | 73,600 | 4,762 | |
| TOTAL CONSUMER DISCRETIONARY | 80,956 | ||
| CONSUMER STAPLES - 13.2% | |||
| Beverages - 4.7% | |||
| Constellation Brands, Inc. Class A (sub. vtg.) | 56,400 | 7,911 | |
| Dr. Pepper Snapple Group, Inc. | 87,311 | 7,836 | |
| PepsiCo, Inc. | 170,500 | 17,077 | |
| The Coca-Cola Co. | 373,410 | 15,915 | |
| 48,739 | |||
| Food & Staples Retailing - 3.6% | |||
| CVS Health Corp. | 183,391 | 17,255 | |
| Kroger Co. | 118,720 | 4,471 | |
| Rami Levi Chain Stores Hashikma Marketing 2006 Ltd. | 68,693 | 3,185 | |
| Walgreens Boots Alliance, Inc. | 148,523 | 12,480 | |
| 37,391 | |||
| Food Products - 0.6% | |||
| Greencore Group PLC | 812,005 | 4,130 | |
| Hilton Food Group PLC | 242,144 | 1,893 | |
| 6,023 | |||
| Household Products - 1.8% | |||
| Procter & Gamble Co. | 247,700 | 18,538 | |
| Personal Products - 0.2% | |||
| Edgewell Personal Care Co. (a) | 23,300 | 1,876 | |
| Tobacco - 2.3% | |||
| British American Tobacco PLC (United Kingdom) | 132,257 | 7,697 | |
| Imperial Tobacco Group PLC | 124,702 | 6,739 | |
| Reynolds American, Inc. | 213,700 | 9,884 | |
| 24,320 | |||
| TOTAL CONSUMER STAPLES | 136,887 | ||
| ENERGY - 6.3% | |||
| Oil, Gas & Consumable Fuels - 6.3% | |||
| Chevron Corp. | 234,990 | 21,459 | |
| Emerald Oil, Inc. warrants 2/4/16 (a) | 826 | 0 | |
| Exxon Mobil Corp. | 311,022 | 25,398 | |
| Imperial Oil Ltd. | 222,634 | 7,232 | |
| Kinder Morgan, Inc. | 26,538 | 626 | |
| Northern Oil & Gas, Inc. (a) | 128,694 | 660 | |
| PrairieSky Royalty Ltd. (b) | 121,700 | 2,337 | |
| Suncor Energy, Inc. | 253,380 | 7,001 | |
| 64,713 | |||
| FINANCIALS - 16.4% | |||
| Banks - 11.7% | |||
| Bank of America Corp. | 1,102,803 | 19,222 | |
| Citigroup, Inc. | 303,223 | 16,401 | |
| JPMorgan Chase & Co. | 437,993 | 29,205 | |
| PacWest Bancorp | 159,000 | 7,476 | |
| SunTrust Banks, Inc. | 181,900 | 7,898 | |
| U.S. Bancorp | 346,817 | 15,222 | |
| Wells Fargo & Co. | 467,790 | 25,775 | |
| 121,199 | |||
| Capital Markets - 0.9% | |||
| Diamond Hill Investment Group, Inc. | 7,501 | 1,652 | |
| Franklin Resources, Inc. | 84,400 | 3,538 | |
| The Blackstone Group LP | 116,290 | 3,632 | |
| 8,822 | |||
| Consumer Finance - 0.6% | |||
| American Express Co. | 82,200 | 5,889 | |
| Imperial Holdings, Inc. warrants 4/11/19 (a) | 4,481 | 1 | |
| 5,890 | |||
| Diversified Financial Services - 1.3% | |||
| McGraw Hill Financial, Inc. | 124,267 | 11,988 | |
| MSCI, Inc. Class A | 20,900 | 1,466 | |
| 13,454 | |||
| Insurance - 1.3% | |||
| ACE Ltd. | 76,000 | 8,729 | |
| MetLife, Inc. | 93,300 | 4,767 | |
| 13,496 | |||
| Real Estate Investment Trusts - 0.6% | |||
| American Tower Corp. | 66,000 | 6,559 | |
| TOTAL FINANCIALS | 169,420 | ||
| HEALTH CARE - 12.9% | |||
| Biotechnology - 2.2% | |||
| AbbVie, Inc. | 203,200 | 11,816 | |
| Amgen, Inc. | 69,737 | 11,235 | |
| 23,051 | |||
| Health Care Equipment & Supplies - 2.4% | |||
| Medtronic PLC | 254,102 | 19,144 | |
| The Cooper Companies, Inc. | 37,590 | 5,498 | |
| 24,642 | |||
| Health Care Providers & Services - 1.0% | |||
| McKesson Corp. | 51,232 | 9,701 | |
| Health Care Technology - 0.2% | |||
| CompuGroup Medical AG | 68,579 | 2,399 | |
| Pharmaceuticals - 7.1% | |||
| Allergan PLC (a) | 27,800 | 8,726 | |
| Astellas Pharma, Inc. | 355,300 | 5,001 | |
| Johnson & Johnson | 307,302 | 31,111 | |
| Sanofi SA sponsored ADR | 163,300 | 7,221 | |
| Shire PLC | 72,800 | 5,068 | |
| Teva Pharmaceutical Industries Ltd. sponsored ADR | 256,400 | 16,135 | |
| 73,262 | |||
| TOTAL HEALTH CARE | 133,055 | ||
| INDUSTRIALS - 9.8% | |||
| Aerospace & Defense - 2.7% | |||
| BWX Technologies, Inc. | 322,100 | 9,808 | |
| General Dynamics Corp. | 28,800 | 4,218 | |
| The Boeing Co. | 98,403 | 14,313 | |
| 28,339 | |||
| Air Freight & Logistics - 0.3% | |||
| C.H. Robinson Worldwide, Inc. | 45,700 | 3,082 | |
| Commercial Services & Supplies - 0.1% | |||
| Deluxe Corp. | 23,100 | 1,355 | |
| Construction & Engineering - 0.1% | |||
| Astaldi SpA (b) | 143,400 | 861 | |
| Electrical Equipment - 0.5% | |||
| AMETEK, Inc. | 62,072 | 3,505 | |
| EnerSys | 23,100 | 1,361 | |
| 4,866 | |||
| Industrial Conglomerates - 5.9% | |||
| Danaher Corp. | 166,394 | 16,039 | |
| General Electric Co. | 1,036,700 | 31,039 | |
| Roper Industries, Inc. | 70,196 | 13,582 | |
| 60,660 | |||
| Professional Services - 0.2% | |||
| CEB, Inc. | 28,900 | 2,233 | |
| Trading Companies & Distributors - 0.0% | |||
| Now, Inc. (a)(b) | 17,720 | 326 | |
| TOTAL INDUSTRIALS | 101,722 | ||
| INFORMATION TECHNOLOGY - 24.1% | |||
| Communications Equipment - 3.2% | |||
| Cisco Systems, Inc. | 657,379 | 17,914 | |
| QUALCOMM, Inc. | 314,378 | 15,339 | |
| 33,253 | |||
| Electronic Equipment & Components - 0.6% | |||
| TE Connectivity Ltd. | 85,313 | 5,724 | |
| Internet Software & Services - 2.2% | |||
| Alphabet, Inc. Class C | 31,263 | 23,216 | |
| IT Services - 4.5% | |||
| Accenture PLC Class A | 83,100 | 8,910 | |
| ASAC II LP (a)(c) | 298,480 | 7,721 | |
| Fidelity National Information Services, Inc. | 132,798 | 8,455 | |
| IBM Corp. | 77,400 | 10,791 | |
| Leidos Holdings, Inc. | 54,200 | 3,140 | |
| Total System Services, Inc. | 137,200 | 7,678 | |
| 46,695 | |||
| Semiconductors & Semiconductor Equipment - 0.4% | |||
| Broadcom Corp. Class A | 81,500 | 4,452 | |
| Software - 5.7% | |||
| Activision Blizzard, Inc. | 207,867 | 7,828 | |
| Micro Focus International PLC | 246,900 | 4,771 | |
| Microsoft Corp. | 593,063 | 32,233 | |
| Oracle Corp. | 359,828 | 14,022 | |
| 58,854 | |||
| Technology Hardware, Storage & Peripherals - 7.5% | |||
| Apple, Inc. | 419,024 | 49,570 | |
| EMC Corp. | 517,100 | 13,103 | |
| Hewlett Packard Enterprise Co. | 421,100 | 6,258 | |
| HP, Inc. | 421,100 | 5,281 | |
| Western Digital Corp. | 47,800 | 2,983 | |
| 77,195 | |||
| TOTAL INFORMATION TECHNOLOGY | 249,389 | ||
| MATERIALS - 3.2% | |||
| Chemicals - 2.9% | |||
| CF Industries Holdings, Inc. | 131,100 | 6,049 | |
| E.I. du Pont de Nemours & Co. | 151,800 | 10,222 | |
| LyondellBasell Industries NV Class A | 104,200 | 9,984 | |
| PPG Industries, Inc. | 31,400 | 3,320 | |
| 29,575 | |||
| Containers & Packaging - 0.3% | |||
| Ball Corp. | 46,662 | 3,239 | |
| TOTAL MATERIALS | 32,814 | ||
| TELECOMMUNICATION SERVICES - 1.6% | |||
| Diversified Telecommunication Services - 1.6% | |||
| AT&T, Inc. | 499,700 | 16,825 | |
| TOTAL COMMON STOCKS | |||
| (Cost $848,886) | 985,781 | ||
| Principal Amount (000s) | Value (000s) | ||
| Convertible Bonds - 0.1% | |||
| ENERGY - 0.1% | |||
| Oil, Gas & Consumable Fuels - 0.1% | |||
| Amyris, Inc. 3% 2/27/17 (Cost $791) | 791 | 719 | |
| Shares | Value (000s) | ||
| Money Market Funds - 5.0% | |||
| Fidelity Cash Central Fund, 0.18% (d) | 48,550,476 | 48,550 | |
| Fidelity Securities Lending Cash Central Fund, 0.22% (d)(e) | 3,563,031 | 3,563 | |
| TOTAL MONEY MARKET FUNDS | |||
| (Cost $52,113) | 52,113 | ||
| TOTAL INVESTMENT PORTFOLIO - 100.4% | |||
| (Cost $901,790) | 1,038,613 | ||
| NET OTHER ASSETS (LIABILITIES) - (0.4)% | (4,266) | ||
| NET ASSETS - 100% | $1,034,347 |
Values shown as $0 may reflect amounts less than $500.
Legend
(a) Non-income producing
(b) Security or a portion of the security is on loan at period end.
(c) Restricted securities - Investment in securities not registered under the Securities Act of 1933 (excluding 144A issues). At the end of the period, the value of restricted securities (excluding 144A issues) amounted to $7,721,000 or 0.7% of net assets.
(d) Affiliated fund that is generally available only to investment companies and other accounts managed by Fidelity Investments. The rate quoted is the annualized seven-day yield of the fund at period end. A complete unaudited listing of the fund's holdings as of its most recent quarter end is available upon request. In addition, each Fidelity Central Fund's financial statements, which are not covered by the Fund's Report of Independent Registered Public Accounting Firm, are available on the SEC's website or upon request.
(e) Investment made with cash collateral received from securities on loan.
Additional information on each restricted holding is as follows:
| Security | Acquisition Date | Acquisition Cost (000s) |
| ASAC II LP | 10/10/13 | $2,985 |
Affiliated Central Funds
Information regarding fiscal year to date income earned by the Fund from investments in Fidelity Central Funds is as follows:
| Fund | Income earned |
| (Amounts in thousands) | |
| Fidelity Cash Central Fund | $53 |
| Fidelity Securities Lending Cash Central Fund | 89 |
| Total | $142 |
Investment Valuation
The following is a summary of the inputs used, as of November 30, 2015, involving the Fund's assets and liabilities carried at fair value. The inputs or methodology used for valuing securities may not be an indication of the risk associated with investing in those securities. For more information on valuation inputs, and their aggregation into the levels used below, please refer to the Investment Valuation section in the accompanying Notes to Financial Statements.
| Valuation Inputs at Reporting Date: | ||||
| Description | Total | Level 1 | Level 2 | Level 3 |
| (Amounts in thousands) | ||||
| Investments in Securities: | ||||
| Equities: | ||||
| Consumer Discretionary | $80,956 | $80,935 | $21 | $-- |
| Consumer Staples | 136,887 | 129,190 | 7,697 | -- |
| Energy | 64,713 | 64,713 | -- | -- |
| Financials | 169,420 | 169,419 | 1 | -- |
| Health Care | 133,055 | 122,986 | 10,069 | -- |
| Industrials | 101,722 | 101,722 | -- | -- |
| Information Technology | 249,389 | 241,668 | -- | 7,721 |
| Materials | 32,814 | 32,814 | -- | -- |
| Telecommunication Services | 16,825 | 16,825 | -- | -- |
| Corporate Bonds | 719 | -- | 719 | -- |
| Money Market Funds | 52,113 | 52,113 | -- | -- |
| Total Investments in Securities: | $1,038,613 | $1,012,385 | $18,507 | $7,721 |
Other Information
Distribution of investments by country or territory of incorporation, as a percentage of Total Net Assets, is as follows (Unaudited):
| United States of America | 85.8% |
| Ireland | 4.0% |
| United Kingdom | 2.0% |
| Israel | 1.9% |
| Canada | 1.6% |
| Switzerland | 1.4% |
| Netherlands | 1.3% |
| Others (Individually Less Than 1%) | 2.0% |
| 100.0% |
See accompanying notes which are an integral part of the financial statements.
Financial Statements
Statement of Assets and Liabilities
| Amounts in thousands (except per-share amounts) | November 30, 2015 | |
| Assets | ||
| Investment in securities, at value (including securities loaned of $3,399) — See accompanying schedule: Unaffiliated issuers (cost $849,677) | $986,500 | |
| Fidelity Central Funds (cost $52,113) | 52,113 | |
| Total Investments (cost $901,790) | $1,038,613 | |
| Receivable for investments sold | 6,167 | |
| Receivable for fund shares sold | 471 | |
| Dividends receivable | 2,418 | |
| Interest receivable | 6 | |
| Distributions receivable from Fidelity Central Funds | 8 | |
| Prepaid expenses | 3 | |
| Other receivables | 2 | |
| Total assets | 1,047,688 | |
| Liabilities | ||
| Payable for investments purchased | $7,269 | |
| Payable for fund shares redeemed | 1,513 | |
| Accrued management fee | 359 | |
| Distribution and service plan fees payable | 375 | |
| Other affiliated payables | 205 | |
| Other payables and accrued expenses | 57 | |
| Collateral on securities loaned, at value | 3,563 | |
| Total liabilities | 13,341 | |
| Net Assets | $1,034,347 | |
| Net Assets consist of: | ||
| Paid in capital | $839,284 | |
| Undistributed net investment income | 8,234 | |
| Accumulated undistributed net realized gain (loss) on investments and foreign currency transactions | 50,009 | |
| Net unrealized appreciation (depreciation) on investments and assets and liabilities in foreign currencies | 136,820 | |
| Net Assets | $1,034,347 | |
| Calculation of Maximum Offering Price | ||
| Class A: | ||
| Net Asset Value and redemption price per share ($356,355 ÷ 20,539.91 shares) | $17.35 | |
| Maximum offering price per share (100/94.25 of $17.35) | $18.41 | |
| Class T: | ||
| Net Asset Value and redemption price per share ($371,725 ÷ 21,548.72 shares) | $17.25 | |
| Maximum offering price per share (100/96.50 of $17.25) | $17.88 | |
| Class B: | ||
| Net Asset Value and offering price per share ($6,495 ÷ 391.35 shares)(a) | $16.60 | |
| Class C: | ||
| Net Asset Value and offering price per share ($166,529 ÷ 10,075.72 shares)(a) | $16.53 | |
| Class I: | ||
| Net Asset Value, offering price and redemption price per share ($124,601 ÷ 6,878.03 shares) | $18.12 | |
| Class Z: | ||
| Net Asset Value, offering price and redemption price per share ($8,642 ÷ 470.82 shares) | $18.36 |
(a) Redemption price per share is equal to net asset value less any applicable contingent deferred sales charge.
See accompanying notes which are an integral part of the financial statements.
Statement of Operations
| Amounts in thousands | Year ended November 30, 2015 | |
| Investment Income | ||
| Dividends | $22,786 | |
| Interest | 24 | |
| Income from Fidelity Central Funds | 142 | |
| Total income | 22,952 | |
| Expenses | ||
| Management fee | ||
| Basic fee | $5,919 | |
| Performance adjustment | (594) | |
| Transfer agent fees | 2,234 | |
| Distribution and service plan fees | 4,715 | |
| Accounting and security lending fees | 355 | |
| Custodian fees and expenses | 39 | |
| Independent trustees' compensation | 5 | |
| Registration fees | 97 | |
| Audit | 63 | |
| Legal | 6 | |
| Miscellaneous | 7 | |
| Total expenses before reductions | 12,846 | |
| Expense reductions | (50) | 12,796 |
| Net investment income (loss) | 10,156 | |
| Realized and Unrealized Gain (Loss) | ||
| Net realized gain (loss) on: | ||
| Investment securities: | ||
| Unaffiliated issuers | 57,682 | |
| Foreign currency transactions | (25) | |
| Total net realized gain (loss) | 57,657 | |
| Change in net unrealized appreciation (depreciation) on: Investment securities | (74,642) | |
| Assets and liabilities in foreign currencies | 9 | |
| Total change in net unrealized appreciation (depreciation) | (74,633) | |
| Net gain (loss) | (16,976) | |
| Net increase (decrease) in net assets resulting from operations | $(6,820) |
See accompanying notes which are an integral part of the financial statements.
Statement of Changes in Net Assets
| Amounts in thousands | Year ended November 30, 2015 | Year ended November 30, 2014 |
| Increase (Decrease) in Net Assets | ||
| Operations | ||
| Net investment income (loss) | $10,156 | $11,692 |
| Net realized gain (loss) | 57,657 | 133,433 |
| Change in net unrealized appreciation (depreciation) | (74,633) | (1,155) |
| Net increase (decrease) in net assets resulting from operations | (6,820) | 143,970 |
| Distributions to shareholders from net investment income | (9,131) | (4,242) |
| Distributions to shareholders from net realized gain | (113,106) | (420) |
| Total distributions | (122,237) | (4,662) |
| Share transactions - net increase (decrease) | 43,684 | (80,124) |
| Total increase (decrease) in net assets | (85,373) | 59,184 |
| Net Assets | ||
| Beginning of period | 1,119,720 | 1,060,536 |
| End of period (including undistributed net investment income of $8,234 and undistributed net investment income of $9,131, respectively) | $1,034,347 | $1,119,720 |
See accompanying notes which are an integral part of the financial statements.
Financial Highlights — Fidelity Advisor Dividend Growth Fund Class A
| Years ended November 30, | 2015 | 2014 | 2013 | 2012 | 2011 |
| Selected Per–Share Data | |||||
| Net asset value, beginning of period | $19.65 | $17.23 | $13.33 | $11.45 | $11.58 |
| Income from Investment Operations | |||||
| Net investment income (loss)A | .20 | .23B | .13 | .07 | .02 |
| Net realized and unrealized gain (loss) | (.34)C | 2.29 | 3.87 | 1.81 | (.09) |
| Total from investment operations | (.14) | 2.52 | 4.00 | 1.88 | (.07) |
| Distributions from net investment income | (.19) | (.09) | (.10) | – | – |
| Distributions from net realized gain | (1.96) | (.01) | – | – | (.06) |
| Total distributions | (2.16)D | (.10) | (.10) | – | (.06) |
| Net asset value, end of period | $17.35 | $19.65 | $17.23 | $13.33 | $11.45 |
| Total ReturnE,F | (.41)%C | 14.70% | 30.26% | 16.42% | (.63)% |
| Ratios to Average Net AssetsG,H | |||||
| Expenses before reductions | 1.01% | .94% | .98% | 1.21% | 1.36% |
| Expenses net of fee waivers, if any | 1.00% | .94% | .98% | 1.21% | 1.33% |
| Expenses net of all reductions | 1.00% | .94% | .97% | 1.20% | 1.33% |
| Net investment income (loss) | 1.13% | 1.29%B | .87% | .53% | .16% |
| Supplemental Data | |||||
| Net assets, end of period (in millions) | $356 | $386 | $369 | $301 | $295 |
| Portfolio turnover rateI | 56% | 106% | 70% | 64% | 68% |
A Calculated based on average shares outstanding during the period.
B Investment income per share reflects a large, non-recurring dividend which amounted to $.04 per share. Excluding this non-recurring dividend, the ratio of net investment income (loss) to average net assets would have been 1.07%.
C Net realized and unrealized gain (loss) per share reflects proceeds received from litigation which amounted to $.02 per share. Excluding these litigation proceeds, the total return would have been (.51)%.
D Total distributions of $2.16 per share is comprised of distributions from net investment income of $.193 and distributions from net realized gain of $1.962 per share.
E Total returns would have been lower if certain expenses had not been reduced during the applicable periods shown.
F Total returns do not include the effect of the sales charges.
G Fees and expenses of any underlying Fidelity Central Funds are not included in the Fund's expense ratio. The Fund indirectly bears its proportionate share of the expenses of any underlying Fidelity Central Funds.
H Expense ratios reflect operating expenses of the class. Expenses before reductions do not reflect amounts reimbursed by the investment adviser or reductions from brokerage service arrangements or reductions from other expense offset arrangements and do not represent the amount paid by the class during periods when reimbursements or reductions occur. Expenses net of fee waivers reflect expenses after reimbursement by the investment adviser but prior to reductions from brokerage service arrangements or other expense offset arrangements. Expenses net of all reductions represent the net expenses paid by the class.
I Amount does not include the portfolio activity of any underlying Fidelity Central Funds.
See accompanying notes which are an integral part of the financial statements.
Financial Highlights — Fidelity Advisor Dividend Growth Fund Class T
| Years ended November 30, | 2015 | 2014 | 2013 | 2012 | 2011 |
| Selected Per–Share Data | |||||
| Net asset value, beginning of period | $19.55 | $17.15 | $13.26 | $11.42 | $11.55 |
| Income from Investment Operations | |||||
| Net investment income (loss)A | .15 | .19B | .10 | .04 | (.01) |
| Net realized and unrealized gain (loss) | (.34)C | 2.27 | 3.86 | 1.80 | (.09) |
| Total from investment operations | (.19) | 2.46 | 3.96 | 1.84 | (.10) |
| Distributions from net investment income | (.15) | (.06) | (.07) | – | – |
| Distributions from net realized gain | (1.96) | (.01) | – | – | (.03) |
| Total distributions | (2.11) | (.06)D | (.07) | – | (.03) |
| Net asset value, end of period | $17.25 | $19.55 | $17.15 | $13.26 | $11.42 |
| Total ReturnE,F | (.67)%C | 14.41% | 30.05% | 16.11% | (.90)% |
| Ratios to Average Net AssetsG,H | |||||
| Expenses before reductions | 1.24% | 1.18% | 1.20% | 1.42% | 1.57% |
| Expenses net of fee waivers, if any | 1.24% | 1.18% | 1.20% | 1.42% | 1.55% |
| Expenses net of all reductions | 1.24% | 1.17% | 1.19% | 1.42% | 1.54% |
| Net investment income (loss) | .89% | 1.05%B | .65% | .32% | (.06)% |
| Supplemental Data | |||||
| Net assets, end of period (in millions) | $372 | $412 | $375 | $304 | $294 |
| Portfolio turnover rateI | 56% | 106% | 70% | 64% | 68% |
A Calculated based on average shares outstanding during the period.
B Investment income per share reflects a large non-recurring dividend which amounted to $.04 per share. Excluding this non-recurring dividend, the ratio of net investment income (loss) to average net assets would have been .83%.
C Net realized and unrealized gain (loss) per share reflects proceeds received from litigation which amounted to $.02 per share. Excluding these litigation proceeds, the total return would have been (.77)%.
D Total distributions of $.06 per share is comprised of distributions from net investment income of $.055 and distributions from net realized gain of $.007 per share.
E Total returns would have been lower if certain expenses had not been reduced during the applicable periods shown.
F Total returns do not include the effect of the sales charges.
G Fees and expenses of any underlying Fidelity Central Funds are not included in the Fund's expense ratio. The Fund indirectly bears its proportionate share of the expenses of any underlying Fidelity Central Funds.
H Expense ratios reflect operating expenses of the class. Expenses before reductions do not reflect amounts reimbursed by the investment adviser or reductions from brokerage service arrangements or reductions from other expense offset arrangements and do not represent the amount paid by the class during periods when reimbursements or reductions occur. Expenses net of fee waivers reflect expenses after reimbursement by the investment adviser but prior to reductions from brokerage service arrangements or other expense offset arrangements. Expenses net of all reductions represent the net expenses paid by the class.
I Amount does not include the portfolio activity of any underlying Fidelity Central Funds.
See accompanying notes which are an integral part of the financial statements.
Financial Highlights — Fidelity Advisor Dividend Growth Fund Class B
| Years ended November 30, | 2015 | 2014 | 2013 | 2012 | 2011 |
| Selected Per–Share Data | |||||
| Net asset value, beginning of period | $18.84 | $16.57 | $12.82 | $11.11 | $11.26 |
| Income from Investment Operations | |||||
| Net investment income (loss)A | .05 | .08B | .01 | (.03) | (.07) |
| Net realized and unrealized gain (loss) | (.32)C | 2.20 | 3.74 | 1.74 | (.08) |
| Total from investment operations | (.27) | 2.28 | 3.75 | 1.71 | (.15) |
| Distributions from net investment income | (.01) | – | – | – | – |
| Distributions from net realized gain | (1.96) | (.01) | – | – | – |
| Total distributions | (1.97) | (.01) | – | – | – |
| Net asset value, end of period | $16.60 | $18.84 | $16.57 | $12.82 | $11.11 |
| Total ReturnD,E | (1.20)%C | 13.75% | 29.25% | 15.39% | (1.33)% |
| Ratios to Average Net AssetsF,G | |||||
| Expenses before reductions | 1.84% | 1.78% | 1.79% | 1.99% | 2.14% |
| Expenses net of fee waivers, if any | 1.84% | 1.78% | 1.79% | 1.99% | 2.09% |
| Expenses net of all reductions | 1.84% | 1.78% | 1.78% | 1.99% | 2.09% |
| Net investment income (loss) | .29% | .45%B | .06% | (.25)% | (.61)% |
| Supplemental Data | |||||
| Net assets, end of period (in millions) | $6 | $11 | $15 | $17 | $22 |
| Portfolio turnover rateH | 56% | 106% | 70% | 64% | 68% |
A Calculated based on average shares outstanding during the period.
B Investment income per share reflects a large, non-recurring dividend which amounted to $.04 per share. Excluding this non-recurring dividend, the ratio of net investment income (loss) to average net assets would have been .23%.
C Net realized and unrealized gain (loss) per share reflects proceeds received from litigation which amounted to $.02 per share. Excluding these litigation proceeds, the total return would have been (1.30)%.
D Total returns would have been lower if certain expenses had not been reduced during the applicable periods shown.
E Total returns do not include the effect of the contingent deferred sales charge.
F Fees and expenses of any underlying Fidelity Central Funds are not included in the Fund's expense ratio. The Fund indirectly bears its proportionate share of the expenses of any underlying Fidelity Central Funds.
G Expense ratios reflect operating expenses of the class. Expenses before reductions do not reflect amounts reimbursed by the investment adviser or reductions from brokerage service arrangements or reductions from other expense offset arrangements and do not represent the amount paid by the class during periods when reimbursements or reductions occur. Expenses net of fee waivers reflect expenses after reimbursement by the investment adviser but prior to reductions from brokerage service arrangements or other expense offset arrangements. Expenses net of all reductions represent the net expenses paid by the class.
H Amount does not include the portfolio activity of any underlying Fidelity Central Funds.
See accompanying notes which are an integral part of the financial statements.
Financial Highlights — Fidelity Advisor Dividend Growth Fund Class C
| Years ended November 30, | 2015 | 2014 | 2013 | 2012 | 2011 |
| Selected Per–Share Data | |||||
| Net asset value, beginning of period | $18.82 | $16.54 | $12.79 | $11.07 | $11.22 |
| Income from Investment Operations | |||||
| Net investment income (loss)A | .06 | .09B | .02 | (.02) | (.07) |
| Net realized and unrealized gain (loss) | (.32)C | 2.20 | 3.73 | 1.74 | (.08) |
| Total from investment operations | (.26) | 2.29 | 3.75 | 1.72 | (.15) |
| Distributions from net investment income | (.06) | – | – | – | – |
| Distributions from net realized gain | (1.96) | (.01) | – | – | – |
| Total distributions | (2.03)D | (.01) | – | – | – |
| Net asset value, end of period | $16.53 | $18.82 | $16.54 | $12.79 | $11.07 |
| Total ReturnE,F | (1.16)%C | 13.83% | 29.36% | 15.54% | (1.34)% |
| Ratios to Average Net AssetsG,H | |||||
| Expenses before reductions | 1.76% | 1.69% | 1.72% | 1.94% | 2.08% |
| Expenses net of fee waivers, if any | 1.76% | 1.69% | 1.72% | 1.94% | 2.06% |
| Expenses net of all reductions | 1.76% | 1.69% | 1.71% | 1.93% | 2.05% |
| Net investment income (loss) | .37% | .54%B | .13% | (.20)% | (.57)% |
| Supplemental Data | |||||
| Net assets, end of period (in millions) | $167 | $179 | $160 | $123 | $124 |
| Portfolio turnover rateI | 56% | 106% | 70% | 64% | 68% |
A Calculated based on average shares outstanding during the period.
B Investment income per share reflects a large, non-recurring dividend which amounted to $.04 per share. Excluding this non-recurring dividend, the ratio of net investment income (loss) to average net assets would have been .32%.
C Net realized and unrealized gain (loss) per share reflects proceeds received from litigation which amounted to $.02 per share. Excluding these litigation proceeds, the total return would have been (1.26)%.
D Total distributions of $2.03 per share is comprised of distributions from net investment income of $.064 and distributions from net realized gain of $1.962 per share.
E Total returns would have been lower if certain expenses had not been reduced during the applicable periods shown.
F Total returns do not include the effect of the contingent deferred sales charge.
G Fees and expenses of any underlying Fidelity Central Funds are not included in the Fund's expense ratio. The Fund indirectly bears its proportionate share of the expenses of any underlying Fidelity Central Funds.
H Expense ratios reflect operating expenses of the class. Expenses before reductions do not reflect amounts reimbursed by the investment adviser or reductions from brokerage service arrangements or reductions from other expense offset arrangements and do not represent the amount paid by the class during periods when reimbursements or reductions occur. Expenses net of fee waivers reflect expenses after reimbursement by the investment adviser but prior to reductions from brokerage service arrangements or other expense offset arrangements. Expenses net of all reductions represent the net expenses paid by the class.
I Amount does not include the portfolio activity of any underlying Fidelity Central Funds.
See accompanying notes which are an integral part of the financial statements.
Financial Highlights — Fidelity Advisor Dividend Growth Fund Class I
| Years ended November 30, | 2015 | 2014 | 2013 | 2012 | 2011 |
| Selected Per–Share Data | |||||
| Net asset value, beginning of period | $20.42 | $17.91 | $13.86 | $11.88 | $12.00 |
| Income from Investment Operations | |||||
| Net investment income (loss)A | .25 | .29B | .18 | .11 | .06 |
| Net realized and unrealized gain (loss) | (.35)C | 2.37 | 4.02 | 1.87 | (.09) |
| Total from investment operations | (.10) | 2.66 | 4.20 | 1.98 | (.03) |
| Distributions from net investment income | (.24) | (.14) | (.15) | – | (.02) |
| Distributions from net realized gain | (1.96) | (.01) | – | – | (.07) |
| Total distributions | (2.20) | (.15) | (.15) | – | (.09) |
| Net asset value, end of period | $18.12 | $20.42 | $17.91 | $13.86 | $11.88 |
| Total ReturnD | (.14)%C | 14.99% | 30.63% | 16.67% | (.33)% |
| Ratios to Average Net AssetsE,F | |||||
| Expenses before reductions | .76% | .69% | .70% | .91% | 1.04% |
| Expenses net of fee waivers, if any | .76% | .69% | .70% | .91% | 1.03% |
| Expenses net of all reductions | .76% | .69% | .69% | .90% | 1.02% |
| Net investment income (loss) | 1.37% | 1.54%B | 1.15% | .83% | .46% |
| Supplemental Data | |||||
| Net assets, end of period (in millions) | $125 | $131 | $135 | $103 | $83 |
| Portfolio turnover rateG | 56% | 106% | 70% | 64% | 68% |
A Calculated based on average shares outstanding during the period.
B Investment income per share reflects a large, non-recurring dividend which amounted to $.04 per share. Excluding this non-recurring dividend, the ratio of net investment income (loss) to average net assets would have been 1.32%.
C Net realized and unrealized gain (loss) per share reflects proceeds received from litigation which amounted to $.02 per share. Excluding these litigation proceeds, the total return would have been (.24)%.
D Total returns would have been lower if certain expenses had not been reduced during the applicable periods shown.
E Fees and expenses of any underlying Fidelity Central Funds are not included in the Fund's expense ratio. The Fund indirectly bears its proportionate share of the expenses of any underlying Fidelity Central Funds.
F Expense ratios reflect operating expenses of the class. Expenses before reductions do not reflect amounts reimbursed by the investment adviser or reductions from brokerage service arrangements or reductions from other expense offset arrangements and do not represent the amount paid by the class during periods when reimbursements or reductions occur. Expenses net of fee waivers reflect expenses after reimbursement by the investment adviser but prior to reductions from brokerage service arrangements or other expense offset arrangements. Expenses net of all reductions represent the net expenses paid by the class.
G Amount does not include the portfolio activity of any underlying Fidelity Central Funds.
See accompanying notes which are an integral part of the financial statements.
Financial Highlights — Fidelity Advisor Dividend Growth Fund Class Z
| Years ended November 30, | 2015 | 2014 | 2013 A |
| Selected Per–Share Data | |||
| Net asset value, beginning of period | $20.44 | $17.92 | $16.59 |
| Income from Investment Operations | |||
| Net investment income (loss)B | .28 | .31C | .06 |
| Net realized and unrealized gain (loss) | (.35)D | 2.38 | 1.27 |
| Total from investment operations | (.07) | 2.69 | 1.33 |
| Distributions from net investment income | (.05) | (.17) | – |
| Distributions from net realized gain | (1.96) | (.01) | – |
| Total distributions | (2.01) | (.17)E | – |
| Net asset value, end of period | $18.36 | $20.44 | $17.92 |
| Total ReturnF,G | (.01)%D | 15.20% | 8.02% |
| Ratios to Average Net AssetsH,I | |||
| Expenses before reductions | .59% | .52% | .54%J |
| Expenses net of fee waivers, if any | .59% | .52% | .54%J |
| Expenses net of all reductions | .59% | .52% | .52%J |
| Net investment income (loss) | 1.54% | 1.71%C | 1.26%J |
| Supplemental Data | |||
| Net assets, end of period (000 omitted) | $8,642 | $118 | $7,394 |
| Portfolio turnover rateK | 56% | 106% | 70% |
A For the period August 13, 2013 (commencement of sale of shares) to November 30, 2013.
B Calculated based on average shares outstanding during the period.
C Investment income per share reflects a large, non-recurring dividend which amounted to $.04 per share. Excluding this non-recurring dividend, the ratio of net investment income (loss) to average net assets would have been 1.49%.
D Net realized and unrealized gain (loss) per share reflects proceeds received from litigation which amounted to $.02 per share. Excluding these litigation proceeds, the total return would have been (.11)%.
E Total distributions of $.17 per share is comprised of distributions from net investment income of $.166 and distributions from net realized gain of $.007 per share.
F Total returns for periods of less than one year are not annualized.
G Total returns would have been lower if certain expenses had not been reduced during the applicable periods shown.
H Fees and expenses of any underlying Fidelity Central Funds are not included in the Fund's expense ratio. The Fund indirectly bears its proportionate share of the expenses of any underlying Fidelity Central Funds.
I Expense ratios reflect operating expenses of the class. Expenses before reductions do not reflect amounts reimbursed by the investment adviser or reductions from brokerage service arrangements or reductions from other expense offset arrangements and do not represent the amount paid by the class during periods when reimbursements or reductions occur. Expense ratios before reductions for start-up periods may not be representative of longer-term operating periods. Expenses net of fee waivers reflect expenses after reimbursement by the investment adviser but prior to reductions from brokerage service arrangements or other expense offset arrangements. Expenses net of all reductions represent the net expenses paid by the class.
J Annualized
K Amount does not include the portfolio activity of any underlying Fidelity Central Funds.
See accompanying notes which are an integral part of the financial statements.
Notes to Financial Statements
For the period ended November 30, 2015
(Amounts in thousands except percentages)
1. Organization.
Fidelity Advisor Dividend Growth Fund (the Fund) is a fund of Fidelity Advisor Series I (the Trust) and is authorized to issue an unlimited number of shares. The Trust is registered under the Investment Company Act of 1940, as amended (the 1940 Act), as an open-end management investment company organized as a Massachusetts business trust. The Fund offers Class A, Class T, Class C, Class I (formerly Institutional Class) and Class Z shares, each of which, along with Class B shares, has equal rights as to assets and voting privileges. Class B shares are closed to new accounts and additional purchases, except for exchanges and reinvestments. Each class has exclusive voting rights with respect to matters that affect that class. Class B shares will automatically convert to Class A shares after a holding period of seven years from the initial date of purchase.
2. Investments in Fidelity Central Funds.
The Fund invests in Fidelity Central Funds, which are open-end investment companies generally available only to other investment companies and accounts managed by the investment adviser and its affiliates. The Fund's Schedule of Investments lists each of the Fidelity Central Funds held as of period end, if any, as an investment of the Fund, but does not include the underlying holdings of each Fidelity Central Fund. As an Investing Fund, the Fund indirectly bears its proportionate share of the expenses of the underlying Fidelity Central Funds.
The Money Market Central Funds seek preservation of capital and current income and are managed by Fidelity Investments Money Management, Inc. (FIMM), an affiliate of the investment adviser. Annualized expenses of the Money Market Central Funds as of their most recent shareholder report date are less than .005%.
A complete unaudited list of holdings for each Fidelity Central Fund is available upon request or at the Securities and Exchange Commission (the SEC) website at www.sec.gov. In addition, the financial statements of the Fidelity Central Funds, which are not covered by the Fund's Report of Independent Registered Public Accounting Firm, are available on the SEC website or upon request.
3. Significant Accounting Policies.
The financial statements have been prepared in conformity with accounting principles generally accepted in the United States of America (GAAP), which require management to make certain estimates and assumptions at the date of the financial statements. Actual results could differ from those estimates. Subsequent events, if any, through the date that the financial statements were issued have been evaluated in the preparation of the financial statements. The following summarizes the significant accounting policies of the Fund:
Investment Valuation. Investments are valued as of 4:00 p.m. Eastern time on the last calendar day of the period. The Board of Trustees (the Board) has delegated the day to day responsibility for the valuation of the Fund's investments to the Fidelity Management & Research Company (FMR) Fair Value Committee (the Committee). In accordance with valuation policies and procedures approved by the Board, the Fund attempts to obtain prices from one or more third party pricing vendors or brokers to value its investments. When current market prices, quotations or currency exchange rates are not readily available or reliable, investments will be fair valued in good faith by the Committee, in accordance with procedures adopted by the Board. Factors used in determining fair value vary by investment type and may include market or investment specific events, changes in interest rates and credit quality. The frequency with which these procedures are used cannot be predicted and they may be utilized to a significant extent. The Committee oversees the Fund's valuation policies and procedures and reports to the Board on the Committee's activities and fair value determinations. The Board monitors the appropriateness of the procedures used in valuing the Fund's investments and ratifies the fair value determinations of the Committee.
The Fund categorizes the inputs to valuation techniques used to value its investments into a disclosure hierarchy consisting of three levels as shown below:
- Level 1 – quoted prices in active markets for identical investments
- Level 2 – other significant observable inputs (including quoted prices for similar investments, interest rates, prepayment speeds, etc.)
- Level 3 – unobservable inputs (including the Fund's own assumptions based on the best information available)
Valuation techniques used to value the Fund's investments by major category are as follows:
Equity securities, including restricted securities, for which market quotations are readily available, are valued at the last reported sale price or official closing price as reported by a third party pricing vendor on the primary market or exchange on which they are traded and are categorized as Level 1 in the hierarchy. In the event there were no sales during the day or closing prices are not available, securities are valued at the last quoted bid price or may be valued using the last available price and are generally categorized as Level 2 in the hierarchy. For foreign equity securities, when market or security specific events arise, comparisons to the valuation of American Depositary Receipts (ADRs), futures contracts, Exchange-Traded Funds (ETFs) and certain indexes as well as quoted prices for similar securities may be used and would be categorized as Level 2 in the hierarchy. Utilizing these techniques may result in transfers between Level 1 and Level 2. For equity securities, including restricted securities, where observable inputs are limited, assumptions about market activity and risk are used and these securities may be categorized as Level 3 in the hierarchy.
Debt securities, including restricted securities, are valued based on evaluated prices received from third party pricing vendors or from brokers who make markets in such securities. Corporate bonds are valued by pricing vendors who utilize matrix pricing which considers yield or price of bonds of comparable quality, coupon, maturity and type or by broker-supplied prices. When independent prices are unavailable or unreliable, debt securities may be valued utilizing pricing methodologies which consider similar factors that would be used by third party pricing vendors. Debt securities are generally categorized as Level 2 in the hierarchy but may be Level 3 depending on the circumstances.
Investments in open-end mutual funds, including the Fidelity Central Funds, are valued at their closing net asset value (NAV) each business day and are categorized as Level 1 in the hierarchy.
Changes in valuation techniques may result in transfers in or out of an assigned level within the disclosure hierarchy. The aggregate value of investments by input level as of November 30, 2015 is included at the end of the Fund's Schedule of Investments.
Foreign Currency. The Fund may use foreign currency contracts to facilitate transactions in foreign-denominated securities. Gains and losses from these transactions may arise from changes in the value of the foreign currency or if the counterparties do not perform under the contracts' terms.
Foreign-denominated assets, including investment securities, and liabilities are translated into U.S. dollars at the exchange rates at period end. Purchases and sales of investment securities, income and dividends received and expenses denominated in foreign currencies are translated into U.S. dollars at the exchange rate in effect on the transaction date.
The effects of exchange rate fluctuations on investments are included with the net realized and unrealized gain (loss) on investment securities. Other foreign currency transactions resulting in realized and unrealized gain (loss) are disclosed separately.
Investment Transactions and Income. For financial reporting purposes, the Fund's investment holdings and NAV include trades executed through the end of the last business day of the period. The NAV per share for processing shareholder transactions is calculated as of the close of business of the New York Stock Exchange (NYSE), normally 4:00 p.m. Eastern time and includes trades executed through the end of the prior business day. Gains and losses on securities sold are determined on the basis of identified cost and may include proceeds received from litigation. Dividend income is recorded on the ex-dividend date, except for certain dividends from foreign securities where the ex-dividend date may have passed, which are recorded as soon as the Fund is informed of the ex-dividend date. Non-cash dividends included in dividend income, if any, are recorded at the fair market value of the securities received. Income and capital gain distributions from Fidelity Central Funds, if any, are recorded on the ex-dividend date. Distributions received on securities that represent a return of capital or capital gain are recorded as a reduction of cost of investments and/or as a realized gain. Subsequent to ex-dividend date the Fund determines the components of these distributions, based upon receipt of tax filings or other correspondence relating to the underlying investment. Interest income is accrued as earned and includes coupon interest and amortization of premium and accretion of discount on debt securities as applicable. Investment income is recorded net of foreign taxes withheld where recovery of such taxes is uncertain.
Class Allocations and Expenses. Investment income, realized and unrealized capital gains and losses, common expenses of the Fund, and certain fund-level expense reductions, if any, are allocated daily on a pro-rata basis to each class based on the relative net assets of each class to the total net assets of the Fund. Each class differs with respect to transfer agent and distribution and service plan fees incurred. Certain expense reductions may also differ by class. For the reporting period, the allocated portion of income and expenses to each class as a percent of its average net assets may vary due to the timing of recording these transactions in relation to fluctuating net assets of the classes. Expenses directly attributable to a fund are charged to that fund. Expenses attributable to more than one fund are allocated among the respective funds on the basis of relative net assets or other appropriate methods. Expense estimates are accrued in the period to which they relate and adjustments are made when actual amounts are known.
Income Tax Information and Distributions to Shareholders. Each year, the Fund intends to qualify as a regulated investment company under Subchapter M of the Internal Revenue Code, including distributing substantially all of its taxable income and realized gains. As a result, no provision for U.S. Federal income taxes is required. As of November 30, 2015, the Fund did not have any unrecognized tax benefits in the financial statements; nor is the Fund aware of any tax positions for which it is reasonably possible that the total amounts of unrecognized tax benefits will significantly change in the next twelve months. The Fund files a U.S. federal tax return, in addition to state and local tax returns as required. The Fund's federal income tax returns are subject to examination by the Internal Revenue Service (IRS) for a period of three fiscal years after they are filed. State and local tax returns may be subject to examination for an additional fiscal year depending on the jurisdiction. Foreign taxes are provided for based on the Fund's understanding of the tax rules and rates that exist in the foreign markets in which it invests.
Distributions are declared and recorded on the ex-dividend date. Income dividends and capital gain distributions are declared separately for each class. Income and capital gain distributions are determined in accordance with income tax regulations, which may differ from GAAP. In addition, the Fund claimed a portion of the payment made to redeeming shareholders as a distribution for income tax purposes.
Capital accounts within the financial statements are adjusted for permanent book-tax differences. These adjustments have no impact on net assets or the results of operations. Capital accounts are not adjusted for temporary book-tax differences which will reverse in a subsequent period.
Book-tax differences are primarily due to foreign currency transactions, partnerships and losses deferred due to wash sales and excise tax regulations.
The federal tax cost of investment securities and unrealized appreciation (depreciation) as of period end were as follows:
| Gross unrealized appreciation | $179,987 |
| Gross unrealized depreciation | (44,962) |
| Net unrealized appreciation (depreciation) on securities | $135,025 |
| Tax Cost | $903,588 |
The tax-based components of distributable earnings as of period end were as follows:
| Undistributed ordinary income | $8,234 |
| Undistributed long-term capital gain | $56,258 |
| Net unrealized appreciation (depreciation) on securities and other investments | $135,022 |
The fund intends to elect to defer to its next fiscal year $4,451 of capital loss recognized during the period November 1, 2015 to November 30, 2015.
The tax character of distributions paid was as follows:
| November 30, 2015 | November 30, 2014 | |
| Ordinary Income | $23,853 | $ 4,242 |
| Long-term Capital Gains | 98,384 | 420 |
| Total | $122,237 | $ 4,662 |
Restricted Securities. The Fund may invest in securities that are subject to legal or contractual restrictions on resale. These securities generally may be resold in transactions exempt from registration or to the public if the securities are registered. Disposal of these securities may involve time-consuming negotiations and expense, and prompt sale at an acceptable price may be difficult. Information regarding restricted securities is included at the end of the Fund's Schedule of Investments.
4. Purchases and Sales of Investments.
Purchases and sales of securities, other than short-term securities, aggregated $583,377 and $642,751, respectively.
5. Fees and Other Transactions with Affiliates.
Management Fee. Fidelity Management & Research Company (the investment adviser) and its affiliates provide the Fund with investment management related services for which the Fund pays a monthly management fee. The management fee is the sum of an individual fund fee rate that is based on an annual rate of .30% of the Fund's average net assets and an annualized group fee rate that averaged .25% during the period. The group fee rate is based upon the average net assets of all the mutual funds advised by the investment adviser, including any mutual funds previously advised by the investment adviser that are currently advised by Fidelity SelectCo, LLC, an affiliate of the investment adviser. The group fee rate decreases as assets under management increase and increases as assets under management decrease. In addition, the management fee is subject to a performance adjustment (up to a maximum of +/- .20% of the Fund's average net assets over a 36 month performance period). The upward or downward adjustment to the management fee is based on Class I of the Fund as compared to its benchmark index, the S&P 500 Index, over the same 36 month performance period. For the reporting period, the total annual management fee rate, including the performance adjustment, was .49% of the Fund's average net assets. The performance adjustment included in the management fee rate may be higher or lower than the maximum performance adjustment rate due to the difference between the average net assets for the reporting and performance periods.
Distribution and Service Plan Fees. In accordance with Rule 12b-1 of the 1940 Act, the Fund has adopted separate Distribution and Service Plans for each class of shares. Certain classes pay Fidelity Distributors Corporation (FDC), an affiliate of the investment adviser, separate Distribution and Service Fees, each of which is based on an annual percentage of each class' average net assets. In addition, FDC may pay financial intermediaries for selling shares of the Fund and providing shareholder support services. For the period, the Distribution and Service Fee rates, total fees and amounts retained by FDC were as follows:
| Distribution Fee | Service Fee | Total Fees | Retained by FDC | |
| Class A | -% | .25% | $920 | $6 |
| Class T | .25% | .25% | 1,972 | 5 |
| Class B | .75% | .25% | 87 | 66 |
| Class C | .75% | .25% | 1,736 | 114 |
| $4,715 | $191 |
Sales Load. FDC may receive a front-end sales charge of up to 5.75% for selling Class A shares and 3.50% for selling Class T shares, some of which is paid to financial intermediaries for selling shares of the Fund. Depending on the holding period, FDC may receive contingent deferred sales charges levied on Class A, Class T, Class B, and Class C redemptions. The deferred sales charges range from 5.00% to 1.00% for Class B shares, 1.00% for Class C shares, 1.00% for certain purchases of Class A shares and .25% for certain purchases of Class T shares.
For the period, sales charge amounts retained by FDC were as follows:
| Retained by FDC | |
| Class A | $115 |
| Class T | 18 |
| Class B(a) | 3 |
| Class C(a) | 12 |
| $148 |
(a) When Class B and Class C shares are initially sold, FDC pays commissions from its own resources to financial intermediaries through which the sales are made.
Transfer Agent Fees. Fidelity Investments Institutional Operations Company, Inc., (FIIOC), an affiliate of the investment adviser, is the transfer, dividend disbursing and shareholder servicing agent for each class of the Fund. FIIOC receives account fees and asset-based fees that vary according to the account size and type of account of the shareholders of the respective classes of the Fund, except for Class Z. FIIOC receives an asset-based fee of Class Z's average net assets. FIIOC pays for typesetting, printing and mailing of shareholder reports, except proxy statements.
For the period, transfer agent fees for each class were as follows:
| Amount | % of Class-Level Average Net Assets | |
| Class A | $775 | .21 |
| Class T | 777 | .20 |
| Class B | 26 | .30 |
| Class C | 374 | .22 |
| Class I | 279 | .22 |
| Class Z | 3 | .05 |
| $2,234 |
Accounting and Security Lending Fees. Fidelity Service Company, Inc. (FSC), an affiliate of the investment adviser, maintains the Fund's accounting records. The accounting fee is based on the level of average net assets for each month. Under a separate contract, FSC administers the security lending program. The security lending fee is based on the number and duration of lending transactions.
Brokerage Commissions. The Fund placed a portion of its portfolio transactions with brokerage firms which are affiliates of the investment adviser. Brokerage commissions are included in net realized gain (loss) and change in net unrealized appreciation (depreciation) in the Statement of Operations. The commissions paid to these affiliated firms were $10 for the period.
6. Committed Line of Credit.
The Fund participates with other funds managed by the investment adviser or an affiliate in a $4.25 billion credit facility (the "line of credit") to be utilized for temporary or emergency purposes to fund shareholder redemptions or for other short-term liquidity purposes. The Fund has agreed to pay commitment fees on its pro-rata portion of the line of credit, which amounted to $2 and is reflected in Miscellaneous expenses on the Statement of Operations. During the period, the Fund did not borrow on this line of credit.
7. Security Lending.
The Fund lends portfolio securities through a lending agent from time to time in order to earn additional income. For equity securities, a lending agent is used and may loan securities to certain qualified borrowers, including Fidelity Capital Markets (FCM), a broker-dealer affiliated with the Fund. On the settlement date of the loan, the Fund receives collateral (in the form of U.S. Treasury obligations, letters of credit and/or cash) against the loaned securities and maintains collateral in an amount not less than 100% of the market value of the loaned securities during the period of the loan. The market value of the loaned securities is determined at the close of business of the Fund and any additional required collateral is delivered to the Fund on the next business day. The Fund or borrower may terminate the loan at any time, and if the borrower defaults on its obligation to return the securities loaned because of insolvency or other reasons, the Fund may apply collateral received from the borrower against the obligation. The Fund may experience delays and costs in recovering the securities loaned. Any cash collateral received is invested in the Fidelity Securities Lending Cash Central Fund. The value of loaned securities and cash collateral at period end are disclosed on the Fund's Statement of Assets and Liabilities. At period end, there were no security loans outstanding with FCM. Security lending income represents the income earned on investing cash collateral, less rebates paid to borrowers and any lending agent fees associated with the loan, plus any premium payments received for lending certain types of securities. Security lending income is presented in the Statement of Operations as a component of income from Fidelity Central Funds. Total security lending income during the period amounted to $89, including less than five hundred dollars from securities loaned to FCM.
8. Expense Reductions.
Commissions paid to certain brokers with whom the investment adviser, or its affiliates, places trades on behalf of the Fund include an amount in addition to trade execution, which may be rebated back to the Fund to offset certain expenses. This amount totaled $24 for the period.
In addition, during the period the investment adviser reimbursed and/or waived a portion of fund-level operating expenses in the amount of $4 and a portion of class-level operating expenses as follows:
| Amount | |
| Class A | $8 |
| Class T | 8 |
| Class B | –(a) |
| Class C | 4 |
| Class I | 2 |
| $22 |
(a) In the amount of less than five hundred dollars.
9. Distributions to Shareholders.
Distributions to shareholders of each class were as follows:
| Years ended November 30, | 2015 | 2014 |
| From net investment income | ||
| Class A | $3,806 | $1,902 |
| Class T | 3,175 | 1,201 |
| Class B | 5 | – |
| Class C | 609 | – |
| Class I | 1,536 | 1,071 |
| Class Z | –(a) | 68 |
| Total | $9,131 | $4,242 |
| From net realized gain | ||
| Class A | $38,921 | $147 |
| Class T | 41,529 | 152 |
| Class B | 1,164 | 6 |
| Class C | 18,788 | 68 |
| Class I | 12,693 | 44 |
| Class Z | 11 | 3 |
| Total | $113,106 | $420 |
(a) In the amount of less than five hundred dollars.
10. Share Transactions.
Share transactions for each class were as follows and may contain automatic conversions between classes or exchanges between funds:
| Shares | Shares | Dollars | Dollars | |
| Years ended November 30, | 2015 | 2014 | 2015 | 2014 |
| Class A | ||||
| Shares sold | 2,750 | 2,553 | $48,068 | $46,007 |
| Reinvestment of distributions | 2,322 | 107 | 39,381 | 1,806 |
| Shares redeemed | (4,182) | (4,408) | (72,975) | (79,256) |
| Net increase (decrease) | 890 | (1,748) | $14,474 | $(31,443) |
| Class T | ||||
| Shares sold | 3,861 | 3,910 | $67,241 | $70,377 |
| Reinvestment of distributions | 2,576 | 77 | 43,556 | 1,302 |
| Shares redeemed | (5,958) | (4,771) | (103,477) | (85,489) |
| Net increase (decrease) | 479 | (784) | $7,320 | $(13,810) |
| Class B | ||||
| Shares sold | 11 | 29 | $199 | $480 |
| Reinvestment of distributions | 68 | – | 1,105 | 5 |
| Shares redeemed | (286) | (319) | (4,794) | (5,509) |
| Net increase (decrease) | (207) | (290) | $(3,490) | $(5,024) |
| Class C | ||||
| Shares sold | 1,178 | 1,183 | $19,680 | $20,503 |
| Reinvestment of distributions | 1,033 | 3 | 16,812 | 58 |
| Shares redeemed | (1,654) | (1,331) | (27,529) | (23,161) |
| Net increase (decrease) | 557 | (145) | $8,963 | $(2,600) |
| Class I | ||||
| Shares sold | 1,619 | 1,479 | $29,609 | $27,537 |
| Reinvestment of distributions | 752 | 59 | 13,280 | 1,027 |
| Shares redeemed | (1,918) | (2,664) | (35,222) | (48,359) |
| Net increase (decrease) | 453 | (1,126) | $7,667 | $(19,795) |
| Class Z | ||||
| Shares sold | 511 | 23 | $9,593 | $420 |
| Reinvestment of distributions | 1 | 4 | 11 | 71 |
| Shares redeemed | (47) | (434) | (854) | (7,943) |
| Net increase (decrease) | 465 | (407) | $8,750 | $(7,452) |
11. Other.
The Fund's organizational documents provide former and current trustees and officers with a limited indemnification against liabilities arising in connection with the performance of their duties to the Fund. In the normal course of business, the Fund may also enter into contracts that provide general indemnifications. The Fund's maximum exposure under these arrangements is unknown as this would be dependent on future claims that may be made against the Fund. The risk of material loss from such claims is considered remote.
Report of Independent Registered Public Accounting Firm
To the Trustees of Fidelity Advisor Series I and Shareholders of Fidelity Advisor® Dividend Growth Fund:
In our opinion, the accompanying statement of assets and liabilities, including the schedule of investments, and the related statements of operations and of changes in net assets and the financial highlights present fairly, in all material respects, the financial position of Fidelity Advisor® Dividend Growth Fund (a fund of Fidelity Advisor Series I) at November 30, 2015, the results of its operations for the year then ended, the changes in its net assets for each of the two years in the period then ended and the financial highlights for each of the periods indicated, in conformity with accounting principles generally accepted in the United States of America. These financial statements and financial highlights (hereafter referred to as “financial statements”) are the responsibility of the Fidelity Advisor® Dividend Growth Fund’s management. Our responsibility is to express an opinion on these financial statements based on our audits. We conducted our audits of these financial statements in accordance with the standards of the Public Company Accounting Oversight Board (United States). Those standards require that we plan and perform the audit to obtain reasonable assurance about whether the financial statements are free of material misstatement. An audit includes examining, on a test basis, evidence supporting the amounts and disclosures in the financial statements, assessing the accounting principles used and significant estimates made by management, and evaluating the overall financial statement presentation. We believe that our audits, which included confirmation of securities at November 30, 2015 by correspondence with the custodian and brokers, provide a reasonable basis for our opinion.
PricewaterhouseCoopers LLP
Boston, Massachusetts
January 19, 2016
Trustees and Officers
The Trustees, Members of the Advisory Board (if any), and officers of the trust and fund, as applicable, are listed below. The Board of Trustees governs the fund and is responsible for protecting the interests of shareholders. The Trustees are experienced executives who meet periodically throughout the year to oversee the fund's activities, review contractual arrangements with companies that provide services to the fund, oversee management of the risks associated with such activities and contractual arrangements, and review the fund's performance. Each of the Trustees oversees 170 funds.
The Trustees hold office without limit in time except that (a) any Trustee may resign; (b) any Trustee may be removed by written instrument, signed by at least two-thirds of the number of Trustees prior to such removal; (c) any Trustee who requests to be retired or who has become incapacitated by illness or injury may be retired by written instrument signed by a majority of the other Trustees; and (d) any Trustee may be removed at any special meeting of shareholders by a two-thirds vote of the outstanding voting securities of the trust. Each Trustee who is not an interested person (as defined in the 1940 Act) of the trust and the fund is referred to herein as an Independent Trustee. Each Independent Trustee shall retire not later than the last day of the calendar year in which his or her 75th birthday occurs. The Independent Trustees may waive this mandatory retirement age policy with respect to individual Trustees. Officers and Advisory Board Members hold office without limit in time, except that any officer or Advisory Board Member may resign or may be removed by a vote of a majority of the Trustees at any regular meeting or any special meeting of the Trustees. Except as indicated, each individual has held the office shown or other offices in the same company for the past five years.
The fund’s Statement of Additional Information (SAI) includes more information about the Trustees. To request a free copy, call Fidelity at 1-877-208-0098.
Experience, Skills, Attributes, and Qualifications of the Trustees. The Governance and Nominating Committee has adopted a statement of policy that describes the experience, qualifications, attributes, and skills that are necessary and desirable for potential Independent Trustee candidates (Statement of Policy). The Board believes that each Trustee satisfied at the time he or she was initially elected or appointed a Trustee, and continues to satisfy, the standards contemplated by the Statement of Policy. The Governance and Nominating Committee also engages professional search firms to help identify potential Independent Trustee candidates who have the experience, qualifications, attributes, and skills consistent with the Statement of Policy. From time to time, additional criteria based on the composition and skills of the current Independent Trustees, as well as experience or skills that may be appropriate in light of future changes to board composition, business conditions, and regulatory or other developments, have also been considered by the professional search firms and the Governance and Nominating Committee. In addition, the Board takes into account the Trustees' commitment and participation in Board and committee meetings, as well as their leadership of standing and ad hoc committees throughout their tenure.
In determining that a particular Trustee was and continues to be qualified to serve as a Trustee, the Board has considered a variety of criteria, none of which, in isolation, was controlling. The Board believes that, collectively, the Trustees have balanced and diverse experience, qualifications, attributes, and skills, which allow the Board to operate effectively in governing the fund and protecting the interests of shareholders. Information about the specific experience, skills, attributes, and qualifications of each Trustee, which in each case led to the Board's conclusion that the Trustee should serve (or continue to serve) as a trustee of the fund, is provided below.
Board Structure and Oversight Function. James C. Curvey is an interested person and currently serves as Chairman. The Trustees have determined that an interested Chairman is appropriate and benefits shareholders because an interested Chairman has a personal and professional stake in the quality and continuity of services provided to the fund. Independent Trustees exercise their informed business judgment to appoint an individual of their choosing to serve as Chairman, regardless of whether the Trustee happens to be independent or a member of management. The Independent Trustees have determined that they can act independently and effectively without having an Independent Trustee serve as Chairman and that a key structural component for assuring that they are in a position to do so is for the Independent Trustees to constitute a substantial majority for the Board. The Independent Trustees also regularly meet in executive session. Ned C. Lautenbach serves as Chairman of the Independent Trustees and as such (i) acts as a liaison between the Independent Trustees and management with respect to matters important to the Independent Trustees and (ii) with management prepares agendas for Board meetings.
Fidelity® funds are overseen by different Boards of Trustees. The fund's Board oversees Fidelity's high income and certain equity funds, and other Boards oversee Fidelity's investment-grade bond, money market, asset allocation, and sector funds. The asset allocation funds may invest in Fidelity® funds overseen by the fund's Board. The use of separate Boards, each with its own committee structure, allows the Trustees of each group of Fidelity® funds to focus on the unique issues of the funds they oversee, including common research, investment, and operational issues. On occasion, the separate Boards establish joint committees to address issues of overlapping consequences for the Fidelity® funds overseen by each Board.
The Trustees operate using a system of committees to facilitate the timely and efficient consideration of all matters of importance to the Trustees, the fund, and fund shareholders and to facilitate compliance with legal and regulatory requirements and oversight of the fund's activities and associated risks. The Board, acting through its committees, has charged FMR and its affiliates with (i) identifying events or circumstances the occurrence of which could have demonstrably adverse effects on the fund's business and/or reputation; (ii) implementing processes and controls to lessen the possibility that such events or circumstances occur or to mitigate the effects of such events or circumstances if they do occur; and (iii) creating and maintaining a system designed to evaluate continuously business and market conditions in order to facilitate the identification and implementation processes described in (i) and (ii) above. Because the day-to-day operations and activities of the fund are carried out by or through FMR, its affiliates, and other service providers, the fund's exposure to risks is mitigated but not eliminated by the processes overseen by the Trustees. While each of the Board's committees has responsibility for overseeing different aspects of the fund's activities, oversight is exercised primarily through the Operations, Audit, and Compliance Committees. In addition, the Independent Trustees have worked with FMR to enhance the Board's oversight of investment and financial risks, legal and regulatory risks, technology risks, and operational risks, including the development of additional risk reporting to the Board. For example, a working group comprised of Independent Trustees and FMR has worked and continues to work to review the Fidelity® funds' valuation-related activities, reporting and risk management. Appropriate personnel, including but not limited to the fund's Chief Compliance Officer (CCO), FMR's internal auditor, the independent accountants, the fund's Treasurer and portfolio management personnel, make periodic reports to the Board's committees, as appropriate, including an annual review of Fidelity's risk management program for the Fidelity® funds. The responsibilities of each standing committee, including their oversight responsibilities, are described further under "Standing Committees of the Trustees."
Interested Trustees*:
Correspondence intended for a Trustee who is an interested person may be sent to Fidelity Investments, 245 Summer Street, Boston, Massachusetts 02210.
Name, Year of Birth; Principal Occupations and Other Relevant Experience+
James C. Curvey (1935)
Year of Election or Appointment: 2007
Trustee
Chairman of the Board of Trustees
Mr. Curvey also serves as Trustee of other Fidelity® funds. Mr. Curvey is a Director of Fidelity Research & Analysis Co. (investment adviser firm, 2009-present), and Vice Chairman (2007-present) and Director of FMR LLC (diversified financial services company). In addition, Mr. Curvey serves as an Overseer for the Boston Symphony Orchestra and a member of the board of Artis-Naples, Naples, Florida, and as a Trustee for Brewster Academy, Wolfeboro, New Hampshire. Previously, Mr. Curvey served as a Director of Fidelity Investments Money Management, Inc. (investment adviser firm, 2009-2014) and a Director of FMR and FMR Co., Inc. (investment adviser firms, 2007-2014).
Charles S. Morrison (1960)
Year of Election or Appointment: 2014
Trustee
Mr. Morrison also serves as Trustee of other funds. He serves as a Director of Fidelity Investments Money Management, Inc. (FIMM) (investment adviser firm, 2014-present), Director of Fidelity SelectCo, LLC (investment adviser firm, 2014-present), President, Asset Management (2014-present), and is an employee of Fidelity Investments. Previously, Mr. Morrison served as Vice President of Fidelity's Fixed Income and Asset Allocation Funds (2012-2014), President, Fixed Income (2011-2014), Vice President of Fidelity's Money Market Funds (2005-2009), President, Money Market Group Leader of FMR (investment adviser firm, 2009), and Senior Vice President, Money Market Group of FMR (2004-2009). Mr. Morrison also served as Vice President of Fidelity's Bond Funds (2002-2005), certain Balanced Funds (2002-2005), and certain Asset Allocation Funds (2002-2007), and as Senior Vice President (2002-2005) of Fidelity's Bond Division.
* Determined to be an “Interested Trustee” by virtue of, among other things, his or her affiliation with the trust or various entities under common control with FMR.
+ The information includes the Trustee's principal occupation during the last five years and other information relating to the experience, attributes, and skills relevant to the Trustee's qualifications to serve as a Trustee, which led to the conclusion that the Trustee should serve as a Trustee for the fund.
Independent Trustees:
Correspondence intended for an Independent Trustee may be sent to Fidelity Investments, P.O. Box 55235, Boston, Massachusetts 02205-5235.
Name, Year of Birth; Principal Occupations and Other Relevant Experience+
Dennis J. Dirks (1948)
Year of Election or Appointment: 2005
Trustee
Mr. Dirks also serves as Trustee of other Fidelity® funds. Prior to his retirement in May 2003, Mr. Dirks was Chief Operating Officer and a member of the Board of The Depository Trust & Clearing Corporation (DTCC). He also served as President, Chief Operating Officer, and Board member of The Depository Trust Company (DTC) and President and Board member of the National Securities Clearing Corporation (NSCC). In addition, Mr. Dirks served as Chief Executive Officer and Board member of the Government Securities Clearing Corporation, Chief Executive Officer and Board member of the Mortgage-Backed Securities Clearing Corporation, as a Trustee and a member of the Finance Committee of Manhattan College (2005-2008), as a Trustee and a member of the Finance Committee of AHRC of Nassau County (2006-2008), and as a member of the Independent Directors Council (IDC) Governing Council (2010-2015). Mr. Dirks is a member of the Board of Directors for The Brookville Center for Children's Services, Inc. (2009-present).
Alan J. Lacy (1953)
Year of Election or Appointment: 2008
Trustee
Mr. Lacy also serves as Trustee of other Fidelity® funds. Mr. Lacy serves as a member of the Board of Directors of Dave & Buster's Entertainment, Inc. (restaurant and entertainment complexes, 2010-present) and Bristol-Myers Squibb Company (global pharmaceuticals, 2008-present). In addition, Mr. Lacy served as Senior Adviser (2007-2014) of Oak Hill Capital Partners, L.P. (private equity) and also served as Chief Executive Officer (2000-2005) and Vice Chairman (2005-2006) of Sears Holdings Corporation and Sears, Roebuck and Co. (retail). Mr. Lacy is a member of the Board of Trustees of The National Parks Conservation Association (2006-present). Previously, Mr. Lacy served as Chairman of the Board of Trustees of the National Parks Conservation Association (2008-2011) and as a member of the Board of Directors for The Western Union Company (global money transfer, 2006-2011), The Hillman Companies, Inc. (hardware wholesalers, 2010-2014), and Earth Fare, Inc. (retail grocery, 2010-2014).
Ned C. Lautenbach (1944)
Year of Election or Appointment: 2000
Trustee
Chairman of the Independent Trustees
Mr. Lautenbach also serves as Trustee of other Fidelity® funds. Mr. Lautenbach currently serves as the Lead Director of the Eaton Corporation Board of Directors (diversified industrial, 1997-present). Mr. Lautenbach is Chairman of the Board of Directors of Artis-Naples in Naples, Florida (2012-present), a member of the Council on Foreign Relations (1994-present), and a member of the Board of Governors, State University System of Florida (2013-present). Previously, Mr. Lautenbach was a Partner/Advisory Partner at Clayton, Dubilier & Rice, LLC (private equity investment, 1998-2010), as well as a Director of Sony Corporation (2006-2007).
Joseph Mauriello (1944)
Year of Election or Appointment: 2008
Trustee
Mr. Mauriello also serves as Trustee of other Fidelity® funds. Prior to his retirement in January 2006, Mr. Mauriello served in numerous senior management positions including Deputy Chairman and Chief Operating Officer (2004-2005), and Vice Chairman of Financial Services (2002-2004) of KPMG LLP US (professional services, 1965-2005). Mr. Mauriello currently serves as a member of the Board of Directors of XL Group plc. (global insurance and re-insurance, 2006-present) and the Independent Directors Council (IDC) Governing Council (2015-present). Previously, Mr. Mauriello served as a Director of the Hamilton Funds of the Bank of New York (2006-2007) and of Arcadia Resources Inc. (health care services and products, 2007-2012).
Robert W. Selander (1950)
Year of Election or Appointment: 2011
Trustee
Mr. Selander also serves as Trustee of other Fidelity® funds. Mr. Selander serves as a Director of The Western Union Company (global money transfer, 2014-present). Previously, Mr. Selander served as a Member of the Advisory Board of other Fidelity® funds (2011), and Executive Vice Chairman (2010), Chief Executive Officer (2009-2010), and President and Chief Executive Officer (1997-2009) of Mastercard, Inc.
Cornelia M. Small (1944)
Year of Election or Appointment: 2005
Trustee
Ms. Small also serves as Trustee of other Fidelity® funds. Ms. Small is a member of the Board of Directors (2009-present) and Chair of the Investment Committee (2010-present) of the Teagle Foundation. Ms. Small also serves on the Investment Committee of the Berkshire Taconic Community Foundation (2008-present). Previously, Ms. Small served as Chairperson (2002-2008) and a member of the Investment Committee and Chairperson (2008-2012) and a member of the Board of Trustees of Smith College. In addition, Ms. Small served as Chief Investment Officer, Director of Global Equity Investments, and a member of the Board of Directors of Scudder, Stevens & Clark and Scudder Kemper Investments.
William S. Stavropoulos (1939)
Year of Election or Appointment: 2002
Trustee
Vice Chairman of the Independent Trustees
Mr. Stavropoulos also serves as Trustee of other Fidelity® funds. Mr. Stavropoulos serves as President and Founder of the Michigan Baseball Foundation, the Great Lakes Loons (2007-present). Mr. Stavropoulos is Chairman Emeritus of the Board of Directors of The Dow Chemical Company, where he previously served in numerous senior management positions, including President, CEO (1995-2000; 2002-2004), Chairman of the Executive Committee (2000-2006), and as a member of the Board of Directors (1990-2006). Currently, Mr. Stavropoulos is Chairman of the Board of Directors of Univar Inc. (global distributor of commodity and specialty chemicals), a Director of Teradata Corporation (data warehousing and technology solutions), and Maersk Inc. (industrial conglomerate), and a member of the Advisory Board for Metalmark Capital LLC (private equity investment, 2005-present). Mr. Stavropoulos is an operating advisor to Clayton, Dubilier & Rice, LLC (private equity investment). In addition, Mr. Stavropoulos is a member of the University of Notre Dame Advisory Council for the College of Science, a Trustee of the Rollin L. Gerstacker Foundation, and a Director of the Naples Philharmonic Center for the Arts. Previously, Mr. Stavropoulos served as a Director of Chemical Financial Corporation (bank holding company, 1993-2012) and Tyco International, Ltd. (multinational manufacturing and services, 2007-2012).
David M. Thomas (1949)
Year of Election or Appointment: 2008
Trustee
Mr. Thomas also serves as Trustee of other Fidelity® funds. Mr. Thomas serves as Non-Executive Chairman of the Board of Directors of Fortune Brands Home and Security (home and security products, 2011-present), as a member of the Board of Directors (2004-present) and Presiding Director (2013-present) of Interpublic Group of Companies, Inc. (marketing communication), and as a member of the Board of Trustees of the University of Florida (2013-present). Previously, Mr. Thomas served as Executive Chairman (2005-2006) and Chairman and Chief Executive Officer (2000-2005) of IMS Health, Inc. (pharmaceutical and healthcare information solutions), and a Director of Fortune Brands, Inc. (consumer products, 2000-2011).
+ The information includes the Trustee's principal occupation during the last five years and other information relating to the experience, attributes, and skills relevant to the Trustee's qualifications to serve as a Trustee, which led to the conclusion that the Trustee should serve as a Trustee for the fund.
Advisory Board Members and Officers:
Correspondence intended for an officer or Peter S. Lynch may be sent to Fidelity Investments, 245 Summer Street, Boston, Massachusetts 02210. Officers appear below in alphabetical order.
Name, Year of Birth; Principal Occupation
Peter S. Lynch (1944)
Year of Election or Appointment: 2003
Member of the Advisory Board
Mr. Lynch also serves as Member of the Advisory Board of other Fidelity® funds. Mr. Lynch is Vice Chairman and a Director of FMR (investment adviser firm) and FMR Co., Inc. (investment adviser firm). In addition, Mr. Lynch serves as a Trustee of Boston College and as the Chairman of the Inner-City Scholarship Fund. Previously, Mr. Lynch served on the Special Olympics International Board of Directors (1997-2006).
Elizabeth Paige Baumann (1968)
Year of Election or Appointment: 2012
Anti-Money Laundering (AML) Officer
Ms. Baumann also serves as AML Officer of other funds. She is Chief AML Officer of FMR LLC (diversified financial services company, 2012-present) and is an employee of Fidelity Investments. Previously, Ms. Baumann served as Vice President and Deputy Anti-Money Laundering Officer (2007-2012).
Marc R. Bryant (1966)
Year of Election or Appointment: 2015
Secretary and Chief Legal Officer (CLO)
Mr. Bryant also serves as Secretary and CLO of other funds. Mr. Bryant serves as CLO, Secretary, and Senior Vice President of Fidelity Management & Research Company (investment adviser firm, 2015-present) and FMR Co., Inc. (investment adviser firm, 2015-present); Secretary of Fidelity SelectCo, LLC (investment adviser firm, 2015-present) and Fidelity Investments Money Management, Inc. (investment adviser firm, 2015-present); and CLO of Fidelity Management & Research (Hong Kong) Limited (investment adviser firm, 2015-present). He is Senior Vice President and Deputy General Counsel of FMR LLC (diversified financial services company). Previously, Mr. Bryant served as Secretary and CLO of Fidelity Rutland Square Trust II (2010-2014) and Assistant Secretary of Fidelity's Fixed Income and Asset Allocation Funds (2013-2015). Prior to joining Fidelity Investments, Mr. Bryant served as a Senior Vice President and the Head of Global Retail Legal for AllianceBernstein L.P. (2006-2010), and as the General Counsel for ProFund Advisors LLC (2001-2006).
William C. Coffey (1969)
Year of Election or Appointment: 2009
Assistant Secretary
Mr. Coffey also serves as Assistant Secretary of other funds. He is Senior Vice President and Deputy General Counsel of FMR LLC (diversified financial services company, 2010-present), and is an employee of Fidelity Investments. Previously, Mr. Coffey served as Vice President and Associate General Counsel of FMR LLC (2005-2009).
Jonathan Davis (1968)
Year of Election or Appointment: 2010
Assistant Treasurer
Mr. Davis also serves as Assistant Treasurer of other funds, and is an employee of Fidelity Investments. Previously, Mr. Davis served as Vice President and Associate General Counsel of FMR LLC (diversified financial services company, 2003-2010).
Adrien E. Deberghes (1967)
Year of Election or Appointment: 2008
Deputy Treasurer
Mr. Deberghes also serves as an officer of other funds. He is an employee of Fidelity Investments (2008-present). Prior to joining Fidelity Investments, Mr. Deberghes was Senior Vice President of Mutual Fund Administration at State Street Corporation (2007-2008), Senior Director of Mutual Fund Administration at Investors Bank & Trust (2005-2007), and Director of Finance for Dunkin' Brands (2000-2005).
Stephanie J. Dorsey (1969)
Year of Election or Appointment: 2010
Assistant Treasurer
Ms. Dorsey also serves as an officer of other funds. She is an employee of Fidelity Investments (2008-present) and has served in other fund officer roles. Prior to joining Fidelity Investments, Ms. Dorsey served as Treasurer (2004-2008) of the JPMorgan Mutual Funds and Vice President (2004-2008) of JPMorgan Chase Bank.
Howard J. Galligan III (1966)
Year of Election or Appointment: 2014
Chief Financial Officer
Mr. Galligan also serves as Chief Financial Officer of other funds. Mr. Galligan serves as President of Fidelity Pricing and Cash Management Services (FPCMS) (2014-present) and as a Director of Strategic Advisers, Inc. (investment adviser firm, 2008-present). Previously, Mr. Galligan served as Chief Administrative Officer of Asset Management (2011-2014) and Chief Operating Officer and Senior Vice President of Investment Support for Strategic Advisers, Inc. (2003-2011).
Scott C. Goebel (1968)
Year of Election or Appointment: 2015
Vice President
Mr. Goebel serves as Vice President of other funds and is an employee of Fidelity Investments (2001-present). Previously, Mr. Goebel served as Secretary of Fidelity SelectCo, LLC (investment adviser firm, 2013-2015), Fidelity Investments Money Management, Inc. (FIMM) (investment adviser firm, 2010-2015), and Fidelity Research and Analysis Company (FRAC) (investment adviser firm, 2010-2015); General Counsel, Secretary, and Senior Vice President of Fidelity Management & Research Company (investment adviser firm, 2008-2015) and FMR Co., Inc. (investment adviser firm, 2008-2015); Assistant Secretary of Fidelity Management & Research (Japan) Limited (investment adviser firm, 2008-2015) and FMR Investment Management (U.K.) Limited (investment adviser firm, 2008-2015); Chief Legal Officer (CLO) of Fidelity Management & Research (Hong Kong) Limited (investment adviser firm, 2008-2015); Secretary and CLO of certain Fidelity® funds (2008-2015); Assistant Secretary of FIMM (2008-2010), FRAC (2008-2010), and certain funds (2007-2008); and as Vice President and Secretary of Fidelity Distributors Corporation (FDC) (2005-2007).
Thomas C. Hense (1964)
Year of Election or Appointment: 2008, 2010, or 2015
Vice President
Mr. Hense serves as Vice President of Fidelity Advisor® Multi-Asset Income Fund (2015) and other funds (High Income (2008), Small Cap (2008), and Value (2010) funds), and is an employee of Fidelity Investments (1993-present). Previously, Mr. Hense served as a portfolio manager for Fidelity's Institutional Money Management Group (Pyramis) (2003-2008).
Brian B. Hogan (1964)
Year of Election or Appointment: 2009
Vice President
Mr. Hogan also serves as Trustee or Vice President of other funds. Mr. Hogan serves as a Director of Fidelity SelectCo, LLC (investment adviser firm, 2014-present) and President of the Equity Division of FMR (investment adviser firm, 2009-present). Previously, Mr. Hogan served as Senior Vice President, Equity Research of FMR (2006-2009) and as a portfolio manager.
Chris Maher (1972)
Year of Election or Appointment: 2013
Assistant Treasurer
Mr. Maher serves as Assistant Treasurer of other funds. Mr. Maher is Vice President of Valuation Oversight and is an employee of Fidelity Investments. Previously, Mr. Maher served as Vice President of Asset Management Compliance (2013), Vice President of the Program Management Group of FMR (investment adviser firm, 2010-2013), and Vice President of Valuation Oversight (2008-2010).
Kenneth B. Robins (1969)
Year of Election or Appointment: 2008
President and Treasurer
Mr. Robins also serves as an officer of other funds. Mr. Robins serves as Executive Vice President of Fidelity Investments Money Management, Inc. (FIMM) (investment adviser firm, 2013-present) and is an employee of Fidelity Investments (2004-present). Previously, Mr. Robins served in other fund officer roles.
Stacie M. Smith (1974)
Year of Election or Appointment: 2013
Deputy Treasurer
Ms. Smith also serves as an officer of other funds. She is an employee of Fidelity Investments (2009-present) and has served in other fund officer roles. Prior to joining Fidelity Investments, Ms. Smith served as Senior Audit Manager of Ernst & Young LLP (1996-2009).
Renee Stagnone (1975)
Year of Election or Appointment: 2013
Deputy Treasurer
Ms. Stagnone also serves as Deputy Treasurer of other funds. Ms. Stagnone is an employee of Fidelity Investments (1997-present).
Linda J. Wondrack (1964)
Year of Election or Appointment: 2014
Chief Compliance Officer
Ms. Wondrack also serves as Chief Compliance Officer of other funds. Ms. Wondrack is Executive Vice President and head of the Ethics Office and Asset Management Compliance for Fidelity Investments (2012-present). Ms. Wondrack also serves as Chief Compliance Officer of Fidelity SelectCo, LLC (investment adviser firm, 2014-present); Chief Compliance Officer of Impresa Management LLC (2013-present); and Chief Compliance Officer of FMR Co., Inc. (investment adviser firm), Fidelity Investments Money Management, Inc. (investment adviser firm), Fidelity Management & Research (Japan) Limited (investment adviser firm), FMR Investment Management (U.K.) Limited (investment adviser firm), Fidelity Management & Research (Hong Kong) (investment adviser firm), Fidelity Management & Research Company (investment adviser firm), FIAM LLC (investment adviser firm), and Strategic Advisers, Inc. (investment adviser firm), Ballyrock Investment Advisors LLC, and Northern Neck Investors LLC (2012-present). Previously, Ms. Wondrack served as Senior Vice President and Chief Compliance Officer for Columbia Management Investment Advisers, LLC (2005-2012); Chief Compliance Officer for certain funds within the Columbia Family of Funds (2007-2012); and Senior Vice President of Compliance Risk Management at Bank of America (2005-2010).
Joseph F. Zambello (1957)
Year of Election or Appointment: 2011
Deputy Treasurer
Mr. Zambello also serves as Deputy Treasurer of other funds. Mr. Zambello is an employee of Fidelity Investments (1991-present). Previously, Mr. Zambello served as Vice President of the Program Management Group of FMR (investment adviser firm, 2009-2011) and Vice President of the Transfer Agent Oversight Group (2005-2009).
Shareholder Expense Example
As a shareholder of the Fund, you incur two types of costs: (1) transaction costs, including sales charges (loads) on purchase payments or redemption proceeds, and (2) ongoing costs, including management fees, distribution and/or service (12b-1) fees and other Fund expenses. This Example is intended to help you understand your ongoing costs (in dollars) of investing in the Fund and to compare these costs with the ongoing costs of investing in other mutual funds.
The Example is based on an investment of $1,000 invested at the beginning of the period and held for the entire period (June 1, 2015 to November 30, 2015).
Actual Expenses
The first line of the accompanying table for each class of the Fund provides information about actual account values and actual expenses. You may use the information in this line, together with the amount you invested, to estimate the expenses that you paid over the period. Simply divide your account value by $1,000.00 (for example, an $8,600 account value divided by $1,000.00 = 8.6), then multiply the result by the number in the first line for a class of the Fund under the heading entitled "Expenses Paid During Period" to estimate the expenses you paid on your account during this period. In addition, the Fund, as a shareholder in the underlying Fidelity Central Funds, will indirectly bear its pro-rata share of the fees and expenses incurred by the underlying Fidelity Central Funds. These fees and expenses are not included in the Fund's annualized expense ratio used to calculate the expense estimate in the table below.
Hypothetical Example for Comparison Purposes
The second line of the accompanying table for each class of the Fund provides information about hypothetical account values and hypothetical expenses based on a Class' actual expense ratio and an assumed rate of return of 5% per year before expenses, which is not the Class' actual return. The hypothetical account values and expenses may not be used to estimate the actual ending account balance or expenses you paid for the period. You may use this information to compare the ongoing costs of investing in the Fund and other funds. To do so, compare this 5% hypothetical example with the 5% hypothetical examples that appear in the shareholder reports of the other funds. In addition, the Fund, as a shareholder in the underlying Fidelity Central Funds, will indirectly bear its pro-rata share of the fees and expenses incurred by the underlying Fidelity Central Funds. These fees and expenses are not included in the Fund's annualized expense ratio used to calculate the expense estimate in the table below.
Please note that the expenses shown in the table are meant to highlight your ongoing costs only and do not reflect any transaction costs. Therefore, the second line of the table is useful in comparing ongoing costs only, and will not help you determine the relative total costs of owning different funds. In addition, if these transactional costs were included, your costs would have been higher.
| Annualized Expense Ratio-A | Beginning Account Value June 1, 2015 | Ending Account Value November 30, 2015 | Expenses Paid During Period-B June 1, 2015 to November 30, 2015 | |
| Class A | 1.00% | |||
| Actual | $1,000.00 | $971.40 | $4.94 | |
| Hypothetical-C | $1,000.00 | $1,020.05 | $5.06 | |
| Class T | 1.24% | |||
| Actual | $1,000.00 | $970.20 | $6.12 | |
| Hypothetical-C | $1,000.00 | $1,018.85 | $6.28 | |
| Class B | 1.84% | |||
| Actual | $1,000.00 | $967.40 | $9.07 | |
| Hypothetical-C | $1,000.00 | $1,015.84 | $9.30 | |
| Class C | 1.76% | |||
| Actual | $1,000.00 | $967.80 | $8.68 | |
| Hypothetical-C | $1,000.00 | $1,016.24 | $8.90 | |
| Class I | .76% | |||
| Actual | $1,000.00 | $972.60 | $3.76 | |
| Hypothetical-C | $1,000.00 | $1,021.26 | $3.85 | |
| Class Z | .60% | |||
| Actual | $1,000.00 | $973.50 | $2.97 | |
| Hypothetical-C | $1,000.00 | $1,022.06 | $3.04 |
A Annualized expense ratio reflects expenses net of applicable fee waivers.
B Expenses are equal to each Class' annualized expense ratio, multiplied by the average account value over the period, multiplied by 183/365 (to reflect the one-half year period).
C 5% return per year before expenses
Distributions (Unaudited)
The Board of Trustees of Advisor Dividend Growth Fund voted to pay to shareholders of record at the opening of business on record date, the following distributions per share derived from capital gains realized from sales of portfolio securities, and dividends derived from net investment income:
| Pay Date | Record Date | Dividends | Capital Gains | |
| Class A | 12/14/15 | 12/11/15 | $0.183 | $0.941 |
| Class T | 12/14/15 | 12/11/15 | $0.138 | $0.941 |
| Class B | 12/14/15 | 12/11/15 | $0.000 | $0.941 |
| Class C | 12/14/15 | 01/09/15 | $0.056 | $0.941 |
The fund hereby designates as a capital gain dividend with respect to the taxable year ended November 30, 2015, $63,036,073, or, if subsequently determined to be different, the net capital gain of such year.
Class A designates 60%; Class T designates 66%; Class B designates 100%; and Class C designates 84%; of the dividends distributed during the fiscal year as qualifying for the dividends–received deduction for corporate shareholders.
Class A designates 79%; Class T designates 87%; Class B designates 100%; and Class C designates 100%; of the dividends distributed during the fiscal year as amounts which may be taken into account as a dividend for purposes of the maximum rate under section 1(h)(11) of the Internal Revenue Code.
The fund will notify shareholders in January 2016 of amounts for use in preparing 2015 income tax returns.
Board Approval of Investment Advisory Contracts and Management Fees
Fidelity Advisor Dividend Growth Fund
Each year, the Board of Trustees, including the Independent Trustees (together, the Board), votes on the renewal of the management contract with Fidelity Management & Research Company (FMR) and the sub-advisory agreements (together, the Advisory Contracts) for the fund. The Board, assisted by the advice of fund counsel and Independent Trustees' counsel, requests and considers a broad range of information relevant to the renewal of the Advisory Contracts throughout the year.
The Board meets regularly and, at each of its meetings, covers an extensive agenda of topics and materials and considers factors that are relevant to its annual consideration of the renewal of the fund's Advisory Contracts, including the services and support provided to the fund and its shareholders. The Board has established various standing committees (Committees), each composed of and chaired by Independent Trustees with varying backgrounds, to which the Board has assigned specific subject matter responsibilities in order to enhance effective decision-making by the Board. The Board, acting directly and through its Committees, requests and receives information concerning the annual consideration of the renewal of the fund's Advisory Contracts. The Board also meets as needed to consider matters specifically related to the Board's annual consideration of the renewal of the Advisory Contracts. Members of the Board may also meet with trustees of other Fidelity funds through ad hoc joint committees to discuss certain matters relevant to all of the Fidelity funds.
At its July 2015 meeting, the Board unanimously determined to renew the fund's Advisory Contracts. In reaching its determination, the Board considered all factors it believed relevant, including (i) the nature, extent, and quality of the services to be provided to the fund and its shareholders (including the investment performance of the fund); (ii) the competitiveness of the fund's management fee and total expense ratio relative to peer funds; (iii) the total costs of the services to be provided by and the profits to be realized by Fidelity from its relationship with the fund; and (iv) the extent to which (if any) economies of scale exist and would be realized as the fund grows, and whether any economies of scale are appropriately shared with fund shareholders.
In considering whether to renew the Advisory Contracts for the fund, the Board reached a determination, with the assistance of fund counsel and Independent Trustees' counsel and through the exercise of its business judgment, that the renewal of the Advisory Contracts was in the best interests of the fund and its shareholders and that the compensation payable under the Advisory Contracts was fair and reasonable. The Board's decision to renew the Advisory Contracts was not based on any single factor, but rather was based on a comprehensive consideration of all the information provided to the Board at its meetings throughout the year. The Board, in reaching its determination to renew the Advisory Contracts, was aware that shareholders of the fund have a broad range of investment choices available to them, including a wide choice among funds offered by Fidelity's competitors, and that the fund's shareholders, who have the opportunity to review and weigh the disclosure provided by the fund in its prospectus and other public disclosures, have chosen to invest in this fund, which is part of the Fidelity family of funds.
Nature, Extent, and Quality of Services Provided. The Board considered Fidelity's staffing as it relates to the fund, including the backgrounds of investment personnel of Fidelity, and also considered the fund's investment objective, strategies, and related investment philosophy. The Independent Trustees also had discussions with senior management of Fidelity's investment operations and investment groups. The Board considered the structure of the portfolio manager compensation program and whether this structure provides appropriate incentives to act in the best interests of the fund. Additionally, the Board considered the portfolio managers' investments, if any, in the funds that they manage.Resources Dedicated to Investment Management and Support Services. The Board and the Fund Oversight and Research Committees reviewed the general qualifications and capabilities of Fidelity's investment staff, including its size, education, experience, and resources, as well as Fidelity's approach to recruiting, training, managing, and compensating investment personnel. The Board noted that Fidelity has continued to increase the resources devoted to non-U.S. offices, including expansion of Fidelity's global investment organization. The Board also noted that Fidelity's analysts have extensive resources, tools and capabilities that allow them to conduct sophisticated quantitative and fundamental analysis, as well as credit analysis of issuers, counterparties and guarantors. Further, the Board considered that Fidelity's investment professionals have sufficient access to global information and data so as to provide competitive investment results over time, and that those professionals also have access to sophisticated tools that permit them to assess portfolio construction and risk and performance attribution characteristics continuously, as well as to transmit new information and research conclusions rapidly around the world. Additionally, in its deliberations, the Board considered Fidelity's trading, risk management, and compliance capabilities and resources, which are integral parts of the investment management process.Shareholder and Administrative Services. The Board considered (i) the nature, extent, quality, and cost of advisory, administrative, and shareholder services performed by FMR, the sub-advisers (together with FMR, the Investment Advisers), and their affiliates under the Advisory Contracts and under separate agreements covering transfer agency, pricing and bookkeeping, and securities lending services for the fund; (ii) the nature and extent of the supervision of third party service providers, principally custodians and subcustodians; and (iii) the resources devoted to, and the record of compliance with, the fund's compliance policies and procedures. The Board also reviewed the allocation of fund brokerage, including allocations to brokers affiliated with the Investment Advisers, the use of brokerage commissions to pay fund expenses, and the use of "soft" commission dollars to pay for research services.The Board noted that the growth of fund assets over time across the complex allows Fidelity to reinvest in the development of services designed to enhance the value or convenience of the Fidelity funds as investment vehicles. These services include 24-hour access to account information and market information through telephone representatives and over the Internet, investor education materials and asset allocation tools, and the expanded availability of Fidelity Investor Centers.In 2014, the Board formed an ad hoc Committee on Transfer Agency Fees to review the variety of transfer agency fee structures throughout the industry and Fidelity's competitive positioning with respect to industry participants.Investment in a Large Fund Family. The Board considered the benefits to shareholders of investing in a Fidelity fund, including the benefits of investing in a fund that is part of a large family of funds offering a variety of investment disciplines and providing a large variety of mutual fund investor services. The Board noted that Fidelity had taken, or had made recommendations that resulted in the Fidelity funds taking, a number of actions over the previous year that benefited particular funds, including (i) continuing to dedicate additional resources to investment research and to the support of the senior management team that oversees asset management; (ii) continuing efforts to enhance Fidelity's global research capabilities; (iii) launching new funds and making other enhancements to meet client needs; (iv) reducing management fees and total expenses for certain index funds and diversified international funds; (v) continuing to launch dedicated lower cost underlying funds to meet portfolio construction needs related to expanding underlying fund options for Fidelity funds of funds, specifically for the Freedom Fund product lines; (vi) rationalizing product lines and gaining increased efficiencies through fund mergers; (vii) launching active fixed-income exchange-traded funds; (viii) continuing to develop, acquire and implement systems and technology to improve services to the funds and information security and to increase efficiency; (ix) implementing investment enhancements to further strengthen Fidelity's target date product line to increase investors' probability of success in achieving their goals; (x) modifying the eligibility criteria for certain share classes to accommodate roll-over assets from employer-sponsored retirement plans; (xi) launching a new Class W of the Freedom Index Funds to attract and retain Fidelity record-kept retirement plan assets; and (xii) implementing changes to Fidelity's money market product line in response to recent money market regulatory reforms.Investment Performance. The Board considered whether the fund has operated in accordance with its investment objective, as well as its record of compliance with its investment restrictions and its performance history. The Board noted that there was a portfolio management change for the fund in January 2014.The Board took into account discussions with representatives of the Investment Advisers about fund investment performance that occur at Board meetings throughout the year. In this regard the Board noted that as part of regularly scheduled fund reviews and other reports to the Board on fund performance, the Board considers annualized return information for the fund, for different time periods, measured against a securities market index ("benchmark index") and a peer group of funds with similar objectives ("peer group"), if any. In its evaluation of fund investment performance, the Board gave particular attention to information indicating changes in performance of certain Fidelity funds for specific time periods and discussed with the Investment Advisers the reasons for any overperformance or underperformance.In addition to reviewing absolute and relative fund performance, the Independent Trustees periodically consider the appropriateness of fund performance metrics in evaluating the results achieved. In general, the Independent Trustees believe that fund performance should be evaluated based on net performance (after fees and expenses) of both the highest performing and lowest performing fund share classes, where applicable, compared to appropriate benchmark indices, over appropriate time periods that may include full market cycles, and compared to peer groups, as applicable, over the same periods, taking into account relevant factors including the following: general market conditions; issuer-specific information; and fund cash flows and other factors.The Independent Trustees recognize that shareholders evaluate performance on a net basis over their own holding periods, for which one-, three-, and five-year periods are often used as a proxy. For this reason, the performance information reviewed by the Board also included net cumulative calendar year total return information for the fund and an appropriate benchmark index and peer group for the most recent one-, three-, and five-year periods, as shown below. Returns are shown compared to the 25th percentile (top of box, 75% beaten) and 75th percentile (bottom of box, 25% beaten) of the peer universe.Fidelity Advisor Dividend Growth Fund
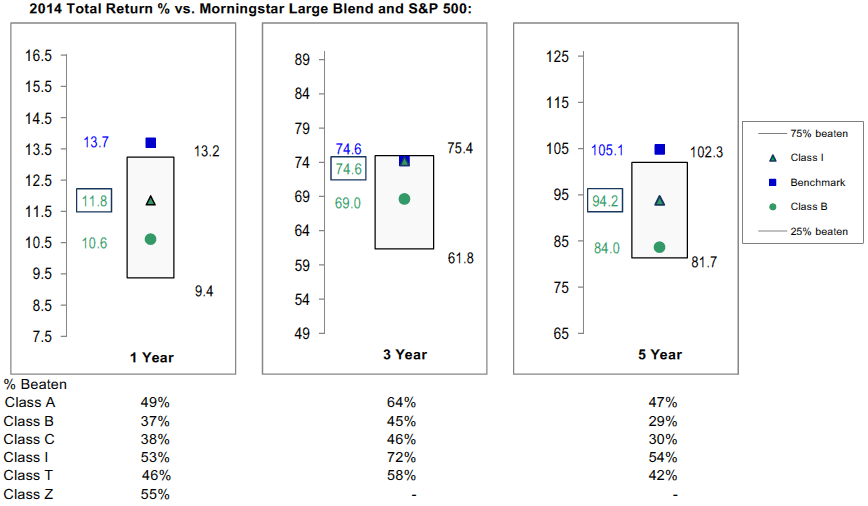
Fidelity Advisor Dividend Growth Fund
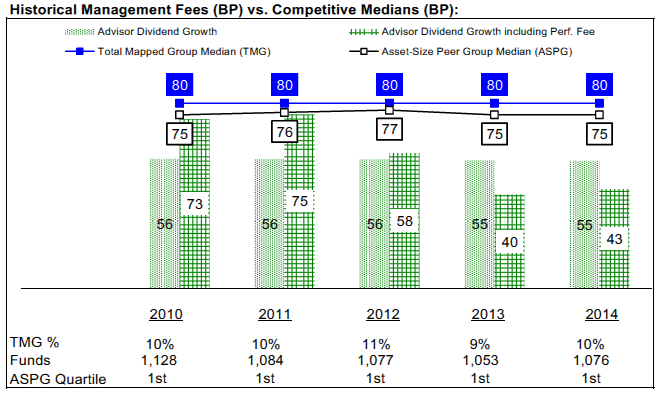
![]()
ADGF-ANN-0116
1.733548.116
Fidelity Advisor® Series Small Cap Fund Annual Report November 30, 2015 |
|
Contents
Board Approval of Investment Advisory Contracts and Management Fees |
To view a fund's proxy voting guidelines and proxy voting record for the 12-month period ended June 30, visit http://www.fidelity.com/proxyvotingresults or visit the Securities and Exchange Commission's (SEC) web site at http://www.sec.gov.
You may also call 1-877-208-0098 to request a free copy of the proxy voting guidelines.
Standard & Poor's, S&P and S&P 500 are registered service marks of The McGraw-Hill Companies, Inc. and have been licensed for use by Fidelity Distributors Corporation.
Other third-party marks appearing herein are the property of their respective owners.
All other marks appearing herein are registered or unregistered trademarks or service marks of FMR LLC or an affiliated company. © 2016 FMR LLC. All rights reserved.
This report and the financial statements contained herein are submitted for the general information of the shareholders of the Fund. This report is not authorized for distribution to prospective investors in the Fund unless preceded or accompanied by an effective prospectus.
A fund files its complete schedule of portfolio holdings with the SEC for the first and third quarters of each fiscal year on Form N-Q. Forms N-Q are available on the SEC’s web site at http://www.sec.gov. A fund's Forms N-Q may be reviewed and copied at the SEC’s Public Reference Room in Washington, DC. Information regarding the operation of the SEC's Public Reference Room may be obtained by calling 1-800-SEC-0330.
For a complete list of a fund's portfolio holdings, view the most recent holdings listing, semiannual report, or annual report on Fidelity's web site at http://www.fidelity.com, http://www.advisor.fidelity.com, or http://www.401k.com, as applicable.
NOT FDIC INSURED •MAY LOSE VALUE •NO BANK GUARANTEE
Neither the Fund nor Fidelity Distributors Corporation is a bank.
Performance: The Bottom Line
Average annual total return reflects the change in the value of an investment, assuming reinvestment of distributions from dividend income and capital gains (the profits earned upon the sale of securities that have grown in value, if any) and assuming a constant rate of performance each year. The hypothetical investment and the average annual total returns do not reflect the deduction of taxes that a shareholder would pay on fund distributions or the redemption of fund shares. During periods of reimbursement by Fidelity, a fund’s total return will be greater than it would be had the reimbursement not occurred. How a fund did yesterday is no guarantee of how it will do tomorrow.
Average Annual Total Returns
| For the periods ended November 30, 2015 | Past 1 year | Life of fundA |
| Fidelity Advisor® Series Small Cap Fund | 3.81% | 7.74% |
A From November 7, 2013
$10,000 Over Life of Fund
Let's say hypothetically that $10,000 was invested in Fidelity Advisor® Series Small Cap Fund on November 7, 2013, when the fund started.
The chart shows how the value of your investment would have changed, and also shows how the Russell 2000® Index performed over the same period.
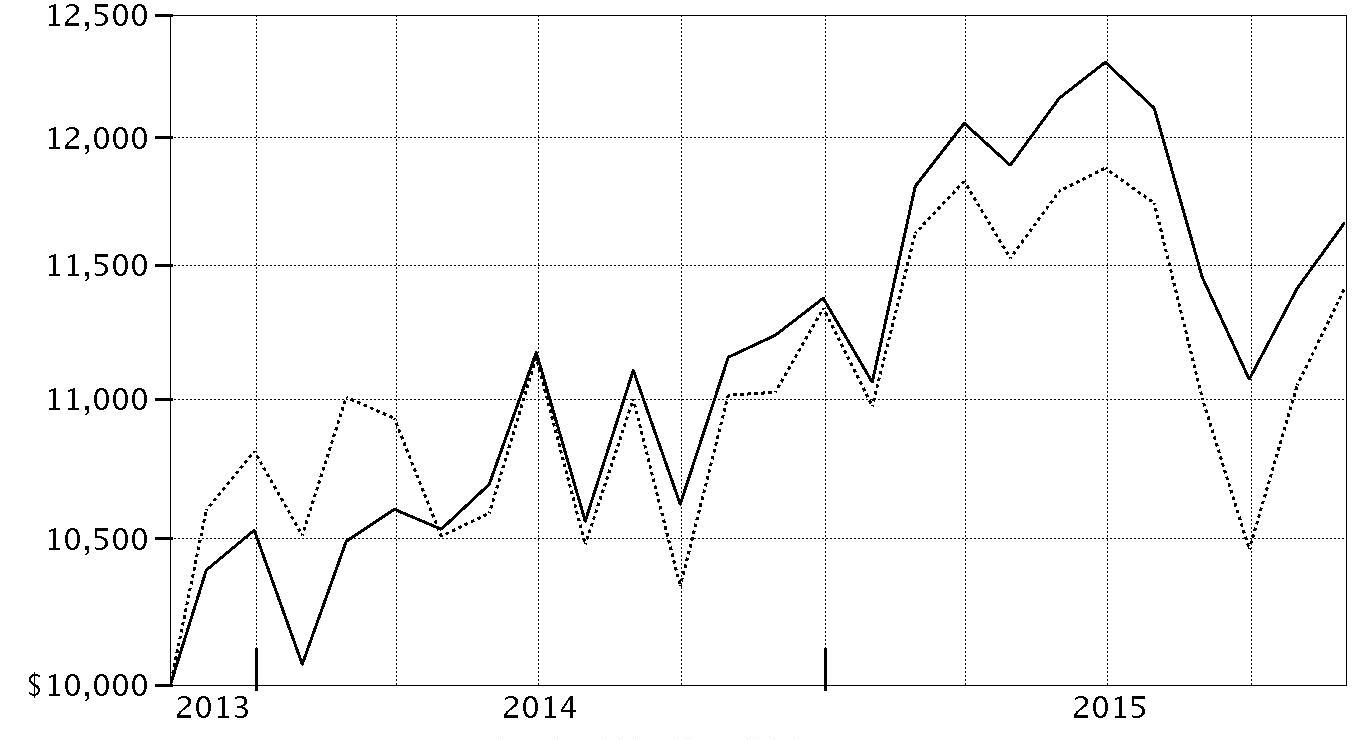
| Period Ending Values | ||
| $11,662 | Fidelity Advisor® Series Small Cap Fund | |
| $11,411 | Russell 2000® Index | |
Management's Discussion of Fund Performance
Market Recap: U.S. stocks gained modestly for the 12 months ending November 30, 2015, despite a steep decline in August and September on concern about slowing economic growth in China. The S&P 500® index rebounded in October and gained 2.75% for the year. Stocks benefited late in the period amid waning expectations for a near-term interest-rate hike by the U.S. Federal Reserve, more economic stimulus in Europe and an interest-rate cut in China. Growth stocks in the benchmark far outpaced their value counterparts, as investors continued to seek growth in a subpar economic environment. Sector performance varied widely, with more than 26 percentage points separating the leader from the laggard. Consumer discretionary (+14%) secured the top spot, benefiting from a combination of rising personal income and still-benign inflation. Information technology (+7%) and health care (+4%) also outpaced the broad market. Conversely, the energy sector (-12%) performed worst, stymied by depressed commodity prices that also hit materials (-5%). Telecommunication services (-5%) and utilities (-4%), considered defensive sectors less sensitive to the economy, also lost ground. At period end, investors remained focused on the potential global implications of a stronger U.S. dollar and how China’s transition toward a consumption-led economy may affect corporate earnings.Comments from Portfolio Manager James Harmon: For the year, the fund outperformed the benchmark Russell 2000® Index, which gained 3.51%. Relative to the benchmark, the fund benefited from strong security selection in the information technology, materials and consumer staples sectors. Global Payments, a provider of payment technology services, was a standout contributor. Also adding value were positions in Stamps.com, which allows businesses and consumers to print their own postage, and CDW, a technology products distributor. Although stock selection in the health care sector detracted, a position in AmSurg was an exception; this provider of outpatient surgical centers performed very well. The fund's foreign holdings contributed to performance, despite the strength of the U.S. dollar. In contrast, weak stock selection in consumer discretionary hurt results, especially a position in Fossil Group, a maker of watches and other fashion accessories. The company’s shares lost about two-thirds of their value this period, with much of the decline coming in November 2015 after the company issued a weak quarterly financial report. Other meaningful detractors were conference-call services provider West, and hospital operator Community Health Systems. Of the stocks mentioned, only Stamps.com, AmSurg and West were in the benchmark.The views expressed above reflect those of the portfolio manager(s) only through the end of the period as stated on the cover of this report and do not necessarily represent the views of Fidelity or any other person in the Fidelity organization. Any such views are subject to change at any time based upon market or other conditions and Fidelity disclaims any responsibility to update such views. These views may not be relied on as investment advice and, because investment decisions for a Fidelity fund are based on numerous factors, may not be relied on as an indication of trading intent on behalf of any Fidelity fund.
Investment Summary (Unaudited)
Top Ten Stocks as of November 30, 2015
| % of fund's net assets | % of fund's net assets 6 months ago | |
| CDW Corp. | 2.6 | 2.4 |
| Syntel, Inc. | 2.3 | 1.3 |
| Primerica, Inc. | 2.3 | 1.8 |
| West Corp. | 2.2 | 2.3 |
| SYNNEX Corp. | 2.2 | 1.4 |
| Global Payments, Inc. | 2.1 | 2.9 |
| The Ensign Group, Inc. | 2.0 | 1.8 |
| CNO Financial Group, Inc. | 1.9 | 1.3 |
| United Therapeutics Corp. | 1.9 | 2.1 |
| Zebra Technologies Corp. Class A | 1.8 | 1.8 |
| 21.3 |
Top Five Market Sectors as of November 30, 2015
| % of fund's net assets | % of fund's net assets 6 months ago | |
| Financials | 22.7 | 21.4 |
| Information Technology | 22.1 | 20.3 |
| Industrials | 16.8 | 14.6 |
| Health Care | 14.0 | 14.8 |
| Consumer Discretionary | 9.5 | 13.9 |
Asset Allocation (% of fund's net assets)
| As of November 30, 2015* | ||
| Stocks and Equity Futures | 98.8% | |
| Other Investments | 0.4% | |
| Short-Term Investments and Net Other Assets (Liabilities) | 0.8% | |

* Foreign investments - 13.3%
| As of May 31, 2015* | ||
| Stocks and Equity Futures | 98.8% | |
| Other Investments | 0.4% | |
| Short-Term Investments and Net Other Assets (Liabilities) | 0.8% | |

* Foreign investments - 11.7%
Investments November 30, 2015
Showing Percentage of Net Assets
| Common Stocks - 93.0% | |||
| Shares | Value | ||
| CONSUMER DISCRETIONARY - 9.5% | |||
| Auto Components - 0.1% | |||
| Horizon Global Corp. (a) | 49,179 | $427,366 | |
| Diversified Consumer Services - 1.1% | |||
| Meiko Network Japan Co. Ltd. | 222,100 | 2,524,110 | |
| Tsukada Global Holdings, Inc. | 392,500 | 2,604,976 | |
| 5,129,086 | |||
| Household Durables - 0.9% | |||
| Tupperware Brands Corp. (b) | 77,800 | 4,416,706 | |
| Leisure Products - 0.9% | |||
| Smith & Wesson Holding Corp. (a) | 245,894 | 4,509,696 | |
| Media - 0.2% | |||
| Crown Media Holdings, Inc. Class A (a) | 162,000 | 918,540 | |
| Specialty Retail - 5.7% | |||
| Aarons, Inc. Class A | 181,400 | 4,402,578 | |
| Hibbett Sports, Inc. (a)(b) | 138,200 | 4,534,342 | |
| Jumbo SA | 35,381 | 360,734 | |
| Office Depot, Inc. (a) | 1,136,120 | 7,487,031 | |
| Sally Beauty Holdings, Inc. (a) | 176,900 | 4,574,634 | |
| Select Comfort Corp. (a) | 238,900 | 5,642,818 | |
| Staples, Inc. | 70,200 | 847,314 | |
| 27,849,451 | |||
| Textiles, Apparel & Luxury Goods - 0.6% | |||
| Fossil Group, Inc. (a)(b) | 70,700 | 2,719,829 | |
| TOTAL CONSUMER DISCRETIONARY | 45,970,674 | ||
| CONSUMER STAPLES - 2.8% | |||
| Food & Staples Retailing - 2.8% | |||
| Ain Holdings, Inc. | 20,700 | 973,623 | |
| Sundrug Co. Ltd. | 66,000 | 4,251,665 | |
| Tsuruha Holdings, Inc. | 68,800 | 6,147,847 | |
| United Natural Foods, Inc. (a) | 47,700 | 2,094,507 | |
| 13,467,642 | |||
| ENERGY - 2.2% | |||
| Energy Equipment & Services - 0.0% | |||
| Cathedral Energy Services Ltd. | 479,300 | 208,165 | |
| Oil, Gas & Consumable Fuels - 2.2% | |||
| Delek Logistics Partners LP | 68,900 | 2,515,539 | |
| World Fuel Services Corp. | 186,225 | 8,117,548 | |
| 10,633,087 | |||
| TOTAL ENERGY | 10,841,252 | ||
| FINANCIALS - 22.3% | |||
| Banks - 6.3% | |||
| Allegiance Bancshares, Inc. (a) | 20,200 | 494,294 | |
| Bank of the Ozarks, Inc. | 86,000 | 4,668,080 | |
| ConnectOne Bancorp, Inc. | 271,300 | 5,293,063 | |
| First NBC Bank Holding Co. (a) | 178,600 | 7,561,924 | |
| German American Bancorp, Inc. | 5,584 | 192,536 | |
| Investors Bancorp, Inc. | 565,999 | 7,256,107 | |
| Wilshire Bancorp, Inc. | 414,900 | 5,119,866 | |
| 30,585,870 | |||
| Consumer Finance - 2.1% | |||
| Credit Acceptance Corp. (a) | 1,001 | 200,620 | |
| PRA Group, Inc. (a)(b) | 140,200 | 5,791,662 | |
| SLM Corp. (a) | 595,500 | 4,022,603 | |
| 10,014,885 | |||
| Insurance - 8.4% | |||
| CNO Financial Group, Inc. | 463,800 | 9,382,674 | |
| Enstar Group Ltd. (a) | 26,000 | 4,006,860 | |
| Hanover Insurance Group, Inc. | 37,700 | 3,189,420 | |
| James River Group Holdings Ltd. | 104,100 | 3,341,610 | |
| National Western Life Group, Inc. | 3,300 | 868,725 | |
| Primerica, Inc. | 217,359 | 11,137,475 | |
| Reinsurance Group of America, Inc. | 93,800 | 8,618,344 | |
| 40,545,108 | |||
| Real Estate Investment Trusts - 2.6% | |||
| EPR Properties | 57,100 | 3,199,884 | |
| MFA Financial, Inc. | 689,800 | 4,814,804 | |
| VEREIT, Inc. | 542,000 | 4,514,860 | |
| 12,529,548 | |||
| Real Estate Management & Development - 0.5% | |||
| Relo Holdings Corp. | 22,600 | 2,447,262 | |
| Thrifts & Mortgage Finance - 2.4% | |||
| BofI Holding, Inc. (a)(b) | 429,200 | 8,596,876 | |
| Meridian Bancorp, Inc. | 173,610 | 2,545,123 | |
| Oritani Financial Corp. | 31,900 | 553,146 | |
| 11,695,145 | |||
| TOTAL FINANCIALS | 107,817,818 | ||
| HEALTH CARE - 14.0% | |||
| Biotechnology - 1.9% | |||
| United Therapeutics Corp. (a) | 59,700 | 9,112,011 | |
| Health Care Equipment & Supplies - 0.8% | |||
| Fukuda Denshi Co. Ltd. | 20,200 | 1,074,817 | |
| The Cooper Companies, Inc. | 20,800 | 3,042,000 | |
| 4,116,817 | |||
| Health Care Providers & Services - 9.2% | |||
| Aceto Corp. | 212,200 | 5,986,162 | |
| AmSurg Corp. (a) | 59,900 | 5,035,194 | |
| Community Health Systems, Inc. (a) | 266,300 | 7,706,722 | |
| HealthSouth Corp. | 131,500 | 4,627,485 | |
| MEDNAX, Inc. (a) | 51,920 | 3,705,530 | |
| Message Co. Ltd. | 73,700 | 1,735,632 | |
| Providence Service Corp. (a) | 106,100 | 5,137,362 | |
| Ryman Healthcare Group Ltd. | 145,526 | 751,971 | |
| Sigma Pharmaceuticals Ltd. | 485,087 | 305,209 | |
| The Ensign Group, Inc. | 204,800 | 9,742,336 | |
| 44,733,603 | |||
| Life Sciences Tools & Services - 0.7% | |||
| VWR Corp. (a) | 125,500 | 3,348,340 | |
| Pharmaceuticals - 1.4% | |||
| Jazz Pharmaceuticals PLC (a) | 25,800 | 3,782,022 | |
| Sawai Pharmaceutical Co. Ltd. | 48,500 | 2,781,560 | |
| 6,563,582 | |||
| TOTAL HEALTH CARE | 67,874,353 | ||
| INDUSTRIALS - 16.8% | |||
| Aerospace & Defense - 3.5% | |||
| BWX Technologies, Inc. | 177,800 | 5,414,010 | |
| Engility Holdings, Inc. | 106,100 | 3,671,060 | |
| Moog, Inc. Class A (a) | 70,700 | 4,671,149 | |
| Teledyne Technologies, Inc. (a) | 34,600 | 3,200,846 | |
| 16,957,065 | |||
| Commercial Services & Supplies - 6.0% | |||
| Coor Service Management Holding AB (a) | 207,400 | 808,503 | |
| Deluxe Corp. | 139,900 | 8,205,135 | |
| Mitie Group PLC | 906,100 | 4,354,685 | |
| UniFirst Corp. | 44,200 | 4,799,236 | |
| West Corp. | 419,100 | 10,687,050 | |
| 28,854,609 | |||
| Electrical Equipment - 1.3% | |||
| EnerSys | 106,700 | 6,284,630 | |
| Machinery - 4.5% | |||
| Federal Signal Corp. | 318,400 | 5,368,224 | |
| Hy-Lok Corp. | 120,411 | 2,615,870 | |
| Standex International Corp. | 93,900 | 8,391,843 | |
| TriMas Corp. (a) | 237,200 | 5,130,636 | |
| 21,506,573 | |||
| Marine - 0.3% | |||
| SITC International Holdings Co. Ltd. | 3,074,000 | 1,554,157 | |
| Professional Services - 0.7% | |||
| Benefit One, Inc. | 190,800 | 3,599,006 | |
| Transportation Infrastructure - 0.5% | |||
| Wesco Aircraft Holdings, Inc. (a) | 172,000 | 2,301,360 | |
| TOTAL INDUSTRIALS | 81,057,400 | ||
| INFORMATION TECHNOLOGY - 22.1% | |||
| Electronic Equipment & Components - 8.8% | |||
| Belden, Inc. | 70,700 | 4,437,839 | |
| CDW Corp. | 290,500 | 12,540,885 | |
| Insight Enterprises, Inc. (a) | 233,200 | 6,245,096 | |
| SYNNEX Corp. | 111,612 | 10,521,663 | |
| Zebra Technologies Corp. Class A (a) | 110,300 | 8,846,060 | |
| 42,591,543 | |||
| Internet Software & Services - 1.2% | |||
| Stamps.com, Inc. (a) | 57,700 | 5,848,472 | |
| IT Services - 9.8% | |||
| Blackhawk Network Holdings, Inc. (a) | 152,300 | 7,211,405 | |
| Cardtronics, Inc. (a) | 172,800 | 6,499,008 | |
| EVERTEC, Inc. | 233,100 | 4,004,658 | |
| Global Payments, Inc. | 142,400 | 10,089,040 | |
| MoneyGram International, Inc. (a) | 316,296 | 2,777,079 | |
| Perficient, Inc. (a) | 137,600 | 2,405,248 | |
| Syntel, Inc. (a) | 230,800 | 11,177,644 | |
| WEX, Inc. (a) | 30,200 | 2,846,954 | |
| 47,011,036 | |||
| Software - 2.3% | |||
| NIIT Technologies Ltd. | 286,728 | 2,457,712 | |
| Sword Group | 82,661 | 2,065,484 | |
| Verint Systems, Inc. (a) | 105,800 | 4,956,730 | |
| Zensar Technologies Ltd. | 105,206 | 1,717,152 | |
| 11,197,078 | |||
| TOTAL INFORMATION TECHNOLOGY | 106,648,129 | ||
| MATERIALS - 2.8% | |||
| Chemicals - 2.1% | |||
| Innospec, Inc. | 32,800 | 1,915,520 | |
| PolyOne Corp. | 226,400 | 8,145,872 | |
| 10,061,392 | |||
| Paper & Forest Products - 0.7% | |||
| Neenah Paper, Inc. | 52,200 | 3,469,734 | |
| TOTAL MATERIALS | 13,531,126 | ||
| TELECOMMUNICATION SERVICES - 0.3% | |||
| Diversified Telecommunication Services - 0.2% | |||
| APT Satellite Holdings Ltd. | 509,250 | 431,520 | |
| Asia Satellite Telecommunications Holdings Ltd. | 129,500 | 187,065 | |
| Vocus Communications Ltd. | 126,918 | 663,621 | |
| 1,282,206 | |||
| Wireless Telecommunication Services - 0.1% | |||
| Cellcom Israel Ltd. (Israel) (a) | 32,400 | 230,977 | |
| Partner Communications Co. Ltd. (a) | 39,845 | 180,620 | |
| 411,597 | |||
| TOTAL TELECOMMUNICATION SERVICES | 1,693,803 | ||
| UTILITIES - 0.2% | |||
| Gas Utilities - 0.2% | |||
| Star Gas Partners LP | 100,800 | 778,176 | |
| TOTAL COMMON STOCKS | |||
| (Cost $409,440,630) | 449,680,373 | ||
| Principal Amount(c) | Value | ||
| U.S. Treasury Obligations - 0.3% | |||
| U.S. Treasury Bills, yield at date of purchase 0.09% to 0.13% 1/28/16 to 2/18/16 (d) | |||
| (Cost $1,619,663) | 1,620,000 | 1,619,670 | |
| Preferred Securities - 0.4% | |||
| FINANCIALS - 0.4% | |||
| Diversified Financial Services - 0.4% | |||
| Baggot Securities Ltd. 10.24%(e)(f) | EUR | ||
| (Cost $2,687,396) | $1,730,000 | $1,986,222 | |
| Shares | Value | ||
| Money Market Funds - 12.4% | |||
| Fidelity Cash Central Fund, 0.18% (g) | 35,396,065 | 35,396,065 | |
| Fidelity Securities Lending Cash Central Fund, 0.22% (g)(h) | 24,458,825 | 24,458,825 | |
| TOTAL MONEY MARKET FUNDS | |||
| (Cost $59,854,890) | 59,854,890 | ||
| TOTAL INVESTMENT PORTFOLIO - 106.1% | |||
| (Cost $473,602,579) | 513,141,155 | ||
| NET OTHER ASSETS (LIABILITIES) - (6.1)% | (29,574,918) | ||
| NET ASSETS - 100% | $483,566,237 |
| Futures Contracts | |||
| Expiration Date | Underlying Face Amount at Value | Unrealized Appreciation/(Depreciation) | |
| Purchased | |||
| Equity Index Contracts | |||
| 234 ICE Russell 2000 Index Contracts (United States) | Dec. 2015 | 27,984,060 | $850,703 |
The face value of futures purchased as a percentage of Net Assets is 5.8%
Currency Abbreviations
EUR – European Monetary Unit
Legend
(a) Non-income producing
(b) Security or a portion of the security is on loan at period end.
(c) Amount is stated in United States dollars unless otherwise noted.
(d) Security or a portion of the security was pledged to cover margin requirements for futures contracts. At period end, the value of securities pledged amounted to $1,619,670.
(e) Security exempt from registration under Rule 144A of the Securities Act of 1933. These securities may be resold in transactions exempt from registration, normally to qualified institutional buyers. At the end of the period, the value of these securities amounted to $1,986,222 or 0.4% of net assets.
(f) Security is perpetual in nature with no stated maturity date.
(g) Affiliated fund that is generally available only to investment companies and other accounts managed by Fidelity Investments. The rate quoted is the annualized seven-day yield of the fund at period end. A complete unaudited listing of the fund's holdings as of its most recent quarter end is available upon request. In addition, each Fidelity Central Fund's financial statements, which are not covered by the Fund's Report of Independent Registered Public Accounting Firm, are available on the SEC's website or upon request.
(h) Investment made with cash collateral received from securities on loan.
Affiliated Central Funds
Information regarding fiscal year to date income earned by the Fund from investments in Fidelity Central Funds is as follows:
| Fund | Income earned |
| Fidelity Cash Central Fund | $56,090 |
| Fidelity Securities Lending Cash Central Fund | 71,367 |
| Total | $127,457 |
Investment Valuation
The following is a summary of the inputs used, as of November 30, 2015, involving the Fund's assets and liabilities carried at fair value. The inputs or methodology used for valuing securities may not be an indication of the risk associated with investing in those securities. For more information on valuation inputs, and their aggregation into the levels used below, please refer to the Investment Valuation section in the accompanying Notes to Financial Statements.
| Valuation Inputs at Reporting Date: | ||||
| Description | Total | Level 1 | Level 2 | Level 3 |
| Investments in Securities: | ||||
| Equities: | ||||
| Consumer Discretionary | $45,970,674 | $45,970,674 | $-- | $-- |
| Consumer Staples | 13,467,642 | 13,467,642 | -- | -- |
| Energy | 10,841,252 | 10,841,252 | -- | -- |
| Financials | 107,817,818 | 107,817,818 | -- | -- |
| Health Care | 67,874,353 | 67,874,353 | -- | -- |
| Industrials | 81,057,400 | 81,057,400 | -- | -- |
| Information Technology | 106,648,129 | 106,648,129 | -- | -- |
| Materials�� | 13,531,126 | 13,531,126 | -- | -- |
| Telecommunication Services | 1,693,803 | 1,693,803 | -- | -- |
| Utilities | 778,176 | 778,176 | -- | -- |
| U.S. Government and Government Agency Obligations | 1,619,670 | -- | 1,619,670 | -- |
| Preferred Securities | 1,986,222 | -- | 1,986,222 | -- |
| Money Market Funds | 59,854,890 | 59,854,890 | -- | -- |
| Total Investments in Securities: | $513,141,155 | $509,535,263 | $3,605,892 | $-- |
| Derivative Instruments: | ||||
| Assets | ||||
| Futures Contracts | $850,703 | $850,703 | $-- | $-- |
| Total Assets | $850,703 | $850,703 | $-- | $-- |
| Total Derivative Instruments: | $850,703 | $850,703 | $-- | $-- |
Value of Derivative Instruments
The following table is a summary of the Fund's value of derivative instruments by primary risk exposure as of November 30, 2015. For additional information on derivative instruments, please refer to the Derivative Instruments section in the accompanying Notes to Financial Statements.
| Primary Risk Exposure / Derivative Type | Value | |
| Asset | Liability | |
| Equity Risk | ||
| Futures Contracts(a) | $850,703 | $0 |
| Total Equity Risk | 850,703 | 0 |
| Total Value of Derivatives | $850,703 | $0 |
(a) Reflects gross cumulative appreciation (depreciation) on futures contracts as presented in the Schedule of Investments. Only the period end receivable or payable for daily variation margin and net unrealized appreciation (depreciation) are presented in the Statement of Assets and Liabilities.
Other Information
Distribution of investments by country or territory of incorporation, as a percentage of Total Net Assets, is as follows (Unaudited):
| United States of America | 86.7% |
| Japan | 5.9% |
| Bermuda | 1.6% |
| Ireland | 1.2% |
| Others (Individually Less Than 1%) | 4.6% |
| 100.0% |
See accompanying notes which are an integral part of the financial statements.
Financial Statements
Statement of Assets and Liabilities
| November 30, 2015 | ||
| Assets | ||
| Investment in securities, at value (including securities loaned of $23,585,575) — See accompanying schedule: Unaffiliated issuers (cost $413,747,689) | $453,286,265 | |
| Fidelity Central Funds (cost $59,854,890) | 59,854,890 | |
| Total Investments (cost $473,602,579) | $513,141,155 | |
| Receivable for investments sold | 1,315,496 | |
| Receivable for fund shares sold | 14,962 | |
| Dividends receivable | 303,594 | |
| Distributions receivable from Fidelity Central Funds | 15,368 | |
| Prepaid expenses | 1,185 | |
| Other receivables | 150 | |
| Total assets | 514,791,910 | |
| Liabilities | ||
| Payable to custodian bank | $2,543 | |
| Payable for investments purchased | 763,637 | |
| Payable for fund shares redeemed | 5,182,059 | |
| Accrued management fee | 322,130 | |
| Payable for daily variation margin for derivative instruments | 129,629 | |
| Other affiliated payables | 85,099 | |
| Other payables and accrued expenses | 281,751 | |
| Collateral on securities loaned, at value | 24,458,825 | |
| Total liabilities | 31,225,673 | |
| Net Assets | $483,566,237 | |
| Net Assets consist of: | ||
| Paid in capital | $422,189,666 | |
| Undistributed net investment income | 721,035 | |
| Accumulated undistributed net realized gain (loss) on investments and foreign currency transactions | 20,513,236 | |
| Net unrealized appreciation (depreciation) on investments and assets and liabilities in foreign currencies | 40,142,300 | |
| Net Assets, for 42,937,943 shares outstanding | $483,566,237 | |
| Net Asset Value, offering price and redemption price per share ($483,566,237 ÷ 42,937,943 shares) | $11.26 |
See accompanying notes which are an integral part of the financial statements.
Statement of Operations
| Year ended November 30, 2015 | ||
| Investment Income | ||
| Dividends | $5,352,148 | |
| Special dividends | 1,213,147 | |
| Interest | 23,469 | |
| Income from Fidelity Central Funds | 127,457 | |
| Total income | 6,716,221 | |
| Expenses | ||
| Management fee | ||
| Basic fee | $3,547,231 | |
| Performance adjustment | 525,240 | |
| Transfer agent fees | 890,301 | |
| Accounting and security lending fees | 200,624 | |
| Custodian fees and expenses | 35,991 | |
| Independent trustees' compensation | 2,168 | |
| Audit | 52,172 | |
| Legal | 1,311 | |
| Miscellaneous | 4,053 | |
| Total expenses before reductions | 5,259,091 | |
| Expense reductions | (55,402) | 5,203,689 |
| Net investment income (loss) | 1,512,532 | |
| Realized and Unrealized Gain (Loss) | ||
| Net realized gain (loss) on: | ||
| Investment securities: | ||
| Unaffiliated issuers | 20,641,994 | |
| Foreign currency transactions | (39,332) | |
| Futures contracts | 545,739 | |
| Total net realized gain (loss) | 21,148,401 | |
| Change in net unrealized appreciation (depreciation) on: Investment securities (net of increase in deferred foreign taxes of $238,915) | (2,109,781) | |
| Assets and liabilities in foreign currencies | 11,066 | |
| Futures contracts | 254,670 | |
| Total change in net unrealized appreciation (depreciation) | (1,844,045) | |
| Net gain (loss) | 19,304,356 | |
| Net increase (decrease) in net assets resulting from operations | $20,816,888 |
See accompanying notes which are an integral part of the financial statements.
Statement of Changes in Net Assets
| Year ended November 30, 2015 | Year ended November 30, 2014 | |
| Increase (Decrease) in Net Assets | ||
| Operations | ||
| Net investment income (loss) | $1,512,532 | $811,029 |
| Net realized gain (loss) | 21,148,401 | 15,399,988 |
| Change in net unrealized appreciation (depreciation) | (1,844,045) | 24,000,565 |
| Net increase (decrease) in net assets resulting from operations | 20,816,888 | 40,211,582 |
| Distributions to shareholders from net investment income | (873,571) | (371,126) |
| Distributions to shareholders from net realized gain | (14,905,741) | (1,499,894) |
| Total distributions | (15,779,312) | (1,871,020) |
| Share transactions | ||
| Proceeds from sales of shares | 62,308,107 | 76,149,969 |
| Reinvestment of distributions | 15,779,312 | 1,871,020 |
| Cost of shares redeemed | (117,385,403) | (84,073,515) |
| Net increase (decrease) in net assets resulting from share transactions | (39,297,984) | (6,052,526) |
| Total increase (decrease) in net assets | (34,260,408) | 32,288,036 |
| Net Assets | ||
| Beginning of period | 517,826,645 | 485,538,609 |
| End of period (including undistributed net investment income of $721,035 and undistributed net investment income of $313,191, respectively) | $483,566,237 | $517,826,645 |
| Other Information | ||
| Shares | ||
| Sold | 5,521,950 | 7,246,431 |
| Issued in reinvestment of distributions | 1,453,584 | 179,493 |
| Redeemed | (10,299,915) | (7,909,428) |
| Net increase (decrease) | (3,324,381) | (483,504) |
See accompanying notes which are an integral part of the financial statements.
Financial Highlights — Fidelity Advisor Series Small Cap Fund
| November 30, | |||
| Years ended November 30, | 2015 | 2014 | 2013 A |
| Selected Per–Share Data | |||
| Net asset value, beginning of period | $11.19 | $10.39 | $10.00 |
| Income from Investment Operations | |||
| Net investment income (loss)B | .03C | .02 | –D,E |
| Net realized and unrealized gain (loss) | .38 | .82 | .39 |
| Total from investment operations | .41 | .84 | .39 |
| Distributions from net investment income | (.02) | (.01) | – |
| Distributions from net realized gain | (.32) | (.03) | – |
| Total distributions | (.34) | (.04) | – |
| Net asset value, end of period | $11.26 | $11.19 | $10.39 |
| Total ReturnF,G | 3.81% | 8.12% | 3.90% |
| Ratios to Average Net AssetsH,I | |||
| Expenses before reductions | 1.04% | .94% | 1.07%J |
| Expenses net of fee waivers, if any | 1.03% | .94% | .95%J |
| Expenses net of all reductions | 1.02% | .94% | .95%J |
| Net investment income (loss) | .30%C | .16% | (.25)%E,J |
| Supplemental Data | |||
| Net assets, end of period (000 omitted) | $483,566 | $517,827 | $485,539 |
| Portfolio turnover rateK | 35% | 58% | 4%L |
A For the period November 7, 2013 (commencement of operations) to November 30, 2013.
B Calculated based on average shares outstanding during the period.
C Investment income per share reflects a large, non-recurring dividend which amounted to $.03 per share. Excluding this non-recurring dividend, the ratio of net investment income (loss) to average net assets would have been .06%.
D Amount represents less than $.005 per share.
E Investment income per share reflects a large, non-recurring dividend which amounted to less than $.01 per share. Excluding this non-recurring dividend, the ratio of net investment income (loss) to average net assets would have been (.36)%.
F Total returns for periods of less than one year are not annualized.
G Total returns would have been lower if certain expenses had not been reduced during the applicable periods shown.
H Fees and expenses of any underlying Fidelity Central Funds are not included in the Fund's expense ratio. The Fund indirectly bears its proportionate share of the expenses of any underlying Fidelity Central Funds.
I Expense ratios reflect operating expenses of the Fund. Expenses before reductions do not reflect amounts reimbursed by the investment adviser or reductions from brokerage service arrangements or reductions from other expense offset arrangements and do not represent the amount paid by the Fund during periods when reimbursements or reductions occur. Expense ratios before reductions for start-up periods may not be representative of longer term operating periods. Expenses net of fee waivers reflect expenses after reimbursement by the investment adviser but prior to reductions from brokerage service arrangements or other expense offset arrangements. Expenses net of all reductions represent the net expenses paid by the Fund.
J Annualized
K Amount does not include the portfolio activity of any underlying Fidelity Central Funds.
L Amount not annualized.
See accompanying notes which are an integral part of the financial statements.
Notes to Financial Statements
For the period ended November 30, 2015
1. Organization.
Fidelity Advisor Series Small Cap Fund (the Fund) is a fund of Fidelity Advisor Series I (the Trust) and is authorized to issue an unlimited number of shares. Shares of the Fund are only available for purchase by mutual funds for which Fidelity Management & Research Company (FMR) or an affiliate serves as an investment manager. The Trust is registered under the Investment Company Act of 1940, as amended (the 1940 Act), as an open-end management investment company organized as a Massachusetts business trust.
2. Investments in Fidelity Central Funds.
The Fund invests in Fidelity Central Funds, which are open-end investment companies generally available only to other investment companies and accounts managed by the investment adviser and its affiliates. The Fund's Schedule of Investments lists each of the Fidelity Central Funds held as of period end, if any, as an investment of the Fund, but does not include the underlying holdings of each Fidelity Central Fund. As an Investing Fund, the Fund indirectly bears its proportionate share of the expenses of the underlying Fidelity Central Funds.
The Money Market Central Funds seek preservation of capital and current income and are managed by Fidelity Investments Money Management, Inc. (FIMM), an affiliate of the investment adviser. Annualized expenses of the Money Market Central Funds as of their most recent shareholder report date are less than .005%.
A complete unaudited list of holdings for each Fidelity Central Fund is available upon request or at the Securities and Exchange Commission (the SEC) website at www.sec.gov. In addition, the financial statements of the Fidelity Central Funds, which are not covered by the Fund's Report of Independent Registered Public Accounting Firm, are available on the SEC website or upon request.
3. Significant Accounting Policies.
The financial statements have been prepared in conformity with accounting principles generally accepted in the United States of America (GAAP), which require management to make certain estimates and assumptions at the date of the financial statements. Actual results could differ from those estimates. Subsequent events, if any, through the date that the financial statements were issued have been evaluated in the preparation of the financial statements. The following summarizes the significant accounting policies of the Fund:
Investment Valuation. Investments are valued as of 4:00 p.m. Eastern time on the last calendar day of the period. The Board of Trustees (the Board) has delegated the day to day responsibility for the valuation of the Fund's investments to the FMR Fair Value Committee (the Committee). In accordance with valuation policies and procedures approved by the Board, the Fund attempts to obtain prices from one or more third party pricing vendors or brokers to value its investments. When current market prices, quotations or currency exchange rates are not readily available or reliable, investments will be fair valued in good faith by the Committee, in accordance with procedures adopted by the Board. Factors used in determining fair value vary by investment type and may include market or investment specific events, changes in interest rates and credit quality. The frequency with which these procedures are used cannot be predicted and they may be utilized to a significant extent. The Committee oversees the Fund's valuation policies and procedures and reports to the Board on the Committee's activities and fair value determinations. The Board monitors the appropriateness of the procedures used in valuing the Fund's investments and ratifies the fair value determinations of the Committee.
The Fund categorizes the inputs to valuation techniques used to value its investments into a disclosure hierarchy consisting of three levels as shown below:
- Level 1 – quoted prices in active markets for identical investments
- Level 2 – other significant observable inputs (including quoted prices for similar investments, interest rates, prepayment speeds, etc.)
- Level 3 – unobservable inputs (including the Fund's own assumptions based on the best information available)
Valuation techniques used to value the Fund's investments by major category are as follows:
Equity securities, including restricted securities, for which market quotations are readily available, are valued at the last reported sale price or official closing price as reported by a third party pricing vendor on the primary market or exchange on which they are traded and are categorized as Level 1 in the hierarchy. In the event there were no sales during the day or closing prices are not available, securities are valued at the last quoted bid price or may be valued using the last available price and are generally categorized as Level 2 in the hierarchy. For foreign equity securities, when market or security specific events arise, comparisons to the valuation of American Depositary Receipts (ADRs), futures contracts, Exchange-Traded Funds (ETFs) and certain indexes as well as quoted prices for similar securities may be used and would be categorized as Level 2 in the hierarchy. Utilizing these techniques may result in transfers between Level 1 and Level 2. For equity securities, including restricted securities, where observable inputs are limited, assumptions about market activity and risk are used and these securities may be categorized as Level 3 in the hierarchy.
Debt securities, including restricted securities, are valued based on evaluated prices received from third party pricing vendors or from brokers who make markets in such securities. Preferred securities and U.S. government and government agency obligations are valued by pricing vendors who utilize matrix pricing which considers yield or price of bonds of comparable quality, coupon, maturity and type or by broker-supplied prices. When independent prices are unavailable or unreliable, debt securities may be valued utilizing pricing methodologies which consider similar factors that would be used by third party pricing vendors. Debt securities are generally categorized as Level 2 in the hierarchy but may be Level 3 depending on the circumstances.
Futures contracts are valued at the settlement price established each day by the board of trade or exchange on which they are traded and are categorized as Level 1 in the hierarchy. Investments in open-end mutual funds, including the Fidelity Central Funds, are valued at their closing net asset value (NAV) each business day and are categorized as Level 1 in the hierarchy.
Changes in valuation techniques may result in transfers in or out of an assigned level within the disclosure hierarchy. The aggregate value of investments by input level as of November 30, 2015, is included at the end of the Fund's Schedule of Investments.
Foreign Currency. The Fund may use foreign currency contracts to facilitate transactions in foreign-denominated securities. Gains and losses from these transactions may arise from changes in the value of the foreign currency or if the counterparties do not perform under the contracts' terms.
Foreign-denominated assets, including investment securities, and liabilities are translated into U.S. dollars at the exchange rates at period end. Purchases and sales of investment securities, income and dividends received and expenses denominated in foreign currencies are translated into U.S. dollars at the exchange rate in effect on the transaction date.
The effects of exchange rate fluctuations on investments are included with the net realized and unrealized gain (loss) on investment securities. Other foreign currency transactions resulting in realized and unrealized gain (loss) are disclosed separately.
Investment Transactions and Income. For financial reporting purposes, the Fund's investment holdings and NAV include trades executed through the end of the last business day of the period. The NAV per share for processing shareholder transactions is calculated as of the close of business of the New York Stock Exchange (NYSE), normally 4:00 p.m. Eastern time and includes trades executed through the end of the prior business day. Gains and losses on securities sold are determined on the basis of identified cost. Dividend income is recorded on the ex-dividend date, except for certain dividends from foreign securities where the ex-dividend date may have passed, which are recorded as soon as the Fund is informed of the ex-dividend date. Non-cash dividends included in dividend income, if any, are recorded at the fair market value of the securities received. Income and capital gain distributions from Fidelity Central Funds, if any, are recorded on the ex-dividend date. Distributions received on securities that represent a return of capital or capital gain are recorded as a reduction of cost of investments and/or as a realized gain. Subsequent to ex-dividend date the Fund determines the components of these distributions, based upon receipt of tax filings or other correspondence relating to the underlying investment. Large, non-recurring dividends recognized by the Fund are presented separately on the Statement of Operations as "Special Dividends" and the impact of these dividends is presented in the Financial Highlights. Interest income is accrued as earned and includes coupon interest and amortization of premium and accretion of discount on debt securities as applicable. Investment income is recorded net of foreign taxes withheld where recovery of such taxes is uncertain.
Expenses. Expenses directly attributable to a fund are charged to that fund. Expenses attributable to more than one fund are allocated among the respective funds on the basis of relative net assets or other appropriate methods. Expense estimates are accrued in the period to which they relate and adjustments are made when actual amounts are known.
Income Tax Information and Distributions to Shareholders. Each year, the Fund intends to qualify as a regulated investment company under Subchapter M of the Internal Revenue Code, including distributing substantially all of its taxable income and realized gains. As a result, no provision for U.S. Federal income taxes is required. As of November 30, 2015, the Fund did not have any unrecognized tax benefits in the financial statements; nor is the Fund aware of any tax positions for which it is reasonably possible that the total amounts of unrecognized tax benefits will significantly change in the next twelve months. The Fund files a U.S. federal tax return, in addition to state and local tax returns as required. The Fund's federal income tax returns are subject to examination by the Internal Revenue Service (IRS) for a period of three fiscal years after they are filed. State and local tax returns may be subject to examination for an additional fiscal year depending on the jurisdiction. Foreign taxes are provided for based on the Fund's understanding of the tax rules and rates that exist in the foreign markets in which it invests. The Fund is subject to a tax imposed on capital gains by certain countries in which it invests. An estimated deferred tax liability for net unrealized appreciation on the applicable securities is included in Other payables and accrued expenses on the Statement of Assets & Liabilities.
Distributions are declared and recorded on the ex-dividend date. Income and capital gain distributions are determined in accordance with income tax regulations, which may differ from GAAP.
Capital accounts within the financial statements are adjusted for permanent book-tax differences. These adjustments have no impact on net assets or the results of operations. Capital accounts are not adjusted for temporary book-tax differences which will reverse in a subsequent period.
Book-tax differences are primarily due to futures contracts, foreign currency transactions, market discount, partnerships and losses deferred due to wash sales.
The federal tax cost of investment securities and unrealized appreciation (depreciation) as of period end were as follows:
| Gross unrealized appreciation | $72,975,333 |
| Gross unrealized depreciation | (33,362,600) |
| Net unrealized appreciation (depreciation) on securities | $39,612,733 |
| Tax Cost | $473,528,422 |
The tax-based components of distributable earnings as of period end were as follows:
| Undistributed ordinary income | $720,828 |
| Undistributed long-term capital gain | $21,289,892 |
| Net unrealized appreciation (depreciation) on securities and other investments | $39,604,749 |
The tax character of distributions paid was as follows:
| November 30, 2015 | November 30, 2014 | |
| Ordinary Income | $15,779,312 | $ 961,994 |
| Long-term Capital Gains | – | 909,026 |
| Total | $15,779,312 | $1,871,020 |
Restricted Securities. The Fund may invest in securities that are subject to legal or contractual restrictions on resale. These securities generally may be resold in transactions exempt from registration or to the public if the securities are registered. Disposal of these securities may involve time-consuming negotiations and expense, and prompt sale at an acceptable price may be difficult. Information regarding restricted securities is included at the end of the Fund's Schedule of Investments.
4. Derivative Instruments.
Risk Exposures and the Use of Derivative Instruments. The Fund's investment objective allows the Fund to enter into various types of derivative contracts, including futures contracts. Derivatives are investments whose value is primarily derived from underlying assets, indices or reference rates and may be transacted on an exchange or over-the-counter (OTC). Derivatives may involve a future commitment to buy or sell a specified asset based on specified terms, to exchange future cash flows at periodic intervals based on a notional principal amount, or for one party to make one or more payments upon the occurrence of specified events in exchange for periodic payments from the other party.
The Fund used derivatives to increase returns and to manage exposure to certain risks as defined below. The success of any strategy involving derivatives depends on analysis of numerous economic factors, and if the strategies for investment do not work as intended, the Fund may not achieve its objectives.
The Fund's use of derivatives increased or decreased its exposure to the following risk:
| Equity Risk | Equity risk relates to the fluctuations in the value of financial instruments as a result of changes in market prices (other than those arising from interest rate risk or foreign exchange risk), whether caused by factors specific to an individual investment, its issuer, or all factors affecting all instruments traded in a market or market segment. |
The Fund is also exposed to additional risks from investing in derivatives, such as liquidity risk and counterparty credit risk. Liquidity risk is the risk that the Fund will be unable to close out the derivative in the open market in a timely manner. Counterparty credit risk is the risk that the counterparty will not be able to fulfill its obligation to the Fund. Counterparty credit risk related to exchange-traded futures contracts may be mitigated by the protection provided by the exchange on which they trade.
Investing in derivatives may involve greater risks than investing in the underlying assets directly and, to varying degrees, may involve risk of loss in excess of any initial investment and collateral received and amounts recognized in the Statement of Assets and Liabilities. In addition, there may be the risk that the change in value of the derivative contract does not correspond to the change in value of the underlying instrument.
Futures Contracts. A futures contract is an agreement between two parties to buy or sell a specified underlying instrument for a fixed price at a specified future date. The Fund used futures contracts to manage its exposure to the stock market.
Upon entering into a futures contract, a fund is required to deposit either cash or securities (initial margin) with a clearing broker in an amount equal to a certain percentage of the face value of the contract. Futures contracts are marked-to-market daily and subsequent daily payments (variation margin) are made or received by a fund depending on the daily fluctuations in the value of the futures contracts and are recorded as unrealized appreciation or (depreciation). This receivable and/or payable, if any, is included in daily variation margin for derivative instruments in the Statement of Assets and Liabilities. Realized gain or (loss) is recorded upon the expiration or closing of a futures contract.
Any open futures contracts at period end are presented in the Schedule of Investments under the caption "Futures Contracts". The underlying face amount at value reflects each contract's exposure to the underlying instrument or index at period end and is representative of volume of activity during the period. Securities deposited to meet initial margin requirements are identified in the Schedule of Investments.
During the period the Fund recognized net realized gain (loss) of $545,739 and a change in net unrealized appreciation (depreciation) of $254,670 related to its investment in futures contracts. These amounts are included in the Statement of Operations.
5. Purchases and Sales of Investments.
Purchases and sales of securities, other than short-term securities, aggregated $164,530,557 and $221,947,933, respectively.
6. Fees and Other Transactions with Affiliates.
Management Fee. Fidelity Management & Research Company (the investment adviser) and its affiliates provide the Fund with investment management related services for which the Fund pays a monthly management fee. The management fee is the sum of an individual fund fee rate that is based on an annual rate of .45% of the Fund's average net assets and an annualized group fee rate that averaged .25% during the period. The group fee rate is based upon the average net assets of all the mutual funds advised by the investment adviser, including any mutual funds previously advised by the investment adviser that are currently advised by Fidelity SelectCo, LLC, an affiliate of the investment adviser. The group fee rate decreases as assets under management increase and increases as assets under management decrease. In addition, the management fee is subject to a performance adjustment (up to a maximum of +/- .20% of the Fund's average net assets over a 36 month performance period). The upward or downward adjustment to the management fee is based on the Fund's relative investment performance as compared to its benchmark index, the Russell 2000 Index, over the same 36 month performance period. For the reporting period, the total annual management fee rate, including the performance adjustment, was .80% of the Fund's average net assets. The performance adjustment included in the management fee rate may be higher or lower than the maximum performance adjustment rate due to the difference between the average net assets for the reporting and performance periods.
Transfer Agent Fees. Fidelity Investments Institutional Operations Company, Inc. (FIIOC), an affiliate of the investment adviser, is the Fund's transfer, dividend disbursing and shareholder servicing agent. FIIOC receives account fees and asset-based fees that vary according to account size and type of account. FIIOC pays for typesetting, printing and mailing of shareholder reports, except proxy statements. For the period, the transfer agent fees were equivalent to an annual rate of .18% of average net assets.
Accounting and Security Lending Fees. Fidelity Service Company, Inc. (FSC), an affiliate of the investment adviser, maintains the Fund's accounting records. The accounting fee is based on the level of average net assets for each month. Under a separate contract, FSC administers the security lending program. The security lending fee is based on the number and duration of lending transactions.
Brokerage Commissions. The Fund placed a portion of its portfolio transactions with brokerage firms which are affiliates of the investment adviser. Brokerage commissions are included in net realized gain (loss) and change in net unrealized appreciation (depreciation) in the Statement of Operations. The commissions paid to these affiliated firms were $6,364 for the period.
7. Committed Line of Credit.
The Fund participates with other funds managed by the investment adviser or an affiliate in a $4.25 billion credit facility (the "line of credit") to be utilized for temporary or emergency purposes to fund shareholder redemptions or for other short-term liquidity purposes. The Fund has agreed to pay commitment fees on its pro-rata portion of the line of credit, which amounted to $736 and is reflected in Miscellaneous expenses on the Statement of Operations. During the period, the Fund did not borrow on this line of credit.
8. Security Lending.
The Fund lends portfolio securities through a lending agent from time to time in order to earn additional income. For equity securities, a lending agent is used and may loan securities to certain qualified borrowers, including Fidelity Capital Markets (FCM), a broker-dealer affiliated with the Fund. On the settlement date of the loan, the Fund receives collateral (in the form of U.S. Treasury obligations, letters of credit and/or cash) against the loaned securities and maintains collateral in an amount not less than 100% of the market value of the loaned securities during the period of the loan. The market value of the loaned securities is determined at the close of business of the Fund and any additional required collateral is delivered to the Fund on the next business day. The Fund or borrower may terminate the loan at any time, and if the borrower defaults on its obligation to return the securities loaned because of insolvency or other reasons, the Fund may apply collateral received from the borrower against the obligation. The Fund may experience delays and costs in recovering the securities loaned. Any cash collateral received is invested in the Fidelity Securities Lending Cash Central Fund. The value of loaned securities and cash collateral at period end are disclosed on the Fund's Statement of Assets and Liabilities. Security lending income represents the income earned on investing cash collateral, less rebates paid to borrowers and any lending agent fees associated with the loan, plus any premium payments received for lending certain types of securities. Security lending income is presented in the Statement of Operations as a component of income from Fidelity Central Funds. Total security lending income during the period amounted to $71,367. During the period, there were no securities loaned to FCM.
9. Expense Reductions.
The investment adviser contractually agreed to reimburse the Fund to the extent annual operating expenses exceeded .95% of average net assets. Some expenses, for example interest expense, including commitment fees, are excluded from this reimbursement. During the period this reimbursement reduced the Fund's expenses by $33,811. Effective January 31, 2015 the expense limitation was discontinued.
Commissions paid to certain brokers with whom the investment adviser, or its affiliates, places trades on behalf of the Fund include an amount in addition to trade execution, which may be rebated back to the Fund to offset certain expenses. This amount totaled $12,046 for the period.
In addition, during the period the investment adviser reimbursed and/or waived a portion of operating expenses in the amount of $9,545.
10. Other.
The Fund's organizational documents provide former and current trustees and officers with a limited indemnification against liabilities arising in connection with the performance of their duties to the Fund. In the normal course of business, the Fund may also enter into contracts that provide general indemnifications. The Fund's maximum exposure under these arrangements is unknown as this would be dependent on future claims that may be made against the Fund. The risk of material loss from such claims is considered remote.
At the end of the period, mutual funds managed by the investment adviser or its affiliates were the owners of record of all of the outstanding shares of the Fund.
Report of Independent Registered Public Accounting Firm
To the Trustees of Fidelity Advisor Series I and Shareholders of Fidelity Advisor® Series Small Cap Fund:
In our opinion, the accompanying statement of assets and liabilities, including the schedule of investments, and the related statements of operations and of changes in net assets and the financial highlights present fairly, in all material respects, the financial position of Fidelity Advisor® Series Small Cap Fund (a fund of Fidelity Advisor Series I) at November 30, 2015, the results of its operations for the year then ended, the changes in its net assets for each of the two years in the period then ended and the financial highlights for each of the periods indicated, in conformity with accounting principles generally accepted in the United States of America. These financial statements and financial highlights (hereafter referred to as “financial statements”) are the responsibility of the Fidelity Advisor® Series Small Cap Fund’s management. Our responsibility is to express an opinion on these financial statements based on our audits. We conducted our audits of these financial statements in accordance with the standards of the Public Company Accounting Oversight Board (United States). Those standards require that we plan and perform the audit to obtain reasonable assurance about whether the financial statements are free of material misstatement. An audit includes examining, on a test basis, evidence supporting the amounts and disclosures in the financial statements, assessing the accounting principles used and significant estimates made by management, and evaluating the overall financial statement presentation. We believe that our audits, which included confirmation of securities at November 30, 2015 by correspondence with the custodian and brokers, provide a reasonable basis for our opinion.
PricewaterhouseCoopers LLP
Boston, Massachusetts
January 20, 2016
Trustees and Officers
The Trustees, Members of the Advisory Board (if any), and officers of the trust and fund, as applicable, are listed below. The Board of Trustees governs the fund and is responsible for protecting the interests of shareholders. The Trustees are experienced executives who meet periodically throughout the year to oversee the fund's activities, review contractual arrangements with companies that provide services to the fund, oversee management of the risks associated with such activities and contractual arrangements, and review the fund's performance. Each of the Trustees oversees 170 funds.
The Trustees hold office without limit in time except that (a) any Trustee may resign; (b) any Trustee may be removed by written instrument, signed by at least two-thirds of the number of Trustees prior to such removal; (c) any Trustee who requests to be retired or who has become incapacitated by illness or injury may be retired by written instrument signed by a majority of the other Trustees; and (d) any Trustee may be removed at any special meeting of shareholders by a two-thirds vote of the outstanding voting securities of the trust. Each Trustee who is not an interested person (as defined in the 1940 Act) of the trust and the fund is referred to herein as an Independent Trustee. Each Independent Trustee shall retire not later than the last day of the calendar year in which his or her 75th birthday occurs. The Independent Trustees may waive this mandatory retirement age policy with respect to individual Trustees. Officers and Advisory Board Members hold office without limit in time, except that any officer or Advisory Board Member may resign or may be removed by a vote of a majority of the Trustees at any regular meeting or any special meeting of the Trustees. Except as indicated, each individual has held the office shown or other offices in the same company for the past five years.
The fund’s Statement of Additional Information (SAI) includes more information about the Trustees. To request a free copy, call Fidelity at 1-877-208-0098.
Experience, Skills, Attributes, and Qualifications of the Trustees. The Governance and Nominating Committee has adopted a statement of policy that describes the experience, qualifications, attributes, and skills that are necessary and desirable for potential Independent Trustee candidates (Statement of Policy). The Board believes that each Trustee satisfied at the time he or she was initially elected or appointed a Trustee, and continues to satisfy, the standards contemplated by the Statement of Policy. The Governance and Nominating Committee also engages professional search firms to help identify potential Independent Trustee candidates who have the experience, qualifications, attributes, and skills consistent with the Statement of Policy. From time to time, additional criteria based on the composition and skills of the current Independent Trustees, as well as experience or skills that may be appropriate in light of future changes to board composition, business conditions, and regulatory or other developments, have also been considered by the professional search firms and the Governance and Nominating Committee. In addition, the Board takes into account the Trustees' commitment and participation in Board and committee meetings, as well as their leadership of standing and ad hoc committees throughout their tenure.
In determining that a particular Trustee was and continues to be qualified to serve as a Trustee, the Board has considered a variety of criteria, none of which, in isolation, was controlling. The Board believes that, collectively, the Trustees have balanced and diverse experience, qualifications, attributes, and skills, which allow the Board to operate effectively in governing the fund and protecting the interests of shareholders. Information about the specific experience, skills, attributes, and qualifications of each Trustee, which in each case led to the Board's conclusion that the Trustee should serve (or continue to serve) as a trustee of the fund, is provided below.
Board Structure and Oversight Function. James C. Curvey is an interested person and currently serves as Chairman. The Trustees have determined that an interested Chairman is appropriate and benefits shareholders because an interested Chairman has a personal and professional stake in the quality and continuity of services provided to the fund. Independent Trustees exercise their informed business judgment to appoint an individual of their choosing to serve as Chairman, regardless of whether the Trustee happens to be independent or a member of management. The Independent Trustees have determined that they can act independently and effectively without having an Independent Trustee serve as Chairman and that a key structural component for assuring that they are in a position to do so is for the Independent Trustees to constitute a substantial majority for the Board. The Independent Trustees also regularly meet in executive session. Ned C. Lautenbach serves as Chairman of the Independent Trustees and as such (i) acts as a liaison between the Independent Trustees and management with respect to matters important to the Independent Trustees and (ii) with management prepares agendas for Board meetings.
Fidelity® funds are overseen by different Boards of Trustees. The fund's Board oversees Fidelity's high income and certain equity funds, and other Boards oversee Fidelity's investment-grade bond, money market, asset allocation, and sector funds. The asset allocation funds may invest in Fidelity® funds overseen by the fund's Board. The use of separate Boards, each with its own committee structure, allows the Trustees of each group of Fidelity® funds to focus on the unique issues of the funds they oversee, including common research, investment, and operational issues. On occasion, the separate Boards establish joint committees to address issues of overlapping consequences for the Fidelity® funds overseen by each Board.
The Trustees operate using a system of committees to facilitate the timely and efficient consideration of all matters of importance to the Trustees, the fund, and fund shareholders and to facilitate compliance with legal and regulatory requirements and oversight of the fund's activities and associated risks. The Board, acting through its committees, has charged FMR and its affiliates with (i) identifying events or circumstances the occurrence of which could have demonstrably adverse effects on the fund's business and/or reputation; (ii) implementing processes and controls to lessen the possibility that such events or circumstances occur or to mitigate the effects of such events or circumstances if they do occur; and (iii) creating and maintaining a system designed to evaluate continuously business and market conditions in order to facilitate the identification and implementation processes described in (i) and (ii) above. Because the day-to-day operations and activities of the fund are carried out by or through FMR, its affiliates, and other service providers, the fund's exposure to risks is mitigated but not eliminated by the processes overseen by the Trustees. While each of the Board's committees has responsibility for overseeing different aspects of the fund's activities, oversight is exercised primarily through the Operations, Audit, and Compliance Committees. In addition, the Independent Trustees have worked with FMR to enhance the Board's oversight of investment and financial risks, legal and regulatory risks, technology risks, and operational risks, including the development of additional risk reporting to the Board. For example, a working group comprised of Independent Trustees and FMR has worked and continues to work to review the Fidelity® funds' valuation-related activities, reporting and risk management. Appropriate personnel, including but not limited to the fund's Chief Compliance Officer (CCO), FMR's internal auditor, the independent accountants, the fund's Treasurer and portfolio management personnel, make periodic reports to the Board's committees, as appropriate, including an annual review of Fidelity's risk management program for the Fidelity® funds. The responsibilities of each standing committee, including their oversight responsibilities, are described further under "Standing Committees of the Trustees."
Interested Trustees*:
Correspondence intended for a Trustee who is an interested person may be sent to Fidelity Investments, 245 Summer Street, Boston, Massachusetts 02210.
Name, Year of Birth; Principal Occupations and Other Relevant Experience+
James C. Curvey (1935)
Year of Election or Appointment: 2007
Trustee
Chairman of the Board of Trustees
Mr. Curvey also serves as Trustee of other Fidelity® funds. Mr. Curvey is a Director of Fidelity Research & Analysis Co. (investment adviser firm, 2009-present), and Vice Chairman (2007-present) and Director of FMR LLC (diversified financial services company). In addition, Mr. Curvey serves as an Overseer for the Boston Symphony Orchestra and a member of the board of Artis-Naples, Naples, Florida, and as a Trustee for Brewster Academy, Wolfeboro, New Hampshire. Previously, Mr. Curvey served as a Director of Fidelity Investments Money Management, Inc. (investment adviser firm, 2009-2014) and a Director of FMR and FMR Co., Inc. (investment adviser firms, 2007-2014).
Charles S. Morrison (1960)
Year of Election or Appointment: 2014
Trustee
Mr. Morrison also serves as Trustee of other funds. He serves as a Director of Fidelity Investments Money Management, Inc. (FIMM) (investment adviser firm, 2014-present), Director of Fidelity SelectCo, LLC (investment adviser firm, 2014-present), President, Asset Management (2014-present), and is an employee of Fidelity Investments. Previously, Mr. Morrison served as Vice President of Fidelity's Fixed Income and Asset Allocation Funds (2012-2014), President, Fixed Income (2011-2014), Vice President of Fidelity's Money Market Funds (2005-2009), President, Money Market Group Leader of FMR (investment adviser firm, 2009), and Senior Vice President, Money Market Group of FMR (2004-2009). Mr. Morrison also served as Vice President of Fidelity's Bond Funds (2002-2005), certain Balanced Funds (2002-2005), and certain Asset Allocation Funds (2002-2007), and as Senior Vice President (2002-2005) of Fidelity's Bond Division.
* Determined to be an “Interested Trustee” by virtue of, among other things, his or her affiliation with the trust or various entities under common control with FMR.
+ The information includes the Trustee's principal occupation during the last five years and other information relating to the experience, attributes, and skills relevant to the Trustee's qualifications to serve as a Trustee, which led to the conclusion that the Trustee should serve as a Trustee for the fund.
Independent Trustees:
Correspondence intended for an Independent Trustee may be sent to Fidelity Investments, P.O. Box 55235, Boston, Massachusetts 02205-5235.
Name, Year of Birth; Principal Occupations and Other Relevant Experience+
Dennis J. Dirks (1948)
Year of Election or Appointment: 2005
Trustee
Mr. Dirks also serves as Trustee of other Fidelity® funds. Prior to his retirement in May 2003, Mr. Dirks was Chief Operating Officer and a member of the Board of The Depository Trust & Clearing Corporation (DTCC). He also served as President, Chief Operating Officer, and Board member of The Depository Trust Company (DTC) and President and Board member of the National Securities Clearing Corporation (NSCC). In addition, Mr. Dirks served as Chief Executive Officer and Board member of the Government Securities Clearing Corporation, Chief Executive Officer and Board member of the Mortgage-Backed Securities Clearing Corporation, as a Trustee and a member of the Finance Committee of Manhattan College (2005-2008), as a Trustee and a member of the Finance Committee of AHRC of Nassau County (2006-2008), and as a member of the Independent Directors Council (IDC) Governing Council (2010-2015). Mr. Dirks is a member of the Board of Directors for The Brookville Center for Children's Services, Inc. (2009-present).
Alan J. Lacy (1953)
Year of Election or Appointment: 2008
Trustee
Mr. Lacy also serves as Trustee of other Fidelity® funds. Mr. Lacy serves as a member of the Board of Directors of Dave & Buster's Entertainment, Inc. (restaurant and entertainment complexes, 2010-present) and Bristol-Myers Squibb Company (global pharmaceuticals, 2008-present). In addition, Mr. Lacy served as Senior Adviser (2007-2014) of Oak Hill Capital Partners, L.P. (private equity) and also served as Chief Executive Officer (2000-2005) and Vice Chairman (2005-2006) of Sears Holdings Corporation and Sears, Roebuck and Co. (retail). Mr. Lacy is a member of the Board of Trustees of The National Parks Conservation Association (2006-present). Previously, Mr. Lacy served as Chairman of the Board of Trustees of the National Parks Conservation Association (2008-2011) and as a member of the Board of Directors for The Western Union Company (global money transfer, 2006-2011), The Hillman Companies, Inc. (hardware wholesalers, 2010-2014), and Earth Fare, Inc. (retail grocery, 2010-2014).
Ned C. Lautenbach (1944)
Year of Election or Appointment: 2000
Trustee
Chairman of the Independent Trustees
Mr. Lautenbach also serves as Trustee of other Fidelity® funds. Mr. Lautenbach currently serves as the Lead Director of the Eaton Corporation Board of Directors (diversified industrial, 1997-present). Mr. Lautenbach is Chairman of the Board of Directors of Artis-Naples in Naples, Florida (2012-present), a member of the Council on Foreign Relations (1994-present), and a member of the Board of Governors, State University System of Florida (2013-present). Previously, Mr. Lautenbach was a Partner/Advisory Partner at Clayton, Dubilier & Rice, LLC (private equity investment, 1998-2010), as well as a Director of Sony Corporation (2006-2007).
Joseph Mauriello (1944)
Year of Election or Appointment: 2008
Trustee
Mr. Mauriello also serves as Trustee of other Fidelity® funds. Prior to his retirement in January 2006, Mr. Mauriello served in numerous senior management positions including Deputy Chairman and Chief Operating Officer (2004-2005), and Vice Chairman of Financial Services (2002-2004) of KPMG LLP US (professional services, 1965-2005). Mr. Mauriello currently serves as a member of the Board of Directors of XL Group plc. (global insurance and re-insurance, 2006-present) and the Independent Directors Council (IDC) Governing Council (2015-present). Previously, Mr. Mauriello served as a Director of the Hamilton Funds of the Bank of New York (2006-2007) and of Arcadia Resources Inc. (health care services and products, 2007-2012).
Robert W. Selander (1950)
Year of Election or Appointment: 2011
Trustee
Mr. Selander also serves as Trustee of other Fidelity® funds. Mr. Selander serves as a Director of The Western Union Company (global money transfer, 2014-present). Previously, Mr. Selander served as a Member of the Advisory Board of other Fidelity® funds (2011), and Executive Vice Chairman (2010), Chief Executive Officer (2009-2010), and President and Chief Executive Officer (1997-2009) of Mastercard, Inc.
Cornelia M. Small (1944)
Year of Election or Appointment: 2005
Trustee
Ms. Small also serves as Trustee of other Fidelity® funds. Ms. Small is a member of the Board of Directors (2009-present) and Chair of the Investment Committee (2010-present) of the Teagle Foundation. Ms. Small also serves on the Investment Committee of the Berkshire Taconic Community Foundation (2008-present). Previously, Ms. Small served as Chairperson (2002-2008) and a member of the Investment Committee and Chairperson (2008-2012) and a member of the Board of Trustees of Smith College. In addition, Ms. Small served as Chief Investment Officer, Director of Global Equity Investments, and a member of the Board of Directors of Scudder, Stevens & Clark and Scudder Kemper Investments.
William S. Stavropoulos (1939)
Year of Election or Appointment: 2002
Trustee
Vice Chairman of the Independent Trustees
Mr. Stavropoulos also serves as Trustee of other Fidelity® funds. Mr. Stavropoulos serves as President and Founder of the Michigan Baseball Foundation, the Great Lakes Loons (2007-present). Mr. Stavropoulos is Chairman Emeritus of the Board of Directors of The Dow Chemical Company, where he previously served in numerous senior management positions, including President, CEO (1995-2000; 2002-2004), Chairman of the Executive Committee (2000-2006), and as a member of the Board of Directors (1990-2006). Currently, Mr. Stavropoulos is Chairman of the Board of Directors of Univar Inc. (global distributor of commodity and specialty chemicals), a Director of Teradata Corporation (data warehousing and technology solutions), and Maersk Inc. (industrial conglomerate), and a member of the Advisory Board for Metalmark Capital LLC (private equity investment, 2005-present). Mr. Stavropoulos is an operating advisor to Clayton, Dubilier & Rice, LLC (private equity investment). In addition, Mr. Stavropoulos is a member of the University of Notre Dame Advisory Council for the College of Science, a Trustee of the Rollin L. Gerstacker Foundation, and a Director of the Naples Philharmonic Center for the Arts. Previously, Mr. Stavropoulos served as a Director of Chemical Financial Corporation (bank holding company, 1993-2012) and Tyco International, Ltd. (multinational manufacturing and services, 2007-2012).
David M. Thomas (1949)
Year of Election or Appointment: 2008
Trustee
Mr. Thomas also serves as Trustee of other Fidelity® funds. Mr. Thomas serves as Non-Executive Chairman of the Board of Directors of Fortune Brands Home and Security (home and security products, 2011-present), as a member of the Board of Directors (2004-present) and Presiding Director (2013-present) of Interpublic Group of Companies, Inc. (marketing communication), and as a member of the Board of Trustees of the University of Florida (2013-present). Previously, Mr. Thomas served as Executive Chairman (2005-2006) and Chairman and Chief Executive Officer (2000-2005) of IMS Health, Inc. (pharmaceutical and healthcare information solutions), and a Director of Fortune Brands, Inc. (consumer products, 2000-2011).
+ The information includes the Trustee's principal occupation during the last five years and other information relating to the experience, attributes, and skills relevant to the Trustee's qualifications to serve as a Trustee, which led to the conclusion that the Trustee should serve as a Trustee for the fund.
Advisory Board Members and Officers:
Correspondence intended for an officer or Peter S. Lynch may be sent to Fidelity Investments, 245 Summer Street, Boston, Massachusetts 02210. Officers appear below in alphabetical order.
Name, Year of Birth; Principal Occupation
Peter S. Lynch (1944)
Year of Election or Appointment: 2003
Member of the Advisory Board
Mr. Lynch also serves as Member of the Advisory Board of other Fidelity® funds. Mr. Lynch is Vice Chairman and a Director of FMR (investment adviser firm) and FMR Co., Inc. (investment adviser firm). In addition, Mr. Lynch serves as a Trustee of Boston College and as the Chairman of the Inner-City Scholarship Fund. Previously, Mr. Lynch served on the Special Olympics International Board of Directors (1997-2006).
Elizabeth Paige Baumann (1968)
Year of Election or Appointment: 2012
Anti-Money Laundering (AML) Officer
Ms. Baumann also serves as AML Officer of other funds. She is Chief AML Officer of FMR LLC (diversified financial services company, 2012-present) and is an employee of Fidelity Investments. Previously, Ms. Baumann served as Vice President and Deputy Anti-Money Laundering Officer (2007-2012).
Marc R. Bryant (1966)
Year of Election or Appointment: 2015
Secretary and Chief Legal Officer (CLO)
Mr. Bryant also serves as Secretary and CLO of other funds. Mr. Bryant serves as CLO, Secretary, and Senior Vice President of Fidelity Management & Research Company (investment adviser firm, 2015-present) and FMR Co., Inc. (investment adviser firm, 2015-present); Secretary of Fidelity SelectCo, LLC (investment adviser firm, 2015-present) and Fidelity Investments Money Management, Inc. (investment adviser firm, 2015-present); and CLO of Fidelity Management & Research (Hong Kong) Limited (investment adviser firm, 2015-present). He is Senior Vice President and Deputy General Counsel of FMR LLC (diversified financial services company). Previously, Mr. Bryant served as Secretary and CLO of Fidelity Rutland Square Trust II (2010-2014) and Assistant Secretary of Fidelity's Fixed Income and Asset Allocation Funds (2013-2015). Prior to joining Fidelity Investments, Mr. Bryant served as a Senior Vice President and the Head of Global Retail Legal for AllianceBernstein L.P. (2006-2010), and as the General Counsel for ProFund Advisors LLC (2001-2006).
William C. Coffey (1969)
Year of Election or Appointment: 2009
Assistant Secretary
Mr. Coffey also serves as Assistant Secretary of other funds. He is Senior Vice President and Deputy General Counsel of FMR LLC (diversified financial services company, 2010-present), and is an employee of Fidelity Investments. Previously, Mr. Coffey served as Vice President and Associate General Counsel of FMR LLC (2005-2009).
Jonathan Davis (1968)
Year of Election or Appointment: 2010
Assistant Treasurer
Mr. Davis also serves as Assistant Treasurer of other funds, and is an employee of Fidelity Investments. Previously, Mr. Davis served as Vice President and Associate General Counsel of FMR LLC (diversified financial services company, 2003-2010).
Adrien E. Deberghes (1967)
Year of Election or Appointment: 2008
Deputy Treasurer
Mr. Deberghes also serves as an officer of other funds. He is an employee of Fidelity Investments (2008-present). Prior to joining Fidelity Investments, Mr. Deberghes was Senior Vice President of Mutual Fund Administration at State Street Corporation (2007-2008), Senior Director of Mutual Fund Administration at Investors Bank & Trust (2005-2007), and Director of Finance for Dunkin' Brands (2000-2005).
Stephanie J. Dorsey (1969)
Year of Election or Appointment: 2010
Assistant Treasurer
Ms. Dorsey also serves as an officer of other funds. She is an employee of Fidelity Investments (2008-present) and has served in other fund officer roles. Prior to joining Fidelity Investments, Ms. Dorsey served as Treasurer (2004-2008) of the JPMorgan Mutual Funds and Vice President (2004-2008) of JPMorgan Chase Bank.
Howard J. Galligan III (1966)
Year of Election or Appointment: 2014
Chief Financial Officer
Mr. Galligan also serves as Chief Financial Officer of other funds. Mr. Galligan serves as President of Fidelity Pricing and Cash Management Services (FPCMS) (2014-present) and as a Director of Strategic Advisers, Inc. (investment adviser firm, 2008-present). Previously, Mr. Galligan served as Chief Administrative Officer of Asset Management (2011-2014) and Chief Operating Officer and Senior Vice President of Investment Support for Strategic Advisers, Inc. (2003-2011).
Scott C. Goebel (1968)
Year of Election or Appointment: 2015
Vice President
Mr. Goebel serves as Vice President of other funds and is an employee of Fidelity Investments (2001-present). Previously, Mr. Goebel served as Secretary of Fidelity SelectCo, LLC (investment adviser firm, 2013-2015), Fidelity Investments Money Management, Inc. (FIMM) (investment adviser firm, 2010-2015), and Fidelity Research and Analysis Company (FRAC) (investment adviser firm, 2010-2015); General Counsel, Secretary, and Senior Vice President of Fidelity Management & Research Company (investment adviser firm, 2008-2015) and FMR Co., Inc. (investment adviser firm, 2008-2015); Assistant Secretary of Fidelity Management & Research (Japan) Limited (investment adviser firm, 2008-2015) and FMR Investment Management (U.K.) Limited (investment adviser firm, 2008-2015); Chief Legal Officer (CLO) of Fidelity Management & Research (Hong Kong) Limited (investment adviser firm, 2008-2015); Secretary and CLO of certain Fidelity® funds (2008-2015); Assistant Secretary of FIMM (2008-2010), FRAC (2008-2010), and certain funds (2007-2008); and as Vice President and Secretary of Fidelity Distributors Corporation (FDC) (2005-2007).
Thomas C. Hense (1964)
Year of Election or Appointment: 2008, 2010, or 2015
Vice President
Mr. Hense serves as Vice President of Fidelity Advisor® Multi-Asset Income Fund (2015) and other funds (High Income (2008), Small Cap (2008), and Value (2010) funds), and is an employee of Fidelity Investments (1993-present). Previously, Mr. Hense served as a portfolio manager for Fidelity's Institutional Money Management Group (Pyramis) (2003-2008).
Brian B. Hogan (1964)
Year of Election or Appointment: 2009
Vice President
Mr. Hogan also serves as Trustee or Vice President of other funds. Mr. Hogan serves as a Director of Fidelity SelectCo, LLC (investment adviser firm, 2014-present) and President of the Equity Division of FMR (investment adviser firm, 2009-present). Previously, Mr. Hogan served as Senior Vice President, Equity Research of FMR (2006-2009) and as a portfolio manager.
Chris Maher (1972)
Year of Election or Appointment: 2013
Assistant Treasurer
Mr. Maher serves as Assistant Treasurer of other funds. Mr. Maher is Vice President of Valuation Oversight and is an employee of Fidelity Investments. Previously, Mr. Maher served as Vice President of Asset Management Compliance (2013), Vice President of the Program Management Group of FMR (investment adviser firm, 2010-2013), and Vice President of Valuation Oversight (2008-2010).
Kenneth B. Robins (1969)
Year of Election or Appointment: 2008
President and Treasurer
Mr. Robins also serves as an officer of other funds. Mr. Robins serves as Executive Vice President of Fidelity Investments Money Management, Inc. (FIMM) (investment adviser firm, 2013-present) and is an employee of Fidelity Investments (2004-present). Previously, Mr. Robins served in other fund officer roles.
Stacie M. Smith (1974)
Year of Election or Appointment: 2013
Deputy Treasurer
Ms. Smith also serves as an officer of other funds. She is an employee of Fidelity Investments (2009-present) and has served in other fund officer roles. Prior to joining Fidelity Investments, Ms. Smith served as Senior Audit Manager of Ernst & Young LLP (1996-2009).
Renee Stagnone (1975)
Year of Election or Appointment: 2013
Deputy Treasurer
Ms. Stagnone also serves as Deputy Treasurer of other funds. Ms. Stagnone is an employee of Fidelity Investments (1997-present).
Linda J. Wondrack (1964)
Year of Election or Appointment: 2014
Chief Compliance Officer
Ms. Wondrack also serves as Chief Compliance Officer of other funds. Ms. Wondrack is Executive Vice President and head of the Ethics Office and Asset Management Compliance for Fidelity Investments (2012-present). Ms. Wondrack also serves as Chief Compliance Officer of Fidelity SelectCo, LLC (investment adviser firm, 2014-present); Chief Compliance Officer of Impresa Management LLC (2013-present); and Chief Compliance Officer of FMR Co., Inc. (investment adviser firm), Fidelity Investments Money Management, Inc. (investment adviser firm), Fidelity Management & Research (Japan) Limited (investment adviser firm), FMR Investment Management (U.K.) Limited (investment adviser firm), Fidelity Management & Research (Hong Kong) (investment adviser firm), Fidelity Management & Research Company (investment adviser firm), FIAM LLC (investment adviser firm), and Strategic Advisers, Inc. (investment adviser firm), Ballyrock Investment Advisors LLC, and Northern Neck Investors LLC (2012-present). Previously, Ms. Wondrack served as Senior Vice President and Chief Compliance Officer for Columbia Management Investment Advisers, LLC (2005-2012); Chief Compliance Officer for certain funds within the Columbia Family of Funds (2007-2012); and Senior Vice President of Compliance Risk Management at Bank of America (2005-2010).
Joseph F. Zambello (1957)
Year of Election or Appointment: 2011
Deputy Treasurer
Mr. Zambello also serves as Deputy Treasurer of other funds. Mr. Zambello is an employee of Fidelity Investments (1991-present). Previously, Mr. Zambello served as Vice President of the Program Management Group of FMR (investment adviser firm, 2009-2011) and Vice President of the Transfer Agent Oversight Group (2005-2009).
Shareholder Expense Example
As a shareholder of the Fund, you incur two types of costs: (1) transaction costs, and (2) ongoing costs, including management fees and other Fund expenses. This Example is intended to help you understand your ongoing costs (in dollars) of investing in the Fund and to compare these costs with the ongoing costs of investing in other mutual funds.
The Example is based on an investment of $1,000 invested at the beginning of the period and held for the entire period (June 1, 2015 to November 30, 2015).
Actual Expenses
The first line of the accompanying table provides information about actual account values and actual expenses. You may use the information in this line, together with the amount you invested, to estimate the expenses that you paid over the period. Simply divide your account value by $1,000.00 (for example, an $8,600 account value divided by $1,000.00 = 8.6), then multiply the result by the number in the first line under the heading entitled "Expenses Paid During Period" to estimate the expenses you paid on your account during this period. In addition, the Fund, as a shareholder in the underlying Fidelity Central Funds, will indirectly bear its pro-rata share of the fees and expenses incurred by the underlying Fidelity Central Funds. These fees and expenses are not included in the Fund's annualized expense ratio used to calculate the expense estimate in the table below.
Hypothetical Example for Comparison Purposes
The second line of the accompanying table provides information about hypothetical account values and hypothetical expenses based on the Fund's actual expense ratio and an assumed rate of return of 5% per year before expenses, which is not the Fund's actual return. The hypothetical account values and expenses may not be used to estimate the actual ending account balance or expenses you paid for the period. You may use this information to compare the ongoing costs of investing in the Fund and other funds. To do so, compare this 5% hypothetical example with the 5% hypothetical examples that appear in the shareholder reports of the other funds. In addition, the Fund, as a shareholder in the underlying Fidelity Central Funds, will indirectly bear its pro-rata share of the fees and expenses incurred by the underlying Fidelity Central Funds. These fees and expenses are not included in the Fund's annualized expense ratio used to calculate the expense estimate in the table below.
Please note that the expenses shown in the table are meant to highlight your ongoing costs only and do not reflect any transaction costs. Therefore, the second line of the table is useful in comparing ongoing costs only, and will not help you determine the relative total costs of owning different funds.
| Annualized Expense Ratio-A | Beginning Account Value June 1, 2015 | Ending Account Value November 30, 2015 | Expenses Paid During Period-B June 1, 2015 to November 30, 2015 | |
| Actual | 1.05% | $1,000.00 | $959.10 | $5.16 |
| Hypothetical-C | $1,000.00 | $1,019.80 | $5.32 |
A Annualized expense ratio reflects expenses net of applicable fee waivers.
B Expenses are equal to the Fund's annualized expense ratio, multiplied by the average account value over the period, multiplied by 183/365 (to reflect the one-half year period).
C 5% return per year before expenses
Distributions (Unaudited)
The Board of Trustees of Fidelity Advisor Series Small Cap Fund voted to pay to shareholders of record at the opening of business on record date, the following distributions per share derived from capital gains realized from sales of portfolio securities, and dividends derived from net investment income:
| Pay Date | Record Date | Dividends | Capital Gains | |
| Fidelity Advisor Series Small Cap Fund | 12/07/2015 | 12/04/2015 | $0.027 | $0.408 |
| 01/19/2016 | 01/15/2016 | $0.000 | $0.088 | |
The fund hereby designates as a capital gain dividend with respect to the taxable year ended November 30, 2015, $21,290,010, or, if subsequently determined to be different, the net capital gain of such year.
Fidelity Advisor Series Small Cap designates 11% of the dividends distributed during the fiscal year as qualifying for the dividends received deduction for corporate shareholders.
Fidelity Advisor Series Small Cap designates 4% of the dividends distributed during the fiscal year as amounts which may be taken into account as a dividend for the purposes of the maximum rate under section l(h)(ll)of the Internal Revenue Code.
The fund will notify shareholders in January 2016 of amounts for use in preparing 2015 income tax returns.
Board Approval of Investment Advisory Contracts and Management Fees
Fidelity Advisor Series Small Cap Fund
Each year, the Board of Trustees, including the Independent Trustees (together, the Board), votes on the renewal of the management contract with Fidelity Management & Research Company (FMR) and the sub-advisory agreements (together, the Advisory Contracts) for the fund. The Board, assisted by the advice of fund counsel and Independent Trustees' counsel, requests and considers a broad range of information relevant to the renewal of the Advisory Contracts throughout the year.
The Board meets regularly and, at each of its meetings, covers an extensive agenda of topics and materials and considers factors that are relevant to its annual consideration of the renewal of the fund's Advisory Contracts, including the services and support provided to the fund and its shareholders. The Board has established various standing committees (Committees), each composed of and chaired by Independent Trustees with varying backgrounds, to which the Board has assigned specific subject matter responsibilities in order to enhance effective decision-making by the Board. The Board, acting directly and through its Committees, requests and receives information concerning the annual consideration of the renewal of the fund's Advisory Contracts. The Board also meets as needed to consider matters specifically related to the Board's annual consideration of the renewal of the Advisory Contracts. Members of the Board may also meet with trustees of other Fidelity funds through ad hoc joint committees to discuss certain matters relevant to all of the Fidelity funds.
At its July 2015 meeting, the Board unanimously determined to renew the fund's Advisory Contracts. In reaching its determination, the Board considered all factors it believed relevant, including (i) the nature, extent, and quality of the services to be provided to the fund and its shareholders (including the investment performance of the fund); (ii) the competitiveness of the fund's management fee and total expense ratio relative to peer funds; (iii) the total costs of the services to be provided by and the profits to be realized by Fidelity from its relationship with the fund; and (iv) the extent to which (if any) economies of scale exist and would be realized as the fund grows, and whether any economies of scale are appropriately shared with fund shareholders.
In considering whether to renew the Advisory Contracts for the fund, the Board reached a determination, with the assistance of fund counsel and Independent Trustees' counsel and through the exercise of its business judgment, that the renewal of the Advisory Contracts was in the best interests of the fund and its shareholders and that the compensation payable under the Advisory Contracts was fair and reasonable. The Board's decision to renew the Advisory Contracts was not based on any single factor, but rather was based on a comprehensive consideration of all the information provided to the Board at its meetings throughout the year. The Board, in reaching its determination to renew the Advisory Contracts, was aware that shareholders of the fund have a broad range of investment choices available to them, including a wide choice among funds offered by Fidelity's competitors, and that the fund's shareholders, who have the opportunity to review and weigh the disclosure provided by the fund in its prospectus and other public disclosures, have chosen to invest in this fund, which is part of the Fidelity family of funds.
Nature, Extent, and Quality of Services Provided. The Board considered Fidelity's staffing as it relates to the fund, including the backgrounds of investment personnel of Fidelity, and also considered the fund's investment objective, strategies, and related investment philosophy. The Independent Trustees also had discussions with senior management of Fidelity's investment operations and investment groups. The Board considered the structure of the portfolio manager compensation program and whether this structure provides appropriate incentives to act in the best interests of the fund. Additionally, the Board considered the portfolio managers' investments, if any, in the funds that they manage.Resources Dedicated to Investment Management and Support Services. The Board and the Fund Oversight and Research Committees reviewed the general qualifications and capabilities of Fidelity's investment staff, including its size, education, experience, and resources, as well as Fidelity's approach to recruiting, training, managing, and compensating investment personnel. The Board noted that Fidelity has continued to increase the resources devoted to non-U.S. offices, including expansion of Fidelity's global investment organization. The Board also noted that Fidelity's analysts have extensive resources, tools and capabilities that allow them to conduct sophisticated quantitative and fundamental analysis, as well as credit analysis of issuers, counterparties and guarantors. Further, the Board considered that Fidelity's investment professionals have sufficient access to global information and data so as to provide competitive investment results over time, and that those professionals also have access to sophisticated tools that permit them to assess portfolio construction and risk and performance attribution characteristics continuously, as well as to transmit new information and research conclusions rapidly around the world. Additionally, in its deliberations, the Board considered Fidelity's trading, risk management, and compliance capabilities and resources, which are integral parts of the investment management process.Shareholder and Administrative Services. The Board considered (i) the nature, extent, quality, and cost of advisory, administrative, and shareholder services performed by FMR, the sub-advisers (together with FMR, the Investment Advisers), and their affiliates under the Advisory Contracts and under separate agreements covering transfer agency, pricing and bookkeeping, and securities lending services for the fund; (ii) the nature and extent of the supervision of third party service providers, principally custodians and subcustodians; and (iii) the resources devoted to, and the record of compliance with, the fund's compliance policies and procedures. The Board also reviewed the allocation of fund brokerage, including allocations to brokers affiliated with the Investment Advisers, the use of brokerage commissions to pay fund expenses, and the use of "soft" commission dollars to pay for research services.The Board noted that the growth of fund assets over time across the complex allows Fidelity to reinvest in the development of services designed to enhance the value or convenience of the Fidelity funds as investment vehicles. These services include 24-hour access to account information and market information through telephone representatives and over the Internet, investor education materials and asset allocation tools, and the expanded availability of Fidelity Investor Centers.In 2014, the Board formed an ad hoc Committee on Transfer Agency Fees to review the variety of transfer agency fee structures throughout the industry and Fidelity's competitive positioning with respect to industry participants.Investment in a Large Fund Family. The Board considered the benefits to shareholders of investing in a Fidelity fund, including the benefits of investing in a fund that is part of a large family of funds offering a variety of investment disciplines and providing a large variety of mutual fund investor services. The Board noted that Fidelity had taken, or had made recommendations that resulted in the Fidelity funds taking, a number of actions over the previous year that benefited particular funds, including (i) continuing to dedicate additional resources to investment research and to the support of the senior management team that oversees asset management; (ii) continuing efforts to enhance Fidelity's global research capabilities; (iii) launching new funds and making other enhancements to meet client needs; (iv) reducing management fees and total expenses for certain index funds and diversified international funds; (v) continuing to launch dedicated lower cost underlying funds to meet portfolio construction needs related to expanding underlying fund options for Fidelity funds of funds, specifically for the Freedom Fund product lines; (vi) rationalizing product lines and gaining increased efficiencies through fund mergers; (vii) launching active fixed-income exchange-traded funds; (viii) continuing to develop, acquire and implement systems and technology to improve services to the funds and information security and to increase efficiency; (ix) implementing investment enhancements to further strengthen Fidelity's target date product line to increase investors' probability of success in achieving their goals; (x) modifying the eligibility criteria for certain share classes to accommodate roll-over assets from employer-sponsored retirement plans; (xi) launching a new Class W of the Freedom Index Funds to attract and retain Fidelity record-kept retirement plan assets; and (xii) implementing changes to Fidelity's money market product line in response to recent money market regulatory reforms.Investment Performance. The Board considered whether the fund has operated in accordance with its investment objective, as well as its record of compliance with its investment restrictions and its performance history.The Board took into account discussions with representatives of the Investment Advisers about fund investment performance that occur at Board meetings throughout the year. In this regard the Board noted that as part of regularly scheduled fund reviews and other reports to the Board on fund performance, the Board considers annualized return information for the fund, for different time periods, measured against a securities market index ("benchmark index") and a peer group of funds with similar objectives ("peer group"), if any. In its evaluation of fund investment performance, the Board gave particular attention to information indicating changes in performance of certain Fidelity funds for specific time periods and discussed with the Investment Advisers the reasons for any overperformance or underperformance.In addition to reviewing absolute and relative fund performance, the Independent Trustees periodically consider the appropriateness of fund performance metrics in evaluating the results achieved. In general, the Independent Trustees believe that fund performance should be evaluated based on net performance (after fees and expenses) of both the highest performing and lowest performing fund share classes, where applicable, compared to appropriate benchmark indices, over appropriate time periods that may include full market cycles, and compared to peer groups, as applicable, over the same periods, taking into account relevant factors including the following: general market conditions; issuer-specific information; and fund cash flows and other factors.The Independent Trustees recognize that shareholders evaluate performance on a net basis over their own holding periods, for which one-, three-, and five-year periods are often used as a proxy. For this reason, the performance information reviewed by the Board also included net cumulative calendar year total return information for the fund and an appropriate benchmark index and peer group for the most recent one-year period, as shown below. Returns are shown compared to the 25th percentile (top of box, 75% beaten) and 75th percentile (bottom of box, 25% beaten) of the peer universe.Fidelity Advisor Series Small Cap Fund
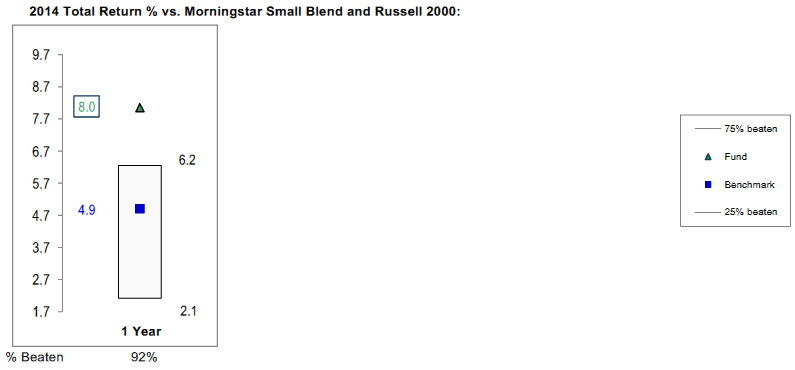
Fidelity Advisor Series Small Cap Fund
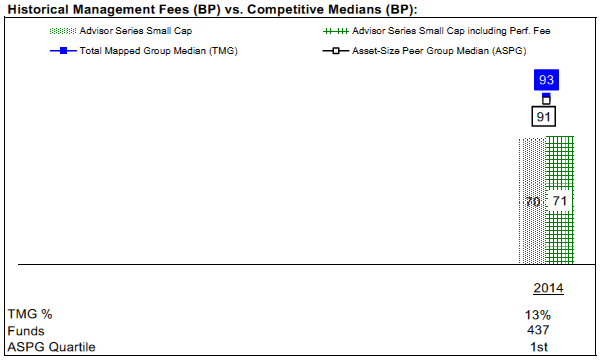
![]()
Corporate Headquarters
245 Summer St.
Boston, MA 02210
www.fidelity.com
AXS5-ANN-0116
1.967941.102
Fidelity Advisor® Equity Growth Fund Class I (formerly Institutional Class) Annual Report November 30, 2015 |
|
Contents
Board Approval of Investment Advisory Contracts and Management Fees |
To view a fund's proxy voting guidelines and proxy voting record for the 12-month period ended June 30, visit http://www.fidelity.com/proxyvotingresults or visit the Securities and Exchange Commission's (SEC) web site at http://www.sec.gov.
You may also call 1-877-208-0098 to request a free copy of the proxy voting guidelines.
Standard & Poor's, S&P and S&P 500 are registered service marks of The McGraw-Hill Companies, Inc. and have been licensed for use by Fidelity Distributors Corporation.
Other third-party marks appearing herein are the property of their respective owners.
All other marks appearing herein are registered or unregistered trademarks or service marks of FMR LLC or an affiliated company. © 2016 FMR LLC. All rights reserved.
This report and the financial statements contained herein are submitted for the general information of the shareholders of the Fund. This report is not authorized for distribution to prospective investors in the Fund unless preceded or accompanied by an effective prospectus.
A fund files its complete schedule of portfolio holdings with the SEC for the first and third quarters of each fiscal year on Form N-Q. Forms N-Q are available on the SEC’s web site at http://www.sec.gov. A fund's Forms N-Q may be reviewed and copied at the SEC’s Public Reference Room in Washington, DC. Information regarding the operation of the SEC's Public Reference Room may be obtained by calling 1-800-SEC-0330.
For a complete list of a fund's portfolio holdings, view the most recent holdings listing, semiannual report, or annual report on Fidelity's web site at http://www.fidelity.com, http://www.advisor.fidelity.com, or http://www.401k.com, as applicable.
NOT FDIC INSURED •MAY LOSE VALUE •NO BANK GUARANTEE
Neither the Fund nor Fidelity Distributors Corporation is a bank.
Performance: The Bottom Line
Average annual total return reflects the change in the value of an investment, assuming reinvestment of distributions from dividend income and capital gains (the profits earned upon the sale of securities that have grown in value, if any) and assuming a constant rate of performance each year.
The hypothetical investment and the average annual total returns do not reflect the deduction of taxes that a shareholder would pay on fund distributions or the redemption of fund shares.
During periods of reimbursement by Fidelity, a fund’s total return will be greater than it would be had the reimbursement not occurred.
How a fund did yesterday is no guarantee of how it will do tomorrow.
Average Annual Total Returns
| For the periods ended November 30, 2015 | Past 1 year | Past 5 years | Past 10 years |
| Class I | 5.64% | 14.68% | 7.89% |
$10,000 Over 10 Years
Let's say hypothetically that $10,000 was invested in Fidelity Advisor® Equity Growth Fund - Class I on November 30, 2005.
The chart shows how the value of your investment would have changed, and also shows how the Russell 3000® Growth Index performed over the same period.

| Period Ending Values | ||
| $21,373 | Fidelity Advisor® Equity Growth Fund - Class I | |
| $22,916 | Russell 3000® Growth Index | |
Management's Discussion of Fund Performance
Market Recap: U.S. stocks gained modestly for the 12 months ending November 30, 2015, despite a steep decline in August and September on concern about slowing economic growth in China. The S&P 500® index rebounded in October and gained 2.75% for the year. Stocks benefited late in the period amid waning expectations for a near-term interest-rate hike by the U.S. Federal Reserve, more economic stimulus in Europe and an interest-rate cut in China. Growth stocks in the benchmark far outpaced their value counterparts, as investors continued to seek growth in a subpar economic environment. Sector performance varied widely, with more than 26 percentage points separating the leader from the laggard. Consumer discretionary (+14%) secured the top spot, benefiting from a combination of rising personal income and still-benign inflation. Information technology (+7%) and health care (+4%) also outpaced the broad market. Conversely, the energy sector (-12%) performed worst, stymied by depressed commodity prices that also hit materials (-5%). Telecommunication services (-5%) and utilities (-4%), considered defensive sectors less sensitive to the economy, also lost ground. At period end, investors remained focused on the potential global implications of a stronger U.S. dollar and how China’s transition toward a consumption-led economy may affect corporate earnings.Comments from Portfolio Manager Jason Weiner: For the year, the fund’s share classes (excluding sales charges, if applicable) saw gains in the mid-single digits, lagging the 6.14% advance of the benchmark Russell 3000® Growth Index. Versus the benchmark, picks in food, beverage & tobacco, part of the consumer staples sector, weighed most on the fund's performance, largely due to the fund’s overweighting in Keurig Green Mountain – by far the largest individual detractor the past year. Keurig shares suffered partly due to the firm’s disappointing December 2014 launch of its second-generation brewing machine and subsequent consecutive quarters of lower-than-expected earnings and revenue. In November, the stock hit a nearly three-year low when an influential analyst reduced its forecast for Keurig’s sales due to lowered prices on its coffee brewers, decreased K-Cup volumes and weak demand for its new Kold machine. On the plus side, positioning in information technology's software & services industry was a big plus. From this group, the fund’s position in Facebook – the largest holding – was its biggest individual contributor by a wide margin. Facebook outperformed, partly in anticipation of second-quarter earnings that reflected a strong rise in advertising revenue and growth in the number of subscribers accessing its services on mobile devices. The firm continued to make progress with video advertising and announced new features geared toward small and medium-sized businesses.The views expressed above reflect those of the portfolio manager(s) only through the end of the period as stated on the cover of this report and do not necessarily represent the views of Fidelity or any other person in the Fidelity organization. Any such views are subject to change at any time based upon market or other conditions and Fidelity disclaims any responsibility to update such views. These views may not be relied on as investment advice and, because investment decisions for a Fidelity fund are based on numerous factors, may not be relied on as an indication of trading intent on behalf of any Fidelity fund.
Investment Summary (Unaudited)
Top Ten Stocks as of November 30, 2015
| % of fund's net assets | % of fund's net assets 6 months ago | |
| Facebook, Inc. Class A | 11.3 | 8.5 |
| Alphabet, Inc. Class A | 6.5 | 3.3 |
| Gilead Sciences, Inc. | 5.1 | 5.8 |
| Apple, Inc. | 2.9 | 6.9 |
| Amazon.com, Inc. | 2.7 | 0.5 |
| Salesforce.com, Inc. | 2.6 | 2.1 |
| Starbucks Corp. | 2.5 | 1.9 |
| Home Depot, Inc. | 2.4 | 1.8 |
| Avago Technologies Ltd. | 2.4 | 0.1 |
| Danaher Corp. | 2.3 | 1.8 |
| 40.7 |
Top Five Market Sectors as of November 30, 2015
| % of fund's net assets | % of fund's net assets 6 months ago | |
| Information Technology | 41.6 | 36.2 |
| Consumer Discretionary | 16.3 | 15.0 |
| Health Care | 15.7 | 18.5 |
| Industrials | 10.3 | 11.7 |
| Financials | 6.7 | 7.6 |
Asset Allocation (% of fund's net assets)
| As of November 30, 2015* | ||
| Stocks | 93.6% | |
| Convertible Securities | 0.9% | |
| Short-Term Investments and Net Other Assets (Liabilities) | 5.5% | |

* Foreign investments - 14.5%
| As of May 31, 2015* | ||
| Stocks | 96.5% | |
| Convertible Securities | 0.9% | |
| Short-Term Investments and Net Other Assets (Liabilities) | 2.6% | |

* Foreign investments - 14.1%
Investments November 30, 2015
Showing Percentage of Net Assets
| Common Stocks - 93.6% | |||
| Shares | Value (000s) | ||
| CONSUMER DISCRETIONARY - 16.2% | |||
| Automobiles - 0.7% | |||
| Tesla Motors, Inc. (a) | 91,300 | $21,023 | |
| Diversified Consumer Services - 1.3% | |||
| Bright Horizons Family Solutions, Inc. (a) | 166,600 | 11,051 | |
| Houghton Mifflin Harcourt Co. (a) | 221,900 | 4,385 | |
| Nord Anglia Education, Inc. (a) | 134,321 | 2,852 | |
| ServiceMaster Global Holdings, Inc. (a) | 487,300 | 18,264 | |
| 36,552 | |||
| Hotels, Restaurants & Leisure - 3.8% | |||
| Buffalo Wild Wings, Inc. (a) | 52,400 | 8,397 | |
| Chipotle Mexican Grill, Inc. (a) | 15,185 | 8,800 | |
| Domino's Pizza, Inc. | 184,800 | 19,860 | |
| Jubilant Foodworks Ltd. | 52,463 | 1,218 | |
| Starbucks Corp. | 1,161,402 | 71,298 | |
| 109,573 | |||
| Household Durables - 0.9% | |||
| Harman International Industries, Inc. | 185,100 | 19,095 | |
| Toll Brothers, Inc. (a) | 205,800 | 7,652 | |
| 26,747 | |||
| Internet & Catalog Retail - 3.6% | |||
| Amazon.com, Inc. (a) | 117,800 | 78,313 | |
| Netflix, Inc. (a) | 150,700 | 18,586 | |
| NutriSystem, Inc. | 122,400 | 2,808 | |
| Travelport Worldwide Ltd. | 143,600 | 1,911 | |
| 101,618 | |||
| Leisure Products - 0.0% | |||
| NJOY, Inc. (a)(b) | 202,642 | 0 | |
| Specialty Retail - 4.2% | |||
| AutoZone, Inc. (a) | 11,100 | 8,700 | |
| Five Below, Inc. (a)(c) | 335,100 | 9,386 | |
| Home Depot, Inc. | 518,244 | 69,383 | |
| L Brands, Inc. | 87,200 | 8,320 | |
| Lowe's Companies, Inc. | 152,700 | 11,697 | |
| MarineMax, Inc. (a) | 209,400 | 3,801 | |
| Restoration Hardware Holdings, Inc. (a) | 2,800 | 252 | |
| Ulta Salon, Cosmetics & Fragrance, Inc. (a) | 58,274 | 9,732 | |
| 121,271 | |||
| Textiles, Apparel & Luxury Goods - 1.7% | |||
| Kate Spade & Co. (a) | 1,104,724 | 22,139 | |
| NIKE, Inc. Class B | 209,257 | 27,681 | |
| 49,820 | |||
| TOTAL CONSUMER DISCRETIONARY | 466,604 | ||
| CONSUMER STAPLES - 3.2% | |||
| Beverages - 0.5% | |||
| Kweichow Moutai Co. Ltd. | 64,130 | 2,148 | |
| The Coca-Cola Co. | 317,626 | 13,537 | |
| 15,685 | |||
| Food & Staples Retailing - 0.7% | |||
| CVS Health Corp. | 135,900 | 12,787 | |
| Whole Foods Market, Inc. | 248,083 | 7,232 | |
| 20,019 | |||
| Food Products - 0.4% | |||
| Keurig Green Mountain, Inc. | 240,691 | 12,612 | |
| Household Products - 0.3% | |||
| Procter & Gamble Co. | 104,691 | 7,835 | |
| Personal Products - 1.3% | |||
| Avon Products, Inc. | 287,500 | 992 | |
| Estee Lauder Companies, Inc. Class A | 101,200 | 8,513 | |
| Herbalife Ltd. (a) | 466,166 | 26,912 | |
| 36,417 | |||
| TOTAL CONSUMER STAPLES | 92,568 | ||
| ENERGY - 0.3% | |||
| Oil, Gas & Consumable Fuels - 0.3% | |||
| Golar LNG Ltd. | 264,848 | 7,244 | |
| FINANCIALS - 6.7% | |||
| Banks - 0.9% | |||
| First Republic Bank | 302,800 | 20,851 | |
| HDFC Bank Ltd. (a) | 68,446 | 1,319 | |
| M&T Bank Corp. | 25,400 | 3,183 | |
| 25,353 | |||
| Capital Markets - 2.8% | |||
| BlackRock, Inc. Class A | 42,000 | 15,276 | |
| E*TRADE Financial Corp. (a) | 850,445 | 25,879 | |
| HFF, Inc. | 199,700 | 6,864 | |
| Invesco Ltd. | 282,523 | 9,518 | |
| JMP Group, Inc. | 141,100 | 872 | |
| PJT Partners, Inc. (a) | 21,880 | 513 | |
| The Blackstone Group LP | 451,933 | 14,114 | |
| Virtus Investment Partners, Inc. | 51,400 | 7,003 | |
| 80,039 | |||
| Diversified Financial Services - 1.4% | |||
| Berkshire Hathaway, Inc. Class B (a) | 55,800 | 7,482 | |
| McGraw Hill Financial, Inc. | 246,875 | 23,816 | |
| MSCI, Inc. Class A | 114,600 | 8,036 | |
| 39,334 | |||
| Real Estate Investment Trusts - 0.6% | |||
| American Tower Corp. | 174,400 | 17,332 | |
| Real Estate Management & Development - 0.8% | |||
| Realogy Holdings Corp. (a) | 594,918 | 24,576 | |
| Thrifts & Mortgage Finance - 0.2% | |||
| Essent Group Ltd. (a) | 229,300 | 5,668 | |
| TOTAL FINANCIALS | 192,302 | ||
| HEALTH CARE - 15.7% | |||
| Biotechnology - 9.9% | |||
| Amgen, Inc. | 178,100 | 28,692 | |
| BioMarin Pharmaceutical, Inc. (a) | 161,679 | 15,419 | |
| Celgene Corp. (a) | 161,600 | 17,687 | |
| Cytokinetics, Inc. warrants 6/25/17 (a) | 856,620 | 974 | |
| Gilead Sciences, Inc. | 1,388,047 | 147,077 | |
| Insmed, Inc. (a) | 744,220 | 12,138 | |
| Medivation, Inc. (a) | 794,600 | 33,596 | |
| Vertex Pharmaceuticals, Inc. (a) | 231,700 | 29,973 | |
| 285,556 | |||
| Health Care Equipment & Supplies - 0.6% | |||
| Medtronic PLC | 138,800 | 10,457 | |
| Novadaq Technologies, Inc. (a) | 575,300 | 7,007 | |
| 17,464 | |||
| Health Care Providers & Services - 0.3% | |||
| Express Scripts Holding Co. (a) | 111,500 | 9,531 | |
| Pharmaceuticals - 4.9% | |||
| Astellas Pharma, Inc. | 3,065,000 | 43,137 | |
| Teva Pharmaceutical Industries Ltd. sponsored ADR | 533,300 | 33,561 | |
| Valeant Pharmaceuticals International, Inc. (Canada) (a) | 701,100 | 63,183 | |
| 139,881 | |||
| TOTAL HEALTH CARE | 452,432 | ||
| INDUSTRIALS - 10.3% | |||
| Aerospace & Defense - 1.3% | |||
| Textron, Inc. | 340,200 | 14,516 | |
| TransDigm Group, Inc. (a) | 102,177 | 23,974 | |
| 38,490 | |||
| Air Freight & Logistics - 0.7% | |||
| United Parcel Service, Inc. Class B | 178,600 | 18,398 | |
| Airlines - 0.7% | |||
| Ryanair Holdings PLC sponsored ADR | 262,060 | 20,152 | |
| Building Products - 0.8% | |||
| A.O. Smith Corp. | 138,138 | 11,018 | |
| Caesarstone Sdot-Yam Ltd. | 258,500 | 10,567 | |
| 21,585 | |||
| Electrical Equipment - 0.8% | |||
| Acuity Brands, Inc. | 52,200 | 12,052 | |
| AMETEK, Inc. | 199,955 | 11,289 | |
| 23,341 | |||
| Industrial Conglomerates - 3.1% | |||
| Danaher Corp. | 674,214 | 64,987 | |
| Roper Industries, Inc. | 126,169 | 24,412 | |
| 89,399 | |||
| Professional Services - 1.6% | |||
| CEB, Inc. | 42,300 | 3,269 | |
| Equifax, Inc. | 48,900 | 5,452 | |
| Resources Connection, Inc. | 311,700 | 5,689 | |
| Robert Half International, Inc. | 287,800 | 14,730 | |
| WageWorks, Inc. (a) | 392,900 | 16,714 | |
| 45,854 | |||
| Road & Rail - 0.0% | |||
| Swift Transporation Co. (a) | 43,100 | 688 | |
| Trading Companies & Distributors - 1.3% | |||
| HD Supply Holdings, Inc. (a) | 1,084,400 | 34,300 | |
| Summit Ascent Holdings Ltd. (a) | 5,330,000 | 2,530 | |
| 36,830 | |||
| TOTAL INDUSTRIALS | 294,737 | ||
| INFORMATION TECHNOLOGY - 40.8% | |||
| Communications Equipment - 0.1% | |||
| QUALCOMM, Inc. | 74,400 | 3,630 | |
| Electronic Equipment & Components - 0.2% | |||
| CDW Corp. | 100,000 | 4,317 | |
| TE Connectivity Ltd. | 19,423 | 1,303 | |
| 5,620 | |||
| Internet Software & Services - 21.5% | |||
| 58.com, Inc. ADR (a) | 99,200 | 5,973 | |
| Alibaba Group Holding Ltd. sponsored ADR (a) | 335,700 | 28,226 | |
| Alphabet, Inc.: | |||
| Class A (a) | 244,150 | 186,250 | |
| Class C | 42,136 | 31,290 | |
| Cvent, Inc. (a) | 324,878 | 11,738 | |
| Demandware, Inc. (a)(c) | 155,704 | 7,964 | |
| Facebook, Inc. Class A (a) | 3,112,400 | 324,433 | |
| Just Dial Ltd. | 139,013 | 1,965 | |
| JUST EAT Ltd. (a) | 825,555 | 5,478 | |
| Shopify, Inc. Class A (c) | 3,600 | 95 | |
| Textura Corp. (a) | 409,489 | 9,889 | |
| Zillow Group, Inc. (a)(c) | 69,800 | 1,817 | |
| Zillow Group, Inc. Class C (a)(c) | 139,600 | 3,441 | |
| 618,559 | |||
| IT Services - 3.3% | |||
| Cognizant Technology Solutions Corp. Class A (a) | 445,300 | 28,757 | |
| Global Payments, Inc. | 75,200 | 5,328 | |
| MasterCard, Inc. Class A | 81,000 | 7,932 | |
| Visa, Inc. Class A | 672,532 | 53,137 | |
| 95,154 | |||
| Semiconductors & Semiconductor Equipment - 3.0% | |||
| Avago Technologies Ltd. | 518,300 | 67,612 | |
| Maxim Integrated Products, Inc. | 168,728 | 6,542 | |
| Monolithic Power Systems, Inc. | 162,432 | 11,099 | |
| 85,253 | |||
| Software - 9.8% | |||
| Activision Blizzard, Inc. | 246,600 | 9,287 | |
| Adobe Systems, Inc. (a) | 432,300 | 39,538 | |
| Computer Modelling Group Ltd. | 627,900 | 4,885 | |
| CyberArk Software Ltd. (a)(c) | 214,800 | 9,299 | |
| Electronic Arts, Inc. (a) | 767,645 | 52,039 | |
| Fleetmatics Group PLC (a) | 308,600 | 18,423 | |
| HubSpot, Inc. (a) | 176,800 | 9,584 | |
| Intuit, Inc. | 56,500 | 5,661 | |
| Mobileye NV (a)(c) | 416,200 | 18,146 | |
| Red Hat, Inc. (a) | 280,800 | 22,860 | |
| Salesforce.com, Inc. (a) | 928,292 | 73,976 | |
| ServiceNow, Inc. (a) | 215,100 | 18,716 | |
| 282,414 | |||
| Technology Hardware, Storage & Peripherals - 2.9% | |||
| Apple, Inc. | 693,427 | 82,032 | |
| TOTAL INFORMATION TECHNOLOGY | 1,172,662 | ||
| MATERIALS - 0.2% | |||
| Chemicals - 0.2% | |||
| CF Industries Holdings, Inc. | 134,100 | 6,187 | |
| TELECOMMUNICATION SERVICES - 0.2% | |||
| Wireless Telecommunication Services - 0.2% | |||
| SBA Communications Corp. Class A (a) | 53,500 | 5,626 | |
| TOTAL COMMON STOCKS | |||
| (Cost $2,142,764) | 2,690,362 | ||
| Convertible Preferred Stocks - 0.9% | |||
| CONSUMER DISCRETIONARY - 0.1% | |||
| Household Durables - 0.1% | |||
| Blu Homes, Inc. Series A, 5.00% (a)(b) | 875,350 | 3,782 | |
| INFORMATION TECHNOLOGY - 0.8% | |||
| Internet Software & Services - 0.7% | |||
| Uber Technologies, Inc. Series D, 8.00% (a)(b) | 485,012 | 19,226 | |
| IT Services - 0.1% | |||
| AppNexus, Inc. Series E (a)(b) | 105,425 | 2,116 | |
| TOTAL INFORMATION TECHNOLOGY | 21,342 | ||
| TOTAL CONVERTIBLE PREFERRED STOCKS | |||
| (Cost $13,680) | 25,124 | ||
| Money Market Funds - 6.5% | |||
| Fidelity Cash Central Fund, 0.18% (d) | 159,225,900 | 159,226 | |
| Fidelity Securities Lending Cash Central Fund, 0.22% (d)(e) | 28,009,728 | 28,010 | |
| TOTAL MONEY MARKET FUNDS | |||
| (Cost $187,236) | 187,236 | ||
| TOTAL INVESTMENT PORTFOLIO - 101.0% | |||
| (Cost $2,343,680) | 2,902,722 | ||
| NET OTHER ASSETS (LIABILITIES) - (1.0)% | (27,550) | ||
| NET ASSETS - 100% | $2,875,172 |
Values shown as $0 may reflect amounts less than $500.
Legend
(a) Non-income producing
(b) Restricted securities - Investment in securities not registered under the Securities Act of 1933 (excluding 144A issues). At the end of the period, the value of restricted securities (excluding 144A issues) amounted to $25,123,000 or 0.9% of net assets.
(c) Security or a portion of the security is on loan at period end.
(d) Affiliated fund that is generally available only to investment companies and other accounts managed by Fidelity Investments. The rate quoted is the annualized seven-day yield of the fund at period end. A complete unaudited listing of the fund's holdings as of its most recent quarter end is available upon request. In addition, each Fidelity Central Fund's financial statements, which are not covered by the Fund's Report of Independent Registered Public Accounting Firm, are available on the SEC's website or upon request.
(e) Investment made with cash collateral received from securities on loan.
Additional information on each restricted holding is as follows:
| Security | Acquisition Date | Acquisition Cost (000s) |
| AppNexus, Inc. Series E | 8/1/14 | $2,112 |
| Blu Homes, Inc. Series A, 5.00% | 6/21/13 | $4,044 |
| NJOY, Inc. | 9/11/13 | $1,637 |
| Uber Technologies, Inc. Series D, 8.00% | 6/6/14 | $7,524 |
Affiliated Central Funds
Information regarding fiscal year to date income earned by the Fund from investments in Fidelity Central Funds is as follows:
| Fund | Income earned |
| (Amounts in thousands) | |
| Fidelity Cash Central Fund | $222 |
| Fidelity Securities Lending Cash Central Fund | 515 |
| Total | $737 |
Investment Valuation
The following is a summary of the inputs used, as of November 30, 2015, involving the Fund's assets and liabilities carried at fair value. The inputs or methodology used for valuing securities may not be an indication of the risk associated with investing in those securities. For more information on valuation inputs, and their aggregation into the levels used below, please refer to the Investment Valuation section in the accompanying Notes to Financial Statements.
| Valuation Inputs at Reporting Date: | ||||
| Description | Total | Level 1 | Level 2 | Level 3 |
| (Amounts in thousands) | ||||
| Investments in Securities: | ||||
| Equities: | ||||
| Consumer Discretionary | $470,386 | $466,604 | $-- | $3,782 |
| Consumer Staples | 92,568 | 92,568 | -- | -- |
| Energy | 7,244 | 7,244 | -- | -- |
| Financials | 192,302 | 190,983 | 1,319 | -- |
| Health Care | 452,432 | 408,321 | 44,111 | -- |
| Industrials | 294,737 | 294,737 | -- | -- |
| Information Technology | 1,194,004 | 1,172,662 | -- | 21,342 |
| Materials | 6,187 | 6,187 | -- | -- |
| Telecommunication Services | 5,626 | 5,626 | -- | -- |
| Money Market Funds | 187,236 | 187,236 | -- | -- |
| Total Investments in Securities: | $2,902,722 | $2,832,168 | $45,430 | $25,124 |
Other Information
Distribution of investments by country or territory of incorporation, as a percentage of Total Net Assets, is as follows (Unaudited):
| United States of America | 85.5% |
| Canada | 2.6% |
| Singapore | 2.4% |
| Cayman Islands | 2.3% |
| Israel | 1.9% |
| Ireland | 1.7% |
| Japan | 1.5% |
| Bermuda | 1.0% |
| Others (Individually Less Than 1%) | 1.1% |
| 100.0% |
See accompanying notes which are an integral part of the financial statements.
Financial Statements
Statement of Assets and Liabilities
| Amounts in thousands (except per-share amounts) | November 30, 2015 | |
| Assets | ||
| Investment in securities, at value (including securities loaned of $27,374) — See accompanying schedule: Unaffiliated issuers (cost $2,156,444) | $2,715,486 | |
| Fidelity Central Funds (cost $187,236) | 187,236 | |
| Total Investments (cost $2,343,680) | $2,902,722 | |
| Receivable for investments sold | 3,674 | |
| Receivable for fund shares sold | 2,258 | |
| Dividends receivable | 1,468 | |
| Distributions receivable from Fidelity Central Funds | 73 | |
| Prepaid expenses | 7 | |
| Other receivables | 153 | |
| Total assets | 2,910,355 | |
| Liabilities | ||
| Payable for fund shares redeemed | $4,250 | |
| Accrued management fee | 1,312 | |
| Distribution and service plan fees payable | 888 | |
| Other affiliated payables | 525 | |
| Other payables and accrued expenses | 198 | |
| Collateral on securities loaned, at value | 28,010 | |
| Total liabilities | 35,183 | |
| Net Assets | $2,875,172 | |
| Net Assets consist of: | ||
| Paid in capital | $2,258,565 | |
| Accumulated net investment loss | (9,672) | |
| Accumulated undistributed net realized gain (loss) on investments and foreign currency transactions | 67,246 | |
| Net unrealized appreciation (depreciation) on investments and assets and liabilities in foreign currencies | 559,033 | |
| Net Assets | $2,875,172 | |
| Calculation of Maximum Offering Price | ||
| Class A: | ||
| Net Asset Value and redemption price per share ($887,025 ÷ 8,979.10 shares) | $98.79 | |
| Maximum offering price per share (100/94.25 of $98.79) | $104.82 | |
| Class T: | ||
| Net Asset Value and redemption price per share ($1,305,911 ÷ 13,369.18 shares) | $97.68 | |
| Maximum offering price per share (100/96.50 of $97.68) | $101.22 | |
| Class B: | ||
| Net Asset Value and offering price per share ($10,751 ÷ 124.43 shares)(a) | $86.40 | |
| Class C: | ||
| Net Asset Value and offering price per share ($183,004 ÷ 2,079.42 shares)(a) | $88.01 | |
| Class I: | ||
| Net Asset Value, offering price and redemption price per share ($462,843 ÷ 4,364.12 shares) | $106.06 | |
| Class Z: | ||
| Net Asset Value, offering price and redemption price per share ($25,638 ÷ 240.98 shares) | $106.39 |
(a) Redemption price per share is equal to net asset value less any applicable contingent deferred sales charge.
See accompanying notes which are an integral part of the financial statements.
Statement of Operations
| Amounts in thousands | Year ended November 30, 2015 | |
| Investment Income | ||
| Dividends | $25,162 | |
| Income from Fidelity Central Funds | 737 | |
| Total income | 25,899 | |
| Expenses | ||
| Management fee | $15,573 | |
| Transfer agent fees | 5,535 | |
| Distribution and service plan fees | 10,779 | |
| Accounting and security lending fees | 844 | |
| Custodian fees and expenses | 54 | |
| Independent trustees' compensation | 13 | |
| Registration fees | 133 | |
| Audit | 76 | |
| Legal | 20 | |
| Miscellaneous | 20 | |
| Total expenses before reductions | 33,047 | |
| Expense reductions | (173) | 32,874 |
| Net investment income (loss) | (6,975) | |
| Realized and Unrealized Gain (Loss) | ||
| Net realized gain (loss) on: | ||
| Investment securities: | ||
| Unaffiliated issuers | 205,402 | |
| Foreign currency transactions | (81) | |
| Total net realized gain (loss) | 205,321 | |
| Change in net unrealized appreciation (depreciation) on: Investment securities | (53,555) | |
| Assets and liabilities in foreign currencies | (2) | |
| Total change in net unrealized appreciation (depreciation) | (53,557) | |
| Net gain (loss) | 151,764 | |
| Net increase (decrease) in net assets resulting from operations | $144,789 |
See accompanying notes which are an integral part of the financial statements.
Statement of Changes in Net Assets
| Amounts in thousands | Year ended November 30, 2015 | Year ended November 30, 2014 |
| Increase (Decrease) in Net Assets | ||
| Operations | ||
| Net investment income (loss) | $(6,975) | $(4,201) |
| Net realized gain (loss) | 205,321 | 701,406 |
| Change in net unrealized appreciation (depreciation) | (53,557) | (219,078) |
| Net increase (decrease) in net assets resulting from operations | 144,789 | 478,127 |
| Share transactions - net increase (decrease) | (115,712) | (1,134,005) |
| Total increase (decrease) in net assets | 29,077 | (655,878) |
| Net Assets | ||
| Beginning of period | 2,846,095 | 3,501,973 |
| End of period (including accumulated net investment loss of $9,672 and accumulated net investment loss of $7,916, respectively) | $2,875,172 | $2,846,095 |
See accompanying notes which are an integral part of the financial statements.
Financial Highlights — Fidelity Advisor Equity Growth Fund Class A
| Years ended November 30, | 2015 | 2014 | 2013 | 2012 | 2011 |
| Selected Per–Share Data | |||||
| Net asset value, beginning of period | $93.78 | $80.87 | $61.77 | $54.56 | $50.75 |
| Income from Investment Operations | |||||
| Net investment income (loss)A | (.13) | (.07) | (.05) | .02 | (.04) |
| Net realized and unrealized gain (loss) | 5.14 | 12.98 | 19.15 | 7.30 | 3.90 |
| Total from investment operations | 5.01 | 12.91 | 19.10 | 7.32 | 3.86 |
| Distributions from net realized gain | – | – | – | (.11) | (.05) |
| Net asset value, end of period | $98.79 | $93.78 | $80.87 | $61.77 | $54.56 |
| Total ReturnB,C | 5.34% | 15.96% | 30.92% | 13.45% | 7.61% |
| Ratios to Average Net AssetsD,E | |||||
| Expenses before reductions | 1.05% | 1.07% | 1.11% | 1.14% | 1.15% |
| Expenses net of fee waivers, if any | 1.05% | 1.07% | 1.11% | 1.14% | 1.15% |
| Expenses net of all reductions | 1.04% | 1.07% | 1.10% | 1.14% | 1.14% |
| Net investment income (loss) | (.13)% | (.08)% | (.07)% | .04% | (.08)% |
| Supplemental Data | |||||
| Net assets, end of period (in millions) | $887 | $853 | $772 | $632 | $609 |
| Portfolio turnover rateF | 63% | 49%G | 81% | 73% | 70% |
A Calculated based on average shares outstanding during the period.
B Total returns would have been lower if certain expenses had not been reduced during the applicable periods shown.
C Total returns do not include the effect of the sales charges.
D Fees and expenses of any underlying Fidelity Central Funds are not included in the Fund's expense ratio. The Fund indirectly bears its proportionate share of the expenses of any underlying Fidelity Central Funds.
E Expense ratios reflect operating expenses of the class. Expenses before reductions do not reflect amounts reimbursed by the investment adviser or reductions from brokerage service arrangements or reductions from other expense offset arrangements and do not represent the amount paid by the class during periods when reimbursements or reductions occur. Expenses net of fee waivers reflect expenses after reimbursement by the investment adviser but prior to reductions from brokerage service arrangements or other expense offset arrangements. Expenses net of all reductions represent the net expenses paid by the class.
F Amount does not include the portfolio activity of any underlying Fidelity Central Funds.
G Portfolio turnover rate excludes securities received or delivered in-kind.
See accompanying notes which are an integral part of the financial statements.
Financial Highlights — Fidelity Advisor Equity Growth Fund Class T
| Years ended November 30, | 2015 | 2014 | 2013 | 2012 | 2011 |
| Selected Per–Share Data | |||||
| Net asset value, beginning of period | $92.94 | $80.31 | $61.45 | $54.26 | $50.51 |
| Income from Investment Operations | |||||
| Net investment income (loss)A | (.34) | (.25) | (.17) | (.08) | (.14) |
| Net realized and unrealized gain (loss) | 5.08 | 12.88 | 19.03 | 7.27 | 3.89 |
| Total from investment operations | 4.74 | 12.63 | 18.86 | 7.19 | 3.75 |
| Net asset value, end of period | $97.68 | $92.94 | $80.31 | $61.45 | $54.26 |
| Total ReturnB,C | 5.10% | 15.73% | 30.69% | 13.25% | 7.42% |
| Ratios to Average Net AssetsD,E | |||||
| Expenses before reductions | 1.27% | 1.28% | 1.29% | 1.31% | 1.32% |
| Expenses net of fee waivers, if any | 1.27% | 1.28% | 1.29% | 1.31% | 1.32% |
| Expenses net of all reductions | 1.27% | 1.28% | 1.28% | 1.31% | 1.31% |
| Net investment income (loss) | (.36)% | (.29)% | (.25)% | (.13)% | (.25)% |
| Supplemental Data | |||||
| Net assets, end of period (in millions) | $1,306 | $1,368 | $1,283 | $1,108 | $1,139 |
| Portfolio turnover rateF | 63% | 49%G | 81% | 73% | 70% |
A Calculated based on average shares outstanding during the period.
B Total returns would have been lower if certain expenses had not been reduced during the applicable periods shown.
C Total returns do not include the effect of the sales charges.
D Fees and expenses of any underlying Fidelity Central Funds are not included in the Fund's expense ratio. The Fund indirectly bears its proportionate share of the expenses of any underlying Fidelity Central Funds.
E Expense ratios reflect operating expenses of the class. Expenses before reductions do not reflect amounts reimbursed by the investment adviser or reductions from brokerage service arrangements or reductions from other expense offset arrangements and do not represent the amount paid by the class during periods when reimbursements or reductions occur. Expenses net of fee waivers reflect expenses after reimbursement by the investment adviser but prior to reductions from brokerage service arrangements or other expense offset arrangements. Expenses net of all reductions represent the net expenses paid by the class.
F Amount does not include the portfolio activity of any underlying Fidelity Central Funds.
G Portfolio turnover rate excludes securities received or delivered in-kind.
See accompanying notes which are an integral part of the financial statements.
Financial Highlights — Fidelity Advisor Equity Growth Fund Class B
| Years ended November 30, | 2015 | 2014 | 2013 | 2012 | 2011 |
| Selected Per–Share Data | |||||
| Net asset value, beginning of period | $82.71 | $71.91 | $55.36 | $49.17 | $46.04 |
| Income from Investment Operations | |||||
| Net investment income (loss)A | (.82) | (.70) | (.52) | (.39) | (.42) |
| Net realized and unrealized gain (loss) | 4.51 | 11.50 | 17.07 | 6.58 | 3.55 |
| Total from investment operations | 3.69 | 10.80 | 16.55 | 6.19 | 3.13 |
| Net asset value, end of period | $86.40 | $82.71 | $71.91 | $55.36 | $49.17 |
| Total ReturnB,C | 4.46% | 15.02% | 29.90% | 12.59% | 6.80% |
| Ratios to Average Net AssetsD,E | |||||
| Expenses before reductions | 1.89% | 1.89% | 1.89% | 1.90% | 1.90% |
| Expenses net of fee waivers, if any | 1.89% | 1.89% | 1.89% | 1.90% | 1.90% |
| Expenses net of all reductions | 1.89% | 1.89% | 1.88% | 1.90% | 1.90% |
| Net investment income (loss) | (.98)% | (.91)% | (.85)% | (.72)% | (.83)% |
| Supplemental Data | |||||
| Net assets, end of period (in millions) | $11 | $18 | $23 | $26 | $35 |
| Portfolio turnover rateF | 63% | 49%G | 81% | 73% | 70% |
A Calculated based on average shares outstanding during the period.
B Total returns would have been lower if certain expenses had not been reduced during the applicable periods shown.
C Total returns do not include the effect of the contingent deferred sales charge.
D Fees and expenses of any underlying Fidelity Central Funds are not included in the Fund's expense ratio. The Fund indirectly bears its proportionate share of the expenses of any underlying Fidelity Central Funds.
E Expense ratios reflect operating expenses of the class. Expenses before reductions do not reflect amounts reimbursed by the investment adviser or reductions from brokerage service arrangements or reductions from other expense offset arrangements and do not represent the amount paid by the class during periods when reimbursements or reductions occur. Expenses net of fee waivers reflect expenses after reimbursement by the investment adviser but prior to reductions from brokerage service arrangements or other expense offset arrangements. Expenses net of all reductions represent the net expenses paid by the class.
F Amount does not include the portfolio activity of any underlying Fidelity Central Funds.
G Portfolio turnover rate excludes securities received or delivered in-kind.
See accompanying notes which are an integral part of the financial statements.
Financial Highlights — Fidelity Advisor Equity Growth Fund Class C
| Years ended November 30, | 2015 | 2014 | 2013 | 2012 | 2011 |
| Selected Per–Share Data | |||||
| Net asset value, beginning of period | $84.18 | $73.13 | $56.27 | $49.96 | $46.77 |
| Income from Investment Operations | |||||
| Net investment income (loss)A | (.77) | (.66) | (.50) | (.37) | (.41) |
| Net realized and unrealized gain (loss) | 4.60 | 11.71 | 17.36 | 6.68 | 3.60 |
| Total from investment operations | 3.83 | 11.05 | 16.86 | 6.31 | 3.19 |
| Net asset value, end of period | $88.01 | $84.18 | $73.13 | $56.27 | $49.96 |
| Total ReturnB,C | 4.55% | 15.11% | 29.96% | 12.63% | 6.82% |
| Ratios to Average Net AssetsD,E | |||||
| Expenses before reductions | 1.81% | 1.81% | 1.84% | 1.86% | 1.88% |
| Expenses net of fee waivers, if any | 1.81% | 1.81% | 1.84% | 1.86% | 1.88% |
| Expenses net of all reductions | 1.80% | 1.81% | 1.83% | 1.86% | 1.87% |
| Net investment income (loss) | (.89)% | (.83)% | (.79)% | (.68)% | (.81)% |
| Supplemental Data | |||||
| Net assets, end of period (in millions) | $183 | $175 | $157 | $133 | $136 |
| Portfolio turnover rateF | 63% | 49%G | 81% | 73% | 70% |
A Calculated based on average shares outstanding during the period.
B Total returns would have been lower if certain expenses had not been reduced during the applicable periods shown.
C Total returns do not include the effect of the contingent deferred sales charge.
D Fees and expenses of any underlying Fidelity Central Funds are not included in the Fund's expense ratio. The Fund indirectly bears its proportionate share of the expenses of any underlying Fidelity Central Funds.
E Expense ratios reflect operating expenses of the class. Expenses before reductions do not reflect amounts reimbursed by the investment adviser or reductions from brokerage service arrangements or reductions from other expense offset arrangements and do not represent the amount paid by the class during periods when reimbursements or reductions occur. Expenses net of fee waivers reflect expenses after reimbursement by the investment adviser but prior to reductions from brokerage service arrangements or other expense offset arrangements. Expenses net of all reductions represent the net expenses paid by the class.
F Amount does not include the portfolio activity of any underlying Fidelity Central Funds.
G Portfolio turnover rate excludes securities received or delivered in-kind.
See accompanying notes which are an integral part of the financial statements.
Financial Highlights — Fidelity Advisor Equity Growth Fund Class I
| Years ended November 30, | 2015 | 2014 | 2013 | 2012 | 2011 |
| Selected Per–Share Data | |||||
| Net asset value, beginning of period | $100.40 | $86.32 | $65.92 | $58.24 | $54.14 |
| Income from Investment Operations | |||||
| Net investment income (loss)A | .15 | .20 | .20 | .25 | .16 |
| Net realized and unrealized gain (loss) | 5.51 | 13.88 | 20.40 | 7.75 | 4.16 |
| Total from investment operations | 5.66 | 14.08 | 20.60 | 8.00 | 4.32 |
| Distributions from net investment income | – | – | (.20) | – | – |
| Distributions from net realized gain | – | – | – | (.32) | (.22) |
| Total distributions | – | – | (.20) | (.32) | (.22) |
| Net asset value, end of period | $106.06 | $100.40 | $86.32 | $65.92 | $58.24 |
| Total ReturnB | 5.64% | 16.31% | 31.36% | 13.83% | 7.99% |
| Ratios to Average Net AssetsC,D | |||||
| Expenses before reductions | .78% | .77% | .78% | .80% | .80% |
| Expenses net of fee waivers, if any | .77% | .77% | .78% | .80% | .80% |
| Expenses net of all reductions | .77% | .77% | .77% | .79% | .79% |
| Net investment income (loss) | .14% | .21% | .27% | .39% | .27% |
| Supplemental Data | |||||
| Net assets, end of period (in millions) | $463 | $432 | $1,266 | $1,063 | $897 |
| Portfolio turnover rateE | 63% | 49%F | 81% | 73% | 70% |
A Calculated based on average shares outstanding during the period.
B Total returns would have been lower if certain expenses had not been reduced during the applicable periods shown.
C Fees and expenses of any underlying Fidelity Central Funds are not included in the Fund's expense ratio. The Fund indirectly bears its proportionate share of the expenses of any underlying Fidelity Central Funds.
D Expense ratios reflect operating expenses of the class. Expenses before reductions do not reflect amounts reimbursed by the investment adviser or reductions from brokerage service arrangements or reductions from other expense offset arrangements and do not represent the amount paid by the class during periods when reimbursements or reductions occur. Expenses net of fee waivers reflect expenses after reimbursement by the investment adviser but prior to reductions from brokerage service arrangements or other expense offset arrangements. Expenses net of all reductions represent the net expenses paid by the class.
E Amount does not include the portfolio activity of any underlying Fidelity Central Funds.
F Portfolio turnover rate excludes securities received or delivered in-kind.
See accompanying notes which are an integral part of the financial statements.
Financial Highlights — Fidelity Advisor Equity Growth Fund Class Z
| Years ended November 30, | 2015 | 2014 | 2013 A |
| Selected Per–Share Data | |||
| Net asset value, beginning of period | $100.59 | $86.36 | $78.49 |
| Income from Investment Operations | |||
| Net investment income (loss)B | .29 | .33 | .09 |
| Net realized and unrealized gain (loss) | 5.51 | 13.90 | 7.78 |
| Total from investment operations | 5.80 | 14.23 | 7.87 |
| Net asset value, end of period | $106.39 | $100.59 | $86.36 |
| Total ReturnC,D | 5.77% | 16.48% | 10.03% |
| Ratios to Average Net AssetsE,F | |||
| Expenses before reductions | .64% | .64% | .64%G |
| Expenses net of fee waivers, if any | .64% | .64% | .64%G |
| Expenses net of all reductions | .63% | .64% | .63%G |
| Net investment income (loss) | .28% | .35% | .38%G |
| Supplemental Data | |||
| Net assets, end of period (000 omitted) | $25,638 | $122 | $110 |
| Portfolio turnover rateH | 63% | 49%I | 81% |
A For the period August 13, 2013 (commencement of sale of shares) to November 30, 2013.
B Calculated based on average shares outstanding during the period.
C Total returns for periods of less than one year are not annualized.
D Total returns would have been lower if certain expenses had not been reduced during the applicable periods shown.
E Fees and expenses of any underlying Fidelity Central Funds are not included in the Fund's expense ratio. The Fund indirectly bears its proportionate share of the expenses of any underlying Fidelity Central Funds.
F Expense ratios reflect operating expenses of the class. Expenses before reductions do not reflect amounts reimbursed by the investment adviser or reductions from brokerage service arrangements or reductions from other expense offset arrangements and do not represent the amount paid by the class during periods when reimbursements or reductions occur. Expense ratios before reductions for start-up periods may not be representative of longer-term operating periods. Expenses net of fee waivers reflect expenses after reimbursement by the investment adviser but prior to reductions from brokerage service arrangements or other expense offset arrangements. Expenses net of all reductions represent the net expenses paid by the class.
G Annualized
H Amount does not include the portfolio activity of any underlying Fidelity Central Funds.
I Portfolio turnover rate excludes securities received or delivered in-kind.
See accompanying notes which are an integral part of the financial statements.
Notes to Financial Statements
For the period ended November 30, 2015
(Amounts in thousands except percentages)
1. Organization.
Fidelity Advisor Equity Growth Fund (the Fund) is a fund of Fidelity Advisor Series I (the Trust) and is authorized to issue an unlimited number of shares. The Trust is registered under the Investment Company Act of 1940, as amended (the 1940 Act), as an open-end management investment company organized as a Massachusetts business trust. The Fund offers Class A, Class T, Class C, Class I (formerly Institutional Class) and Class Z shares, each of which, along with Class B shares, has equal rights as to assets and voting privileges. Class B shares are closed to new accounts and additional purchases, except for exchanges and reinvestments. Each class has exclusive voting rights with respect to matters that affect that class. Class B shares will automatically convert to Class A shares after a holding period of seven years from the initial date of purchase.
2. Investments in Fidelity Central Funds.
The Fund invests in Fidelity Central Funds, which are open-end investment companies generally available only to other investment companies and accounts managed by the investment adviser and its affiliates. The Fund's Schedule of Investments lists each of the Fidelity Central Funds held as of period end, if any, as an investment of the Fund, but does not include the underlying holdings of each Fidelity Central Fund. As an Investing Fund, the Fund indirectly bears its proportionate share of the expenses of the underlying Fidelity Central Funds.
The Money Market Central Funds seek preservation of capital and current income and are managed by Fidelity Investments Money Management, Inc. (FIMM), an affiliate of the investment adviser. Annualized expenses of the Money Market Central Funds as of their most recent shareholder report date are less than .005%.
A complete unaudited list of holdings for each Fidelity Central Fund is available upon request or at the Securities and Exchange Commission (the SEC) website at www.sec.gov. In addition, the financial statements of the Fidelity Central Funds, which are not covered by the Fund's Report of Independent Registered Public Accounting Firm, are available on the SEC website or upon request.
3. Significant Accounting Policies.
The financial statements have been prepared in conformity with accounting principles generally accepted in the United States of America (GAAP), which require management to make certain estimates and assumptions at the date of the financial statements. Actual results could differ from those estimates. Subsequent events, if any, through the date that the financial statements were issued have been evaluated in the preparation of the financial statements. The following summarizes the significant accounting policies of the Fund:
Investment Valuation. Investments are valued as of 4:00 p.m. Eastern time on the last calendar day of the period. The Board of Trustees (the Board) has delegated the day to day responsibility for the valuation of the Fund's investments to the Fidelity Management & Research Company (FMR) Fair Value Committee (the Committee). In accordance with valuation policies and procedures approved by the Board, the Fund attempts to obtain prices from one or more third party pricing vendors or brokers to value its investments. When current market prices, quotations or currency exchange rates are not readily available or reliable, investments will be fair valued in good faith by the Committee, in accordance with procedures adopted by the Board. Factors used in determining fair value vary by investment type and may include market or investment specific events. The frequency with which these procedures are used cannot be predicted and they may be utilized to a significant extent. The Committee oversees the Fund's valuation policies and procedures and reports to the Board on the Committee's activities and fair value determinations. The Board monitors the appropriateness of the procedures used in valuing the Fund's investments and ratifies the fair value determinations of the Committee.
The Fund categorizes the inputs to valuation techniques used to value its investments into a disclosure hierarchy consisting of three levels as shown below:
- Level 1 – quoted prices in active markets for identical investments
- Level 2 – other significant observable inputs (including quoted prices for similar investments, interest rates, prepayment speeds, etc.)
- Level 3 – unobservable inputs (including the Fund's own assumptions based on the best information available)
Valuation techniques used to value the Fund's investments by major category are as follows:
Equity securities, including restricted securities, for which market quotations are readily available, are valued at the last reported sale price or official closing price as reported by a third party pricing vendor on the primary market or exchange on which they are traded and are categorized as Level 1 in the hierarchy. In the event there were no sales during the day or closing prices are not available, securities are valued at the last quoted bid price or may be valued using the last available price and are generally categorized as Level 2 in the hierarchy. For foreign equity securities, when market or security specific events arise, comparisons to the valuation of American Depositary Receipts (ADRs), futures contracts, Exchange-Traded Funds (ETFs) and certain indexes as well as quoted prices for similar securities may be used and would be categorized as Level 2 in the hierarchy. Utilizing these techniques may result in transfers between Level 1 and Level 2. For equity securities, including restricted securities, where observable inputs are limited, assumptions about market activity and risk are used and these securities may be categorized as Level 3 in the hierarchy.
Investments in open-end mutual funds, including the Fidelity Central Funds, are valued at their closing net asset value (NAV) each business day and are categorized as Level 1 in the hierarchy.
Changes in valuation techniques may result in transfers in or out of an assigned level within the disclosure hierarchy. The aggregate value of investments by input level as of November 30, 2015 is included at the end of the Fund's Schedule of Investments.
Foreign Currency. The Fund may use foreign currency contracts to facilitate transactions in foreign-denominated securities. Gains and losses from these transactions may arise from changes in the value of the foreign currency or if the counterparties do not perform under the contracts' terms.
Foreign-denominated assets, including investment securities, and liabilities are translated into U.S. dollars at the exchange rates at period end. Purchases and sales of investment securities, income and dividends received and expenses denominated in foreign currencies are translated into U.S. dollars at the exchange rate in effect on the transaction date.
The effects of exchange rate fluctuations on investments are included with the net realized and unrealized gain (loss) on investment securities. Other foreign currency transactions resulting in realized and unrealized gain (loss) are disclosed separately.
Investment Transactions and Income. For financial reporting purposes, the Fund's investment holdings and NAV include trades executed through the end of the last business day of the period. The NAV per share for processing shareholder transactions is calculated as of the close of business of the New York Stock Exchange (NYSE), normally 4:00 p.m. Eastern time and includes trades executed through the end of the prior business day. Gains and losses on securities sold are determined on the basis of identified cost and may include proceeds received from litigation. Dividend income is recorded on the ex-dividend date, except for certain dividends from foreign securities where the ex-dividend date may have passed, which are recorded as soon as the Fund is informed of the ex-dividend date. Non-cash dividends included in dividend income, if any, are recorded at the fair market value of the securities received. Income and capital gain distributions from Fidelity Central Funds, if any, are recorded on the ex-dividend date. Distributions received on securities that represent a return of capital or capital gain are recorded as a reduction of cost of investments and/or as a realized gain. Subsequent to ex-dividend date the Fund determines the components of these distributions, based upon receipt of tax filings or other correspondence relating to the underlying investment. Investment income is recorded net of foreign taxes withheld where recovery of such taxes is uncertain.
Class Allocations and Expenses. Investment income, realized and unrealized capital gains and losses, common expenses of the Fund, and certain fund-level expense reductions, if any, are allocated daily on a pro-rata basis to each class based on the relative net assets of each class to the total net assets of the Fund. Each class differs with respect to transfer agent and distribution and service plan fees incurred. Certain expense reductions may also differ by class. For the reporting period, the allocated portion of income and expenses to each class as a percent of its average net assets may vary due to the timing of recording these transactions in relation to fluctuating net assets of the classes. Expenses directly attributable to a fund are charged to that fund. Expenses attributable to more than one fund are allocated among the respective funds on the basis of relative net assets or other appropriate methods. Expense estimates are accrued in the period to which they relate and adjustments are made when actual amounts are known.
Deferred Trustee Compensation. Under a Deferred Compensation Plan (the Plan), independent Trustees may elect to defer receipt of a portion of their annual compensation. Deferred amounts are invested in a cross-section of Fidelity funds, are marked-to-market and remain in the Fund until distributed in accordance with the Plan. The investment of deferred amounts and the offsetting payable to the Trustees are included in the accompanying Statement of Assets and Liabilities.
Income Tax Information and Distributions to Shareholders. Each year, the Fund intends to qualify as a regulated investment company under Subchapter M of the Internal Revenue Code, including distributing substantially all of its taxable income and realized gains. As a result, no provision for U.S. Federal income taxes is required. As of November 30, 2015, the Fund did not have any unrecognized tax benefits in the financial statements; nor is the Fund aware of any tax positions for which it is reasonably possible that the total amounts of unrecognized tax benefits will significantly change in the next twelve months. The Fund files a U.S. federal tax return, in addition to state and local tax returns as required. The Fund's federal income tax returns are subject to examination by the Internal Revenue Service (IRS) for a period of three fiscal years after they are filed. State and local tax returns may be subject to examination for an additional fiscal year depending on the jurisdiction. Foreign taxes are provided for based on the Fund's understanding of the tax rules and rates that exist in the foreign markets in which it invests.
Distributions are declared and recorded on the ex-dividend date. Income dividends and capital gain distributions are declared separately for each class. Income and capital gain distributions are determined in accordance with income tax regulations, which may differ from GAAP.
Capital accounts within the financial statements are adjusted for permanent book-tax differences. These adjustments have no impact on net assets or the results of operations. Capital accounts are not adjusted for temporary book-tax differences which will reverse in a subsequent period.
Book-tax differences are primarily due to foreign currency transactions, partnerships, deferred trustees compensation, net operating losses, capital loss carryforwards and losses deferred due to wash sales and excise tax regulations.
The federal tax cost of investment securities and unrealized appreciation (depreciation) as of period end were as follows:
| Gross unrealized appreciation | $676,173 |
| Gross unrealized depreciation | (119,104) |
| Net unrealized appreciation (depreciation) on securities | $557,069 |
| Tax Cost | $2,345,653 |
The tax-based components of distributable earnings as of period end were as follows:
| Undistributed long-term capital gain | $69,219 |
| Net unrealized appreciation (depreciation) on securities and other investments | $557,059 |
The Fund intends to elect to defer to its next fiscal year $9,526 of ordinary losses recognized during the period January 1, 2015 to November 30, 2015.
Restricted Securities. The Fund may invest in securities that are subject to legal or contractual restrictions on resale. These securities generally may be resold in transactions exempt from registration or to the public if the securities are registered. Disposal of these securities may involve time-consuming negotiations and expense, and prompt sale at an acceptable price may be difficult. Information regarding restricted securities is included at the end of the Fund's Schedule of Investments.
4. Purchases and Sales of Investments.
Purchases and sales of securities, other than short-term securities, aggregated $1,698,266 and $1,920,732, respectively.
5. Fees and Other Transactions with Affiliates.
Management Fee. Fidelity Management & Research Company (the investment adviser) and its affiliates provide the Fund with investment management related services for which the Fund pays a monthly management fee. The management fee is the sum of an individual fund fee rate that is based on an annual rate of .30% of the Fund's average net assets and an annualized group fee rate that averaged .25% during the period. The group fee rate is based upon the average net assets of all the mutual funds advised by the investment adviser, including any mutual funds previously advised by the investment adviser that are currently advised by Fidelity SelectCo, LLC, an affiliate of the investment adviser. The group fee rate decreases as assets under management increase and increases as assets under management decrease. For the reporting period, the total annual management fee rate was .55% of the Fund's average net assets.
Distribution and Service Plan Fees. In accordance with Rule 12b-1 of the 1940 Act, the Fund has adopted separate Distribution and Service Plans for each class of shares. Certain classes pay Fidelity Distributors Corporation (FDC), an affiliate of the investment adviser, separate Distribution and Service Fees, each of which is based on an annual percentage of each class' average net assets. In addition, FDC may pay financial intermediaries for selling shares of the Fund and providing shareholder support services. For the period, the Distribution and Service Fee rates, total fees and amounts retained by FDC were as follows:
| Distribution Fee | Service Fee | Total Fees | Retained by FDC | |
| Class A | -% | .25% | $2,163 | $30 |
| Class T | .25% | .25% | 6,697 | 14 |
| Class B | .75% | .25% | 140 | 106 |
| Class C | .75% | .25% | 1,779 | 118 |
| $10,779 | $268 |
Sales Load. FDC may receive a front-end sales charge of up to 5.75% for selling Class A shares and 3.50% for selling Class T shares, some of which is paid to financial intermediaries for selling shares of the Fund. Depending on the holding period, FDC may receive contingent deferred sales charges levied on Class A, Class T, Class B, and Class C redemptions. The deferred sales charges range from 5.00% to 1.00% for Class B shares, 1.00% for Class C shares, 1.00% for certain purchases of Class A shares and .25% for certain purchases of Class T shares.
For the period, sales charge amounts retained by FDC were as follows:
| Retained by FDC | |
| Class A | $103 |
| Class T | 39 |
| Class B(a) | 3 |
| Class C(a) | 11 |
| $156 |
(a) When Class B and Class C shares are initially sold, FDC pays commissions from its own resources to financial intermediaries through which the sales are made.
Transfer Agent Fees. Fidelity Investments Institutional Operations Company, Inc., (FIIOC), an affiliate of the investment adviser, is the transfer, dividend disbursing and shareholder servicing agent for each class of the Fund. FIIOC receives account fees and asset-based fees that vary according to the account size and type of account of the shareholders of the respective classes of the Fund, except for Class Z. FIIOC receives an asset-based fee of Class Z's average net assets. FIIOC pays for typesetting, printing and mailing of shareholder reports, except proxy statements.
For the period, transfer agent fees for each class were as follows:
| Amount | % of Class-Level Average Net Assets | |
| Class A | $1,822 | .21 |
| Class T | 2,478 | .19 |
| Class B | 42 | .30 |
| Class C | 390 | .22 |
| Class I | 795 | .19 |
| Class Z | 8 | .05 |
| $5,535 |
Accounting and Security Lending Fees. Fidelity Service Company, Inc. (FSC), an affiliate of the investment adviser, maintains the Fund's accounting records. The accounting fee is based on the level of average net assets for each month. Under a separate contract, FSC administers the security lending program. The security lending fee is based on the number and duration of lending transactions.
Brokerage Commissions. The Fund placed a portion of its portfolio transactions with brokerage firms which are affiliates of the investment adviser. Brokerage commissions are included in net realized gain (loss) and change in net unrealized appreciation (depreciation) in the Statement of Operations. The commissions paid to these affiliated firms were $21 for the period.
6. Committed Line of Credit.
The Fund participates with other funds managed by the investment adviser or an affiliate in a $4.25 billion credit facility (the "line of credit") to be utilized for temporary or emergency purposes to fund shareholder redemptions or for other short-term liquidity purposes. The Fund has agreed to pay commitment fees on its pro-rata portion of the line of credit, which amounted to $4 and is reflected in Miscellaneous expenses on the Statement of Operations. During the period, the Fund did not borrow on this line of credit.
7. Security Lending.
The Fund lends portfolio securities through a lending agent from time to time in order to earn additional income. For equity securities, a lending agent is used and may loan securities to certain qualified borrowers, including Fidelity Capital Markets (FCM), a broker-dealer affiliated with the Fund. On the settlement date of the loan, the Fund receives collateral (in the form of U.S. Treasury obligations, letters of credit and/or cash) against the loaned securities and maintains collateral in an amount not less than 100% of the market value of the loaned securities during the period of the loan. The market value of the loaned securities is determined at the close of business of the Fund and any additional required collateral is delivered to the Fund on the next business day. The Fund or borrower may terminate the loan at any time, and if the borrower defaults on its obligation to return the securities loaned because of insolvency or other reasons, the Fund may apply collateral received from the borrower against the obligation. The Fund may experience delays and costs in recovering the securities loaned. Any cash collateral received is invested in the Fidelity Securities Lending Cash Central Fund. The value of loaned securities and cash collateral at period end are disclosed on the Fund's Statement of Assets and Liabilities. The value of securities loaned to FCM at period end was $3,416. Security lending income represents the income earned on investing cash collateral, less rebates paid to borrowers and any lending agent fees associated with the loan, plus any premium payments received for lending certain types of securities. Security lending income is presented in the Statement of Operations as a component of income from Fidelity Central Funds. Total security lending income during the period amounted to $515, including $35 from securities loaned to FCM.
8. Expense Reductions.
Commissions paid to certain brokers with whom the investment adviser, or its affiliates, places trades on behalf of the Fund include an amount in addition to trade execution, which may be rebated back to the Fund to offset certain expenses. This amount totaled $89 for the period
In addition, during the period the investment adviser reimbursed and/or waived a portion of fund-level operating expenses in the amount of $11 and a portion of class-level operating expenses as follows:
| Amount | |
| Class A | $18 |
| Class T | 30 |
| Class B | –(a) |
| Class C | 4 |
| Class I | 21 |
| $73 |
(a) In the amount of less than five hundred dollars.
9. Share Transactions.
Share transactions for each class were as follows and may contain automatic conversions between classes or exchanges between funds:
| Shares | Shares | Dollars | Dollars | |
| Years ended November 30, | 2015 | 2014 | 2015 | 2014 |
| Class A | ||||
| Shares sold | 1,688 | 1,501 | $162,907 | $132,626 |
| Shares redeemed | (1,807) | (1,946) | (173,253) | (170,229) |
| Net increase (decrease) | (119) | (445) | $(10,346) | $(37,603) |
| Class T | ||||
| Shares sold | 1,492 | 1,656 | $141,497 | $144,112 |
| Shares redeemed | (2,839) | (2,920) | (269,251) | (253,312) |
| Net increase (decrease) | (1,347) | (1,264) | $(127,754) | $(109,200) |
| Class B | ||||
| Shares sold | 2 | 3 | $164 | $258 |
| Shares redeemed | (95) | (107) | (7,987) | (8,283) |
| Net increase (decrease) | (93) | (104) | $(7,823) | $(8,025) |
| Class C | ||||
| Shares sold | 365 | 262 | $31,362 | $20,995 |
| Shares redeemed | (360) | (341) | (30,838) | (26,719) |
| Net increase (decrease) | 5 | (79) | $524 | $(5,724) |
| Class I | ||||
| Shares sold | 1,565 | 2,450 | $159,813 | $230,126 |
| Shares redeemed | (1,508) | (12,811)(a) | (155,242) | (1,203,573)(a) |
| Net increase (decrease) | 57 | (10,361) | $4,571 | $(973,447) |
| Class Z | ||||
| Shares sold | 259 | – | $27,086 | $– |
| Shares redeemed | (19) | –(b) | (1,970) | (6) |
| Net increase (decrease) | 240 | –(b) | $25,116 | $(6) |
(a) Amount includes in-kind redemptions.
(b) In the amount of less than five hundred dollars.
10. Other.
The Fund's organizational documents provide former and current trustees and officers with a limited indemnification against liabilities arising in connection with the performance of their duties to the Fund. In the normal course of business, the Fund may also enter into contracts that provide general indemnifications. The Fund's maximum exposure under these arrangements is unknown as this would be dependent on future claims that may be made against the Fund. The risk of material loss from such claims is considered remote.
Report of Independent Registered Public Accounting Firm
To the Trustees of Fidelity Advisor Series I and Shareholders of Fidelity Advisor® Equity Growth Fund:
We have audited the accompanying statement of assets and liabilities of Fidelity Advisor® Equity Growth Fund (the Fund), a fund of Fidelity Advisor Series I, including the schedule of investments, as of November 30, 2015, and the related statement of operations for the year then ended, the statement of changes in net assets for each of the two years in the period then ended, and the financial highlights for each of the five years in the period then ended. These financial statements and financial highlights are the responsibility of the Fund's management. Our responsibility is to express an opinion on these financial statements and financial highlights based on our audits.
We conducted our audits in accordance with the standards of the Public Company Accounting Oversight Board (United States). Those standards require that we plan and perform the audit to obtain reasonable assurance about whether the financial statements and financial highlights are free of material misstatement. The Fund is not required to have, nor were we engaged to perform, an audit of its internal control over financial reporting. Our audits included consideration of internal control over financial reporting as a basis for designing audit procedures that are appropriate in the circumstances, but not for the purpose of expressing an opinion on the effectiveness of the Fund's internal control over financial reporting. Accordingly, we express no such opinion. An audit also includes examining, on a test basis, evidence supporting the amounts and disclosures in the financial statements, assessing the accounting principles used and significant estimates made by management, as well as evaluating the overall financial statement presentation. Our procedures included confirmation of securities owned as of November 30, 2015, by correspondence with the custodians and brokers; when replies were not received from brokers, we performed other auditing procedures. We believe our audits provide a reasonable basis for our opinion.
In our opinion, such financial statements and financial highlights referred to above present fairly, in all material respects, the financial position of Fidelity Advisor® Equity Growth Fund as of November 30, 2015, the results of its operations for the year then ended, the changes in its net assets for each of the two years in the period then ended, and the financial highlights for each of the five years in the period then ended in conformity with accounting principles generally accepted in the United States of America.
DELOITTE & TOUCHE LLP
Boston, Massachusetts
January 14, 2016
Trustees and Officers
The Trustees, Members of the Advisory Board (if any), and officers of the trust and fund, as applicable, are listed below. The Board of Trustees governs the fund and is responsible for protecting the interests of shareholders. The Trustees are experienced executives who meet periodically throughout the year to oversee the fund's activities, review contractual arrangements with companies that provide services to the fund, oversee management of the risks associated with such activities and contractual arrangements, and review the fund's performance. Each of the Trustees oversees 170 funds.
The Trustees hold office without limit in time except that (a) any Trustee may resign; (b) any Trustee may be removed by written instrument, signed by at least two-thirds of the number of Trustees prior to such removal; (c) any Trustee who requests to be retired or who has become incapacitated by illness or injury may be retired by written instrument signed by a majority of the other Trustees; and (d) any Trustee may be removed at any special meeting of shareholders by a two-thirds vote of the outstanding voting securities of the trust. Each Trustee who is not an interested person (as defined in the 1940 Act) of the trust and the fund is referred to herein as an Independent Trustee. Each Independent Trustee shall retire not later than the last day of the calendar year in which his or her 75th birthday occurs. The Independent Trustees may waive this mandatory retirement age policy with respect to individual Trustees. Officers and Advisory Board Members hold office without limit in time, except that any officer or Advisory Board Member may resign or may be removed by a vote of a majority of the Trustees at any regular meeting or any special meeting of the Trustees. Except as indicated, each individual has held the office shown or other offices in the same company for the past five years.
The fund’s Statement of Additional Information (SAI) includes more information about the Trustees. To request a free copy, call Fidelity at 1-877-208-0098.
Experience, Skills, Attributes, and Qualifications of the Trustees. The Governance and Nominating Committee has adopted a statement of policy that describes the experience, qualifications, attributes, and skills that are necessary and desirable for potential Independent Trustee candidates (Statement of Policy). The Board believes that each Trustee satisfied at the time he or she was initially elected or appointed a Trustee, and continues to satisfy, the standards contemplated by the Statement of Policy. The Governance and Nominating Committee also engages professional search firms to help identify potential Independent Trustee candidates who have the experience, qualifications, attributes, and skills consistent with the Statement of Policy. From time to time, additional criteria based on the composition and skills of the current Independent Trustees, as well as experience or skills that may be appropriate in light of future changes to board composition, business conditions, and regulatory or other developments, have also been considered by the professional search firms and the Governance and Nominating Committee. In addition, the Board takes into account the Trustees' commitment and participation in Board and committee meetings, as well as their leadership of standing and ad hoc committees throughout their tenure.
In determining that a particular Trustee was and continues to be qualified to serve as a Trustee, the Board has considered a variety of criteria, none of which, in isolation, was controlling. The Board believes that, collectively, the Trustees have balanced and diverse experience, qualifications, attributes, and skills, which allow the Board to operate effectively in governing the fund and protecting the interests of shareholders. Information about the specific experience, skills, attributes, and qualifications of each Trustee, which in each case led to the Board's conclusion that the Trustee should serve (or continue to serve) as a trustee of the fund, is provided below.
Board Structure and Oversight Function. James C. Curvey is an interested person and currently serves as Chairman. The Trustees have determined that an interested Chairman is appropriate and benefits shareholders because an interested Chairman has a personal and professional stake in the quality and continuity of services provided to the fund. Independent Trustees exercise their informed business judgment to appoint an individual of their choosing to serve as Chairman, regardless of whether the Trustee happens to be independent or a member of management. The Independent Trustees have determined that they can act independently and effectively without having an Independent Trustee serve as Chairman and that a key structural component for assuring that they are in a position to do so is for the Independent Trustees to constitute a substantial majority for the Board. The Independent Trustees also regularly meet in executive session. Ned C. Lautenbach serves as Chairman of the Independent Trustees and as such (i) acts as a liaison between the Independent Trustees and management with respect to matters important to the Independent Trustees and (ii) with management prepares agendas for Board meetings.
Fidelity® funds are overseen by different Boards of Trustees. The fund's Board oversees Fidelity's high income and certain equity funds, and other Boards oversee Fidelity's investment-grade bond, money market, asset allocation, and sector funds. The asset allocation funds may invest in Fidelity® funds overseen by the fund's Board. The use of separate Boards, each with its own committee structure, allows the Trustees of each group of Fidelity® funds to focus on the unique issues of the funds they oversee, including common research, investment, and operational issues. On occasion, the separate Boards establish joint committees to address issues of overlapping consequences for the Fidelity® funds overseen by each Board.
The Trustees operate using a system of committees to facilitate the timely and efficient consideration of all matters of importance to the Trustees, the fund, and fund shareholders and to facilitate compliance with legal and regulatory requirements and oversight of the fund's activities and associated risks. The Board, acting through its committees, has charged FMR and its affiliates with (i) identifying events or circumstances the occurrence of which could have demonstrably adverse effects on the fund's business and/or reputation; (ii) implementing processes and controls to lessen the possibility that such events or circumstances occur or to mitigate the effects of such events or circumstances if they do occur; and (iii) creating and maintaining a system designed to evaluate continuously business and market conditions in order to facilitate the identification and implementation processes described in (i) and (ii) above. Because the day-to-day operations and activities of the fund are carried out by or through FMR, its affiliates, and other service providers, the fund's exposure to risks is mitigated but not eliminated by the processes overseen by the Trustees. While each of the Board's committees has responsibility for overseeing different aspects of the fund's activities, oversight is exercised primarily through the Operations, Audit, and Compliance Committees. In addition, the Independent Trustees have worked with FMR to enhance the Board's oversight of investment and financial risks, legal and regulatory risks, technology risks, and operational risks, including the development of additional risk reporting to the Board. For example, a working group comprised of Independent Trustees and FMR has worked and continues to work to review the Fidelity® funds' valuation-related activities, reporting and risk management. Appropriate personnel, including but not limited to the fund's Chief Compliance Officer (CCO), FMR's internal auditor, the independent accountants, the fund's Treasurer and portfolio management personnel, make periodic reports to the Board's committees, as appropriate, including an annual review of Fidelity's risk management program for the Fidelity® funds. The responsibilities of each standing committee, including their oversight responsibilities, are described further under "Standing Committees of the Trustees."
Interested Trustees*:
Correspondence intended for a Trustee who is an interested person may be sent to Fidelity Investments, 245 Summer Street, Boston, Massachusetts 02210.
Name, Year of Birth; Principal Occupations and Other Relevant Experience+
James C. Curvey (1935)
Year of Election or Appointment: 2007
Trustee
Chairman of the Board of Trustees
Mr. Curvey also serves as Trustee of other Fidelity® funds. Mr. Curvey is a Director of Fidelity Research & Analysis Co. (investment adviser firm, 2009-present), and Vice Chairman (2007-present) and Director of FMR LLC (diversified financial services company). In addition, Mr. Curvey serves as an Overseer for the Boston Symphony Orchestra and a member of the board of Artis-Naples, Naples, Florida, and as a Trustee for Brewster Academy, Wolfeboro, New Hampshire. Previously, Mr. Curvey served as a Director of Fidelity Investments Money Management, Inc. (investment adviser firm, 2009-2014) and a Director of FMR and FMR Co., Inc. (investment adviser firms, 2007-2014).
Charles S. Morrison (1960)
Year of Election or Appointment: 2014
Trustee
Mr. Morrison also serves as Trustee of other funds. He serves as a Director of Fidelity Investments Money Management, Inc. (FIMM) (investment adviser firm, 2014-present), Director of Fidelity SelectCo, LLC (investment adviser firm, 2014-present), President, Asset Management (2014-present), and is an employee of Fidelity Investments. Previously, Mr. Morrison served as Vice President of Fidelity's Fixed Income and Asset Allocation Funds (2012-2014), President, Fixed Income (2011-2014), Vice President of Fidelity's Money Market Funds (2005-2009), President, Money Market Group Leader of FMR (investment adviser firm, 2009), and Senior Vice President, Money Market Group of FMR (2004-2009). Mr. Morrison also served as Vice President of Fidelity's Bond Funds (2002-2005), certain Balanced Funds (2002-2005), and certain Asset Allocation Funds (2002-2007), and as Senior Vice President (2002-2005) of Fidelity's Bond Division.
* Determined to be an “Interested Trustee” by virtue of, among other things, his or her affiliation with the trust or various entities under common control with FMR.
+ The information includes the Trustee's principal occupation during the last five years and other information relating to the experience, attributes, and skills relevant to the Trustee's qualifications to serve as a Trustee, which led to the conclusion that the Trustee should serve as a Trustee for the fund.
Independent Trustees:
Correspondence intended for an Independent Trustee may be sent to Fidelity Investments, P.O. Box 55235, Boston, Massachusetts 02205-5235.
Name, Year of Birth; Principal Occupations and Other Relevant Experience+
Dennis J. Dirks (1948)
Year of Election or Appointment: 2005
Trustee
Mr. Dirks also serves as Trustee of other Fidelity® funds. Prior to his retirement in May 2003, Mr. Dirks was Chief Operating Officer and a member of the Board of The Depository Trust & Clearing Corporation (DTCC). He also served as President, Chief Operating Officer, and Board member of The Depository Trust Company (DTC) and President and Board member of the National Securities Clearing Corporation (NSCC). In addition, Mr. Dirks served as Chief Executive Officer and Board member of the Government Securities Clearing Corporation, Chief Executive Officer and Board member of the Mortgage-Backed Securities Clearing Corporation, as a Trustee and a member of the Finance Committee of Manhattan College (2005-2008), as a Trustee and a member of the Finance Committee of AHRC of Nassau County (2006-2008), and as a member of the Independent Directors Council (IDC) Governing Council (2010-2015). Mr. Dirks is a member of the Board of Directors for The Brookville Center for Children's Services, Inc. (2009-present).
Alan J. Lacy (1953)
Year of Election or Appointment: 2008
Trustee
Mr. Lacy also serves as Trustee of other Fidelity® funds. Mr. Lacy serves as a member of the Board of Directors of Dave & Buster's Entertainment, Inc. (restaurant and entertainment complexes, 2010-present) and Bristol-Myers Squibb Company (global pharmaceuticals, 2008-present). In addition, Mr. Lacy served as Senior Adviser (2007-2014) of Oak Hill Capital Partners, L.P. (private equity) and also served as Chief Executive Officer (2000-2005) and Vice Chairman (2005-2006) of Sears Holdings Corporation and Sears, Roebuck and Co. (retail). Mr. Lacy is a member of the Board of Trustees of The National Parks Conservation Association (2006-present). Previously, Mr. Lacy served as Chairman of the Board of Trustees of the National Parks Conservation Association (2008-2011) and as a member of the Board of Directors for The Western Union Company (global money transfer, 2006-2011), The Hillman Companies, Inc. (hardware wholesalers, 2010-2014), and Earth Fare, Inc. (retail grocery, 2010-2014).
Ned C. Lautenbach (1944)
Year of Election or Appointment: 2000
Trustee
Chairman of the Independent Trustees
Mr. Lautenbach also serves as Trustee of other Fidelity® funds. Mr. Lautenbach currently serves as the Lead Director of the Eaton Corporation Board of Directors (diversified industrial, 1997-present). Mr. Lautenbach is Chairman of the Board of Directors of Artis-Naples in Naples, Florida (2012-present), a member of the Council on Foreign Relations (1994-present), and a member of the Board of Governors, State University System of Florida (2013-present). Previously, Mr. Lautenbach was a Partner/Advisory Partner at Clayton, Dubilier & Rice, LLC (private equity investment, 1998-2010), as well as a Director of Sony Corporation (2006-2007).
Joseph Mauriello (1944)
Year of Election or Appointment: 2008
Trustee
Mr. Mauriello also serves as Trustee of other Fidelity® funds. Prior to his retirement in January 2006, Mr. Mauriello served in numerous senior management positions including Deputy Chairman and Chief Operating Officer (2004-2005), and Vice Chairman of Financial Services (2002-2004) of KPMG LLP US (professional services, 1965-2005). Mr. Mauriello currently serves as a member of the Board of Directors of XL Group plc. (global insurance and re-insurance, 2006-present) and the Independent Directors Council (IDC) Governing Council (2015-present). Previously, Mr. Mauriello served as a Director of the Hamilton Funds of the Bank of New York (2006-2007) and of Arcadia Resources Inc. (health care services and products, 2007-2012).
Robert W. Selander (1950)
Year of Election or Appointment: 2011
Trustee
Mr. Selander also serves as Trustee of other Fidelity® funds. Mr. Selander serves as a Director of The Western Union Company (global money transfer, 2014-present). Previously, Mr. Selander served as a Member of the Advisory Board of other Fidelity® funds (2011), and Executive Vice Chairman (2010), Chief Executive Officer (2009-2010), and President and Chief Executive Officer (1997-2009) of Mastercard, Inc.
Cornelia M. Small (1944)
Year of Election or Appointment: 2005
Trustee
Ms. Small also serves as Trustee of other Fidelity® funds. Ms. Small is a member of the Board of Directors (2009-present) and Chair of the Investment Committee (2010-present) of the Teagle Foundation. Ms. Small also serves on the Investment Committee of the Berkshire Taconic Community Foundation (2008-present). Previously, Ms. Small served as Chairperson (2002-2008) and a member of the Investment Committee and Chairperson (2008-2012) and a member of the Board of Trustees of Smith College. In addition, Ms. Small served as Chief Investment Officer, Director of Global Equity Investments, and a member of the Board of Directors of Scudder, Stevens & Clark and Scudder Kemper Investments.
William S. Stavropoulos (1939)
Year of Election or Appointment: 2002
Trustee
Vice Chairman of the Independent Trustees
Mr. Stavropoulos also serves as Trustee of other Fidelity® funds. Mr. Stavropoulos serves as President and Founder of the Michigan Baseball Foundation, the Great Lakes Loons (2007-present). Mr. Stavropoulos is Chairman Emeritus of the Board of Directors of The Dow Chemical Company, where he previously served in numerous senior management positions, including President, CEO (1995-2000; 2002-2004), Chairman of the Executive Committee (2000-2006), and as a member of the Board of Directors (1990-2006). Currently, Mr. Stavropoulos is Chairman of the Board of Directors of Univar Inc. (global distributor of commodity and specialty chemicals), a Director of Teradata Corporation (data warehousing and technology solutions), and Maersk Inc. (industrial conglomerate), and a member of the Advisory Board for Metalmark Capital LLC (private equity investment, 2005-present). Mr. Stavropoulos is an operating advisor to Clayton, Dubilier & Rice, LLC (private equity investment). In addition, Mr. Stavropoulos is a member of the University of Notre Dame Advisory Council for the College of Science, a Trustee of the Rollin L. Gerstacker Foundation, and a Director of the Naples Philharmonic Center for the Arts. Previously, Mr. Stavropoulos served as a Director of Chemical Financial Corporation (bank holding company, 1993-2012) and Tyco International, Ltd. (multinational manufacturing and services, 2007-2012).
David M. Thomas (1949)
Year of Election or Appointment: 2008
Trustee
Mr. Thomas also serves as Trustee of other Fidelity® funds. Mr. Thomas serves as Non-Executive Chairman of the Board of Directors of Fortune Brands Home and Security (home and security products, 2011-present), as a member of the Board of Directors (2004-present) and Presiding Director (2013-present) of Interpublic Group of Companies, Inc. (marketing communication), and as a member of the Board of Trustees of the University of Florida (2013-present). Previously, Mr. Thomas served as Executive Chairman (2005-2006) and Chairman and Chief Executive Officer (2000-2005) of IMS Health, Inc. (pharmaceutical and healthcare information solutions), and a Director of Fortune Brands, Inc. (consumer products, 2000-2011).
+ The information includes the Trustee's principal occupation during the last five years and other information relating to the experience, attributes, and skills relevant to the Trustee's qualifications to serve as a Trustee, which led to the conclusion that the Trustee should serve as a Trustee for the fund.
Advisory Board Members and Officers:
Correspondence intended for an officer or Peter S. Lynch may be sent to Fidelity Investments, 245 Summer Street, Boston, Massachusetts 02210. Officers appear below in alphabetical order.
Name, Year of Birth; Principal Occupation
Peter S. Lynch (1944)
Year of Election or Appointment: 2003
Member of the Advisory Board
Mr. Lynch also serves as Member of the Advisory Board of other Fidelity® funds. Mr. Lynch is Vice Chairman and a Director of FMR (investment adviser firm) and FMR Co., Inc. (investment adviser firm). In addition, Mr. Lynch serves as a Trustee of Boston College and as the Chairman of the Inner-City Scholarship Fund. Previously, Mr. Lynch served on the Special Olympics International Board of Directors (1997-2006).
Elizabeth Paige Baumann (1968)
Year of Election or Appointment: 2012
Anti-Money Laundering (AML) Officer
Ms. Baumann also serves as AML Officer of other funds. She is Chief AML Officer of FMR LLC (diversified financial services company, 2012-present) and is an employee of Fidelity Investments. Previously, Ms. Baumann served as Vice President and Deputy Anti-Money Laundering Officer (2007-2012).
Marc R. Bryant (1966)
Year of Election or Appointment: 2015
Secretary and Chief Legal Officer (CLO)
Mr. Bryant also serves as Secretary and CLO of other funds. Mr. Bryant serves as CLO, Secretary, and Senior Vice President of Fidelity Management & Research Company (investment adviser firm, 2015-present) and FMR Co., Inc. (investment adviser firm, 2015-present); Secretary of Fidelity SelectCo, LLC (investment adviser firm, 2015-present) and Fidelity Investments Money Management, Inc. (investment adviser firm, 2015-present); and CLO of Fidelity Management & Research (Hong Kong) Limited (investment adviser firm, 2015-present). He is Senior Vice President and Deputy General Counsel of FMR LLC (diversified financial services company). Previously, Mr. Bryant served as Secretary and CLO of Fidelity Rutland Square Trust II (2010-2014) and Assistant Secretary of Fidelity's Fixed Income and Asset Allocation Funds (2013-2015). Prior to joining Fidelity Investments, Mr. Bryant served as a Senior Vice President and the Head of Global Retail Legal for AllianceBernstein L.P. (2006-2010), and as the General Counsel for ProFund Advisors LLC (2001-2006).
William C. Coffey (1969)
Year of Election or Appointment: 2009
Assistant Secretary
Mr. Coffey also serves as Assistant Secretary of other funds. He is Senior Vice President and Deputy General Counsel of FMR LLC (diversified financial services company, 2010-present), and is an employee of Fidelity Investments. Previously, Mr. Coffey served as Vice President and Associate General Counsel of FMR LLC (2005-2009).
Jonathan Davis (1968)
Year of Election or Appointment: 2010
Assistant Treasurer
Mr. Davis also serves as Assistant Treasurer of other funds, and is an employee of Fidelity Investments. Previously, Mr. Davis served as Vice President and Associate General Counsel of FMR LLC (diversified financial services company, 2003-2010).
Adrien E. Deberghes (1967)
Year of Election or Appointment: 2008
Deputy Treasurer
Mr. Deberghes also serves as an officer of other funds. He is an employee of Fidelity Investments (2008-present). Prior to joining Fidelity Investments, Mr. Deberghes was Senior Vice President of Mutual Fund Administration at State Street Corporation (2007-2008), Senior Director of Mutual Fund Administration at Investors Bank & Trust (2005-2007), and Director of Finance for Dunkin' Brands (2000-2005).
Stephanie J. Dorsey (1969)
Year of Election or Appointment: 2010
Assistant Treasurer
Ms. Dorsey also serves as an officer of other funds. She is an employee of Fidelity Investments (2008-present) and has served in other fund officer roles. Prior to joining Fidelity Investments, Ms. Dorsey served as Treasurer (2004-2008) of the JPMorgan Mutual Funds and Vice President (2004-2008) of JPMorgan Chase Bank.
Howard J. Galligan III (1966)
Year of Election or Appointment: 2014
Chief Financial Officer
Mr. Galligan also serves as Chief Financial Officer of other funds. Mr. Galligan serves as President of Fidelity Pricing and Cash Management Services (FPCMS) (2014-present) and as a Director of Strategic Advisers, Inc. (investment adviser firm, 2008-present). Previously, Mr. Galligan served as Chief Administrative Officer of Asset Management (2011-2014) and Chief Operating Officer and Senior Vice President of Investment Support for Strategic Advisers, Inc. (2003-2011).
Scott C. Goebel (1968)
Year of Election or Appointment: 2015
Vice President
Mr. Goebel serves as Vice President of other funds and is an employee of Fidelity Investments (2001-present). Previously, Mr. Goebel served as Secretary of Fidelity SelectCo, LLC (investment adviser firm, 2013-2015), Fidelity Investments Money Management, Inc. (FIMM) (investment adviser firm, 2010-2015), and Fidelity Research and Analysis Company (FRAC) (investment adviser firm, 2010-2015); General Counsel, Secretary, and Senior Vice President of Fidelity Management & Research Company (investment adviser firm, 2008-2015) and FMR Co., Inc. (investment adviser firm, 2008-2015); Assistant Secretary of Fidelity Management & Research (Japan) Limited (investment adviser firm, 2008-2015) and FMR Investment Management (U.K.) Limited (investment adviser firm, 2008-2015); Chief Legal Officer (CLO) of Fidelity Management & Research (Hong Kong) Limited (investment adviser firm, 2008-2015); Secretary and CLO of certain Fidelity® funds (2008-2015); Assistant Secretary of FIMM (2008-2010), FRAC (2008-2010), and certain funds (2007-2008); and as Vice President and Secretary of Fidelity Distributors Corporation (FDC) (2005-2007).
Brian B. Hogan (1964)
Year of Election or Appointment: 2009
Vice President
Mr. Hogan also serves as Trustee or Vice President of other funds. Mr. Hogan serves as a Director of Fidelity SelectCo, LLC (investment adviser firm, 2014-present) and President of the Equity Division of FMR (investment adviser firm, 2009-present). Previously, Mr. Hogan served as Senior Vice President, Equity Research of FMR (2006-2009) and as a portfolio manager.
Chris Maher (1972)
Year of Election or Appointment: 2013
Assistant Treasurer
Mr. Maher serves as Assistant Treasurer of other funds. Mr. Maher is Vice President of Valuation Oversight and is an employee of Fidelity Investments. Previously, Mr. Maher served as Vice President of Asset Management Compliance (2013), Vice President of the Program Management Group of FMR (investment adviser firm, 2010-2013), and Vice President of Valuation Oversight (2008-2010).
Melissa M. Reilly (1971)
Year of Election or Appointment: 2014
Vice President of certain Equity Funds
Ms. Reilly also serves as Vice President of other funds. Ms. Reilly is an employee of Fidelity Investments (2004-present).
Kenneth B. Robins (1969)
Year of Election or Appointment: 2008
President and Treasurer
Mr. Robins also serves as an officer of other funds. Mr. Robins serves as Executive Vice President of Fidelity Investments Money Management, Inc. (FIMM) (investment adviser firm, 2013-present) and is an employee of Fidelity Investments (2004-present). Previously, Mr. Robins served in other fund officer roles.
Stacie M. Smith (1974)
Year of Election or Appointment: 2013
Deputy Treasurer
Ms. Smith also serves as an officer of other funds. She is an employee of Fidelity Investments (2009-present) and has served in other fund officer roles. Prior to joining Fidelity Investments, Ms. Smith served as Senior Audit Manager of Ernst & Young LLP (1996-2009).
Renee Stagnone (1975)
Year of Election or Appointment: 2013
Deputy Treasurer
Ms. Stagnone also serves as Deputy Treasurer of other funds. Ms. Stagnone is an employee of Fidelity Investments (1997-present).
Linda J. Wondrack (1964)
Year of Election or Appointment: 2014
Chief Compliance Officer
Ms. Wondrack also serves as Chief Compliance Officer of other funds. Ms. Wondrack is Executive Vice President and head of the Ethics Office and Asset Management Compliance for Fidelity Investments (2012-present). Ms. Wondrack also serves as Chief Compliance Officer of Fidelity SelectCo, LLC (investment adviser firm, 2014-present); Chief Compliance Officer of Impresa Management LLC (2013-present); and Chief Compliance Officer of FMR Co., Inc. (investment adviser firm), Fidelity Investments Money Management, Inc. (investment adviser firm), Fidelity Management & Research (Japan) Limited (investment adviser firm), FMR Investment Management (U.K.) Limited (investment adviser firm), Fidelity Management & Research (Hong Kong) (investment adviser firm), Fidelity Management & Research Company (investment adviser firm), FIAM LLC (investment adviser firm), and Strategic Advisers, Inc. (investment adviser firm), Ballyrock Investment Advisors LLC, and Northern Neck Investors LLC (2012-present). Previously, Ms. Wondrack served as Senior Vice President and Chief Compliance Officer for Columbia Management Investment Advisers, LLC (2005-2012); Chief Compliance Officer for certain funds within the Columbia Family of Funds (2007-2012); and Senior Vice President of Compliance Risk Management at Bank of America (2005-2010).
Joseph F. Zambello (1957)
Year of Election or Appointment: 2011
Deputy Treasurer
Mr. Zambello also serves as Deputy Treasurer of other funds. Mr. Zambello is an employee of Fidelity Investments (1991-present). Previously, Mr. Zambello served as Vice President of the Program Management Group of FMR (investment adviser firm, 2009-2011) and Vice President of the Transfer Agent Oversight Group (2005-2009).
Shareholder Expense Example
As a shareholder of the Fund, you incur two types of costs: (1) transaction costs, including sales charges (loads) on purchase payments or redemption proceeds, and (2) ongoing costs, including management fees, distribution and/or service (12b-1) fees and other Fund expenses. This Example is intended to help you understand your ongoing costs (in dollars) of investing in the Fund and to compare these costs with the ongoing costs of investing in other mutual funds.
The Example is based on an investment of $1,000 invested at the beginning of the period and held for the entire period (June 1, 2015 to November 30, 2015).
Actual Expenses
The first line of the accompanying table for each class of the Fund provides information about actual account values and actual expenses. You may use the information in this line, together with the amount you invested, to estimate the expenses that you paid over the period. Simply divide your account value by $1,000.00 (for example, an $8,600 account value divided by $1,000.00 = 8.6), then multiply the result by the number in the first line for a class of the Fund under the heading entitled "Expenses Paid During Period" to estimate the expenses you paid on your account during this period. In addition, the Fund, as a shareholder in the underlying Fidelity Central Funds, will indirectly bear its pro-rata share of the fees and expenses incurred by the underlying Fidelity Central Funds. These fees and expenses are not included in the Fund's annualized expense ratio used to calculate the expense estimate in the table below.
Hypothetical Example for Comparison Purposes
The second line of the accompanying table for each class of the Fund provides information about hypothetical account values and hypothetical expenses based on a Class' actual expense ratio and an assumed rate of return of 5% per year before expenses, which is not the Class' actual return. The hypothetical account values and expenses may not be used to estimate the actual ending account balance or expenses you paid for the period. You may use this information to compare the ongoing costs of investing in the Fund and other funds. To do so, compare this 5% hypothetical example with the 5% hypothetical examples that appear in the shareholder reports of the other funds. In addition, the Fund, as a shareholder in the underlying Fidelity Central Funds, will indirectly bear its pro-rata share of the fees and expenses incurred by the underlying Fidelity Central Funds. These fees and expenses are not included in the Fund's annualized expense ratio used to calculate the expense estimate in the table below.
Please note that the expenses shown in the table are meant to highlight your ongoing costs only and do not reflect any transaction costs. Therefore, the second line of the table is useful in comparing ongoing costs only, and will not help you determine the relative total costs of owning different funds. In addition, if these transactional costs were included, your costs would have been higher.
| Annualized Expense Ratio-A | Beginning Account Value June 1, 2015 | Ending Account Value November 30, 2015 | Expenses Paid During Period-B June 1, 2015 to November 30, 2015 | |
| Class A | 1.04% | |||
| Actual | $1,000.00 | $1,012.80 | $5.25 | |
| Hypothetical-C | $1,000.00 | $1,019.85 | $5.27 | |
| Class T | 1.27% | |||
| Actual | $1,000.00 | $1,011.60 | $6.40 | |
| Hypothetical-C | $1,000.00 | $1,018.70 | $6.43 | |
| Class B | 1.88% | |||
| Actual | $1,000.00 | $1,008.50 | $9.47 | |
| Hypothetical-C | $1,000.00 | $1,015.64 | $9.50 | |
| Class C | 1.80% | |||
| Actual | $1,000.00 | $1,008.90 | $9.06 | |
| Hypothetical-C | $1,000.00 | $1,016.04 | $9.10 | |
| Class I | .77% | |||
| Actual | $1,000.00 | $1,014.20 | $3.89 | |
| Hypothetical-C | $1,000.00 | $1,021.21 | $3.90 | |
| Class Z | .64% | |||
| Actual | $1,000.00 | $1,014.90 | $3.23 | |
| Hypothetical-C | $1,000.00 | $1,021.86 | $3.24 |
A Annualized expense ratio reflects expenses net of applicable fee waivers.
B Expenses are equal to each Class' annualized expense ratio, multiplied by the average account value over the period, multiplied by 183/365 (to reflect the one-half year period).
C 5% return per year before expenses
Distributions (Unaudited)
The Board of Trustees of Fidelity Advisor Equity Growth Fund voted to pay to shareholders of record at the opening of business on record date, the following distributions per share derived from capital gains realized from sales of portfolio securities, and dividends derived from net investment income:
| Pay Date | Record Date | Capital Gains | ||
| Class I | 12/07/15 | 12/04/15 | $2.288 | |
| 01/11/16 | 01/08/16 | $0.092 | ||
The fund hereby designates as a capital gain dividend with respect to the taxable year ended November 30, 2015, $69,219,051, or, if subsequently determined to be different, the net capital gain of such year.
The fund will notify shareholders in January 2016 of amounts for use in preparing 2015 income tax returns.
Board Approval of Investment Advisory Contracts and Management Fees
Fidelity Advisor Equity Growth Fund
Each year, the Board of Trustees, including the Independent Trustees (together, the Board), votes on the renewal of the management contract with Fidelity Management & Research Company (FMR) and the sub-advisory agreements (together, the Advisory Contracts) for the fund. The Board, assisted by the advice of fund counsel and Independent Trustees' counsel, requests and considers a broad range of information relevant to the renewal of the Advisory Contracts throughout the year.
The Board meets regularly and, at each of its meetings, covers an extensive agenda of topics and materials and considers factors that are relevant to its annual consideration of the renewal of the fund's Advisory Contracts, including the services and support provided to the fund and its shareholders. The Board has established various standing committees (Committees), each composed of and chaired by Independent Trustees with varying backgrounds, to which the Board has assigned specific subject matter responsibilities in order to enhance effective decision-making by the Board. The Board, acting directly and through its Committees, requests and receives information concerning the annual consideration of the renewal of the fund's Advisory Contracts. The Board also meets as needed to consider matters specifically related to the Board's annual consideration of the renewal of the Advisory Contracts. Members of the Board may also meet with trustees of other Fidelity funds through ad hoc joint committees to discuss certain matters relevant to all of the Fidelity funds.
At its July 2015 meeting, the Board unanimously determined to renew the fund's Advisory Contracts. In reaching its determination, the Board considered all factors it believed relevant, including (i) the nature, extent, and quality of the services to be provided to the fund and its shareholders (including the investment performance of the fund); (ii) the competitiveness of the fund's management fee and total expense ratio relative to peer funds; (iii) the total costs of the services to be provided by and the profits to be realized by Fidelity from its relationship with the fund; and (iv) the extent to which (if any) economies of scale exist and would be realized as the fund grows, and whether any economies of scale are appropriately shared with fund shareholders.
In considering whether to renew the Advisory Contracts for the fund, the Board reached a determination, with the assistance of fund counsel and Independent Trustees' counsel and through the exercise of its business judgment, that the renewal of the Advisory Contracts was in the best interests of the fund and its shareholders and that the compensation payable under the Advisory Contracts was fair and reasonable. The Board's decision to renew the Advisory Contracts was not based on any single factor, but rather was based on a comprehensive consideration of all the information provided to the Board at its meetings throughout the year. The Board, in reaching its determination to renew the Advisory Contracts, was aware that shareholders of the fund have a broad range of investment choices available to them, including a wide choice among funds offered by Fidelity's competitors, and that the fund's shareholders, who have the opportunity to review and weigh the disclosure provided by the fund in its prospectus and other public disclosures, have chosen to invest in this fund, which is part of the Fidelity family of funds.
Nature, Extent, and Quality of Services Provided. The Board considered Fidelity's staffing as it relates to the fund, including the backgrounds of investment personnel of Fidelity, and also considered the fund's investment objective, strategies, and related investment philosophy. The Independent Trustees also had discussions with senior management of Fidelity's investment operations and investment groups. The Board considered the structure of the portfolio manager compensation program and whether this structure provides appropriate incentives to act in the best interests of the fund. Additionally, the Board considered the portfolio managers' investments, if any, in the funds that they manage.Resources Dedicated to Investment Management and Support Services. The Board and the Fund Oversight and Research Committees reviewed the general qualifications and capabilities of Fidelity's investment staff, including its size, education, experience, and resources, as well as Fidelity's approach to recruiting, training, managing, and compensating investment personnel. The Board noted that Fidelity has continued to increase the resources devoted to non-U.S. offices, including expansion of Fidelity's global investment organization. The Board also noted that Fidelity's analysts have extensive resources, tools and capabilities that allow them to conduct sophisticated quantitative and fundamental analysis, as well as credit analysis of issuers, counterparties and guarantors. Further, the Board considered that Fidelity's investment professionals have sufficient access to global information and data so as to provide competitive investment results over time, and that those professionals also have access to sophisticated tools that permit them to assess portfolio construction and risk and performance attribution characteristics continuously, as well as to transmit new information and research conclusions rapidly around the world. Additionally, in its deliberations, the Board considered Fidelity's trading, risk management, and compliance capabilities and resources, which are integral parts of the investment management process.Shareholder and Administrative Services. The Board considered (i) the nature, extent, quality, and cost of advisory, administrative, and shareholder services performed by FMR, the sub-advisers (together with FMR, the Investment Advisers), and their affiliates under the Advisory Contracts and under separate agreements covering transfer agency, pricing and bookkeeping, and securities lending services for the fund; (ii) the nature and extent of the supervision of third party service providers, principally custodians and subcustodians; and (iii) the resources devoted to, and the record of compliance with, the fund's compliance policies and procedures. The Board also reviewed the allocation of fund brokerage, including allocations to brokers affiliated with the Investment Advisers, the use of brokerage commissions to pay fund expenses, and the use of "soft" commission dollars to pay for research services.The Board noted that the growth of fund assets over time across the complex allows Fidelity to reinvest in the development of services designed to enhance the value or convenience of the Fidelity funds as investment vehicles. These services include 24-hour access to account information and market information through telephone representatives and over the Internet, investor education materials and asset allocation tools, and the expanded availability of Fidelity Investor Centers.In 2014, the Board formed an ad hoc Committee on Transfer Agency Fees to review the variety of transfer agency fee structures throughout the industry and Fidelity's competitive positioning with respect to industry participants.Investment in a Large Fund Family. The Board considered the benefits to shareholders of investing in a Fidelity fund, including the benefits of investing in a fund that is part of a large family of funds offering a variety of investment disciplines and providing a large variety of mutual fund investor services. The Board noted that Fidelity had taken, or had made recommendations that resulted in the Fidelity funds taking, a number of actions over the previous year that benefited particular funds, including (i) continuing to dedicate additional resources to investment research and to the support of the senior management team that oversees asset management; (ii) continuing efforts to enhance Fidelity's global research capabilities; (iii) launching new funds and making other enhancements to meet client needs; (iv) reducing management fees and total expenses for certain index funds and diversified international funds; (v) continuing to launch dedicated lower cost underlying funds to meet portfolio construction needs related to expanding underlying fund options for Fidelity funds of funds, specifically for the Freedom Fund product lines; (vi) rationalizing product lines and gaining increased efficiencies through fund mergers; (vii) launching active fixed-income exchange-traded funds; (viii) continuing to develop, acquire and implement systems and technology to improve services to the funds and information security and to increase efficiency; (ix) implementing investment enhancements to further strengthen Fidelity's target date product line to increase investors' probability of success in achieving their goals; (x) modifying the eligibility criteria for certain share classes to accommodate roll-over assets from employer-sponsored retirement plans; (xi) launching a new Class W of the Freedom Index Funds to attract and retain Fidelity record-kept retirement plan assets; and (xii) implementing changes to Fidelity's money market product line in response to recent money market regulatory reforms.Investment Performance. The Board considered whether the fund has operated in accordance with its investment objective, as well as its record of compliance with its investment restrictions and its performance history.The Board took into account discussions with representatives of the Investment Advisers about fund investment performance that occur at Board meetings throughout the year. In this regard the Board noted that as part of regularly scheduled fund reviews and other reports to the Board on fund performance, the Board considers annualized return information for the fund, for different time periods, measured against a securities market index ("benchmark index") and a peer group of funds with similar objectives ("peer group"), if any. In its evaluation of fund investment performance, the Board gave particular attention to information indicating changes in performance of certain Fidelity funds for specific time periods and discussed with the Investment Advisers the reasons for any overperformance or underperformance.In addition to reviewing absolute and relative fund performance, the Independent Trustees periodically consider the appropriateness of fund performance metrics in evaluating the results achieved. In general, the Independent Trustees believe that fund performance should be evaluated based on net performance (after fees and expenses) of both the highest performing and lowest performing fund share classes, where applicable, compared to appropriate benchmark indices, over appropriate time periods that may include full market cycles, and compared to peer groups, as applicable, over the same periods, taking into account relevant factors including the following: general market conditions; issuer-specific information; and fund cash flows and other factors.The Independent Trustees recognize that shareholders evaluate performance on a net basis over their own holding periods, for which one-, three-, and five-year periods are often used as a proxy. For this reason, the performance information reviewed by the Board also included net cumulative calendar year total return information for the fund and an appropriate benchmark index and peer group for the most recent one-, three-, and five-year periods, as shown below. Returns are shown compared to the 25th percentile (top of box, 75% beaten) and 75th percentile (bottom of box, 25% beaten) of the peer universe.Fidelity Advisor Equity Growth Fund
Fidelity Advisor Equity Growth Fund
![]()
EPGI-ANN-0116
1.539471.118
Fidelity Advisor® Growth & Income Fund Class A, Class T, Class B and Class C Annual Report November 30, 2015 |
|
Contents
Board Approval of Investment Advisory Contracts and Management Fees |
To view a fund's proxy voting guidelines and proxy voting record for the 12-month period ended June 30, visit http://www.fidelity.com/proxyvotingresults or visit the Securities and Exchange Commission's (SEC) web site at http://www.sec.gov.
You may also call 1-877-208-0098 to request a free copy of the proxy voting guidelines.
Standard & Poor's, S&P and S&P 500 are registered service marks of The McGraw-Hill Companies, Inc. and have been licensed for use by Fidelity Distributors Corporation.
Other third-party marks appearing herein are the property of their respective owners.
All other marks appearing herein are registered or unregistered trademarks or service marks of FMR LLC or an affiliated company. © 2016 FMR LLC. All rights reserved.
This report and the financial statements contained herein are submitted for the general information of the shareholders of the Fund. This report is not authorized for distribution to prospective investors in the Fund unless preceded or accompanied by an effective prospectus.
A fund files its complete schedule of portfolio holdings with the SEC for the first and third quarters of each fiscal year on Form N-Q. Forms N-Q are available on the SEC’s web site at http://www.sec.gov. A fund's Forms N-Q may be reviewed and copied at the SEC’s Public Reference Room in Washington, DC. Information regarding the operation of the SEC's Public Reference Room may be obtained by calling 1-800-SEC-0330.
For a complete list of a fund's portfolio holdings, view the most recent holdings listing, semiannual report, or annual report on Fidelity's web site at http://www.fidelity.com, http://www.advisor.fidelity.com, or http://www.401k.com, as applicable.
NOT FDIC INSURED •MAY LOSE VALUE •NO BANK GUARANTEE
Neither the Fund nor Fidelity Distributors Corporation is a bank.
Performance: The Bottom Line
Average annual total return reflects the change in the value of an investment, assuming reinvestment of distributions from dividend income and capital gains (the profits earned upon the sale of securities that have grown in value, if any) and assuming a constant rate of performance each year.
The hypothetical investment and the average annual total returns do not reflect the deduction of taxes that a shareholder would pay on fund distributions or the redemption of fund shares.
During periods of reimbursement by Fidelity, a fund’s total return will be greater than it would be had the reimbursement not occurred.
How a fund did yesterday is no guarantee of how it will do tomorrow.
Returns reflect the conversion of Class B shares to Class A shares after a maximum of seven years.
Average Annual Total Returns
| For the periods ended November 30, 2015 | Past 1 year | Past 5 years | Past 10 years |
| Class A (incl. 5.75% sales charge) | (6.65)% | 12.01% | 5.73% |
| Class T (incl. 3.50% sales charge) | (4.68)% | 12.28% | 5.73% |
| Class B (incl. contingent deferred sales charge) | (6.37)% | 12.20% | 5.80% |
| Class C (incl. contingent deferred sales charge) | (2.64)% | 12.53% | 5.58% |
Class B shares' contingent deferred sales charges included in the past one year, past five years and past ten years total return figures are 5%, 2% and 0%, respectively.
Class C shares' contingent deferred sales charges included in the past one year, past five years and past ten years total return figures are 1%, 0% and 0%, respectively.
$10,000 Over 10 Years
Let's say hypothetically that $10,000 was invested in Fidelity Advisor® Growth & Income Fund - Class A on November 30, 2005, and the current 5.75% sales charge was paid.
The chart shows how the value of your investment would have changed, and also shows how the S&P 500® Index performed over the same period.
| Period Ending Values | ||
| $17,464 | Fidelity Advisor® Growth & Income Fund - Class A | |
| $20,574 | S&P 500® Index | |
Management's Discussion of Fund Performance
Market Recap: U.S. stocks gained modestly for the 12 months ending November 30, 2015, despite a steep decline in August and September on concern about slowing economic growth in China. The S&P 500® index rebounded in October and gained 2.75% for the year. Stocks benefited late in the period amid waning expectations for a near-term interest-rate hike by the U.S. Federal Reserve, more economic stimulus in Europe and an interest-rate cut in China. Growth stocks in the benchmark far outpaced their value counterparts, as investors continued to seek growth in a subpar economic environment. Sector performance varied widely, with more than 26 percentage points separating the leader from the laggard. Consumer discretionary (+14%) secured the top spot, benefiting from a combination of rising personal income and still-benign inflation. Information technology (+7%) and health care (+4%) also outpaced the broad market. Conversely, the energy sector (-12%) performed worst, stymied by depressed commodity prices that also hit materials (-5%). Telecommunication services (-5%) and utilities (-4%), considered defensive sectors less sensitive to the economy, also lost ground. At period end, investors remained focused on the potential global implications of a stronger U.S. dollar and how China's transition toward a consumption-led economy may affect corporate earnings.Comments from Portfolio Manager Matthew Fruhan: For the year, the fund's share classes (excluding sales charges, if applicable) declined modestly, meaningfully lagging the benchmark S&P 500®. Some unusual market challenges held back the fund. Most notably, investors seemingly favored stocks that offered secure near-term earnings, regardless of valuation. Versus the benchmark, stock picks in consumer discretionary disappointed, especially not owning online retailer and benchmark component Amazon.com. I declined to own Amazon because its stock traded at an extreme valuation and did not fit my investment approach. Security selection in energy also hampered results. Our foreign investments hurt as well, given a stronger dollar. In contrast, the fund benefited from picks among diversified financials stocks. Other individual detractors besides Amazon included social-networking company Facebook – an index member the fund did not hold – and QUALCOMM, a maker of communications equipment. On the positive side, the fund's top relative contributor was financial services giant JPMorgan Chase, which produced solid financial results, benefiting from its dominant competitive position. A stake in industrial conglomerate General Electric also added value, due to the company’s decision to exit most of its financial services businesses.The views expressed above reflect those of the portfolio manager(s) only through the end of the period as stated on the cover of this report and do not necessarily represent the views of Fidelity or any other person in the Fidelity organization. Any such views are subject to change at any time based upon market or other conditions and Fidelity disclaims any responsibility to update such views. These views may not be relied on as investment advice and, because investment decisions for a Fidelity fund are based on numerous factors, may not be relied on as an indication of trading intent on behalf of any Fidelity fund.
Investment Summary (Unaudited)
Top Ten Stocks as of November 30, 2015
| % of fund's net assets | % of fund's net assets 6 months ago | |
| JPMorgan Chase & Co. | 4.2 | 4.4 |
| General Electric Co. | 3.6 | 3.4 |
| Apple, Inc. | 3.4 | 3.7 |
| Microsoft Corp. | 3.2 | 3.0 |
| Bank of America Corp. | 2.9 | 2.5 |
| Citigroup, Inc. | 2.6 | 2.6 |
| Chevron Corp. | 2.2 | 2.0 |
| Procter & Gamble Co. | 2.1 | 1.8 |
| Johnson & Johnson | 2.0 | 1.7 |
| Target Corp. | 1.9 | 2.2 |
| 28.1 |
Top Five Market Sectors as of November 30, 2015
| % of fund's net assets | % of fund's net assets 6 months ago | |
| Financials | 22.3 | 22.3 |
| Information Technology | 21.3 | 21.4 |
| Industrials | 12.8 | 12.8 |
| Health Care | 11.7 | 10.5 |
| Energy | 9.7 | 8.9 |
Asset Allocation (% of fund's net assets)
| As of November 30, 2015* | ||
| Stocks | 98.1% | |
| Convertible Securities | 1.1% | |
| Short-Term Investments and Net Other Assets (Liabilities) | 0.8% | |

* Foreign investments - 11.7%
| As of May 31, 2015* | ||
| Stocks | 98.5% | |
| Convertible Securities | 1.1% | |
| Short-Term Investments and Net Other Assets (Liabilities) | 0.4% | |

* Foreign investments - 11.9%
Investments November 30, 2015
Showing Percentage of Net Assets
| Common Stocks - 98.1% | |||
| Shares | Value (000s) | ||
| CONSUMER DISCRETIONARY - 9.1% | |||
| Automobiles - 0.1% | |||
| Harley-Davidson, Inc. | 9,300 | $455 | |
| Diversified Consumer Services - 0.3% | |||
| H&R Block, Inc. | 25,397 | 932 | |
| ServiceMaster Global Holdings, Inc. (a) | 19,500 | 731 | |
| 1,663 | |||
| Hotels, Restaurants & Leisure - 0.9% | |||
| Dunkin' Brands Group, Inc. | 9,600 | 407 | |
| Las Vegas Sands Corp. | 30,100 | 1,326 | |
| Yum! Brands, Inc. | 40,961 | 2,970 | |
| 4,703 | |||
| Household Durables - 0.2% | |||
| Tupperware Brands Corp. | 21,500 | 1,221 | |
| Leisure Products - 0.2% | |||
| Mattel, Inc. (b) | 39,100 | 972 | |
| Media - 4.4% | |||
| Comcast Corp. Class A (special) (non-vtg.) | 157,229 | 9,597 | |
| Scripps Networks Interactive, Inc. Class A | 49,872 | 2,833 | |
| Sinclair Broadcast Group, Inc. Class A | 60,127 | 2,110 | |
| Time Warner, Inc. | 90,418 | 6,327 | |
| Viacom, Inc. Class B (non-vtg.) | 67,800 | 3,376 | |
| 24,243 | |||
| Multiline Retail - 1.9% | |||
| Dillard's, Inc. Class A | 2,000 | 150 | |
| Target Corp. | 137,999 | 10,005 | |
| 10,155 | |||
| Specialty Retail - 1.1% | |||
| Lowe's Companies, Inc. | 76,057 | 5,826 | |
| TOTAL CONSUMER DISCRETIONARY | 49,238 | ||
| CONSUMER STAPLES - 7.8% | |||
| Beverages - 2.7% | |||
| Diageo PLC | 101,447 | 2,910 | |
| PepsiCo, Inc. | 30,043 | 3,009 | |
| The Coca-Cola Co. | 212,084 | 9,039 | |
| 14,958 | |||
| Food & Staples Retailing - 1.0% | |||
| CVS Health Corp. | 33,651 | 3,166 | |
| Wal-Mart Stores, Inc. | 6,200 | 365 | |
| Walgreens Boots Alliance, Inc. | 22,182 | 1,864 | |
| 5,395 | |||
| Food Products - 0.1% | |||
| Mead Johnson Nutrition Co. Class A | 9,100 | 733 | |
| Household Products - 2.1% | |||
| Procter & Gamble Co. | 149,435 | 11,184 | |
| Personal Products - 0.1% | |||
| Estee Lauder Companies, Inc. Class A | 3,600 | 303 | |
| Tobacco - 1.8% | |||
| British American Tobacco PLC sponsored ADR | 30,776 | 3,562 | |
| Imperial Tobacco Group PLC | 16,815 | 909 | |
| Philip Morris International, Inc. | 63,338 | 5,535 | |
| 10,006 | |||
| TOTAL CONSUMER STAPLES | 42,579 | ||
| ENERGY - 9.6% | |||
| Energy Equipment & Services - 1.5% | |||
| Baker Hughes, Inc. | 7,500 | 406 | |
| Ensco PLC Class A | 105,241 | 1,802 | |
| Helmerich & Payne, Inc. | 9,300 | 542 | |
| National Oilwell Varco, Inc. | 29,400 | 1,098 | |
| Oceaneering International, Inc. | 50,900 | 2,226 | |
| Schlumberger Ltd. | 26,334 | 2,032 | |
| 8,106 | |||
| Oil, Gas & Consumable Fuels - 8.1% | |||
| Apache Corp. | 89,441 | 4,399 | |
| Cenovus Energy, Inc. | 53,300 | 789 | |
| Chevron Corp. | 128,863 | 11,768 | |
| ConocoPhillips Co. | 58,800 | 3,178 | |
| EQT Midstream Partners LP | 13,600 | 920 | |
| Foresight Energy LP | 19,500 | 84 | |
| Golar LNG Ltd. | 43,000 | 1,176 | |
| Imperial Oil Ltd. | 118,100 | 3,836 | |
| Kinder Morgan, Inc. | 92,800 | 2,187 | |
| Legacy Reserves LP | 89,800 | 280 | |
| Markwest Energy Partners LP | 41,505 | 1,992 | |
| PrairieSky Royalty Ltd. (b) | 42,100 | 809 | |
| PrairieSky Royalty Ltd. rights(a)(c) | 20,340 | 384 | |
| Suncor Energy, Inc. | 283,390 | 7,830 | |
| The Williams Companies, Inc. | 69,231 | 2,531 | |
| Williams Partners LP | 69,920 | 1,917 | |
| 44,080 | |||
| TOTAL ENERGY | 52,186 | ||
| FINANCIALS - 22.3% | |||
| Banks - 15.2% | |||
| Bank of America Corp. | 901,442 | 15,712 | |
| Citigroup, Inc. | 266,022 | 14,389 | |
| Comerica, Inc. | 47,200 | 2,188 | |
| Commerce Bancshares, Inc. | 17,325 | 796 | |
| Fifth Third Bancorp | 67,300 | 1,391 | |
| JPMorgan Chase & Co. | 342,043 | 22,810 | |
| Lloyds Banking Group PLC | 240,500 | 264 | |
| M&T Bank Corp. | 18,600 | 2,331 | |
| PNC Financial Services Group, Inc. | 32,616 | 3,115 | |
| Regions Financial Corp. | 274,500 | 2,783 | |
| Standard Chartered PLC: | |||
| rights 12/10/15 (a) | 37,296 | 51 | |
| (United Kingdom) | 130,536 | 1,095 | |
| SunTrust Banks, Inc. | 134,435 | 5,837 | |
| U.S. Bancorp | 149,330 | 6,554 | |
| UMB Financial Corp. | 9,200 | 485 | |
| Wells Fargo & Co. | 52,850 | 2,912 | |
| 82,713 | |||
| Capital Markets - 5.4% | |||
| Ashmore Group PLC | 36,000 | 137 | |
| Charles Schwab Corp. | 118,513 | 3,995 | |
| Franklin Resources, Inc. | 16,300 | 683 | |
| Invesco Ltd. | 35,700 | 1,203 | |
| KKR & Co. LP | 173,113 | 2,927 | |
| Morgan Stanley | 128,630 | 4,412 | |
| Northern Trust Corp. | 61,240 | 4,589 | |
| Oaktree Capital Group LLC Class A | 20,100 | 981 | |
| PJT Partners, Inc. (a) | 77 | 2 | |
| State Street Corp. | 120,570 | 8,751 | |
| T. Rowe Price Group, Inc. | 800 | 61 | |
| The Blackstone Group LP | 41,100 | 1,284 | |
| TPG Specialty Lending, Inc. | 6,553 | 113 | |
| 29,138 | |||
| Insurance - 1.2% | |||
| ACE Ltd. | 3,700 | 425 | |
| Marsh & McLennan Companies, Inc. | 21,966 | 1,215 | |
| MetLife, Inc. | 61,605 | 3,147 | |
| Principal Financial Group, Inc. | 34,300 | 1,765 | |
| 6,552 | |||
| Real Estate Investment Trusts - 0.3% | |||
| American Tower Corp. | 7,500 | 745 | |
| Crown Castle International Corp. | 4,600 | 395 | |
| First Potomac Realty Trust | 9,872 | 115 | |
| Sabra Health Care REIT, Inc. | 17,100 | 354 | |
| 1,609 | |||
| Thrifts & Mortgage Finance - 0.2% | |||
| Radian Group, Inc. | 83,790 | 1,194 | |
| TOTAL FINANCIALS | 121,206 | ||
| HEALTH CARE - 10.9% | |||
| Biotechnology - 1.8% | |||
| AbbVie, Inc. | 39,200 | 2,279 | |
| Amgen, Inc. | 23,692 | 3,817 | |
| Biogen, Inc. (a) | 10,500 | 3,012 | |
| Intercept Pharmaceuticals, Inc. (a) | 3,600 | 635 | |
| 9,743 | |||
| Health Care Equipment & Supplies - 2.0% | |||
| Abbott Laboratories | 54,526 | 2,449 | |
| Ansell Ltd. | 20,366 | 321 | |
| Medtronic PLC | 64,342 | 4,848 | |
| St. Jude Medical, Inc. | 11,700 | 738 | |
| Zimmer Biomet Holdings, Inc. | 24,090 | 2,433 | |
| 10,789 | |||
| Health Care Providers & Services - 1.4% | |||
| Cardinal Health, Inc. | 9,400 | 816 | |
| Express Scripts Holding Co. (a) | 9,900 | 846 | |
| McKesson Corp. | 24,833 | 4,702 | |
| Patterson Companies, Inc. | 27,300 | 1,244 | |
| 7,608 | |||
| Life Sciences Tools & Services - 0.2% | |||
| Agilent Technologies, Inc. | 33,600 | 1,405 | |
| Pharmaceuticals - 5.5% | |||
| Astellas Pharma, Inc. | 44,700 | 629 | |
| Bristol-Myers Squibb Co. | 13,700 | 918 | |
| GlaxoSmithKline PLC sponsored ADR | 188,209 | 7,624 | |
| Johnson & Johnson | 108,201 | 10,954 | |
| Novartis AG sponsored ADR | 1,201 | 102 | |
| Shire PLC sponsored ADR | 8,400 | 1,750 | |
| Teva Pharmaceutical Industries Ltd. sponsored ADR | 121,074 | 7,619 | |
| Theravance, Inc. (b) | 29,900 | 277 | |
| 29,873 | |||
| TOTAL HEALTH CARE | 59,418 | ||
| INDUSTRIALS - 12.8% | |||
| Aerospace & Defense - 2.2% | |||
| Meggitt PLC | 47,906 | 279 | |
| Rolls-Royce Group PLC | 71,700 | 654 | |
| The Boeing Co. | 51,094 | 7,432 | |
| United Technologies Corp. | 35,531 | 3,413 | |
| 11,778 | |||
| Air Freight & Logistics - 1.7% | |||
| C.H. Robinson Worldwide, Inc. | 5,100 | 344 | |
| PostNL NV (a) | 351,100 | 1,173 | |
| United Parcel Service, Inc. Class B | 76,179 | 7,847 | |
| 9,364 | |||
| Airlines - 0.2% | |||
| Copa Holdings SA Class A | 21,000 | 1,085 | |
| Building Products - 0.2% | |||
| Lennox International, Inc. | 7,500 | 1,019 | |
| Commercial Services & Supplies - 0.5% | |||
| ADT Corp. (b) | 74,383 | 2,638 | |
| Electrical Equipment - 1.0% | |||
| Eaton Corp. PLC | 21,400 | 1,245 | |
| Emerson Electric Co. | 49,200 | 2,460 | |
| Hubbell, Inc. Class B | 18,412 | 1,828 | |
| 5,533 | |||
| Industrial Conglomerates - 3.6% | |||
| General Electric Co. | 653,093 | 19,554 | |
| Machinery - 0.7% | |||
| Cummins, Inc. | 4,000 | 401 | |
| Deere & Co. | 16,600 | 1,321 | |
| Donaldson Co., Inc. | 23,500 | 738 | |
| IMI PLC | 22,600 | 325 | |
| Pentair PLC | 7,900 | 448 | |
| Xylem, Inc. | 19,200 | 717 | |
| 3,950 | |||
| Professional Services - 0.1% | |||
| Nielsen Holdings PLC | 8,500 | 397 | |
| Road & Rail - 2.2% | |||
| CSX Corp. | 154,033 | 4,379 | |
| J.B. Hunt Transport Services, Inc. | 42,820 | 3,350 | |
| Kansas City Southern | 17,605 | 1,601 | |
| Norfolk Southern Corp. | 19,608 | 1,864 | |
| Union Pacific Corp. | 7,600 | 638 | |
| 11,832 | |||
| Trading Companies & Distributors - 0.4% | |||
| W.W. Grainger, Inc. | 1,500 | 301 | |
| Watsco, Inc. | 16,464 | 2,093 | |
| 2,394 | |||
| TOTAL INDUSTRIALS | 69,544 | ||
| INFORMATION TECHNOLOGY - 21.2% | |||
| Communications Equipment - 3.1% | |||
| Cisco Systems, Inc. | 282,171 | 7,689 | |
| QUALCOMM, Inc. | 187,013 | 9,124 | |
| 16,813 | |||
| Internet Software & Services - 3.3% | |||
| Alphabet, Inc.: | |||
| Class A (a) | 11,858 | 9,046 | |
| Class C | 10,153 | 7,540 | |
| Yahoo!, Inc. (a) | 37,592 | 1,271 | |
| 17,857 | |||
| IT Services - 5.5% | |||
| First Data Corp. | 126,726 | 1,916 | |
| First Data Corp. Class A (a) | 18,800 | 316 | |
| IBM Corp. | 39,400 | 5,493 | |
| MasterCard, Inc. Class A | 59,390 | 5,815 | |
| Paychex, Inc. | 129,809 | 7,042 | |
| The Western Union Co. | 37,461 | 707 | |
| Unisys Corp. (a) | 77,900 | 1,002 | |
| Visa, Inc. Class A | 100,340 | 7,928 | |
| 30,219 | |||
| Semiconductors & Semiconductor Equipment - 0.7% | |||
| Analog Devices, Inc. | 5,400 | 333 | |
| Broadcom Corp. Class A | 20,236 | 1,105 | |
| Marvell Technology Group Ltd. | 71,400 | 633 | |
| Maxim Integrated Products, Inc. | 41,100 | 1,593 | |
| 3,664 | |||
| Software - 3.9% | |||
| Microsoft Corp. | 323,573 | 17,586 | |
| Oracle Corp. | 97,284 | 3,791 | |
| 21,377 | |||
| Technology Hardware, Storage & Peripherals - 4.7% | |||
| Apple, Inc. | 156,078 | 18,464 | |
| EMC Corp. | 211,900 | 5,370 | |
| HP, Inc. | 53,800 | 675 | |
| Western Digital Corp. | 13,800 | 861 | |
| 25,370 | |||
| TOTAL INFORMATION TECHNOLOGY | 115,300 | ||
| MATERIALS - 3.1% | |||
| Chemicals - 2.7% | |||
| CF Industries Holdings, Inc. | 20,800 | 960 | |
| E.I. du Pont de Nemours & Co. | 26,331 | 1,773 | |
| LyondellBasell Industries NV Class A | 13,400 | 1,284 | |
| Monsanto Co. | 62,601 | 5,957 | |
| Potash Corp. of Saskatchewan, Inc. | 86,100 | 1,743 | |
| Syngenta AG (Switzerland) | 7,447 | 2,743 | |
| Tronox Ltd. Class A | 17,751 | 103 | |
| 14,563 | |||
| Containers & Packaging - 0.3% | |||
| Packaging Corp. of America | 7,400 | 503 | |
| WestRock Co. | 19,000 | 962 | |
| 1,465 | |||
| Metals & Mining - 0.1% | |||
| Freeport-McMoRan, Inc. | 61,100 | 500 | |
| Paper & Forest Products - 0.0% | |||
| International Paper Co. | 4,200 | 176 | |
| TOTAL MATERIALS | 16,704 | ||
| TELECOMMUNICATION SERVICES - 0.9% | |||
| Diversified Telecommunication Services - 0.9% | |||
| Verizon Communications, Inc. | 110,709 | 5,032 | |
| UTILITIES - 0.4% | |||
| Electric Utilities - 0.4% | |||
| Exelon Corp. | 67,700 | 1,849 | |
| PPL Corp. | 8,400 | 286 | |
| 2,135 | |||
| TOTAL COMMON STOCKS | |||
| (Cost $439,298) | 533,342 | ||
| Preferred Stocks - 0.8% | |||
| Convertible Preferred Stocks - 0.8% | |||
| CONSUMER DISCRETIONARY - 0.0% | |||
| Leisure Products - 0.0% | |||
| NJOY, Inc. Series D (a)(d) | 5,350 | 3 | |
| HEALTH CARE - 0.8% | |||
| Health Care Equipment & Supplies - 0.8% | |||
| Alere, Inc. 3.00% (a) | 14,154 | 4,175 | |
| TOTAL CONVERTIBLE PREFERRED STOCKS | 4,178 | ||
| Nonconvertible Preferred Stocks - 0.0% | |||
| INDUSTRIALS - 0.0% | |||
| Aerospace & Defense - 0.0% | |||
| Rolls-Royce Group PLC | 2,679,030 | 4 | |
| TOTAL PREFERRED STOCKS | |||
| (Cost $4,022) | 4,182 | ||
| Principal Amount (000s) | Value (000s) | ||
| Convertible Bonds - 0.3% | |||
| CONSUMER DISCRETIONARY - 0.1% | |||
| Automobiles - 0.1% | |||
| Tesla Motors, Inc. 1.25% 3/1/21 | 270 | 245 | |
| ENERGY - 0.1% | |||
| Oil, Gas & Consumable Fuels - 0.1% | |||
| Amyris, Inc. 9.5% 4/15/19 (e) | 697 | 722 | |
| Peabody Energy Corp. 4.75% 12/15/41 | 590 | 34 | |
| 756 | |||
| INFORMATION TECHNOLOGY - 0.1% | |||
| Internet Software & Services - 0.1% | |||
| Twitter, Inc. 0.25% 9/15/19 | 790 | 684 | |
| TOTAL CONVERTIBLE BONDS | |||
| (Cost $2,089) | 1,685 | ||
| Shares | Value (000s) | ||
| Money Market Funds - 1.3% | |||
| Fidelity Cash Central Fund, 0.18% (f) | 3,067,306 | 3,067 | |
| Fidelity Securities Lending Cash Central Fund, 0.22% (f)(g) | 4,001,689 | 4,002 | |
| TOTAL MONEY MARKET FUNDS | |||
| (Cost $7,069) | 7,069 | ||
| TOTAL INVESTMENT PORTFOLIO - 100.5% | |||
| (Cost $452,478) | 546,278 | ||
| NET OTHER ASSETS (LIABILITIES) - (0.5)% | (2,811) | ||
| NET ASSETS - 100% | $543,467 |
Legend
(a) Non-income producing
(b) Security or a portion of the security is on loan at period end.
(c) Security or a portion of the security purchased on a delayed delivery or when-issued basis.
(d) Restricted securities - Investment in securities not registered under the Securities Act of 1933 (excluding 144A issues). At the end of the period, the value of restricted securities (excluding 144A issues) amounted to $3,000 or 0.0% of net assets.
(e) Security exempt from registration under Rule 144A of the Securities Act of 1933. These securities may be resold in transactions exempt from registration, normally to qualified institutional buyers. At the end of the period, the value of these securities amounted to $722,000 or 0.1% of net assets.
(f) Affiliated fund that is generally available only to investment companies and other accounts managed by Fidelity Investments. The rate quoted is the annualized seven-day yield of the fund at period end. A complete unaudited listing of the fund's holdings as of its most recent quarter end is available upon request. In addition, each Fidelity Central Fund's financial statements, which are not covered by the Fund's Report of Independent Registered Public Accounting Firm, are available on the SEC's website or upon request.
(g) Investment made with cash collateral received from securities on loan.
Additional information on each restricted holding is as follows:
| Security | Acquisition Date | Acquisition Cost (000s) |
| NJOY, Inc. Series D | 2/14/14 | $91 |
Affiliated Central Funds
Information regarding fiscal year to date income earned by the Fund from investments in Fidelity Central Funds is as follows:
| Fund | Income earned |
| (Amounts in thousands) | |
| Fidelity Cash Central Fund | $48 |
| Fidelity Securities Lending Cash Central Fund | 69 |
| Total | $117 |
Investment Valuation
The following is a summary of the inputs used, as of November 30, 2015, involving the Fund's assets and liabilities carried at fair value. The inputs or methodology used for valuing securities may not be an indication of the risk associated with investing in those securities. For more information on valuation inputs, and their aggregation into the levels used below, please refer to the Investment Valuation section in the accompanying Notes to Financial Statements.
| Valuation Inputs at Reporting Date: | ||||
| Description | Total | Level 1 | Level 2 | Level 3 |
| (Amounts in thousands) | ||||
| Investments in Securities: | ||||
| Equities: | ||||
| Consumer Discretionary | $49,241 | $49,238 | $-- | $3 |
| Consumer Staples | 42,579 | 39,669 | 2,910 | -- |
| Energy | 52,186 | 51,802 | 384 | -- |
| Financials | 121,206 | 120,942 | 264 | -- |
| Health Care | 63,593 | 62,964 | 629 | -- |
| Industrials | 69,548 | 68,615 | 933 | -- |
| Information Technology | 115,300 | 113,384 | 1,916 | -- |
| Materials | 16,704 | 13,961 | 2,743 | -- |
| Telecommunication Services | 5,032 | 5,032 | -- | -- |
| Utilities | 2,135 | 2,135 | -- | -- |
| Corporate Bonds | 1,685 | -- | 1,685 | -- |
| Money Market Funds | 7,069 | 7,069 | -- | -- |
| Total Investments in Securities: | $546,278 | $534,811 | $11,464 | $3 |
Other Information
Distribution of investments by country or territory of incorporation, as a percentage of Total Net Assets, is as follows (Unaudited):
| United States of America | 88.3% |
| United Kingdom | 3.7% |
| Canada | 2.7% |
| Israel | 1.4% |
| Ireland | 1.2% |
| Others (Individually Less Than 1%) | 2.7% |
| 100.0% |
See accompanying notes which are an integral part of the financial statements.
Financial Statements
Statement of Assets and Liabilities
| Amounts in thousands (except per-share amounts) | November 30, 2015 | |
| Assets | ||
| Investment in securities, at value (including securities loaned of $3,986) — See accompanying schedule: Unaffiliated issuers (cost $445,409) | $539,209 | |
| Fidelity Central Funds (cost $7,069) | 7,069 | |
| Total Investments (cost $452,478) | $546,278 | |
| Cash | 30 | |
| Receivable for investments sold | 1,972 | |
| Receivable for fund shares sold | 227 | |
| Dividends receivable | 1,541 | |
| Interest receivable | 33 | |
| Distributions receivable from Fidelity Central Funds | 2 | |
| Prepaid expenses | 1 | |
| Other receivables | 2 | |
| Total assets | 550,086 | |
| Liabilities | ||
| Payable for investments purchased | ||
| Regular delivery | $1,188 | |
| Delayed delivery | 384 | |
| Payable for fund shares redeemed | 480 | |
| Accrued management fee | 204 | |
| Distribution and service plan fees payable | 196 | |
| Other affiliated payables | 113 | |
| Other payables and accrued expenses | 52 | |
| Collateral on securities loaned, at value | 4,002 | |
| Total liabilities | 6,619 | |
| Net Assets | $543,467 | |
| Net Assets consist of: | ||
| Paid in capital | $413,267 | |
| Undistributed net investment income | 6,597 | |
| Accumulated undistributed net realized gain (loss) on investments and foreign currency transactions | 29,817 | |
| Net unrealized appreciation (depreciation) on investments and assets and liabilities in foreign currencies | 93,786 | |
| Net Assets | $543,467 | |
| Calculation of Maximum Offering Price | ||
| Class A: | ||
| Net Asset Value and redemption price per share ($243,615 ÷ 9,242.84 shares) | $26.36 | |
| Maximum offering price per share (100/94.25 of $26.36) | $27.97 | |
| Class T: | ||
| Net Asset Value and redemption price per share ($179,813 ÷ 6,831.12 shares) | $26.32 | |
| Maximum offering price per share (100/96.50 of $26.32) | $27.27 | |
| Class B: | ||
| Net Asset Value and offering price per share ($4,693 ÷ 187.25 shares)(a) | $25.06 | |
| Class C: | ||
| Net Asset Value and offering price per share ($79,016 ÷ 3,170.45 shares)(a) | $24.92 | |
| Class I: | ||
| Net Asset Value, offering price and redemption price per share ($36,330 ÷ 1,353.11 shares) | $26.85 |
(a) Redemption price per share is equal to net asset value less any applicable contingent deferred sales charge.
See accompanying notes which are an integral part of the financial statements.
Statement of Operations
| Amounts in thousands | Year ended November 30, 2015 | |
| Investment Income | ||
| Dividends | $14,489 | |
| Interest | 82 | |
| Income from Fidelity Central Funds | 117 | |
| Total income | 14,688 | |
| Expenses | ||
| Management fee | $2,581 | |
| Transfer agent fees | 1,233 | |
| Distribution and service plan fees | 2,515 | |
| Accounting and security lending fees | 217 | |
| Custodian fees and expenses | 48 | |
| Independent trustees' compensation | 2 | |
| Registration fees | 76 | |
| Audit | 65 | |
| Legal | 3 | |
| Interest | 1 | |
| Miscellaneous | 4 | |
| Total expenses before reductions | 6,745 | |
| Expense reductions | (28) | 6,717 |
| Net investment income (loss) | 7,971 | |
| Realized and Unrealized Gain (Loss) | ||
| Net realized gain (loss) on: | ||
| Investment securities: | ||
| Unaffiliated issuers | 33,819 | |
| Foreign currency transactions | (5) | |
| Total net realized gain (loss) | 33,814 | |
| Change in net unrealized appreciation (depreciation) on: Investment securities | (48,437) | |
| Assets and liabilities in foreign currencies | (6) | |
| Total change in net unrealized appreciation (depreciation) | (48,443) | |
| Net gain (loss) | (14,629) | |
| Net increase (decrease) in net assets resulting from operations | $(6,658) |
See accompanying notes which are an integral part of the financial statements.
Statement of Changes in Net Assets
| Amounts in thousands | Year ended November 30, 2015 | Year ended November 30, 2014 |
| Increase (Decrease) in Net Assets | ||
| Operations | ||
| Net investment income (loss) | $7,971 | $7,556 |
| Net realized gain (loss) | 33,814 | 44,197 |
| Change in net unrealized appreciation (depreciation) | (48,443) | 20,295 |
| Net increase (decrease) in net assets resulting from operations | (6,658) | 72,048 |
| Distributions to shareholders from net investment income | (6,678) | (1,555) |
| Distributions to shareholders from net realized gain | (40,365) | (4,023) |
| Total distributions | (47,043) | (5,578) |
| Share transactions - net increase (decrease) | (16,615) | (32,125) |
| Total increase (decrease) in net assets | (70,316) | 34,345 |
| Net Assets | ||
| Beginning of period | 613,783 | 579,438 |
| End of period (including undistributed net investment income of $6,597 and undistributed net investment income of $6,680, respectively) | $543,467 | $613,783 |
See accompanying notes which are an integral part of the financial statements.
Financial Highlights — Fidelity Advisor Growth & Income Fund Class A
| Years ended November 30, | 2015 | 2014 | 2013 | 2012 | 2011 |
| Selected Per–Share Data | |||||
| Net asset value, beginning of period | $28.95 | $25.87 | $19.67 | $17.00 | $16.05 |
| Income from Investment Operations | |||||
| Net investment income (loss)A | .42 | .40 | .37 | .33 | .21 |
| Net realized and unrealized gain (loss) | (.76)B | 2.97 | 5.88 | 2.90 | .78 |
| Total from investment operations | (.34) | 3.37 | 6.25 | 3.23 | .99 |
| Distributions from net investment income | (.36) | (.11) | (.05) | (.53) | (.04) |
| Distributions from net realized gain | (1.88) | (.18) | – | (.03) | – |
| Total distributions | (2.25)C | (.29) | (.05) | (.56) | (.04) |
| Net asset value, end of period | $26.36 | $28.95 | $25.87 | $19.67 | $17.00 |
| Total ReturnD,E | (.96)%B | 13.20% | 31.86% | 19.20% | 6.17% |
| Ratios to Average Net AssetsF,G | |||||
| Expenses before reductions | .99% | 1.01% | 1.02% | 1.05% | 1.06% |
| Expenses net of fee waivers, if any | .98% | 1.01% | 1.02% | 1.05% | 1.06% |
| Expenses net of all reductions | .98% | 1.01% | 1.00% | 1.04% | 1.05% |
| Net investment income (loss) | 1.57% | 1.48% | 1.61% | 1.75% | 1.22% |
| Supplemental Data | |||||
| Net assets, end of period (in millions) | $244 | $276 | $255 | $183 | $170 |
| Portfolio turnover rateH | 35% | 44% | 48% | 57% | 123% |
A Calculated based on average shares outstanding during the period.
B Net realized and unrealized gain (loss) per share reflects proceeds from litigation which amounted to $0.04 per share. Excluding these litigation proceeds, the total return would have been (1.10)%.
C Total distributions of $2.25 per share is comprised of distributions from net investment income of $.363 and distributions from net realized gain of $1.883 per share.
D Total returns would have been lower if certain expenses had not been reduced during the applicable periods shown.
E Total returns do not include the effect of the sales charges.
F Fees and expenses of any underlying Fidelity Central Funds are not included in the Fund's expense ratio. The Fund indirectly bears its proportionate share of the expenses of any underlying Fidelity Central Funds.
G Expense ratios reflect operating expenses of the class. Expenses before reductions do not reflect amounts reimbursed by the investment adviser or reductions from brokerage service arrangements or reductions from other expense offset arrangements and do not represent the amount paid by the class during periods when reimbursements or reductions occur. Expenses net of fee waivers reflect expenses after reimbursement by the investment adviser but prior to reductions from brokerage service arrangements or other expense offset arrangements. Expenses net of all reductions represent the net expenses paid by the class.
H Amount does not include the portfolio activity of any underlying Fidelity Central Funds.
See accompanying notes which are an integral part of the financial statements.
Financial Highlights — Fidelity Advisor Growth & Income Fund Class T
| Years ended November 30, | 2015 | 2014 | 2013 | 2012 | 2011 |
| Selected Per–Share Data | |||||
| Net asset value, beginning of period | $28.91 | $25.84 | $19.68 | $16.97 | $16.02 |
| Income from Investment Operations | |||||
| Net investment income (loss)A | .35 | .33 | .32 | .29 | .17 |
| Net realized and unrealized gain (loss) | (.76)B | 2.97 | 5.89 | 2.89 | .78 |
| Total from investment operations | (.41) | 3.30 | 6.21 | 3.18 | .95 |
| Distributions from net investment income | (.29) | (.05) | (.05) | (.44) | – |
| Distributions from net realized gain | (1.88) | (.18) | – | (.03) | – |
| Total distributions | (2.18)C | (.23) | (.05) | (.47) | – |
| Net asset value, end of period | $26.32 | $28.91 | $25.84 | $19.68 | $16.97 |
| Total ReturnD,E | (1.22)%B | 12.91% | 31.62% | 18.93% | 5.93% |
| Ratios to Average Net AssetsF,G | |||||
| Expenses before reductions | 1.23% | 1.25% | 1.25% | 1.27% | 1.29% |
| Expenses net of fee waivers, if any | 1.23% | 1.25% | 1.25% | 1.27% | 1.29% |
| Expenses net of all reductions | 1.23% | 1.24% | 1.23% | 1.26% | 1.28% |
| Net investment income (loss) | 1.32% | 1.24% | 1.38% | 1.53% | .99% |
| Supplemental Data | |||||
| Net assets, end of period (in millions) | $180 | $216 | $214 | $166 | $158 |
| Portfolio turnover rateH | 35% | 44% | 48% | 57% | 123% |
A Calculated based on average shares outstanding during the period.
B Net realized and unrealized gain (loss) per share reflects proceeds from litigation which amounted to $0.04 per share. Excluding these litigation proceeds, the total return would have been (1.36)%.
C Total distributions of $2.18 per share is comprised of distributions from net investment income of $.293 and distributions from net realized gain of $1.883 per share.
D Total returns would have been lower if certain expenses had not been reduced during the applicable periods shown.
E Total returns do not include the effect of the sales charges.
F Fees and expenses of any underlying Fidelity Central Funds are not included in the Fund's expense ratio. The Fund indirectly bears its proportionate share of the expenses of any underlying Fidelity Central Funds.
G Expense ratios reflect operating expenses of the class. Expenses before reductions do not reflect amounts reimbursed by the investment adviser or reductions from brokerage service arrangements or reductions from other expense offset arrangements and do not represent the amount paid by the class during periods when reimbursements or reductions occur. Expenses net of fee waivers reflect expenses after reimbursement by the investment adviser but prior to reductions from brokerage service arrangements or other expense offset arrangements. Expenses net of all reductions represent the net expenses paid by the class.
H Amount does not include the portfolio activity of any underlying Fidelity Central Funds.
See accompanying notes which are an integral part of the financial statements.
Financial Highlights — Fidelity Advisor Growth & Income Fund Class B
| Years ended November 30, | 2015 | 2014 | 2013 | 2012 | 2011 |
| Selected Per–Share Data | |||||
| Net asset value, beginning of period | $27.58 | $24.74 | $18.95 | $16.24 | $15.41 |
| Income from Investment Operations | |||||
| Net investment income (loss)A | .19 | .17 | .18 | .18 | .08 |
| Net realized and unrealized gain (loss) | (.74)B | 2.85 | 5.65 | 2.78 | .75 |
| Total from investment operations | (.55) | 3.02 | 5.83 | 2.96 | .83 |
| Distributions from net investment income | (.09) | – | (.04) | (.22) | – |
| Distributions from net realized gain | (1.88) | (.18) | – | (.03) | – |
| Total distributions | (1.97) | (.18) | (.04) | (.25) | – |
| Net asset value, end of period | $25.06 | $27.58 | $24.74 | $18.95 | $16.24 |
| Total ReturnC,D | (1.83)%B | 12.30% | 30.81% | 18.31% | 5.39% |
| Ratios to Average Net AssetsE,F | |||||
| Expenses before reductions | 1.82% | 1.83% | 1.81% | 1.81% | 1.81% |
| Expenses net of fee waivers, if any | 1.82% | 1.83% | 1.81% | 1.81% | 1.81% |
| Expenses net of all reductions | 1.82% | 1.83% | 1.80% | 1.81% | 1.80% |
| Net investment income (loss) | .73% | .65% | .82% | .99% | .47% |
| Supplemental Data | |||||
| Net assets, end of period (in millions) | $5 | $8 | $12 | $11 | $13 |
| Portfolio turnover rateG | 35% | 44% | 48% | 57% | 123% |
A Calculated based on average shares outstanding during the period.
B Net realized and unrealized gain (loss) per share reflects proceeds from litigation which amounted to $0.04 per share. Excluding these litigation proceeds, the total return would have been (1.97)%.
C Total returns would have been lower if certain expenses had not been reduced during the applicable periods shown.
D Total returns do not include the effect of the contingent deferred sales charge.
E Fees and expenses of any underlying Fidelity Central Funds are not included in the Fund's expense ratio. The Fund indirectly bears its proportionate share of the expenses of any underlying Fidelity Central Funds.
F Expense ratios reflect operating expenses of the class. Expenses before reductions do not reflect amounts reimbursed by the investment adviser or reductions from brokerage service arrangements or reductions from other expense offset arrangements and do not represent the amount paid by the class during periods when reimbursements or reductions occur. Expenses net of fee waivers reflect expenses after reimbursement by the investment adviser but prior to reductions from brokerage service arrangements or other expense offset arrangements. Expenses net of all reductions represent the net expenses paid by the class.
G Amount does not include the portfolio activity of any underlying Fidelity Central Funds.
See accompanying notes which are an integral part of the financial statements.
Financial Highlights — Fidelity Advisor Growth & Income Fund Class C
| Years ended November 30, | 2015 | 2014 | 2013 | 2012 | 2011 |
| Selected Per–Share Data | |||||
| Net asset value, beginning of period | $27.51 | $24.66 | $18.87 | $16.23 | $15.39 |
| Income from Investment Operations | |||||
| Net investment income (loss)A | .21 | .19 | .19 | .19 | .08 |
| Net realized and unrealized gain (loss) | (.73)B | 2.84 | 5.64 | 2.77 | .76 |
| Total from investment operations | (.52) | 3.03 | 5.83 | 2.96 | .84 |
| Distributions from net investment income | (.18) | – | (.04) | (.29) | – |
| Distributions from net realized gain | (1.88) | (.18) | – | (.03) | – |
| Total distributions | (2.07)C | (.18) | (.04) | (.32) | – |
| Net asset value, end of period | $24.92 | $27.51 | $24.66 | $18.87 | $16.23 |
| Total ReturnD,E | (1.74)%B | 12.38% | 30.95% | 18.33% | 5.46% |
| Ratios to Average Net AssetsF,G | |||||
| Expenses before reductions | 1.73% | 1.74% | 1.74% | 1.76% | 1.78% |
| Expenses net of fee waivers, if any | 1.73% | 1.74% | 1.74% | 1.76% | 1.78% |
| Expenses net of all reductions | 1.73% | 1.74% | 1.73% | 1.76% | 1.77% |
| Net investment income (loss) | .82% | .74% | .89% | 1.04% | .50% |
| Supplemental Data | |||||
| Net assets, end of period (in millions) | $79 | $85 | $74 | $58 | $53 |
| Portfolio turnover rateH | 35% | 44% | 48% | 57% | 123% |
A Calculated based on average shares outstanding during the period.
B Net realized and unrealized gain (loss) per share reflects proceeds from litigation which amounted to $0.04 per share. Excluding these litigation proceeds, the total return would have been (1.88)%.
C Total distributions of $2.07per share is comprised of distributions from net investment income of $.183 and distributions from net realized gain of $1.883 per share.
D Total returns would have been lower if certain expenses had not been reduced during the applicable periods shown.
E Total returns do not include the effect of the contingent deferred sales charge.
F Fees and expenses of any underlying Fidelity Central Funds are not included in the Fund's expense ratio. The Fund indirectly bears its proportionate share of the expenses of any underlying Fidelity Central Funds.
G Expense ratios reflect operating expenses of the class. Expenses before reductions do not reflect amounts reimbursed by the investment adviser or reductions from brokerage service arrangements or reductions from other expense offset arrangements and do not represent the amount paid by the class during periods when reimbursements or reductions occur. Expenses net of fee waivers reflect expenses after reimbursement by the investment adviser but prior to reductions from brokerage service arrangements or other expense offset arrangements. Expenses net of all reductions represent the net expenses paid by the class.
H Amount does not include the portfolio activity of any underlying Fidelity Central Funds.
See accompanying notes which are an integral part of the financial statements.
Financial Highlights — Fidelity Advisor Growth & Income Fund Class I
| Years ended November 30, | 2015 | 2014 | 2013 | 2012 | 2011 |
| Selected Per–Share Data | |||||
| Net asset value, beginning of period | $29.47 | $26.13 | $19.79 | $17.16 | $16.19 |
| Income from Investment Operations | |||||
| Net investment income (loss)A | .50 | .49 | .43 | .40 | .27 |
| Net realized and unrealized gain (loss) | (.78)B | 3.03 | 5.97 | 2.91 | .79 |
| Total from investment operations | (.28) | 3.52 | 6.40 | 3.31 | 1.06 |
| Distributions from net investment income | (.45) | – | (.06) | (.65) | (.09) |
| Distributions from net realized gain | (1.88) | (.18) | – | (.03) | – |
| Total distributions | (2.34)C | (.18) | (.06) | (.68) | (.09) |
| Net asset value, end of period | $26.85 | $29.47 | $26.13 | $19.79 | $17.16 |
| Total ReturnD | (.70)%B | 13.56% | 32.41% | 19.59% | 6.56% |
| Ratios to Average Net AssetsE,F | |||||
| Expenses before reductions | .71% | .70% | .70% | .71% | .72% |
| Expenses net of fee waivers, if any | .70% | .70% | .70% | .71% | .72% |
| Expenses net of all reductions | .70% | .70% | .68% | .70% | .71% |
| Net investment income (loss) | 1.86% | 1.78% | 1.93% | 2.09% | 1.56% |
| Supplemental Data | |||||
| Net assets, end of period (in millions) | $36 | $28 | $24 | $1,031 | $1,017 |
| Portfolio turnover rateG | 35% | 44% | 48% | 57% | 123% |
A Calculated based on average shares outstanding during the period.
B Net realized and unrealized gain (loss) per share reflects proceeds from litigation which amounted to $0.04 per share. Excluding these litigation proceeds, the total return would have been (.84)%.
C Total distributions of $2.34 per share is comprised of distributions from net investment income of $.454 and distributions from net realized gain of $1.883 per share.
D Total returns would have been lower if certain expenses had not been reduced during the applicable periods shown.
E Fees and expenses of any underlying Fidelity Central Funds are not included in the Fund's expense ratio. The Fund indirectly bears its proportionate share of the expenses of any underlying Fidelity Central Funds.
F Expense ratios reflect operating expenses of the class. Expenses before reductions do not reflect amounts reimbursed by the investment adviser or reductions from brokerage service arrangements or reductions from other expense offset arrangements and do not represent the amount paid by the class during periods when reimbursements or reductions occur. Expenses net of fee waivers reflect expenses after reimbursement by the investment adviser but prior to reductions from brokerage service arrangements or other expense offset arrangements. Expenses net of all reductions represent the net expenses paid by the class.
G Amount does not include the portfolio activity of any underlying Fidelity Central Funds.
See accompanying notes which are an integral part of the financial statements.
Notes to Financial Statements
For the period ended November 30, 2015
(Amounts in thousands except percentages)
1. Organization.
Fidelity Advisor Growth & Income Fund (the Fund) is a fund of Fidelity Advisor Series I (the Trust) and is authorized to issue an unlimited number of shares. The Trust is registered under the Investment Company Act of 1940, as amended (the 1940 Act), as an open-end management investment company organized as a Massachusetts business trust. The Fund offers Class A, Class T, Class C, and Class I (formerly Institutional Class) shares, each of which, along with Class B shares, has equal rights as to assets and voting privileges. Class B shares are closed to new accounts and additional purchases, except for exchanges and reinvestments. Each class has exclusive voting rights with respect to matters that affect that class. Class B shares will automatically convert to Class A shares after a holding period of seven years from the initial date of purchase.
2. Investments in Fidelity Central Funds.
The Fund invests in Fidelity Central Funds, which are open-end investment companies generally available only to other investment companies and accounts managed by the investment adviser and its affiliates. The Fund's Schedule of Investments lists each of the Fidelity Central Funds held as of period end, if any, as an investment of the Fund, but does not include the underlying holdings of each Fidelity Central Fund. As an Investing Fund, the Fund indirectly bears its proportionate share of the expenses of the underlying Fidelity Central Funds.
The Money Market Central Funds seek preservation of capital and current income and are managed by Fidelity Investments Money Management, Inc. (FIMM), an affiliate of the investment adviser. Annualized expenses of the Money Market Central Funds as of their most recent shareholder report date are less than .005%.
A complete unaudited list of holdings for each Fidelity Central Fund is available upon request or at the Securities and Exchange Commission (the SEC) website at www.sec.gov. In addition, the financial statements of the Fidelity Central Funds, which are not covered by the Fund's Report of Independent Registered Public Accounting Firm, are available on the SEC website or upon request.
3. Significant Accounting Policies.
The financial statements have been prepared in conformity with accounting principles generally accepted in the United States of America (GAAP), which require management to make certain estimates and assumptions at the date of the financial statements. Actual results could differ from those estimates. Subsequent events, if any, through the date that the financial statements were issued have been evaluated in the preparation of the financial statements. The following summarizes the significant accounting policies of the Fund:
Investment Valuation. Investments are valued as of 4:00 p.m. Eastern time on the last calendar day of the period. The Board of Trustees (the Board) has delegated the day to day responsibility for the valuation of the Fund's investments to the Fidelity Management & Research Company (FMR) Fair Value Committee (the Committee). In accordance with valuation policies and procedures approved by the Board, the Fund attempts to obtain prices from one or more third party pricing vendors or brokers to value its investments. When current market prices, quotations or currency exchange rates are not readily available or reliable, investments will be fair valued in good faith by the Committee, in accordance with procedures adopted by the Board. Factors used in determining fair value vary by investment type and may include market or investment specific events, changes in interest rates and credit quality. The frequency with which these procedures are used cannot be predicted and they may be utilized to a significant extent. The Committee oversees the Fund's valuation policies and procedures and reports to the Board on the Committee's activities and fair value determinations. The Board monitors the appropriateness of the procedures used in valuing the Fund's investments and ratifies the fair value determinations of the Committee.
The Fund categorizes the inputs to valuation techniques used to value its investments into a disclosure hierarchy consisting of three levels as shown below:
- Level 1 – quoted prices in active markets for identical investments
- Level 2 – other significant observable inputs (including quoted prices for similar investments, interest rates, prepayment speeds, etc.)
- Level 3 – unobservable inputs (including the Fund's own assumptions based on the best information available)
Valuation techniques used to value the Fund's investments by major category are as follows:
Equity securities, including restricted securities, for which market quotations are readily available, are valued at the last reported sale price or official closing price as reported by a third party pricing vendor on the primary market or exchange on which they are traded and are categorized as Level 1 in the hierarchy. In the event there were no sales during the day or closing prices are not available, securities are valued at the last quoted bid price or may be valued using the last available price and are generally categorized as Level 2 in the hierarchy. For foreign equity securities, when market or security specific events arise, comparisons to the valuation of American Depositary Receipts (ADRs), futures contracts, Exchange-Traded Funds (ETFs) and certain indexes as well as quoted prices for similar securities may be used and would be categorized as Level 2 in the hierarchy. Utilizing these techniques may result in transfers between Level 1 and Level 2. For equity securities, including restricted securities, where observable inputs are limited, assumptions about market activity and risk are used and these securities may be categorized as Level 3 in the hierarchy.
Debt securities, including restricted securities, are valued based on evaluated prices received from third party pricing vendors or from brokers who make markets in such securities. Corporate bonds are valued by pricing vendors who utilize matrix pricing which considers yield or price of bonds of comparable quality, coupon, maturity and type or by broker-supplied prices. When independent prices are unavailable or unreliable, debt securities may be valued utilizing pricing methodologies which consider similar factors that would be used by third party pricing vendors. Debt securities are generally categorized as Level 2 in the hierarchy but may be Level 3 depending on the circumstances.
Investments in open-end mutual funds, including the Fidelity Central Funds, are valued at their closing net asset value (NAV) each business day and are categorized as Level 1 in the hierarchy.
Changes in valuation techniques may result in transfers in or out of an assigned level within the disclosure hierarchy. The aggregate value of investments by input level as of November 30, 2015 is included at the end of the Fund's Schedule of Investments.
Foreign Currency. The Fund may use foreign currency contracts to facilitate transactions in foreign-denominated securities. Gains and losses from these transactions may arise from changes in the value of the foreign currency or if the counterparties do not perform under the contracts' terms.
Foreign-denominated assets, including investment securities, and liabilities are translated into U.S. dollars at the exchange rates at period end. Purchases and sales of investment securities, income and dividends received and expenses denominated in foreign currencies are translated into U.S. dollars at the exchange rate in effect on the transaction date.
The effects of exchange rate fluctuations on investments are included with the net realized and unrealized gain (loss) on investment securities. Other foreign currency transactions resulting in realized and unrealized gain (loss) are disclosed separately.
Investment Transactions and Income. For financial reporting purposes, the Fund's investment holdings and NAV include trades executed through the end of the last business day of the period. The NAV per share for processing shareholder transactions is calculated as of the close of business of the New York Stock Exchange (NYSE), normally 4:00 p.m. Eastern time and includes trades executed through the end of the prior business day. Gains and losses on securities sold are determined on the basis of identified cost and may include proceeds received from litigation. Dividend income is recorded on the ex-dividend date, except for certain dividends from foreign securities where the ex-dividend date may have passed, which are recorded as soon as the Fund is informed of the ex-dividend date. Non-cash dividends included in dividend income, if any, are recorded at the fair market value of the securities received. Income and capital gain distributions from Fidelity Central Funds, if any, are recorded on the ex-dividend date. Distributions received on securities that represent a return of capital or capital gain are recorded as a reduction of cost of investments and/or as a realized gain. Subsequent to ex-dividend date the Fund determines the components of these distributions, based upon receipt of tax filings or other correspondence relating to the underlying investment. Interest income is accrued as earned and includes coupon interest and amortization of premium and accretion of discount on debt securities as applicable. Investment income is recorded net of foreign taxes withheld where recovery of such taxes is uncertain.
Class Allocations and Expenses. Investment income, realized and unrealized capital gains and losses, common expenses of the Fund, and certain fund-level expense reductions, if any, are allocated daily on a pro-rata basis to each class based on the relative net assets of each class to the total net assets of the Fund. Each class differs with respect to transfer agent and distribution and service plan fees incurred. Certain expense reductions may also differ by class. For the reporting period, the allocated portion of income and expenses to each class as a percent of its average net assets may vary due to the timing of recording these transactions in relation to fluctuating net assets of the classes. Expenses directly attributable to a fund are charged to that fund. Expenses attributable to more than one fund are allocated among the respective funds on the basis of relative net assets or other appropriate methods. Expense estimates are accrued in the period to which they relate and adjustments are made when actual amounts are known.
Income Tax Information and Distributions to Shareholders. Each year, the Fund intends to qualify as a regulated investment company under Subchapter M of the Internal Revenue Code, including distributing substantially all of its taxable income and realized gains. As a result, no provision for U.S. Federal income taxes is required. As of November 30, 2015, the Fund did not have any unrecognized tax benefits in the financial statements; nor is the Fund aware of any tax positions for which it is reasonably possible that the total amounts of unrecognized tax benefits will significantly change in the next twelve months. The Fund files a U.S. federal tax return, in addition to state and local tax returns as required. The Fund's federal income tax returns are subject to examination by the Internal Revenue Service (IRS) for a period of three fiscal years after they are filed. State and local tax returns may be subject to examination for an additional fiscal year depending on the jurisdiction. Foreign taxes are provided for based on the Fund's understanding of the tax rules and rates that exist in the foreign markets in which it invests.
Distributions are declared and recorded on the ex-dividend date. Income dividends and capital gain distributions are declared separately for each class. Income and capital gain distributions are determined in accordance with income tax regulations, which may differ from GAAP. In addition, the fund will claim a portion of the payment made to redeeming shareholders as a distribution for income tax purposes.
Capital accounts within the financial statements are adjusted for permanent book-tax differences. These adjustments have no impact on net assets or the results of operations. Capital accounts are not adjusted for temporary book-tax differences which will reverse in a subsequent period.
Book-tax differences are primarily due to foreign currency transactions, market discount, partnerships, certain conversion ratio adjustments, and losses deferred due to wash sales.
The federal tax cost of investment securities and unrealized appreciation (depreciation) as of period end were as follows:
| Gross unrealized appreciation | $125,258 |
| Gross unrealized depreciation | (34,114) |
| Net unrealized appreciation (depreciation) on securities | $91,144 |
| Tax Cost | $455,134 |
The tax-based components of distributable earnings as of period end were as follows:
| Undistributed ordinary income | $6,575 |
| Undistributed long-term capital gain | $32,493 |
| Net unrealized appreciation (depreciation) on securities and other investments | $91,132 |
The tax character of distributions paid was as follows:
| November 30, 2015 | November 30, 2014 | |
| Ordinary Income | $10,140 | $ 1,555 |
| Long-term Capital Gains | 36,903 | 4,023 |
| Total | $47,043 | $ 5,578 |
Delayed Delivery Transactions and When-Issued Securities. During the period, the Fund transacted in securities on a delayed delivery or when-issued basis. Payment and delivery may take place after the customary settlement period for that security. The price of the underlying securities and the date when the securities will be delivered and paid for are fixed at the time the transaction is negotiated. The securities purchased on a delayed delivery or when-issued basis are identified as such in the Fund's Schedule of Investments. The Fund may receive compensation for interest forgone in the purchase of a delayed delivery or when-issued security. With respect to purchase commitments, the Fund identifies securities as segregated in its records with a value at least equal to the amount of the commitment. Losses may arise due to changes in the value of the underlying securities or if the counterparty does not perform under the contract's terms, or if the issuer does not issue the securities due to political, economic, or other factors.
Restricted Securities. The Fund may invest in securities that are subject to legal or contractual restrictions on resale. These securities generally may be resold in transactions exempt from registration or to the public if the securities are registered. Disposal of these securities may involve time-consuming negotiations and expense, and prompt sale at an acceptable price may be difficult. Information regarding restricted securities is included at the end of the Fund's Schedule of Investments.
4. Purchases and Sales of Investments.
Purchases and sales of securities, other than short-term securities, aggregated $202,351 and $257,454, respectively.
5. Fees and Other Transactions with Affiliates.
Management Fee. Fidelity Management & Research Company (the investment adviser) and its affiliates provide the Fund with investment management related services for which the Fund pays a monthly management fee. The management fee is the sum of an individual fund fee rate that is based on an annual rate of .20% of the Fund's average net assets and an annualized group fee rate that averaged .25% during the period. The group fee rate is based upon the average net assets of all the mutual funds advised by the investment adviser, including any mutual funds previously advised by the investment adviser that are currently advised by Fidelity SelectCo, LLC, an affiliate of the investment adviser. The group fee rate decreases as assets under management increase and increases as assets under management decrease. For the reporting period, the total annual management fee rate was .45% of the Fund's average net assets.
Distribution and Service Plan Fees. In accordance with Rule 12b-1 of the 1940 Act, the Fund has adopted separate Distribution and Service Plans for each class of shares. Certain classes pay Fidelity Distributors Corporation (FDC), an affiliate of the investment adviser, separate Distribution and Service Fees, each of which is based on an annual percentage of each class' average net assets. In addition, FDC may pay financial intermediaries for selling shares of the Fund and providing shareholder support services. For the period, the Distribution and Service Fee rates, total fees and amounts retained by FDC were as follows:
| Distribution Fee | Service Fee | Total Fees | Retained by FDC | |
| Class A | -% | .25% | $649 | $8 |
| Class T | .25% | .25% | 977 | 3 |
| Class B | .75% | .25% | 65 | 49 |
| Class C | .75% | .25% | 824 | 74 |
| $2,515 | $134 |
Sales Load. FDC may receive a front-end sales charge of up to 5.75% for selling Class A shares and 3.50% for selling Class T shares, some of which is paid to financial intermediaries for selling shares of the Fund. Depending on the holding period, FDC may receive contingent deferred sales charges levied on Class A, Class T, Class B, and Class C redemptions. The deferred sales charges range from 5.00% to 1.00% for Class B shares, 1.00% for Class C shares, 1.00% for certain purchases of Class A shares and .25% for certain purchases of Class T shares.
For the period, sales charge amounts retained by FDC were as follows:
| Retained by FDC | |
| Class A | $72 |
| Class T | 17 |
| Class B(a) | 2 |
| Class C(a) | 8 |
| $99 |
(a) When Class B and Class C shares are initially sold, FDC pays commissions from its own resources to financial intermediaries through which the sales are made.
Transfer Agent Fees. Fidelity Investments Institutional Operations Company, Inc., (FIIOC), an affiliate of the investment adviser, is the transfer, dividend disbursing and shareholder servicing agent for each class of the Fund. FIIOC receives account fees and asset-based fees that vary according to the account size and type of account of the shareholders of the respective classes of the Fund. FIIOC pays for typesetting, printing and mailing of shareholder reports, except proxy statements.
For the period, transfer agent fees for each class were as follows:
| Amount | % of Class-Level Average Net Assets | |
| Class A | $560 | .22 |
| Class T | 417 | .21 |
| Class B | 20 | .30 |
| Class C | 176 | .21 |
| Class I | 60 | .19 |
| $1,233 |
Accounting and Security Lending Fees. Fidelity Service Company, Inc. (FSC), an affiliate of the investment adviser, maintains the Fund's accounting records. The accounting fee is based on the level of average net assets for each month. Under a separate contract, FSC administers the security lending program. The security lending fee is based on the number and duration of lending transactions.
Brokerage Commissions. The Fund placed a portion of its portfolio transactions with brokerage firms which are affiliates of the investment adviser. Brokerage commissions are included in net realized gain (loss) and change in net unrealized appreciation (depreciation) in the Statement of Operations. The commissions paid to these affiliated firms were $4 for the period.
Interfund Lending Program. Pursuant to an Exemptive Order issued by the SEC, the Fund, along with other registered investment companies having management contracts with FMR or other affiliated entities of FMR, may participate in an interfund lending program. This program provides an alternative credit facility allowing the funds to borrow from, or lend money to, other participating affiliated funds. At period end, there were no interfund loans outstanding. The Fund's activity in this program during the period for which loans were outstanding was as follows:
| Borrower or Lender | Average Loan Balance | Weighted Average Interest Rate | Interest Expense |
| Borrower | $16,385 | .34% | $1 |
6. Committed Line of Credit.
The Fund participates with other funds managed by the investment adviser or an affiliate in a $4.25 billion credit facility (the "line of credit") to be utilized for temporary or emergency purposes to fund shareholder redemptions or for other short-term liquidity purposes. The Fund has agreed to pay commitment fees on its pro-rata portion of the line of credit, which amounted to $1 and is reflected in Miscellaneous expenses on the Statement of Operations. During the period, the Fund did not borrow on this line of credit.
7. Security Lending.
The Fund lends portfolio securities through a lending agent from time to time in order to earn additional income. For equity securities, a lending agent is used and may loan securities to certain qualified borrowers, including Fidelity Capital Markets (FCM), a broker-dealer affiliated with the Fund. On the settlement date of the loan, the Fund receives collateral (in the form of U.S. Treasury obligations, letters of credit and/or cash) against the loaned securities and maintains collateral in an amount not less than 100% of the market value of the loaned securities during the period of the loan. The market value of the loaned securities is determined at the close of business of the Fund and any additional required collateral is delivered to the Fund on the next business day. The Fund or borrower may terminate the loan at any time, and if the borrower defaults on its obligation to return the securities loaned because of insolvency or other reasons, the Fund may apply collateral received from the borrower against the obligation. The Fund may experience delays and costs in recovering the securities loaned. Any cash collateral received is invested in the Fidelity Securities Lending Cash Central Fund. The value of loaned securities and cash collateral at period end are disclosed on the Fund's Statement of Assets and Liabilities. At period end, there were no security loans outstanding with FCM. Security lending income represents the income earned on investing cash collateral, less rebates paid to borrowers and any lending agent fees associated with the loan, plus any premium payments received for lending certain types of securities. Security lending income is presented in the Statement of Operations as a component of income from Fidelity Central Funds. Total security lending income during the period amounted to $69, including $1 from securities loaned to FCM.
8. Expense Reductions.
Commissions paid to certain brokers with whom the investment adviser, or its affiliates, places trades on behalf of the Fund include an amount in addition to trade execution, which may be rebated back to the Fund to offset certain expenses. This amount totaled $10 for the period
In addition, during the period the investment adviser reimbursed and/or waived a portion of fund-level operating expenses in the amount of $2 and a portion of class-level operating expenses as follows:
| Amount | |
| Class A | $6 |
| Class T | 5 |
| Class B | –(a) |
| Class C | 2 |
| Class I | 3 |
| $16 |
(a) In the amount of less than five hundred dollars.
9. Distributions to Shareholders.
Distributions to shareholders of each class were as follows:
| Years ended November 30, | 2015 | 2014 |
| From net investment income | ||
| Class A | $3,464 | $1,111 |
| Class T | 2,191 | 444 |
| Class B | 27 | – |
| Class C | 567 | – |
| Class I | 429 | – |
| Total | $6,678 | $1,555 |
| From net realized gain | ||
| Class A | $18,027 | $1,766 |
| Class T | 14,122 | 1,470 |
| Class B | 575 | 82 |
| Class C | 5,855 | 550 |
| Class I | 1,786 | 155 |
| Total | $40,365 | $4,023 |
10. Share Transactions.
Share transactions for each class were as follows and may contain automatic conversions between classes or exchanges between funds:
| Shares | Shares | Dollars | Dollars | |
| Years ended November 30, | 2015 | 2014 | 2015 | 2014 |
| Class A | ||||
| Shares sold | 1,359 | 1,298 | $36,064 | $34,745 |
| Reinvestment of distributions | 778 | 102 | 19,973 | 2,583 |
| Shares redeemed | (2,428) | (1,724) | (64,761) | (46,421) |
| Net increase (decrease) | (291) | (324) | $(8,724) | $(9,093) |
| Class T | ||||
| Shares sold | 490 | 589 | $12,982 | $15,822 |
| Reinvestment of distributions | 618 | 73 | 15,887 | 1,855 |
| Shares redeemed | (1,760) | (1,477) | (46,877) | (39,516) |
| Net increase (decrease) | (652) | (815) | $(18,008) | $(21,839) |
| Class B | ||||
| Shares sold | 10 | 9 | $251 | $223 |
| Reinvestment of distributions | 23 | 3 | 570 | 76 |
| Shares redeemed | (153) | (174) | (3,905) | (4,437) |
| Net increase (decrease) | (120) | (162) | $(3,084) | $(4,138) |
| Class C | ||||
| Shares sold | 460 | 544 | $11,623 | $13,842 |
| Reinvestment of distributions | 231 | 19 | 5,657 | 475 |
| Shares redeemed | (620) | (478) | (15,418) | (12,168) |
| Net increase (decrease) | 71 | 85 | $1,862 | $2,149 |
| Class I | ||||
| Shares sold | 615 | 389 | $16,671 | $10,703 |
| Reinvestment of distributions | 71 | 5 | 1,846 | 137 |
| Shares redeemed | (272) | (375) | (7,178) | (10,044) |
| Net increase (decrease) | 414 | 19 | $11,339 | $796 |
11. Other.
The Fund's organizational documents provide former and current trustees and officers with a limited indemnification against liabilities arising in connection with the performance of their duties to the Fund. In the normal course of business, the Fund may also enter into contracts that provide general indemnifications. The Fund's maximum exposure under these arrangements is unknown as this would be dependent on future claims that may be made against the Fund. The risk of material loss from such claims is considered remote.
Report of Independent Registered Public Accounting Firm
To the Trustees of Fidelity Advisor Series I and Shareholders of Fidelity Advisor® Growth & Income Fund:
We have audited the accompanying statement of assets and liabilities of Fidelity Advisor® Growth & Income Fund (the Fund), a fund of Fidelity Advisor Series I, including the schedule of investments, as of November 30, 2015, and the related statement of operations for the year then ended, the statement of changes in net assets for each of the two years in the period then ended, and the financial highlights for each of the five years in the period then ended. These financial statements and financial highlights are the responsibility of the Fund's management. Our responsibility is to express an opinion on these financial statements and financial highlights based on our audits.
We conducted our audits in accordance with the standards of the Public Company Accounting Oversight Board (United States). Those standards require that we plan and perform the audit to obtain reasonable assurance about whether the financial statements and financial highlights are free of material misstatement. The Fund is not required to have, nor were we engaged to perform, an audit of its internal control over financial reporting. Our audits included consideration of internal control over financial reporting as a basis for designing audit procedures that are appropriate in the circumstances, but not for the purpose of expressing an opinion on the effectiveness of the Fund's internal control over financial reporting. Accordingly, we express no such opinion. An audit also includes examining, on a test basis, evidence supporting the amounts and disclosures in the financial statements, assessing the accounting principles used and significant estimates made by management, as well as evaluating the overall financial statement presentation. Our procedures included confirmation of securities owned as of November 30, 2015, by correspondence with the custodians and brokers; when replies were not received from brokers, we performed other auditing procedures. We believe that our audits provide a reasonable basis for our opinion.
In our opinion, such financial statements and financial highlights referred to above present fairly, in all material respects, the financial position of Fidelity Advisor® Growth & Income Fund as of November 30, 2015, the results of its operations for the year then ended, the changes in its net assets for each of the two years in the period then ended, and the financial highlights for each of the five years in the period then ended in conformity with accounting principles generally accepted in the United States of America.
DELOITTE & TOUCHE LLP
Boston, Massachusetts
January 14, 2016
Trustees and Officers
The Trustees, Members of the Advisory Board (if any), and officers of the trust and fund, as applicable, are listed below. The Board of Trustees governs the fund and is responsible for protecting the interests of shareholders. The Trustees are experienced executives who meet periodically throughout the year to oversee the fund's activities, review contractual arrangements with companies that provide services to the fund, oversee management of the risks associated with such activities and contractual arrangements, and review the fund's performance. Each of the Trustees oversees 170 funds.
The Trustees hold office without limit in time except that (a) any Trustee may resign; (b) any Trustee may be removed by written instrument, signed by at least two-thirds of the number of Trustees prior to such removal; (c) any Trustee who requests to be retired or who has become incapacitated by illness or injury may be retired by written instrument signed by a majority of the other Trustees; and (d) any Trustee may be removed at any special meeting of shareholders by a two-thirds vote of the outstanding voting securities of the trust. Each Trustee who is not an interested person (as defined in the 1940 Act) of the trust and the fund is referred to herein as an Independent Trustee. Each Independent Trustee shall retire not later than the last day of the calendar year in which his or her 75th birthday occurs. The Independent Trustees may waive this mandatory retirement age policy with respect to individual Trustees. Officers and Advisory Board Members hold office without limit in time, except that any officer or Advisory Board Member may resign or may be removed by a vote of a majority of the Trustees at any regular meeting or any special meeting of the Trustees. Except as indicated, each individual has held the office shown or other offices in the same company for the past five years.
The fund’s Statement of Additional Information (SAI) includes more information about the Trustees. To request a free copy, call Fidelity at 1-877-208-0098.
Experience, Skills, Attributes, and Qualifications of the Trustees. The Governance and Nominating Committee has adopted a statement of policy that describes the experience, qualifications, attributes, and skills that are necessary and desirable for potential Independent Trustee candidates (Statement of Policy). The Board believes that each Trustee satisfied at the time he or she was initially elected or appointed a Trustee, and continues to satisfy, the standards contemplated by the Statement of Policy. The Governance and Nominating Committee also engages professional search firms to help identify potential Independent Trustee candidates who have the experience, qualifications, attributes, and skills consistent with the Statement of Policy. From time to time, additional criteria based on the composition and skills of the current Independent Trustees, as well as experience or skills that may be appropriate in light of future changes to board composition, business conditions, and regulatory or other developments, have also been considered by the professional search firms and the Governance and Nominating Committee. In addition, the Board takes into account the Trustees' commitment and participation in Board and committee meetings, as well as their leadership of standing and ad hoc committees throughout their tenure.
In determining that a particular Trustee was and continues to be qualified to serve as a Trustee, the Board has considered a variety of criteria, none of which, in isolation, was controlling. The Board believes that, collectively, the Trustees have balanced and diverse experience, qualifications, attributes, and skills, which allow the Board to operate effectively in governing the fund and protecting the interests of shareholders. Information about the specific experience, skills, attributes, and qualifications of each Trustee, which in each case led to the Board's conclusion that the Trustee should serve (or continue to serve) as a trustee of the fund, is provided below.
Board Structure and Oversight Function. James C. Curvey is an interested person and currently serves as Chairman. The Trustees have determined that an interested Chairman is appropriate and benefits shareholders because an interested Chairman has a personal and professional stake in the quality and continuity of services provided to the fund. Independent Trustees exercise their informed business judgment to appoint an individual of their choosing to serve as Chairman, regardless of whether the Trustee happens to be independent or a member of management. The Independent Trustees have determined that they can act independently and effectively without having an Independent Trustee serve as Chairman and that a key structural component for assuring that they are in a position to do so is for the Independent Trustees to constitute a substantial majority for the Board. The Independent Trustees also regularly meet in executive session. Ned C. Lautenbach serves as Chairman of the Independent Trustees and as such (i) acts as a liaison between the Independent Trustees and management with respect to matters important to the Independent Trustees and (ii) with management prepares agendas for Board meetings.
Fidelity® funds are overseen by different Boards of Trustees. The fund's Board oversees Fidelity's high income and certain equity funds, and other Boards oversee Fidelity's investment-grade bond, money market, asset allocation, and sector funds. The asset allocation funds may invest in Fidelity® funds overseen by the fund's Board. The use of separate Boards, each with its own committee structure, allows the Trustees of each group of Fidelity® funds to focus on the unique issues of the funds they oversee, including common research, investment, and operational issues. On occasion, the separate Boards establish joint committees to address issues of overlapping consequences for the Fidelity® funds overseen by each Board.
The Trustees operate using a system of committees to facilitate the timely and efficient consideration of all matters of importance to the Trustees, the fund, and fund shareholders and to facilitate compliance with legal and regulatory requirements and oversight of the fund's activities and associated risks. The Board, acting through its committees, has charged FMR and its affiliates with (i) identifying events or circumstances the occurrence of which could have demonstrably adverse effects on the fund's business and/or reputation; (ii) implementing processes and controls to lessen the possibility that such events or circumstances occur or to mitigate the effects of such events or circumstances if they do occur; and (iii) creating and maintaining a system designed to evaluate continuously business and market conditions in order to facilitate the identification and implementation processes described in (i) and (ii) above. Because the day-to-day operations and activities of the fund are carried out by or through FMR, its affiliates, and other service providers, the fund's exposure to risks is mitigated but not eliminated by the processes overseen by the Trustees. While each of the Board's committees has responsibility for overseeing different aspects of the fund's activities, oversight is exercised primarily through the Operations, Audit, and Compliance Committees. In addition, the Independent Trustees have worked with FMR to enhance the Board's oversight of investment and financial risks, legal and regulatory risks, technology risks, and operational risks, including the development of additional risk reporting to the Board. For example, a working group comprised of Independent Trustees and FMR has worked and continues to work to review the Fidelity® funds' valuation-related activities, reporting and risk management. Appropriate personnel, including but not limited to the fund's Chief Compliance Officer (CCO), FMR's internal auditor, the independent accountants, the fund's Treasurer and portfolio management personnel, make periodic reports to the Board's committees, as appropriate, including an annual review of Fidelity's risk management program for the Fidelity® funds. The responsibilities of each standing committee, including their oversight responsibilities, are described further under "Standing Committees of the Trustees."
Interested Trustees*:
Correspondence intended for a Trustee who is an interested person may be sent to Fidelity Investments, 245 Summer Street, Boston, Massachusetts 02210.
Name, Year of Birth; Principal Occupations and Other Relevant Experience+
James C. Curvey (1935)
Year of Election or Appointment: 2007
Trustee
Chairman of the Board of Trustees
Mr. Curvey also serves as Trustee of other Fidelity® funds. Mr. Curvey is a Director of Fidelity Research & Analysis Co. (investment adviser firm, 2009-present), and Vice Chairman (2007-present) and Director of FMR LLC (diversified financial services company). In addition, Mr. Curvey serves as an Overseer for the Boston Symphony Orchestra and a member of the board of Artis-Naples, Naples, Florida, and as a Trustee for Brewster Academy, Wolfeboro, New Hampshire. Previously, Mr. Curvey served as a Director of Fidelity Investments Money Management, Inc. (investment adviser firm, 2009-2014) and a Director of FMR and FMR Co., Inc. (investment adviser firms, 2007-2014).
Charles S. Morrison (1960)
Year of Election or Appointment: 2014
Trustee
Mr. Morrison also serves as Trustee of other funds. He serves as a Director of Fidelity Investments Money Management, Inc. (FIMM) (investment adviser firm, 2014-present), Director of Fidelity SelectCo, LLC (investment adviser firm, 2014-present), President, Asset Management (2014-present), and is an employee of Fidelity Investments. Previously, Mr. Morrison served as Vice President of Fidelity's Fixed Income and Asset Allocation Funds (2012-2014), President, Fixed Income (2011-2014), Vice President of Fidelity's Money Market Funds (2005-2009), President, Money Market Group Leader of FMR (investment adviser firm, 2009), and Senior Vice President, Money Market Group of FMR (2004-2009). Mr. Morrison also served as Vice President of Fidelity's Bond Funds (2002-2005), certain Balanced Funds (2002-2005), and certain Asset Allocation Funds (2002-2007), and as Senior Vice President (2002-2005) of Fidelity's Bond Division.
* Determined to be an “Interested Trustee” by virtue of, among other things, his or her affiliation with the trust or various entities under common control with FMR.
+ The information includes the Trustee's principal occupation during the last five years and other information relating to the experience, attributes, and skills relevant to the Trustee's qualifications to serve as a Trustee, which led to the conclusion that the Trustee should serve as a Trustee for the fund.
Independent Trustees:
Correspondence intended for an Independent Trustee may be sent to Fidelity Investments, P.O. Box 55235, Boston, Massachusetts 02205-5235.
Name, Year of Birth; Principal Occupations and Other Relevant Experience+
Dennis J. Dirks (1948)
Year of Election or Appointment: 2005
Trustee
Mr. Dirks also serves as Trustee of other Fidelity® funds. Prior to his retirement in May 2003, Mr. Dirks was Chief Operating Officer and a member of the Board of The Depository Trust & Clearing Corporation (DTCC). He also served as President, Chief Operating Officer, and Board member of The Depository Trust Company (DTC) and President and Board member of the National Securities Clearing Corporation (NSCC). In addition, Mr. Dirks served as Chief Executive Officer and Board member of the Government Securities Clearing Corporation, Chief Executive Officer and Board member of the Mortgage-Backed Securities Clearing Corporation, as a Trustee and a member of the Finance Committee of Manhattan College (2005-2008), as a Trustee and a member of the Finance Committee of AHRC of Nassau County (2006-2008), and as a member of the Independent Directors Council (IDC) Governing Council (2010-2015). Mr. Dirks is a member of the Board of Directors for The Brookville Center for Children's Services, Inc. (2009-present).
Alan J. Lacy (1953)
Year of Election or Appointment: 2008
Trustee
Mr. Lacy also serves as Trustee of other Fidelity® funds. Mr. Lacy serves as a member of the Board of Directors of Dave & Buster's Entertainment, Inc. (restaurant and entertainment complexes, 2010-present) and Bristol-Myers Squibb Company (global pharmaceuticals, 2008-present). In addition, Mr. Lacy served as Senior Adviser (2007-2014) of Oak Hill Capital Partners, L.P. (private equity) and also served as Chief Executive Officer (2000-2005) and Vice Chairman (2005-2006) of Sears Holdings Corporation and Sears, Roebuck and Co. (retail). Mr. Lacy is a member of the Board of Trustees of The National Parks Conservation Association (2006-present). Previously, Mr. Lacy served as Chairman of the Board of Trustees of the National Parks Conservation Association (2008-2011) and as a member of the Board of Directors for The Western Union Company (global money transfer, 2006-2011), The Hillman Companies, Inc. (hardware wholesalers, 2010-2014), and Earth Fare, Inc. (retail grocery, 2010-2014).
Ned C. Lautenbach (1944)
Year of Election or Appointment: 2000
Trustee
Chairman of the Independent Trustees
Mr. Lautenbach also serves as Trustee of other Fidelity® funds. Mr. Lautenbach currently serves as the Lead Director of the Eaton Corporation Board of Directors (diversified industrial, 1997-present). Mr. Lautenbach is Chairman of the Board of Directors of Artis-Naples in Naples, Florida (2012-present), a member of the Council on Foreign Relations (1994-present), and a member of the Board of Governors, State University System of Florida (2013-present). Previously, Mr. Lautenbach was a Partner/Advisory Partner at Clayton, Dubilier & Rice, LLC (private equity investment, 1998-2010), as well as a Director of Sony Corporation (2006-2007).
Joseph Mauriello (1944)
Year of Election or Appointment: 2008
Trustee
Mr. Mauriello also serves as Trustee of other Fidelity® funds. Prior to his retirement in January 2006, Mr. Mauriello served in numerous senior management positions including Deputy Chairman and Chief Operating Officer (2004-2005), and Vice Chairman of Financial Services (2002-2004) of KPMG LLP US (professional services, 1965-2005). Mr. Mauriello currently serves as a member of the Board of Directors of XL Group plc. (global insurance and re-insurance, 2006-present) and the Independent Directors Council (IDC) Governing Council (2015-present). Previously, Mr. Mauriello served as a Director of the Hamilton Funds of the Bank of New York (2006-2007) and of Arcadia Resources Inc. (health care services and products, 2007-2012).
Robert W. Selander (1950)
Year of Election or Appointment: 2011
Trustee
Mr. Selander also serves as Trustee of other Fidelity® funds. Mr. Selander serves as a Director of The Western Union Company (global money transfer, 2014-present). Previously, Mr. Selander served as a Member of the Advisory Board of other Fidelity® funds (2011), and Executive Vice Chairman (2010), Chief Executive Officer (2009-2010), and President and Chief Executive Officer (1997-2009) of Mastercard, Inc.
Cornelia M. Small (1944)
Year of Election or Appointment: 2005
Trustee
Ms. Small also serves as Trustee of other Fidelity® funds. Ms. Small is a member of the Board of Directors (2009-present) and Chair of the Investment Committee (2010-present) of the Teagle Foundation. Ms. Small also serves on the Investment Committee of the Berkshire Taconic Community Foundation (2008-present). Previously, Ms. Small served as Chairperson (2002-2008) and a member of the Investment Committee and Chairperson (2008-2012) and a member of the Board of Trustees of Smith College. In addition, Ms. Small served as Chief Investment Officer, Director of Global Equity Investments, and a member of the Board of Directors of Scudder, Stevens & Clark and Scudder Kemper Investments.
William S. Stavropoulos (1939)
Year of Election or Appointment: 2002
Trustee
Vice Chairman of the Independent Trustees
Mr. Stavropoulos also serves as Trustee of other Fidelity® funds. Mr. Stavropoulos serves as President and Founder of the Michigan Baseball Foundation, the Great Lakes Loons (2007-present). Mr. Stavropoulos is Chairman Emeritus of the Board of Directors of The Dow Chemical Company, where he previously served in numerous senior management positions, including President, CEO (1995-2000; 2002-2004), Chairman of the Executive Committee (2000-2006), and as a member of the Board of Directors (1990-2006). Currently, Mr. Stavropoulos is Chairman of the Board of Directors of Univar Inc. (global distributor of commodity and specialty chemicals), a Director of Teradata Corporation (data warehousing and technology solutions), and Maersk Inc. (industrial conglomerate), and a member of the Advisory Board for Metalmark Capital LLC (private equity investment, 2005-present). Mr. Stavropoulos is an operating advisor to Clayton, Dubilier & Rice, LLC (private equity investment). In addition, Mr. Stavropoulos is a member of the University of Notre Dame Advisory Council for the College of Science, a Trustee of the Rollin L. Gerstacker Foundation, and a Director of the Naples Philharmonic Center for the Arts. Previously, Mr. Stavropoulos served as a Director of Chemical Financial Corporation (bank holding company, 1993-2012) and Tyco International, Ltd. (multinational manufacturing and services, 2007-2012).
David M. Thomas (1949)
Year of Election or Appointment: 2008
Trustee
Mr. Thomas also serves as Trustee of other Fidelity® funds. Mr. Thomas serves as Non-Executive Chairman of the Board of Directors of Fortune Brands Home and Security (home and security products, 2011-present), as a member of the Board of Directors (2004-present) and Presiding Director (2013-present) of Interpublic Group of Companies, Inc. (marketing communication), and as a member of the Board of Trustees of the University of Florida (2013-present). Previously, Mr. Thomas served as Executive Chairman (2005-2006) and Chairman and Chief Executive Officer (2000-2005) of IMS Health, Inc. (pharmaceutical and healthcare information solutions), and a Director of Fortune Brands, Inc. (consumer products, 2000-2011).
+ The information includes the Trustee's principal occupation during the last five years and other information relating to the experience, attributes, and skills relevant to the Trustee's qualifications to serve as a Trustee, which led to the conclusion that the Trustee should serve as a Trustee for the fund.
Advisory Board Members and Officers:
Correspondence intended for an officer or Peter S. Lynch may be sent to Fidelity Investments, 245 Summer Street, Boston, Massachusetts 02210. Officers appear below in alphabetical order.
Name, Year of Birth; Principal Occupation
Peter S. Lynch (1944)
Year of Election or Appointment: 2003
Member of the Advisory Board
Mr. Lynch also serves as Member of the Advisory Board of other Fidelity® funds. Mr. Lynch is Vice Chairman and a Director of FMR (investment adviser firm) and FMR Co., Inc. (investment adviser firm). In addition, Mr. Lynch serves as a Trustee of Boston College and as the Chairman of the Inner-City Scholarship Fund. Previously, Mr. Lynch served on the Special Olympics International Board of Directors (1997-2006).
Elizabeth Paige Baumann (1968)
Year of Election or Appointment: 2012
Anti-Money Laundering (AML) Officer
Ms. Baumann also serves as AML Officer of other funds. She is Chief AML Officer of FMR LLC (diversified financial services company, 2012-present) and is an employee of Fidelity Investments. Previously, Ms. Baumann served as Vice President and Deputy Anti-Money Laundering Officer (2007-2012).
Marc R. Bryant (1966)
Year of Election or Appointment: 2015
Secretary and Chief Legal Officer (CLO)
Mr. Bryant also serves as Secretary and CLO of other funds. Mr. Bryant serves as CLO, Secretary, and Senior Vice President of Fidelity Management & Research Company (investment adviser firm, 2015-present) and FMR Co., Inc. (investment adviser firm, 2015-present); Secretary of Fidelity SelectCo, LLC (investment adviser firm, 2015-present) and Fidelity Investments Money Management, Inc. (investment adviser firm, 2015-present); and CLO of Fidelity Management & Research (Hong Kong) Limited (investment adviser firm, 2015-present). He is Senior Vice President and Deputy General Counsel of FMR LLC (diversified financial services company). Previously, Mr. Bryant served as Secretary and CLO of Fidelity Rutland Square Trust II (2010-2014) and Assistant Secretary of Fidelity's Fixed Income and Asset Allocation Funds (2013-2015). Prior to joining Fidelity Investments, Mr. Bryant served as a Senior Vice President and the Head of Global Retail Legal for AllianceBernstein L.P. (2006-2010), and as the General Counsel for ProFund Advisors LLC (2001-2006).
William C. Coffey (1969)
Year of Election or Appointment: 2009
Assistant Secretary
Mr. Coffey also serves as Assistant Secretary of other funds. He is Senior Vice President and Deputy General Counsel of FMR LLC (diversified financial services company, 2010-present), and is an employee of Fidelity Investments. Previously, Mr. Coffey served as Vice President and Associate General Counsel of FMR LLC (2005-2009).
Jonathan Davis (1968)
Year of Election or Appointment: 2010
Assistant Treasurer
Mr. Davis also serves as Assistant Treasurer of other funds, and is an employee of Fidelity Investments. Previously, Mr. Davis served as Vice President and Associate General Counsel of FMR LLC (diversified financial services company, 2003-2010).
Adrien E. Deberghes (1967)
Year of Election or Appointment: 2008
Deputy Treasurer
Mr. Deberghes also serves as an officer of other funds. He is an employee of Fidelity Investments (2008-present). Prior to joining Fidelity Investments, Mr. Deberghes was Senior Vice President of Mutual Fund Administration at State Street Corporation (2007-2008), Senior Director of Mutual Fund Administration at Investors Bank & Trust (2005-2007), and Director of Finance for Dunkin' Brands (2000-2005).
Stephanie J. Dorsey (1969)
Year of Election or Appointment: 2010
Assistant Treasurer
Ms. Dorsey also serves as an officer of other funds. She is an employee of Fidelity Investments (2008-present) and has served in other fund officer roles. Prior to joining Fidelity Investments, Ms. Dorsey served as Treasurer (2004-2008) of the JPMorgan Mutual Funds and Vice President (2004-2008) of JPMorgan Chase Bank.
Howard J. Galligan III (1966)
Year of Election or Appointment: 2014
Chief Financial Officer
Mr. Galligan also serves as Chief Financial Officer of other funds. Mr. Galligan serves as President of Fidelity Pricing and Cash Management Services (FPCMS) (2014-present) and as a Director of Strategic Advisers, Inc. (investment adviser firm, 2008-present). Previously, Mr. Galligan served as Chief Administrative Officer of Asset Management (2011-2014) and Chief Operating Officer and Senior Vice President of Investment Support for Strategic Advisers, Inc. (2003-2011).
Scott C. Goebel (1968)
Year of Election or Appointment: 2015
Vice President
Mr. Goebel serves as Vice President of other funds and is an employee of Fidelity Investments (2001-present). Previously, Mr. Goebel served as Secretary of Fidelity SelectCo, LLC (investment adviser firm, 2013-2015), Fidelity Investments Money Management, Inc. (FIMM) (investment adviser firm, 2010-2015), and Fidelity Research and Analysis Company (FRAC) (investment adviser firm, 2010-2015); General Counsel, Secretary, and Senior Vice President of Fidelity Management & Research Company (investment adviser firm, 2008-2015) and FMR Co., Inc. (investment adviser firm, 2008-2015); Assistant Secretary of Fidelity Management & Research (Japan) Limited (investment adviser firm, 2008-2015) and FMR Investment Management (U.K.) Limited (investment adviser firm, 2008-2015); Chief Legal Officer (CLO) of Fidelity Management & Research (Hong Kong) Limited (investment adviser firm, 2008-2015); Secretary and CLO of certain Fidelity® funds (2008-2015); Assistant Secretary of FIMM (2008-2010), FRAC (2008-2010), and certain funds (2007-2008); and as Vice President and Secretary of Fidelity Distributors Corporation (FDC) (2005-2007).
Brian B. Hogan (1964)
Year of Election or Appointment: 2009
Vice President
Mr. Hogan also serves as Trustee or Vice President of other funds. Mr. Hogan serves as a Director of Fidelity SelectCo, LLC (investment adviser firm, 2014-present) and President of the Equity Division of FMR (investment adviser firm, 2009-present). Previously, Mr. Hogan served as Senior Vice President, Equity Research of FMR (2006-2009) and as a portfolio manager.
Chris Maher (1972)
Year of Election or Appointment: 2013
Assistant Treasurer
Mr. Maher serves as Assistant Treasurer of other funds. Mr. Maher is Vice President of Valuation Oversight and is an employee of Fidelity Investments. Previously, Mr. Maher served as Vice President of Asset Management Compliance (2013), Vice President of the Program Management Group of FMR (investment adviser firm, 2010-2013), and Vice President of Valuation Oversight (2008-2010).
Kenneth B. Robins (1969)
Year of Election or Appointment: 2008
President and Treasurer
Mr. Robins also serves as an officer of other funds. Mr. Robins serves as Executive Vice President of Fidelity Investments Money Management, Inc. (FIMM) (investment adviser firm, 2013-present) and is an employee of Fidelity Investments (2004-present). Previously, Mr. Robins served in other fund officer roles.
Stacie M. Smith (1974)
Year of Election or Appointment: 2013
Deputy Treasurer
Ms. Smith also serves as an officer of other funds. She is an employee of Fidelity Investments (2009-present) and has served in other fund officer roles. Prior to joining Fidelity Investments, Ms. Smith served as Senior Audit Manager of Ernst & Young LLP (1996-2009).
Renee Stagnone (1975)
Year of Election or Appointment: 2013
Deputy Treasurer
Ms. Stagnone also serves as Deputy Treasurer of other funds. Ms. Stagnone is an employee of Fidelity Investments (1997-present).
Linda J. Wondrack (1964)
Year of Election or Appointment: 2014
Chief Compliance Officer
Ms. Wondrack also serves as Chief Compliance Officer of other funds. Ms. Wondrack is Executive Vice President and head of the Ethics Office and Asset Management Compliance for Fidelity Investments (2012-present). Ms. Wondrack also serves as Chief Compliance Officer of Fidelity SelectCo, LLC (investment adviser firm, 2014-present); Chief Compliance Officer of Impresa Management LLC (2013-present); and Chief Compliance Officer of FMR Co., Inc. (investment adviser firm), Fidelity Investments Money Management, Inc. (investment adviser firm), Fidelity Management & Research (Japan) Limited (investment adviser firm), FMR Investment Management (U.K.) Limited (investment adviser firm), Fidelity Management & Research (Hong Kong) (investment adviser firm), Fidelity Management & Research Company (investment adviser firm), FIAM LLC (investment adviser firm), and Strategic Advisers, Inc. (investment adviser firm), Ballyrock Investment Advisors LLC, and Northern Neck Investors LLC (2012-present). Previously, Ms. Wondrack served as Senior Vice President and Chief Compliance Officer for Columbia Management Investment Advisers, LLC (2005-2012); Chief Compliance Officer for certain funds within the Columbia Family of Funds (2007-2012); and Senior Vice President of Compliance Risk Management at Bank of America (2005-2010).
Joseph F. Zambello (1957)
Year of Election or Appointment: 2011
Deputy Treasurer
Mr. Zambello also serves as Deputy Treasurer of other funds. Mr. Zambello is an employee of Fidelity Investments (1991-present). Previously, Mr. Zambello served as Vice President of the Program Management Group of FMR (investment adviser firm, 2009-2011) and Vice President of the Transfer Agent Oversight Group (2005-2009).
Shareholder Expense Example
As a shareholder of the Fund, you incur two types of costs: (1) transaction costs, including sales charges (loads) on purchase payments or redemption proceeds, and (2) ongoing costs, including management fees, distribution and/or service (12b-1) fees and other Fund expenses. This Example is intended to help you understand your ongoing costs (in dollars) of investing in the Fund and to compare these costs with the ongoing costs of investing in other mutual funds.
The Example is based on an investment of $1,000 invested at the beginning of the period and held for the entire period (June 1, 2015 to November 30, 2015).
Actual Expenses
The first line of the accompanying table for each class of the Fund provides information about actual account values and actual expenses. You may use the information in this line, together with the amount you invested, to estimate the expenses that you paid over the period. Simply divide your account value by $1,000.00 (for example, an $8,600 account value divided by $1,000.00 = 8.6), then multiply the result by the number in the first line for a class of the Fund under the heading entitled "Expenses Paid During Period" to estimate the expenses you paid on your account during this period. In addition, the Fund, as a shareholder in the underlying Fidelity Central Funds, will indirectly bear its pro-rata share of the fees and expenses incurred by the underlying Fidelity Central Funds. These fees and expenses are not included in the Fund's annualized expense ratio used to calculate the expense estimate in the table below.
Hypothetical Example for Comparison Purposes
The second line of the accompanying table for each class of the Fund provides information about hypothetical account values and hypothetical expenses based on a Class' actual expense ratio and an assumed rate of return of 5% per year before expenses, which is not the Class' actual return. The hypothetical account values and expenses may not be used to estimate the actual ending account balance or expenses you paid for the period. You may use this information to compare the ongoing costs of investing in the Fund and other funds. To do so, compare this 5% hypothetical example with the 5% hypothetical examples that appear in the shareholder reports of the other funds. In addition, the Fund, as a shareholder in the underlying Fidelity Central Funds, will indirectly bear its pro-rata share of the fees and expenses incurred by the underlying Fidelity Central Funds. These fees and expenses are not included in the Fund's annualized expense ratio used to calculate the expense estimate in the table below.
Please note that the expenses shown in the table are meant to highlight your ongoing costs only and do not reflect any transaction costs. Therefore, the second line of the table is useful in comparing ongoing costs only, and will not help you determine the relative total costs of owning different funds. In addition, if these transactional costs were included, your costs would have been higher.
| Annualized Expense Ratio-A | Beginning Account Value June 1, 2015 | Ending Account Value November 30, 2015 | Expenses Paid During Period-B June 1, 2015 to November 30, 2015 | |
| Class A | .98% | |||
| Actual | $1,000.00 | $965.20 | $4.83 | |
| Hypothetical-C | $1,000.00 | $1,020.16 | $4.96 | |
| Class T | 1.23% | |||
| Actual | $1,000.00 | $963.70 | $6.05 | |
| Hypothetical-C | $1,000.00 | $1,018.90 | $6.23 | |
| Class B | 1.81% | |||
| Actual | $1,000.00 | $960.90 | $8.90 | |
| Hypothetical-C | $1,000.00 | $1,015.99 | $9.15 | |
| Class C | 1.73% | |||
| Actual | $1,000.00 | $961.40 | $8.51 | |
| Hypothetical-C | $1,000.00 | $1,016.39 | $8.74 | |
| Class I | .70% | |||
| Actual | $1,000.00 | $966.50 | $3.45 | |
| Hypothetical-C | $1,000.00 | $1,021.56 | $3.55 |
A Annualized expense ratio reflects expenses net of applicable fee waivers.
B Expenses are equal to each Class' annualized expense ratio, multiplied by the average account value over the period, multiplied by 183/365 (to reflect the one-half year period).
C 5% return per year before expenses
Distributions (Unaudited)
The Board of Trustees of Fidelity Advisor Growth & Income Fund voted to pay to shareholders of record at the opening of business on record date, the following distributions per share derived from capital gains realized from sales of portfolio securities, and dividends derived from net investment income:
| Pay Date | Record Date | Dividends | Capital Gains | |
| Class A | 12/14/15 | 12/11/15 | $0.390 | $1.490 |
| 01/11/16 | 01/08/16 | $0.000 | $0.075 | |
| Class T | 12/14/15 | 12/11/15 | $0.319 | $1.490 |
| 01/11/16 | 01/08/16 | $0.000 | $0.075 | |
| Class B | 12/14/15 | 12/11/15 | $0.082 | $1.490 |
| 01/11/16 | 01/08/16 | $0.000 | $0.075 | |
| Class C | 12/14/15 | 12/11/15 | $0.206 | $1.490 |
| 01/11/16 | 01/08/16 | $0.000 | $0.075 |
The fund hereby designates as a capital gain dividend with respect to the taxable year ended November 30, 2015, $33,156,935, or, if subsequently determined to be different, the net capital gain of such year.
Class A , Class T, Class B and Class C designate 100% of the dividends distributed during the fiscal year as qualifying for the dividends–received deduction for corporate shareholders.
Class A , Class T, Class B and Class C designate 100% of dividends distributed during the fiscal year as amounts which may be taken into account as a dividend for purposes of the maximum rate under section 1(h)(11) of the Internal Revenue Code.
The fund will notify shareholders in January 2016 of amounts for use in preparing 2015 income tax returns.
Board Approval of Investment Advisory Contracts and Management Fees
Fidelity Advisor Growth & Income Fund
Each year, the Board of Trustees, including the Independent Trustees (together, the Board), votes on the renewal of the management contract with Fidelity Management & Research Company (FMR) and the sub-advisory agreements (together, the Advisory Contracts) for the fund. The Board, assisted by the advice of fund counsel and Independent Trustees' counsel, requests and considers a broad range of information relevant to the renewal of the Advisory Contracts throughout the year.
The Board meets regularly and, at each of its meetings, covers an extensive agenda of topics and materials and considers factors that are relevant to its annual consideration of the renewal of the fund's Advisory Contracts, including the services and support provided to the fund and its shareholders. The Board has established various standing committees (Committees), each composed of and chaired by Independent Trustees with varying backgrounds, to which the Board has assigned specific subject matter responsibilities in order to enhance effective decision-making by the Board. The Board, acting directly and through its Committees, requests and receives information concerning the annual consideration of the renewal of the fund's Advisory Contracts. The Board also meets as needed to consider matters specifically related to the Board's annual consideration of the renewal of the Advisory Contracts. Members of the Board may also meet with trustees of other Fidelity funds through ad hoc joint committees to discuss certain matters relevant to all of the Fidelity funds.
At its July 2015 meeting, the Board unanimously determined to renew the fund's Advisory Contracts. In reaching its determination, the Board considered all factors it believed relevant, including (i) the nature, extent, and quality of the services to be provided to the fund and its shareholders (including the investment performance of the fund); (ii) the competitiveness of the fund's management fee and total expense ratio relative to peer funds; (iii) the total costs of the services to be provided by and the profits to be realized by Fidelity from its relationship with the fund; and (iv) the extent to which (if any) economies of scale exist and would be realized as the fund grows, and whether any economies of scale are appropriately shared with fund shareholders.
In considering whether to renew the Advisory Contracts for the fund, the Board reached a determination, with the assistance of fund counsel and Independent Trustees' counsel and through the exercise of its business judgment, that the renewal of the Advisory Contracts was in the best interests of the fund and its shareholders and that the compensation payable under the Advisory Contracts was fair and reasonable. The Board's decision to renew the Advisory Contracts was not based on any single factor, but rather was based on a comprehensive consideration of all the information provided to the Board at its meetings throughout the year. The Board, in reaching its determination to renew the Advisory Contracts, was aware that shareholders of the fund have a broad range of investment choices available to them, including a wide choice among funds offered by Fidelity's competitors, and that the fund's shareholders, who have the opportunity to review and weigh the disclosure provided by the fund in its prospectus and other public disclosures, have chosen to invest in this fund, which is part of the Fidelity family of funds.
Nature, Extent, and Quality of Services Provided. The Board considered Fidelity's staffing as it relates to the fund, including the backgrounds of investment personnel of Fidelity, and also considered the fund's investment objective, strategies, and related investment philosophy. The Independent Trustees also had discussions with senior management of Fidelity's investment operations and investment groups. The Board considered the structure of the portfolio manager compensation program and whether this structure provides appropriate incentives to act in the best interests of the fund. Additionally, the Board considered the portfolio managers' investments, if any, in the funds that they manage.Resources Dedicated to Investment Management and Support Services. The Board and the Fund Oversight and Research Committees reviewed the general qualifications and capabilities of Fidelity's investment staff, including its size, education, experience, and resources, as well as Fidelity's approach to recruiting, training, managing, and compensating investment personnel. The Board noted that Fidelity has continued to increase the resources devoted to non-U.S. offices, including expansion of Fidelity's global investment organization. The Board also noted that Fidelity's analysts have extensive resources, tools and capabilities that allow them to conduct sophisticated quantitative and fundamental analysis, as well as credit analysis of issuers, counterparties and guarantors. Further, the Board considered that Fidelity's investment professionals have sufficient access to global information and data so as to provide competitive investment results over time, and that those professionals also have access to sophisticated tools that permit them to assess portfolio construction and risk and performance attribution characteristics continuously, as well as to transmit new information and research conclusions rapidly around the world. Additionally, in its deliberations, the Board considered Fidelity's trading, risk management, and compliance capabilities and resources, which are integral parts of the investment management process.Shareholder and Administrative Services. The Board considered (i) the nature, extent, quality, and cost of advisory, administrative, and shareholder services performed by FMR, the sub-advisers (together with FMR, the Investment Advisers), and their affiliates under the Advisory Contracts and under separate agreements covering transfer agency, pricing and bookkeeping, and securities lending services for the fund; (ii) the nature and extent of the supervision of third party service providers, principally custodians and subcustodians; and (iii) the resources devoted to, and the record of compliance with, the fund's compliance policies and procedures. The Board also reviewed the allocation of fund brokerage, including allocations to brokers affiliated with the Investment Advisers, the use of brokerage commissions to pay fund expenses, and the use of "soft" commission dollars to pay for research services.The Board noted that the growth of fund assets over time across the complex allows Fidelity to reinvest in the development of services designed to enhance the value or convenience of the Fidelity funds as investment vehicles. These services include 24-hour access to account information and market information through telephone representatives and over the Internet, investor education materials and asset allocation tools, and the expanded availability of Fidelity Investor Centers.In 2014, the Board formed an ad hoc Committee on Transfer Agency Fees to review the variety of transfer agency fee structures throughout the industry and Fidelity's competitive positioning with respect to industry participants.Investment in a Large Fund Family. The Board considered the benefits to shareholders of investing in a Fidelity fund, including the benefits of investing in a fund that is part of a large family of funds offering a variety of investment disciplines and providing a large variety of mutual fund investor services. The Board noted that Fidelity had taken, or had made recommendations that resulted in the Fidelity funds taking, a number of actions over the previous year that benefited particular funds, including (i) continuing to dedicate additional resources to investment research and to the support of the senior management team that oversees asset management; (ii) continuing efforts to enhance Fidelity's global research capabilities; (iii) launching new funds and making other enhancements to meet client needs; (iv) reducing management fees and total expenses for certain index funds and diversified international funds; (v) continuing to launch dedicated lower cost underlying funds to meet portfolio construction needs related to expanding underlying fund options for Fidelity funds of funds, specifically for the Freedom Fund product lines; (vi) rationalizing product lines and gaining increased efficiencies through fund mergers; (vii) launching active fixed-income exchange-traded funds; (viii) continuing to develop, acquire and implement systems and technology to improve services to the funds and information security and to increase efficiency; (ix) implementing investment enhancements to further strengthen Fidelity's target date product line to increase investors' probability of success in achieving their goals; (x) modifying the eligibility criteria for certain share classes to accommodate roll-over assets from employer-sponsored retirement plans; (xi) launching a new Class W of the Freedom Index Funds to attract and retain Fidelity record-kept retirement plan assets; and (xii) implementing changes to Fidelity's money market product line in response to recent money market regulatory reforms.Investment Performance. The Board considered whether the fund has operated in accordance with its investment objective, as well as its record of compliance with its investment restrictions and its performance history.The Board took into account discussions with representatives of the Investment Advisers about fund investment performance that occur at Board meetings throughout the year. In this regard the Board noted that as part of regularly scheduled fund reviews and other reports to the Board on fund performance, the Board considers annualized return information for the fund, for different time periods, measured against a securities market index ("benchmark index") and a peer group of funds with similar objectives ("peer group"), if any. In its evaluation of fund investment performance, the Board gave particular attention to information indicating changes in performance of certain Fidelity funds for specific time periods and discussed with the Investment Advisers the reasons for any overperformance or underperformance.In addition to reviewing absolute and relative fund performance, the Independent Trustees periodically consider the appropriateness of fund performance metrics in evaluating the results achieved. In general, the Independent Trustees believe that fund performance should be evaluated based on net performance (after fees and expenses) of both the highest performing and lowest performing fund share classes, where applicable, compared to appropriate benchmark indices, over appropriate time periods that may include full market cycles, and compared to peer groups, as applicable, over the same periods, taking into account relevant factors including the following: general market conditions; issuer-specific information; and fund cash flows and other factors.The Independent Trustees recognize that shareholders evaluate performance on a net basis over their own holding periods, for which one-, three-, and five-year periods are often used as a proxy. For this reason, the performance information reviewed by the Board also included net cumulative calendar year total return information for the fund and an appropriate benchmark index and peer group for the most recent one-, three-, and five-year periods, as shown below. Returns are shown compared to the 25th percentile (top of box, 75% beaten) and 75th percentile (bottom of box, 25% beaten) of the peer universe.Fidelity Advisor Growth & Income Fund
Fidelity Advisor Growth & Income Fund
![]()
AGAI-ANN-0116
1.539472.118
Fidelity Advisor® Series Equity Growth Fund Annual Report November 30, 2015 |
|
Contents
Board Approval of Investment Advisory Contracts and Management Fees |
To view a fund's proxy voting guidelines and proxy voting record for the 12-month period ended June 30, visit http://www.fidelity.com/proxyvotingresults or visit the Securities and Exchange Commission's (SEC) web site at http://www.sec.gov.
You may also call 1-877-208-0098 to request a free copy of the proxy voting guidelines.
Standard & Poor's, S&P and S&P 500 are registered service marks of The McGraw-Hill Companies, Inc. and have been licensed for use by Fidelity Distributors Corporation.
Other third-party marks appearing herein are the property of their respective owners.
All other marks appearing herein are registered or unregistered trademarks or service marks of FMR LLC or an affiliated company. © 2016 FMR LLC. All rights reserved.
This report and the financial statements contained herein are submitted for the general information of the shareholders of the Fund. This report is not authorized for distribution to prospective investors in the Fund unless preceded or accompanied by an effective prospectus.
A fund files its complete schedule of portfolio holdings with the SEC for the first and third quarters of each fiscal year on Form N-Q. Forms N-Q are available on the SEC’s web site at http://www.sec.gov. A fund's Forms N-Q may be reviewed and copied at the SEC’s Public Reference Room in Washington, DC. Information regarding the operation of the SEC's Public Reference Room may be obtained by calling 1-800-SEC-0330.
For a complete list of a fund's portfolio holdings, view the most recent holdings listing, semiannual report, or annual report on Fidelity's web site at http://www.fidelity.com, http://www.advisor.fidelity.com, or http://www.401k.com, as applicable.
NOT FDIC INSURED •MAY LOSE VALUE •NO BANK GUARANTEE
Neither the Fund nor Fidelity Distributors Corporation is a bank.
Performance: The Bottom Line
Average annual total return reflects the change in the value of an investment, assuming reinvestment of distributions from dividend income and capital gains (the profits earned upon the sale of securities that have grown in value, if any) and assuming a constant rate of performance each year. The hypothetical investment and the average annual total returns do not reflect the deduction of taxes that a shareholder would pay on fund distributions or the redemption of fund shares. During periods of reimbursement by Fidelity, a fund’s total return will be greater than it would be had the reimbursement not occurred. How a fund did yesterday is no guarantee of how it will do tomorrow.
Average Annual Total Returns
| For the periods ended November 30, 2015 | Past 1 year | Life of fundA |
| Fidelity Advisor® Series Equity Growth Fund | 5.70% | 8.30% |
A From June 6, 2014
$10,000 Over Life of Fund
Let's say hypothetically that $10,000 was invested in Fidelity Advisor® Series Equity Growth Fund on June 6, 2014, when the fund started.
The chart shows how the value of your investment would have changed, and also shows how the Russell 3000® Growth Index performed over the same period.
| Period Ending Values | ||
| $11,257 | ||
| $11,441 | Russell 3000® Growth Index | |
Management's Discussion of Fund Performance
Market Recap: U.S. stocks gained modestly for the 12 months ending November 30, 2015, despite a steep decline in August and September on concern about slowing economic growth in China. The S&P 500® index rebounded in October and gained 2.75% for the year. Stocks benefited late in the period amid waning expectations for a near-term interest-rate hike by the U.S. Federal Reserve, more economic stimulus in Europe and an interest-rate cut in China. Growth stocks in the benchmark far outpaced their value counterparts, as investors continued to seek growth in a subpar economic environment. Sector performance varied widely, with more than 26 percentage points separating the leader from the laggard. Consumer discretionary (+14%) secured the top spot, benefiting from a combination of rising personal income and still-benign inflation. Information technology (+7%) and health care (+4%) also outpaced the broad market. Conversely, the energy sector (-12%) performed worst, stymied by depressed commodity prices that also hit materials (-5%). Telecommunication services (-5%) and utilities (-4%), considered defensive sectors less sensitive to the economy, also lost ground. At period end, investors remained focused on the potential global implications of a stronger U.S. dollar and how China’s transition toward a consumption-led economy may affect corporate earnings.Comments from Portfolio Manager Jason Weiner: For the year, the fund saw a gain in the mid-single digits, modestly lagging the 6.14% advance of the benchmark Russell 3000® Growth Index. Versus the benchmark, picks in food, beverage & tobacco, part of the consumer staples sector, weighed most on the fund's performance, largely due to the fund’s overweighting in Keurig Green Mountain – by far the largest individual detractor the past year. Keurig shares suffered partly due to the firm’s disappointing December 2014 launch of its second-generation brewing machine and subsequent consecutive quarters of lower-than-expected earnings and revenue. In November, the stock hit a nearly three-year low when an influential analyst reduced its forecast for Keurig’s sales due to lowered prices on its coffee brewers, decreased K-Cup volumes and weak demand for its new Kold machine. On the plus side, positioning in information technology's software & services industry was a big plus. From this group, the fund’s position in Facebook – the largest holding – was its biggest individual contributor by a wide margin. Facebook outperformed, partly in anticipation of second-quarter earnings that reflected a strong rise in advertising revenue and growth in the number of subscribers accessing its services on mobile devices. The firm continued to make progress with video advertising and announced new features geared toward small and medium-sized businesses.The views expressed above reflect those of the portfolio manager(s) only through the end of the period as stated on the cover of this report and do not necessarily represent the views of Fidelity or any other person in the Fidelity organization. Any such views are subject to change at any time based upon market or other conditions and Fidelity disclaims any responsibility to update such views. These views may not be relied on as investment advice and, because investment decisions for a Fidelity fund are based on numerous factors, may not be relied on as an indication of trading intent on behalf of any Fidelity fund.
Investment Summary (Unaudited)
Top Ten Stocks as of November 30, 2015
| % of fund's net assets | % of fund's net assets 6 months ago | |
| Facebook, Inc. Class A | 11.5 | 8.8 |
| Alphabet, Inc. Class A | 6.6 | 3.3 |
| Gilead Sciences, Inc. | 5.5 | 6.1 |
| Apple, Inc. | 2.9 | 7.2 |
| Amazon.com, Inc. | 2.8 | 0.5 |
| Salesforce.com, Inc. | 2.8 | 2.3 |
| Starbucks Corp. | 2.7 | 1.9 |
| Home Depot, Inc. | 2.6 | 1.8 |
| Danaher Corp. | 2.4 | 1.8 |
| Avago Technologies Ltd. | 2.4 | 0.1 |
| 42.2 |
Top Five Market Sectors as of November 30, 2015
| % of fund's net assets | % of fund's net assets 6 months ago | |
| Information Technology | 42.0 | 36.5 |
| Consumer Discretionary | 16.7 | 14.9 |
| Health Care | 16.4 | 19.1 |
| Industrials | 10.6 | 11.9 |
| Financials | 6.8 | 7.9 |
Asset Allocation (% of fund's net assets)
| As of November 30, 2015* | ||
| Stocks | 96.4% | |
| Convertible Securities | 0.1% | |
| Short-Term Investments and Net Other Assets (Liabilities) | 3.5% | |

* Foreign investments - 14.8%
| As of May 31, 2015* | ||
| Stocks | 98.8% | |
| Convertible Securities | 0.1% | |
| Short-Term Investments and Net Other Assets (Liabilities) | 1.1% | |

* Foreign investments - 14.4%
Investments November 30, 2015
Showing Percentage of Net Assets
| Common Stocks - 96.4% | |||
| Shares | Value | ||
| CONSUMER DISCRETIONARY - 16.7% | |||
| Automobiles - 0.8% | |||
| Tesla Motors, Inc. (a) | 30,900 | $7,115,034 | |
| Diversified Consumer Services - 1.3% | |||
| Bright Horizons Family Solutions, Inc. (a) | 55,500 | 3,681,315 | |
| Houghton Mifflin Harcourt Co. (a) | 73,500 | 1,452,360 | |
| Nord Anglia Education, Inc. (a) | 42,221 | 896,352 | |
| ServiceMaster Global Holdings, Inc. (a) | 164,800 | 6,176,704 | |
| 12,206,731 | |||
| Hotels, Restaurants & Leisure - 4.0% | |||
| Buffalo Wild Wings, Inc. (a) | 18,200 | 2,916,368 | |
| Chipotle Mexican Grill, Inc. (a) | 5,200 | 3,013,660 | |
| Domino's Pizza, Inc. | 66,600 | 7,157,502 | |
| Starbucks Corp. | 418,500 | 25,691,715 | |
| 38,779,245 | |||
| Household Durables - 0.9% | |||
| Harman International Industries, Inc. | 63,800 | 6,581,608 | |
| Toll Brothers, Inc. (a) | 66,200 | 2,461,316 | |
| 9,042,924 | |||
| Internet & Catalog Retail - 3.6% | |||
| Amazon.com, Inc. (a) | 40,900 | 27,190,320 | |
| Netflix, Inc. (a) | 51,000 | 6,289,830 | |
| NutriSystem, Inc. | 38,600 | 885,484 | |
| Travelport Worldwide Ltd. | 48,500 | 645,535 | |
| 35,011,169 | |||
| Specialty Retail - 4.3% | |||
| AutoZone, Inc. (a) | 3,500 | 2,743,195 | |
| Five Below, Inc. (a) | 105,500 | 2,955,055 | |
| Home Depot, Inc. | 186,700 | 24,995,396 | |
| L Brands, Inc. | 27,100 | 2,585,611 | |
| Lowe's Companies, Inc. | 50,400 | 3,860,640 | |
| MarineMax, Inc. (a) | 65,600 | 1,190,640 | |
| Restoration Hardware Holdings, Inc. (a) | 1,100 | 98,857 | |
| Ulta Salon, Cosmetics & Fragrance, Inc. (a) | 19,664 | 3,283,888 | |
| 41,713,282 | |||
| Textiles, Apparel & Luxury Goods - 1.8% | |||
| Kate Spade & Co. (a) | 374,223 | 7,499,429 | |
| NIKE, Inc. Class B | 72,500 | 9,590,300 | |
| 17,089,729 | |||
| TOTAL CONSUMER DISCRETIONARY | 160,958,114 | ||
| CONSUMER STAPLES - 3.3% | |||
| Beverages - 0.6% | |||
| Kweichow Moutai Co. Ltd. | 21,780 | 729,535 | |
| The Coca-Cola Co. | 105,900 | 4,513,458 | |
| 5,242,993 | |||
| Food & Staples Retailing - 0.7% | |||
| CVS Health Corp. | 46,800 | 4,403,412 | |
| Whole Foods Market, Inc. | 83,800 | 2,442,770 | |
| 6,846,182 | |||
| Food Products - 0.4% | |||
| Keurig Green Mountain, Inc. | 81,400 | 4,265,360 | |
| Household Products - 0.3% | |||
| Procter & Gamble Co. | 35,400 | 2,649,336 | |
| Personal Products - 1.3% | |||
| Avon Products, Inc. | 98,800 | 340,860 | |
| Estee Lauder Companies, Inc. Class A | 33,400 | 2,809,608 | |
| Herbalife Ltd. (a) | 168,000 | 9,698,640 | |
| 12,849,108 | |||
| TOTAL CONSUMER STAPLES | 31,852,979 | ||
| ENERGY - 0.3% | |||
| Oil, Gas & Consumable Fuels - 0.3% | |||
| Golar LNG Ltd. | 91,774 | 2,510,019 | |
| FINANCIALS - 6.8% | |||
| Banks - 0.9% | |||
| First Republic Bank | 109,100 | 7,512,626 | |
| M&T Bank Corp. | 8,000 | 1,002,640 | |
| 8,515,266 | |||
| Capital Markets - 2.8% | |||
| BlackRock, Inc. Class A | 13,100 | 4,764,732 | |
| E*TRADE Financial Corp. (a) | 306,400 | 9,323,752 | |
| HFF, Inc. | 62,800 | 2,158,436 | |
| Invesco Ltd. | 97,100 | 3,271,299 | |
| JMP Group, Inc. | 50,300 | 310,854 | |
| PJT Partners, Inc. (a) | 7,885 | 184,824 | |
| The Blackstone Group LP | 157,000 | 4,903,110 | |
| Virtus Investment Partners, Inc. | 17,800 | 2,425,072 | |
| 27,342,079 | |||
| Diversified Financial Services - 1.4% | |||
| Berkshire Hathaway, Inc. Class B (a) | 18,600 | 2,494,074 | |
| McGraw Hill Financial, Inc. | 89,000 | 8,585,830 | |
| MSCI, Inc. Class A | 39,800 | 2,790,776 | |
| 13,870,680 | |||
| Real Estate Investment Trusts - 0.6% | |||
| American Tower Corp. | 58,900 | 5,853,482 | |
| Real Estate Management & Development - 0.9% | |||
| Realogy Holdings Corp. (a) | 204,900 | 8,464,419 | |
| Thrifts & Mortgage Finance - 0.2% | |||
| Essent Group Ltd. (a) | 72,000 | 1,779,840 | |
| TOTAL FINANCIALS | 65,825,766 | ||
| HEALTH CARE - 16.4% | |||
| Biotechnology - 10.4% | |||
| Amgen, Inc. | 61,400 | 9,891,540 | |
| BioMarin Pharmaceutical, Inc. (a) | 58,300 | 5,560,071 | |
| Celgene Corp. (a) | 58,200 | 6,369,990 | |
| Gilead Sciences, Inc. | 500,100 | 52,990,596 | |
| Insmed, Inc. (a) | 247,875 | 4,042,841 | |
| Medivation, Inc. (a) | 268,500 | 11,352,180 | |
| Vertex Pharmaceuticals, Inc. (a) | 83,500 | 10,801,560 | |
| 101,008,778 | |||
| Health Care Equipment & Supplies - 0.6% | |||
| Medtronic PLC | 43,700 | 3,292,358 | |
| Novadaq Technologies, Inc. (a) | 181,100 | 2,205,798 | |
| 5,498,156 | |||
| Health Care Providers & Services - 0.3% | |||
| Express Scripts Holding Co. (a) | 38,600 | 3,299,528 | |
| Pharmaceuticals - 5.1% | |||
| Astellas Pharma, Inc. | 1,104,400 | 15,543,370 | |
| Teva Pharmaceutical Industries Ltd. sponsored ADR | 192,200 | 12,095,146 | |
| Valeant Pharmaceuticals International, Inc. (Canada) (a) | 237,100 | 21,367,318 | |
| 49,005,834 | |||
| TOTAL HEALTH CARE | 158,812,296 | ||
| INDUSTRIALS - 10.6% | |||
| Aerospace & Defense - 1.3% | |||
| Textron, Inc. | 106,600 | 4,548,622 | |
| TransDigm Group, Inc. (a) | 34,600 | 8,118,198 | |
| 12,666,820 | |||
| Air Freight & Logistics - 0.7% | |||
| United Parcel Service, Inc. Class B | 64,400 | 6,633,844 | |
| Airlines - 0.8% | |||
| Ryanair Holdings PLC sponsored ADR | 94,380 | 7,257,822 | |
| Building Products - 0.8% | |||
| A.O. Smith Corp. | 46,683 | 3,723,436 | |
| Caesarstone Sdot-Yam Ltd. | 87,400 | 3,572,912 | |
| 7,296,348 | |||
| Electrical Equipment - 0.8% | |||
| Acuity Brands, Inc. | 18,100 | 4,178,928 | |
| AMETEK, Inc. | 66,600 | 3,760,236 | |
| 7,939,164 | |||
| Industrial Conglomerates - 3.3% | |||
| Danaher Corp. | 242,900 | 23,413,131 | |
| Roper Industries, Inc. | 45,500 | 8,803,795 | |
| 32,216,926 | |||
| Professional Services - 1.6% | |||
| CEB, Inc. | 14,700 | 1,135,869 | |
| Equifax, Inc. | 15,400 | 1,717,100 | |
| Resources Connection, Inc. | 97,425 | 1,778,006 | |
| Robert Half International, Inc. | 88,400 | 4,524,312 | |
| WageWorks, Inc. (a) | 141,600 | 6,023,664 | |
| 15,178,951 | |||
| Road & Rail - 0.0% | |||
| Swift Transporation Co. (a) | 14,600 | 233,162 | |
| Trading Companies & Distributors - 1.3% | |||
| HD Supply Holdings, Inc. (a) | 376,100 | 11,896,043 | |
| Summit Ascent Holdings Ltd. (a) | 1,840,000 | 873,314 | |
| 12,769,357 | |||
| TOTAL INDUSTRIALS | 102,192,394 | ||
| INFORMATION TECHNOLOGY - 41.9% | |||
| Communications Equipment - 0.1% | |||
| QUALCOMM, Inc. | 25,700 | 1,253,903 | |
| Electronic Equipment & Components - 0.2% | |||
| CDW Corp. | 34,700 | 1,497,999 | |
| TE Connectivity Ltd. | 6,786 | 455,273 | |
| 1,953,272 | |||
| Internet Software & Services - 22.0% | |||
| 58.com, Inc. ADR (a) | 30,500 | 1,836,405 | |
| Alibaba Group Holding Ltd. sponsored ADR (a) | 116,400 | 9,786,912 | |
| Alphabet, Inc.: | |||
| Class A (a) | 83,400 | 63,621,690 | |
| Class C | 15,212 | 11,296,431 | |
| Cvent, Inc. (a) | 124,600 | 4,501,798 | |
| Demandware, Inc. (a) | 54,100 | 2,767,215 | |
| Facebook, Inc. Class A (a) | 1,064,400 | 110,953,056 | |
| Just Dial Ltd. | 43,239 | 611,261 | |
| JUST EAT Ltd. (a) | 235,622 | 1,563,559 | |
| Shopify, Inc. Class A | 1,200 | 31,608 | |
| Textura Corp. (a) | 141,914 | 3,427,223 | |
| Zillow Group, Inc. (a)(b) | 21,400 | 557,042 | |
| Zillow Group, Inc. Class C (a)(b) | 42,800 | 1,055,020 | |
| 212,009,220 | |||
| IT Services - 3.4% | |||
| Cognizant Technology Solutions Corp. Class A (a) | 155,700 | 10,055,106 | |
| Global Payments, Inc. | 23,400 | 1,657,890 | |
| MasterCard, Inc. Class A | 25,500 | 2,496,960 | |
| Visa, Inc. Class A | 242,300 | 19,144,123 | |
| 33,354,079 | |||
| Semiconductors & Semiconductor Equipment - 3.0% | |||
| Avago Technologies Ltd. | 175,200 | 22,854,840 | |
| Maxim Integrated Products, Inc. | 52,414 | 2,032,091 | |
| Monolithic Power Systems, Inc. | 53,648 | 3,665,768 | |
| 28,552,699 | |||
| Software - 10.3% | |||
| Activision Blizzard, Inc. | 91,500 | 3,445,890 | |
| Adobe Systems, Inc. (a) | 155,800 | 14,249,468 | |
| Computer Modelling Group Ltd. | 195,200 | 1,518,685 | |
| CyberArk Software Ltd. (a)(b) | 73,900 | 3,199,131 | |
| Electronic Arts, Inc. (a) | 276,600 | 18,750,714 | |
| Fleetmatics Group PLC (a) | 106,100 | 6,334,170 | |
| HubSpot, Inc. (a) | 61,000 | 3,306,810 | |
| Intuit, Inc. | 19,500 | 1,953,900 | |
| Mobileye NV (a)(b) | 140,800 | 6,138,880 | |
| Red Hat, Inc. (a) | 101,200 | 8,238,692 | |
| Salesforce.com, Inc. (a) | 334,500 | 26,656,305 | |
| ServiceNow, Inc. (a) | 67,700 | 5,890,577 | |
| 99,683,222 | |||
| Technology Hardware, Storage & Peripherals - 2.9% | |||
| Apple, Inc. | 234,300 | 27,717,690 | |
| TOTAL INFORMATION TECHNOLOGY | 404,524,085 | ||
| MATERIALS - 0.2% | |||
| Chemicals - 0.2% | |||
| CF Industries Holdings, Inc. | 46,200 | 2,131,668 | |
| TELECOMMUNICATION SERVICES - 0.2% | |||
| Wireless Telecommunication Services - 0.2% | |||
| SBA Communications Corp. Class A (a) | 16,800 | 1,766,688 | |
| TOTAL COMMON STOCKS | |||
| (Cost $789,715,416) | 930,574,009 | ||
| Convertible Preferred Stocks - 0.1% | |||
| INFORMATION TECHNOLOGY - 0.1% | |||
| IT Services - 0.1% | |||
| AppNexus, Inc. Series E (a)(c) | |||
| (Cost $769,617) | 38,419 | 771,069 | |
| Money Market Funds - 5.0% | |||
| Fidelity Cash Central Fund, 0.18% (d) | 42,173,536 | 42,173,536 | |
| Fidelity Securities Lending Cash Central Fund, 0.22% (d)(e) | 5,733,450 | 5,733,450 | |
| TOTAL MONEY MARKET FUNDS | |||
| (Cost $47,906,986) | 47,906,986 | ||
| TOTAL INVESTMENT PORTFOLIO - 101.5% | |||
| (Cost $838,392,019) | 979,252,064 | ||
| NET OTHER ASSETS (LIABILITIES) - (1.5)% | (14,334,384) | ||
| NET ASSETS - 100% | $964,917,680 |
Legend
(a) Non-income producing
(b) Security or a portion of the security is on loan at period end.
(c) Restricted securities - Investment in securities not registered under the Securities Act of 1933 (excluding 144A issues). At the end of the period, the value of restricted securities (excluding 144A issues) amounted to $771,069 or 0.1% of net assets.
(d) Affiliated fund that is generally available only to investment companies and other accounts managed by Fidelity Investments. The rate quoted is the annualized seven-day yield of the fund at period end. A complete unaudited listing of the fund's holdings as of its most recent quarter end is available upon request. In addition, each Fidelity Central Fund's financial statements, which are not covered by the Fund's Report of Independent Registered Public Accounting Firm, are available on the SEC's website or upon request.
(e) Investment made with cash collateral received from securities on loan.
Additional information on each restricted holding is as follows:
| Security | Acquisition Date | Acquisition Cost |
| AppNexus, Inc. Series E | 8/1/14 | $769,617 |
Affiliated Central Funds
Information regarding fiscal year to date income earned by the Fund from investments in Fidelity Central Funds is as follows:
| Fund | Income earned |
| Fidelity Cash Central Fund | $53,161 |
| Fidelity Securities Lending Cash Central Fund | 105,626 |
| Total | $158,787 |
Investment Valuation
The following is a summary of the inputs used, as of November 30, 2015, involving the Fund's assets and liabilities carried at fair value. The inputs or methodology used for valuing securities may not be an indication of the risk associated with investing in those securities. For more information on valuation inputs, and their aggregation into the levels used below, please refer to the Investment Valuation section in the accompanying Notes to Financial Statements.
| Valuation Inputs at Reporting Date: | ||||
| Description | Total | Level 1 | Level 2 | Level 3 |
| Investments in Securities: | ||||
| Equities: | ||||
| Consumer Discretionary | $160,958,114 | $160,958,114 | $-- | $-- |
| Consumer Staples | 31,852,979 | 31,852,979 | -- | -- |
| Energy | 2,510,019 | 2,510,019 | -- | -- |
| Financials | 65,825,766 | 65,825,766 | -- | -- |
| Health Care | 158,812,296 | 143,268,926 | 15,543,370 | -- |
| Industrials | 102,192,394 | 102,192,394 | -- | -- |
| Information Technology | 405,295,154 | 404,524,085 | -- | 771,069 |
| Materials | 2,131,668 | 2,131,668 | -- | -- |
| Telecommunication Services | 1,766,688 | 1,766,688 | -- | -- |
| Money Market Funds | 47,906,986 | 47,906,986 | -- | -- |
| Total Investments in Securities: | $979,252,064 | $962,937,625 | $15,543,370 | $771,069 |
Other Information
Distribution of investments by country or territory of incorporation, as a percentage of Total Net Assets, is as follows (Unaudited):
| United States of America | 85.2% |
| Canada | 2.6% |
| Singapore | 2.4% |
| Cayman Islands | 2.3% |
| Israel | 2.0% |
| Ireland | 1.9% |
| Japan | 1.6% |
| Bermuda | 1.0% |
| Others (Individually Less Than 1%) | 1.0% |
| 100.0% |
See accompanying notes which are an integral part of the financial statements.
Financial Statements
Statement of Assets and Liabilities
| November 30, 2015 | ||
| Assets | ||
| Investment in securities, at value (including securities loaned of $5,588,372) — See accompanying schedule: Unaffiliated issuers (cost $790,485,033) | $931,345,078 | |
| Fidelity Central Funds (cost $47,906,986) | 47,906,986 | |
| Total Investments (cost $838,392,019) | $979,252,064 | |
| Receivable for investments sold | 1,272,473 | |
| Receivable for fund shares sold | 29,096 | |
| Dividends receivable | 514,674 | |
| Distributions receivable from Fidelity Central Funds | 20,863 | |
| Prepaid expenses | 2,206 | |
| Other receivables | 2,458 | |
| Total assets | 981,093,834 | |
| Liabilities | ||
| Payable for fund shares redeemed | $9,851,815 | |
| Accrued management fee | 385,770 | |
| Other affiliated payables | 170,431 | |
| Other payables and accrued expenses | 34,688 | |
| Collateral on securities loaned, at value | 5,733,450 | |
| Total liabilities | 16,176,154 | |
| Net Assets | $964,917,680 | |
| Net Assets consist of: | ||
| Paid in capital | $843,148,558 | |
| Undistributed net investment income | 465,556 | |
| Accumulated undistributed net realized gain (loss) on investments and foreign currency transactions | (19,552,568) | |
| Net unrealized appreciation (depreciation) on investments and assets and liabilities in foreign currencies | 140,856,134 | |
| Net Assets, for 85,797,958 shares outstanding | $964,917,680 | |
| Net Asset Value, offering price and redemption price per share ($964,917,680 ÷ 85,797,958 shares) | $11.25 |
See accompanying notes which are an integral part of the financial statements.
Statement of Operations
| Year ended November 30, 2015 | ||
| Investment Income | ||
| Dividends | $8,538,393 | |
| Income from Fidelity Central Funds | 158,787 | |
| Total income | 8,697,180 | |
| Expenses | ||
| Management fee | ||
| Basic fee | $5,185,752 | |
| Performance adjustment | (297,838) | |
| Transfer agent fees | 1,660,698 | |
| Accounting and security lending fees | 318,423 | |
| Custodian fees and expenses | 44,194 | |
| Independent trustees' compensation | 4,021 | |
| Audit | 37,698 | |
| Legal | 2,328 | |
| Interest | 1,044 | |
| Miscellaneous | 2,917 | |
| Total expenses before reductions | 6,959,237 | |
| Expense reductions | (36,498) | 6,922,739 |
| Net investment income (loss) | 1,774,441 | |
| Realized and Unrealized Gain (Loss) | ||
| Net realized gain (loss) on: | ||
| Investment securities: | ||
| Unaffiliated issuers | (9,787,666) | |
| Foreign currency transactions | (15,423) | |
| Total net realized gain (loss) | (9,803,089) | |
| Change in net unrealized appreciation (depreciation) on: Investment securities | 67,262,698 | |
| Assets and liabilities in foreign currencies | (1,354) | |
| Total change in net unrealized appreciation (depreciation) | 67,261,344 | |
| Net gain (loss) | 57,458,255 | |
| Net increase (decrease) in net assets resulting from operations | $59,232,696 |
See accompanying notes which are an integral part of the financial statements.
Statement of Changes in Net Assets
| Year ended November 30, 2015 | Year ended November 30, 2014 | |
| Increase (Decrease) in Net Assets | ||
| Operations | ||
| Net investment income (loss) | $1,774,441 | $1,090,866 |
| Net realized gain (loss) | (9,803,089) | (11,596,041) |
| Change in net unrealized appreciation (depreciation) | 67,261,344 | 73,594,790 |
| Net increase (decrease) in net assets resulting from operations | 59,232,696 | 63,089,615 |
| Distributions to shareholders from net investment income | (554,508) | – |
| Share transactions | ||
| Proceeds from sales of shares | 190,823,867 | 1,022,916,685 |
| Reinvestment of distributions | 554,508 | – |
| Cost of shares redeemed | (271,672,435) | (99,472,748) |
| Net increase (decrease) in net assets resulting from share transactions | (80,294,060) | 923,443,937 |
| Total increase (decrease) in net assets | (21,615,872) | 986,533,552 |
| Net Assets | ||
| Beginning of period | 986,533,552 | – |
| End of period (including undistributed net investment income of $465,556 and undistributed net investment income of $267,114, respectively) | $964,917,680 | $986,533,552 |
| Other Information | ||
| Shares | ||
| Sold | 17,849,661 | 102,189,613 |
| Issued in reinvestment of distributions | 53,627 | – |
| Redeemed | (24,778,896) | (9,516,047) |
| Net increase (decrease) | (6,875,608) | 92,673,566 |
See accompanying notes which are an integral part of the financial statements.
Financial Highlights — Fidelity Advisor Series Equity Growth Fund
| Years ended November 30, | 2015 | 2014 A |
| Selected Per–Share Data | ||
| Net asset value, beginning of period | $10.65 | $10.00 |
| Income from Investment Operations | ||
| Net investment income (loss)B | .02 | .01 |
| Net realized and unrealized gain (loss) | .59 | .64 |
| Total from investment operations | .61 | .65 |
| Distributions from net investment income | (.01) | – |
| Net asset value, end of period | $11.25 | $10.65 |
| Total ReturnC,D | 5.70% | 6.50% |
| Ratios to Average Net AssetsE,F | ||
| Expenses before reductions | .74% | .77%G |
| Expenses net of fee waivers, if any | .74% | .77%G |
| Expenses net of all reductions | .73% | .77%G |
| Net investment income (loss) | .19% | .23%G |
| Supplemental Data | ||
| Net assets, end of period (000 omitted) | $964,918 | $986,534 |
| Portfolio turnover rateH | 65% | 26%I,J |
A For the period June 6, 2014 (commencement of operations) to November 30, 2014.
B Calculated based on average shares outstanding during the period.
C Total returns for periods of less than one year are not annualized.
D Total returns would have been lower if certain expenses had not been reduced during the applicable periods shown.
E Fees and expenses of any underlying Fidelity Central Funds are not included in the Fund's expense ratio. The Fund indirectly bears its proportionate share of the expenses of any underlying Fidelity Central Funds.
F Expense ratios reflect operating expenses of the Fund. Expenses before reductions do not reflect amounts reimbursed by the investment adviser or reductions from brokerage service arrangements or reductions from other expense offset arrangements and do not represent the amount paid by the Fund during periods when reimbursements or reductions occur. Expense ratios before reductions for start-up periods may not be representative of longer term operating periods. Expenses net of fee waivers reflect expenses after reimbursement by the investment adviser but prior to reductions from brokerage service arrangements or other expense offset arrangements. Expenses net of all reductions represent the net expenses paid by the Fund.
G Annualized
H Amount does not include the portfolio activity of any underlying Fidelity Central Funds.
I Portfolio turnover rate excludes securities received or delivered in-kind.
J Amount not annualized.
See accompanying notes which are an integral part of the financial statements.
Notes to Financial Statements
For the period ended November 30, 2015
1. Organization.
Fidelity Advisor Series Equity Growth Fund (the Fund) is a fund of Fidelity Advisor Series I (the Trust) and is authorized to issue an unlimited number of shares. Shares of the Fund are only available for purchase by mutual funds for which Fidelity Management & Research Company (FMR) or an affiliate serves as an investment manager. The Trust is registered under the Investment Company Act of 1940, as amended (the 1940 Act), as an open-end management investment company organized as a Massachusetts business trust.
2. Investments in Fidelity Central Funds.
The Fund invests in Fidelity Central Funds, which are open-end investment companies generally available only to other investment companies and accounts managed by the investment adviser and its affiliates. The Fund's Schedule of Investments lists each of the Fidelity Central Funds held as of period end, if any, as an investment of the Fund, but does not include the underlying holdings of each Fidelity Central Fund. As an Investing Fund, the Fund indirectly bears its proportionate share of the expenses of the underlying Fidelity Central Funds.
The Money Market Central Funds seek preservation of capital and current income and are managed by Fidelity Investments Money Management, Inc. (FIMM), an affiliate of the investment adviser. Annualized expenses of the Money Market Central Funds as of their most recent shareholder report date are less than .005%.
A complete unaudited list of holdings for each Fidelity Central Fund is available upon request or at the Securities and Exchange Commission (the SEC) website at www.sec.gov. In addition, the financial statements of the Fidelity Central Funds, which are not covered by the Fund's Report of Independent Registered Public Accounting Firm, are available on the SEC website or upon request.
3. Significant Accounting Policies.
The financial statements have been prepared in conformity with accounting principles generally accepted in the United States of America (GAAP), which require management to make certain estimates and assumptions at the date of the financial statements. Actual results could differ from those estimates. Subsequent events, if any, through the date that the financial statements were issued have been evaluated in the preparation of the financial statements. The following summarizes the significant accounting policies of the Fund:
Investment Valuation. Investments are valued as of 4:00 p.m. Eastern time on the last calendar day of the period. The Board of Trustees (the Board) has delegated the day to day responsibility for the valuation of the Fund's investments to the FMR Fair Value Committee (the Committee). In accordance with valuation policies and procedures approved by the Board, the Fund attempts to obtain prices from one or more third party pricing vendors or brokers to value its investments. When current market prices, quotations or currency exchange rates are not readily available or reliable, investments will be fair valued in good faith by the Committee, in accordance with procedures adopted by the Board. Factors used in determining fair value vary by investment type and may include market or investment specific events. The frequency with which these procedures are used cannot be predicted and they may be utilized to a significant extent. The Committee oversees the Fund's valuation policies and procedures and reports to the Board on the Committee's activities and fair value determinations. The Board monitors the appropriateness of the procedures used in valuing the Fund's investments and ratifies the fair value determinations of the Committee.
The Fund categorizes the inputs to valuation techniques used to value its investments into a disclosure hierarchy consisting of three levels as shown below:
- Level 1 – quoted prices in active markets for identical investments
- Level 2 – other significant observable inputs (including quoted prices for similar investments, interest rates, prepayment speeds, etc.)
- Level 3 – unobservable inputs (including the Fund's own assumptions based on the best information available)
Valuation techniques used to value the Fund's investments by major category are as follows:
Equity securities, including restricted securities, for which market quotations are readily available, are valued at the last reported sale price or official closing price as reported by a third party pricing vendor on the primary market or exchange on which they are traded and are categorized as Level 1 in the hierarchy. In the event there were no sales during the day or closing prices are not available, securities are valued at the last quoted bid price or may be valued using the last available price and are generally categorized as Level 2 in the hierarchy. For foreign equity securities, when market or security specific events arise, comparisons to the valuation of American Depositary Receipts (ADRs), futures contracts, Exchange-Traded Funds (ETFs) and certain indexes as well as quoted prices for similar securities may be used and would be categorized as Level 2 in the hierarchy. Utilizing these techniques may result in transfers between Level 1 and Level 2. For equity securities, including restricted securities, where observable inputs are limited, assumptions about market activity and risk are used and these securities may be categorized as Level 3 in the hierarchy.
Investments in open-end mutual funds, including the Fidelity Central Funds, are valued at their closing net asset value (NAV) each business day and are categorized as Level 1 in the hierarchy.
Changes in valuation techniques may result in transfers in or out of an assigned level within the disclosure hierarchy. The aggregate value of investments by input level as of November 30, 2015 is included at the end of the Fund's Schedule of Investments.
Foreign Currency.The Fund may use foreign currency contracts to facilitate transactions in foreign-denominated securities. Gains and losses from these transactions may arise from changes in the value of the foreign currency or if the counterparties do not perform under the contracts' terms.
Foreign-denominated assets, including investment securities, and liabilities are translated into U.S. dollars at the exchange rates at period end. Purchases and sales of investment securities, income and dividends received and expenses denominated in foreign currencies are translated into U.S. dollars at the exchange rate in effect on the transaction date.
The effects of exchange rate fluctuations on investments are included with the net realized and unrealized gain (loss) on investment securities. Other foreign currency transactions resulting in realized and unrealized gain (loss) are disclosed separately.
Investment Transactions and Income. For financial reporting purposes, the Fund's investment holdings and NAV include trades executed through the end of the last business day of the period. The NAV per share for processing shareholder transactions is calculated as of the close of business of the New York Stock Exchange (NYSE), normally 4:00 p.m. Eastern time and includes trades executed through the end of the prior business day. Gains and losses on securities sold are determined on the basis of identified cost. Dividend income is recorded on the ex-dividend date, except for certain dividends from foreign securities where the ex-dividend date may have passed, which are recorded as soon as the Fund is informed of the ex-dividend date. Non-cash dividends included in dividend income, if any, are recorded at the fair market value of the securities received. Income and capital gain distributions from Fidelity Central Funds, if any, are recorded on the ex-dividend date. Distributions received on securities that represent a return of capital or capital gain are recorded as a reduction of cost of investments and/or as a realized gain. Subsequent to ex-dividend date the Fund determines the components of these distributions, based upon receipt of tax filings or other correspondence relating to the underlying investment. Investment income is recorded net of foreign taxes withheld where recovery of such taxes is uncertain.
Expenses. Expenses directly attributable to a fund are charged to that fund. Expenses attributable to more than one fund are allocated among the respective funds on the basis of relative net assets or other appropriate methods. Expense estimates are accrued in the period to which they relate and adjustments are made when actual amounts are known.
Income Tax Information and Distributions to Shareholders. Each year, the Fund intends to qualify as a regulated investment company under Subchapter M of the Internal Revenue Code, including distributing substantially all of its taxable income and realized gains. As a result, no provision for U.S. Federal income taxes is required. As of November 30, 2015, the Fund did not have any unrecognized tax benefits in the financial statements; nor is the Fund aware of any tax positions for which it is reasonably possible that the total amounts of unrecognized tax benefits will significantly change in the next twelve months. The Fund files a U.S. federal tax return, in addition to state and local tax returns as required. The Fund's federal income tax returns are subject to examination by the Internal Revenue Service (IRS) for a period of three fiscal years after they are filed. State and local tax returns may be subject to examination for an additional fiscal year depending on the jurisdiction. Foreign taxes are provided for based on the Fund's understanding of the tax rules and rates that exist in the foreign markets in which it invests.
Distributions are declared and recorded on the ex-dividend date. Income and capital gain distributions are determined in accordance with income tax regulations, which may differ from GAAP.
Capital accounts within the financial statements are adjusted for permanent book-tax differences. These adjustments have no impact on net assets or the results of operations. Capital accounts are not adjusted for temporary book-tax differences which will reverse in a subsequent period.
Book-tax differences are primarily due to foreign currency transactions, partnerships, capital loss carryforwards and losses deferred due to wash sales.
The federal tax cost of investment securities and unrealized appreciation (depreciation) as of period end were as follows:
| Gross unrealized appreciation | $178,044,363 |
| Gross unrealized depreciation | (39,068,883) |
| Net unrealized appreciation (depreciation) on securities | $138,975,480 |
| Tax Cost | $840,276,584 |
The tax-based components of distributable earnings as of period end were as follows:
| Undistributed ordinary income | $465,556 |
| Capital loss carryforward | $(17,668,003) |
| Net unrealized appreciation (depreciation) on securities and other investments | $138,971,569 |
Capital loss carryforwards are only available to offset future capital gains of the Fund to the extent provided by regulations and may be limited. Under the Regulated Investment Company Modernization Act of 2010 (the Act), the Fund is permitted to carry forward capital losses incurred in taxable years beginning after December 22, 2010 for an unlimited period and such capital losses are required to be used prior to any losses that expire. The capital loss carryforward information presented below, including any applicable limitation, is estimated as of fiscal period end and is subject to adjustment.
| No expiration | |
| Short-term | $(17,668,003) |
The tax character of distributions paid was as follows:
| November 30, 2015 | November 30, 2014 | |
| Ordinary Income | $554,508 | $0 |
Restricted Securities. The Fund may invest in securities that are subject to legal or contractual restrictions on resale. These securities generally may be resold in transactions exempt from registration or to the public if the securities are registered. Disposal of these securities may involve time-consuming negotiations and expense, and prompt sale at an acceptable price may be difficult. Information regarding restricted securities is included at the end of the Fund's Schedule of Investments.
4. Purchases and Sales of Investments.
Purchases and sales of securities, other than short-term securities, aggregated $589,827,785 and $719,249,767, respectively.
5. Fees and Other Transactions with Affiliates.
Management Fee. Fidelity Management & Research Company (the investment adviser) and its affiliates provide the Fund with investment management related services for which the Fund pays a monthly management fee. The management fee is the sum of an individual fund fee rate that is based on an annual rate of .30% of the Fund's average net assets and an annualized group fee rate that averaged .25% during the period. The group fee rate is based upon the average net assets of all the mutual funds advised by the investment adviser, including any mutual funds previously advised by the investment adviser that are currently advised by Fidelity SelectCo, LLC, an affiliate of the investment adviser. The group fee rate decreases as assets under management increase and increases as assets under management decrease. In addition, the management fee is subject to a performance adjustment (up to a maximum of +/- .20% of the Fund's average net assets over a 36 month performance period). The upward or downward adjustment to the management fee is based on the Fund's relative investment performance as compared to its benchmark index, the Russell 3000 Growth Index, over the same 36 month performance period. The Fund's performance adjustment took effect in June 2015. Subsequent months will be added until the performance period includes 36 months. For the reporting period, the total annual management fee rate, including the performance adjustment, was .52% of the Fund's average net assets. The performance adjustment included in the management fee rate may be higher or lower than the maximum performance adjustment rate due to the difference between the average net assets for the reporting and performance periods.
Transfer Agent Fees. Fidelity Investments Institutional Operations Company, Inc. (FIIOC), an affiliate of the investment adviser, is the Fund's transfer, dividend disbursing and shareholder servicing agent. FIIOC receives account fees and asset-based fees that vary according to account size and type of account. FIIOC pays for typesetting, printing and mailing of shareholder reports, except proxy statements. For the period, the transfer agent fees were equivalent to an annual rate of .18% of average net assets.
Accounting and Security Lending Fees. Fidelity Service Company, Inc. (FSC), an affiliate of the investment adviser, maintains the Fund's accounting records. The accounting fee is based on the level of average net assets for each month. Under a separate contract, FSC administers the security lending program. The security lending fee is based on the number and duration of lending transactions.
Brokerage Commissions. The Fund placed a portion of its portfolio transactions with brokerage firms which are affiliates of the investment adviser. Brokerage commissions are included in net realized gain (loss) and change in net unrealized appreciation (depreciation) in the Statement of Operations. The commissions paid to these affiliated firms were $7,561 for the period.
Interfund Lending Program. Pursuant to an Exemptive Order issued by the SEC, the Fund, along with other registered investment companies having management contracts with FMR or other affiliated entities of FMR, may participate in an interfund lending program. This program provides an alternative credit facility allowing the funds to borrow from, or lend money to, other participating affiliated funds. The Fund's activity in this program during the period for which loans were outstanding was as follows:
| Borrower or Lender | Average Loan Balance | Weighted Average Interest Rate | Interest Expense |
| Borrower | $14,419,286 | .37% | $1,044 |
6. Security Lending.
The Fund lends portfolio securities through a lending agent from time to time in order to earn additional income. For equity securities, a lending agent is used and may loan securities to certain qualified borrowers, including Fidelity Capital Markets (FCM), a broker-dealer affiliated with the Fund. On the settlement date of the loan, the Fund receives collateral (in the form of U.S. Treasury obligations, letters of credit and/or cash) against the loaned securities and maintains collateral in an amount not less than 100% of the market value of the loaned securities during the period of the loan. The market value of the loaned securities is determined at the close of business of the Fund and any additional required collateral is delivered to the Fund on the next business day. The Fund or borrower may terminate the loan at any time, and if the borrower defaults on its obligation to return the securities loaned because of insolvency or other reasons, the Fund may apply collateral received from the borrower against the obligation. The Fund may experience delays and costs in recovering the securities loaned. Any cash collateral received is invested in the Fidelity Securities Lending Cash Central Fund. The value of loaned securities and cash collateral at period end are disclosed on the Fund's Statement of Assets and Liabilities. The value of securities loaned to FCM at period end was $246,500. Security lending income represents the income earned on investing cash collateral, less rebates paid to borrowers and any lending agent fees associated with the loan, plus any premium payments received for lending certain types of securities. Security lending income is presented in the Statement of Operations as a component of income from Fidelity Central Funds. Total security lending income during the period amounted to $105,626, including $1,631 from securities loaned to FCM.
7. Expense Reductions.
Commissions paid to certain brokers with whom the investment adviser, or its affiliates, places trades on behalf of the Fund include an amount in addition to trade execution, which may be rebated back to the Fund to offset certain expenses. This amount totaled $29,353 for the period.
In addition, during the period the investment adviser reimbursed and/or waived a portion of operating expenses in the amount of $7,145.
8. Other.
The Fund's organizational documents provide former and current trustees and officers with a limited indemnification against liabilities arising in connection with the performance of their duties to the Fund. In the normal course of business, the Fund may also enter into contracts that provide general indemnifications. The Fund's maximum exposure under these arrangements is unknown as this would be dependent on future claims that may be made against the Fund. The risk of material loss from such claims is considered remote.
At the end of the period, mutual funds managed by the investment adviser or its affiliates were the owners of record of all the outstanding shares of the Fund.
Report of Independent Registered Public Accounting Firm
To the Trustees of Fidelity Advisor Series I and Shareholders of Fidelity Advisor® Series Equity Growth Fund:
In our opinion, the accompanying statement of assets and liabilities, including the schedule of investments, and the related statements of operations and of changes in net assets and the financial highlights present fairly, in all material respects, the financial position of Fidelity Advisor® Series Equity Growth Fund (a fund of Fidelity Advisor Series I) at November 30, 2015, and the results of its operations for the year then ended, the changes in its net assets for each of the two years in the periods indicated and the financial highlights for each of the periods indicated, in conformity with accounting principles generally accepted in the United States of America. These financial statements and financial highlights (hereafter referred to as “financial statements”) are the responsibility of the Fidelity Advisor® Series Equity Growth Fund’s management. Our responsibility is to express an opinion on these financial statements based on our audits. We conducted our audits of these financial statements in accordance with the standards of the Public Company Accounting Oversight Board (United States). Those standards require that we plan and perform the audit to obtain reasonable assurance about whether the financial statements are free of material misstatement. An audit includes examining, on a test basis, evidence supporting the amounts and disclosures in the financial statements, assessing the accounting principles used and significant estimates made by management, and evaluating the overall financial statement presentation. We believe that our audits, which included confirmation of securities at November 30, 2015 by correspondence with the custodian and brokers, provide a reasonable basis for our opinion.
PricewaterhouseCoopers LLP
Boston, Massachusetts
January 20, 2016
Trustees and Officers
The Trustees, Members of the Advisory Board (if any), and officers of the trust and fund, as applicable, are listed below. The Board of Trustees governs the fund and is responsible for protecting the interests of shareholders. The Trustees are experienced executives who meet periodically throughout the year to oversee the fund's activities, review contractual arrangements with companies that provide services to the fund, oversee management of the risks associated with such activities and contractual arrangements, and review the fund's performance. Each of the Trustees oversees 170 funds.
The Trustees hold office without limit in time except that (a) any Trustee may resign; (b) any Trustee may be removed by written instrument, signed by at least two-thirds of the number of Trustees prior to such removal; (c) any Trustee who requests to be retired or who has become incapacitated by illness or injury may be retired by written instrument signed by a majority of the other Trustees; and (d) any Trustee may be removed at any special meeting of shareholders by a two-thirds vote of the outstanding voting securities of the trust. Each Trustee who is not an interested person (as defined in the 1940 Act) of the trust and the fund is referred to herein as an Independent Trustee. Each Independent Trustee shall retire not later than the last day of the calendar year in which his or her 75th birthday occurs. The Independent Trustees may waive this mandatory retirement age policy with respect to individual Trustees. Officers and Advisory Board Members hold office without limit in time, except that any officer or Advisory Board Member may resign or may be removed by a vote of a majority of the Trustees at any regular meeting or any special meeting of the Trustees. Except as indicated, each individual has held the office shown or other offices in the same company for the past five years.
The fund’s Statement of Additional Information (SAI) includes more information about the Trustees. To request a free copy, call Fidelity at 1-877-208-0098.
Experience, Skills, Attributes, and Qualifications of the Trustees. The Governance and Nominating Committee has adopted a statement of policy that describes the experience, qualifications, attributes, and skills that are necessary and desirable for potential Independent Trustee candidates (Statement of Policy). The Board believes that each Trustee satisfied at the time he or she was initially elected or appointed a Trustee, and continues to satisfy, the standards contemplated by the Statement of Policy. The Governance and Nominating Committee also engages professional search firms to help identify potential Independent Trustee candidates who have the experience, qualifications, attributes, and skills consistent with the Statement of Policy. From time to time, additional criteria based on the composition and skills of the current Independent Trustees, as well as experience or skills that may be appropriate in light of future changes to board composition, business conditions, and regulatory or other developments, have also been considered by the professional search firms and the Governance and Nominating Committee. In addition, the Board takes into account the Trustees' commitment and participation in Board and committee meetings, as well as their leadership of standing and ad hoc committees throughout their tenure.
In determining that a particular Trustee was and continues to be qualified to serve as a Trustee, the Board has considered a variety of criteria, none of which, in isolation, was controlling. The Board believes that, collectively, the Trustees have balanced and diverse experience, qualifications, attributes, and skills, which allow the Board to operate effectively in governing the fund and protecting the interests of shareholders. Information about the specific experience, skills, attributes, and qualifications of each Trustee, which in each case led to the Board's conclusion that the Trustee should serve (or continue to serve) as a trustee of the fund, is provided below.
Board Structure and Oversight Function. James C. Curvey is an interested person and currently serves as Chairman. The Trustees have determined that an interested Chairman is appropriate and benefits shareholders because an interested Chairman has a personal and professional stake in the quality and continuity of services provided to the fund. Independent Trustees exercise their informed business judgment to appoint an individual of their choosing to serve as Chairman, regardless of whether the Trustee happens to be independent or a member of management. The Independent Trustees have determined that they can act independently and effectively without having an Independent Trustee serve as Chairman and that a key structural component for assuring that they are in a position to do so is for the Independent Trustees to constitute a substantial majority for the Board. The Independent Trustees also regularly meet in executive session. Ned C. Lautenbach serves as Chairman of the Independent Trustees and as such (i) acts as a liaison between the Independent Trustees and management with respect to matters important to the Independent Trustees and (ii) with management prepares agendas for Board meetings.
Fidelity® funds are overseen by different Boards of Trustees. The fund's Board oversees Fidelity's high income and certain equity funds, and other Boards oversee Fidelity's investment-grade bond, money market, asset allocation, and sector funds. The asset allocation funds may invest in Fidelity® funds overseen by the fund's Board. The use of separate Boards, each with its own committee structure, allows the Trustees of each group of Fidelity® funds to focus on the unique issues of the funds they oversee, including common research, investment, and operational issues. On occasion, the separate Boards establish joint committees to address issues of overlapping consequences for the Fidelity® funds overseen by each Board.
The Trustees operate using a system of committees to facilitate the timely and efficient consideration of all matters of importance to the Trustees, the fund, and fund shareholders and to facilitate compliance with legal and regulatory requirements and oversight of the fund's activities and associated risks. The Board, acting through its committees, has charged FMR and its affiliates with (i) identifying events or circumstances the occurrence of which could have demonstrably adverse effects on the fund's business and/or reputation; (ii) implementing processes and controls to lessen the possibility that such events or circumstances occur or to mitigate the effects of such events or circumstances if they do occur; and (iii) creating and maintaining a system designed to evaluate continuously business and market conditions in order to facilitate the identification and implementation processes described in (i) and (ii) above. Because the day-to-day operations and activities of the fund are carried out by or through FMR, its affiliates, and other service providers, the fund's exposure to risks is mitigated but not eliminated by the processes overseen by the Trustees. While each of the Board's committees has responsibility for overseeing different aspects of the fund's activities, oversight is exercised primarily through the Operations, Audit, and Compliance Committees. In addition, the Independent Trustees have worked with FMR to enhance the Board's oversight of investment and financial risks, legal and regulatory risks, technology risks, and operational risks, including the development of additional risk reporting to the Board. For example, a working group comprised of Independent Trustees and FMR has worked and continues to work to review the Fidelity® funds' valuation-related activities, reporting and risk management. Appropriate personnel, including but not limited to the fund's Chief Compliance Officer (CCO), FMR's internal auditor, the independent accountants, the fund's Treasurer and portfolio management personnel, make periodic reports to the Board's committees, as appropriate, including an annual review of Fidelity's risk management program for the Fidelity® funds. The responsibilities of each standing committee, including their oversight responsibilities, are described further under "Standing Committees of the Trustees."
Interested Trustees*:
Correspondence intended for a Trustee who is an interested person may be sent to Fidelity Investments, 245 Summer Street, Boston, Massachusetts 02210.
Name, Year of Birth; Principal Occupations and Other Relevant Experience+
James C. Curvey (1935)
Year of Election or Appointment: 2007
Trustee
Chairman of the Board of Trustees
Mr. Curvey also serves as Trustee of other Fidelity® funds. Mr. Curvey is a Director of Fidelity Research & Analysis Co. (investment adviser firm, 2009-present), and Vice Chairman (2007-present) and Director of FMR LLC (diversified financial services company). In addition, Mr. Curvey serves as an Overseer for the Boston Symphony Orchestra and a member of the board of Artis-Naples, Naples, Florida, and as a Trustee for Brewster Academy, Wolfeboro, New Hampshire. Previously, Mr. Curvey served as a Director of Fidelity Investments Money Management, Inc. (investment adviser firm, 2009-2014) and a Director of FMR and FMR Co., Inc. (investment adviser firms, 2007-2014).
Charles S. Morrison (1960)
Year of Election or Appointment: 2014
Trustee
Mr. Morrison also serves as Trustee of other funds. He serves as a Director of Fidelity Investments Money Management, Inc. (FIMM) (investment adviser firm, 2014-present), Director of Fidelity SelectCo, LLC (investment adviser firm, 2014-present), President, Asset Management (2014-present), and is an employee of Fidelity Investments. Previously, Mr. Morrison served as Vice President of Fidelity's Fixed Income and Asset Allocation Funds (2012-2014), President, Fixed Income (2011-2014), Vice President of Fidelity's Money Market Funds (2005-2009), President, Money Market Group Leader of FMR (investment adviser firm, 2009), and Senior Vice President, Money Market Group of FMR (2004-2009). Mr. Morrison also served as Vice President of Fidelity's Bond Funds (2002-2005), certain Balanced Funds (2002-2005), and certain Asset Allocation Funds (2002-2007), and as Senior Vice President (2002-2005) of Fidelity's Bond Division.
* Determined to be an “Interested Trustee” by virtue of, among other things, his or her affiliation with the trust or various entities under common control with FMR.
+ The information includes the Trustee's principal occupation during the last five years and other information relating to the experience, attributes, and skills relevant to the Trustee's qualifications to serve as a Trustee, which led to the conclusion that the Trustee should serve as a Trustee for the fund.
Independent Trustees:
Correspondence intended for an Independent Trustee may be sent to Fidelity Investments, P.O. Box 55235, Boston, Massachusetts 02205-5235.
Name, Year of Birth; Principal Occupations and Other Relevant Experience+
Dennis J. Dirks (1948)
Year of Election or Appointment: 2005
Trustee
Mr. Dirks also serves as Trustee of other Fidelity® funds. Prior to his retirement in May 2003, Mr. Dirks was Chief Operating Officer and a member of the Board of The Depository Trust & Clearing Corporation (DTCC). He also served as President, Chief Operating Officer, and Board member of The Depository Trust Company (DTC) and President and Board member of the National Securities Clearing Corporation (NSCC). In addition, Mr. Dirks served as Chief Executive Officer and Board member of the Government Securities Clearing Corporation, Chief Executive Officer and Board member of the Mortgage-Backed Securities Clearing Corporation, as a Trustee and a member of the Finance Committee of Manhattan College (2005-2008), as a Trustee and a member of the Finance Committee of AHRC of Nassau County (2006-2008), and as a member of the Independent Directors Council (IDC) Governing Council (2010-2015). Mr. Dirks is a member of the Board of Directors for The Brookville Center for Children's Services, Inc. (2009-present).
Alan J. Lacy (1953)
Year of Election or Appointment: 2008
Trustee
Mr. Lacy also serves as Trustee of other Fidelity® funds. Mr. Lacy serves as a member of the Board of Directors of Dave & Buster's Entertainment, Inc. (restaurant and entertainment complexes, 2010-present) and Bristol-Myers Squibb Company (global pharmaceuticals, 2008-present). In addition, Mr. Lacy served as Senior Adviser (2007-2014) of Oak Hill Capital Partners, L.P. (private equity) and also served as Chief Executive Officer (2000-2005) and Vice Chairman (2005-2006) of Sears Holdings Corporation and Sears, Roebuck and Co. (retail). Mr. Lacy is a member of the Board of Trustees of The National Parks Conservation Association (2006-present). Previously, Mr. Lacy served as Chairman of the Board of Trustees of the National Parks Conservation Association (2008-2011) and as a member of the Board of Directors for The Western Union Company (global money transfer, 2006-2011), The Hillman Companies, Inc. (hardware wholesalers, 2010-2014), and Earth Fare, Inc. (retail grocery, 2010-2014).
Ned C. Lautenbach (1944)
Year of Election or Appointment: 2000
Trustee
Chairman of the Independent Trustees
Mr. Lautenbach also serves as Trustee of other Fidelity® funds. Mr. Lautenbach currently serves as the Lead Director of the Eaton Corporation Board of Directors (diversified industrial, 1997-present). Mr. Lautenbach is Chairman of the Board of Directors of Artis-Naples in Naples, Florida (2012-present), a member of the Council on Foreign Relations (1994-present), and a member of the Board of Governors, State University System of Florida (2013-present). Previously, Mr. Lautenbach was a Partner/Advisory Partner at Clayton, Dubilier & Rice, LLC (private equity investment, 1998-2010), as well as a Director of Sony Corporation (2006-2007).
Joseph Mauriello (1944)
Year of Election or Appointment: 2008
Trustee
Mr. Mauriello also serves as Trustee of other Fidelity® funds. Prior to his retirement in January 2006, Mr. Mauriello served in numerous senior management positions including Deputy Chairman and Chief Operating Officer (2004-2005), and Vice Chairman of Financial Services (2002-2004) of KPMG LLP US (professional services, 1965-2005). Mr. Mauriello currently serves as a member of the Board of Directors of XL Group plc. (global insurance and re-insurance, 2006-present) and the Independent Directors Council (IDC) Governing Council (2015-present). Previously, Mr. Mauriello served as a Director of the Hamilton Funds of the Bank of New York (2006-2007) and of Arcadia Resources Inc. (health care services and products, 2007-2012).
Robert W. Selander (1950)
Year of Election or Appointment: 2011
Trustee
Mr. Selander also serves as Trustee of other Fidelity® funds. Mr. Selander serves as a Director of The Western Union Company (global money transfer, 2014-present). Previously, Mr. Selander served as a Member of the Advisory Board of other Fidelity® funds (2011), and Executive Vice Chairman (2010), Chief Executive Officer (2009-2010), and President and Chief Executive Officer (1997-2009) of Mastercard, Inc.
Cornelia M. Small (1944)
Year of Election or Appointment: 2005
Trustee
Ms. Small also serves as Trustee of other Fidelity® funds. Ms. Small is a member of the Board of Directors (2009-present) and Chair of the Investment Committee (2010-present) of the Teagle Foundation. Ms. Small also serves on the Investment Committee of the Berkshire Taconic Community Foundation (2008-present). Previously, Ms. Small served as Chairperson (2002-2008) and a member of the Investment Committee and Chairperson (2008-2012) and a member of the Board of Trustees of Smith College. In addition, Ms. Small served as Chief Investment Officer, Director of Global Equity Investments, and a member of the Board of Directors of Scudder, Stevens & Clark and Scudder Kemper Investments.
William S. Stavropoulos (1939)
Year of Election or Appointment: 2002
Trustee
Vice Chairman of the Independent Trustees
Mr. Stavropoulos also serves as Trustee of other Fidelity® funds. Mr. Stavropoulos serves as President and Founder of the Michigan Baseball Foundation, the Great Lakes Loons (2007-present). Mr. Stavropoulos is Chairman Emeritus of the Board of Directors of The Dow Chemical Company, where he previously served in numerous senior management positions, including President, CEO (1995-2000; 2002-2004), Chairman of the Executive Committee (2000-2006), and as a member of the Board of Directors (1990-2006). Currently, Mr. Stavropoulos is Chairman of the Board of Directors of Univar Inc. (global distributor of commodity and specialty chemicals), a Director of Teradata Corporation (data warehousing and technology solutions), and Maersk Inc. (industrial conglomerate), and a member of the Advisory Board for Metalmark Capital LLC (private equity investment, 2005-present). Mr. Stavropoulos is an operating advisor to Clayton, Dubilier & Rice, LLC (private equity investment). In addition, Mr. Stavropoulos is a member of the University of Notre Dame Advisory Council for the College of Science, a Trustee of the Rollin L. Gerstacker Foundation, and a Director of the Naples Philharmonic Center for the Arts. Previously, Mr. Stavropoulos served as a Director of Chemical Financial Corporation (bank holding company, 1993-2012) and Tyco International, Ltd. (multinational manufacturing and services, 2007-2012).
David M. Thomas (1949)
Year of Election or Appointment: 2008
Trustee
Mr. Thomas also serves as Trustee of other Fidelity® funds. Mr. Thomas serves as Non-Executive Chairman of the Board of Directors of Fortune Brands Home and Security (home and security products, 2011-present), as a member of the Board of Directors (2004-present) and Presiding Director (2013-present) of Interpublic Group of Companies, Inc. (marketing communication), and as a member of the Board of Trustees of the University of Florida (2013-present). Previously, Mr. Thomas served as Executive Chairman (2005-2006) and Chairman and Chief Executive Officer (2000-2005) of IMS Health, Inc. (pharmaceutical and healthcare information solutions), and a Director of Fortune Brands, Inc. (consumer products, 2000-2011).
+ The information includes the Trustee's principal occupation during the last five years and other information relating to the experience, attributes, and skills relevant to the Trustee's qualifications to serve as a Trustee, which led to the conclusion that the Trustee should serve as a Trustee for the fund.
Advisory Board Members and Officers:
Correspondence intended for an officer or Peter S. Lynch may be sent to Fidelity Investments, 245 Summer Street, Boston, Massachusetts 02210. Officers appear below in alphabetical order.
Name, Year of Birth; Principal Occupation
Peter S. Lynch (1944)
Year of Election or Appointment: 2003
Member of the Advisory Board
Mr. Lynch also serves as Member of the Advisory Board of other Fidelity® funds. Mr. Lynch is Vice Chairman and a Director of FMR (investment adviser firm) and FMR Co., Inc. (investment adviser firm). In addition, Mr. Lynch serves as a Trustee of Boston College and as the Chairman of the Inner-City Scholarship Fund. Previously, Mr. Lynch served on the Special Olympics International Board of Directors (1997-2006).
Elizabeth Paige Baumann (1968)
Year of Election or Appointment: 2012
Anti-Money Laundering (AML) Officer
Ms. Baumann also serves as AML Officer of other funds. She is Chief AML Officer of FMR LLC (diversified financial services company, 2012-present) and is an employee of Fidelity Investments. Previously, Ms. Baumann served as Vice President and Deputy Anti-Money Laundering Officer (2007-2012).
Marc R. Bryant (1966)
Year of Election or Appointment: 2015
Secretary and Chief Legal Officer (CLO)
Mr. Bryant also serves as Secretary and CLO of other funds. Mr. Bryant serves as CLO, Secretary, and Senior Vice President of Fidelity Management & Research Company (investment adviser firm, 2015-present) and FMR Co., Inc. (investment adviser firm, 2015-present); Secretary of Fidelity SelectCo, LLC (investment adviser firm, 2015-present) and Fidelity Investments Money Management, Inc. (investment adviser firm, 2015-present); and CLO of Fidelity Management & Research (Hong Kong) Limited (investment adviser firm, 2015-present). He is Senior Vice President and Deputy General Counsel of FMR LLC (diversified financial services company). Previously, Mr. Bryant served as Secretary and CLO of Fidelity Rutland Square Trust II (2010-2014) and Assistant Secretary of Fidelity's Fixed Income and Asset Allocation Funds (2013-2015). Prior to joining Fidelity Investments, Mr. Bryant served as a Senior Vice President and the Head of Global Retail Legal for AllianceBernstein L.P. (2006-2010), and as the General Counsel for ProFund Advisors LLC (2001-2006).
William C. Coffey (1969)
Year of Election or Appointment: 2009
Assistant Secretary
Mr. Coffey also serves as Assistant Secretary of other funds. He is Senior Vice President and Deputy General Counsel of FMR LLC (diversified financial services company, 2010-present), and is an employee of Fidelity Investments. Previously, Mr. Coffey served as Vice President and Associate General Counsel of FMR LLC (2005-2009).
Jonathan Davis (1968)
Year of Election or Appointment: 2010
Assistant Treasurer
Mr. Davis also serves as Assistant Treasurer of other funds, and is an employee of Fidelity Investments. Previously, Mr. Davis served as Vice President and Associate General Counsel of FMR LLC (diversified financial services company, 2003-2010).
Adrien E. Deberghes (1967)
Year of Election or Appointment: 2008
Deputy Treasurer
Mr. Deberghes also serves as an officer of other funds. He is an employee of Fidelity Investments (2008-present). Prior to joining Fidelity Investments, Mr. Deberghes was Senior Vice President of Mutual Fund Administration at State Street Corporation (2007-2008), Senior Director of Mutual Fund Administration at Investors Bank & Trust (2005-2007), and Director of Finance for Dunkin' Brands (2000-2005).
Stephanie J. Dorsey (1969)
Year of Election or Appointment: 2010
Assistant Treasurer
Ms. Dorsey also serves as an officer of other funds. She is an employee of Fidelity Investments (2008-present) and has served in other fund officer roles. Prior to joining Fidelity Investments, Ms. Dorsey served as Treasurer (2004-2008) of the JPMorgan Mutual Funds and Vice President (2004-2008) of JPMorgan Chase Bank.
Howard J. Galligan III (1966)
Year of Election or Appointment: 2014
Chief Financial Officer
Mr. Galligan also serves as Chief Financial Officer of other funds. Mr. Galligan serves as President of Fidelity Pricing and Cash Management Services (FPCMS) (2014-present) and as a Director of Strategic Advisers, Inc. (investment adviser firm, 2008-present). Previously, Mr. Galligan served as Chief Administrative Officer of Asset Management (2011-2014) and Chief Operating Officer and Senior Vice President of Investment Support for Strategic Advisers, Inc. (2003-2011).
Scott C. Goebel (1968)
Year of Election or Appointment: 2015
Vice President
Mr. Goebel serves as Vice President of other funds and is an employee of Fidelity Investments (2001-present). Previously, Mr. Goebel served as Secretary of Fidelity SelectCo, LLC (investment adviser firm, 2013-2015), Fidelity Investments Money Management, Inc. (FIMM) (investment adviser firm, 2010-2015), and Fidelity Research and Analysis Company (FRAC) (investment adviser firm, 2010-2015); General Counsel, Secretary, and Senior Vice President of Fidelity Management & Research Company (investment adviser firm, 2008-2015) and FMR Co., Inc. (investment adviser firm, 2008-2015); Assistant Secretary of Fidelity Management & Research (Japan) Limited (investment adviser firm, 2008-2015) and FMR Investment Management (U.K.) Limited (investment adviser firm, 2008-2015); Chief Legal Officer (CLO) of Fidelity Management & Research (Hong Kong) Limited (investment adviser firm, 2008-2015); Secretary and CLO of certain Fidelity® funds (2008-2015); Assistant Secretary of FIMM (2008-2010), FRAC (2008-2010), and certain funds (2007-2008); and as Vice President and Secretary of Fidelity Distributors Corporation (FDC) (2005-2007).
Brian B. Hogan (1964)
Year of Election or Appointment: 2009
Vice President
Mr. Hogan also serves as Trustee or Vice President of other funds. Mr. Hogan serves as a Director of Fidelity SelectCo, LLC (investment adviser firm, 2014-present) and President of the Equity Division of FMR (investment adviser firm, 2009-present). Previously, Mr. Hogan served as Senior Vice President, Equity Research of FMR (2006-2009) and as a portfolio manager.
Chris Maher (1972)
Year of Election or Appointment: 2013
Assistant Treasurer
Mr. Maher serves as Assistant Treasurer of other funds. Mr. Maher is Vice President of Valuation Oversight and is an employee of Fidelity Investments. Previously, Mr. Maher served as Vice President of Asset Management Compliance (2013), Vice President of the Program Management Group of FMR (investment adviser firm, 2010-2013), and Vice President of Valuation Oversight (2008-2010).
Melissa M. Reilly (1971)
Year of Election or Appointment: 2014
Vice President of certain Equity Funds
Ms. Reilly also serves as Vice President of other funds. Ms. Reilly is an employee of Fidelity Investments (2004-present).
Kenneth B. Robins (1969)
Year of Election or Appointment: 2008
President and Treasurer
Mr. Robins also serves as an officer of other funds. Mr. Robins serves as Executive Vice President of Fidelity Investments Money Management, Inc. (FIMM) (investment adviser firm, 2013-present) and is an employee of Fidelity Investments (2004-present). Previously, Mr. Robins served in other fund officer roles.
Stacie M. Smith (1974)
Year of Election or Appointment: 2013
Deputy Treasurer
Ms. Smith also serves as an officer of other funds. She is an employee of Fidelity Investments (2009-present) and has served in other fund officer roles. Prior to joining Fidelity Investments, Ms. Smith served as Senior Audit Manager of Ernst & Young LLP (1996-2009).
Renee Stagnone (1975)
Year of Election or Appointment: 2013
Deputy Treasurer
Ms. Stagnone also serves as Deputy Treasurer of other funds. Ms. Stagnone is an employee of Fidelity Investments (1997-present).
Linda J. Wondrack (1964)
Year of Election or Appointment: 2014
Chief Compliance Officer
Ms. Wondrack also serves as Chief Compliance Officer of other funds. Ms. Wondrack is Executive Vice President and head of the Ethics Office and Asset Management Compliance for Fidelity Investments (2012-present). Ms. Wondrack also serves as Chief Compliance Officer of Fidelity SelectCo, LLC (investment adviser firm, 2014-present); Chief Compliance Officer of Impresa Management LLC (2013-present); and Chief Compliance Officer of FMR Co., Inc. (investment adviser firm), Fidelity Investments Money Management, Inc. (investment adviser firm), Fidelity Management & Research (Japan) Limited (investment adviser firm), FMR Investment Management (U.K.) Limited (investment adviser firm), Fidelity Management & Research (Hong Kong) (investment adviser firm), Fidelity Management & Research Company (investment adviser firm), FIAM LLC (investment adviser firm), and Strategic Advisers, Inc. (investment adviser firm), Ballyrock Investment Advisors LLC, and Northern Neck Investors LLC (2012-present). Previously, Ms. Wondrack served as Senior Vice President and Chief Compliance Officer for Columbia Management Investment Advisers, LLC (2005-2012); Chief Compliance Officer for certain funds within the Columbia Family of Funds (2007-2012); and Senior Vice President of Compliance Risk Management at Bank of America (2005-2010).
Joseph F. Zambello (1957)
Year of Election or Appointment: 2011
Deputy Treasurer
Mr. Zambello also serves as Deputy Treasurer of other funds. Mr. Zambello is an employee of Fidelity Investments (1991-present). Previously, Mr. Zambello served as Vice President of the Program Management Group of FMR (investment adviser firm, 2009-2011) and Vice President of the Transfer Agent Oversight Group (2005-2009).
Shareholder Expense Example
As a shareholder of the Fund, you incur two types of costs: (1) transaction costs, and (2) ongoing costs, including management fees and other Fund expenses. This Example is intended to help you understand your ongoing costs (in dollars) of investing in the Fund and to compare these costs with the ongoing costs of investing in other mutual funds.
The Example is based on an investment of $1,000 invested at the beginning of the period and held for the entire period (June 1, 2015 to November 30, 2015).
Actual Expenses
The first line of the accompanying table provides information about actual account values and actual expenses. You may use the information in this line, together with the amount you invested, to estimate the expenses that you paid over the period. Simply divide your account value by $1,000.00 (for example, an $8,600 account value divided by $1,000.00 = 8.6), then multiply the result by the number in the first line under the heading entitled "Expenses Paid During Period" to estimate the expenses you paid on your account during this period. In addition, the Fund, as a shareholder in the underlying Fidelity Central Funds, will indirectly bear its pro-rata share of the fees and expenses incurred by the underlying Fidelity Central Funds. These fees and expenses are not included in the Fund's annualized expense ratio used to calculate the expense estimate in the table below.
Hypothetical Example for Comparison Purposes
The second line of the accompanying table provides information about hypothetical account values and hypothetical expenses based on the Fund's actual expense ratio and an assumed rate of return of 5% per year before expenses, which is not the Fund's actual return. The hypothetical account values and expenses may not be used to estimate the actual ending account balance or expenses you paid for the period. You may use this information to compare the ongoing costs of investing in the Fund and other funds. To do so, compare this 5% hypothetical example with the 5% hypothetical examples that appear in the shareholder reports of the other funds. In addition, the Fund, as a shareholder in the underlying Fidelity Central Funds, will indirectly bear its pro-rata share of the fees and expenses incurred by the underlying Fidelity Central Funds. These fees and expenses are not included in the Fund's annualized expense ratio used to calculate the expense estimate in the table below.
Please note that the expenses shown in the table are meant to highlight your ongoing costs only and do not reflect any transaction costs. Therefore, the second line of the table is useful in comparing ongoing costs only, and will not help you determine the relative total costs of owning different funds.
| Annualized Expense Ratio-A | Beginning Account Value June 1, 2015 | Ending Account Value November 30, 2015 | Expenses Paid During Period-B June 1, 2015 to November 30, 2015 | |
| Actual | .70% | $1,000.00 | $1,015.30 | $3.54 |
| Hypothetical-C | $1,000.00 | $1,021.56 | $3.55 |
A Annualized expense ratio reflects expenses net of applicable fee waivers.
B Expenses are equal to the Fund's annualized expense ratio, multiplied by the average account value over the period, multiplied by 183/365 (to reflect the one-half year period).
C 5% return per year before expenses
Distributions (Unaudited)
Fidelity Advisor Series Equity Growth Fund designates 87% of the dividends distributed during the fiscal year as qualifying for the dividends received deduction for corporate shareholders.
Fidelity Advisor Series Equity Growth Fund designates 100% of the dividends distributed during the fiscal year as amounts which may be taken into account as a dividend for the purposes of the maximum rate under section l(h)(ll)of the Internal Revenue Code.
The fund will notify shareholders in January 20l6 of amounts for use in preparing 20l5 income tax returns.
Board Approval of Investment Advisory Contracts and Management Fees
Fidelity Advisor Series Equity Growth Fund
Each year, the Board of Trustees, including the Independent Trustees (together, the Board), votes on the renewal of the management contract with Fidelity Management & Research Company (FMR) and the sub-advisory agreements (together, the Advisory Contracts) for the fund. The Board, assisted by the advice of fund counsel and Independent Trustees' counsel, requests and considers a broad range of information relevant to the renewal of the Advisory Contracts throughout the year.
The Board meets regularly and, at each of its meetings, covers an extensive agenda of topics and materials and considers factors that are relevant to its annual consideration of the renewal of the fund's Advisory Contracts, including the services and support provided to the fund and its shareholders. The Board has established various standing committees (Committees), each composed of and chaired by Independent Trustees with varying backgrounds, to which the Board has assigned specific subject matter responsibilities in order to enhance effective decision-making by the Board. The Board, acting directly and through its Committees, requests and receives information concerning the annual consideration of the renewal of the fund's Advisory Contracts. The Board also meets as needed to consider matters specifically related to the Board's annual consideration of the renewal of the Advisory Contracts. Members of the Board may also meet with trustees of other Fidelity funds through ad hoc joint committees to discuss certain matters relevant to all of the Fidelity funds.
At its July 2015 meeting, the Board unanimously determined to renew the fund's Advisory Contracts. In reaching its determination, the Board considered all factors it believed relevant, including (i) the nature, extent, and quality of the services to be provided to the fund and its shareholders (including the investment performance of the fund); (ii) the competitiveness of the fund's management fee and total expense ratio relative to peer funds; (iii) the total costs of the services to be provided by and the profits to be realized by Fidelity from its relationship with the fund; and (iv) the extent to which (if any) economies of scale exist and would be realized as the fund grows, and whether any economies of scale are appropriately shared with fund shareholders.
In considering whether to renew the Advisory Contracts for the fund, the Board reached a determination, with the assistance of fund counsel and Independent Trustees' counsel and through the exercise of its business judgment, that the renewal of the Advisory Contracts was in the best interests of the fund and its shareholders and that the compensation payable under the Advisory Contracts was fair and reasonable. The Board's decision to renew the Advisory Contracts was not based on any single factor, but rather was based on a comprehensive consideration of all the information provided to the Board at its meetings throughout the year. The Board, in reaching its determination to renew the Advisory Contracts, was aware that shareholders of the fund have a broad range of investment choices available to them, including a wide choice among funds offered by Fidelity's competitors, and that the fund's shareholders, who have the opportunity to review and weigh the disclosure provided by the fund in its prospectus and other public disclosures, have chosen to invest in this fund, which is part of the Fidelity family of funds.
Nature, Extent, and Quality of Services Provided. The Board considered Fidelity's staffing as it relates to the fund, including the backgrounds of investment personnel of Fidelity, and also considered the fund's investment objective, strategies, and related investment philosophy. The Independent Trustees also had discussions with senior management of Fidelity's investment operations and investment groups. The Board considered the structure of the portfolio manager compensation program and whether this structure provides appropriate incentives to act in the best interests of the fund. Additionally, the Board considered the portfolio managers' investments, if any, in the funds that they manage.Resources Dedicated to Investment Management and Support Services. The Board and the Fund Oversight and Research Committees reviewed the general qualifications and capabilities of Fidelity's investment staff, including its size, education, experience, and resources, as well as Fidelity's approach to recruiting, training, managing, and compensating investment personnel. The Board noted that Fidelity has continued to increase the resources devoted to non-U.S. offices, including expansion of Fidelity's global investment organization. The Board also noted that Fidelity's analysts have extensive resources, tools and capabilities that allow them to conduct sophisticated quantitative and fundamental analysis, as well as credit analysis of issuers, counterparties and guarantors. Further, the Board considered that Fidelity's investment professionals have sufficient access to global information and data so as to provide competitive investment results over time, and that those professionals also have access to sophisticated tools that permit them to assess portfolio construction and risk and performance attribution characteristics continuously, as well as to transmit new information and research conclusions rapidly around the world. Additionally, in its deliberations, the Board considered Fidelity's trading, risk management, and compliance capabilities and resources, which are integral parts of the investment management process.Shareholder and Administrative Services. The Board considered (i) the nature, extent, quality, and cost of advisory, administrative, and shareholder services performed by FMR, the sub-advisers (together with FMR, the Investment Advisers), and their affiliates under the Advisory Contracts and under separate agreements covering transfer agency, pricing and bookkeeping, and securities lending services for the fund; (ii) the nature and extent of the supervision of third party service providers, principally custodians and subcustodians; and (iii) the resources devoted to, and the record of compliance with, the fund's compliance policies and procedures. The Board also reviewed the allocation of fund brokerage, including allocations to brokers affiliated with the Investment Advisers, the use of brokerage commissions to pay fund expenses, and the use of "soft" commission dollars to pay for research services.The Board noted that the growth of fund assets over time across the complex allows Fidelity to reinvest in the development of services designed to enhance the value or convenience of the Fidelity funds as investment vehicles. These services include 24-hour access to account information and market information through telephone representatives and over the Internet, investor education materials and asset allocation tools, and the expanded availability of Fidelity Investor Centers.In 2014, the Board formed an ad hoc Committee on Transfer Agency Fees to review the variety of transfer agency fee structures throughout the industry and Fidelity's competitive positioning with respect to industry participants.Investment in a Large Fund Family. The Board considered the benefits to shareholders of investing in a Fidelity fund, including the benefits of investing in a fund that is part of a large family of funds offering a variety of investment disciplines and providing a large variety of mutual fund investor services. The Board noted that Fidelity had taken, or had made recommendations that resulted in the Fidelity funds taking, a number of actions over the previous year that benefited particular funds, including (i) continuing to dedicate additional resources to investment research and to the support of the senior management team that oversees asset management; (ii) continuing efforts to enhance Fidelity's global research capabilities; (iii) launching new funds and making other enhancements to meet client needs; (iv) reducing management fees and total expenses for certain index funds and diversified international funds; (v) continuing to launch dedicated lower cost underlying funds to meet portfolio construction needs related to expanding underlying fund options for Fidelity funds of funds, specifically for the Freedom Fund product lines; (vi) rationalizing product lines and gaining increased efficiencies through fund mergers; (vii) launching active fixed-income exchange-traded funds; (viii) continuing to develop, acquire and implement systems and technology to improve services to the funds and information security and to increase efficiency; (ix) implementing investment enhancements to further strengthen Fidelity's target date product line to increase investors' probability of success in achieving their goals; (x) modifying the eligibility criteria for certain share classes to accommodate roll-over assets from employer-sponsored retirement plans; (xi) launching a new Class W of the Freedom Index Funds to attract and retain Fidelity record-kept retirement plan assets; and (xii) implementing changes to Fidelity's money market product line in response to recent money market regulatory reforms.Investment Performance. The Board considered whether the fund has operated in accordance with its investment objective, as well as its record of compliance with its investment restrictions. As the fund recently commenced operations, the Board did not believe that it was appropriate to assign significant weight to its limited investment performance.Based on its review, the Board concluded that the nature, extent, and quality of services provided to the fund under the Advisory Contracts should benefit the shareholders of the fund.Competitiveness of Management Fee and Total Expense Ratio. The Board considered the fund's management fee and total expense ratio compared to "mapped groups" of competitive funds and classes created for the purpose of facilitating the Trustees' competitive analysis of management fees and total expenses. Fidelity creates "mapped groups" by combining similar Lipper investment objective categories that have comparable investment mandates. Combining Lipper investment objective categories aids the Board's management fee and total expense ratio comparisons by broadening the competitive group used for comparison.Management Fee. The Board considered two proprietary management fee comparisons for the period of the fund's operations shown in basis points (BP) in the chart below. The group of Lipper funds used by the Board for management fee comparisons is referred to below as the "Total Mapped Group." The Total Mapped Group comparison focuses on a fund's standing in terms of gross management fees before expense reimbursements or caps, and without giving effect to the fund's performance adjustment, relative to the total universe of funds with comparable investment mandates, regardless of whether their management fee structures also are comparable. Funds with comparable investment mandates offer exposure to similar types of securities. Funds with comparable management fee structures have similar management fee contractual arrangements (e.g., flat rate charged for advisory services, all-inclusive fee rate, etc.). "TMG %" represents the percentage of funds in the Total Mapped Group that had management fees that were lower than the fund's. For example, a hypothetical TMG % of 20% would mean that 80% of the funds in the Total Mapped Group had higher, and 20% had lower, management fees than the fund. The fund's actual TMG % and the number of funds in the Total Mapped Group are in the chart below. The "Asset-Size Peer Group" (ASPG) comparison focuses on a fund's standing relative to a subset of non-Fidelity funds within the Total Mapped Group that are similar in size and management fee structure without taking into account performance adjustments, if any. For example, if a fund is in the first quartile of the ASPG, the fund's management fee ranks in the least expensive or lowest 25% of funds in the ASPG. The ASPG represents at least 15% of the funds in the Total Mapped Group with comparable asset size and management fee structures, subject to a minimum of 50 funds (or all funds in the Total Mapped Group if fewer than 50). Additional information, such as the ASPG quartile in which the fund's management fee rate ranked, is also included in the chart and considered by the Board.Fidelity Advisor Series Equity Growth Fund
![]()
Corporate Headquarters
245 Summer St.
Boston, MA 02210
www.fidelity.com
AXM1-ANN-0116
1.9860268.101
Fidelity Advisor® Small Cap Fund Class Z Annual Report November 30, 2015 |
|
Contents
Board Approval of Investment Advisory Contracts and Management Fees |
To view a fund's proxy voting guidelines and proxy voting record for the 12-month period ended June 30, visit http://www.fidelity.com/proxyvotingresults or visit the Securities and Exchange Commission's (SEC) web site at http://www.sec.gov.
You may also call 1-877-208-0098 to request a free copy of the proxy voting guidelines.
Standard & Poor's, S&P and S&P 500 are registered service marks of The McGraw-Hill Companies, Inc. and have been licensed for use by Fidelity Distributors Corporation.
Other third-party marks appearing herein are the property of their respective owners.
All other marks appearing herein are registered or unregistered trademarks or service marks of FMR LLC or an affiliated company. ©2016 FMR LLC. All rights reserved.
This report and the financial statements contained herein are submitted for the general information of the shareholders of the Fund. This report is not authorized for distribution to prospective investors in the Fund unless preceded or accompanied by an effective prospectus.
A fund files its complete schedule of portfolio holdings with the SEC for the first and third quarters of each fiscal year on Form N-Q. Forms N-Q are available on the SEC’s web site at http://www.sec.gov. A fund's Forms N-Q may be reviewed and copied at the SEC’s Public Reference Room in Washington, DC. Information regarding the operation of the SEC's Public Reference Room may be obtained by calling 1-800-SEC-0330.
For a complete list of a fund's portfolio holdings, view the most recent holdings listing, semiannual report, or annual report on Fidelity's web site at http://www.fidelity.com, http://www.advisor.fidelity.com, or http://www.401k.com, as applicable.
NOT FDIC INSURED •MAY LOSE VALUE •NO BANK GUARANTEE
Neither the Fund nor Fidelity Distributors Corporation is a bank.
Performance: The Bottom Line
Average annual total return reflects the change in the value of an investment, assuming reinvestment of distributions from dividend income and capital gains (the profits earned upon the sale of securities that have grown in value, if any) and assuming a constant rate of performance each year.
The hypothetical investment and the average annual total returns do not reflect the deduction of taxes that a shareholder would pay on fund distributions or the redemption of fund shares.
During periods of reimbursement by Fidelity, a fund’s total return will be greater than it would be had the reimbursement not occurred.
How a fund did yesterday is no guarantee of how it will do tomorrow.
Average Annual Total Returns
| For the periods ended November 30, 2015 | Past 1 year | Past 5 years | Past 10 years |
| Class Z | 4.59% | 11.16% | 8.31% |
The initial offering of Class Z shares took place on August 13, 2013. Returns prior to August 13, 2013, are those of Class I.
$10,000 Over 10 Years
Let's say hypothetically that $10,000 was invested in Fidelity Advisor® Small Cap Fund - Class Z on November 30, 2005.
The chart shows how the value of your investment would have changed, and also shows how the Russell 2000® Index performed over the same period.
See previous page for additional information regarding the performance of Class Z.
| Period Ending Values | ||
| $22,221 | Fidelity Advisor® Small Cap Fund - Class Z | |
| $20,242 | Russell 2000® Index | |
Management's Discussion of Fund Performance
Market Recap: U.S. stocks gained modestly for the 12 months ending November 30, 2015, despite a steep decline in August and September on concern about slowing economic growth in China. The S&P 500® index rebounded in October and gained 2.75% for the year. Stocks benefited late in the period amid waning expectations for a near-term interest-rate hike by the U.S. Federal Reserve, more economic stimulus in Europe and an interest-rate cut in China. Growth stocks in the benchmark far outpaced their value counterparts, as investors continued to seek growth in a subpar economic environment. Sector performance varied widely, with more than 26 percentage points separating the leader from the laggard. Consumer discretionary (+14%) secured the top spot, benefiting from a combination of rising personal income and still-benign inflation. Information technology (+7%) and health care (+4%) also outpaced the broad market. Conversely, the energy sector (-12%) performed worst, stymied by depressed commodity prices that also hit materials (-5%). Telecommunication services (-5%) and utilities (-4%), considered defensive sectors less sensitive to the economy, also lost ground. At period end, investors remained focused on the potential global implications of a stronger U.S. dollar and how China's transition toward a consumption-led economy may affect corporate earnings.Comments from Portfolio Manager James Harmon: For the year, a majority of the fund's share classes (excluding sales charges, if applicable) outperformed the 3.51% gain of the benchmark Russell 2000® Index. Relative to the benchmark, the fund benefited from strong security selection in the information technology, materials and consumer staples sectors. Global Payments, a provider of payment technology services, was a standout contributor. Also adding value were positions in Stamps.com, which allows businesses and consumers to print their own postage, and Zensar Technologies, an Indian IT outsourcing company. The fund's foreign holdings contributed to performance, despite the strength of the U.S. dollar. Although stock selection in health care detracted, a position in outpatient surgical center provider AmSurg was an exception. In contrast, weak stock selection in consumer discretionary nicked results, especially a position in Fossil Group, a maker of watches and other fashion accessories that was weighed down by business challenges at customer Michael Kors. Other meaningful detractors were conference call services provider West, and Genesco, a shoe and hat retailer no longer held at period end. Of the stocks mentioned, only Global Payments, Zensar and Fossil were not in the benchmark.The views expressed above reflect those of the portfolio manager(s) only through the end of the period as stated on the cover of this report and do not necessarily represent the views of Fidelity or any other person in the Fidelity organization. Any such views are subject to change at any time based upon market or other conditions and Fidelity disclaims any responsibility to update such views. These views may not be relied on as investment advice and, because investment decisions for a Fidelity fund are based on numerous factors, may not be relied on as an indication of trading intent on behalf of any Fidelity fund.
Investment Summary (Unaudited)
Top Ten Stocks as of November 30, 2015
| % of fund's net assets | % of fund's net assets 6 months ago | |
| CDW Corp. | 2.4 | 2.3 |
| Primerica, Inc. | 2.2 | 1.8 |
| Syntel, Inc. | 2.2 | 1.2 |
| West Corp. | 2.0 | 2.2 |
| Zensar Technologies Ltd. | 1.9 | 1.4 |
| The Ensign Group, Inc. | 1.9 | 1.8 |
| Global Payments, Inc. | 1.9 | 2.8 |
| CNO Financial Group, Inc. | 1.8 | 1.3 |
| United Therapeutics Corp. | 1.8 | 2.1 |
| Zebra Technologies Corp. Class A | 1.7 | 1.7 |
| 19.8 |
Top Five Market Sectors as of November 30, 2015
| % of fund's net assets | % of fund's net assets 6 months ago | |
| Information Technology | 22.4 | 21.4 |
| Financials | 21.3 | 21.0 |
| Industrials | 15.6 | 14.3 |
| Health Care | 13.1 | 14.4 |
| Consumer Discretionary | 8.9 | 14.9 |
Asset Allocation (% of fund's net assets)
| As of November 30, 2015* | ||
| Stocks, Investment Companies and Equity Futures | 98.6% | |
| Other Investments | 0.5% | |
| Short-Term Investments and Net Other Assets (Liabilities) | 0.9% | |

* Foreign investments - 15.4%
| As of May 31, 2015* | ||
| Stocks and Equity Futures | 98.9% | |
| Other Investments | 0.4% | |
| Short-Term Investments and Net Other Assets (Liabilities) | 0.7% | |

* Foreign investments - 14.2%
Investments November 30, 2015
Showing Percentage of Net Assets
| Common Stocks - 88.7% | |||
| Shares | Value (000s) | ||
| CONSUMER DISCRETIONARY - 8.9% | |||
| Auto Components - 0.1% | |||
| Horizon Global Corp. (a) | 292,022 | $2,538 | |
| Diversified Consumer Services - 1.2% | |||
| Meiko Network Japan Co. Ltd. (b) | 1,577,900 | 17,932 | |
| Tsukada Global Holdings, Inc. (b)(c) | 2,800,000 | 18,583 | |
| 36,515 | |||
| Household Durables - 0.8% | |||
| Tupperware Brands Corp. (c) | 440,000 | 24,979 | |
| Leisure Products - 0.8% | |||
| Smith & Wesson Holding Corp. (a) | 1,265,100 | 23,202 | |
| Media - 0.2% | |||
| Crown Media Holdings, Inc. Class A (a) | 1,006,821 | 5,709 | |
| Specialty Retail - 5.3% | |||
| Aarons, Inc. Class A | 1,072,000 | 26,017 | |
| Hibbett Sports, Inc. (a)(c) | 800,000 | 26,248 | |
| Jumbo SA | 303,981 | 3,099 | |
| Office Depot, Inc. (a) | 6,514,200 | 42,929 | |
| Sally Beauty Holdings, Inc. (a) | 1,000,000 | 25,860 | |
| Select Comfort Corp. (a) | 1,400,000 | 33,068 | |
| Staples, Inc. | 200,000 | 2,414 | |
| 159,635 | |||
| Textiles, Apparel & Luxury Goods - 0.5% | |||
| Fossil Group, Inc. (a)(c) | 400,000 | 15,388 | |
| TOTAL CONSUMER DISCRETIONARY | 267,966 | ||
| CONSUMER STAPLES - 2.7% | |||
| Food & Staples Retailing - 2.7% | |||
| Ain Holdings, Inc. | 115,000 | 5,409 | |
| Sundrug Co. Ltd. | 400,000 | 25,768 | |
| Tsuruha Holdings, Inc. | 425,000 | 37,977 | |
| United Natural Foods, Inc. (a) | 300,000 | 13,173 | |
| 82,327 | |||
| ENERGY - 2.1% | |||
| Energy Equipment & Services - 0.0% | |||
| Cathedral Energy Services Ltd. (b) | 3,363,407 | 1,461 | |
| Oil, Gas & Consumable Fuels - 2.1% | |||
| Delek Logistics Partners LP | 400,000 | 14,604 | |
| World Fuel Services Corp. | 1,091,300 | 47,570 | |
| 62,174 | |||
| TOTAL ENERGY | 63,635 | ||
| FINANCIALS - 20.8% | |||
| Banks - 5.9% | |||
| Allegiance Bancshares, Inc. (a) | 119,542 | 2,925 | |
| Bank of the Ozarks, Inc. | 500,000 | 27,140 | |
| ConnectOne Bancorp, Inc. (b) | 1,550,000 | 30,241 | |
| First NBC Bank Holding Co. (a)(b) | 1,026,364 | 43,456 | |
| German American Bancorp, Inc. | 33,344 | 1,150 | |
| Investors Bancorp, Inc. | 3,316,299 | 42,515 | |
| Wilshire Bancorp, Inc. | 2,350,000 | 28,999 | |
| 176,426 | |||
| Consumer Finance - 1.9% | |||
| Credit Acceptance Corp. (a)(c) | 6,300 | 1,263 | |
| PRA Group, Inc. (a)(c) | 800,000 | 33,048 | |
| SLM Corp. (a) | 3,385,800 | 22,871 | |
| 57,182 | |||
| Insurance - 7.9% | |||
| CNO Financial Group, Inc. | 2,700,000 | 54,621 | |
| Enstar Group Ltd. (a) | 150,000 | 23,117 | |
| Hanover Insurance Group, Inc. | 226,842 | 19,191 | |
| James River Group Holdings Ltd. | 617,952 | 19,836 | |
| National Western Life Group, Inc. | 20,000 | 5,265 | |
| Primerica, Inc. | 1,307,265 | 66,984 | |
| Reinsurance Group of America, Inc. | 550,000 | 50,534 | |
| 239,548 | |||
| Real Estate Investment Trusts - 2.4% | |||
| EPR Properties | 330,000 | 18,493 | |
| MFA Financial, Inc. | 3,900,000 | 27,222 | |
| VEREIT, Inc. | 3,200,000 | 26,656 | |
| 72,371 | |||
| Real Estate Management & Development - 0.5% | |||
| Relo Holdings Corp. | 140,000 | 15,160 | |
| Thrifts & Mortgage Finance - 2.2% | |||
| BofI Holding, Inc. (a)(c) | 2,400,000 | 48,072 | |
| Meridian Bancorp, Inc. | 1,095,110 | 16,054 | |
| Oritani Financial Corp. | 200,000 | 3,468 | |
| 67,594 | |||
| TOTAL FINANCIALS | 628,281 | ||
| HEALTH CARE - 13.1% | |||
| Biotechnology - 1.8% | |||
| United Therapeutics Corp. (a) | 350,000 | 53,421 | |
| Health Care Equipment & Supplies - 0.8% | |||
| Fukuda Denshi Co. Ltd. | 125,000 | 6,651 | |
| The Cooper Companies, Inc. | 115,000 | 16,819 | |
| 23,470 | |||
| Health Care Providers & Services - 8.6% | |||
| Aceto Corp. | 1,200,000 | 33,852 | |
| AmSurg Corp. (a) | 313,000 | 26,311 | |
| Community Health Systems, Inc. (a) | 1,600,000 | 46,304 | |
| HealthSouth Corp. | 800,000 | 28,152 | |
| MEDNAX, Inc. (a) | 300,000 | 21,411 | |
| Message Co. Ltd. | 523,200 | 12,321 | |
| Providence Service Corp. (a) | 600,000 | 29,052 | |
| Ryman Healthcare Group Ltd. | 900,000 | 4,651 | |
| Sigma Pharmaceuticals Ltd. | 3,000,000 | 1,888 | |
| The Ensign Group, Inc. | 1,200,000 | 57,084 | |
| 261,026 | |||
| Life Sciences Tools & Services - 0.6% | |||
| VWR Corp. (a)(c) | 681,000 | 18,169 | |
| Pharmaceuticals - 1.3% | |||
| Jazz Pharmaceuticals PLC (a) | 150,000 | 21,989 | |
| Sawai Pharmaceutical Co. Ltd. | 300,000 | 17,206 | |
| 39,195 | |||
| TOTAL HEALTH CARE | 395,281 | ||
| INDUSTRIALS - 15.6% | |||
| Aerospace & Defense - 3.2% | |||
| BWX Technologies, Inc. | 1,050,000 | 31,973 | |
| Engility Holdings, Inc. | 600,000 | 20,760 | |
| Moog, Inc. Class A (a) | 400,000 | 26,428 | |
| Teledyne Technologies, Inc. (a) | 200,000 | 18,502 | |
| 97,663 | |||
| Commercial Services & Supplies - 5.6% | |||
| Coor Service Management Holding AB (a) | 1,535,502 | 5,986 | |
| Deluxe Corp. | 800,000 | 46,920 | |
| Mitie Group PLC | 5,600,000 | 26,913 | |
| UniFirst Corp. | 250,000 | 27,145 | |
| West Corp. | 2,400,000 | 61,200 | |
| 168,164 | |||
| Electrical Equipment - 1.2% | |||
| EnerSys | 625,550 | 36,845 | |
| Machinery - 4.1% | |||
| Federal Signal Corp. | 1,800,000 | 30,348 | |
| Hy-Lok Corp. (b) | 700,000 | 15,207 | |
| Standex International Corp. | 550,000 | 49,154 | |
| TriMas Corp. (a) | 1,350,000 | 29,201 | |
| 123,910 | |||
| Marine - 0.3% | |||
| SITC International Holdings Co. Ltd. | 19,000,000 | 9,606 | |
| Professional Services - 0.7% | |||
| Benefit One, Inc. | 1,150,000 | 21,692 | |
| Transportation Infrastructure - 0.5% | |||
| Wesco Aircraft Holdings, Inc. (a) | 1,000,000 | 13,380 | |
| TOTAL INDUSTRIALS | 471,260 | ||
| INFORMATION TECHNOLOGY - 22.4% | |||
| Electronic Equipment & Components - 7.9% | |||
| Belden, Inc. | 400,000 | 25,108 | |
| CDW Corp. | 1,700,000 | 73,385 | |
| Insight Enterprises, Inc. (a) | 1,400,000 | 37,492 | |
| SYNNEX Corp. | 530,913 | 50,049 | |
| Zebra Technologies Corp. Class A (a) | 650,000 | 52,130 | |
| 238,164 | |||
| Internet Software & Services - 1.1% | |||
| Stamps.com, Inc. (a) | 325,000 | 32,942 | |
| IT Services - 9.0% | |||
| Blackhawk Network Holdings, Inc. (a) | 900,000 | 42,615 | |
| Cardtronics, Inc. (a) | 1,000,000 | 37,610 | |
| EVERTEC, Inc. | 1,365,000 | 23,451 | |
| Global Payments, Inc. | 800,000 | 56,680 | |
| MoneyGram International, Inc. (a) | 1,838,009 | 16,138 | |
| Perficient, Inc. (a) | 800,000 | 13,984 | |
| Syntel, Inc. (a) | 1,350,000 | 65,381 | |
| WEX, Inc. (a) | 170,000 | 16,026 | |
| 271,885 | |||
| Software - 4.4% | |||
| NIIT Technologies Ltd. (b) | 3,800,000 | 32,572 | |
| Sword Group (b) | 587,339 | 14,676 | |
| Verint Systems, Inc. (a) | 620,000 | 29,047 | |
| Zensar Technologies Ltd. (b) | 3,500,000 | 57,126 | |
| 133,421 | |||
| TOTAL INFORMATION TECHNOLOGY | 676,412 | ||
| MATERIALS - 2.6% | |||
| Chemicals - 1.9% | |||
| Innospec, Inc. | 200,000 | 11,680 | |
| PolyOne Corp. | 1,300,000 | 46,774 | |
| 58,454 | |||
| Paper & Forest Products - 0.7% | |||
| Neenah Paper, Inc. | 300,000 | 19,941 | |
| TOTAL MATERIALS | 78,395 | ||
| TELECOMMUNICATION SERVICES - 0.4% | |||
| Diversified Telecommunication Services - 0.3% | |||
| APT Satellite Holdings Ltd. | 3,150,000 | 2,669 | |
| Asia Satellite Telecommunications Holdings Ltd. | 800,000 | 1,156 | |
| Vocus Communications Ltd. (c) | 784,380 | 4,101 | |
| 7,926 | |||
| Wireless Telecommunication Services - 0.1% | |||
| Cellcom Israel Ltd. (Israel) (a) | 200,000 | 1,426 | |
| Partner Communications Co. Ltd. (a) | 293,027 | 1,328 | |
| 2,754 | |||
| TOTAL TELECOMMUNICATION SERVICES | 10,680 | ||
| UTILITIES - 0.1% | |||
| Gas Utilities - 0.1% | |||
| Star Gas Partners LP | 600,000 | 4,632 | |
| TOTAL COMMON STOCKS | |||
| (Cost $2,121,588) | 2,678,869 | ||
| Investment Companies - 1.6% | |||
| iShares Russell 2000 Index ETF (c) | |||
| (Cost $48,715) | 417,100 | 49,672 | |
| Principal Amount (000s)(d) | Value (000s) | ||
| U.S. Treasury Obligations - 0.4% | |||
| U.S. Treasury Bills, yield at date of purchase 0.04% to 0.15% 1/28/16 to 2/25/16 (e) | |||
| (Cost $11,588) | 11,590 | 11,588 | |
| Preferred Securities - 0.5% | |||
| FINANCIALS - 0.5% | |||
| Diversified Financial Services - 0.5% | |||
| Baggot Securities Ltd. 10.24% (f)(g) (Cost $18,643) | $12,000 | $13,780 | |
| Shares | Value (000s) | ||
| Money Market Funds - 12.6% | |||
| Fidelity Cash Central Fund, 0.18% (h) | 278,295,789 | 278,296 | |
| Fidelity Securities Lending Cash Central Fund, 0.22% (h)(i) | 102,156,853 | 102,157 | |
| TOTAL MONEY MARKET FUNDS | |||
| (Cost $380,453) | 380,453 | ||
| TOTAL INVESTMENT PORTFOLIO - 103.8% | |||
| (Cost $2,580,987) | 3,134,362 | ||
| NET OTHER ASSETS (LIABILITIES) - (3.8)% | (115,618) | ||
| NET ASSETS - 100% | $3,018,744 |
| Futures Contracts | |||
| Expiration Date | Underlying Face Amount at Value (000s) | Unrealized Appreciation/(Depreciation) (000s) | |
| Purchased | |||
| Equity Index Contracts | |||
| 2,107 ICE Russell 2000 Index Contracts (United States) | Dec. 2015 | 251,976 | $6,815 |
The face value of futures purchased as a percentage of Net Assets is 8.3%
Currency Abbreviations
EUR – European Monetary Unit
Security Type Abbreviations
ETF – Exchange-Traded Fund
Legend
(a) Non-income producing
(b) Affiliated company
(c) Security or a portion of the security is on loan at period end.
(d) Amount is stated in United States dollars unless otherwise noted.
(e) Security or a portion of the security was pledged to cover margin requirements for futures contracts. At period end, the value of securities pledged amounted to $11,588,000.
(f) Security exempt from registration under Rule 144A of the Securities Act of 1933. These securities may be resold in transactions exempt from registration, normally to qualified institutional buyers. At the end of the period, the value of these securities amounted to $13,780,000 or 0.5% of net assets.
(g) Security is perpetual in nature with no stated maturity date.
(h) Affiliated fund that is generally available only to investment companies and other accounts managed by Fidelity Investments. The rate quoted is the annualized seven-day yield of the fund at period end. A complete unaudited listing of the fund's holdings as of its most recent quarter end is available upon request. In addition, each Fidelity Central Fund's financial statements, which are not covered by the Fund's Report of Independent Registered Public Accounting Firm, are available on the SEC's website or upon request.
(i) Investment made with cash collateral received from securities on loan.
Affiliated Central Funds
Information regarding fiscal year to date income earned by the Fund from investments in Fidelity Central Funds is as follows:
| Fund | Income earned |
| (Amounts in thousands) | |
| Fidelity Cash Central Fund | $355 |
| Fidelity Securities Lending Cash Central Fund | 292 |
| Total | $647 |
Other Affiliated Issuers
An affiliated company is a company in which the Fund has ownership of at least 5% of the voting securities. Fiscal year to date transactions with companies which are or were affiliates are as follows:
| Affiliate (Amounts in thousands) | Value, beginning of period | Purchases | Sales Proceeds | Dividend Income | Value, end of period |
| Cathedral Energy Services Ltd. | $8,984 | $376 | $-- | $453 | $1,461 |
| ConnectOne Bancorp, Inc. | -- | 30,386 | -- | 276 | 30,241 |
| First NBC Bank Holding Co. | 29,120 | 8,512 | -- | -- | 43,456 |
| Hy-Lok Corp. | 19,901 | -- | -- | 212 | 15,207 |
| Meiko Network Japan Co. Ltd. | 16,216 | -- | -- | 403 | 17,932 |
| NIIT Technologies Ltd. | 23,245 | -- | -- | 566 | 32,572 |
| Stamps.com, Inc. | 40,163 | -- | 37,361 | -- | -- |
| Sword Group | 12,905 | -- | -- | 668 | 14,676 |
| The Ensign Group, Inc. | 47,304 | -- | -- | 360 | -- |
| Tsukada Global Holdings, Inc. | 17,524 | -- | -- | 206 | 18,583 |
| Zensar Technologies Ltd. | 33,225 | -- | -- | 614 | 57,126 |
| Total | $248,587 | $39,274 | $37,361 | $3,758 | $231,254 |
Investment Valuation
The following is a summary of the inputs used, as of November 30, 2015, involving the Fund's assets and liabilities carried at fair value. The inputs or methodology used for valuing securities may not be an indication of the risk associated with investing in those securities. For more information on valuation inputs, and their aggregation into the levels used below, please refer to the Investment Valuation section in the accompanying Notes to Financial Statements.
| Valuation Inputs at Reporting Date: | ||||
| Description | Total | Level 1 | Level 2 | Level 3 |
| (Amounts in thousands) | ||||
| Investments in Securities: | ||||
| Equities: | ||||
| Consumer Discretionary | $267,966 | $267,966 | $-- | $-- |
| Consumer Staples | 82,327 | 82,327 | -- | -- |
| Energy | 63,635 | 63,635 | -- | -- |
| Financials | 628,281 | 628,281 | -- | -- |
| Health Care | 395,281 | 395,281 | -- | -- |
| Industrials | 471,260 | 471,260 | -- | -- |
| Information Technology | 676,412 | 676,412 | -- | -- |
| Materials | 78,395 | 78,395 | -- | -- |
| Telecommunication Services | 10,680 | 10,680 | -- | -- |
| Utilities | 4,632 | 4,632 | -- | -- |
| Investment Companies | 49,672 | 49,672 | -- | -- |
| U.S. Government and Government Agency Obligations | 11,588 | -- | 11,588 | -- |
| Preferred Securities | 13,780 | -- | 13,780 | -- |
| Money Market Funds | 380,453 | 380,453 | -- | -- |
| Total Investments in Securities: | $3,134,362 | $3,108,994 | $25,368 | $-- |
| Derivative Instruments: | ||||
| Assets | ||||
| Futures Contracts | $6,815 | $6,815 | $-- | $-- |
| Total Assets | $6,815 | $6,815 | $-- | $-- |
| Total Derivative Instruments: | $6,815 | $6,815 | $-- | $-- |
Value of Derivative Instruments
The following table is a summary of the Fund's value of derivative instruments by primary risk exposure as of November 30, 2015. For additional information on derivative instruments, please refer to the Derivative Instruments section in the accompanying Notes to Financial Statements.
| Primary Risk Exposure / Derivative Type | Value | |
| (Amounts in thousands) | Asset | Liability |
| Equity Risk | ||
| Futures Contracts(a) | $6,815 | $0 |
| Total Equity Risk | 6,815 | 0 |
| Total Value of Derivatives | $6,815 | $0 |
(a) Reflects gross cumulative appreciation (depreciation) on futures contracts as presented in the Schedule of Investments. Only the period end receivable or payable for daily variation margin and net unrealized appreciation (depreciation) are presented in the Statement of Assets and Liabilities.
Other Information
Distribution of investments by country or territory of incorporation, as a percentage of Total Net Assets, is as follows (Unaudited):
| United States of America | 84.6% |
| Japan | 5.9% |
| India | 3.0% |
| Bermuda | 1.6% |
| Ireland | 1.2% |
| Others (Individually Less Than 1%) | 3.7% |
| 100.0% |
See accompanying notes which are an integral part of the financial statements.
Financial Statements
Statement of Assets and Liabilities
| Amounts in thousands (except per-share amounts) | November 30, 2015 | |
| Assets | ||
| Investment in securities, at value (including securities loaned of $99,108) — See accompanying schedule: Unaffiliated issuers (cost $2,019,444) | $2,522,655 | |
| Fidelity Central Funds (cost $380,453) | 380,453 | |
| Other affiliated issuers (cost $181,090) | 231,254 | |
| Total Investments (cost $2,580,987) | $3,134,362 | |
| Receivable for investments sold | 9,564 | |
| Receivable for fund shares sold | 2,093 | |
| Dividends receivable | 1,785 | |
| Distributions receivable from Fidelity Central Funds | 86 | |
| Prepaid expenses | 7 | |
| Other receivables | 3 | |
| Total assets | 3,147,900 | |
| Liabilities | ||
| Payable to custodian bank | $2,317 | |
| Payable for investments purchased | 14,906 | |
| Payable for fund shares redeemed | 5,140 | |
| Accrued management fee | 2,123 | |
| Distribution and service plan fees payable | 866 | |
| Payable for daily variation margin for derivative instruments | 1,010 | |
| Other affiliated payables | 575 | |
| Other payables and accrued expenses | 62 | |
| Collateral on securities loaned, at value | 102,157 | |
| Total liabilities | 129,156 | |
| Net Assets | $3,018,744 | |
| Net Assets consist of: | ||
| Paid in capital | $2,219,498 | |
| Accumulated net investment loss | (3,498) | |
| Accumulated undistributed net realized gain (loss) on investments and foreign currency transactions | 242,608 | |
| Net unrealized appreciation (depreciation) on investments and assets and liabilities in foreign currencies | 560,136 | |
| Net Assets | $3,018,744 | |
| Calculation of Maximum Offering Price | ||
| Class A: | ||
| Net Asset Value and redemption price per share ($1,046,645 ÷ 37,972.4 shares) | $27.56 | |
| Maximum offering price per share (100/94.25 of $27.56) | $29.24 | |
| Class T: | ||
| Net Asset Value and redemption price per share ($888,348 ÷ 34,177.5 shares) | $25.99 | |
| Maximum offering price per share (100/96.50 of $25.99) | $26.93 | |
| Class B: | ||
| Net Asset Value and offering price per share ($21,075 ÷ 955.9 shares)(a) | $22.05 | |
| Class C: | ||
| Net Asset Value and offering price per share ($317,907 ÷ 14,168.4 shares)(a) | $22.44 | |
| Class I: | ||
| Net Asset Value, offering price and redemption price per share ($703,678 ÷ 23,780.2 shares) | $29.59 | |
| Class Z: | ||
| Net Asset Value, offering price and redemption price per share ($41,091 ÷ 1,391.4 shares) | $29.53 |
(a) Redemption price per share is equal to net asset value less any applicable contingent deferred sales charge.
See accompanying notes which are an integral part of the financial statements.
Statement of Operations
| Amounts in thousands | Year ended November 30, 2015 | |
| Investment Income | ||
| Dividends (including $3,758 earned from other affiliated issuers) | $32,816 | |
| Special dividends | 6,860 | |
| Interest | 163 | |
| Income from Fidelity Central Funds | 647 | |
| Total income | 40,486 | |
| Expenses | ||
| Management fee | ||
| Basic fee | $21,376 | |
| Performance adjustment | 1,695 | |
| Transfer agent fees | 6,233 | |
| Distribution and service plan fees | 10,852 | |
| Accounting and security lending fees | 911 | |
| Custodian fees and expenses | 119 | |
| Independent trustees' compensation | 13 | |
| Registration fees | 138 | |
| Audit | 62 | |
| Legal | 10 | |
| Miscellaneous | 18 | |
| Total expenses before reductions | 41,427 | |
| Expense reductions | (157) | 41,270 |
| Net investment income (loss) | (784) | |
| Realized and Unrealized Gain (Loss) | ||
| Net realized gain (loss) on: | ||
| Investment securities: | ||
| Unaffiliated issuers | 256,467 | |
| Other affiliated issuers | 25,828 | |
| Foreign currency transactions | (386) | |
| Futures contracts | (9,056) | |
| Total net realized gain (loss) | 272,853 | |
| Change in net unrealized appreciation (depreciation) on: Investment securities | (159,608) | |
| Assets and liabilities in foreign currencies | 74 | |
| Futures contracts | 6,738 | |
| Total change in net unrealized appreciation (depreciation) | (152,796) | |
| Net gain (loss) | 120,057 | |
| Net increase (decrease) in net assets resulting from operations | $119,273 |
See accompanying notes which are an integral part of the financial statements.
Statement of Changes in Net Assets
| Amounts in thousands | Year ended November 30, 2015 | Year ended November 30, 2014 |
| Increase (Decrease) in Net Assets | ||
| Operations | ||
| Net investment income (loss) | $(784) | $1,228 |
| Net realized gain (loss) | 272,853 | 448,042 |
| Change in net unrealized appreciation (depreciation) | (152,796) | (182,506) |
| Net increase (decrease) in net assets resulting from operations | 119,273 | 266,764 |
| Distributions to shareholders from net investment income | (1,701) | (1,611) |
| Distributions to shareholders from net realized gain | (353,938) | (400,188) |
| Total distributions | (355,639) | (401,799) |
| Share transactions - net increase (decrease) | 204,314 | (287,435) |
| Total increase (decrease) in net assets | (32,052) | (422,470) |
| Net Assets | ||
| Beginning of period | 3,050,796 | 3,473,266 |
| End of period (including accumulated net investment loss of $3,498 and $0, respectively) | $3,018,744 | $3,050,796 |
See accompanying notes which are an integral part of the financial statements.
Financial Highlights — Fidelity Advisor Small Cap Fund Class A
| Years ended November 30, | 2015 | 2014 | 2013 | 2012 | 2011 |
| Selected Per–Share Data | |||||
| Net asset value, beginning of period | $29.85 | $30.96 | $22.45 | $23.60 | $24.35 |
| Income from Investment Operations | |||||
| Net investment income (loss)A | .02B | .04 | .12C | (.03) | (.09)D |
| Net realized and unrealized gain (loss) | 1.10 | 2.36 | 8.45 | .79 | .67 |
| Total from investment operations | 1.12 | 2.40 | 8.57 | .76 | .58 |
| Distributions from net investment income | – | (.01) | (.05) | – | – |
| Distributions from net realized gain | (3.41) | (3.50) | (.01) | (1.91) | (1.33) |
| Total distributions | (3.41) | (3.51) | (.06) | (1.91) | (1.33) |
| Net asset value, end of period | $27.56 | $29.85 | $30.96 | $22.45 | $23.60 |
| Total ReturnE,F | 4.17% | 9.06% | 38.30% | 3.87% | 2.17% |
| Ratios to Average Net AssetsG,H | |||||
| Expenses before reductions | 1.26% | .98% | 1.01% | 1.06% | 1.31% |
| Expenses net of fee waivers, if any | 1.26% | .98% | 1.01% | 1.06% | 1.31% |
| Expenses net of all reductions | 1.25% | .97% | 1.00% | 1.06% | 1.31% |
| Net investment income (loss) | .07%B | .14% | .46%C | (.13)% | (.35)%D |
| Supplemental Data | |||||
| Net assets, end of period (in millions) | $1,047 | $1,097 | $1,263 | $1,212 | $1,461 |
| Portfolio turnover rateI | 33% | 39% | 34% | 69% | 38% |
A Calculated based on average shares outstanding during the period.
B Investment income per share reflects a large, non-recurring dividend which amounted to $.06 per share. Excluding this non-recurring dividend, the ratio of net investment income (loss) to average net assets would have been (.16) %.
C Investment income per share reflects a large, non-recurring dividend which amounted to $.04 per share. Excluding this non-recurring dividend, the ratio of net investment income (loss) to average net assets would have been .29%.
D Investment income per share reflects a large, non-recurring dividend which amounted to $.04 per share. Excluding this non-recurring dividend, the ratio of net investment income (loss) to average net assets would have been (.50) %.
E Total returns would have been lower if certain expenses had not been reduced during the applicable periods shown.
F Total returns do not include the effect of the sales charges.
G Fees and expenses of any underlying Fidelity Central Funds are not included in the Fund's expense ratio. The Fund indirectly bears its proportionate share of the expenses of any underlying Fidelity Central Funds.
H Expense ratios reflect operating expenses of the class. Expenses before reductions do not reflect amounts reimbursed by the investment adviser or reductions from brokerage service arrangements or reductions from other expense offset arrangements and do not represent the amount paid by the class during periods when reimbursements or reductions occur. Expenses net of fee waivers reflect expenses after reimbursement by the investment adviser but prior to reductions from brokerage service arrangements or other expense offset arrangements. Expenses net of all reductions represent the net expenses paid by the class.
I Amount does not include the portfolio activity of any underlying Fidelity Central Funds.
See accompanying notes which are an integral part of the financial statements.
Financial Highlights — Fidelity Advisor Small Cap Fund Class T
| Years ended November 30, | 2015 | 2014 | 2013 | 2012 | 2011 |
| Selected Per–Share Data | |||||
| Net asset value, beginning of period | $28.40 | $29.69 | $21.52 | $22.75 | $23.57 |
| Income from Investment Operations | |||||
| Net investment income (loss)A | (.04)B | (.02) | .06C | (.07) | (.13)D |
| Net realized and unrealized gain (loss) | 1.04 | 2.23 | 8.13 | .75 | .64 |
| Total from investment operations | 1.00 | 2.21 | 8.19 | .68 | .51 |
| Distributions from net investment income | – | – | (.01) | – | – |
| Distributions from net realized gain | (3.41) | (3.50) | (.01) | (1.91) | (1.33) |
| Total distributions | (3.41) | (3.50) | (.02) | (1.91) | (1.33) |
| Net asset value, end of period | $25.99 | $28.40 | $29.69 | $21.52 | $22.75 |
| Total ReturnE,F | 3.93% | 8.79% | 38.11% | 3.64% | 1.94% |
| Ratios to Average Net AssetsG,H | |||||
| Expenses before reductions | 1.49% | 1.20% | 1.22% | 1.26% | 1.51% |
| Expenses net of fee waivers, if any | 1.49% | 1.20% | 1.22% | 1.26% | 1.51% |
| Expenses net of all reductions | 1.49% | 1.20% | 1.21% | 1.25% | 1.51% |
| Net investment income (loss) | (.16)%B | (.08)% | .25%C | (.33)% | (.55)%D |
| Supplemental Data | |||||
| Net assets, end of period (in millions) | $888 | $958 | $1,113 | $1,054 | $1,244 |
| Portfolio turnover rateI | 33% | 39% | 34% | 69% | 38% |
A Calculated based on average shares outstanding during the period.
B Investment income per share reflects a large, non-recurring dividend which amounted to $.06 per share. Excluding this non-recurring dividend, the ratio of net investment income (loss) to average net assets would have been (.39) %.
C Investment income per share reflects a large, non-recurring dividend which amounted to $.04 per share. Excluding this non-recurring dividend, the ratio of net investment income (loss) to average net assets would have been .09%.
D Investment income per share reflects a large, non-recurring dividend which amounted to $.04 per share. Excluding this non-recurring dividend, the ratio of net investment income (loss) to average net assets would have been (.70) %.
E Total returns would have been lower if certain expenses had not been reduced during the applicable periods shown.
F Total returns do not include the effect of the sales charges.
G Fees and expenses of any underlying Fidelity Central Funds are not included in the Fund's expense ratio. The Fund indirectly bears its proportionate share of the expenses of any underlying Fidelity Central Funds.
H Expense ratios reflect operating expenses of the class. Expenses before reductions do not reflect amounts reimbursed by the investment adviser or reductions from brokerage service arrangements or reductions from other expense offset arrangements and do not represent the amount paid by the class during periods when reimbursements or reductions occur. Expenses net of fee waivers reflect expenses after reimbursement by the investment adviser but prior to reductions from brokerage service arrangements or other expense offset arrangements. Expenses net of all reductions represent the net expenses paid by the class.
I Amount does not include the portfolio activity of any underlying Fidelity Central Funds.
See accompanying notes which are an integral part of the financial statements.
Financial Highlights — Fidelity Advisor Small Cap Fund Class B
| Years ended November 30, | 2015 | 2014 | 2013 | 2012 | 2011 |
| Selected Per–Share Data | |||||
| Net asset value, beginning of period | $24.73 | $26.45 | $19.27 | $20.69 | $21.66 |
| Income from Investment Operations | |||||
| Net investment income (loss)A | (.17)B | (.16) | (.08)C | (.18) | (.25)D |
| Net realized and unrealized gain (loss) | .90 | 1.94 | 7.26 | .67 | .61 |
| Total from investment operations | .73 | 1.78 | 7.18 | .49 | .36 |
| Distributions from net realized gain | (3.41) | (3.50) | – | (1.91) | (1.33) |
| Net asset value, end of period | $22.05 | $24.73 | $26.45 | $19.27 | $20.69 |
| Total ReturnE,F | 3.35% | 8.16% | 37.26% | 3.03% | 1.39% |
| Ratios to Average Net AssetsG,H | |||||
| Expenses before reductions | 2.07% | 1.80% | 1.81% | 1.85% | 2.10% |
| Expenses net of fee waivers, if any | 2.06% | 1.80% | 1.81% | 1.85% | 2.10% |
| Expenses net of all reductions | 2.06% | 1.79% | 1.80% | 1.84% | 2.10% |
| Net investment income (loss) | (.74)%B | (.68)% | (.34)%C | (.92)% | (1.14)%D |
| Supplemental Data | |||||
| Net assets, end of period (in millions) | $21 | $31 | $40 | $40 | $55 |
| Portfolio turnover rateI | 33% | 39% | 34% | 69% | 38% |
A Calculated based on average shares outstanding during the period.
B Investment income per share reflects a large, non-recurring dividend which amounted to $.05 per share. Excluding this non-recurring dividend, the ratio of net investment income (loss) to average net assets would have been (.96) %.
C Investment income per share reflects a large, non-recurring dividend which amounted to $.04 per share. Excluding this non-recurring dividend, the ratio of net investment income (loss) to average net assets would have been (.51) %.
D Investment income per share reflects a large, non-recurring dividend which amounted to $.03 per share. Excluding this non-recurring dividend, the ratio of net investment income (loss) to average net assets would have been (1.29) %.
E Total returns would have been lower if certain expenses had not been reduced during the applicable periods shown.
F Total returns do not include the effect of the contingent deferred sales charge.
G Fees and expenses of any underlying Fidelity Central Funds are not included in the Fund's expense ratio. The Fund indirectly bears its proportionate share of the expenses of any underlying Fidelity Central Funds.
H Expense ratios reflect operating expenses of the class. Expenses before reductions do not reflect amounts reimbursed by the investment adviser or reductions from brokerage service arrangements or reductions from other expense offset arrangements and do not represent the amount paid by the class during periods when reimbursements or reductions occur. Expenses net of fee waivers reflect expenses after reimbursement by the investment adviser but prior to reductions from brokerage service arrangements or other expense offset arrangements. Expenses net of all reductions represent the net expenses paid by the class.
I Amount does not include the portfolio activity of any underlying Fidelity Central Funds.
See accompanying notes which are an integral part of the financial statements.
Financial Highlights — Fidelity Advisor Small Cap Fund Class C
| Years ended November 30, | 2015 | 2014 | 2013 | 2012 | 2011 |
| Selected Per–Share Data | |||||
| Net asset value, beginning of period | $25.10 | $26.77 | $19.50 | $20.90 | $21.87 |
| Income from Investment Operations | |||||
| Net investment income (loss)A | (.16)B | (.15) | (.07)C | (.17) | (.24)D |
| Net realized and unrealized gain (loss) | .91 | 1.98 | 7.34 | .68 | .60 |
| Total from investment operations | .75 | 1.83 | 7.27 | .51 | .36 |
| Distributions from net realized gain | (3.41) | (3.50) | – | (1.91) | (1.33) |
| Net asset value, end of period | $22.44 | $25.10 | $26.77 | $19.50 | $20.90 |
| Total ReturnE,F | 3.38% | 8.26% | 37.28% | 3.10% | 1.37% |
| Ratios to Average Net AssetsG,H | |||||
| Expenses before reductions | 2.02% | 1.73% | 1.76% | 1.81% | 2.06% |
| Expenses net of fee waivers, if any | 2.02% | 1.73% | 1.76% | 1.81% | 2.06% |
| Expenses net of all reductions | 2.01% | 1.73% | 1.75% | 1.80% | 2.05% |
| Net investment income (loss) | (.69)%B | (.62)% | (.29)%C | (.88)% | (1.10)%D |
| Supplemental Data | |||||
| Net assets, end of period (in millions) | $318 | $317 | $334 | $284 | $328 |
| Portfolio turnover rateI | 33% | 39% | 34% | 69% | 38% |
A Calculated based on average shares outstanding during the period.
B Investment income per share reflects a large, non-recurring dividend which amounted to $.05 per share. Excluding this non-recurring dividend, the ratio of net investment income (loss) to average net assets would have been (.91) %.
C Investment income per share reflects a large, non-recurring dividend which amounted to $.04 per share. Excluding this non-recurring dividend, the ratio of net investment income (loss) to average net assets would have been (.45) %.
D Investment income per share reflects a large, non-recurring dividend which amounted to $.03 per share. Excluding this non-recurring dividend, the ratio of net investment income (loss) to average net assets would have been (1.25) %.
E Total returns would have been lower if certain expenses had not been reduced during the applicable periods shown.
F Total returns do not include the effect of the contingent deferred sales charge.
G Fees and expenses of any underlying Fidelity Central Funds are not included in the Fund's expense ratio. The Fund indirectly bears its proportionate share of the expenses of any underlying Fidelity Central Funds.
H Expense ratios reflect operating expenses of the class. Expenses before reductions do not reflect amounts reimbursed by the investment adviser or reductions from brokerage service arrangements or reductions from other expense offset arrangements and do not represent the amount paid by the class during periods when reimbursements or reductions occur. Expenses net of fee waivers reflect expenses after reimbursement by the investment adviser but prior to reductions from brokerage service arrangements or other expense offset arrangements. Expenses net of all reductions represent the net expenses paid by the class.
I Amount does not include the portfolio activity of any underlying Fidelity Central Funds.
See accompanying notes which are an integral part of the financial statements.
Financial Highlights — Fidelity Advisor Small Cap Fund Class I
| Years ended November 30, | 2015 | 2014 | 2013 | 2012 | 2011 |
| Selected Per–Share Data | |||||
| Net asset value, beginning of period | $31.80 | $32.73 | $23.73 | $24.77 | $25.42 |
| Income from Investment Operations | |||||
| Net investment income (loss)A | .10B | .13 | .21C | .04 | (.01)D |
| Net realized and unrealized gain (loss) | 1.18 | 2.50 | 8.94 | .83 | .69 |
| Total from investment operations | 1.28 | 2.63 | 9.15 | .87 | .68 |
| Distributions from net investment income | (.08) | (.06) | (.13) | – | – |
| Distributions from net realized gain | (3.41) | (3.50) | (.01) | (1.91) | (1.33) |
| Total distributions | (3.49) | (3.56) | (.15)E | (1.91) | (1.33) |
| Net asset value, end of period | $29.59 | $31.80 | $32.73 | $23.73 | $24.77 |
| Total ReturnF | 4.46% | 9.33% | 38.79% | 4.15% | 2.49% |
| Ratios to Average Net AssetsG,H | |||||
| Expenses before reductions | .99% | .70% | .71% | .75% | 1.01% |
| Expenses net of fee waivers, if any | .99% | .70% | .71% | .75% | 1.01% |
| Expenses net of all reductions | .99% | .70% | .70% | .74% | 1.00% |
| Net investment income (loss) | .34%B | .41% | .76%C | .18% | (.05)%D |
| Supplemental Data | |||||
| Net assets, end of period (in millions) | $704 | $627 | $718 | $1,141 | $1,314 |
| Portfolio turnover rateI | 33% | 39% | 34% | 69% | 38% |
A Calculated based on average shares outstanding during the period.
B Investment income per share reflects a large, non-recurring dividend which amounted to $.07 per share. Excluding this non-recurring dividend, the ratio of net investment income (loss) to average net assets would have been .11%.
C Investment income per share reflects a large, non-recurring dividend which amounted to $.05 per share. Excluding this non-recurring dividend, the ratio of net investment income (loss) to average net assets would have been .59%.
D Investment income per share reflects a large, non-recurring dividend which amounted to $.04 per share. Excluding this non-recurring dividend, the ratio of net investment income (loss) to average net assets would have been (.19) %.
E Total distributions of $.15 per share is comprised of distributions from net investment income of $.133 and distributions from net realized gain of $.014 per share.
F Total returns would have been lower if certain expenses had not been reduced during the applicable periods shown.
G Fees and expenses of any underlying Fidelity Central Funds are not included in the Fund's expense ratio. The Fund indirectly bears its proportionate share of the expenses of any underlying Fidelity Central Funds.
H Expense ratios reflect operating expenses of the class. Expenses before reductions do not reflect amounts reimbursed by the investment adviser or reductions from brokerage service arrangements or reductions from other expense offset arrangements and do not represent the amount paid by the class during periods when reimbursements or reductions occur. Expenses net of fee waivers reflect expenses after reimbursement by the investment adviser but prior to reductions from brokerage service arrangements or other expense offset arrangements. Expenses net of all reductions represent the net expenses paid by the class.
I Amount does not include the portfolio activity of any underlying Fidelity Central Funds.
See accompanying notes which are an integral part of the financial statements.
Financial Highlights — Fidelity Advisor Small Cap Fund Class Z
| Years ended November 30, | 2015 | 2014 | 2013 A |
| Selected Per–Share Data | |||
| Net asset value, beginning of period | $31.76 | $32.74 | $29.79 |
| Income from Investment Operations | |||
| Net investment income (loss)B | .14C | .17 | .02D |
| Net realized and unrealized gain (loss) | 1.17 | 2.51 | 2.93 |
| Total from investment operations | 1.31 | 2.68 | 2.95 |
| Distributions from net investment income | (.14) | (.16) | – |
| Distributions from net realized gain | (3.41) | (3.50) | – |
| Total distributions | (3.54)E | (3.66) | – |
| Net asset value, end of period | $29.53 | $31.76 | $32.74 |
| Total ReturnF,G | 4.59% | 9.52% | 9.90% |
| Ratios to Average Net AssetsH,I | |||
| Expenses before reductions | .84% | .55% | .56%J |
| Expenses net of fee waivers, if any | .84% | .55% | .56%J |
| Expenses net of all reductions | .84% | .54% | .55%J |
| Net investment income (loss) | .48%C | .57% | .26%D,J |
| Supplemental Data | |||
| Net assets, end of period (in millions) | $41 | $20 | $5 |
| Portfolio turnover rateK | 33% | 39% | 34% |
A For the period August 13, 2013 (commencement of sale of shares) to November 30, 2013.
B Calculated based on average shares outstanding during the period.
C Investment income per share reflects a large, non-recurring dividend which amounted to $.07 per share. Excluding this non-recurring dividend, the ratio of net investment income (loss) to average net assets would have been .26%.
D Investment income per share reflects a large, non-recurring dividend which amounted to $.01 per share. Excluding this non-recurring dividend, the ratio of net investment income (loss) to average net assets would have been .09%.
E Total distributions of $3.54 per share is comprised of distributions from net investment income of $.136 and distributions from net realized gain of $3.406 per share.
F Total returns for periods of less than one year are not annualized.
G Total returns would have been lower if certain expenses had not been reduced during the applicable periods shown.
H Fees and expenses of any underlying Fidelity Central Funds are not included in the Fund's expense ratio. The Fund indirectly bears its proportionate share of the expenses of any underlying Fidelity Central Funds.
I Expense ratios reflect operating expenses of the class. Expenses before reductions do not reflect amounts reimbursed by the investment adviser or reductions from brokerage service arrangements or reductions from other expense offset arrangements and do not represent the amount paid by the class during periods when reimbursements or reductions occur. Expense ratios before reductions for start-up periods may not be representative of longer-term operating periods. Expenses net of fee waivers reflect expenses after reimbursement by the investment adviser but prior to reductions from brokerage service arrangements or other expense offset arrangements. Expenses net of all reductions represent the net expenses paid by the class.
J Annualized
K Amount does not include the portfolio activity of any underlying Fidelity Central Funds.
See accompanying notes which are an integral part of the financial statements.
Notes to Financial Statements
For the period ended November 30, 2015
(Amounts in thousands except percentages)
1. Organization.
Fidelity Advisor Small Cap Fund (the Fund) is a fund of Fidelity Advisor Series I (the Trust) and is authorized to issue an unlimited number of shares. The Trust is registered under the Investment Company Act of 1940, as amended (the 1940 Act), as an open-end management investment company organized as a Massachusetts business trust. The Fund offers Class A, Class T, Class C, Class I (formerly Institutional Class) and Class Z shares, each of which, along with Class B shares, has equal rights as to assets and voting privileges. Class B shares are closed to new accounts and additional purchases, except for exchanges and reinvestments. Each class has exclusive voting rights with respect to matters that affect that class. Class B shares will automatically convert to Class A shares after a holding period of seven years from the initial date of purchase.
2. Investments in Fidelity Central Funds.
The Fund invests in Fidelity Central Funds, which are open-end investment companies generally available only to other investment companies and accounts managed by the investment adviser and its affiliates. The Fund's Schedule of Investments lists each of the Fidelity Central Funds held as of period end, if any, as an investment of the Fund, but does not include the underlying holdings of each Fidelity Central Fund. As an Investing Fund, the Fund indirectly bears its proportionate share of the expenses of the underlying Fidelity Central Funds.
The Money Market Central Funds seek preservation of capital and current income and are managed by Fidelity Investments Money Management, Inc. (FIMM), an affiliate of the investment adviser. Annualized expenses of the Money Market Central Funds as of their most recent shareholder report date are less than .005%.
A complete unaudited list of holdings for each Fidelity Central Fund is available upon request or at the Securities and Exchange Commission (the SEC) website at www.sec.gov. In addition, the financial statements of the Fidelity Central Funds, which are not covered by the Fund's Report of Independent Registered Public Accounting Firm, are available on the SEC website or upon request.
3. Significant Accounting Policies.
The financial statements have been prepared in conformity with accounting principles generally accepted in the United States of America (GAAP), which require management to make certain estimates and assumptions at the date of the financial statements. Actual results could differ from those estimates. Subsequent events, if any, through the date that the financial statements were issued have been evaluated in the preparation of the financial statements. The following summarizes the significant accounting policies of the Fund:
Investment Valuation. Investments are valued as of 4:00 p.m. Eastern time on the last calendar day of the period. The Board of Trustees (the Board) has delegated the day to day responsibility for the valuation of the Fund's investments to the Fidelity Management & Research Company (FMR) Fair Value Committee (the Committee). In accordance with valuation policies and procedures approved by the Board, the Fund attempts to obtain prices from one or more third party pricing vendors or brokers to value its investments. When current market prices, quotations or currency exchange rates are not readily available or reliable, investments will be fair valued in good faith by the Committee, in accordance with procedures adopted by the Board. Factors used in determining fair value vary by investment type and may include market or investment specific events, changes in interest rates and credit quality. The frequency with which these procedures are used cannot be predicted and they may be utilized to a significant extent. The Committee oversees the Fund's valuation policies and procedures and reports to the Board on the Committee's activities and fair value determinations. The Board monitors the appropriateness of the procedures used in valuing the Fund's investments and ratifies the fair value determinations of the Committee.
The Fund categorizes the inputs to valuation techniques used to value its investments into a disclosure hierarchy consisting of three levels as shown below:
- Level 1 – quoted prices in active markets for identical investments
- Level 2 – other significant observable inputs (including quoted prices for similar investments, interest rates, prepayment speeds, etc.)
- Level 3 – unobservable inputs (including the Fund's own assumptions based on the best information available)
Valuation techniques used to value the Fund's investments by major category are as follows:
Equity securities, including restricted securities, for which market quotations are readily available, are valued at the last reported sale price or official closing price as reported by a third party pricing vendor on the primary market or exchange on which they are traded and are categorized as Level 1 in the hierarchy. In the event there were no sales during the day or closing prices are not available, securities are valued at the last quoted bid price or may be valued using the last available price and are generally categorized as Level 2 in the hierarchy. For foreign equity securities, when market or security specific events arise, comparisons to the valuation of American Depositary Receipts (ADRs), futures contracts, Exchange-Traded Funds (ETFs) and certain indexes as well as quoted prices for similar securities may be used and would be categorized as Level 2 in the hierarchy. Utilizing these techniques may result in transfers between Level 1 and Level 2. For equity securities, including restricted securities, where observable inputs are limited, assumptions about market activity and risk are used and these securities may be categorized as Level 3 in the hierarchy.
Debt securities, including restricted securities, are valued based on evaluated prices received from third party pricing vendors or from brokers who make markets in such securities. Preferred securities and U.S. government and government agency obligations, are valued by pricing vendors who utilize matrix pricing which considers yield or price of bonds of comparable quality, coupon, maturity and type or by broker-supplied prices. When independent prices are unavailable or unreliable, debt securities may be valued utilizing pricing methodologies which consider similar factors that would be used by third party pricing vendors. Debt securities are generally categorized as Level 2 in the hierarchy but may be Level 3 depending on the circumstances. ETFs are valued at their last sale price or official closing price as reported by a third party pricing vendor on the primary market or exchange on which they are traded and are categorized as Level 1 in the hierarchy. In the event there were no sales during the day but the exchange reports a closing bid level, ETFs are valued at the closing bid and would be categorized as Level 1 in the hierarchy. In the event there was no closing bid, ETFs may be valued by another method that the Board believes reflects fair value in accordance with the Board's fair value pricing policies and may be categorized as Level 2 in the hierarchy.
Futures contracts are valued at the settlement price established each day by the board of trade or exchange on which they are traded and are categorized as Level 1 in the hierarchy. Investments in open-end mutual funds, including the Fidelity Central Funds, are valued at their closing net asset value (NAV) each business day and are categorized as Level 1 in the hierarchy.
Changes in valuation techniques may result in transfers in or out of an assigned level within the disclosure hierarchy. The aggregate value of investments by input level as of November 30, 2015 is included at the end of the Fund's Schedule of Investments.
Foreign Currency. The Fund may use foreign currency contracts to facilitate transactions in foreign-denominated securities. Gains and losses from these transactions may arise from changes in the value of the foreign currency or if the counterparties do not perform under the contracts' terms.
Foreign-denominated assets, including investment securities, and liabilities are translated into U.S. dollars at the exchange rates at period end. Purchases and sales of investment securities, income and dividends received and expenses denominated in foreign currencies are translated into U.S. dollars at the exchange rate in effect on the transaction date.
The effects of exchange rate fluctuations on investments are included with the net realized and unrealized gain (loss) on investment securities. Other foreign currency transactions resulting in realized and unrealized gain (loss) are disclosed separately.
Investment Transactions and Income. For financial reporting purposes, the Fund's investment holdings and NAV include trades executed through the end of the last business day of the period. The NAV per share for processing shareholder transactions is calculated as of the close of business of the New York Stock Exchange (NYSE), normally 4:00 p.m. Eastern time and includes trades executed through the end of the prior business day. Gains and losses on securities sold are determined on the basis of identified cost and may include proceeds received from litigation. Dividend income is recorded on the ex-dividend date, except for certain dividends from foreign securities where the ex-dividend date may have passed, which are recorded as soon as the Fund is informed of the ex-dividend date. Non-cash dividends included in dividend income, if any, are recorded at the fair market value of the securities received. Income and capital gain distributions from Fidelity Central Funds, if any, are recorded on the ex-dividend date. Distributions received on securities that represent a return of capital or capital gain are recorded as a reduction of cost of investments and/or as a realized gain. Subsequent to ex-dividend date the Fund determines the components of these distributions, based upon receipt of tax filings or other correspondence relating to the underlying investment. Large, non-recurring dividends recognized by the Fund are presented separately on the Statement of Operations as "Special Dividends" and the impact of these dividends is presented in the Financial Highlights. Interest income is accrued as earned and includes coupon interest and amortization of premium and accretion of discount on debt securities as applicable. Investment income is recorded net of foreign taxes withheld where recovery of such taxes is uncertain.
Class Allocations and Expenses. Investment income, realized and unrealized capital gains and losses, common expenses of the Fund, and certain fund-level expense reductions, if any, are allocated daily on a pro-rata basis to each class based on the relative net assets of each class to the total net assets of the Fund. Each class differs with respect to transfer agent and distribution and service plan fees incurred. Certain expense reductions may also differ by class. For the reporting period, the allocated portion of income and expenses to each class as a percent of its average net assets may vary due to the timing of recording these transactions in relation to fluctuating net assets of the classes. Expenses directly attributable to a fund are charged to that fund. Expenses attributable to more than one fund are allocated among the respective funds on the basis of relative net assets or other appropriate methods. Expense estimates are accrued in the period to which they relate and adjustments are made when actual amounts are known.
Income Tax Information and Distributions to Shareholders. Each year, the Fund intends to qualify as a regulated investment company under Subchapter M of the Internal Revenue Code, including distributing substantially all of its taxable income and realized gains. As a result, no provision for U.S. Federal income taxes is required. As of November 30, 2015, the Fund did not have any unrecognized tax benefits in the financial statements; nor is the Fund aware of any tax positions for which it is reasonably possible that the total amounts of unrecognized tax benefits will significantly change in the next twelve months. The Fund files a U.S. federal tax return, in addition to state and local tax returns as required. The Fund's federal income tax returns are subject to examination by the Internal Revenue Service (IRS) for a period of three fiscal years after they are filed. State and local tax returns may be subject to examination for an additional fiscal year depending on the jurisdiction. Foreign taxes are provided for based on the Fund's understanding of the tax rules and rates that exist in the foreign markets in which it invests.
Distributions are declared and recorded on the ex-dividend date. Income dividends and capital gain distributions are declared separately for each class. Income and capital gain distributions are determined in accordance with income tax regulations, which may differ from GAAP. In addition, the Fund claimed a portion of the payment made to redeeming shareholders as a distribution for income tax purposes.
Capital accounts within the financial statements are adjusted for permanent book-tax differences. These adjustments have no impact on net assets or the results of operations. Capital accounts are not adjusted for temporary book-tax differences which will reverse in a subsequent period.
Book-tax differences are primarily due to futures contracts, market discount, foreign currency transactions, partnerships and losses deferred due to wash sales and excise tax regulations.
The federal tax cost of investment securities and unrealized appreciation (depreciation) as of period end were as follows:
| Gross unrealized appreciation | $739,926 |
| Gross unrealized depreciation | (185,981) |
| Net unrealized appreciation (depreciation) on securities | $553,945 |
| Tax Cost | $2,580,417 |
The tax-based components of distributable earnings as of period end were as follows:
| Undistributed long-term capital gain | $248,855 |
| Net unrealized appreciation (depreciation) on securities and other investments | $553,891 |
The tax character of distributions paid was as follows:
| November 30, 2015 | November 30, 2014 | |
| Ordinary Income | $1,701 | $ 1,611 |
| Long-term Capital Gains | 353,938 | 400,188 |
| Total | $355,639 | $ 401,799 |
The Fund intends to elect to defer to its next fiscal year $3,499 of ordinary losses recognized during the period January 1, 2015 to November 30, 2015.
Restricted Securities. The Fund may invest in securities that are subject to legal or contractual restrictions on resale. These securities generally may be resold in transactions exempt from registration or to the public if the securities are registered. Disposal of these securities may involve time-consuming negotiations and expense, and prompt sale at an acceptable price may be difficult. Information regarding restricted securities is included at the end of the Fund's Schedule of Investments.
4. Derivative Instruments.
Risk Exposures and the Use of Derivative Instruments. The Fund's investment objective allows the Fund to enter into various types of derivative contracts, including futures contracts. Derivatives are investments whose value is primarily derived from underlying assets, indices or reference rates and may be transacted on an exchange or over-the-counter (OTC). Derivatives may involve a future commitment to buy or sell a specified asset based on specified terms, to exchange future cash flows at periodic intervals based on a notional principal amount, or for one party to make one or more payments upon the occurrence of specified events in exchange for periodic payments from the other party.
The Fund used derivatives to increase returns and to manage exposure to certain risks as defined below. The success of any strategy involving derivatives depends on analysis of numerous economic factors, and if the strategies for investment do not work as intended, the Fund may not achieve its objectives.
The Fund's use of derivatives increased or decreased its exposure to the following risk:
| Equity Risk | Equity risk relates to the fluctuations in the value of financial instruments as a result of changes in market prices (other than those arising from interest rate risk or foreign exchange risk), whether caused by factors specific to an individual investment, its issuer, or all factors affecting all instruments traded in a market or market segment. |
The Fund is also exposed to additional risks from investing in derivatives, such as liquidity risk and counterparty credit risk. Liquidity risk is the risk that the Fund will be unable to close out the derivative in the open market in a timely manner. Counterparty credit risk is the risk that the counterparty will not be able to fulfill its obligation to the Fund. Counterparty credit risk related to exchange-traded futures contracts may be mitigated by the protection provided by the exchange on which they trade.
Investing in derivatives may involve greater risks than investing in the underlying assets directly and, to varying degrees, may involve risk of loss in excess of any initial investment and collateral received and amounts recognized in the Statement of Assets and Liabilities. In addition, there may be the risk that the change in value of the derivative contract does not correspond to the change in value of the underlying instrument.
Futures Contracts. A futures contract is an agreement between two parties to buy or sell a specified underlying instrument for a fixed price at a specified future date. The Fund used futures contracts to manage its exposure to the stock market.
Upon entering into a futures contract, a fund is required to deposit either cash or securities (initial margin) with a clearing broker in an amount equal to a certain percentage of the face value of the contract. Futures contracts are marked-to-market daily and subsequent daily payments (variation margin) are made or received by a fund depending on the daily fluctuations in the value of the futures contracts and are recorded as unrealized appreciation or (depreciation). This receivable and/or payable, if any, is included in daily variation margin for derivative instruments in the Statement of Assets and Liabilities. Realized gain or (loss) is recorded upon the expiration or closing of a futures contract.
Any open futures contracts at period end are presented in the Schedule of Investments under the caption "Futures Contracts". The underlying face amount at value reflects each contract's exposure to the underlying instrument or index at period end and is representative of volume of activity during the period. Securities deposited to meet initial margin requirements are identified in the Schedule of Investments.
During the period the Fund recognized net realized gain (loss) of $(9,056) and a change in net unrealized appreciation (depreciation) of $6,738 related to its investment in futures contracts. These amounts are included in the Statement of Operations.
5. Purchases and Sales of Investments.
Purchases and sales of securities, other than short-term securities, aggregated $924,163 and $1,325,153, respectively.
6. Fees and Other Transactions with Affiliates.
Management Fee. Fidelity Management & Research Company (the investment adviser) and its affiliates provide the Fund with investment management related services for which the Fund pays a monthly management fee. The management fee is the sum of an individual fund fee rate that is based on an annual rate of .45% of the Fund's average net assets and an annualized group fee rate that averaged .25% during the period. The group fee rate is based upon the average net assets of all the mutual funds advised by the investment adviser, including any mutual funds previously advised by the investment adviser that are currently advised by Fidelity SelectCo, LLC, an affiliate of the investment adviser. The group fee rate decreases as assets under management increase and increases as assets under management decrease. In addition, the management fee is subject to a performance adjustment (up to a maximum of +/- .20% of the Fund's average net assets over a 36 month performance period). The upward or downward adjustment to the management fee is based on the relative investment performance of Class I of the Fund as compared to its benchmark index, the Russell 2000 Index, over the same 36 month performance period. For the reporting period, the total annual management fee rate, including the performance adjustment, was .75% of the Fund's average net assets. The performance adjustment included in the management fee rate may be higher or lower than the maximum performance adjustment rate due to the difference between the average net assets for the reporting and performance periods.
Distribution and Service Plan Fees. In accordance with Rule 12b-1 of the 1940 Act, the Fund has adopted separate Distribution and Service Plans for each class of shares. Certain classes pay Fidelity Distributors Corporation (FDC), an affiliate of the investment adviser, separate Distribution and Service Fees, each of which is based on an annual percentage of each class' average net assets. In addition, FDC may pay financial intermediaries for selling shares of the Fund and providing shareholder support services. For the period, the Distribution and Service Fee rates, total fees and amounts retained by FDC were as follows:
| Distribution Fee | Service Fee | Total Fees | Retained by FDC | |
| Class A | -% | .25% | $2,694 | $12 |
| Class T | .25% | .25% | 4,668 | - |
| Class B | .75% | .25% | 269 | 202 |
| Class C | .75% | .25% | 3,221 | 196 |
| $10,852 | $410 |
Sales Load. FDC may receive a front-end sales charge of up to 5.75% for selling Class A shares and 3.50% for selling Class T shares, some of which is paid to financial intermediaries for selling shares of the Fund. Depending on the holding period, FDC may receive contingent deferred sales charges levied on Class A, Class T, Class B, and Class C redemptions. The deferred sales charges range from 5.00% to 1.00% for Class B shares, 1.00% for Class C shares, 1.00% for certain purchases of Class A shares and .25% for certain purchases of Class T shares.
For the period, sales charge amounts retained by FDC were as follows:
| Retained by FDC | |
| Class A | $174 |
| Class T | 29 |
| Class B(a) | 9 |
| Class C(a) | 16 |
| $228 |
(a) When Class B and Class C shares are initially sold, FDC pays commissions from its own resources to financial intermediaries through which the sales are made.
Transfer Agent Fees. Fidelity Investments Institutional Operations Company, Inc., (FIIOC), an affiliate of the investment adviser, is the transfer, dividend disbursing and shareholder servicing agent for each class of the Fund. FIIOC receives account fees and asset-based fees that vary according to the account size and type of account of the shareholders of the respective classes of the Fund, except for Class Z. FIIOC receives an asset-based fee of Class Z's average net assets. FIIOC pays for typesetting, printing and mailing of shareholder reports, except proxy statements.
For the period, transfer agent fees for each class were as follows:
| Amount | % of Class-Level Average Net Assets | |
| Class A | $2,307 | .21 |
| Class T | 1,826 | .20 |
| Class B | 72 | .27 |
| Class C | 718 | .22 |
| Class I | 1,291 | .20 |
| Class Z | 19 | .05 |
| $6,233 |
Accounting and Security Lending Fees. Fidelity Service Company, Inc. (FSC), an affiliate of the investment adviser, maintains the Fund's accounting records. The accounting fee is based on the level of average net assets for each month. Under a separate contract, FSC administers the security lending program. The security lending fee is based on the number and duration of lending transactions.
Brokerage Commissions. The Fund placed a portion of its portfolio transactions with brokerage firms which are affiliates of the investment adviser. Brokerage commissions are included in net realized gain (loss) and change in net unrealized appreciation (depreciation) in the Statement of Operations. The commissions paid to these affiliated firms were $35 for the period.
Other. During the period, the investment adviser reimbursed the Fund for certain losses in the amount of $3.
7. Committed Line of Credit.
The Fund participates with other funds managed by the investment adviser or an affiliate in a $4.25 billion credit facility (the "line of credit") to be utilized for temporary or emergency purposes to fund shareholder redemptions or for other short-term liquidity purposes. The Fund has agreed to pay commitment fees on its pro-rata portion of the line of credit, which amounted to $4 and is reflected in Miscellaneous expenses on the Statement of Operations. During the period, the Fund did not borrow on this line of credit.
8. Security Lending.
The Fund lends portfolio securities through a lending agent from time to time in order to earn additional income. For equity securities, a lending agent is used and may loan securities to certain qualified borrowers, including Fidelity Capital Markets (FCM), a broker-dealer affiliated with the Fund. On the settlement date of the loan, the Fund receives collateral (in the form of U.S. Treasury obligations, letters of credit and/or cash) against the loaned securities and maintains collateral in an amount not less than 100% of the market value of the loaned securities during the period of the loan. The market value of the loaned securities is determined at the close of business of the Fund and any additional required collateral is delivered to the Fund on the next business day. The Fund or borrower may terminate the loan at any time, and if the borrower defaults on its obligation to return the securities loaned because of insolvency or other reasons, the Fund may apply collateral received from the borrower against the obligation. The Fund may experience delays and costs in recovering the securities loaned. Any cash collateral received is invested in the Fidelity Securities Lending Cash Central Fund. The value of loaned securities and cash collateral at period end are disclosed on the Fund's Statement of Assets and Liabilities. The value of securities loaned to FCM at period end was $17,865. Security lending income represents the income earned on investing cash collateral, less rebates paid to borrowers and any lending agent fees associated with the loan, plus any premium payments received for lending certain types of securities. Security lending income is presented in the Statement of Operations as a component of income from Fidelity Central Funds. Total security lending income during the period amounted to $292, including $4 from securities loaned to FCM.
9. Expense Reductions.
Commissions paid to certain brokers with whom the investment adviser, or its affiliates, places trades on behalf of the Fund include an amount in addition to trade execution, which may be rebated back to the Fund to offset certain expenses. This amount totaled $70 for the period.
In addition, during the period the investment adviser reimbursed and/or waived a portion of fund-level operating expenses in the amount of $13 and a portion of class-level operating expenses as follows:
| Amount | |
| Class A | $26 |
| Class T | 23 |
| Class B | 1 |
| Class C | 7 |
| Class I | 17 |
| $74 |
10. Distributions to Shareholders.
Distributions to shareholders of each class were as follows:
| Years ended November 30, | 2015 | 2014 |
| From net investment income | ||
| Class A | $–(a) | $284 |
| Class I | 1,619 | 1,305 |
| Class Z | 82 | 22 |
| Total | $1,701 | $1,611 |
| From net realized gain | ||
| Class A | $123,666�� | $142,771 |
| Class T | 113,567 | 131,371 |
| Class B | 4,225 | 5,267 |
| Class C | 42,961 | 43,783 |
| Class I | 67,403 | 76,492 |
| Class Z | 2,116 | 504 |
| Total | $353,938 | $400,188 |
(a) In the amount of less than five hundred dollars.
11. Share Transactions.
Share transactions for each class were as follows and may contain automatic conversions between classes or exchanges between funds:
| Shares | Shares | Dollars | Dollars | |
| Years ended November 30, | 2015 | 2014 | 2015 | 2014 |
| Class A | ||||
| Shares sold | 7,266 | 5,882 | $201,961 | $166,699 |
| Reinvestment of distributions | 4,474 | 4,985 | 119,319 | 134,212 |
| Shares redeemed | (10,527) | (14,908) | (292,656) | (422,262) |
| Net increase (decrease) | 1,213 | (4,041) | $28,624 | $(121,351) |
| Class T | ||||
| Shares sold | 6,096 | 5,277 | $160,232 | $141,817 |
| Reinvestment of distributions | 4,384 | 4,931 | 110,516 | 126,640 |
| Shares redeemed | (10,046) | (13,972) | (263,505) | (376,684) |
| Net increase (decrease) | 434 | (3,764) | $7,243 | $(108,227) |
| Class B | ||||
| Shares sold | 21 | 13 | $461 | $288 |
| Reinvestment of distributions | 189 | 220 | 4,069 | 4,958 |
| Shares redeemed | (510) | (484) | (11,385) | (11,378) |
| Net increase (decrease) | (300) | (251) | $(6,855) | $(6,132) |
| Class C | ||||
| Shares sold | 1,967 | 1,271 | $44,618 | $30,236 |
| Reinvestment of distributions | 1,812 | 1,754 | 39,668 | 40,042 |
| Shares redeemed | (2,262) | (2,841) | (51,403) | (67,748) |
| Net increase (decrease) | 1,517 | 184 | $32,883 | $2,530 |
| Class I | ||||
| Shares sold | 8,618 | 5,735 | $256,826 | $172,958 |
| Reinvestment of distributions | 2,131 | 2,348 | 60,822 | 67,135 |
| Shares redeemed | (6,687) | (10,306) | (197,913) | (308,759) |
| Net increase (decrease) | 4,062 | (2,223) | $119,735 | $(68,666) |
| Class Z | ||||
| Shares sold | 1,152 | 611 | $33,575 | $18,714 |
| Reinvestment of distributions | 77 | 18 | 2,198 | 526 |
| Shares redeemed | (454) | (159) | (13,089) | (4,829) |
| Net increase (decrease) | 775 | 470 | $22,684 | $14,411 |
12. Other.
The Fund's organizational documents provide former and current trustees and officers with a limited indemnification against liabilities arising in connection with the performance of their duties to the Fund. In the normal course of business, the Fund may also enter into contracts that provide general indemnifications. The Fund's maximum exposure under these arrangements is unknown as this would be dependent on future claims that may be made against the Fund. The risk of material loss from such claims is considered remote.
Report of Independent Registered Public Accounting Firm
To the Trustees of Fidelity Advisor Series I and Shareholders of Fidelity Advisor® Small Cap Fund:
In our opinion, the accompanying statement of assets and liabilities, including the schedule of investments, and the related statements of operations and of changes in net assets and the financial highlights present fairly, in all material respects, the financial position of Fidelity Advisor® Small Cap Fund (a fund of Fidelity Advisor Series I) at November 30, 2015, the results of its operations for the year then ended, the changes in its net assets for each of the two years in the period then ended and the financial highlights for each of the periods indicated, in conformity with accounting principles generally accepted in the United States of America. These financial statements and financial highlights (hereafter referred to as “financial statements”) are the responsibility of the Fidelity Advisor® Small Cap Fund’s management. Our responsibility is to express an opinion on these financial statements based on our audits. We conducted our audits of these financial statements in accordance with the standards of the Public Company Accounting Oversight Board (United States). Those standards require that we plan and perform the audit to obtain reasonable assurance about whether the financial statements are free of material misstatement. An audit includes examining, on a test basis, evidence supporting the amounts and disclosures in the financial statements, assessing the accounting principles used and significant estimates made by management, and evaluating the overall financial statement presentation. We believe that our audits, which included confirmation of securities at November 30, 2015 by correspondence with the custodian and brokers, provide a reasonable basis for our opinion.
PricewaterhouseCoopers LLP
Boston, Massachusetts
January 15, 2016
Trustees and Officers
The Trustees, Members of the Advisory Board (if any), and officers of the trust and fund, as applicable, are listed below. The Board of Trustees governs the fund and is responsible for protecting the interests of shareholders. The Trustees are experienced executives who meet periodically throughout the year to oversee the fund's activities, review contractual arrangements with companies that provide services to the fund, oversee management of the risks associated with such activities and contractual arrangements, and review the fund's performance. Each of the Trustees oversees 170 funds.
The Trustees hold office without limit in time except that (a) any Trustee may resign; (b) any Trustee may be removed by written instrument, signed by at least two-thirds of the number of Trustees prior to such removal; (c) any Trustee who requests to be retired or who has become incapacitated by illness or injury may be retired by written instrument signed by a majority of the other Trustees; and (d) any Trustee may be removed at any special meeting of shareholders by a two-thirds vote of the outstanding voting securities of the trust. Each Trustee who is not an interested person (as defined in the 1940 Act) of the trust and the fund is referred to herein as an Independent Trustee. Each Independent Trustee shall retire not later than the last day of the calendar year in which his or her 75th birthday occurs. The Independent Trustees may waive this mandatory retirement age policy with respect to individual Trustees. Officers and Advisory Board Members hold office without limit in time, except that any officer or Advisory Board Member may resign or may be removed by a vote of a majority of the Trustees at any regular meeting or any special meeting of the Trustees. Except as indicated, each individual has held the office shown or other offices in the same company for the past five years.
The fund’s Statement of Additional Information (SAI) includes more information about the Trustees. To request a free copy, call Fidelity at 1-877-208-0098.
Experience, Skills, Attributes, and Qualifications of the Trustees. The Governance and Nominating Committee has adopted a statement of policy that describes the experience, qualifications, attributes, and skills that are necessary and desirable for potential Independent Trustee candidates (Statement of Policy). The Board believes that each Trustee satisfied at the time he or she was initially elected or appointed a Trustee, and continues to satisfy, the standards contemplated by the Statement of Policy. The Governance and Nominating Committee also engages professional search firms to help identify potential Independent Trustee candidates who have the experience, qualifications, attributes, and skills consistent with the Statement of Policy. From time to time, additional criteria based on the composition and skills of the current Independent Trustees, as well as experience or skills that may be appropriate in light of future changes to board composition, business conditions, and regulatory or other developments, have also been considered by the professional search firms and the Governance and Nominating Committee. In addition, the Board takes into account the Trustees' commitment and participation in Board and committee meetings, as well as their leadership of standing and ad hoc committees throughout their tenure.
In determining that a particular Trustee was and continues to be qualified to serve as a Trustee, the Board has considered a variety of criteria, none of which, in isolation, was controlling. The Board believes that, collectively, the Trustees have balanced and diverse experience, qualifications, attributes, and skills, which allow the Board to operate effectively in governing the fund and protecting the interests of shareholders. Information about the specific experience, skills, attributes, and qualifications of each Trustee, which in each case led to the Board's conclusion that the Trustee should serve (or continue to serve) as a trustee of the fund, is provided below.
Board Structure and Oversight Function. James C. Curvey is an interested person and currently serves as Chairman. The Trustees have determined that an interested Chairman is appropriate and benefits shareholders because an interested Chairman has a personal and professional stake in the quality and continuity of services provided to the fund. Independent Trustees exercise their informed business judgment to appoint an individual of their choosing to serve as Chairman, regardless of whether the Trustee happens to be independent or a member of management. The Independent Trustees have determined that they can act independently and effectively without having an Independent Trustee serve as Chairman and that a key structural component for assuring that they are in a position to do so is for the Independent Trustees to constitute a substantial majority for the Board. The Independent Trustees also regularly meet in executive session. Ned C. Lautenbach serves as Chairman of the Independent Trustees and as such (i) acts as a liaison between the Independent Trustees and management with respect to matters important to the Independent Trustees and (ii) with management prepares agendas for Board meetings.
Fidelity® funds are overseen by different Boards of Trustees. The fund's Board oversees Fidelity's high income and certain equity funds, and other Boards oversee Fidelity's investment-grade bond, money market, asset allocation, and sector funds. The asset allocation funds may invest in Fidelity® funds overseen by the fund's Board. The use of separate Boards, each with its own committee structure, allows the Trustees of each group of Fidelity® funds to focus on the unique issues of the funds they oversee, including common research, investment, and operational issues. On occasion, the separate Boards establish joint committees to address issues of overlapping consequences for the Fidelity® funds overseen by each Board.
The Trustees operate using a system of committees to facilitate the timely and efficient consideration of all matters of importance to the Trustees, the fund, and fund shareholders and to facilitate compliance with legal and regulatory requirements and oversight of the fund's activities and associated risks. The Board, acting through its committees, has charged FMR and its affiliates with (i) identifying events or circumstances the occurrence of which could have demonstrably adverse effects on the fund's business and/or reputation; (ii) implementing processes and controls to lessen the possibility that such events or circumstances occur or to mitigate the effects of such events or circumstances if they do occur; and (iii) creating and maintaining a system designed to evaluate continuously business and market conditions in order to facilitate the identification and implementation processes described in (i) and (ii) above. Because the day-to-day operations and activities of the fund are carried out by or through FMR, its affiliates, and other service providers, the fund's exposure to risks is mitigated but not eliminated by the processes overseen by the Trustees. While each of the Board's committees has responsibility for overseeing different aspects of the fund's activities, oversight is exercised primarily through the Operations, Audit, and Compliance Committees. In addition, the Independent Trustees have worked with FMR to enhance the Board's oversight of investment and financial risks, legal and regulatory risks, technology risks, and operational risks, including the development of additional risk reporting to the Board. For example, a working group comprised of Independent Trustees and FMR has worked and continues to work to review the Fidelity® funds' valuation-related activities, reporting and risk management. Appropriate personnel, including but not limited to the fund's Chief Compliance Officer (CCO), FMR's internal auditor, the independent accountants, the fund's Treasurer and portfolio management personnel, make periodic reports to the Board's committees, as appropriate, including an annual review of Fidelity's risk management program for the Fidelity® funds. The responsibilities of each standing committee, including their oversight responsibilities, are described further under "Standing Committees of the Trustees."
Interested Trustees*:
Correspondence intended for a Trustee who is an interested person may be sent to Fidelity Investments, 245 Summer Street, Boston, Massachusetts 02210.
Name, Year of Birth; Principal Occupations and Other Relevant Experience+
James C. Curvey (1935)
Year of Election or Appointment: 2007
Trustee
Chairman of the Board of Trustees
Mr. Curvey also serves as Trustee of other Fidelity® funds. Mr. Curvey is a Director of Fidelity Research & Analysis Co. (investment adviser firm, 2009-present), and Vice Chairman (2007-present) and Director of FMR LLC (diversified financial services company). In addition, Mr. Curvey serves as an Overseer for the Boston Symphony Orchestra and a member of the board of Artis-Naples, Naples, Florida, and as a Trustee for Brewster Academy, Wolfeboro, New Hampshire. Previously, Mr. Curvey served as a Director of Fidelity Investments Money Management, Inc. (investment adviser firm, 2009-2014) and a Director of FMR and FMR Co., Inc. (investment adviser firms, 2007-2014).
Charles S. Morrison (1960)
Year of Election or Appointment: 2014
Trustee
Mr. Morrison also serves as Trustee of other funds. He serves as a Director of Fidelity Investments Money Management, Inc. (FIMM) (investment adviser firm, 2014-present), Director of Fidelity SelectCo, LLC (investment adviser firm, 2014-present), President, Asset Management (2014-present), and is an employee of Fidelity Investments. Previously, Mr. Morrison served as Vice President of Fidelity's Fixed Income and Asset Allocation Funds (2012-2014), President, Fixed Income (2011-2014), Vice President of Fidelity's Money Market Funds (2005-2009), President, Money Market Group Leader of FMR (investment adviser firm, 2009), and Senior Vice President, Money Market Group of FMR (2004-2009). Mr. Morrison also served as Vice President of Fidelity's Bond Funds (2002-2005), certain Balanced Funds (2002-2005), and certain Asset Allocation Funds (2002-2007), and as Senior Vice President (2002-2005) of Fidelity's Bond Division.
* Determined to be an “Interested Trustee” by virtue of, among other things, his or her affiliation with the trust or various entities under common control with FMR.
+ The information includes the Trustee's principal occupation during the last five years and other information relating to the experience, attributes, and skills relevant to the Trustee's qualifications to serve as a Trustee, which led to the conclusion that the Trustee should serve as a Trustee for the fund.
Independent Trustees:
Correspondence intended for an Independent Trustee may be sent to Fidelity Investments, P.O. Box 55235, Boston, Massachusetts 02205-5235.
Name, Year of Birth; Principal Occupations and Other Relevant Experience+
Dennis J. Dirks (1948)
Year of Election or Appointment: 2005
Trustee
Mr. Dirks also serves as Trustee of other Fidelity® funds. Prior to his retirement in May 2003, Mr. Dirks was Chief Operating Officer and a member of the Board of The Depository Trust & Clearing Corporation (DTCC). He also served as President, Chief Operating Officer, and Board member of The Depository Trust Company (DTC) and President and Board member of the National Securities Clearing Corporation (NSCC). In addition, Mr. Dirks served as Chief Executive Officer and Board member of the Government Securities Clearing Corporation, Chief Executive Officer and Board member of the Mortgage-Backed Securities Clearing Corporation, as a Trustee and a member of the Finance Committee of Manhattan College (2005-2008), as a Trustee and a member of the Finance Committee of AHRC of Nassau County (2006-2008), and as a member of the Independent Directors Council (IDC) Governing Council (2010-2015). Mr. Dirks is a member of the Board of Directors for The Brookville Center for Children's Services, Inc. (2009-present).
Alan J. Lacy (1953)
Year of Election or Appointment: 2008
Trustee
Mr. Lacy also serves as Trustee of other Fidelity® funds. Mr. Lacy serves as a member of the Board of Directors of Dave & Buster's Entertainment, Inc. (restaurant and entertainment complexes, 2010-present) and Bristol-Myers Squibb Company (global pharmaceuticals, 2008-present). In addition, Mr. Lacy served as Senior Adviser (2007-2014) of Oak Hill Capital Partners, L.P. (private equity) and also served as Chief Executive Officer (2000-2005) and Vice Chairman (2005-2006) of Sears Holdings Corporation and Sears, Roebuck and Co. (retail). Mr. Lacy is a member of the Board of Trustees of The National Parks Conservation Association (2006-present). Previously, Mr. Lacy served as Chairman of the Board of Trustees of the National Parks Conservation Association (2008-2011) and as a member of the Board of Directors for The Western Union Company (global money transfer, 2006-2011), The Hillman Companies, Inc. (hardware wholesalers, 2010-2014), and Earth Fare, Inc. (retail grocery, 2010-2014).
Ned C. Lautenbach (1944)
Year of Election or Appointment: 2000
Trustee
Chairman of the Independent Trustees
Mr. Lautenbach also serves as Trustee of other Fidelity® funds. Mr. Lautenbach currently serves as the Lead Director of the Eaton Corporation Board of Directors (diversified industrial, 1997-present). Mr. Lautenbach is Chairman of the Board of Directors of Artis-Naples in Naples, Florida (2012-present), a member of the Council on Foreign Relations (1994-present), and a member of the Board of Governors, State University System of Florida (2013-present). Previously, Mr. Lautenbach was a Partner/Advisory Partner at Clayton, Dubilier & Rice, LLC (private equity investment, 1998-2010), as well as a Director of Sony Corporation (2006-2007).
Joseph Mauriello (1944)
Year of Election or Appointment: 2008
Trustee
Mr. Mauriello also serves as Trustee of other Fidelity® funds. Prior to his retirement in January 2006, Mr. Mauriello served in numerous senior management positions including Deputy Chairman and Chief Operating Officer (2004-2005), and Vice Chairman of Financial Services (2002-2004) of KPMG LLP US (professional services, 1965-2005). Mr. Mauriello currently serves as a member of the Board of Directors of XL Group plc. (global insurance and re-insurance, 2006-present) and the Independent Directors Council (IDC) Governing Council (2015-present). Previously, Mr. Mauriello served as a Director of the Hamilton Funds of the Bank of New York (2006-2007) and of Arcadia Resources Inc. (health care services and products, 2007-2012).
Robert W. Selander (1950)
Year of Election or Appointment: 2011
Trustee
Mr. Selander also serves as Trustee of other Fidelity® funds. Mr. Selander serves as a Director of The Western Union Company (global money transfer, 2014-present). Previously, Mr. Selander served as a Member of the Advisory Board of other Fidelity® funds (2011), and Executive Vice Chairman (2010), Chief Executive Officer (2009-2010), and President and Chief Executive Officer (1997-2009) of Mastercard, Inc.
Cornelia M. Small (1944)
Year of Election or Appointment: 2005
Trustee
Ms. Small also serves as Trustee of other Fidelity® funds. Ms. Small is a member of the Board of Directors (2009-present) and Chair of the Investment Committee (2010-present) of the Teagle Foundation. Ms. Small also serves on the Investment Committee of the Berkshire Taconic Community Foundation (2008-present). Previously, Ms. Small served as Chairperson (2002-2008) and a member of the Investment Committee and Chairperson (2008-2012) and a member of the Board of Trustees of Smith College. In addition, Ms. Small served as Chief Investment Officer, Director of Global Equity Investments, and a member of the Board of Directors of Scudder, Stevens & Clark and Scudder Kemper Investments.
William S. Stavropoulos (1939)
Year of Election or Appointment: 2002
Trustee
Vice Chairman of the Independent Trustees
Mr. Stavropoulos also serves as Trustee of other Fidelity® funds. Mr. Stavropoulos serves as President and Founder of the Michigan Baseball Foundation, the Great Lakes Loons (2007-present). Mr. Stavropoulos is Chairman Emeritus of the Board of Directors of The Dow Chemical Company, where he previously served in numerous senior management positions, including President, CEO (1995-2000; 2002-2004), Chairman of the Executive Committee (2000-2006), and as a member of the Board of Directors (1990-2006). Currently, Mr. Stavropoulos is Chairman of the Board of Directors of Univar Inc. (global distributor of commodity and specialty chemicals), a Director of Teradata Corporation (data warehousing and technology solutions), and Maersk Inc. (industrial conglomerate), and a member of the Advisory Board for Metalmark Capital LLC (private equity investment, 2005-present). Mr. Stavropoulos is an operating advisor to Clayton, Dubilier & Rice, LLC (private equity investment). In addition, Mr. Stavropoulos is a member of the University of Notre Dame Advisory Council for the College of Science, a Trustee of the Rollin L. Gerstacker Foundation, and a Director of the Naples Philharmonic Center for the Arts. Previously, Mr. Stavropoulos served as a Director of Chemical Financial Corporation (bank holding company, 1993-2012) and Tyco International, Ltd. (multinational manufacturing and services, 2007-2012).
David M. Thomas (1949)
Year of Election or Appointment: 2008
Trustee
Mr. Thomas also serves as Trustee of other Fidelity® funds. Mr. Thomas serves as Non-Executive Chairman of the Board of Directors of Fortune Brands Home and Security (home and security products, 2011-present), as a member of the Board of Directors (2004-present) and Presiding Director (2013-present) of Interpublic Group of Companies, Inc. (marketing communication), and as a member of the Board of Trustees of the University of Florida (2013-present). Previously, Mr. Thomas served as Executive Chairman (2005-2006) and Chairman and Chief Executive Officer (2000-2005) of IMS Health, Inc. (pharmaceutical and healthcare information solutions), and a Director of Fortune Brands, Inc. (consumer products, 2000-2011).
+ The information includes the Trustee's principal occupation during the last five years and other information relating to the experience, attributes, and skills relevant to the Trustee's qualifications to serve as a Trustee, which led to the conclusion that the Trustee should serve as a Trustee for the fund.
Advisory Board Members and Officers:
Correspondence intended for an officer or Peter S. Lynch may be sent to Fidelity Investments, 245 Summer Street, Boston, Massachusetts 02210. Officers appear below in alphabetical order.
Name, Year of Birth; Principal Occupation
Peter S. Lynch (1944)
Year of Election or Appointment: 2003
Member of the Advisory Board
Mr. Lynch also serves as Member of the Advisory Board of other Fidelity® funds. Mr. Lynch is Vice Chairman and a Director of FMR (investment adviser firm) and FMR Co., Inc. (investment adviser firm). In addition, Mr. Lynch serves as a Trustee of Boston College and as the Chairman of the Inner-City Scholarship Fund. Previously, Mr. Lynch served on the Special Olympics International Board of Directors (1997-2006).
Elizabeth Paige Baumann (1968)
Year of Election or Appointment: 2012
Anti-Money Laundering (AML) Officer
Ms. Baumann also serves as AML Officer of other funds. She is Chief AML Officer of FMR LLC (diversified financial services company, 2012-present) and is an employee of Fidelity Investments. Previously, Ms. Baumann served as Vice President and Deputy Anti-Money Laundering Officer (2007-2012).
Marc R. Bryant (1966)
Year of Election or Appointment: 2015
Secretary and Chief Legal Officer (CLO)
Mr. Bryant also serves as Secretary and CLO of other funds. Mr. Bryant serves as CLO, Secretary, and Senior Vice President of Fidelity Management & Research Company (investment adviser firm, 2015-present) and FMR Co., Inc. (investment adviser firm, 2015-present); Secretary of Fidelity SelectCo, LLC (investment adviser firm, 2015-present) and Fidelity Investments Money Management, Inc. (investment adviser firm, 2015-present); and CLO of Fidelity Management & Research (Hong Kong) Limited (investment adviser firm, 2015-present). He is Senior Vice President and Deputy General Counsel of FMR LLC (diversified financial services company). Previously, Mr. Bryant served as Secretary and CLO of Fidelity Rutland Square Trust II (2010-2014) and Assistant Secretary of Fidelity's Fixed Income and Asset Allocation Funds (2013-2015). Prior to joining Fidelity Investments, Mr. Bryant served as a Senior Vice President and the Head of Global Retail Legal for AllianceBernstein L.P. (2006-2010), and as the General Counsel for ProFund Advisors LLC (2001-2006).
William C. Coffey (1969)
Year of Election or Appointment: 2009
Assistant Secretary
Mr. Coffey also serves as Assistant Secretary of other funds. He is Senior Vice President and Deputy General Counsel of FMR LLC (diversified financial services company, 2010-present), and is an employee of Fidelity Investments. Previously, Mr. Coffey served as Vice President and Associate General Counsel of FMR LLC (2005-2009).
Jonathan Davis (1968)
Year of Election or Appointment: 2010
Assistant Treasurer
Mr. Davis also serves as Assistant Treasurer of other funds, and is an employee of Fidelity Investments. Previously, Mr. Davis served as Vice President and Associate General Counsel of FMR LLC (diversified financial services company, 2003-2010).
Adrien E. Deberghes (1967)
Year of Election or Appointment: 2008
Deputy Treasurer
Mr. Deberghes also serves as an officer of other funds. He is an employee of Fidelity Investments (2008-present). Prior to joining Fidelity Investments, Mr. Deberghes was Senior Vice President of Mutual Fund Administration at State Street Corporation (2007-2008), Senior Director of Mutual Fund Administration at Investors Bank & Trust (2005-2007), and Director of Finance for Dunkin' Brands (2000-2005).
Stephanie J. Dorsey (1969)
Year of Election or Appointment: 2010
Assistant Treasurer
Ms. Dorsey also serves as an officer of other funds. She is an employee of Fidelity Investments (2008-present) and has served in other fund officer roles. Prior to joining Fidelity Investments, Ms. Dorsey served as Treasurer (2004-2008) of the JPMorgan Mutual Funds and Vice President (2004-2008) of JPMorgan Chase Bank.
Howard J. Galligan III (1966)
Year of Election or Appointment: 2014
Chief Financial Officer
Mr. Galligan also serves as Chief Financial Officer of other funds. Mr. Galligan serves as President of Fidelity Pricing and Cash Management Services (FPCMS) (2014-present) and as a Director of Strategic Advisers, Inc. (investment adviser firm, 2008-present). Previously, Mr. Galligan served as Chief Administrative Officer of Asset Management (2011-2014) and Chief Operating Officer and Senior Vice President of Investment Support for Strategic Advisers, Inc. (2003-2011).
Scott C. Goebel (1968)
Year of Election or Appointment: 2015
Vice President
Mr. Goebel serves as Vice President of other funds and is an employee of Fidelity Investments (2001-present). Previously, Mr. Goebel served as Secretary of Fidelity SelectCo, LLC (investment adviser firm, 2013-2015), Fidelity Investments Money Management, Inc. (FIMM) (investment adviser firm, 2010-2015), and Fidelity Research and Analysis Company (FRAC) (investment adviser firm, 2010-2015); General Counsel, Secretary, and Senior Vice President of Fidelity Management & Research Company (investment adviser firm, 2008-2015) and FMR Co., Inc. (investment adviser firm, 2008-2015); Assistant Secretary of Fidelity Management & Research (Japan) Limited (investment adviser firm, 2008-2015) and FMR Investment Management (U.K.) Limited (investment adviser firm, 2008-2015); Chief Legal Officer (CLO) of Fidelity Management & Research (Hong Kong) Limited (investment adviser firm, 2008-2015); Secretary and CLO of certain Fidelity® funds (2008-2015); Assistant Secretary of FIMM (2008-2010), FRAC (2008-2010), and certain funds (2007-2008); and as Vice President and Secretary of Fidelity Distributors Corporation (FDC) (2005-2007).
Thomas C. Hense (1964)
Year of Election or Appointment: 2008, 2010, or 2015
Vice President
Mr. Hense serves as Vice President of Fidelity Advisor® Multi-Asset Income Fund (2015) and other funds (High Income (2008), Small Cap (2008), and Value (2010) funds), and is an employee of Fidelity Investments (1993-present). Previously, Mr. Hense served as a portfolio manager for Fidelity's Institutional Money Management Group (Pyramis) (2003-2008).
Brian B. Hogan (1964)
Year of Election or Appointment: 2009
Vice President
Mr. Hogan also serves as Trustee or Vice President of other funds. Mr. Hogan serves as a Director of Fidelity SelectCo, LLC (investment adviser firm, 2014-present) and President of the Equity Division of FMR (investment adviser firm, 2009-present). Previously, Mr. Hogan served as Senior Vice President, Equity Research of FMR (2006-2009) and as a portfolio manager.
Chris Maher (1972)
Year of Election or Appointment: 2013
Assistant Treasurer
Mr. Maher serves as Assistant Treasurer of other funds. Mr. Maher is Vice President of Valuation Oversight and is an employee of Fidelity Investments. Previously, Mr. Maher served as Vice President of Asset Management Compliance (2013), Vice President of the Program Management Group of FMR (investment adviser firm, 2010-2013), and Vice President of Valuation Oversight (2008-2010).
Kenneth B. Robins (1969)
Year of Election or Appointment: 2008
President and Treasurer
Mr. Robins also serves as an officer of other funds. Mr. Robins serves as Executive Vice President of Fidelity Investments Money Management, Inc. (FIMM) (investment adviser firm, 2013-present) and is an employee of Fidelity Investments (2004-present). Previously, Mr. Robins served in other fund officer roles.
Stacie M. Smith (1974)
Year of Election or Appointment: 2013
Deputy Treasurer
Ms. Smith also serves as an officer of other funds. She is an employee of Fidelity Investments (2009-present) and has served in other fund officer roles. Prior to joining Fidelity Investments, Ms. Smith served as Senior Audit Manager of Ernst & Young LLP (1996-2009).
Renee Stagnone (1975)
Year of Election or Appointment: 2013
Deputy Treasurer
Ms. Stagnone also serves as Deputy Treasurer of other funds. Ms. Stagnone is an employee of Fidelity Investments (1997-present).
Linda J. Wondrack (1964)
Year of Election or Appointment: 2014
Chief Compliance Officer
Ms. Wondrack also serves as Chief Compliance Officer of other funds. Ms. Wondrack is Executive Vice President and head of the Ethics Office and Asset Management Compliance for Fidelity Investments (2012-present). Ms. Wondrack also serves as Chief Compliance Officer of Fidelity SelectCo, LLC (investment adviser firm, 2014-present); Chief Compliance Officer of Impresa Management LLC (2013-present); and Chief Compliance Officer of FMR Co., Inc. (investment adviser firm), Fidelity Investments Money Management, Inc. (investment adviser firm), Fidelity Management & Research (Japan) Limited (investment adviser firm), FMR Investment Management (U.K.) Limited (investment adviser firm), Fidelity Management & Research (Hong Kong) (investment adviser firm), Fidelity Management & Research Company (investment adviser firm), FIAM LLC (investment adviser firm), and Strategic Advisers, Inc. (investment adviser firm), Ballyrock Investment Advisors LLC, and Northern Neck Investors LLC (2012-present). Previously, Ms. Wondrack served as Senior Vice President and Chief Compliance Officer for Columbia Management Investment Advisers, LLC (2005-2012); Chief Compliance Officer for certain funds within the Columbia Family of Funds (2007-2012); and Senior Vice President of Compliance Risk Management at Bank of America (2005-2010).
Joseph F. Zambello (1957)
Year of Election or Appointment: 2011
Deputy Treasurer
Mr. Zambello also serves as Deputy Treasurer of other funds. Mr. Zambello is an employee of Fidelity Investments (1991-present). Previously, Mr. Zambello served as Vice President of the Program Management Group of FMR (investment adviser firm, 2009-2011) and Vice President of the Transfer Agent Oversight Group (2005-2009).
Shareholder Expense Example
As a shareholder of the Fund, you incur two types of costs: (1) transaction costs, including sales charges (loads) on purchase payments or redemption proceeds, and (2) ongoing costs, including management fees, distribution and/or service (12b-1) fees and other Fund expenses. This Example is intended to help you understand your ongoing costs (in dollars) of investing in the Fund and to compare these costs with the ongoing costs of investing in other mutual funds.
The Example is based on an investment of $1,000 invested at the beginning of the period and held for the entire period (June 1, 2015 to November 30, 2015).
Actual Expenses
The first line of the accompanying table for each class of the Fund provides information about actual account values and actual expenses. You may use the information in this line, together with the amount you invested, to estimate the expenses that you paid over the period. Simply divide your account value by $1,000.00 (for example, an $8,600 account value divided by $1,000.00 = 8.6), then multiply the result by the number in the first line for a class of the Fund under the heading entitled "Expenses Paid During Period" to estimate the expenses you paid on your account during this period. In addition, the Fund, as a shareholder in the underlying Fidelity Central Funds, will indirectly bear its pro-rata share of the fees and expenses incurred by the underlying Fidelity Central Funds. These fees and expenses are not included in the Fund's annualized expense ratio used to calculate the expense estimate in the table below.
Hypothetical Example for Comparison Purposes
The second line of the accompanying table for each class of the Fund provides information about hypothetical account values and hypothetical expenses based on a Class' actual expense ratio and an assumed rate of return of 5% per year before expenses, which is not the Class' actual return. The hypothetical account values and expenses may not be used to estimate the actual ending account balance or expenses you paid for the period. You may use this information to compare the ongoing costs of investing in the Fund and other funds. To do so, compare this 5% hypothetical example with the 5% hypothetical examples that appear in the shareholder reports of the other funds. In addition, the Fund, as a shareholder in the underlying Fidelity Central Funds, will indirectly bear its pro-rata share of the fees and expenses incurred by the underlying Fidelity Central Funds. These fees and expenses are not included in the Fund's annualized expense ratio used to calculate the expense estimate in the table below.
Please note that the expenses shown in the table are meant to highlight your ongoing costs only and do not reflect any transaction costs. Therefore, the second line of the table is useful in comparing ongoing costs only, and will not help you determine the relative total costs of owning different funds. In addition, if these transactional costs were included, your costs would have been higher.
| Annualized Expense Ratio-A | Beginning Account Value June 1, 2015 | Ending Account Value November 30, 2015 | Expenses Paid During Period-B June 1, 2015 to November 30, 2015 | |
| Class A | 1.41% | |||
| Actual | $1,000.00 | $964.60 | $6.94 | |
| Hypothetical-C | $1,000.00 | $1,018.00 | $7.13 | |
| Class T | 1.64% | |||
| Actual | $1,000.00 | $963.70 | $8.07 | |
| Hypothetical-C | $1,000.00 | $1,016.85 | $8.29 | |
| Class B | 2.24% | |||
| Actual | $1,000.00 | $961.20 | $11.01 | |
| Hypothetical-C | $1,000.00 | $1,013.84 | $11.31 | |
| Class C | 2.16% | |||
| Actual | $1,000.00 | $961.40 | $10.62 | |
| Hypothetical-C | $1,000.00 | $1,014.24 | $10.91 | |
| Class I | 1.13% | |||
| Actual | $1,000.00 | $966.00 | $5.57 | |
| Hypothetical-C | $1,000.00 | $1,019.40 | $5.72 | |
| Class Z | .97% | |||
| Actual | $1,000.00 | $966.90 | $4.78 | |
| Hypothetical-C | $1,000.00 | $1,020.21 | $4.91 |
A Annualized expense ratio reflects expenses net of applicable fee waivers.
B Expenses are equal to each Class' annualized expense ratio, multiplied by the average account value over the period, multiplied by 183/365 (to reflect the one-half year period).
C 5% return per year before expenses
Distributions (Unaudited)
The Board of Trustees of Advisor Small Cap Fund voted to pay to shareholders of record at the opening of business on record date, the following distributions per share derived from capital gains realized from sales of portfolio securities and dividends from net investment income:
| Pay Date | Record Date | Dividends | Capital Gains | |
| Class Z | 12/21/2015 | 12/18/2015 | $0.00 | $1.933 |
| 01/11/2016 | 01/08/2016 | $ 0.00 | $0.278 | |
The fund hereby designates as a capital gain dividend with respect to the taxable year ended November 30, 2015 $280,500,766 or, if subsequently determined to be different, the net capital gain of such year.
Class Z designates 100% of the dividends distributed during the fiscal year as qualifying for the dividends-received deduction for corporate shareholders.
Class Z designates 100% of dividends distributed during the fiscal year as amounts which may be taken into account as a dividend for purposes of the maximum rate under section 1(h)(11) of the Internal Revenue Code.
The fund will notify shareholders in January 2016 of amounts for use in preparing 2015 income tax returns.
Board Approval of Investment Advisory Contracts and Management Fees
Fidelity Advisor Small Cap Fund
Each year, the Board of Trustees, including the Independent Trustees (together, the Board), votes on the renewal of the management contract with Fidelity Management & Research Company (FMR) and the sub-advisory agreements (together, the Advisory Contracts) for the fund. The Board, assisted by the advice of fund counsel and Independent Trustees' counsel, requests and considers a broad range of information relevant to the renewal of the Advisory Contracts throughout the year.
The Board meets regularly and, at each of its meetings, covers an extensive agenda of topics and materials and considers factors that are relevant to its annual consideration of the renewal of the fund's Advisory Contracts, including the services and support provided to the fund and its shareholders. The Board has established various standing committees (Committees), each composed of and chaired by Independent Trustees with varying backgrounds, to which the Board has assigned specific subject matter responsibilities in order to enhance effective decision-making by the Board. The Board, acting directly and through its Committees, requests and receives information concerning the annual consideration of the renewal of the fund's Advisory Contracts. The Board also meets as needed to consider matters specifically related to the Board's annual consideration of the renewal of the Advisory Contracts. Members of the Board may also meet with trustees of other Fidelity funds through ad hoc joint committees to discuss certain matters relevant to all of the Fidelity funds.
At its July 2015 meeting, the Board unanimously determined to renew the fund's Advisory Contracts. In reaching its determination, the Board considered all factors it believed relevant, including (i) the nature, extent, and quality of the services to be provided to the fund and its shareholders (including the investment performance of the fund); (ii) the competitiveness of the fund's management fee and total expense ratio relative to peer funds; (iii) the total costs of the services to be provided by and the profits to be realized by Fidelity from its relationship with the fund; and (iv) the extent to which (if any) economies of scale exist and would be realized as the fund grows, and whether any economies of scale are appropriately shared with fund shareholders.
In considering whether to renew the Advisory Contracts for the fund, the Board reached a determination, with the assistance of fund counsel and Independent Trustees' counsel and through the exercise of its business judgment, that the renewal of the Advisory Contracts was in the best interests of the fund and its shareholders and that the compensation payable under the Advisory Contracts was fair and reasonable. The Board's decision to renew the Advisory Contracts was not based on any single factor, but rather was based on a comprehensive consideration of all the information provided to the Board at its meetings throughout the year. The Board, in reaching its determination to renew the Advisory Contracts, was aware that shareholders of the fund have a broad range of investment choices available to them, including a wide choice among funds offered by Fidelity's competitors, and that the fund's shareholders, who have the opportunity to review and weigh the disclosure provided by the fund in its prospectus and other public disclosures, have chosen to invest in this fund, which is part of the Fidelity family of funds.
Nature, Extent, and Quality of Services Provided. The Board considered Fidelity's staffing as it relates to the fund, including the backgrounds of investment personnel of Fidelity, and also considered the fund's investment objective, strategies, and related investment philosophy. The Independent Trustees also had discussions with senior management of Fidelity's investment operations and investment groups. The Board considered the structure of the portfolio manager compensation program and whether this structure provides appropriate incentives to act in the best interests of the fund. Additionally, the Board considered the portfolio managers' investments, if any, in the funds that they manage.Resources Dedicated to Investment Management and Support Services. The Board and the Fund Oversight and Research Committees reviewed the general qualifications and capabilities of Fidelity's investment staff, including its size, education, experience, and resources, as well as Fidelity's approach to recruiting, training, managing, and compensating investment personnel. The Board noted that Fidelity has continued to increase the resources devoted to non-U.S. offices, including expansion of Fidelity's global investment organization. The Board also noted that Fidelity's analysts have extensive resources, tools and capabilities that allow them to conduct sophisticated quantitative and fundamental analysis, as well as credit analysis of issuers, counterparties and guarantors. Further, the Board considered that Fidelity's investment professionals have sufficient access to global information and data so as to provide competitive investment results over time, and that those professionals also have access to sophisticated tools that permit them to assess portfolio construction and risk and performance attribution characteristics continuously, as well as to transmit new information and research conclusions rapidly around the world. Additionally, in its deliberations, the Board considered Fidelity's trading, risk management, and compliance capabilities and resources, which are integral parts of the investment management process.Shareholder and Administrative Services. The Board considered (i) the nature, extent, quality, and cost of advisory, administrative, and shareholder services performed by FMR, the sub-advisers (together with FMR, the Investment Advisers), and their affiliates under the Advisory Contracts and under separate agreements covering transfer agency, pricing and bookkeeping, and securities lending services for the fund; (ii) the nature and extent of the supervision of third party service providers, principally custodians and subcustodians; and (iii) the resources devoted to, and the record of compliance with, the fund's compliance policies and procedures. The Board also reviewed the allocation of fund brokerage, including allocations to brokers affiliated with the Investment Advisers, the use of brokerage commissions to pay fund expenses, and the use of "soft" commission dollars to pay for research services.The Board noted that the growth of fund assets over time across the complex allows Fidelity to reinvest in the development of services designed to enhance the value or convenience of the Fidelity funds as investment vehicles. These services include 24-hour access to account information and market information through telephone representatives and over the Internet, investor education materials and asset allocation tools, and the expanded availability of Fidelity Investor Centers.In 2014, the Board formed an ad hoc Committee on Transfer Agency Fees to review the variety of transfer agency fee structures throughout the industry and Fidelity's competitive positioning with respect to industry participants.Investment in a Large Fund Family. The Board considered the benefits to shareholders of investing in a Fidelity fund, including the benefits of investing in a fund that is part of a large family of funds offering a variety of investment disciplines and providing a large variety of mutual fund investor services. The Board noted that Fidelity had taken, or had made recommendations that resulted in the Fidelity funds taking, a number of actions over the previous year that benefited particular funds, including (i) continuing to dedicate additional resources to investment research and to the support of the senior management team that oversees asset management; (ii) continuing efforts to enhance Fidelity's global research capabilities; (iii) launching new funds and making other enhancements to meet client needs; (iv) reducing management fees and total expenses for certain index funds and diversified international funds; (v) continuing to launch dedicated lower cost underlying funds to meet portfolio construction needs related to expanding underlying fund options for Fidelity funds of funds, specifically for the Freedom Fund product lines; (vi) rationalizing product lines and gaining increased efficiencies through fund mergers; (vii) launching active fixed-income exchange-traded funds; (viii) continuing to develop, acquire and implement systems and technology to improve services to the funds and information security and to increase efficiency; (ix) implementing investment enhancements to further strengthen Fidelity's target date product line to increase investors' probability of success in achieving their goals; (x) modifying the eligibility criteria for certain share classes to accommodate roll-over assets from employer-sponsored retirement plans; (xi) launching a new Class W of the Freedom Index Funds to attract and retain Fidelity record-kept retirement plan assets; and (xii) implementing changes to Fidelity's money market product line in response to recent money market regulatory reforms.Investment Performance. The Board considered whether the fund has operated in accordance with its investment objective, as well as its record of compliance with its investment restrictions and its performance history.The Board took into account discussions with representatives of the Investment Advisers about fund investment performance that occur at Board meetings throughout the year. In this regard the Board noted that as part of regularly scheduled fund reviews and other reports to the Board on fund performance, the Board considers annualized return information for the fund, for different time periods, measured against a securities market index ("benchmark index") and a peer group of funds with similar objectives ("peer group"), if any. In its evaluation of fund investment performance, the Board gave particular attention to information indicating changes in performance of certain Fidelity funds for specific time periods and discussed with the Investment Advisers the reasons for any overperformance or underperformance.In addition to reviewing absolute and relative fund performance, the Independent Trustees periodically consider the appropriateness of fund performance metrics in evaluating the results achieved. In general, the Independent Trustees believe that fund performance should be evaluated based on net performance (after fees and expenses) of both the highest performing and lowest performing fund share classes, where applicable, compared to appropriate benchmark indices, over appropriate time periods that may include full market cycles, and compared to peer groups, as applicable, over the same periods, taking into account relevant factors including the following: general market conditions; issuer-specific information; and fund cash flows and other factors.The Independent Trustees recognize that shareholders evaluate performance on a net basis over their own holding periods, for which one-, three-, and five-year periods are often used as a proxy. For this reason, the performance information reviewed by the Board also included net cumulative calendar year total return information for the fund and an appropriate benchmark index and peer group for the most recent one-, three-, and five-year periods, as shown below. Returns are shown compared to the 25th percentile (top of box, 75% beaten) and 75th percentile (bottom of box, 25% beaten) of the peer universe.Fidelity Advisor Small Cap Fund
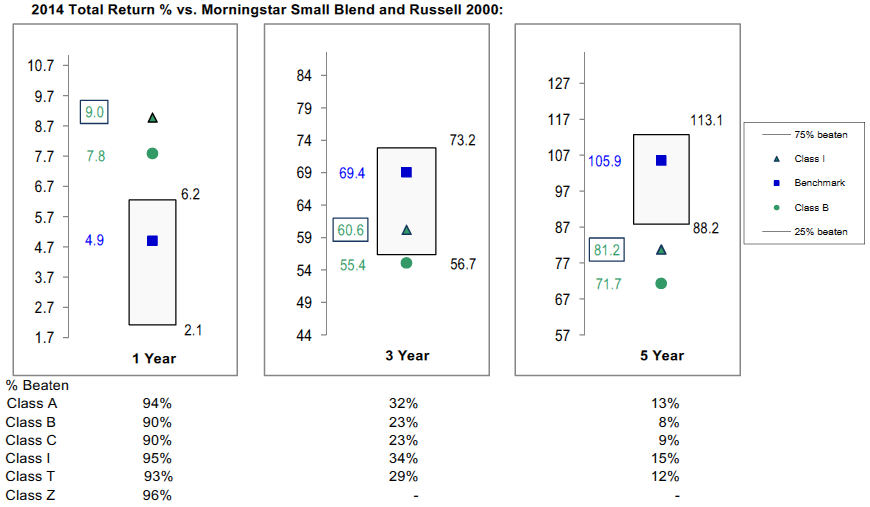
Fidelity Advisor Small Cap Fund
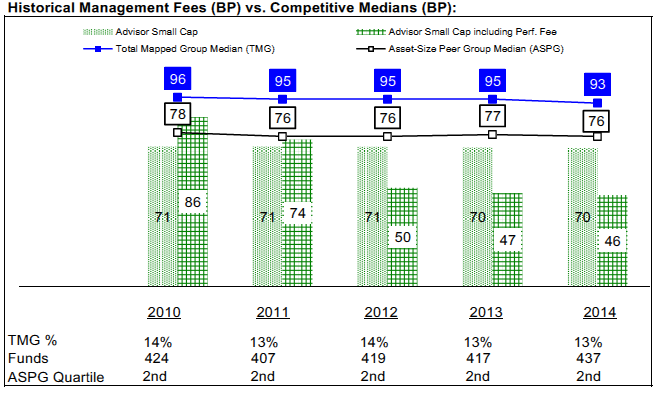
![]()
ASCFZ-ANN-0116
1.9585488.102
Fidelity® Value Strategies Fund Annual Report November 30, 2015 |
|
Contents
Board Approval of Investment Advisory Contracts and Management Fees |
To view a fund's proxy voting guidelines and proxy voting record for the 12-month period ended June 30, visit http://www.fidelity.com/proxyvotingresults or visit the Securities and Exchange Commission's (SEC) web site at http://www.sec.gov.
You may also call 1-800-544-8544 to request a free copy of the proxy voting guidelines.
Standard & Poor's, S&P and S&P 500 are registered service marks of The McGraw-Hill Companies, Inc. and have been licensed for use by Fidelity Distributors Corporation.
Other third-party marks appearing herein are the property of their respective owners.
All other marks appearing herein are registered or unregistered trademarks or service marks of FMR LLC or an affiliated company. ©2016 FMR LLC. All rights reserved.
This report and the financial statements contained herein are submitted for the general information of the shareholders of the Fund. This report is not authorized for distribution to prospective investors in the Fund unless preceded or accompanied by an effective prospectus.
A fund files its complete schedule of portfolio holdings with the SEC for the first and third quarters of each fiscal year on Form N-Q. Forms N-Q are available on the SEC’s web site at http://www.sec.gov. A fund's Forms N-Q may be reviewed and copied at the SEC’s Public Reference Room in Washington, DC. Information regarding the operation of the SEC's Public Reference Room may be obtained by calling 1-800-SEC-0330.
For a complete list of a fund's portfolio holdings, view the most recent holdings listing, semiannual report, or annual report on Fidelity's web site at http://www.fidelity.com, http://www.advisor.fidelity.com, or http://www.401k.com, as applicable.
NOT FDIC INSURED •MAY LOSE VALUE •NO BANK GUARANTEE
Neither the Fund nor Fidelity Distributors Corporation is a bank.
Performance: The Bottom Line
Average annual total return reflects the change in the value of an investment, assuming reinvestment of distributions from dividend income and capital gains (the profits earned upon the sale of securities that have grown in value, if any) and assuming a constant rate of performance each year.
The hypothetical investment and the average annual total returns do not reflect the deduction of taxes that a shareholder would pay on fund distributions or the redemption of fund shares.
During periods of reimbursement by Fidelity, a fund’s total return will be greater than it would be had the reimbursement not occurred.
How a fund did yesterday is no guarantee of how it will do tomorrow.
Average Annual Total Returns
| For the periods ended November 30, 2015 | Past 1 year | Past 5 years | Past 10 years |
| Fidelity® Value Strategies Fund | 1.35% | 11.91% | 7.11% |
$10,000 Over 10 Years
Let's say hypothetically that $10,000 was invested in Fidelity® Value Strategies Fund, a class of the fund, on November 30, 2005.
The chart shows how the value of your investment would have changed, and also shows how the Russell Midcap® Value Index performed over the same period.

| Period Ending Values | ||
| $19,883 | Fidelity® Value Strategies Fund | |
| $21,688 | Russell Midcap® Value Index | |
Management's Discussion of Fund Performance
Market Recap: U.S. stocks gained modestly for the 12 months ending November 30, 2015, despite a steep decline in August and September on concern about slowing economic growth in China. The S&P 500® index rebounded in October and gained 2.75% for the year. Stocks benefited late in the period amid waning expectations for a near-term interest-rate hike by the U.S. Federal Reserve, more economic stimulus in Europe and an interest-rate cut in China. Growth stocks in the benchmark far outpaced their value counterparts, as investors continued to seek growth in a subpar economic environment. Sector performance varied widely, with more than 26 percentage points separating the leader from the laggard. Consumer discretionary (+14%) secured the top spot, benefiting from a combination of rising personal income and still-benign inflation. Information technology (+7%) and health care (+4%) also outpaced the broad market. Conversely, the energy sector (-12%) performed worst, stymied by depressed commodity prices that also hit materials (-5%). Telecommunication services (-5%) and utilities (-4%), considered defensive sectors less sensitive to the economy, also lost ground. At period end, investors remained focused on the potential global implications of a stronger U.S. dollar and how China’s transition toward a consumption-led economy may affect corporate earnings.Comments from Portfolio Manager Tom Soviero: For the year, the fund’s share classes (excluding sales charges, if applicable) gained modestly, beating the -1.00% return of the benchmark Russell Midcap® Value Index. Security selection drove performance versus the benchmark, especially picks in the consumer discretionary, materials and energy sectors. Underweighting energy also helped. Our biggest individual contributor was top holding LyondellBasell Industries, a Netherlands-based multinational plastics, chemicals and refining company dependent on natural-gas derivatives. Although Lyondell lost its cost advantage when oil prices plunged early in the period, the quality of its assets and strong free cash flow lifted the stock. Another standout was Cott, which bought a water company, diluting its dependence on carbonated beverages and boosting its earnings-growth prospects. Additionally, the fund’s foreign holdings bolstered performance despite the stronger U.S. dollar. By contrast, stock picks in information technology and health care, as well as a sizable underweighting in financials, detracted. Disappointments included Micron Technology, a semiconductor company hurt by more capacity coming online as industry demand slowed. Lastly, not owning for-profit health insurer and index component Cigna hurt. Lyondell, Cott and Micron were all non-index holdings.The views expressed above reflect those of the portfolio manager(s) only through the end of the period as stated on the cover of this report and do not necessarily represent the views of Fidelity or any other person in the Fidelity organization. Any such views are subject to change at any time based upon market or other conditions and Fidelity disclaims any responsibility to update such views. These views may not be relied on as investment advice and, because investment decisions for a Fidelity fund are based on numerous factors, may not be relied on as an indication of trading intent on behalf of any Fidelity fund.
Investment Summary (Unaudited)
Top Ten Stocks as of November 30, 2015
| % of fund's net assets | % of fund's net assets 6 months ago | |
| LyondellBasell Industries NV Class A | 6.5 | 5.3 |
| Bank of America Corp. | 4.1 | 3.6 |
| Apple, Inc. | 3.4 | 4.8 |
| General Motors Co. | 3.3 | 3.0 |
| Citigroup, Inc. | 3.0 | 0.8 |
| Delphi Automotive PLC | 3.0 | 4.1 |
| U.S. Bancorp | 2.7 | 2.4 |
| Cott Corp. | 2.6 | 2.2 |
| Universal Health Services, Inc. Class B | 2.4 | 2.3 |
| Boston Scientific Corp. | 2.3 | 2.1 |
| 33.3 |
Top Five Market Sectors as of November 30, 2015
| % of fund's net assets | % of fund's net assets 6 months ago | |
| Consumer Discretionary | 19.8 | 23.0 |
| Financials | 15.2 | 12.8 |
| Health Care | 14.5 | 16.3 |
| Materials | 10.0 | 8.6 |
| Information Technology | 8.1 | 13.7 |
Asset Allocation (% of fund's net assets)
| As of November 30, 2015 * | ||
| Stocks | 88.9% | |
| Bonds | 0.1% | |
| Short-Term Investments and Net Other Assets (Liabilities) | 11.0% | |

* Foreign investments - 15.9%
| As of May 31, 2015 * | ||
| Stocks | 97.1% | |
| Bonds | 0.5% | |
| Short-Term Investments and Net Other Assets (Liabilities) | 2.4% | |

* Foreign investments - 17.5%
Investments November 30, 2015
Showing Percentage of Net Assets
| Common Stocks - 88.9% | |||
| Shares | Value (000s) | ||
| CONSUMER DISCRETIONARY - 19.8% | |||
| Auto Components - 3.3% | |||
| Delphi Automotive PLC | 474,177 | $41,671 | |
| Tenneco, Inc. (a) | 90,224 | 4,861 | |
| 46,532 | |||
| Automobiles - 3.3% | |||
| General Motors Co. | 1,284,836 | 46,511 | |
| Diversified Consumer Services - 1.3% | |||
| Service Corp. International | 691,750 | 19,265 | |
| Hotels, Restaurants & Leisure - 2.0% | |||
| Cedar Fair LP (depositary unit) | 227,420 | 12,808 | |
| Wyndham Worldwide Corp. | 199,867 | 15,174 | |
| 27,982 | |||
| Household Durables - 4.1% | |||
| CalAtlantic Group, Inc. | 527,581 | 22,211 | |
| Lennar Corp. Class A (b) | 424,700 | 21,749 | |
| PulteGroup, Inc. | 744,504 | 14,503 | |
| 58,463 | |||
| Leisure Products - 3.1% | |||
| Hasbro, Inc. | 266,797 | 19,500 | |
| Vista Outdoor, Inc. (a) | 557,700 | 24,567 | |
| 44,067 | |||
| Media - 1.1% | |||
| Omnicom Group, Inc. | 120,112 | 8,879 | |
| Regal Entertainment Group Class A (b) | 330,800 | 6,203 | |
| 15,082 | |||
| Specialty Retail - 1.4% | |||
| Asbury Automotive Group, Inc. (a) | 111,241 | 8,354 | |
| GameStop Corp. Class A (b) | 313,213 | 10,972 | |
| 19,326 | |||
| Textiles, Apparel & Luxury Goods - 0.2% | |||
| PVH Corp. | 36,500 | 3,332 | |
| TOTAL CONSUMER DISCRETIONARY | 280,560 | ||
| CONSUMER STAPLES - 5.9% | |||
| Beverages - 2.6% | |||
| Cott Corp. | 3,511,564 | 36,787 | |
| Food & Staples Retailing - 1.6% | |||
| CVS Health Corp. | 237,100 | 22,309 | |
| Food Products - 0.9% | |||
| Calavo Growers, Inc. | 232,028 | 13,128 | |
| Household Products - 0.8% | |||
| Procter & Gamble Co. | 142,100 | 10,635 | |
| TOTAL CONSUMER STAPLES | 82,859 | ||
| ENERGY - 3.3% | |||
| Energy Equipment & Services - 0.5% | |||
| Halliburton Co. | 183,600 | 7,316 | |
| Oil, Gas & Consumable Fuels - 2.8% | |||
| ConocoPhillips Co. | 117,100 | 6,329 | |
| EP Energy Corp. (a)(b) | 274,600 | 1,554 | |
| HollyFrontier Corp. | 76,400 | 3,673 | |
| Kinder Morgan, Inc. | 170,400 | 4,016 | |
| Valero Energy Corp. | 327,300 | 23,520 | |
| 39,092 | |||
| TOTAL ENERGY | 46,408 | ||
| FINANCIALS - 15.2% | |||
| Banks - 13.9% | |||
| Bank of America Corp. | 3,355,213 | 58,481 | |
| CIT Group, Inc. | 157,349 | 6,760 | |
| Citigroup, Inc. | 796,323 | 43,073 | |
| JPMorgan Chase & Co. | 314,200 | 20,951 | |
| Regions Financial Corp. | 778,163 | 7,891 | |
| U.S. Bancorp | 862,484 | 37,854 | |
| Wells Fargo & Co. | 377,370 | 20,793 | |
| 195,803 | |||
| Capital Markets - 0.6% | |||
| PJT Partners, Inc. (a) | 6,685 | 157 | |
| The Blackstone Group LP | 267,400 | 8,351 | |
| 8,508 | |||
| Insurance - 0.7% | |||
| AFLAC, Inc. | 158,186 | 10,320 | |
| TOTAL FINANCIALS | 214,631 | ||
| HEALTH CARE - 14.5% | |||
| Health Care Equipment & Supplies - 5.5% | |||
| Alere, Inc. (a) | 172,283 | 7,110 | |
| Boston Scientific Corp. (a) | 1,785,400 | 32,637 | |
| St. Jude Medical, Inc. | 463,300 | 29,234 | |
| Zimmer Biomet Holdings, Inc. | 87,600 | 8,848 | |
| 77,829 | |||
| Health Care Providers & Services - 3.2% | |||
| DaVita HealthCare Partners, Inc. (a) | 158,496 | 11,577 | |
| Universal Health Services, Inc. Class B | 278,914 | 33,894 | |
| 45,471 | |||
| Life Sciences Tools & Services - 0.8% | |||
| PerkinElmer, Inc. | 207,500 | 11,031 | |
| Pharmaceuticals - 5.0% | |||
| Johnson & Johnson | 187,800 | 19,013 | |
| Merck & Co., Inc. | 390,800 | 20,716 | |
| Sanofi SA sponsored ADR | 720,344 | 31,854 | |
| 71,583 | |||
| TOTAL HEALTH CARE | 205,914 | ||
| INDUSTRIALS - 7.7% | |||
| Aerospace & Defense - 4.6% | |||
| Esterline Technologies Corp. (a) | 180,022 | 17,116 | |
| Honeywell International, Inc. | 139,500 | 14,501 | |
| Orbital ATK, Inc. | 278,850 | 23,956 | |
| Textron, Inc. | 223,717 | 9,546 | |
| 65,119 | |||
| Machinery - 1.8% | |||
| Deere & Co. (b) | 164,900 | 13,121 | |
| Ingersoll-Rand PLC | 208,100 | 12,209 | |
| 25,330 | |||
| Road & Rail - 0.6% | |||
| Hertz Global Holdings, Inc. (a) | 557,200 | 8,837 | |
| Trading Companies & Distributors - 0.7% | |||
| Aircastle Ltd. | 467,200 | 9,793 | |
| TOTAL INDUSTRIALS | 109,079 | ||
| INFORMATION TECHNOLOGY - 8.1% | |||
| IT Services - 0.7% | |||
| Fidelity National Information Services, Inc. | 165,730 | 10,552 | |
| Semiconductors & Semiconductor Equipment - 2.3% | |||
| Cypress Semiconductor Corp. (b) | 1,507,475 | 16,311 | |
| Micron Technology, Inc. (a) | 559,183 | 8,908 | |
| ON Semiconductor Corp. (a) | 646,970 | 7,091 | |
| 32,310 | |||
| Software - 1.7% | |||
| Microsoft Corp. | 429,324 | 23,334 | |
| Technology Hardware, Storage & Peripherals - 3.4% | |||
| Apple, Inc. | 407,860 | 48,250 | |
| TOTAL INFORMATION TECHNOLOGY | 114,446 | ||
| MATERIALS - 10.0% | |||
| Chemicals - 8.8% | |||
| Ashland, Inc. | 83,100 | 9,361 | |
| Axiall Corp. | 284,126 | 5,921 | |
| LyondellBasell Industries NV Class A | 965,892 | 92,551 | |
| PPG Industries, Inc. | 154,592 | 16,347 | |
| 124,180 | |||
| Containers & Packaging - 1.2% | |||
| WestRock Co. | 347,900 | 17,614 | |
| TOTAL MATERIALS | 141,794 | ||
| TELECOMMUNICATION SERVICES - 2.0% | |||
| Diversified Telecommunication Services - 2.0% | |||
| Level 3 Communications, Inc. (a) | 558,139 | 28,370 | |
| UTILITIES - 2.4% | |||
| Independent Power and Renewable Electricity Producers - 1.1% | |||
| Calpine Corp. (a) | 567,563 | 8,389 | |
| Dynegy, Inc. (a) | 441,400 | 7,115 | |
| 15,504 | |||
| Multi-Utilities - 1.3% | |||
| Sempra Energy | 179,639 | 17,826 | |
| TOTAL UTILITIES | 33,330 | ||
| TOTAL COMMON STOCKS | |||
| (Cost $794,484) | 1,257,391 | ||
| Principal Amount (000s) | Value (000s) | ||
| Nonconvertible Bonds - 0.1% | |||
| ENERGY - 0.1% | |||
| Oil, Gas & Consumable Fuels - 0.1% | |||
| Peabody Energy Corp. 6.25% 11/15/21 (Cost $14,230) | 15,405 | 2,426 | |
| Shares | Value (000s) | ||
| Money Market Funds - 3.8% | |||
| Fidelity Cash Central Fund, 0.18% (c) | 23,178,091 | 23,178 | |
| Fidelity Securities Lending Cash Central Fund, 0.22% (c)(d) | 30,384,778 | 30,385 | |
| TOTAL MONEY MARKET FUNDS | |||
| (Cost $53,563) | 53,563 | ||
| TOTAL INVESTMENT PORTFOLIO - 92.8% | |||
| (Cost $862,277) | 1,313,380 | ||
| NET OTHER ASSETS (LIABILITIES) - 7.2% | 101,256 | ||
| NET ASSETS - 100% | $1,414,636 |
Legend
(a) Non-income producing
(b) Security or a portion of the security is on loan at period end.
(c) Affiliated fund that is generally available only to investment companies and other accounts managed by Fidelity Investments. The rate quoted is the annualized seven-day yield of the fund at period end. A complete unaudited listing of the fund's holdings as of its most recent quarter end is available upon request. In addition, each Fidelity Central Fund's financial statements, which are not covered by the Fund's Report of Independent Registered Public Accounting Firm, are available on the SEC's website or upon request.
(d) Investment made with cash collateral received from securities on loan.
Affiliated Central Funds
Information regarding fiscal year to date income earned by the Fund from investments in Fidelity Central Funds is as follows:
| Fund | Income earned |
| (Amounts in thousands) | |
| Fidelity Cash Central Fund | $50 |
| Fidelity Securities Lending Cash Central Fund | 791 |
| Total | $841 |
Investment Valuation
The following is a summary of the inputs used, as of November 30, 2015, involving the Fund's assets and liabilities carried at fair value. The inputs or methodology used for valuing securities may not be an indication of the risk associated with investing in those securities. For more information on valuation inputs, and their aggregation into the levels used below, please refer to the Investment Valuation section in the accompanying Notes to Financial Statements.
| Valuation Inputs at Reporting Date: | ||||
| Description | Total | Level 1 | Level 2 | Level 3 |
| (Amounts in thousands) | ||||
| Investments in Securities: | ||||
| Equities: | ||||
| Consumer Discretionary | $280,560 | $280,560 | $-- | $-- |
| Consumer Staples | 82,859 | 82,859 | -- | -- |
| Energy | 46,408 | 46,408 | -- | -- |
| Financials | 214,631 | 214,631 | -- | -- |
| Health Care | 205,914 | 205,914 | -- | -- |
| Industrials | 109,079 | 109,079 | -- | -- |
| Information Technology | 114,446 | 114,446 | -- | -- |
| Materials | 141,794 | 141,794 | -- | -- |
| Telecommunication Services | 28,370 | 28,370 | -- | -- |
| Utilities | 33,330 | 33,330 | -- | -- |
| Corporate Bonds | 2,426 | -- | 2,426 | -- |
| Money Market Funds | 53,563 | 53,563 | -- | -- |
| Total Investments in Securities: | $1,313,380 | $1,310,954 | $2,426 | $-- |
Other Information
Distribution of investments by country or territory of incorporation, as a percentage of Total Net Assets, is as follows (Unaudited):
| United States of America | 84.1% |
| Netherlands | 6.5% |
| Bailiwick of Jersey | 3.0% |
| Canada | 2.6% |
| France | 2.2% |
| Others (Individually Less Than 1%) | 1.6% |
| 100.0% |
See accompanying notes which are an integral part of the financial statements.
Financial Statements
Statement of Assets and Liabilities
| Amounts in thousands (except per-share amounts) | November 30, 2015 | |
| Assets | ||
| Investment in securities, at value (including securities loaned of $29,334) — See accompanying schedule: Unaffiliated issuers (cost $808,714) | $1,259,817 | |
| Fidelity Central Funds (cost $53,563) | 53,563 | |
| Total Investments (cost $862,277) | $1,313,380 | |
| Receivable for investments sold | 379 | |
| Receivable for fund shares sold | 131,840 | |
| Dividends receivable | 2,389 | |
| Interest receivable | 43 | |
| Distributions receivable from Fidelity Central Funds | 52 | |
| Prepaid expenses | 3 | |
| Other receivables | 13 | |
| Total assets | 1,448,099 | |
| Liabilities | ||
| Payable for fund shares redeemed | $2,215 | |
| Accrued management fee | 358 | |
| Distribution and service plan fees payable | 211 | |
| Other affiliated payables | 250 | |
| Other payables and accrued expenses | 44 | |
| Collateral on securities loaned, at value | 30,385 | |
| Total liabilities | 33,463 | |
| Net Assets | $1,414,636 | |
| Net Assets consist of: | ||
| Paid in capital | $1,086,894 | |
| Undistributed net investment income | 12,741 | |
| Accumulated undistributed net realized gain (loss) on investments and foreign currency transactions | (136,102) | |
| Net unrealized appreciation (depreciation) on investments and assets and liabilities in foreign currencies | 451,103 | |
| Net Assets | $1,414,636 | |
| Calculation of Maximum Offering Price | ||
| Class A: | ||
| Net Asset Value and redemption price per share ($215,141 ÷ 5,514.662 shares) | $39.01 | |
| Maximum offering price per share (100/94.25 of $39.01) | $41.39 | |
| Class T: | ||
| Net Asset Value and redemption price per share ($294,097 ÷ 7,279.753 shares) | $40.40 | |
| Maximum offering price per share (100/96.50 of $40.40) | $41.87 | |
| Class B: | ||
| Net Asset Value and offering price per share ($3,911 ÷ 110.061 shares)(a) | $35.53 | |
| Class C: | ||
| Net Asset Value and offering price per share ($49,140 ÷ 1,399.392 shares)(a) | $35.12 | |
| Fidelity Value Strategies Fund: | ||
| Net Asset Value, offering price and redemption price per share ($715,837 ÷ 16,373.120 shares) | $43.72 | |
| Class K: | ||
| Net Asset Value, offering price and redemption price per share ($71,635 ÷ 1,637.769 shares) | $43.74 | |
| Class I: | ||
| Net Asset Value, offering price and redemption price per share ($64,875 ÷ 1,555.559 shares) | $41.71 |
(a) Redemption price per share is equal to net asset value less any applicable contingent deferred sales charge.
See accompanying notes which are an integral part of the financial statements.
Statement of Operations
| Amounts in thousands | Year ended November 30, 2015 | |
| Investment Income | ||
| Dividends | $24,333 | |
| Interest | 1,276 | |
| Income from Fidelity Central Funds | 841 | |
| Total income | 26,450 | |
| Expenses | ||
| Management fee | ||
| Basic fee | $7,974 | |
| Performance adjustment | (1,933) | |
| Transfer agent fees | 2,877 | |
| Distribution and service plan fees | 2,725 | |
| Accounting and security lending fees | 465 | |
| Custodian fees and expenses | 15 | |
| Independent trustees' compensation | 6 | |
| Registration fees | 109 | |
| Audit | 65 | |
| Legal | 6 | |
| Miscellaneous | 11 | |
| Total expenses before reductions | 12,320 | |
| Expense reductions | (77) | 12,243 |
| Net investment income (loss) | 14,207 | |
| Realized and Unrealized Gain (Loss) | ||
| Net realized gain (loss) on: | ||
| Investment securities: | ||
| Unaffiliated issuers | 117,277 | |
| Foreign currency transactions | 14 | |
| Total net realized gain (loss) | 117,291 | |
| Change in net unrealized appreciation (depreciation) on: Investment securities | (113,534) | |
| Assets and liabilities in foreign currencies | 3 | |
| Total change in net unrealized appreciation (depreciation) | (113,531) | |
| Net gain (loss) | 3,760 | |
| Net increase (decrease) in net assets resulting from operations | $17,967 |
See accompanying notes which are an integral part of the financial statements.
Statement of Changes in Net Assets
| Amounts in thousands | Year ended November 30, 2015 | Year ended November 30, 2014 |
| Increase (Decrease) in Net Assets | ||
| Operations | ||
| Net investment income (loss) | $14,207 | $12,033 |
| Net realized gain (loss) | 117,291 | 6,319 |
| Change in net unrealized appreciation (depreciation) | (113,531) | 112,825 |
| Net increase (decrease) in net assets resulting from operations | 17,967 | 131,177 |
| Distributions to shareholders from net investment income | (11,929) | (10,331) |
| Distributions to shareholders from net realized gain | (1,090) | – |
| Total distributions | (13,019) | (10,331) |
| Share transactions - net increase (decrease) | (175,423) | (53,813) |
| Total increase (decrease) in net assets | (170,475) | 67,033 |
| Net Assets | ||
| Beginning of period | 1,585,111 | 1,518,078 |
| End of period (including undistributed net investment income of $12,741 and undistributed net investment income of $11,706, respectively) | $1,414,636 | $1,585,111 |
See accompanying notes which are an integral part of the financial statements.
Financial Highlights — Fidelity Advisor Value Strategies Fund Class A
| November 30, | |||||
| Years ended November 30, | 2015 | 2014 | 2013 | 2012 | 2011 |
| Selected Per–Share Data | |||||
| Net asset value, beginning of period | $38.91 | $36.02 | $27.62 | $22.71 | $23.11 |
| Income from Investment Operations | |||||
| Net investment income (loss)A | .35 | .25 | .23 | –B | .13C |
| Net realized and unrealized gain (loss) | .06 | 2.87 | 8.25 | 5.03 | (.49) |
| Total from investment operations | .41 | 3.12 | 8.48 | 5.03 | (.36) |
| Distributions from net investment income | (.28)D | (.23) | (.08) | (.12) | (.03)D |
| Distributions from net realized gain | (.03)D | – | – | – | (.01)D |
| Total distributions | (.31) | (.23) | (.08) | (.12) | (.04) |
| Net asset value, end of period | $39.01 | $38.91 | $36.02 | $27.62 | $22.71 |
| Total ReturnE,F | 1.07% | 8.74% | 30.77% | 22.29% | (1.57)% |
| Ratios to Average Net AssetsG,H | |||||
| Expenses before reductions | .93% | .96% | 1.04% | 1.21% | 1.18% |
| Expenses net of fee waivers, if any | .93% | .96% | 1.04% | 1.21% | 1.18% |
| Expenses net of all reductions | .93% | .96% | 1.03% | 1.21% | 1.17% |
| Net investment income (loss) | .89% | .68% | .73% | - %B | .51%C |
| Supplemental Data | |||||
| Net assets, end of period (in millions) | $215 | $233 | $243 | $203 | $190 |
| Portfolio turnover rateI | 9% | 6% | 22% | 23% | 34% |
A Calculated based on average shares outstanding during the period.
B Investment income per share reflects a large, non-recurring dividend which amounted to $.07 per share. Excluding this non-recurring dividend, the ratio of net investment income (loss) to average net assets would have been (.28) %.
C Investment income per share reflects a large, non-recurring dividend which amounted to $.16 per share. Excluding this non-recurring dividend, the ratio of net investment income (loss) to average net assets would have been (.11) %.
D The amounts shown reflect certain reclassifications related to book to tax differences that were made in the year shown.
E Total returns would have been lower if certain expenses had not been reduced during the applicable periods shown.
F Total returns do not include the effect of the sales charges.
G Fees and expenses of any underlying Fidelity Central Funds are not included in the Fund's expense ratio. The Fund indirectly bears its proportionate share of the expenses of any underlying Fidelity Central Funds.
H Expense ratios reflect operating expenses of the class. Expenses before reductions do not reflect amounts reimbursed by the investment adviser or reductions from brokerage service arrangements or reductions from other expense offset arrangements and do not represent the amount paid by the class during periods when reimbursements or reductions occur. Expenses net of fee waivers reflect expenses after reimbursement by the investment adviser but prior to reductions from brokerage service arrangements or other expense offset arrangements. Expenses net of all reductions represent the net expenses paid by the class.
I Amount does not include the portfolio activity of any underlying Fidelity Central Funds.
See accompanying notes which are an integral part of the financial statements.
Financial Highlights — Fidelity Advisor Value Strategies Fund Class T
| November 30, | |||||
| Years ended November 30, | 2015 | 2014 | 2013 | 2012 | 2011 |
| Selected Per–Share Data | |||||
| Net asset value, beginning of period | $40.28 | $37.28 | $28.58 | $23.48 | $23.90 |
| Income from Investment Operations | |||||
| Net investment income (loss)A | .28 | .18 | .18 | (.05)B | .08C |
| Net realized and unrealized gain (loss) | .06 | 2.98 | 8.54 | 5.22 | (.50) |
| Total from investment operations | .34 | 3.16 | 8.72 | 5.17 | (.42) |
| Distributions from net investment income | (.19)D | (.16) | (.02) | (.07) | – |
| Distributions from net realized gain | (.03)D | – | – | – | – |
| Total distributions | (.22) | (.16) | (.02) | (.07) | – |
| Net asset value, end of period | $40.40 | $40.28 | $37.28 | $28.58 | $23.48 |
| Total ReturnE,F | .86% | 8.51% | 30.52% | 22.08% | (1.76)% |
| Ratios to Average Net AssetsG,H | |||||
| Expenses before reductions | 1.15% | 1.17% | 1.23% | 1.38% | 1.35% |
| Expenses net of fee waivers, if any | 1.14% | 1.17% | 1.23% | 1.38% | 1.35% |
| Expenses net of all reductions | 1.14% | 1.17% | 1.22% | 1.38% | 1.35% |
| Net investment income (loss) | .68% | .47% | .54% | (.17)%B | .33%C |
| Supplemental Data | |||||
| Net assets, end of period (in millions) | $294 | $324 | $335 | $283 | $274 |
| Portfolio turnover rateI | 9% | 6% | 22% | 23% | 34% |
A Calculated based on average shares outstanding during the period.
B Investment income per share reflects a large, non-recurring dividend which amounted to $.07 per share. Excluding this non-recurring dividend, the ratio of net investment income (loss) to average net assets would have been (.45) %.
C Investment income per share reflects a large, non-recurring dividend which amounted to $.16 per share. Excluding this non-recurring dividend, the ratio of net investment income (loss) to average net assets would have been (.29) %.
D The amounts shown reflect certain reclassifications related to book to tax differences that were made in the year shown.
E Total returns would have been lower if certain expenses had not been reduced during the applicable periods shown.
F Total returns do not include the effect of the sales charges.
G Fees and expenses of any underlying Fidelity Central Funds are not included in the Fund's expense ratio. The Fund indirectly bears its proportionate share of the expenses of any underlying Fidelity Central Funds.
H Expense ratios reflect operating expenses of the class. Expenses before reductions do not reflect amounts reimbursed by the investment adviser or reductions from brokerage service arrangements or reductions from other expense offset arrangements and do not represent the amount paid by the class during periods when reimbursements or reductions occur. Expenses net of fee waivers reflect expenses after reimbursement by the investment adviser but prior to reductions from brokerage service arrangements or other expense offset arrangements. Expenses net of all reductions represent the net expenses paid by the class.
I Amount does not include the portfolio activity of any underlying Fidelity Central Funds.
See accompanying notes which are an integral part of the financial statements.
Financial Highlights — Fidelity Advisor Value Strategies Fund Class B
| Years ended November 30, | 2015 | 2014 | 2013 | 2012 | 2011 |
| Selected Per–Share Data | |||||
| Net asset value, beginning of period | $35.44 | $32.86 | $25.34 | $20.87 | $21.37 |
| Income from Investment Operations | |||||
| Net investment income (loss)A | .02 | (.05) | (.02) | (.18)B | (.06)C |
| Net realized and unrealized gain (loss) | .07 | 2.63 | 7.54 | 4.65 | (.44) |
| Total from investment operations | .09 | 2.58 | 7.52 | 4.47 | (.50) |
| Distributions from net investment income | – | – | – | – | – |
| Distributions from net realized gain | – | – | – | – | – |
| Total distributions | – | – | – | – | – |
| Net asset value, end of period | $35.53 | $35.44 | $32.86 | $25.34 | $20.87 |
| Total ReturnD,E | .25% | 7.85% | 29.68% | 21.42% | (2.34)% |
| Ratios to Average Net AssetsF,G | |||||
| Expenses before reductions | 1.77% | 1.78% | 1.83% | 1.97% | 1.93% |
| Expenses net of fee waivers, if any | 1.76% | 1.78% | 1.83% | 1.97% | 1.93% |
| Expenses net of all reductions | 1.76% | 1.78% | 1.82% | 1.97% | 1.93% |
| Net investment income (loss) | .06% | (.14)% | (.07)% | (.76)%B | (.25)%C |
| Supplemental Data | |||||
| Net assets, end of period (in millions) | $4 | $7 | $11 | $13 | $16 |
| Portfolio turnover rateH | 9% | 6% | 22% | 23% | 34% |
A Calculated based on average shares outstanding during the period.
B Investment income per share reflects a large, non-recurring dividend which amounted to $.06 per share. Excluding this non-recurring dividend, the ratio of net investment income (loss) to average net assets would have been (1.04) %.
C Investment income per share reflects a large, non-recurring dividend which amounted to $.16 per share. Excluding this non-recurring dividend, the ratio of net investment income (loss) to average net assets would have been (.87) %.
D Total returns would have been lower if certain expenses had not been reduced during the applicable periods shown.
E Total returns do not include the effect of the contingent deferred sales charge.
F Fees and expenses of any underlying Fidelity Central Funds are not included in the Fund's expense ratio. The Fund indirectly bears its proportionate share of the expenses of any underlying Fidelity Central Funds.
G Expense ratios reflect operating expenses of the class. Expenses before reductions do not reflect amounts reimbursed by the investment adviser or reductions from brokerage service arrangements or reductions from other expense offset arrangements and do not represent the amount paid by the class during periods when reimbursements or reductions occur. Expenses net of fee waivers reflect expenses after reimbursement by the investment adviser but prior to reductions from brokerage service arrangements or other expense offset arrangements. Expenses net of all reductions represent the net expenses paid by the class.
H Amount does not include the portfolio activity of any underlying Fidelity Central Funds.
See accompanying notes which are an integral part of the financial statements.
Financial Highlights — Fidelity Advisor Value Strategies Fund Class C
| November 30, | |||||
| Years ended November 30, | 2015 | 2014 | 2013 | 2012 | 2011 |
| Selected Per–Share Data | |||||
| Net asset value, beginning of period | $35.07 | $32.52 | $25.06 | $20.64 | $21.13 |
| Income from Investment Operations | |||||
| Net investment income (loss)A | .05 | (.03) | (.01) | (.17)B | (.05)C |
| Net realized and unrealized gain (loss) | .07 | 2.60 | 7.47 | 4.59 | (.44) |
| Total from investment operations | .12 | 2.57 | 7.46 | 4.42 | (.49) |
| Distributions from net investment income | (.04)D | (.02) | – | – | – |
| Distributions from net realized gain | (.03)D | – | – | – | – |
| Total distributions | (.07) | (.02) | – | – | – |
| Net asset value, end of period | $35.12 | $35.07 | $32.52 | $25.06 | $20.64 |
| Total ReturnE,F | .33% | 7.91% | 29.77% | 21.41% | (2.32)% |
| Ratios to Average Net AssetsG,H | |||||
| Expenses before reductions | 1.70% | 1.72% | 1.78% | 1.95% | 1.92% |
| Expenses net of fee waivers, if any | 1.69% | 1.72% | 1.78% | 1.95% | 1.92% |
| Expenses net of all reductions | 1.69% | 1.72% | 1.77% | 1.95% | 1.92% |
| Net investment income (loss) | .13% | (.08)% | (.02)% | (.75)%B | (.24)%C |
| Supplemental Data | |||||
| Net assets, end of period (in millions) | $49 | $53 | $54 | $43 | $40 |
| Portfolio turnover rateI | 9% | 6% | 22% | 23% | 34% |
A Calculated based on average shares outstanding during the period.
B Investment income per share reflects a large, non-recurring dividend which amounted to $.06 per share. Excluding this non-recurring dividend, the ratio of net investment income (loss) to average net assets would have been (1.02) %.
C Investment income per share reflects a large, non-recurring dividend which amounted to $.16 per share. Excluding this non-recurring dividend, the ratio of net investment income (loss) to average net assets would have been (.86) %.
D The amounts shown reflect certain reclassifications related to book to tax differences that were made in the year shown.
E Total returns would have been lower if certain expenses had not been reduced during the applicable periods shown.
F Total returns do not include the effect of the contingent deferred sales charge.
G Fees and expenses of any underlying Fidelity Central Funds are not included in the Fund's expense ratio. The Fund indirectly bears its proportionate share of the expenses of any underlying Fidelity Central Funds.
H Expense ratios reflect operating expenses of the class. Expenses before reductions do not reflect amounts reimbursed by the investment adviser or reductions from brokerage service arrangements or reductions from other expense offset arrangements and do not represent the amount paid by the class during periods when reimbursements or reductions occur. Expenses net of fee waivers reflect expenses after reimbursement by the investment adviser but prior to reductions from brokerage service arrangements or other expense offset arrangements. Expenses net of all reductions represent the net expenses paid by the class.
I Amount does not include the portfolio activity of any underlying Fidelity Central Funds.
See accompanying notes which are an integral part of the financial statements.
Financial Highlights — Fidelity Advisor Value Strategies Fund
| November 30, | |||||
| Years ended November 30, | 2015 | 2014 | 2013 | 2012 | 2011 |
| Selected Per–Share Data | |||||
| Net asset value, beginning of period | $43.56 | $40.28 | $30.89 | $25.37 | $25.80 |
| Income from Investment Operations | |||||
| Net investment income (loss)A | .51 | .40 | .37 | .09B | .22C |
| Net realized and unrealized gain (loss) | .07 | 3.21 | 9.20 | 5.62 | (.54) |
| Total from investment operations | .58 | 3.61 | 9.57 | 5.71 | (.32) |
| Distributions from net investment income | (.39)D | (.33) | (.18) | (.19) | (.10)D |
| Distributions from net realized gain | (.03)D | – | – | – | (.01)D |
| Total distributions | (.42) | (.33) | (.18) | (.19) | (.11) |
| Net asset value, end of period | $43.72 | $43.56 | $40.28 | $30.89 | $25.37 |
| Total ReturnE | 1.35% | 9.05% | 31.14% | 22.69% | (1.29)% |
| Ratios to Average Net AssetsF,G | |||||
| Expenses before reductions | .67% | .69% | .73% | .89% | .88% |
| Expenses net of fee waivers, if any | .67% | .69% | .73% | .89% | .88% |
| Expenses net of all reductions | .66% | .69% | .72% | .89% | .88% |
| Net investment income (loss) | 1.16% | .95% | 1.03% | .31%B | .80%C |
| Supplemental Data | |||||
| Net assets, end of period (in millions) | $716 | $786 | $681 | $396 | $284 |
| Portfolio turnover rateH | 9% | 6% | 22% | 23% | 34% |
A Calculated based on average shares outstanding during the period.
B Investment income per share reflects a large, non-recurring dividend which amounted to $.08 per share. Excluding this non-recurring dividend, the ratio of net investment income (loss) to average net assets would have been .04%.
C Investment income per share reflects a large, non-recurring dividends which amounted to $.16 per share. Excluding this non-recurring dividend, the ratio of net investment income (loss) to average net assets would have been .18%.
D The amounts shown reflect certain reclassifications related to book to tax differences that were made in the year shown.
E Total returns would have been lower if certain expenses had not been reduced during the applicable periods shown.
F Fees and expenses of any underlying Fidelity Central Funds are not included in the Fund's expense ratio. The Fund indirectly bears its proportionate share of the expenses of any underlying Fidelity Central Funds.
G Expense ratios reflect operating expenses of the class. Expenses before reductions do not reflect amounts reimbursed by the investment adviser or reductions from brokerage service arrangements or reductions from other expense offset arrangements and do not represent the amount paid by the class during periods when reimbursements or reductions occur. Expenses net of fee waivers reflect expenses after reimbursement by the investment adviser but prior to reductions from brokerage service arrangements or other expense offset arrangements. Expenses net of all reductions represent the net expenses paid by the class.
H Amount does not include the portfolio activity of any underlying Fidelity Central Funds.
See accompanying notes which are an integral part of the financial statements.
Financial Highlights — Fidelity Advisor Value Strategies Fund Class K
| November 30, | |||||
| Years ended November 30, | 2015 | 2014 | 2013 | 2012 | 2011 |
| Selected Per–Share Data | |||||
| Net asset value, beginning of period | $43.57 | $40.28 | $30.89 | $25.38 | $25.82 |
| Income from Investment Operations | |||||
| Net investment income (loss)A | .58 | .47 | .43 | .14B | .28C |
| Net realized and unrealized gain (loss) | .07 | 3.20 | 9.18 | 5.61 | (.55) |
| Total from investment operations | .65 | 3.67 | 9.61 | 5.75 | (.27) |
| Distributions from net investment income | (.45)D | (.38) | (.22) | (.24) | (.16)D |
| Distributions from net realized gain | (.03)D | – | – | – | (.01)D |
| Total distributions | (.48) | (.38) | (.22) | (.24) | (.17) |
| Net asset value, end of period | $43.74 | $43.57 | $40.28 | $30.89 | $25.38 |
| Total ReturnE | 1.51% | 9.21% | 31.34% | 22.93% | (1.11)% |
| Ratios to Average Net AssetsF,G | |||||
| Expenses before reductions | .51% | .53% | .58% | .71% | .68% |
| Expenses net of fee waivers, if any | .51% | .53% | .58% | .71% | .68% |
| Expenses net of all reductions | .51% | .53% | .57% | .71% | .68% |
| Net investment income (loss) | 1.31% | 1.11% | 1.18% | .50%B | 1.00%C |
| Supplemental Data | |||||
| Net assets, end of period (in millions) | $72 | $97 | $119 | $70 | $47 |
| Portfolio turnover rateH | 9% | 6% | 22% | 23% | 34% |
A Calculated based on average shares outstanding during the period.
B Investment income per share reflects a large, non-recurring dividend which amounted to $.08 per share. Excluding this non-recurring dividend, the ratio of net investment income (loss) to average net assets would have been .22%.
C Investment income per share reflects a large, non-recurring dividend which amounted to $.16 per share. Excluding this non-recurring dividend, the ratio of net investment income (loss) to average net assets would have been .38%.
D The amounts shown reflect certain reclassifications related to book to tax differences that were made in the year shown.
E Total returns would have been lower if certain expenses had not been reduced during the applicable periods shown.
F Fees and expenses of any underlying Fidelity Central Funds are not included in the Fund's expense ratio. The Fund indirectly bears its proportionate share of the expenses of any underlying Fidelity Central Funds.
G Expense ratios reflect operating expenses of the class. Expenses before reductions do not reflect amounts reimbursed by the investment adviser or reductions from brokerage service arrangements or reductions from other expense offset arrangements and do not represent the amount paid by the class during periods when reimbursements or reductions occur. Expenses net of fee waivers reflect expenses after reimbursement by the investment adviser but prior to reductions from brokerage service arrangements or other expense offset arrangements. Expenses net of all reductions represent the net expenses paid by the class.
H Amount does not include the portfolio activity of any underlying Fidelity Central Funds.
See accompanying notes which are an integral part of the financial statements.
Financial Highlights — Fidelity Advisor Value Strategies Fund Class I
| November 30, | |||||
| Years ended November 30, | 2015 | 2014 | 2013 | 2012 | 2011 |
| Selected Per–Share Data | |||||
| Net asset value, beginning of period | $41.57 | $38.46 | $29.51 | $24.26 | $24.69 |
| Income from Investment Operations | |||||
| Net investment income (loss)A | .48 | .37 | .34 | .08B | .22C |
| Net realized and unrealized gain (loss) | .08 | 3.06 | 8.79 | 5.37 | (.53) |
| Total from investment operations | .56 | 3.43 | 9.13 | 5.45 | (.31) |
| Distributions from net investment income | (.39)D | (.32) | (.18) | (.20) | (.11)D |
| Distributions from net realized gain | (.03)D | – | – | – | (.01)D |
| Total distributions | (.42) | (.32) | (.18) | (.20) | (.12) |
| Net asset value, end of period | $41.71 | $41.57 | $38.46 | $29.51 | $24.26 |
| Total ReturnE | 1.36% | 9.01% | 31.11% | 22.67% | (1.30)% |
| Ratios to Average Net AssetsF,G | |||||
| Expenses before reductions | .68% | .71% | .76% | .90% | .86% |
| Expenses net of fee waivers, if any | .68% | .71% | .76% | .90% | .86% |
| Expenses net of all reductions | .68% | .71% | .75% | .90% | .86% |
| Net investment income (loss) | 1.14% | .93% | 1.00% | .31%B | .82%C |
| Supplemental Data | |||||
| Net assets, end of period (in millions) | $65 | $86 | $74 | $66 | $52 |
| Portfolio turnover rateH | 9% | 6% | 22% | 23% | 34% |
A Calculated based on average shares outstanding during the period.
B Investment income per share reflects a large, non-recurring dividend which amounted to $.08 per share. Excluding this non-recurring dividend, the ratio of net investment income (loss) to average net assets would have been .03%.
C Investment income per share reflects a large, non-recurring dividend which amounted to $.16 per share. Excluding this non-recurring dividend, the ratio of net investment income (loss) to average net assets would have been .20%.
D The amounts shown reflect certain reclassifications related to book to tax differences that were made in the year shown.
E Total returns would have been lower if certain expenses had not been reduced during the applicable periods shown.
F Fees and expenses of any underlying Fidelity Central Funds are not included in the Fund's expense ratio. The Fund indirectly bears its proportionate share of the expenses of any underlying Fidelity Central Funds.
G Expense ratios reflect operating expenses of the class. Expenses before reductions do not reflect amounts reimbursed by the investment adviser or reductions from brokerage service arrangements or reductions from other expense offset arrangements and do not represent the amount paid by the class during periods when reimbursements or reductions occur. Expenses net of fee waivers reflect expenses after reimbursement by the investment adviser but prior to reductions from brokerage service arrangements or other expense offset arrangements. Expenses net of all reductions represent the net expenses paid by the class.
H Amount does not include the portfolio activity of any underlying Fidelity Central Funds.
See accompanying notes which are an integral part of the financial statements.
Notes to Financial Statements
For the period ended November 30, 2015
(Amounts in thousands except percentages)
1. Organization.
Fidelity Advisor Value Strategies Fund (the Fund) is a fund of Fidelity Advisor Series I (the Trust) and is authorized to issue an unlimited number of shares. The Trust is registered under the Investment Company Act of 1940, as amended (the 1940 Act), as an open-end management investment company organized as a Massachusetts business trust. The Fund offers Class A, Class T, Class C, Fidelity Value Strategies Fund, Class K and Class I (formerly Institutional Class) shares, each of which, along with Class B shares, has equal rights as to assets and voting privileges. Class B shares are closed to new accounts and additional purchases, except for exchanges and reinvestments. Each class has exclusive voting rights with respect to matters that affect that class. Class B shares will automatically convert to Class A shares after a holding period of seven years from the initial date of purchase.
2. Investments in Fidelity Central Funds.
The Fund invests in Fidelity Central Funds, which are open-end investment companies generally available only to other investment companies and accounts managed by the investment adviser and its affiliates. The Fund's Schedule of Investments lists each of the Fidelity Central Funds held as of period end, if any, as an investment of the Fund, but does not include the underlying holdings of each Fidelity Central Fund. As an Investing Fund, the Fund indirectly bears its proportionate share of the expenses of the underlying Fidelity Central Funds.
The Money Market Central Funds seek preservation of capital and current income and are managed by Fidelity Investments Money Management, Inc. (FIMM), an affiliate of the investment adviser. Annualized expenses of the Money Market Central Funds as of their most recent shareholder report date are less than .005%.
A complete unaudited list of holdings for each Fidelity Central Fund is available upon request or at the Securities and Exchange Commission (the SEC) website at www.sec.gov. In addition, the financial statements of the Fidelity Central Funds, which are not covered by the Fund's Report of Independent Registered Public Accounting Firm, are available on the SEC website or upon request.
3. Significant Accounting Policies.
The financial statements have been prepared in conformity with accounting principles generally accepted in the United States of America (GAAP), which require management to make certain estimates and assumptions at the date of the financial statements. Actual results could differ from those estimates. Subsequent events, if any, through the date that the financial statements were issued have been evaluated in the preparation of the financial statements. The following summarizes the significant accounting policies of the Fund:
Investment Valuation. Investments are valued as of 4:00 p.m. Eastern time on the last calendar day of the period. The Board of Trustees (the Board) has delegated the day to day responsibility for the valuation of the Fund's investments to the Fidelity Management & Research Company (FMR) Fair Value Committee (the Committee). In accordance with valuation policies and procedures approved by the Board, the Fund attempts to obtain prices from one or more third party pricing vendors or brokers to value its investments. When current market prices, quotations or currency exchange rates are not readily available or reliable, investments will be fair valued in good faith by the Committee, in accordance with procedures adopted by the Board. Factors used in determining fair value vary by investment type and may include market or investment specific events, changes in interest rates and credit quality. The frequency with which these procedures are used cannot be predicted and they may be utilized to a significant extent. The Committee oversees the Fund's valuation policies and procedures and reports to the Board on the Committee's activities and fair value determinations. The Board monitors the appropriateness of the procedures used in valuing the Fund's investments and ratifies the fair value determinations of the Committee.
The Fund categorizes the inputs to valuation techniques used to value its investments into a disclosure hierarchy consisting of three levels as shown below:
- Level 1 – quoted prices in active markets for identical investments
- Level 2 – other significant observable inputs (including quoted prices for similar investments, interest rates, prepayment speeds, etc.)
- Level 3 – unobservable inputs (including the Fund's own assumptions based on the best information available)
Valuation techniques used to value the Fund's investments by major category are as follows:
Equity securities, including restricted securities, for which market quotations are readily available, are valued at the last reported sale price or official closing price as reported by a third party pricing vendor on the primary market or exchange on which they are traded and are categorized as Level 1 in the hierarchy. In the event there were no sales during the day or closing prices are not available, securities are valued at the last quoted bid price or may be valued using the last available price and are generally categorized as Level 2 in the hierarchy. For foreign equity securities, when market or security specific events arise, comparisons to the valuation of American Depositary Receipts (ADRs), futures contracts, Exchange-Traded Funds (ETFs) and certain indexes as well as quoted prices for similar securities may be used and would be categorized as Level 2 in the hierarchy. Utilizing these techniques may result in transfers between Level 1 and Level 2. For equity securities, including restricted securities, where observable inputs are limited, assumptions about market activity and risk are used and these securities may be categorized as Level 3 in the hierarchy.
Debt securities, including restricted securities, are valued based on evaluated prices received from third party pricing vendors or from brokers who make markets in such securities. Corporate bonds are valued by pricing vendors who utilize matrix pricing which considers yield or price of bonds of comparable quality, coupon, maturity and type or by broker-supplied prices. When independent prices are unavailable or unreliable, debt securities may be valued utilizing pricing methodologies which consider similar factors that would be used by third party pricing vendors. Debt securities are generally categorized as Level 2 in the hierarchy but may be Level 3 depending on the circumstances.
Investments in open-end mutual funds, including the Fidelity Central Funds, are valued at their closing net asset value (NAV) each business day and are categorized as Level 1 in the hierarchy.
Changes in valuation techniques may result in transfers in or out of an assigned level within the disclosure hierarchy. The aggregate value of investments by input level as of November 30, 2015, is included at the end of the Fund's Schedule of Investments.
Foreign Currency. The Fund may use foreign currency contracts to facilitate transactions in foreign-denominated securities. Gains and losses from these transactions may arise from changes in the value of the foreign currency or if the counterparties do not perform under the contracts' terms.
Foreign-denominated assets, including investment securities, and liabilities are translated into U.S. dollars at the exchange rates at period end. Purchases and sales of investment securities, income and dividends received and expenses denominated in foreign currencies are translated into U.S. dollars at the exchange rate in effect on the transaction date.
The effects of exchange rate fluctuations on investments are included with the net realized and unrealized gain (loss) on investment securities. Other foreign currency transactions resulting in realized and unrealized gain (loss) are disclosed separately.
Investment Transactions and Income. For financial reporting purposes, the Fund's investment holdings and NAV include trades executed through the end of the last business day of the period. The NAV per share for processing shareholder transactions is calculated as of the close of business of the New York Stock Exchange (NYSE), normally 4:00 p.m. Eastern time and includes trades executed through the end of the prior business day. Gains and losses on securities sold are determined on the basis of identified cost and may include proceeds received from litigation. Dividend income is recorded on the ex-dividend date, except for certain dividends from foreign securities where the ex-dividend date may have passed, which are recorded as soon as the Fund is informed of the ex-dividend date. Non-cash dividends included in dividend income, if any, are recorded at the fair market value of the securities received. Income and capital gain distributions from Fidelity Central Funds, if any, are recorded on the ex-dividend date. Distributions received on securities that represent a return of capital or capital gain are recorded as a reduction of cost of investments and/or as a realized gain. Subsequent to ex-dividend date the Fund determines the components of these distributions, based upon receipt of tax filings or other correspondence relating to the underlying investment. Interest income is accrued as earned and includes coupon interest and amortization of premium and accretion of discount on debt securities as applicable. Investment income is recorded net of foreign taxes withheld where recovery of such taxes is uncertain.
Class Allocations and Expenses. Investment income, realized and unrealized capital gains and losses, common expenses of the Fund, and certain fund-level expense reductions, if any, are allocated daily on a pro-rata basis to each class based on the relative net assets of each class to the total net assets of the Fund. Each class differs with respect to transfer agent and distribution and service plan fees incurred. Certain expense reductions may also differ by class. For the reporting period, the allocated portion of income and expenses to each class as a percent of its average net assets may vary due to the timing of recording these transactions in relation to fluctuating net assets of the classes. Expenses directly attributable to a fund are charged to that fund. Expenses attributable to more than one fund are allocated among the respective funds on the basis of relative net assets or other appropriate methods. Expense estimates are accrued in the period to which they relate and adjustments are made when actual amounts are known.
Income Tax Information and Distributions to Shareholders. Each year, the Fund intends to qualify as a regulated investment company under Subchapter M of the Internal Revenue Code, including distributing substantially all of its taxable income and realized gains. As a result, no provision for U.S. Federal income taxes is required. As of November 30, 2015, the Fund did not have any unrecognized tax benefits in the financial statements; nor is the Fund aware of any tax positions for which it is reasonably possible that the total amounts of unrecognized tax benefits will significantly change in the next twelve months. The Fund files a U.S. federal tax return, in addition to state and local tax returns as required. The Fund's federal income tax returns are subject to examination by the Internal Revenue Service (IRS) for a period of three fiscal years after they are filed. State and local tax returns may be subject to examination for an additional fiscal year depending on the jurisdiction. Foreign taxes are provided for based on the Fund's understanding of the tax rules and rates that exist in the foreign markets in which it invests.
Distributions are declared and recorded on the ex-dividend date. Income dividends and capital gain distributions are declared separately for each class. Income and capital gain distributions are determined in accordance with income tax regulations, which may differ from GAAP. These differences resulted in distribution reclassifications.
Capital accounts within the financial statements are adjusted for permanent book-tax differences. These adjustments have no impact on net assets or the results of operations. Capital accounts are not adjusted for temporary book-tax differences which will reverse in a subsequent period.
Book-tax differences are primarily due to foreign currency transactions, passive foreign investment companies (PFIC), partnerships, market discount, deferred trustees compensation, capital loss carryforwards and losses deferred due to wash sales and tax regulations.
The federal tax cost of investment securities and unrealized appreciation (depreciation) as of period end were as follows:
| Gross unrealized appreciation | $487,259 |
| Gross unrealized depreciation | (37,739) |
| Net unrealized appreciation (depreciation) on securities | $449,520 |
| Tax Cost | $863,860 |
The tax-based components of distributable earnings as of period end were as follows:
| Undistributed ordinary income | $12,594 |
| Capital loss carryforward | $(133,637) |
| Net unrealized appreciation (depreciation) on securities and other investments | $449,520 |
Capital loss carryforwards are only available to offset future capital gains of the Fund to the extent provided by regulations and may be limited. Under the Regulated Investment Company Modernization Act of 2010 (the Act), the Fund is permitted to carry forward capital losses incurred in taxable years beginning after December 22, 2010 for an unlimited period and such capital losses are required to be used prior to any losses that expire. The capital loss carryforward information presented below, including any applicable limitation, is estimated as of fiscal period end and is subject to adjustment.
| Fiscal year of expiration | |
| 2017 | $(133,637) |
The Fund intends to elect to defer to its next fiscal year $734 of capital losses recognized during the period November 1, 2015 to November 30, 2015.
The tax character of distributions paid was as follows:
| November 30, 2015 | November 30, 2014 | |
| Ordinary Income | $13,019 | $ 10,331 |
4. Purchases and Sales of Investments.
Purchases and sales of securities, other than short-term securities, aggregated $129,951 and $350,153, respectively.
5. Fees and Other Transactions with Affiliates.
Management Fee. Fidelity Management & Research Company (the investment adviser) and its affiliates provide the Fund with investment management related services for which the Fund pays a monthly management fee. The management fee is the sum of an individual fund fee rate that is based on an annual rate of .30% of the Fund's average net assets and an annualized group fee rate that averaged .25% during the period. The group fee rate is based upon the average net assets of all the mutual funds advised by the investment adviser, including any mutual funds previously advised by the investment adviser that are currently advised by Fidelity SelectCo, LLC, an affiliate of the investment adviser. The group fee rate decreases as assets under management increase and increases as assets under management decrease. In addition, the management fee is subject to a performance adjustment (up to a maximum of +/- .20% of the Fund's average net assets over a 36 month performance period). The upward or downward adjustment to the management fee is based on the relative investment performance of Fidelity Value Strategies Fund as compared to its benchmark index, the Russell Midcap Value Index, over the same 36 month performance period. For the reporting period, the total annual management fee rate, including the performance adjustment, was .42% of the Fund's average net assets. The performance adjustment included in the management fee rate may be higher or lower than the maximum performance adjustment rate due to the difference between the average net assets for the reporting and performance periods.
Distribution and Service Plan Fees. In accordance with Rule 12b-1 of the 1940 Act, the Fund has adopted separate Distribution and Service Plans for each class of shares. Certain classes pay Fidelity Distributors Corporation (FDC), an affiliate of the investment adviser, separate Distribution and Service Fees, each of which is based on an annual percentage of each class' average net assets. In addition, FDC may pay financial intermediaries for selling shares of the Fund and providing shareholder support services. For the period, the Distribution and Service Fee rates, total fees and amounts retained by FDC were as follows:
| Distribution Fee | Service Fee | Total Fees | Retained by FDC | |
| Class A | -% | .25% | $573 | $5 |
| Class T | .25% | .25% | 1,574 | 12 |
| Class B | .75% | .25% | 56 | 42 |
| Class C | .75% | .25% | 522 | 24 |
| $2,725 | $83 |
Sales Load. FDC may receive a front-end sales charge of up to 5.75% for selling Class A shares and 3.50% for selling Class T shares, some of which is paid to financial intermediaries for selling shares of the Fund. Depending on the holding period, FDC may receive contingent deferred sales charges levied on Class A, Class T, Class B, and Class C redemptions. The deferred sales charges range from 5.00% to 1.00% for Class B shares, 1.00% for Class C shares, 1.00% for certain purchases of Class A shares and .25% for certain purchases of Class T shares.
For the period, sales charge amounts retained by FDC were as follows:
| Retained by FDC | |
| Class A | $21 |
| Class T | 8 |
| Class B(a) | 2 |
| Class C(a) | 2 |
| $33 |
(a) When Class B and Class C shares are initially sold, FDC pays commissions from its own resources to financial intermediaries through which the sales are made.
Transfer Agent Fees. Fidelity Investments Institutional Operations Company, Inc., (FIIOC), an affiliate of the investment adviser, is the transfer, dividend disbursing and shareholder servicing agent for each class of the Fund. FIIOC receives account fees and asset-based fees that vary according to the account size and type of account of the shareholders of the respective classes of the Fund, except for Class K. FIIOC receives an asset-based fee of Class K's average net assets. FIIOC pays for typesetting, printing and mailing of shareholder reports, except proxy statements.
For the period, transfer agent fees for each class were as follows:
| Amount | % of Class-Level Average Net Assets | |
| Class A | $508 | .22 |
| Class T | 583 | .19 |
| Class B | 17 | .30 |
| Class C | 122 | .23 |
| Fidelity Value Strategies Fund | 1,437 | .21 |
| Class K | 37 | .05 |
| Class I | 173 | .22 |
| $2,877 |
Accounting and Security Lending Fees. Fidelity Service Company, Inc. (FSC), an affiliate of the investment adviser, maintains the Fund's accounting records. The accounting fee is based on the level of average net assets for each month. Under a separate contract, FSC administers the security lending program. The security lending fee is based on the number and duration of lending transactions.
Brokerage Commissions. The Fund placed a portion of its portfolio transactions with brokerage firms which are affiliates of the investment adviser. Brokerage commissions are included in net realized gain (loss) and change in net unrealized appreciation (depreciation) in the Statement of Operations. The commissions paid to these affiliated firms were $5 for the period.
6. Committed Line of Credit.
The Fund participates with other funds managed by the investment adviser or an affiliate in a $4.25 billion credit facility (the "line of credit") to be utilized for temporary or emergency purposes to fund shareholder redemptions or for other short-term liquidity purposes. The Fund has agreed to pay commitment fees on its pro-rata portion of the line of credit, which amounted to $2 and is reflected in Miscellaneous expenses on the Statement of Operations. During the period, the Fund did not borrow on this line of credit.
7. Security Lending.
The Fund lends portfolio securities through a lending agent from time to time in order to earn additional income. For equity securities, a lending agent is used and may loan securities to certain qualified borrowers, including Fidelity Capital Markets (FCM), a broker-dealer affiliated with the Fund. On the settlement date of the loan, the Fund receives collateral (in the form of U.S. Treasury obligations, letters of credit and/or cash) against the loaned securities and maintains collateral in an amount not less than 100% of the market value of the loaned securities during the period of the loan. The market value of the loaned securities is determined at the close of business of the Fund and any additional required collateral is delivered to the Fund on the next business day. The Fund or borrower may terminate the loan at any time, and if the borrower defaults on its obligation to return the securities loaned because of insolvency or other reasons, the Fund may apply collateral received from the borrower against the obligation. The Fund may experience delays and costs in recovering the securities loaned. Any cash collateral received is invested in the Fidelity Securities Lending Cash Central Fund. The value of loaned securities and cash collateral at period end are disclosed on the Fund's Statement of Assets and Liabilities. At period end, there were no security loans outstanding with FCM. Security lending income represents the income earned on investing cash collateral, less rebates paid to borrowers and any lending agent fees associated with the loan, plus any premium payments received for lending certain types of securities. Security lending income is presented in the Statement of Operations as a component of income from Fidelity Central Funds. Total security lending income during the period amounted to $791, including $3 from securities loaned to FCM.
8. Expense Reductions.
Commissions paid to certain brokers with whom the investment adviser, or its affiliates, places trades on behalf of the Fund include an amount in addition to trade execution, which may be rebated back to the Fund to offset certain expenses. This amount totaled $39 for the period.
In addition, during the period the investment adviser reimbursed and/or waived a portion of fund-level operating expenses in the amount of $6 and a portion of class-level operating expenses as follows:
| Amount | |
| Class A | $5 |
| Class T | 8 |
| Class B | –(a) |
| Class C | 1 |
| Fidelity Value Strategies Fund | 17 |
| Class I | 1 |
| $32 |
(a) In the amount of less than five hundred dollars.
9. Distributions to Shareholders.
Distributions to shareholders of each class were as follows:
| Years ended November 30, | 2015 | 2014 |
| From net investment income | ||
| Class A | $1,691 | $1,567 |
| Class T | 1,553 | 1,415 |
| Class C | 56 | 32 |
| Fidelity Value Strategies Fund | 6,934 | 5,578 |
| Class K | 896 | 1,131 |
| Class I | 799 | 608 |
| Total | $11,929 | $10,331 |
| From net realized gain | ||
| Class A | $174 | $– |
| Class T | 234 | – |
| Class C | 44 | – |
| Fidelity Value Strategies Fund | 520 | – |
| Class K | 58 | – |
| Class I | 60 | – |
| Total | $1,090 | $– |
10. Share Transactions.
Share transactions for each class were as follows and may contain automatic conversions between classes or exchanges between funds:
| Shares | Shares | Dollars | Dollars | |
| Years ended November 30, | 2015 | 2014 | 2015 | 2014 |
| Class A | ||||
| Shares sold | 391 | 546 | $15,470 | $20,399 |
| Reinvestment of distributions | 46 | 41 | 1,760 | 1,447 |
| Shares redeemed | (904) | (1,342) | (35,567) | (50,201) |
| Net increase (decrease) | (467) | (755) | $(18,337) | $(28,355) |
| Class T | ||||
| Shares sold | 486 | 435 | $19,926 | $16,774 |
| Reinvestment of distributions | 41 | 35 | 1,646 | 1,293 |
| Shares redeemed | (1,296) | (1,420) | (52,610) | (54,916) |
| Net increase (decrease) | (769) | (950) | $(31,038) | $(36,849) |
| Class B | ||||
| Shares sold | – | 1 | $12 | $30 |
| Reinvestment of distributions | – | – | – | – |
| Shares redeemed | (95) | (140) | (3,438) | (4,799) |
| Net increase (decrease) | (95) | (139) | $(3,426) | $(4,769) |
| Class C | ||||
| Shares sold | 131 | 125 | $4,724 | $4,210 |
| Reinvestment of distributions | 3 | 1 | 95 | 29 |
| Shares redeemed | (237) | (282) | (8,407) | (9,502) |
| Net increase (decrease) | (103) | (156) | $(3,588) | $(5,263) |
| Fidelity Value Strategies Fund | ||||
| Shares sold | 3,980 | 7,626 | $174,437 | $315,612 |
| Reinvestment of distributions | 106 | 127 | 4,551 | 4,998 |
| Shares redeemed | (5,750) | (6,627) | (250,149) | (273,372) |
| Net increase (decrease) | (1,664) | 1,126 | $(71,161) | $47,238 |
| Class K | ||||
| Shares sold | 390 | 669 | $17,106 | $27,831 |
| Reinvestment of distributions | 22 | 29 | 954 | 1,131 |
| Shares redeemed | (1,001) | (1,437) | (44,142) | (60,236) |
| Net increase (decrease) | (589) | (739) | $(26,082) | $(31,274) |
| Class I | ||||
| Shares sold | 288 | 522 | $12,081 | $20,905 |
| Reinvestment of distributions | 18 | 14 | 748 | 523 |
| Shares redeemed | (809) | (403) | (34,620) | (15,969) |
| Net increase (decrease) | (503) | 133 | $(21,791) | $5,459 |
11. Other.
The Fund's organizational documents provide former and current trustees and officers with a limited indemnification against liabilities arising in connection with the performance of their duties to the Fund. In the normal course of business, the Fund may also enter into contracts that provide general indemnifications. The Fund's maximum exposure under these arrangements is unknown as this would be dependent on future claims that may be made against the Fund. The risk of material loss from such claims is considered remote.
Report of Independent Registered Public Accounting Firm
To the Trustees of Fidelity Advisor Series I and Shareholders of Fidelity Advisor® Value Strategies Fund:
We have audited the accompanying statement of assets and liabilities of Fidelity Advisor® Value Strategies Fund (the Fund), a fund of Fidelity Advisor Series I, including the schedule of investments, as of November 30, 2015, and the related statement of operations for the year then ended, the statement of changes in net assets for each of the two years in the period then ended, and the financial highlights for each of the five years in the period then ended. These financial statements and financial highlights are the responsibility of the Fund's management. Our responsibility is to express an opinion on these financial statements and financial highlights based on our audits.
We conducted our audits in accordance with the standards of the Public Company Accounting Oversight Board (United States). Those standards require that we plan and perform the audit to obtain reasonable assurance about whether the financial statements and financial highlights are free of material misstatement. The Fund is not required to have, nor were we engaged to perform, an audit of its internal control over financial reporting. Our audits included consideration of internal control over financial reporting as a basis for designing audit procedures that are appropriate in the circumstances, but not for the purpose of expressing an opinion on the effectiveness of the Fund's internal control over financial reporting. Accordingly, we express no such opinion. An audit also includes examining, on a test basis, evidence supporting the amounts and disclosures in the financial statements, assessing the accounting principles used and significant estimates made by management, as well as evaluating the overall financial statement presentation. Our procedures included confirmation of securities owned as of November 30, 2015, by correspondence with the custodians and brokers. We believe that our audits provide a reasonable basis for our opinion.
In our opinion, such financial statements and financial highlights referred to above present fairly, in all material respects, the financial position of Fidelity Advisor® Value Strategies Fund as of November 30, 2015, the results of its operations for the year then ended, the changes in its net assets for each of the two years in the period then ended, and the financial highlights for each of the five years in the period then ended, in conformity with accounting principles generally accepted in the United States of America.
DELOITTE & TOUCHE LLP
Boston, Massachusetts
January 15, 2016
Trustees and Officers
The Trustees, Members of the Advisory Board (if any), and officers of the trust and fund, as applicable, are listed below. The Board of Trustees governs the fund and is responsible for protecting the interests of shareholders. The Trustees are experienced executives who meet periodically throughout the year to oversee the fund's activities, review contractual arrangements with companies that provide services to the fund, oversee management of the risks associated with such activities and contractual arrangements, and review the fund's performance. Each of the Trustees oversees 170 funds.
The Trustees hold office without limit in time except that (a) any Trustee may resign; (b) any Trustee may be removed by written instrument, signed by at least two-thirds of the number of Trustees prior to such removal; (c) any Trustee who requests to be retired or who has become incapacitated by illness or injury may be retired by written instrument signed by a majority of the other Trustees; and (d) any Trustee may be removed at any special meeting of shareholders by a two-thirds vote of the outstanding voting securities of the trust. Each Trustee who is not an interested person (as defined in the 1940 Act) of the trust and the fund is referred to herein as an Independent Trustee. Each Independent Trustee shall retire not later than the last day of the calendar year in which his or her 75th birthday occurs. The Independent Trustees may waive this mandatory retirement age policy with respect to individual Trustees. Officers and Advisory Board Members hold office without limit in time, except that any officer or Advisory Board Member may resign or may be removed by a vote of a majority of the Trustees at any regular meeting or any special meeting of the Trustees. Except as indicated, each individual has held the office shown or other offices in the same company for the past five years.
The fund’s Statement of Additional Information (SAI) includes more information about the Trustees. To request a free copy, call Fidelity at 1-800-544-8544.
Experience, Skills, Attributes, and Qualifications of the Trustees. The Governance and Nominating Committee has adopted a statement of policy that describes the experience, qualifications, attributes, and skills that are necessary and desirable for potential Independent Trustee candidates (Statement of Policy). The Board believes that each Trustee satisfied at the time he or she was initially elected or appointed a Trustee, and continues to satisfy, the standards contemplated by the Statement of Policy. The Governance and Nominating Committee also engages professional search firms to help identify potential Independent Trustee candidates who have the experience, qualifications, attributes, and skills consistent with the Statement of Policy. From time to time, additional criteria based on the composition and skills of the current Independent Trustees, as well as experience or skills that may be appropriate in light of future changes to board composition, business conditions, and regulatory or other developments, have also been considered by the professional search firms and the Governance and Nominating Committee. In addition, the Board takes into account the Trustees' commitment and participation in Board and committee meetings, as well as their leadership of standing and ad hoc committees throughout their tenure.
In determining that a particular Trustee was and continues to be qualified to serve as a Trustee, the Board has considered a variety of criteria, none of which, in isolation, was controlling. The Board believes that, collectively, the Trustees have balanced and diverse experience, qualifications, attributes, and skills, which allow the Board to operate effectively in governing the fund and protecting the interests of shareholders. Information about the specific experience, skills, attributes, and qualifications of each Trustee, which in each case led to the Board's conclusion that the Trustee should serve (or continue to serve) as a trustee of the fund, is provided below.
Board Structure and Oversight Function. James C. Curvey is an interested person and currently serves as Chairman. The Trustees have determined that an interested Chairman is appropriate and benefits shareholders because an interested Chairman has a personal and professional stake in the quality and continuity of services provided to the fund. Independent Trustees exercise their informed business judgment to appoint an individual of their choosing to serve as Chairman, regardless of whether the Trustee happens to be independent or a member of management. The Independent Trustees have determined that they can act independently and effectively without having an Independent Trustee serve as Chairman and that a key structural component for assuring that they are in a position to do so is for the Independent Trustees to constitute a substantial majority for the Board. The Independent Trustees also regularly meet in executive session. Ned C. Lautenbach serves as Chairman of the Independent Trustees and as such (i) acts as a liaison between the Independent Trustees and management with respect to matters important to the Independent Trustees and (ii) with management prepares agendas for Board meetings.
Fidelity® funds are overseen by different Boards of Trustees. The fund's Board oversees Fidelity's high income and certain equity funds, and other Boards oversee Fidelity's investment-grade bond, money market, asset allocation, and sector funds. The asset allocation funds may invest in Fidelity® funds overseen by the fund's Board. The use of separate Boards, each with its own committee structure, allows the Trustees of each group of Fidelity® funds to focus on the unique issues of the funds they oversee, including common research, investment, and operational issues. On occasion, the separate Boards establish joint committees to address issues of overlapping consequences for the Fidelity® funds overseen by each Board.
The Trustees operate using a system of committees to facilitate the timely and efficient consideration of all matters of importance to the Trustees, the fund, and fund shareholders and to facilitate compliance with legal and regulatory requirements and oversight of the fund's activities and associated risks. The Board, acting through its committees, has charged FMR and its affiliates with (i) identifying events or circumstances the occurrence of which could have demonstrably adverse effects on the fund's business and/or reputation; (ii) implementing processes and controls to lessen the possibility that such events or circumstances occur or to mitigate the effects of such events or circumstances if they do occur; and (iii) creating and maintaining a system designed to evaluate continuously business and market conditions in order to facilitate the identification and implementation processes described in (i) and (ii) above. Because the day-to-day operations and activities of the fund are carried out by or through FMR, its affiliates, and other service providers, the fund's exposure to risks is mitigated but not eliminated by the processes overseen by the Trustees. While each of the Board's committees has responsibility for overseeing different aspects of the fund's activities, oversight is exercised primarily through the Operations, Audit, and Compliance Committees. In addition, the Independent Trustees have worked with FMR to enhance the Board's oversight of investment and financial risks, legal and regulatory risks, technology risks, and operational risks, including the development of additional risk reporting to the Board. For example, a working group comprised of Independent Trustees and FMR has worked and continues to work to review the Fidelity® funds' valuation-related activities, reporting and risk management. Appropriate personnel, including but not limited to the fund's Chief Compliance Officer (CCO), FMR's internal auditor, the independent accountants, the fund's Treasurer and portfolio management personnel, make periodic reports to the Board's committees, as appropriate, including an annual review of Fidelity's risk management program for the Fidelity® funds. The responsibilities of each standing committee, including their oversight responsibilities, are described further under "Standing Committees of the Trustees."
Interested Trustees*:
Correspondence intended for a Trustee who is an interested person may be sent to Fidelity Investments, 245 Summer Street, Boston, Massachusetts 02210.
Name, Year of Birth; Principal Occupations and Other Relevant Experience+
James C. Curvey (1935)
Year of Election or Appointment: 2007
Trustee
Chairman of the Board of Trustees
Mr. Curvey also serves as Trustee of other Fidelity® funds. Mr. Curvey is a Director of Fidelity Research & Analysis Co. (investment adviser firm, 2009-present), and Vice Chairman (2007-present) and Director of FMR LLC (diversified financial services company). In addition, Mr. Curvey serves as an Overseer for the Boston Symphony Orchestra and a member of the board of Artis-Naples, Naples, Florida, and as a Trustee for Brewster Academy, Wolfeboro, New Hampshire. Previously, Mr. Curvey served as a Director of Fidelity Investments Money Management, Inc. (investment adviser firm, 2009-2014) and a Director of FMR and FMR Co., Inc. (investment adviser firms, 2007-2014).
Charles S. Morrison (1960)
Year of Election or Appointment: 2014
Trustee
Mr. Morrison also serves as Trustee of other funds. He serves as a Director of Fidelity Investments Money Management, Inc. (FIMM) (investment adviser firm, 2014-present), Director of Fidelity SelectCo, LLC (investment adviser firm, 2014-present), President, Asset Management (2014-present), and is an employee of Fidelity Investments. Previously, Mr. Morrison served as Vice President of Fidelity's Fixed Income and Asset Allocation Funds (2012-2014), President, Fixed Income (2011-2014), Vice President of Fidelity's Money Market Funds (2005-2009), President, Money Market Group Leader of FMR (investment adviser firm, 2009), and Senior Vice President, Money Market Group of FMR (2004-2009). Mr. Morrison also served as Vice President of Fidelity's Bond Funds (2002-2005), certain Balanced Funds (2002-2005), and certain Asset Allocation Funds (2002-2007), and as Senior Vice President (2002-2005) of Fidelity's Bond Division.
* Determined to be an “Interested Trustee” by virtue of, among other things, his or her affiliation with the trust or various entities under common control with FMR.
+ The information includes the Trustee's principal occupation during the last five years and other information relating to the experience, attributes, and skills relevant to the Trustee's qualifications to serve as a Trustee, which led to the conclusion that the Trustee should serve as a Trustee for the fund.
Independent Trustees:
Correspondence intended for an Independent Trustee may be sent to Fidelity Investments, P.O. Box 55235, Boston, Massachusetts 02205-5235.
Name, Year of Birth; Principal Occupations and Other Relevant Experience+
Dennis J. Dirks (1948)
Year of Election or Appointment: 2005
Trustee
Mr. Dirks also serves as Trustee of other Fidelity® funds. Prior to his retirement in May 2003, Mr. Dirks was Chief Operating Officer and a member of the Board of The Depository Trust & Clearing Corporation (DTCC). He also served as President, Chief Operating Officer, and Board member of The Depository Trust Company (DTC) and President and Board member of the National Securities Clearing Corporation (NSCC). In addition, Mr. Dirks served as Chief Executive Officer and Board member of the Government Securities Clearing Corporation, Chief Executive Officer and Board member of the Mortgage-Backed Securities Clearing Corporation, as a Trustee and a member of the Finance Committee of Manhattan College (2005-2008), as a Trustee and a member of the Finance Committee of AHRC of Nassau County (2006-2008), and as a member of the Independent Directors Council (IDC) Governing Council (2010-2015). Mr. Dirks is a member of the Board of Directors for The Brookville Center for Children's Services, Inc. (2009-present).
Alan J. Lacy (1953)
Year of Election or Appointment: 2008
Trustee
Mr. Lacy also serves as Trustee of other Fidelity® funds. Mr. Lacy serves as a member of the Board of Directors of Dave & Buster's Entertainment, Inc. (restaurant and entertainment complexes, 2010-present) and Bristol-Myers Squibb Company (global pharmaceuticals, 2008-present). In addition, Mr. Lacy served as Senior Adviser (2007-2014) of Oak Hill Capital Partners, L.P. (private equity) and also served as Chief Executive Officer (2000-2005) and Vice Chairman (2005-2006) of Sears Holdings Corporation and Sears, Roebuck and Co. (retail). Mr. Lacy is a member of the Board of Trustees of The National Parks Conservation Association (2006-present). Previously, Mr. Lacy served as Chairman of the Board of Trustees of the National Parks Conservation Association (2008-2011) and as a member of the Board of Directors for The Western Union Company (global money transfer, 2006-2011), The Hillman Companies, Inc. (hardware wholesalers, 2010-2014), and Earth Fare, Inc. (retail grocery, 2010-2014).
Ned C. Lautenbach (1944)
Year of Election or Appointment: 2000
Trustee
Chairman of the Independent Trustees
Mr. Lautenbach also serves as Trustee of other Fidelity® funds. Mr. Lautenbach currently serves as the Lead Director of the Eaton Corporation Board of Directors (diversified industrial, 1997-present). Mr. Lautenbach is Chairman of the Board of Directors of Artis-Naples in Naples, Florida (2012-present), a member of the Council on Foreign Relations (1994-present), and a member of the Board of Governors, State University System of Florida (2013-present). Previously, Mr. Lautenbach was a Partner/Advisory Partner at Clayton, Dubilier & Rice, LLC (private equity investment, 1998-2010), as well as a Director of Sony Corporation (2006-2007).
Joseph Mauriello (1944)
Year of Election or Appointment: 2008
Trustee
Mr. Mauriello also serves as Trustee of other Fidelity® funds. Prior to his retirement in January 2006, Mr. Mauriello served in numerous senior management positions including Deputy Chairman and Chief Operating Officer (2004-2005), and Vice Chairman of Financial Services (2002-2004) of KPMG LLP US (professional services, 1965-2005). Mr. Mauriello currently serves as a member of the Board of Directors of XL Group plc. (global insurance and re-insurance, 2006-present) and the Independent Directors Council (IDC) Governing Council (2015-present). Previously, Mr. Mauriello served as a Director of the Hamilton Funds of the Bank of New York (2006-2007) and of Arcadia Resources Inc. (health care services and products, 2007-2012).
Robert W. Selander (1950)
Year of Election or Appointment: 2011
Trustee
Mr. Selander also serves as Trustee of other Fidelity® funds. Mr. Selander serves as a Director of The Western Union Company (global money transfer, 2014-present). Previously, Mr. Selander served as a Member of the Advisory Board of other Fidelity® funds (2011), and Executive Vice Chairman (2010), Chief Executive Officer (2009-2010), and President and Chief Executive Officer (1997-2009) of Mastercard, Inc.
Cornelia M. Small (1944)
Year of Election or Appointment: 2005
Trustee
Ms. Small also serves as Trustee of other Fidelity® funds. Ms. Small is a member of the Board of Directors (2009-present) and Chair of the Investment Committee (2010-present) of the Teagle Foundation. Ms. Small also serves on the Investment Committee of the Berkshire Taconic Community Foundation (2008-present). Previously, Ms. Small served as Chairperson (2002-2008) and a member of the Investment Committee and Chairperson (2008-2012) and a member of the Board of Trustees of Smith College. In addition, Ms. Small served as Chief Investment Officer, Director of Global Equity Investments, and a member of the Board of Directors of Scudder, Stevens & Clark and Scudder Kemper Investments.
William S. Stavropoulos (1939)
Year of Election or Appointment: 2002
Trustee
Vice Chairman of the Independent Trustees
Mr. Stavropoulos also serves as Trustee of other Fidelity® funds. Mr. Stavropoulos serves as President and Founder of the Michigan Baseball Foundation, the Great Lakes Loons (2007-present). Mr. Stavropoulos is Chairman Emeritus of the Board of Directors of The Dow Chemical Company, where he previously served in numerous senior management positions, including President, CEO (1995-2000; 2002-2004), Chairman of the Executive Committee (2000-2006), and as a member of the Board of Directors (1990-2006). Currently, Mr. Stavropoulos is Chairman of the Board of Directors of Univar Inc. (global distributor of commodity and specialty chemicals), a Director of Teradata Corporation (data warehousing and technology solutions), and Maersk Inc. (industrial conglomerate), and a member of the Advisory Board for Metalmark Capital LLC (private equity investment, 2005-present). Mr. Stavropoulos is an operating advisor to Clayton, Dubilier & Rice, LLC (private equity investment). In addition, Mr. Stavropoulos is a member of the University of Notre Dame Advisory Council for the College of Science, a Trustee of the Rollin L. Gerstacker Foundation, and a Director of the Naples Philharmonic Center for the Arts. Previously, Mr. Stavropoulos served as a Director of Chemical Financial Corporation (bank holding company, 1993-2012) and Tyco International, Ltd. (multinational manufacturing and services, 2007-2012).
David M. Thomas (1949)
Year of Election or Appointment: 2008
Trustee
Mr. Thomas also serves as Trustee of other Fidelity® funds. Mr. Thomas serves as Non-Executive Chairman of the Board of Directors of Fortune Brands Home and Security (home and security products, 2011-present), as a member of the Board of Directors (2004-present) and Presiding Director (2013-present) of Interpublic Group of Companies, Inc. (marketing communication), and as a member of the Board of Trustees of the University of Florida (2013-present). Previously, Mr. Thomas served as Executive Chairman (2005-2006) and Chairman and Chief Executive Officer (2000-2005) of IMS Health, Inc. (pharmaceutical and healthcare information solutions), and a Director of Fortune Brands, Inc. (consumer products, 2000-2011).
+ The information includes the Trustee's principal occupation during the last five years and other information relating to the experience, attributes, and skills relevant to the Trustee's qualifications to serve as a Trustee, which led to the conclusion that the Trustee should serve as a Trustee for the fund.
Advisory Board Members and Officers:
Correspondence intended for an officer or Peter S. Lynch may be sent to Fidelity Investments, 245 Summer Street, Boston, Massachusetts 02210. Officers appear below in alphabetical order.
Name, Year of Birth; Principal Occupation
Peter S. Lynch (1944)
Year of Election or Appointment: 2003
Member of the Advisory Board
Mr. Lynch also serves as Member of the Advisory Board of other Fidelity® funds. Mr. Lynch is Vice Chairman and a Director of FMR (investment adviser firm) and FMR Co., Inc. (investment adviser firm). In addition, Mr. Lynch serves as a Trustee of Boston College and as the Chairman of the Inner-City Scholarship Fund. Previously, Mr. Lynch served on the Special Olympics International Board of Directors (1997-2006).
Elizabeth Paige Baumann (1968)
Year of Election or Appointment: 2012
Anti-Money Laundering (AML) Officer
Ms. Baumann also serves as AML Officer of other funds. She is Chief AML Officer of FMR LLC (diversified financial services company, 2012-present) and is an employee of Fidelity Investments. Previously, Ms. Baumann served as Vice President and Deputy Anti-Money Laundering Officer (2007-2012).
Marc R. Bryant (1966)
Year of Election or Appointment: 2015
Secretary and Chief Legal Officer (CLO)
Mr. Bryant also serves as Secretary and CLO of other funds. Mr. Bryant serves as CLO, Secretary, and Senior Vice President of Fidelity Management & Research Company (investment adviser firm, 2015-present) and FMR Co., Inc. (investment adviser firm, 2015-present); Secretary of Fidelity SelectCo, LLC (investment adviser firm, 2015-present) and Fidelity Investments Money Management, Inc. (investment adviser firm, 2015-present); and CLO of Fidelity Management & Research (Hong Kong) Limited (investment adviser firm, 2015-present). He is Senior Vice President and Deputy General Counsel of FMR LLC (diversified financial services company). Previously, Mr. Bryant served as Secretary and CLO of Fidelity Rutland Square Trust II (2010-2014) and Assistant Secretary of Fidelity's Fixed Income and Asset Allocation Funds (2013-2015). Prior to joining Fidelity Investments, Mr. Bryant served as a Senior Vice President and the Head of Global Retail Legal for AllianceBernstein L.P. (2006-2010), and as the General Counsel for ProFund Advisors LLC (2001-2006).
William C. Coffey (1969)
Year of Election or Appointment: 2009
Assistant Secretary
Mr. Coffey also serves as Assistant Secretary of other funds. He is Senior Vice President and Deputy General Counsel of FMR LLC (diversified financial services company, 2010-present), and is an employee of Fidelity Investments. Previously, Mr. Coffey served as Vice President and Associate General Counsel of FMR LLC (2005-2009).
Jonathan Davis (1968)
Year of Election or Appointment: 2010
Assistant Treasurer
Mr. Davis also serves as Assistant Treasurer of other funds, and is an employee of Fidelity Investments. Previously, Mr. Davis served as Vice President and Associate General Counsel of FMR LLC (diversified financial services company, 2003-2010).
Adrien E. Deberghes (1967)
Year of Election or Appointment: 2008
Deputy Treasurer
Mr. Deberghes also serves as an officer of other funds. He is an employee of Fidelity Investments (2008-present). Prior to joining Fidelity Investments, Mr. Deberghes was Senior Vice President of Mutual Fund Administration at State Street Corporation (2007-2008), Senior Director of Mutual Fund Administration at Investors Bank & Trust (2005-2007), and Director of Finance for Dunkin' Brands (2000-2005).
Stephanie J. Dorsey (1969)
Year of Election or Appointment: 2010
Assistant Treasurer
Ms. Dorsey also serves as an officer of other funds. She is an employee of Fidelity Investments (2008-present) and has served in other fund officer roles. Prior to joining Fidelity Investments, Ms. Dorsey served as Treasurer (2004-2008) of the JPMorgan Mutual Funds and Vice President (2004-2008) of JPMorgan Chase Bank.
Howard J. Galligan III (1966)
Year of Election or Appointment: 2014
Chief Financial Officer
Mr. Galligan also serves as Chief Financial Officer of other funds. Mr. Galligan serves as President of Fidelity Pricing and Cash Management Services (FPCMS) (2014-present) and as a Director of Strategic Advisers, Inc. (investment adviser firm, 2008-present). Previously, Mr. Galligan served as Chief Administrative Officer of Asset Management (2011-2014) and Chief Operating Officer and Senior Vice President of Investment Support for Strategic Advisers, Inc. (2003-2011).
Scott C. Goebel (1968)
Year of Election or Appointment: 2015
Vice President
Mr. Goebel serves as Vice President of other funds and is an employee of Fidelity Investments (2001-present). Previously, Mr. Goebel served as Secretary of Fidelity SelectCo, LLC (investment adviser firm, 2013-2015), Fidelity Investments Money Management, Inc. (FIMM) (investment adviser firm, 2010-2015), and Fidelity Research and Analysis Company (FRAC) (investment adviser firm, 2010-2015); General Counsel, Secretary, and Senior Vice President of Fidelity Management & Research Company (investment adviser firm, 2008-2015) and FMR Co., Inc. (investment adviser firm, 2008-2015); Assistant Secretary of Fidelity Management & Research (Japan) Limited (investment adviser firm, 2008-2015) and FMR Investment Management (U.K.) Limited (investment adviser firm, 2008-2015); Chief Legal Officer (CLO) of Fidelity Management & Research (Hong Kong) Limited (investment adviser firm, 2008-2015); Secretary and CLO of certain Fidelity® funds (2008-2015); Assistant Secretary of FIMM (2008-2010), FRAC (2008-2010), and certain funds (2007-2008); and as Vice President and Secretary of Fidelity Distributors Corporation (FDC) (2005-2007).
Thomas C. Hense (1964)
Year of Election or Appointment: 2008, 2010, or 2015
Vice President
Mr. Hense serves as Vice President of Fidelity Advisor® Multi-Asset Income Fund (2015) and other funds (High Income (2008), Small Cap (2008), and Value (2010) funds), and is an employee of Fidelity Investments (1993-present). Previously, Mr. Hense served as a portfolio manager for Fidelity's Institutional Money Management Group (Pyramis) (2003-2008).
Brian B. Hogan (1964)
Year of Election or Appointment: 2009
Vice President
Mr. Hogan also serves as Trustee or Vice President of other funds. Mr. Hogan serves as a Director of Fidelity SelectCo, LLC (investment adviser firm, 2014-present) and President of the Equity Division of FMR (investment adviser firm, 2009-present). Previously, Mr. Hogan served as Senior Vice President, Equity Research of FMR (2006-2009) and as a portfolio manager.
Chris Maher (1972)
Year of Election or Appointment: 2013
Assistant Treasurer
Mr. Maher serves as Assistant Treasurer of other funds. Mr. Maher is Vice President of Valuation Oversight and is an employee of Fidelity Investments. Previously, Mr. Maher served as Vice President of Asset Management Compliance (2013), Vice President of the Program Management Group of FMR (investment adviser firm, 2010-2013), and Vice President of Valuation Oversight (2008-2010).
Kenneth B. Robins (1969)
Year of Election or Appointment: 2008
President and Treasurer
Mr. Robins also serves as an officer of other funds. Mr. Robins serves as Executive Vice President of Fidelity Investments Money Management, Inc. (FIMM) (investment adviser firm, 2013-present) and is an employee of Fidelity Investments (2004-present). Previously, Mr. Robins served in other fund officer roles.
Stacie M. Smith (1974)
Year of Election or Appointment: 2013
Deputy Treasurer
Ms. Smith also serves as an officer of other funds. She is an employee of Fidelity Investments (2009-present) and has served in other fund officer roles. Prior to joining Fidelity Investments, Ms. Smith served as Senior Audit Manager of Ernst & Young LLP (1996-2009).
Renee Stagnone (1975)
Year of Election or Appointment: 2013
Deputy Treasurer
Ms. Stagnone also serves as Deputy Treasurer of other funds. Ms. Stagnone is an employee of Fidelity Investments (1997-present).
Linda J. Wondrack (1964)
Year of Election or Appointment: 2014
Chief Compliance Officer
Ms. Wondrack also serves as Chief Compliance Officer of other funds. Ms. Wondrack is Executive Vice President and head of the Ethics Office and Asset Management Compliance for Fidelity Investments (2012-present). Ms. Wondrack also serves as Chief Compliance Officer of Fidelity SelectCo, LLC (investment adviser firm, 2014-present); Chief Compliance Officer of Impresa Management LLC (2013-present); and Chief Compliance Officer of FMR Co., Inc. (investment adviser firm), Fidelity Investments Money Management, Inc. (investment adviser firm), Fidelity Management & Research (Japan) Limited (investment adviser firm), FMR Investment Management (U.K.) Limited (investment adviser firm), Fidelity Management & Research (Hong Kong) (investment adviser firm), Fidelity Management & Research Company (investment adviser firm), FIAM LLC (investment adviser firm), and Strategic Advisers, Inc. (investment adviser firm), Ballyrock Investment Advisors LLC, and Northern Neck Investors LLC (2012-present). Previously, Ms. Wondrack served as Senior Vice President and Chief Compliance Officer for Columbia Management Investment Advisers, LLC (2005-2012); Chief Compliance Officer for certain funds within the Columbia Family of Funds (2007-2012); and Senior Vice President of Compliance Risk Management at Bank of America (2005-2010).
Joseph F. Zambello (1957)
Year of Election or Appointment: 2011
Deputy Treasurer
Mr. Zambello also serves as Deputy Treasurer of other funds. Mr. Zambello is an employee of Fidelity Investments (1991-present). Previously, Mr. Zambello served as Vice President of the Program Management Group of FMR (investment adviser firm, 2009-2011) and Vice President of the Transfer Agent Oversight Group (2005-2009).
Shareholder Expense Example
As a shareholder of the Fund, you incur two types of costs: (1) transaction costs, including sales charges (loads) on purchase payments or redemption proceeds, and (2) ongoing costs, including management fees, distribution and/or service (12b-1) fees and other Fund expenses. This Example is intended to help you understand your ongoing costs (in dollars) of investing in the Fund and to compare these costs with the ongoing costs of investing in other mutual funds.
The Example is based on an investment of $1,000 invested at the beginning of the period and held for the entire period (June 1, 2015 to November 30, 2015).
Actual Expenses
The first line of the accompanying table for each class of the Fund provides information about actual account values and actual expenses. You may use the information in this line, together with the amount you invested, to estimate the expenses that you paid over the period. Simply divide your account value by $1,000.00 (for example, an $8,600 account value divided by $1,000.00 = 8.6), then multiply the result by the number in the first line for a class of the Fund under the heading entitled "Expenses Paid During Period" to estimate the expenses you paid on your account during this period. A small balance maintenance fee of $12.00 that is charged once a year may apply for certain accounts with a value of less than $2,000. This fee is not included in the table below. If it was, the estimate of expenses you paid during the period would be higher, and your ending account value lower, by this amount. In addition, the Fund, as a shareholder in the underlying Fidelity Central Funds, will indirectly bear its pro-rata share of the fees and expenses incurred by the underlying Fidelity Central Funds. These fees and expenses are not included in the Fund's annualized expense ratio used to calculate the expense estimate in the table below.
Hypothetical Example for Comparison Purposes
The second line of the accompanying table for each class of the Fund provides information about hypothetical account values and hypothetical expenses based on a Class' actual expense ratio and an assumed rate of return of 5% per year before expenses, which is not the Class' actual return. The hypothetical account values and expenses may not be used to estimate the actual ending account balance or expenses you paid for the period. You may use this information to compare the ongoing costs of investing in the Fund and other funds. To do so, compare this 5% hypothetical example with the 5% hypothetical examples that appear in the shareholder reports of the other funds. A small balance maintenance fee of $12.00 that is charged once a year may apply for certain accounts with a value of less than $2,000. This fee is not included in the table below. If it was, the estimate of expenses you paid during the period would be higher, and your ending account value lower, by this amount. In addition, the Fund, as a shareholder in the underlying Fidelity Central Funds, will indirectly bear its pro-rata share of the fees and expenses incurred by the underlying Fidelity Central Funds. These fees and expenses are not included in the Fund's annualized expense ratio used to calculate the expense estimate in the table below.
Please note that the expenses shown in the table are meant to highlight your ongoing costs only and do not reflect any transaction costs. Therefore, the second line of the table is useful in comparing ongoing costs only, and will not help you determine the relative total costs of owning different funds. In addition, if these transactional costs were included, your costs would have been higher.
| Annualized Expense Ratio-A | Beginning Account Value June 1, 2015 | Ending Account Value November 30, 2015 | Expenses Paid During Period-B June 1, 2015 to November 30, 2015 | |
| Class A | .91% | |||
| Actual | $1,000.00 | $943.40 | $4.43 | |
| Hypothetical-C | $1,000.00 | $1,020.51 | $4.61 | |
| Class T | 1.12% | |||
| Actual | $1,000.00 | $942.60 | $5.45 | |
| Hypothetical-C | $1,000.00 | $1,019.45 | $5.67 | |
| Class B | 1.73% | |||
| Actual | $1,000.00 | $939.70 | $8.41 | |
| Hypothetical-C | $1,000.00 | $1,016.39 | $8.74 | |
| Class C | 1.67% | |||
| Actual | $1,000.00 | $940.00 | $8.12 | |
| Hypothetical-C | $1,000.00 | $1,016.70 | $8.44 | |
| Fidelity Value Strategies Fund | .65% | |||
| Actual | $1,000.00 | $944.70 | $3.17 | |
| Hypothetical-C | $1,000.00 | $1,021.81 | $3.29 | |
| Class K | .49% | |||
| Actual | $1,000.00 | $945.50 | $2.39 | |
| Hypothetical-C | $1,000.00 | $1,022.61 | $2.48 | |
| Class I | .66% | |||
| Actual | $1,000.00 | $944.70 | $3.22 | |
| Hypothetical-C | $1,000.00 | $1,021.76 | $3.35 |
A Annualized expense ratio reflects expenses net of applicable fee waivers.
B Expenses are equal to each Class' annualized expense ratio, multiplied by the average account value over the period, multiplied by 183/365 (to reflect the one-half year period).
C 5% return per year before expenses
Distributions (Unaudited)
Fidelity Value Strategies Fund designates 100% of the dividends distributed during the fiscal year as qualifying for the dividends–received deduction for corporate shareholders.
Fidelity Value Strategies Fund designates 100% of the dividends distributed during the fiscal year as amounts which may be taken into account as a dividend for purposes of the maximum rate under section 1(h)(11) of the Internal Revenue Code.
The fund will notify shareholders in January 2016 of amounts for use in preparing 2015 income tax returns.
Board Approval of Investment Advisory Contracts and Management Fees
Fidelity Advisor Value Strategies Fund
Each year, the Board of Trustees, including the Independent Trustees (together, the Board), votes on the renewal of the management contract with Fidelity Management & Research Company (FMR) and the sub-advisory agreements (together, the Advisory Contracts) for the fund. The Board, assisted by the advice of fund counsel and Independent Trustees' counsel, requests and considers a broad range of information relevant to the renewal of the Advisory Contracts throughout the year.
The Board meets regularly and, at each of its meetings, covers an extensive agenda of topics and materials and considers factors that are relevant to its annual consideration of the renewal of the fund's Advisory Contracts, including the services and support provided to the fund and its shareholders. The Board has established various standing committees (Committees), each composed of and chaired by Independent Trustees with varying backgrounds, to which the Board has assigned specific subject matter responsibilities in order to enhance effective decision-making by the Board. The Board, acting directly and through its Committees, requests and receives information concerning the annual consideration of the renewal of the fund's Advisory Contracts. The Board also meets as needed to consider matters specifically related to the Board's annual consideration of the renewal of the Advisory Contracts. Members of the Board may also meet with trustees of other Fidelity funds through ad hoc joint committees to discuss certain matters relevant to all of the Fidelity funds.
At its July 2015 meeting, the Board unanimously determined to renew the fund's Advisory Contracts. In reaching its determination, the Board considered all factors it believed relevant, including (i) the nature, extent, and quality of the services to be provided to the fund and its shareholders (including the investment performance of the fund); (ii) the competitiveness of the fund's management fee and total expense ratio relative to peer funds; (iii) the total costs of the services to be provided by and the profits to be realized by Fidelity from its relationship with the fund; and (iv) the extent to which (if any) economies of scale exist and would be realized as the fund grows, and whether any economies of scale are appropriately shared with fund shareholders.
In considering whether to renew the Advisory Contracts for the fund, the Board reached a determination, with the assistance of fund counsel and Independent Trustees' counsel and through the exercise of its business judgment, that the renewal of the Advisory Contracts was in the best interests of the fund and its shareholders and that the compensation payable under the Advisory Contracts was fair and reasonable. The Board's decision to renew the Advisory Contracts was not based on any single factor, but rather was based on a comprehensive consideration of all the information provided to the Board at its meetings throughout the year. The Board, in reaching its determination to renew the Advisory Contracts, was aware that shareholders of the fund have a broad range of investment choices available to them, including a wide choice among funds offered by Fidelity's competitors, and that the fund's shareholders, who have the opportunity to review and weigh the disclosure provided by the fund in its prospectus and other public disclosures, have chosen to invest in this fund, which is part of the Fidelity family of funds.
Nature, Extent, and Quality of Services Provided. The Board considered Fidelity's staffing as it relates to the fund, including the backgrounds of investment personnel of Fidelity, and also considered the fund's investment objective, strategies, and related investment philosophy. The Independent Trustees also had discussions with senior management of Fidelity's investment operations and investment groups. The Board considered the structure of the portfolio manager compensation program and whether this structure provides appropriate incentives to act in the best interests of the fund. Additionally, the Board considered the portfolio managers' investments, if any, in the funds that they manage.Resources Dedicated to Investment Management and Support Services. The Board and the Fund Oversight and Research Committees reviewed the general qualifications and capabilities of Fidelity's investment staff, including its size, education, experience, and resources, as well as Fidelity's approach to recruiting, training, managing, and compensating investment personnel. The Board noted that Fidelity has continued to increase the resources devoted to non-U.S. offices, including expansion of Fidelity's global investment organization. The Board also noted that Fidelity's analysts have extensive resources, tools and capabilities that allow them to conduct sophisticated quantitative and fundamental analysis, as well as credit analysis of issuers, counterparties and guarantors. Further, the Board considered that Fidelity's investment professionals have sufficient access to global information and data so as to provide competitive investment results over time, and that those professionals also have access to sophisticated tools that permit them to assess portfolio construction and risk and performance attribution characteristics continuously, as well as to transmit new information and research conclusions rapidly around the world. Additionally, in its deliberations, the Board considered Fidelity's trading, risk management, and compliance capabilities and resources, which are integral parts of the investment management process.Shareholder and Administrative Services. The Board considered (i) the nature, extent, quality, and cost of advisory, administrative, and shareholder services performed by FMR, the sub-advisers (together with FMR, the Investment Advisers), and their affiliates under the Advisory Contracts and under separate agreements covering transfer agency, pricing and bookkeeping, and securities lending services for the fund; (ii) the nature and extent of the supervision of third party service providers, principally custodians and subcustodians; and (iii) the resources devoted to, and the record of compliance with, the fund's compliance policies and procedures. The Board also reviewed the allocation of fund brokerage, including allocations to brokers affiliated with the Investment Advisers, the use of brokerage commissions to pay fund expenses, and the use of "soft" commission dollars to pay for research services.The Board noted that the growth of fund assets over time across the complex allows Fidelity to reinvest in the development of services designed to enhance the value or convenience of the Fidelity funds as investment vehicles. These services include 24-hour access to account information and market information through telephone representatives and over the Internet, investor education materials and asset allocation tools, and the expanded availability of Fidelity Investor Centers.In 2014, the Board formed an ad hoc Committee on Transfer Agency Fees to review the variety of transfer agency fee structures throughout the industry and Fidelity's competitive positioning with respect to industry participants.Investment in a Large Fund Family. The Board considered the benefits to shareholders of investing in a Fidelity fund, including the benefits of investing in a fund that is part of a large family of funds offering a variety of investment disciplines and providing a large variety of mutual fund investor services. The Board noted that Fidelity had taken, or had made recommendations that resulted in the Fidelity funds taking, a number of actions over the previous year that benefited particular funds, including (i) continuing to dedicate additional resources to investment research and to the support of the senior management team that oversees asset management; (ii) continuing efforts to enhance Fidelity's global research capabilities; (iii) launching new funds and making other enhancements to meet client needs; (iv) reducing management fees and total expenses for certain index funds and diversified international funds; (v) continuing to launch dedicated lower cost underlying funds to meet portfolio construction needs related to expanding underlying fund options for Fidelity funds of funds, specifically for the Freedom Fund product lines; (vi) rationalizing product lines and gaining increased efficiencies through fund mergers; (vii) launching active fixed-income exchange-traded funds; (viii) continuing to develop, acquire and implement systems and technology to improve services to the funds and information security and to increase efficiency; (ix) implementing investment enhancements to further strengthen Fidelity's target date product line to increase investors' probability of success in achieving their goals; (x) modifying the eligibility criteria for certain share classes to accommodate roll-over assets from employer-sponsored retirement plans; (xi) launching a new Class W of the Freedom Index Funds to attract and retain Fidelity record-kept retirement plan assets; and (xii) implementing changes to Fidelity's money market product line in response to recent money market regulatory reforms.Investment Performance. The Board considered whether the fund has operated in accordance with its investment objective, as well as its record of compliance with its investment restrictions and its performance history.The Board took into account discussions with representatives of the Investment Advisers about fund investment performance that occur at Board meetings throughout the year. In this regard the Board noted that as part of regularly scheduled fund reviews and other reports to the Board on fund performance, the Board considers annualized return information for the fund, for different time periods, measured against a securities market index ("benchmark index") and a peer group of funds with similar objectives ("peer group"), if any. In its evaluation of fund investment performance, the Board gave particular attention to information indicating changes in performance of certain Fidelity funds for specific time periods and discussed with the Investment Advisers the reasons for any overperformance or underperformance.In addition to reviewing absolute and relative fund performance, the Independent Trustees periodically consider the appropriateness of fund performance metrics in evaluating the results achieved. In general, the Independent Trustees believe that fund performance should be evaluated based on net performance (after fees and expenses) of both the highest performing and lowest performing fund share classes, where applicable, compared to appropriate benchmark indices, over appropriate time periods that may include full market cycles, and compared to peer groups, as applicable, over the same periods, taking into account relevant factors including the following: general market conditions; issuer-specific information; and fund cash flows and other factors.The Independent Trustees recognize that shareholders evaluate performance on a net basis over their own holding periods, for which one-, three-, and five-year periods are often used as a proxy. For this reason, the performance information reviewed by the Board also included net cumulative calendar year total return information for the fund and an appropriate benchmark index and peer group for the most recent one-, three-, and five-year periods, as shown below. Returns are shown compared to the 25th percentile (top of box, 75% beaten) and 75th percentile (bottom of box, 25% beaten) of the peer universe.Fidelity Advisor Value Strategies Fund
Fidelity Advisor Value Strategies Fund
![]()
Corporate Headquarters
245 Summer St.
Boston, MA 02210
www.fidelity.com
SOI-ANN-0116
1.539183.118
Fidelity Advisor® Large Cap Fund Class I (formerly Institutional Class) Annual Report November 30, 2015 |
|
Contents
Board Approval of Investment Advisory Contracts and Management Fees |
To view a fund's proxy voting guidelines and proxy voting record for the 12-month period ended June 30, visit http://www.fidelity.com/proxyvotingresults or visit the Securities and Exchange Commission's (SEC) web site at http://www.sec.gov.
You may also call 1-877-208-0098 to request a free copy of the proxy voting guidelines.
Standard & Poor's, S&P and S&P 500 are registered service marks of The McGraw-Hill Companies, Inc. and have been licensed for use by Fidelity Distributors Corporation.
Other third-party marks appearing herein are the property of their respective owners.
All other marks appearing herein are registered or unregistered trademarks or service marks of FMR LLC or an affiliated company. © 2016 FMR LLC. All rights reserved.
This report and the financial statements contained herein are submitted for the general information of the shareholders of the Fund. This report is not authorized for distribution to prospective investors in the Fund unless preceded or accompanied by an effective prospectus.
A fund files its complete schedule of portfolio holdings with the SEC for the first and third quarters of each fiscal year on Form N-Q. Forms N-Q are available on the SEC’s web site at http://www.sec.gov. A fund's Forms N-Q may be reviewed and copied at the SEC’s Public Reference Room in Washington, DC. Information regarding the operation of the SEC's Public Reference Room may be obtained by calling 1-800-SEC-0330.
For a complete list of a fund's portfolio holdings, view the most recent holdings listing, semiannual report, or annual report on Fidelity's web site at http://www.fidelity.com, http://www.advisor.fidelity.com, or http://www.401k.com, as applicable.
NOT FDIC INSURED •MAY LOSE VALUE •NO BANK GUARANTEE
Neither the Fund nor Fidelity Distributors Corporation is a bank.
Performance: The Bottom Line
Average annual total return reflects the change in the value of an investment, assuming reinvestment of distributions from dividend income and capital gains (the profits earned upon the sale of securities that have grown in value, if any) and assuming a constant rate of performance each year.
The hypothetical investment and the average annual total returns do not reflect the deduction of taxes that a shareholder would pay on fund distributions or the redemption of fund shares.
During periods of reimbursement by Fidelity, a fund’s total return will be greater than it would be had the reimbursement not occurred.
How a fund did yesterday is no guarantee of how it will do tomorrow.
Average Annual Total Returns
| For the periods ended November 30, 2015 | Past 1 year | Past 5 years | Past 10 years |
| Class I | (1.33)% | 14.79% | 8.16% |
$10,000 Over 10 Years
Let's say hypothetically that $10,000 was invested in Fidelity Advisor® Large Cap Fund - Class I on November 30, 2005.
The chart shows how the value of your investment would have changed, and also shows how the S&P 500® Index performed over the same period.
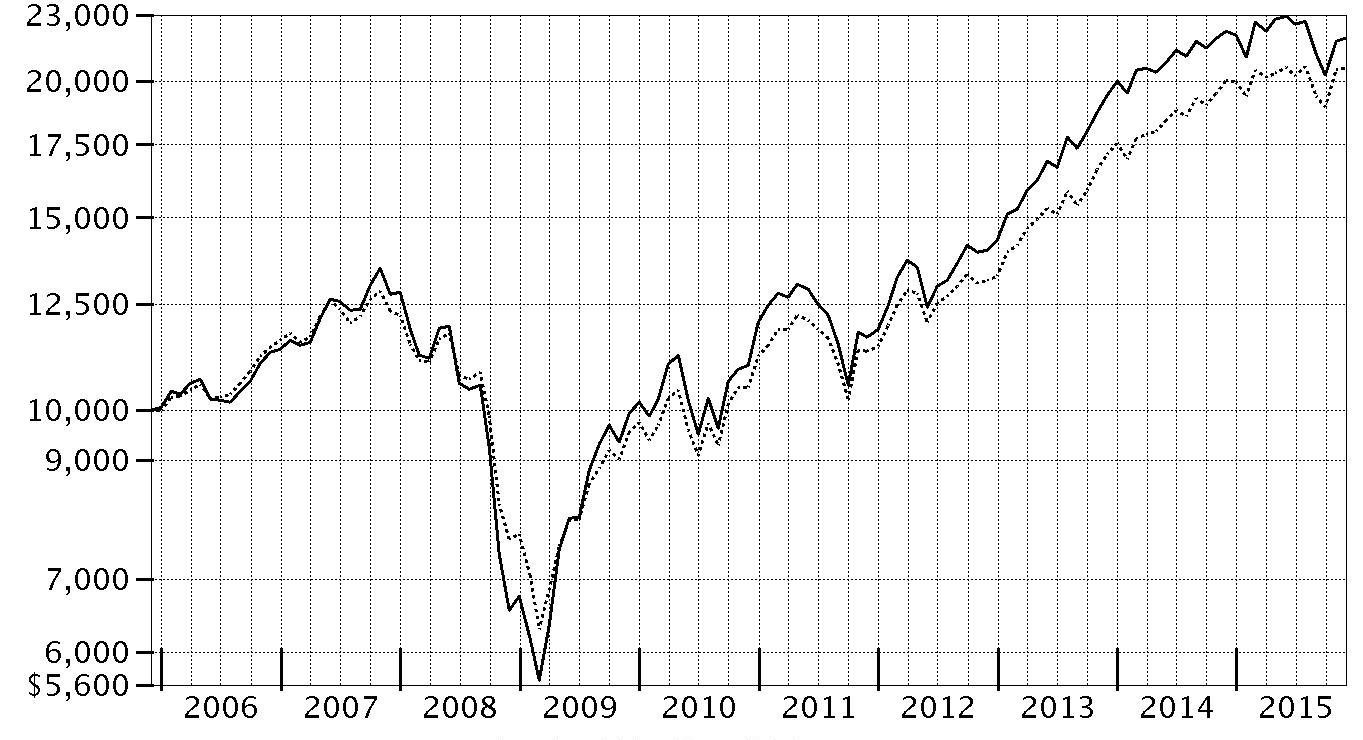
| Period Ending Values | ||
| $21,914 | Fidelity Advisor® Large Cap Fund - Class I | |
| $20,574 | S&P 500® Index | |
Management's Discussion of Fund Performance
Market Recap: U.S. stocks gained modestly for the 12 months ending November 30, 2015, despite a steep decline in August and September on concern about slowing economic growth in China. The S&P 500® index rebounded in October and gained 2.75% for the year. Stocks benefited late in the period amid waning expectations for a near-term interest-rate hike by the U.S. Federal Reserve, more economic stimulus in Europe and an interest-rate cut in China. Growth stocks in the benchmark far outpaced their value counterparts, as investors continued to seek growth in a subpar economic environment. Sector performance varied widely, with more than 26 percentage points separating the leader from the laggard. Consumer discretionary (+14%) secured the top spot, benefiting from a combination of rising personal income and still-benign inflation. Information technology (+7%) and health care (+4%) also outpaced the broad market. Conversely, the energy sector (-12%) performed worst, stymied by depressed commodity prices that also hit materials (-5%). Telecommunication services (-5%) and utilities (-4%), considered defensive sectors less sensitive to the economy, also lost ground. At period end, investors remained focused on the potential global implications of a stronger U.S. dollar and how China's transition toward a consumption-led economy may affect corporate earnings.Comments from Portfolio Manager Matthew Fruhan: For the year, the fund's share classes (excluding sales charges, if applicable) declined modestly, meaningfully lagging the benchmark S&P 500®. Some unusual market challenges held back the fund's results the past year. Most notably, investors seemingly favored stocks that offered secure near-term earnings, regardless of valuation. Versus the benchmark, my picks in consumer discretionary were the biggest disappointment, especially not owning online retailer and benchmark component Amazon.com, one of those expensive near-term earners I referred to. I declined to own Amazon because its stock traded at an excessive valuation that more than reflected the company's good short-term fundamentals. Other individual detractors included social-networking company Facebook – a benchmark constituent the fund did not hold until I established a small position on a summertime dip – and QUALCOMM, a maker of communications equipment. In contrast, the fund benefited from my picks among diversified financials stocks. On the positive side, JPMorgan Chase was a strong relative contributor. This financial services giant continued to produce solid financial results, benefiting from its dominant competitive position in multiple businesses, from mortgage origination to commercial lending to asset management.The views expressed above reflect those of the portfolio manager(s) only through the end of the period as stated on the cover of this report and do not necessarily represent the views of Fidelity or any other person in the Fidelity organization. Any such views are subject to change at any time based upon market or other conditions and Fidelity disclaims any responsibility to update such views. These views may not be relied on as investment advice and, because investment decisions for a Fidelity fund are based on numerous factors, may not be relied on as an indication of trading intent on behalf of any Fidelity fund.
Investment Summary (Unaudited)
Top Ten Stocks as of November 30, 2015
| % of fund's net assets | % of fund's net assets 6 months ago | |
| JPMorgan Chase & Co. | 4.3 | 4.2 |
| General Electric Co. | 3.6 | 3.2 |
| Apple, Inc. | 3.4 | 3.6 |
| Bank of America Corp. | 3.0 | 2.6 |
| Microsoft Corp. | 2.8 | 2.4 |
| Citigroup, Inc. | 2.6 | 2.5 |
| Target Corp. | 1.8 | 2.2 |
| Chevron Corp. | 1.8 | 1.5 |
| Procter & Gamble Co. | 1.8 | 1.5 |
| Alphabet, Inc. Class A | 1.8 | 1.5 |
| 26.9 |
Top Five Market Sectors as of November 30, 2015
| % of fund's net assets | % of fund's net assets 6 months ago | |
| Information Technology | 22.7 | 22.0 |
| Financials | 21.8 | 21.6 |
| Industrials | 13.0 | 12.2 |
| Health Care | 12.4 | 12.1 |
| Consumer Discretionary | 9.1 | 9.9 |
Asset Allocation (% of fund's net assets)
| As of November 30, 2015* | ||
| Stocks | 99.2% | |
| Short-Term Investments and Net Other Assets (Liabilities) | 0.8% | |

* Foreign investments - 9.6%
| As of May 31, 2015* | ||
| Stocks | 98.4% | |
| Short-Term Investments and Net Other Assets (Liabilities) | 1.6% | |

* Foreign investments - 10.6%
Investments November 30, 2015
Showing Percentage of Net Assets
| Common Stocks - 99.2% | |||
| Shares | Value | ||
| CONSUMER DISCRETIONARY - 9.1% | |||
| Automobiles - 0.1% | |||
| Harley-Davidson, Inc. | 22,900 | $1,120,268 | |
| Tesla Motors, Inc. (a) | 600 | 138,156 | |
| 1,258,424 | |||
| Diversified Consumer Services - 0.2% | |||
| H&R Block, Inc. | 51,578 | 1,892,397 | |
| ServiceMaster Global Holdings, Inc. (a) | 36,900 | 1,383,012 | |
| 3,275,409 | |||
| Hotels, Restaurants & Leisure - 0.8% | |||
| Las Vegas Sands Corp. | 61,500 | 2,709,690 | |
| Yum! Brands, Inc. | 105,938 | 7,681,564 | |
| 10,391,254 | |||
| Household Durables - 0.3% | |||
| KB Home | 201,800 | 2,843,362 | |
| Taylor Morrison Home Corp. (a) | 112,100 | 1,961,750 | |
| 4,805,112 | |||
| Leisure Products - 0.0% | |||
| NJOY, Inc. (a)(b) | 115,947 | 1 | |
| Media - 4.5% | |||
| Comcast Corp. Class A (special) (non-vtg.) | 358,237 | 21,866,786 | |
| Scripps Networks Interactive, Inc. Class A | 101,600 | 5,770,880 | |
| Sinclair Broadcast Group, Inc. Class A | 150,400 | 5,279,040 | |
| Time Warner, Inc. | 236,159 | 16,526,407 | |
| Viacom, Inc. Class B (non-vtg.) | 200,700 | 9,992,853 | |
| 59,435,966 | |||
| Multiline Retail - 1.8% | |||
| Target Corp. | 336,640 | 24,406,400 | |
| Specialty Retail - 1.3% | |||
| Lowe's Companies, Inc. | 198,379 | 15,195,831 | |
| Lumber Liquidators Holdings, Inc. (a)(c) | 81,000 | 1,265,220 | |
| Sally Beauty Holdings, Inc. (a) | 18,300 | 473,238 | |
| 16,934,289 | |||
| Textiles, Apparel & Luxury Goods - 0.1% | |||
| Michael Kors Holdings Ltd. (a) | 26,200 | 1,127,124 | |
| TOTAL CONSUMER DISCRETIONARY | 121,633,979 | ||
| CONSUMER STAPLES - 6.7% | |||
| Beverages - 2.1% | |||
| Diageo PLC | 265,415 | 7,612,437 | |
| PepsiCo, Inc. | 28,740 | 2,878,598 | |
| The Coca-Cola Co. | 420,075 | 17,903,597 | |
| 28,394,632 | |||
| Food & Staples Retailing - 1.0% | |||
| CVS Health Corp. | 63,511 | 5,975,750 | |
| Tesco PLC | 153,300 | 385,780 | |
| United Natural Foods, Inc. (a) | 52,300 | 2,296,493 | |
| Walgreens Boots Alliance, Inc. | 61,155 | 5,138,855 | |
| 13,796,878 | |||
| Food Products - 0.2% | |||
| Mead Johnson Nutrition Co. Class A | 23,500 | 1,893,865 | |
| Household Products - 1.8% | |||
| Procter & Gamble Co. | 313,852 | 23,488,684 | |
| Tobacco - 1.6% | |||
| British American Tobacco PLC sponsored ADR | 72,131 | 8,348,442 | |
| Philip Morris International, Inc. | 153,629 | 13,425,638 | |
| 21,774,080 | |||
| TOTAL CONSUMER STAPLES | 89,348,139 | ||
| ENERGY - 9.0% | |||
| Energy Equipment & Services - 1.6% | |||
| Ensco PLC Class A | 301,050 | 5,153,976 | |
| Helmerich & Payne, Inc. (c) | 23,800 | 1,386,350 | |
| National Oilwell Varco, Inc. | 101,932 | 3,806,141 | |
| Oceaneering International, Inc. | 126,600 | 5,537,484 | |
| Schlumberger Ltd. | 61,705 | 4,760,541 | |
| 20,644,492 | |||
| Oil, Gas & Consumable Fuels - 7.4% | |||
| Amyris, Inc. (a)(c) | 764,344 | 1,276,454 | |
| Anadarko Petroleum Corp. | 31,100 | 1,862,890 | |
| Apache Corp. | 269,710 | 13,264,338 | |
| Cabot Oil & Gas Corp. | 118,000 | 2,221,940 | |
| Chevron Corp. | 264,907 | 24,191,307 | |
| ConocoPhillips Co. | 150,100 | 8,112,905 | |
| Golar LNG Ltd. | 47,200 | 1,290,920 | |
| Imperial Oil Ltd. | 276,600 | 8,984,917 | |
| Kinder Morgan, Inc. | 133,700 | 3,151,309 | |
| Legacy Reserves LP | 79,400 | 247,728 | |
| Markwest Energy Partners LP | 36,720 | 1,762,560 | |
| Noble Energy, Inc. | 28,800 | 1,056,096 | |
| SM Energy Co. | 24,900 | 731,313 | |
| Suncor Energy, Inc. | 727,300 | 20,096,125 | |
| The Williams Companies, Inc. | 162,725 | 5,949,226 | |
| Williams Partners LP | 165,500 | 4,538,010 | |
| 98,738,038 | |||
| TOTAL ENERGY | 119,382,530 | ||
| FINANCIALS - 21.8% | |||
| Banks - 14.4% | |||
| Bank of America Corp. | 2,290,900 | 39,930,387 | |
| Citigroup, Inc. | 645,097 | 34,893,297 | |
| Comerica, Inc. | 121,400 | 5,626,890 | |
| Fifth Third Bancorp | 133,500 | 2,759,445 | |
| JPMorgan Chase & Co. | 857,573 | 57,182,962 | |
| Lloyds Banking Group PLC | 463,200 | 508,655 | |
| PNC Financial Services Group, Inc. | 45,385 | 4,334,721 | |
| Regions Financial Corp. | 744,900 | 7,553,286 | |
| Standard Chartered PLC: | |||
| rights 12/10/15 (a) | 96,264 | 131,935 | |
| (United Kingdom) | 336,924 | 2,827,463 | |
| SunTrust Banks, Inc. | 330,108 | 14,333,289 | |
| U.S. Bancorp | 315,665 | 13,854,537 | |
| Wells Fargo & Co. | 146,894 | 8,093,859 | |
| 192,030,726 | |||
| Capital Markets - 5.3% | |||
| Charles Schwab Corp. | 305,553 | 10,300,192 | |
| E*TRADE Financial Corp. (a) | 119,600 | 3,639,428 | |
| Franklin Resources, Inc. | 27,000 | 1,131,840 | |
| Goldman Sachs Group, Inc. | 4,800 | 912,096 | |
| KKR & Co. LP | 267,636 | 4,525,725 | |
| Morgan Stanley | 443,843 | 15,223,815 | |
| Northern Trust Corp. | 136,186 | 10,205,779 | |
| PJT Partners, Inc. (a) | 172 | 4,032 | |
| State Street Corp. | 297,758 | 21,611,276 | |
| The Blackstone Group LP | 109,000 | 3,404,070 | |
| 70,958,253 | |||
| Diversified Financial Services - 0.3% | |||
| KKR Renaissance Co-Invest LP unit (a)(b) | 29,500 | 3,788,095 | |
| Insurance - 1.0% | |||
| MetLife, Inc. | 172,985 | 8,837,804 | |
| Principal Financial Group, Inc. | 78,700 | 4,049,902 | |
| 12,887,706 | |||
| Thrifts & Mortgage Finance - 0.8% | |||
| MGIC Investment Corp. (a) | 254,092 | 2,424,038 | |
| Radian Group, Inc. | 606,968 | 8,649,294 | |
| 11,073,332 | |||
| TOTAL FINANCIALS | 290,738,112 | ||
| HEALTH CARE - 12.4% | |||
| Biotechnology - 2.4% | |||
| AbbVie, Inc. | 29,800 | 1,732,870 | |
| Alnylam Pharmaceuticals, Inc. (a) | 11,400 | 1,186,284 | |
| Amgen, Inc. | 59,947 | 9,657,462 | |
| Biogen, Inc. (a) | 28,700 | 8,232,882 | |
| BioMarin Pharmaceutical, Inc. (a) | 25,900 | 2,470,083 | |
| Celldex Therapeutics, Inc. (a) | 5,100 | 91,851 | |
| Discovery Laboratories, Inc. (a) | 535,529 | 161,837 | |
| Genocea Biosciences, Inc. (a) | 18,400 | 117,760 | |
| Insmed, Inc. (a) | 45,387 | 740,262 | |
| Intercept Pharmaceuticals, Inc. (a) | 41,431 | 7,312,986 | |
| Spark Therapeutics, Inc. | 15,800 | 913,082 | |
| 32,617,359 | |||
| Health Care Equipment & Supplies - 3.9% | |||
| Abbott Laboratories | 113,525 | 5,099,543 | |
| Alere, Inc. (a) | 373,668 | 15,421,278 | |
| Boston Scientific Corp. (a) | 908,586 | 16,608,952 | |
| Medtronic PLC | 91,700 | 6,908,678 | |
| Neovasc, Inc. (a) | 35,700 | 177,429 | |
| St. Jude Medical, Inc. | 47,200 | 2,978,320 | |
| Zimmer Biomet Holdings, Inc. | 41,800 | 4,222,218 | |
| 51,416,418 | |||
| Health Care Providers & Services - 1.7% | |||
| Express Scripts Holding Co. (a) | 121,310 | 10,369,579 | |
| McKesson Corp. | 61,496 | 11,644,268 | |
| 22,013,847 | |||
| Health Care Technology - 0.0% | |||
| Castlight Health, Inc. Class B (a) | 34,700 | 138,800 | |
| Life Sciences Tools & Services - 0.2% | |||
| Agilent Technologies, Inc. | 49,100 | 2,053,362 | |
| Pharmaceuticals - 4.2% | |||
| Allergan PLC (a) | 9,029 | 2,834,113 | |
| Bristol-Myers Squibb Co. | 8,500 | 569,585 | |
| GlaxoSmithKline PLC sponsored ADR | 425,839 | 17,250,738 | |
| Jazz Pharmaceuticals PLC (a) | 29,607 | 4,340,090 | |
| Johnson & Johnson | 126,263 | 12,782,866 | |
| Teva Pharmaceutical Industries Ltd. sponsored ADR | 260,791 | 16,411,578 | |
| TherapeuticsMD, Inc. (a) | 226,900 | 1,704,019 | |
| Theravance, Inc. | 44,700 | 413,475 | |
| 56,306,464 | |||
| TOTAL HEALTH CARE | 164,546,250 | ||
| INDUSTRIALS - 13.0% | |||
| Aerospace & Defense - 1.5% | |||
| KEYW Holding Corp. (a) | 135,382 | 865,091 | |
| The Boeing Co. | 91,963 | 13,376,018 | |
| United Technologies Corp. | 61,472 | 5,904,386 | |
| 20,145,495 | |||
| Air Freight & Logistics - 2.0% | |||
| FedEx Corp. | 46,600 | 7,387,964 | |
| Hub Group, Inc. Class A (a) | 96,900 | 3,733,557 | |
| United Parcel Service, Inc. Class B | 146,675 | 15,108,992 | |
| 26,230,513 | |||
| Building Products - 0.3% | |||
| Caesarstone Sdot-Yam Ltd. | 12,000 | 490,560 | |
| Lennox International, Inc. | 24,100 | 3,275,672 | |
| 3,766,232 | |||
| Commercial Services & Supplies - 0.6% | |||
| ADT Corp. (c) | 215,200 | 7,633,144 | |
| Electrical Equipment - 1.2% | |||
| AMETEK, Inc. | 80,130 | 4,524,140 | |
| Eaton Corp. PLC | 43,400 | 2,524,144 | |
| Emerson Electric Co. | 125,100 | 6,255,000 | |
| Hubbell, Inc. Class B | 26,782 | 2,659,185 | |
| 15,962,469 | |||
| Industrial Conglomerates - 3.6% | |||
| General Electric Co. | 1,598,444 | 47,857,413 | |
| Machinery - 0.9% | |||
| Cummins, Inc. | 9,200 | 923,404 | |
| Deere & Co. | 47,500 | 3,779,575 | |
| Ingersoll-Rand PLC | 46,183 | 2,709,557 | |
| Joy Global, Inc. (c) | 43,100 | 661,585 | |
| Rexnord Corp. (a) | 146,400 | 2,990,952 | |
| Xylem, Inc. | 21,000 | 783,720 | |
| 11,848,793 | |||
| Professional Services - 0.3% | |||
| Acacia Research Corp. (c) | 112,537 | 665,094 | |
| Verisk Analytics, Inc. (a) | 49,600 | 3,717,520 | |
| 4,382,614 | |||
| Road & Rail - 2.4% | |||
| CSX Corp. | 400,601 | 11,389,086 | |
| Genesee & Wyoming, Inc. Class A (a) | 70,400 | 4,876,608 | |
| J.B. Hunt Transport Services, Inc. | 63,300 | 4,952,592 | |
| Kansas City Southern | 50,700 | 4,609,644 | |
| Norfolk Southern Corp. | 42,558 | 4,045,563 | |
| Old Dominion Freight Lines, Inc. (a) | 21,900 | 1,395,249 | |
| Union Pacific Corp. | 8,900 | 747,155 | |
| 32,015,897 | |||
| Trading Companies & Distributors - 0.2% | |||
| HD Supply Holdings, Inc. (a) | 99,100 | 3,134,533 | |
| TOTAL INDUSTRIALS | 172,977,103 | ||
| INFORMATION TECHNOLOGY - 22.7% | |||
| Communications Equipment - 3.1% | |||
| Cisco Systems, Inc. | 734,854 | 20,024,772 | |
| QUALCOMM, Inc. | 451,450 | 22,026,246 | |
| 42,051,018 | |||
| Internet Software & Services - 4.3% | |||
| Alphabet, Inc.: | |||
| Class A (a) | 30,756 | 23,462,215 | |
| Class C | 26,937 | 20,003,416 | |
| Facebook, Inc. Class A (a) | 34,500 | 3,596,280 | |
| Twitter, Inc. (a) | 167,300 | 4,249,420 | |
| Yahoo!, Inc. (a) | 176,634 | 5,971,996 | |
| 57,283,327 | |||
| IT Services - 5.4% | |||
| Cognizant Technology Solutions Corp. Class A (a) | 46,884 | 3,027,769 | |
| First Data Corp. | 205,630 | 3,109,126 | |
| First Data Corp. Class A (a)(c) | 147,400 | 2,476,320 | |
| IBM Corp. | 94,081 | 13,116,773 | |
| MasterCard, Inc. Class A | 157,500 | 15,422,400 | |
| Paychex, Inc. | 159,322 | 8,643,219 | |
| PayPal Holdings, Inc. (a) | 97,800 | 3,448,428 | |
| Unisys Corp. (a) | 286,062 | 3,678,757 | |
| Visa, Inc. Class A | 249,420 | 19,706,674 | |
| 72,629,466 | |||
| Semiconductors & Semiconductor Equipment - 0.7% | |||
| Broadcom Corp. Class A | 115,925 | 6,332,983 | |
| Marvell Technology Group Ltd. | 228,700 | 2,026,282 | |
| Maxim Integrated Products, Inc. | 24,700 | 957,619 | |
| 9,316,884 | |||
| Software - 4.5% | |||
| Adobe Systems, Inc. (a) | 50,810 | 4,647,083 | |
| Autodesk, Inc. (a) | 62,681 | 3,978,363 | |
| Microsoft Corp. | 682,254 | 37,080,505 | |
| Oracle Corp. | 245,950 | 9,584,672 | |
| Salesforce.com, Inc. (a) | 54,650 | 4,355,059 | |
| 59,645,682 | |||
| Technology Hardware, Storage & Peripherals - 4.7% | |||
| Apple, Inc. | 381,621 | 45,145,764 | |
| EMC Corp. | 564,900 | 14,314,566 | |
| HP, Inc. | 57,400 | 719,796 | |
| Western Digital Corp. | 30,600 | 1,909,746 | |
| 62,089,872 | |||
| TOTAL INFORMATION TECHNOLOGY | 303,016,249 | ||
| MATERIALS - 3.1% | |||
| Chemicals - 2.6% | |||
| CF Industries Holdings, Inc. | 48,300 | 2,228,562 | |
| E.I. du Pont de Nemours & Co. | 46,515 | 3,132,320 | |
| Intrepid Potash, Inc. (a) | 291,160 | 1,045,264 | |
| LyondellBasell Industries NV Class A | 19,700 | 1,887,654 | |
| Monsanto Co. | 150,717 | 14,342,230 | |
| Potash Corp. of Saskatchewan, Inc. | 244,300 | 4,944,722 | |
| Syngenta AG (Switzerland) | 17,391 | 6,405,105 | |
| W.R. Grace & Co. (a) | 4,100 | 402,702 | |
| 34,388,559 | |||
| Containers & Packaging - 0.4% | |||
| WestRock Co. | 95,389 | 4,829,545 | |
| Metals & Mining - 0.1% | |||
| Freeport-McMoRan, Inc. | 233,100 | 1,906,758 | |
| TOTAL MATERIALS | 41,124,862 | ||
| TELECOMMUNICATION SERVICES - 0.9% | |||
| Diversified Telecommunication Services - 0.9% | |||
| Verizon Communications, Inc. | 257,394 | 11,698,557 | |
| UTILITIES - 0.5% | |||
| Electric Utilities - 0.4% | |||
| Exelon Corp. | 170,300 | 4,650,893 | |
| Independent Power and Renewable Electricity Producers - 0.1% | |||
| Dynegy, Inc. (a) | 95,100 | 1,533,012 | |
| TOTAL UTILITIES | 6,183,905 | ||
| TOTAL COMMON STOCKS | |||
| (Cost $1,164,657,795) | 1,320,649,686 | ||
| Convertible Preferred Stocks - 0.0% | |||
| CONSUMER DISCRETIONARY - 0.0% | |||
| Leisure Products - 0.0% | |||
| NJOY, Inc. Series C (a)(b) | |||
| (Cost $271,645) | 33,607 | 16,679 | |
| Principal Amount | Value | ||
| Convertible Bonds - 0.0% | |||
| ENERGY - 0.0% | |||
| Oil, Gas & Consumable Fuels - 0.0% | |||
| Amyris, Inc. 9.5% 4/15/19(d) | |||
| (Cost $676,000) | 676,000 | 700,505 | |
| Shares | Value | ||
| Money Market Funds - 1.6% | |||
| Fidelity Cash Central Fund, 0.18% (e) | 9,408,014 | 9,408,014 | |
| Fidelity Securities Lending Cash Central Fund, 0.22% (e)(f) | 11,388,275 | 11,388,275 | |
| TOTAL MONEY MARKET FUNDS | |||
| (Cost $20,796,289) | 20,796,289 | ||
| TOTAL INVESTMENT PORTFOLIO - 100.8% | |||
| (Cost $1,186,401,729) | 1,342,163,159 | ||
| NET OTHER ASSETS (LIABILITIES) - (0.8)% | (10,380,575) | ||
| NET ASSETS - 100% | $1,331,782,584 |
Legend
(a) Non-income producing
(b) Restricted securities - Investment in securities not registered under the Securities Act of 1933 (excluding 144A issues). At the end of the period, the value of restricted securities (excluding 144A issues) amounted to $3,804,775 or 0.3% of net assets.
(c) Security or a portion of the security is on loan at period end.
(d) Security exempt from registration under Rule 144A of the Securities Act of 1933. These securities may be resold in transactions exempt from registration, normally to qualified institutional buyers. At the end of the period, the value of these securities amounted to $700,505 or 0.1% of net assets.
(e) Affiliated fund that is generally available only to investment companies and other accounts managed by Fidelity Investments. The rate quoted is the annualized seven-day yield of the fund at period end. A complete unaudited listing of the fund's holdings as of its most recent quarter end is available upon request. In addition, each Fidelity Central Fund's financial statements, which are not covered by the Fund's Report of Independent Registered Public Accounting Firm, are available on the SEC's website or upon request.
(f) Investment made with cash collateral received from securities on loan.
Additional information on each restricted holding is as follows:
| Security | Acquisition Date | Acquisition Cost |
| KKR Renaissance Co-Invest LP unit | 7/25/13 | $3,112,250 |
| NJOY, Inc. | 9/11/13 - 10/24/13 | $936,852 |
| NJOY, Inc. Series C | 6/7/13 | $271,645 |
Affiliated Central Funds
Information regarding fiscal year to date income earned by the Fund from investments in Fidelity Central Funds is as follows:
| Fund | Income earned |
| Fidelity Cash Central Fund | $23,967 |
| Fidelity Securities Lending Cash Central Fund | 312,822 |
| Total | $336,789 |
Investment Valuation
The following is a summary of the inputs used, as of November 30, 2015, involving the Fund's assets and liabilities carried at fair value. The inputs or methodology used for valuing securities may not be an indication of the risk associated with investing in those securities. For more information on valuation inputs, and their aggregation into the levels used below, please refer to the Investment Valuation section in the accompanying Notes to Financial Statements.
| Valuation Inputs at Reporting Date: | ||||
| Description | Total | Level 1 | Level 2 | Level 3 |
| Investments in Securities: | ||||
| Equities: | ||||
| Consumer Discretionary | $121,650,658 | $121,633,978 | $-- | $16,680 |
| Consumer Staples | 89,348,139 | 81,349,922 | 7,998,217 | -- |
| Energy | 119,382,530 | 119,382,530 | -- | -- |
| Financials | 290,738,112 | 286,441,362 | 508,655 | 3,788,095 |
| Health Care | 164,546,250 | 164,546,250 | -- | -- |
| Industrials | 172,977,103 | 172,977,103 | -- | -- |
| Information Technology | 303,016,249 | 299,907,123 | 3,109,126 | -- |
| Materials | 41,124,862 | 34,719,757 | 6,405,105 | -- |
| Telecommunication Services | 11,698,557 | 11,698,557 | -- | -- |
| Utilities | 6,183,905 | 6,183,905 | -- | -- |
| Corporate Bonds | 700,505 | -- | 700,505 | -- |
| Money Market Funds | 20,796,289 | 20,796,289 | -- | -- |
| Total Investments in Securities: | $1,342,163,159 | $1,319,636,776 | $18,721,608 | $3,804,775 |
See accompanying notes which are an integral part of the financial statements.
Financial Statements
Statement of Assets and Liabilities
| November 30, 2015 | ||
| Assets | ||
| Investment in securities, at value (including securities loaned of $11,407,091) — See accompanying schedule: Unaffiliated issuers (cost $1,165,605,440) | $1,321,366,870 | |
| Fidelity Central Funds (cost $20,796,289) | 20,796,289 | |
| Total Investments (cost $1,186,401,729) | $1,342,163,159 | |
| Receivable for investments sold | 4,847,281 | |
| Receivable for fund shares sold | 790,933 | |
| Dividends receivable | 2,988,971 | |
| Interest receivable | 7,314 | |
| Distributions receivable from Fidelity Central Funds | 28,931 | |
| Prepaid expenses | 3,261 | |
| Other receivables | 858 | |
| Total assets | 1,350,830,708 | |
| Liabilities | ||
| Payable for investments purchased | $2,183,811 | |
| Payable for fund shares redeemed | 4,234,758 | |
| Accrued management fee | 609,818 | |
| Distribution and service plan fees payable | 329,404 | |
| Other affiliated payables | 252,494 | |
| Other payables and accrued expenses | 49,564 | |
| Collateral on securities loaned, at value | 11,388,275 | |
| Total liabilities | 19,048,124 | |
| Net Assets | $1,331,782,584 | |
| Net Assets consist of: | ||
| Paid in capital | $1,142,721,550 | |
| Undistributed net investment income | 9,266,812 | |
| Accumulated undistributed net realized gain (loss) on investments and foreign currency transactions | 24,037,902 | |
| Net unrealized appreciation (depreciation) on investments and assets and liabilities in foreign currencies | 155,756,320 | |
| Net Assets | $1,331,782,584 | |
| Calculation of Maximum Offering Price | ||
| Class A: | ||
| Net Asset Value and redemption price per share ($469,026,196 ÷ 16,679,126 shares) | $28.12 | |
| Maximum offering price per share (100/94.25 of $28.12) | $29.84 | |
| Class T: | ||
| Net Asset Value and redemption price per share ($177,559,883 ÷ 6,336,184 shares) | $28.02 | |
| Maximum offering price per share (100/96.50 of $28.02) | $29.04 | |
| Class B: | ||
| Net Asset Value and offering price per share ($4,835,465 ÷ 185,194 shares)(a) | $26.11 | |
| Class C: | ||
| Net Asset Value and offering price per share ($181,956,807 ÷ 7,080,515 shares)(a) | $25.70 | |
| Class I: | ||
| Net Asset Value, offering price and redemption price per share ($498,404,233 ÷ 17,012,816 shares) | $29.30 |
(a) Redemption price per share is equal to net asset value less any applicable contingent deferred sales charge.
See accompanying notes which are an integral part of the financial statements.
Statement of Operations
| Year ended November 30, 2015 | ||
| Investment Income | ||
| Dividends | $27,054,554 | |
| Interest | 23,447 | |
| Income from Fidelity Central Funds | 336,789 | |
| Total income | 27,414,790 | |
| Expenses | ||
| Management fee | ||
| Basic fee | $7,364,032 | |
| Performance adjustment | 1,354,162 | |
| Transfer agent fees | 2,666,022 | |
| Distribution and service plan fees | 3,947,316 | |
| Accounting and security lending fees | 430,252 | |
| Custodian fees and expenses | 59,524 | |
| Independent trustees' compensation | 5,719 | |
| Registration fees | 125,412 | |
| Audit | 59,790 | |
| Legal | 4,964 | |
| Miscellaneous | 7,427 | |
| Total expenses before reductions | 16,024,620 | |
| Expense reductions | (53,587) | 15,971,033 |
| Net investment income (loss) | 11,443,757 | |
| Realized and Unrealized Gain (Loss) | ||
| Net realized gain (loss) on: | ||
| Investment securities: | ||
| Unaffiliated issuers | 29,710,390 | |
| Foreign currency transactions | 17,228 | |
| Total net realized gain (loss) | 29,727,618 | |
| Change in net unrealized appreciation (depreciation) on: Investment securities | (63,999,185) | |
| Assets and liabilities in foreign currencies | (7,945) | |
| Total change in net unrealized appreciation (depreciation) | (64,007,130) | |
| Net gain (loss) | (34,279,512) | |
| Net increase (decrease) in net assets resulting from operations | $(22,835,755) |
See accompanying notes which are an integral part of the financial statements.
Statement of Changes in Net Assets
| Year ended November 30, 2015 | Year ended November 30, 2014 | |
| Increase (Decrease) in Net Assets | ||
| Operations | ||
| Net investment income (loss) | $11,443,757 | $6,461,156 |
| Net realized gain (loss) | 29,727,618 | 41,893,521 |
| Change in net unrealized appreciation (depreciation) | (64,007,130) | 75,995,975 |
| Net increase (decrease) in net assets resulting from operations | (22,835,755) | 124,350,652 |
| Distributions to shareholders from net investment income | (5,828,260) | (4,161,808) |
| Distributions to shareholders from net realized gain | (37,026,970) | (46,319,957) |
| Total distributions | (42,855,230) | (50,481,765) |
| Share transactions - net increase (decrease) | 119,504,310 | 553,374,307 |
| Total increase (decrease) in net assets | 53,813,325 | 627,243,194 |
| Net Assets | ||
| Beginning of period | 1,277,969,259 | 650,726,065 |
| End of period (including undistributed net investment income of $9,266,812 and undistributed net investment income of $5,775,521, respectively) | $1,331,782,584 | $1,277,969,259 |
See accompanying notes which are an integral part of the financial statements.
Financial Highlights — Fidelity Advisor Large Cap Fund Class A
| Years ended November 30, | 2015 | 2014 | 2013 | 2012 | 2011 |
| Selected Per–Share Data | |||||
| Net asset value, beginning of period | $29.60 | $28.11 | $20.43 | $17.57 | $16.69 |
| Income from Investment Operations | |||||
| Net investment income (loss)A | .25 | .20 | .16 | .15 | .09 |
| Net realized and unrealized gain (loss) | (.74) | 3.45 | 7.61 | 3.30 | .87 |
| Total from investment operations | (.49) | 3.65 | 7.77 | 3.45 | .96 |
| Distributions from net investment income | (.14) | (.22) | (.02) | (.18) | (.06) |
| Distributions from net realized gain | (.85) | (1.94) | (.07) | (.41) | (.02) |
| Total distributions | (.99) | (2.16) | (.09) | (.59) | (.08) |
| Net asset value, end of period | $28.12 | $29.60 | $28.11 | $20.43 | $17.57 |
| Total ReturnB,C | (1.57)% | 14.13% | 38.16% | 19.69% | 5.73% |
| Ratios to Average Net AssetsD,E | |||||
| Expenses before reductions | 1.15% | 1.30% | 1.26% | 1.25% | 1.29% |
| Expenses net of fee waivers, if any | 1.15% | 1.25% | 1.26% | 1.25% | 1.29% |
| Expenses net of all reductions | 1.15% | 1.25% | 1.24% | 1.24% | 1.28% |
| Net investment income (loss) | .90% | .72% | .68% | .76% | .49% |
| Supplemental Data | |||||
| Net assets, end of period (000 omitted) | $469,026 | $414,421 | $214,686 | $123,303 | $103,670 |
| Portfolio turnover rateF | 31% | 28% | 54% | 59% | 83% |
A Calculated based on average shares outstanding during the period.
B Total returns would have been lower if certain expenses had not been reduced during the applicable periods shown.
C Total returns do not include the effect of the sales charges.
D Fees and expenses of any underlying Fidelity Central Funds are not included in the Fund's expense ratio. The Fund indirectly bears its proportionate share of the expenses of any underlying Fidelity Central Funds.
E Expense ratios reflect operating expenses of the class. Expenses before reductions do not reflect amounts reimbursed by the investment adviser or reductions from brokerage service arrangements or reductions from other expense offset arrangements and do not represent the amount paid by the class during periods when reimbursements or reductions occur. Expenses net of fee waivers reflect expenses after reimbursement by the investment adviser but prior to reductions from brokerage service arrangements or other expense offset arrangements. Expenses net of all reductions represent the net expenses paid by the class.
F Amount does not include the portfolio activity of any underlying Fidelity Central Funds.
See accompanying notes which are an integral part of the financial statements.
Financial Highlights — Fidelity Advisor Large Cap Fund Class T
| Years ended November 30, | 2015 | 2014 | 2013 | 2012 | 2011 |
| Selected Per–Share Data | |||||
| Net asset value, beginning of period | $29.50 | $28.02 | $20.41 | $17.51 | $16.63 |
| Income from Investment Operations | |||||
| Net investment income (loss)A | .18 | .13 | .10 | .10 | .04 |
| Net realized and unrealized gain (loss) | (.74) | 3.44 | 7.59 | 3.29 | .87 |
| Total from investment operations | (.56) | 3.57 | 7.69 | 3.39 | .91 |
| Distributions from net investment income | (.07) | (.15) | (.01) | (.10) | –B |
| Distributions from net realized gain | (.85) | (1.94) | (.07) | (.39) | (.02) |
| Total distributions | (.92) | (2.09) | (.08) | (.49) | (.03)C |
| Net asset value, end of period | $28.02 | $29.50 | $28.02 | $20.41 | $17.51 |
| Total ReturnD,E | (1.84)% | 13.83% | 37.82% | 19.39% | 5.44% |
| Ratios to Average Net AssetsF,G | |||||
| Expenses before reductions | 1.41% | 1.56% | 1.51% | 1.49% | 1.54% |
| Expenses net of fee waivers, if any | 1.41% | 1.50% | 1.51% | 1.49% | 1.54% |
| Expenses net of all reductions | 1.41% | 1.50% | 1.49% | 1.49% | 1.53% |
| Net investment income (loss) | .63% | .47% | .42% | .52% | .24% |
| Supplemental Data | |||||
| Net assets, end of period (000 omitted) | $177,560 | $170,613 | $114,864 | $76,151 | $69,678 |
| Portfolio turnover rateH | 31% | 28% | 54% | 59% | 83% |
A Calculated based on average shares outstanding during the period.
B Amount represents less than $.005 per share.
C Total distributions of $.03 per share is comprised of distributions from net investment income of $.004 and distributions from net realized gain of $.021 per share.
D Total returns would have been lower if certain expenses had not been reduced during the applicable periods shown.
E Total returns do not include the effect of the sales charges.
F Fees and expenses of any underlying Fidelity Central Funds are not included in the Fund's expense ratio. The Fund indirectly bears its proportionate share of the expenses of any underlying Fidelity Central Funds.
G Expense ratios reflect operating expenses of the class. Expenses before reductions do not reflect amounts reimbursed by the investment adviser or reductions from brokerage service arrangements or reductions from other expense offset arrangements and do not represent the amount paid by the class during periods when reimbursements or reductions occur. Expenses net of fee waivers reflect expenses after reimbursement by the investment adviser but prior to reductions from brokerage service arrangements or other expense offset arrangements. Expenses net of all reductions represent the net expenses paid by the class.
H Amount does not include the portfolio activity of any underlying Fidelity Central Funds.
See accompanying notes which are an integral part of the financial statements.
Financial Highlights — Fidelity Advisor Large Cap Fund Class B
| Years ended November 30, | 2015 | 2014 | 2013 | 2012 | 2011 |
| Selected Per–Share Data | |||||
| Net asset value, beginning of period | $27.52 | $26.24 | $19.21 | $16.49 | $15.72 |
| Income from Investment Operations | |||||
| Net investment income (loss)A | .01 | (.01) | (.03) | –B | (.05) |
| Net realized and unrealized gain (loss) | (.69) | 3.23 | 7.13 | 3.10 | .82 |
| Total from investment operations | (.68) | 3.22 | 7.10 | 3.10 | .77 |
| Distributions from net investment income | – | – | – | – | – |
| Distributions from net realized gain | (.73) | (1.94) | (.07) | (.38) | – |
| Total distributions | (.73) | (1.94) | (.07) | (.38) | – |
| Net asset value, end of period | $26.11 | $27.52 | $26.24 | $19.21 | $16.49 |
| Total ReturnC,D | (2.42)% | 13.30% | 37.08% | 18.77% | 4.90% |
| Ratios to Average Net AssetsE,F | |||||
| Expenses before reductions | 2.00% | 2.16% | 2.06% | 2.02% | 2.04% |
| Expenses net of fee waivers, if any | 1.99% | 2.00% | 2.06% | 2.02% | 2.04% |
| Expenses net of all reductions | 1.99% | 2.00% | 2.05% | 2.01% | 2.04% |
| Net investment income (loss) | .05% | (.03)% | (.13)% | (.01)% | (.26)% |
| Supplemental Data | |||||
| Net assets, end of period (000 omitted) | $4,835 | $8,401 | $10,499 | $10,535 | $12,839 |
| Portfolio turnover rateG | 31% | 28% | 54% | 59% | 83% |
A Calculated based on average shares outstanding during the period.
B Amount represents less than $.005 per share.
C Total returns would have been lower if certain expenses had not been reduced during the applicable periods shown.
D Total returns do not include the effect of the contingent deferred sales charge.
E Fees and expenses of any underlying Fidelity Central Funds are not included in the Fund's expense ratio. The Fund indirectly bears its proportionate share of the expenses of any underlying Fidelity Central Funds.
F Expense ratios reflect operating expenses of the class. Expenses before reductions do not reflect amounts reimbursed by the investment adviser or reductions from brokerage service arrangements or reductions from other expense offset arrangements and do not represent the amount paid by the class during periods when reimbursements or reductions occur. Expenses net of fee waivers reflect expenses after reimbursement by the investment adviser but prior to reductions from brokerage service arrangements or other expense offset arrangements. Expenses net of all reductions represent the net expenses paid by the class.
G Amount does not include the portfolio activity of any underlying Fidelity Central Funds.
See accompanying notes which are an integral part of the financial statements.
Financial Highlights — Fidelity Advisor Large Cap Fund Class C
| Years ended November 30, | 2015 | 2014 | 2013 | 2012 | 2011 |
| Selected Per–Share Data | |||||
| Net asset value, beginning of period | $27.21 | $26.07 | $19.08 | $16.41 | $15.65 |
| Income from Investment Operations | |||||
| Net investment income (loss)A | .04 | (.01) | (.02) | –B | (.04) |
| Net realized and unrealized gain (loss) | (.69) | 3.19 | 7.08 | 3.09 | .80 |
| Total from investment operations | (.65) | 3.18 | 7.06 | 3.09 | .76 |
| Distributions from net investment income | (.01) | (.10) | –B | (.03) | – |
| Distributions from net realized gain | (.85) | (1.94) | (.07) | (.39) | – |
| Total distributions | (.86) | (2.04) | (.07) | (.42) | – |
| Net asset value, end of period | $25.70 | $27.21 | $26.07 | $19.08 | $16.41 |
| Total ReturnC,D | (2.33)% | 13.31% | 37.14% | 18.83% | 4.86% |
| Ratios to Average Net AssetsE,F | |||||
| Expenses before reductions | 1.90% | 2.05% | 2.00% | 2.00% | 2.03% |
| Expenses net of fee waivers, if any | 1.90% | 2.00% | 2.00% | 2.00% | 2.03% |
| Expenses net of all reductions | 1.90% | 2.00% | 1.99% | 1.99% | 2.03% |
| Net investment income (loss) | .14% | (.03)% | (.07)% | .01% | (.25)% |
| Supplemental Data | |||||
| Net assets, end of period (000 omitted) | $181,957 | $168,763 | $67,780 | $28,856 | $24,197 |
| Portfolio turnover rateG | 31% | 28% | 54% | 59% | 83% |
A Calculated based on average shares outstanding during the period.
B Amount represents less than $.005 per share.
C Total returns would have been lower if certain expenses had not been reduced during the applicable periods shown.
D Total returns do not include the effect of the contingent deferred sales charge.
E Fees and expenses of any underlying Fidelity Central Funds are not included in the Fund's expense ratio. The Fund indirectly bears its proportionate share of the expenses of any underlying Fidelity Central Funds.
F Expense ratios reflect operating expenses of the class. Expenses before reductions do not reflect amounts reimbursed by the investment adviser or reductions from brokerage service arrangements or reductions from other expense offset arrangements and do not represent the amount paid by the class during periods when reimbursements or reductions occur. Expenses net of fee waivers reflect expenses after reimbursement by the investment adviser but prior to reductions from brokerage service arrangements or other expense offset arrangements. Expenses net of all reductions represent the net expenses paid by the class.
G Amount does not include the portfolio activity of any underlying Fidelity Central Funds.
See accompanying notes which are an integral part of the financial statements.
Financial Highlights — Fidelity Advisor Large Cap Fund Class I
| Years ended November 30, | 2015 | 2014 | 2013 | 2012 | 2011 |
| Selected Per–Share Data | |||||
| Net asset value, beginning of period | $30.78 | $29.03 | $21.03 | $18.13 | $17.22 |
| Income from Investment Operations | |||||
| Net investment income (loss)A | .34 | .28 | .24 | .22 | .15 |
| Net realized and unrealized gain (loss) | (.78) | 3.59 | 7.85 | 3.40 | .89 |
| Total from investment operations | (.44) | 3.87 | 8.09 | 3.62 | 1.04 |
| Distributions from net investment income | (.20) | (.18) | (.02) | (.31) | (.11) |
| Distributions from net realized gain | (.85) | (1.94) | (.07) | (.41) | (.02) |
| Total distributions | (1.04)B | (2.12) | (.09) | (.72) | (.13) |
| Net asset value, end of period | $29.30 | $30.78 | $29.03 | $21.03 | $18.13 |
| Total ReturnC | (1.33)% | 14.43% | 38.62% | 20.10% | 6.03% |
| Ratios to Average Net AssetsD,E | |||||
| Expenses before reductions | .89% | 1.04% | .95% | .91% | .95% |
| Expenses net of fee waivers, if any | .89% | 1.00% | .95% | .91% | .95% |
| Expenses net of all reductions | .89% | 1.00% | .94% | .91% | .94% |
| Net investment income (loss) | 1.15% | .97% | .98% | 1.10% | .83% |
| Supplemental Data | |||||
| Net assets, end of period (000 omitted) | $498,404 | $515,771 | $242,897 | $1,071,491 | $1,013,999 |
| Portfolio turnover rateF | 31% | 28% | 54% | 59% | 83% |
A Calculated based on average shares outstanding during the period.
B Total distributions of $1.04 per share is comprised of distributions from net investment income of $.195 and distributions from net realized gain of $.849 per share.
C Total returns would have been lower if certain expenses had not been reduced during the applicable periods shown.
D Fees and expenses of any underlying Fidelity Central Funds are not included in the Fund's expense ratio. The Fund indirectly bears its proportionate share of the expenses of any underlying Fidelity Central Funds.
E Expense ratios reflect operating expenses of the class. Expenses before reductions do not reflect amounts reimbursed by the investment adviser or reductions from brokerage service arrangements or reductions from other expense offset arrangements and do not represent the amount paid by the class during periods when reimbursements or reductions occur. Expenses net of fee waivers reflect expenses after reimbursement by the investment adviser but prior to reductions from brokerage service arrangements or other expense offset arrangements. Expenses net of all reductions represent the net expenses paid by the class.
F Amount does not include the portfolio activity of any underlying Fidelity Central Funds.
See accompanying notes which are an integral part of the financial statements.
Notes to Financial Statements
For the period ended November 30, 2015
1. Organization.
Fidelity Advisor Large Cap Fund (the Fund) is a fund of Fidelity Advisor Series I (the Trust) and is authorized to issue an unlimited number of shares. The Trust is registered under the Investment Company Act of 1940, as amended (the 1940 Act), as an open-end management investment company organized as a Massachusetts business trust. The Fund offers Class A, Class T, Class C and Class I (formerly Institutional Class) shares, each of which, along with Class B shares, has equal rights as to assets and voting privileges. Class B shares are closed to new accounts and additional purchases, except for exchanges and reinvestments. Each class has exclusive voting rights with respect to matters that affect that class. Class B shares will automatically convert to Class A shares after a holding period of seven years from the initial date of purchase.
2. Investments in Fidelity Central Funds.
The Fund invests in Fidelity Central Funds, which are open-end investment companies generally available only to other investment companies and accounts managed by the investment adviser and its affiliates. The Fund's Schedule of Investments lists each of the Fidelity Central Funds held as of period end, if any, as an investment of the Fund, but does not include the underlying holdings of each Fidelity Central Fund. As an Investing Fund, the Fund indirectly bears its proportionate share of the expenses of the underlying Fidelity Central Funds.
The Money Market Central Funds seek preservation of capital and current income and are managed by Fidelity Investments Money Management, Inc. (FIMM), an affiliate of the investment adviser. Annualized expenses of the Money Market Central Funds as of their most recent shareholder report date are less than .005%.
A complete unaudited list of holdings for each Fidelity Central Fund is available upon request or at the Securities and Exchange Commission (the SEC) website at www.sec.gov. In addition, the financial statements of the Fidelity Central Funds, which are not covered by the Fund's Report of Independent Registered Public Accounting Firm, are available on the SEC website or upon request.
3. Significant Accounting Policies.
The financial statements have been prepared in conformity with accounting principles generally accepted in the United States of America (GAAP), which require management to make certain estimates and assumptions at the date of the financial statements. Actual results could differ from those estimates. Subsequent events, if any, through the date that the financial statements were issued have been evaluated in the preparation of the financial statements. The following summarizes the significant accounting policies of the Fund:
Investment Valuation. Investments are valued as of 4:00 p.m. Eastern time on the last calendar day of the period. The Board of Trustees (the Board) has delegated the day to day responsibility for the valuation of the Fund's investments to the Fidelity Management & Research Company (FMR) Fair Value Committee (the Committee). In accordance with valuation policies and procedures approved by the Board, the Fund attempts to obtain prices from one or more third party pricing vendors or brokers to value its investments. When current market prices, quotations or currency exchange rates are not readily available or reliable, investments will be fair valued in good faith by the Committee, in accordance with procedures adopted by the Board. Factors used in determining fair value vary by investment type and may include market or investment specific events, changes in interest rates and credit quality. The frequency with which these procedures are used cannot be predicted and they may be utilized to a significant extent. The Committee oversees the Fund's valuation policies and procedures and reports to the Board on the Committee's activities and fair value determinations. The Board monitors the appropriateness of the procedures used in valuing the Fund's investments and ratifies the fair value determinations of the Committee.
The Fund categorizes the inputs to valuation techniques used to value its investments into a disclosure hierarchy consisting of three levels as shown below:
- Level 1 – quoted prices in active markets for identical investments
- Level 2 – other significant observable inputs (including quoted prices for similar investments, interest rates, prepayment speeds, etc.)
- Level 3 – unobservable inputs (including the Fund's own assumptions based on the best information available)
Valuation techniques used to value the Fund's investments by major category are as follows:
Equity securities, including restricted securities, for which market quotations are readily available, are valued at the last reported sale price or official closing price as reported by a third party pricing vendor on the primary market or exchange on which they are traded and are categorized as Level 1 in the hierarchy. In the event there were no sales during the day or closing prices are not available, securities are valued at the last quoted bid price or may be valued using the last available price and are generally categorized as Level 2 in the hierarchy. For foreign equity securities, when market or security specific events arise, comparisons to the valuation of American Depositary Receipts (ADRs), futures contracts, Exchange-Traded Funds (ETFs) and certain indexes as well as quoted prices for similar securities may be used and would be categorized as Level 2 in the hierarchy. Utilizing these techniques may result in transfers between Level 1 and Level 2. For equity securities, including restricted securities, where observable inputs are limited, assumptions about market activity and risk are used and these securities may be categorized as Level 3 in the hierarchy.
Debt securities, including restricted securities, are valued based on evaluated prices received from third party pricing vendors or from brokers who make markets in such securities. Corporate bonds are valued by pricing vendors who utilize matrix pricing which considers yield or price of bonds of comparable quality, coupon, maturity and type or by broker-supplied prices. When independent prices are unavailable or unreliable, debt securities may be valued utilizing pricing methodologies which consider similar factors that would be used by third party pricing vendors. Debt securities are generally categorized as Level 2 in the hierarchy but may be Level 3 depending on the circumstances.
Investments in open-end mutual funds, including the Fidelity Central Funds, are valued at their closing net asset value (NAV) each business day and are categorized as Level 1 in the hierarchy.
Changes in valuation techniques may result in transfers in or out of an assigned level within the disclosure hierarchy. The aggregate value of investments by input level as of November 30, 2015 is included at the end of the Fund's Schedule of Investments.
Foreign Currency. The Fund may use foreign currency contracts to facilitate transactions in foreign-denominated securities. Gains and losses from these transactions may arise from changes in the value of the foreign currency or if the counterparties do not perform under the contracts' terms.
Foreign-denominated assets, including investment securities, and liabilities are translated into U.S. dollars at the exchange rates at period end. Purchases and sales of investment securities, income and dividends received and expenses denominated in foreign currencies are translated into U.S. dollars at the exchange rate in effect on the transaction date.
The effects of exchange rate fluctuations on investments are included with the net realized and unrealized gain (loss) on investment securities. Other foreign currency transactions resulting in realized and unrealized gain (loss) are disclosed separately.
Investment Transactions and Income. For financial reporting purposes, the Fund's investment holdings and NAV include trades executed through the end of the last business day of the period. The NAV per share for processing shareholder transactions is calculated as of the close of business of the New York Stock Exchange (NYSE), normally 4:00 p.m. Eastern time and includes trades executed through the end of the prior business day. Gains and losses on securities sold are determined on the basis of identified cost and may include proceeds received from litigation. Dividend income is recorded on the ex-dividend date, except for certain dividends from foreign securities where the ex-dividend date may have passed, which are recorded as soon as the Fund is informed of the ex-dividend date. Non-cash dividends included in dividend income, if any, are recorded at the fair market value of the securities received. Income and capital gain distributions from Fidelity Central Funds, if any, are recorded on the ex-dividend date. Distributions received on securities that represent a return of capital or capital gain are recorded as a reduction of cost of investments and/or as a realized gain. Subsequent to ex-dividend date the Fund determines the components of these distributions, based upon receipt of tax filings or other correspondence relating to the underlying investment. Interest income is accrued as earned and includes coupon interest and amortization of premium and accretion of discount on debt securities as applicable. Investment income is recorded net of foreign taxes withheld where recovery of such taxes is uncertain.
Class Allocations and Expenses. Investment income, realized and unrealized capital gains and losses, common expenses of the Fund, and certain fund-level expense reductions, if any, are allocated daily on a pro-rata basis to each class based on the relative net assets of each class to the total net assets of the Fund. Each class differs with respect to transfer agent and distribution and service plan fees incurred. Certain expense reductions may also differ by class. For the reporting period, the allocated portion of income and expenses to each class as a percent of its average net assets may vary due to the timing of recording these transactions in relation to fluctuating net assets of the classes. Expenses directly attributable to a fund are charged to that fund. Expenses attributable to more than one fund are allocated among the respective funds on the basis of relative net assets or other appropriate methods. Expense estimates are accrued in the period to which they relate and adjustments are made when actual amounts are known.
Income Tax Information and Distributions to Shareholders. Each year, the Fund intends to qualify as a regulated investment company under Subchapter M of the Internal Revenue Code, including distributing substantially all of its taxable income and realized gains. As a result, no provision for U.S. Federal income taxes is required. As of November 30, 2015, the Fund did not have any unrecognized tax benefits in the financial statements; nor is the Fund aware of any tax positions for which it is reasonably possible that the total amounts of unrecognized tax benefits will significantly change in the next twelve months. The Fund files a U.S. federal tax return, in addition to state and local tax returns as required. The Fund's federal income tax returns are subject to examination by the Internal Revenue Service (IRS) for a period of three fiscal years after they are filed. State and local tax returns may be subject to examination for an additional fiscal year depending on the jurisdiction. Foreign taxes are provided for based on the Fund's understanding of the tax rules and rates that exist in the foreign markets in which it invests.
Distributions are declared and recorded on the ex-dividend date. Income dividends and capital gain distributions are declared separately for each class. Income and capital gain distributions are determined in accordance with income tax regulations, which may differ from GAAP. In addition, the Fund claimed a portion of the payment made to redeeming shareholders as a distribution for income tax purposes.
Capital accounts within the financial statements are adjusted for permanent book-tax differences. These adjustments have no impact on net assets or the results of operations. Capital accounts are not adjusted for temporary book-tax differences which will reverse in a subsequent period.
Book-tax differences are primarily due to partnerships, foreign currency transactions, deferred trustees compensation and losses deferred due to wash sales.
The federal tax cost of investment securities and unrealized appreciation (depreciation) as of period end were as follows:
| Gross unrealized appreciation | $248,701,371 |
| Gross unrealized depreciation | (97,078,194) |
| Net unrealized appreciation (depreciation) on securities | $151,623,177 |
| Tax Cost | $1,190,539,982 |
The tax-based components of distributable earnings as of period end were as follows:
| Undistributed ordinary income | $9,266,825 |
| Undistributed long-term capital gain | $28,176,155 |
| Net unrealized appreciation (depreciation) on securities and other investments | $151,618,067 |
The tax character of distributions paid was as follows:
| November 30, 2015 | November 30, 2014 | |
| Ordinary Income | $11,250,007 | $ 4,161,808 |
| Long-term Capital Gains | 31,605,223 | 46,319,957 |
| Total | $42,855,230 | $ 50,481,765 |
Restricted Securities. The Fund may invest in securities that are subject to legal or contractual restrictions on resale. These securities generally may be resold in transactions exempt from registration or to the public if the securities are registered. Disposal of these securities may involve time-consuming negotiations and expense, and prompt sale at an acceptable price may be difficult. Information regarding restricted securities is included at the end of the Fund's Schedule of Investments.
4. Purchases and Sales of Investments.
Purchases and sales of securities, other than short-term securities, aggregated $519,590,858 and $404,008,132, respectively.
5. Fees and Other Transactions with Affiliates.
Management Fee. Fidelity Management & Research Company (the investment adviser) and its affiliates provide the Fund with investment management related services for which the Fund pays a monthly management fee. The management fee is the sum of an individual fund fee rate that is based on an annual rate of .30% of the Fund's average net assets and an annualized group fee rate that averaged .25% during the period. The group fee rate is based upon the average net assets of all the mutual funds advised by the investment adviser, including any mutual funds previously advised by the investment adviser that are currently advised by Fidelity SelectCo, LLC, an affiliate of the investment adviser. The group fee rate decreases as assets under management increase and increases as assets under management decrease. In addition, the management fee is subject to a performance adjustment (up to a maximum of +/- .20% of the Fund's average net assets over a 36 month performance period). The upward or downward adjustment to the management fee is based on the relative investment performance of Class I of the Fund as compared to its benchmark index, the S&P 500 Index, over the same 36 month performance period. For the reporting period, the total annual management fee rate, including the performance adjustment, was .65% of the Fund's average net assets. The performance adjustment included in the management fee rate may be higher or lower than the maximum performance adjustment rate due to the difference between the average net assets for the reporting and performance periods.
Distribution and Service Plan Fees. In accordance with Rule 12b-1 of the 1940 Act, the Fund has adopted separate Distribution and Service Plans for each class of shares. Certain classes pay Fidelity Distributors Corporation (FDC), an affiliate of the investment adviser, separate Distribution and Service Fees, each of which is based on an annual percentage of each class' average net assets. In addition, FDC may pay financial intermediaries for selling shares of the Fund and providing shareholder support services. For the period, the Distribution and Service Fee rates, total fees and amounts retained by FDC were as follows:
| Distribution Fee | Service Fee | Total Fees | Retained by FDC | |
| Class A | -% | .25% | $1,153,574 | $44,899 |
| Class T | .25% | .25% | 897,464 | 1,279 |
| Class B | .75% | .25% | 64,851 | 49,204 |
| Class C | .75% | .25% | 1,831,427 | 727,520 |
| $3,947,316 | $822,902 |
Sales Load. FDC may receive a front-end sales charge of up to 5.75% for selling Class A shares and 3.50% for selling Class T shares, some of which is paid to financial intermediaries for selling shares of the Fund. Depending on the holding period, FDC may receive contingent deferred sales charges levied on Class A, Class T, Class B, and Class C redemptions. The deferred sales charges range from 5.00% to 1.00% for Class B shares, 1.00% for Class C shares, 1.00% for certain purchases of Class A shares and .25% for certain purchases of Class T shares.
For the period, sales charge amounts retained by FDC were as follows:
| Retained by FDC | |
| Class A | $217,284 |
| Class T | 30,621 |
| Class B(a) | 1,454 |
| Class C(a) | 39,172 |
| $288,531 |
(a) When Class B and Class C shares are initially sold, FDC pays commissions from its own resources to financial intermediaries through which the sales are made.
Transfer Agent Fees. Fidelity Investments Institutional Operations Company, Inc., (FIIOC), an affiliate of the investment adviser, is the transfer, dividend disbursing and shareholder servicing agent for each class of the Fund. FIIOC receives account fees and asset-based fees that vary according to the account size and type of account of the shareholders of the respective classes of the Fund. FIIOC pays for typesetting, printing and mailing of shareholder reports, except proxy statements.
For the period, transfer agent fees for each class were as follows:
| Amount | % of Class-Level Average Net Assets | |
| Class A | $914,888 | .20 |
| Class T | 379,869 | .21 |
| Class B | 19,635 | .30 |
| Class C | 373,434 | .20 |
| Class I | 978,196 | .19 |
| $2,666,022 |
Accounting and Security Lending Fees. Fidelity Service Company, Inc. (FSC), an affiliate of the investment adviser, maintains the Fund's accounting records. The accounting fee is based on the level of average net assets for each month. Under a separate contract, FSC administers the security lending program. The security lending fee is based on the number and duration of lending transactions.
Brokerage Commissions. The Fund placed a portion of its portfolio transactions with brokerage firms which are affiliates of the investment adviser. Brokerage commissions are included in net realized gain (loss) and change in net unrealized appreciation (depreciation) in the Statement of Operations. The commissions paid to these affiliated firms were $8,062 for the period.
6. Committed Line of Credit.
The Fund participates with other funds managed by the investment adviser or an affiliate in a $4.25 billion credit facility (the "line of credit") to be utilized for temporary or emergency purposes to fund shareholder redemptions or for other short-term liquidity purposes. The Fund has agreed to pay commitment fees on its pro-rata portion of the line of credit, which amounted to $1,889 and is reflected in Miscellaneous expenses on the Statement of Operations. During the period, the Fund did not borrow on this line of credit.
7. Security Lending.
The Fund lends portfolio securities through a lending agent from time to time in order to earn additional income. For equity securities, a lending agent is used and may loan securities to certain qualified borrowers, including Fidelity Capital Markets (FCM), a broker-dealer affiliated with the Fund. On the settlement date of the loan, the Fund receives collateral (in the form of U.S. Treasury obligations, letters of credit and/or cash) against the loaned securities and maintains collateral in an amount not less than 100% of the market value of the loaned securities during the period of the loan. The market value of the loaned securities is determined at the close of business of the Fund and any additional required collateral is delivered to the Fund on the next business day. The Fund or borrower may terminate the loan at any time, and if the borrower defaults on its obligation to return the securities loaned because of insolvency or other reasons, the Fund may apply collateral received from the borrower against the obligation. The Fund may experience delays and costs in recovering the securities loaned. Any cash collateral received is invested in the Fidelity Securities Lending Cash Central Fund. The value of loaned securities and cash collateral at period end are disclosed on the Fund's Statement of Assets and Liabilities. At period end, there were no security loans outstanding with FCM. Security lending income represents the income earned on investing cash collateral, less rebates paid to borrowers and any lending agent fees associated with the loan, plus any premium payments received for lending certain types of securities. Security lending income is presented in the Statement of Operations as a component of income from Fidelity Central Funds. Total security lending income during the period amounted to $312,822, including $199 from securities loaned to FCM.
8. Expense Reductions.
The investment adviser contractually agreed to reimburse each class to the extent annual operating expenses exceeded certain levels of average net assets as noted in the table below. This reimbursement remained in place through January 31, 2015. Some expenses, for example interest expense, including commitment fees, are excluded from this reimbursement.
The following classes were in reimbursement during the period:
| Expense Limitations | Reimbursement | |
| Class B | 2.00% | $ 900 |
Effective February 1, 2015 the expense limitations were discontinued.
Commissions paid to certain brokers with whom the investment adviser, or its affiliates, places trades on behalf of the Fund include an amount in addition to trade execution, which may be rebated back to the Fund to offset certain expenses. This amount totaled $23,306 for the period. Through arrangements with the Fund's custodian, credits realized as a result of certain uninvested cash balances were used to reduce the Fund's expenses. During the period, these credits reduced the Fund's expenses by $57.
In addition, during the period the investment adviser reimbursed and/or waived a portion of fund-level operating expenses in the amount of $5,590 and a portion of the class-level operating expenses as follows:
| Amount | |
| Class A | $6,444 |
| Class T | 3,051 |
| Class B | 21 |
| Class C | 2,393 |
| Class I | 11,825 |
| $23,734 |
9. Distributions to Shareholders.
Distributions to shareholders of each class were as follows:
| Years ended November 30, | 2015 | 2014 |
| From net investment income | ||
| Class A | $2,028,918 | $1,725,330 |
| Class T | 401,622 | 631,390 |
| Class C | 82,446 | 276,842 |
| Class I | 3,315,274 | 1,528,246 |
| Total | $5,828,260 | $4,161,808 |
| From net realized gain | ||
| Class A | $12,045,812 | $15,246,732 |
| Class T | 4,941,694 | 8,130,692 |
| Class B | 220,894 | 772,695 |
| Class C | 5,384,378 | 5,278,471 |
| Class I | 14,434,192 | 16,891,367 |
| Total | $37,026,970 | $46,319,957 |
10. Share Transactions.
Share transactions for each class were as follows and may contain automatic conversions between classes or exchanges between funds:
| Shares | Shares | Dollars | Dollars | |
| Years ended November 30, | 2015 | 2014 | 2015 | 2014 |
| Class A | ||||
| Shares sold | 6,318,731 | 8,408,316 | $179,805,007 | $235,098,861 |
| Reinvestment of distributions | 488,972 | 597,961 | 13,432,055 | 15,576,063 |
| Shares redeemed | (4,126,969) | (2,644,637) | (116,797,696) | (73,404,808) |
| Net increase (decrease) | 2,680,734 | 6,361,640 | $76,439,366 | $177,270,116 |
| Class T | ||||
| Shares sold | 1,467,747 | 2,252,343 | $41,749,475 | $62,382,415 |
| Reinvestment of distributions | 188,811 | 330,308 | 5,182,860 | 8,595,867 |
| Shares redeemed | (1,103,079) | (899,697) | (31,222,052) | (24,855,772) |
| Net increase (decrease) | 553,479 | 1,682,954 | $15,710,283 | $46,122,510 |
| Class B | ||||
| Shares sold | 8,184 | 30,155 | $216,847 | $767,030 |
| Reinvestment of distributions | 8,005 | 28,643 | 205,898 | 699,228 |
| Shares redeemed | (136,299) | (153,665) | (3,621,450) | (3,963,597) |
| Net increase (decrease) | (120,110) | (94,867) | $(3,198,705) | $(2,497,339) |
| Class C | ||||
| Shares sold | 2,311,592 | 3,985,252 | $60,389,767 | $102,765,440 |
| Reinvestment of distributions | 182,523 | 203,409 | 4,616,012 | 4,911,069 |
| Shares redeemed | (1,616,562) | (585,466) | (41,900,226) | (14,978,915) |
| Net increase (decrease) | 877,553 | 3,603,195 | $23,105,553 | $92,697,594 |
| Class I | ||||
| Shares sold | 7,784,685 | 11,292,139 | $230,249,704 | $325,660,606 |
| Reinvestment of distributions | 563,541 | 653,047 | 16,089,097 | 17,642,167 |
| Shares redeemed | (8,094,060) | (3,554,189) | (238,890,988) | (103,521,347) |
| Net increase (decrease) | 254,166 | 8,390,997 | $7,447,813 | $239,781,426 |
11. Other.
The Fund's organizational documents provide former and current trustees and officers with a limited indemnification against liabilities arising in connection with the performance of their duties to the Fund. In the normal course of business, the Fund may also enter into contracts that provide general indemnifications. The Fund's maximum exposure under these arrangements is unknown as this would be dependent on future claims that may be made against the Fund. The risk of material loss from such claims is considered remote.
Report of Independent Registered Public Accounting Firm
To the Trustees of Fidelity Advisor Series I and Shareholders of Fidelity Advisor® Large Cap Fund:
We have audited the accompanying statement of assets and liabilities of Fidelity Advisor® Large Cap Fund (the Fund), a fund of Fidelity Advisor Series I, including the schedule of investments, as of November 30, 2015, and the related statement of operations for the year then ended, the statement of changes in net assets for each of the two years in the period then ended, and the financial highlights for each of the five years in the period then ended. These financial statements and financial highlights are the responsibility of the Fund's management. Our responsibility is to express an opinion on these financial statements and financial highlights based on our audits.
We conducted our audits in accordance with the standards of the Public Company Accounting Oversight Board (United States). Those standards require that we plan and perform the audit to obtain reasonable assurance about whether the financial statements and financial highlights are free of material misstatement. The Fund is not required to have, nor were we engaged to perform, an audit of its internal control over financial reporting. Our audits included consideration of internal control over financial reporting as a basis for designing audit procedures that are appropriate in the circumstances, but not for the purpose of expressing an opinion on the effectiveness of the Fund's internal control over financial reporting. Accordingly, we express no such opinion. An audit also includes examining, on a test basis, evidence supporting the amounts and disclosures in the financial statements, assessing the accounting principles used and significant estimates made by management, as well as evaluating the overall financial statement presentation. Our procedures included confirmation of securities owned as of November 30, 2015, by correspondence with the custodians and brokers; when replies were not received from brokers, we performed other auditing procedures. We believe that our audits provide a reasonable basis for our opinion.
In our opinion, such financial statements and financial highlights referred to above present fairly, in all material respects, the financial position of Fidelity Advisor® Large Cap Fund as of November 30, 2015, the results of its operations for the year then ended, the changes in its net assets for each of the two years in the period then ended, and the financial highlights for each of the five years in the period then ended, in conformity with accounting principles generally accepted in the United States of America.
DELOITTE & TOUCHE LLP
Boston, Massachusetts
January 14, 2016
Trustees and Officers
The Trustees, Members of the Advisory Board (if any), and officers of the trust and fund, as applicable, are listed below. The Board of Trustees governs the fund and is responsible for protecting the interests of shareholders. The Trustees are experienced executives who meet periodically throughout the year to oversee the fund's activities, review contractual arrangements with companies that provide services to the fund, oversee management of the risks associated with such activities and contractual arrangements, and review the fund's performance. Each of the Trustees oversees 170 funds.
The Trustees hold office without limit in time except that (a) any Trustee may resign; (b) any Trustee may be removed by written instrument, signed by at least two-thirds of the number of Trustees prior to such removal; (c) any Trustee who requests to be retired or who has become incapacitated by illness or injury may be retired by written instrument signed by a majority of the other Trustees; and (d) any Trustee may be removed at any special meeting of shareholders by a two-thirds vote of the outstanding voting securities of the trust. Each Trustee who is not an interested person (as defined in the 1940 Act) of the trust and the fund is referred to herein as an Independent Trustee. Each Independent Trustee shall retire not later than the last day of the calendar year in which his or her 75th birthday occurs. The Independent Trustees may waive this mandatory retirement age policy with respect to individual Trustees. Officers and Advisory Board Members hold office without limit in time, except that any officer or Advisory Board Member may resign or may be removed by a vote of a majority of the Trustees at any regular meeting or any special meeting of the Trustees. Except as indicated, each individual has held the office shown or other offices in the same company for the past five years.
The fund’s Statement of Additional Information (SAI) includes more information about the Trustees. To request a free copy, call Fidelity at 1-877-208-0098.
Experience, Skills, Attributes, and Qualifications of the Trustees. The Governance and Nominating Committee has adopted a statement of policy that describes the experience, qualifications, attributes, and skills that are necessary and desirable for potential Independent Trustee candidates (Statement of Policy). The Board believes that each Trustee satisfied at the time he or she was initially elected or appointed a Trustee, and continues to satisfy, the standards contemplated by the Statement of Policy. The Governance and Nominating Committee also engages professional search firms to help identify potential Independent Trustee candidates who have the experience, qualifications, attributes, and skills consistent with the Statement of Policy. From time to time, additional criteria based on the composition and skills of the current Independent Trustees, as well as experience or skills that may be appropriate in light of future changes to board composition, business conditions, and regulatory or other developments, have also been considered by the professional search firms and the Governance and Nominating Committee. In addition, the Board takes into account the Trustees' commitment and participation in Board and committee meetings, as well as their leadership of standing and ad hoc committees throughout their tenure.
In determining that a particular Trustee was and continues to be qualified to serve as a Trustee, the Board has considered a variety of criteria, none of which, in isolation, was controlling. The Board believes that, collectively, the Trustees have balanced and diverse experience, qualifications, attributes, and skills, which allow the Board to operate effectively in governing the fund and protecting the interests of shareholders. Information about the specific experience, skills, attributes, and qualifications of each Trustee, which in each case led to the Board's conclusion that the Trustee should serve (or continue to serve) as a trustee of the fund, is provided below.
Board Structure and Oversight Function. James C. Curvey is an interested person and currently serves as Chairman. The Trustees have determined that an interested Chairman is appropriate and benefits shareholders because an interested Chairman has a personal and professional stake in the quality and continuity of services provided to the fund. Independent Trustees exercise their informed business judgment to appoint an individual of their choosing to serve as Chairman, regardless of whether the Trustee happens to be independent or a member of management. The Independent Trustees have determined that they can act independently and effectively without having an Independent Trustee serve as Chairman and that a key structural component for assuring that they are in a position to do so is for the Independent Trustees to constitute a substantial majority for the Board. The Independent Trustees also regularly meet in executive session. Ned C. Lautenbach serves as Chairman of the Independent Trustees and as such (i) acts as a liaison between the Independent Trustees and management with respect to matters important to the Independent Trustees and (ii) with management prepares agendas for Board meetings.
Fidelity® funds are overseen by different Boards of Trustees. The fund's Board oversees Fidelity's high income and certain equity funds, and other Boards oversee Fidelity's investment-grade bond, money market, asset allocation, and sector funds. The asset allocation funds may invest in Fidelity® funds overseen by the fund's Board. The use of separate Boards, each with its own committee structure, allows the Trustees of each group of Fidelity® funds to focus on the unique issues of the funds they oversee, including common research, investment, and operational issues. On occasion, the separate Boards establish joint committees to address issues of overlapping consequences for the Fidelity® funds overseen by each Board.
The Trustees operate using a system of committees to facilitate the timely and efficient consideration of all matters of importance to the Trustees, the fund, and fund shareholders and to facilitate compliance with legal and regulatory requirements and oversight of the fund's activities and associated risks. The Board, acting through its committees, has charged FMR and its affiliates with (i) identifying events or circumstances the occurrence of which could have demonstrably adverse effects on the fund's business and/or reputation; (ii) implementing processes and controls to lessen the possibility that such events or circumstances occur or to mitigate the effects of such events or circumstances if they do occur; and (iii) creating and maintaining a system designed to evaluate continuously business and market conditions in order to facilitate the identification and implementation processes described in (i) and (ii) above. Because the day-to-day operations and activities of the fund are carried out by or through FMR, its affiliates, and other service providers, the fund's exposure to risks is mitigated but not eliminated by the processes overseen by the Trustees. While each of the Board's committees has responsibility for overseeing different aspects of the fund's activities, oversight is exercised primarily through the Operations, Audit, and Compliance Committees. In addition, the Independent Trustees have worked with FMR to enhance the Board's oversight of investment and financial risks, legal and regulatory risks, technology risks, and operational risks, including the development of additional risk reporting to the Board. For example, a working group comprised of Independent Trustees and FMR has worked and continues to work to review the Fidelity® funds' valuation-related activities, reporting and risk management. Appropriate personnel, including but not limited to the fund's Chief Compliance Officer (CCO), FMR's internal auditor, the independent accountants, the fund's Treasurer and portfolio management personnel, make periodic reports to the Board's committees, as appropriate, including an annual review of Fidelity's risk management program for the Fidelity® funds. The responsibilities of each standing committee, including their oversight responsibilities, are described further under "Standing Committees of the Trustees."
Interested Trustees*:
Correspondence intended for a Trustee who is an interested person may be sent to Fidelity Investments, 245 Summer Street, Boston, Massachusetts 02210.
Name, Year of Birth; Principal Occupations and Other Relevant Experience+
James C. Curvey (1935)
Year of Election or Appointment: 2007
Trustee
Chairman of the Board of Trustees
Mr. Curvey also serves as Trustee of other Fidelity® funds. Mr. Curvey is a Director of Fidelity Research & Analysis Co. (investment adviser firm, 2009-present), and Vice Chairman (2007-present) and Director of FMR LLC (diversified financial services company). In addition, Mr. Curvey serves as an Overseer for the Boston Symphony Orchestra and a member of the board of Artis-Naples, Naples, Florida, and as a Trustee for Brewster Academy, Wolfeboro, New Hampshire. Previously, Mr. Curvey served as a Director of Fidelity Investments Money Management, Inc. (investment adviser firm, 2009-2014) and a Director of FMR and FMR Co., Inc. (investment adviser firms, 2007-2014).
Charles S. Morrison (1960)
Year of Election or Appointment: 2014
Trustee
Mr. Morrison also serves as Trustee of other funds. He serves as a Director of Fidelity Investments Money Management, Inc. (FIMM) (investment adviser firm, 2014-present), Director of Fidelity SelectCo, LLC (investment adviser firm, 2014-present), President, Asset Management (2014-present), and is an employee of Fidelity Investments. Previously, Mr. Morrison served as Vice President of Fidelity's Fixed Income and Asset Allocation Funds (2012-2014), President, Fixed Income (2011-2014), Vice President of Fidelity's Money Market Funds (2005-2009), President, Money Market Group Leader of FMR (investment adviser firm, 2009), and Senior Vice President, Money Market Group of FMR (2004-2009). Mr. Morrison also served as Vice President of Fidelity's Bond Funds (2002-2005), certain Balanced Funds (2002-2005), and certain Asset Allocation Funds (2002-2007), and as Senior Vice President (2002-2005) of Fidelity's Bond Division.
* Determined to be an “Interested Trustee” by virtue of, among other things, his or her affiliation with the trust or various entities under common control with FMR.
+ The information includes the Trustee's principal occupation during the last five years and other information relating to the experience, attributes, and skills relevant to the Trustee's qualifications to serve as a Trustee, which led to the conclusion that the Trustee should serve as a Trustee for the fund.
Independent Trustees:
Correspondence intended for an Independent Trustee may be sent to Fidelity Investments, P.O. Box 55235, Boston, Massachusetts 02205-5235.
Name, Year of Birth; Principal Occupations and Other Relevant Experience+
Dennis J. Dirks (1948)
Year of Election or Appointment: 2005
Trustee
Mr. Dirks also serves as Trustee of other Fidelity® funds. Prior to his retirement in May 2003, Mr. Dirks was Chief Operating Officer and a member of the Board of The Depository Trust & Clearing Corporation (DTCC). He also served as President, Chief Operating Officer, and Board member of The Depository Trust Company (DTC) and President and Board member of the National Securities Clearing Corporation (NSCC). In addition, Mr. Dirks served as Chief Executive Officer and Board member of the Government Securities Clearing Corporation, Chief Executive Officer and Board member of the Mortgage-Backed Securities Clearing Corporation, as a Trustee and a member of the Finance Committee of Manhattan College (2005-2008), as a Trustee and a member of the Finance Committee of AHRC of Nassau County (2006-2008), and as a member of the Independent Directors Council (IDC) Governing Council (2010-2015). Mr. Dirks is a member of the Board of Directors for The Brookville Center for Children's Services, Inc. (2009-present).
Alan J. Lacy (1953)
Year of Election or Appointment: 2008
Trustee
Mr. Lacy also serves as Trustee of other Fidelity® funds. Mr. Lacy serves as a member of the Board of Directors of Dave & Buster's Entertainment, Inc. (restaurant and entertainment complexes, 2010-present) and Bristol-Myers Squibb Company (global pharmaceuticals, 2008-present). In addition, Mr. Lacy served as Senior Adviser (2007-2014) of Oak Hill Capital Partners, L.P. (private equity) and also served as Chief Executive Officer (2000-2005) and Vice Chairman (2005-2006) of Sears Holdings Corporation and Sears, Roebuck and Co. (retail). Mr. Lacy is a member of the Board of Trustees of The National Parks Conservation Association (2006-present). Previously, Mr. Lacy served as Chairman of the Board of Trustees of the National Parks Conservation Association (2008-2011) and as a member of the Board of Directors for The Western Union Company (global money transfer, 2006-2011), The Hillman Companies, Inc. (hardware wholesalers, 2010-2014), and Earth Fare, Inc. (retail grocery, 2010-2014).
Ned C. Lautenbach (1944)
Year of Election or Appointment: 2000
Trustee
Chairman of the Independent Trustees
Mr. Lautenbach also serves as Trustee of other Fidelity® funds. Mr. Lautenbach currently serves as the Lead Director of the Eaton Corporation Board of Directors (diversified industrial, 1997-present). Mr. Lautenbach is Chairman of the Board of Directors of Artis-Naples in Naples, Florida (2012-present), a member of the Council on Foreign Relations (1994-present), and a member of the Board of Governors, State University System of Florida (2013-present). Previously, Mr. Lautenbach was a Partner/Advisory Partner at Clayton, Dubilier & Rice, LLC (private equity investment, 1998-2010), as well as a Director of Sony Corporation (2006-2007).
Joseph Mauriello (1944)
Year of Election or Appointment: 2008
Trustee
Mr. Mauriello also serves as Trustee of other Fidelity® funds. Prior to his retirement in January 2006, Mr. Mauriello served in numerous senior management positions including Deputy Chairman and Chief Operating Officer (2004-2005), and Vice Chairman of Financial Services (2002-2004) of KPMG LLP US (professional services, 1965-2005). Mr. Mauriello currently serves as a member of the Board of Directors of XL Group plc. (global insurance and re-insurance, 2006-present) and the Independent Directors Council (IDC) Governing Council (2015-present). Previously, Mr. Mauriello served as a Director of the Hamilton Funds of the Bank of New York (2006-2007) and of Arcadia Resources Inc. (health care services and products, 2007-2012).
Robert W. Selander (1950)
Year of Election or Appointment: 2011
Trustee
Mr. Selander also serves as Trustee of other Fidelity® funds. Mr. Selander serves as a Director of The Western Union Company (global money transfer, 2014-present). Previously, Mr. Selander served as a Member of the Advisory Board of other Fidelity® funds (2011), and Executive Vice Chairman (2010), Chief Executive Officer (2009-2010), and President and Chief Executive Officer (1997-2009) of Mastercard, Inc.
Cornelia M. Small (1944)
Year of Election or Appointment: 2005
Trustee
Ms. Small also serves as Trustee of other Fidelity® funds. Ms. Small is a member of the Board of Directors (2009-present) and Chair of the Investment Committee (2010-present) of the Teagle Foundation. Ms. Small also serves on the Investment Committee of the Berkshire Taconic Community Foundation (2008-present). Previously, Ms. Small served as Chairperson (2002-2008) and a member of the Investment Committee and Chairperson (2008-2012) and a member of the Board of Trustees of Smith College. In addition, Ms. Small served as Chief Investment Officer, Director of Global Equity Investments, and a member of the Board of Directors of Scudder, Stevens & Clark and Scudder Kemper Investments.
William S. Stavropoulos (1939)
Year of Election or Appointment: 2002
Trustee
Vice Chairman of the Independent Trustees
Mr. Stavropoulos also serves as Trustee of other Fidelity® funds. Mr. Stavropoulos serves as President and Founder of the Michigan Baseball Foundation, the Great Lakes Loons (2007-present). Mr. Stavropoulos is Chairman Emeritus of the Board of Directors of The Dow Chemical Company, where he previously served in numerous senior management positions, including President, CEO (1995-2000; 2002-2004), Chairman of the Executive Committee (2000-2006), and as a member of the Board of Directors (1990-2006). Currently, Mr. Stavropoulos is Chairman of the Board of Directors of Univar Inc. (global distributor of commodity and specialty chemicals), a Director of Teradata Corporation (data warehousing and technology solutions), and Maersk Inc. (industrial conglomerate), and a member of the Advisory Board for Metalmark Capital LLC (private equity investment, 2005-present). Mr. Stavropoulos is an operating advisor to Clayton, Dubilier & Rice, LLC (private equity investment). In addition, Mr. Stavropoulos is a member of the University of Notre Dame Advisory Council for the College of Science, a Trustee of the Rollin L. Gerstacker Foundation, and a Director of the Naples Philharmonic Center for the Arts. Previously, Mr. Stavropoulos served as a Director of Chemical Financial Corporation (bank holding company, 1993-2012) and Tyco International, Ltd. (multinational manufacturing and services, 2007-2012).
David M. Thomas (1949)
Year of Election or Appointment: 2008
Trustee
Mr. Thomas also serves as Trustee of other Fidelity® funds. Mr. Thomas serves as Non-Executive Chairman of the Board of Directors of Fortune Brands Home and Security (home and security products, 2011-present), as a member of the Board of Directors (2004-present) and Presiding Director (2013-present) of Interpublic Group of Companies, Inc. (marketing communication), and as a member of the Board of Trustees of the University of Florida (2013-present). Previously, Mr. Thomas served as Executive Chairman (2005-2006) and Chairman and Chief Executive Officer (2000-2005) of IMS Health, Inc. (pharmaceutical and healthcare information solutions), and a Director of Fortune Brands, Inc. (consumer products, 2000-2011).
+ The information includes the Trustee's principal occupation during the last five years and other information relating to the experience, attributes, and skills relevant to the Trustee's qualifications to serve as a Trustee, which led to the conclusion that the Trustee should serve as a Trustee for the fund.
Advisory Board Members and Officers:
Correspondence intended for an officer or Peter S. Lynch may be sent to Fidelity Investments, 245 Summer Street, Boston, Massachusetts 02210. Officers appear below in alphabetical order.
Name, Year of Birth; Principal Occupation
Peter S. Lynch (1944)
Year of Election or Appointment: 2003
Member of the Advisory Board
Mr. Lynch also serves as Member of the Advisory Board of other Fidelity® funds. Mr. Lynch is Vice Chairman and a Director of FMR (investment adviser firm) and FMR Co., Inc. (investment adviser firm). In addition, Mr. Lynch serves as a Trustee of Boston College and as the Chairman of the Inner-City Scholarship Fund. Previously, Mr. Lynch served on the Special Olympics International Board of Directors (1997-2006).
Elizabeth Paige Baumann (1968)
Year of Election or Appointment: 2012
Anti-Money Laundering (AML) Officer
Ms. Baumann also serves as AML Officer of other funds. She is Chief AML Officer of FMR LLC (diversified financial services company, 2012-present) and is an employee of Fidelity Investments. Previously, Ms. Baumann served as Vice President and Deputy Anti-Money Laundering Officer (2007-2012).
Marc R. Bryant (1966)
Year of Election or Appointment: 2015
Secretary and Chief Legal Officer (CLO)
Mr. Bryant also serves as Secretary and CLO of other funds. Mr. Bryant serves as CLO, Secretary, and Senior Vice President of Fidelity Management & Research Company (investment adviser firm, 2015-present) and FMR Co., Inc. (investment adviser firm, 2015-present); Secretary of Fidelity SelectCo, LLC (investment adviser firm, 2015-present) and Fidelity Investments Money Management, Inc. (investment adviser firm, 2015-present); and CLO of Fidelity Management & Research (Hong Kong) Limited (investment adviser firm, 2015-present). He is Senior Vice President and Deputy General Counsel of FMR LLC (diversified financial services company). Previously, Mr. Bryant served as Secretary and CLO of Fidelity Rutland Square Trust II (2010-2014) and Assistant Secretary of Fidelity's Fixed Income and Asset Allocation Funds (2013-2015). Prior to joining Fidelity Investments, Mr. Bryant served as a Senior Vice President and the Head of Global Retail Legal for AllianceBernstein L.P. (2006-2010), and as the General Counsel for ProFund Advisors LLC (2001-2006).
William C. Coffey (1969)
Year of Election or Appointment: 2009
Assistant Secretary
Mr. Coffey also serves as Assistant Secretary of other funds. He is Senior Vice President and Deputy General Counsel of FMR LLC (diversified financial services company, 2010-present), and is an employee of Fidelity Investments. Previously, Mr. Coffey served as Vice President and Associate General Counsel of FMR LLC (2005-2009).
Jonathan Davis (1968)
Year of Election or Appointment: 2010
Assistant Treasurer
Mr. Davis also serves as Assistant Treasurer of other funds, and is an employee of Fidelity Investments. Previously, Mr. Davis served as Vice President and Associate General Counsel of FMR LLC (diversified financial services company, 2003-2010).
Adrien E. Deberghes (1967)
Year of Election or Appointment: 2008
Deputy Treasurer
Mr. Deberghes also serves as an officer of other funds. He is an employee of Fidelity Investments (2008-present). Prior to joining Fidelity Investments, Mr. Deberghes was Senior Vice President of Mutual Fund Administration at State Street Corporation (2007-2008), Senior Director of Mutual Fund Administration at Investors Bank & Trust (2005-2007), and Director of Finance for Dunkin' Brands (2000-2005).
Stephanie J. Dorsey (1969)
Year of Election or Appointment: 2010
Assistant Treasurer
Ms. Dorsey also serves as an officer of other funds. She is an employee of Fidelity Investments (2008-present) and has served in other fund officer roles. Prior to joining Fidelity Investments, Ms. Dorsey served as Treasurer (2004-2008) of the JPMorgan Mutual Funds and Vice President (2004-2008) of JPMorgan Chase Bank.
Howard J. Galligan III (1966)
Year of Election or Appointment: 2014
Chief Financial Officer
Mr. Galligan also serves as Chief Financial Officer of other funds. Mr. Galligan serves as President of Fidelity Pricing and Cash Management Services (FPCMS) (2014-present) and as a Director of Strategic Advisers, Inc. (investment adviser firm, 2008-present). Previously, Mr. Galligan served as Chief Administrative Officer of Asset Management (2011-2014) and Chief Operating Officer and Senior Vice President of Investment Support for Strategic Advisers, Inc. (2003-2011).
Scott C. Goebel (1968)
Year of Election or Appointment: 2015
Vice President
Mr. Goebel serves as Vice President of other funds and is an employee of Fidelity Investments (2001-present). Previously, Mr. Goebel served as Secretary of Fidelity SelectCo, LLC (investment adviser firm, 2013-2015), Fidelity Investments Money Management, Inc. (FIMM) (investment adviser firm, 2010-2015), and Fidelity Research and Analysis Company (FRAC) (investment adviser firm, 2010-2015); General Counsel, Secretary, and Senior Vice President of Fidelity Management & Research Company (investment adviser firm, 2008-2015) and FMR Co., Inc. (investment adviser firm, 2008-2015); Assistant Secretary of Fidelity Management & Research (Japan) Limited (investment adviser firm, 2008-2015) and FMR Investment Management (U.K.) Limited (investment adviser firm, 2008-2015); Chief Legal Officer (CLO) of Fidelity Management & Research (Hong Kong) Limited (investment adviser firm, 2008-2015); Secretary and CLO of certain Fidelity® funds (2008-2015); Assistant Secretary of FIMM (2008-2010), FRAC (2008-2010), and certain funds (2007-2008); and as Vice President and Secretary of Fidelity Distributors Corporation (FDC) (2005-2007).
Thomas C. Hense (1964)
Year of Election or Appointment: 2008, 2010, or 2015
Vice President
Mr. Hense serves as Vice President of Fidelity Advisor® Multi-Asset Income Fund (2015) and other funds (High Income (2008), Small Cap (2008), and Value (2010) funds), and is an employee of Fidelity Investments (1993-present). Previously, Mr. Hense served as a portfolio manager for Fidelity's Institutional Money Management Group (Pyramis) (2003-2008).
Brian B. Hogan (1964)
Year of Election or Appointment: 2009
Vice President
Mr. Hogan also serves as Trustee or Vice President of other funds. Mr. Hogan serves as a Director of Fidelity SelectCo, LLC (investment adviser firm, 2014-present) and President of the Equity Division of FMR (investment adviser firm, 2009-present). Previously, Mr. Hogan served as Senior Vice President, Equity Research of FMR (2006-2009) and as a portfolio manager.
Chris Maher (1972)
Year of Election or Appointment: 2013
Assistant Treasurer
Mr. Maher serves as Assistant Treasurer of other funds. Mr. Maher is Vice President of Valuation Oversight and is an employee of Fidelity Investments. Previously, Mr. Maher served as Vice President of Asset Management Compliance (2013), Vice President of the Program Management Group of FMR (investment adviser firm, 2010-2013), and Vice President of Valuation Oversight (2008-2010).
Kenneth B. Robins (1969)
Year of Election or Appointment: 2008
President and Treasurer
Mr. Robins also serves as an officer of other funds. Mr. Robins serves as Executive Vice President of Fidelity Investments Money Management, Inc. (FIMM) (investment adviser firm, 2013-present) and is an employee of Fidelity Investments (2004-present). Previously, Mr. Robins served in other fund officer roles.
Stacie M. Smith (1974)
Year of Election or Appointment: 2013
Deputy Treasurer
Ms. Smith also serves as an officer of other funds. She is an employee of Fidelity Investments (2009-present) and has served in other fund officer roles. Prior to joining Fidelity Investments, Ms. Smith served as Senior Audit Manager of Ernst & Young LLP (1996-2009).
Renee Stagnone (1975)
Year of Election or Appointment: 2013
Deputy Treasurer
Ms. Stagnone also serves as Deputy Treasurer of other funds. Ms. Stagnone is an employee of Fidelity Investments (1997-present).
Linda J. Wondrack (1964)
Year of Election or Appointment: 2014
Chief Compliance Officer
Ms. Wondrack also serves as Chief Compliance Officer of other funds. Ms. Wondrack is Executive Vice President and head of the Ethics Office and Asset Management Compliance for Fidelity Investments (2012-present). Ms. Wondrack also serves as Chief Compliance Officer of Fidelity SelectCo, LLC (investment adviser firm, 2014-present); Chief Compliance Officer of Impresa Management LLC (2013-present); and Chief Compliance Officer of FMR Co., Inc. (investment adviser firm), Fidelity Investments Money Management, Inc. (investment adviser firm), Fidelity Management & Research (Japan) Limited (investment adviser firm), FMR Investment Management (U.K.) Limited (investment adviser firm), Fidelity Management & Research (Hong Kong) (investment adviser firm), Fidelity Management & Research Company (investment adviser firm), FIAM LLC (investment adviser firm), and Strategic Advisers, Inc. (investment adviser firm), Ballyrock Investment Advisors LLC, and Northern Neck Investors LLC (2012-present). Previously, Ms. Wondrack served as Senior Vice President and Chief Compliance Officer for Columbia Management Investment Advisers, LLC (2005-2012); Chief Compliance Officer for certain funds within the Columbia Family of Funds (2007-2012); and Senior Vice President of Compliance Risk Management at Bank of America (2005-2010).
Joseph F. Zambello (1957)
Year of Election or Appointment: 2011
Deputy Treasurer
Mr. Zambello also serves as Deputy Treasurer of other funds. Mr. Zambello is an employee of Fidelity Investments (1991-present). Previously, Mr. Zambello served as Vice President of the Program Management Group of FMR (investment adviser firm, 2009-2011) and Vice President of the Transfer Agent Oversight Group (2005-2009).
Shareholder Expense Example
As a shareholder of the Fund, you incur two types of costs: (1) transaction costs, including sales charges (loads) on purchase payments or redemption proceeds, and (2) ongoing costs, including management fees, distribution and/or service (12b-1) fees and other Fund expenses. This Example is intended to help you understand your ongoing costs (in dollars) of investing in the Fund and to compare these costs with the ongoing costs of investing in other mutual funds.
The Example is based on an investment of $1,000 invested at the beginning of the period and held for the entire period (June 1, 2015 to November 30, 2015).
Actual Expenses
The first line of the accompanying table for each class of the Fund provides information about actual account values and actual expenses. You may use the information in this line, together with the amount you invested, to estimate the expenses that you paid over the period. Simply divide your account value by $1,000.00 (for example, an $8,600 account value divided by $1,000.00 = 8.6), then multiply the result by the number in the first line for a class of the Fund under the heading entitled "Expenses Paid During Period" to estimate the expenses you paid on your account during this period. In addition, the Fund, as a shareholder in the underlying Fidelity Central Funds, will indirectly bear its pro-rata share of the fees and expenses incurred by the underlying Fidelity Central Funds. These fees and expenses are not included in the Fund's annualized expense ratio used to calculate the expense estimate in the table below.
Hypothetical Example for Comparison Purposes
The second line of the accompanying table for each class of the Fund provides information about hypothetical account values and hypothetical expenses based on a Class' actual expense ratio and an assumed rate of return of 5% per year before expenses, which is not the Class' actual return. The hypothetical account values and expenses may not be used to estimate the actual ending account balance or expenses you paid for the period. You may use this information to compare the ongoing costs of investing in the Fund and other funds. To do so, compare this 5% hypothetical example with the 5% hypothetical examples that appear in the shareholder reports of the other funds. In addition, the Fund, as a shareholder in the underlying Fidelity Central Funds, will indirectly bear its pro-rata share of the fees and expenses incurred by the underlying Fidelity Central Funds. These fees and expenses are not included in the Fund's annualized expense ratio used to calculate the expense estimate in the table below.
Please note that the expenses shown in the table are meant to highlight your ongoing costs only and do not reflect any transaction costs. Therefore, the second line of the table is useful in comparing ongoing costs only, and will not help you determine the relative total costs of owning different funds. In addition, if these transactional costs were included, your costs would have been higher.
| Annualized Expense Ratio-A | Beginning Account Value June 1, 2015 | Ending Account Value November 30, 2015 | Expenses Paid During Period-B June 1, 2015 to November 30, 2015 | |
| Class A | 1.11% | |||
| Actual | $1,000.00 | $954.50 | $5.44 | |
| Hypothetical-C | $1,000.00 | $1,019.50 | $5.62 | |
| Class T | 1.37% | |||
| Actual | $1,000.00 | $953.10 | $6.71 | |
| Hypothetical-C | $1,000.00 | $1,018.20 | $6.93 | |
| Class B | 1.95% | |||
| Actual | $1,000.00 | $950.50 | $9.53 | |
| Hypothetical-C | $1,000.00 | $1,015.29 | $9.85 | |
| Class C | 1.87% | |||
| Actual | $1,000.00 | $950.80 | $9.14 | |
| Hypothetical-C | $1,000.00 | $1,015.69 | $9.45 | |
| Class I | .85% | |||
| Actual | $1,000.00 | $956.00 | $4.17 | |
| Hypothetical-C | $1,000.00 | $1,020.81 | $4.31 |
A Annualized expense ratio reflects expenses net of applicable fee waivers.
B Expenses are equal to each Class' annualized expense ratio, multiplied by the average account value over the period, multiplied by 183/365 (to reflect the one-half year period).
C 5% return per year before expenses
Distributions (Unaudited)
The Board of Trustees of Advisor Large Cap Fund voted to pay to shareholders of record at the opening of business on record date, the following distributions per share derived from capital gains realized from sales of portfolio securities, and dividends derived from net investment income:
| Pay Date | Record Date | Dividends | Capital Gains | |
| Class I | 12/14/15 | 12/11/15 | $0.300 | $0.570 |
| Class I | 01/11/16 | 01/08/16 | $0.000 | $0.031 |
The fund hereby designates as a capital gain dividend with respect to the taxable year ended November 31, 2015, $31,580,039, or, if subsequently determined to be different, the net capital gain of such year.
Class I designates 100% of the dividends distributed during the fiscal year as qualifying for the dividends-received deduction for corporate shareholders.
Class I designates 100% of the dividends distributed during the fiscal year as amounts which may be taken into account as a dividend for purposes of the maximum rate under section 1(h) (11) of the Internal Revenue Code.
The fund will notify shareholders in January 2016 of amounts for use in preparing 2015 income tax returns.
Board Approval of Investment Advisory Contracts and Management Fees
Fidelity Advisor Large Cap Fund
Each year, the Board of Trustees, including the Independent Trustees (together, the Board), votes on the renewal of the management contract with Fidelity Management & Research Company (FMR) and the sub-advisory agreements (together, the Advisory Contracts) for the fund. The Board, assisted by the advice of fund counsel and Independent Trustees' counsel, requests and considers a broad range of information relevant to the renewal of the Advisory Contracts throughout the year.
The Board meets regularly and, at each of its meetings, covers an extensive agenda of topics and materials and considers factors that are relevant to its annual consideration of the renewal of the fund's Advisory Contracts, including the services and support provided to the fund and its shareholders. The Board has established various standing committees (Committees), each composed of and chaired by Independent Trustees with varying backgrounds, to which the Board has assigned specific subject matter responsibilities in order to enhance effective decision-making by the Board. The Board, acting directly and through its Committees, requests and receives information concerning the annual consideration of the renewal of the fund's Advisory Contracts. The Board also meets as needed to consider matters specifically related to the Board's annual consideration of the renewal of the Advisory Contracts. Members of the Board may also meet with trustees of other Fidelity funds through ad hoc joint committees to discuss certain matters relevant to all of the Fidelity funds.
At its July 2015 meeting, the Board unanimously determined to renew the fund's Advisory Contracts. In reaching its determination, the Board considered all factors it believed relevant, including (i) the nature, extent, and quality of the services to be provided to the fund and its shareholders (including the investment performance of the fund); (ii) the competitiveness of the fund's management fee and total expense ratio relative to peer funds; (iii) the total costs of the services to be provided by and the profits to be realized by Fidelity from its relationship with the fund; and (iv) the extent to which (if any) economies of scale exist and would be realized as the fund grows, and whether any economies of scale are appropriately shared with fund shareholders.
In considering whether to renew the Advisory Contracts for the fund, the Board reached a determination, with the assistance of fund counsel and Independent Trustees' counsel and through the exercise of its business judgment, that the renewal of the Advisory Contracts was in the best interests of the fund and its shareholders and that the compensation payable under the Advisory Contracts was fair and reasonable. The Board's decision to renew the Advisory Contracts was not based on any single factor, but rather was based on a comprehensive consideration of all the information provided to the Board at its meetings throughout the year. The Board, in reaching its determination to renew the Advisory Contracts, was aware that shareholders of the fund have a broad range of investment choices available to them, including a wide choice among funds offered by Fidelity's competitors, and that the fund's shareholders, who have the opportunity to review and weigh the disclosure provided by the fund in its prospectus and other public disclosures, have chosen to invest in this fund, which is part of the Fidelity family of funds.
Nature, Extent, and Quality of Services Provided. The Board considered Fidelity's staffing as it relates to the fund, including the backgrounds of investment personnel of Fidelity, and also considered the fund's investment objective, strategies, and related investment philosophy. The Independent Trustees also had discussions with senior management of Fidelity's investment operations and investment groups. The Board considered the structure of the portfolio manager compensation program and whether this structure provides appropriate incentives to act in the best interests of the fund. Additionally, the Board considered the portfolio managers' investments, if any, in the funds that they manage.Resources Dedicated to Investment Management and Support Services. The Board and the Fund Oversight and Research Committees reviewed the general qualifications and capabilities of Fidelity's investment staff, including its size, education, experience, and resources, as well as Fidelity's approach to recruiting, training, managing, and compensating investment personnel. The Board noted that Fidelity has continued to increase the resources devoted to non-U.S. offices, including expansion of Fidelity's global investment organization. The Board also noted that Fidelity's analysts have extensive resources, tools and capabilities that allow them to conduct sophisticated quantitative and fundamental analysis, as well as credit analysis of issuers, counterparties and guarantors. Further, the Board considered that Fidelity's investment professionals have sufficient access to global information and data so as to provide competitive investment results over time, and that those professionals also have access to sophisticated tools that permit them to assess portfolio construction and risk and performance attribution characteristics continuously, as well as to transmit new information and research conclusions rapidly around the world. Additionally, in its deliberations, the Board considered Fidelity's trading, risk management, and compliance capabilities and resources, which are integral parts of the investment management process.Shareholder and Administrative Services. The Board considered (i) the nature, extent, quality, and cost of advisory, administrative, and shareholder services performed by FMR, the sub-advisers (together with FMR, the Investment Advisers), and their affiliates under the Advisory Contracts and under separate agreements covering transfer agency, pricing and bookkeeping, and securities lending services for the fund; (ii) the nature and extent of the supervision of third party service providers, principally custodians and subcustodians; and (iii) the resources devoted to, and the record of compliance with, the fund's compliance policies and procedures. The Board also reviewed the allocation of fund brokerage, including allocations to brokers affiliated with the Investment Advisers, the use of brokerage commissions to pay fund expenses, and the use of "soft" commission dollars to pay for research services.The Board noted that the growth of fund assets over time across the complex allows Fidelity to reinvest in the development of services designed to enhance the value or convenience of the Fidelity funds as investment vehicles. These services include 24-hour access to account information and market information through telephone representatives and over the Internet, investor education materials and asset allocation tools, and the expanded availability of Fidelity Investor Centers.In 2014, the Board formed an ad hoc Committee on Transfer Agency Fees to review the variety of transfer agency fee structures throughout the industry and Fidelity's competitive positioning with respect to industry participants.Investment in a Large Fund Family. The Board considered the benefits to shareholders of investing in a Fidelity fund, including the benefits of investing in a fund that is part of a large family of funds offering a variety of investment disciplines and providing a large variety of mutual fund investor services. The Board noted that Fidelity had taken, or had made recommendations that resulted in the Fidelity funds taking, a number of actions over the previous year that benefited particular funds, including (i) continuing to dedicate additional resources to investment research and to the support of the senior management team that oversees asset management; (ii) continuing efforts to enhance Fidelity's global research capabilities; (iii) launching new funds and making other enhancements to meet client needs; (iv) reducing management fees and total expenses for certain index funds and diversified international funds; (v) continuing to launch dedicated lower cost underlying funds to meet portfolio construction needs related to expanding underlying fund options for Fidelity funds of funds, specifically for the Freedom Fund product lines; (vi) rationalizing product lines and gaining increased efficiencies through fund mergers; (vii) launching active fixed-income exchange-traded funds; (viii) continuing to develop, acquire and implement systems and technology to improve services to the funds and information security and to increase efficiency; (ix) implementing investment enhancements to further strengthen Fidelity's target date product line to increase investors' probability of success in achieving their goals; (x) modifying the eligibility criteria for certain share classes to accommodate roll-over assets from employer-sponsored retirement plans; (xi) launching a new Class W of the Freedom Index Funds to attract and retain Fidelity record-kept retirement plan assets; and (xii) implementing changes to Fidelity's money market product line in response to recent money market regulatory reforms.Investment Performance. The Board considered whether the fund has operated in accordance with its investment objective, as well as its record of compliance with its investment restrictions and its performance history.The Board took into account discussions with representatives of the Investment Advisers about fund investment performance that occur at Board meetings throughout the year. In this regard the Board noted that as part of regularly scheduled fund reviews and other reports to the Board on fund performance, the Board considers annualized return information for the fund, for different time periods, measured against a securities market index ("benchmark index") and a peer group of funds with similar objectives ("peer group"), if any. In its evaluation of fund investment performance, the Board gave particular attention to information indicating changes in performance of certain Fidelity funds for specific time periods and discussed with the Investment Advisers the reasons for any overperformance or underperformance.In addition to reviewing absolute and relative fund performance, the Independent Trustees periodically consider the appropriateness of fund performance metrics in evaluating the results achieved. In general, the Independent Trustees believe that fund performance should be evaluated based on net performance (after fees and expenses) of both the highest performing and lowest performing fund share classes, where applicable, compared to appropriate benchmark indices, over appropriate time periods that may include full market cycles, and compared to peer groups, as applicable, over the same periods, taking into account relevant factors including the following: general market conditions; issuer-specific information; and fund cash flows and other factors.The Independent Trustees recognize that shareholders evaluate performance on a net basis over their own holding periods, for which one-, three-, and five-year periods are often used as a proxy. For this reason, the performance information reviewed by the Board also included net cumulative calendar year total return information for the fund and an appropriate benchmark index and peer group for the most recent one-, three-, and five-year periods, as shown below. Returns are shown compared to the 25th percentile (top of box, 75% beaten) and 75th percentile (bottom of box, 25% beaten) of the peer universe.Fidelity Advisor Large Cap Fund
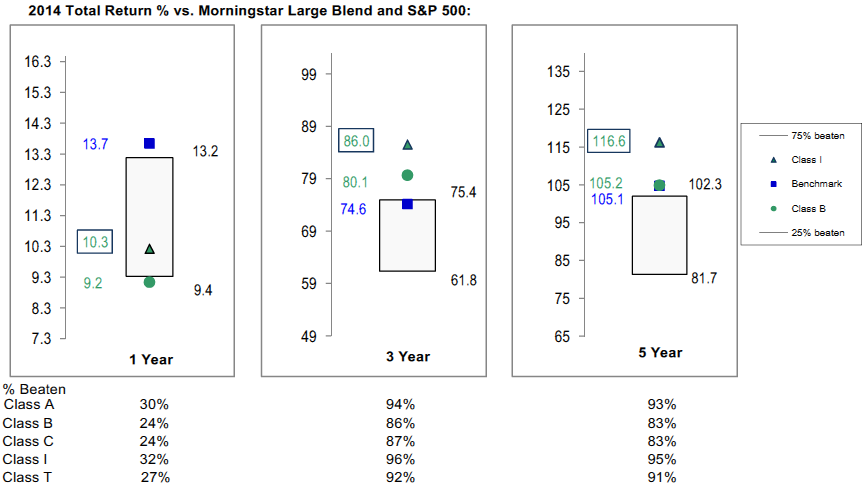
Fidelity Advisor Large Cap Fund
![]()
LCI-ANN-0116
1.539157.118
Fidelity Advisor® Equity Value Fund Class A, Class T, Class B and Class C Annual Report November 30, 2015 |
|
Contents
Board Approval of Investment Advisory Contracts and Management Fees |
To view a fund's proxy voting guidelines and proxy voting record for the 12-month period ended June 30, visit http://www.fidelity.com/proxyvotingresults or visit the Securities and Exchange Commission's (SEC) web site at http://www.sec.gov.
You may also call 1-877-208-0098 to request a free copy of the proxy voting guidelines.
Standard & Poor's, S&P and S&P 500 are registered service marks of The McGraw-Hill Companies, Inc. and have been licensed for use by Fidelity Distributors Corporation.
Other third-party marks appearing herein are the property of their respective owners.
All other marks appearing herein are registered or unregistered trademarks or service marks of FMR LLC or an affiliated company. © 2016 FMR LLC. All rights reserved.
This report and the financial statements contained herein are submitted for the general information of the shareholders of the Fund. This report is not authorized for distribution to prospective investors in the Fund unless preceded or accompanied by an effective prospectus.
A fund files its complete schedule of portfolio holdings with the SEC for the first and third quarters of each fiscal year on Form N-Q. Forms N-Q are available on the SEC’s web site at http://www.sec.gov. A fund's Forms N-Q may be reviewed and copied at the SEC’s Public Reference Room in Washington, DC. Information regarding the operation of the SEC's Public Reference Room may be obtained by calling 1-800-SEC-0330.
For a complete list of a fund's portfolio holdings, view the most recent holdings listing, semiannual report, or annual report on Fidelity's web site at http://www.fidelity.com, http://www.advisor.fidelity.com, or http://www.401k.com, as applicable.
NOT FDIC INSURED •MAY LOSE VALUE •NO BANK GUARANTEE
Neither the Fund nor Fidelity Distributors Corporation is a bank.
Performance: The Bottom Line
Average annual total return reflects the change in the value of an investment, assuming reinvestment of distributions from dividend income and capital gains (the profits earned upon the sale of securities that have grown in value, if any) and assuming a constant rate of performance each year.
The hypothetical investment and the average annual total returns do not reflect the deduction of taxes that a shareholder would pay on fund distributions or the redemption of fund shares.
During periods of reimbursement by Fidelity, a fund’s total return will be greater than it would be had the reimbursement not occurred.
How a fund did yesterday is no guarantee of how it will do tomorrow.
Returns reflect the conversion of Class B shares to Class A shares after a maximum of seven years.
Average Annual Total Returns
| For the periods ended November 30, 2015 | Past 1 year | Past 5 years | Past 10 years |
| Class A (incl. 5.75% sales charge) | (6.60)% | 11.85% | 5.41% |
| Class T (incl. 3.50% sales charge) | (4.65)% | 12.10% | 5.39% |
| Class B (incl. contingent deferred sales charge) | (6.55)% | 12.08% | 5.49% |
| Class C (incl. contingent deferred sales charge) | (2.66)% | 12.33% | 5.24% |
Class B shares' contingent deferred sales charges included in the past one year, past five years and past ten years total return figures are 5%, 2% and 0%, respectively.
Class C shares' contingent deferred sales charges included in the past one year, past five years and past ten years total return figures are 1%, 0% and 0%, respectively.
$10,000 Over 10 Years
Let's say hypothetically that $10,000 was invested in Fidelity Advisor® Equity Value Fund - Class A on November 30, 2005, and the current 5.75% sales charge was paid.
The chart shows how the value of your investment would have changed, and also shows how the Russell 3000® Value Index performed over the same period.
| Period Ending Values | ||
| $16,942 | Fidelity Advisor® Equity Value Fund - Class A | |
| $18,627 | Russell 3000® Value Index | |
Management's Discussion of Fund Performance
Market Recap: U.S. stocks gained modestly for the 12 months ending November 30, 2015, despite a steep decline in August and September on concern about slowing economic growth in China. The S&P 500® index rebounded in October and gained 2.75% for the year. Stocks benefited late in the period amid waning expectations for a near-term interest-rate hike by the U.S. Federal Reserve, more economic stimulus in Europe and an interest-rate cut in China. Growth stocks in the benchmark far outpaced their value counterparts, as investors continued to seek growth in a subpar economic environment. Sector performance varied widely, with more than 26 percentage points separating the leader from the laggard. Consumer discretionary (+14%) secured the top spot, benefiting from a combination of rising personal income and still-benign inflation. Information technology (+7%) and health care (+4%) also outpaced the broad market. Conversely, the energy sector (-12%) performed worst, stymied by depressed commodity prices that also hit materials (-5%). Telecommunication services (-5%) and utilities (-4%), considered defensive sectors less sensitive to the economy, also lost ground. At period end, investors remained focused on the potential global implications of a stronger U.S. dollar and how China's transition toward a consumption-led economy may affect corporate earnings.Comments from Portfolio Manager Sean Gavin: For the year, the fund's share classes (excluding sales charges, if applicable) declined modestly, roughly in line with the -1.01% return of the benchmark Russell 3000® Value Index. Versus the benchmark, the fund benefited from strong security selection in information technology and favorable positioning in energy. In contrast, the fund was hurt by stock picking in financials and consumer discretionary. Our top individual contributor was Internet search provider Google. In October, Google changed its name to Alphabet, which became the parent company of Google and the firm's various other businesses. Also lifting results was health insurance provider Cigna, whose shares produced a strong gain. Another notable contributor was auto-parts retailer Autozone. The company continued to increase its operating margins and produce healthy free cash flow. Eventually, the stock exceeded my target price, and I sold the fund's stake. In contrast, various energy holdings struggled, especially BW Offshore, a supplier of equipment to offshore oil drillers. Another meaningful detractor was media company Viacom, which at period end continued to meet my valuation and quality criteria. During the period, however, the company faced a number of business challenges – all of them short term, in my view.The views expressed above reflect those of the portfolio manager(s) only through the end of the period as stated on the cover of this report and do not necessarily represent the views of Fidelity or any other person in the Fidelity organization. Any such views are subject to change at any time based upon market or other conditions and Fidelity disclaims any responsibility to update such views. These views may not be relied on as investment advice and, because investment decisions for a Fidelity fund are based on numerous factors, may not be relied on as an indication of trading intent on behalf of any Fidelity fund.
Investment Summary (Unaudited)
Top Ten Stocks as of November 30, 2015
| % of fund's net assets | % of fund's net assets 6 months ago | |
| JPMorgan Chase & Co. | 4.0 | 4.1 |
| Johnson & Johnson | 3.8 | 3.1 |
| General Electric Co. | 3.4 | 2.5 |
| Wells Fargo & Co. | 3.3 | 3.4 |
| Berkshire Hathaway, Inc. Class B | 3.0 | 2.9 |
| Oracle Corp. | 2.7 | 1.7 |
| Chevron Corp. | 2.5 | 2.3 |
| Teva Pharmaceutical Industries Ltd. sponsored ADR | 2.4 | 2.0 |
| EMC Corp. | 2.4 | 1.2 |
| U.S. Bancorp | 1.9 | 1.9 |
| 29.4 |
Top Five Market Sectors as of November 30, 2015
| % of fund's net assets | % of fund's net assets 6 months ago | |
| Financials | 25.3 | 28.9 |
| Information Technology | 16.4 | 15.6 |
| Health Care | 15.1 | 14.2 |
| Consumer Discretionary | 10.0 | 11.8 |
| Energy | 9.3 | 7.6 |
Asset Allocation (% of fund's net assets)
| As of November 30, 2015* | ||
| Stocks | 94.7% | |
| Short-Term Investments and Net Other Assets (Liabilities) | 5.3% | |

* Foreign investments - 13.9%
| As of May 31, 2015* | ||
| Stocks | 94.8% | |
| Short-Term Investments and Net Other Assets (Liabilities) | 5.2% | |

* Foreign investments - 18.0%
Investments November 30, 2015
Showing Percentage of Net Assets
| Common Stocks - 94.7% | |||
| Shares | Value | ||
| CONSUMER DISCRETIONARY - 10.0% | |||
| Auto Components - 0.5% | |||
| Hyundai Mobis | 3,889 | $836,485 | |
| Diversified Consumer Services - 0.1% | |||
| Steiner Leisure Ltd. (a) | 2,600 | 163,488 | |
| Media - 7.8% | |||
| Cablevision Systems Corp. - NY Group Class A | 30,000 | 915,000 | |
| CBS Corp. Class B | 32,300 | 1,630,504 | |
| Corus Entertainment, Inc. Class B (non-vtg.) (b) | 48,700 | 382,175 | |
| John Wiley & Sons, Inc. Class A | 17,615 | 908,758 | |
| Starz Series A (a) | 45,700 | 1,612,296 | |
| Time Warner Cable, Inc. | 13,900 | 2,568,303 | |
| Twenty-First Century Fox, Inc. Class A | 63,500 | 1,873,885 | |
| Viacom, Inc. Class B (non-vtg.) | 48,700 | 2,424,773 | |
| 12,315,694 | |||
| Multiline Retail - 0.5% | |||
| Macy's, Inc. | 20,147 | 787,345 | |
| Specialty Retail - 1.1% | |||
| Bed Bath & Beyond, Inc. (a) | 9,900 | 539,748 | |
| GNC Holdings, Inc. | 37,900 | 1,129,799 | |
| 1,669,547 | |||
| TOTAL CONSUMER DISCRETIONARY | 15,772,559 | ||
| CONSUMER STAPLES - 3.8% | |||
| Beverages - 0.6% | |||
| C&C Group PLC | 232,281 | 900,679 | |
| Food & Staples Retailing - 2.0% | |||
| Rite Aid Corp. (a) | 125,200 | 986,576 | |
| Wal-Mart Stores, Inc. | 36,000 | 2,118,240 | |
| 3,104,816 | |||
| Food Products - 1.2% | |||
| Seaboard Corp. (a) | 300 | 990,000 | |
| The J.M. Smucker Co. | 7,779 | 942,737 | |
| 1,932,737 | |||
| TOTAL CONSUMER STAPLES | 5,938,232 | ||
| ENERGY - 9.3% | |||
| Energy Equipment & Services - 2.1% | |||
| Baker Hughes, Inc. | 38,500 | 2,081,695 | |
| BW Offshore Ltd. | 1,534,900 | 522,787 | |
| National Oilwell Varco, Inc. | 17,700 | 660,918 | |
| 3,265,400 | |||
| Oil, Gas & Consumable Fuels - 7.2% | |||
| Chevron Corp. | 42,897 | 3,917,354 | |
| Exxon Mobil Corp. | 28,272 | 2,308,692 | |
| Marathon Petroleum Corp. | 25,400 | 1,483,614 | |
| Niska Gas Storage Partners LLC | 5,200 | 16,640 | |
| Phillips 66 Co. | 15,700 | 1,437,021 | |
| Suncor Energy, Inc. | 81,900 | 2,262,990 | |
| 11,426,311 | |||
| TOTAL ENERGY | 14,691,711 | ||
| FINANCIALS - 25.3% | |||
| Banks - 10.7% | |||
| JPMorgan Chase & Co. | 93,952 | 6,264,718 | |
| Regions Financial Corp. | 110,500 | 1,120,470 | |
| SunTrust Banks, Inc. | 29,500 | 1,280,890 | |
| U.S. Bancorp | 68,666 | 3,013,751 | |
| Wells Fargo & Co. | 93,732 | 5,164,633 | |
| 16,844,462 | |||
| Capital Markets - 0.2% | |||
| GP Investments Ltd. Class A (depositary receipt) (a) | 183,300 | 369,537 | |
| Consumer Finance - 2.8% | |||
| American Express Co. | 9,200 | 659,088 | |
| Capital One Financial Corp. | 28,818 | 2,262,501 | |
| Discover Financial Services | 26,100 | 1,481,436 | |
| 4,403,025 | |||
| Diversified Financial Services - 3.0% | |||
| Berkshire Hathaway, Inc. Class B (a) | 34,769 | 4,662,175 | |
| Insurance - 5.2% | |||
| ACE Ltd. | 14,700 | 1,688,295 | |
| Allied World Assurance Co. Holdings AG | 21,400 | 777,248 | |
| Allstate Corp. | 22,900 | 1,437,204 | |
| FNF Group | 28,480 | 1,021,008 | |
| FNFV Group (a) | 37,692 | 421,773 | |
| Prudential PLC | 34,419 | 797,892 | |
| The Travelers Companies, Inc. | 17,987 | 2,060,771 | |
| 8,204,191 | |||
| Real Estate Investment Trusts - 3.4% | |||
| American Capital Agency Corp. | 88,601 | 1,590,388 | |
| Annaly Capital Management, Inc. | 203,805 | 1,952,452 | |
| MFA Financial, Inc. | 262,536 | 1,832,501 | |
| 5,375,341 | |||
| TOTAL FINANCIALS | 39,858,731 | ||
| HEALTH CARE - 15.1% | |||
| Biotechnology - 1.9% | |||
| Amgen, Inc. | 16,900 | 2,722,590 | |
| Dyax Corp. (a) | 9,200 | 309,672 | |
| 3,032,262 | |||
| Health Care Providers & Services - 4.0% | |||
| Aetna, Inc. | 4,100 | 421,275 | |
| Anthem, Inc. | 3,200 | 417,216 | |
| Cigna Corp. | 14,700 | 1,984,206 | |
| Express Scripts Holding Co. (a) | 22,199 | 1,897,571 | |
| Laboratory Corp. of America Holdings (a) | 13,000 | 1,580,020 | |
| 6,300,288 | |||
| Pharmaceuticals - 9.2% | |||
| Allergan PLC (a) | 7,600 | 2,385,564 | |
| Johnson & Johnson | 58,992 | 5,972,350 | |
| Sanofi SA sponsored ADR | 52,300 | 2,312,706 | |
| Teva Pharmaceutical Industries Ltd. sponsored ADR | 61,132 | 3,847,037 | |
| 14,517,657 | |||
| TOTAL HEALTH CARE | 23,850,207 | ||
| INDUSTRIALS - 8.3% | |||
| Aerospace & Defense - 2.1% | |||
| BWX Technologies, Inc. | 43,500 | 1,324,575 | |
| Precision Castparts Corp. | 700 | 162,078 | |
| United Technologies Corp. | 18,700 | 1,796,135 | |
| 3,282,788 | |||
| Industrial Conglomerates - 3.4% | |||
| General Electric Co. | 178,200 | 5,335,308 | |
| Machinery - 1.7% | |||
| Deere & Co. | 33,810 | 2,690,262 | |
| Professional Services - 1.1% | |||
| Dun & Bradstreet Corp. | 16,300 | 1,756,977 | |
| TOTAL INDUSTRIALS | 13,065,335 | ||
| INFORMATION TECHNOLOGY - 16.4% | |||
| Communications Equipment - 3.3% | |||
| Cisco Systems, Inc. | 97,682 | 2,661,835 | |
| Harris Corp. | 29,900 | 2,485,587 | |
| 5,147,422 | |||
| Electronic Equipment & Components - 1.0% | |||
| Keysight Technologies, Inc. (a) | 22,200 | 683,982 | |
| TE Connectivity Ltd. | 13,898 | 932,417 | |
| 1,616,399 | |||
| Internet Software & Services - 1.5% | |||
| Alphabet, Inc. Class A (a) | 3,100 | 2,364,835 | |
| IT Services - 0.9% | |||
| The Western Union Co. | 72,800 | 1,373,008 | |
| Semiconductors & Semiconductor Equipment - 0.1% | |||
| Altera Corp. | 3,000 | 158,400 | |
| Software - 4.3% | |||
| Microsoft Corp. | 47,800 | 2,597,930 | |
| Oracle Corp. | 107,387 | 4,184,871 | |
| 6,782,801 | |||
| Technology Hardware, Storage & Peripherals - 5.3% | |||
| Apple, Inc. | 14,200 | 1,679,860 | |
| EMC Corp. | 147,500 | 3,737,650 | |
| Samsung Electronics Co. Ltd. | 1,774 | 1,963,668 | |
| SanDisk Corp. | 13,500 | 997,245 | |
| 8,378,423 | |||
| TOTAL INFORMATION TECHNOLOGY | 25,821,288 | ||
| MATERIALS - 2.9% | |||
| Chemicals - 2.4% | |||
| CF Industries Holdings, Inc. | 45,275 | 2,088,989 | |
| LyondellBasell Industries NV Class A | 17,500 | 1,676,850 | |
| 3,765,839 | |||
| Paper & Forest Products - 0.5% | |||
| Schweitzer-Mauduit International, Inc. | 19,200 | 802,944 | |
| TOTAL MATERIALS | 4,568,783 | ||
| UTILITIES - 3.6% | |||
| Electric Utilities - 3.5% | |||
| American Electric Power Co., Inc. | 21,300 | 1,193,013 | |
| Cleco Corp. | 9,500 | 476,045 | |
| Edison International | 12,593 | 747,520 | |
| Exelon Corp. | 74,500 | 2,034,595 | |
| Xcel Energy, Inc. | 30,100 | 1,073,366 | |
| 5,524,539 | |||
| Independent Power and Renewable Electricity Producers - 0.1% | |||
| Vivint Solar, Inc. (a)(b) | 22,326 | 180,617 | |
| TOTAL UTILITIES | 5,705,156 | ||
| TOTAL COMMON STOCKS | |||
| (Cost $143,727,545) | 149,272,002 | ||
| Money Market Funds - 4.0% | |||
| Fidelity Cash Central Fund, 0.18% (c) | 5,828,326 | 5,828,326 | |
| Fidelity Securities Lending Cash Central Fund, 0.22% (c)(d) | 492,718 | 492,718 | |
| TOTAL MONEY MARKET FUNDS | |||
| (Cost $6,321,044) | 6,321,044 | ||
| TOTAL INVESTMENT PORTFOLIO - 98.7% | |||
| (Cost $150,048,589) | 155,593,046 | ||
| NET OTHER ASSETS (LIABILITIES) - 1.3% | 2,110,293 | ||
| NET ASSETS - 100% | $157,703,339 |
Legend
(a) Non-income producing
(b) Security or a portion of the security is on loan at period end.
(c) Affiliated fund that is generally available only to investment companies and other accounts managed by Fidelity Investments. The rate quoted is the annualized seven-day yield of the fund at period end. A complete unaudited listing of the fund's holdings as of its most recent quarter end is available upon request. In addition, each Fidelity Central Fund's financial statements, which are not covered by the Fund's Report of Independent Registered Public Accounting Firm, are available on the SEC's website or upon request.
(d) Investment made with cash collateral received from securities on loan.
Affiliated Central Funds
Information regarding fiscal year to date income earned by the Fund from investments in Fidelity Central Funds is as follows:
| Fund | Income earned |
| Fidelity Cash Central Fund | $13,226 |
| Fidelity Securities Lending Cash Central Fund | 10,163 |
| Total | $23,389 |
Investment Valuation
The following is a summary of the inputs used, as of November 30, 2015, involving the Fund's assets and liabilities carried at fair value. The inputs or methodology used for valuing securities may not be an indication of the risk associated with investing in those securities. For more information on valuation inputs, and their aggregation into the levels used below, please refer to the Investment Valuation section in the accompanying Notes to Financial Statements.
| Valuation Inputs at Reporting Date: | ||||
| Description | Total | Level 1 | Level 2 | Level 3 |
| Investments in Securities: | ||||
| Equities: | ||||
| Consumer Discretionary | $15,772,559 | $15,772,559 | $-- | $-- |
| Consumer Staples | 5,938,232 | 5,938,232 | -- | -- |
| Energy | 14,691,711 | 14,691,711 | -- | -- |
| Financials | 39,858,731 | 39,060,839 | 797,892 | -- |
| Health Care | 23,850,207 | 23,850,207 | -- | -- |
| Industrials | 13,065,335 | 13,065,335 | -- | -- |
| Information Technology | 25,821,288 | 25,821,288 | -- | -- |
| Materials | 4,568,783 | 4,568,783 | -- | -- |
| Utilities | 5,705,156 | 5,705,156 | -- | -- |
| Money Market Funds | 6,321,044 | 6,321,044 | -- | -- |
| Total Investments in Securities: | $155,593,046 | $154,795,154 | $797,892 | $-- |
Other Information
Distribution of investments by country or territory of incorporation, as a percentage of Total Net Assets, is as follows (Unaudited):
| United States of America | 86.1% |
| Israel | 2.4% |
| Switzerland | 2.2% |
| Ireland | 2.1% |
| Korea (South) | 1.7% |
| Canada | 1.7% |
| France | 1.5% |
| Netherlands | 1.1% |
| Others (Individually Less Than 1%) | 1.2% |
| 100.0% |
See accompanying notes which are an integral part of the financial statements.
Financial Statements
Statement of Assets and Liabilities
| November 30, 2015 | ||
| Assets | ||
| Investment in securities, at value (including securities loaned of $477,459) — See accompanying schedule: Unaffiliated issuers (cost $143,727,545) | $149,272,002 | |
| Fidelity Central Funds (cost $6,321,044) | 6,321,044 | |
| Total Investments (cost $150,048,589) | $155,593,046 | |
| Foreign currency held at value (cost $17) | 17 | |
| Receivable for investments sold | 3,483,284 | |
| Receivable for fund shares sold | 184,546 | |
| Dividends receivable | 402,669 | |
| Distributions receivable from Fidelity Central Funds | 1,688 | |
| Prepaid expenses | 364 | |
| Other receivables | 9 | |
| Total assets | 159,665,623 | |
| Liabilities | ||
| Payable for investments purchased | $1,094,746 | |
| Payable for fund shares redeemed | 159,173 | |
| Accrued management fee | 82,803 | |
| Distribution and service plan fees payable | 53,252 | |
| Other affiliated payables | 33,697 | |
| Other payables and accrued expenses | 45,895 | |
| Collateral on securities loaned, at value | 492,718 | |
| Total liabilities | 1,962,284 | |
| Net Assets | $157,703,339 | |
| Net Assets consist of: | ||
| Paid in capital | $150,741,271 | |
| Undistributed net investment income | 1,900,740 | |
| Accumulated undistributed net realized gain (loss) on investments and foreign currency transactions | (482,793) | |
| Net unrealized appreciation (depreciation) on investments and assets and liabilities in foreign currencies | 5,544,121 | |
| Net Assets | $157,703,339 | |
| Calculation of Maximum Offering Price | ||
| Class A: | ||
| Net Asset Value and redemption price per share ($67,005,063 ÷ 4,277,848 shares) | $15.66 | |
| Maximum offering price per share (100/94.25 of $15.66) | $16.62 | |
| Class T: | ||
| Net Asset Value and redemption price per share ($34,643,301 ÷ 2,217,267 shares) | $15.62 | |
| Maximum offering price per share (100/96.50 of $15.62) | $16.19 | |
| Class B: | ||
| Net Asset Value and offering price per share ($1,776,241 ÷ 114,688 shares)(a) | $15.49 | |
| Class C: | ||
| Net Asset Value and offering price per share ($28,294,528 ÷ 1,852,841 shares)(a) | $15.27 | |
| Class I: | ||
| Net Asset Value, offering price and redemption price per share ($25,984,206 ÷ 1,630,985 shares) | $15.93 |
(a) Redemption price per share is equal to net asset value less any applicable contingent deferred sales charge.
See accompanying notes which are an integral part of the financial statements.
Statement of Operations
| Year ended November 30, 2015 | ||
| Investment Income | ||
| Dividends | $3,590,922 | |
| Special dividends | 1,294,732 | |
| Interest | 15 | |
| Income from Fidelity Central Funds | 23,389 | |
| Total income | 4,909,058 | |
| Expenses | ||
| Management fee | ||
| Basic fee | $778,511 | |
| Performance adjustment | 100,788 | |
| Transfer agent fees | 322,377 | |
| Distribution and service plan fees | 613,119 | |
| Accounting and security lending fees | 55,551 | |
| Custodian fees and expenses | 12,314 | |
| Independent trustees' compensation | 585 | |
| Registration fees | 72,420 | |
| Audit | 59,867 | |
| Legal | 549 | |
| Miscellaneous | 979 | |
| Total expenses before reductions | 2,017,060 | |
| Expense reductions | (9,176) | 2,007,884 |
| Net investment income (loss) | 2,901,174 | |
| Realized and Unrealized Gain (Loss) | ||
| Net realized gain (loss) on: | ||
| Investment securities: | ||
| Unaffiliated issuers | 3,857,704 | |
| Foreign currency transactions | 2,222 | |
| Futures contracts | (132,655) | |
| Total net realized gain (loss) | 3,727,271 | |
| Change in net unrealized appreciation (depreciation) on: Investment securities | (9,228,349) | |
| Assets and liabilities in foreign currencies | (351) | |
| Total change in net unrealized appreciation (depreciation) | (9,228,700) | |
| Net gain (loss) | (5,501,429) | |
| Net increase (decrease) in net assets resulting from operations | $(2,600,255) |
See accompanying notes which are an integral part of the financial statements.
Statement of Changes in Net Assets
| Year ended November 30, 2015 | Year ended November 30, 2014 | |
| Increase (Decrease) in Net Assets | ||
| Operations | ||
| Net investment income (loss) | $2,901,174 | $904,007 |
| Net realized gain (loss) | 3,727,271 | 15,072,334 |
| Change in net unrealized appreciation (depreciation) | (9,228,700) | (1,986,549) |
| Net increase (decrease) in net assets resulting from operations | (2,600,255) | 13,989,792 |
| Distributions to shareholders from net investment income | (1,112,123) | (521,742) |
| Share transactions - net increase (decrease) | 52,856,883 | 9,971,359 |
| Total increase (decrease) in net assets | 49,144,505 | 23,439,409 |
| Net Assets | ||
| Beginning of period | 108,558,834 | 85,119,425 |
| End of period (including undistributed net investment income of $1,900,740 and undistributed net investment income of $953,800, respectively) | $157,703,339 | $108,558,834 |
See accompanying notes which are an integral part of the financial statements.
Financial Highlights — Fidelity Advisor Equity Value Fund Class A
| Years ended November 30, | 2015 | 2014 | 2013 | 2012 | 2011 |
| Selected Per–Share Data | |||||
| Net asset value, beginning of period | $16.00 | $13.93 | $10.60 | $9.09 | $8.85 |
| Income from Investment Operations | |||||
| Net investment income (loss)A | .35B | .17 | .13 | .12 | .06 |
| Net realized and unrealized gain (loss) | (.50)C | 2.01 | 3.33 | 1.44 | .27 |
| Total from investment operations | (.15) | 2.18 | 3.46 | 1.56 | .33 |
| Distributions from net investment income | (.19) | (.11) | (.13) | (.05) | (.09) |
| Net asset value, end of period | $15.66 | $16.00 | $13.93 | $10.60 | $9.09 |
| Total ReturnD,E | (.91)%C | 15.79% | 33.09% | 17.27% | 3.72% |
| Ratios to Average Net AssetsF,G | |||||
| Expenses before reductions | 1.24% | 1.23% | 1.22% | 1.30% | 1.27% |
| Expenses net of fee waivers, if any | 1.23% | 1.23% | 1.22% | 1.25% | 1.25% |
| Expenses net of all reductions | 1.23% | 1.23% | 1.20% | 1.25% | 1.25% |
| Net investment income (loss) | 2.23%B | 1.15% | 1.07% | 1.20% | .59% |
| Supplemental Data | |||||
| Net assets, end of period (000 omitted) | $67,005 | $50,957 | $39,538 | $29,282 | $27,910 |
| Portfolio turnover rateH | 49% | 68% | 68% | 77% | 65% |
A Calculated based on average shares outstanding during the period.
B Investment income per share reflects a large, non-recurring dividend which amounted to $.14 per share. Excluding this non-recurring dividend, the ratio of net investment income (loss) to average net assets would have been 1.31%.
C Net realized and unrealized gain (loss) per share reflects proceeds from litigation which amounted to $0.01 per share. Excluding these litigation proceeds, the total return would have been (.99)%.
D Total returns would have been lower if certain expenses had not been reduced during the applicable periods shown.
E Total returns do not include the effect of the sales charges.
F Fees and expenses of any underlying Fidelity Central Funds are not included in the Fund's expense ratio. The Fund indirectly bears its proportionate share of the expenses of any underlying Fidelity Central Funds.
G Expense ratios reflect operating expenses of the class. Expenses before reductions do not reflect amounts reimbursed by the investment adviser or reductions from brokerage service arrangements or reductions from other expense offset arrangements and do not represent the amount paid by the class during periods when reimbursements or reductions occur. Expenses net of fee waivers reflect expenses after reimbursement by the investment adviser but prior to reductions from brokerage service arrangements or other expense offset arrangements. Expenses net of all reductions represent the net expenses paid by the class.
H Amount does not include the portfolio activity of any underlying Fidelity Central Funds.
See accompanying notes which are an integral part of the financial statements.
Financial Highlights — Fidelity Advisor Equity Value Fund Class T
| Years ended November 30, | 2015 | 2014 | 2013 | 2012 | 2011 |
| Selected Per–Share Data | |||||
| Net asset value, beginning of period | $15.96 | $13.90 | $10.57 | $9.06 | $8.81 |
| Income from Investment Operations | |||||
| Net investment income (loss)A | .31B | .13 | .10 | .09 | .03 |
| Net realized and unrealized gain (loss) | (.50)C | 2.01 | 3.34 | 1.44 | .28 |
| Total from investment operations | (.19) | 2.14 | 3.44 | 1.53 | .31 |
| Distributions from net investment income | (.15) | (.08) | (.11) | (.02) | (.06) |
| Net asset value, end of period | $15.62 | $15.96 | $13.90 | $10.57 | $9.06 |
| Total ReturnD,E | (1.19)%C | 15.46% | 32.82% | 16.94% | 3.53% |
| Ratios to Average Net AssetsF,G | |||||
| Expenses before reductions | 1.50% | 1.49% | 1.48% | 1.55% | 1.53% |
| Expenses net of fee waivers, if any | 1.50% | 1.49% | 1.48% | 1.50% | 1.50% |
| Expenses net of all reductions | 1.50% | 1.49% | 1.46% | 1.50% | 1.50% |
| Net investment income (loss) | 1.96%B | .88% | .81% | .95% | .34% |
| Supplemental Data | |||||
| Net assets, end of period (000 omitted) | $34,643 | $31,087 | $27,241 | $21,212 | $21,319 |
| Portfolio turnover rateH | 49% | 68% | 68% | 77% | 65% |
A Calculated based on average shares outstanding during the period.
B Investment income per share reflects a large, non-recurring dividend which amounted to $.14 per share. Excluding this non-recurring dividend, the ratio of net investment income (loss) to average net assets would have been 1.05%.
C Net realized and unrealized gain (loss) per share reflects proceeds from litigation which amounted to $0.01 per share. Excluding these litigation proceeds, the total return would have been (1.27)%.
D Total returns would have been lower if certain expenses had not been reduced during the applicable periods shown.
E Total returns do not include the effect of the sales charges.
F Fees and expenses of any underlying Fidelity Central Funds are not included in the Fund's expense ratio. The Fund indirectly bears its proportionate share of the expenses of any underlying Fidelity Central Funds.
G Expense ratios reflect operating expenses of the class. Expenses before reductions do not reflect amounts reimbursed by the investment adviser or reductions from brokerage service arrangements or reductions from other expense offset arrangements and do not represent the amount paid by the class during periods when reimbursements or reductions occur. Expenses net of fee waivers reflect expenses after reimbursement by the investment adviser but prior to reductions from brokerage service arrangements or other expense offset arrangements. Expenses net of all reductions represent the net expenses paid by the class.
H Amount does not include the portfolio activity of any underlying Fidelity Central Funds.
See accompanying notes which are an integral part of the financial statements.
Financial Highlights — Fidelity Advisor Equity Value Fund Class B
| Years ended November 30, | 2015 | 2014 | 2013 | 2012 | 2011 |
| Selected Per–Share Data | |||||
| Net asset value, beginning of period | $15.81 | $13.76 | $10.45 | $8.98 | $8.73 |
| Income from Investment Operations | |||||
| Net investment income (loss)A | .23B | .06 | .04 | .04 | (.01) |
| Net realized and unrealized gain (loss) | (.49)C | 1.99 | 3.31 | 1.43 | .27 |
| Total from investment operations | (.26) | 2.05 | 3.35 | 1.47 | .26 |
| Distributions from net investment income | (.06) | – | (.04) | – | (.01) |
| Net asset value, end of period | $15.49 | $15.81 | $13.76 | $10.45 | $8.98 |
| Total ReturnD,E | (1.65)%C | 14.90% | 32.13% | 16.37% | 2.96% |
| Ratios to Average Net AssetsF,G | |||||
| Expenses before reductions | 2.08% | 2.04% | 1.99% | 2.06% | 2.02% |
| Expenses net of fee waivers, if any | 2.00% | 2.00% | 1.99% | 2.00% | 2.00% |
| Expenses net of all reductions | 2.00% | 1.99% | 1.97% | 2.00% | 2.00% |
| Net investment income (loss) | 1.46%B | .38% | .30% | .45% | (.16)% |
| Supplemental Data | |||||
| Net assets, end of period (000 omitted) | $1,776 | $2,738 | $2,886 | $2,981 | $3,884 |
| Portfolio turnover rateH | 49% | 68% | 68% | 77% | 65% |
A Calculated based on average shares outstanding during the period.
B Investment income per share reflects a large, non-recurring dividend which amounted to $.14 per share. Excluding this non-recurring dividend, the ratio of net investment income (loss) to average net assets would have been .55%.
C Net realized and unrealized gain (loss) per share reflects proceeds from litigation which amounted to $0.01 per share. Excluding these litigation proceeds, the total return would have been (1.73)%.
D Total returns would have been lower if certain expenses had not been reduced during the applicable periods shown.
E Total returns do not include the effect of the contingent deferred sales charge.
F Fees and expenses of any underlying Fidelity Central Funds are not included in the Fund's expense ratio. The Fund indirectly bears its proportionate share of the expenses of any underlying Fidelity Central Funds.
G Expense ratios reflect operating expenses of the class. Expenses before reductions do not reflect amounts reimbursed by the investment adviser or reductions from brokerage service arrangements or reductions from other expense offset arrangements and do not represent the amount paid by the class during periods when reimbursements or reductions occur. Expenses net of fee waivers reflect expenses after reimbursement by the investment adviser but prior to reductions from brokerage service arrangements or other expense offset arrangements. Expenses net of all reductions represent the net expenses paid by the class.
H Amount does not include the portfolio activity of any underlying Fidelity Central Funds.
See accompanying notes which are an integral part of the financial statements.
Financial Highlights — Fidelity Advisor Equity Value Fund Class C
| Years ended November 30, | 2015 | 2014 | 2013 | 2012 | 2011 |
| Selected Per–Share Data | |||||
| Net asset value, beginning of period�� | $15.63 | $13.63 | $10.37 | $8.91 | $8.67 |
| Income from Investment Operations | |||||
| Net investment income (loss)A | .23B | .06 | .04 | .04 | (.01) |
| Net realized and unrealized gain (loss) | (.49)C | 1.97 | 3.28 | 1.42 | .27 |
| Total from investment operations | (.26) | 2.03 | 3.32 | 1.46 | .26 |
| Distributions from net investment income | (.10) | (.03) | (.06) | – | (.02) |
| Net asset value, end of period | $15.27 | $15.63 | $13.63 | $10.37 | $8.91 |
| Total ReturnD,E | (1.68)%C | 14.90% | 32.16% | 16.39% | 2.95% |
| Ratios to Average Net AssetsF,G | |||||
| Expenses before reductions | 2.00% | 2.00% | 1.97% | 2.05% | 2.02% |
| Expenses net of fee waivers, if any | 2.00% | 2.00% | 1.97% | 2.00% | 2.00% |
| Expenses net of all reductions | 2.00% | 1.99% | 1.96% | 2.00% | 2.00% |
| Net investment income (loss) | 1.46%B | .38% | .32% | .45% | (.16)% |
| Supplemental Data | |||||
| Net assets, end of period (000 omitted) | $28,295 | $18,614 | $12,329 | $8,785 | $8,922 |
| Portfolio turnover rateH | 49% | 68% | 68% | 77% | 65% |
A Calculated based on average shares outstanding during the period.
B Investment income per share reflects a large, non-recurring dividend which amounted to $.14 per share. Excluding this non-recurring dividend, the ratio of net investment income (loss) to average net assets would have been .55%.
C Net realized and unrealized gain (loss) per share reflects proceeds from litigation which amounted to $0.01 per share. Excluding these litigation proceeds, the total return would have been (1.76)%.
D Total returns would have been lower if certain expenses had not been reduced during the applicable periods shown.
E Total returns do not include the effect of the contingent deferred sales charge.
F Fees and expenses of any underlying Fidelity Central Funds are not included in the Fund's expense ratio. The Fund indirectly bears its proportionate share of the expenses of any underlying Fidelity Central Funds.
G Expense ratios reflect operating expenses of the class. Expenses before reductions do not reflect amounts reimbursed by the investment adviser or reductions from brokerage service arrangements or reductions from other expense offset arrangements and do not represent the amount paid by the class during periods when reimbursements or reductions occur. Expenses net of fee waivers reflect expenses after reimbursement by the investment adviser but prior to reductions from brokerage service arrangements or other expense offset arrangements. Expenses net of all reductions represent the net expenses paid by the class.
H Amount does not include the portfolio activity of any underlying Fidelity Central Funds.
See accompanying notes which are an integral part of the financial statements.
Financial Highlights — Fidelity Advisor Equity Value Fund Class I
| Years ended November 30, | 2015 | 2014 | 2013 | 2012 | 2011 |
| Selected Per–Share Data | |||||
| Net asset value, beginning of period | $16.27 | $14.16 | $10.75 | $9.22 | $8.97 |
| Income from Investment Operations | |||||
| Net investment income (loss)A | .40B | .22 | .17 | .15 | .08 |
| Net realized and unrealized gain (loss) | (.50)C | 2.04 | 3.39 | 1.45 | .29 |
| Total from investment operations | (.10) | 2.26 | 3.56 | 1.60 | .37 |
| Distributions from net investment income | (.24) | (.15) | (.15) | (.07) | (.12) |
| Net asset value, end of period | $15.93 | $16.27 | $14.16 | $10.75 | $9.22 |
| Total ReturnD | (.60)%C | 16.16% | 33.61% | 17.49% | 4.05% |
| Ratios to Average Net AssetsE,F | |||||
| Expenses before reductions | .93% | .91% | .89% | .96% | 1.01% |
| Expenses net of fee waivers, if any | .93% | .91% | .89% | .96% | 1.00% |
| Expenses net of all reductions | .93% | .91% | .87% | .96% | 1.00% |
| Net investment income (loss) | 2.53%B | 1.46% | 1.40% | 1.49% | .84% |
| Supplemental Data | |||||
| Net assets, end of period (000 omitted) | $25,984 | $5,162 | $3,126 | $2,123 | $3,381 |
| Portfolio turnover rateG | 49% | 68% | 68% | 77% | 65% |
A Calculated based on average shares outstanding during the period.
B Investment income per share reflects a large, non-recurring dividend which amounted to $.15 per share. Excluding this non-recurring dividend, the ratio of net investment income (loss) to average net assets would have been 1.61%.
C Net realized and unrealized gain (loss) per share reflects proceeds from litigation which amounted to $0.01 per share. Excluding these litigation proceeds, the total return would have been (.68)%.
D Total returns would have been lower if certain expenses had not been reduced during the applicable periods shown.
E Fees and expenses of any underlying Fidelity Central Funds are not included in the Fund's expense ratio. The Fund indirectly bears its proportionate share of the expenses of any underlying Fidelity Central Funds.
F Expense ratios reflect operating expenses of the class. Expenses before reductions do not reflect amounts reimbursed by the investment adviser or reductions from brokerage service arrangements or reductions from other expense offset arrangements and do not represent the amount paid by the class during periods when reimbursements or reductions occur. Expenses net of fee waivers reflect expenses after reimbursement by the investment adviser but prior to reductions from brokerage service arrangements or other expense offset arrangements. Expenses net of all reductions represent the net expenses paid by the class.
G Amount does not include the portfolio activity of any underlying Fidelity Central Funds.
See accompanying notes which are an integral part of the financial statements.
Notes to Financial Statements
For the period ended November 30, 2015
1. Organization.
Fidelity Advisor Equity Value Fund (the Fund) is a fund of Fidelity Advisor Series I (the Trust) and is authorized to issue an unlimited number of shares. The Trust is registered under the Investment Company Act of 1940, as amended (the 1940 Act), as an open-end management investment company organized as a Massachusetts business trust. The Fund offers Class A, Class T, Class C, and Class I (formerly Institutional Class) shares, each of which, along with Class B shares, has equal rights as to assets and voting privileges. Class B shares are closed to new accounts and additional purchases, except for exchanges and reinvestments. Each class has exclusive voting rights with respect to matters that affect that class. Class B shares will automatically convert to Class A shares after a holding period of seven years from the initial date of purchase.
2. Investments in Fidelity Central Funds.
The Fund invests in Fidelity Central Funds, which are open-end investment companies generally available only to other investment companies and accounts managed by the investment adviser and its affiliates. The Fund's Schedule of Investments lists each of the Fidelity Central Funds held as of period end, if any, as an investment of the Fund, but do not include the underlying holdings of each Fidelity Central Fund. As an Investing Fund, the Fund indirectly bears its proportionate share of the expenses of the underlying Fidelity Central Funds.
The Money Market Central Funds seek preservation of capital and current income and are managed by Fidelity Investments Money Management, Inc. (FIMM), an affiliate of the investment adviser. Annualized expenses of the Money Market Central Funds as of their most recent shareholder report date are less than .005%.
A complete unaudited list of holdings for each Fidelity Central Fund is available upon request or at the Securities and Exchange Commission (the SEC) website at www.sec.gov. In addition, the financial statements of the Fidelity Central Funds, which are not covered by the Fund's Report of Independent Registered Public Accounting Firm, are available on the SEC website or upon request.
3. Significant Accounting Policies.
The financial statements have been prepared in conformity with accounting principles generally accepted in the United States of America (GAAP), which require management to make certain estimates and assumptions at the date of the financial statements. Actual results could differ from those estimates. Subsequent events, if any, through the date that the financial statements were issued have been evaluated in the preparation of the financial statements. The following summarizes the significant accounting policies of the Fund:
Investment Valuation. Investments are valued as of 4:00 p.m. Eastern time on the last calendar day of the period. The Board of Trustees (the Board) has delegated the day to day responsibility for the valuation of the Fund's investments to the Fidelity Management & Research Company (FMR) Fair Value Committee (the Committee). In accordance with valuation policies and procedures approved by the Board, the Fund attempts to obtain prices from one or more third party pricing vendors or brokers to value its investments. When current market prices, quotations or currency exchange rates are not readily available or reliable, investments will be fair valued in good faith by the Committee, in accordance with procedures adopted by the Board. Factors used in determining fair value vary by investment type and may include market or investment specific events. The frequency with which these procedures are used cannot be predicted and they may be utilized to a significant extent. The Committee oversees the Fund's valuation policies and procedures and reports to the Board on the Committee's activities and fair value determinations. The Board monitors the appropriateness of the procedures used in valuing the Fund's investments and ratifies the fair value determinations of the Committee.
The Fund categorizes the inputs to valuation techniques used to value its investments into a disclosure hierarchy consisting of three levels as shown below:
- Level 1 – quoted prices in active markets for identical investments
- Level 2 – other significant observable inputs (including quoted prices for similar investments, interest rates, prepayment speeds, etc.)
- Level 3 – unobservable inputs (including the Fund's own assumptions based on the best information available)
Valuation techniques used to value the Fund's investments by major category are as follows:
Equity securities, including restricted securities, for which market quotations are readily available, are valued at the last reported sale price or official closing price as reported by a third party pricing vendor on the primary market or exchange on which they are traded and are categorized as Level 1 in the hierarchy. In the event there were no sales during the day or closing prices are not available, securities are valued at the last quoted bid price or may be valued using the last available price and are generally categorized as Level 2 in the hierarchy. For foreign equity securities, when market or security specific events arise, comparisons to the valuation of American Depositary Receipts (ADRs), futures contracts, Exchange-Traded Funds (ETFs) and certain indexes as well as quoted prices for similar securities may be used and would be categorized as Level 2 in the hierarchy. Utilizing these techniques may result in transfers between Level 1 and Level 2. For equity securities, including restricted securities, where observable inputs are limited, assumptions about market activity and risk are used and these securities may be categorized as Level 3 in the hierarchy.
Investments in open-end mutual funds, including the Fidelity Central Funds, are valued at their closing net asset value (NAV) each business day and are categorized as Level 1 in the hierarchy.
Changes in valuation techniques may result in transfers in or out of an assigned level within the disclosure hierarchy. The aggregate value of investments by input level as of November 30, 2015 is included at the end of the Fund's Schedule of Investments.
Foreign Currency. The Fund may use foreign currency contracts to facilitate transactions in foreign-denominated securities. Gains and losses from these transactions may arise from changes in the value of the foreign currency or if the counterparties do not perform under the contracts' terms.
Foreign-denominated assets, including investment securities, and liabilities are translated into U.S. dollars at the exchange rates at period end. Purchases and sales of investment securities, income and dividends received and expenses denominated in foreign currencies are translated into U.S. dollars at the exchange rate in effect on the transaction date.
The effects of exchange rate fluctuations on investments are included with the net realized and unrealized gain (loss) on investment securities. Other foreign currency transactions resulting in realized and unrealized gain (loss) are disclosed separately.
Investment Transactions and Income. For financial reporting purposes, the Fund's investment holdings and NAV include trades executed through the end of the last business day of the period. The NAV per share for processing shareholder transactions is calculated as of the close of business of the New York Stock Exchange (NYSE), normally 4:00 p.m. Eastern time and includes trades executed through the end of the prior business day. Gains and losses on securities sold are determined on the basis of identified cost and may include proceeds received from litigation. Dividend income is recorded on the ex-dividend date, except for certain dividends from foreign securities where the ex-dividend date may have passed, which are recorded as soon as the Fund is informed of the ex-dividend date. Non-cash dividends included in dividend income, if any, are recorded at the fair market value of the securities received. Income and capital gain distributions from Fidelity Central Funds, if any, are recorded on the ex-dividend date. Distributions received on securities that represent a return of capital or capital gain are recorded as a reduction of cost of investments and/or as a realized gain. Subsequent to ex-dividend date the Fund determines the components of these distributions, based upon receipt of tax filings or other correspondence relating to the underlying investment. Large, non-recurring dividends recognized by the Fund are presented separately on the Statement of Operations as "Special Dividends" and the impact of these dividends is presented in the Financial Highlights. Interest income is accrued as earned and includes coupon interest and amortization of premium and accretion of discount on debt securities as applicable. Investment income is recorded net of foreign taxes withheld where recovery of such taxes is uncertain.
Class Allocations and Expenses. Investment income, realized and unrealized capital gains and losses, common expenses of the Fund, and certain fund-level expense reductions, if any, are allocated daily on a pro-rata basis to each class based on the relative net assets of each class to the total net assets of the Fund. Each class differs with respect to transfer agent and distribution and service plan fees incurred. Certain expense reductions may also differ by class. For the reporting period, the allocated portion of income and expenses to each class as a percent of its average net assets may vary due to the timing of recording these transactions in relation to fluctuating net assets of the classes. Expenses directly attributable to a fund are charged to that fund. Expenses attributable to more than one fund are allocated among the respective funds on the basis of relative net assets or other appropriate methods. Expense estimates are accrued in the period to which they relate and adjustments are made when actual amounts are known.
Income Tax Information and Distributions to Shareholders. Each year, the Fund intends to qualify as a regulated investment company under Subchapter M of the Internal Revenue Code, including distributing substantially all of its taxable income and realized gains. As a result, no provision for U.S. Federal income taxes is required. As of November 30, 2015, the Fund did not have any unrecognized tax benefits in the financial statements; nor is the Fund aware of any tax positions for which it is reasonably possible that the total amounts of unrecognized tax benefits will significantly change in the next twelve months. The Fund files a U.S. federal tax return, in addition to state and local tax returns as required. The Fund's federal income tax returns are subject to examination by the Internal Revenue Service (IRS) for a period of three fiscal years after they are filed. State and local tax returns may be subject to examination for an additional fiscal year depending on the jurisdiction. Foreign taxes are provided for based on the Fund's understanding of the tax rules and rates that exist in the foreign markets in which it invests.
Distributions are declared and recorded on the ex-dividend date. Income dividends and capital gain distributions are declared separately for each class. Income and capital gain distributions are determined in accordance with income tax regulations, which may differ from GAAP. In addition, the fund claimed a portion of the payment made to redeeming shareholders as a distribution for income tax purposes.
Capital accounts within the financial statements are adjusted for permanent book-tax differences. These adjustments have no impact on net assets or the results of operations. Capital accounts are not adjusted for temporary book-tax differences which will reverse in a subsequent period.
Book-tax differences are primarily due to foreign currency transactions, market discount, passive foreign investment companies (PFIC), partnerships, capital loss carryforwards and losses deferred due to wash sales and excise tax regulations.
The federal tax cost of investment securities and unrealized appreciation (depreciation) as of period end were as follows:
| Gross unrealized appreciation | $13,603,727 |
| Gross unrealized depreciation | (8,406,466) |
| Net unrealized appreciation (depreciation) on securities | $5,197,261 |
| Tax Cost | $150,395,785 |
The tax-based components of distributable earnings as of period end were as follows:
| Undistributed ordinary income | $1,900,739 |
| Undistributed long-term capital gain | $1,374,604 |
| Net unrealized appreciation (depreciation) on securities and other investments | $5,196,925 |
The Fund intends to elect to defer to its next fiscal year $1,510,201 of capital losses recognized during the period November 1, 2015 to November 30, 2015.
The tax character of distributions paid was as follows:
| November 30, 2015 | November 30, 2014 | |
| Ordinary Income | $1,112,123 | $ 521,742 |
4. Derivative Instruments.
Risk Exposures and the Use of Derivative Instruments. The Fund's investment objective allows the Fund to enter into various types of derivative contracts, including futures contracts. Derivatives are investments whose value is primarily derived from underlying assets, indices or reference rates and may be transacted on an exchange or over-the-counter (OTC). Derivatives may involve a future commitment to buy or sell a specified asset based on specified terms, to exchange future cash flows at periodic intervals based on a notional principal amount, or for one party to make one or more payments upon the occurrence of specified events in exchange for periodic payments from the other party.
The Fund used derivatives to increase returns and to manage exposure to certain risks as defined below. The success of any strategy involving derivatives depends on analysis of numerous economic factors, and if the strategies for investment do not work as intended, the Fund may not achieve its objectives.
The Fund's use of derivatives increased or decreased its exposure to the following risk:
| Equity Risk | Equity risk relates to the fluctuations in the value of financial instruments as a result of changes in market prices (other than those arising from interest rate risk or foreign exchange risk), whether caused by factors specific to an individual investment, its issuer, or all factors affecting all instruments traded in a market or market segment. |
The Fund is also exposed to additional risks from investing in derivatives, such as liquidity risk and counterparty credit risk. Liquidity risk is the risk that the Fund will be unable to close out the derivative in the open market in a timely manner. Counterparty credit risk is the risk that the counterparty will not be able to fulfill its obligation to the Fund. Counterparty credit risk related to exchange-traded futures contracts may be mitigated by the protection provided by the exchange on which they trade.
Investing in derivatives may involve greater risks than investing in the underlying assets directly and, to varying degrees, may involve risk of loss in excess of any initial investment and collateral received and amounts recognized in the Statement of Assets and Liabilities. In addition, there may be the risk that the change in value of the derivative contract does not correspond to the change in value of the underlying instrument.
Futures Contracts. A futures contract is an agreement between two parties to buy or sell a specified underlying instrument for a fixed price at a specified future date. The Fund used futures contracts to manage its exposure to the stock market.
Upon entering into a futures contract, a fund is required to deposit either cash or securities (initial margin) with a clearing broker in an amount equal to a certain percentage of the face value of the contract. Futures contracts are marked-to-market daily and subsequent daily payments (variation margin) are made or received by a fund depending on the daily fluctuations in the value of the futures contracts and are recorded as unrealized appreciation or (depreciation). This receivable and/or payable, if any, is included in daily variation margin for derivative instruments in the Statement of Assets and Liabilities. Realized gain or (loss) is recorded upon the expiration or closing of a futures contract.
Any open futures contracts at period end are presented in the Schedule of Investments under the caption "Futures Contracts". The underlying face amount at value reflects each contract's exposure to the underlying instrument or index at period end.
During the period the Fund recognized net realized gain (loss) of $(132,655) related to its investment in futures contracts. This amount is included in the Statement of Operations.
5. Purchases and Sales of Investments.
Purchases and sales of securities, other than short-term securities, aggregated $114,194,087 and $65,358,664, respectively.
6. Fees and Other Transactions with Affiliates.
Management Fee. Fidelity Management & Research Company (the investment adviser) and its affiliates provide the Fund with investment management related services for which the Fund pays a monthly management fee. The management fee is the sum of an individual fund fee rate that is based on an annual rate of .30% of the Fund's average net assets and an annualized group fee rate that averaged .25% during the period. The group fee rate is based upon the average net assets of all the mutual funds advised by the investment adviser, including any mutual funds previously advised by the investment adviser that are currently advised by Fidelity SelectCo, LLC, an affiliate of the investment adviser. The group fee rate decreases as assets under management increase and increases as assets under management decrease. In addition, the management fee is subject to a performance adjustment (up to a maximum of +/- .20% of the Fund's average net assets over a 36 month performance period). The upward or downward adjustment to the management fee is based on the relative investment performance of Class I of the Fund as compared to its benchmark index, the Russell 3000 Value Index, over the same 36 month performance period. For the reporting period, the total annual management fee rate, including the performance adjustment, was .62% of the Fund's average net assets. The performance adjustment included in the management fee rate may be higher or lower than the maximum performance adjustment rate due to the difference between the average net assets for the reporting and performance periods.
Distribution and Service Plan Fees. In accordance with Rule 12b-1 of the 1940 Act, the Fund has adopted separate Distribution and Service Plans for each class of shares. Certain classes pay Fidelity Distributors Corporation (FDC), an affiliate of the investment adviser, separate Distribution and Service Fees, each of which is based on an annual percentage of each class' average net assets. In addition, FDC may pay financial intermediaries for selling shares of the Fund and providing shareholder support services. For the period, the Distribution and Service Fee rates, total fees and amounts retained by FDC were as follows:
| Distribution Fee | Service Fee | Total Fees | Retained by FDC | |
| Class A | -% | .25% | $154,435 | $2,800 |
| Class T | .25% | .25% | 173,996 | 4 |
| Class B | .75% | .25% | 23,617 | 17,726 |
| Class C | .75% | .25% | 261,071 | 47,750 |
| $613,119 | $68,280 |
Sales Load. FDC may receive a front-end sales charge of up to 5.75% for selling Class A shares and 3.50% for selling Class T shares, some of which is paid to financial intermediaries for selling shares of the Fund. Depending on the holding period, FDC may receive contingent deferred sales charges levied on Class A, Class T, Class B, and Class C redemptions. The deferred sales charges range from 5.00% to 1.00% for Class B shares, 1.00% for Class C shares, 1.00% for certain purchases of Class A shares and .25% for certain purchases of Class T shares.
For the period, sales charge amounts retained by FDC were as follows:
| Retained by FDC | |
| Class A | $44,961 |
| Class T | 8,330 |
| Class B(a) | 406 |
| Class C(a) | 4,176 |
| $57,873 |
(a) When Class B and Class C shares are initially sold, FDC pays commissions from its own resources to financial intermediaries through which the sales are made.
Transfer Agent Fees. Fidelity Investments Institutional Operations Company, Inc., (FIIOC), an affiliate of the investment adviser, is the transfer, dividend disbursing and shareholder servicing agent for each class of the Fund. FIIOC receives account fees and asset-based fees that vary according to the account size and type of account of the shareholders of the respective classes of the Fund. FIIOC pays for typesetting, printing and mailing of shareholder reports, except proxy statements.
For the period, transfer agent fees for each class were as follows:
| Amount | % of Class-Level Average Net Assets | |
| Class A | $138,529 | .22 |
| Class T | 83,959 | .24 |
| Class B | 7,234 | .31 |
| Class C | 61,424 | .24 |
| Class I | 31,231 | .18 |
| $322,377 |
Accounting and Security Lending Fees. Fidelity Service Company, Inc. (FSC), an affiliate of the investment adviser, maintains the Fund's accounting records. The accounting fee is based on the level of average net assets for each month. Under a separate contract, FSC administers the security lending program. The security lending fee is based on the number and duration of lending transactions.
Brokerage Commissions. The Fund placed a portion of its portfolio transactions with brokerage firms which are affiliates of the investment adviser. Brokerage commissions are included in net realized gain (loss) and change in net unrealized appreciation (depreciation) in the Statement of Operations. The commissions paid to these affiliated firms were $1,208 for the period.
7. Committed Line of Credit.
The Fund participates with other funds managed by the investment adviser or an affiliate in a $4.25 billion credit facility (the "line of credit") to be utilized for temporary or emergency purposes to fund shareholder redemptions or for other short-term liquidity purposes. The Fund has agreed to pay commitment fees on its pro-rata portion of the line of credit, which amounted to $189 and is reflected in Miscellaneous expenses on the Statement of Operations. During the period, the Fund did not borrow on this line of credit.
8. Security Lending.
The Fund lends portfolio securities through a lending agent from time to time in order to earn additional income. For equity securities, a lending agent is used and may loan securities to certain qualified borrowers, including Fidelity Capital Markets (FCM), a broker-dealer affiliated with the Fund. On the settlement date of the loan, the Fund receives collateral (in the form of U.S. Treasury obligations, letters of credit and/or cash) against the loaned securities and maintains collateral in an amount not less than 100% of the market value of the loaned securities during the period of the loan. The market value of the loaned securities is determined at the close of business of the Fund and any additional required collateral is delivered to the Fund on the next business day. The Fund or borrower may terminate the loan at any time, and if the borrower defaults on its obligation to return the securities loaned because of insolvency or other reasons, the Fund may apply collateral received from the borrower against the obligation. The Fund may experience delays and costs in recovering the securities loaned. Any cash collateral received is invested in the Fidelity Securities Lending Cash Central Fund. The value of loaned securities and cash collateral at period end are disclosed on the Fund's Statement of Assets and Liabilities. Security lending income represents the income earned on investing cash collateral, less rebates paid to borrowers and any lending agent fees associated with the loan, plus any premium payments received for lending certain types of securities. Security lending income is presented in the Statement of Operations as a component of income from Fidelity Central Funds. Total security lending income during the period amounted to $10,163. During the period, there were no securities loaned to FCM.
9. Expense Reductions.
The investment adviser voluntarily agreed to reimburse each class to the extent annual operating expenses exceeded certain levels of average net assets as noted in the table below. Some expenses, for example interest expense, including commitment fees, are excluded from this reimbursement.
The following classes were in reimbursement during the period:
| Expense Limitations | Reimbursement | |
| Class T | 1.50% | 1,511 |
| Class B | 2.00% | 1,810 |
| Class C | 2.00% | 801 |
| $4,122 |
In addition, during the period the investment adviser reimbursed and/or waived a portion of fund-level operating expenses in the amount of $622 and a portion of class-level operating expenses as follows:
| Amount | |
| Class A | $1,005 |
| Class T | 634 |
| Class B | 6 |
| Class C | 351 |
| Class I | 121 |
| $2,117 |
Commissions paid to certain brokers with whom the investment adviser, or its affiliates, places trades on behalf of the Fund include an amount in addition to trade execution, which may be rebated back to the Fund to offset certain expenses. This amount totaled $2,315 for the period
10. Distributions to Shareholders.
Distributions to shareholders of each class were as follows:
| Years ended November 30, | 2015 | 2014 |
| From net investment income | ||
| Class A | $615,978 | $313,844 |
| Class T | 290,749 | 150,475 |
| Class B | 10,041 | – |
| Class C | 117,971 | 23,680 |
| Class I | 77,384 | 33,743 |
| Total | $1,112,123 | $521,742 |
11. Share Transactions.
Share transactions for each class were as follows and may contain automatic conversions between classes or exchanges between funds:
| Shares | Shares | Dollars | Dollars | |
| Years ended November 30, | 2015 | 2014 | 2015 | 2014 |
| Class A | ||||
| Shares sold | 2,015,005 | 970,744 | $32,448,584 | $14,424,123 |
| Reinvestment of distributions | 38,605 | 21,597 | 595,591 | 293,073 |
| Shares redeemed | (960,120) | (645,902) | (15,261,622) | (9,642,824) |
| Net increase (decrease) | 1,093,490 | 346,439 | $17,782,553 | $5,074,372 |
| Class T | ||||
| Shares sold | 826,030 | 455,273 | $13,376,322 | $6,703,728 |
| Reinvestment of distributions | 18,532 | 10,805 | 286,169 | 146,522 |
| Shares redeemed | (575,170) | (478,458) | (9,138,418) | (7,047,321) |
| Net increase (decrease) | 269,392 | (12,380) | $4,524,073 | $(197,071) |
| Class B | ||||
| Shares sold | 35,557 | 32,366 | $577,356 | $476,104 |
| Reinvestment of distributions | 629 | – | 9,736 | – |
| Shares redeemed | (94,699) | (68,915) | (1,497,315) | (1,011,558) |
| Net increase (decrease) | (58,513) | (36,549) | $(910,223) | $(535,454) |
| Class C | ||||
| Shares sold | 1,023,935 | 474,669 | $15,818,813 | $6,945,091 |
| Reinvestment of distributions | 7,049 | 1,582 | 107,103 | 21,115 |
| Shares redeemed | (369,314) | (189,954) | (5,731,970) | (2,772,301) |
| Net increase (decrease) | 661,670 | 286,297 | $10,193,946 | $4,193,905 |
| Class I | ||||
| Shares sold | 1,650,138 | 213,556 | $26,551,745 | $3,228,875 |
| Reinvestment of distributions | 4,819 | 2,352 | 75,344 | 32,366 |
| Shares redeemed | (341,188) | (119,400) | (5,360,555) | (1,825,634) |
| Net increase (decrease) | 1,313,769 | 96,508 | $21,266,534 | $1,435,607 |
12. Other.
The Fund's organizational documents provide former and current trustees and officers with a limited indemnification against liabilities arising in connection with the performance of their duties to the Fund. In the normal course of business, the Fund may also enter into contracts that provide general indemnifications. The Fund's maximum exposure under these arrangements is unknown as this would be dependent on future claims that may be made against the Fund. The risk of material loss from such claims is considered remote.
Report of Independent Registered Public Accounting Firm
To the Trustees of Fidelity Advisor Series I and Shareholders of Fidelity Advisor® Equity Value Fund:
We have audited the accompanying statement of assets and liabilities of Fidelity Advisor® Equity Value Fund (the Fund), a fund of Fidelity Advisor Series I, including the schedule of investments, as of November 30, 2015, and the related statement of operations for the year then ended, the statement of changes in net assets for each of the two years in the period then ended, and the financial highlights for each of the five years in the period then ended. These financial statements and financial highlights are the responsibility of the Fund's management. Our responsibility is to express an opinion on these financial statements and financial highlights based on our audits.
We conducted our audits in accordance with the standards of the Public Company Accounting Oversight Board (United States). Those standards require that we plan and perform the audit to obtain reasonable assurance about whether the financial statements and financial highlights are free of material misstatement. The Fund is not required to have, nor were we engaged to perform, an audit of its internal control over financial reporting. Our audits included consideration of internal control over financial reporting as a basis for designing audit procedures that are appropriate in the circumstances, but not for the purpose of expressing an opinion on the effectiveness of the Fund's internal control over financial reporting. Accordingly, we express no such opinion. An audit also includes examining, on a test basis, evidence supporting the amounts and disclosures in the financial statements, assessing the accounting principles used and significant estimates made by management, as well as evaluating the overall financial statement presentation. Our procedures included confirmation of securities owned as of November 30, 2015, by correspondence with the custodians and brokers; when replies were not received from brokers, we performed other auditing procedures. We believe our audits provide a reasonable basis for our opinion.
In our opinion, such financial statements and financial highlights referred to above present fairly, in all material respects, the financial position of Fidelity Advisor® Equity Value Fund as of November 30, 2015, the results of its operations for the year then ended, the changes in its net assets for each of the two years in the period then ended, and the financial highlights for each of the five years in the period then ended in conformity with accounting principles generally accepted in the United States of America.
DELOITTE & TOUCHE LLP
Boston, Massachusetts
January 15, 2016
Trustees and Officers
The Trustees, Members of the Advisory Board (if any), and officers of the trust and fund, as applicable, are listed below. The Board of Trustees governs the fund and is responsible for protecting the interests of shareholders. The Trustees are experienced executives who meet periodically throughout the year to oversee the fund's activities, review contractual arrangements with companies that provide services to the fund, oversee management of the risks associated with such activities and contractual arrangements, and review the fund's performance. Each of the Trustees oversees 170 funds.
The Trustees hold office without limit in time except that (a) any Trustee may resign; (b) any Trustee may be removed by written instrument, signed by at least two-thirds of the number of Trustees prior to such removal; (c) any Trustee who requests to be retired or who has become incapacitated by illness or injury may be retired by written instrument signed by a majority of the other Trustees; and (d) any Trustee may be removed at any special meeting of shareholders by a two-thirds vote of the outstanding voting securities of the trust. Each Trustee who is not an interested person (as defined in the 1940 Act) of the trust and the fund is referred to herein as an Independent Trustee. Each Independent Trustee shall retire not later than the last day of the calendar year in which his or her 75th birthday occurs. The Independent Trustees may waive this mandatory retirement age policy with respect to individual Trustees. Officers and Advisory Board Members hold office without limit in time, except that any officer or Advisory Board Member may resign or may be removed by a vote of a majority of the Trustees at any regular meeting or any special meeting of the Trustees. Except as indicated, each individual has held the office shown or other offices in the same company for the past five years.
The fund’s Statement of Additional Information (SAI) includes more information about the Trustees. To request a free copy, call Fidelity at 1-877-208-0098.
Experience, Skills, Attributes, and Qualifications of the Trustees. The Governance and Nominating Committee has adopted a statement of policy that describes the experience, qualifications, attributes, and skills that are necessary and desirable for potential Independent Trustee candidates (Statement of Policy). The Board believes that each Trustee satisfied at the time he or she was initially elected or appointed a Trustee, and continues to satisfy, the standards contemplated by the Statement of Policy. The Governance and Nominating Committee also engages professional search firms to help identify potential Independent Trustee candidates who have the experience, qualifications, attributes, and skills consistent with the Statement of Policy. From time to time, additional criteria based on the composition and skills of the current Independent Trustees, as well as experience or skills that may be appropriate in light of future changes to board composition, business conditions, and regulatory or other developments, have also been considered by the professional search firms and the Governance and Nominating Committee. In addition, the Board takes into account the Trustees' commitment and participation in Board and committee meetings, as well as their leadership of standing and ad hoc committees throughout their tenure.
In determining that a particular Trustee was and continues to be qualified to serve as a Trustee, the Board has considered a variety of criteria, none of which, in isolation, was controlling. The Board believes that, collectively, the Trustees have balanced and diverse experience, qualifications, attributes, and skills, which allow the Board to operate effectively in governing the fund and protecting the interests of shareholders. Information about the specific experience, skills, attributes, and qualifications of each Trustee, which in each case led to the Board's conclusion that the Trustee should serve (or continue to serve) as a trustee of the fund, is provided below.
Board Structure and Oversight Function. James C. Curvey is an interested person and currently serves as Chairman. The Trustees have determined that an interested Chairman is appropriate and benefits shareholders because an interested Chairman has a personal and professional stake in the quality and continuity of services provided to the fund. Independent Trustees exercise their informed business judgment to appoint an individual of their choosing to serve as Chairman, regardless of whether the Trustee happens to be independent or a member of management. The Independent Trustees have determined that they can act independently and effectively without having an Independent Trustee serve as Chairman and that a key structural component for assuring that they are in a position to do so is for the Independent Trustees to constitute a substantial majority for the Board. The Independent Trustees also regularly meet in executive session. Ned C. Lautenbach serves as Chairman of the Independent Trustees and as such (i) acts as a liaison between the Independent Trustees and management with respect to matters important to the Independent Trustees and (ii) with management prepares agendas for Board meetings.
Fidelity® funds are overseen by different Boards of Trustees. The fund's Board oversees Fidelity's high income and certain equity funds, and other Boards oversee Fidelity's investment-grade bond, money market, asset allocation, and sector funds. The asset allocation funds may invest in Fidelity® funds overseen by the fund's Board. The use of separate Boards, each with its own committee structure, allows the Trustees of each group of Fidelity® funds to focus on the unique issues of the funds they oversee, including common research, investment, and operational issues. On occasion, the separate Boards establish joint committees to address issues of overlapping consequences for the Fidelity® funds overseen by each Board.
The Trustees operate using a system of committees to facilitate the timely and efficient consideration of all matters of importance to the Trustees, the fund, and fund shareholders and to facilitate compliance with legal and regulatory requirements and oversight of the fund's activities and associated risks. The Board, acting through its committees, has charged FMR and its affiliates with (i) identifying events or circumstances the occurrence of which could have demonstrably adverse effects on the fund's business and/or reputation; (ii) implementing processes and controls to lessen the possibility that such events or circumstances occur or to mitigate the effects of such events or circumstances if they do occur; and (iii) creating and maintaining a system designed to evaluate continuously business and market conditions in order to facilitate the identification and implementation processes described in (i) and (ii) above. Because the day-to-day operations and activities of the fund are carried out by or through FMR, its affiliates, and other service providers, the fund's exposure to risks is mitigated but not eliminated by the processes overseen by the Trustees. While each of the Board's committees has responsibility for overseeing different aspects of the fund's activities, oversight is exercised primarily through the Operations, Audit, and Compliance Committees. In addition, the Independent Trustees have worked with FMR to enhance the Board's oversight of investment and financial risks, legal and regulatory risks, technology risks, and operational risks, including the development of additional risk reporting to the Board. For example, a working group comprised of Independent Trustees and FMR has worked and continues to work to review the Fidelity® funds' valuation-related activities, reporting and risk management. Appropriate personnel, including but not limited to the fund's Chief Compliance Officer (CCO), FMR's internal auditor, the independent accountants, the fund's Treasurer and portfolio management personnel, make periodic reports to the Board's committees, as appropriate, including an annual review of Fidelity's risk management program for the Fidelity® funds. The responsibilities of each standing committee, including their oversight responsibilities, are described further under "Standing Committees of the Trustees."
Interested Trustees*:
Correspondence intended for a Trustee who is an interested person may be sent to Fidelity Investments, 245 Summer Street, Boston, Massachusetts 02210.
Name, Year of Birth; Principal Occupations and Other Relevant Experience+
James C. Curvey (1935)
Year of Election or Appointment: 2007
Trustee
Chairman of the Board of Trustees
Mr. Curvey also serves as Trustee of other Fidelity® funds. Mr. Curvey is a Director of Fidelity Research & Analysis Co. (investment adviser firm, 2009-present), and Vice Chairman (2007-present) and Director of FMR LLC (diversified financial services company). In addition, Mr. Curvey serves as an Overseer for the Boston Symphony Orchestra and a member of the board of Artis-Naples, Naples, Florida, and as a Trustee for Brewster Academy, Wolfeboro, New Hampshire. Previously, Mr. Curvey served as a Director of Fidelity Investments Money Management, Inc. (investment adviser firm, 2009-2014) and a Director of FMR and FMR Co., Inc. (investment adviser firms, 2007-2014).
Charles S. Morrison (1960)
Year of Election or Appointment: 2014
Trustee
Mr. Morrison also serves as Trustee of other funds. He serves as a Director of Fidelity Investments Money Management, Inc. (FIMM) (investment adviser firm, 2014-present), Director of Fidelity SelectCo, LLC (investment adviser firm, 2014-present), President, Asset Management (2014-present), and is an employee of Fidelity Investments. Previously, Mr. Morrison served as Vice President of Fidelity's Fixed Income and Asset Allocation Funds (2012-2014), President, Fixed Income (2011-2014), Vice President of Fidelity's Money Market Funds (2005-2009), President, Money Market Group Leader of FMR (investment adviser firm, 2009), and Senior Vice President, Money Market Group of FMR (2004-2009). Mr. Morrison also served as Vice President of Fidelity's Bond Funds (2002-2005), certain Balanced Funds (2002-2005), and certain Asset Allocation Funds (2002-2007), and as Senior Vice President (2002-2005) of Fidelity's Bond Division.
* Determined to be an “Interested Trustee” by virtue of, among other things, his or her affiliation with the trust or various entities under common control with FMR.
+ The information includes the Trustee's principal occupation during the last five years and other information relating to the experience, attributes, and skills relevant to the Trustee's qualifications to serve as a Trustee, which led to the conclusion that the Trustee should serve as a Trustee for the fund.
Independent Trustees:
Correspondence intended for an Independent Trustee may be sent to Fidelity Investments, P.O. Box 55235, Boston, Massachusetts 02205-5235.
Name, Year of Birth; Principal Occupations and Other Relevant Experience+
Dennis J. Dirks (1948)
Year of Election or Appointment: 2005
Trustee
Mr. Dirks also serves as Trustee of other Fidelity® funds. Prior to his retirement in May 2003, Mr. Dirks was Chief Operating Officer and a member of the Board of The Depository Trust & Clearing Corporation (DTCC). He also served as President, Chief Operating Officer, and Board member of The Depository Trust Company (DTC) and President and Board member of the National Securities Clearing Corporation (NSCC). In addition, Mr. Dirks served as Chief Executive Officer and Board member of the Government Securities Clearing Corporation, Chief Executive Officer and Board member of the Mortgage-Backed Securities Clearing Corporation, as a Trustee and a member of the Finance Committee of Manhattan College (2005-2008), as a Trustee and a member of the Finance Committee of AHRC of Nassau County (2006-2008), and as a member of the Independent Directors Council (IDC) Governing Council (2010-2015). Mr. Dirks is a member of the Board of Directors for The Brookville Center for Children's Services, Inc. (2009-present).
Alan J. Lacy (1953)
Year of Election or Appointment: 2008
Trustee
Mr. Lacy also serves as Trustee of other Fidelity® funds. Mr. Lacy serves as a member of the Board of Directors of Dave & Buster's Entertainment, Inc. (restaurant and entertainment complexes, 2010-present) and Bristol-Myers Squibb Company (global pharmaceuticals, 2008-present). In addition, Mr. Lacy served as Senior Adviser (2007-2014) of Oak Hill Capital Partners, L.P. (private equity) and also served as Chief Executive Officer (2000-2005) and Vice Chairman (2005-2006) of Sears Holdings Corporation and Sears, Roebuck and Co. (retail). Mr. Lacy is a member of the Board of Trustees of The National Parks Conservation Association (2006-present). Previously, Mr. Lacy served as Chairman of the Board of Trustees of the National Parks Conservation Association (2008-2011) and as a member of the Board of Directors for The Western Union Company (global money transfer, 2006-2011), The Hillman Companies, Inc. (hardware wholesalers, 2010-2014), and Earth Fare, Inc. (retail grocery, 2010-2014).
Ned C. Lautenbach (1944)
Year of Election or Appointment: 2000
Trustee
Chairman of the Independent Trustees
Mr. Lautenbach also serves as Trustee of other Fidelity® funds. Mr. Lautenbach currently serves as the Lead Director of the Eaton Corporation Board of Directors (diversified industrial, 1997-present). Mr. Lautenbach is Chairman of the Board of Directors of Artis-Naples in Naples, Florida (2012-present), a member of the Council on Foreign Relations (1994-present), and a member of the Board of Governors, State University System of Florida (2013-present). Previously, Mr. Lautenbach was a Partner/Advisory Partner at Clayton, Dubilier & Rice, LLC (private equity investment, 1998-2010), as well as a Director of Sony Corporation (2006-2007).
Joseph Mauriello (1944)
Year of Election or Appointment: 2008
Trustee
Mr. Mauriello also serves as Trustee of other Fidelity® funds. Prior to his retirement in January 2006, Mr. Mauriello served in numerous senior management positions including Deputy Chairman and Chief Operating Officer (2004-2005), and Vice Chairman of Financial Services (2002-2004) of KPMG LLP US (professional services, 1965-2005). Mr. Mauriello currently serves as a member of the Board of Directors of XL Group plc. (global insurance and re-insurance, 2006-present) and the Independent Directors Council (IDC) Governing Council (2015-present). Previously, Mr. Mauriello served as a Director of the Hamilton Funds of the Bank of New York (2006-2007) and of Arcadia Resources Inc. (health care services and products, 2007-2012).
Robert W. Selander (1950)
Year of Election or Appointment: 2011
Trustee
Mr. Selander also serves as Trustee of other Fidelity® funds. Mr. Selander serves as a Director of The Western Union Company (global money transfer, 2014-present). Previously, Mr. Selander served as a Member of the Advisory Board of other Fidelity® funds (2011), and Executive Vice Chairman (2010), Chief Executive Officer (2009-2010), and President and Chief Executive Officer (1997-2009) of Mastercard, Inc.
Cornelia M. Small (1944)
Year of Election or Appointment: 2005
Trustee
Ms. Small also serves as Trustee of other Fidelity® funds. Ms. Small is a member of the Board of Directors (2009-present) and Chair of the Investment Committee (2010-present) of the Teagle Foundation. Ms. Small also serves on the Investment Committee of the Berkshire Taconic Community Foundation (2008-present). Previously, Ms. Small served as Chairperson (2002-2008) and a member of the Investment Committee and Chairperson (2008-2012) and a member of the Board of Trustees of Smith College. In addition, Ms. Small served as Chief Investment Officer, Director of Global Equity Investments, and a member of the Board of Directors of Scudder, Stevens & Clark and Scudder Kemper Investments.
William S. Stavropoulos (1939)
Year of Election or Appointment: 2002
Trustee
Vice Chairman of the Independent Trustees
Mr. Stavropoulos also serves as Trustee of other Fidelity® funds. Mr. Stavropoulos serves as President and Founder of the Michigan Baseball Foundation, the Great Lakes Loons (2007-present). Mr. Stavropoulos is Chairman Emeritus of the Board of Directors of The Dow Chemical Company, where he previously served in numerous senior management positions, including President, CEO (1995-2000; 2002-2004), Chairman of the Executive Committee (2000-2006), and as a member of the Board of Directors (1990-2006). Currently, Mr. Stavropoulos is Chairman of the Board of Directors of Univar Inc. (global distributor of commodity and specialty chemicals), a Director of Teradata Corporation (data warehousing and technology solutions), and Maersk Inc. (industrial conglomerate), and a member of the Advisory Board for Metalmark Capital LLC (private equity investment, 2005-present). Mr. Stavropoulos is an operating advisor to Clayton, Dubilier & Rice, LLC (private equity investment). In addition, Mr. Stavropoulos is a member of the University of Notre Dame Advisory Council for the College of Science, a Trustee of the Rollin L. Gerstacker Foundation, and a Director of the Naples Philharmonic Center for the Arts. Previously, Mr. Stavropoulos served as a Director of Chemical Financial Corporation (bank holding company, 1993-2012) and Tyco International, Ltd. (multinational manufacturing and services, 2007-2012).
David M. Thomas (1949)
Year of Election or Appointment: 2008
Trustee
Mr. Thomas also serves as Trustee of other Fidelity® funds. Mr. Thomas serves as Non-Executive Chairman of the Board of Directors of Fortune Brands Home and Security (home and security products, 2011-present), as a member of the Board of Directors (2004-present) and Presiding Director (2013-present) of Interpublic Group of Companies, Inc. (marketing communication), and as a member of the Board of Trustees of the University of Florida (2013-present). Previously, Mr. Thomas served as Executive Chairman (2005-2006) and Chairman and Chief Executive Officer (2000-2005) of IMS Health, Inc. (pharmaceutical and healthcare information solutions), and a Director of Fortune Brands, Inc. (consumer products, 2000-2011).
+ The information includes the Trustee's principal occupation during the last five years and other information relating to the experience, attributes, and skills relevant to the Trustee's qualifications to serve as a Trustee, which led to the conclusion that the Trustee should serve as a Trustee for the fund.
Advisory Board Members and Officers:
Correspondence intended for an officer or Peter S. Lynch may be sent to Fidelity Investments, 245 Summer Street, Boston, Massachusetts 02210. Officers appear below in alphabetical order.
Name, Year of Birth; Principal Occupation
Peter S. Lynch (1944)
Year of Election or Appointment: 2003
Member of the Advisory Board
Mr. Lynch also serves as Member of the Advisory Board of other Fidelity® funds. Mr. Lynch is Vice Chairman and a Director of FMR (investment adviser firm) and FMR Co., Inc. (investment adviser firm). In addition, Mr. Lynch serves as a Trustee of Boston College and as the Chairman of the Inner-City Scholarship Fund. Previously, Mr. Lynch served on the Special Olympics International Board of Directors (1997-2006).
Elizabeth Paige Baumann (1968)
Year of Election or Appointment: 2012
Anti-Money Laundering (AML) Officer
Ms. Baumann also serves as AML Officer of other funds. She is Chief AML Officer of FMR LLC (diversified financial services company, 2012-present) and is an employee of Fidelity Investments. Previously, Ms. Baumann served as Vice President and Deputy Anti-Money Laundering Officer (2007-2012).
Marc R. Bryant (1966)
Year of Election or Appointment: 2015
Secretary and Chief Legal Officer (CLO)
Mr. Bryant also serves as Secretary and CLO of other funds. Mr. Bryant serves as CLO, Secretary, and Senior Vice President of Fidelity Management & Research Company (investment adviser firm, 2015-present) and FMR Co., Inc. (investment adviser firm, 2015-present); Secretary of Fidelity SelectCo, LLC (investment adviser firm, 2015-present) and Fidelity Investments Money Management, Inc. (investment adviser firm, 2015-present); and CLO of Fidelity Management & Research (Hong Kong) Limited (investment adviser firm, 2015-present). He is Senior Vice President and Deputy General Counsel of FMR LLC (diversified financial services company). Previously, Mr. Bryant served as Secretary and CLO of Fidelity Rutland Square Trust II (2010-2014) and Assistant Secretary of Fidelity's Fixed Income and Asset Allocation Funds (2013-2015). Prior to joining Fidelity Investments, Mr. Bryant served as a Senior Vice President and the Head of Global Retail Legal for AllianceBernstein L.P. (2006-2010), and as the General Counsel for ProFund Advisors LLC (2001-2006).
William C. Coffey (1969)
Year of Election or Appointment: 2009
Assistant Secretary
Mr. Coffey also serves as Assistant Secretary of other funds. He is Senior Vice President and Deputy General Counsel of FMR LLC (diversified financial services company, 2010-present), and is an employee of Fidelity Investments. Previously, Mr. Coffey served as Vice President and Associate General Counsel of FMR LLC (2005-2009).
Jonathan Davis (1968)
Year of Election or Appointment: 2010
Assistant Treasurer
Mr. Davis also serves as Assistant Treasurer of other funds, and is an employee of Fidelity Investments. Previously, Mr. Davis served as Vice President and Associate General Counsel of FMR LLC (diversified financial services company, 2003-2010).
Adrien E. Deberghes (1967)
Year of Election or Appointment: 2008
Deputy Treasurer
Mr. Deberghes also serves as an officer of other funds. He is an employee of Fidelity Investments (2008-present). Prior to joining Fidelity Investments, Mr. Deberghes was Senior Vice President of Mutual Fund Administration at State Street Corporation (2007-2008), Senior Director of Mutual Fund Administration at Investors Bank & Trust (2005-2007), and Director of Finance for Dunkin' Brands (2000-2005).
Stephanie J. Dorsey (1969)
Year of Election or Appointment: 2010
Assistant Treasurer
Ms. Dorsey also serves as an officer of other funds. She is an employee of Fidelity Investments (2008-present) and has served in other fund officer roles. Prior to joining Fidelity Investments, Ms. Dorsey served as Treasurer (2004-2008) of the JPMorgan Mutual Funds and Vice President (2004-2008) of JPMorgan Chase Bank.
Howard J. Galligan III (1966)
Year of Election or Appointment: 2014
Chief Financial Officer
Mr. Galligan also serves as Chief Financial Officer of other funds. Mr. Galligan serves as President of Fidelity Pricing and Cash Management Services (FPCMS) (2014-present) and as a Director of Strategic Advisers, Inc. (investment adviser firm, 2008-present). Previously, Mr. Galligan served as Chief Administrative Officer of Asset Management (2011-2014) and Chief Operating Officer and Senior Vice President of Investment Support for Strategic Advisers, Inc. (2003-2011).
Scott C. Goebel (1968)
Year of Election or Appointment: 2015
Vice President
Mr. Goebel serves as Vice President of other funds and is an employee of Fidelity Investments (2001-present). Previously, Mr. Goebel served as Secretary of Fidelity SelectCo, LLC (investment adviser firm, 2013-2015), Fidelity Investments Money Management, Inc. (FIMM) (investment adviser firm, 2010-2015), and Fidelity Research and Analysis Company (FRAC) (investment adviser firm, 2010-2015); General Counsel, Secretary, and Senior Vice President of Fidelity Management & Research Company (investment adviser firm, 2008-2015) and FMR Co., Inc. (investment adviser firm, 2008-2015); Assistant Secretary of Fidelity Management & Research (Japan) Limited (investment adviser firm, 2008-2015) and FMR Investment Management (U.K.) Limited (investment adviser firm, 2008-2015); Chief Legal Officer (CLO) of Fidelity Management & Research (Hong Kong) Limited (investment adviser firm, 2008-2015); Secretary and CLO of certain Fidelity® funds (2008-2015); Assistant Secretary of FIMM (2008-2010), FRAC (2008-2010), and certain funds (2007-2008); and as Vice President and Secretary of Fidelity Distributors Corporation (FDC) (2005-2007).
Thomas C. Hense (1964)
Year of Election or Appointment: 2008, 2010, or 2015
Vice President
Mr. Hense serves as Vice President of Fidelity Advisor® Multi-Asset Income Fund (2015) and other funds (High Income (2008), Small Cap (2008), and Value (2010) funds), and is an employee of Fidelity Investments (1993-present). Previously, Mr. Hense served as a portfolio manager for Fidelity's Institutional Money Management Group (Pyramis) (2003-2008).
Brian B. Hogan (1964)
Year of Election or Appointment: 2009
Vice President
Mr. Hogan also serves as Trustee or Vice President of other funds. Mr. Hogan serves as a Director of Fidelity SelectCo, LLC (investment adviser firm, 2014-present) and President of the Equity Division of FMR (investment adviser firm, 2009-present). Previously, Mr. Hogan served as Senior Vice President, Equity Research of FMR (2006-2009) and as a portfolio manager.
Chris Maher (1972)
Year of Election or Appointment: 2013
Assistant Treasurer
Mr. Maher serves as Assistant Treasurer of other funds. Mr. Maher is Vice President of Valuation Oversight and is an employee of Fidelity Investments. Previously, Mr. Maher served as Vice President of Asset Management Compliance (2013), Vice President of the Program Management Group of FMR (investment adviser firm, 2010-2013), and Vice President of Valuation Oversight (2008-2010).
Kenneth B. Robins (1969)
Year of Election or Appointment: 2008
President and Treasurer
Mr. Robins also serves as an officer of other funds. Mr. Robins serves as Executive Vice President of Fidelity Investments Money Management, Inc. (FIMM) (investment adviser firm, 2013-present) and is an employee of Fidelity Investments (2004-present). Previously, Mr. Robins served in other fund officer roles.
Stacie M. Smith (1974)
Year of Election or Appointment: 2013
Deputy Treasurer
Ms. Smith also serves as an officer of other funds. She is an employee of Fidelity Investments (2009-present) and has served in other fund officer roles. Prior to joining Fidelity Investments, Ms. Smith served as Senior Audit Manager of Ernst & Young LLP (1996-2009).
Renee Stagnone (1975)
Year of Election or Appointment: 2013
Deputy Treasurer
Ms. Stagnone also serves as Deputy Treasurer of other funds. Ms. Stagnone is an employee of Fidelity Investments (1997-present).
Linda J. Wondrack (1964)
Year of Election or Appointment: 2014
Chief Compliance Officer
Ms. Wondrack also serves as Chief Compliance Officer of other funds. Ms. Wondrack is Executive Vice President and head of the Ethics Office and Asset Management Compliance for Fidelity Investments (2012-present). Ms. Wondrack also serves as Chief Compliance Officer of Fidelity SelectCo, LLC (investment adviser firm, 2014-present); Chief Compliance Officer of Impresa Management LLC (2013-present); and Chief Compliance Officer of FMR Co., Inc. (investment adviser firm), Fidelity Investments Money Management, Inc. (investment adviser firm), Fidelity Management & Research (Japan) Limited (investment adviser firm), FMR Investment Management (U.K.) Limited (investment adviser firm), Fidelity Management & Research (Hong Kong) (investment adviser firm), Fidelity Management & Research Company (investment adviser firm), FIAM LLC (investment adviser firm), and Strategic Advisers, Inc. (investment adviser firm), Ballyrock Investment Advisors LLC, and Northern Neck Investors LLC (2012-present). Previously, Ms. Wondrack served as Senior Vice President and Chief Compliance Officer for Columbia Management Investment Advisers, LLC (2005-2012); Chief Compliance Officer for certain funds within the Columbia Family of Funds (2007-2012); and Senior Vice President of Compliance Risk Management at Bank of America (2005-2010).
Joseph F. Zambello (1957)
Year of Election or Appointment: 2011
Deputy Treasurer
Mr. Zambello also serves as Deputy Treasurer of other funds. Mr. Zambello is an employee of Fidelity Investments (1991-present). Previously, Mr. Zambello served as Vice President of the Program Management Group of FMR (investment adviser firm, 2009-2011) and Vice President of the Transfer Agent Oversight Group (2005-2009).
Shareholder Expense Example
As a shareholder of the Fund, you incur two types of costs: (1) transaction costs, including sales charges (loads) on purchase payments or redemption proceeds, and (2) ongoing costs, including management fees, distribution and/or service (12b-1) fees and other Fund expenses. This Example is intended to help you understand your ongoing costs (in dollars) of investing in the Fund and to compare these costs with the ongoing costs of investing in other mutual funds.
The Example is based on an investment of $1,000 invested at the beginning of the period and held for the entire period (June 1, 2015 to November 30, 2015).
Actual Expenses
The first line of the accompanying table for each class of the Fund provides information about actual account values and actual expenses. You may use the information in this line, together with the amount you invested, to estimate the expenses that you paid over the period. Simply divide your account value by $1,000.00 (for example, an $8,600 account value divided by $1,000.00 = 8.6), then multiply the result by the number in the first line for a class of the Fund under the heading entitled "Expenses Paid During Period" to estimate the expenses you paid on your account during this period. In addition, the Fund, as a shareholder in the underlying Fidelity Central Funds, will indirectly bear its pro-rata share of the fees and expenses incurred by the underlying Fidelity Central Funds. These fees and expenses are not included in the Fund's annualized expense ratio used to calculate the expense estimate in the table below.
Hypothetical Example for Comparison Purposes
The second line of the accompanying table for each class of the Fund provides information about hypothetical account values and hypothetical expenses based on a Class' actual expense ratio and an assumed rate of return of 5% per year before expenses, which is not the Class' actual return. The hypothetical account values and expenses may not be used to estimate the actual ending account balance or expenses you paid for the period. You may use this information to compare the ongoing costs of investing in the Fund and other funds. To do so, compare this 5% hypothetical example with the 5% hypothetical examples that appear in the shareholder reports of the other funds. In addition, the Fund, as a shareholder in the underlying Fidelity Central Funds, will indirectly bear its pro-rata share of the fees and expenses incurred by the underlying Fidelity Central Funds. These fees and expenses are not included in the Fund's annualized expense ratio used to calculate the expense estimate in the table below.
Please note that the expenses shown in the table are meant to highlight your ongoing costs only and do not reflect any transaction costs. Therefore, the second line of the table is useful in comparing ongoing costs only, and will not help you determine the relative total costs of owning different funds. In addition, if these transactional costs were included, your costs would have been higher.
| Annualized Expense Ratio-A | Beginning Account Value June 1, 2015 | Ending Account Value November 30, 2015 | Expenses Paid During Period-B June 1, 2015 to November 30, 2015 | |
| Class A | 1.22% | |||
| Actual | $1,000.00 | $958.40 | $5.99 | |
| Hypothetical-C | $1,000.00 | $1,018.95 | $6.17 | |
| Class T | 1.50% | |||
| Actual | $1,000.00 | $956.50 | $7.36 | |
| Hypothetical-C | $1,000.00 | $1,017.55 | $7.59 | |
| Class B | 2.00% | |||
| Actual | $1,000.00 | $955.00 | $9.80 | |
| Hypothetical-C | $1,000.00 | $1,015.04 | $10.10 | |
| Class C | 2.00% | |||
| Actual | $1,000.00 | $954.40 | $9.80 | |
| Hypothetical-C | $1,000.00 | $1,015.04 | $10.10 | |
| Class I | .91% | |||
| Actual | $1,000.00 | $959.60 | $4.47 | |
| Hypothetical-C | $1,000.00 | $1,020.51 | $4.61 |
A Annualized expense ratio reflects expenses net of applicable fee waivers.
B Expenses are equal to each Class' annualized expense ratio, multiplied by the average account value over the period, multiplied by 183/365 (to reflect the one-half year period).
C 5% return per year before expenses
Distributions (Unaudited)
The Board of Trustees of Fidelity Advisor Equity Value Fund voted to pay to shareholders of record at the opening of business on record date, the following distributions per share derived from capital gains realized from sales of portfolio securities, and dividends derived from net investment income:
| Pay Date | Record Date | Dividends | Capital Gains | ||
| Class A | 12/14/15 | 12/11/15 | $0.231 | $0.140 | |
| Class T | 12/14/15 | 12/11/15 | $0.184 | $0.140 | |
| Class B | 12/14/15 | 12/11/15 | $0.051 | $0.140 | |
| Class C | 12/14/15 | 12/11/15 | $0.123 | $0.140 | |
The fund hereby designates as a capital gain dividend with respect to the taxable year ended November 30, 2015, $1,943,993, or, if subsequently determined to be different, the net capital gain of such year.
Class A designates 100% and 65%; Class T designates 100% and 65%; Class B designates 100% and 65%; and Class C designates 100% and 65%; of the dividends distributed during the fiscal year as qualifying for the dividends–received deduction for corporate shareholders.
Class A, Class T, Class B, and Class C designates 100% of the dividends distributed during the fiscal year as amounts which may be taken into account as a dividend for purposes of the maximum rate under section 1(h)(11) of the Internal Revenue Code.
The fund will notify shareholders in January 2016 of amounts for use in preparing 2015 income tax returns.
Board Approval of Investment Advisory Contracts and Management Fees
Fidelity Advisor Equity Value Fund
Each year, the Board of Trustees, including the Independent Trustees (together, the Board), votes on the renewal of the management contract with Fidelity Management & Research Company (FMR) and the sub-advisory agreements (together, the Advisory Contracts) for the fund. The Board, assisted by the advice of fund counsel and Independent Trustees' counsel, requests and considers a broad range of information relevant to the renewal of the Advisory Contracts throughout the year.
The Board meets regularly and, at each of its meetings, covers an extensive agenda of topics and materials and considers factors that are relevant to its annual consideration of the renewal of the fund's Advisory Contracts, including the services and support provided to the fund and its shareholders. The Board has established various standing committees (Committees), each composed of and chaired by Independent Trustees with varying backgrounds, to which the Board has assigned specific subject matter responsibilities in order to enhance effective decision-making by the Board. The Board, acting directly and through its Committees, requests and receives information concerning the annual consideration of the renewal of the fund's Advisory Contracts. The Board also meets as needed to consider matters specifically related to the Board's annual consideration of the renewal of the Advisory Contracts. Members of the Board may also meet with trustees of other Fidelity funds through ad hoc joint committees to discuss certain matters relevant to all of the Fidelity funds.
At its July 2015 meeting, the Board unanimously determined to renew the fund's Advisory Contracts. In reaching its determination, the Board considered all factors it believed relevant, including (i) the nature, extent, and quality of the services to be provided to the fund and its shareholders (including the investment performance of the fund); (ii) the competitiveness of the fund's management fee and total expense ratio relative to peer funds; (iii) the total costs of the services to be provided by and the profits to be realized by Fidelity from its relationship with the fund; and (iv) the extent to which (if any) economies of scale exist and would be realized as the fund grows, and whether any economies of scale are appropriately shared with fund shareholders.
In considering whether to renew the Advisory Contracts for the fund, the Board reached a determination, with the assistance of fund counsel and Independent Trustees' counsel and through the exercise of its business judgment, that the renewal of the Advisory Contracts was in the best interests of the fund and its shareholders and that the compensation payable under the Advisory Contracts was fair and reasonable. The Board's decision to renew the Advisory Contracts was not based on any single factor, but rather was based on a comprehensive consideration of all the information provided to the Board at its meetings throughout the year. The Board, in reaching its determination to renew the Advisory Contracts, was aware that shareholders of the fund have a broad range of investment choices available to them, including a wide choice among funds offered by Fidelity's competitors, and that the fund's shareholders, who have the opportunity to review and weigh the disclosure provided by the fund in its prospectus and other public disclosures, have chosen to invest in this fund, which is part of the Fidelity family of funds.
Nature, Extent, and Quality of Services Provided. The Board considered Fidelity's staffing as it relates to the fund, including the backgrounds of investment personnel of Fidelity, and also considered the fund's investment objective, strategies, and related investment philosophy. The Independent Trustees also had discussions with senior management of Fidelity's investment operations and investment groups. The Board considered the structure of the portfolio manager compensation program and whether this structure provides appropriate incentives to act in the best interests of the fund. Additionally, the Board considered the portfolio managers' investments, if any, in the funds that they manage.Resources Dedicated to Investment Management and Support Services. The Board and the Fund Oversight and Research Committees reviewed the general qualifications and capabilities of Fidelity's investment staff, including its size, education, experience, and resources, as well as Fidelity's approach to recruiting, training, managing, and compensating investment personnel. The Board noted that Fidelity has continued to increase the resources devoted to non-U.S. offices, including expansion of Fidelity's global investment organization. The Board also noted that Fidelity's analysts have extensive resources, tools and capabilities that allow them to conduct sophisticated quantitative and fundamental analysis, as well as credit analysis of issuers, counterparties and guarantors. Further, the Board considered that Fidelity's investment professionals have sufficient access to global information and data so as to provide competitive investment results over time, and that those professionals also have access to sophisticated tools that permit them to assess portfolio construction and risk and performance attribution characteristics continuously, as well as to transmit new information and research conclusions rapidly around the world. Additionally, in its deliberations, the Board considered Fidelity's trading, risk management, and compliance capabilities and resources, which are integral parts of the investment management process.Shareholder and Administrative Services. The Board considered (i) the nature, extent, quality, and cost of advisory, administrative, and shareholder services performed by FMR, the sub-advisers (together with FMR, the Investment Advisers), and their affiliates under the Advisory Contracts and under separate agreements covering transfer agency, pricing and bookkeeping, and securities lending services for the fund; (ii) the nature and extent of the supervision of third party service providers, principally custodians and subcustodians; and (iii) the resources devoted to, and the record of compliance with, the fund's compliance policies and procedures. The Board also reviewed the allocation of fund brokerage, including allocations to brokers affiliated with the Investment Advisers, the use of brokerage commissions to pay fund expenses, and the use of "soft" commission dollars to pay for research services.The Board noted that the growth of fund assets over time across the complex allows Fidelity to reinvest in the development of services designed to enhance the value or convenience of the Fidelity funds as investment vehicles. These services include 24-hour access to account information and market information through telephone representatives and over the Internet, investor education materials and asset allocation tools, and the expanded availability of Fidelity Investor Centers.In 2014, the Board formed an ad hoc Committee on Transfer Agency Fees to review the variety of transfer agency fee structures throughout the industry and Fidelity's competitive positioning with respect to industry participants.Investment in a Large Fund Family. The Board considered the benefits to shareholders of investing in a Fidelity fund, including the benefits of investing in a fund that is part of a large family of funds offering a variety of investment disciplines and providing a large variety of mutual fund investor services. The Board noted that Fidelity had taken, or had made recommendations that resulted in the Fidelity funds taking, a number of actions over the previous year that benefited particular funds, including (i) continuing to dedicate additional resources to investment research and to the support of the senior management team that oversees asset management; (ii) continuing efforts to enhance Fidelity's global research capabilities; (iii) launching new funds and making other enhancements to meet client needs; (iv) reducing management fees and total expenses for certain index funds and diversified international funds; (v) continuing to launch dedicated lower cost underlying funds to meet portfolio construction needs related to expanding underlying fund options for Fidelity funds of funds, specifically for the Freedom Fund product lines; (vi) rationalizing product lines and gaining increased efficiencies through fund mergers; (vii) launching active fixed-income exchange-traded funds; (viii) continuing to develop, acquire and implement systems and technology to improve services to the funds and information security and to increase efficiency; (ix) implementing investment enhancements to further strengthen Fidelity's target date product line to increase investors' probability of success in achieving their goals; (x) modifying the eligibility criteria for certain share classes to accommodate roll-over assets from employer-sponsored retirement plans; (xi) launching a new Class W of the Freedom Index Funds to attract and retain Fidelity record-kept retirement plan assets; and (xii) implementing changes to Fidelity's money market product line in response to recent money market regulatory reforms.Investment Performance. The Board considered whether the fund has operated in accordance with its investment objective, as well as its record of compliance with its investment restrictions and its performance history.The Board took into account discussions with representatives of the Investment Advisers about fund investment performance that occur at Board meetings throughout the year. In this regard the Board noted that as part of regularly scheduled fund reviews and other reports to the Board on fund performance, the Board considers annualized return information for the fund, for different time periods, measured against a securities market index ("benchmark index") and a peer group of funds with similar objectives ("peer group"), if any. In its evaluation of fund investment performance, the Board gave particular attention to information indicating changes in performance of certain Fidelity funds for specific time periods and discussed with the Investment Advisers the reasons for any overperformance or underperformance.In addition to reviewing absolute and relative fund performance, the Independent Trustees periodically consider the appropriateness of fund performance metrics in evaluating the results achieved. In general, the Independent Trustees believe that fund performance should be evaluated based on net performance (after fees and expenses) of both the highest performing and lowest performing fund share classes, where applicable, compared to appropriate benchmark indices, over appropriate time periods that may include full market cycles, and compared to peer groups, as applicable, over the same periods, taking into account relevant factors including the following: general market conditions; issuer-specific information; and fund cash flows and other factors.The Independent Trustees recognize that shareholders evaluate performance on a net basis over their own holding periods, for which one-, three-, and five-year periods are often used as a proxy. For this reason, the performance information reviewed by the Board also included net cumulative calendar year total return information for the fund and an appropriate benchmark index and peer group for the most recent one-, three-, and five-year periods, as shown below. Returns are shown compared to the 25th percentile (top of box, 75% beaten) and 75th percentile (bottom of box, 25% beaten) of the peer universe.Fidelity Advisor Equity Value Fund
Fidelity Advisor Equity Value Fund
![]()
AEV-ANN-0116
1.767075.114
Fidelity Advisor® Equity Income Fund Class A, Class T, Class B and Class C Annual Report November 30, 2015 |
|
Contents
Board Approval of Investment Advisory Contracts and Management Fees |
To view a fund's proxy voting guidelines and proxy voting record for the 12-month period ended June 30, visit http://www.fidelity.com/proxyvotingresults or visit the Securities and Exchange Commission's (SEC) web site at http://www.sec.gov.
You may also call 1-877-208-0098 to request a free copy of the proxy voting guidelines.
Standard & Poor's, S&P and S&P 500 are registered service marks of The McGraw-Hill Companies, Inc. and have been licensed for use by Fidelity Distributors Corporation.
Other third-party marks appearing herein are the property of their respective owners.
All other marks appearing herein are registered or unregistered trademarks or service marks of FMR LLC or an affiliated company. © 2016 FMR LLC. All rights reserved.
This report and the financial statements contained herein are submitted for the general information of the shareholders of the Fund. This report is not authorized for distribution to prospective investors in the Fund unless preceded or accompanied by an effective prospectus.
A fund files its complete schedule of portfolio holdings with the SEC for the first and third quarters of each fiscal year on Form N-Q. Forms N-Q are available on the SEC’s web site at http://www.sec.gov. A fund's Forms N-Q may be reviewed and copied at the SEC’s Public Reference Room in Washington, DC. Information regarding the operation of the SEC's Public Reference Room may be obtained by calling 1-800-SEC-0330.
For a complete list of a fund's portfolio holdings, view the most recent holdings listing, semiannual report, or annual report on Fidelity's web site at http://www.fidelity.com, http://www.advisor.fidelity.com, or http://www.401k.com, as applicable.
NOT FDIC INSURED •MAY LOSE VALUE •NO BANK GUARANTEE
Neither the Fund nor Fidelity Distributors Corporation is a bank.
Performance: The Bottom Line
Average annual total return reflects the change in the value of an investment, assuming reinvestment of distributions from dividend income and capital gains (the profits earned upon the sale of securities that have grown in value, if any) and assuming a constant rate of performance each year.
The hypothetical investment and the average annual total returns do not reflect the deduction of taxes that a shareholder would pay on fund distributions or the redemption of fund shares.
During periods of reimbursement by Fidelity, a fund’s total return will be greater than it would be had the reimbursement not occurred.
How a fund did yesterday is no guarantee of how it will do tomorrow.
Returns reflect the conversion of Class B shares to Class A shares after a maximum of seven years.
Average Annual Total Returns
| For the periods ended November 30, 2015 | Past 1 year | Past 5 years | Past 10 years |
| Class A (incl. 5.75% sales charge) | (9.16)% | 10.08% | 4.18% |
| Class T (incl. 3.50% sales charge) | (7.19)% | 10.37% | 4.21% |
| Class B (incl. contingent deferred sales charge) | (8.95)% | 10.22% | 4.22% |
| Class C (incl. contingent deferred sales charge) | (5.24)% | 10.54% | 4.01% |
Class B shares' contingent deferred sales charges included in the past one year, past five years and past ten years total return figures are 5%, 2% and 0%, respectively.
Class C shares' contingent deferred sales charges included in the past one year, past five years and past ten years total return figures are 1%, 0% and 0%, respectively.
$10,000 Over 10 Years
Let's say hypothetically that $10,000 was invested in Fidelity Advisor® Equity Income Fund - Class A on November 30, 2005, and the current 5.75% sales charge was paid.
The chart shows how the value of your investment would have changed, and also shows how the Russell 3000® Value Index performed over the same period.
| Period Ending Values | ||
| $15,064 | Fidelity Advisor® Equity Income Fund - Class A | |
| $18,627 | Russell 3000® Value Index | |
Management's Discussion of Fund Performance
Market Recap: U.S. stocks gained modestly for the 12 months ending November 30, 2015, despite a steep decline in August and September on concern about slowing economic growth in China. The S&P 500® index rebounded in October and gained 2.75% for the year. Stocks benefited late in the period amid waning expectations for a near-term interest-rate hike by the U.S. Federal Reserve, more economic stimulus in Europe and an interest-rate cut in China. Growth stocks in the benchmark far outpaced their value counterparts, as investors continued to seek growth in a subpar economic environment. Sector performance varied widely, with more than 26 percentage points separating the leader from the laggard. Consumer discretionary (+14%) secured the top spot, benefiting from a combination of rising personal income and still-benign inflation. Information technology (+7%) and health care (+4%) also outpaced the broad market. Conversely, the energy sector (-12%) performed worst, stymied by depressed commodity prices that also hit materials (-5%). Telecommunication services (-5%) and utilities (-4%), considered defensive sectors less sensitive to the economy, also lost ground. At period end, investors remained focused on the potential global implications of a stronger U.S. dollar and how China’s transition toward a consumption-led economy may affect corporate earnings.Comments from Portfolio Manager James Morrow: For the year, fund’s share classes (excluding sales charges, if applicable) struggled to low-single-digit declines, significantly trailing the -1.01% return of the benchmark Russell 3000® Value Index. The fund was hurt most by poor stock picking in the energy and materials sectors, especially master limited partnership Williams Partners and its majority-owner, energy transportation company Williams Companies. Both of these non-benchmark entities were hard hit by upheaval in the energy business. CONSOL Energy, a producer of coal and natural gas, also detracted. Despite the multiple challenges we saw in energy, the fund benefited from largely avoiding Exxon Mobil and not owning ConocoPhillips, two integrated energy firms whose risk/reward trade-off struck me as less attractive than others. In contrast, JPMorgan Chase, among the fund’s largest holdings and a notable overweighting, contributed meaningfully. I saw JPMorgan as a relatively inexpensive stock in an increasingly expensive market. The fund also was helped by a position in Chubb, a provider of property and casualty insurance. During the period, insurance company ACE Limited agreed to acquire Chubb for a significant premium. Although I did not anticipate this event, I’m not surprised that a buyer emerged for a company I, too, found to be a very well-priced company.The views expressed above reflect those of the portfolio manager(s) only through the end of the period as stated on the cover of this report and do not necessarily represent the views of Fidelity or any other person in the Fidelity organization. Any such views are subject to change at any time based upon market or other conditions and Fidelity disclaims any responsibility to update such views. These views may not be relied on as investment advice and, because investment decisions for a Fidelity fund are based on numerous factors, may not be relied on as an indication of trading intent on behalf of any Fidelity fund.
Investment Summary (Unaudited)
Top Ten Stocks as of November 30, 2015
| % of fund's net assets | % of fund's net assets 6 months ago | |
| Johnson & Johnson | 5.4 | 4.3 |
| General Electric Co.(a) | 3.9 | 3.8 |
| Chevron Corp. | 3.7 | 2.8 |
| JPMorgan Chase & Co. | 3.3 | 4.5 |
| Procter & Gamble Co. | 3.1 | 2.4 |
| United Parcel Service, Inc. Class B(a) | 2.5 | 2.1 |
| AT&T, Inc. | 2.0 | 1.3 |
| Cisco Systems, Inc. | 1.9 | 2.0 |
| MetLife, Inc. | 1.8 | 1.5 |
| Verizon Communications, Inc. | 1.8 | 1.7 |
| 29.4 |
(a) Security or a portion of the security is pledged as collateral for call options written.
Top Five Market Sectors as of November 30, 2015
| % of fund's net assets | % of fund's net assets 6 months ago | |
| Financials | 24.8 | 27.4 |
| Industrials | 11.8 | 11.8 |
| Information Technology | 11.6 | 12.5 |
| Health Care | 10.4 | 9.9 |
| Energy | 9.8 | 10.2 |
Asset Allocation (% of fund's net assets)
| As of November 30, 2015*,** | ||
| Stocks | 94.7% | |
| Bonds | 0.1% | |
| Convertible Securities | 0.6% | |
| Other Investments | 0.1% | |
| Short-Term Investments and Net Other Assets (Liabilities) | 4.5% | |

* Written options - (0.1)%
** Foreign investments - 9.1%
| As of May 31, 2015*,** | ||
| Stocks | 93.8% | |
| Bonds | 0.2% | |
| Convertible Securities | 1.5% | |
| Other Investments | 0.1% | |
| Short-Term Investments and Net Other Assets (Liabilities) | 4.4% | |

* Written options - 0.0%
** Foreign investments - 10.4%
Investments November 30, 2015
Showing Percentage of Net Assets
| Common Stocks - 94.5% | |||
| Shares | Value (000s) | ||
| CONSUMER DISCRETIONARY - 7.7% | |||
| Automobiles - 1.1% | |||
| General Motors Co. | 620,600 | $22,466 | |
| Hotels, Restaurants & Leisure - 1.3% | |||
| Compass Group PLC | 13,500 | 235 | |
| Dunkin' Brands Group, Inc. (a) | 119,400 | 5,065 | |
| McDonald's Corp. (b) | 131,417 | 15,003 | |
| Whitbread PLC | 15,604 | 1,069 | |
| Yum! Brands, Inc. (b) | 90,721 | 6,578 | |
| 27,950 | |||
| Household Durables - 0.6% | |||
| M.D.C. Holdings, Inc. | 185,600 | 4,868 | |
| Tupperware Brands Corp. | 149,800 | 8,504 | |
| 13,372 | |||
| Leisure Products - 0.9% | |||
| Mattel, Inc. (a) | 422,600 | 10,506 | |
| New Academy Holding Co. LLC unit (c)(d)(e) | 52,800 | 7,983 | |
| 18,489 | |||
| Media - 1.6% | |||
| Comcast Corp. Class A | 487,374 | 29,662 | |
| Time Warner, Inc. | 60,800 | 4,255 | |
| 33,917 | |||
| Multiline Retail - 1.6% | |||
| Kohl's Corp. | 97,648 | 4,602 | |
| Macy's, Inc. | 185,100 | 7,234 | |
| Target Corp. | 316,955 | 22,979 | |
| 34,815 | |||
| Specialty Retail - 0.6% | |||
| Foot Locker, Inc. | 97,100 | 6,312 | |
| GNC Holdings, Inc. | 167,000 | 4,978 | |
| Stage Stores, Inc. (a) | 284,361 | 2,201 | |
| 13,491 | |||
| TOTAL CONSUMER DISCRETIONARY | 164,500 | ||
| CONSUMER STAPLES - 8.8% | |||
| Beverages - 1.7% | |||
| Anheuser-Busch InBev SA NV ADR | 53,000 | 6,808 | |
| Molson Coors Brewing Co. Class B (b) | 93,505 | 8,605 | |
| The Coca-Cola Co. | 480,200 | 20,466 | |
| 35,879 | |||
| Food & Staples Retailing - 2.7% | |||
| CVS Health Corp. | 324,000 | 30,485 | |
| Tesco PLC | 677,700 | 1,705 | |
| Wal-Mart Stores, Inc. | 251,850 | 14,819 | |
| Walgreens Boots Alliance, Inc. | 98,744 | 8,297 | |
| Whole Foods Market, Inc. | 91,200 | 2,658 | |
| 57,964 | |||
| Food Products - 1.1% | |||
| B&G Foods, Inc. Class A | 136,354 | 5,151 | |
| Sanderson Farms, Inc. (a) | 35,200 | 2,633 | |
| The Hershey Co. (b) | 196,900 | 16,994 | |
| 24,778 | |||
| Household Products - 3.1% | |||
| Procter & Gamble Co. | 888,617 | 66,504 | |
| Personal Products - 0.2% | |||
| Avon Products, Inc. (a) | 1,151,900 | 3,974 | |
| TOTAL CONSUMER STAPLES | 189,099 | ||
| ENERGY - 9.6% | |||
| Energy Equipment & Services - 0.4% | |||
| Ensco PLC Class A | 243,224 | 4,164 | |
| National Oilwell Varco, Inc. | 73,949 | 2,761 | |
| Oceaneering International, Inc. | 63,100 | 2,760 | |
| 9,685 | |||
| Oil, Gas & Consumable Fuels - 9.2% | |||
| Anadarko Petroleum Corp. | 100,545 | 6,023 | |
| Apache Corp. | 258,227 | 12,700 | |
| Avance Gas Holding Ltd. (a) | 179,455 | 2,437 | |
| BW LPG Ltd. | 350,634 | 3,026 | |
| Cameco Corp. | 123,900 | 1,514 | |
| Chevron Corp. | 875,869 | 79,984 | |
| CONSOL Energy, Inc. (a) | 320,375 | 2,525 | |
| Foresight Energy LP (a) | 257,600 | 1,108 | |
| Golar LNG Ltd. | 68,300 | 1,868 | |
| Imperial Oil Ltd. | 48,000 | 1,559 | |
| Kinder Morgan, Inc. | 359,300 | 8,469 | |
| Legacy Reserves LP | 505,299 | 1,577 | |
| Markwest Energy Partners LP | 235,991 | 11,328 | |
| Noble Energy, Inc. | 138,200 | 5,068 | |
| Suncor Energy, Inc. | 795,700 | 21,986 | |
| The Williams Companies, Inc. | 555,950 | 20,326 | |
| Williams Partners LP | 547,815 | 15,021 | |
| 196,519 | |||
| TOTAL ENERGY | 206,204 | ||
| FINANCIALS - 24.6% | |||
| Banks - 11.4% | |||
| Bank of America Corp. | 1,549,400 | 27,006 | |
| BB&T Corp. | 26,700 | 1,031 | |
| Comerica, Inc. | 232,180 | 10,762 | |
| First Niagara Financial Group, Inc. | 724,200 | 7,807 | |
| FirstMerit Corp. | 348,340 | 7,047 | |
| JPMorgan Chase & Co. | 1,055,557 | 70,385 | |
| KeyCorp | 533,000 | 6,988 | |
| Lloyds Banking Group PLC | 1,703,700 | 1,871 | |
| M&T Bank Corp. | 245,517 | 30,771 | |
| Regions Financial Corp. | 1,332,300 | 13,510 | |
| Standard Chartered PLC: | |||
| rights 12/10/15 (d) | 116,110 | 159 | |
| (United Kingdom) | 406,386 | 3,410 | |
| SunTrust Banks, Inc. | 373,100 | 16,200 | |
| U.S. Bancorp | 452,700 | 19,869 | |
| Wells Fargo & Co. (b) | 486,550 | 26,809 | |
| 243,625 | |||
| Capital Markets - 5.5% | |||
| Apollo Global Management LLC Class A | 35,500 | 580 | |
| Apollo Investment Corp. (a) | 790,757 | 5,021 | |
| Ares Capital Corp. | 375,042 | 5,933 | |
| Ares Management LP | 170,880 | 2,404 | |
| KKR & Co. LP | 1,844,596 | 31,192 | |
| Morgan Stanley | 231,342 | 7,935 | |
| PJT Partners, Inc. (d) | 27,955 | 655 | |
| State Street Corp. | 356,899 | 25,904 | |
| The Blackstone Group LP | 1,141,703 | 35,655 | |
| TPG Specialty Lending, Inc. | 143,100 | 2,463 | |
| 117,742 | |||
| Consumer Finance - 0.4% | |||
| Synchrony Financial (d) | 251,257 | 7,998 | |
| Insurance - 4.8% | |||
| ACE Ltd. | 105,911 | 12,164 | |
| MetLife, Inc. | 769,857 | 39,332 | |
| Prudential Financial, Inc. | 169,198 | 14,644 | |
| The Chubb Corp. | 213,667 | 27,890 | |
| The Travelers Companies, Inc. | 81,649 | 9,355 | |
| 103,385 | |||
| Real Estate Investment Trusts - 2.3% | |||
| American Capital Agency Corp. | 213,080 | 3,825 | |
| American Tower Corp. | 11,800 | 1,173 | |
| Annaly Capital Management, Inc. | 402,294 | 3,854 | |
| Care Capital Properties, Inc. | 15,273 | 483 | |
| Coresite Realty Corp. | 31,220 | 1,829 | |
| Cousins Properties, Inc. | 356,400 | 3,503 | |
| Crown Castle International Corp. | 77,900 | 6,692 | |
| Duke Realty LP | 294,600 | 5,995 | |
| First Potomac Realty Trust | 452,777 | 5,261 | |
| Piedmont Office Realty Trust, Inc. Class A | 249,935 | 4,871 | |
| Public Storage | 10,600 | 2,545 | |
| Retail Properties America, Inc. | 165,897 | 2,538 | |
| Sabra Health Care REIT, Inc. | 70,700 | 1,462 | |
| Two Harbors Investment Corp. | 301,541 | 2,563 | |
| Ventas, Inc. | 61,094 | 3,259 | |
| 49,853 | |||
| Thrifts & Mortgage Finance - 0.2% | |||
| Radian Group, Inc. | 239,290 | 3,410 | |
| TOTAL FINANCIALS | 526,013 | ||
| HEALTH CARE - 10.3% | |||
| Biotechnology - 1.0% | |||
| AbbVie, Inc. | 119,100 | 6,926 | |
| Amgen, Inc. | 57,949 | 9,336 | |
| Gilead Sciences, Inc. | 50,400 | 5,340 | |
| 21,602 | |||
| Health Care Equipment & Supplies - 1.7% | |||
| DENTSPLY International, Inc. | 81,300 | 4,932 | |
| Medtronic PLC (b) | 369,982 | 27,874 | |
| St. Jude Medical, Inc. | 66,462 | 4,194 | |
| 37,000 | |||
| Health Care Providers & Services - 0.0% | |||
| Anthem, Inc. | 44 | 6 | |
| Pharmaceuticals - 7.6% | |||
| GlaxoSmithKline PLC | 914,000 | 18,575 | |
| Johnson & Johnson | 1,137,318 | 115,136 | |
| Merck & Co., Inc. | 100,700 | 5,338 | |
| Pfizer, Inc. | 240,513 | 7,882 | |
| Sanofi SA | 73,234 | 6,509 | |
| Teva Pharmaceutical Industries Ltd. sponsored ADR | 135,700 | 8,540 | |
| 161,980 | |||
| TOTAL HEALTH CARE | 220,588 | ||
| INDUSTRIALS - 11.8% | |||
| Aerospace & Defense - 2.8% | |||
| General Dynamics Corp. | 52,200 | 7,645 | |
| Raytheon Co. | 71,000 | 8,806 | |
| The Boeing Co. (b) | 124,200 | 18,065 | |
| United Technologies Corp. | 262,907 | 25,252 | |
| 59,768 | |||
| Air Freight & Logistics - 3.0% | |||
| C.H. Robinson Worldwide, Inc. | 80,979 | 5,460 | |
| PostNL NV (d) | 1,871,900 | 6,256 | |
| United Parcel Service, Inc. Class B (b) | 518,790 | 53,441 | |
| 65,157 | |||
| Airlines - 0.2% | |||
| Copa Holdings SA Class A | 82,000 | 4,235 | |
| Commercial Services & Supplies - 0.5% | |||
| KAR Auction Services, Inc. | 215,104 | 8,159 | |
| Republic Services, Inc. | 60,089 | 2,640 | |
| 10,799 | |||
| Electrical Equipment - 1.3% | |||
| Eaton Corp. PLC | 203,500 | 11,836 | |
| Emerson Electric Co. | 299,370 | 14,969 | |
| 26,805 | |||
| Industrial Conglomerates - 3.9% | |||
| General Electric Co. (b) | 2,769,054 | 82,905 | |
| Machinery - 0.1% | |||
| Cummins, Inc. | 26,100 | 2,620 | |
| Professional Services - 0.0% | |||
| Acacia Research Corp. (a) | 153,060 | 905 | |
| TOTAL INDUSTRIALS | 253,194 | ||
| INFORMATION TECHNOLOGY - 11.4% | |||
| Communications Equipment - 2.9% | |||
| Cisco Systems, Inc. | 1,473,353 | 40,149 | |
| QUALCOMM, Inc. | 468,889 | 22,877 | |
| 63,026 | |||
| Electronic Equipment & Components - 0.5% | |||
| Hitachi Ltd. | 536,000 | 3,164 | |
| TE Connectivity Ltd. | 98,930 | 6,637 | |
| 9,801 | |||
| Internet Software & Services - 0.4% | |||
| Yahoo!, Inc. (d) | 278,200 | 9,406 | |
| IT Services - 2.9% | |||
| First Data Corp. | 779,769 | 11,790 | |
| First Data Corp. Class A (d) | 24,000 | 403 | |
| IBM Corp. | 218,423 | 30,453 | |
| Paychex, Inc. (b) | 367,878 | 19,957 | |
| 62,603 | |||
| Semiconductors & Semiconductor Equipment - 1.4% | |||
| Applied Materials, Inc. | 951,877 | 17,867 | |
| Maxim Integrated Products, Inc. | 288,600 | 11,189 | |
| 29,056 | |||
| Software - 0.8% | |||
| Microsoft Corp. (b) | 321,338 | 17,465 | |
| Technology Hardware, Storage & Peripherals - 2.5% | |||
| Apple, Inc. | 187,700 | 22,205 | |
| EMC Corp. | 1,069,300 | 27,096 | |
| Seagate Technology LLC | 103,600 | 3,723 | |
| 53,024 | |||
| TOTAL INFORMATION TECHNOLOGY | 244,381 | ||
| MATERIALS - 1.4% | |||
| Chemicals - 0.6% | |||
| LyondellBasell Industries NV Class A | 60,200 | 5,768 | |
| Potash Corp. of Saskatchewan, Inc. | 291,100 | 5,892 | |
| Syngenta AG sponsored ADR | 4,500 | 333 | |
| Tronox Ltd. Class A | 174,965 | 1,018 | |
| 13,011 | |||
| Containers & Packaging - 0.5% | |||
| Packaging Corp. of America | 89,600 | 6,092 | |
| WestRock Co. | 99,000 | 5,012 | |
| 11,104 | |||
| Metals & Mining - 0.3% | |||
| Freeport-McMoRan, Inc. | 202,514 | 1,657 | |
| Nucor Corp. | 103,100 | 4,273 | |
| 5,930 | |||
| TOTAL MATERIALS | 30,045 | ||
| TELECOMMUNICATION SERVICES - 4.0% | |||
| Diversified Telecommunication Services - 3.9% | |||
| AT&T, Inc. | 1,250,127 | 42,092 | |
| TDC A/S | 226,900 | 1,192 | |
| Verizon Communications, Inc. | 851,590 | 38,705 | |
| 81,989 | |||
| Wireless Telecommunication Services - 0.1% | |||
| KDDI Corp. | 94,900 | 2,354 | |
| TOTAL TELECOMMUNICATION SERVICES | 84,343 | ||
| UTILITIES - 4.9% | |||
| Electric Utilities - 4.7% | |||
| American Electric Power Co., Inc. | 210,515 | 11,791 | |
| Entergy Corp. | 118,500 | 7,896 | |
| Exelon Corp. | 1,108,700 | 30,279 | |
| NextEra Energy, Inc. | 18,986 | 1,896 | |
| PPL Corp. | 658,000 | 22,398 | |
| Southern Co. | 501,525 | 22,338 | |
| Xcel Energy, Inc. | 100,900 | 3,598 | |
| 100,196 | |||
| Multi-Utilities - 0.2% | |||
| CenterPoint Energy, Inc. | 299,400 | 5,075 | |
| TOTAL UTILITIES | 105,271 | ||
| TOTAL COMMON STOCKS | |||
| (Cost $1,902,926) | 2,023,638 | ||
| Preferred Stocks - 0.4% | |||
| Convertible Preferred Stocks - 0.2% | |||
| HEALTH CARE - 0.1% | |||
| Health Care Providers & Services - 0.1% | |||
| AmSurg Corp. Series A-1, 5.25% | 5,900 | 938 | |
| Pharmaceuticals - 0.0% | |||
| Allergan PLC 5.50% | 880 | 922 | |
| TOTAL HEALTH CARE | 1,860 | ||
| TELECOMMUNICATION SERVICES - 0.0% | |||
| Wireless Telecommunication Services - 0.0% | |||
| T-Mobile U.S., Inc. Series A 5.50% | 14,600 | 902 | |
| UTILITIES - 0.1% | |||
| Independent Power and Renewable Electricity Producers - 0.0% | |||
| Dynegy, Inc. 5.375% | 11,400 | 705 | |
| Multi-Utilities - 0.1% | |||
| CenterPoint Energy, Inc. 2.00% ZENS (d) | 12,700 | 752 | |
| TOTAL UTILITIES | 1,457 | ||
| TOTAL CONVERTIBLE PREFERRED STOCKS | 4,219 | ||
| Nonconvertible Preferred Stocks - 0.2% | |||
| CONSUMER DISCRETIONARY - 0.1% | |||
| Automobiles - 0.1% | |||
| Volkswagen AG | 16,608 | 2,302 | |
| FINANCIALS - 0.1% | |||
| Consumer Finance - 0.1% | |||
| Ally Financial, Inc. 7.00% (f) | 2,265 | 2,281 | |
| TOTAL NONCONVERTIBLE PREFERRED STOCKS | 4,583 | ||
| TOTAL PREFERRED STOCKS | |||
| (Cost $9,164) | 8,802 | ||
| Principal Amount (000s)(g) | Value (000s) | ||
| Corporate Bonds - 0.5% | |||
| Convertible Bonds - 0.4% | |||
| CONSUMER DISCRETIONARY - 0.0% | |||
| Household Durables - 0.0% | |||
| Jarden Corp. 1.875% 9/15/18 | 460 | 709 | |
| ENERGY - 0.2% | |||
| Oil, Gas & Consumable Fuels - 0.2% | |||
| Amyris, Inc. 3% 2/27/17 | 516 | 469 | |
| Scorpio Tankers, Inc. 2.375% 7/1/19 (f) | 2,860 | 2,812 | |
| Whiting Petroleum Corp. 1.25% 4/1/20 (f) | 840 | 739 | |
| 4,020 | |||
| INFORMATION TECHNOLOGY - 0.2% | |||
| Communications Equipment - 0.1% | |||
| InterDigital, Inc. 1.5% 3/1/20 (f) | 1,800 | 1,789 | |
| Semiconductors & Semiconductor Equipment - 0.1% | |||
| GT Advanced Technologies, Inc.: | |||
| 3% 10/1/17 (h) | 1,510 | 14 | |
| 3% 12/15/20 (h) | 2,160 | 20 | |
| Micron Technology, Inc. 3.125% 5/1/32 | 450 | 784 | |
| NXP Semiconductors NV 1% 12/1/19 (f) | 910 | 1,051 | |
| 1,869 | |||
| TOTAL INFORMATION TECHNOLOGY | 3,658 | ||
| TOTAL CONVERTIBLE BONDS | 8,387 | ||
| Nonconvertible Bonds - 0.1% | |||
| CONSUMER DISCRETIONARY - 0.1% | |||
| Media - 0.1% | |||
| Altice SA 7.625% 2/15/25 (f) | 1,240 | 1,085 | |
| CONSUMER STAPLES - 0.0% | |||
| Tobacco - 0.0% | |||
| Vector Group Ltd. 7.75% 2/15/21 | 905 | 962 | |
| MATERIALS - 0.0% | |||
| Metals & Mining - 0.0% | |||
| Walter Energy, Inc. 8.5% 4/15/21 (h) | 2,030 | 5 | |
| TOTAL NONCONVERTIBLE BONDS | 2,052 | ||
| TOTAL CORPORATE BONDS | |||
| (Cost $16,967) | 10,439 | ||
| Preferred Securities - 0.1% | |||
| FINANCIALS - 0.1% | |||
| Diversified Financial Services - 0.1% | |||
| Baggot Securities Ltd. 10.24%(f)(i) | |||
| (Cost $1,520) | EUR | 990 | 1,137 |
| Shares | Value (000s) | ||
| Money Market Funds - 5.4% | |||
| Fidelity Cash Central Fund, 0.18% (j) | 92,725,145 | 92,725 | |
| Fidelity Securities Lending Cash Central Fund, 0.22% (j)(k) | 23,547,494 | 23,547 | |
| TOTAL MONEY MARKET FUNDS | |||
| (Cost $116,272) | 116,272 | ||
| TOTAL INVESTMENT PORTFOLIO - 100.9% | |||
| (Cost $2,046,849) | 2,160,288 | ||
| NET OTHER ASSETS (LIABILITIES) - (0.9)% | (19,886) | ||
| NET ASSETS - 100% | $2,140,402 |
| Written Options | ||||
| Expiration Date/Exercise Price | Number of Contracts | Premium (000s) | Value (000s) | |
| Call Options | ||||
| General Electric Co. | 1/15/16 - $31.00 | 9,926 | $303 | $(253) |
| McDonald's Corp. | 1/15/16 - $115.00 | 458 | 83 | (109) |
| Medtronic PLC | 1/15/16 - $77.50 | 1,215 | 229 | (117) |
| Microsoft Corp. | 12/18/15 - $55.00 | 1,366 | 123 | (92) |
| Molson Coors Brewing Co. Class B | 1/15/16 - $100.00 | 305 | 36 | (15) |
| Paychex, Inc. | 12/18/15 - $50.00 | 1,853 | 152 | (788) |
| The Boeing Co. | 1/15/16 - $150.00 | 409 | 157 | (74) |
| The Hershey Co. | 2/19/16 - $90.00 | 646 | 82 | (111) |
| United Parcel Service, Inc. Class B | 1/15/16 - $105.00 | 1,710 | 313 | (255) |
| Wells Fargo & Co. | 1/15/16 - $57.50 | 1,622 | 111 | (74) |
| Yum! Brands, Inc. | 1/15/16 - $75.00 | 293 | 51 | (71) |
| TOTAL WRITTEN OPTIONS | $1,640 | $(1,959) |
Currency Abbreviations
EUR – European Monetary Unit
Legend
(a) Security or a portion of the security is on loan at period end.
(b) Security or a portion of the security is pledged as collateral for call options written. At period end, the value of securities pledged amounted to $104,585,000.
(c) Restricted securities - Investment in securities not registered under the Securities Act of 1933 (excluding 144A issues). At the end of the period, the value of restricted securities (excluding 144A issues) amounted to $7,983,000 or 0.4% of net assets.
(d) Non-income producing
(e) Investment is owned by an entity that is treated as a U.S. Corporation for tax purposes in which the Fund holds a percentage ownership.
(f) Security exempt from registration under Rule 144A of the Securities Act of 1933. These securities may be resold in transactions exempt from registration, normally to qualified institutional buyers. At the end of the period, the value of these securities amounted to $10,894,000 or 0.5% of net assets.
(g) Amount is stated in United States dollars unless otherwise noted.
(h) Non-income producing - Security is in default.
(i) Security is perpetual in nature with no stated maturity date.
(j) Affiliated fund that is generally available only to investment companies and other accounts managed by Fidelity Investments. The rate quoted is the annualized seven-day yield of the fund at period end. A complete unaudited listing of the fund's holdings as of its most recent quarter end is available upon request. In addition, each Fidelity Central Fund's financial statements, which are not covered by the Fund's Report of Independent Registered Public Accounting Firm, are available on the SEC's website or upon request.
(k) Investment made with cash collateral received from securities on loan.
Additional information on each restricted holding is as follows:
| Security | Acquisition Date | Acquisition Cost (000s) |
| New Academy Holding Co. LLC unit | 8/1/11 | $5,565 |
Affiliated Central Funds
Information regarding fiscal year to date income earned by the Fund from investments in Fidelity Central Funds is as follows:
| Fund | Income earned |
| (Amounts in thousands) | |
| Fidelity Cash Central Fund | $126 |
| Fidelity Securities Lending Cash Central Fund | 180 |
| Total | $306 |
Investment Valuation
The following is a summary of the inputs used, as of November 30, 2015, involving the Fund's assets and liabilities carried at fair value. The inputs or methodology used for valuing securities may not be an indication of the risk associated with investing in those securities. For more information on valuation inputs, and their aggregation into the levels used below, please refer to the Investment Valuation section in the accompanying Notes to Financial Statements.
| Valuation Inputs at Reporting Date: | ||||
| Description | Total | Level 1 | Level 2 | Level 3 |
| (Amounts in thousands) | ||||
| Investments in Securities: | ||||
| Equities: | ||||
| Consumer Discretionary | $166,802 | $156,282 | $2,537 | $7,983 |
| Consumer Staples | 189,099 | 187,394 | 1,705 | -- |
| Energy | 206,204 | 206,204 | -- | -- |
| Financials | 528,294 | 524,142 | 4,152 | -- |
| Health Care | 222,448 | 196,426 | 26,022 | -- |
| Industrials | 253,194 | 253,194 | -- | -- |
| Information Technology | 244,381 | 232,591 | 11,790 | -- |
| Materials | 30,045 | 30,045 | -- | -- |
| Telecommunication Services | 85,245 | 82,891 | 2,354 | -- |
| Utilities | 106,728 | 105,976 | 752 | -- |
| Corporate Bonds | 10,439 | -- | 10,439 | -- |
| Preferred Securities | 1,137 | -- | 1,137 | -- |
| Money Market Funds | 116,272 | 116,272 | -- | -- |
| Total Investments in Securities: | $2,160,288 | $2,091,417 | $60,888 | $7,983 |
| Derivative Instruments: | ||||
| Liabilities | ||||
| Written Options | $(1,959) | $(1,959) | $-- | $-- |
| Total Liabilities | $(1,959) | $(1,959) | $-- | $-- |
| Total Derivative Instruments: | $(1,959) | $(1,959) | $-- | $-- |
Value of Derivative Instruments
The following table is a summary of the Fund's value of derivative instruments by primary risk exposure as of November 30, 2015. For additional information on derivative instruments, please refer to the Derivative Instruments section in the accompanying Notes to Financial Statements.
| Primary Risk Exposure / Derivative Type | Value | |
| (Amounts in thousands) | Asset | Liability |
| Equity Risk | ||
| Written Options(a) | $0 | $(1,959) |
| Total Equity Risk | $0 | $(1,959) |
| Total Value of Derivatives | $0 | $(1,959) |
(a) Gross value is presented in the Statement of Assets and Liabilities in the written options, at value line-item.
See accompanying notes which are an integral part of the financial statements.
Financial Statements
Statement of Assets and Liabilities
| Amounts in thousands (except per-share amounts) | November 30, 2015 | |
| Assets | ||
| Investment in securities, at value (including securities loaned of $23,187) — See accompanying schedule: Unaffiliated issuers (cost $1,930,577) | $2,044,016 | |
| Fidelity Central Funds (cost $116,272) | 116,272 | |
| Total Investments (cost $2,046,849) | $2,160,288 | |
| Receivable for investments sold | 3,887 | |
| Receivable for fund shares sold | 674 | |
| Dividends receivable | 7,838 | |
| Interest receivable | 85 | |
| Distributions receivable from Fidelity Central Funds | 33 | |
| Prepaid expenses | 6 | |
| Other receivables | 106 | |
| Total assets | 2,172,917 | |
| Liabilities | ||
| Payable to custodian bank | $6 | |
| Payable for investments purchased | 90 | |
| Payable for fund shares redeemed | 4,887 | |
| Accrued management fee | 808 | |
| Distribution and service plan fees payable | 652 | |
| Written options, at value (premium received $1,640) | 1,959 | |
| Other affiliated payables | 416 | |
| Other payables and accrued expenses | 150 | |
| Collateral on securities loaned, at value | 23,547 | |
| Total liabilities | 32,515 | |
| Net Assets | $2,140,402 | |
| Net Assets consist of: | ||
| Paid in capital | $1,867,306 | |
| Undistributed net investment income | 16,088 | |
| Accumulated undistributed net realized gain (loss) on investments and foreign currency transactions | 143,904 | |
| Net unrealized appreciation (depreciation) on investments and assets and liabilities in foreign currencies | 113,104 | |
| Net Assets | $2,140,402 | |
| Calculation of Maximum Offering Price | ||
| Class A: | ||
| Net Asset Value and redemption price per share ($687,822 ÷ 22,116.10 shares) | $31.10 | |
| Maximum offering price per share (100/94.25 of $31.10) | $33.00 | |
| Class T: | ||
| Net Asset Value and redemption price per share ($812,999 ÷ 25,697.37 shares) | $31.64 | |
| Maximum offering price per share (100/96.50 of $31.64) | $32.79 | |
| Class B: | ||
| Net Asset Value and offering price per share ($10,079 ÷ 321.57 shares)(a) | $31.34 | |
| Class C: | ||
| Net Asset Value and offering price per share ($187,196 ÷ 5,992.07 shares)(a) | $31.24 | |
| Class I: | ||
| Net Asset Value, offering price and redemption price per share ($428,052 ÷ 13,288.20 shares) | $32.21 | |
| Class Z: | ||
| Net Asset Value, offering price and redemption price per share ($14,254 ÷ 442.57 shares) | $32.21 |
(a) Redemption price per share is equal to net asset value less any applicable contingent deferred sales charge.
See accompanying notes which are an integral part of the financial statements.
Statement of Operations
| Amounts in thousands | Year ended November 30, 2015 | |
| Investment Income | ||
| Dividends | $86,344 | |
| Interest | 1,590 | |
| Income from Fidelity Central Funds | 306 | |
| Total income | 88,240 | |
| Expenses | ||
| Management fee | $10,432 | |
| Transfer agent fees | 4,662 | |
| Distribution and service plan fees | 8,483 | |
| Accounting and security lending fees | 702 | |
| Custodian fees and expenses | 58 | |
| Independent trustees' compensation | 10 | |
| Registration fees | 104 | |
| Audit | 70 | |
| Legal | 10 | |
| Miscellaneous | 28 | |
| Total expenses before reductions | 24,559 | |
| Expense reductions | (179) | 24,380 |
| Net investment income (loss) | 63,860 | |
| Realized and Unrealized Gain (Loss) | ||
| Net realized gain (loss) on: | ||
| Investment securities: | ||
| Unaffiliated issuers | 149,314 | |
| Foreign currency transactions | (35) | |
| Written options | 5,913 | |
| Total net realized gain (loss) | 155,192 | |
| Change in net unrealized appreciation (depreciation) on: Investment securities | (305,822) | |
| Assets and liabilities in foreign currencies | 16 | |
| Written options | 303 | |
| Total change in net unrealized appreciation (depreciation) | (305,503) | |
| Net gain (loss) | (150,311) | |
| Net increase (decrease) in net assets resulting from operations | $(86,451) |
See accompanying notes which are an integral part of the financial statements.
Statement of Changes in Net Assets
| Amounts in thousands | Year ended November 30, 2015 | Year ended November 30, 2014 |
| Increase (Decrease) in Net Assets | ||
| Operations | ||
| Net investment income (loss) | $63,860 | $60,679 |
| Net realized gain (loss) | 155,192 | 202,288 |
| Change in net unrealized appreciation (depreciation) | (305,503) | 813 |
| Net increase (decrease) in net assets resulting from operations | (86,451) | 263,780 |
| Distributions to shareholders from net investment income | (66,216) | (45,196) |
| Distributions to shareholders from net realized gain | (81,483) | (2,749) |
| Total distributions | (147,699) | (47,945) |
| Share transactions - net increase (decrease) | (126,756) | (180,981) |
| Total increase (decrease) in net assets | (360,906) | 34,854 |
| Net Assets | ||
| Beginning of period | 2,501,308 | 2,466,454 |
| End of period (including undistributed net investment income of $16,088 and undistributed net investment income of $22,526, respectively) | $2,140,402 | $2,501,308 |
See accompanying notes which are an integral part of the financial statements.
Financial Highlights — Fidelity Advisor Equity Income Fund Class A
| November 30, | |||||
| Years ended November 30, | 2015 | 2014 | 2013 | 2012 | 2011 |
| Selected Per–Share Data | |||||
| Net asset value, beginning of period | $34.44 | $31.60 | $25.55 | $22.18 | $21.07 |
| Income from Investment Operations | |||||
| Net investment income (loss)A | .92 | .84B | .60 | .61 | .42 |
| Net realized and unrealized gain (loss) | (2.15) | 2.67 | 6.06 | 3.32 | 1.11 |
| Total from investment operations | (1.23) | 3.51 | 6.66 | 3.93 | 1.53 |
| Distributions from net investment income | (.98) | (.64) | (.58) | (.56) | (.42) |
| Distributions from net realized gain | (1.14) | (.04) | (.03) | – | – |
| Total distributions | (2.11)C | (.67)D | (.61) | (.56) | (.42) |
| Net asset value, end of period | $31.10 | $34.44 | $31.60 | $25.55 | $22.18 |
| Total ReturnE,F | (3.61)% | 11.28% | 26.43% | 17.90% | 7.25% |
| Ratios to Average Net AssetsG,H | |||||
| Expenses before reductions | .95% | .96% | .98% | 1.02% | 1.03% |
| Expenses net of fee waivers, if any | .95% | .96% | .98% | 1.02% | 1.03% |
| Expenses net of all reductions | .94% | .95% | .97% | 1.01% | 1.02% |
| Net investment income (loss) | 2.85% | 2.55%B | 2.07% | 2.52% | 1.82% |
| Supplemental Data | |||||
| Net assets, end of period (in millions) | $688 | $794 | $777 | $646 | $634 |
| Portfolio turnover rateI | 53% | 33% | 34% | 49% | 89% |
A Calculated based on average shares outstanding during the period.
B Investment income per share reflects a large, non-recurring dividend which amounted to $.11 per share. Excluding this non-recurring dividend, the ratio of net investment income (loss) to average net assets would have been 2.21%.
C Total distributions of $2.11 per share is comprised of distributions from net investment income of $.975 and distributions from net realized gain of $1.136 per share.
D Total distributions of $.67 per share is comprised of distributions from net investment income of $.636 and distributions from net realized gain of $.038 per share.
E Total returns would have been lower if certain expenses had not been reduced during the applicable periods shown.
F Total returns do not include the effect of the sales charges.
G Fees and expenses of any underlying Fidelity Central Funds are not included in the Fund's expense ratio. The Fund indirectly bears its proportionate share of the expenses of any underlying Fidelity Central Funds.
H Expense ratios reflect operating expenses of the class. Expenses before reductions do not reflect amounts reimbursed by the investment adviser or reductions from brokerage service arrangements or reductions from other expense offset arrangements and do not represent the amount paid by the class during periods when reimbursements or reductions occur. Expenses net of fee waivers reflect expenses after reimbursement by the investment adviser but prior to reductions from brokerage service arrangements or other expense offset arrangements. Expenses net of all reductions represent the net expenses paid by the class.
I Amount does not include the portfolio activity of any underlying Fidelity Central Funds.
See accompanying notes which are an integral part of the financial statements.
Financial Highlights — Fidelity Advisor Equity Income Fund Class T
| November 30, | |||||
| Years ended November 30, | 2015 | 2014 | 2013 | 2012 | 2011 |
| Selected Per–Share Data | |||||
| Net asset value, beginning of period | $34.99 | $32.09 | $25.94 | $22.50 | $21.37 |
| Income from Investment Operations | |||||
| Net investment income (loss)A | .86 | .78B | .55 | .57 | .38 |
| Net realized and unrealized gain (loss) | (2.18) | 2.72 | 6.15 | 3.37 | 1.13 |
| Total from investment operations | (1.32) | 3.50 | 6.70 | 3.94 | 1.51 |
| Distributions from net investment income | (.89) | (.56) | (.52) | (.50) | (.38) |
| Distributions from net realized gain | (1.14) | (.04) | (.03) | – | – |
| Total distributions | (2.03) | (.60) | (.55) | (.50) | (.38) |
| Net asset value, end of period | $31.64 | $34.99 | $32.09 | $25.94 | $22.50 |
| Total ReturnC,D | (3.83)% | 11.04% | 26.14% | 17.70% | 7.02% |
| Ratios to Average Net AssetsE,F | |||||
| Expenses before reductions | 1.18% | 1.18% | 1.19% | 1.21% | 1.22% |
| Expenses net of fee waivers, if any | 1.18% | 1.18% | 1.19% | 1.21% | 1.22% |
| Expenses net of all reductions | 1.17% | 1.18% | 1.18% | 1.21% | 1.21% |
| Net investment income (loss) | 2.62% | 2.33%B | 1.86% | 2.32% | 1.63% |
| Supplemental Data | |||||
| Net assets, end of period (in millions) | $813 | $974 | $984 | $854 | $862 |
| Portfolio turnover rateG | 53% | 33% | 34% | 49% | 89% |
A Calculated based on average shares outstanding during the period.
B Investment income per share reflects a large, non-recurring dividend which amounted to $.11 per share. Excluding this non-recurring dividend, the ratio of net investment income (loss) to average net assets would have been 1.98%.
C Total returns would have been lower if certain expenses had not been reduced during the applicable periods shown.
D Total returns do not include the effect of the sales charges.
E Fees and expenses of any underlying Fidelity Central Funds are not included in the Fund's expense ratio. The Fund indirectly bears its proportionate share of the expenses of any underlying Fidelity Central Funds.
F Expense ratios reflect operating expenses of the class. Expenses before reductions do not reflect amounts reimbursed by the investment adviser or reductions from brokerage service arrangements or reductions from other expense offset arrangements and do not represent the amount paid by the class during periods when reimbursements or reductions occur. Expenses net of fee waivers reflect expenses after reimbursement by the investment adviser but prior to reductions from brokerage service arrangements or other expense offset arrangements. Expenses net of all reductions represent the net expenses paid by the class.
G Amount does not include the portfolio activity of any underlying Fidelity Central Funds.
See accompanying notes which are an integral part of the financial statements.
Financial Highlights — Fidelity Advisor Equity Income Fund Class B
| November 30, | |||||
| Years ended November 30, | 2015 | 2014 | 2013 | 2012 | 2011 |
| Selected Per–Share Data | |||||
| Net asset value, beginning of period | $34.65 | $31.79 | $25.69 | $22.29 | $21.16 |
| Income from Investment Operations | |||||
| Net investment income (loss)A | .66 | .57B | .36 | .42 | .24 |
| Net realized and unrealized gain (loss) | (2.17) | 2.69 | 6.10 | 3.34 | 1.12 |
| Total from investment operations | (1.51) | 3.26 | 6.46 | 3.76 | 1.36 |
| Distributions from net investment income | (.67) | (.37) | (.33) | (.36) | (.23) |
| Distributions from net realized gain | (1.14) | (.04) | (.03) | – | – |
| Total distributions | (1.80)C | (.40)D | (.36) | (.36) | (.23) |
| Net asset value, end of period | $31.34 | $34.65 | $31.79 | $25.69 | $22.29 |
| Total ReturnE,F | (4.43)% | 10.37% | 25.39% | 16.97% | 6.43% |
| Ratios to Average Net AssetsG,H | |||||
| Expenses before reductions | 1.79% | 1.79% | 1.80% | 1.80% | 1.81% |
| Expenses net of fee waivers, if any | 1.79% | 1.79% | 1.80% | 1.80% | 1.81% |
| Expenses net of all reductions | 1.79% | 1.79% | 1.79% | 1.80% | 1.80% |
| Net investment income (loss) | 2.01% | 1.71%B | 1.26% | 1.73% | 1.04% |
| Supplemental Data | |||||
| Net assets, end of period (in millions) | $10 | $19 | $27 | $31 | $42 |
| Portfolio turnover rateI | 53% | 33% | 34% | 49% | 89% |
A Calculated based on average shares outstanding during the period.
B Investment income per share reflects a large, non-recurring dividend which amounted to $.11 per share. Excluding this non-recurring dividend, the ratio of net investment income (loss) to average net assets would have been 1.37%.
C Total distributions of $1.80 per share is comprised of distributions from net investment income of $.665 and distributions from net realized gain of $1.136 per share.
D Total distributions of $.40 per share is comprised of distributions from net investment income of $.366 and distributions from net realized gain of $.038 per share.
E Total returns would have been lower if certain expenses had not been reduced during the applicable periods shown.
F Total returns do not include the effect of the contingent deferred sales charge.
G Fees and expenses of any underlying Fidelity Central Funds are not included in the Fund's expense ratio. The Fund indirectly bears its proportionate share of the expenses of any underlying Fidelity Central Funds.
H Expense ratios reflect operating expenses of the class. Expenses before reductions do not reflect amounts reimbursed by the investment adviser or reductions from brokerage service arrangements or reductions from other expense offset arrangements and do not represent the amount paid by the class during periods when reimbursements or reductions occur. Expenses net of fee waivers reflect expenses after reimbursement by the investment adviser but prior to reductions from brokerage service arrangements or other expense offset arrangements. Expenses net of all reductions represent the net expenses paid by the class.
I Amount does not include the portfolio activity of any underlying Fidelity Central Funds.
See accompanying notes which are an integral part of the financial statements.
Financial Highlights — Fidelity Advisor Equity Income Fund Class C
| November 30, | |||||
| Years ended November 30, | 2015 | 2014 | 2013 | 2012 | 2011 |
| Selected Per–Share Data | |||||
| Net asset value, beginning of period | $34.57 | $31.73 | $25.66 | $22.27 | $21.16 |
| Income from Investment Operations | |||||
| Net investment income (loss)A | .68 | .59B | .38 | .43 | .25 |
| Net realized and unrealized gain (loss) | (2.15) | 2.69 | 6.09 | 3.33 | 1.11 |
| Total from investment operations | (1.47) | 3.28 | 6.47 | 3.76 | 1.36 |
| Distributions from net investment income | (.72) | (.40) | (.37) | (.37) | (.25) |
| Distributions from net realized gain | (1.14) | (.04) | (.03) | – | – |
| Total distributions | (1.86) | (.44) | (.40) | (.37) | (.25) |
| Net asset value, end of period | $31.24 | $34.57 | $31.73 | $25.66 | $22.27 |
| Total ReturnC,D | (4.34)% | 10.44% | 25.46% | 17.03% | 6.40% |
| Ratios to Average Net AssetsE,F | |||||
| Expenses before reductions | 1.72% | 1.72% | 1.74% | 1.77% | 1.78% |
| Expenses net of fee waivers, if any | 1.71% | 1.72% | 1.74% | 1.77% | 1.78% |
| Expenses net of all reductions | 1.71% | 1.71% | 1.73% | 1.77% | 1.77% |
| Net investment income (loss) | 2.09% | 1.79%B | 1.32% | 1.76% | 1.06% |
| Supplemental Data | |||||
| Net assets, end of period (in millions) | $187 | $214 | $195 | $143 | $134 |
| Portfolio turnover rateG | 53% | 33% | 34% | 49% | 89% |
A Calculated based on average shares outstanding during the period.
B Investment income per share reflects a large, non-recurring dividend which amounted to $.11 per share. Excluding this non-recurring dividend, the ratio of net investment income (loss) to average net assets would have been 1.45%.
C Total returns would have been lower if certain expenses had not been reduced during the applicable periods shown.
D Total returns do not include the effect of the contingent deferred sales charge.
E Fees and expenses of any underlying Fidelity Central Funds are not included in the Fund's expense ratio. The Fund indirectly bears its proportionate share of the expenses of any underlying Fidelity Central Funds.
F Expense ratios reflect operating expenses of the class. Expenses before reductions do not reflect amounts reimbursed by the investment adviser or reductions from brokerage service arrangements or reductions from other expense offset arrangements and do not represent the amount paid by the class during periods when reimbursements or reductions occur. Expenses net of fee waivers reflect expenses after reimbursement by the investment adviser but prior to reductions from brokerage service arrangements or other expense offset arrangements. Expenses net of all reductions represent the net expenses paid by the class.
G Amount does not include the portfolio activity of any underlying Fidelity Central Funds.
See accompanying notes which are an integral part of the financial statements.
Financial Highlights — Fidelity Advisor Equity Income Fund Class I
| November 30, | |||||
| Years ended November 30, | 2015 | 2014 | 2013 | 2012 | 2011 |
| Selected Per–Share Data | |||||
| Net asset value, beginning of period | $35.59 | $32.62 | $26.36 | $22.86 | $21.70 |
| Income from Investment Operations | |||||
| Net investment income (loss)A | 1.04 | .95B | .70 | .70 | .50 |
| Net realized and unrealized gain (loss) | (2.23) | 2.77 | 6.24 | 3.43 | 1.14 |
| Total from investment operations | (1.19) | 3.72 | 6.94 | 4.13 | 1.64 |
| Distributions from net investment income | (1.06) | (.72) | (.65) | (.63) | (.48) |
| Distributions from net realized gain | (1.14) | (.04) | (.03) | – | – |
| Total distributions | (2.19)C | (.75)D | (.68) | (.63) | (.48) |
| Net asset value, end of period | $32.21 | $35.59 | $32.62 | $26.36 | $22.86 |
| Total ReturnE | (3.37)% | 11.59% | 26.72% | 18.27% | 7.55% |
| Ratios to Average Net AssetsF,G | |||||
| Expenses before reductions | .69% | .70% | .72% | .73% | .74% |
| Expenses net of fee waivers, if any | .69% | .70% | .72% | .73% | .74% |
| Expenses net of all reductions | .69% | .70% | .71% | .73% | .73% |
| Net investment income (loss) | 3.11% | 2.81%B | 2.34% | 2.80% | 2.10% |
| Supplemental Data | |||||
| Net assets, end of period (in millions) | $428 | $496 | $483 | $445 | $360 |
| Portfolio turnover rateH | 53% | 33% | 34% | 49% | 89% |
A Calculated based on average shares outstanding during the period.
B Investment income per share reflects a large, non-recurring dividend which amounted to $.12 per share. Excluding this non-recurring dividend, the ratio of net investment income (loss) to average net assets would have been 2.46%.
C Total distributions of $2.19 per share is comprised of distributions from net investment income of $1.058 and distributions from net realized gain of $1.136 per share.
D Total distributions of $.75 per share is comprised of distributions from net investment income of $.716 and distributions from net realized gain of $.038 per share.
E Total returns would have been lower if certain expenses had not been reduced during the applicable periods shown.
F Fees and expenses of any underlying Fidelity Central Funds are not included in the Fund's expense ratio. The Fund indirectly bears its proportionate share of the expenses of any underlying Fidelity Central Funds.
G Expense ratios reflect operating expenses of the class. Expenses before reductions do not reflect amounts reimbursed by the investment adviser or reductions from brokerage service arrangements or reductions from other expense offset arrangements and do not represent the amount paid by the class during periods when reimbursements or reductions occur. Expenses net of fee waivers reflect expenses after reimbursement by the investment adviser but prior to reductions from brokerage service arrangements or other expense offset arrangements. Expenses net of all reductions represent the net expenses paid by the class.
H Amount does not include the portfolio activity of any underlying Fidelity Central Funds.
See accompanying notes which are an integral part of the financial statements.
Financial Highlights — Fidelity Advisor Equity Income Fund Class Z
| November 30, | |||
| Years ended November 30, | 2015 | 2014 | 2013 A |
| Selected Per–Share Data | |||
| Net asset value, beginning of period | $35.59 | $32.63 | $31.44 |
| Income from Investment Operations | |||
| Net investment income (loss)B | 1.08 | 1.03C | .23 |
| Net realized and unrealized gain (loss) | (2.21) | 2.74 | 1.12 |
| Total from investment operations | (1.13) | 3.77 | 1.35 |
| Distributions from net investment income | (1.11) | (.78) | (.16) |
| Distributions from net realized gain | (1.14) | (.04) | – |
| Total distributions | (2.25) | (.81)D | (.16) |
| Net asset value, end of period | $32.21 | $35.59 | $32.63 |
| Total ReturnE,F | (3.20)% | 11.75% | 4.30% |
| Ratios to Average Net AssetsG,H | |||
| Expenses before reductions | .54% | .54% | .54%I |
| Expenses net of fee waivers, if any | .54% | .54% | .54%I |
| Expenses net of all reductions | .53% | .54% | .54%I |
| Net investment income (loss) | 3.26% | 2.97%C | 2.37%I |
| Supplemental Data | |||
| Net assets, end of period (000s omitted) | $14,254 | $4,060 | $104 |
| Portfolio turnover rateJ | 53% | 33% | 34% |
A For the period August 13, 2013 (commencement of sale of shares) to November 30, 2013.
B Calculated based on average shares outstanding during the period.
C Investment income per share reflects a large, non-recurring dividend which amounted to $.12 per share. Excluding this non-recurring dividend, the ratio of net investment income (loss) to average net assets would have been 2.62%.
D Total distributions of $.81 per share is comprised of distributions from net investment income of $.775 and distributions from net realized gain of $.038 per share.
E Total returns for periods of less than one year are not annualized.
F Total returns would have been lower if certain expenses had not been reduced during the applicable periods shown.
G Fees and expenses of any underlying Fidelity Central Funds are not included in the Fund's expense ratio. The Fund indirectly bears its proportionate share of the expenses of any underlying Fidelity Central Funds.
H Expense ratios reflect operating expenses of the class. Expenses before reductions do not reflect amounts reimbursed by the investment adviser or reductions from brokerage service arrangements or reductions from other expense offset arrangements and do not represent the amount paid by the class during periods when reimbursements or reductions occur. Expense ratios before reductions for start-up periods may not be representative of longer-term operating periods. Expenses net of fee waivers reflect expenses after reimbursement by the investment adviser but prior to reductions from brokerage service arrangements or other expense offset arrangements. Expenses net of all reductions represent the net expenses paid by the class.
I Annualized
J Amount does not include the portfolio activity of any underlying Fidelity Central Funds.
See accompanying notes which are an integral part of the financial statements.
Notes to Financial Statements
For the period ended November 30, 2015
(Amounts in thousands except percentages)
1. Organization.
Fidelity Advisor Equity Income Fund (the Fund) is a fund of Fidelity Advisor Series I (the Trust) and is authorized to issue an unlimited number of shares. The Trust is registered under the Investment Company Act of 1940, as amended (the 1940 Act), as an open-end management investment company organized as a Massachusetts business trust. The Fund offers Class A, Class T, Class C, Class I (formerly Institutional Class) and Class Z shares, each of which, along with Class B shares, has equal rights as to assets and voting privileges. Class B shares are closed to new accounts and additional purchases, except for exchanges and reinvestments. Each class has exclusive voting rights with respect to matters that affect that class. Class B shares will automatically convert to Class A shares after a holding period of seven years from the initial date of purchase.
2. Investments in Fidelity Central Funds.
The Fund invests in Fidelity Central Funds, which are open-end investment companies generally available only to other investment companies and accounts managed by the investment adviser and its affiliates. The Fund's Schedule of Investments lists each of the Fidelity Central Funds held as of period end, if any, as an investment of the Fund, but does not include the underlying holdings of each Fidelity Central Fund. As an Investing Fund, the Fund indirectly bears its proportionate share of the expenses of the underlying Fidelity Central Funds.
The Money Market Central Funds seek preservation of capital and current income and are managed by Fidelity Investments Money Management, Inc. (FIMM), an affiliate of the investment adviser. Annualized expenses of the Money Market Central Funds as of their most recent shareholder report date are less than .005%.
A complete unaudited list of holdings for each Fidelity Central Fund is available upon request or at the Securities and Exchange Commission (the SEC) website at www.sec.gov. In addition, the financial statements of the Fidelity Central Funds, which are not covered by the Fund's Report of Independent Registered Public Accounting Firm, are available on the SEC website or upon request.
3. Significant Accounting Policies.
The financial statements have been prepared in conformity with accounting principles generally accepted in the United States of America (GAAP), which require management to make certain estimates and assumptions at the date of the financial statements. Actual results could differ from those estimates. Subsequent events, if any, through the date that the financial statements were issued have been evaluated in the preparation of the financial statements. The following summarizes the significant accounting policies of the Fund:
Investment Valuation. Investments are valued as of 4:00 p.m. Eastern time on the last calendar day of the period. The Board of Trustees (the Board) has delegated the day to day responsibility for the valuation of the Fund's investments to the Fidelity Management & Research Company (FMR) Fair Value Committee (the Committee). In accordance with valuation policies and procedures approved by the Board, the Fund attempts to obtain prices from one or more third party pricing vendors or brokers to value its investments. When current market prices, quotations or currency exchange rates are not readily available or reliable, investments will be fair valued in good faith by the Committee, in accordance with procedures adopted by the Board. Factors used in determining fair value vary by investment type and may include market or investment specific events, changes in interest rates and credit quality. The frequency with which these procedures are used cannot be predicted and they may be utilized to a significant extent. The Committee oversees the Fund's valuation policies and procedures and reports to the Board on the Committee's activities and fair value determinations. The Board monitors the appropriateness of the procedures used in valuing the Fund's investments and ratifies the fair value determinations of the Committee.
The Fund categorizes the inputs to valuation techniques used to value its investments into a disclosure hierarchy consisting of three levels as shown below:
- Level 1 – quoted prices in active markets for identical investments
- Level 2 – other significant observable inputs (including quoted prices for similar investments, interest rates, prepayment speeds, etc.)
- Level 3 – unobservable inputs (including the Fund's own assumptions based on the best information available)
Valuation techniques used to value the Fund's investments by major category are as follows:
Equity securities, including restricted securities, for which market quotations are readily available, are valued at the last reported sale price or official closing price as reported by a third party pricing vendor on the primary market or exchange on which they are traded and are categorized as Level 1 in the hierarchy. In the event there were no sales during the day or closing prices are not available, securities are valued at the last quoted bid price or may be valued using the last available price and are generally categorized as Level 2 in the hierarchy. For foreign equity securities, when market or security specific events arise, comparisons to the valuation of American Depositary Receipts (ADRs), futures contracts, Exchange-Traded Funds (ETFs) and certain indexes as well as quoted prices for similar securities may be used and would be categorized as Level 2 in the hierarchy. Utilizing these techniques may result in transfers between Level 1 and Level 2. For equity securities, including restricted securities, where observable inputs are limited, assumptions about market activity and risk are used and these securities may be categorized as Level 3 in the hierarchy.
Debt securities, including restricted securities, are valued based on evaluated prices received from third party pricing vendors or from brokers who make markets in such securities. Corporate bonds and preferred securities are valued by pricing vendors who utilize matrix pricing which considers yield or price of bonds of comparable quality, coupon, maturity and type or by broker-supplied prices. When independent prices are unavailable or unreliable, debt securities may be valued utilizing pricing methodologies which consider similar factors that would be used by third party pricing vendors. Debt securities are generally categorized as Level 2 in the hierarchy but may be Level 3 depending on the circumstances.
Exchange-traded options are valued using the last sale price or, in the absence of a sale, the last offering price and are categorized as Level 1 in the hierarchy. Investments in open-end mutual funds, including the Fidelity Central Funds, are valued at their closing net asset value (NAV) each business day and are categorized as Level 1 in the hierarchy.
Changes in valuation techniques may result in transfers in or out of an assigned level within the disclosure hierarchy. The aggregate value of investments by input level as of November 30, 2015, is included at the end of the Fund's Schedule of Investments.
Foreign Currency. The Fund may use foreign currency contracts to facilitate transactions in foreign-denominated securities. Gains and losses from these transactions may arise from changes in the value of the foreign currency or if the counterparties do not perform under the contracts' terms.
Foreign-denominated assets, including investment securities, and liabilities are translated into U.S. dollars at the exchange rates at period end. Purchases and sales of investment securities, income and dividends received and expenses denominated in foreign currencies are translated into U.S. dollars at the exchange rate in effect on the transaction date.
The effects of exchange rate fluctuations on investments are included with the net realized and unrealized gain (loss) on investment securities. Other foreign currency transactions resulting in realized and unrealized gain (loss) are disclosed separately.
Investment Transactions and Income. For financial reporting purposes, the Fund's investment holdings and NAV include trades executed through the end of the last business day of the period. The NAV per share for processing shareholder transactions is calculated as of the close of business of the New York Stock Exchange (NYSE), normally 4:00 p.m. Eastern time and includes trades executed through the end of the prior business day. Gains and losses on securities sold are determined on the basis of identified cost and may include proceeds received from litigation. Dividend income is recorded on the ex-dividend date, except for certain dividends from foreign securities where the ex-dividend date may have passed, which are recorded as soon as the Fund is informed of the ex-dividend date. Non-cash dividends included in dividend income, if any, are recorded at the fair market value of the securities received. Income and capital gain distributions from Fidelity Central Funds, if any, are recorded on the ex-dividend date. Distributions received on securities that represent a return of capital or capital gain are recorded as a reduction of cost of investments and/or as a realized gain. Subsequent to ex-dividend date the Fund determines the components of these distributions, based upon receipt of tax filings or other correspondence relating to the underlying investment. Interest income is accrued as earned and includes coupon interest and amortization of premium and accretion of discount on debt securities as applicable. Investment income is recorded net of foreign taxes withheld where recovery of such taxes is uncertain. Debt obligations may be placed on non-accrual status and related interest income may be reduced by ceasing current accruals and writing off interest receivables when the collection of all or a portion of interest has become doubtful based on consistently applied procedures. A debt obligation is removed from non-accrual status when the issuer resumes interest payments or when collectability of interest is reasonably assured.
Class Allocations and Expenses. Investment income, realized and unrealized capital gains and losses, common expenses of the Fund, and certain fund-level expense reductions, if any, are allocated daily on a pro-rata basis to each class based on the relative net assets of each class to the total net assets of the Fund. Each class differs with respect to transfer agent and distribution and service plan fees incurred. Certain expense reductions may also differ by class. For the reporting period, the allocated portion of income and expenses to each class as a percent of its average net assets may vary due to the timing of recording these transactions in relation to fluctuating net assets of the classes. Expenses directly attributable to a fund are charged to that fund. Expenses attributable to more than one fund are allocated among the respective funds on the basis of relative net assets or other appropriate methods. Expense estimates are accrued in the period to which they relate and adjustments are made when actual amounts are known.
Deferred Trustee Compensation. Under a Deferred Compensation Plan (the Plan), independent Trustees may elect to defer receipt of a portion of their annual compensation. Deferred amounts are invested in a cross-section of Fidelity funds, are marked-to-market and remain in the Fund until distributed in accordance with the Plan. The investment of deferred amounts and the offsetting payable to the Trustees are included in the accompanying Statement of Assets and Liabilities.
Income Tax Information and Distributions to Shareholders. Each year, the Fund intends to qualify as a regulated investment company under Subchapter M of the Internal Revenue Code, including distributing substantially all of its taxable income and realized gains. As a result, no provision for U.S. Federal income taxes is required. As of November 30, 2015, the Fund did not have any unrecognized tax benefits in the financial statements; nor is the Fund aware of any tax positions for which it is reasonably possible that the total amounts of unrecognized tax benefits will significantly change in the next twelve months. The Fund files a U.S. federal tax return, in addition to state and local tax returns as required. The Fund's federal income tax returns are subject to examination by the Internal Revenue Service (IRS) for a period of three fiscal years after they are filed. State and local tax returns may be subject to examination for an additional fiscal year depending on the jurisdiction. Foreign taxes are provided for based on the Fund's understanding of the tax rules and rates that exist in the foreign markets in which it invests.
Distributions are declared and recorded on the ex-dividend date. Income dividends and capital gain distributions are declared separately for each class. Income and capital gain distributions are determined in accordance with income tax regulations, which may differ from GAAP. In addition, the Fund claimed a portion of the payment made to redeeming shareholders as a distribution for income tax purposes.
Capital accounts within the financial statements are adjusted for permanent book-tax differences. These adjustments have no impact on net assets or the results of operations. Capital accounts are not adjusted for temporary book-tax differences which will reverse in a subsequent period.
Book-tax differences are primarily due to foreign currency transactions, partnerships, market discount, deferred trustees compensation, contingent interest, certain conversion ratio adjustments, equity-debt classifications and losses deferred due to wash sales.
The federal tax cost of investment securities and unrealized appreciation (depreciation) as of period end were as follows:
| Gross unrealized appreciation | $301,303 |
| Gross unrealized depreciation | (187,028) |
| Net unrealized appreciation (depreciation) on securities | $114,275 |
| Tax Cost | $2,046,013 |
The tax-based components of distributable earnings as of period end were as follows:
| Undistributed ordinary income | $17,222 |
| Undistributed long-term capital gain | $142,032 |
| Net unrealized appreciation (depreciation) on securities and other investments | $113,940 |
The tax character of distributions paid was as follows:
| November 30, 2015 | November 30, 2014 | |
| Ordinary Income | $66,216 | $ 47,945 |
| Long-term Capital Gains | 81,483 | – |
| Total | $147,699 | $ 47,945 |
Restricted Securities. The Fund may invest in securities that are subject to legal or contractual restrictions on resale. These securities generally may be resold in transactions exempt from registration or to the public if the securities are registered. Disposal of these securities may involve time-consuming negotiations and expense, and prompt sale at an acceptable price may be difficult. Information regarding restricted securities is included at the end of the Fund's Schedule of Investments.
4. Derivative Instruments.
Risk Exposures and the Use of Derivative Instruments. The Fund's investment objective allows the Fund to enter into various types of derivative contracts, including options. Derivatives are investments whose value is primarily derived from underlying assets, indices or reference rates and may be transacted on an exchange or over-the-counter (OTC). Derivatives may involve a future commitment to buy or sell a specified asset based on specified terms, to exchange future cash flows at periodic intervals based on a notional principal amount, or for one party to make one or more payments upon the occurrence of specified events in exchange for periodic payments from the other party.
The Fund used derivatives to increase returns and to manage exposure to certain risks as defined below. The success of any strategy involving derivatives depends on analysis of numerous economic factors, and if the strategies for investment do not work as intended, the Fund may not achieve its objectives.
The Fund's use of derivatives increased or decreased its exposure to the following risk:
| Equity Risk | Equity risk relates to the fluctuations in the value of financial instruments as a result of changes in market prices (other than those arising from interest rate risk or foreign exchange risk), whether caused by factors specific to an individual investment, its issuer, or all factors affecting all instruments traded in a market or market segment. |
The Fund is also exposed to additional risks from investing in derivatives, such as liquidity risk and counterparty credit risk. Liquidity risk is the risk that the Fund will be unable to close out the derivative in the open market in a timely manner. Counterparty credit risk is the risk that the counterparty will not be able to fulfill its obligation to the Fund. Counterparty credit risk related to exchange-traded options may be mitigated by the protection provided by the exchange on which they trade.
Investing in derivatives may involve greater risks than investing in the underlying assets directly and, to varying degrees, may involve risk of loss in excess of any initial investment and collateral received and amounts recognized in the Statement of Assets and Liabilities. In addition, there may be the risk that the change in value of the derivative contract does not correspond to the change in value of the underlying instrument.
Options. Options give the purchaser the right, but not the obligation, to buy (call) or sell (put) an underlying security or financial instrument at an agreed exercise or strike price between or on certain dates. Options obligate the seller (writer) to buy (put) or sell (call) an underlying instrument at the exercise or strike price or cash settle an underlying derivative instrument if the holder exercises the option on or before the expiration date.
The Fund (the Fund) used exchange-traded written covered call options to manage its exposure to the market. When the Fund writes a covered call option, the Fund holds the underlying instrument which must be delivered to the holder upon the exercise of the option.
Upon entering into a written options contract, the Fund will receive a premium. Premiums received are reflected as a liability on the Statement of Assets and Liabilities. Options are valued daily and any unrealized appreciation (depreciation) is reflected on the Statement of Assets and Liabilities. When a written option is exercised, the premium is added to the proceeds from the sale of the underlying instrument in determining the gain or loss realized on that investment. When an option is closed the Fund will realize a gain or loss depending on whether the proceeds or amount paid for the closing sale transaction are greater or less than the premium received. When an option expires, gains and losses are realized to the extent of premiums received. The net realized gain (loss) on closed and expired written options and the change in net unrealized appreciation (depreciation) on written options are reflected separately on the Statement of Operations.
Writing call options tends to decrease exposure to the underlying instrument and risk of loss is the change in value in excess of the premium received.
Any open options at period end are presented in the Schedule of Investments under the caption "Written Options" and are representative of volume of activity during the period.
During the period, the Fund recognized net realized gain (loss) of $5,913 and a change in net unrealized appreciation (depreciation) of $302 related to its investment in written options. This amount is included in the Statement of Operations.
The following is a summary of the Fund's written options activity:
Written Options
| Number of Contracts | Amount of Premiums | |
| Outstanding at beginning of period | 10 | $912 |
| Options Opened | 119 | 10,886 |
| Options Exercised | (37) | (3,340) |
| Options Closed | (36) | (3,531) |
| Options Expired | (36) | (3,287) |
| Outstanding at end of period | 20 | $1,640 |
5. Purchases and Sales of Investments.
Purchases and sales of securities, other than short-term securities, aggregated $1,190,348 and $1,300,637, respectively.
6. Fees and Other Transactions with Affiliates.
Management Fee. Fidelity Management & Research Company (the investment adviser) and its affiliates provide the Fund with investment management related services for which the Fund pays a monthly management fee. The management fee is the sum of an individual fund fee rate that is based on an annual rate of .20% of the Fund's average net assets and an annualized group fee rate that averaged .25% during the period. The group fee rate is based upon the average net assets of all the mutual funds advised by the investment adviser, including any mutual funds previously advised by the investment adviser that are currently advised by Fidelity SelectCo, LLC, an affiliate of the investment adviser. The group fee rate decreases as assets under management increase and increases as assets under management decrease. For the reporting period, the total annual management fee rate was .45% of the Fund's average net assets.
Distribution and Service Plan Fees. In accordance with Rule 12b-1 of the 1940 Act, the Fund has adopted separate Distribution and Service Plans for each class of shares. Certain classes pay Fidelity Distributors Corporation (FDC), an affiliate of the investment adviser, separate Distribution and Service Fees, each of which is based on an annual percentage of each class' average net assets. In addition, FDC may pay financial intermediaries for selling shares of the Fund and providing shareholder support services. For the period, the Distribution and Service Fee rates, total fees and amounts retained by FDC were as follows:
| Distribution Fee | Service Fee | Total Fees | Retained by FDC | |
| Class A | -% | .25% | $1,861 | $12 |
| Class T | .25% | .25% | 4,477 | 7 |
| Class B | .75% | .25% | 143 | 107 |
| Class C | .75% | .25% | 2,002 | 149 |
| $8,483 | $275 |
Sales Load. FDC may receive a front-end sales charge of up to 5.75% for selling Class A shares and 3.50% for selling Class T shares, some of which is paid to financial intermediaries for selling shares of the Fund. Depending on the holding period, FDC may receive contingent deferred sales charges levied on Class A, Class T, Class B, and Class C redemptions. The deferred sales charges range from 5.00% to 1.00% for Class B shares, 1.00% for Class C shares, 1.00% for certain purchases of Class A shares and .25% for certain purchases of Class T shares.
For the period, sales charge amounts retained by FDC were as follows:
| Retained by FDC | |
| Class A | $123 |
| Class T | 34 |
| Class B(a) | 4 |
| Class C(a) | 14 |
| $175 |
(a) When Class B and Class C shares are initially sold, FDC pays commissions from its own resources to financial intermediaries through which the sales are made.
Transfer Agent Fees. Fidelity Investments Institutional Operations Company, Inc., (FIIOC), an affiliate of the investment adviser, is the transfer, dividend disbursing and shareholder servicing agent for each class of the Fund. FIIOC receives account fees and asset-based fees that vary according to the account size and type of account of the shareholders of the respective classes of the Fund, except for Class Z. FIIOC receives an asset-based fee of Class Z's average net assets. FIIOC pays for typesetting, printing and mailing of shareholder reports, except proxy statements.
For the period, transfer agent fees for each class were as follows:
| Amount | % of Class-Level Average Net Assets | |
| Class A | $1,555 | .21 |
| Class T | 1,678 | .19 |
| Class B | 43 | .30 |
| Class C | 452 | .23 |
| Class I | 928 | .20 |
| Class Z | 6 | .05 |
| $4,662 |
Accounting and Security Lending Fees. Fidelity Service Company, Inc. (FSC), an affiliate of the investment adviser, maintains the Fund's accounting records. The accounting fee is based on the level of average net assets for each month. Under a separate contract, FSC administers the security lending program. The security lending fee is based on the number and duration of lending transactions.
Brokerage Commissions. The Fund placed a portion of its portfolio transactions with brokerage firms which are affiliates of the investment adviser. Brokerage commissions are included in net realized gain (loss) and change in net unrealized appreciation (depreciation) in the Statement of Operations. The commissions paid to these affiliated firms were $12 for the period.
7. Committed Line of Credit.
The Fund participates with other funds managed by the investment adviser or an affiliate in a $4.25 billion credit facility (the "line of credit") to be utilized for temporary or emergency purposes to fund shareholder redemptions or for other short-term liquidity purposes. The Fund has agreed to pay commitment fees on its pro-rata portion of the line of credit, which amounted to $3 and is reflected in Miscellaneous expenses on the Statement of Operations. During the period, the Fund did not borrow on this line of credit.
8. Security Lending.
The Fund lends portfolio securities through a lending agent from time to time in order to earn additional income. For equity securities, a lending agent is used and may loan securities to certain qualified borrowers, including Fidelity Capital Markets (FCM), a broker-dealer affiliated with the Fund. On the settlement date of the loan, the Fund receives collateral (in the form of U.S. Treasury obligations, letters of credit and/or cash) against the loaned securities and maintains collateral in an amount not less than 100% of the market value of the loaned securities during the period of the loan. The market value of the loaned securities is determined at the close of business of the Fund and any additional required collateral is delivered to the Fund on the next business day. The Fund or borrower may terminate the loan at any time, and if the borrower defaults on its obligation to return the securities loaned because of insolvency or other reasons, the Fund may apply collateral received from the borrower against the obligation. The Fund may experience delays and costs in recovering the securities loaned. Any cash collateral received is invested in the Fidelity Securities Lending Cash Central Fund. The value of loaned securities and cash collateral at period end are disclosed on the Fund's Statement of Assets and Liabilities. At period end, there were no security loans outstanding with FCM. Security lending income represents the income earned on investing cash collateral, less rebates paid to borrowers and any lending agent fees associated with the loan, plus any premium payments received for lending certain types of securities. Security lending income is presented in the Statement of Operations as a component of income from Fidelity Central Funds. Total security lending income during the period amounted to $180, including $1 from securities loaned to FCM.
9. Expense Reductions.
Commissions paid to certain brokers with whom the investment adviser, or its affiliates, places trades on behalf of the Fund include an amount in addition to trade execution, which may be rebated back to the Fund to offset certain expenses. This amount totaled $116 for the period.
In addition, during the period the investment adviser reimbursed and/or waived a portion of fund-level operating expenses in the amount of $9 and a portion of class-level operating expenses as follows:
| Amount | |
| Class A | $18 |
| Class T | 22 |
| Class B | -* |
| Class C | 5 |
| Class I | 9 |
| $54 |
* In the Amount of less than five hundred dollars.
10. Distributions to Shareholders.
Distributions to shareholders of each class were as follows:
| Years ended November 30, | 2015 | 2014 |
| From net investment income | ||
| Class A | $22,360 | $15,398 |
| Class T | 24,297 | 16,652 |
| Class B | 312 | 284 |
| Class C | 4,432 | 2,480 |
| Class I | 14,486 | 10,355 |
| Class Z | 329 | 27 |
| Total | $66,216 | $45,196 |
| From net realized gain | ||
| Class A | $26,221 | $885 |
| Class T | 31,523 | 1,072 |
| Class B | 619 | 22 |
| Class C | 7,102 | 235 |
| Class I | 15,863 | 531 |
| Class Z | 155 | 4 |
| Total | $81,483 | $2,749 |
11. Share Transactions.
Share transactions for each class were as follows and may contain automatic conversions between classes or exchanges between funds:
| Shares | Shares | Dollars | Dollars | |
| Years ended November 30, | 2015 | 2014 | 2015 | 2014 |
| Class A | ||||
| Shares sold | 2,362 | 2,874 | $75,894 | $94,044 |
| Reinvestment of distributions | 1,433 | 468 | 45,794 | 15,075 |
| Shares redeemed | (4,745) | (4,883) | (152,883) | (160,473) |
| Net increase (decrease) | (950) | (1,541) | $(31,195) | $(51,354) |
| Class T | ||||
| Shares sold | 2,316 | 2,961 | $76,171 | $98,369 |
| Reinvestment of distributions | 1,671 | 523 | 54,352 | 17,076 |
| Shares redeemed | (6,115) | (6,341) | (200,386) | (211,072) |
| Net increase (decrease) | (2,128) | (2,857) | $(69,863) | $(95,627) |
| Class B | ||||
| Shares sold | 9 | 28 | $284 | $933 |
| Reinvestment of distributions | 26 | 9 | 855 | 278 |
| Shares redeemed | (270) | (335) | (8,810) | (11,003) |
| Net increase (decrease) | (235) | (298) | $(7,671) | $(9,792) |
| Class C | ||||
| Shares sold | 655 | 952 | $21,329 | $31,255 |
| Reinvestment of distributions | 323 | 74 | 10,405 | 2,385 |
| Shares redeemed | (1,186) | (962) | (38,343) | (31,695) |
| Net increase (decrease) | (208) | 64 | $(6,609) | $1,945 |
| Class I | ||||
| Shares sold | 1,946 | 2,911 | $64,288 | $97,428 |
| Reinvestment of distributions | 888 | 313 | 29,367 | 10,419 |
| Shares redeemed | (3,471) | (4,089) | (116,106) | (137,936) |
| Net increase (decrease) | (637) | (865) | $(22,451) | $(30,089) |
| Class Z | ||||
| Shares sold | 374 | 113 | $12,522 | $4,010 |
| Reinvestment of distributions | 15 | 1 | 484 | 31 |
| Shares redeemed | (60) | (3) | (1,973) | (105) |
| Net increase (decrease) | 329 | 111 | $11,033 | $3,936 |
12. Other.
The Fund's organizational documents provide former and current trustees and officers with a limited indemnification against liabilities arising in connection with the performance of their duties to the Fund. In the normal course of business, the Fund may also enter into contracts that provide general indemnifications. The Fund's maximum exposure under these arrangements is unknown as this would be dependent on future claims that may be made against the Fund. The risk of material loss from such claims is considered remote.
Report of Independent Registered Public Accounting Firm
To the Trustees of Fidelity Advisor Series I and Shareholders of Fidelity Advisor® Equity Income Fund:
We have audited the accompanying statement of assets and liabilities of Fidelity Advisor® Equity Income Fund (the Fund), a fund of Fidelity Advisor Series I, including the schedule of investments, as of November 30, 2015, and the related statement of operations for the year then ended, the statement of changes in net assets for each of the two years in the period then ended, and the financial highlights for each of the five years in the period then ended. These financial statements and financial highlights are the responsibility of the Fund's management. Our responsibility is to express an opinion on these financial statements and financial highlights based on our audits.
We conducted our audits in accordance with the standards of the Public Company Accounting Oversight Board (United States). Those standards require that we plan and perform the audit to obtain reasonable assurance about whether the financial statements and financial highlights are free of material misstatement. The Fund is not required to have, nor were we engaged to perform, an audit of its internal control over financial reporting. Our audits included consideration of internal control over financial reporting as a basis for designing audit procedures that are appropriate in the circumstances, but not for the purpose of expressing an opinion on the effectiveness of the Fund's internal control over financial reporting. Accordingly, we express no such opinion. An audit also includes examining, on a test basis, evidence supporting the amounts and disclosures in the financial statements, assessing the accounting principles used and significant estimates made by management, as well as evaluating the overall financial statement presentation. Our procedures included confirmation of securities owned as of November 30, 2015, by correspondence with the custodians and brokers; when replies were not received from brokers, we performed other auditing procedures. We believe that our audits provide a reasonable basis for our opinion.
In our opinion, such financial statements and financial highlights referred to above present fairly, in all material respects, the financial position of Fidelity Advisor® Equity Income Fund as of November 30, 2015, the results of its operations for the year then ended, the changes in its net assets for each of the two years in the period then ended, and the financial highlights for each of the five years in the period then ended, in conformity with accounting principles generally accepted in the United States of America.
DELOITTE & TOUCHE LLP
Boston, Massachusetts
January 20, 2016
Trustees and Officers
The Trustees, Members of the Advisory Board (if any), and officers of the trust and fund, as applicable, are listed below. The Board of Trustees governs the fund and is responsible for protecting the interests of shareholders. The Trustees are experienced executives who meet periodically throughout the year to oversee the fund's activities, review contractual arrangements with companies that provide services to the fund, oversee management of the risks associated with such activities and contractual arrangements, and review the fund's performance. Each of the Trustees oversees 170 funds.
The Trustees hold office without limit in time except that (a) any Trustee may resign; (b) any Trustee may be removed by written instrument, signed by at least two-thirds of the number of Trustees prior to such removal; (c) any Trustee who requests to be retired or who has become incapacitated by illness or injury may be retired by written instrument signed by a majority of the other Trustees; and (d) any Trustee may be removed at any special meeting of shareholders by a two-thirds vote of the outstanding voting securities of the trust. Each Trustee who is not an interested person (as defined in the 1940 Act) of the trust and the fund is referred to herein as an Independent Trustee. Each Independent Trustee shall retire not later than the last day of the calendar year in which his or her 75th birthday occurs. The Independent Trustees may waive this mandatory retirement age policy with respect to individual Trustees. Officers and Advisory Board Members hold office without limit in time, except that any officer or Advisory Board Member may resign or may be removed by a vote of a majority of the Trustees at any regular meeting or any special meeting of the Trustees. Except as indicated, each individual has held the office shown or other offices in the same company for the past five years.
The fund’s Statement of Additional Information (SAI) includes more information about the Trustees. To request a free copy, call Fidelity at 1-877-208-0098.
Experience, Skills, Attributes, and Qualifications of the Trustees. The Governance and Nominating Committee has adopted a statement of policy that describes the experience, qualifications, attributes, and skills that are necessary and desirable for potential Independent Trustee candidates (Statement of Policy). The Board believes that each Trustee satisfied at the time he or she was initially elected or appointed a Trustee, and continues to satisfy, the standards contemplated by the Statement of Policy. The Governance and Nominating Committee also engages professional search firms to help identify potential Independent Trustee candidates who have the experience, qualifications, attributes, and skills consistent with the Statement of Policy. From time to time, additional criteria based on the composition and skills of the current Independent Trustees, as well as experience or skills that may be appropriate in light of future changes to board composition, business conditions, and regulatory or other developments, have also been considered by the professional search firms and the Governance and Nominating Committee. In addition, the Board takes into account the Trustees' commitment and participation in Board and committee meetings, as well as their leadership of standing and ad hoc committees throughout their tenure.
In determining that a particular Trustee was and continues to be qualified to serve as a Trustee, the Board has considered a variety of criteria, none of which, in isolation, was controlling. The Board believes that, collectively, the Trustees have balanced and diverse experience, qualifications, attributes, and skills, which allow the Board to operate effectively in governing the fund and protecting the interests of shareholders. Information about the specific experience, skills, attributes, and qualifications of each Trustee, which in each case led to the Board's conclusion that the Trustee should serve (or continue to serve) as a trustee of the fund, is provided below.
Board Structure and Oversight Function. James C. Curvey is an interested person and currently serves as Chairman. The Trustees have determined that an interested Chairman is appropriate and benefits shareholders because an interested Chairman has a personal and professional stake in the quality and continuity of services provided to the fund. Independent Trustees exercise their informed business judgment to appoint an individual of their choosing to serve as Chairman, regardless of whether the Trustee happens to be independent or a member of management. The Independent Trustees have determined that they can act independently and effectively without having an Independent Trustee serve as Chairman and that a key structural component for assuring that they are in a position to do so is for the Independent Trustees to constitute a substantial majority for the Board. The Independent Trustees also regularly meet in executive session. Ned C. Lautenbach serves as Chairman of the Independent Trustees and as such (i) acts as a liaison between the Independent Trustees and management with respect to matters important to the Independent Trustees and (ii) with management prepares agendas for Board meetings.
Fidelity® funds are overseen by different Boards of Trustees. The fund's Board oversees Fidelity's high income and certain equity funds, and other Boards oversee Fidelity's investment-grade bond, money market, asset allocation, and sector funds. The asset allocation funds may invest in Fidelity® funds overseen by the fund's Board. The use of separate Boards, each with its own committee structure, allows the Trustees of each group of Fidelity® funds to focus on the unique issues of the funds they oversee, including common research, investment, and operational issues. On occasion, the separate Boards establish joint committees to address issues of overlapping consequences for the Fidelity® funds overseen by each Board.
The Trustees operate using a system of committees to facilitate the timely and efficient consideration of all matters of importance to the Trustees, the fund, and fund shareholders and to facilitate compliance with legal and regulatory requirements and oversight of the fund's activities and associated risks. The Board, acting through its committees, has charged FMR and its affiliates with (i) identifying events or circumstances the occurrence of which could have demonstrably adverse effects on the fund's business and/or reputation; (ii) implementing processes and controls to lessen the possibility that such events or circumstances occur or to mitigate the effects of such events or circumstances if they do occur; and (iii) creating and maintaining a system designed to evaluate continuously business and market conditions in order to facilitate the identification and implementation processes described in (i) and (ii) above. Because the day-to-day operations and activities of the fund are carried out by or through FMR, its affiliates, and other service providers, the fund's exposure to risks is mitigated but not eliminated by the processes overseen by the Trustees. While each of the Board's committees has responsibility for overseeing different aspects of the fund's activities, oversight is exercised primarily through the Operations, Audit, and Compliance Committees. In addition, the Independent Trustees have worked with FMR to enhance the Board's oversight of investment and financial risks, legal and regulatory risks, technology risks, and operational risks, including the development of additional risk reporting to the Board. For example, a working group comprised of Independent Trustees and FMR has worked and continues to work to review the Fidelity® funds' valuation-related activities, reporting and risk management. Appropriate personnel, including but not limited to the fund's Chief Compliance Officer (CCO), FMR's internal auditor, the independent accountants, the fund's Treasurer and portfolio management personnel, make periodic reports to the Board's committees, as appropriate, including an annual review of Fidelity's risk management program for the Fidelity® funds. The responsibilities of each standing committee, including their oversight responsibilities, are described further under "Standing Committees of the Trustees."
Interested Trustees*:
Correspondence intended for a Trustee who is an interested person may be sent to Fidelity Investments, 245 Summer Street, Boston, Massachusetts 02210.
Name, Year of Birth; Principal Occupations and Other Relevant Experience+
James C. Curvey (1935)
Year of Election or Appointment: 2007
Trustee
Chairman of the Board of Trustees
Mr. Curvey also serves as Trustee of other Fidelity® funds. Mr. Curvey is a Director of Fidelity Research & Analysis Co. (investment adviser firm, 2009-present), and Vice Chairman (2007-present) and Director of FMR LLC (diversified financial services company). In addition, Mr. Curvey serves as an Overseer for the Boston Symphony Orchestra and a member of the board of Artis-Naples, Naples, Florida, and as a Trustee for Brewster Academy, Wolfeboro, New Hampshire. Previously, Mr. Curvey served as a Director of Fidelity Investments Money Management, Inc. (investment adviser firm, 2009-2014) and a Director of FMR and FMR Co., Inc. (investment adviser firms, 2007-2014).
Charles S. Morrison (1960)
Year of Election or Appointment: 2014
Trustee
Mr. Morrison also serves as Trustee of other funds. He serves as a Director of Fidelity Investments Money Management, Inc. (FIMM) (investment adviser firm, 2014-present), Director of Fidelity SelectCo, LLC (investment adviser firm, 2014-present), President, Asset Management (2014-present), and is an employee of Fidelity Investments. Previously, Mr. Morrison served as Vice President of Fidelity's Fixed Income and Asset Allocation Funds (2012-2014), President, Fixed Income (2011-2014), Vice President of Fidelity's Money Market Funds (2005-2009), President, Money Market Group Leader of FMR (investment adviser firm, 2009), and Senior Vice President, Money Market Group of FMR (2004-2009). Mr. Morrison also served as Vice President of Fidelity's Bond Funds (2002-2005), certain Balanced Funds (2002-2005), and certain Asset Allocation Funds (2002-2007), and as Senior Vice President (2002-2005) of Fidelity's Bond Division.
* Determined to be an “Interested Trustee” by virtue of, among other things, his or her affiliation with the trust or various entities under common control with FMR.
+ The information includes the Trustee's principal occupation during the last five years and other information relating to the experience, attributes, and skills relevant to the Trustee's qualifications to serve as a Trustee, which led to the conclusion that the Trustee should serve as a Trustee for the fund.
Independent Trustees:
Correspondence intended for an Independent Trustee may be sent to Fidelity Investments, P.O. Box 55235, Boston, Massachusetts 02205-5235.
Name, Year of Birth; Principal Occupations and Other Relevant Experience+
Dennis J. Dirks (1948)
Year of Election or Appointment: 2005
Trustee
Mr. Dirks also serves as Trustee of other Fidelity® funds. Prior to his retirement in May 2003, Mr. Dirks was Chief Operating Officer and a member of the Board of The Depository Trust & Clearing Corporation (DTCC). He also served as President, Chief Operating Officer, and Board member of The Depository Trust Company (DTC) and President and Board member of the National Securities Clearing Corporation (NSCC). In addition, Mr. Dirks served as Chief Executive Officer and Board member of the Government Securities Clearing Corporation, Chief Executive Officer and Board member of the Mortgage-Backed Securities Clearing Corporation, as a Trustee and a member of the Finance Committee of Manhattan College (2005-2008), as a Trustee and a member of the Finance Committee of AHRC of Nassau County (2006-2008), and as a member of the Independent Directors Council (IDC) Governing Council (2010-2015). Mr. Dirks is a member of the Board of Directors for The Brookville Center for Children's Services, Inc. (2009-present).
Alan J. Lacy (1953)
Year of Election or Appointment: 2008
Trustee
Mr. Lacy also serves as Trustee of other Fidelity® funds. Mr. Lacy serves as a member of the Board of Directors of Dave & Buster's Entertainment, Inc. (restaurant and entertainment complexes, 2010-present) and Bristol-Myers Squibb Company (global pharmaceuticals, 2008-present). In addition, Mr. Lacy served as Senior Adviser (2007-2014) of Oak Hill Capital Partners, L.P. (private equity) and also served as Chief Executive Officer (2000-2005) and Vice Chairman (2005-2006) of Sears Holdings Corporation and Sears, Roebuck and Co. (retail). Mr. Lacy is a member of the Board of Trustees of The National Parks Conservation Association (2006-present). Previously, Mr. Lacy served as Chairman of the Board of Trustees of the National Parks Conservation Association (2008-2011) and as a member of the Board of Directors for The Western Union Company (global money transfer, 2006-2011), The Hillman Companies, Inc. (hardware wholesalers, 2010-2014), and Earth Fare, Inc. (retail grocery, 2010-2014).
Ned C. Lautenbach (1944)
Year of Election or Appointment: 2000
Trustee
Chairman of the Independent Trustees
Mr. Lautenbach also serves as Trustee of other Fidelity® funds. Mr. Lautenbach currently serves as the Lead Director of the Eaton Corporation Board of Directors (diversified industrial, 1997-present). Mr. Lautenbach is Chairman of the Board of Directors of Artis-Naples in Naples, Florida (2012-present), a member of the Council on Foreign Relations (1994-present), and a member of the Board of Governors, State University System of Florida (2013-present). Previously, Mr. Lautenbach was a Partner/Advisory Partner at Clayton, Dubilier & Rice, LLC (private equity investment, 1998-2010), as well as a Director of Sony Corporation (2006-2007).
Joseph Mauriello (1944)
Year of Election or Appointment: 2008
Trustee
Mr. Mauriello also serves as Trustee of other Fidelity® funds. Prior to his retirement in January 2006, Mr. Mauriello served in numerous senior management positions including Deputy Chairman and Chief Operating Officer (2004-2005), and Vice Chairman of Financial Services (2002-2004) of KPMG LLP US (professional services, 1965-2005). Mr. Mauriello currently serves as a member of the Board of Directors of XL Group plc. (global insurance and re-insurance, 2006-present) and the Independent Directors Council (IDC) Governing Council (2015-present). Previously, Mr. Mauriello served as a Director of the Hamilton Funds of the Bank of New York (2006-2007) and of Arcadia Resources Inc. (health care services and products, 2007-2012).
Robert W. Selander (1950)
Year of Election or Appointment: 2011
Trustee
Mr. Selander also serves as Trustee of other Fidelity® funds. Mr. Selander serves as a Director of The Western Union Company (global money transfer, 2014-present). Previously, Mr. Selander served as a Member of the Advisory Board of other Fidelity® funds (2011), and Executive Vice Chairman (2010), Chief Executive Officer (2009-2010), and President and Chief Executive Officer (1997-2009) of Mastercard, Inc.
Cornelia M. Small (1944)
Year of Election or Appointment: 2005
Trustee
Ms. Small also serves as Trustee of other Fidelity® funds. Ms. Small is a member of the Board of Directors (2009-present) and Chair of the Investment Committee (2010-present) of the Teagle Foundation. Ms. Small also serves on the Investment Committee of the Berkshire Taconic Community Foundation (2008-present). Previously, Ms. Small served as Chairperson (2002-2008) and a member of the Investment Committee and Chairperson (2008-2012) and a member of the Board of Trustees of Smith College. In addition, Ms. Small served as Chief Investment Officer, Director of Global Equity Investments, and a member of the Board of Directors of Scudder, Stevens & Clark and Scudder Kemper Investments.
William S. Stavropoulos (1939)
Year of Election or Appointment: 2002
Trustee
Vice Chairman of the Independent Trustees
Mr. Stavropoulos also serves as Trustee of other Fidelity® funds. Mr. Stavropoulos serves as President and Founder of the Michigan Baseball Foundation, the Great Lakes Loons (2007-present). Mr. Stavropoulos is Chairman Emeritus of the Board of Directors of The Dow Chemical Company, where he previously served in numerous senior management positions, including President, CEO (1995-2000; 2002-2004), Chairman of the Executive Committee (2000-2006), and as a member of the Board of Directors (1990-2006). Currently, Mr. Stavropoulos is Chairman of the Board of Directors of Univar Inc. (global distributor of commodity and specialty chemicals), a Director of Teradata Corporation (data warehousing and technology solutions), and Maersk Inc. (industrial conglomerate), and a member of the Advisory Board for Metalmark Capital LLC (private equity investment, 2005-present). Mr. Stavropoulos is an operating advisor to Clayton, Dubilier & Rice, LLC (private equity investment). In addition, Mr. Stavropoulos is a member of the University of Notre Dame Advisory Council for the College of Science, a Trustee of the Rollin L. Gerstacker Foundation, and a Director of the Naples Philharmonic Center for the Arts. Previously, Mr. Stavropoulos served as a Director of Chemical Financial Corporation (bank holding company, 1993-2012) and Tyco International, Ltd. (multinational manufacturing and services, 2007-2012).
David M. Thomas (1949)
Year of Election or Appointment: 2008
Trustee
Mr. Thomas also serves as Trustee of other Fidelity® funds. Mr. Thomas serves as Non-Executive Chairman of the Board of Directors of Fortune Brands Home and Security (home and security products, 2011-present), as a member of the Board of Directors (2004-present) and Presiding Director (2013-present) of Interpublic Group of Companies, Inc. (marketing communication), and as a member of the Board of Trustees of the University of Florida (2013-present). Previously, Mr. Thomas served as Executive Chairman (2005-2006) and Chairman and Chief Executive Officer (2000-2005) of IMS Health, Inc. (pharmaceutical and healthcare information solutions), and a Director of Fortune Brands, Inc. (consumer products, 2000-2011).
+ The information includes the Trustee's principal occupation during the last five years and other information relating to the experience, attributes, and skills relevant to the Trustee's qualifications to serve as a Trustee, which led to the conclusion that the Trustee should serve as a Trustee for the fund.
Advisory Board Members and Officers:
Correspondence intended for an officer or Peter S. Lynch may be sent to Fidelity Investments, 245 Summer Street, Boston, Massachusetts 02210. Officers appear below in alphabetical order.
Name, Year of Birth; Principal Occupation
Peter S. Lynch (1944)
Year of Election or Appointment: 2003
Member of the Advisory Board
Mr. Lynch also serves as Member of the Advisory Board of other Fidelity® funds. Mr. Lynch is Vice Chairman and a Director of FMR (investment adviser firm) and FMR Co., Inc. (investment adviser firm). In addition, Mr. Lynch serves as a Trustee of Boston College and as the Chairman of the Inner-City Scholarship Fund. Previously, Mr. Lynch served on the Special Olympics International Board of Directors (1997-2006).
Elizabeth Paige Baumann (1968)
Year of Election or Appointment: 2012
Anti-Money Laundering (AML) Officer
Ms. Baumann also serves as AML Officer of other funds. She is Chief AML Officer of FMR LLC (diversified financial services company, 2012-present) and is an employee of Fidelity Investments. Previously, Ms. Baumann served as Vice President and Deputy Anti-Money Laundering Officer (2007-2012).
Marc R. Bryant (1966)
Year of Election or Appointment: 2015
Secretary and Chief Legal Officer (CLO)
Mr. Bryant also serves as Secretary and CLO of other funds. Mr. Bryant serves as CLO, Secretary, and Senior Vice President of Fidelity Management & Research Company (investment adviser firm, 2015-present) and FMR Co., Inc. (investment adviser firm, 2015-present); Secretary of Fidelity SelectCo, LLC (investment adviser firm, 2015-present) and Fidelity Investments Money Management, Inc. (investment adviser firm, 2015-present); and CLO of Fidelity Management & Research (Hong Kong) Limited (investment adviser firm, 2015-present). He is Senior Vice President and Deputy General Counsel of FMR LLC (diversified financial services company). Previously, Mr. Bryant served as Secretary and CLO of Fidelity Rutland Square Trust II (2010-2014) and Assistant Secretary of Fidelity's Fixed Income and Asset Allocation Funds (2013-2015). Prior to joining Fidelity Investments, Mr. Bryant served as a Senior Vice President and the Head of Global Retail Legal for AllianceBernstein L.P. (2006-2010), and as the General Counsel for ProFund Advisors LLC (2001-2006).
William C. Coffey (1969)
Year of Election or Appointment: 2009
Assistant Secretary
Mr. Coffey also serves as Assistant Secretary of other funds. He is Senior Vice President and Deputy General Counsel of FMR LLC (diversified financial services company, 2010-present), and is an employee of Fidelity Investments. Previously, Mr. Coffey served as Vice President and Associate General Counsel of FMR LLC (2005-2009).
Jonathan Davis (1968)
Year of Election or Appointment: 2010
Assistant Treasurer
Mr. Davis also serves as Assistant Treasurer of other funds, and is an employee of Fidelity Investments. Previously, Mr. Davis served as Vice President and Associate General Counsel of FMR LLC (diversified financial services company, 2003-2010).
Adrien E. Deberghes (1967)
Year of Election or Appointment: 2008
Deputy Treasurer
Mr. Deberghes also serves as an officer of other funds. He is an employee of Fidelity Investments (2008-present). Prior to joining Fidelity Investments, Mr. Deberghes was Senior Vice President of Mutual Fund Administration at State Street Corporation (2007-2008), Senior Director of Mutual Fund Administration at Investors Bank & Trust (2005-2007), and Director of Finance for Dunkin' Brands (2000-2005).
Stephanie J. Dorsey (1969)
Year of Election or Appointment: 2010
Assistant Treasurer
Ms. Dorsey also serves as an officer of other funds. She is an employee of Fidelity Investments (2008-present) and has served in other fund officer roles. Prior to joining Fidelity Investments, Ms. Dorsey served as Treasurer (2004-2008) of the JPMorgan Mutual Funds and Vice President (2004-2008) of JPMorgan Chase Bank.
Howard J. Galligan III (1966)
Year of Election or Appointment: 2014
Chief Financial Officer
Mr. Galligan also serves as Chief Financial Officer of other funds. Mr. Galligan serves as President of Fidelity Pricing and Cash Management Services (FPCMS) (2014-present) and as a Director of Strategic Advisers, Inc. (investment adviser firm, 2008-present). Previously, Mr. Galligan served as Chief Administrative Officer of Asset Management (2011-2014) and Chief Operating Officer and Senior Vice President of Investment Support for Strategic Advisers, Inc. (2003-2011).
Scott C. Goebel (1968)
Year of Election or Appointment: 2015
Vice President
Mr. Goebel serves as Vice President of other funds and is an employee of Fidelity Investments (2001-present). Previously, Mr. Goebel served as Secretary of Fidelity SelectCo, LLC (investment adviser firm, 2013-2015), Fidelity Investments Money Management, Inc. (FIMM) (investment adviser firm, 2010-2015), and Fidelity Research and Analysis Company (FRAC) (investment adviser firm, 2010-2015); General Counsel, Secretary, and Senior Vice President of Fidelity Management & Research Company (investment adviser firm, 2008-2015) and FMR Co., Inc. (investment adviser firm, 2008-2015); Assistant Secretary of Fidelity Management & Research (Japan) Limited (investment adviser firm, 2008-2015) and FMR Investment Management (U.K.) Limited (investment adviser firm, 2008-2015); Chief Legal Officer (CLO) of Fidelity Management & Research (Hong Kong) Limited (investment adviser firm, 2008-2015); Secretary and CLO of certain Fidelity® funds (2008-2015); Assistant Secretary of FIMM (2008-2010), FRAC (2008-2010), and certain funds (2007-2008); and as Vice President and Secretary of Fidelity Distributors Corporation (FDC) (2005-2007).
Thomas C. Hense (1964)
Year of Election or Appointment: 2008, 2010, or 2015
Vice President
Mr. Hense serves as Vice President of Fidelity Advisor® Multi-Asset Income Fund (2015) and other funds (High Income (2008), Small Cap (2008), and Value (2010) funds), and is an employee of Fidelity Investments (1993-present). Previously, Mr. Hense served as a portfolio manager for Fidelity's Institutional Money Management Group (Pyramis) (2003-2008).
Brian B. Hogan (1964)
Year of Election or Appointment: 2009
Vice President
Mr. Hogan also serves as Trustee or Vice President of other funds. Mr. Hogan serves as a Director of Fidelity SelectCo, LLC (investment adviser firm, 2014-present) and President of the Equity Division of FMR (investment adviser firm, 2009-present). Previously, Mr. Hogan served as Senior Vice President, Equity Research of FMR (2006-2009) and as a portfolio manager.
Chris Maher (1972)
Year of Election or Appointment: 2013
Assistant Treasurer
Mr. Maher serves as Assistant Treasurer of other funds. Mr. Maher is Vice President of Valuation Oversight and is an employee of Fidelity Investments. Previously, Mr. Maher served as Vice President of Asset Management Compliance (2013), Vice President of the Program Management Group of FMR (investment adviser firm, 2010-2013), and Vice President of Valuation Oversight (2008-2010).
Kenneth B. Robins (1969)
Year of Election or Appointment: 2008
President and Treasurer
Mr. Robins also serves as an officer of other funds. Mr. Robins serves as Executive Vice President of Fidelity Investments Money Management, Inc. (FIMM) (investment adviser firm, 2013-present) and is an employee of Fidelity Investments (2004-present). Previously, Mr. Robins served in other fund officer roles.
Stacie M. Smith (1974)
Year of Election or Appointment: 2013
Deputy Treasurer
Ms. Smith also serves as an officer of other funds. She is an employee of Fidelity Investments (2009-present) and has served in other fund officer roles. Prior to joining Fidelity Investments, Ms. Smith served as Senior Audit Manager of Ernst & Young LLP (1996-2009).
Renee Stagnone (1975)
Year of Election or Appointment: 2013
Deputy Treasurer
Ms. Stagnone also serves as Deputy Treasurer of other funds. Ms. Stagnone is an employee of Fidelity Investments (1997-present).
Linda J. Wondrack (1964)
Year of Election or Appointment: 2014
Chief Compliance Officer
Ms. Wondrack also serves as Chief Compliance Officer of other funds. Ms. Wondrack is Executive Vice President and head of the Ethics Office and Asset Management Compliance for Fidelity Investments (2012-present). Ms. Wondrack also serves as Chief Compliance Officer of Fidelity SelectCo, LLC (investment adviser firm, 2014-present); Chief Compliance Officer of Impresa Management LLC (2013-present); and Chief Compliance Officer of FMR Co., Inc. (investment adviser firm), Fidelity Investments Money Management, Inc. (investment adviser firm), Fidelity Management & Research (Japan) Limited (investment adviser firm), FMR Investment Management (U.K.) Limited (investment adviser firm), Fidelity Management & Research (Hong Kong) (investment adviser firm), Fidelity Management & Research Company (investment adviser firm), FIAM LLC (investment adviser firm), and Strategic Advisers, Inc. (investment adviser firm), Ballyrock Investment Advisors LLC, and Northern Neck Investors LLC (2012-present). Previously, Ms. Wondrack served as Senior Vice President and Chief Compliance Officer for Columbia Management Investment Advisers, LLC (2005-2012); Chief Compliance Officer for certain funds within the Columbia Family of Funds (2007-2012); and Senior Vice President of Compliance Risk Management at Bank of America (2005-2010).
Joseph F. Zambello (1957)
Year of Election or Appointment: 2011
Deputy Treasurer
Mr. Zambello also serves as Deputy Treasurer of other funds. Mr. Zambello is an employee of Fidelity Investments (1991-present). Previously, Mr. Zambello served as Vice President of the Program Management Group of FMR (investment adviser firm, 2009-2011) and Vice President of the Transfer Agent Oversight Group (2005-2009).
Shareholder Expense Example
As a shareholder of the Fund, you incur two types of costs: (1) transaction costs, including sales charges (loads) on purchase payments or redemption proceeds, and (2) ongoing costs, including management fees, distribution and/or service (12b-1) fees and other Fund expenses. This Example is intended to help you understand your ongoing costs (in dollars) of investing in the Fund and to compare these costs with the ongoing costs of investing in other mutual funds.
The Example is based on an investment of $1,000 invested at the beginning of the period and held for the entire period (June 1, 2015 to November 30, 2015).
Actual Expenses
The first line of the accompanying table for each class of the Fund provides information about actual account values and actual expenses. You may use the information in this line, together with the amount you invested, to estimate the expenses that you paid over the period. Simply divide your account value by $1,000.00 (for example, an $8,600 account value divided by $1,000.00 = 8.6), then multiply the result by the number in the first line for a class of the Fund under the heading entitled "Expenses Paid During Period" to estimate the expenses you paid on your account during this period. In addition, the Fund, as a shareholder in the underlying Fidelity Central Funds, will indirectly bear its pro-rata share of the fees and expenses incurred by the underlying Fidelity Central Funds. These fees and expenses are not included in the Fund's annualized expense ratio used to calculate the expense estimate in the table below.
Hypothetical Example for Comparison Purposes
The second line of the accompanying table for each class of the Fund provides information about hypothetical account values and hypothetical expenses based on a Class' actual expense ratio and an assumed rate of return of 5% per year before expenses, which is not the Class' actual return. The hypothetical account values and expenses may not be used to estimate the actual ending account balance or expenses you paid for the period. You may use this information to compare the ongoing costs of investing in the Fund and other funds. To do so, compare this 5% hypothetical example with the 5% hypothetical examples that appear in the shareholder reports of the other funds. In addition, the Fund, as a shareholder in the underlying Fidelity Central Funds, will indirectly bear its pro-rata share of the fees and expenses incurred by the underlying Fidelity Central Funds. These fees and expenses are not included in the Fund's annualized expense ratio used to calculate the expense estimate in the table below.
Please note that the expenses shown in the table are meant to highlight your ongoing costs only and do not reflect any transaction costs. Therefore, the second line of the table is useful in comparing ongoing costs only, and will not help you determine the relative total costs of owning different funds. In addition, if these transactional costs were included, your costs would have been higher.
| Annualized Expense Ratio-A | Beginning Account Value June 1, 2015 | Ending Account Value November 30, 2015 | Expenses Paid During Period-B June 1, 2015 to November 30, 2015 | |
| Class A | .94% | |||
| Actual | $1,000.00 | $944.20 | $4.58 | |
| Hypothetical-C | $1,000.00 | $1,020.36 | $4.76 | |
| Class T | 1.17% | |||
| Actual | $1,000.00 | $943.00 | $5.70 | |
| Hypothetical-C | $1,000.00 | $1,019.20 | $5.92 | |
| Class B | 1.78% | |||
| Actual | $1,000.00 | $939.90 | $8.66 | |
| Hypothetical-C | $1,000.00 | $1,016.14 | $9.00 | |
| Class C | 1.71% | |||
| Actual | $1,000.00 | $940.30 | $8.32 | |
| Hypothetical-C | $1,000.00 | $1,016.50 | $8.64 | |
| Class I | .68% | |||
| Actual | $1,000.00 | $945.20 | $3.32 | |
| Hypothetical-C | $1,000.00 | $1,021.66 | $3.45 | |
| Class Z | .54% | |||
| Actual | $1,000.00 | $946.30 | $2.63 | |
| Hypothetical-C | $1,000.00 | $1,022.36 | $2.74 |
A Annualized expense ratio reflects expenses net of applicable fee waivers.
B Expenses are equal to each Class' annualized expense ratio, multiplied by the average account value over the period, multiplied by 183/365 (to reflect the one-half year period).
C 5% return per year before expenses
Distributions (Unaudited)
The Board of Trustees of Fidelity Advisor Equity Income Fund voted to pay to shareholders of record at the opening of business on record date, the following distributions per share derived from capital gains realized from sales of portfolio securities, and dividends derived from net investment income:
| Pay Date | Record Date | Dividends | Capital Gains | |
| Class A | 12/14/15 | 12/11/15 | $0.347 | $1.823 |
| Class A | 01/19/16 | 01/15/16 | $0.000 | $0.283 |
| Class T | 12/14/15 | 12/11/15 | $0.327 | $1.823 |
| Class T | 01/19/16 | 01/15/16 | $0.000 | $0.283 |
| Class B | 12/14/15 | 12/11/15 | $0.269 | $1.823 |
| Class B | 01/19/16 | 01/15/16 | $0.000 | $0.283 |
| Class C | 12/14/15 | 12/11/15 | $0.282 | $1.823 |
| Class C | 01/19/16 | 01/15/16 | $0.000 | $0.283 |
The fund hereby designates as a capital gain dividend with respect to the taxable year ended November 30, 2015, $144,048,258, or, if subsequently determined to be different, the net capital gain of such year.
A total of 0.04% of the dividends distributed during the fiscal year was derived from interest on U.S. Government securities which is generally exempt from state income tax.
Class A designates 81%, 100%, 100%, and 100%; Class T designates 86%, 100%, 100%, and 100%; Class B designates 100%, 100%, 100%, and 100%; and Class C designates 100%, 100%, 100%, and 100%; of the dividends distributed in December 2014, April 2015, July 2015 and October 2015, respectively during the fiscal year as qualifying for the dividends-received deduction for corporate shareholders.
Class A, Class T, Class B, and Class C designate 100% of the dividends distributed during the fiscal year as amounts which may be taken into account as a dividend for purposes of the maximum rate under section 1(h)(11) of the Internal Revenue Code.
The fund will notify shareholders in January 2016 of amounts for use in preparing 2015 income tax returns.
Board Approval of Investment Advisory Contracts and Management Fees
Fidelity Advisor Equity Income Fund
Each year, the Board of Trustees, including the Independent Trustees (together, the Board), votes on the renewal of the management contract with Fidelity Management & Research Company (FMR) and the sub-advisory agreements (together, the Advisory Contracts) for the fund. The Board, assisted by the advice of fund counsel and Independent Trustees' counsel, requests and considers a broad range of information relevant to the renewal of the Advisory Contracts throughout the year.
The Board meets regularly and, at each of its meetings, covers an extensive agenda of topics and materials and considers factors that are relevant to its annual consideration of the renewal of the fund's Advisory Contracts, including the services and support provided to the fund and its shareholders. The Board has established various standing committees (Committees), each composed of and chaired by Independent Trustees with varying backgrounds, to which the Board has assigned specific subject matter responsibilities in order to enhance effective decision-making by the Board. The Board, acting directly and through its Committees, requests and receives information concerning the annual consideration of the renewal of the fund's Advisory Contracts. The Board also meets as needed to consider matters specifically related to the Board's annual consideration of the renewal of the Advisory Contracts. Members of the Board may also meet with trustees of other Fidelity funds through ad hoc joint committees to discuss certain matters relevant to all of the Fidelity funds.
At its July 2015 meeting, the Board unanimously determined to renew the fund's Advisory Contracts. In reaching its determination, the Board considered all factors it believed relevant, including (i) the nature, extent, and quality of the services to be provided to the fund and its shareholders (including the investment performance of the fund); (ii) the competitiveness of the fund's management fee and total expense ratio relative to peer funds; (iii) the total costs of the services to be provided by and the profits to be realized by Fidelity from its relationship with the fund; and (iv) the extent to which (if any) economies of scale exist and would be realized as the fund grows, and whether any economies of scale are appropriately shared with fund shareholders.
In considering whether to renew the Advisory Contracts for the fund, the Board reached a determination, with the assistance of fund counsel and Independent Trustees' counsel and through the exercise of its business judgment, that the renewal of the Advisory Contracts was in the best interests of the fund and its shareholders and that the compensation payable under the Advisory Contracts was fair and reasonable. The Board's decision to renew the Advisory Contracts was not based on any single factor, but rather was based on a comprehensive consideration of all the information provided to the Board at its meetings throughout the year. The Board, in reaching its determination to renew the Advisory Contracts, was aware that shareholders of the fund have a broad range of investment choices available to them, including a wide choice among funds offered by Fidelity's competitors, and that the fund's shareholders, who have the opportunity to review and weigh the disclosure provided by the fund in its prospectus and other public disclosures, have chosen to invest in this fund, which is part of the Fidelity family of funds.
Nature, Extent, and Quality of Services Provided. The Board considered Fidelity's staffing as it relates to the fund, including the backgrounds of investment personnel of Fidelity, and also considered the fund's investment objective, strategies, and related investment philosophy. The Independent Trustees also had discussions with senior management of Fidelity's investment operations and investment groups. The Board considered the structure of the portfolio manager compensation program and whether this structure provides appropriate incentives to act in the best interests of the fund. Additionally, the Board considered the portfolio managers' investments, if any, in the funds that they manage.Resources Dedicated to Investment Management and Support Services. The Board and the Fund Oversight and Research Committees reviewed the general qualifications and capabilities of Fidelity's investment staff, including its size, education, experience, and resources, as well as Fidelity's approach to recruiting, training, managing, and compensating investment personnel. The Board noted that Fidelity has continued to increase the resources devoted to non-U.S. offices, including expansion of Fidelity's global investment organization. The Board also noted that Fidelity's analysts have extensive resources, tools and capabilities that allow them to conduct sophisticated quantitative and fundamental analysis, as well as credit analysis of issuers, counterparties and guarantors. Further, the Board considered that Fidelity's investment professionals have sufficient access to global information and data so as to provide competitive investment results over time, and that those professionals also have access to sophisticated tools that permit them to assess portfolio construction and risk and performance attribution characteristics continuously, as well as to transmit new information and research conclusions rapidly around the world. Additionally, in its deliberations, the Board considered Fidelity's trading, risk management, and compliance capabilities and resources, which are integral parts of the investment management process.Shareholder and Administrative Services. The Board considered (i) the nature, extent, quality, and cost of advisory, administrative, and shareholder services performed by FMR, the sub-advisers (together with FMR, the Investment Advisers), and their affiliates under the Advisory Contracts and under separate agreements covering transfer agency, pricing and bookkeeping, and securities lending services for the fund; (ii) the nature and extent of the supervision of third party service providers, principally custodians and subcustodians; and (iii) the resources devoted to, and the record of compliance with, the fund's compliance policies and procedures. The Board also reviewed the allocation of fund brokerage, including allocations to brokers affiliated with the Investment Advisers, the use of brokerage commissions to pay fund expenses, and the use of "soft" commission dollars to pay for research services.The Board noted that the growth of fund assets over time across the complex allows Fidelity to reinvest in the development of services designed to enhance the value or convenience of the Fidelity funds as investment vehicles. These services include 24-hour access to account information and market information through telephone representatives and over the Internet, investor education materials and asset allocation tools, and the expanded availability of Fidelity Investor Centers.In 2014, the Board formed an ad hoc Committee on Transfer Agency Fees to review the variety of transfer agency fee structures throughout the industry and Fidelity's competitive positioning with respect to industry participants.Investment in a Large Fund Family. The Board considered the benefits to shareholders of investing in a Fidelity fund, including the benefits of investing in a fund that is part of a large family of funds offering a variety of investment disciplines and providing a large variety of mutual fund investor services. The Board noted that Fidelity had taken, or had made recommendations that resulted in the Fidelity funds taking, a number of actions over the previous year that benefited particular funds, including (i) continuing to dedicate additional resources to investment research and to the support of the senior management team that oversees asset management; (ii) continuing efforts to enhance Fidelity's global research capabilities; (iii) launching new funds and making other enhancements to meet client needs; (iv) reducing management fees and total expenses for certain index funds and diversified international funds; (v) continuing to launch dedicated lower cost underlying funds to meet portfolio construction needs related to expanding underlying fund options for Fidelity funds of funds, specifically for the Freedom Fund product lines; (vi) rationalizing product lines and gaining increased efficiencies through fund mergers; (vii) launching active fixed-income exchange-traded funds; (viii) continuing to develop, acquire and implement systems and technology to improve services to the funds and information security and to increase efficiency; (ix) implementing investment enhancements to further strengthen Fidelity's target date product line to increase investors' probability of success in achieving their goals; (x) modifying the eligibility criteria for certain share classes to accommodate roll-over assets from employer-sponsored retirement plans; (xi) launching a new Class W of the Freedom Index Funds to attract and retain Fidelity record-kept retirement plan assets; and (xii) implementing changes to Fidelity's money market product line in response to recent money market regulatory reforms.Investment Performance. The Board considered whether the fund has operated in accordance with its investment objective, as well as its record of compliance with its investment restrictions and its performance history.The Board took into account discussions with representatives of the Investment Advisers about fund investment performance that occur at Board meetings throughout the year. In this regard the Board noted that as part of regularly scheduled fund reviews and other reports to the Board on fund performance, the Board considers annualized return information for the fund, for different time periods, measured against a securities market index ("benchmark index") and a peer group of funds with similar objectives ("peer group"), if any. In its evaluation of fund investment performance, the Board gave particular attention to information indicating changes in performance of certain Fidelity funds for specific time periods and discussed with the Investment Advisers the reasons for any overperformance or underperformance.In addition to reviewing absolute and relative fund performance, the Independent Trustees periodically consider the appropriateness of fund performance metrics in evaluating the results achieved. In general, the Independent Trustees believe that fund performance should be evaluated based on net performance (after fees and expenses) of both the highest performing and lowest performing fund share classes, where applicable, compared to appropriate benchmark indices, over appropriate time periods that may include full market cycles, and compared to peer groups, as applicable, over the same periods, taking into account relevant factors including the following: general market conditions; issuer-specific information; and fund cash flows and other factors.The Independent Trustees recognize that shareholders evaluate performance on a net basis over their own holding periods, for which one-, three-, and five-year periods are often used as a proxy. For this reason, the performance information reviewed by the Board also included net cumulative calendar year total return information for the fund and an appropriate benchmark index and peer group for the most recent one-, three-, and five-year periods, as shown below. Returns are shown compared to the 25th percentile (top of box, 75% beaten) and 75th percentile (bottom of box, 25% beaten) of the peer universe.Fidelity Advisor Equity Income Fund
Fidelity Advisor Equity Income Fund
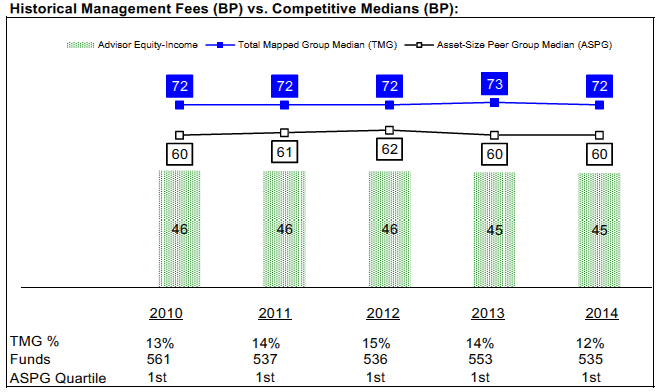
![]()
EPI-ANN-0116
1.539449.119
Fidelity Advisor® Equity Growth Fund Class Z Annual Report November 30, 2015 |
|
Contents
Board Approval of Investment Advisory Contracts and Management Fees |
To view a fund's proxy voting guidelines and proxy voting record for the 12-month period ended June 30, visit http://www.fidelity.com/proxyvotingresults or visit the Securities and Exchange Commission's (SEC) web site at http://www.sec.gov.
You may also call 1-877-208-0098 to request a free copy of the proxy voting guidelines.
Standard & Poor's, S&P and S&P 500 are registered service marks of The McGraw-Hill Companies, Inc. and have been licensed for use by Fidelity Distributors Corporation.
Other third-party marks appearing herein are the property of their respective owners.
All other marks appearing herein are registered or unregistered trademarks or service marks of FMR LLC or an affiliated company. © 2016 FMR LLC. All rights reserved.
This report and the financial statements contained herein are submitted for the general information of the shareholders of the Fund. This report is not authorized for distribution to prospective investors in the Fund unless preceded or accompanied by an effective prospectus.
A fund files its complete schedule of portfolio holdings with the SEC for the first and third quarters of each fiscal year on Form N-Q. Forms N-Q are available on the SEC’s web site at http://www.sec.gov. A fund's Forms N-Q may be reviewed and copied at the SEC’s Public Reference Room in Washington, DC. Information regarding the operation of the SEC's Public Reference Room may be obtained by calling 1-800-SEC-0330.
For a complete list of a fund's portfolio holdings, view the most recent holdings listing, semiannual report, or annual report on Fidelity's web site at http://www.fidelity.com, http://www.advisor.fidelity.com, or http://www.401k.com, as applicable.
NOT FDIC INSURED •MAY LOSE VALUE •NO BANK GUARANTEE
Neither the Fund nor Fidelity Distributors Corporation is a bank.
Performance: The Bottom Line
Average annual total return reflects the change in the value of an investment, assuming reinvestment of distributions from dividend income and capital gains (the profits earned upon the sale of securities that have grown in value, if any) and assuming a constant rate of performance each year.
The hypothetical investment and the average annual total returns do not reflect the deduction of taxes that a shareholder would pay on fund distributions or the redemption of fund shares.
During periods of reimbursement by Fidelity, a fund’s total return will be greater than it would be had the reimbursement not occurred.
How a fund did yesterday is no guarantee of how it will do tomorrow.
Average Annual Total Returns
| For the periods ended November 30, 2015 | Past 1 year | Past 5 years | Past 10 years |
| Class Z | 5.77% | 14.76% | 7.93% |
The initial offering of Class Z shares took place on August 13, 2013. Returns prior to August 13, 2013, are those of Class I.
$10,000 Over 10 Years
Let's say hypothetically that $10,000 was invested in Fidelity Advisor® Equity Growth Fund - Class Z on November 30, 2005.
The chart shows how the value of your investment would have changed, and also shows how the Russell 3000® Growth Index performed over the same period.
See previous page for additional information regarding the performance of Class Z.
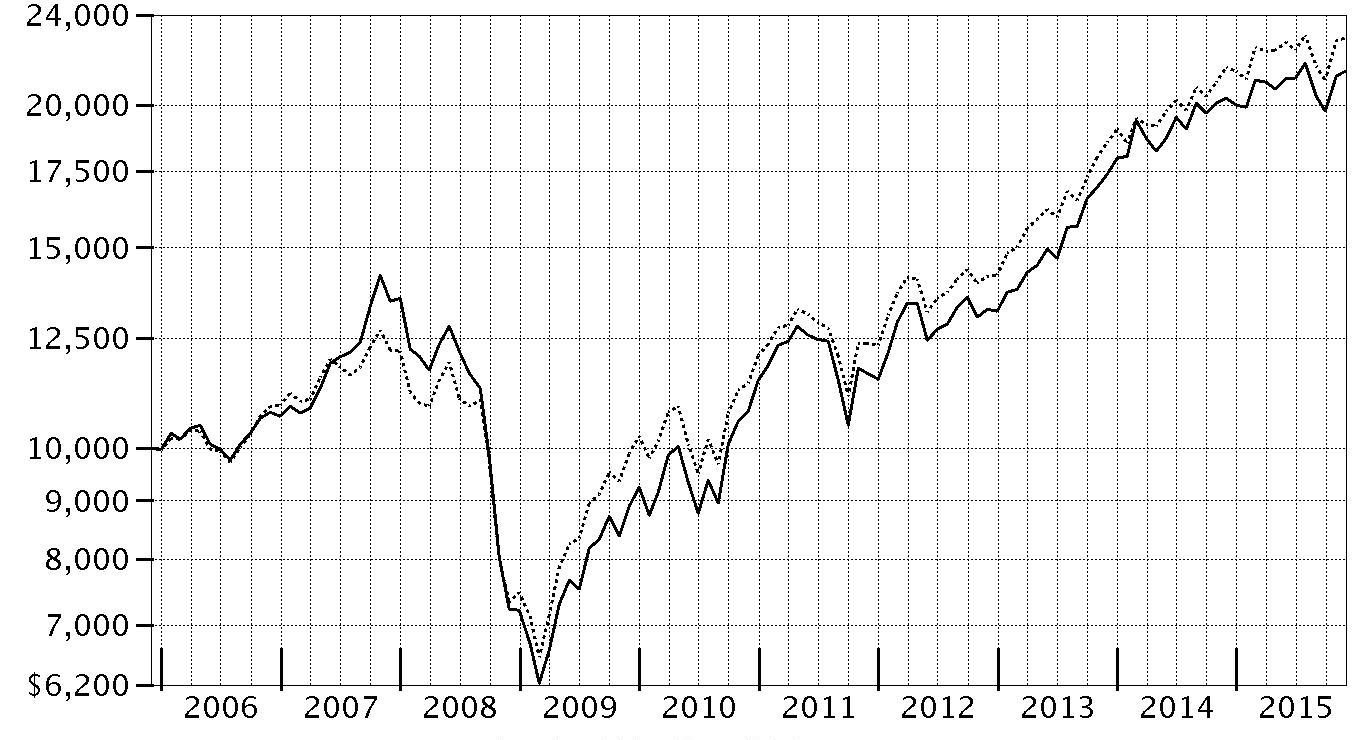
| Period Ending Values | ||
| $21,440 | Fidelity Advisor® Equity Growth Fund - Class Z | |
| $22,916 | Russell 3000® Growth Index | |
Management's Discussion of Fund Performance
Market Recap: U.S. stocks gained modestly for the 12 months ending November 30, 2015, despite a steep decline in August and September on concern about slowing economic growth in China. The S&P 500® index rebounded in October and gained 2.75% for the year. Stocks benefited late in the period amid waning expectations for a near-term interest-rate hike by the U.S. Federal Reserve, more economic stimulus in Europe and an interest-rate cut in China. Growth stocks in the benchmark far outpaced their value counterparts, as investors continued to seek growth in a subpar economic environment. Sector performance varied widely, with more than 26 percentage points separating the leader from the laggard. Consumer discretionary (+14%) secured the top spot, benefiting from a combination of rising personal income and still-benign inflation. Information technology (+7%) and health care (+4%) also outpaced the broad market. Conversely, the energy sector (-12%) performed worst, stymied by depressed commodity prices that also hit materials (-5%). Telecommunication services (-5%) and utilities (-4%), considered defensive sectors less sensitive to the economy, also lost ground. At period end, investors remained focused on the potential global implications of a stronger U.S. dollar and how China’s transition toward a consumption-led economy may affect corporate earnings.Comments from Portfolio Manager Jason Weiner: For the year, the fund’s share classes (excluding sales charges, if applicable) saw gains in the mid-single digits, lagging the 6.14% advance of the benchmark Russell 3000® Growth Index. Versus the benchmark, picks in food, beverage & tobacco, part of the consumer staples sector, weighed most on the fund's performance, largely due to the fund’s overweighting in Keurig Green Mountain – by far the largest individual detractor the past year. Keurig shares suffered partly due to the firm’s disappointing December 2014 launch of its second-generation brewing machine and subsequent consecutive quarters of lower-than-expected earnings and revenue. In November, the stock hit a nearly three-year low when an influential analyst reduced its forecast for Keurig’s sales due to lowered prices on its coffee brewers, decreased K-Cup volumes and weak demand for its new Kold machine. On the plus side, positioning in information technology's software & services industry was a big plus. From this group, the fund’s position in Facebook – the largest holding – was its biggest individual contributor by a wide margin. Facebook outperformed, partly in anticipation of second-quarter earnings that reflected a strong rise in advertising revenue and growth in the number of subscribers accessing its services on mobile devices. The firm continued to make progress with video advertising and announced new features geared toward small and medium-sized businesses.The views expressed above reflect those of the portfolio manager(s) only through the end of the period as stated on the cover of this report and do not necessarily represent the views of Fidelity or any other person in the Fidelity organization. Any such views are subject to change at any time based upon market or other conditions and Fidelity disclaims any responsibility to update such views. These views may not be relied on as investment advice and, because investment decisions for a Fidelity fund are based on numerous factors, may not be relied on as an indication of trading intent on behalf of any Fidelity fund.
Investment Summary (Unaudited)
Top Ten Stocks as of November 30, 2015
| % of fund's net assets | % of fund's net assets 6 months ago | |
| Facebook, Inc. Class A | 11.3 | 8.5 |
| Alphabet, Inc. Class A | 6.5 | 3.3 |
| Gilead Sciences, Inc. | 5.1 | 5.8 |
| Apple, Inc. | 2.9 | 6.9 |
| Amazon.com, Inc. | 2.7 | 0.5 |
| Salesforce.com, Inc. | 2.6 | 2.1 |
| Starbucks Corp. | 2.5 | 1.9 |
| Home Depot, Inc. | 2.4 | 1.8 |
| Avago Technologies Ltd. | 2.4 | 0.1 |
| Danaher Corp. | 2.3 | 1.8 |
| 40.7 |
Top Five Market Sectors as of November 30, 2015
| % of fund's net assets | % of fund's net assets 6 months ago | |
| Information Technology | 41.6 | 36.2 |
| Consumer Discretionary | 16.3 | 15.0 |
| Health Care | 15.7 | 18.5 |
| Industrials | 10.3 | 11.7 |
| Financials | 6.7 | 7.6 |
Asset Allocation (% of fund's net assets)
| As of November 30, 2015* | ||
| Stocks | 93.6% | |
| Convertible Securities | 0.9% | |
| Short-Term Investments and Net Other Assets (Liabilities) | 5.5% | |

* Foreign investments - 14.5%
| As of May 31, 2015* | ||
| Stocks | 96.5% | |
| Convertible Securities | 0.9% | |
| Short-Term Investments and Net Other Assets (Liabilities) | 2.6% | |

* Foreign investments - 14.1%
Investments November 30, 2015
Showing Percentage of Net Assets
| Common Stocks - 93.6% | |||
| Shares | Value (000s) | ||
| CONSUMER DISCRETIONARY - 16.2% | |||
| Automobiles - 0.7% | |||
| Tesla Motors, Inc. (a) | 91,300 | $21,023 | |
| Diversified Consumer Services - 1.3% | |||
| Bright Horizons Family Solutions, Inc. (a) | 166,600 | 11,051 | |
| Houghton Mifflin Harcourt Co. (a) | 221,900 | 4,385 | |
| Nord Anglia Education, Inc. (a) | 134,321 | 2,852 | |
| ServiceMaster Global Holdings, Inc. (a) | 487,300 | 18,264 | |
| 36,552 | |||
| Hotels, Restaurants & Leisure - 3.8% | |||
| Buffalo Wild Wings, Inc. (a) | 52,400 | 8,397 | |
| Chipotle Mexican Grill, Inc. (a) | 15,185 | 8,800 | |
| Domino's Pizza, Inc. | 184,800 | 19,860 | |
| Jubilant Foodworks Ltd. | 52,463 | 1,218 | |
| Starbucks Corp. | 1,161,402 | 71,298 | |
| 109,573 | |||
| Household Durables - 0.9% | |||
| Harman International Industries, Inc. | 185,100 | 19,095 | |
| Toll Brothers, Inc. (a) | 205,800 | 7,652 | |
| 26,747 | |||
| Internet & Catalog Retail - 3.6% | |||
| Amazon.com, Inc. (a) | 117,800 | 78,313 | |
| Netflix, Inc. (a) | 150,700 | 18,586 | |
| NutriSystem, Inc. | 122,400 | 2,808 | |
| Travelport Worldwide Ltd. | 143,600 | 1,911 | |
| 101,618 | |||
| Leisure Products - 0.0% | |||
| NJOY, Inc. (a)(b) | 202,642 | 0 | |
| Specialty Retail - 4.2% | |||
| AutoZone, Inc. (a) | 11,100 | 8,700 | |
| Five Below, Inc. (a)(c) | 335,100 | 9,386 | |
| Home Depot, Inc. | 518,244 | 69,383 | |
| L Brands, Inc. | 87,200 | 8,320 | |
| Lowe's Companies, Inc. | 152,700 | 11,697 | |
| MarineMax, Inc. (a) | 209,400 | 3,801 | |
| Restoration Hardware Holdings, Inc. (a) | 2,800 | 252 | |
| Ulta Salon, Cosmetics & Fragrance, Inc. (a) | 58,274 | 9,732 | |
| 121,271 | |||
| Textiles, Apparel & Luxury Goods - 1.7% | |||
| Kate Spade & Co. (a) | 1,104,724 | 22,139 | |
| NIKE, Inc. Class B | 209,257 | 27,681 | |
| 49,820 | |||
| TOTAL CONSUMER DISCRETIONARY | 466,604 | ||
| CONSUMER STAPLES - 3.2% | |||
| Beverages - 0.5% | |||
| Kweichow Moutai Co. Ltd. | 64,130 | 2,148 | |
| The Coca-Cola Co. | 317,626 | 13,537 | |
| 15,685 | |||
| Food & Staples Retailing - 0.7% | |||
| CVS Health Corp. | 135,900 | 12,787 | |
| Whole Foods Market, Inc. | 248,083 | 7,232 | |
| 20,019 | |||
| Food Products - 0.4% | |||
| Keurig Green Mountain, Inc. | 240,691 | 12,612 | |
| Household Products - 0.3% | |||
| Procter & Gamble Co. | 104,691 | 7,835 | |
| Personal Products - 1.3% | |||
| Avon Products, Inc. | 287,500 | 992 | |
| Estee Lauder Companies, Inc. Class A | 101,200 | 8,513 | |
| Herbalife Ltd. (a) | 466,166 | 26,912 | |
| 36,417 | |||
| TOTAL CONSUMER STAPLES | 92,568 | ||
| ENERGY - 0.3% | |||
| Oil, Gas & Consumable Fuels - 0.3% | |||
| Golar LNG Ltd. | 264,848 | 7,244 | |
| FINANCIALS - 6.7% | |||
| Banks - 0.9% | |||
| First Republic Bank | 302,800 | 20,851 | |
| HDFC Bank Ltd. (a) | 68,446 | 1,319 | |
| M&T Bank Corp. | 25,400 | 3,183 | |
| 25,353 | |||
| Capital Markets - 2.8% | |||
| BlackRock, Inc. Class A | 42,000 | 15,276 | |
| E*TRADE Financial Corp. (a) | 850,445 | 25,879 | |
| HFF, Inc. | 199,700 | 6,864 | |
| Invesco Ltd. | 282,523 | 9,518 | |
| JMP Group, Inc. | 141,100 | 872 | |
| PJT Partners, Inc. (a) | 21,880 | 513 | |
| The Blackstone Group LP | 451,933 | 14,114 | |
| Virtus Investment Partners, Inc. | 51,400 | 7,003 | |
| 80,039 | |||
| Diversified Financial Services - 1.4% | |||
| Berkshire Hathaway, Inc. Class B (a) | 55,800 | 7,482 | |
| McGraw Hill Financial, Inc. | 246,875 | 23,816 | |
| MSCI, Inc. Class A | 114,600 | 8,036 | |
| 39,334 | |||
| Real Estate Investment Trusts - 0.6% | |||
| American Tower Corp. | 174,400 | 17,332 | |
| Real Estate Management & Development - 0.8% | |||
| Realogy Holdings Corp. (a) | 594,918 | 24,576 | |
| Thrifts & Mortgage Finance - 0.2% | |||
| Essent Group Ltd. (a) | 229,300 | 5,668 | |
| TOTAL FINANCIALS | 192,302 | ||
| HEALTH CARE - 15.7% | |||
| Biotechnology - 9.9% | |||
| Amgen, Inc. | 178,100 | 28,692 | |
| BioMarin Pharmaceutical, Inc. (a) | 161,679 | 15,419 | |
| Celgene Corp. (a) | 161,600 | 17,687 | |
| Cytokinetics, Inc. warrants 6/25/17 (a) | 856,620 | 974 | |
| Gilead Sciences, Inc. | 1,388,047 | 147,077 | |
| Insmed, Inc. (a) | 744,220 | 12,138 | |
| Medivation, Inc. (a) | 794,600 | 33,596 | |
| Vertex Pharmaceuticals, Inc. (a) | 231,700 | 29,973 | |
| 285,556 | |||
| Health Care Equipment & Supplies - 0.6% | |||
| Medtronic PLC | 138,800 | 10,457 | |
| Novadaq Technologies, Inc. (a) | 575,300 | 7,007 | |
| 17,464 | |||
| Health Care Providers & Services - 0.3% | |||
| Express Scripts Holding Co. (a) | 111,500 | 9,531 | |
| Pharmaceuticals - 4.9% | |||
| Astellas Pharma, Inc. | 3,065,000 | 43,137 | |
| Teva Pharmaceutical Industries Ltd. sponsored ADR | 533,300 | 33,561 | |
| Valeant Pharmaceuticals International, Inc. (Canada) (a) | 701,100 | 63,183 | |
| 139,881 | |||
| TOTAL HEALTH CARE | 452,432 | ||
| INDUSTRIALS - 10.3% | |||
| Aerospace & Defense - 1.3% | |||
| Textron, Inc. | 340,200 | 14,516 | |
| TransDigm Group, Inc. (a) | 102,177 | 23,974 | |
| 38,490 | |||
| Air Freight & Logistics - 0.7% | |||
| United Parcel Service, Inc. Class B | 178,600 | 18,398 | |
| Airlines - 0.7% | |||
| Ryanair Holdings PLC sponsored ADR | 262,060 | 20,152 | |
| Building Products - 0.8% | |||
| A.O. Smith Corp. | 138,138 | 11,018 | |
| Caesarstone Sdot-Yam Ltd. | 258,500 | 10,567 | |
| 21,585 | |||
| Electrical Equipment - 0.8% | |||
| Acuity Brands, Inc. | 52,200 | 12,052 | |
| AMETEK, Inc. | 199,955 | 11,289 | |
| 23,341 | |||
| Industrial Conglomerates - 3.1% | |||
| Danaher Corp. | 674,214 | 64,987 | |
| Roper Industries, Inc. | 126,169 | 24,412 | |
| 89,399 | |||
| Professional Services - 1.6% | |||
| CEB, Inc. | 42,300 | 3,269 | |
| Equifax, Inc. | 48,900 | 5,452 | |
| Resources Connection, Inc. | 311,700 | 5,689 | |
| Robert Half International, Inc. | 287,800 | 14,730 | |
| WageWorks, Inc. (a) | 392,900 | 16,714 | |
| 45,854 | |||
| Road & Rail - 0.0% | |||
| Swift Transporation Co. (a) | 43,100 | 688 | |
| Trading Companies & Distributors - 1.3% | |||
| HD Supply Holdings, Inc. (a) | 1,084,400 | 34,300 | |
| Summit Ascent Holdings Ltd. (a) | 5,330,000 | 2,530 | |
| 36,830 | |||
| TOTAL INDUSTRIALS | 294,737 | ||
| INFORMATION TECHNOLOGY - 40.8% | |||
| Communications Equipment - 0.1% | |||
| QUALCOMM, Inc. | 74,400 | 3,630 | |
| Electronic Equipment & Components - 0.2% | |||
| CDW Corp. | 100,000 | 4,317 | |
| TE Connectivity Ltd. | 19,423 | 1,303 | |
| 5,620 | |||
| Internet Software & Services - 21.5% | |||
| 58.com, Inc. ADR (a) | 99,200 | 5,973 | |
| Alibaba Group Holding Ltd. sponsored ADR (a) | 335,700 | 28,226 | |
| Alphabet, Inc.: | |||
| Class A (a) | 244,150 | 186,250 | |
| Class C | 42,136 | 31,290 | |
| Cvent, Inc. (a) | 324,878 | 11,738 | |
| Demandware, Inc. (a)(c) | 155,704 | 7,964 | |
| Facebook, Inc. Class A (a) | 3,112,400 | 324,433 | |
| Just Dial Ltd. | 139,013 | 1,965 | |
| JUST EAT Ltd. (a) | 825,555 | 5,478 | |
| Shopify, Inc. Class A (c) | 3,600 | 95 | |
| Textura Corp. (a) | 409,489 | 9,889 | |
| Zillow Group, Inc. (a)(c) | 69,800 | 1,817 | |
| Zillow Group, Inc. Class C (a)(c) | 139,600 | 3,441 | |
| 618,559 | |||
| IT Services - 3.3% | |||
| Cognizant Technology Solutions Corp. Class A (a) | 445,300 | 28,757 | |
| Global Payments, Inc. | 75,200 | 5,328 | |
| MasterCard, Inc. Class A | 81,000 | 7,932 | |
| Visa, Inc. Class A | 672,532 | 53,137 | |
| 95,154 | |||
| Semiconductors & Semiconductor Equipment - 3.0% | |||
| Avago Technologies Ltd. | 518,300 | 67,612 | |
| Maxim Integrated Products, Inc. | 168,728 | 6,542 | |
| Monolithic Power Systems, Inc. | 162,432 | 11,099 | |
| 85,253 | |||
| Software - 9.8% | |||
| Activision Blizzard, Inc. | 246,600 | 9,287 | |
| Adobe Systems, Inc. (a) | 432,300 | 39,538 | |
| Computer Modelling Group Ltd. | 627,900 | 4,885 | |
| CyberArk Software Ltd. (a)(c) | 214,800 | 9,299 | |
| Electronic Arts, Inc. (a) | 767,645 | 52,039 | |
| Fleetmatics Group PLC (a) | 308,600 | 18,423 | |
| HubSpot, Inc. (a) | 176,800 | 9,584 | |
| Intuit, Inc. | 56,500 | 5,661 | |
| Mobileye NV (a)(c) | 416,200 | 18,146 | |
| Red Hat, Inc. (a) | 280,800 | 22,860 | |
| Salesforce.com, Inc. (a) | 928,292 | 73,976 | |
| ServiceNow, Inc. (a) | 215,100 | 18,716 | |
| 282,414 | |||
| Technology Hardware, Storage & Peripherals - 2.9% | |||
| Apple, Inc. | 693,427 | 82,032 | |
| TOTAL INFORMATION TECHNOLOGY | 1,172,662 | ||
| MATERIALS - 0.2% | |||
| Chemicals - 0.2% | |||
| CF Industries Holdings, Inc. | 134,100 | 6,187 | |
| TELECOMMUNICATION SERVICES - 0.2% | |||
| Wireless Telecommunication Services - 0.2% | |||
| SBA Communications Corp. Class A (a) | 53,500 | 5,626 | |
| TOTAL COMMON STOCKS | |||
| (Cost $2,142,764) | 2,690,362 | ||
| Convertible Preferred Stocks - 0.9% | |||
| CONSUMER DISCRETIONARY - 0.1% | |||
| Household Durables - 0.1% | |||
| Blu Homes, Inc. Series A, 5.00% (a)(b) | 875,350 | 3,782 | |
| INFORMATION TECHNOLOGY - 0.8% | |||
| Internet Software & Services - 0.7% | |||
| Uber Technologies, Inc. Series D, 8.00% (a)(b) | 485,012 | 19,226 | |
| IT Services - 0.1% | |||
| AppNexus, Inc. Series E (a)(b) | 105,425 | 2,116 | |
| TOTAL INFORMATION TECHNOLOGY | 21,342 | ||
| TOTAL CONVERTIBLE PREFERRED STOCKS | |||
| (Cost $13,680) | 25,124 | ||
| Money Market Funds - 6.5% | |||
| Fidelity Cash Central Fund, 0.18% (d) | 159,225,900 | 159,226 | |
| Fidelity Securities Lending Cash Central Fund, 0.22% (d)(e) | 28,009,728 | 28,010 | |
| TOTAL MONEY MARKET FUNDS | |||
| (Cost $187,236) | 187,236 | ||
| TOTAL INVESTMENT PORTFOLIO - 101.0% | |||
| (Cost $2,343,680) | 2,902,722 | ||
| NET OTHER ASSETS (LIABILITIES) - (1.0)% | (27,550) | ||
| NET ASSETS - 100% | $2,875,172 |
Values shown as $0 may reflect amounts less than $500.
Legend
(a) Non-income producing
(b) Restricted securities - Investment in securities not registered under the Securities Act of 1933 (excluding 144A issues). At the end of the period, the value of restricted securities (excluding 144A issues) amounted to $25,123,000 or 0.9% of net assets.
(c) Security or a portion of the security is on loan at period end.
(d) Affiliated fund that is generally available only to investment companies and other accounts managed by Fidelity Investments. The rate quoted is the annualized seven-day yield of the fund at period end. A complete unaudited listing of the fund's holdings as of its most recent quarter end is available upon request. In addition, each Fidelity Central Fund's financial statements, which are not covered by the Fund's Report of Independent Registered Public Accounting Firm, are available on the SEC's website or upon request.
(e) Investment made with cash collateral received from securities on loan.
Additional information on each restricted holding is as follows:
| Security | Acquisition Date | Acquisition Cost (000s) |
| AppNexus, Inc. Series E | 8/1/14 | $2,112 |
| Blu Homes, Inc. Series A, 5.00% | 6/21/13 | $4,044 |
| NJOY, Inc. | 9/11/13 | $1,637 |
| Uber Technologies, Inc. Series D, 8.00% | 6/6/14 | $7,524 |
Affiliated Central Funds
Information regarding fiscal year to date income earned by the Fund from investments in Fidelity Central Funds is as follows:
| Fund | Income earned |
| (Amounts in thousands) | |
| Fidelity Cash Central Fund | $222 |
| Fidelity Securities Lending Cash Central Fund | 515 |
| Total | $737 |
Investment Valuation
The following is a summary of the inputs used, as of November 30, 2015, involving the Fund's assets and liabilities carried at fair value. The inputs or methodology used for valuing securities may not be an indication of the risk associated with investing in those securities. For more information on valuation inputs, and their aggregation into the levels used below, please refer to the Investment Valuation section in the accompanying Notes to Financial Statements.
| Valuation Inputs at Reporting Date: | ||||
| Description | Total | Level 1 | Level 2 | Level 3 |
| (Amounts in thousands) | ||||
| Investments in Securities: | ||||
| Equities: | ||||
| Consumer Discretionary | $470,386 | $466,604 | $-- | $3,782 |
| Consumer Staples | 92,568 | 92,568 | -- | -- |
| Energy | 7,244 | 7,244 | -- | -- |
| Financials | 192,302 | 190,983 | 1,319 | -- |
| Health Care | 452,432 | 408,321 | 44,111 | -- |
| Industrials | 294,737 | 294,737 | -- | -- |
| Information Technology | 1,194,004 | 1,172,662 | -- | 21,342 |
| Materials | 6,187 | 6,187 | -- | -- |
| Telecommunication Services | 5,626 | 5,626 | -- | -- |
| Money Market Funds | 187,236 | 187,236 | -- | -- |
| Total Investments in Securities: | $2,902,722 | $2,832,168 | $45,430 | $25,124 |
Other Information
Distribution of investments by country or territory of incorporation, as a percentage of Total Net Assets, is as follows (Unaudited):
| United States of America | 85.5% |
| Canada | 2.6% |
| Singapore | 2.4% |
| Cayman Islands | 2.3% |
| Israel | 1.9% |
| Ireland | 1.7% |
| Japan | 1.5% |
| Bermuda | 1.0% |
| Others (Individually Less Than 1%) | 1.1% |
| 100.0% |
See accompanying notes which are an integral part of the financial statements.
Financial Statements
Statement of Assets and Liabilities
| Amounts in thousands (except per-share amounts) | November 30, 2015 | |
| Assets | ||
| Investment in securities, at value (including securities loaned of $27,374) — See accompanying schedule: Unaffiliated issuers (cost $2,156,444) | $2,715,486 | |
| Fidelity Central Funds (cost $187,236) | 187,236 | |
| Total Investments (cost $2,343,680) | $2,902,722 | |
| Receivable for investments sold | 3,674 | |
| Receivable for fund shares sold | 2,258 | |
| Dividends receivable | 1,468 | |
| Distributions receivable from Fidelity Central Funds | 73 | |
| Prepaid expenses | 7 | |
| Other receivables | 153 | |
| Total assets | 2,910,355 | |
| Liabilities | ||
| Payable for fund shares redeemed | $4,250 | |
| Accrued management fee | 1,312 | |
| Distribution and service plan fees payable | 888 | |
| Other affiliated payables | 525 | |
| Other payables and accrued expenses | 198 | |
| Collateral on securities loaned, at value | 28,010 | |
| Total liabilities | 35,183 | |
| Net Assets | $2,875,172 | |
| Net Assets consist of: | ||
| Paid in capital | $2,258,565 | |
| Accumulated net investment loss | (9,672) | |
| Accumulated undistributed net realized gain (loss) on investments and foreign currency transactions | 67,246 | |
| Net unrealized appreciation (depreciation) on investments and assets and liabilities in foreign currencies | 559,033 | |
| Net Assets | $2,875,172 | |
| Calculation of Maximum Offering Price | ||
| Class A: | ||
| Net Asset Value and redemption price per share ($887,025 ÷ 8,979.10 shares) | $98.79 | |
| Maximum offering price per share (100/94.25 of $98.79) | $104.82 | |
| Class T: | ||
| Net Asset Value and redemption price per share ($1,305,911 ÷ 13,369.18 shares) | $97.68 | |
| Maximum offering price per share (100/96.50 of $97.68) | $101.22 | |
| Class B: | ||
| Net Asset Value and offering price per share ($10,751 ÷ 124.43 shares)(a) | $86.40 | |
| Class C: | ||
| Net Asset Value and offering price per share ($183,004 ÷ 2,079.42 shares)(a) | $88.01 | |
| Class I: | ||
| Net Asset Value, offering price and redemption price per share ($462,843 ÷ 4,364.12 shares) | $106.06 | |
| Class Z: | ||
| Net Asset Value, offering price and redemption price per share ($25,638 ÷ 240.98 shares) | $106.39 |
(a) Redemption price per share is equal to net asset value less any applicable contingent deferred sales charge.
See accompanying notes which are an integral part of the financial statements.
Statement of Operations
| Amounts in thousands | Year ended November 30, 2015 | |
| Investment Income | ||
| Dividends | $25,162 | |
| Income from Fidelity Central Funds | 737 | |
| Total income | 25,899 | |
| Expenses | ||
| Management fee | $15,573 | |
| Transfer agent fees | 5,535 | |
| Distribution and service plan fees | 10,779 | |
| Accounting and security lending fees | 844 | |
| Custodian fees and expenses | 54 | |
| Independent trustees' compensation | 13 | |
| Registration fees | 133 | |
| Audit | 76 | |
| Legal | 20 | |
| Miscellaneous | 20 | |
| Total expenses before reductions | 33,047 | |
| Expense reductions | (173) | 32,874 |
| Net investment income (loss) | (6,975) | |
| Realized and Unrealized Gain (Loss) | ||
| Net realized gain (loss) on: | ||
| Investment securities: | ||
| Unaffiliated issuers | 205,402 | |
| Foreign currency transactions | (81) | |
| Total net realized gain (loss) | 205,321 | |
| Change in net unrealized appreciation (depreciation) on: Investment securities | (53,555) | |
| Assets and liabilities in foreign currencies | (2) | |
| Total change in net unrealized appreciation (depreciation) | (53,557) | |
| Net gain (loss) | 151,764 | |
| Net increase (decrease) in net assets resulting from operations | $144,789 |
See accompanying notes which are an integral part of the financial statements.
Statement of Changes in Net Assets
| Amounts in thousands | Year ended November 30, 2015 | Year ended November 30, 2014 |
| Increase (Decrease) in Net Assets | ||
| Operations | ||
| Net investment income (loss) | $(6,975) | $(4,201) |
| Net realized gain (loss) | 205,321 | 701,406 |
| Change in net unrealized appreciation (depreciation) | (53,557) | (219,078) |
| Net increase (decrease) in net assets resulting from operations | 144,789 | 478,127 |
| Share transactions - net increase (decrease) | (115,712) | (1,134,005) |
| Total increase (decrease) in net assets | 29,077 | (655,878) |
| Net Assets | ||
| Beginning of period | 2,846,095 | 3,501,973 |
| End of period (including accumulated net investment loss of $9,672 and accumulated net investment loss of $7,916, respectively) | $2,875,172 | $2,846,095 |
See accompanying notes which are an integral part of the financial statements.
Financial Highlights — Fidelity Advisor Equity Growth Fund Class A
| Years ended November 30, | 2015 | 2014 | 2013 | 2012 | 2011 |
| Selected Per–Share Data | |||||
| Net asset value, beginning of period | $93.78 | $80.87 | $61.77 | $54.56 | $50.75 |
| Income from Investment Operations | |||||
| Net investment income (loss)A | (.13) | (.07) | (.05) | .02 | (.04) |
| Net realized and unrealized gain (loss) | 5.14 | 12.98 | 19.15 | 7.30 | 3.90 |
| Total from investment operations | 5.01 | 12.91 | 19.10 | 7.32 | 3.86 |
| Distributions from net realized gain | – | – | – | (.11) | (.05) |
| Net asset value, end of period | $98.79 | $93.78 | $80.87 | $61.77 | $54.56 |
| Total ReturnB,C | 5.34% | 15.96% | 30.92% | 13.45% | 7.61% |
| Ratios to Average Net AssetsD,E | |||||
| Expenses before reductions | 1.05% | 1.07% | 1.11% | 1.14% | 1.15% |
| Expenses net of fee waivers, if any | 1.05% | 1.07% | 1.11% | 1.14% | 1.15% |
| Expenses net of all reductions | 1.04% | 1.07% | 1.10% | 1.14% | 1.14% |
| Net investment income (loss) | (.13)% | (.08)% | (.07)% | .04% | (.08)% |
| Supplemental Data | |||||
| Net assets, end of period (in millions) | $887 | $853 | $772 | $632 | $609 |
| Portfolio turnover rateF | 63% | 49%G | 81% | 73% | 70% |
A Calculated based on average shares outstanding during the period.
B Total returns would have been lower if certain expenses had not been reduced during the applicable periods shown.
C Total returns do not include the effect of the sales charges.
D Fees and expenses of any underlying Fidelity Central Funds are not included in the Fund's expense ratio. The Fund indirectly bears its proportionate share of the expenses of any underlying Fidelity Central Funds.
E Expense ratios reflect operating expenses of the class. Expenses before reductions do not reflect amounts reimbursed by the investment adviser or reductions from brokerage service arrangements or reductions from other expense offset arrangements and do not represent the amount paid by the class during periods when reimbursements or reductions occur. Expenses net of fee waivers reflect expenses after reimbursement by the investment adviser but prior to reductions from brokerage service arrangements or other expense offset arrangements. Expenses net of all reductions represent the net expenses paid by the class.
F Amount does not include the portfolio activity of any underlying Fidelity Central Funds.
G Portfolio turnover rate excludes securities received or delivered in-kind.
See accompanying notes which are an integral part of the financial statements.
Financial Highlights — Fidelity Advisor Equity Growth Fund Class T
| Years ended November 30, | 2015 | 2014 | 2013 | 2012 | 2011 |
| Selected Per–Share Data | |||||
| Net asset value, beginning of period | $92.94 | $80.31 | $61.45 | $54.26 | $50.51 |
| Income from Investment Operations | |||||
| Net investment income (loss)A | (.34) | (.25) | (.17) | (.08) | (.14) |
| Net realized and unrealized gain (loss) | 5.08 | 12.88 | 19.03 | 7.27 | 3.89 |
| Total from investment operations | 4.74 | 12.63 | 18.86 | 7.19 | 3.75 |
| Net asset value, end of period | $97.68 | $92.94 | $80.31 | $61.45 | $54.26 |
| Total ReturnB,C | 5.10% | 15.73% | 30.69% | 13.25% | 7.42% |
| Ratios to Average Net AssetsD,E | |||||
| Expenses before reductions | 1.27% | 1.28% | 1.29% | 1.31% | 1.32% |
| Expenses net of fee waivers, if any | 1.27% | 1.28% | 1.29% | 1.31% | 1.32% |
| Expenses net of all reductions | 1.27% | 1.28% | 1.28% | 1.31% | 1.31% |
| Net investment income (loss) | (.36)% | (.29)% | (.25)% | (.13)% | (.25)% |
| Supplemental Data | |||||
| Net assets, end of period (in millions) | $1,306 | $1,368 | $1,283 | $1,108 | $1,139 |
| Portfolio turnover rateF | 63% | 49%G | 81% | 73% | 70% |
A Calculated based on average shares outstanding during the period.
B Total returns would have been lower if certain expenses had not been reduced during the applicable periods shown.
C Total returns do not include the effect of the sales charges.
D Fees and expenses of any underlying Fidelity Central Funds are not included in the Fund's expense ratio. The Fund indirectly bears its proportionate share of the expenses of any underlying Fidelity Central Funds.
E Expense ratios reflect operating expenses of the class. Expenses before reductions do not reflect amounts reimbursed by the investment adviser or reductions from brokerage service arrangements or reductions from other expense offset arrangements and do not represent the amount paid by the class during periods when reimbursements or reductions occur. Expenses net of fee waivers reflect expenses after reimbursement by the investment adviser but prior to reductions from brokerage service arrangements or other expense offset arrangements. Expenses net of all reductions represent the net expenses paid by the class.
F Amount does not include the portfolio activity of any underlying Fidelity Central Funds.
G Portfolio turnover rate excludes securities received or delivered in-kind.
See accompanying notes which are an integral part of the financial statements.
Financial Highlights — Fidelity Advisor Equity Growth Fund Class B
| Years ended November 30, | 2015 | 2014 | 2013 | 2012 | 2011 |
| Selected Per–Share Data | |||||
| Net asset value, beginning of period | $82.71 | $71.91 | $55.36 | $49.17 | $46.04 |
| Income from Investment Operations | |||||
| Net investment income (loss)A | (.82) | (.70) | (.52) | (.39) | (.42) |
| Net realized and unrealized gain (loss) | 4.51 | 11.50 | 17.07 | 6.58 | 3.55 |
| Total from investment operations | 3.69 | 10.80 | 16.55 | 6.19 | 3.13 |
| Net asset value, end of period | $86.40 | $82.71 | $71.91 | $55.36 | $49.17 |
| Total ReturnB,C | 4.46% | 15.02% | 29.90% | 12.59% | 6.80% |
| Ratios to Average Net AssetsD,E | |||||
| Expenses before reductions | 1.89% | 1.89% | 1.89% | 1.90% | 1.90% |
| Expenses net of fee waivers, if any | 1.89% | 1.89% | 1.89% | 1.90% | 1.90% |
| Expenses net of all reductions | 1.89% | 1.89% | 1.88% | 1.90% | 1.90% |
| Net investment income (loss) | (.98)% | (.91)% | (.85)% | (.72)% | (.83)% |
| Supplemental Data | |||||
| Net assets, end of period (in millions) | $11 | $18 | $23 | $26 | $35 |
| Portfolio turnover rateF | 63% | 49%G | 81% | 73% | 70% |
A Calculated based on average shares outstanding during the period.
B Total returns would have been lower if certain expenses had not been reduced during the applicable periods shown.
C Total returns do not include the effect of the contingent deferred sales charge.
D Fees and expenses of any underlying Fidelity Central Funds are not included in the Fund's expense ratio. The Fund indirectly bears its proportionate share of the expenses of any underlying Fidelity Central Funds.
E Expense ratios reflect operating expenses of the class. Expenses before reductions do not reflect amounts reimbursed by the investment adviser or reductions from brokerage service arrangements or reductions from other expense offset arrangements and do not represent the amount paid by the class during periods when reimbursements or reductions occur. Expenses net of fee waivers reflect expenses after reimbursement by the investment adviser but prior to reductions from brokerage service arrangements or other expense offset arrangements. Expenses net of all reductions represent the net expenses paid by the class.
F Amount does not include the portfolio activity of any underlying Fidelity Central Funds.
G Portfolio turnover rate excludes securities received or delivered in-kind.
See accompanying notes which are an integral part of the financial statements.
Financial Highlights — Fidelity Advisor Equity Growth Fund Class C
| Years ended November 30, | 2015 | 2014 | 2013 | 2012 | 2011 |
| Selected Per–Share Data | |||||
| Net asset value, beginning of period | $84.18 | $73.13 | $56.27 | $49.96 | $46.77 |
| Income from Investment Operations | |||||
| Net investment income (loss)A | (.77) | (.66) | (.50) | (.37) | (.41) |
| Net realized and unrealized gain (loss) | 4.60 | 11.71 | 17.36 | 6.68 | 3.60 |
| Total from investment operations | 3.83 | 11.05 | 16.86 | 6.31 | 3.19 |
| Net asset value, end of period | $88.01 | $84.18 | $73.13 | $56.27 | $49.96 |
| Total ReturnB,C | 4.55% | 15.11% | 29.96% | 12.63% | 6.82% |
| Ratios to Average Net AssetsD,E | |||||
| Expenses before reductions | 1.81% | 1.81% | 1.84% | 1.86% | 1.88% |
| Expenses net of fee waivers, if any | 1.81% | 1.81% | 1.84% | 1.86% | 1.88% |
| Expenses net of all reductions | 1.80% | 1.81% | 1.83% | 1.86% | 1.87% |
| Net investment income (loss) | (.89)% | (.83)% | (.79)% | (.68)% | (.81)% |
| Supplemental Data | |||||
| Net assets, end of period (in millions) | $183 | $175 | $157 | $133 | $136 |
| Portfolio turnover rateF | 63% | 49%G | 81% | 73% | 70% |
A Calculated based on average shares outstanding during the period.
B Total returns would have been lower if certain expenses had not been reduced during the applicable periods shown.
C Total returns do not include the effect of the contingent deferred sales charge.
D Fees and expenses of any underlying Fidelity Central Funds are not included in the Fund's expense ratio. The Fund indirectly bears its proportionate share of the expenses of any underlying Fidelity Central Funds.
E Expense ratios reflect operating expenses of the class. Expenses before reductions do not reflect amounts reimbursed by the investment adviser or reductions from brokerage service arrangements or reductions from other expense offset arrangements and do not represent the amount paid by the class during periods when reimbursements or reductions occur. Expenses net of fee waivers reflect expenses after reimbursement by the investment adviser but prior to reductions from brokerage service arrangements or other expense offset arrangements. Expenses net of all reductions represent the net expenses paid by the class.
F Amount does not include the portfolio activity of any underlying Fidelity Central Funds.
G Portfolio turnover rate excludes securities received or delivered in-kind.
See accompanying notes which are an integral part of the financial statements.
Financial Highlights — Fidelity Advisor Equity Growth Fund Class I
| Years ended November 30, | 2015 | 2014 | 2013 | 2012 | 2011 |
| Selected Per–Share Data | |||||
| Net asset value, beginning of period | $100.40 | $86.32 | $65.92 | $58.24 | $54.14 |
| Income from Investment Operations | |||||
| Net investment income (loss)A | .15 | .20 | .20 | .25 | .16 |
| Net realized and unrealized gain (loss) | 5.51 | 13.88 | 20.40 | 7.75 | 4.16 |
| Total from investment operations | 5.66 | 14.08 | 20.60 | 8.00 | 4.32 |
| Distributions from net investment income | – | – | (.20) | – | – |
| Distributions from net realized gain | – | – | – | (.32) | (.22) |
| Total distributions | – | – | (.20) | (.32) | (.22) |
| Net asset value, end of period | $106.06 | $100.40 | $86.32 | $65.92 | $58.24 |
| Total ReturnB | 5.64% | 16.31% | 31.36% | 13.83% | 7.99% |
| Ratios to Average Net AssetsC,D | |||||
| Expenses before reductions | .78% | .77% | .78% | .80% | .80% |
| Expenses net of fee waivers, if any | .77% | .77% | .78% | .80% | .80% |
| Expenses net of all reductions | .77% | .77% | .77% | .79% | .79% |
| Net investment income (loss) | .14% | .21% | .27% | .39% | .27% |
| Supplemental Data | |||||
| Net assets, end of period (in millions) | $463 | $432 | $1,266 | $1,063 | $897 |
| Portfolio turnover rateE | 63% | 49%F | 81% | 73% | 70% |
A Calculated based on average shares outstanding during the period.
B Total returns would have been lower if certain expenses had not been reduced during the applicable periods shown.
C Fees and expenses of any underlying Fidelity Central Funds are not included in the Fund's expense ratio. The Fund indirectly bears its proportionate share of the expenses of any underlying Fidelity Central Funds.
D Expense ratios reflect operating expenses of the class. Expenses before reductions do not reflect amounts reimbursed by the investment adviser or reductions from brokerage service arrangements or reductions from other expense offset arrangements and do not represent the amount paid by the class during periods when reimbursements or reductions occur. Expenses net of fee waivers reflect expenses after reimbursement by the investment adviser but prior to reductions from brokerage service arrangements or other expense offset arrangements. Expenses net of all reductions represent the net expenses paid by the class.
E Amount does not include the portfolio activity of any underlying Fidelity Central Funds.
F Portfolio turnover rate excludes securities received or delivered in-kind.
See accompanying notes which are an integral part of the financial statements.
Financial Highlights — Fidelity Advisor Equity Growth Fund Class Z
| Years ended November 30, | 2015 | 2014 | 2013 A |
| Selected Per–Share Data | |||
| Net asset value, beginning of period | $100.59 | $86.36 | $78.49 |
| Income from Investment Operations | |||
| Net investment income (loss)B | .29 | .33 | .09 |
| Net realized and unrealized gain (loss) | 5.51 | 13.90 | 7.78 |
| Total from investment operations | 5.80 | 14.23 | 7.87 |
| Net asset value, end of period | $106.39 | $100.59 | $86.36 |
| Total ReturnC,D | 5.77% | 16.48% | 10.03% |
| Ratios to Average Net AssetsE,F | |||
| Expenses before reductions | .64% | .64% | .64%G |
| Expenses net of fee waivers, if any | .64% | .64% | .64%G |
| Expenses net of all reductions | .63% | .64% | .63%G |
| Net investment income (loss) | .28% | .35% | .38%G |
| Supplemental Data | |||
| Net assets, end of period (000 omitted) | $25,638 | $122 | $110 |
| Portfolio turnover rateH | 63% | 49%I | 81% |
A For the period August 13, 2013 (commencement of sale of shares) to November 30, 2013.
B Calculated based on average shares outstanding during the period.
C Total returns for periods of less than one year are not annualized.
D Total returns would have been lower if certain expenses had not been reduced during the applicable periods shown.
E Fees and expenses of any underlying Fidelity Central Funds are not included in the Fund's expense ratio. The Fund indirectly bears its proportionate share of the expenses of any underlying Fidelity Central Funds.
F Expense ratios reflect operating expenses of the class. Expenses before reductions do not reflect amounts reimbursed by the investment adviser or reductions from brokerage service arrangements or reductions from other expense offset arrangements and do not represent the amount paid by the class during periods when reimbursements or reductions occur. Expense ratios before reductions for start-up periods may not be representative of longer-term operating periods. Expenses net of fee waivers reflect expenses after reimbursement by the investment adviser but prior to reductions from brokerage service arrangements or other expense offset arrangements. Expenses net of all reductions represent the net expenses paid by the class.
G Annualized
H Amount does not include the portfolio activity of any underlying Fidelity Central Funds.
I Portfolio turnover rate excludes securities received or delivered in-kind.
See accompanying notes which are an integral part of the financial statements.
Notes to Financial Statements
For the period ended November 30, 2015
(Amounts in thousands except percentages)
1. Organization.
Fidelity Advisor Equity Growth Fund (the Fund) is a fund of Fidelity Advisor Series I (the Trust) and is authorized to issue an unlimited number of shares. The Trust is registered under the Investment Company Act of 1940, as amended (the 1940 Act), as an open-end management investment company organized as a Massachusetts business trust. The Fund offers Class A, Class T, Class C, Class I (formerly Institutional Class) and Class Z shares, each of which, along with Class B shares, has equal rights as to assets and voting privileges. Class B shares are closed to new accounts and additional purchases, except for exchanges and reinvestments. Each class has exclusive voting rights with respect to matters that affect that class. Class B shares will automatically convert to Class A shares after a holding period of seven years from the initial date of purchase.
2. Investments in Fidelity Central Funds.
The Fund invests in Fidelity Central Funds, which are open-end investment companies generally available only to other investment companies and accounts managed by the investment adviser and its affiliates. The Fund's Schedule of Investments lists each of the Fidelity Central Funds held as of period end, if any, as an investment of the Fund, but does not include the underlying holdings of each Fidelity Central Fund. As an Investing Fund, the Fund indirectly bears its proportionate share of the expenses of the underlying Fidelity Central Funds.
The Money Market Central Funds seek preservation of capital and current income and are managed by Fidelity Investments Money Management, Inc. (FIMM), an affiliate of the investment adviser. Annualized expenses of the Money Market Central Funds as of their most recent shareholder report date are less than .005%.
A complete unaudited list of holdings for each Fidelity Central Fund is available upon request or at the Securities and Exchange Commission (the SEC) website at www.sec.gov. In addition, the financial statements of the Fidelity Central Funds, which are not covered by the Fund's Report of Independent Registered Public Accounting Firm, are available on the SEC website or upon request.
3. Significant Accounting Policies.
The financial statements have been prepared in conformity with accounting principles generally accepted in the United States of America (GAAP), which require management to make certain estimates and assumptions at the date of the financial statements. Actual results could differ from those estimates. Subsequent events, if any, through the date that the financial statements were issued have been evaluated in the preparation of the financial statements. The following summarizes the significant accounting policies of the Fund:
Investment Valuation. Investments are valued as of 4:00 p.m. Eastern time on the last calendar day of the period. The Board of Trustees (the Board) has delegated the day to day responsibility for the valuation of the Fund's investments to the Fidelity Management & Research Company (FMR) Fair Value Committee (the Committee). In accordance with valuation policies and procedures approved by the Board, the Fund attempts to obtain prices from one or more third party pricing vendors or brokers to value its investments. When current market prices, quotations or currency exchange rates are not readily available or reliable, investments will be fair valued in good faith by the Committee, in accordance with procedures adopted by the Board. Factors used in determining fair value vary by investment type and may include market or investment specific events. The frequency with which these procedures are used cannot be predicted and they may be utilized to a significant extent. The Committee oversees the Fund's valuation policies and procedures and reports to the Board on the Committee's activities and fair value determinations. The Board monitors the appropriateness of the procedures used in valuing the Fund's investments and ratifies the fair value determinations of the Committee.
The Fund categorizes the inputs to valuation techniques used to value its investments into a disclosure hierarchy consisting of three levels as shown below:
- Level 1 – quoted prices in active markets for identical investments
- Level 2 – other significant observable inputs (including quoted prices for similar investments, interest rates, prepayment speeds, etc.)
- Level 3 – unobservable inputs (including the Fund's own assumptions based on the best information available)
Valuation techniques used to value the Fund's investments by major category are as follows:
Equity securities, including restricted securities, for which market quotations are readily available, are valued at the last reported sale price or official closing price as reported by a third party pricing vendor on the primary market or exchange on which they are traded and are categorized as Level 1 in the hierarchy. In the event there were no sales during the day or closing prices are not available, securities are valued at the last quoted bid price or may be valued using the last available price and are generally categorized as Level 2 in the hierarchy. For foreign equity securities, when market or security specific events arise, comparisons to the valuation of American Depositary Receipts (ADRs), futures contracts, Exchange-Traded Funds (ETFs) and certain indexes as well as quoted prices for similar securities may be used and would be categorized as Level 2 in the hierarchy. Utilizing these techniques may result in transfers between Level 1 and Level 2. For equity securities, including restricted securities, where observable inputs are limited, assumptions about market activity and risk are used and these securities may be categorized as Level 3 in the hierarchy.
Investments in open-end mutual funds, including the Fidelity Central Funds, are valued at their closing net asset value (NAV) each business day and are categorized as Level 1 in the hierarchy.
Changes in valuation techniques may result in transfers in or out of an assigned level within the disclosure hierarchy. The aggregate value of investments by input level as of November 30, 2015 is included at the end of the Fund's Schedule of Investments.
Foreign Currency. The Fund may use foreign currency contracts to facilitate transactions in foreign-denominated securities. Gains and losses from these transactions may arise from changes in the value of the foreign currency or if the counterparties do not perform under the contracts' terms.
Foreign-denominated assets, including investment securities, and liabilities are translated into U.S. dollars at the exchange rates at period end. Purchases and sales of investment securities, income and dividends received and expenses denominated in foreign currencies are translated into U.S. dollars at the exchange rate in effect on the transaction date.
The effects of exchange rate fluctuations on investments are included with the net realized and unrealized gain (loss) on investment securities. Other foreign currency transactions resulting in realized and unrealized gain (loss) are disclosed separately.
Investment Transactions and Income. For financial reporting purposes, the Fund's investment holdings and NAV include trades executed through the end of the last business day of the period. The NAV per share for processing shareholder transactions is calculated as of the close of business of the New York Stock Exchange (NYSE), normally 4:00 p.m. Eastern time and includes trades executed through the end of the prior business day. Gains and losses on securities sold are determined on the basis of identified cost and may include proceeds received from litigation. Dividend income is recorded on the ex-dividend date, except for certain dividends from foreign securities where the ex-dividend date may have passed, which are recorded as soon as the Fund is informed of the ex-dividend date. Non-cash dividends included in dividend income, if any, are recorded at the fair market value of the securities received. Income and capital gain distributions from Fidelity Central Funds, if any, are recorded on the ex-dividend date. Distributions received on securities that represent a return of capital or capital gain are recorded as a reduction of cost of investments and/or as a realized gain. Subsequent to ex-dividend date the Fund determines the components of these distributions, based upon receipt of tax filings or other correspondence relating to the underlying investment. Investment income is recorded net of foreign taxes withheld where recovery of such taxes is uncertain.
Class Allocations and Expenses. Investment income, realized and unrealized capital gains and losses, common expenses of the Fund, and certain fund-level expense reductions, if any, are allocated daily on a pro-rata basis to each class based on the relative net assets of each class to the total net assets of the Fund. Each class differs with respect to transfer agent and distribution and service plan fees incurred. Certain expense reductions may also differ by class. For the reporting period, the allocated portion of income and expenses to each class as a percent of its average net assets may vary due to the timing of recording these transactions in relation to fluctuating net assets of the classes. Expenses directly attributable to a fund are charged to that fund. Expenses attributable to more than one fund are allocated among the respective funds on the basis of relative net assets or other appropriate methods. Expense estimates are accrued in the period to which they relate and adjustments are made when actual amounts are known.
Deferred Trustee Compensation. Under a Deferred Compensation Plan (the Plan), independent Trustees may elect to defer receipt of a portion of their annual compensation. Deferred amounts are invested in a cross-section of Fidelity funds, are marked-to-market and remain in the Fund until distributed in accordance with the Plan. The investment of deferred amounts and the offsetting payable to the Trustees are included in the accompanying Statement of Assets and Liabilities.
Income Tax Information and Distributions to Shareholders. Each year, the Fund intends to qualify as a regulated investment company under Subchapter M of the Internal Revenue Code, including distributing substantially all of its taxable income and realized gains. As a result, no provision for U.S. Federal income taxes is required. As of November 30, 2015, the Fund did not have any unrecognized tax benefits in the financial statements; nor is the Fund aware of any tax positions for which it is reasonably possible that the total amounts of unrecognized tax benefits will significantly change in the next twelve months. The Fund files a U.S. federal tax return, in addition to state and local tax returns as required. The Fund's federal income tax returns are subject to examination by the Internal Revenue Service (IRS) for a period of three fiscal years after they are filed. State and local tax returns may be subject to examination for an additional fiscal year depending on the jurisdiction. Foreign taxes are provided for based on the Fund's understanding of the tax rules and rates that exist in the foreign markets in which it invests.
Distributions are declared and recorded on the ex-dividend date. Income dividends and capital gain distributions are declared separately for each class. Income and capital gain distributions are determined in accordance with income tax regulations, which may differ from GAAP.
Capital accounts within the financial statements are adjusted for permanent book-tax differences. These adjustments have no impact on net assets or the results of operations. Capital accounts are not adjusted for temporary book-tax differences which will reverse in a subsequent period.
Book-tax differences are primarily due to foreign currency transactions, partnerships, deferred trustees compensation, net operating losses, capital loss carryforwards and losses deferred due to wash sales and excise tax regulations.
The federal tax cost of investment securities and unrealized appreciation (depreciation) as of period end were as follows:
| Gross unrealized appreciation | $676,173 |
| Gross unrealized depreciation | (119,104) |
| Net unrealized appreciation (depreciation) on securities | $557,069 |
| Tax Cost | $2,345,653 |
The tax-based components of distributable earnings as of period end were as follows:
| Undistributed long-term capital gain | $69,219 |
| Net unrealized appreciation (depreciation) on securities and other investments | $557,059 |
The Fund intends to elect to defer to its next fiscal year $9,526 of ordinary losses recognized during the period January 1, 2015 to November 30, 2015.
Restricted Securities. The Fund may invest in securities that are subject to legal or contractual restrictions on resale. These securities generally may be resold in transactions exempt from registration or to the public if the securities are registered. Disposal of these securities may involve time-consuming negotiations and expense, and prompt sale at an acceptable price may be difficult. Information regarding restricted securities is included at the end of the Fund's Schedule of Investments.
4. Purchases and Sales of Investments.
Purchases and sales of securities, other than short-term securities, aggregated $1,698,266 and $1,920,732, respectively.
5. Fees and Other Transactions with Affiliates.
Management Fee. Fidelity Management & Research Company (the investment adviser) and its affiliates provide the Fund with investment management related services for which the Fund pays a monthly management fee. The management fee is the sum of an individual fund fee rate that is based on an annual rate of .30% of the Fund's average net assets and an annualized group fee rate that averaged .25% during the period. The group fee rate is based upon the average net assets of all the mutual funds advised by the investment adviser, including any mutual funds previously advised by the investment adviser that are currently advised by Fidelity SelectCo, LLC, an affiliate of the investment adviser. The group fee rate decreases as assets under management increase and increases as assets under management decrease. For the reporting period, the total annual management fee rate was .55% of the Fund's average net assets.
Distribution and Service Plan Fees. In accordance with Rule 12b-1 of the 1940 Act, the Fund has adopted separate Distribution and Service Plans for each class of shares. Certain classes pay Fidelity Distributors Corporation (FDC), an affiliate of the investment adviser, separate Distribution and Service Fees, each of which is based on an annual percentage of each class' average net assets. In addition, FDC may pay financial intermediaries for selling shares of the Fund and providing shareholder support services. For the period, the Distribution and Service Fee rates, total fees and amounts retained by FDC were as follows:
| Distribution Fee | Service Fee | Total Fees | Retained by FDC | |
| Class A | -% | .25% | $2,163 | $30 |
| Class T | .25% | .25% | 6,697 | 14 |
| Class B | .75% | .25% | 140 | 106 |
| Class C | .75% | .25% | 1,779 | 118 |
| $10,779 | $268 |
Sales Load. FDC may receive a front-end sales charge of up to 5.75% for selling Class A shares and 3.50% for selling Class T shares, some of which is paid to financial intermediaries for selling shares of the Fund. Depending on the holding period, FDC may receive contingent deferred sales charges levied on Class A, Class T, Class B, and Class C redemptions. The deferred sales charges range from 5.00% to 1.00% for Class B shares, 1.00% for Class C shares, 1.00% for certain purchases of Class A shares and .25% for certain purchases of Class T shares.
For the period, sales charge amounts retained by FDC were as follows:
| Retained by FDC | |
| Class A | $103 |
| Class T | 39 |
| Class B(a) | 3 |
| Class C(a) | 11 |
| $156 |
(a) When Class B and Class C shares are initially sold, FDC pays commissions from its own resources to financial intermediaries through which the sales are made.
Transfer Agent Fees. Fidelity Investments Institutional Operations Company, Inc., (FIIOC), an affiliate of the investment adviser, is the transfer, dividend disbursing and shareholder servicing agent for each class of the Fund. FIIOC receives account fees and asset-based fees that vary according to the account size and type of account of the shareholders of the respective classes of the Fund, except for Class Z. FIIOC receives an asset-based fee of Class Z's average net assets. FIIOC pays for typesetting, printing and mailing of shareholder reports, except proxy statements.
For the period, transfer agent fees for each class were as follows:
| Amount | % of Class-Level Average Net Assets | |
| Class A | $1,822 | .21 |
| Class T | 2,478 | .19 |
| Class B | 42 | .30 |
| Class C | 390 | .22 |
| Class I | 795 | .19 |
| Class Z | 8 | .05 |
| $5,535 |
Accounting and Security Lending Fees. Fidelity Service Company, Inc. (FSC), an affiliate of the investment adviser, maintains the Fund's accounting records. The accounting fee is based on the level of average net assets for each month. Under a separate contract, FSC administers the security lending program. The security lending fee is based on the number and duration of lending transactions.
Brokerage Commissions. The Fund placed a portion of its portfolio transactions with brokerage firms which are affiliates of the investment adviser. Brokerage commissions are included in net realized gain (loss) and change in net unrealized appreciation (depreciation) in the Statement of Operations. The commissions paid to these affiliated firms were $21 for the period.
6. Committed Line of Credit.
The Fund participates with other funds managed by the investment adviser or an affiliate in a $4.25 billion credit facility (the "line of credit") to be utilized for temporary or emergency purposes to fund shareholder redemptions or for other short-term liquidity purposes. The Fund has agreed to pay commitment fees on its pro-rata portion of the line of credit, which amounted to $4 and is reflected in Miscellaneous expenses on the Statement of Operations. During the period, the Fund did not borrow on this line of credit.
7. Security Lending.
The Fund lends portfolio securities through a lending agent from time to time in order to earn additional income. For equity securities, a lending agent is used and may loan securities to certain qualified borrowers, including Fidelity Capital Markets (FCM), a broker-dealer affiliated with the Fund. On the settlement date of the loan, the Fund receives collateral (in the form of U.S. Treasury obligations, letters of credit and/or cash) against the loaned securities and maintains collateral in an amount not less than 100% of the market value of the loaned securities during the period of the loan. The market value of the loaned securities is determined at the close of business of the Fund and any additional required collateral is delivered to the Fund on the next business day. The Fund or borrower may terminate the loan at any time, and if the borrower defaults on its obligation to return the securities loaned because of insolvency or other reasons, the Fund may apply collateral received from the borrower against the obligation. The Fund may experience delays and costs in recovering the securities loaned. Any cash collateral received is invested in the Fidelity Securities Lending Cash Central Fund. The value of loaned securities and cash collateral at period end are disclosed on the Fund's Statement of Assets and Liabilities. The value of securities loaned to FCM at period end was $3,416. Security lending income represents the income earned on investing cash collateral, less rebates paid to borrowers and any lending agent fees associated with the loan, plus any premium payments received for lending certain types of securities. Security lending income is presented in the Statement of Operations as a component of income from Fidelity Central Funds. Total security lending income during the period amounted to $515, including $35 from securities loaned to FCM.
8. Expense Reductions.
Commissions paid to certain brokers with whom the investment adviser, or its affiliates, places trades on behalf of the Fund include an amount in addition to trade execution, which may be rebated back to the Fund to offset certain expenses. This amount totaled $89 for the period
In addition, during the period the investment adviser reimbursed and/or waived a portion of fund-level operating expenses in the amount of $11 and a portion of class-level operating expenses as follows:
| Amount | |
| Class A | $18 |
| Class T | 30 |
| Class B | –(a) |
| Class C | 4 |
| Class I | 21 |
| $73 |
(a) In the amount of less than five hundred dollars.
9. Share Transactions.
Share transactions for each class were as follows and may contain automatic conversions between classes or exchanges between funds:
| Shares | Shares | Dollars | Dollars | |
| Years ended November 30, | 2015 | 2014 | 2015 | 2014 |
| Class A | ||||
| Shares sold | 1,688 | 1,501 | $162,907 | $132,626 |
| Shares redeemed | (1,807) | (1,946) | (173,253) | (170,229) |
| Net increase (decrease) | (119) | (445) | $(10,346) | $(37,603) |
| Class T | ||||
| Shares sold | 1,492 | 1,656 | $141,497 | $144,112 |
| Shares redeemed | (2,839) | (2,920) | (269,251) | (253,312) |
| Net increase (decrease) | (1,347) | (1,264) | $(127,754) | $(109,200) |
| Class B | ||||
| Shares sold | 2 | 3 | $164 | $258 |
| Shares redeemed | (95) | (107) | (7,987) | (8,283) |
| Net increase (decrease) | (93) | (104) | $(7,823) | $(8,025) |
| Class C | ||||
| Shares sold | 365 | 262 | $31,362 | $20,995 |
| Shares redeemed | (360) | (341) | (30,838) | (26,719) |
| Net increase (decrease) | 5 | (79) | $524 | $(5,724) |
| Class I | ||||
| Shares sold | 1,565 | 2,450 | $159,813 | $230,126 |
| Shares redeemed | (1,508) | (12,811)(a) | (155,242) | (1,203,573)(a) |
| Net increase (decrease) | 57 | (10,361) | $4,571 | $(973,447) |
| Class Z | ||||
| Shares sold | 259 | – | $27,086 | $– |
| Shares redeemed | (19) | –(b) | (1,970) | (6) |
| Net increase (decrease) | 240 | –(b) | $25,116 | $(6) |
(a) Amount includes in-kind redemptions.
(b) In the amount of less than five hundred dollars.
10. Other.
The Fund's organizational documents provide former and current trustees and officers with a limited indemnification against liabilities arising in connection with the performance of their duties to the Fund. In the normal course of business, the Fund may also enter into contracts that provide general indemnifications. The Fund's maximum exposure under these arrangements is unknown as this would be dependent on future claims that may be made against the Fund. The risk of material loss from such claims is considered remote.
Report of Independent Registered Public Accounting Firm
To the Trustees of Fidelity Advisor Series I and Shareholders of Fidelity Advisor® Equity Growth Fund:
We have audited the accompanying statement of assets and liabilities of Fidelity Advisor® Equity Growth Fund (the Fund), a fund of Fidelity Advisor Series I, including the schedule of investments, as of November 30, 2015, and the related statement of operations for the year then ended, the statement of changes in net assets for each of the two years in the period then ended, and the financial highlights for each of the five years in the period then ended. These financial statements and financial highlights are the responsibility of the Fund's management. Our responsibility is to express an opinion on these financial statements and financial highlights based on our audits.
We conducted our audits in accordance with the standards of the Public Company Accounting Oversight Board (United States). Those standards require that we plan and perform the audit to obtain reasonable assurance about whether the financial statements and financial highlights are free of material misstatement. The Fund is not required to have, nor were we engaged to perform, an audit of its internal control over financial reporting. Our audits included consideration of internal control over financial reporting as a basis for designing audit procedures that are appropriate in the circumstances, but not for the purpose of expressing an opinion on the effectiveness of the Fund's internal control over financial reporting. Accordingly, we express no such opinion. An audit also includes examining, on a test basis, evidence supporting the amounts and disclosures in the financial statements, assessing the accounting principles used and significant estimates made by management, as well as evaluating the overall financial statement presentation. Our procedures included confirmation of securities owned as of November 30, 2015, by correspondence with the custodians and brokers; when replies were not received from brokers, we performed other auditing procedures. We believe our audits provide a reasonable basis for our opinion.
In our opinion, such financial statements and financial highlights referred to above present fairly, in all material respects, the financial position of Fidelity Advisor® Equity Growth Fund as of November 30, 2015, the results of its operations for the year then ended, the changes in its net assets for each of the two years in the period then ended, and the financial highlights for each of the five years in the period then ended in conformity with accounting principles generally accepted in the United States of America.
DELOITTE & TOUCHE LLP
Boston, Massachusetts
January 14, 2016
Trustees and Officers
The Trustees, Members of the Advisory Board (if any), and officers of the trust and fund, as applicable, are listed below. The Board of Trustees governs the fund and is responsible for protecting the interests of shareholders. The Trustees are experienced executives who meet periodically throughout the year to oversee the fund's activities, review contractual arrangements with companies that provide services to the fund, oversee management of the risks associated with such activities and contractual arrangements, and review the fund's performance. Each of the Trustees oversees 170 funds.
The Trustees hold office without limit in time except that (a) any Trustee may resign; (b) any Trustee may be removed by written instrument, signed by at least two-thirds of the number of Trustees prior to such removal; (c) any Trustee who requests to be retired or who has become incapacitated by illness or injury may be retired by written instrument signed by a majority of the other Trustees; and (d) any Trustee may be removed at any special meeting of shareholders by a two-thirds vote of the outstanding voting securities of the trust. Each Trustee who is not an interested person (as defined in the 1940 Act) of the trust and the fund is referred to herein as an Independent Trustee. Each Independent Trustee shall retire not later than the last day of the calendar year in which his or her 75th birthday occurs. The Independent Trustees may waive this mandatory retirement age policy with respect to individual Trustees. Officers and Advisory Board Members hold office without limit in time, except that any officer or Advisory Board Member may resign or may be removed by a vote of a majority of the Trustees at any regular meeting or any special meeting of the Trustees. Except as indicated, each individual has held the office shown or other offices in the same company for the past five years.
The fund’s Statement of Additional Information (SAI) includes more information about the Trustees. To request a free copy, call Fidelity at 1-877-208-0098.
Experience, Skills, Attributes, and Qualifications of the Trustees. The Governance and Nominating Committee has adopted a statement of policy that describes the experience, qualifications, attributes, and skills that are necessary and desirable for potential Independent Trustee candidates (Statement of Policy). The Board believes that each Trustee satisfied at the time he or she was initially elected or appointed a Trustee, and continues to satisfy, the standards contemplated by the Statement of Policy. The Governance and Nominating Committee also engages professional search firms to help identify potential Independent Trustee candidates who have the experience, qualifications, attributes, and skills consistent with the Statement of Policy. From time to time, additional criteria based on the composition and skills of the current Independent Trustees, as well as experience or skills that may be appropriate in light of future changes to board composition, business conditions, and regulatory or other developments, have also been considered by the professional search firms and the Governance and Nominating Committee. In addition, the Board takes into account the Trustees' commitment and participation in Board and committee meetings, as well as their leadership of standing and ad hoc committees throughout their tenure.
In determining that a particular Trustee was and continues to be qualified to serve as a Trustee, the Board has considered a variety of criteria, none of which, in isolation, was controlling. The Board believes that, collectively, the Trustees have balanced and diverse experience, qualifications, attributes, and skills, which allow the Board to operate effectively in governing the fund and protecting the interests of shareholders. Information about the specific experience, skills, attributes, and qualifications of each Trustee, which in each case led to the Board's conclusion that the Trustee should serve (or continue to serve) as a trustee of the fund, is provided below.
Board Structure and Oversight Function. James C. Curvey is an interested person and currently serves as Chairman. The Trustees have determined that an interested Chairman is appropriate and benefits shareholders because an interested Chairman has a personal and professional stake in the quality and continuity of services provided to the fund. Independent Trustees exercise their informed business judgment to appoint an individual of their choosing to serve as Chairman, regardless of whether the Trustee happens to be independent or a member of management. The Independent Trustees have determined that they can act independently and effectively without having an Independent Trustee serve as Chairman and that a key structural component for assuring that they are in a position to do so is for the Independent Trustees to constitute a substantial majority for the Board. The Independent Trustees also regularly meet in executive session. Ned C. Lautenbach serves as Chairman of the Independent Trustees and as such (i) acts as a liaison between the Independent Trustees and management with respect to matters important to the Independent Trustees and (ii) with management prepares agendas for Board meetings.
Fidelity® funds are overseen by different Boards of Trustees. The fund's Board oversees Fidelity's high income and certain equity funds, and other Boards oversee Fidelity's investment-grade bond, money market, asset allocation, and sector funds. The asset allocation funds may invest in Fidelity® funds overseen by the fund's Board. The use of separate Boards, each with its own committee structure, allows the Trustees of each group of Fidelity® funds to focus on the unique issues of the funds they oversee, including common research, investment, and operational issues. On occasion, the separate Boards establish joint committees to address issues of overlapping consequences for the Fidelity® funds overseen by each Board.
The Trustees operate using a system of committees to facilitate the timely and efficient consideration of all matters of importance to the Trustees, the fund, and fund shareholders and to facilitate compliance with legal and regulatory requirements and oversight of the fund's activities and associated risks. The Board, acting through its committees, has charged FMR and its affiliates with (i) identifying events or circumstances the occurrence of which could have demonstrably adverse effects on the fund's business and/or reputation; (ii) implementing processes and controls to lessen the possibility that such events or circumstances occur or to mitigate the effects of such events or circumstances if they do occur; and (iii) creating and maintaining a system designed to evaluate continuously business and market conditions in order to facilitate the identification and implementation processes described in (i) and (ii) above. Because the day-to-day operations and activities of the fund are carried out by or through FMR, its affiliates, and other service providers, the fund's exposure to risks is mitigated but not eliminated by the processes overseen by the Trustees. While each of the Board's committees has responsibility for overseeing different aspects of the fund's activities, oversight is exercised primarily through the Operations, Audit, and Compliance Committees. In addition, the Independent Trustees have worked with FMR to enhance the Board's oversight of investment and financial risks, legal and regulatory risks, technology risks, and operational risks, including the development of additional risk reporting to the Board. For example, a working group comprised of Independent Trustees and FMR has worked and continues to work to review the Fidelity® funds' valuation-related activities, reporting and risk management. Appropriate personnel, including but not limited to the fund's Chief Compliance Officer (CCO), FMR's internal auditor, the independent accountants, the fund's Treasurer and portfolio management personnel, make periodic reports to the Board's committees, as appropriate, including an annual review of Fidelity's risk management program for the Fidelity® funds. The responsibilities of each standing committee, including their oversight responsibilities, are described further under "Standing Committees of the Trustees."
Interested Trustees*:
Correspondence intended for a Trustee who is an interested person may be sent to Fidelity Investments, 245 Summer Street, Boston, Massachusetts 02210.
Name, Year of Birth; Principal Occupations and Other Relevant Experience+
James C. Curvey (1935)
Year of Election or Appointment: 2007
Trustee
Chairman of the Board of Trustees
Mr. Curvey also serves as Trustee of other Fidelity® funds. Mr. Curvey is a Director of Fidelity Research & Analysis Co. (investment adviser firm, 2009-present), and Vice Chairman (2007-present) and Director of FMR LLC (diversified financial services company). In addition, Mr. Curvey serves as an Overseer for the Boston Symphony Orchestra and a member of the board of Artis-Naples, Naples, Florida, and as a Trustee for Brewster Academy, Wolfeboro, New Hampshire. Previously, Mr. Curvey served as a Director of Fidelity Investments Money Management, Inc. (investment adviser firm, 2009-2014) and a Director of FMR and FMR Co., Inc. (investment adviser firms, 2007-2014).
Charles S. Morrison (1960)
Year of Election or Appointment: 2014
Trustee
Mr. Morrison also serves as Trustee of other funds. He serves as a Director of Fidelity Investments Money Management, Inc. (FIMM) (investment adviser firm, 2014-present), Director of Fidelity SelectCo, LLC (investment adviser firm, 2014-present), President, Asset Management (2014-present), and is an employee of Fidelity Investments. Previously, Mr. Morrison served as Vice President of Fidelity's Fixed Income and Asset Allocation Funds (2012-2014), President, Fixed Income (2011-2014), Vice President of Fidelity's Money Market Funds (2005-2009), President, Money Market Group Leader of FMR (investment adviser firm, 2009), and Senior Vice President, Money Market Group of FMR (2004-2009). Mr. Morrison also served as Vice President of Fidelity's Bond Funds (2002-2005), certain Balanced Funds (2002-2005), and certain Asset Allocation Funds (2002-2007), and as Senior Vice President (2002-2005) of Fidelity's Bond Division.
* Determined to be an “Interested Trustee” by virtue of, among other things, his or her affiliation with the trust or various entities under common control with FMR.
+ The information includes the Trustee's principal occupation during the last five years and other information relating to the experience, attributes, and skills relevant to the Trustee's qualifications to serve as a Trustee, which led to the conclusion that the Trustee should serve as a Trustee for the fund.
Independent Trustees:
Correspondence intended for an Independent Trustee may be sent to Fidelity Investments, P.O. Box 55235, Boston, Massachusetts 02205-5235.
Name, Year of Birth; Principal Occupations and Other Relevant Experience+
Dennis J. Dirks (1948)
Year of Election or Appointment: 2005
Trustee
Mr. Dirks also serves as Trustee of other Fidelity® funds. Prior to his retirement in May 2003, Mr. Dirks was Chief Operating Officer and a member of the Board of The Depository Trust & Clearing Corporation (DTCC). He also served as President, Chief Operating Officer, and Board member of The Depository Trust Company (DTC) and President and Board member of the National Securities Clearing Corporation (NSCC). In addition, Mr. Dirks served as Chief Executive Officer and Board member of the Government Securities Clearing Corporation, Chief Executive Officer and Board member of the Mortgage-Backed Securities Clearing Corporation, as a Trustee and a member of the Finance Committee of Manhattan College (2005-2008), as a Trustee and a member of the Finance Committee of AHRC of Nassau County (2006-2008), and as a member of the Independent Directors Council (IDC) Governing Council (2010-2015). Mr. Dirks is a member of the Board of Directors for The Brookville Center for Children's Services, Inc. (2009-present).
Alan J. Lacy (1953)
Year of Election or Appointment: 2008
Trustee
Mr. Lacy also serves as Trustee of other Fidelity® funds. Mr. Lacy serves as a member of the Board of Directors of Dave & Buster's Entertainment, Inc. (restaurant and entertainment complexes, 2010-present) and Bristol-Myers Squibb Company (global pharmaceuticals, 2008-present). In addition, Mr. Lacy served as Senior Adviser (2007-2014) of Oak Hill Capital Partners, L.P. (private equity) and also served as Chief Executive Officer (2000-2005) and Vice Chairman (2005-2006) of Sears Holdings Corporation and Sears, Roebuck and Co. (retail). Mr. Lacy is a member of the Board of Trustees of The National Parks Conservation Association (2006-present). Previously, Mr. Lacy served as Chairman of the Board of Trustees of the National Parks Conservation Association (2008-2011) and as a member of the Board of Directors for The Western Union Company (global money transfer, 2006-2011), The Hillman Companies, Inc. (hardware wholesalers, 2010-2014), and Earth Fare, Inc. (retail grocery, 2010-2014).
Ned C. Lautenbach (1944)
Year of Election or Appointment: 2000
Trustee
Chairman of the Independent Trustees
Mr. Lautenbach also serves as Trustee of other Fidelity® funds. Mr. Lautenbach currently serves as the Lead Director of the Eaton Corporation Board of Directors (diversified industrial, 1997-present). Mr. Lautenbach is Chairman of the Board of Directors of Artis-Naples in Naples, Florida (2012-present), a member of the Council on Foreign Relations (1994-present), and a member of the Board of Governors, State University System of Florida (2013-present). Previously, Mr. Lautenbach was a Partner/Advisory Partner at Clayton, Dubilier & Rice, LLC (private equity investment, 1998-2010), as well as a Director of Sony Corporation (2006-2007).
Joseph Mauriello (1944)
Year of Election or Appointment: 2008
Trustee
Mr. Mauriello also serves as Trustee of other Fidelity® funds. Prior to his retirement in January 2006, Mr. Mauriello served in numerous senior management positions including Deputy Chairman and Chief Operating Officer (2004-2005), and Vice Chairman of Financial Services (2002-2004) of KPMG LLP US (professional services, 1965-2005). Mr. Mauriello currently serves as a member of the Board of Directors of XL Group plc. (global insurance and re-insurance, 2006-present) and the Independent Directors Council (IDC) Governing Council (2015-present). Previously, Mr. Mauriello served as a Director of the Hamilton Funds of the Bank of New York (2006-2007) and of Arcadia Resources Inc. (health care services and products, 2007-2012).
Robert W. Selander (1950)
Year of Election or Appointment: 2011
Trustee
Mr. Selander also serves as Trustee of other Fidelity® funds. Mr. Selander serves as a Director of The Western Union Company (global money transfer, 2014-present). Previously, Mr. Selander served as a Member of the Advisory Board of other Fidelity® funds (2011), and Executive Vice Chairman (2010), Chief Executive Officer (2009-2010), and President and Chief Executive Officer (1997-2009) of Mastercard, Inc.
Cornelia M. Small (1944)
Year of Election or Appointment: 2005
Trustee
Ms. Small also serves as Trustee of other Fidelity® funds. Ms. Small is a member of the Board of Directors (2009-present) and Chair of the Investment Committee (2010-present) of the Teagle Foundation. Ms. Small also serves on the Investment Committee of the Berkshire Taconic Community Foundation (2008-present). Previously, Ms. Small served as Chairperson (2002-2008) and a member of the Investment Committee and Chairperson (2008-2012) and a member of the Board of Trustees of Smith College. In addition, Ms. Small served as Chief Investment Officer, Director of Global Equity Investments, and a member of the Board of Directors of Scudder, Stevens & Clark and Scudder Kemper Investments.
William S. Stavropoulos (1939)
Year of Election or Appointment: 2002
Trustee
Vice Chairman of the Independent Trustees
Mr. Stavropoulos also serves as Trustee of other Fidelity® funds. Mr. Stavropoulos serves as President and Founder of the Michigan Baseball Foundation, the Great Lakes Loons (2007-present). Mr. Stavropoulos is Chairman Emeritus of the Board of Directors of The Dow Chemical Company, where he previously served in numerous senior management positions, including President, CEO (1995-2000; 2002-2004), Chairman of the Executive Committee (2000-2006), and as a member of the Board of Directors (1990-2006). Currently, Mr. Stavropoulos is Chairman of the Board of Directors of Univar Inc. (global distributor of commodity and specialty chemicals), a Director of Teradata Corporation (data warehousing and technology solutions), and Maersk Inc. (industrial conglomerate), and a member of the Advisory Board for Metalmark Capital LLC (private equity investment, 2005-present). Mr. Stavropoulos is an operating advisor to Clayton, Dubilier & Rice, LLC (private equity investment). In addition, Mr. Stavropoulos is a member of the University of Notre Dame Advisory Council for the College of Science, a Trustee of the Rollin L. Gerstacker Foundation, and a Director of the Naples Philharmonic Center for the Arts. Previously, Mr. Stavropoulos served as a Director of Chemical Financial Corporation (bank holding company, 1993-2012) and Tyco International, Ltd. (multinational manufacturing and services, 2007-2012).
David M. Thomas (1949)
Year of Election or Appointment: 2008
Trustee
Mr. Thomas also serves as Trustee of other Fidelity® funds. Mr. Thomas serves as Non-Executive Chairman of the Board of Directors of Fortune Brands Home and Security (home and security products, 2011-present), as a member of the Board of Directors (2004-present) and Presiding Director (2013-present) of Interpublic Group of Companies, Inc. (marketing communication), and as a member of the Board of Trustees of the University of Florida (2013-present). Previously, Mr. Thomas served as Executive Chairman (2005-2006) and Chairman and Chief Executive Officer (2000-2005) of IMS Health, Inc. (pharmaceutical and healthcare information solutions), and a Director of Fortune Brands, Inc. (consumer products, 2000-2011).
+ The information includes the Trustee's principal occupation during the last five years and other information relating to the experience, attributes, and skills relevant to the Trustee's qualifications to serve as a Trustee, which led to the conclusion that the Trustee should serve as a Trustee for the fund.
Advisory Board Members and Officers:
Correspondence intended for an officer or Peter S. Lynch may be sent to Fidelity Investments, 245 Summer Street, Boston, Massachusetts 02210. Officers appear below in alphabetical order.
Name, Year of Birth; Principal Occupation
Peter S. Lynch (1944)
Year of Election or Appointment: 2003
Member of the Advisory Board
Mr. Lynch also serves as Member of the Advisory Board of other Fidelity® funds. Mr. Lynch is Vice Chairman and a Director of FMR (investment adviser firm) and FMR Co., Inc. (investment adviser firm). In addition, Mr. Lynch serves as a Trustee of Boston College and as the Chairman of the Inner-City Scholarship Fund. Previously, Mr. Lynch served on the Special Olympics International Board of Directors (1997-2006).
Elizabeth Paige Baumann (1968)
Year of Election or Appointment: 2012
Anti-Money Laundering (AML) Officer
Ms. Baumann also serves as AML Officer of other funds. She is Chief AML Officer of FMR LLC (diversified financial services company, 2012-present) and is an employee of Fidelity Investments. Previously, Ms. Baumann served as Vice President and Deputy Anti-Money Laundering Officer (2007-2012).
Marc R. Bryant (1966)
Year of Election or Appointment: 2015
Secretary and Chief Legal Officer (CLO)
Mr. Bryant also serves as Secretary and CLO of other funds. Mr. Bryant serves as CLO, Secretary, and Senior Vice President of Fidelity Management & Research Company (investment adviser firm, 2015-present) and FMR Co., Inc. (investment adviser firm, 2015-present); Secretary of Fidelity SelectCo, LLC (investment adviser firm, 2015-present) and Fidelity Investments Money Management, Inc. (investment adviser firm, 2015-present); and CLO of Fidelity Management & Research (Hong Kong) Limited (investment adviser firm, 2015-present). He is Senior Vice President and Deputy General Counsel of FMR LLC (diversified financial services company). Previously, Mr. Bryant served as Secretary and CLO of Fidelity Rutland Square Trust II (2010-2014) and Assistant Secretary of Fidelity's Fixed Income and Asset Allocation Funds (2013-2015). Prior to joining Fidelity Investments, Mr. Bryant served as a Senior Vice President and the Head of Global Retail Legal for AllianceBernstein L.P. (2006-2010), and as the General Counsel for ProFund Advisors LLC (2001-2006).
William C. Coffey (1969)
Year of Election or Appointment: 2009
Assistant Secretary
Mr. Coffey also serves as Assistant Secretary of other funds. He is Senior Vice President and Deputy General Counsel of FMR LLC (diversified financial services company, 2010-present), and is an employee of Fidelity Investments. Previously, Mr. Coffey served as Vice President and Associate General Counsel of FMR LLC (2005-2009).
Jonathan Davis (1968)
Year of Election or Appointment: 2010
Assistant Treasurer
Mr. Davis also serves as Assistant Treasurer of other funds, and is an employee of Fidelity Investments. Previously, Mr. Davis served as Vice President and Associate General Counsel of FMR LLC (diversified financial services company, 2003-2010).
Adrien E. Deberghes (1967)
Year of Election or Appointment: 2008
Deputy Treasurer
Mr. Deberghes also serves as an officer of other funds. He is an employee of Fidelity Investments (2008-present). Prior to joining Fidelity Investments, Mr. Deberghes was Senior Vice President of Mutual Fund Administration at State Street Corporation (2007-2008), Senior Director of Mutual Fund Administration at Investors Bank & Trust (2005-2007), and Director of Finance for Dunkin' Brands (2000-2005).
Stephanie J. Dorsey (1969)
Year of Election or Appointment: 2010
Assistant Treasurer
Ms. Dorsey also serves as an officer of other funds. She is an employee of Fidelity Investments (2008-present) and has served in other fund officer roles. Prior to joining Fidelity Investments, Ms. Dorsey served as Treasurer (2004-2008) of the JPMorgan Mutual Funds and Vice President (2004-2008) of JPMorgan Chase Bank.
Howard J. Galligan III (1966)
Year of Election or Appointment: 2014
Chief Financial Officer
Mr. Galligan also serves as Chief Financial Officer of other funds. Mr. Galligan serves as President of Fidelity Pricing and Cash Management Services (FPCMS) (2014-present) and as a Director of Strategic Advisers, Inc. (investment adviser firm, 2008-present). Previously, Mr. Galligan served as Chief Administrative Officer of Asset Management (2011-2014) and Chief Operating Officer and Senior Vice President of Investment Support for Strategic Advisers, Inc. (2003-2011).
Scott C. Goebel (1968)
Year of Election or Appointment: 2015
Vice President
Mr. Goebel serves as Vice President of other funds and is an employee of Fidelity Investments (2001-present). Previously, Mr. Goebel served as Secretary of Fidelity SelectCo, LLC (investment adviser firm, 2013-2015), Fidelity Investments Money Management, Inc. (FIMM) (investment adviser firm, 2010-2015), and Fidelity Research and Analysis Company (FRAC) (investment adviser firm, 2010-2015); General Counsel, Secretary, and Senior Vice President of Fidelity Management & Research Company (investment adviser firm, 2008-2015) and FMR Co., Inc. (investment adviser firm, 2008-2015); Assistant Secretary of Fidelity Management & Research (Japan) Limited (investment adviser firm, 2008-2015) and FMR Investment Management (U.K.) Limited (investment adviser firm, 2008-2015); Chief Legal Officer (CLO) of Fidelity Management & Research (Hong Kong) Limited (investment adviser firm, 2008-2015); Secretary and CLO of certain Fidelity® funds (2008-2015); Assistant Secretary of FIMM (2008-2010), FRAC (2008-2010), and certain funds (2007-2008); and as Vice President and Secretary of Fidelity Distributors Corporation (FDC) (2005-2007).
Brian B. Hogan (1964)
Year of Election or Appointment: 2009
Vice President
Mr. Hogan also serves as Trustee or Vice President of other funds. Mr. Hogan serves as a Director of Fidelity SelectCo, LLC (investment adviser firm, 2014-present) and President of the Equity Division of FMR (investment adviser firm, 2009-present). Previously, Mr. Hogan served as Senior Vice President, Equity Research of FMR (2006-2009) and as a portfolio manager.
Chris Maher (1972)
Year of Election or Appointment: 2013
Assistant Treasurer
Mr. Maher serves as Assistant Treasurer of other funds. Mr. Maher is Vice President of Valuation Oversight and is an employee of Fidelity Investments. Previously, Mr. Maher served as Vice President of Asset Management Compliance (2013), Vice President of the Program Management Group of FMR (investment adviser firm, 2010-2013), and Vice President of Valuation Oversight (2008-2010).
Melissa M. Reilly (1971)
Year of Election or Appointment: 2014
Vice President of certain Equity Funds
Ms. Reilly also serves as Vice President of other funds. Ms. Reilly is an employee of Fidelity Investments (2004-present).
Kenneth B. Robins (1969)
Year of Election or Appointment: 2008
President and Treasurer
Mr. Robins also serves as an officer of other funds. Mr. Robins serves as Executive Vice President of Fidelity Investments Money Management, Inc. (FIMM) (investment adviser firm, 2013-present) and is an employee of Fidelity Investments (2004-present). Previously, Mr. Robins served in other fund officer roles.
Stacie M. Smith (1974)
Year of Election or Appointment: 2013
Deputy Treasurer
Ms. Smith also serves as an officer of other funds. She is an employee of Fidelity Investments (2009-present) and has served in other fund officer roles. Prior to joining Fidelity Investments, Ms. Smith served as Senior Audit Manager of Ernst & Young LLP (1996-2009).
Renee Stagnone (1975)
Year of Election or Appointment: 2013
Deputy Treasurer
Ms. Stagnone also serves as Deputy Treasurer of other funds. Ms. Stagnone is an employee of Fidelity Investments (1997-present).
Linda J. Wondrack (1964)
Year of Election or Appointment: 2014
Chief Compliance Officer
Ms. Wondrack also serves as Chief Compliance Officer of other funds. Ms. Wondrack is Executive Vice President and head of the Ethics Office and Asset Management Compliance for Fidelity Investments (2012-present). Ms. Wondrack also serves as Chief Compliance Officer of Fidelity SelectCo, LLC (investment adviser firm, 2014-present); Chief Compliance Officer of Impresa Management LLC (2013-present); and Chief Compliance Officer of FMR Co., Inc. (investment adviser firm), Fidelity Investments Money Management, Inc. (investment adviser firm), Fidelity Management & Research (Japan) Limited (investment adviser firm), FMR Investment Management (U.K.) Limited (investment adviser firm), Fidelity Management & Research (Hong Kong) (investment adviser firm), Fidelity Management & Research Company (investment adviser firm), FIAM LLC (investment adviser firm), and Strategic Advisers, Inc. (investment adviser firm), Ballyrock Investment Advisors LLC, and Northern Neck Investors LLC (2012-present). Previously, Ms. Wondrack served as Senior Vice President and Chief Compliance Officer for Columbia Management Investment Advisers, LLC (2005-2012); Chief Compliance Officer for certain funds within the Columbia Family of Funds (2007-2012); and Senior Vice President of Compliance Risk Management at Bank of America (2005-2010).
Joseph F. Zambello (1957)
Year of Election or Appointment: 2011
Deputy Treasurer
Mr. Zambello also serves as Deputy Treasurer of other funds. Mr. Zambello is an employee of Fidelity Investments (1991-present). Previously, Mr. Zambello served as Vice President of the Program Management Group of FMR (investment adviser firm, 2009-2011) and Vice President of the Transfer Agent Oversight Group (2005-2009).
Shareholder Expense Example
As a shareholder of the Fund, you incur two types of costs: (1) transaction costs, including sales charges (loads) on purchase payments or redemption proceeds, and (2) ongoing costs, including management fees, distribution and/or service (12b-1) fees and other Fund expenses. This Example is intended to help you understand your ongoing costs (in dollars) of investing in the Fund and to compare these costs with the ongoing costs of investing in other mutual funds.
The Example is based on an investment of $1,000 invested at the beginning of the period and held for the entire period (June 1, 2015 to November 30, 2015).
Actual Expenses
The first line of the accompanying table for each class of the Fund provides information about actual account values and actual expenses. You may use the information in this line, together with the amount you invested, to estimate the expenses that you paid over the period. Simply divide your account value by $1,000.00 (for example, an $8,600 account value divided by $1,000.00 = 8.6), then multiply the result by the number in the first line for a class of the Fund under the heading entitled "Expenses Paid During Period" to estimate the expenses you paid on your account during this period. In addition, the Fund, as a shareholder in the underlying Fidelity Central Funds, will indirectly bear its pro-rata share of the fees and expenses incurred by the underlying Fidelity Central Funds. These fees and expenses are not included in the Fund's annualized expense ratio used to calculate the expense estimate in the table below.
Hypothetical Example for Comparison Purposes
The second line of the accompanying table for each class of the Fund provides information about hypothetical account values and hypothetical expenses based on a Class' actual expense ratio and an assumed rate of return of 5% per year before expenses, which is not the Class' actual return. The hypothetical account values and expenses may not be used to estimate the actual ending account balance or expenses you paid for the period. You may use this information to compare the ongoing costs of investing in the Fund and other funds. To do so, compare this 5% hypothetical example with the 5% hypothetical examples that appear in the shareholder reports of the other funds. In addition, the Fund, as a shareholder in the underlying Fidelity Central Funds, will indirectly bear its pro-rata share of the fees and expenses incurred by the underlying Fidelity Central Funds. These fees and expenses are not included in the Fund's annualized expense ratio used to calculate the expense estimate in the table below.
Please note that the expenses shown in the table are meant to highlight your ongoing costs only and do not reflect any transaction costs. Therefore, the second line of the table is useful in comparing ongoing costs only, and will not help you determine the relative total costs of owning different funds. In addition, if these transactional costs were included, your costs would have been higher.
| Annualized Expense Ratio-A | Beginning Account Value June 1, 2015 | Ending Account Value November 30, 2015 | Expenses Paid During Period-B June 1, 2015 to November 30, 2015 | |
| Class A | 1.04% | |||
| Actual | $1,000.00 | $1,012.80 | $5.25 | |
| Hypothetical-C | $1,000.00 | $1,019.85 | $5.27 | |
| Class T | 1.27% | |||
| Actual | $1,000.00 | $1,011.60 | $6.40 | |
| Hypothetical-C | $1,000.00 | $1,018.70 | $6.43 | |
| Class B | 1.88% | |||
| Actual | $1,000.00 | $1,008.50 | $9.47 | |
| Hypothetical-C | $1,000.00 | $1,015.64 | $9.50 | |
| Class C | 1.80% | |||
| Actual | $1,000.00 | $1,008.90 | $9.06 | |
| Hypothetical-C | $1,000.00 | $1,016.04 | $9.10 | |
| Class I | .77% | |||
| Actual | $1,000.00 | $1,014.20 | $3.89 | |
| Hypothetical-C | $1,000.00 | $1,021.21 | $3.90 | |
| Class Z | .64% | |||
| Actual | $1,000.00 | $1,014.90 | $3.23 | |
| Hypothetical-C | $1,000.00 | $1,021.86 | $3.24 |
A Annualized expense ratio reflects expenses net of applicable fee waivers.
B Expenses are equal to each Class' annualized expense ratio, multiplied by the average account value over the period, multiplied by 183/365 (to reflect the one-half year period).
C 5% return per year before expenses
Distributions (Unaudited)
The Board of Trustees of Fidelity Advisor Equity Growth Fund voted to pay to shareholders of record at the opening of business on record date, the following distributions per share derived from capital gains realized from sales of portfolio securities, and dividends derived from net investment income:
| Pay Date | Record Date | Capital Gains | |
| Class Z | 12/07/15 | 12/04/15 | $2.288 |
| 01/11/16 | 01/08/16 | $0.092 |
The fund hereby designates as a capital gain dividend with respect to the taxable year ended November 30, 2015, $69,219,051, or, if subsequently determined to be different, the net capital gain of such year.
The fund will notify shareholders in January 2016 of amounts for use in preparing 2015 income tax returns.
Board Approval of Investment Advisory Contracts and Management Fees
Fidelity Advisor Equity Growth Fund
Each year, the Board of Trustees, including the Independent Trustees (together, the Board), votes on the renewal of the management contract with Fidelity Management & Research Company (FMR) and the sub-advisory agreements (together, the Advisory Contracts) for the fund. The Board, assisted by the advice of fund counsel and Independent Trustees' counsel, requests and considers a broad range of information relevant to the renewal of the Advisory Contracts throughout the year.
The Board meets regularly and, at each of its meetings, covers an extensive agenda of topics and materials and considers factors that are relevant to its annual consideration of the renewal of the fund's Advisory Contracts, including the services and support provided to the fund and its shareholders. The Board has established various standing committees (Committees), each composed of and chaired by Independent Trustees with varying backgrounds, to which the Board has assigned specific subject matter responsibilities in order to enhance effective decision-making by the Board. The Board, acting directly and through its Committees, requests and receives information concerning the annual consideration of the renewal of the fund's Advisory Contracts. The Board also meets as needed to consider matters specifically related to the Board's annual consideration of the renewal of the Advisory Contracts. Members of the Board may also meet with trustees of other Fidelity funds through ad hoc joint committees to discuss certain matters relevant to all of the Fidelity funds.
At its July 2015 meeting, the Board unanimously determined to renew the fund's Advisory Contracts. In reaching its determination, the Board considered all factors it believed relevant, including (i) the nature, extent, and quality of the services to be provided to the fund and its shareholders (including the investment performance of the fund); (ii) the competitiveness of the fund's management fee and total expense ratio relative to peer funds; (iii) the total costs of the services to be provided by and the profits to be realized by Fidelity from its relationship with the fund; and (iv) the extent to which (if any) economies of scale exist and would be realized as the fund grows, and whether any economies of scale are appropriately shared with fund shareholders.
In considering whether to renew the Advisory Contracts for the fund, the Board reached a determination, with the assistance of fund counsel and Independent Trustees' counsel and through the exercise of its business judgment, that the renewal of the Advisory Contracts was in the best interests of the fund and its shareholders and that the compensation payable under the Advisory Contracts was fair and reasonable. The Board's decision to renew the Advisory Contracts was not based on any single factor, but rather was based on a comprehensive consideration of all the information provided to the Board at its meetings throughout the year. The Board, in reaching its determination to renew the Advisory Contracts, was aware that shareholders of the fund have a broad range of investment choices available to them, including a wide choice among funds offered by Fidelity's competitors, and that the fund's shareholders, who have the opportunity to review and weigh the disclosure provided by the fund in its prospectus and other public disclosures, have chosen to invest in this fund, which is part of the Fidelity family of funds.
Nature, Extent, and Quality of Services Provided. The Board considered Fidelity's staffing as it relates to the fund, including the backgrounds of investment personnel of Fidelity, and also considered the fund's investment objective, strategies, and related investment philosophy. The Independent Trustees also had discussions with senior management of Fidelity's investment operations and investment groups. The Board considered the structure of the portfolio manager compensation program and whether this structure provides appropriate incentives to act in the best interests of the fund. Additionally, the Board considered the portfolio managers' investments, if any, in the funds that they manage.Resources Dedicated to Investment Management and Support Services. The Board and the Fund Oversight and Research Committees reviewed the general qualifications and capabilities of Fidelity's investment staff, including its size, education, experience, and resources, as well as Fidelity's approach to recruiting, training, managing, and compensating investment personnel. The Board noted that Fidelity has continued to increase the resources devoted to non-U.S. offices, including expansion of Fidelity's global investment organization. The Board also noted that Fidelity's analysts have extensive resources, tools and capabilities that allow them to conduct sophisticated quantitative and fundamental analysis, as well as credit analysis of issuers, counterparties and guarantors. Further, the Board considered that Fidelity's investment professionals have sufficient access to global information and data so as to provide competitive investment results over time, and that those professionals also have access to sophisticated tools that permit them to assess portfolio construction and risk and performance attribution characteristics continuously, as well as to transmit new information and research conclusions rapidly around the world. Additionally, in its deliberations, the Board considered Fidelity's trading, risk management, and compliance capabilities and resources, which are integral parts of the investment management process.Shareholder and Administrative Services. The Board considered (i) the nature, extent, quality, and cost of advisory, administrative, and shareholder services performed by FMR, the sub-advisers (together with FMR, the Investment Advisers), and their affiliates under the Advisory Contracts and under separate agreements covering transfer agency, pricing and bookkeeping, and securities lending services for the fund; (ii) the nature and extent of the supervision of third party service providers, principally custodians and subcustodians; and (iii) the resources devoted to, and the record of compliance with, the fund's compliance policies and procedures. The Board also reviewed the allocation of fund brokerage, including allocations to brokers affiliated with the Investment Advisers, the use of brokerage commissions to pay fund expenses, and the use of "soft" commission dollars to pay for research services.The Board noted that the growth of fund assets over time across the complex allows Fidelity to reinvest in the development of services designed to enhance the value or convenience of the Fidelity funds as investment vehicles. These services include 24-hour access to account information and market information through telephone representatives and over the Internet, investor education materials and asset allocation tools, and the expanded availability of Fidelity Investor Centers.In 2014, the Board formed an ad hoc Committee on Transfer Agency Fees to review the variety of transfer agency fee structures throughout the industry and Fidelity's competitive positioning with respect to industry participants.Investment in a Large Fund Family. The Board considered the benefits to shareholders of investing in a Fidelity fund, including the benefits of investing in a fund that is part of a large family of funds offering a variety of investment disciplines and providing a large variety of mutual fund investor services. The Board noted that Fidelity had taken, or had made recommendations that resulted in the Fidelity funds taking, a number of actions over the previous year that benefited particular funds, including (i) continuing to dedicate additional resources to investment research and to the support of the senior management team that oversees asset management; (ii) continuing efforts to enhance Fidelity's global research capabilities; (iii) launching new funds and making other enhancements to meet client needs; (iv) reducing management fees and total expenses for certain index funds and diversified international funds; (v) continuing to launch dedicated lower cost underlying funds to meet portfolio construction needs related to expanding underlying fund options for Fidelity funds of funds, specifically for the Freedom Fund product lines; (vi) rationalizing product lines and gaining increased efficiencies through fund mergers; (vii) launching active fixed-income exchange-traded funds; (viii) continuing to develop, acquire and implement systems and technology to improve services to the funds and information security and to increase efficiency; (ix) implementing investment enhancements to further strengthen Fidelity's target date product line to increase investors' probability of success in achieving their goals; (x) modifying the eligibility criteria for certain share classes to accommodate roll-over assets from employer-sponsored retirement plans; (xi) launching a new Class W of the Freedom Index Funds to attract and retain Fidelity record-kept retirement plan assets; and (xii) implementing changes to Fidelity's money market product line in response to recent money market regulatory reforms.Investment Performance. The Board considered whether the fund has operated in accordance with its investment objective, as well as its record of compliance with its investment restrictions and its performance history.The Board took into account discussions with representatives of the Investment Advisers about fund investment performance that occur at Board meetings throughout the year. In this regard the Board noted that as part of regularly scheduled fund reviews and other reports to the Board on fund performance, the Board considers annualized return information for the fund, for different time periods, measured against a securities market index ("benchmark index") and a peer group of funds with similar objectives ("peer group"), if any. In its evaluation of fund investment performance, the Board gave particular attention to information indicating changes in performance of certain Fidelity funds for specific time periods and discussed with the Investment Advisers the reasons for any overperformance or underperformance.In addition to reviewing absolute and relative fund performance, the Independent Trustees periodically consider the appropriateness of fund performance metrics in evaluating the results achieved. In general, the Independent Trustees believe that fund performance should be evaluated based on net performance (after fees and expenses) of both the highest performing and lowest performing fund share classes, where applicable, compared to appropriate benchmark indices, over appropriate time periods that may include full market cycles, and compared to peer groups, as applicable, over the same periods, taking into account relevant factors including the following: general market conditions; issuer-specific information; and fund cash flows and other factors.The Independent Trustees recognize that shareholders evaluate performance on a net basis over their own holding periods, for which one-, three-, and five-year periods are often used as a proxy. For this reason, the performance information reviewed by the Board also included net cumulative calendar year total return information for the fund and an appropriate benchmark index and peer group for the most recent one-, three-, and five-year periods, as shown below. Returns are shown compared to the 25th percentile (top of box, 75% beaten) and 75th percentile (bottom of box, 25% beaten) of the peer universe.Fidelity Advisor Equity Growth Fund
Fidelity Advisor Equity Growth Fund
![]()
EPGZ-ANN-0116
1.9585493.102
Fidelity Advisor® Growth Opportunities Fund Class Z Annual Report November 30, 2015 |
|
Contents
Board Approval of Investment Advisory Contracts and Management Fees |
To view a fund's proxy voting guidelines and proxy voting record for the 12-month period ended June 30, visit http://www.fidelity.com/proxyvotingresults or visit the Securities and Exchange Commission's (SEC) web site at http://www.sec.gov.
You may also call 1-877-208-0098 to request a free copy of the proxy voting guidelines.
Standard & Poor's, S&P and S&P 500 are registered service marks of The McGraw-Hill Companies, Inc. and have been licensed for use by Fidelity Distributors Corporation.
Other third-party marks appearing herein are the property of their respective owners.
All other marks appearing herein are registered or unregistered trademarks or service marks of FMR LLC or an affiliated company. © 2016 FMR LLC. All rights reserved.
This report and the financial statements contained herein are submitted for the general information of the shareholders of the Fund. This report is not authorized for distribution to prospective investors in the Fund unless preceded or accompanied by an effective prospectus.
A fund files its complete schedule of portfolio holdings with the SEC for the first and third quarters of each fiscal year on Form N-Q. Forms N-Q are available on the SEC’s web site at http://www.sec.gov. A fund's Forms N-Q may be reviewed and copied at the SEC’s Public Reference Room in Washington, DC. Information regarding the operation of the SEC's Public Reference Room may be obtained by calling 1-800-SEC-0330.
For a complete list of a fund's portfolio holdings, view the most recent holdings listing, semiannual report, or annual report on Fidelity's web site at http://www.fidelity.com, http://www.advisor.fidelity.com, or http://www.401k.com, as applicable.
NOT FDIC INSURED •MAY LOSE VALUE •NO BANK GUARANTEE
Neither the Fund nor Fidelity Distributors Corporation is a bank.
Performance: The Bottom Line
Average annual total return reflects the change in the value of an investment, assuming reinvestment of distributions from dividend income and capital gains (the profits earned upon the sale of securities that have grown in value, if any) and assuming a constant rate of performance each year.
The hypothetical investment and the average annual total returns do not reflect the deduction of taxes that a shareholder would pay on fund distributions or the redemption of fund shares.
During periods of reimbursement by Fidelity, a fund’s total return will be greater than it would be had the reimbursement not occurred.
How a fund did yesterday is no guarantee of how it will do tomorrow.
Average Annual Total Returns
| For the periods ended November 30, 2015 | Past 1 year | Past 5 years | Past 10 years |
| Class Z | 5.70% | 16.09% | 7.91% |
The initial offering of Class Z shares took place on August 13, 2013. Returns prior to August 13, 2013, are those of Class I.
Prior to February 1, 2007, the fund operated under certain different investment policies and compared its performance to a different index. The fund's historical performance may not represent its current investment policies.
$10,000 Over 10 Years
Let's say hypothetically that $10,000 was invested in Fidelity Advisor® Growth Opportunities Fund - Class Z on November 30, 2005.
The chart shows how the value of your investment would have changed, and also shows how the Russell 1000® Growth Index performed over the same period.
See previous page for additional information regarding the performance of Class Z.
| Period Ending Values | ||
| $21,401 | Fidelity Advisor® Growth Opportunities Fund - Class Z | |
| $22,947 | Russell 1000® Growth Index | |
Management's Discussion of Fund Performance
Market Recap: U.S. stocks gained modestly for the 12 months ending November 30, 2015, despite a steep decline in August and September on concern about slowing economic growth in China. The S&P 500® index rebounded in October and gained 2.75% for the year. Stocks benefited late in the period amid waning expectations for a near-term interest-rate hike by the U.S. Federal Reserve, more economic stimulus in Europe and an interest-rate cut in China. Growth stocks in the benchmark far outpaced their value counterparts, as investors continued to seek growth in a subpar economic environment. Sector performance varied widely, with more than 26 percentage points separating the leader from the laggard. Consumer discretionary (+14%) secured the top spot, benefiting from a combination of rising personal income and still-benign inflation. Information technology (+7%) and health care (+4%) also outpaced the broad market. Conversely, the energy sector (-12%) performed worst, stymied by depressed commodity prices that also hit materials (-5%). Telecommunication services (-5%) and utilities (-4%), considered defensive sectors less sensitive to the economy, also lost ground. At period end, investors remained focused on the potential global implications of a stronger U.S. dollar and how China's transition toward a consumption-led economy may affect corporate earnings.Comments from Lead Portfolio Manager Kyle Weaver: For the year, the fund's share classes posted gains in the mid-single digits but lagged the 6.12% return of the benchmark Russell 1000® Growth Index. Stock selection in the consumer staples, consumer discretionary and industrials sectors meaningfully detracted versus the benchmark. A large overweighting in Keurig Green Mountain, an innovator in single-serve beverage products, was the fund's biggest relative detractor, as sales and profitability of the company's products were pressured by cheaper knock-offs. I considerably reduced this position but remained overweighted at period end. Other noteworthy detractors included non-index positions in Lumber Liquidators Holdings, which I sold, and Endurance International Group Holdings, a Web-hosting company. Conversely, picks in health care and information technology added significant value. Regeneron Pharmaceuticals, the fund's top relative contributor, and Alkermes are two biotechnology stocks that strongly outperformed. Salesforce.com, a provider of cloud-based marketing and customer relationship management solutions, also was a strong performer this period. I reduced our stake in all three contributors noted but maintained overweightings in each case.Note to shareholders: Kyle Weaver was named Lead Portfolio Manager of the fund, and Steven Wymer Co-Manager, on July 14, 2015, succeeding Gopal Reddy.The views expressed above reflect those of the portfolio manager(s) only through the end of the period as stated on the cover of this report and do not necessarily represent the views of Fidelity or any other person in the Fidelity organization. Any such views are subject to change at any time based upon market or other conditions and Fidelity disclaims any responsibility to update such views. These views may not be relied on as investment advice and, because investment decisions for a Fidelity fund are based on numerous factors, may not be relied on as an indication of trading intent on behalf of any Fidelity fund.
Investment Summary (Unaudited)
Top Ten Stocks as of November 30, 2015
| % of fund's net assets | % of fund's net assets 6 months ago | |
| Apple, Inc. | 7.0 | 6.6 |
| Alphabet, Inc. Class A | 3.0 | 2.3 |
| Alphabet, Inc. Class C | 3.0 | 2.2 |
| Facebook, Inc. Class A | 2.4 | 2.1 |
| Amazon.com, Inc. | 2.2 | 1.6 |
| American Tower Corp. | 2.1 | 0.0 |
| Visa, Inc. Class A | 2.0 | 1.8 |
| Salesforce.com, Inc. | 1.8 | 4.5 |
| Cognizant Technology Solutions Corp. Class A | 1.7 | 0.2 |
| Endurance International Group Holdings, Inc. | 1.5 | 0.0 |
| 26.7 |
Top Five Market Sectors as of November 30, 2015
| % of fund's net assets | % of fund's net assets 6 months ago | |
| Information Technology | 38.6 | 36.0 |
| Health Care | 18.4 | 23.5 |
| Consumer Discretionary | 17.0 | 16.0 |
| Industrials | 8.3 | 6.8 |
| Consumer Staples | 6.1 | 8.4 |
Asset Allocation (% of fund's net assets)
| As of November 30, 2015* | ||
| Stocks | 99.2% | |
| Convertible Securities | 0.8% | |

* Foreign investments - 9.1%
| As of May 31, 2015* | ||
| Stocks | 98.8% | |
| Convertible Securities | 0.7% | |
| Short-Term Investments and Net Other Assets (Liabilities) | 0.5% | |

* Foreign investments - 6.8%
Percentages shown as 0.0% may reflect amounts less than 0.05%.
Investments November 30, 2015
Showing Percentage of Net Assets
| Common Stocks - 99.2% | |||
| Shares | Value (000s) | ||
| CONSUMER DISCRETIONARY - 17.0% | |||
| Auto Components - 0.5% | |||
| Tenneco, Inc. (a) | 286,400 | $15,431 | |
| Automobiles - 0.6% | |||
| Tesla Motors, Inc. (a)(b) | 95,700 | 22,036 | |
| Diversified Consumer Services - 0.1% | |||
| ServiceMaster Global Holdings, Inc. (a) | 100,900 | 3,782 | |
| Hotels, Restaurants & Leisure - 2.8% | |||
| Buffalo Wild Wings, Inc. (a) | 66,200 | 10,608 | |
| Chipotle Mexican Grill, Inc. (a) | 51,500 | 29,847 | |
| Domino's Pizza, Inc. | 47,000 | 5,051 | |
| Dunkin' Brands Group, Inc. (b) | 165,200 | 7,008 | |
| Las Vegas Sands Corp. | 277,692 | 12,235 | |
| Starbucks Corp. | 421,800 | 25,894 | |
| Starwood Hotels & Resorts Worldwide, Inc. | 54,100 | 3,887 | |
| 94,530 | |||
| Internet & Catalog Retail - 3.7% | |||
| Amazon.com, Inc. (a) | 115,600 | 76,851 | |
| Netflix, Inc. (a) | 137,500 | 16,958 | |
| Priceline Group, Inc. (a) | 14,400 | 17,983 | |
| Travelport Worldwide Ltd. (b) | 1,174,200 | 15,629 | |
| 127,421 | |||
| Media - 4.9% | |||
| AMC Networks, Inc. Class A (a) | 109,300 | 8,887 | |
| Charter Communications, Inc. Class A (a)(b) | 270,200 | 50,625 | |
| Comcast Corp. Class A | 668,900 | 40,709 | |
| Liberty Global PLC Class A (a) | 403,700 | 17,121 | |
| Lions Gate Entertainment Corp. (b) | 217,800 | 7,392 | |
| The Walt Disney Co. | 355,300 | 40,316 | |
| Twenty-First Century Fox, Inc. Class A | 10,500 | 310 | |
| Zee Entertainment Enterprises Ltd. | 679,770 | 4,174 | |
| 169,534 | |||
| Multiline Retail - 0.2% | |||
| Dollar General Corp. | 96,600 | 6,319 | |
| Specialty Retail - 1.4% | |||
| CarMax, Inc. (a) | 231,000 | 13,236 | |
| Home Depot, Inc. | 108,300 | 14,499 | |
| TJX Companies, Inc. | 270,200 | 19,076 | |
| 46,811 | |||
| Textiles, Apparel & Luxury Goods - 2.8% | |||
| lululemon athletica, Inc. (a) | 516,216 | 24,685 | |
| Michael Kors Holdings Ltd. (a) | 88,400 | 3,803 | |
| NIKE, Inc. Class B | 273,300 | 36,152 | |
| Skechers U.S.A., Inc. Class A (sub. vtg.) (a) | 458,898 | 13,859 | |
| Under Armour, Inc. Class A (sub. vtg.) (a)(b) | 123,600 | 10,657 | |
| VF Corp. | 133,400 | 8,631 | |
| 97,787 | |||
| TOTAL CONSUMER DISCRETIONARY | 583,651 | ||
| CONSUMER STAPLES - 5.9% | |||
| Beverages - 1.7% | |||
| Monster Beverage Corp. | 126,600 | 19,574 | |
| PepsiCo, Inc. | 136,900 | 13,712 | |
| The Coca-Cola Co. | 555,200 | 23,663 | |
| 56,949 | |||
| Food & Staples Retailing - 2.5% | |||
| Costco Wholesale Corp. | 227,500 | 36,723 | |
| CVS Health Corp. | 332,800 | 31,313 | |
| Walgreens Boots Alliance, Inc. | 188,200 | 15,814 | |
| Whole Foods Market, Inc. | 109,400 | 3,189 | |
| 87,039 | |||
| Food Products - 0.6% | |||
| Keurig Green Mountain, Inc. | 168,200 | 8,814 | |
| Mead Johnson Nutrition Co. Class A | 83,700 | 6,745 | |
| Mondelez International, Inc. | 110,100 | 4,807 | |
| 20,366 | |||
| Household Products - 0.6% | |||
| Procter & Gamble Co. | 182,900 | 13,688 | |
| Svenska Cellulosa AB (SCA) (B Shares) | 238,500 | 6,864 | |
| 20,552 | |||
| Personal Products - 0.2% | |||
| Herbalife Ltd. (a) | 122,400 | 7,066 | |
| Tobacco - 0.3% | |||
| Altria Group, Inc. | 179,200 | 10,322 | |
| TOTAL CONSUMER STAPLES | 202,294 | ||
| ENERGY - 1.2% | |||
| Energy Equipment & Services - 0.5% | |||
| Dril-Quip, Inc. (a) | 109,400 | 6,904 | |
| Oceaneering International, Inc. | 201,500 | 8,814 | |
| 15,718 | |||
| Oil, Gas & Consumable Fuels - 0.7% | |||
| Cabot Oil & Gas Corp. | 798,900 | 15,043 | |
| Golar LNG Ltd. | 28,700 | 785 | |
| PDC Energy, Inc. (a) | 136,800 | 7,728 | |
| 23,556 | |||
| TOTAL ENERGY | 39,274 | ||
| FINANCIALS - 5.3% | |||
| Banks - 1.5% | |||
| HDFC Bank Ltd. sponsored ADR | 246,900 | 14,350 | |
| JPMorgan Chase & Co. | 531,800 | 35,460 | |
| 49,810 | |||
| Capital Markets - 1.2% | |||
| BlackRock, Inc. Class A | 74,200 | 26,988 | |
| Charles Schwab Corp. | 452,200 | 15,244 | |
| Goldman Sachs Group, Inc. | 41 | 8 | |
| 42,240 | |||
| Consumer Finance - 0.4% | |||
| American Express Co. | 55,900 | 4,005 | |
| Discover Financial Services | 185,233 | 10,514 | |
| 14,519 | |||
| Diversified Financial Services - 0.1% | |||
| MSCI, Inc. Class A | 49,900 | 3,499 | |
| Real Estate Investment Trusts - 2.1% | |||
| American Tower Corp. | 726,600 | 72,210 | |
| TOTAL FINANCIALS | 182,278 | ||
| HEALTH CARE - 18.4% | |||
| Biotechnology - 12.8% | |||
| AbbVie, Inc. | 573,600 | 33,355 | |
| ACADIA Pharmaceuticals, Inc. (a) | 194,600 | 7,385 | |
| Aduro Biotech, Inc. (b) | 78,600 | 2,436 | |
| Agios Pharmaceuticals, Inc. (a) | 75,400 | 4,870 | |
| Alexion Pharmaceuticals, Inc. (a) | 129,400 | 23,090 | |
| Alkermes PLC (a) | 513,400 | 37,663 | |
| Alnylam Pharmaceuticals, Inc. (a) | 229,500 | 23,882 | |
| Amgen, Inc. | 214,300 | 34,524 | |
| Amicus Therapeutics, Inc. (a) | 641,000 | 6,878 | |
| Asterias Biotherapeutics, Inc. (a)(b) | 50,950 | 245 | |
| aTyr Pharma, Inc. (c) | 124,876 | 1,063 | |
| Avalanche Biotechnologies, Inc. (a) | 31,748 | 333 | |
| Baxalta, Inc. | 37,600 | 1,293 | |
| Biogen, Inc. (a) | 71,400 | 20,482 | |
| BioMarin Pharmaceutical, Inc. (a) | 169,500 | 16,165 | |
| BioTime, Inc. warrants 10/1/18 (a) | 62,345 | 52 | |
| bluebird bio, Inc. (a) | 107,000 | 9,496 | |
| Celgene Corp. (a) | 97,670 | 10,690 | |
| Celldex Therapeutics, Inc. (a) | 165,600 | 2,982 | |
| Edge Therapeutics, Inc. (a) | 173,400 | 2,407 | |
| Esperion Therapeutics, Inc. (a) | 77,500 | 2,202 | |
| Gilead Sciences, Inc. | 353,400 | 37,446 | |
| Insmed, Inc. (a) | 375,379 | 6,122 | |
| Intercept Pharmaceuticals, Inc. (a) | 10,235 | 1,807 | |
| Isis Pharmaceuticals, Inc. (a)(b) | 703,053 | 42,914 | |
| Lexicon Pharmaceuticals, Inc. (a) | 114,596 | 1,577 | |
| Merrimack Pharmaceuticals, Inc. (a) | 437,800 | 4,120 | |
| Novavax, Inc. (a) | 887,700 | 7,599 | |
| Ophthotech Corp. (a) | 151,000 | 9,599 | |
| Prothena Corp. PLC (a) | 123,802 | 8,733 | |
| Regeneron Pharmaceuticals, Inc. (a) | 88,700 | 48,297 | |
| Regulus Therapeutics, Inc. (a) | 318,000 | 3,202 | |
| Rigel Pharmaceuticals, Inc. (a) | 667,248 | 2,189 | |
| Seattle Genetics, Inc. (a)(b) | 152,367 | 6,396 | |
| Seres Therapeutics, Inc. | 21,900 | 785 | |
| Spark Therapeutics, Inc. (b) | 3,500 | 202 | |
| Transition Therapeutics, Inc. (a)(b) | 761,897 | 1,432 | |
| Vertex Pharmaceuticals, Inc. (a) | 99,390 | 12,857 | |
| XOMA Corp. (a)(b) | 1,084,759 | 1,443 | |
| 438,213 | |||
| Health Care Equipment & Supplies - 0.4% | |||
| Boston Scientific Corp. (a) | 476,700 | 8,714 | |
| Penumbra, Inc. (a) | 4,200 | 211 | |
| Stryker Corp. | 37,000 | 3,569 | |
| 12,494 | |||
| Health Care Providers & Services - 2.0% | |||
| Express Scripts Holding Co. (a) | 109,767 | 9,383 | |
| McKesson Corp. | 251,900 | 47,697 | |
| UnitedHealth Group, Inc. | 97,100 | 10,944 | |
| 68,024 | |||
| Health Care Technology - 0.4% | |||
| athenahealth, Inc. (a)(b) | 89,700 | 15,047 | |
| Castlight Health, Inc. Class B (a) | 116,700 | 467 | |
| 15,514 | |||
| Pharmaceuticals - 2.8% | |||
| AcelRx Pharmaceuticals, Inc. (a) | 714,917 | 4,089 | |
| Allergan PLC (a) | 58,490 | 18,359 | |
| Bristol-Myers Squibb Co. | 269,000 | 18,026 | |
| Endo Health Solutions, Inc. (a) | 276,800 | 17,018 | |
| Intra-Cellular Therapies, Inc. (a) | 36,700 | 1,957 | |
| Mylan N.V. | 66,000 | 3,386 | |
| Teva Pharmaceutical Industries Ltd. sponsored ADR | 560,500 | 35,272 | |
| 98,107 | |||
| TOTAL HEALTH CARE | 632,352 | ||
| INDUSTRIALS - 8.3% | |||
| Aerospace & Defense - 0.9% | |||
| Honeywell International, Inc. | 114,400 | 11,892 | |
| The Boeing Co. | 137,100 | 19,941 | |
| 31,833 | |||
| Air Freight & Logistics - 0.4% | |||
| FedEx Corp. | 33,900 | 5,375 | |
| United Parcel Service, Inc. Class B | 82,500 | 8,498 | |
| 13,873 | |||
| Airlines - 2.5% | |||
| American Airlines Group, Inc. | 180,400 | 7,443 | |
| Controladora Vuela Compania de Aviacion S.A.B. de CV (a) | 1,097,300 | 1,935 | |
| Controladora Vuela Compania de Aviacion S.A.B. de CV ADR (a) | 105,300 | 1,863 | |
| Delta Air Lines, Inc. | 354,300 | 16,461 | |
| JetBlue Airways Corp. (a) | 66,000 | 1,633 | |
| Southwest Airlines Co. | 829,400 | 38,053 | |
| Spirit Airlines, Inc. (a) | 292,900 | 10,770 | |
| United Continental Holdings, Inc. (a) | 86,100 | 4,798 | |
| WestJet Airlines Ltd. | 199,300 | 3,170 | |
| 86,126 | |||
| Building Products - 0.0% | |||
| Caesarstone Sdot-Yam Ltd. | 36,100 | 1,476 | |
| Electrical Equipment - 1.2% | |||
| Acuity Brands, Inc. | 32,800 | 7,573 | |
| SolarCity Corp. (a)(b) | 1,101,700 | 31,685 | |
| Sunrun, Inc. (a)(b) | 241,300 | 1,605 | |
| 40,863 | |||
| Industrial Conglomerates - 0.9% | |||
| 3M Co. | 62,200 | 9,739 | |
| Danaher Corp. | 230,700 | 22,237 | |
| 31,976 | |||
| Professional Services - 0.7% | |||
| TriNet Group, Inc. (a) | 938,300 | 18,531 | |
| Verisk Analytics, Inc. (a) | 47,700 | 3,575 | |
| 22,106 | |||
| Road & Rail - 1.4% | |||
| Genesee & Wyoming, Inc. Class A (a) | 123,700 | 8,569 | |
| Hertz Global Holdings, Inc. (a) | 135,400 | 2,147 | |
| J.B. Hunt Transport Services, Inc. | 212,200 | 16,603 | |
| TransForce, Inc. | 295,200 | 5,626 | |
| Union Pacific Corp. | 163,200 | 13,701 | |
| 46,646 | |||
| Trading Companies & Distributors - 0.3% | |||
| HD Supply Holdings, Inc. (a) | 345,700 | 10,934 | |
| TOTAL INDUSTRIALS | 285,833 | ||
| INFORMATION TECHNOLOGY - 38.2% | |||
| Communications Equipment - 0.6% | |||
| Infinera Corp. (a) | 423,581 | 9,539 | |
| QUALCOMM, Inc. | 201,165 | 9,815 | |
| 19,354 | |||
| Electronic Equipment & Components - 0.0% | |||
| CDW Corp. | 38,400 | 1,658 | |
| Internet Software & Services - 13.1% | |||
| Alibaba Group Holding Ltd. sponsored ADR (a)(b) | 402,300 | 33,825 | |
| Alphabet, Inc.: | |||
| Class A (a) | 133,665 | 101,966 | |
| Class C | 137,175 | 101,866 | |
| Demandware, Inc. (a)(b) | 150,000 | 7,673 | |
| Endurance International Group Holdings, Inc. (a)(b) | 3,676,340 | 51,358 | |
| Facebook, Inc. Class A (a) | 804,841 | 83,897 | |
| GoDaddy, Inc. (a)(b) | 1,429,000 | 44,399 | |
| LinkedIn Corp. Class A (a) | 9,400 | 2,285 | |
| Rackspace Hosting, Inc. (a) | 176,202 | 5,043 | |
| Wix.com Ltd. (a) | 705,135 | 17,523 | |
| 449,835 | |||
| IT Services - 8.8% | |||
| Alliance Data Systems Corp. (a) | 113,600 | 32,586 | |
| Booz Allen Hamilton Holding Corp. Class A | 231,200 | 7,040 | |
| Cognizant Technology Solutions Corp. Class A (a) | 885,892 | 57,211 | |
| EPAM Systems, Inc. (a) | 451,300 | 35,531 | |
| Fidelity National Information Services, Inc. | 23,771 | 1,513 | |
| Gartner, Inc. Class A (a) | 79,900 | 7,455 | |
| MasterCard, Inc. Class A | 459,200 | 44,965 | |
| PayPal Holdings, Inc. (a) | 235,600 | 8,307 | |
| Sabre Corp. | 1,108,600 | 32,438 | |
| Square, Inc. | 129,100 | 1,554 | |
| Visa, Inc. Class A | 885,300 | 69,948 | |
| WEX, Inc. (a) | 28,500 | 2,687 | |
| 301,235 | |||
| Semiconductors & Semiconductor Equipment - 3.4% | |||
| Avago Technologies Ltd. | 171,700 | 22,398 | |
| Broadcom Corp. Class A | 322,500 | 17,618 | |
| Cypress Semiconductor Corp. (b) | 763,766 | 8,264 | |
| Micron Technology, Inc. (a) | 126,600 | 2,017 | |
| NVIDIA Corp. | 361,030 | 11,452 | |
| NXP Semiconductors NV (a) | 257,500 | 24,066 | |
| Qorvo, Inc. (a) | 440,800 | 25,597 | |
| SolarEdge Technologies, Inc. (b) | 217,900 | 4,277 | |
| SunEdison, Inc. (a)(b) | 245,000 | 782 | |
| 116,471 | |||
| Software - 4.7% | |||
| Adobe Systems, Inc. (a) | 119,300 | 10,911 | |
| Electronic Arts, Inc.(a) | 121,400 | 8,230 | |
| Fortinet, Inc. (a) | 47,600 | 1,715 | |
| Interactive Intelligence Group, Inc. (a) | 189,200 | 6,520 | |
| Microsoft Corp. | 935,900 | 50,866 | |
| Oracle Corp. | 90,600 | 3,531 | |
| Red Hat, Inc. (a) | 43,830 | 3,568 | |
| Salesforce.com, Inc. (a) | 765,700 | 61,019 | |
| ServiceNow, Inc. (a) | 126,200 | 10,981 | |
| Workday, Inc. Class A (a) | 65,200 | 5,458 | |
| 162,799 | |||
| Technology Hardware, Storage & Peripherals - 7.6% | |||
| Apple, Inc. | 2,017,706 | 238,689 | |
| Electronics for Imaging, Inc. (a) | 352,400 | 17,296 | |
| Nimble Storage, Inc. (a)(b) | 477,400 | 4,998 | |
| Pure Storage, Inc. Class A (a) | 31,100 | 402 | |
| 261,385 | |||
| TOTAL INFORMATION TECHNOLOGY | 1,312,737 | ||
| MATERIALS - 3.5% | |||
| Chemicals - 3.0% | |||
| E.I. du Pont de Nemours & Co. | 123,700 | 8,330 | |
| Ecolab, Inc. | 29,300 | 3,491 | |
| LyondellBasell Industries NV Class A | 535,800 | 51,340 | |
| PPG Industries, Inc. | 262,900 | 27,799 | |
| The Chemours Co. LLC | 19,160 | 120 | |
| The Dow Chemical Co. | 235,700 | 12,287 | |
| 103,367 | |||
| Containers & Packaging - 0.5% | |||
| Sealed Air Corp. | 334,700 | 15,182 | |
| TOTAL MATERIALS | 118,549 | ||
| TELECOMMUNICATION SERVICES - 1.4% | |||
| Diversified Telecommunication Services - 0.2% | |||
| Verizon Communications, Inc. | 147,300 | 6,695 | |
| Wireless Telecommunication Services - 1.2% | |||
| SBA Communications Corp. Class A (a) | 117,500 | 12,356 | |
| T-Mobile U.S., Inc. (a) | 840,500 | 29,838 | |
| 42,194 | |||
| TOTAL TELECOMMUNICATION SERVICES | 48,889 | ||
| UTILITIES - 0.0% | |||
| Independent Power and Renewable Electricity Producers - 0.0% | |||
| Terraform Power, Inc. (b) | 145,700 | 1,005 | |
| TOTAL COMMON STOCKS | |||
| (Cost $2,296,893) | 3,406,862 | ||
| Convertible Preferred Stocks - 0.8% | |||
| CONSUMER STAPLES - 0.2% | |||
| Food & Staples Retailing - 0.1% | |||
| Blue Apron, Inc. Series D (d) | 217,605 | 2,900 | |
| Tobacco - 0.1% | |||
| PAX Labs, Inc. Series C (d) | 1,069,313 | 4,128 | |
| TOTAL CONSUMER STAPLES | 7,028 | ||
| FINANCIALS - 0.2% | |||
| Real Estate Management & Development - 0.2% | |||
| Redfin Corp. Series G (d) | 1,081,736 | 4,067 | |
| INFORMATION TECHNOLOGY - 0.4% | |||
| Internet Software & Services - 0.2% | |||
| Uber Technologies, Inc. Series D, 8.00% (a)(d) | 221,104 | 8,765 | |
| Software - 0.2% | |||
| Cloudera, Inc. Series F (a)(d) | 41,786 | 1,372 | |
| MongoDB, Inc. Series F, 8.00% (a)(d) | 515,124 | 4,008 | |
| 5,380 | |||
| TOTAL INFORMATION TECHNOLOGY | 14,145 | ||
| TOTAL CONVERTIBLE PREFERRED STOCKS | |||
| (Cost $23,237) | 25,240 | ||
| Money Market Funds - 5.6% | |||
| Fidelity Cash Central Fund, 0.18% (e) | 10,486,486 | 10,486 | |
| Fidelity Securities Lending Cash Central Fund, 0.22% (e)(f) | 182,358,373 | 182,358 | |
| TOTAL MONEY MARKET FUNDS | |||
| (Cost $192,844) | 192,844 | ||
| TOTAL INVESTMENT PORTFOLIO - 105.6% | |||
| (Cost $2,512,974) | 3,624,946 | ||
| NET OTHER ASSETS (LIABILITIES) - (5.6)% | (190,651) | ||
| NET ASSETS - 100% | $3,434,295 |
Legend
(a) Non-income producing
(b) Security or a portion of the security is on loan at period end.
(c) Security exempt from registration under Rule 144A of the Securities Act of 1933. These securities may be resold in transactions exempt from registration, normally to qualified institutional buyers. At the end of the period, the value of these securities amounted to $1,063,000 or 0.0% of net assets.
(d) Restricted securities - Investment in securities not registered under the Securities Act of 1933 (excluding 144A issues). At the end of the period, the value of restricted securities (excluding 144A issues) amounted to $25,240,000 or 0.7% of net assets.
(e) Affiliated fund that is generally available only to investment companies and other accounts managed by Fidelity Investments. The rate quoted is the annualized seven-day yield of the fund at period end. A complete unaudited listing of the fund's holdings as of its most recent quarter end is available upon request. In addition, each Fidelity Central Fund's financial statements, which are not covered by the Fund's Report of Independent Registered Public Accounting Firm, are available on the SEC's website or upon request.
(f) Investment made with cash collateral received from securities on loan.
Additional information on each restricted holding is as follows:
| Security | Acquisition Date | Acquisition Cost (000s) |
| Blue Apron, Inc. Series D | 5/18/15 | $2,900 |
| Cloudera, Inc. Series F | 2/5/14 | $608 |
| MongoDB, Inc. Series F, 8.00% | 10/2/13 | $8,615 |
| PAX Labs, Inc. Series C | 5/22/15 | $4,117 |
| Redfin Corp. Series G | 12/16/14 | $3,567 |
| Uber Technologies, Inc. Series D, 8.00% | 6/6/14 | $3,430 |
Affiliated Central Funds
Information regarding fiscal year to date income earned by the Fund from investments in Fidelity Central Funds is as follows:
| Fund | Income earned |
| (Amounts in thousands) | |
| Fidelity Cash Central Fund | $35 |
| Fidelity Securities Lending Cash Central Fund | 882 |
| Total | $917 |
Investment Valuation
The following is a summary of the inputs used, as of November 30, 2015, involving the Fund's assets and liabilities carried at fair value. The inputs or methodology used for valuing securities may not be an indication of the risk associated with investing in those securities. For more information on valuation inputs, and their aggregation into the levels used below, please refer to the Investment Valuation section in the accompanying Notes to Financial Statements.
| Valuation Inputs at Reporting Date: | ||||
| Description | Total | Level 1 | Level 2 | Level 3 |
| (Amounts in thousands) | ||||
| Investments in Securities: | ||||
| Equities: | ||||
| Consumer Discretionary | $583,651 | $583,651 | $-- | $-- |
| Consumer Staples | 209,322 | 195,430 | 6,864 | 7,028 |
| Energy | 39,274 | 39,274 | -- | -- |
| Financials | 186,345 | 182,278 | -- | 4,067 |
| Health Care | 632,352 | 632,352 | -- | -- |
| Industrials | 285,833 | 285,833 | -- | -- |
| Information Technology | 1,326,882 | 1,312,737 | -- | 14,145 |
| Materials | 118,549 | 118,549 | -- | -- |
| Telecommunication Services | 48,889 | 48,889 | -- | -- |
| Utilities | 1,005 | 1,005 | -- | -- |
| Money Market Funds | 192,844 | 192,844 | -- | -- |
| Total Investments in Securities: | $3,624,946 | $3,592,842 | $6,864 | $25,240 |
Other Information
Distribution of investments by country or territory of incorporation, as a percentage of Total Net Assets, is as follows (Unaudited):
| United States of America | 89.4% |
| Ireland | 2.4% |
| Netherlands | 2.3% |
| Israel | 1.5% |
| Cayman Islands | 1.2% |
| Others (Individually Less Than 1%) | 3.2% |
| 100.0% |
See accompanying notes which are an integral part of the financial statements.
Financial Statements
Statement of Assets and Liabilities
| Amounts in thousands (except per-share amounts) | November 30, 2015 | |
| Assets | ||
| Investment in securities, at value (including securities loaned of $177,242) — See accompanying schedule: Unaffiliated issuers (cost $2,320,130) | $3,432,102 | |
| Fidelity Central Funds (cost $192,844) | 192,844 | |
| Total Investments (cost $2,512,974) | $3,624,946 | |
| Receivable for investments sold | 8,550 | |
| Receivable for fund shares sold | 1,885 | |
| Dividends receivable | 2,505 | |
| Distributions receivable from Fidelity Central Funds | 134 | |
| Prepaid expenses | 8 | |
| Other receivables | 147 | |
| Total assets | 3,638,175 | |
| Liabilities | ||
| Payable for investments purchased | $8,383 | |
| Payable for fund shares redeemed | 9,798 | |
| Accrued management fee | 1,591 | |
| Distribution and service plan fees payable | 950 | |
| Other affiliated payables | 607 | |
| Other payables and accrued expenses | 193 | |
| Collateral on securities loaned, at value | 182,358 | |
| Total liabilities | 203,880 | |
| Net Assets | $3,434,295 | |
| Net Assets consist of: | ||
| Paid in capital | $1,961,636 | |
| Accumulated net investment loss | (4,687) | |
| Accumulated undistributed net realized gain (loss) on investments and foreign currency transactions | 365,375 | |
| Net unrealized appreciation (depreciation) on investments and assets and liabilities in foreign currencies | 1,111,971 | |
| Net Assets | $3,434,295 | |
| Calculation of Maximum Offering Price | ||
| Class A: | ||
| Net Asset Value and redemption price per share ($664,134 ÷ 9,931.66 shares) | $66.87 | |
| Maximum offering price per share (100/94.25 of $66.87) | $70.95 | |
| Class T: | ||
| Net Asset Value and redemption price per share ($1,461,197 ÷ 21,890.00 shares) | $66.75 | |
| Maximum offering price per share (100/96.50 of $66.75) | $69.17 | |
| Class B: | ||
| Net Asset Value and offering price per share ($5,831 ÷ 95.67 shares)(a) | $60.95 | |
| Class C: | ||
| Net Asset Value and offering price per share ($237,894 ÷ 3,873.23 shares)(a) | $61.42 | |
| Class I: | ||
| Net Asset Value, offering price and redemption price per share ($1,060,642 ÷ 15,142.22 shares) | $70.05 | |
| Class Z: | ||
| Net Asset Value, offering price and redemption price per share ($4,597 ÷ 65.42 shares) | $70.27 |
(a) Redemption price per share is equal to net asset value less any applicable contingent deferred sales charge.
See accompanying notes which are an integral part of the financial statements.
Statement of Operations
| Amounts in thousands | Year ended November 30, 2015 | |
| Investment Income | ||
| Dividends | $32,275 | |
| Income from Fidelity Central Funds | 917 | |
| Total income | 33,192 | |
| Expenses | ||
| Management fee | ||
| Basic fee | $19,666 | |
| Performance adjustment | 317 | |
| Transfer agent fees | 6,720 | |
| Distribution and service plan fees | 11,405 | |
| Accounting and security lending fees | 1,039 | |
| Custodian fees and expenses | 53 | |
| Independent trustees' compensation | 16 | |
| Registration fees | 144 | |
| Audit | 65 | |
| Legal | 15 | |
| Interest | 13 | |
| Miscellaneous | 26 | |
| Total expenses before reductions | 39,479 | |
| Expense reductions | (172) | 39,307 |
| Net investment income (loss) | (6,115) | |
| Realized and Unrealized Gain (Loss) | ||
| Net realized gain (loss) on: | ||
| Investment securities: | ||
| Unaffiliated issuers | 500,027 | |
| Foreign currency transactions | 1 | |
| Total net realized gain (loss) | 500,028 | |
| Change in net unrealized appreciation (depreciation) on: Investment securities | (309,232) | |
| Total change in net unrealized appreciation (depreciation) | (309,232) | |
| Net gain (loss) | 190,796 | |
| Net increase (decrease) in net assets resulting from operations | $184,681 |
See accompanying notes which are an integral part of the financial statements.
Statement of Changes in Net Assets
| Amounts in thousands | Year ended November 30, 2015 | Year ended November 30, 2014 |
| Increase (Decrease) in Net Assets | ||
| Operations | ||
| Net investment income (loss) | $(6,115) | $(7,776) |
| Net realized gain (loss) | 500,028 | 148,379 |
| Change in net unrealized appreciation (depreciation) | (309,232) | 368,352 |
| Net increase (decrease) in net assets resulting from operations | 184,681 | 508,955 |
| Share transactions - net increase (decrease) | (483,133) | (40,304) |
| Total increase (decrease) in net assets | (298,452) | 468,651 |
| Net Assets | ||
| Beginning of period | 3,732,747 | 3,264,096 |
| End of period (including accumulated net investment loss of $4,687 and accumulated net investment loss of $3,051, respectively) | $3,434,295 | $3,732,747 |
See accompanying notes which are an integral part of the financial statements.
Financial Highlights — Fidelity Advisor Growth Opportunities Fund Class A
| November 30, | |||||
| Years ended November 30, | 2015 | 2014 | 2013 | 2012 | 2011 |
| Selected Per–Share Data | |||||
| Net asset value, beginning of period | $63.52 | $54.89 | $41.34 | $35.39 | $32.30 |
| Income from Investment Operations | |||||
| Net investment income (loss)A | (.08) | (.11) | (.10) | (.11) | (.08) |
| Net realized and unrealized gain (loss) | 3.43 | 8.74 | 13.65 | 6.06 | 3.17 |
| Total from investment operations | 3.35 | 8.63 | 13.55 | 5.95 | 3.09 |
| Net asset value, end of period | $66.87 | $63.52 | $54.89 | $41.34 | $35.39 |
| Total ReturnB,C | 5.27% | 15.72% | 32.78% | 16.81% | 9.57% |
| Ratios to Average Net AssetsD,E | |||||
| Expenses before reductions | 1.05% | 1.08% | 1.23% | 1.30% | 1.08% |
| Expenses net of fee waivers, if any | 1.05% | 1.08% | 1.23% | 1.29% | 1.08% |
| Expenses net of all reductions | 1.05% | 1.08% | 1.23% | 1.29% | 1.07% |
| Net investment income (loss) | (.12)% | (.18)% | (.20)% | (.29)% | (.23)% |
| Supplemental Data | |||||
| Net assets, end of period (in millions) | $664 | $648 | $555 | $359 | $267 |
| Portfolio turnover rateF | 51% | 13% | 17% | 34% | 31% |
A Calculated based on average shares outstanding during the period.
B Total returns would have been lower if certain expenses had not been reduced during the applicable periods shown.
C Total returns do not include the effect of the sales charges.
D Fees and expenses of any underlying Fidelity Central Funds are not included in the Fund's expense ratio. The Fund indirectly bears its proportionate share of the expenses of any underlying Fidelity Central Funds.
E Expense ratios reflect operating expenses of the class. Expenses before reductions do not reflect amounts reimbursed by the investment adviser or reductions from brokerage service arrangements or reductions from other expense offset arrangements and do not represent the amount paid by the class during periods when reimbursements or reductions occur. Expenses net of fee waivers reflect expenses after reimbursement by the investment adviser but prior to reductions from brokerage service arrangements or other expense offset arrangements. Expenses net of all reductions represent the net expenses paid by the class.
F Amount does not include the portfolio activity of any underlying Fidelity Central Funds.
See accompanying notes which are an integral part of the financial statements.
Financial Highlights — Fidelity Advisor Growth Opportunities Fund Class T
| November 30, | |||||
| Years ended November 30, | 2015 | 2014 | 2013 | 2012 | 2011 |
| Selected Per–Share Data | |||||
| Net asset value, beginning of period | $63.55 | $55.04 | $41.54 | $35.62 | $32.58 |
| Income from Investment Operations | |||||
| Net investment income (loss)A | (.23) | (.24) | (.19) | (.19) | (.15) |
| Net realized and unrealized gain (loss) | 3.43 | 8.75 | 13.69 | 6.11 | 3.19 |
| Total from investment operations | 3.20 | 8.51 | 13.50 | 5.92 | 3.04 |
| Net asset value, end of period | $66.75 | $63.55 | $55.04 | $41.54 | $35.62 |
| Total ReturnB,C | 5.04% | 15.46% | 32.50% | 16.62% | 9.33% |
| Ratios to Average Net AssetsD,E | |||||
| Expenses before reductions | 1.28% | 1.31% | 1.43% | 1.48% | 1.25% |
| Expenses net of fee waivers, if any | 1.28% | 1.31% | 1.43% | 1.48% | 1.25% |
| Expenses net of all reductions | 1.28% | 1.31% | 1.43% | 1.48% | 1.25% |
| Net investment income (loss) | (.35)% | (.40)% | (.40)% | (.48)% | (.40)% |
| Supplemental Data | |||||
| Net assets, end of period (in millions) | $1,461 | $1,504 | $1,426 | $1,187 | $1,102 |
| Portfolio turnover rateF | 51% | 13% | 17% | 34% | 31% |
A Calculated based on average shares outstanding during the period.
B Total returns would have been lower if certain expenses had not been reduced during the applicable periods shown.
C Total returns do not include the effect of the sales charges.
D Fees and expenses of any underlying Fidelity Central Funds are not included in the Fund's expense ratio. The Fund indirectly bears its proportionate share of the expenses of any underlying Fidelity Central Funds.
E Expense ratios reflect operating expenses of the class. Expenses before reductions do not reflect amounts reimbursed by the investment adviser or reductions from brokerage service arrangements or reductions from other expense offset arrangements and do not represent the amount paid by the class during periods when reimbursements or reductions occur. Expenses net of fee waivers reflect expenses after reimbursement by the investment adviser but prior to reductions from brokerage service arrangements or other expense offset arrangements. Expenses net of all reductions represent the net expenses paid by the class.
F Amount does not include the portfolio activity of any underlying Fidelity Central Funds.
See accompanying notes which are an integral part of the financial statements.
Financial Highlights — Fidelity Advisor Growth Opportunities Fund Class B
| November 30, | |||||
| Years ended November 30, | 2015 | 2014 | 2013 | 2012 | 2011 |
| Selected Per–Share Data | |||||
| Net asset value, beginning of period | $58.39 | $50.87 | $38.62 | $33.31 | $30.64 |
| Income from Investment Operations | |||||
| Net investment income (loss)A | (.58) | (.55) | (.44) | (.39) | (.33) |
| Net realized and unrealized gain (loss) | 3.14 | 8.07 | 12.69 | 5.70 | 3.00 |
| Total from investment operations | 2.56 | 7.52 | 12.25 | 5.31 | 2.67 |
| Net asset value, end of period | $60.95 | $58.39 | $50.87 | $38.62 | $33.31 |
| Total ReturnB,C | 4.38% | 14.78% | 31.72% | 15.94% | 8.71% |
| Ratios to Average Net AssetsD,E | |||||
| Expenses before reductions | 1.90% | 1.92% | 2.03% | 2.07% | 1.83% |
| Expenses net of fee waivers, if any | 1.90% | 1.92% | 2.03% | 2.05% | 1.83% |
| Expenses net of all reductions | 1.90% | 1.92% | 2.03% | 2.05% | 1.83% |
| Net investment income (loss) | (.97)% | (1.02)% | (1.00)% | (1.05)% | (.98)% |
| Supplemental Data | |||||
| Net assets, end of period (in millions) | $6 | $9 | $12 | $13 | $14 |
| Portfolio turnover rateF | 51% | 13% | 17% | 34% | 31% |
A Calculated based on average shares outstanding during the period.
B Total returns would have been lower if certain expenses had not been reduced during the applicable periods shown.
C Total returns do not include the effect of the contingent deferred sales charge.
D Fees and expenses of any underlying Fidelity Central Funds are not included in the Fund's expense ratio. The Fund indirectly bears its proportionate share of the expenses of any underlying Fidelity Central Funds.
E Expense ratios reflect operating expenses of the class. Expenses before reductions do not reflect amounts reimbursed by the investment adviser or reductions from brokerage service arrangements or reductions from other expense offset arrangements and do not represent the amount paid by the class during periods when reimbursements or reductions occur. Expenses net of fee waivers reflect expenses after reimbursement by the investment adviser but prior to reductions from brokerage service arrangements or other expense offset arrangements. Expenses net of all reductions represent the net expenses paid by the class.
F Amount does not include the portfolio activity of any underlying Fidelity Central Funds.
See accompanying notes which are an integral part of the financial statements.
Financial Highlights — Fidelity Advisor Growth Opportunities Fund Class C
| November 30, | |||||
| Years ended November 30, | 2015 | 2014 | 2013 | 2012 | 2011 |
| Selected Per–Share Data | |||||
| Net asset value, beginning of period | $58.78 | $51.17 | $38.83 | $33.48 | $30.79 |
| Income from Investment Operations | |||||
| Net investment income (loss)A | (.52) | (.50) | (.42) | (.38) | (.33) |
| Net realized and unrealized gain (loss) | 3.16 | 8.11 | 12.76 | 5.73 | 3.02 |
| Total from investment operations | 2.64 | 7.61 | 12.34 | 5.35 | 2.69 |
| Net asset value, end of period | $61.42 | $58.78 | $51.17 | $38.83 | $33.48 |
| Total ReturnB,C | 4.49% | 14.87% | 31.78% | 15.98% | 8.74% |
| Ratios to Average Net AssetsD,E | |||||
| Expenses before reductions | 1.80% | 1.83% | 1.96% | 2.04% | 1.82% |
| Expenses net of fee waivers, if any | 1.80% | 1.83% | 1.96% | 2.03% | 1.82% |
| Expenses net of all reductions | 1.80% | 1.83% | 1.96% | 2.02% | 1.82% |
| Net investment income (loss) | (.87)% | (.93)% | (.93)% | (1.02)% | (.97)% |
| Supplemental Data | |||||
| Net assets, end of period (in millions) | $238 | $212 | $159 | $71 | $47 |
| Portfolio turnover rateF | 51% | 13% | 17% | 34% | 31% |
A Calculated based on average shares outstanding during the period.
B Total returns would have been lower if certain expenses had not been reduced during the applicable periods shown.
C Total returns do not include the effect of the contingent deferred sales charge.
D Fees and expenses of any underlying Fidelity Central Funds are not included in the Fund's expense ratio. The Fund indirectly bears its proportionate share of the expenses of any underlying Fidelity Central Funds.
E Expense ratios reflect operating expenses of the class. Expenses before reductions do not reflect amounts reimbursed by the investment adviser or reductions from brokerage service arrangements or reductions from other expense offset arrangements and do not represent the amount paid by the class during periods when reimbursements or reductions occur. Expenses net of fee waivers reflect expenses after reimbursement by the investment adviser but prior to reductions from brokerage service arrangements or other expense offset arrangements. Expenses net of all reductions represent the net expenses paid by the class.
F Amount does not include the portfolio activity of any underlying Fidelity Central Funds.
See accompanying notes which are an integral part of the financial statements.
Financial Highlights — Fidelity Advisor Growth Opportunities Fund Class I
| November 30, | |||||
| Years ended November 30, | 2015 | 2014 | 2013 | 2012 | 2011 |
| Selected Per–Share Data | |||||
| Net asset value, beginning of period | $66.35 | $57.18 | $42.94 | $36.63 | $33.33 |
| Income from Investment Operations | |||||
| Net investment income (loss)A | .11 | .05 | .05 | .01 | .05 |
| Net realized and unrealized gain (loss) | 3.59 | 9.12 | 14.19 | 6.30 | 3.25 |
| Total from investment operations | 3.70 | 9.17 | 14.24 | 6.31 | 3.30 |
| Net asset value, end of period | $70.05 | $66.35 | $57.18 | $42.94 | $36.63 |
| Total ReturnB | 5.58% | 16.04% | 33.16% | 17.23% | 9.90% |
| Ratios to Average Net AssetsC,D | |||||
| Expenses before reductions | .77% | .81% | .93% | .97% | .72% |
| Expenses net of fee waivers, if any | .77% | .81% | .93% | .97% | .72% |
| Expenses net of all reductions | .77% | .81% | .93% | .97% | .72% |
| Net investment income (loss) | .16% | .09% | .09% | .04% | .13% |
| Supplemental Data | |||||
| Net assets, end of period (in millions) | $1,061 | $1,357 | $1,112 | $475 | $215 |
| Portfolio turnover rateE | 51% | 13% | 17% | 34% | 31% |
A Calculated based on average shares outstanding during the period.
B Total returns would have been lower if certain expenses had not been reduced during the applicable periods shown.
C Fees and expenses of any underlying Fidelity Central Funds are not included in the Fund's expense ratio. The Fund indirectly bears its proportionate share of the expenses of any underlying Fidelity Central Funds.
D Expense ratios reflect operating expenses of the class. Expenses before reductions do not reflect amounts reimbursed by the investment adviser or reductions from brokerage service arrangements or reductions from other expense offset arrangements and do not represent the amount paid by the class during periods when reimbursements or reductions occur. Expenses net of fee waivers reflect expenses after reimbursement by the investment adviser but prior to reductions from brokerage service arrangements or other expense offset arrangements. Expenses net of all reductions represent the net expenses paid by the class.
E Amount does not include the portfolio activity of any underlying Fidelity Central Funds.
See accompanying notes which are an integral part of the financial statements.
Financial Highlights — Fidelity Advisor Growth Opportunities Fund Class Z
| November 30, | |||
| Years ended November 30, | 2015 | 2014 | 2013 A |
| Selected Per–Share Data | |||
| Net asset value, beginning of period | $66.48 | $57.20 | $53.30 |
| Income from Investment Operations | |||
| Net investment income (loss)B | .20 | .14 | .02 |
| Net realized and unrealized gain (loss) | 3.59 | 9.14 | 3.88 |
| Total from investment operations | 3.79 | 9.28 | 3.90 |
| Net asset value, end of period | $70.27 | $66.48 | $57.20 |
| Total ReturnC,D | 5.70% | 16.22% | 7.32% |
| Ratios to Average Net AssetsE,F | |||
| Expenses before reductions | .64% | .67% | .78%G |
| Expenses net of fee waivers, if any | .64% | .67% | .78%G |
| Expenses net of all reductions | .64% | .67% | .78%G |
| Net investment income (loss) | .29% | .24% | .14%G |
| Supplemental Data | |||
| Net assets, end of period (000 omitted) | $4,597 | $2,955 | $107 |
| Portfolio turnover rateH | 51% | 13% | 17% |
A For the period August 13, 2013 (commencement of sale of shares) to November 30, 2013.
B Calculated based on average shares outstanding during the period.
C Total returns for periods of less than one year are not annualized.
D Total returns would have been lower if certain expenses had not been reduced during the applicable periods shown.
E Fees and expenses of any underlying Fidelity Central Funds are not included in the Fund's expense ratio. The Fund indirectly bears its proportionate share of the expenses of any underlying Fidelity Central Funds.
F Expense ratios reflect operating expenses of the class. Expenses before reductions do not reflect amounts reimbursed by the investment adviser or reductions from brokerage service arrangements or reductions from other expense offset arrangements and do not represent the amount paid by the class during periods when reimbursements or reductions occur. Expense ratios before reductions for start-up periods may not be representative of longer-term operating periods. Expenses net of fee waivers reflect expenses after reimbursement by the investment adviser but prior to reductions from brokerage service arrangements or other expense offset arrangements. Expenses net of all reductions represent the net expenses paid by the class.
G Annualized
H Amount does not include the portfolio activity of any underlying Fidelity Central Funds.
See accompanying notes which are an integral part of the financial statements.
Notes to Financial Statements
For the period ended November 30, 2015
(Amounts in thousands except percentages)
1. Organization.
Fidelity Advisor Growth Opportunities Fund (the Fund) is a fund of Fidelity Advisor Series I (the Trust) and is authorized to issue an unlimited number of shares. The Trust is registered under the Investment Company Act of 1940, as amended (the 1940 Act), as an open-end management investment company organized as a Massachusetts business trust. The Fund offers Class A, Class T, Class C, Class I (formerly Institutional Class) and Class Z shares, each of which, along with Class B shares, has equal rights as to assets and voting privileges. Class B shares are closed to new accounts and additional purchases, except for exchanges and reinvestments. Each class has exclusive voting rights with respect to matters that affect that class. Class B shares will automatically convert to Class A shares after a holding period of seven years from the initial date of purchase.
2. Investments in Fidelity Central Funds.
The Fund invests in Fidelity Central Funds, which are open-end investment companies generally available only to other investment companies and accounts managed by the investment adviser and its affiliates. The Fund's Schedule of Investments lists each of the Fidelity Central Funds held as of period end, if any, as an investment of the Fund, but does not include the underlying holdings of each Fidelity Central Fund. As an Investing Fund, the Fund indirectly bears its proportionate share of the expenses of the underlying Fidelity Central Funds.
The Money Market Central Funds seek preservation of capital and current income and are managed by Fidelity Investments Money Management, Inc. (FIMM), an affiliate of the investment adviser. Annualized expenses of the Money Market Central Funds as of their most recent shareholder report date are less than .01%.
A complete unaudited list of holdings for each Fidelity Central Fund is available upon request or at the Securities and Exchange Commission (the SEC) website at www.sec.gov. In addition, the financial statements of the Fidelity Central Funds, which are not covered by the Fund's Report of Independent Registered Public Accounting Firm, are available on the SEC website or upon request.
3. Significant Accounting Policies.
The financial statements have been prepared in conformity with accounting principles generally accepted in the United States of America (GAAP), which require management to make certain estimates and assumptions at the date of the financial statements. Actual results could differ from those estimates. Subsequent events, if any, through the date that the financial statements were issued have been evaluated in the preparation of the financial statements. The following summarizes the significant accounting policies of the Fund:
Investment Valuation. Investments are valued as of 4:00 p.m. Eastern time on the last calendar day of the period. The Board of Trustees (the Board) has delegated the day to day responsibility for the valuation of the Fund's investments to the Fidelity Management & Research Company (FMR) Fair Value Committee (the Committee). In accordance with valuation policies and procedures approved by the Board, the Fund attempts to obtain prices from one or more third party pricing vendors or brokers to value its investments. When current market prices, quotations or currency exchange rates are not readily available or reliable, investments will be fair valued in good faith by the Committee, in accordance with procedures adopted by the Board. Factors used in determining fair value vary by investment type and may include market or investment specific events. The frequency with which these procedures are used cannot be predicted and they may be utilized to a significant extent. The Committee oversees the Fund's valuation policies and procedures and reports to the Board on the Committee's activities and fair value determinations. The Board monitors the appropriateness of the procedures used in valuing the Fund's investments and ratifies the fair value determinations of the Committee.
The Fund categorizes the inputs to valuation techniques used to value its investments into a disclosure hierarchy consisting of three levels as shown below:
- Level 1 – quoted prices in active markets for identical investments
- Level 2 – other significant observable inputs (including quoted prices for similar investments, interest rates, prepayment speeds, etc.)
- Level 3 – unobservable inputs (including the Fund's own assumptions based on the best information available)
Valuation techniques used to value the Fund's investments by major category are as follows:
Equity securities, including restricted securities, for which market quotations are readily available, are valued at the last reported sale price or official closing price as reported by a third party pricing vendor on the primary market or exchange on which they are traded and are categorized as Level 1 in the hierarchy. In the event there were no sales during the day or closing prices are not available, securities are valued at the last quoted bid price or may be valued using the last available price and are generally categorized as Level 2 in the hierarchy. For foreign equity securities, when market or security specific events arise, comparisons to the valuation of American Depositary Receipts (ADRs), futures contracts, Exchange-Traded Funds (ETFs) and certain indexes as well as quoted prices for similar securities may be used and would be categorized as Level 2 in the hierarchy. Utilizing these techniques may result in transfers between Level 1 and Level 2. For equity securities, including restricted securities, where observable inputs are limited, assumptions about market activity and risk are used and these securities may be categorized as Level 3 in the hierarchy.
Investments in open-end mutual funds, including the Fidelity Central Funds, are valued at their closing net asset value (NAV) each business day and are categorized as Level 1 in the hierarchy.
Changes in valuation techniques may result in transfers in or out of an assigned level within the disclosure hierarchy. The aggregate value of investments by input level as of November 30, 2015 is included at the end of the each Fund's Schedule of Investments.
Foreign Currency. The Fund may use foreign currency contracts to facilitate transactions in foreign-denominated securities. Gains and losses from these transactions may arise from changes in the value of the foreign currency or if the counterparties do not perform under the contracts' terms.
Foreign-denominated assets, including investment securities, and liabilities are translated into U.S. dollars at the exchange rates at period end. Purchases and sales of investment securities, income and dividends received and expenses denominated in foreign currencies are translated into U.S. dollars at the exchange rate in effect on the transaction date.
The effects of exchange rate fluctuations on investments are included with the net realized and unrealized gain (loss) on investment securities. Other foreign currency transactions resulting in realized and unrealized gain (loss) are disclosed separately.
Investment Transactions and Income. For financial reporting purposes, the Fund's investment holdings and NAV include trades executed through the end of the last business day of the period. The NAV per share for processing shareholder transactions is calculated as of the close of business of the New York Stock Exchange (NYSE), normally 4:00 p.m. Eastern time and includes trades executed through the end of the prior business day. Gains and losses on securities sold are determined on the basis of identified cost and may include proceeds received from litigation. Dividend income is recorded on the ex-dividend date, except for certain dividends from foreign securities where the ex-dividend date may have passed, which are recorded as soon as the Fund is informed of the ex-dividend date. Non-cash dividends included in dividend income, if any, are recorded at the fair market value of the securities received. Income and capital gain distributions from Fidelity Central Funds, if any, are recorded on the ex-dividend date. Distributions received on securities that represent a return of capital or capital gain are recorded as a reduction of cost of investments and/or as a realized gain. Subsequent to ex-dividend date the Fund determines the components of these distributions, based upon receipt of tax filings or other correspondence relating to the underlying investment. Interest income is accrued as earned and includes coupon interest and amortization of premium and accretion of discount on debt securities as applicable. Investment income is recorded net of foreign taxes withheld where recovery of such taxes is uncertain.
Class Allocations and Expenses. Investment income, realized and unrealized capital gains and losses, common expenses of the Fund, and certain fund-level expense reductions, if any, are allocated daily on a pro-rata basis to each class based on the relative net assets of each class to the total net assets of the Fund. Each class differs with respect to transfer agent and distribution and service plan fees incurred. Certain expense reductions may also differ by class. For the reporting period, the allocated portion of income and expenses to each class as a percent of its average net assets may vary due to the timing of recording these transactions in relation to fluctuating net assets of the classes. Expenses directly attributable to a fund are charged to that fund. Expenses attributable to more than one fund are allocated among the respective funds on the basis of relative net assets or other appropriate methods. Expense estimates are accrued in the period to which they relate and adjustments are made when actual amounts are known.
Deferred Trustee Compensation. Under a Deferred Compensation Plan (the Plan), independent Trustees may elect to defer receipt of a portion of their annual compensation. Deferred amounts are invested in a cross-section of Fidelity funds, are marked-to-market and remain in the Fund until distributed in accordance with the Plan. The investment of deferred amounts and the offsetting payable to the Trustees are included in the accompanying Statement of Assets and Liabilities.
Income Tax Information and Distributions to Shareholders. Each year, the Fund intends to qualify as a regulated investment company under Subchapter M of the Internal Revenue Code, including distributing substantially all of its taxable income and realized gains. As a result, no provision for U.S. Federal income taxes is required. As of November 30, 2015, the Fund did not have any unrecognized tax benefits in the financial statements; nor is the Fund aware of any tax positions for which it is reasonably possible that the total amounts of unrecognized tax benefits will significantly change in the next twelve months. The Fund files a U.S. federal tax return, in addition to state and local tax returns as required. The Fund's federal income tax returns are subject to examination by the Internal Revenue Service (IRS) for a period of three fiscal years after they are filed. State and local tax returns may be subject to examination for an additional fiscal year depending on the jurisdiction. Foreign taxes are provided for based on the Fund's understanding of the tax rules and rates that exist in the foreign markets in which it invests.
Distributions are declared and recorded on the ex-dividend date. Income dividends and capital gain distributions are declared separately for each class. Income and capital gain distributions are determined in accordance with income tax regulations, which may differ from GAAP. In addition, the Fund claimed a portion of the payment made to redeeming shareholders as a distribution for income tax purposes.
Capital accounts within the financial statements are adjusted for permanent book-tax differences. These adjustments have no impact on net assets or the results of operations. Capital accounts are not adjusted for temporary book-tax differences which will reverse in a subsequent period.
Book-tax differences are primarily due to foreign currency transactions, partnerships, passive foreign investment companies (PFIC), deferred trustees compensation, net operating losses, capital loss carryforwards and losses deferred due to wash sales and excise tax regulations.
The federal tax cost of investment securities and unrealized appreciation (depreciation) as of period end were as follows:
| Gross unrealized appreciation | $1,210,982 |
| Gross unrealized depreciation | (105,168) |
| Net unrealized appreciation (depreciation) on securities | $1,105,814 |
| Tax Cost | $2,519,132 |
The tax-based components of distributable earnings as of period end were as follows:
| Undistributed long-term capital gain | $371,533 |
| Net unrealized appreciation (depreciation) on securities and other investments | $1,105,813 |
Restricted Securities. The Fund may invest in securities that are subject to legal or contractual restrictions on resale. These securities generally may be resold in transactions exempt from registration or to the public if the securities are registered. Disposal of these securities may involve time-consuming negotiations and expense, and prompt sale at an acceptable price may be difficult. Information regarding restricted securities is included at the end of the Fund's Schedule of Investments.
4. Purchases and Sales of Investments.
Purchases and sales of securities, other than short-term securities, aggregated $1,801,736 and $2,284,611, respectively.
5. Fees and Other Transactions with Affiliates.
Management Fee. Fidelity Management & Research Company (the investment adviser) and its affiliates provide the Fund with investment management related services for which the Fund pays a monthly management fee. The management fee is the sum of an individual fund fee rate that is based on an annual rate of .30% of the Fund's average net assets and an annualized group fee rate that averaged .25% during the period. The group fee rate is based upon the average net assets of all the mutual funds advised by the investment adviser, including any mutual funds previously advised by the investment adviser that are currently advised by Fidelity SelectCo, LLC, an affiliate of the investment adviser. The group fee rate decreases as assets under management increase and increases as assets under management decrease. In addition, the management fee is subject to a performance adjustment (up to a maximum of +/- .20% of the Fund's average net assets over a 36 month performance period). The upward or downward adjustment to the management fee is based on the investment performance of the asset-weighted return of all classes as compared to its benchmark index, the Russell 1000 Growth Index, over the same 36 month performance period. For the reporting period, the total annual management fee rate, including the performance adjustment, was .56% of the Fund's average net assets. The performance adjustment included in the management fee rate may be higher or lower than the maximum performance adjustment rate due to the difference between the average net assets for the reporting and performance periods.
Distribution and Service Plan Fees. In accordance with Rule 12b-1 of the 1940 Act, the Fund has adopted separate Distribution and Service Plans for each class of shares. Certain classes pay Fidelity Distributors Corporation (FDC), an affiliate of the investment adviser, separate Distribution and Service Fees, each of which is based on an annual percentage of each class' average net assets. In addition, FDC may pay financial intermediaries for selling shares of the Fund and providing shareholder support services. For the period, the Distribution and Service Fee rates, total fees and amounts retained by FDC were as follows:
| Distribution Fee | Service Fee | Total Fees | Retained by FDC | |
| Class A | -% | .25% | $1,638 | $28 |
| Class T | .25% | .25% | 7,406 | 18 |
| Class B | .75% | .25% | 71 | 53 |
| Class C | .75% | .25% | 2,290 | 401 |
| $11,405 | $500 |
Sales Load. FDC may receive a front-end sales charge of up to 5.75% for selling Class A shares and 3.50% for selling Class T shares, some of which is paid to financial intermediaries for selling shares of the Fund. Depending on the holding period, FDC may receive contingent deferred sales charges levied on Class A, Class T, Class B, and Class C redemptions. The deferred sales charges range from 5.00% to 1.00% for Class B shares, 1.00% for Class C shares, 1.00% for certain purchases of Class A shares and .25% for certain purchases of Class T shares.
For the period, sales charge amounts retained by FDC were as follows:
| Retained by FDC | |
| Class A | $145 |
| Class T | 44 |
| Class B(a) | 2 |
| Class C(a) | 19 |
| $210 |
(a) When Class B and Class C shares are initially sold, FDC pays commissions from its own resources to financial intermediaries through which the sales are made.
Transfer Agent Fees. Fidelity Investments Institutional Operations Company, Inc., (FIIOC), an affiliate of the investment adviser, is the transfer, dividend disbursing and shareholder servicing agent for each class of the Fund. FIIOC receives account fees and asset-based fees that vary according to the account size and type of account of the shareholders of the respective classes of the Fund, except for Class Z. FIIOC pays for typesetting, printing and mailing of shareholder reports, except proxy statements.
For the period, transfer agent fees for each applicable class were as follows:
| Amount | % of Class-Level Average Net Assets | |
| Class A | $1,357 | .21 |
| Class T | 2,743 | .19 |
| Class B | 21 | .30 |
| Class C | 466 | .20 |
| Class I | 2,132 | .18 |
| Class Z | 1 | .05 |
| $6,720 |
Accounting and Security Lending Fees. Fidelity Service Company, Inc. (FSC), an affiliate of the investment adviser, maintains the Fund's accounting records. The accounting fee is based on the level of average net assets for each month. Under a separate contract, FSC administers the security lending program. The security lending fee is based on the number and duration of lending transactions.
Brokerage Commissions. The Fund placed a portion of its portfolio transactions with brokerage firms which are affiliates of the investment adviser. Brokerage commissions are included in net realized gain (loss) and change in net unrealized appreciation (depreciation) in the Statement of Operations. The commissions paid to these affiliated firms were $50 for the period.
Interfund Lending Program. Pursuant to an Exemptive Order issued by the SEC, the Fund, along with other registered investment companies having management contracts with FMR or other affiliated entities of FMR, may participate in an interfund lending program. This program provides an alternative credit facility allowing the funds to borrow from, or lend money to, other participating affiliated funds. The Fund's activity in this program during the period for which loans were outstanding was as follows:
| Borrower or Lender | Average Loan Balance | Weighted Average Interest Rate | Interest Expense |
| Borrower | $43,534 | .35% | $13 |
6. Committed Line of Credit.
The Fund participates with other funds managed by the investment adviser or an affiliate in a $4.25 billion credit facility (the "line of credit") to be utilized for temporary or emergency purposes to fund shareholder redemptions or for other short-term liquidity purposes. The Fund has agreed to pay commitment fees on its pro-rata portion of the line of credit, which amounted to $5 and is reflected in Miscellaneous expenses on the Statement of Operations. During the period, the Fund did not borrow on this line of credit.
7. Security Lending.
The Fund lends portfolio securities through a lending agent from time to time in order to earn additional income. For equity securities, a lending agent is used and may loan securities to certain qualified borrowers, including Fidelity Capital Markets (FCM), a broker-dealer affiliated with the Fund. On the settlement date of the loan, the Fund receives collateral (in the form of U.S. Treasury obligations, letters of credit and/or cash) against the loaned securities and maintains collateral in an amount not less than 100% of the market value of the loaned securities during the period of the loan. The market value of the loaned securities is determined at the close of business of the Fund and any additional required collateral is delivered to the Fund on the next business day. The Fund or borrower may terminate the loan at any time, and if the borrower defaults on its obligation to return the securities loaned because of insolvency or other reasons, the Fund may apply collateral received from the borrower against the obligation. The Fund may experience delays and costs in recovering the securities loaned. Any cash collateral received is invested in the Fidelity Securities Lending Cash Central Fund. The value of loaned securities and cash collateral at period end are disclosed on the Fund's Statement of Assets and Liabilities. The value of securities loaned to FCM at period end was $5,403. Security lending income represents the income earned on investing cash collateral, less rebates paid to borrowers and any lending agent fees associated with the loan, plus any premium payments received for lending certain types of securities. Security lending income is presented in the Statement of Operations as a component of income from Fidelity Central Funds. Total security lending income during the period amounted to $882, including $26 from securities loaned to FCM.
8. Expense Reductions.
Commissions paid to certain brokers with whom the investment adviser, or its affiliates, places trades on behalf of the Fund include an amount in addition to trade execution, which may be rebated back to the Fund to offset certain expenses. This amount totaled $84 for the period.
In addition, during the period the investment adviser reimbursed and/or waived a portion of fund-level operating expenses in the amount of $14 and a portion of class-level operating expenses as follows:
| Amount | |
| Class A | $13 |
| Class T | 32 |
| Class B | -* |
| Class C | 4 |
| Class I | 25 |
| $74 |
* In the amount of less than five hundred dollars.
9. Share Transactions.
Share transactions for each class were as follows and may contain automatic conversions between classes or exchanges between funds:
| Shares | Shares | Dollars | Dollars | |
| Years ended November 30, | 2015 | 2014 | 2015 | 2014 |
| Class A | ||||
| Shares sold | 2,042 | 3,210 | $132,799 | $185,879 |
| Shares redeemed | (2,310) | (3,125) | (150,069) | (181,042) |
| Net increase (decrease) | (268) | 85 | $(17,270) | $4,837 |
| Class T | ||||
| Shares sold | 2,048 | 2,463 | $132,934 | $142,596 |
| Shares redeemed | (3,816) | (4,710) | (247,857) | (273,249) |
| Net increase (decrease) | (1,768) | (2,247) | $(114,923) | $(130,653) |
| Class B | ||||
| Shares sold | 8 | 9 | $496 | $456 |
| Shares redeemed | (60) | (101) | (3,572) | (5,359) |
| Net increase (decrease) | (52) | (92) | $(3,076) | $(4,903) |
| Class C | ||||
| Shares sold | 976 | 1,386 | $58,121 | $74,498 |
| Shares redeemed | (715) | (882) | (42,885) | (47,157) |
| Net increase (decrease) | 261 | 504 | $15,236 | $27,341 |
| Class I | ||||
| Shares sold | 3,352 | 6,174 | $227,344 | $372,705 |
| Shares redeemed | (8,670) | (5,157) | (591,814) | (312,379) |
| Net increase (decrease) | (5,318) | 1,017 | $(364,470) | $60,326 |
| Class Z | ||||
| Shares sold | 30 | 43 | $1,991 | $2,754 |
| Shares redeemed | (9) | -* | (621) | (6) |
| Net increase (decrease) | 21 | 43 | $1,370 | $2,748 |
* In the amount of less than 500 shares.
10. Other.
The Fund's organizational documents provide former and current trustees and officers with a limited indemnification against liabilities arising in connection with the performance of their duties to the Fund. In the normal course of business, the Fund may also enter into contracts that provide general indemnifications. The Fund's maximum exposure under these arrangements is unknown as this would be dependent on future claims that may be made against the Fund. The risk of material loss from such claims is considered remote.
Report of Independent Registered Public Accounting Firm
To the Trustees of Fidelity Advisor Series I and Shareholders of Fidelity Advisor® Growth Opportunities Fund:
We have audited the accompanying statement of assets and liabilities of Fidelity Advisor® Growth Opportunities Fund (the Fund), a fund of Fidelity Advisor Series I, including the schedule of investments, as of November 30, 2015, and the related statement of operations for the year then ended, the statement of changes in net assets for each of the two years in the period then ended, and the financial highlights for each of the five years in the period then ended. These financial statements and financial highlights are the responsibility of the Fund's management. Our responsibility is to express an opinion on these financial statements and financial highlights based on our audits.
We conducted our audits in accordance with the standards of the Public Company Accounting Oversight Board (United States). Those standards require that we plan and perform the audit to obtain reasonable assurance about whether the financial statements and financial highlights are free of material misstatement. The Fund is not required to have, nor were we engaged to perform, an audit of its internal control over financial reporting. Our audits included consideration of internal control over financial reporting as a basis for designing audit procedures that are appropriate in the circumstances, but not for the purpose of expressing an opinion on the effectiveness of the Fund's internal control over financial reporting. Accordingly, we express no such opinion. An audit also includes examining, on a test basis, evidence supporting the amounts and disclosures in the financial statements, assessing the accounting principles used and significant estimates made by management, as well as evaluating the overall financial statement presentation. Our procedures included confirmation of securities owned as of November 30, 2015, by correspondence with the custodians and brokers; when replies were not received from brokers, we performed other auditing procedures. We believe that our audits provide a reasonable basis for our opinion.
In our opinion, such financial statements and financial highlights referred to above present fairly, in all material respects, the financial position of Fidelity Advisor® Growth Opportunities Fund as of November 30, 2015, the results of its operations for the year then ended, the changes in its net assets for each of the two years in the period then ended, and the financial highlights for each of the five years in the period then ended, in conformity with accounting principles generally accepted in the United States of America.
DELOITTE & TOUCHE LLP
Boston, Massachusetts
January 14, 2016
Trustees and Officers
The Trustees, Members of the Advisory Board (if any), and officers of the trust and fund, as applicable, are listed below. The Board of Trustees governs the fund and is responsible for protecting the interests of shareholders. The Trustees are experienced executives who meet periodically throughout the year to oversee the fund's activities, review contractual arrangements with companies that provide services to the fund, oversee management of the risks associated with such activities and contractual arrangements, and review the fund's performance. Each of the Trustees oversees 170 funds.
The Trustees hold office without limit in time except that (a) any Trustee may resign; (b) any Trustee may be removed by written instrument, signed by at least two-thirds of the number of Trustees prior to such removal; (c) any Trustee who requests to be retired or who has become incapacitated by illness or injury may be retired by written instrument signed by a majority of the other Trustees; and (d) any Trustee may be removed at any special meeting of shareholders by a two-thirds vote of the outstanding voting securities of the trust. Each Trustee who is not an interested person (as defined in the 1940 Act) of the trust and the fund is referred to herein as an Independent Trustee. Each Independent Trustee shall retire not later than the last day of the calendar year in which his or her 75th birthday occurs. The Independent Trustees may waive this mandatory retirement age policy with respect to individual Trustees. Officers and Advisory Board Members hold office without limit in time, except that any officer or Advisory Board Member may resign or may be removed by a vote of a majority of the Trustees at any regular meeting or any special meeting of the Trustees. Except as indicated, each individual has held the office shown or other offices in the same company for the past five years.
The fund’s Statement of Additional Information (SAI) includes more information about the Trustees. To request a free copy, call Fidelity at 1-877-208-0098.
Experience, Skills, Attributes, and Qualifications of the Trustees. The Governance and Nominating Committee has adopted a statement of policy that describes the experience, qualifications, attributes, and skills that are necessary and desirable for potential Independent Trustee candidates (Statement of Policy). The Board believes that each Trustee satisfied at the time he or she was initially elected or appointed a Trustee, and continues to satisfy, the standards contemplated by the Statement of Policy. The Governance and Nominating Committee also engages professional search firms to help identify potential Independent Trustee candidates who have the experience, qualifications, attributes, and skills consistent with the Statement of Policy. From time to time, additional criteria based on the composition and skills of the current Independent Trustees, as well as experience or skills that may be appropriate in light of future changes to board composition, business conditions, and regulatory or other developments, have also been considered by the professional search firms and the Governance and Nominating Committee. In addition, the Board takes into account the Trustees' commitment and participation in Board and committee meetings, as well as their leadership of standing and ad hoc committees throughout their tenure.
In determining that a particular Trustee was and continues to be qualified to serve as a Trustee, the Board has considered a variety of criteria, none of which, in isolation, was controlling. The Board believes that, collectively, the Trustees have balanced and diverse experience, qualifications, attributes, and skills, which allow the Board to operate effectively in governing the fund and protecting the interests of shareholders. Information about the specific experience, skills, attributes, and qualifications of each Trustee, which in each case led to the Board's conclusion that the Trustee should serve (or continue to serve) as a trustee of the fund, is provided below.
Board Structure and Oversight Function. James C. Curvey is an interested person and currently serves as Chairman. The Trustees have determined that an interested Chairman is appropriate and benefits shareholders because an interested Chairman has a personal and professional stake in the quality and continuity of services provided to the fund. Independent Trustees exercise their informed business judgment to appoint an individual of their choosing to serve as Chairman, regardless of whether the Trustee happens to be independent or a member of management. The Independent Trustees have determined that they can act independently and effectively without having an Independent Trustee serve as Chairman and that a key structural component for assuring that they are in a position to do so is for the Independent Trustees to constitute a substantial majority for the Board. The Independent Trustees also regularly meet in executive session. Ned C. Lautenbach serves as Chairman of the Independent Trustees and as such (i) acts as a liaison between the Independent Trustees and management with respect to matters important to the Independent Trustees and (ii) with management prepares agendas for Board meetings.
Fidelity® funds are overseen by different Boards of Trustees. The fund's Board oversees Fidelity's high income and certain equity funds, and other Boards oversee Fidelity's investment-grade bond, money market, asset allocation, and sector funds. The asset allocation funds may invest in Fidelity® funds overseen by the fund's Board. The use of separate Boards, each with its own committee structure, allows the Trustees of each group of Fidelity® funds to focus on the unique issues of the funds they oversee, including common research, investment, and operational issues. On occasion, the separate Boards establish joint committees to address issues of overlapping consequences for the Fidelity® funds overseen by each Board.
The Trustees operate using a system of committees to facilitate the timely and efficient consideration of all matters of importance to the Trustees, the fund, and fund shareholders and to facilitate compliance with legal and regulatory requirements and oversight of the fund's activities and associated risks. The Board, acting through its committees, has charged FMR and its affiliates with (i) identifying events or circumstances the occurrence of which could have demonstrably adverse effects on the fund's business and/or reputation; (ii) implementing processes and controls to lessen the possibility that such events or circumstances occur or to mitigate the effects of such events or circumstances if they do occur; and (iii) creating and maintaining a system designed to evaluate continuously business and market conditions in order to facilitate the identification and implementation processes described in (i) and (ii) above. Because the day-to-day operations and activities of the fund are carried out by or through FMR, its affiliates, and other service providers, the fund's exposure to risks is mitigated but not eliminated by the processes overseen by the Trustees. While each of the Board's committees has responsibility for overseeing different aspects of the fund's activities, oversight is exercised primarily through the Operations, Audit, and Compliance Committees. In addition, the Independent Trustees have worked with FMR to enhance the Board's oversight of investment and financial risks, legal and regulatory risks, technology risks, and operational risks, including the development of additional risk reporting to the Board. For example, a working group comprised of Independent Trustees and FMR has worked and continues to work to review the Fidelity® funds' valuation-related activities, reporting and risk management. Appropriate personnel, including but not limited to the fund's Chief Compliance Officer (CCO), FMR's internal auditor, the independent accountants, the fund's Treasurer and portfolio management personnel, make periodic reports to the Board's committees, as appropriate, including an annual review of Fidelity's risk management program for the Fidelity® funds. The responsibilities of each standing committee, including their oversight responsibilities, are described further under "Standing Committees of the Trustees."
Interested Trustees*:
Correspondence intended for a Trustee who is an interested person may be sent to Fidelity Investments, 245 Summer Street, Boston, Massachusetts 02210.
Name, Year of Birth; Principal Occupations and Other Relevant Experience+
James C. Curvey (1935)
Year of Election or Appointment: 2007
Trustee
Chairman of the Board of Trustees
Mr. Curvey also serves as Trustee of other Fidelity® funds. Mr. Curvey is a Director of Fidelity Research & Analysis Co. (investment adviser firm, 2009-present), and Vice Chairman (2007-present) and Director of FMR LLC (diversified financial services company). In addition, Mr. Curvey serves as an Overseer for the Boston Symphony Orchestra and a member of the board of Artis-Naples, Naples, Florida, and as a Trustee for Brewster Academy, Wolfeboro, New Hampshire. Previously, Mr. Curvey served as a Director of Fidelity Investments Money Management, Inc. (investment adviser firm, 2009-2014) and a Director of FMR and FMR Co., Inc. (investment adviser firms, 2007-2014).
Charles S. Morrison (1960)
Year of Election or Appointment: 2014
Trustee
Mr. Morrison also serves as Trustee of other funds. He serves as a Director of Fidelity Investments Money Management, Inc. (FIMM) (investment adviser firm, 2014-present), Director of Fidelity SelectCo, LLC (investment adviser firm, 2014-present), President, Asset Management (2014-present), and is an employee of Fidelity Investments. Previously, Mr. Morrison served as Vice President of Fidelity's Fixed Income and Asset Allocation Funds (2012-2014), President, Fixed Income (2011-2014), Vice President of Fidelity's Money Market Funds (2005-2009), President, Money Market Group Leader of FMR (investment adviser firm, 2009), and Senior Vice President, Money Market Group of FMR (2004-2009). Mr. Morrison also served as Vice President of Fidelity's Bond Funds (2002-2005), certain Balanced Funds (2002-2005), and certain Asset Allocation Funds (2002-2007), and as Senior Vice President (2002-2005) of Fidelity's Bond Division.
* Determined to be an “Interested Trustee” by virtue of, among other things, his or her affiliation with the trust or various entities under common control with FMR.
+ The information includes the Trustee's principal occupation during the last five years and other information relating to the experience, attributes, and skills relevant to the Trustee's qualifications to serve as a Trustee, which led to the conclusion that the Trustee should serve as a Trustee for the fund.
Independent Trustees:
Correspondence intended for an Independent Trustee may be sent to Fidelity Investments, P.O. Box 55235, Boston, Massachusetts 02205-5235.
Name, Year of Birth; Principal Occupations and Other Relevant Experience+
Dennis J. Dirks (1948)
Year of Election or Appointment: 2005
Trustee
Mr. Dirks also serves as Trustee of other Fidelity® funds. Prior to his retirement in May 2003, Mr. Dirks was Chief Operating Officer and a member of the Board of The Depository Trust & Clearing Corporation (DTCC). He also served as President, Chief Operating Officer, and Board member of The Depository Trust Company (DTC) and President and Board member of the National Securities Clearing Corporation (NSCC). In addition, Mr. Dirks served as Chief Executive Officer and Board member of the Government Securities Clearing Corporation, Chief Executive Officer and Board member of the Mortgage-Backed Securities Clearing Corporation, as a Trustee and a member of the Finance Committee of Manhattan College (2005-2008), as a Trustee and a member of the Finance Committee of AHRC of Nassau County (2006-2008), and as a member of the Independent Directors Council (IDC) Governing Council (2010-2015). Mr. Dirks is a member of the Board of Directors for The Brookville Center for Children's Services, Inc. (2009-present).
Alan J. Lacy (1953)
Year of Election or Appointment: 2008
Trustee
Mr. Lacy also serves as Trustee of other Fidelity® funds. Mr. Lacy serves as a member of the Board of Directors of Dave & Buster's Entertainment, Inc. (restaurant and entertainment complexes, 2010-present) and Bristol-Myers Squibb Company (global pharmaceuticals, 2008-present). In addition, Mr. Lacy served as Senior Adviser (2007-2014) of Oak Hill Capital Partners, L.P. (private equity) and also served as Chief Executive Officer (2000-2005) and Vice Chairman (2005-2006) of Sears Holdings Corporation and Sears, Roebuck and Co. (retail). Mr. Lacy is a member of the Board of Trustees of The National Parks Conservation Association (2006-present). Previously, Mr. Lacy served as Chairman of the Board of Trustees of the National Parks Conservation Association (2008-2011) and as a member of the Board of Directors for The Western Union Company (global money transfer, 2006-2011), The Hillman Companies, Inc. (hardware wholesalers, 2010-2014), and Earth Fare, Inc. (retail grocery, 2010-2014).
Ned C. Lautenbach (1944)
Year of Election or Appointment: 2000
Trustee
Chairman of the Independent Trustees
Mr. Lautenbach also serves as Trustee of other Fidelity® funds. Mr. Lautenbach currently serves as the Lead Director of the Eaton Corporation Board of Directors (diversified industrial, 1997-present). Mr. Lautenbach is Chairman of the Board of Directors of Artis-Naples in Naples, Florida (2012-present), a member of the Council on Foreign Relations (1994-present), and a member of the Board of Governors, State University System of Florida (2013-present). Previously, Mr. Lautenbach was a Partner/Advisory Partner at Clayton, Dubilier & Rice, LLC (private equity investment, 1998-2010), as well as a Director of Sony Corporation (2006-2007).
Joseph Mauriello (1944)
Year of Election or Appointment: 2008
Trustee
Mr. Mauriello also serves as Trustee of other Fidelity® funds. Prior to his retirement in January 2006, Mr. Mauriello served in numerous senior management positions including Deputy Chairman and Chief Operating Officer (2004-2005), and Vice Chairman of Financial Services (2002-2004) of KPMG LLP US (professional services, 1965-2005). Mr. Mauriello currently serves as a member of the Board of Directors of XL Group plc. (global insurance and re-insurance, 2006-present) and the Independent Directors Council (IDC) Governing Council (2015-present). Previously, Mr. Mauriello served as a Director of the Hamilton Funds of the Bank of New York (2006-2007) and of Arcadia Resources Inc. (health care services and products, 2007-2012).
Robert W. Selander (1950)
Year of Election or Appointment: 2011
Trustee
Mr. Selander also serves as Trustee of other Fidelity® funds. Mr. Selander serves as a Director of The Western Union Company (global money transfer, 2014-present). Previously, Mr. Selander served as a Member of the Advisory Board of other Fidelity® funds (2011), and Executive Vice Chairman (2010), Chief Executive Officer (2009-2010), and President and Chief Executive Officer (1997-2009) of Mastercard, Inc.
Cornelia M. Small (1944)
Year of Election or Appointment: 2005
Trustee
Ms. Small also serves as Trustee of other Fidelity® funds. Ms. Small is a member of the Board of Directors (2009-present) and Chair of the Investment Committee (2010-present) of the Teagle Foundation. Ms. Small also serves on the Investment Committee of the Berkshire Taconic Community Foundation (2008-present). Previously, Ms. Small served as Chairperson (2002-2008) and a member of the Investment Committee and Chairperson (2008-2012) and a member of the Board of Trustees of Smith College. In addition, Ms. Small served as Chief Investment Officer, Director of Global Equity Investments, and a member of the Board of Directors of Scudder, Stevens & Clark and Scudder Kemper Investments.
William S. Stavropoulos (1939)
Year of Election or Appointment: 2002
Trustee
Vice Chairman of the Independent Trustees
Mr. Stavropoulos also serves as Trustee of other Fidelity® funds. Mr. Stavropoulos serves as President and Founder of the Michigan Baseball Foundation, the Great Lakes Loons (2007-present). Mr. Stavropoulos is Chairman Emeritus of the Board of Directors of The Dow Chemical Company, where he previously served in numerous senior management positions, including President, CEO (1995-2000; 2002-2004), Chairman of the Executive Committee (2000-2006), and as a member of the Board of Directors (1990-2006). Currently, Mr. Stavropoulos is Chairman of the Board of Directors of Univar Inc. (global distributor of commodity and specialty chemicals), a Director of Teradata Corporation (data warehousing and technology solutions), and Maersk Inc. (industrial conglomerate), and a member of the Advisory Board for Metalmark Capital LLC (private equity investment, 2005-present). Mr. Stavropoulos is an operating advisor to Clayton, Dubilier & Rice, LLC (private equity investment). In addition, Mr. Stavropoulos is a member of the University of Notre Dame Advisory Council for the College of Science, a Trustee of the Rollin L. Gerstacker Foundation, and a Director of the Naples Philharmonic Center for the Arts. Previously, Mr. Stavropoulos served as a Director of Chemical Financial Corporation (bank holding company, 1993-2012) and Tyco International, Ltd. (multinational manufacturing and services, 2007-2012).
David M. Thomas (1949)
Year of Election or Appointment: 2008
Trustee
Mr. Thomas also serves as Trustee of other Fidelity® funds. Mr. Thomas serves as Non-Executive Chairman of the Board of Directors of Fortune Brands Home and Security (home and security products, 2011-present), as a member of the Board of Directors (2004-present) and Presiding Director (2013-present) of Interpublic Group of Companies, Inc. (marketing communication), and as a member of the Board of Trustees of the University of Florida (2013-present). Previously, Mr. Thomas served as Executive Chairman (2005-2006) and Chairman and Chief Executive Officer (2000-2005) of IMS Health, Inc. (pharmaceutical and healthcare information solutions), and a Director of Fortune Brands, Inc. (consumer products, 2000-2011).
+ The information includes the Trustee's principal occupation during the last five years and other information relating to the experience, attributes, and skills relevant to the Trustee's qualifications to serve as a Trustee, which led to the conclusion that the Trustee should serve as a Trustee for the fund.
Advisory Board Members and Officers:
Correspondence intended for an officer or Peter S. Lynch may be sent to Fidelity Investments, 245 Summer Street, Boston, Massachusetts 02210. Officers appear below in alphabetical order.
Name, Year of Birth; Principal Occupation
Peter S. Lynch (1944)
Year of Election or Appointment: 2003
Member of the Advisory Board
Mr. Lynch also serves as Member of the Advisory Board of other Fidelity® funds. Mr. Lynch is Vice Chairman and a Director of FMR (investment adviser firm) and FMR Co., Inc. (investment adviser firm). In addition, Mr. Lynch serves as a Trustee of Boston College and as the Chairman of the Inner-City Scholarship Fund. Previously, Mr. Lynch served on the Special Olympics International Board of Directors (1997-2006).
Elizabeth Paige Baumann (1968)
Year of Election or Appointment: 2012
Anti-Money Laundering (AML) Officer
Ms. Baumann also serves as AML Officer of other funds. She is Chief AML Officer of FMR LLC (diversified financial services company, 2012-present) and is an employee of Fidelity Investments. Previously, Ms. Baumann served as Vice President and Deputy Anti-Money Laundering Officer (2007-2012).
Marc R. Bryant (1966)
Year of Election or Appointment: 2015
Secretary and Chief Legal Officer (CLO)
Mr. Bryant also serves as Secretary and CLO of other funds. Mr. Bryant serves as CLO, Secretary, and Senior Vice President of Fidelity Management & Research Company (investment adviser firm, 2015-present) and FMR Co., Inc. (investment adviser firm, 2015-present); Secretary of Fidelity SelectCo, LLC (investment adviser firm, 2015-present) and Fidelity Investments Money Management, Inc. (investment adviser firm, 2015-present); and CLO of Fidelity Management & Research (Hong Kong) Limited (investment adviser firm, 2015-present). He is Senior Vice President and Deputy General Counsel of FMR LLC (diversified financial services company). Previously, Mr. Bryant served as Secretary and CLO of Fidelity Rutland Square Trust II (2010-2014) and Assistant Secretary of Fidelity's Fixed Income and Asset Allocation Funds (2013-2015). Prior to joining Fidelity Investments, Mr. Bryant served as a Senior Vice President and the Head of Global Retail Legal for AllianceBernstein L.P. (2006-2010), and as the General Counsel for ProFund Advisors LLC (2001-2006).
William C. Coffey (1969)
Year of Election or Appointment: 2009
Assistant Secretary
Mr. Coffey also serves as Assistant Secretary of other funds. He is Senior Vice President and Deputy General Counsel of FMR LLC (diversified financial services company, 2010-present), and is an employee of Fidelity Investments. Previously, Mr. Coffey served as Vice President and Associate General Counsel of FMR LLC (2005-2009).
Jonathan Davis (1968)
Year of Election or Appointment: 2010
Assistant Treasurer
Mr. Davis also serves as Assistant Treasurer of other funds, and is an employee of Fidelity Investments. Previously, Mr. Davis served as Vice President and Associate General Counsel of FMR LLC (diversified financial services company, 2003-2010).
Adrien E. Deberghes (1967)
Year of Election or Appointment: 2008
Deputy Treasurer
Mr. Deberghes also serves as an officer of other funds. He is an employee of Fidelity Investments (2008-present). Prior to joining Fidelity Investments, Mr. Deberghes was Senior Vice President of Mutual Fund Administration at State Street Corporation (2007-2008), Senior Director of Mutual Fund Administration at Investors Bank & Trust (2005-2007), and Director of Finance for Dunkin' Brands (2000-2005).
Stephanie J. Dorsey (1969)
Year of Election or Appointment: 2010
Assistant Treasurer
Ms. Dorsey also serves as an officer of other funds. She is an employee of Fidelity Investments (2008-present) and has served in other fund officer roles. Prior to joining Fidelity Investments, Ms. Dorsey served as Treasurer (2004-2008) of the JPMorgan Mutual Funds and Vice President (2004-2008) of JPMorgan Chase Bank.
Howard J. Galligan III (1966)
Year of Election or Appointment: 2014
Chief Financial Officer
Mr. Galligan also serves as Chief Financial Officer of other funds. Mr. Galligan serves as President of Fidelity Pricing and Cash Management Services (FPCMS) (2014-present) and as a Director of Strategic Advisers, Inc. (investment adviser firm, 2008-present). Previously, Mr. Galligan served as Chief Administrative Officer of Asset Management (2011-2014) and Chief Operating Officer and Senior Vice President of Investment Support for Strategic Advisers, Inc. (2003-2011).
Scott C. Goebel (1968)
Year of Election or Appointment: 2015
Vice President
Mr. Goebel serves as Vice President of other funds and is an employee of Fidelity Investments (2001-present). Previously, Mr. Goebel served as Secretary of Fidelity SelectCo, LLC (investment adviser firm, 2013-2015), Fidelity Investments Money Management, Inc. (FIMM) (investment adviser firm, 2010-2015), and Fidelity Research and Analysis Company (FRAC) (investment adviser firm, 2010-2015); General Counsel, Secretary, and Senior Vice President of Fidelity Management & Research Company (investment adviser firm, 2008-2015) and FMR Co., Inc. (investment adviser firm, 2008-2015); Assistant Secretary of Fidelity Management & Research (Japan) Limited (investment adviser firm, 2008-2015) and FMR Investment Management (U.K.) Limited (investment adviser firm, 2008-2015); Chief Legal Officer (CLO) of Fidelity Management & Research (Hong Kong) Limited (investment adviser firm, 2008-2015); Secretary and CLO of certain Fidelity® funds (2008-2015); Assistant Secretary of FIMM (2008-2010), FRAC (2008-2010), and certain funds (2007-2008); and as Vice President and Secretary of Fidelity Distributors Corporation (FDC) (2005-2007).
Brian B. Hogan (1964)
Year of Election or Appointment: 2009
Vice President
Mr. Hogan also serves as Trustee or Vice President of other funds. Mr. Hogan serves as a Director of Fidelity SelectCo, LLC (investment adviser firm, 2014-present) and President of the Equity Division of FMR (investment adviser firm, 2009-present). Previously, Mr. Hogan served as Senior Vice President, Equity Research of FMR (2006-2009) and as a portfolio manager.
Chris Maher (1972)
Year of Election or Appointment: 2013
Assistant Treasurer
Mr. Maher serves as Assistant Treasurer of other funds. Mr. Maher is Vice President of Valuation Oversight and is an employee of Fidelity Investments. Previously, Mr. Maher served as Vice President of Asset Management Compliance (2013), Vice President of the Program Management Group of FMR (investment adviser firm, 2010-2013), and Vice President of Valuation Oversight (2008-2010).
Melissa M. Reilly (1971)
Year of Election or Appointment: 2014
Vice President of certain Equity Funds
Ms. Reilly also serves as Vice President of other funds. Ms. Reilly is an employee of Fidelity Investments (2004-present).
Kenneth B. Robins (1969)
Year of Election or Appointment: 2008
President and Treasurer
Mr. Robins also serves as an officer of other funds. Mr. Robins serves as Executive Vice President of Fidelity Investments Money Management, Inc. (FIMM) (investment adviser firm, 2013-present) and is an employee of Fidelity Investments (2004-present). Previously, Mr. Robins served in other fund officer roles.
Stacie M. Smith (1974)
Year of Election or Appointment: 2013
Deputy Treasurer
Ms. Smith also serves as an officer of other funds. She is an employee of Fidelity Investments (2009-present) and has served in other fund officer roles. Prior to joining Fidelity Investments, Ms. Smith served as Senior Audit Manager of Ernst & Young LLP (1996-2009).
Renee Stagnone (1975)
Year of Election or Appointment: 2013
Deputy Treasurer
Ms. Stagnone also serves as Deputy Treasurer of other funds. Ms. Stagnone is an employee of Fidelity Investments (1997-present).
Linda J. Wondrack (1964)
Year of Election or Appointment: 2014
Chief Compliance Officer
Ms. Wondrack also serves as Chief Compliance Officer of other funds. Ms. Wondrack is Executive Vice President and head of the Ethics Office and Asset Management Compliance for Fidelity Investments (2012-present). Ms. Wondrack also serves as Chief Compliance Officer of Fidelity SelectCo, LLC (investment adviser firm, 2014-present); Chief Compliance Officer of Impresa Management LLC (2013-present); and Chief Compliance Officer of FMR Co., Inc. (investment adviser firm), Fidelity Investments Money Management, Inc. (investment adviser firm), Fidelity Management & Research (Japan) Limited (investment adviser firm), FMR Investment Management (U.K.) Limited (investment adviser firm), Fidelity Management & Research (Hong Kong) (investment adviser firm), Fidelity Management & Research Company (investment adviser firm), FIAM LLC (investment adviser firm), and Strategic Advisers, Inc. (investment adviser firm), Ballyrock Investment Advisors LLC, and Northern Neck Investors LLC (2012-present). Previously, Ms. Wondrack served as Senior Vice President and Chief Compliance Officer for Columbia Management Investment Advisers, LLC (2005-2012); Chief Compliance Officer for certain funds within the Columbia Family of Funds (2007-2012); and Senior Vice President of Compliance Risk Management at Bank of America (2005-2010).
Joseph F. Zambello (1957)
Year of Election or Appointment: 2011
Deputy Treasurer
Mr. Zambello also serves as Deputy Treasurer of other funds. Mr. Zambello is an employee of Fidelity Investments (1991-present). Previously, Mr. Zambello served as Vice President of the Program Management Group of FMR (investment adviser firm, 2009-2011) and Vice President of the Transfer Agent Oversight Group (2005-2009).
Shareholder Expense Example
As a shareholder of the Fund, you incur two types of costs: (1) transaction costs, including sales charges (loads) on purchase payments or redemption proceeds, and (2) ongoing costs, including management fees, distribution and/or service (12b-1) fees and other Fund expenses. This Example is intended to help you understand your ongoing costs (in dollars) of investing in the Fund and to compare these costs with the ongoing costs of investing in other mutual funds.
The Example is based on an investment of $1,000 invested at the beginning of the period and held for the entire period (June 1, 2015 to November 30, 2015).
Actual Expenses
The first line of the accompanying table for each class of the Fund provides information about actual account values and actual expenses. You may use the information in this line, together with the amount you invested, to estimate the expenses that you paid over the period. Simply divide your account value by $1,000.00 (for example, an $8,600 account value divided by $1,000.00 = 8.6), then multiply the result by the number in the first line for a class of the Fund under the heading entitled "Expenses Paid During Period" to estimate the expenses you paid on your account during this period. In addition, the Fund, as a shareholder in the underlying Fidelity Central Funds, will indirectly bear its pro-rata share of the fees and expenses incurred by the underlying Fidelity Central Funds. These fees and expenses are not included in the Fund's annualized expense ratio used to calculate the expense estimate in the table below.
Hypothetical Example for Comparison Purposes
The second line of the accompanying table for each class of the Fund provides information about hypothetical account values and hypothetical expenses based on a Class' actual expense ratio and an assumed rate of return of 5% per year before expenses, which is not the Class' actual return. The hypothetical account values and expenses may not be used to estimate the actual ending account balance or expenses you paid for the period. You may use this information to compare the ongoing costs of investing in the Fund and other funds. To do so, compare this 5% hypothetical example with the 5% hypothetical examples that appear in the shareholder reports of the other funds. In addition, the Fund, as a shareholder in the underlying Fidelity Central Funds, will indirectly bear its pro-rata share of the fees and expenses incurred by the underlying Fidelity Central Funds. These fees and expenses are not included in the Fund's annualized expense ratio used to calculate the expense estimate in the table below.
Please note that the expenses shown in the table are meant to highlight your ongoing costs only and do not reflect any transaction costs. Therefore, the second line of the table is useful in comparing ongoing costs only, and will not help you determine the relative total costs of owning different funds. In addition, if these transactional costs were included, your costs would have been higher.
| Annualized Expense Ratio-A | Beginning Account Value June 1, 2015 | Ending Account Value November 30, 2015 | Expenses Paid During Period-B June 1, 2015 to November 30, 2015 | |
| Class A | 1.04% | |||
| Actual | $1,000.00 | $1,000.90 | $5.22 | |
| Hypothetical-C | $1,000.00 | $1,019.85 | $5.27 | |
| Class T | 1.27% | |||
| Actual | $1,000.00 | $999.70 | $6.37 | |
| Hypothetical-C | $1,000.00 | $1,018.70 | $6.43 | |
| Class B | 1.89% | |||
| Actual | $1,000.00 | $996.70 | $9.46 | |
| Hypothetical-C | $1,000.00 | $1,015.59 | $9.55 | |
| Class C | 1.79% | |||
| Actual | $1,000.00 | $997.20 | $8.96 | |
| Hypothetical-C | $1,000.00 | $1,016.09 | $9.05 | |
| Class I | .76% | |||
| Actual | $1,000.00 | $1,002.30 | $3.81 | |
| Hypothetical-C | $1,000.00 | $1,021.26 | $3.85 | |
| Class Z | .64% | |||
| Actual | $1,000.00 | $1,002.90 | $3.21 | |
| Hypothetical-C | $1,000.00 | $1,021.86 | $3.24 |
A Annualized expense ratio reflects expenses net of applicable fee waivers.
B Expenses are equal to each Class' annualized expense ratio, multiplied by the average account value over the period, multiplied by 183/365 (to reflect the one-half year period).
C 5% return per year before expenses
Distributions (Unaudited)
The Board of Trustees of Fidelity Advisor Growth Opportunities Fund voted to pay to shareholders of record at the opening of business on record date, the following distributions per share derived from capital gains realized from sales of portfolio securities:
| Pay Date | Record Date | Capital Gains | ||
| Class Z | 12/07/15 | 12/04/15 | $6.636 | |
| 01/11/16 | 01/08/16 | $0.605 |
The fund hereby designates as a capital gain dividend with respect to the taxable year ended November 30, 2015, $404,021,582, or, if subsequently determined to be different, the net capital gain of such year.
The fund will notify shareholders in January 2016 of amounts for use in preparing 2015 income tax returns.
Board Approval of Investment Advisory Contracts and Management Fees
Fidelity Advisor Growth Opportunities Fund
Each year, the Board of Trustees, including the Independent Trustees (together, the Board), votes on the renewal of the management contract with Fidelity Management & Research Company (FMR) and the sub-advisory agreements (together, the Advisory Contracts) for the fund. The Board, assisted by the advice of fund counsel and Independent Trustees' counsel, requests and considers a broad range of information relevant to the renewal of the Advisory Contracts throughout the year.
The Board meets regularly and, at each of its meetings, covers an extensive agenda of topics and materials and considers factors that are relevant to its annual consideration of the renewal of the fund's Advisory Contracts, including the services and support provided to the fund and its shareholders. The Board has established various standing committees (Committees), each composed of and chaired by Independent Trustees with varying backgrounds, to which the Board has assigned specific subject matter responsibilities in order to enhance effective decision-making by the Board. The Board, acting directly and through its Committees, requests and receives information concerning the annual consideration of the renewal of the fund's Advisory Contracts. The Board also meets as needed to consider matters specifically related to the Board's annual consideration of the renewal of the Advisory Contracts. Members of the Board may also meet with trustees of other Fidelity funds through ad hoc joint committees to discuss certain matters relevant to all of the Fidelity funds.
At its July 2015 meeting, the Board unanimously determined to renew the fund's Advisory Contracts. In reaching its determination, the Board considered all factors it believed relevant, including (i) the nature, extent, and quality of the services to be provided to the fund and its shareholders (including the investment performance of the fund); (ii) the competitiveness of the fund's management fee and total expense ratio relative to peer funds; (iii) the total costs of the services to be provided by and the profits to be realized by Fidelity from its relationship with the fund; and (iv) the extent to which (if any) economies of scale exist and would be realized as the fund grows, and whether any economies of scale are appropriately shared with fund shareholders.
In considering whether to renew the Advisory Contracts for the fund, the Board reached a determination, with the assistance of fund counsel and Independent Trustees' counsel and through the exercise of its business judgment, that the renewal of the Advisory Contracts was in the best interests of the fund and its shareholders and that the compensation payable under the Advisory Contracts was fair and reasonable. The Board's decision to renew the Advisory Contracts was not based on any single factor, but rather was based on a comprehensive consideration of all the information provided to the Board at its meetings throughout the year. The Board, in reaching its determination to renew the Advisory Contracts, was aware that shareholders of the fund have a broad range of investment choices available to them, including a wide choice among funds offered by Fidelity's competitors, and that the fund's shareholders, who have the opportunity to review and weigh the disclosure provided by the fund in its prospectus and other public disclosures, have chosen to invest in this fund, which is part of the Fidelity family of funds.
Nature, Extent, and Quality of Services Provided. The Board considered Fidelity's staffing as it relates to the fund, including the backgrounds of investment personnel of Fidelity, and also considered the fund's investment objective, strategies, and related investment philosophy. The Independent Trustees also had discussions with senior management of Fidelity's investment operations and investment groups. The Board considered the structure of the portfolio manager compensation program and whether this structure provides appropriate incentives to act in the best interests of the fund. Additionally, the Board considered the portfolio managers' investments, if any, in the funds that they manage.Resources Dedicated to Investment Management and Support Services. The Board and the Fund Oversight and Research Committees reviewed the general qualifications and capabilities of Fidelity's investment staff, including its size, education, experience, and resources, as well as Fidelity's approach to recruiting, training, managing, and compensating investment personnel. The Board noted that Fidelity has continued to increase the resources devoted to non-U.S. offices, including expansion of Fidelity's global investment organization. The Board also noted that Fidelity's analysts have extensive resources, tools and capabilities that allow them to conduct sophisticated quantitative and fundamental analysis, as well as credit analysis of issuers, counterparties and guarantors. Further, the Board considered that Fidelity's investment professionals have sufficient access to global information and data so as to provide competitive investment results over time, and that those professionals also have access to sophisticated tools that permit them to assess portfolio construction and risk and performance attribution characteristics continuously, as well as to transmit new information and research conclusions rapidly around the world. Additionally, in its deliberations, the Board considered Fidelity's trading, risk management, and compliance capabilities and resources, which are integral parts of the investment management process.Shareholder and Administrative Services. The Board considered (i) the nature, extent, quality, and cost of advisory, administrative, and shareholder services performed by FMR, the sub-advisers (together with FMR, the Investment Advisers), and their affiliates under the Advisory Contracts and under separate agreements covering transfer agency, pricing and bookkeeping, and securities lending services for the fund; (ii) the nature and extent of the supervision of third party service providers, principally custodians and subcustodians; and (iii) the resources devoted to, and the record of compliance with, the fund's compliance policies and procedures. The Board also reviewed the allocation of fund brokerage, including allocations to brokers affiliated with the Investment Advisers, the use of brokerage commissions to pay fund expenses, and the use of "soft" commission dollars to pay for research services.The Board noted that the growth of fund assets over time across the complex allows Fidelity to reinvest in the development of services designed to enhance the value or convenience of the Fidelity funds as investment vehicles. These services include 24-hour access to account information and market information through telephone representatives and over the Internet, investor education materials and asset allocation tools, and the expanded availability of Fidelity Investor Centers.In 2014, the Board formed an ad hoc Committee on Transfer Agency Fees to review the variety of transfer agency fee structures throughout the industry and Fidelity's competitive positioning with respect to industry participants.Investment in a Large Fund Family. The Board considered the benefits to shareholders of investing in a Fidelity fund, including the benefits of investing in a fund that is part of a large family of funds offering a variety of investment disciplines and providing a large variety of mutual fund investor services. The Board noted that Fidelity had taken, or had made recommendations that resulted in the Fidelity funds taking, a number of actions over the previous year that benefited particular funds, including (i) continuing to dedicate additional resources to investment research and to the support of the senior management team that oversees asset management; (ii) continuing efforts to enhance Fidelity's global research capabilities; (iii) launching new funds and making other enhancements to meet client needs; (iv) reducing management fees and total expenses for certain index funds and diversified international funds; (v) continuing to launch dedicated lower cost underlying funds to meet portfolio construction needs related to expanding underlying fund options for Fidelity funds of funds, specifically for the Freedom Fund product lines; (vi) rationalizing product lines and gaining increased efficiencies through fund mergers; (vii) launching active fixed-income exchange-traded funds; (viii) continuing to develop, acquire and implement systems and technology to improve services to the funds and information security and to increase efficiency; (ix) implementing investment enhancements to further strengthen Fidelity's target date product line to increase investors' probability of success in achieving their goals; (x) modifying the eligibility criteria for certain share classes to accommodate roll-over assets from employer-sponsored retirement plans; (xi) launching a new Class W of the Freedom Index Funds to attract and retain Fidelity record-kept retirement plan assets; and (xii) implementing changes to Fidelity's money market product line in response to recent money market regulatory reforms.Investment Performance. The Board considered whether the fund has operated in accordance with its investment objective, as well as its record of compliance with its investment restrictions and its performance history. The Board noted that there were portfolio management changes for the fund in October 2012 and March 2015.The Board took into account discussions with representatives of the Investment Advisers about fund investment performance that occur at Board meetings throughout the year. In this regard the Board noted that as part of regularly scheduled fund reviews and other reports to the Board on fund performance, the Board considers annualized return information for the fund, for different time periods, measured against a securities market index ("benchmark index") and a peer group of funds with similar objectives ("peer group"), if any. In its evaluation of fund investment performance, the Board gave particular attention to information indicating changes in performance of certain Fidelity funds for specific time periods and discussed with the Investment Advisers the reasons for any overperformance or underperformance.In addition to reviewing absolute and relative fund performance, the Independent Trustees periodically consider the appropriateness of fund performance metrics in evaluating the results achieved. In general, the Independent Trustees believe that fund performance should be evaluated based on net performance (after fees and expenses) of both the highest performing and lowest performing fund share classes, where applicable, compared to appropriate benchmark indices, over appropriate time periods that may include full market cycles, and compared to peer groups, as applicable, over the same periods, taking into account relevant factors including the following: general market conditions; issuer-specific information; and fund cash flows and other factors.The Independent Trustees recognize that shareholders evaluate performance on a net basis over their own holding periods, for which one-, three-, and five-year periods are often used as a proxy. For this reason, the performance information reviewed by the Board also included net cumulative calendar year total return information for the fund and an appropriate benchmark index and peer group for the most recent one-, three-, and five-year periods, as shown below. Returns are shown compared to the 25th percentile (top of box, 75% beaten) and 75th percentile (bottom of box, 25% beaten) of the peer universe.Fidelity Advisor Growth Opportunities Fund
Fidelity Advisor Growth Opportunities Fund
![]()
GOZ-ANN-0116
1.9585498.102
Fidelity Advisor® Stock Selector Mid Cap Fund Class A, Class T, Class B and Class C Annual Report November 30, 2015 |
|
Contents
Board Approval of Investment Advisory Contracts and Management Fees |
To view a fund's proxy voting guidelines and proxy voting record for the 12-month period ended June 30, visit http://www.fidelity.com/proxyvotingresults or visit the Securities and Exchange Commission's (SEC) web site at http://www.sec.gov.
You may also call 1-877-208-0098 to request a free copy of the proxy voting guidelines.
Standard & Poor's, S&P and S&P 500 are registered service marks of The McGraw-Hill Companies, Inc. and have been licensed for use by Fidelity Distributors Corporation.
Other third-party marks appearing herein are the property of their respective owners.
All other marks appearing herein are registered or unregistered trademarks or service marks of FMR LLC or an affiliated company. © 2016 FMR LLC. All rights reserved.
This report and the financial statements contained herein are submitted for the general information of the shareholders of the Fund. This report is not authorized for distribution to prospective investors in the Fund unless preceded or accompanied by an effective prospectus.
A fund files its complete schedule of portfolio holdings with the SEC for the first and third quarters of each fiscal year on Form N-Q. Forms N-Q are available on the SEC’s web site at http://www.sec.gov. A fund's Forms N-Q may be reviewed and copied at the SEC’s Public Reference Room in Washington, DC. Information regarding the operation of the SEC's Public Reference Room may be obtained by calling 1-800-SEC-0330.
For a complete list of a fund's portfolio holdings, view the most recent holdings listing, semiannual report, or annual report on Fidelity's web site at http://www.fidelity.com, http://www.advisor.fidelity.com, or http://www.401k.com, as applicable.
NOT FDIC INSURED •MAY LOSE VALUE •NO BANK GUARANTEE
Neither the Fund nor Fidelity Distributors Corporation is a bank.
Performance: The Bottom Line
Average annual total return reflects the change in the value of an investment, assuming reinvestment of distributions from dividend income and capital gains (the profits earned upon the sale of securities that have grown in value, if any) and assuming a constant rate of performance each year.
The hypothetical investment and the average annual total returns do not reflect the deduction of taxes that a shareholder would pay on fund distributions or the redemption of fund shares.
During periods of reimbursement by Fidelity, a fund’s total return will be greater than it would be had the reimbursement not occurred.
How a fund did yesterday is no guarantee of how it will do tomorrow.
Returns reflect the conversion of Class B shares to Class A shares after a maximum of seven years.
Average Annual Total Returns
| For the periods ended November 30, 2015 | Past 1 year | Past 5 years | Past 10 years |
| Class A (incl. 5.75% sales charge) | (5.13)% | 9.73% | 5.24% |
| Class T (incl. 3.50% sales charge) | (3.08)% | 10.02% | 5.28% |
| Class B (incl. contingent deferred sales charge) | (5.19)% | 9.86% | 5.28% |
| Class C (incl. contingent deferred sales charge) | (1.10)% | 10.21% | 5.07% |
Class B shares' contingent deferred sales charges included in the past one year, past five years and past ten years total return figures are 5%, 2% and 0%, respectively.
Class C shares' contingent deferred sales charges included in the past one year, past five years and past ten years total return figures are 1%, 0% and 0%, respectively.
$10,000 Over 10 Years
Let's say hypothetically that $10,000 was invested in Fidelity Advisor® Stock Selector Mid Cap Fund - Class A on November 30, 2005, and the current 5.75% sales charge was paid.
The chart shows how the value of your investment would have changed, and also shows how the S&P MidCap 400® Index performed over the same period.
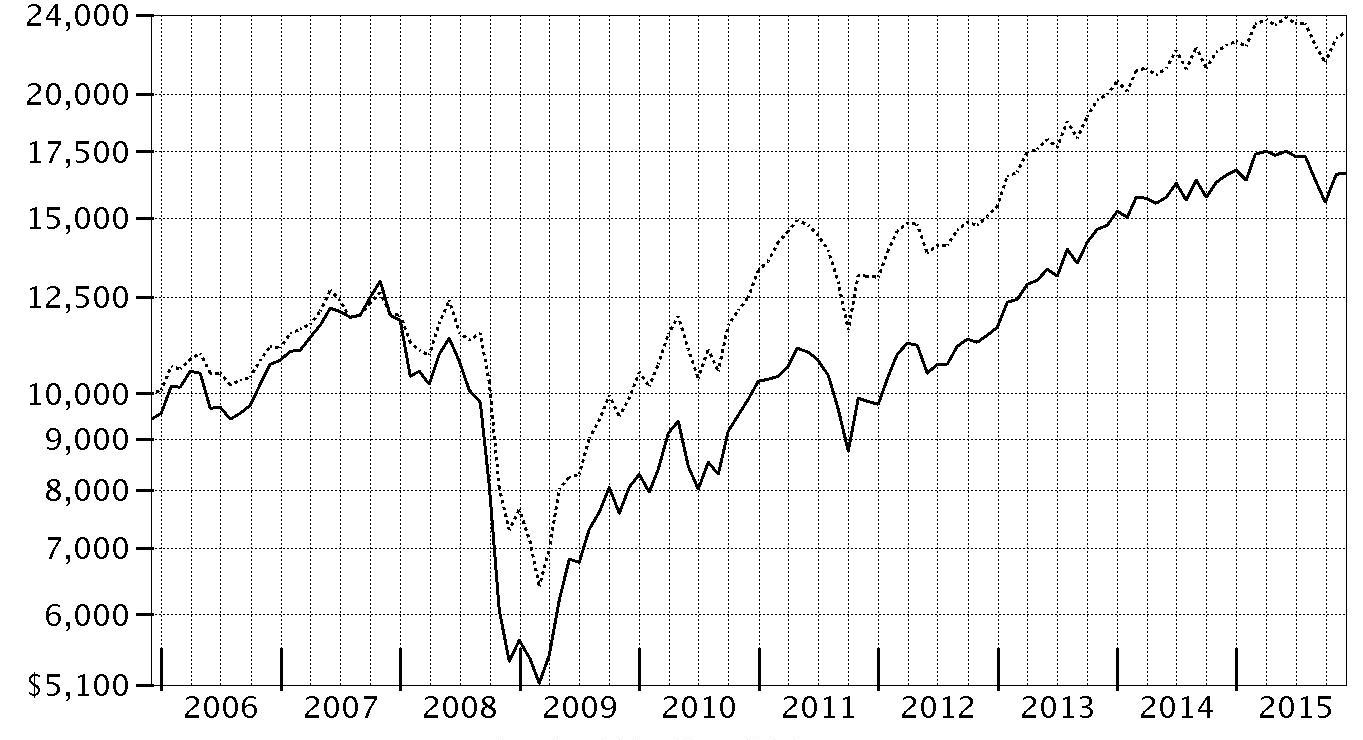
| Period Ending Values | ||
| $16,664 | Fidelity Advisor® Stock Selector Mid Cap Fund - Class A | |
| $23,058 | S&P MidCap 400® Index | |
Management's Discussion of Fund Performance
Market Recap: U.S. stocks gained modestly for the 12 months ending November 30, 2015, helped by a strong October that largely erased a steep decline in August and September on concern about slowing economic growth emanating from China. Stocks benefited late in the period amid waning expectations for a near-term interest-rate hike by the U.S. Federal Reserve, additional economic stimulus in Europe and an interest-rate cut in China. The bellwether S&P 500® index advanced 2.75% for the period, with growth stocks in the benchmark far outpacing their value counterparts, as investors continued to seek growth in a subpar economic environment. Sector performance also varied widely, with more than 26 percentage points separating the leader from the laggard. Consumer discretionary (+14%) secured the top spot, benefiting from a combination of rising personal income and still-benign inflation. Information technology (+7%) and health care (+4%) also outpaced the broad market. Conversely, energy (-12%) performed worst, stymied by depressed commodity prices that also hit materials (-5%). Telecommunication services (-5%) and utilities (-4%), considered defensive sectors less sensitive to the economy, also lost ground. At period end, investors remained focused on the potential global implications of a stronger U.S. dollar and how China's transition toward a consumption-led economy may affect corporate earnings.Comments from Co-Portfolio Manager Shadman Riaz: For the year, most of the fund’s share classes (excluding sales charges, if applicable) delivered a modestly positive return, but lagged the 2.92% result of the benchmark S&P MidCap 400® Index. Stock selection was the primary source of the fund’s relative underperformance, especially in financials. Several out-of-index positions hurt performance, particularly mortgage servicer Ocwen Financial. We did not anticipate the severe impact of the New York Department of Financial Services’ regulatory action related to allegations of Ocwen’s financial irregularities. We eliminated the position by period end. Stock picks in information technology hurt, particularly within software & services. Out-of-benchmark semiconductor firm Marvell Technology Group, cloud-computing company Rackspace Holdings and semiconductor maker Skyworks Solutions all negatively affected the fund's return. Conversely, choices in the capital goods segment of industrials was beneficial, led by a stake in non-benchmark diversified technology company Roper Technologies. Interactive Brokers Group, an out-of-index global electronic broker, also helped on a relative basis.The views expressed above reflect those of the portfolio manager(s) only through the end of the period as stated on the cover of this report and do not necessarily represent the views of Fidelity or any other person in the Fidelity organization. Any such views are subject to change at any time based upon market or other conditions and Fidelity disclaims any responsibility to update such views. These views may not be relied on as investment advice and, because investment decisions for a Fidelity fund are based on numerous factors, may not be relied on as an indication of trading intent on behalf of any Fidelity fund.
Investment Summary (Unaudited)
Top Ten Stocks as of November 30, 2015
| % of fund's net assets | % of fund's net assets 6 months ago | |
| AMETEK, Inc. | 3.5 | 2.6 |
| Roper Technologies, Inc. | 3.2 | 2.5 |
| IDEX Corp. | 2.5 | 0.0 |
| Wabtec Corp. | 2.1 | 0.0 |
| PPG Industries, Inc. | 1.5 | 1.0 |
| Ecolab, Inc. | 1.5 | 1.6 |
| Jarden Corp. | 1.4 | 1.5 |
| Capital One Financial Corp. | 1.4 | 1.3 |
| NVR, Inc. | 1.3 | 0.9 |
| Teledyne Technologies, Inc. | 1.3 | 0.0 |
| 19.7 |
Top Five Market Sectors as of November 30, 2015
| % of fund's net assets | % of fund's net assets 6 months ago | |
| Financials | 24.8 | 22.9 |
| Information Technology | 16.9 | 17.1 |
| Industrials | 14.8 | 16.2 |
| Consumer Discretionary | 13.1 | 13.2 |
| Health Care | 8.3 | 8.5 |
Asset Allocation (% of fund's net assets)
| As of November 30, 2015 * | ||
| Stocks and Equity Futures | 96.8% | |
| Short-Term Investments and Net Other Assets (Liabilities) | 3.2% | |

* Foreign investments - 6.0%
| As of May 31, 2015 * | ||
| Stocks and Equity Futures | 98.4% | |
| Short-Term Investments and Net Other Assets (Liabilities) | 1.6% | |

* Foreign investments - 6.2%
Percentages shown as 0.0% may reflect amounts less than 0.05%.
Investments November 30, 2015
Showing Percentage of Net Assets
| Common Stocks - 96.3% | |||
| Shares | Value (000s) | ||
| CONSUMER DISCRETIONARY - 13.1% | |||
| Auto Components - 0.4% | |||
| Dorman Products, Inc. (a)(b) | 186,700 | $8,909 | |
| Automobiles - 0.7% | |||
| Harley-Davidson, Inc. | 337,800 | 16,525 | |
| Distributors - 0.4% | |||
| LKQ Corp. (a) | 313,300 | 9,239 | |
| Household Durables - 3.4% | |||
| Jarden Corp. (a) | 733,072 | 34,220 | |
| NVR, Inc. (a) | 18,900 | 31,799 | |
| Tupperware Brands Corp. | 264,500 | 15,016 | |
| 81,035 | |||
| Internet & Catalog Retail - 0.5% | |||
| Liberty Interactive Corp. QVC Group Series A (a) | 473,510 | 12,539 | |
| Media - 1.8% | |||
| AMC Networks, Inc. Class A (a) | 195,300 | 15,880 | |
| Liberty Broadband Corp. Class A (a) | 57,081 | 3,026 | |
| Scripps Networks Interactive, Inc. Class A | 222,200 | 12,621 | |
| Viacom, Inc. Class B (non-vtg.) | 266,100 | 13,249 | |
| 44,776 | |||
| Multiline Retail - 0.9% | |||
| Dollar General Corp. | 341,300 | 22,324 | |
| Specialty Retail - 4.5% | |||
| AutoNation, Inc. (a) | 341,200 | 21,810 | |
| Bed Bath & Beyond, Inc. (a) | 165,800 | 9,039 | |
| Best Buy Co., Inc. | 232,900 | 7,402 | |
| DSW, Inc. Class A | 295,800 | 6,792 | |
| Foot Locker, Inc. | 311,600 | 20,254 | |
| GameStop Corp. Class A | 234,900 | 8,229 | |
| Ross Stores, Inc. | 357,500 | 18,594 | |
| Sally Beauty Holdings, Inc. (a) | 617,400 | 15,966 | |
| 108,086 | |||
| Textiles, Apparel & Luxury Goods - 0.5% | |||
| Deckers Outdoor Corp. (a) | 12,700 | 622 | |
| Ralph Lauren Corp. | 90,000 | 11,179 | |
| 11,801 | |||
| TOTAL CONSUMER DISCRETIONARY | 315,234 | ||
| CONSUMER STAPLES - 4.2% | |||
| Beverages - 1.1% | |||
| Coca-Cola Enterprises, Inc. | 193,600 | 9,738 | |
| Dr. Pepper Snapple Group, Inc. | 77,900 | 6,992 | |
| Molson Coors Brewing Co. Class B | 93,300 | 8,586 | |
| 25,316 | |||
| Food & Staples Retailing - 0.4% | |||
| United Natural Foods, Inc. (a) | 169,200 | 7,430 | |
| Whole Foods Market, Inc. | 96,800 | 2,822 | |
| 10,252 | |||
| Food Products - 0.9% | |||
| Campbell Soup Co. | 158,900 | 8,301 | |
| ConAgra Foods, Inc. | 51,200 | 2,096 | |
| Mead Johnson Nutrition Co. Class A | 67,900 | 5,472 | |
| Nomad Foods Ltd. (a) | 62,478 | 775 | |
| The J.M. Smucker Co. | 40,903 | 4,957 | |
| 21,601 | |||
| Household Products - 1.0% | |||
| Church & Dwight Co., Inc. | 187,800 | 16,108 | |
| Energizer Holdings, Inc. | 232,700 | 7,870 | |
| 23,978 | |||
| Personal Products - 0.5% | |||
| Edgewell Personal Care Co. (a) | 154,700 | 12,453 | |
| Tobacco - 0.3% | |||
| Universal Corp. (b) | 102,200 | 5,778 | |
| TOTAL CONSUMER STAPLES | 99,378 | ||
| ENERGY - 3.2% | |||
| Energy Equipment & Services - 1.0% | |||
| Bristow Group, Inc. | 170,700 | 5,215 | |
| Dril-Quip, Inc. (a) | 168,800 | 10,653 | |
| Oil States International, Inc. (a) | 221,000 | 7,010 | |
| 22,878 | |||
| Oil, Gas & Consumable Fuels - 2.2% | |||
| Cabot Oil & Gas Corp. | 247,700 | 4,664 | |
| Cimarex Energy Co. | 56,600 | 6,737 | |
| Energen Corp. | 213,500 | 12,658 | |
| HollyFrontier Corp. | 366,300 | 17,612 | |
| PDC Energy, Inc. (a) | 75,100 | 4,242 | |
| Stone Energy Corp. (a) | 506,400 | 3,692 | |
| Whiting Petroleum Corp. (a) | 271,000 | 4,474 | |
| 54,079 | |||
| TOTAL ENERGY | 76,957 | ||
| FINANCIALS - 24.8% | |||
| Banks - 3.7% | |||
| Aldermore Group PLC | 2,108,400 | 7,462 | |
| Comerica, Inc. | 126,100 | 5,845 | |
| Huntington Bancshares, Inc. | 1,521,178 | 17,783 | |
| Prosperity Bancshares, Inc. | 151,100 | 8,372 | |
| Shawbrook Group PLC | 1,538,100 | 7,707 | |
| Signature Bank (a) | 118,700 | 18,772 | |
| Synovus Financial Corp. | 591,727 | 19,752 | |
| The Jammu & Kashmir Bank Ltd. | 2,642,702 | 3,377 | |
| 89,070 | |||
| Capital Markets - 1.9% | |||
| Fortress Investment Group LLC | 478,300 | 2,612 | |
| Interactive Brokers Group, Inc. | 571,967 | 24,800 | |
| KCG Holdings, Inc. Class A (a) | 315,344 | 4,071 | |
| MLP AG | 1,566,600 | 6,372 | |
| Oaktree Capital Group LLC Class A | 102,900 | 5,025 | |
| Vontobel Holdings AG | 81,403 | 3,659 | |
| 46,539 | |||
| Consumer Finance - 2.8% | |||
| Capital One Financial Corp. | 429,900 | 33,751 | |
| Enova International, Inc. (a) | 295,067 | 2,219 | |
| Navient Corp. | 593,916 | 7,074 | |
| OneMain Holdings, Inc. (a) | 227,080 | 11,004 | |
| SLM Corp. (a) | 1,781,916 | 12,037 | |
| 66,085 | |||
| Diversified Financial Services - 1.1% | |||
| Alexander Forbes Group Holding | 8,160,135 | 3,697 | |
| MSCI, Inc. Class A | 332,000 | 23,280 | |
| 26,977 | |||
| Insurance - 4.9% | |||
| Allied World Assurance Co. Holdings AG | 200,000 | 7,264 | |
| AmTrust Financial Services, Inc. | 194,200 | 12,139 | |
| Arthur J. Gallagher & Co. | 687,500 | 30,078 | |
| CNO Financial Group, Inc. | 665,900 | 13,471 | |
| Direct Line Insurance Group PLC | 3,189,858 | 19,784 | |
| Fairfax Financial Holdings Ltd. (sub. vtg.) | 20,400 | 9,794 | |
| Hanover Insurance Group, Inc. | 201,500 | 17,047 | |
| ProAssurance Corp. | 164,300 | 8,693 | |
| 118,270 | |||
| Real Estate Investment Trusts - 9.4% | |||
| Altisource Residential Corp. Class B | 432,521 | 5,727 | |
| Cousins Properties, Inc. | 595,858 | 5,857 | |
| DCT Industrial Trust, Inc. | 202,400 | 7,726 | |
| Empire State Realty Trust, Inc. | 367,100 | 6,751 | |
| Equity Lifestyle Properties, Inc. | 215,500 | 13,443 | |
| Essex Property Trust, Inc. | 42,000 | 9,693 | |
| Extra Space Storage, Inc. | 233,700 | 19,572 | |
| FelCor Lodging Trust, Inc. | 1,315,200 | 10,548 | |
| Healthcare Realty Trust, Inc. | 244,500 | 6,648 | |
| InfraReit, Inc. | 210,500 | 4,246 | |
| Liberty Property Trust (SBI) | 68,500 | 2,322 | |
| Mack-Cali Realty Corp. | 624,700 | 14,680 | |
| Mid-America Apartment Communities, Inc. | 212,250 | 18,797 | |
| Outfront Media, Inc. | 285,800 | 6,531 | |
| Parkway Properties, Inc. | 621,100 | 10,608 | |
| Potlatch Corp. | 190,900 | 6,380 | |
| Ramco-Gershenson Properties Trust (SBI) | 762,300 | 12,860 | |
| Redwood Trust, Inc. | 358,100 | 4,935 | |
| Sabra Health Care REIT, Inc. | 485,000 | 10,030 | |
| SL Green Realty Corp. | 29,965 | 3,538 | |
| Store Capital Corp. | 324,700 | 7,390 | |
| Taubman Centers, Inc. | 183,700 | 13,203 | |
| The GEO Group, Inc. | 138,450 | 4,059 | |
| Urban Edge Properties | 861,500 | 20,667 | |
| 226,211 | |||
| Real Estate Management & Development - 0.4% | |||
| CBRE Group, Inc. (a) | 239,650 | 8,980 | |
| Thrifts & Mortgage Finance - 0.6% | |||
| Essent Group Ltd. (a) | 330,800 | 8,177 | |
| LIC Housing Finance Ltd. (a) | 790,000 | 5,759 | |
| 13,936 | |||
| TOTAL FINANCIALS | 596,068 | ||
| HEALTH CARE - 8.3% | |||
| Biotechnology - 0.8% | |||
| AMAG Pharmaceuticals, Inc. (a) | 180,000 | 4,792 | |
| Puma Biotechnology, Inc. (a) | 50,000 | 3,765 | |
| Vertex Pharmaceuticals, Inc. (a) | 88,000 | 11,384 | |
| 19,941 | |||
| Health Care Equipment & Supplies - 3.4% | |||
| Boston Scientific Corp. (a) | 1,040,000 | 19,011 | |
| CONMED Corp. | 170,000 | 7,225 | |
| Nevro Corp. | 150,000 | 9,057 | |
| The Cooper Companies, Inc. | 140,000 | 20,475 | |
| Wright Medical Group NV (a) | 620,000 | 13,280 | |
| Zimmer Biomet Holdings, Inc. | 120,000 | 12,121 | |
| 81,169 | |||
| Health Care Providers & Services - 1.8% | |||
| Adeptus Health, Inc. Class A (a)(b) | 116,000 | 6,970 | |
| HCA Holdings, Inc. (a) | 128,000 | 8,712 | |
| MEDNAX, Inc. (a) | 270,000 | 19,270 | |
| Surgical Care Affiliates, Inc. (a) | 230,000 | 8,549 | |
| 43,501 | |||
| Life Sciences Tools & Services - 0.6% | |||
| Agilent Technologies, Inc. | 330,000 | 13,801 | |
| Pharmaceuticals - 1.7% | |||
| Catalent, Inc. (a) | 560,000 | 15,596 | |
| Endo Health Solutions, Inc. (a) | 255,000 | 15,677 | |
| Prestige Brands Holdings, Inc. (a) | 190,000 | 9,669 | |
| 40,942 | |||
| TOTAL HEALTH CARE | 199,354 | ||
| INDUSTRIALS - 14.8% | |||
| Aerospace & Defense - 1.3% | |||
| Teledyne Technologies, Inc. (a) | 338,336 | 31,299 | |
| Electrical Equipment - 3.5% | |||
| AMETEK, Inc. | 1,497,390 | 84,543 | |
| Industrial Conglomerates - 3.2% | |||
| Roper Technologies, Inc. | 404,220 | 78,213 | |
| Machinery - 5.7% | |||
| IDEX Corp. | 755,100 | 59,502 | |
| WABCO Holdings, Inc. (a) | 247,950 | 26,650 | |
| Wabtec Corp. | 630,100 | 50,484 | |
| 136,636 | |||
| Road & Rail - 0.8% | |||
| J.B. Hunt Transport Services, Inc. | 236,440 | 18,499 | |
| Trading Companies & Distributors - 0.3% | |||
| AerCap Holdings NV (a) | 146,500 | 6,657 | |
| TOTAL INDUSTRIALS | 355,847 | ||
| INFORMATION TECHNOLOGY - 16.9% | |||
| Communications Equipment - 0.4% | |||
| F5 Networks, Inc. (a) | 97,230 | 10,015 | |
| Electronic Equipment & Components - 2.4% | |||
| CDW Corp. | 445,700 | 19,241 | |
| IPG Photonics Corp. (a)(b) | 161,700 | 14,745 | |
| Trimble Navigation Ltd. (a) | 968,700 | 22,183 | |
| 56,169 | |||
| Internet Software & Services - 1.2% | |||
| IAC/InterActiveCorp | 123,600 | 7,761 | |
| Rackspace Hosting, Inc. (a) | 748,200 | 21,413 | |
| Velti PLC (a)(c) | 215,084 | 1 | |
| 29,175 | |||
| IT Services - 4.8% | |||
| Alliance Data Systems Corp. (a) | 88,900 | 25,501 | |
| Blackhawk Network Holdings, Inc. (a) | 170,000 | 8,050 | |
| Cognizant Technology Solutions Corp. Class A (a) | 367,600 | 23,740 | |
| Maximus, Inc. | 545,500 | 30,957 | |
| PayPal Holdings, Inc. (a) | 176,100 | 6,209 | |
| Total System Services, Inc. | 292,300 | 16,357 | |
| Virtusa Corp. (a) | 102,200 | 5,033 | |
| 115,847 | |||
| Semiconductors & Semiconductor Equipment - 3.4% | |||
| Cirrus Logic, Inc. (a) | 301,300 | 9,961 | |
| Cree, Inc. (a)(b) | 558,600 | 15,440 | |
| Cypress Semiconductor Corp. (b) | 918,500 | 9,938 | |
| Lam Research Corp. | 57,800 | 4,520 | |
| Marvell Technology Group Ltd. | 1,344,500 | 11,912 | |
| Micron Technology, Inc. (a) | 500,600 | 7,975 | |
| NXP Semiconductors NV (a) | 153,600 | 14,355 | |
| Skyworks Solutions, Inc. | 74,200 | 6,160 | |
| 80,261 | |||
| Software - 3.3% | |||
| Adobe Systems, Inc. (a) | 68,900 | 6,302 | |
| Citrix Systems, Inc. (a) | 198,000 | 15,181 | |
| CommVault Systems, Inc. (a) | 340,800 | 13,966 | |
| Fair Isaac Corp. | 209,600 | 19,964 | |
| Rovi Corp. (a) | 179,170 | 2,116 | |
| Salesforce.com, Inc. (a) | 134,600 | 10,726 | |
| Synchronoss Technologies, Inc. (a) | 25,100 | 988 | |
| VMware, Inc. Class A (a)(b) | 68,700 | 4,219 | |
| Workday, Inc. Class A (a) | 77,000 | 6,446 | |
| 79,908 | |||
| Technology Hardware, Storage & Peripherals - 1.4% | |||
| SanDisk Corp. | 144,200 | 10,652 | |
| Western Digital Corp. | 376,000 | 23,466 | |
| 34,118 | |||
| TOTAL INFORMATION TECHNOLOGY | 405,493 | ||
| MATERIALS - 6.5% | |||
| Chemicals - 5.9% | |||
| CF Industries Holdings, Inc. | 388,000 | 17,902 | |
| Eastman Chemical Co. | 217,800 | 15,823 | |
| Ecolab, Inc. | 297,579 | 35,460 | |
| PPG Industries, Inc. | 336,700 | 35,603 | |
| Sherwin-Williams Co. | 77,800 | 21,478 | |
| W.R. Grace & Co. (a) | 165,397 | 16,245 | |
| 142,511 | |||
| Containers & Packaging - 0.6% | |||
| WestRock Co. | 267,400 | 13,538 | |
| TOTAL MATERIALS | 156,049 | ||
| TELECOMMUNICATION SERVICES - 0.1% | |||
| Diversified Telecommunication Services - 0.1% | |||
| Cogent Communications Group, Inc. | 38,700 | 1,299 | |
| Zayo Group Holdings, Inc. (a) | 38,300 | 931 | |
| 2,230 | |||
| Wireless Telecommunication Services - 0.0% | |||
| T-Mobile U.S., Inc. (a) | 26,900 | 955 | |
| TOTAL TELECOMMUNICATION SERVICES | 3,185 | ||
| UTILITIES - 4.4% | |||
| Electric Utilities - 2.2% | |||
| Hawaiian Electric Industries, Inc. | 135,000 | 3,858 | |
| OGE Energy Corp. | 492,126 | 12,849 | |
| Pinnacle West Capital Corp. | 132,900 | 8,421 | |
| PNM Resources, Inc. | 656,600 | 19,041 | |
| Portland General Electric Co. | 95,300 | 3,518 | |
| Westar Energy, Inc. | 152,803 | 6,522 | |
| 54,209 | |||
| Gas Utilities - 1.5% | |||
| Atmos Energy Corp. | 210,940 | 13,144 | |
| National Fuel Gas Co. | 191,111 | 8,738 | |
| Questar Corp. | 279,900 | 5,304 | |
| Southwest Gas Corp. | 143,263 | 8,034 | |
| 35,220 | |||
| Independent Power and Renewable Electricity Producers - 0.7% | |||
| Black Hills Corp. (b) | 198,735 | 8,530 | |
| Calpine Corp. (a) | 500,300 | 7,394 | |
| 15,924 | |||
| TOTAL UTILITIES | 105,353 | ||
| TOTAL COMMON STOCKS | |||
| (Cost $2,306,814) | 2,312,918 | ||
| Principal Amount (000s) | Value (000s) | ||
| U.S. Treasury Obligations - 0.0% | |||
| U.S. Treasury Bills, yield at date of purchase 0.1% 1/28/16 (d) | |||
| (Cost $660) | 660 | 660 | |
| Shares | Value (000s) | ||
| Money Market Funds - 6.1% | |||
| Fidelity Cash Central Fund, 0.18% (e) | 91,429,328 | $91,429 | |
| Fidelity Securities Lending Cash Central Fund, 0.22% (e)(f) | 55,766,450 | 55,766 | |
| TOTAL MONEY MARKET FUNDS | |||
| (Cost $147,195) | 147,195 | ||
| TOTAL INVESTMENT PORTFOLIO - 102.4% | |||
| (Cost $2,454,669) | 2,460,773 | ||
| NET OTHER ASSETS (LIABILITIES) - (2.4)% | (57,656) | ||
| NET ASSETS - 100% | $2,403,117 |
| Futures Contracts | |||
| Expiration Date | Underlying Face Amount at Value (000s) | Unrealized Appreciation/(Depreciation) (000s) | |
| Purchased | |||
| Equity Index Contracts | |||
| 75 CME E-mini S&P MidCap 400 Index Contracts (United States) | Dec. 2015 | 10,951 | $219 |
The face value of futures purchased as a percentage of Net Assets is 0.5 %
For the period, the average monthly underlying face amount at value for futures contracts in the aggregate was $6,856,000.
Legend
(a) Non-income producing
(b) Security or a portion of the security is on loan at period end.
(c) Restricted securities - Investment in securities not registered under the Securities Act of 1933 (excluding 144A issues). At the end of the period, the value of restricted securities (excluding 144A issues) amounted to $1,000 or 0.0% of net assets.
(d) Security or a portion of the security was pledged to cover margin requirements for futures contracts. At period end, the value of securities pledged amounted to $660,000.
(e) Affiliated fund that is generally available only to investment companies and other accounts managed by Fidelity Investments. The rate quoted is the annualized seven-day yield of the fund at period end. A complete unaudited listing of the fund's holdings as of its most recent quarter end is available upon request. In addition, each Fidelity Central Fund's financial statements , which are not covered by the Fund's Report of Independent Registered Public Accounting Firm, are available on the SEC's website or upon request.
(f) Investment made with cash collateral received from securities on loan.
Additional information on each restricted holding is as follows:
| Security | Acquisition Date | Acquisition Cost (000s) |
| Velti PLC | 4/19/13 | $323 |
Affiliated Central Funds
Information regarding fiscal year to date income earned by the Fund from investments in Fidelity Central Funds is as follows:
| Fund | Income earned |
| (Amounts in thousands) | |
| Fidelity Cash Central Fund | $88 |
| Fidelity Securities Lending Cash Central Fund | 295 |
| Total | $383 |
Investment Valuation
The following is a summary of the inputs used, as of November 30, 2015, involving the Fund's assets and liabilities carried at fair value. The inputs or methodology used for valuing securities may not be an indication of the risk associated with investing in those securities. For more information on valuation inputs, and their aggregation into the levels used below, please refer to the Investment Valuation section in the accompanying Notes to Financial Statements.
| Valuation Inputs at Reporting Date: | ||||
| Description | Total | Level 1 | Level 2 | Level 3 |
| (Amounts in thousands) | ||||
| Investments in Securities: | ||||
| Equities: | ||||
| Consumer Discretionary | $315,234 | $315,234 | $-- | $-- |
| Consumer Staples | 99,378 | 99,378 | -- | -- |
| Energy | 76,957 | 76,957 | -- | -- |
| Financials | 596,068 | 596,068 | -- | -- |
| Health Care | 199,354 | 199,354 | -- | -- |
| Industrials | 355,847 | 355,847 | -- | -- |
| Information Technology | 405,493 | 405,492 | 1 | -- |
| Materials | 156,049 | 156,049 | -- | -- |
| Telecommunication Services | 3,185 | 3,185 | -- | -- |
| Utilities | 105,353 | 105,353 | -- | -- |
| U.S. Government and Government Agency Obligations | 660 | -- | 660 | -- |
| Money Market Funds | 147,195 | 147,195 | -- | -- |
| Total Investments in Securities: | $2,460,773 | $2,460,112 | $661 | $-- |
| Derivative Instruments: | ||||
| Assets | ||||
| Futures Contracts | $219 | $219 | $-- | $-- |
| Total Assets | $219 | $219 | $-- | $-- |
| Total Derivative Instruments: | $219 | $219 | $-- | $-- |
Value of Derivative Instruments
The following table is a summary of the Fund's value of derivative instruments by primary risk exposure as of November 30, 2015. For additional information on derivative instruments, please refer to the Derivative Instruments section in the accompanying Notes to Financial Statements.
| Primary Risk Exposure / Derivative Type | Value | |
| (Amounts in thousands) | ||
| Asset | Liability | |
| Equity Risk | ||
| Futures Contracts(a) | $219 | $0 |
| Total Equity Risk | $219 | $0 |
| Total Value of Derivatives | $219 | $0 |
(a) Reflects gross cumulative appreciation (depreciation) on futures contracts as presented in the Schedule of Investments. Only the period end receivable or payable for daily variation margin and net unrealized appreciation (depreciation) are presented in the Statement of Assets and Liabilities.
See accompanying notes which are an integral part of the financial statements.
Financial Statements
Statement of Assets and Liabilities
| Amounts in thousands (except per-share amounts) | November 30, 2015 | |
| Assets | ||
| Investment in securities, at value (including securities loaned of $54,545) — See accompanying schedule: Unaffiliated issuers (cost $2,307,474) | $2,313,578 | |
| Fidelity Central Funds (cost $147,195) | 147,195 | |
| Total Investments (cost $2,454,669) | $2,460,773 | |
| Cash | 84 | |
| Receivable for investments sold | 5,727 | |
| Receivable for fund shares sold | 1,407 | |
| Dividends receivable | 1,423 | |
| Distributions receivable from Fidelity Central Funds | 40 | |
| Prepaid expenses | 6 | |
| Other receivables | 26 | |
| Total assets | 2,469,486 | |
| Liabilities | ||
| Payable for investments purchased | $4,256 | |
| Payable for fund shares redeemed | 4,322 | |
| Accrued management fee | 843 | |
| Distribution and service plan fees payable | 543 | |
| Payable for daily variation margin for derivative instruments | 82 | |
| Other affiliated payables | 498 | |
| Other payables and accrued expenses | 59 | |
| Collateral on securities loaned, at value | 55,766 | |
| Total liabilities | 66,369 | |
| Net Assets | $2,403,117 | |
| Net Assets consist of: | ||
| Paid in capital | $2,358,912 | |
| Undistributed net investment income | 1,101 | |
| Accumulated undistributed net realized gain (loss) on investments and foreign currency transactions | 36,800 | |
| Net unrealized appreciation (depreciation) on investments and assets and liabilities in foreign currencies | 6,304 | |
| Net Assets | $2,403,117 | |
| Calculation of Maximum Offering Price | ||
| Class A: | ||
| Net Asset Value and redemption price per share ($592,521 ÷ 18,511.05 shares) | $32.01 | |
| Maximum offering price per share (100/94.25 of $32.01) | $33.96 | |
| Class T: | ||
| Net Asset Value and redemption price per share ($681,417 ÷ 21,191.40 shares) | $32.16 | |
| Maximum offering price per share (100/96.50 of $32.16) | $33.33 | |
| Class B: | ||
| Net Asset Value and offering price per share ($9,548 ÷ 324.61 shares)(a) | $29.41 | |
| Class C: | ||
| Net Asset Value and offering price per share ($154,546 ÷ 5,242.53 shares)(a) | $29.48 | |
| Fidelity Stock Selector Mid Cap Fund: | ||
| Net Asset Value, offering price and redemption price per share ($486,252 ÷ 14,586.72 shares) | $33.34 | |
| Class I: | ||
| Net Asset Value, offering price and redemption price per share ($478,833 ÷ 14,339.82 shares) | $33.39 |
(a) Redemption price per share is equal to net asset value less any applicable contingent deferred sales charge.
See accompanying notes which are an integral part of the financial statements.
Statement of Operations
| Amounts in thousands | Year ended November 30, 2015 | |
| Investment Income | ||
| Dividends | $30,394 | |
| Interest | 1 | |
| Income from Fidelity Central Funds | 383 | |
| Total income | 30,778 | |
| Expenses | ||
| Management fee | ||
| Basic fee | $13,923 | |
| Performance adjustment | (1,608) | |
| Transfer agent fees | 5,607 | |
| Distribution and service plan fees | 7,168 | |
| Accounting and security lending fees | 771 | |
| Custodian fees and expenses | 69 | |
| Independent trustees' compensation | 11 | |
| Registration fees | 116 | |
| Audit | 62 | |
| Legal | 20 | |
| Miscellaneous | 17 | |
| Total expenses before reductions | 26,156 | |
| Expense reductions | (255) | 25,901 |
| Net investment income (loss) | 4,877 | |
| Realized and Unrealized Gain (Loss) | ||
| Net realized gain (loss) on: | ||
| Investment securities: | ||
| Unaffiliated issuers | 273,424 | |
| Foreign currency transactions | (26) | |
| Futures contracts | 1,414 | |
| Total net realized gain (loss) | 274,812 | |
| Change in net unrealized appreciation (depreciation) on: Investment securities (net of increase in deferred foreign taxes of $7) | (264,738) | |
| Assets and liabilities in foreign currencies | (7) | |
| Futures contracts | 243 | |
| Total change in net unrealized appreciation (depreciation) | (264,502) | |
| Net gain (loss) | 10,310 | |
| Net increase (decrease) in net assets resulting from operations | $15,187 |
See accompanying notes which are an integral part of the financial statements.
Statement of Changes in Net Assets
| Amounts in thousands | Year ended November 30, 2015 | Year ended November 30, 2014 |
| Increase (Decrease) in Net Assets | ||
| Operations | ||
| Net investment income (loss) | $4,877 | $3,875 |
| Net realized gain (loss) | 274,812 | 302,104 |
| Change in net unrealized appreciation (depreciation) | (264,502) | (34,271) |
| Net increase (decrease) in net assets resulting from operations | 15,187 | 271,708 |
| Distributions to shareholders from net investment income | (2,753) | (1,252) |
| Share transactions - net increase (decrease) | (166,510) | 147,034 |
| Total increase (decrease) in net assets | (154,076) | 417,490 |
| Net Assets | ||
| Beginning of period | 2,557,193 | 2,139,703 |
| End of period (including undistributed net investment income of $1,101 and undistributed net investment income of $708, respectively) | $2,403,117 | $2,557,193 |
See accompanying notes which are an integral part of the financial statements.
Financial Highlights — Fidelity Advisor Stock Selector Mid Cap Fund Class A
| November 30, | |||||
| Years ended November 30, | 2015 | 2014 | 2013 | 2012 | 2011 |
| Selected Per–Share Data | |||||
| Net asset value, beginning of period | $31.80 | $28.37 | $22.16 | $19.15 | $19.22 |
| Income from Investment Operations | |||||
| Net investment income (loss)A | .08 | .08 | .10 | .09 | .08B |
| Net realized and unrealized gain (loss) | .13 | 3.36 | 6.29 | 3.02 | (.15) |
| Total from investment operations | .21 | 3.44 | 6.39 | 3.11 | (.07) |
| Distributions from net investment income | – | (.01) | (.14) | (.10) | – |
| Distributions from net realized gain | – | – | (.04) | – | – |
| Total distributions | – | (.01) | (.18) | (.10) | – |
| Net asset value, end of period | $32.01 | $31.80 | $28.37 | $22.16 | $19.15 |
| Total ReturnC,D | .66% | 12.11% | 29.07% | 16.32% | (.36)% |
| Ratios to Average Net AssetsE,F | |||||
| Expenses before reductions | .98% | 1.05% | .95% | .94% | .92% |
| Expenses net of fee waivers, if any | .98% | 1.05% | .95% | .94% | .92% |
| Expenses net of all reductions | .97% | 1.05% | .92% | .94% | .91% |
| Net investment income (loss) | .24% | .26% | .39% | .41% | .39%B |
| Supplemental Data | |||||
| Net assets, end of period (in millions) | $593 | $652 | $692 | $593 | $644 |
| Portfolio turnover rateG | 109% | 89% | 79%H | 72% | 198% |
A Calculated based on average shares outstanding during the period.
B Investment income per share reflects a large, non-recurring dividend which amounted to $.05 per share. Excluding this non-recurring dividend, the ratio of net investment income (loss) to average net assets would have been .12%.
C Total returns would have been lower if certain expenses had not been reduced during the applicable periods shown.
D Total returns do not include the effect of the sales charges.
E Fees and expenses of any underlying Fidelity Central Funds are not included in the Fund's expense ratio. The Fund indirectly bears its proportionate share of the expenses of any underlying Fidelity Central Funds.
F Expense ratios reflect operating expenses of the class. Expenses before reductions do not reflect amounts reimbursed by the investment adviser or reductions from brokerage service arrangements or reductions from other expense offset arrangements and do not represent the amount paid by the class during periods when reimbursements or reductions occur. Expenses net of fee waivers reflect expenses after reimbursement by the investment adviser but prior to reductions from brokerage service arrangements or other expense offset arrangements. Expenses net of all reductions represent the net expenses paid by the class.
G Amount does not include the portfolio activity of any underlying Fidelity Central Funds.
H The portfolio turnover rate does not include the assets acquired in the merger.
See accompanying notes which are an integral part of the financial statements.
Financial Highlights — Fidelity Advisor Stock Selector Mid Cap Fund Class T
| November 30, | |||||
| Years ended November 30, | 2015 | 2014 | 2013 | 2012 | 2011 |
| Selected Per–Share Data | |||||
| Net asset value, beginning of period | $32.02 | $28.63 | $22.36 | $19.30 | $19.41 |
| Income from Investment Operations | |||||
| Net investment income (loss)A | – | .01 | .04 | .05 | .04B |
| Net realized and unrealized gain (loss) | .14 | 3.38 | 6.36 | 3.05 | (.15) |
| Total from investment operations | .14 | 3.39 | 6.40 | 3.10 | (.11) |
| Distributions from net investment income | – | – | (.09) | (.04) | – |
| Distributions from net realized gain | – | – | (.04) | – | – |
| Total distributions | – | – | (.13) | (.04) | – |
| Net asset value, end of period | $32.16 | $32.02 | $28.63 | $22.36 | $19.30 |
| Total ReturnC,D | .44% | 11.84% | 28.80% | 16.12% | (.57)% |
| Ratios to Average Net AssetsE,F | |||||
| Expenses before reductions | 1.22% | 1.28% | 1.16% | 1.14% | 1.11% |
| Expenses net of fee waivers, if any | 1.21% | 1.28% | 1.16% | 1.14% | 1.11% |
| Expenses net of all reductions | 1.21% | 1.27% | 1.13% | 1.13% | 1.10% |
| Net investment income (loss) | .01% | .03% | .17% | .22% | .20%B |
| Supplemental Data | |||||
| Net assets, end of period (in millions) | $681 | $794 | $817 | $755 | $871 |
| Portfolio turnover rateG | 109% | 89% | 79%H | 72% | 198% |
A Calculated based on average shares outstanding during the period.
B Investment income per share reflects a large, non-recurring dividend which amounted to $.05 per share. Excluding this non-recurring dividend, the ratio of net investment income (loss) to average net assets would have been (.07) %.
C Total returns would have been lower if certain expenses had not been reduced during the applicable periods shown.
D Total returns do not include the effect of the sales charges.
E Fees and expenses of any underlying Fidelity Central Funds are not included in the Fund's expense ratio. The Fund indirectly bears its proportionate share of the expenses of any underlying Fidelity Central Funds.
F Expense ratios reflect operating expenses of the class. Expenses before reductions do not reflect amounts reimbursed by the investment adviser or reductions from brokerage service arrangements or reductions from other expense offset arrangements and do not represent the amount paid by the class during periods when reimbursements or reductions occur. Expenses net of fee waivers reflect expenses after reimbursement by the investment adviser but prior to reductions from brokerage service arrangements or other expense offset arrangements. Expenses net of all reductions represent the net expenses paid by the class.
G Amount does not include the portfolio activity of any underlying Fidelity Central Funds.
H The portfolio turnover rate does not include the assets acquired in the merger.
See accompanying notes which are an integral part of the financial statements.
Financial Highlights — Fidelity Advisor Stock Selector Mid Cap Fund Class B
| November 30, | |||||
| Years ended November 30, | 2015 | 2014 | 2013 | 2012 | 2011 |
| Selected Per–Share Data | |||||
| Net asset value, beginning of period | $29.47 | $26.51 | $20.71 | $17.94 | $18.15 |
| Income from Investment Operations | |||||
| Net investment income (loss)A | (.18) | (.16) | (.10) | (.07) | (.07)B |
| Net realized and unrealized gain (loss) | .12 | 3.12 | 5.90 | 2.84 | (.14) |
| Total from investment operations | (.06) | 2.96 | 5.80 | 2.77 | (.21) |
| Distributions from net investment income | – | – | – | – | – |
| Distributions from net realized gain | – | – | – | – | – |
| Total distributions | – | – | – | – | – |
| Net asset value, end of period | $29.41 | $29.47 | $26.51 | $20.71 | $17.94 |
| Total ReturnC,D | (.20)% | 11.17% | 28.01% | 15.44% | (1.16)% |
| Ratios to Average Net AssetsE,F | |||||
| Expenses before reductions | 1.83% | 1.89% | 1.76% | 1.73% | 1.71% |
| Expenses net of fee waivers, if any | 1.83% | 1.89% | 1.76% | 1.73% | 1.71% |
| Expenses net of all reductions | 1.82% | 1.88% | 1.74% | 1.73% | 1.70% |
| Net investment income (loss) | (.61)% | (.58)% | (.43)% | (.38)% | (.40)%B |
| Supplemental Data | |||||
| Net assets, end of period (in millions) | $10 | $16 | $21 | $22 | $28 |
| Portfolio turnover rateG | 109% | 89% | 79%H | 72% | 198% |
A Calculated based on average shares outstanding during the period.
B Investment income per share reflects a large, non-recurring dividend which amounted to $.05 per share. Excluding this non-recurring dividend, the ratio of net investment income (loss) to average net assets would have been (.67) %.
C Total returns would have been lower if certain expenses had not been reduced during the applicable periods shown.
D Total returns do not include the effect of the contingent deferred sales charge.
E Fees and expenses of any underlying Fidelity Central Funds are not included in the Fund's expense ratio. The Fund indirectly bears its proportionate share of the expenses of any underlying Fidelity Central Funds.
F Expense ratios reflect operating expenses of the class. Expenses before reductions do not reflect amounts reimbursed by the investment adviser or reductions from brokerage service arrangements or reductions from other expense offset arrangements and do not represent the amount paid by the class during periods when reimbursements or reductions occur. Expenses net of fee waivers reflect expenses after reimbursement by the investment adviser but prior to reductions from brokerage service arrangements or other expense offset arrangements. Expenses net of all reductions represent the net expenses paid by the class.
G Amount does not include the portfolio activity of any underlying Fidelity Central Funds.
H The portfolio turnover rate does not include the assets acquired in the merger.
See accompanying notes which are an integral part of the financial statements.
Financial Highlights — Fidelity Advisor Stock Selector Mid Cap Fund Class C
| November 30, | |||||
| Years ended November 30, | 2015 | 2014 | 2013 | 2012 | 2011 |
| Selected Per–Share Data | |||||
| Net asset value, beginning of period | $29.51 | $26.52 | $20.73 | $17.95 | $18.15 |
| Income from Investment Operations | |||||
| Net investment income (loss)A | (.15) | (.14) | (.09) | (.06) | (.07)B |
| Net realized and unrealized gain (loss) | .12 | 3.13 | 5.91 | 2.84 | (.13) |
| Total from investment operations | (.03) | 2.99 | 5.82 | 2.78 | (.20) |
| Distributions from net investment income | – | – | (.02) | – | – |
| Distributions from net realized gain | – | – | (.01) | – | – |
| Total distributions | – | – | (.03) | – | – |
| Net asset value, end of period | $29.48 | $29.51 | $26.52 | $20.73 | $17.95 |
| Total ReturnC,D | (.10)% | 11.27% | 28.09% | 15.49% | (1.10)% |
| Ratios to Average Net AssetsE,F | |||||
| Expenses before reductions | 1.74% | 1.80% | 1.69% | 1.68% | 1.66% |
| Expenses net of fee waivers, if any | 1.73% | 1.80% | 1.69% | 1.68% | 1.66% |
| Expenses net of all reductions | 1.73% | 1.80% | 1.67% | 1.68% | 1.65% |
| Net investment income (loss) | (.51)% | (.49)% | (.36)% | (.33)% | (.35)%B |
| Supplemental Data | |||||
| Net assets, end of period (in millions) | $155 | $172 | $172 | $141 | $150 |
| Portfolio turnover rateG | 109% | 89% | 79%H | 72% | 198% |
A Calculated based on average shares outstanding during the period.
B Investment income per share reflects a large, non-recurring dividend which amounted to $.05 per share. Excluding this non-recurring dividend, the ratio of net investment income (loss) to average net assets would have been (.62) %.
C Total returns would have been lower if certain expenses had not been reduced during the applicable periods shown.
D Total returns do not include the effect of the contingent deferred sales charge.
E Fees and expenses of any underlying Fidelity Central Funds are not included in the Fund's expense ratio. The Fund indirectly bears its proportionate share of the expenses of any underlying Fidelity Central Funds.
F Expense ratios reflect operating expenses of the class. Expenses before reductions do not reflect amounts reimbursed by the investment adviser or reductions from brokerage service arrangements or reductions from other expense offset arrangements and do not represent the amount paid by the class during periods when reimbursements or reductions occur. Expenses net of fee waivers reflect expenses after reimbursement by the investment adviser but prior to reductions from brokerage service arrangements or other expense offset arrangements. Expenses net of all reductions represent the net expenses paid by the class.
G Amount does not include the portfolio activity of any underlying Fidelity Central Funds.
H The portfolio turnover rate does not include the assets acquired in the merger.
See accompanying notes which are an integral part of the financial statements.
Financial Highlights — Fidelity Stock Selector Mid Cap Fund
| November 30, | ||||
| Years ended November 30, | 2015 | 2014 | 2013 | 2012 A |
| Selected Per–Share Data | ||||
| Net asset value, beginning of period | $33.14 | $29.56 | $23.14 | $21.20 |
| Income from Investment Operations | ||||
| Net investment income (loss)B | .16 | .16 | .17 | .09 |
| Net realized and unrealized gain (loss) | .14 | 3.49 | 6.54 | 1.85 |
| Total from investment operations | .30 | 3.65 | 6.71 | 1.94 |
| Distributions from net investment income | (.10) | (.07) | (.25) | – |
| Distributions from net realized gain | – | – | (.04) | – |
| Total distributions | (.10) | (.07) | (.29) | – |
| Net asset value, end of period | $33.34 | $33.14 | $29.56 | $23.14 |
| Total ReturnC,D | .90% | 12.38% | 29.36% | 9.15% |
| Ratios to Average Net AssetsE,F | ||||
| Expenses before reductions | .75% | .81% | .71% | .59%G |
| Expenses net of fee waivers, if any | .74% | .81% | .71% | .59%G |
| Expenses net of all reductions | .74% | .81% | .69% | .58%G |
| Net investment income (loss) | .48% | .50% | .62% | .86%G |
| Supplemental Data | ||||
| Net assets, end of period (in millions) | $486 | $553 | $225 | $1 |
| Portfolio turnover rateH | 109% | 89% | 79%I | 72% |
A For the period June 6, 2012 (commencement of sale of shares) to November 30, 2012.
B Calculated based on average shares outstanding during the period.
C Total returns for periods of less than one year are not annualized.
D Total returns would have been lower if certain expenses had not been reduced during the applicable periods shown.
E Fees and expenses of any underlying Fidelity Central Funds are not included in the Fund's expense ratio. The Fund indirectly bears its proportionate share of the expenses of any underlying Fidelity Central Funds.
F Expense ratios reflect operating expenses of the class. Expenses before reductions do not reflect amounts reimbursed by the investment adviser or reductions from brokerage service arrangements or reductions from other expense offset arrangements and do not represent the amount paid by the class during periods when reimbursements or reductions occur. Expense ratios before reductions for start-up periods may not be representative of longer-term operating periods. Expenses net of fee waivers reflect expenses after reimbursement by the investment adviser but prior to reductions from brokerage service arrangements or other expense offset arrangements. Expenses net of all reductions represent the net expenses paid by the class.
G Annualized
H Amount does not include the portfolio activity of any underlying Fidelity Central Funds.
I The portfolio turnover rate does not include the assets acquired in the merger.
See accompanying notes which are an integral part of the financial statements.
Financial Highlights — Fidelity Advisor Stock Selector Mid Cap Fund Class I
| November 30, | |||||
| Years ended November 30, | 2015 | 2014 | 2013 | 2012 | 2011 |
| Selected Per–Share Data | |||||
| Net asset value, beginning of period | $33.22 | $29.64 | $23.14 | $20.01 | $20.02 |
| Income from Investment Operations | |||||
| Net investment income (loss)A | .13 | .16 | .18 | .15 | .14B |
| Net realized and unrealized gain (loss) | .14 | 3.50 | 6.56 | 3.15 | (.15) |
| Total from investment operations | .27 | 3.66 | 6.74 | 3.30 | (.01) |
| Distributions from net investment income | (.10) | (.08) | (.20) | (.17) | – |
| Distributions from net realized gain | – | – | (.04) | – | – |
| Total distributions | (.10) | (.08) | (.24) | (.17) | – |
| Net asset value, end of period | $33.39 | $33.22 | $29.64 | $23.14 | $20.01 |
| Total ReturnC | .80% | 12.39% | 29.44% | 16.66% | (.05)% |
| Ratios to Average Net AssetsD,E | |||||
| Expenses before reductions | .83% | .80% | .67% | .65% | .62% |
| Expenses net of fee waivers, if any | .83% | .80% | .67% | .65% | .62% |
| Expenses net of all reductions | .82% | .80% | .65% | .64% | .61% |
| Net investment income (loss) | .39% | .51% | .66% | .71% | .69%B |
| Supplemental Data | |||||
| Net assets, end of period (in millions) | $479 | $371 | $214 | $172 | $234 |
| Portfolio turnover rateF | 109% | 89% | 79%G | 72% | 198% |
A Calculated based on average shares outstanding during the period.
B Investment income per share reflects a large, non-recurring dividend which amounted to $.06 per share. Excluding this non-recurring dividend, the ratio of net investment income (loss) to average net assets would have been .42%.
C Total returns would have been lower if certain expenses had not been reduced during the applicable periods shown.
D Fees and expenses of any underlying Fidelity Central Funds are not included in the Fund's expense ratio. The Fund indirectly bears its proportionate share of the expenses of any underlying Fidelity Central Funds.
E Expense ratios reflect operating expenses of the class. Expenses before reductions do not reflect amounts reimbursed by the investment adviser or reductions from brokerage service arrangements or reductions from other expense offset arrangements and do not represent the amount paid by the class during periods when reimbursements or reductions occur. Expenses net of fee waivers reflect expenses after reimbursement by the investment adviser but prior to reductions from brokerage service arrangements or other expense offset arrangements. Expenses net of all reductions represent the net expenses paid by the class.
F Amount does not include the portfolio activity of any underlying Fidelity Central Funds.
G The portfolio turnover rate does not include the assets acquired in the merger.
See accompanying notes which are an integral part of the financial statements.
Notes to Financial Statements
For the period ended November 30, 2015
(Amounts in thousands except percentages)
1. Organization.
Fidelity Advisor Stock Selector Mid Cap Fund (the Fund) is a fund of Fidelity Advisor Series I (the Trust) and is authorized to issue an unlimited number of shares. The Trust is registered under the Investment Company Act of 1940, as amended (the 1940 Act), as an open-end management investment company organized as a Massachusetts business trust. The Fund offers Class A, Class T, Class C, Fidelity Stock Selector Mid Cap Fund and Class I (formerly Institutional Class) shares, each of which, along with Class B shares, has equal rights as to assets and voting privileges. Class B shares are closed to new accounts and additional purchases, except for exchanges and reinvestments. Each class has exclusive voting rights with respect to matters that affect that class. Class B shares will automatically convert to Class A shares after a holding period of seven years from the initial date of purchase.
2. Investments in Fidelity Central Funds.
The Fund invests in Fidelity Central Funds, which are open-end investment companies generally available only to other investment companies and accounts managed by the investment adviser and its affiliates. The Fund's Schedule of Investments lists each of the Fidelity Central Funds held as of period end, if any, as an investment of the Fund, but does not include the underlying holdings of each Fidelity Central Fund. As an Investing Fund, the Fund indirectly bears its proportionate share of the expenses of the underlying Fidelity Central Funds.
The Money Market Central Funds seek preservation of capital and current income and are managed by Fidelity Investments Money Management, Inc. (FIMM), an affiliate of the investment adviser. Annualized expenses of the Money Market Central Funds as of their most recent shareholder report date are less than .005%.
A complete unaudited list of holdings for each Fidelity Central Fund is available upon request or at the Securities and Exchange Commission (the SEC) website at www.sec.gov. In addition, the financial statements of the Fidelity Central Funds, which are not covered by the Fund's Report of Independent Registered Public Accounting Firm, are available on the SEC website or upon request.
3. Significant Accounting Policies.
The financial statements have been prepared in conformity with accounting principles generally accepted in the United States of America (GAAP), which require management to make certain estimates and assumptions at the date of the financial statements. Actual results could differ from those estimates. Subsequent events, if any, through the date that the financial statements were issued have been evaluated in the preparation of the financial statements. The following summarizes the significant accounting policies of the Fund:
Investment Valuation. Investments are valued as of 4:00 p.m. Eastern time on the last calendar day of the period. The Board of Trustees (the Board) has delegated the day to day responsibility for the valuation of the Fund's investments to the Fidelity Management & Research Company (FMR) Fair Value Committee (the Committee). In accordance with valuation policies and procedures approved by the Board, the Fund attempts to obtain prices from one or more third party pricing vendors or brokers to value its investments. When current market prices, quotations or currency exchange rates are not readily available or reliable, investments will be fair valued in good faith by the Committee, in accordance with procedures adopted by the Board. Factors used in determining fair value vary by investment type and may include market or investment specific events, changes in interest rates and credit quality. The frequency with which these procedures are used cannot be predicted and they may be utilized to a significant extent. The Committee oversees the Fund's valuation policies and procedures and reports to the Board on the Committee's activities and fair value determinations. The Board monitors the appropriateness of the procedures used in valuing the Fund's investments and ratifies the fair value determinations of the Committee.
The Fund categorizes the inputs to valuation techniques used to value its investments into a disclosure hierarchy consisting of three levels as shown below:
- Level 1 – quoted prices in active markets for identical investments
- Level 2 – other significant observable inputs (including quoted prices for similar investments, interest rates, prepayment speeds, etc.)
- Level 3 – unobservable inputs (including the Fund's own assumptions based on the best information available)
Valuation techniques used to value the Fund's investments by major category are as follows:
Equity securities, including restricted securities, for which market quotations are readily available, are valued at the last reported sale price or official closing price as reported by a third party pricing vendor on the primary market or exchange on which they are traded and are categorized as Level 1 in the hierarchy. In the event there were no sales during the day or closing prices are not available, securities are valued at the last quoted bid price or may be valued using the last available price and are generally categorized as Level 2 in the hierarchy. For foreign equity securities, when market or security specific events arise, comparisons to the valuation of American Depositary Receipts (ADRs), futures contracts, Exchange-Traded Funds (ETFs) and certain indexes as well as quoted prices for similar securities may be used and would be categorized as Level 2 in the hierarchy. Utilizing these techniques may result in transfers between Level 1 and Level 2. For equity securities, including restricted securities, where observable inputs are limited, assumptions about market activity and risk are used and these securities may be categorized as Level 3 in the hierarchy.
Debt securities, including restricted securities, are valued based on evaluated prices received from third party pricing vendors or from brokers who make markets in such securities. U.S. government and government agency obligations are valued by pricing vendors who utilize matrix pricing which considers prepayment speed assumptions, attributes of the collateral, yield or price of bonds of comparable quality, coupon, maturity and type or by broker-supplied prices. When independent prices are unavailable or unreliable, debt securities may be valued utilizing pricing methodologies which consider similar factors that would be used by third party pricing vendors. Debt securities are generally categorized as Level 2 in the hierarchy but may be Level 3 depending on the circumstances.
Futures contracts are valued at the settlement price established each day by the board of trade or exchange on which they are traded and are categorized as Level 1 in the hierarchy. Investments in open-end mutual funds, including the Fidelity Central Funds, are valued at their closing net asset value (NAV) each business day and are categorized as Level 1 in the hierarchy.
Changes in valuation techniques may result in transfers in or out of an assigned level within the disclosure hierarchy. The aggregate value of investments by input level as of November 30, 2015, is included at the end of the Fund's Schedule of Investments.
Foreign Currency. The Fund may use foreign currency contracts to facilitate transactions in foreign-denominated securities. Gains and losses from these transactions may arise from changes in the value of the foreign currency or if the counterparties do not perform under the contracts' terms.
Foreign-denominated assets, including investment securities, and liabilities are translated into U.S. dollars at the exchange rates at period end. Purchases and sales of investment securities, income and dividends received and expenses denominated in foreign currencies are translated into U.S. dollars at the exchange rate in effect on the transaction date.
The effects of exchange rate fluctuations on investments are included with the net realized and unrealized gain (loss) on investment securities. Other foreign currency transactions resulting in realized and unrealized gain (loss) are disclosed separately.
Investment Transactions and Income. For financial reporting purposes, the Fund's investment holdings and NAV include trades executed through the end of the last business day of the period. The NAV per share for processing shareholder transactions is calculated as of the close of business of the New York Stock Exchange (NYSE), normally 4:00 p.m. Eastern time and includes trades executed through the end of the prior business day. Gains and losses on securities sold are determined on the basis of identified cost and may include proceeds received from litigation. Dividend income is recorded on the ex-dividend date, except for certain dividends from foreign securities where the ex-dividend date may have passed, which are recorded as soon as the Fund is informed of the ex-dividend date. Non-cash dividends included in dividend income, if any, are recorded at the fair market value of the securities received. Income and capital gain distributions from Fidelity Central Funds, if any, are recorded on the ex-dividend date. Distributions received on securities that represent a return of capital or capital gain are recorded as a reduction of cost of investments and/or as a realized gain. Subsequent to ex-dividend date the Fund determines the components of these distributions, based upon receipt of tax filings or other correspondence relating to the underlying investment. Interest income is accrued as earned and includes coupon interest and amortization of premium and accretion of discount on debt securities as applicable. Investment income is recorded net of foreign taxes withheld where recovery of such taxes is uncertain.
Class Allocations and Expenses. Investment income, realized and unrealized capital gains and losses, common expenses of the Fund, and certain fund-level expense reductions, if any, are allocated daily on a pro-rata basis to each class based on the relative net assets of each class to the total net assets of the Fund. Each class differs with respect to transfer agent and distribution and service plan fees incurred. Certain expense reductions may also differ by class. For the reporting period, the allocated portion of income and expenses to each class as a percent of its average net assets may vary due to the timing of recording these transactions in relation to fluctuating net assets of the classes. Expenses directly attributable to a fund are charged to that fund. Expenses attributable to more than one fund are allocated among the respective funds on the basis of relative net assets or other appropriate methods. Expense estimates are accrued in the period to which they relate and adjustments are made when actual amounts are known.
Income Tax Information and Distributions to Shareholders. Each year, the Fund intends to qualify as a regulated investment company under Subchapter M of the Internal Revenue Code, including distributing substantially all of its taxable income and realized gains. As a result, no provision for U.S. Federal income taxes is required. As of November 30, 2015, the Fund did not have any unrecognized tax benefits in the financial statements; nor is the Fund aware of any tax positions for which it is reasonably possible that the total amounts of unrecognized tax benefits will significantly change in the next twelve months. The Fund files a U.S. federal tax return, in addition to state and local tax returns as required. The Fund's federal income tax returns are subject to examination by the Internal Revenue Service (IRS) for a period of three fiscal years after they are filed. State and local tax returns may be subject to examination for an additional fiscal year depending on the jurisdiction. Foreign taxes are provided for based on the Fund's understanding of the tax rules and rates that exist in the foreign markets in which it invests. The Fund is subject to a tax imposed on capital gains by certain countries in which it invests. An estimated deferred tax liability for net unrealized appreciation on the applicable securities is included in Other payables and accrued expenses on the Statement of Assets & Liabilities.
Distributions are declared and recorded on the ex-dividend date. Income dividends and capital gain distributions are declared separately for each class. Income and capital gain distributions are determined in accordance with income tax regulations, which may differ from GAAP. In addition, the Fund claimed a portion of the payment made to redeeming shareholders as a distribution for income tax purposes.
Capital accounts within the financial statements are adjusted for permanent book-tax differences. These adjustments have no impact on net assets or the results of operations. Capital accounts are not adjusted for temporary book-tax differences which will reverse in a subsequent period.
Book-tax differences are primarily due to futures contracts, market discount, foreign currency transactions, partnerships, deferred trustees compensation, capital loss carryforwards and losses deferred due to wash sales.
The federal tax cost of investment securities and unrealized appreciation (depreciation) as of period end were as follows:
| Gross unrealized appreciation | $219,576 |
| Gross unrealized depreciation | (215,300) |
| Net unrealized appreciation (depreciation) on securities | $4,276 |
| Tax Cost | $2,456,497 |
The tax-based components of distributable earnings as of period end were as follows:
| Undistributed ordinary income | $1,101 |
| Undistributed long-term capital gain | $39,098 |
| Net unrealized appreciation (depreciation) on securities and other investments | $4,263 |
Capital loss carryforwards are only available to offset future capital gains of the Fund to the extent provided by regulations and may be limited Under the Regulated Investment Company Modernization Act of 2010 (the Act), the Fund is permitted to carry forward capital losses incurred in taxable years beginning after December 22, 2010 for an unlimited period and such capital losses are required to be used prior to any losses that expire The capital loss carryforward information presented below, including any applicable limitation, is estimated as of fiscal period end and is subject to adjustment.
| Fiscal Year of expiration | |
| 2016 | $(250) |
The tax character of distributions paid was as follows:
| 2015 | 2014 | |
| Ordinary Income | $2,753 | $ 1,252 |
Restricted Securities. The Fund may invest in securities that are subject to legal or contractual restrictions on resale. These securities generally may be resold in transactions exempt from registration or to the public if the securities are registered. Disposal of these securities may involve time-consuming negotiations and expense, and prompt sale at an acceptable price may be difficult. Information regarding restricted securities is included at the end of the Fund's Schedule of Investments.
4. Derivative Instruments.
Risk Exposures and the Use of Derivative Instruments. The Fund's investment objective allows the Fund to enter into various types of derivative contracts, including futures contracts. Derivatives are investments whose value is primarily derived from underlying assets, indices or reference rates and may be transacted on an exchange or over-the-counter (OTC). Derivatives may involve a future commitment to buy or sell a specified asset based on specified terms, to exchange future cash flows at periodic intervals based on a notional principal amount, or for one party to make one or more payments upon the occurrence of specified events in exchange for periodic payments from the other party.
The Fund used derivatives to increase returns and to manage exposure to certain risks as defined below. The success of any strategy involving derivatives depends on analysis of numerous economic factors, and if the strategies for investment do not work as intended, the Fund may not achieve its objectives.
The Fund's use of derivatives increased or decreased its exposure to the following risk:
| Equity Risk | Equity risk relates to the fluctuations in the value of financial instruments as a result of changes in market prices (other than those arising from interest rate risk or foreign exchange risk), whether caused by factors specific to an individual investment, its issuer, or all factors affecting all instruments traded in a market or market segment. |
The Fund is also exposed to additional risks from investing in derivatives, such as liquidity risk and counterparty credit risk. Liquidity risk is the risk that the Fund will be unable to close out the derivative in the open market in a timely manner. Counterparty credit risk is the risk that the counterparty will not be able to fulfill its obligation to the Fund. Counterparty credit risk related to exchange-traded futures contracts may be mitigated by the protection provided by the exchange on which they trade.
Investing in derivatives may involve greater risks than investing in the underlying assets directly and, to varying degrees, may involve risk of loss in excess of any initial investment and collateral received and amounts recognized in the Statement of Assets and Liabilities. In addition, there may be the risk that the change in value of the derivative contract does not correspond to the change in value of the underlying instrument.
Futures Contracts. A futures contract is an agreement between two parties to buy or sell a specified underlying instrument for a fixed price at a specified future date. The Fund used futures contracts to manage its exposure to the stock market.
Upon entering into a futures contract, a fund is required to deposit either cash or securities (initial margin) with a clearing broker in an amount equal to a certain percentage of the face value of the contract. Futures contracts are marked-to-market daily and subsequent daily payments (variation margin) are made or received by a fund depending on the daily fluctuations in the value of the futures contracts and are recorded as unrealized appreciation or (depreciation). This receivable and/or payable, if any, is included in daily variation margin for derivative instruments in the Statement of Assets and Liabilities. Realized gain or (loss) is recorded upon the expiration or closing of a futures contract.
Any open futures contracts at period end are presented in the Schedule of Investments under the caption "Futures Contracts". The underlying face amount at value reflects each contract's exposure to the underlying instrument or index at period end. Securities deposited to meet initial margin requirements are identified in the Schedule of Investments.
During the period the Fund recognized net realized gain (loss) of $1,414 and a change in net unrealized appreciation (depreciation) of $243 related to its investment in futures contracts. These amounts are included in the Statement of Operations.
5. Purchases and Sales of Investments.
Purchases and sales of securities, other than short-term securities, aggregated $2,694,262 and $2,894,464, respectively.
6. Fees and Other Transactions with Affiliates.
Management Fee. Fidelity Management & Research Company (the investment adviser) and its affiliates provide the Fund with investment management related services for which the Fund pays a monthly management fee. The management fee is the sum of an individual fund fee rate that is based on an annual rate of .30% of the Fund's average net assets and an annualized group fee rate that averaged .25% during the period. The group fee rate is based upon the average net assets of all the mutual funds advised by the investment adviser, including any mutual funds previously advised by the investment adviser that are currently advised by Fidelity SelectCo, LLC, an affiliate of the investment adviser. The group fee rate decreases as assets under management increase and increases as assets under management decrease. In addition, the management fee is subject to a performance adjustment (up to a maximum of +/- .20% of the Fund's average net assets over a 36 month performance period). The upward or downward adjustment to the management fee is based on the relative investment performance of the Institutional Class of the Fund as compared to its benchmark index, the S&P MidCap 400 Index, over the same 36 month performance period. For the reporting period, the total annual management fee rate, including the performance adjustment, was .49% of the Fund's average net assets. The performance adjustment included in the management fee rate may be higher or lower than the maximum performance adjustment rate due to the difference between the average net assets for the reporting and performance periods.
Distribution and Service Plan Fees. In accordance with Rule 12b-1 of the 1940 Act, the Fund has adopted separate Distribution and Service Plans for each class of shares. Certain classes pay Fidelity Distributors Corporation (FDC), an affiliate of the investment adviser, separate Distribution and Service Fees, each of which is based on an annual percentage of each class' average net assets. In addition, FDC may pay financial intermediaries for selling shares of the Fund and providing shareholder support services. For the period, the Distribution and Service Fee rates, total fees and amounts retained by FDC were as follows:
| Distribution Fee | Service Fee | Total Fees | Retained by FDC | |
| Class A | -% | .25% | $1,588 | $4 |
| Class T | .25% | .25% | 3,773 | 8 |
| Class B | .75% | .25% | 130 | 98 |
| Class C | .75% | .25% | 1,677 | 26 |
| $7,168 | $136 |
Sales Load. FDC may receive a front-end sales charge of up to 5.75% for selling Class A shares and 3.50% for selling Class T shares, some of which is paid to financial intermediaries for selling shares of the Fund. Depending on the holding period, FDC may receive contingent deferred sales charges levied on Class A, Class T, Class B, and Class C redemptions. The deferred sales charges range from 5.00% to 1.00% for Class B shares, 1.00% for Class C shares, 1.00% for certain purchases of Class A shares and .25% for certain purchases of Class T shares.
For the period, sales charge amounts retained by FDC were as follows:
| Retained by FDC | |
| Class A | $37 |
| Class T | 19 |
| Class B(a) | 3 |
| Class C(a) | 7 |
| $66 |
(a) When Class B and Class C shares are initially sold, FDC pays commissions from its own resources to financial intermediaries through which the sales are made.
Transfer Agent Fees. Fidelity Investments Institutional Operations Company, Inc., (FIIOC), an affiliate of the investment adviser, is the transfer, dividend disbursing and shareholder servicing agent for each class of the Fund. FIIOC receives account fees and asset-based fees that vary according to the account size and type of account of the shareholders of the respective classes of the Fund. FIIOC pays for typesetting, printing and mailing of shareholder reports, except proxy statements.
For the period, transfer agent fees for each class were as follows:
| Amount | % of Class-Level Average Net Assets | |
| Class A | $1,304 | .21 |
| Class T | 1,431 | .19 |
| Class B | 39 | .30 |
| Class C | 350 | .21 |
| Fidelity Stock Selector Mid Cap Fund | 1,196 | .22 |
| Class I | 1,287 | .30 |
| $5,607 |
Accounting and Security Lending Fees. Fidelity Service Company, Inc. (FSC), an affiliate of the investment adviser, maintains the Fund's accounting records. The accounting fee is based on the level of average net assets for each month. Under a separate contract, FSC administers the security lending program. The security lending fee is based on the number and duration of lending transactions.
Brokerage Commissions. The Fund placed a portion of its portfolio transactions with brokerage firms which are affiliates of the investment adviser. Brokerage commissions are included in net realized gain (loss) and change in net unrealized appreciation (depreciation) in the Statement of Operations. The commissions paid to these affiliated firms were $42 for the period.
7. Committed Line of Credit.
The Fund participates with other funds managed by the investment adviser or an affiliate in a $4.25 billion credit facility (the "line of credit") to be utilized for temporary or emergency purposes to fund shareholder redemptions or for other short-term liquidity purposes. The Fund has agreed to pay commitment fees on its pro-rata portion of the line of credit, which amounted to $4 and is reflected in Miscellaneous expenses on the Statement of Operations. During the period, the Fund did not borrow on this line of credit.
8. Security Lending.
The Fund lends portfolio securities through a lending agent from time to time in order to earn additional income. For equity securities, a lending agent is used and may loan securities to certain qualified borrowers, including Fidelity Capital Markets (FCM), a broker-dealer affiliated with the Fund. On the settlement date of the loan, the Fund receives collateral (in the form of U.S. Treasury obligations, letters of credit and/or cash) against the loaned securities and maintains collateral in an amount not less than 100% of the market value of the loaned securities during the period of the loan. The market value of the loaned securities is determined at the close of business of the Fund and any additional required collateral is delivered to the Fund on the next business day. The Fund or borrower may terminate the loan at any time, and if the borrower defaults on its obligation to return the securities loaned because of insolvency or other reasons, the Fund may apply collateral received from the borrower against the obligation. The Fund may experience delays and costs in recovering the securities loaned. Any cash collateral received is invested in the Fidelity Securities Lending Cash Central Fund. The value of loaned securities and cash collateral at period end are disclosed on the Fund's Statement of Assets and Liabilities. The value of securities loaned to FCM at period end was $2,673. Security lending income represents the income earned on investing cash collateral, less rebates paid to borrowers and any lending agent fees associated with the loan, plus any premium payments received for lending certain types of securities. Security lending income is presented in the Statement of Operations as a component of income from Fidelity Central Funds. Total security lending income during the period amounted to $295, including $10 from securities loaned to FCM.
9. Expense Reductions.
Commissions paid to certain brokers with whom the investment adviser, or its affiliates, places trades on behalf of the Fund include an amount in addition to trade execution, which may be rebated back to the Fund to offset certain expenses. This amount totaled $195 for the period.
In addition, during the period the investment adviser reimbursed and/or waived a portion of fund-level operating expenses in the amount of $10 and a portion of class-level operating expenses as follows:
| Amount | |
| Class A | $15 |
| Class T | 19 |
| Class B | –(a) |
| Class C | 4 |
| Fidelity Stock Selector Mid Cap Fund | 8 |
| Class I | 4 |
| $50 |
(a) In the amount of less than five hundred dollars.
10. Distributions to Shareholders.
Distributions to shareholders of each class were as follows:
| Years ended November 30, | 2015 | 2014 |
| From net investment income | ||
| Class A | $– | $146 |
| Fidelity Stock Selector Mid Cap Fund | 1,667 | 530 |
| Class I | 1,086 | 576 |
| Total | $2,753 | $1,252 |
11. Share Transactions.
Share transactions for each class were as follows and may contain automatic conversions between classes or exchanges between funds:
| Shares | Shares | Dollars | Dollars | |
| Years ended November 30, | 2015 | 2014 | 2015 | 2014 |
| Class A | ||||
| Shares sold | 1,378 | 1,462 | $44,847 | $44,155 |
| Reinvestment of distributions | – | 5 | – | 134 |
| Shares redeemed | (3,369) | (5,341) | (109,342) | (162,259) |
| Net increase (decrease) | (1,991) | (3,874) | $(64,495) | $(117,970) |
| Class T | ||||
| Shares sold | 1,615 | 1,902 | $53,028 | $57,696 |
| Shares redeemed | (5,214) | (5,637) | (170,224) | (170,461) |
| Net increase (decrease) | (3,599) | (3,735) | $(117,196) | $(112,765) |
| Class B | ||||
| Shares sold | 2 | 3 | $36 | $76 |
| Shares redeemed | (219) | (244) | (6,583) | (6,801) |
| Net increase (decrease) | (217) | (241) | $(6,547) | $(6,725) |
| Class C | ||||
| Shares sold | 234 | 175 | $7,096 | $4,902 |
| Shares redeemed | (818) | (833) | (24,477) | (23,364) |
| Net increase (decrease) | (584) | (658) | $(17,381) | $(18,462) |
| Fidelity Stock Selector Mid Cap Fund | ||||
| Shares sold | 939 | 10,810 | $31,733 | $334,414 |
| Reinvestment of distributions | 49 | 18 | 1,651 | 518 |
| Shares redeemed | (3,087) | (1,745) | (101,545) | (54,485) |
| Net increase (decrease) | (2,099) | 9,083 | $(68,161) | $280,447 |
| Class I | ||||
| Shares sold | 5,194 | 5,585 | $175,072 | $173,899 |
| Reinvestment of distributions | 30 | 17 | 1,015 | 502 |
| Shares redeemed | (2,041) | (1,659) | (68,817) | (51,892) |
| Net increase (decrease) | 3,183 | 3,943 | $107,270 | $122,509 |
12. Other.
The Fund's organizational documents provide former and current trustees and officers with a limited indemnification against liabilities arising in connection with the performance of their duties to the Fund. In the normal course of business, the Fund may also enter into contracts that provide general indemnifications. The Fund's maximum exposure under these arrangements is unknown as this would be dependent on future claims that may be made against the Fund. The risk of material loss from such claims is considered remote.
At the end of the period, Strategic Advisers Small-Mid Cap Fund was the owner of record of approximately 11% of the total outstanding shares of the Fund.
Report of Independent Registered Public Accounting Firm
To the Trustees of Fidelity Advisor Series I and Shareholders of Fidelity Advisor® Stock Selector Mid Cap Fund:
We have audited the accompanying statement of assets and liabilities of Fidelity Advisor® Stock Selector Mid Cap Fund (the Fund), a fund of Fidelity Advisor Series I, including the schedule of investments, as of November 30, 2015, and the related statement of operations for the year then ended, the statement of changes in net assets for each of the two years in the period then ended, and the financial highlights for each of the five years in the period then ended. These financial statements and financial highlights are the responsibility of the Fund's management. Our responsibility is to express an opinion on these financial statements and financial highlights based on our audits.
We conducted our audits in accordance with the standards of the Public Company Accounting Oversight Board (United States). Those standards require that we plan and perform the audit to obtain reasonable assurance about whether the financial statements and financial highlights are free of material misstatement. The Fund is not required to have, nor were we engaged to perform, an audit of its internal control over financial reporting. Our audits included consideration of internal control over financial reporting as a basis for designing audit procedures that are appropriate in the circumstances, but not for the purpose of expressing an opinion on the effectiveness of the Fund's internal control over financial reporting. Accordingly, we express no such opinion. An audit also includes examining, on a test basis, evidence supporting the amounts and disclosures in the financial statements, assessing the accounting principles used and significant estimates made by management, as well as evaluating the overall financial statement presentation. Our procedures included confirmation of securities owned as of November 30, 2015, by correspondence with the custodians and brokers; when replies were not received from brokers, we performed other auditing procedures. We believe our audits provide a reasonable basis for our opinion.
In our opinion, such financial statements and financial highlights referred to above present fairly, in all material respects, the financial position of Fidelity Advisor® Stock Selector Mid Cap Fund as of November 30, 2015, the results of its operations for the year then ended, the changes in its net assets for each of the two years in the period then ended, and the financial highlights for each of the five years in the period then ended, in conformity with accounting principles generally accepted in the United States of America.
DELOITTE & TOUCHE LLP
Boston, Massachusetts
January 20, 2016
Trustees and Officers
The Trustees, Members of the Advisory Board (if any), and officers of the trust and fund, as applicable, are listed below. The Board of Trustees governs the fund and is responsible for protecting the interests of shareholders. The Trustees are experienced executives who meet periodically throughout the year to oversee the fund's activities, review contractual arrangements with companies that provide services to the fund, oversee management of the risks associated with such activities and contractual arrangements, and review the fund's performance. Each of the Trustees oversees 170 funds.
The Trustees hold office without limit in time except that (a) any Trustee may resign; (b) any Trustee may be removed by written instrument, signed by at least two-thirds of the number of Trustees prior to such removal; (c) any Trustee who requests to be retired or who has become incapacitated by illness or injury may be retired by written instrument signed by a majority of the other Trustees; and (d) any Trustee may be removed at any special meeting of shareholders by a two-thirds vote of the outstanding voting securities of the trust. Each Trustee who is not an interested person (as defined in the 1940 Act) of the trust and the fund is referred to herein as an Independent Trustee. Each Independent Trustee shall retire not later than the last day of the calendar year in which his or her 75th birthday occurs. The Independent Trustees may waive this mandatory retirement age policy with respect to individual Trustees. Officers and Advisory Board Members hold office without limit in time, except that any officer or Advisory Board Member may resign or may be removed by a vote of a majority of the Trustees at any regular meeting or any special meeting of the Trustees. Except as indicated, each individual has held the office shown or other offices in the same company for the past five years.
The fund’s Statement of Additional Information (SAI) includes more information about the Trustees. To request a free copy, call Fidelity at 1-877-208-0098.
Experience, Skills, Attributes, and Qualifications of the Trustees. The Governance and Nominating Committee has adopted a statement of policy that describes the experience, qualifications, attributes, and skills that are necessary and desirable for potential Independent Trustee candidates (Statement of Policy). The Board believes that each Trustee satisfied at the time he or she was initially elected or appointed a Trustee, and continues to satisfy, the standards contemplated by the Statement of Policy. The Governance and Nominating Committee also engages professional search firms to help identify potential Independent Trustee candidates who have the experience, qualifications, attributes, and skills consistent with the Statement of Policy. From time to time, additional criteria based on the composition and skills of the current Independent Trustees, as well as experience or skills that may be appropriate in light of future changes to board composition, business conditions, and regulatory or other developments, have also been considered by the professional search firms and the Governance and Nominating Committee. In addition, the Board takes into account the Trustees' commitment and participation in Board and committee meetings, as well as their leadership of standing and ad hoc committees throughout their tenure.
In determining that a particular Trustee was and continues to be qualified to serve as a Trustee, the Board has considered a variety of criteria, none of which, in isolation, was controlling. The Board believes that, collectively, the Trustees have balanced and diverse experience, qualifications, attributes, and skills, which allow the Board to operate effectively in governing the fund and protecting the interests of shareholders. Information about the specific experience, skills, attributes, and qualifications of each Trustee, which in each case led to the Board's conclusion that the Trustee should serve (or continue to serve) as a trustee of the fund, is provided below.
Board Structure and Oversight Function. James C. Curvey is an interested person and currently serves as Chairman. The Trustees have determined that an interested Chairman is appropriate and benefits shareholders because an interested Chairman has a personal and professional stake in the quality and continuity of services provided to the fund. Independent Trustees exercise their informed business judgment to appoint an individual of their choosing to serve as Chairman, regardless of whether the Trustee happens to be independent or a member of management. The Independent Trustees have determined that they can act independently and effectively without having an Independent Trustee serve as Chairman and that a key structural component for assuring that they are in a position to do so is for the Independent Trustees to constitute a substantial majority for the Board. The Independent Trustees also regularly meet in executive session. Ned C. Lautenbach serves as Chairman of the Independent Trustees and as such (i) acts as a liaison between the Independent Trustees and management with respect to matters important to the Independent Trustees and (ii) with management prepares agendas for Board meetings.
Fidelity® funds are overseen by different Boards of Trustees. The fund's Board oversees Fidelity's high income and certain equity funds, and other Boards oversee Fidelity's investment-grade bond, money market, asset allocation, and sector funds. The asset allocation funds may invest in Fidelity® funds overseen by the fund's Board. The use of separate Boards, each with its own committee structure, allows the Trustees of each group of Fidelity® funds to focus on the unique issues of the funds they oversee, including common research, investment, and operational issues. On occasion, the separate Boards establish joint committees to address issues of overlapping consequences for the Fidelity® funds overseen by each Board.
The Trustees operate using a system of committees to facilitate the timely and efficient consideration of all matters of importance to the Trustees, the fund, and fund shareholders and to facilitate compliance with legal and regulatory requirements and oversight of the fund's activities and associated risks. The Board, acting through its committees, has charged FMR and its affiliates with (i) identifying events or circumstances the occurrence of which could have demonstrably adverse effects on the fund's business and/or reputation; (ii) implementing processes and controls to lessen the possibility that such events or circumstances occur or to mitigate the effects of such events or circumstances if they do occur; and (iii) creating and maintaining a system designed to evaluate continuously business and market conditions in order to facilitate the identification and implementation processes described in (i) and (ii) above. Because the day-to-day operations and activities of the fund are carried out by or through FMR, its affiliates, and other service providers, the fund's exposure to risks is mitigated but not eliminated by the processes overseen by the Trustees. While each of the Board's committees has responsibility for overseeing different aspects of the fund's activities, oversight is exercised primarily through the Operations, Audit, and Compliance Committees. In addition, the Independent Trustees have worked with FMR to enhance the Board's oversight of investment and financial risks, legal and regulatory risks, technology risks, and operational risks, including the development of additional risk reporting to the Board. For example, a working group comprised of Independent Trustees and FMR has worked and continues to work to review the Fidelity® funds' valuation-related activities, reporting and risk management. Appropriate personnel, including but not limited to the fund's Chief Compliance Officer (CCO), FMR's internal auditor, the independent accountants, the fund's Treasurer and portfolio management personnel, make periodic reports to the Board's committees, as appropriate, including an annual review of Fidelity's risk management program for the Fidelity® funds. The responsibilities of each standing committee, including their oversight responsibilities, are described further under "Standing Committees of the Trustees."
Interested Trustees*:
Correspondence intended for a Trustee who is an interested person may be sent to Fidelity Investments, 245 Summer Street, Boston, Massachusetts 02210.
Name, Year of Birth; Principal Occupations and Other Relevant Experience+
James C. Curvey (1935)
Year of Election or Appointment: 2007
Trustee
Chairman of the Board of Trustees
Mr. Curvey also serves as Trustee of other Fidelity® funds. Mr. Curvey is a Director of Fidelity Research & Analysis Co. (investment adviser firm, 2009-present), and Vice Chairman (2007-present) and Director of FMR LLC (diversified financial services company). In addition, Mr. Curvey serves as an Overseer for the Boston Symphony Orchestra and a member of the board of Artis-Naples, Naples, Florida, and as a Trustee for Brewster Academy, Wolfeboro, New Hampshire. Previously, Mr. Curvey served as a Director of Fidelity Investments Money Management, Inc. (investment adviser firm, 2009-2014) and a Director of FMR and FMR Co., Inc. (investment adviser firms, 2007-2014).
Charles S. Morrison (1960)
Year of Election or Appointment: 2014
Trustee
Mr. Morrison also serves as Trustee of other funds. He serves as a Director of Fidelity Investments Money Management, Inc. (FIMM) (investment adviser firm, 2014-present), Director of Fidelity SelectCo, LLC (investment adviser firm, 2014-present), President, Asset Management (2014-present), and is an employee of Fidelity Investments. Previously, Mr. Morrison served as Vice President of Fidelity's Fixed Income and Asset Allocation Funds (2012-2014), President, Fixed Income (2011-2014), Vice President of Fidelity's Money Market Funds (2005-2009), President, Money Market Group Leader of FMR (investment adviser firm, 2009), and Senior Vice President, Money Market Group of FMR (2004-2009). Mr. Morrison also served as Vice President of Fidelity's Bond Funds (2002-2005), certain Balanced Funds (2002-2005), and certain Asset Allocation Funds (2002-2007), and as Senior Vice President (2002-2005) of Fidelity's Bond Division.
* Determined to be an “Interested Trustee” by virtue of, among other things, his or her affiliation with the trust or various entities under common control with FMR.
+ The information includes the Trustee's principal occupation during the last five years and other information relating to the experience, attributes, and skills relevant to the Trustee's qualifications to serve as a Trustee, which led to the conclusion that the Trustee should serve as a Trustee for the fund.
Independent Trustees:
Correspondence intended for an Independent Trustee may be sent to Fidelity Investments, P.O. Box 55235, Boston, Massachusetts 02205-5235.
Name, Year of Birth; Principal Occupations and Other Relevant Experience+
Dennis J. Dirks (1948)
Year of Election or Appointment: 2005
Trustee
Mr. Dirks also serves as Trustee of other Fidelity® funds. Prior to his retirement in May 2003, Mr. Dirks was Chief Operating Officer and a member of the Board of The Depository Trust & Clearing Corporation (DTCC). He also served as President, Chief Operating Officer, and Board member of The Depository Trust Company (DTC) and President and Board member of the National Securities Clearing Corporation (NSCC). In addition, Mr. Dirks served as Chief Executive Officer and Board member of the Government Securities Clearing Corporation, Chief Executive Officer and Board member of the Mortgage-Backed Securities Clearing Corporation, as a Trustee and a member of the Finance Committee of Manhattan College (2005-2008), as a Trustee and a member of the Finance Committee of AHRC of Nassau County (2006-2008), and as a member of the Independent Directors Council (IDC) Governing Council (2010-2015). Mr. Dirks is a member of the Board of Directors for The Brookville Center for Children's Services, Inc. (2009-present).
Alan J. Lacy (1953)
Year of Election or Appointment: 2008
Trustee
Mr. Lacy also serves as Trustee of other Fidelity® funds. Mr. Lacy serves as a member of the Board of Directors of Dave & Buster's Entertainment, Inc. (restaurant and entertainment complexes, 2010-present) and Bristol-Myers Squibb Company (global pharmaceuticals, 2008-present). In addition, Mr. Lacy served as Senior Adviser (2007-2014) of Oak Hill Capital Partners, L.P. (private equity) and also served as Chief Executive Officer (2000-2005) and Vice Chairman (2005-2006) of Sears Holdings Corporation and Sears, Roebuck and Co. (retail). Mr. Lacy is a member of the Board of Trustees of The National Parks Conservation Association (2006-present). Previously, Mr. Lacy served as Chairman of the Board of Trustees of the National Parks Conservation Association (2008-2011) and as a member of the Board of Directors for The Western Union Company (global money transfer, 2006-2011), The Hillman Companies, Inc. (hardware wholesalers, 2010-2014), and Earth Fare, Inc. (retail grocery, 2010-2014).
Ned C. Lautenbach (1944)
Year of Election or Appointment: 2000
Trustee
Chairman of the Independent Trustees
Mr. Lautenbach also serves as Trustee of other Fidelity® funds. Mr. Lautenbach currently serves as the Lead Director of the Eaton Corporation Board of Directors (diversified industrial, 1997-present). Mr. Lautenbach is Chairman of the Board of Directors of Artis-Naples in Naples, Florida (2012-present), a member of the Council on Foreign Relations (1994-present), and a member of the Board of Governors, State University System of Florida (2013-present). Previously, Mr. Lautenbach was a Partner/Advisory Partner at Clayton, Dubilier & Rice, LLC (private equity investment, 1998-2010), as well as a Director of Sony Corporation (2006-2007).
Joseph Mauriello (1944)
Year of Election or Appointment: 2008
Trustee
Mr. Mauriello also serves as Trustee of other Fidelity® funds. Prior to his retirement in January 2006, Mr. Mauriello served in numerous senior management positions including Deputy Chairman and Chief Operating Officer (2004-2005), and Vice Chairman of Financial Services (2002-2004) of KPMG LLP US (professional services, 1965-2005). Mr. Mauriello currently serves as a member of the Board of Directors of XL Group plc. (global insurance and re-insurance, 2006-present) and the Independent Directors Council (IDC) Governing Council (2015-present). Previously, Mr. Mauriello served as a Director of the Hamilton Funds of the Bank of New York (2006-2007) and of Arcadia Resources Inc. (health care services and products, 2007-2012).
Robert W. Selander (1950)
Year of Election or Appointment: 2011
Trustee
Mr. Selander also serves as Trustee of other Fidelity® funds. Mr. Selander serves as a Director of The Western Union Company (global money transfer, 2014-present). Previously, Mr. Selander served as a Member of the Advisory Board of other Fidelity® funds (2011), and Executive Vice Chairman (2010), Chief Executive Officer (2009-2010), and President and Chief Executive Officer (1997-2009) of Mastercard, Inc.
Cornelia M. Small (1944)
Year of Election or Appointment: 2005
Trustee
Ms. Small also serves as Trustee of other Fidelity® funds. Ms. Small is a member of the Board of Directors (2009-present) and Chair of the Investment Committee (2010-present) of the Teagle Foundation. Ms. Small also serves on the Investment Committee of the Berkshire Taconic Community Foundation (2008-present). Previously, Ms. Small served as Chairperson (2002-2008) and a member of the Investment Committee and Chairperson (2008-2012) and a member of the Board of Trustees of Smith College. In addition, Ms. Small served as Chief Investment Officer, Director of Global Equity Investments, and a member of the Board of Directors of Scudder, Stevens & Clark and Scudder Kemper Investments.
William S. Stavropoulos (1939)
Year of Election or Appointment: 2002
Trustee
Vice Chairman of the Independent Trustees
Mr. Stavropoulos also serves as Trustee of other Fidelity® funds. Mr. Stavropoulos serves as President and Founder of the Michigan Baseball Foundation, the Great Lakes Loons (2007-present). Mr. Stavropoulos is Chairman Emeritus of the Board of Directors of The Dow Chemical Company, where he previously served in numerous senior management positions, including President, CEO (1995-2000; 2002-2004), Chairman of the Executive Committee (2000-2006), and as a member of the Board of Directors (1990-2006). Currently, Mr. Stavropoulos is Chairman of the Board of Directors of Univar Inc. (global distributor of commodity and specialty chemicals), a Director of Teradata Corporation (data warehousing and technology solutions), and Maersk Inc. (industrial conglomerate), and a member of the Advisory Board for Metalmark Capital LLC (private equity investment, 2005-present). Mr. Stavropoulos is an operating advisor to Clayton, Dubilier & Rice, LLC (private equity investment). In addition, Mr. Stavropoulos is a member of the University of Notre Dame Advisory Council for the College of Science, a Trustee of the Rollin L. Gerstacker Foundation, and a Director of the Naples Philharmonic Center for the Arts. Previously, Mr. Stavropoulos served as a Director of Chemical Financial Corporation (bank holding company, 1993-2012) and Tyco International, Ltd. (multinational manufacturing and services, 2007-2012).
David M. Thomas (1949)
Year of Election or Appointment: 2008
Trustee
Mr. Thomas also serves as Trustee of other Fidelity® funds. Mr. Thomas serves as Non-Executive Chairman of the Board of Directors of Fortune Brands Home and Security (home and security products, 2011-present), as a member of the Board of Directors (2004-present) and Presiding Director (2013-present) of Interpublic Group of Companies, Inc. (marketing communication), and as a member of the Board of Trustees of the University of Florida (2013-present). Previously, Mr. Thomas served as Executive Chairman (2005-2006) and Chairman and Chief Executive Officer (2000-2005) of IMS Health, Inc. (pharmaceutical and healthcare information solutions), and a Director of Fortune Brands, Inc. (consumer products, 2000-2011).
+ The information includes the Trustee's principal occupation during the last five years and other information relating to the experience, attributes, and skills relevant to the Trustee's qualifications to serve as a Trustee, which led to the conclusion that the Trustee should serve as a Trustee for the fund.
Advisory Board Members and Officers:
Correspondence intended for an officer or Peter S. Lynch may be sent to Fidelity Investments, 245 Summer Street, Boston, Massachusetts 02210. Officers appear below in alphabetical order.
Name, Year of Birth; Principal Occupation
Peter S. Lynch (1944)
Year of Election or Appointment: 2003
Member of the Advisory Board
Mr. Lynch also serves as Member of the Advisory Board of other Fidelity® funds. Mr. Lynch is Vice Chairman and a Director of FMR (investment adviser firm) and FMR Co., Inc. (investment adviser firm). In addition, Mr. Lynch serves as a Trustee of Boston College and as the Chairman of the Inner-City Scholarship Fund. Previously, Mr. Lynch served on the Special Olympics International Board of Directors (1997-2006).
Elizabeth Paige Baumann (1968)
Year of Election or Appointment: 2012
Anti-Money Laundering (AML) Officer
Ms. Baumann also serves as AML Officer of other funds. She is Chief AML Officer of FMR LLC (diversified financial services company, 2012-present) and is an employee of Fidelity Investments. Previously, Ms. Baumann served as Vice President and Deputy Anti-Money Laundering Officer (2007-2012).
Marc R. Bryant (1966)
Year of Election or Appointment: 2015
Secretary and Chief Legal Officer (CLO)
Mr. Bryant also serves as Secretary and CLO of other funds. Mr. Bryant serves as CLO, Secretary, and Senior Vice President of Fidelity Management & Research Company (investment adviser firm, 2015-present) and FMR Co., Inc. (investment adviser firm, 2015-present); Secretary of Fidelity SelectCo, LLC (investment adviser firm, 2015-present) and Fidelity Investments Money Management, Inc. (investment adviser firm, 2015-present); and CLO of Fidelity Management & Research (Hong Kong) Limited (investment adviser firm, 2015-present). He is Senior Vice President and Deputy General Counsel of FMR LLC (diversified financial services company). Previously, Mr. Bryant served as Secretary and CLO of Fidelity Rutland Square Trust II (2010-2014) and Assistant Secretary of Fidelity's Fixed Income and Asset Allocation Funds (2013-2015). Prior to joining Fidelity Investments, Mr. Bryant served as a Senior Vice President and the Head of Global Retail Legal for AllianceBernstein L.P. (2006-2010), and as the General Counsel for ProFund Advisors LLC (2001-2006).
William C. Coffey (1969)
Year of Election or Appointment: 2009
Assistant Secretary
Mr. Coffey also serves as Assistant Secretary of other funds. He is Senior Vice President and Deputy General Counsel of FMR LLC (diversified financial services company, 2010-present), and is an employee of Fidelity Investments. Previously, Mr. Coffey served as Vice President and Associate General Counsel of FMR LLC (2005-2009).
Jonathan Davis (1968)
Year of Election or Appointment: 2010
Assistant Treasurer
Mr. Davis also serves as Assistant Treasurer of other funds, and is an employee of Fidelity Investments. Previously, Mr. Davis served as Vice President and Associate General Counsel of FMR LLC (diversified financial services company, 2003-2010).
Adrien E. Deberghes (1967)
Year of Election or Appointment: 2008
Deputy Treasurer
Mr. Deberghes also serves as an officer of other funds. He is an employee of Fidelity Investments (2008-present). Prior to joining Fidelity Investments, Mr. Deberghes was Senior Vice President of Mutual Fund Administration at State Street Corporation (2007-2008), Senior Director of Mutual Fund Administration at Investors Bank & Trust (2005-2007), and Director of Finance for Dunkin' Brands (2000-2005).
Stephanie J. Dorsey (1969)
Year of Election or Appointment: 2010
Assistant Treasurer
Ms. Dorsey also serves as an officer of other funds. She is an employee of Fidelity Investments (2008-present) and has served in other fund officer roles. Prior to joining Fidelity Investments, Ms. Dorsey served as Treasurer (2004-2008) of the JPMorgan Mutual Funds and Vice President (2004-2008) of JPMorgan Chase Bank.
Howard J. Galligan III (1966)
Year of Election or Appointment: 2014
Chief Financial Officer
Mr. Galligan also serves as Chief Financial Officer of other funds. Mr. Galligan serves as President of Fidelity Pricing and Cash Management Services (FPCMS) (2014-present) and as a Director of Strategic Advisers, Inc. (investment adviser firm, 2008-present). Previously, Mr. Galligan served as Chief Administrative Officer of Asset Management (2011-2014) and Chief Operating Officer and Senior Vice President of Investment Support for Strategic Advisers, Inc. (2003-2011).
Scott C. Goebel (1968)
Year of Election or Appointment: 2015
Vice President
Mr. Goebel serves as Vice President of other funds and is an employee of Fidelity Investments (2001-present). Previously, Mr. Goebel served as Secretary of Fidelity SelectCo, LLC (investment adviser firm, 2013-2015), Fidelity Investments Money Management, Inc. (FIMM) (investment adviser firm, 2010-2015), and Fidelity Research and Analysis Company (FRAC) (investment adviser firm, 2010-2015); General Counsel, Secretary, and Senior Vice President of Fidelity Management & Research Company (investment adviser firm, 2008-2015) and FMR Co., Inc. (investment adviser firm, 2008-2015); Assistant Secretary of Fidelity Management & Research (Japan) Limited (investment adviser firm, 2008-2015) and FMR Investment Management (U.K.) Limited (investment adviser firm, 2008-2015); Chief Legal Officer (CLO) of Fidelity Management & Research (Hong Kong) Limited (investment adviser firm, 2008-2015); Secretary and CLO of certain Fidelity® funds (2008-2015); Assistant Secretary of FIMM (2008-2010), FRAC (2008-2010), and certain funds (2007-2008); and as Vice President and Secretary of Fidelity Distributors Corporation (FDC) (2005-2007).
Thomas C. Hense (1964)
Year of Election or Appointment: 2008, 2010, or 2015
Vice President
Mr. Hense serves as Vice President of Fidelity Advisor® Multi-Asset Income Fund (2015) and other funds (High Income (2008), Small Cap (2008), and Value (2010) funds), and is an employee of Fidelity Investments (1993-present). Previously, Mr. Hense served as a portfolio manager for Fidelity's Institutional Money Management Group (Pyramis) (2003-2008).
Brian B. Hogan (1964)
Year of Election or Appointment: 2009
Vice President
Mr. Hogan also serves as Trustee or Vice President of other funds. Mr. Hogan serves as a Director of Fidelity SelectCo, LLC (investment adviser firm, 2014-present) and President of the Equity Division of FMR (investment adviser firm, 2009-present). Previously, Mr. Hogan served as Senior Vice President, Equity Research of FMR (2006-2009) and as a portfolio manager.
Chris Maher (1972)
Year of Election or Appointment: 2013
Assistant Treasurer
Mr. Maher serves as Assistant Treasurer of other funds. Mr. Maher is Vice President of Valuation Oversight and is an employee of Fidelity Investments. Previously, Mr. Maher served as Vice President of Asset Management Compliance (2013), Vice President of the Program Management Group of FMR (investment adviser firm, 2010-2013), and Vice President of Valuation Oversight (2008-2010).
Kenneth B. Robins (1969)
Year of Election or Appointment: 2008
President and Treasurer
Mr. Robins also serves as an officer of other funds. Mr. Robins serves as Executive Vice President of Fidelity Investments Money Management, Inc. (FIMM) (investment adviser firm, 2013-present) and is an employee of Fidelity Investments (2004-present). Previously, Mr. Robins served in other fund officer roles.
Stacie M. Smith (1974)
Year of Election or Appointment: 2013
Deputy Treasurer
Ms. Smith also serves as an officer of other funds. She is an employee of Fidelity Investments (2009-present) and has served in other fund officer roles. Prior to joining Fidelity Investments, Ms. Smith served as Senior Audit Manager of Ernst & Young LLP (1996-2009).
Renee Stagnone (1975)
Year of Election or Appointment: 2013
Deputy Treasurer
Ms. Stagnone also serves as Deputy Treasurer of other funds. Ms. Stagnone is an employee of Fidelity Investments (1997-present).
Linda J. Wondrack (1964)
Year of Election or Appointment: 2014
Chief Compliance Officer
Ms. Wondrack also serves as Chief Compliance Officer of other funds. Ms. Wondrack is Executive Vice President and head of the Ethics Office and Asset Management Compliance for Fidelity Investments (2012-present). Ms. Wondrack also serves as Chief Compliance Officer of Fidelity SelectCo, LLC (investment adviser firm, 2014-present); Chief Compliance Officer of Impresa Management LLC (2013-present); and Chief Compliance Officer of FMR Co., Inc. (investment adviser firm), Fidelity Investments Money Management, Inc. (investment adviser firm), Fidelity Management & Research (Japan) Limited (investment adviser firm), FMR Investment Management (U.K.) Limited (investment adviser firm), Fidelity Management & Research (Hong Kong) (investment adviser firm), Fidelity Management & Research Company (investment adviser firm), FIAM LLC (investment adviser firm), and Strategic Advisers, Inc. (investment adviser firm), Ballyrock Investment Advisors LLC, and Northern Neck Investors LLC (2012-present). Previously, Ms. Wondrack served as Senior Vice President and Chief Compliance Officer for Columbia Management Investment Advisers, LLC (2005-2012); Chief Compliance Officer for certain funds within the Columbia Family of Funds (2007-2012); and Senior Vice President of Compliance Risk Management at Bank of America (2005-2010).
Joseph F. Zambello (1957)
Year of Election or Appointment: 2011
Deputy Treasurer
Mr. Zambello also serves as Deputy Treasurer of other funds. Mr. Zambello is an employee of Fidelity Investments (1991-present). Previously, Mr. Zambello served as Vice President of the Program Management Group of FMR (investment adviser firm, 2009-2011) and Vice President of the Transfer Agent Oversight Group (2005-2009).
Shareholder Expense Example
As a shareholder of the Fund, you incur two types of costs: (1) transaction costs, including sales charges (loads) on purchase payments or redemption proceeds, and (2) ongoing costs, including management fees, distribution and/or service (12b-1) fees and other Fund expenses. This Example is intended to help you understand your ongoing costs (in dollars) of investing in the Fund and to compare these costs with the ongoing costs of investing in other mutual funds.
The Example is based on an investment of $1,000 invested at the beginning of the period and held for the entire period (June 1, 2015 to November 30, 2015).
Actual Expenses
The first line of the accompanying table for each class of the Fund provides information about actual account values and actual expenses. You may use the information in this line, together with the amount you invested, to estimate the expenses that you paid over the period. Simply divide your account value by $1,000.00 (for example, an $8,600 account value divided by $1,000.00 = 8.6), then multiply the result by the number in the first line for a class of the Fund under the heading entitled "Expenses Paid During Period" to estimate the expenses you paid on your account during this period. A small balance maintenance fee of $12.00 that is charged once a year may apply for certain accounts with a value of less than $2,000. This fee is not included in the table below. If it was, the estimate of expenses you paid during the period would be higher, and your ending account value lower, by this amount. In addition, the Fund, as a shareholder in the underlying Fidelity Central Funds, will indirectly bear its pro-rata share of the fees and expenses incurred by the underlying Fidelity Central Funds. These fees and expenses are not included in the Fund's annualized expense ratio used to calculate the expense estimate in the table below.
Hypothetical Example for Comparison Purposes
The second line of the accompanying table for each class of the Fund provides information about hypothetical account values and hypothetical expenses based on a Class' actual expense ratio and an assumed rate of return of 5% per year before expenses, which is not the Class' actual return. The hypothetical account values and expenses may not be used to estimate the actual ending account balance or expenses you paid for the period. You may use this information to compare the ongoing costs of investing in the Fund and other funds. To do so, compare this 5% hypothetical example with the 5% hypothetical examples that appear in the shareholder reports of the other funds. A small balance maintenance fee of $12.00 that is charged once a year may apply for certain accounts with a value of less than $2,000. This fee is not included in the table below. If it was, the estimate of expenses you paid during the period would be higher, and your ending account value lower, by this amount. In addition, the Fund, as a shareholder in the underlying Fidelity Central Funds, will indirectly bear its pro-rata share of the fees and expenses incurred by the underlying Fidelity Central Funds. These fees and expenses are not included in the Fund's annualized expense ratio used to calculate the expense estimate in the table below.
Please note that the expenses shown in the table are meant to highlight your ongoing costs only and do not reflect any transaction costs. Therefore, the second line of the table is useful in comparing ongoing costs only, and will not help you determine the relative total costs of owning different funds. In addition, if these transactional costs were included, your costs would have been higher.
| Annualized Expense Ratio-A | Beginning Account Value June 1, 2015 | Ending Account Value November 30, 2015 | Expenses Paid During Period-B June 1, 2015 to November 30, 2015 | |
| Class A | .94% | |||
| Actual | $1,000.00 | $951.50 | $4.60 | |
| Hypothetical-C | $1,000.00 | $1,020.36 | $4.76 | |
| Class T | 1.17% | |||
| Actual | $1,000.00 | $950.60 | $5.72 | |
| Hypothetical-C | $1,000.00 | $1,019.20 | $5.92 | |
| Class B | 1.78% | |||
| Actual | $1,000.00 | $947.20 | $8.69 | |
| Hypothetical-C | $1,000.00 | $1,016.14 | $9.00 | |
| Class C | 1.69% | |||
| Actual | $1,000.00 | $947.90 | $8.25 | |
| Hypothetical-C | $1,000.00 | $1,016.60 | $8.54 | |
| Fidelity Stock Selector Mid Cap Fund | .70% | |||
| Actual | $1,000.00 | $952.80 | $3.43 | |
| Hypothetical-C | $1,000.00 | $1,021.56 | $3.55 | |
| Class I | .80% | |||
| Actual | $1,000.00 | $952.10 | $3.91 | |
| Hypothetical-C | $1,000.00 | $1,021.06 | $4.05 |
A Annualized expense ratio reflects expenses net of applicable fee waivers.
B Expenses are equal to each Class' annualized expense ratio, multiplied by the average account value over the period, multiplied by 183/365 (to reflect the one-half year period).
C 5% return per year before expenses
Distributions (Unaudited)
The Board of Trustees of Fidelity Advisor Stock Selector Mid Cap Fund voted to pay to shareholders of record at the opening of business on record date, the following distributions per share derived from capital gains realized from sales of portfolio securities, and dividends derived from net investment income:
| Pay Date | Record Date | Dividends | Capital Gains | |
| Class A | 12/21/15 | 12/18/15 | $0.041 | $0.470 |
| 01/19/16 | 01/15/16 | $0.000 | $0.059 | |
| Class T | 12/21/15 | 12/18/15 | $0.000 | $0.470 |
| 01/19/16 | 01/15/16 | $0.000 | $0.059 | |
| Class B | 12/21/15 | 12/18/15 | $0.000 | $0.470 |
| 01/19/16 | 01/15/15 | $0.000 | $0.059 | |
| Class C | 12/21/15 | 12/18/15 | $0.000 | $0.470 |
| 01/19/16 | 01/15/16 | $0.000 | $0.059 |
The fund hereby designates as a capital gain dividend with respect to the taxable year ended November 30, 2015 $41,177,168 or, if subsequently determined to be different, the net capital gain of such year.
The fund will notify shareholders in January 2016 of amounts for use in preparing 2015 income tax returns.
Board Approval of Investment Advisory Contracts and Management Fees
Fidelity Advisor Stock Selector Mid Cap Fund
Each year, the Board of Trustees, including the Independent Trustees (together, the Board), votes on the renewal of the management contract with Fidelity Management & Research Company (FMR) and the sub-advisory agreements (together, the Advisory Contracts) for the fund. The Board, assisted by the advice of fund counsel and Independent Trustees' counsel, requests and considers a broad range of information relevant to the renewal of the Advisory Contracts throughout the year.
The Board meets regularly and, at each of its meetings, covers an extensive agenda of topics and materials and considers factors that are relevant to its annual consideration of the renewal of the fund's Advisory Contracts, including the services and support provided to the fund and its shareholders. The Board has established various standing committees (Committees), each composed of and chaired by Independent Trustees with varying backgrounds, to which the Board has assigned specific subject matter responsibilities in order to enhance effective decision-making by the Board. The Board, acting directly and through its Committees, requests and receives information concerning the annual consideration of the renewal of the fund's Advisory Contracts. The Board also meets as needed to consider matters specifically related to the Board's annual consideration of the renewal of the Advisory Contracts. Members of the Board may also meet with trustees of other Fidelity funds through ad hoc joint committees to discuss certain matters relevant to all of the Fidelity funds.
At its July 2015 meeting, the Board unanimously determined to renew the fund's Advisory Contracts. In reaching its determination, the Board considered all factors it believed relevant, including (i) the nature, extent, and quality of the services to be provided to the fund and its shareholders (including the investment performance of the fund); (ii) the competitiveness of the fund's management fee and total expense ratio relative to peer funds; (iii) the total costs of the services to be provided by and the profits to be realized by Fidelity from its relationship with the fund; and (iv) the extent to which (if any) economies of scale exist and would be realized as the fund grows, and whether any economies of scale are appropriately shared with fund shareholders.
In considering whether to renew the Advisory Contracts for the fund, the Board reached a determination, with the assistance of fund counsel and Independent Trustees' counsel and through the exercise of its business judgment, that the renewal of the Advisory Contracts was in the best interests of the fund and its shareholders and that the compensation payable under the Advisory Contracts was fair and reasonable. The Board's decision to renew the Advisory Contracts was not based on any single factor, but rather was based on a comprehensive consideration of all the information provided to the Board at its meetings throughout the year. The Board, in reaching its determination to renew the Advisory Contracts, was aware that shareholders of the fund have a broad range of investment choices available to them, including a wide choice among funds offered by Fidelity's competitors, and that the fund's shareholders, who have the opportunity to review and weigh the disclosure provided by the fund in its prospectus and other public disclosures, have chosen to invest in this fund, which is part of the Fidelity family of funds.
Nature, Extent, and Quality of Services Provided. The Board considered Fidelity's staffing as it relates to the fund, including the backgrounds of investment personnel of Fidelity, and also considered the fund's investment objective, strategies, and related investment philosophy. The Independent Trustees also had discussions with senior management of Fidelity's investment operations and investment groups. The Board considered the structure of the portfolio manager compensation program and whether this structure provides appropriate incentives to act in the best interests of the fund. Additionally, the Board considered the portfolio managers' investments, if any, in the funds that they manage.Resources Dedicated to Investment Management and Support Services. The Board and the Fund Oversight and Research Committees reviewed the general qualifications and capabilities of Fidelity's investment staff, including its size, education, experience, and resources, as well as Fidelity's approach to recruiting, training, managing, and compensating investment personnel. The Board noted that Fidelity has continued to increase the resources devoted to non-U.S. offices, including expansion of Fidelity's global investment organization. The Board also noted that Fidelity's analysts have extensive resources, tools and capabilities that allow them to conduct sophisticated quantitative and fundamental analysis, as well as credit analysis of issuers, counterparties and guarantors. Further, the Board considered that Fidelity's investment professionals have sufficient access to global information and data so as to provide competitive investment results over time, and that those professionals also have access to sophisticated tools that permit them to assess portfolio construction and risk and performance attribution characteristics continuously, as well as to transmit new information and research conclusions rapidly around the world. Additionally, in its deliberations, the Board considered Fidelity's trading, risk management, and compliance capabilities and resources, which are integral parts of the investment management process.Shareholder and Administrative Services. The Board considered (i) the nature, extent, quality, and cost of advisory, administrative, and shareholder services performed by FMR, the sub-advisers (together with FMR, the Investment Advisers), and their affiliates under the Advisory Contracts and under separate agreements covering transfer agency, pricing and bookkeeping, and securities lending services for the fund; (ii) the nature and extent of the supervision of third party service providers, principally custodians and subcustodians; and (iii) the resources devoted to, and the record of compliance with, the fund's compliance policies and procedures. The Board also reviewed the allocation of fund brokerage, including allocations to brokers affiliated with the Investment Advisers, the use of brokerage commissions to pay fund expenses, and the use of "soft" commission dollars to pay for research services.The Board noted that the growth of fund assets over time across the complex allows Fidelity to reinvest in the development of services designed to enhance the value or convenience of the Fidelity funds as investment vehicles. These services include 24-hour access to account information and market information through telephone representatives and over the Internet, investor education materials and asset allocation tools, and the expanded availability of Fidelity Investor Centers.In 2014, the Board formed an ad hoc Committee on Transfer Agency Fees to review the variety of transfer agency fee structures throughout the industry and Fidelity's competitive positioning with respect to industry participants.Investment in a Large Fund Family. The Board considered the benefits to shareholders of investing in a Fidelity fund, including the benefits of investing in a fund that is part of a large family of funds offering a variety of investment disciplines and providing a large variety of mutual fund investor services. The Board noted that Fidelity had taken, or had made recommendations that resulted in the Fidelity funds taking, a number of actions over the previous year that benefited particular funds, including (i) continuing to dedicate additional resources to investment research and to the support of the senior management team that oversees asset management; (ii) continuing efforts to enhance Fidelity's global research capabilities; (iii) launching new funds and making other enhancements to meet client needs; (iv) reducing management fees and total expenses for certain index funds and diversified international funds; (v) continuing to launch dedicated lower cost underlying funds to meet portfolio construction needs related to expanding underlying fund options for Fidelity funds of funds, specifically for the Freedom Fund product lines; (vi) rationalizing product lines and gaining increased efficiencies through fund mergers; (vii) launching active fixed-income exchange-traded funds; (viii) continuing to develop, acquire and implement systems and technology to improve services to the funds and information security and to increase efficiency; (ix) implementing investment enhancements to further strengthen Fidelity's target date product line to increase investors' probability of success in achieving their goals; (x) modifying the eligibility criteria for certain share classes to accommodate roll-over assets from employer-sponsored retirement plans; (xi) launching a new Class W of the Freedom Index Funds to attract and retain Fidelity record-kept retirement plan assets; and (xii) implementing changes to Fidelity's money market product line in response to recent money market regulatory reforms.Investment Performance. The Board considered whether the fund has operated in accordance with its investment objective, as well as its record of compliance with its investment restrictions and its performance history. The Board noted that there was a portfolio management change for the fund in October 2012.The Board took into account discussions with representatives of the Investment Advisers about fund investment performance that occur at Board meetings throughout the year. In this regard the Board noted that as part of regularly scheduled fund reviews and other reports to the Board on fund performance, the Board considers annualized return information for the fund, for different time periods, measured against a securities market index ("benchmark index") and a peer group of funds with similar objectives ("peer group"), if any. In its evaluation of fund investment performance, the Board gave particular attention to information indicating changes in performance of certain Fidelity funds for specific time periods and discussed with the Investment Advisers the reasons for any overperformance or underperformance.In addition to reviewing absolute and relative fund performance, the Independent Trustees periodically consider the appropriateness of fund performance metrics in evaluating the results achieved. In general, the Independent Trustees believe that fund performance should be evaluated based on net performance (after fees and expenses) of both the highest performing and lowest performing fund share classes, where applicable, compared to appropriate benchmark indices, over appropriate time periods that may include full market cycles, and compared to peer groups, as applicable, over the same periods, taking into account relevant factors including the following: general market conditions; issuer-specific information; and fund cash flows and other factors.The Independent Trustees recognize that shareholders evaluate performance on a net basis over their own holding periods, for which one-, three-, and five-year periods are often used as a proxy. For this reason, the performance information reviewed by the Board also included net cumulative calendar year total return information for the fund and an appropriate benchmark index and peer group for the most recent one-, three-, and five-year periods, as shown below. Returns are shown compared to the 25th percentile (top of box, 75% beaten) and 75th percentile (bottom of box, 25% beaten) of the peer universe.Fidelity Advisor Stock Selector Mid Cap Fund
Fidelity Advisor Stock Selector Mid Cap Fund
![]()
MC-ANN-0116
1.539186.118
Fidelity Advisor® Dividend Growth Fund Class Z Annual Report November 30, 2015 |
|
Contents
Board Approval of Investment Advisory Contracts and Management Fees |
To view a fund's proxy voting guidelines and proxy voting record for the 12-month period ended June 30, visit http://www.fidelity.com/proxyvotingresults or visit the Securities and Exchange Commission's (SEC) web site at http://www.sec.gov.
You may also call 1-877-208-0098 to request a free copy of the proxy voting guidelines.
Standard & Poor's, S&P and S&P 500 are registered service marks of The McGraw-Hill Companies, Inc. and have been licensed for use by Fidelity Distributors Corporation.
Other third-party marks appearing herein are the property of their respective owners.
All other marks appearing herein are registered or unregistered trademarks or service marks of FMR LLC or an affiliated company. © 2016 FMR LLC. All rights reserved.
This report and the financial statements contained herein are submitted for the general information of the shareholders of the Fund. This report is not authorized for distribution to prospective investors in the Fund unless preceded or accompanied by an effective prospectus.
A fund files its complete schedule of portfolio holdings with the SEC for the first and third quarters of each fiscal year on Form N-Q. Forms N-Q are available on the SEC’s web site at http://www.sec.gov. A fund's Forms N-Q may be reviewed and copied at the SEC’s Public Reference Room in Washington, DC. Information regarding the operation of the SEC's Public Reference Room may be obtained by calling 1-800-SEC-0330.
For a complete list of a fund's portfolio holdings, view the most recent holdings listing, semiannual report, or annual report on Fidelity's web site at http://www.fidelity.com, http://www.advisor.fidelity.com, or http://www.401k.com, as applicable.
NOT FDIC INSURED •MAY LOSE VALUE •NO BANK GUARANTEE
Neither the Fund nor Fidelity Distributors Corporation is a bank.
Performance: The Bottom Line
Average annual total return reflects the change in the value of an investment, assuming reinvestment of distributions from dividend income and capital gains (the profits earned upon the sale of securities that have grown in value, if any) and assuming a constant rate of performance each year.
The hypothetical investment and the average annual total returns do not reflect the deduction of taxes that a shareholder would pay on fund distributions or the redemption of fund shares.
During periods of reimbursement by Fidelity, a fund’s total return will be greater than it would be had the reimbursement not occurred.
How a fund did yesterday is no guarantee of how it will do tomorrow.
Average Annual Total Returns
| For the periods ended November 30, 2015 | Past 1 year | Past 5 years | Past 10 years |
| Class Z | (0.01)% | 11.85% | 7.00% |
The initial offering of Class Z shares took place on August 13, 2013. Returns prior to August 13, 2013, are those of Class I.
$10,000 Over 10 Years
Let's say hypothetically that $10,000 was invested in Fidelity Advisor® Dividend Growth Fund - Class Z on November 30, 2005.
The chart shows how the value of your investment would have changed, and also shows how the S&P 500® Index performed over the same period.
See previous page for additional information regarding the performance of Class Z.

| Period Ending Values | ||
| $19,677 | Fidelity Advisor® Dividend Growth Fund - Class Z | |
| $20,574 | S&P 500® Index | |
Management's Discussion of Fund Performance
Market Recap: U.S. stocks gained modestly for the 12 months ending November 30, 2015, despite a steep decline in August and September on concern about slowing economic growth in China. The S&P 500® index rebounded in October and gained 2.75% for the year. Stocks benefited late in the period amid waning expectations for a near-term interest-rate hike by the U.S. Federal Reserve, more economic stimulus in Europe and an interest-rate cut in China. Growth stocks in the benchmark far outpaced their value counterparts, as investors continued to seek growth in a subpar economic environment. Sector performance varied widely, with more than 26 percentage points separating the leader from the laggard. Consumer discretionary (+14%) secured the top spot, benefiting from a combination of rising personal income and still-benign inflation. Information technology (+7%) and health care (+4%) also outpaced the broad market. Conversely, the energy sector (-12%) performed worst, stymied by depressed commodity prices that also hit materials (-5%). Telecommunication services (-5%) and utilities (-4%), considered defensive sectors less sensitive to the economy, also lost ground. At period end, investors remained focused on the potential global implications of a stronger U.S. dollar and how China’s transition toward a consumption-led economy may affect corporate earnings.Comments from Portfolio Manager Ramona Persaud: For the year, the fund’s share classes (excluding sales charges, if applicable) declined modestly, lagging the benchmark S&P 500® index. The market's preference for growth-oriented names the past year made it a challenging environment for our value- and quality-focused stock-picking approach. Among sectors, positioning in consumer discretionary was by far the biggest relative detractor, followed by stock picking in information technology and health care. Looking at individual stocks, I avoided index component and e-commerce giant Amazon.com because it did not fit my investment philosophy. Unfortunately for the fund, the stock outperformed the past year, which dragged on the fund's relative result. Of note, the fund’s foreign holdings hurt against a rising dollar. Included was a non-index stake in Canada-based Potash Corp of Saskatchewan, which hurt as the stock tumbled amid lower demand and declining potash prices. Turning to positives, successful positioning in industrials contributed meaningfully to performance. The fund’s stake in videogame publisher Activision Blizzard contributed.The views expressed above reflect those of the portfolio manager(s) only through the end of the period as stated on the cover of this report and do not necessarily represent the views of Fidelity or any other person in the Fidelity organization. Any such views are subject to change at any time based upon market or other conditions and Fidelity disclaims any responsibility to update such views. These views may not be relied on as investment advice and, because investment decisions for a Fidelity fund are based on numerous factors, may not be relied on as an indication of trading intent on behalf of any Fidelity fund.
Investment Summary (Unaudited)
Top Ten Stocks as of November 30, 2015
| % of fund's net assets | % of fund's net assets 6 months ago | |
| Apple, Inc. | 4.8 | 4.6 |
| Microsoft Corp. | 3.1 | 2.4 |
| Johnson & Johnson | 3.0 | 2.5 |
| General Electric Co. | 3.0 | 2.1 |
| JPMorgan Chase & Co. | 2.8 | 2.6 |
| Wells Fargo & Co. | 2.5 | 2.3 |
| Exxon Mobil Corp. | 2.4 | 2.2 |
| Alphabet, Inc. Class C | 2.2 | 2.2 |
| Chevron Corp. | 2.1 | 2.2 |
| Bank of America Corp. | 1.8 | 1.7 |
| 27.7 |
Top Five Market Sectors as of November 30, 2015
| % of fund's net assets | % of fund's net assets 6 months ago | |
| Information Technology | 24.1 | 21.8 |
| Financials | 16.4 | 16.0 |
| Consumer Staples | 13.2 | 10.5 |
| Health Care | 12.9 | 16.4 |
| Industrials | 9.8 | 8.6 |
Asset Allocation (% of fund's net assets)
| As of November 30, 2015* | ||
| Stocks | 95.3% | |
| Convertible Securities | 0.1% | |
| Short-Term Investments and Net Other Assets (Liabilities) | 4.6% | |

* Foreign investments - 14.2%
| As of May 31, 2015* | ||
| Stocks | 97.8% | |
| Convertible Securities | 0.1% | |
| Short-Term Investments and Net Other Assets (Liabilities) | 2.1% | |

* Foreign investments - 16.3%
Investments November 30, 2015
Showing Percentage of Net Assets
| Common Stocks - 95.3% | |||
| Shares | Value (000s) | ||
| CONSUMER DISCRETIONARY - 7.8% | |||
| Diversified Consumer Services - 0.3% | |||
| H&R Block, Inc. | 95,806 | $3,515 | |
| Hotels, Restaurants & Leisure - 1.2% | |||
| Las Vegas Sands Corp. | 80,400 | 3,542 | |
| Wyndham Worldwide Corp. | 116,852 | 8,871 | |
| 12,413 | |||
| Leisure Products - 0.1% | |||
| Vista Outdoor, Inc. (a) | 33,900 | 1,493 | |
| Media - 1.7% | |||
| Altice NV Class A (a) | 195,300 | 3,000 | |
| Comcast Corp. Class A | 242,425 | 14,754 | |
| 17,754 | |||
| Multiline Retail - 2.1% | |||
| Dillard's, Inc. Class A | 91,400 | 6,855 | |
| Target Corp. | 199,100 | 14,435 | |
| 21,290 | |||
| Specialty Retail - 1.9% | |||
| AutoZone, Inc. (a) | 10,400 | 8,151 | |
| Foot Locker, Inc. | 156,391 | 10,165 | |
| Kingfisher PLC | 4,010 | 21 | |
| Staples, Inc. | 115,300 | 1,392 | |
| 19,729 | |||
| Textiles, Apparel & Luxury Goods - 0.5% | |||
| VF Corp. | 73,600 | 4,762 | |
| TOTAL CONSUMER DISCRETIONARY | 80,956 | ||
| CONSUMER STAPLES - 13.2% | |||
| Beverages - 4.7% | |||
| Constellation Brands, Inc. Class A (sub. vtg.) | 56,400 | 7,911 | |
| Dr. Pepper Snapple Group, Inc. | 87,311 | 7,836 | |
| PepsiCo, Inc. | 170,500 | 17,077 | |
| The Coca-Cola Co. | 373,410 | 15,915 | |
| 48,739 | |||
| Food & Staples Retailing - 3.6% | |||
| CVS Health Corp. | 183,391 | 17,255 | |
| Kroger Co. | 118,720 | 4,471 | |
| Rami Levi Chain Stores Hashikma Marketing 2006 Ltd. | 68,693 | 3,185 | |
| Walgreens Boots Alliance, Inc. | 148,523 | 12,480 | |
| 37,391 | |||
| Food Products - 0.6% | |||
| Greencore Group PLC | 812,005 | 4,130 | |
| Hilton Food Group PLC | 242,144 | 1,893 | |
| 6,023 | |||
| Household Products - 1.8% | |||
| Procter & Gamble Co. | 247,700 | 18,538 | |
| Personal Products - 0.2% | |||
| Edgewell Personal Care Co. (a) | 23,300 | 1,876 | |
| Tobacco - 2.3% | |||
| British American Tobacco PLC (United Kingdom) | 132,257 | 7,697 | |
| Imperial Tobacco Group PLC | 124,702 | 6,739 | |
| Reynolds American, Inc. | 213,700 | 9,884 | |
| 24,320 | |||
| TOTAL CONSUMER STAPLES | 136,887 | ||
| ENERGY - 6.3% | |||
| Oil, Gas & Consumable Fuels - 6.3% | |||
| Chevron Corp. | 234,990 | 21,459 | |
| Emerald Oil, Inc. warrants 2/4/16 (a) | 826 | 0 | |
| Exxon Mobil Corp. | 311,022 | 25,398 | |
| Imperial Oil Ltd. | 222,634 | 7,232 | |
| Kinder Morgan, Inc. | 26,538 | 626 | |
| Northern Oil & Gas, Inc. (a) | 128,694 | 660 | |
| PrairieSky Royalty Ltd. (b) | 121,700 | 2,337 | |
| Suncor Energy, Inc. | 253,380 | 7,001 | |
| 64,713 | |||
| FINANCIALS - 16.4% | |||
| Banks - 11.7% | |||
| Bank of America Corp. | 1,102,803 | 19,222 | |
| Citigroup, Inc. | 303,223 | 16,401 | |
| JPMorgan Chase & Co. | 437,993 | 29,205 | |
| PacWest Bancorp | 159,000 | 7,476 | |
| SunTrust Banks, Inc. | 181,900 | 7,898 | |
| U.S. Bancorp | 346,817 | 15,222 | |
| Wells Fargo & Co. | 467,790 | 25,775 | |
| 121,199 | |||
| Capital Markets - 0.9% | |||
| Diamond Hill Investment Group, Inc. | 7,501 | 1,652 | |
| Franklin Resources, Inc. | 84,400 | 3,538 | |
| The Blackstone Group LP | 116,290 | 3,632 | |
| 8,822 | |||
| Consumer Finance - 0.6% | |||
| American Express Co. | 82,200 | 5,889 | |
| Imperial Holdings, Inc. warrants 4/11/19 (a) | 4,481 | 1 | |
| 5,890 | |||
| Diversified Financial Services - 1.3% | |||
| McGraw Hill Financial, Inc. | 124,267 | 11,988 | |
| MSCI, Inc. Class A | 20,900 | 1,466 | |
| 13,454 | |||
| Insurance - 1.3% | |||
| ACE Ltd. | 76,000 | 8,729 | |
| MetLife, Inc. | 93,300 | 4,767 | |
| 13,496 | |||
| Real Estate Investment Trusts - 0.6% | |||
| American Tower Corp. | 66,000 | 6,559 | |
| TOTAL FINANCIALS | 169,420 | ||
| HEALTH CARE - 12.9% | |||
| Biotechnology - 2.2% | |||
| AbbVie, Inc. | 203,200 | 11,816 | |
| Amgen, Inc. | 69,737 | 11,235 | |
| 23,051 | |||
| Health Care Equipment & Supplies - 2.4% | |||
| Medtronic PLC | 254,102 | 19,144 | |
| The Cooper Companies, Inc. | 37,590 | 5,498 | |
| 24,642 | |||
| Health Care Providers & Services - 1.0% | |||
| McKesson Corp. | 51,232 | 9,701 | |
| Health Care Technology - 0.2% | |||
| CompuGroup Medical AG | 68,579 | 2,399 | |
| Pharmaceuticals - 7.1% | |||
| Allergan PLC (a) | 27,800 | 8,726 | |
| Astellas Pharma, Inc. | 355,300 | 5,001 | |
| Johnson & Johnson | 307,302 | 31,111 | |
| Sanofi SA sponsored ADR | 163,300 | 7,221 | |
| Shire PLC | 72,800 | 5,068 | |
| Teva Pharmaceutical Industries Ltd. sponsored ADR | 256,400 | 16,135 | |
| 73,262 | |||
| TOTAL HEALTH CARE | 133,055 | ||
| INDUSTRIALS - 9.8% | |||
| Aerospace & Defense - 2.7% | |||
| BWX Technologies, Inc. | 322,100 | 9,808 | |
| General Dynamics Corp. | 28,800 | 4,218 | |
| The Boeing Co. | 98,403 | 14,313 | |
| 28,339 | |||
| Air Freight & Logistics - 0.3% | |||
| C.H. Robinson Worldwide, Inc. | 45,700 | 3,082 | |
| Commercial Services & Supplies - 0.1% | |||
| Deluxe Corp. | 23,100 | 1,355 | |
| Construction & Engineering - 0.1% | |||
| Astaldi SpA (b) | 143,400 | 861 | |
| Electrical Equipment - 0.5% | |||
| AMETEK, Inc. | 62,072 | 3,505 | |
| EnerSys | 23,100 | 1,361 | |
| 4,866 | |||
| Industrial Conglomerates - 5.9% | |||
| Danaher Corp. | 166,394 | 16,039 | |
| General Electric Co. | 1,036,700 | 31,039 | |
| Roper Industries, Inc. | 70,196 | 13,582 | |
| 60,660 | |||
| Professional Services - 0.2% | |||
| CEB, Inc. | 28,900 | 2,233 | |
| Trading Companies & Distributors - 0.0% | |||
| Now, Inc. (a)(b) | 17,720 | 326 | |
| TOTAL INDUSTRIALS | 101,722 | ||
| INFORMATION TECHNOLOGY - 24.1% | |||
| Communications Equipment - 3.2% | |||
| Cisco Systems, Inc. | 657,379 | 17,914 | |
| QUALCOMM, Inc. | 314,378 | 15,339 | |
| 33,253 | |||
| Electronic Equipment & Components - 0.6% | |||
| TE Connectivity Ltd. | 85,313 | 5,724 | |
| Internet Software & Services - 2.2% | |||
| Alphabet, Inc. Class C | 31,263 | 23,216 | |
| IT Services - 4.5% | |||
| Accenture PLC Class A | 83,100 | 8,910 | |
| ASAC II LP (a)(c) | 298,480 | 7,721 | |
| Fidelity National Information Services, Inc. | 132,798 | 8,455 | |
| IBM Corp. | 77,400 | 10,791 | |
| Leidos Holdings, Inc. | 54,200 | 3,140 | |
| Total System Services, Inc. | 137,200 | 7,678 | |
| 46,695 | |||
| Semiconductors & Semiconductor Equipment - 0.4% | |||
| Broadcom Corp. Class A | 81,500 | 4,452 | |
| Software - 5.7% | |||
| Activision Blizzard, Inc. | 207,867 | 7,828 | |
| Micro Focus International PLC | 246,900 | 4,771 | |
| Microsoft Corp. | 593,063 | 32,233 | |
| Oracle Corp. | 359,828 | 14,022 | |
| 58,854 | |||
| Technology Hardware, Storage & Peripherals - 7.5% | |||
| Apple, Inc. | 419,024 | 49,570 | |
| EMC Corp. | 517,100 | 13,103 | |
| Hewlett Packard Enterprise Co. | 421,100 | 6,258 | |
| HP, Inc. | 421,100 | 5,281 | |
| Western Digital Corp. | 47,800 | 2,983 | |
| 77,195 | |||
| TOTAL INFORMATION TECHNOLOGY | 249,389 | ||
| MATERIALS - 3.2% | |||
| Chemicals - 2.9% | |||
| CF Industries Holdings, Inc. | 131,100 | 6,049 | |
| E.I. du Pont de Nemours & Co. | 151,800 | 10,222 | |
| LyondellBasell Industries NV Class A | 104,200 | 9,984 | |
| PPG Industries, Inc. | 31,400 | 3,320 | |
| 29,575 | |||
| Containers & Packaging - 0.3% | |||
| Ball Corp. | 46,662 | 3,239 | |
| TOTAL MATERIALS | 32,814 | ||
| TELECOMMUNICATION SERVICES - 1.6% | |||
| Diversified Telecommunication Services - 1.6% | |||
| AT&T, Inc. | 499,700 | 16,825 | |
| TOTAL COMMON STOCKS | |||
| (Cost $848,886) | 985,781 | ||
| Principal Amount (000s) | Value (000s) | ||
| Convertible Bonds - 0.1% | |||
| ENERGY - 0.1% | |||
| Oil, Gas & Consumable Fuels - 0.1% | |||
| Amyris, Inc. 3% 2/27/17 (Cost $791) | 791 | 719 | |
| Shares | Value (000s) | ||
| Money Market Funds - 5.0% | |||
| Fidelity Cash Central Fund, 0.18% (d) | 48,550,476 | 48,550 | |
| Fidelity Securities Lending Cash Central Fund, 0.22% (d)(e) | 3,563,031 | 3,563 | |
| TOTAL MONEY MARKET FUNDS | |||
| (Cost $52,113) | 52,113 | ||
| TOTAL INVESTMENT PORTFOLIO - 100.4% | |||
| (Cost $901,790) | 1,038,613 | ||
| NET OTHER ASSETS (LIABILITIES) - (0.4)% | (4,266) | ||
| NET ASSETS - 100% | $1,034,347 |
Values shown as $0 may reflect amounts less than $500.
Legend
(a) Non-income producing
(b) Security or a portion of the security is on loan at period end.
(c) Restricted securities - Investment in securities not registered under the Securities Act of 1933 (excluding 144A issues). At the end of the period, the value of restricted securities (excluding 144A issues) amounted to $7,721,000 or 0.7% of net assets.
(d) Affiliated fund that is generally available only to investment companies and other accounts managed by Fidelity Investments. The rate quoted is the annualized seven-day yield of the fund at period end. A complete unaudited listing of the fund's holdings as of its most recent quarter end is available upon request. In addition, each Fidelity Central Fund's financial statements, which are not covered by the Fund's Report of Independent Registered Public Accounting Firm, are available on the SEC's website or upon request.
(e) Investment made with cash collateral received from securities on loan.
Additional information on each restricted holding is as follows:
| Security | Acquisition Date | Acquisition Cost (000s) |
| ASAC II LP | 10/10/13 | $2,985 |
Affiliated Central Funds
Information regarding fiscal year to date income earned by the Fund from investments in Fidelity Central Funds is as follows:
| Fund | Income earned |
| (Amounts in thousands) | |
| Fidelity Cash Central Fund | $53 |
| Fidelity Securities Lending Cash Central Fund | 89 |
| Total | $142 |
Investment Valuation
The following is a summary of the inputs used, as of November 30, 2015, involving the Fund's assets and liabilities carried at fair value. The inputs or methodology used for valuing securities may not be an indication of the risk associated with investing in those securities. For more information on valuation inputs, and their aggregation into the levels used below, please refer to the Investment Valuation section in the accompanying Notes to Financial Statements.
| Valuation Inputs at Reporting Date: | ||||
| Description | Total | Level 1 | Level 2 | Level 3 |
| (Amounts in thousands) | ||||
| Investments in Securities: | ||||
| Equities: | ||||
| Consumer Discretionary | $80,956 | $80,935 | $21 | $-- |
| Consumer Staples | 136,887 | 129,190 | 7,697 | -- |
| Energy | 64,713 | 64,713 | -- | -- |
| Financials | 169,420 | 169,419 | 1 | -- |
| Health Care | 133,055 | 122,986 | 10,069 | -- |
| Industrials | 101,722 | 101,722 | -- | -- |
| Information Technology | 249,389 | 241,668 | -- | 7,721 |
| Materials | 32,814 | 32,814 | -- | -- |
| Telecommunication Services | 16,825 | 16,825 | -- | -- |
| Corporate Bonds | 719 | -- | 719 | -- |
| Money Market Funds | 52,113 | 52,113 | -- | -- |
| Total Investments in Securities: | $1,038,613 | $1,012,385 | $18,507 | $7,721 |
Other Information
Distribution of investments by country or territory of incorporation, as a percentage of Total Net Assets, is as follows (Unaudited):
| United States of America | 85.8% |
| Ireland | 4.0% |
| United Kingdom | 2.0% |
| Israel | 1.9% |
| Canada | 1.6% |
| Switzerland | 1.4% |
| Netherlands | 1.3% |
| Others (Individually Less Than 1%) | 2.0% |
| 100.0% |
See accompanying notes which are an integral part of the financial statements.
Financial Statements
Statement of Assets and Liabilities
| Amounts in thousands (except per-share amounts) | November 30, 2015 | |
| Assets | ||
| Investment in securities, at value (including securities loaned of $3,399) — See accompanying schedule: Unaffiliated issuers (cost $849,677) | $986,500 | |
| Fidelity Central Funds (cost $52,113) | 52,113 | |
| Total Investments (cost $901,790) | $1,038,613 | |
| Receivable for investments sold | 6,167 | |
| Receivable for fund shares sold | 471 | |
| Dividends receivable | 2,418 | |
| Interest receivable | 6 | |
| Distributions receivable from Fidelity Central Funds | 8 | |
| Prepaid expenses | 3 | |
| Other receivables | 2 | |
| Total assets | 1,047,688 | |
| Liabilities | ||
| Payable for investments purchased | $7,269 | |
| Payable for fund shares redeemed | 1,513 | |
| Accrued management fee | 359 | |
| Distribution and service plan fees payable | 375 | |
| Other affiliated payables | 205 | |
| Other payables and accrued expenses | 57 | |
| Collateral on securities loaned, at value | 3,563 | |
| Total liabilities | 13,341 | |
| Net Assets | $1,034,347 | |
| Net Assets consist of: | ||
| Paid in capital | $839,284 | |
| Undistributed net investment income | 8,234 | |
| Accumulated undistributed net realized gain (loss) on investments and foreign currency transactions | 50,009 | |
| Net unrealized appreciation (depreciation) on investments and assets and liabilities in foreign currencies | 136,820 | |
| Net Assets | $1,034,347 | |
| Calculation of Maximum Offering Price | ||
| Class A: | ||
| Net Asset Value and redemption price per share ($356,355 ÷ 20,539.91 shares) | $17.35 | |
| Maximum offering price per share (100/94.25 of $17.35) | $18.41 | |
| Class T: | ||
| Net Asset Value and redemption price per share ($371,725 ÷ 21,548.72 shares) | $17.25 | |
| Maximum offering price per share (100/96.50 of $17.25) | $17.88 | |
| Class B: | ||
| Net Asset Value and offering price per share ($6,495 ÷ 391.35 shares)(a) | $16.60 | |
| Class C: | ||
| Net Asset Value and offering price per share ($166,529 ÷ 10,075.72 shares)(a) | $16.53 | |
| Class I: | ||
| Net Asset Value, offering price and redemption price per share ($124,601 ÷ 6,878.03 shares) | $18.12 | |
| Class Z: | ||
| Net Asset Value, offering price and redemption price per share ($8,642 ÷ 470.82 shares) | $18.36 |
(a) Redemption price per share is equal to net asset value less any applicable contingent deferred sales charge.
See accompanying notes which are an integral part of the financial statements.
Statement of Operations
| Amounts in thousands | Year ended November 30, 2015 | |
| Investment Income | ||
| Dividends | $22,786 | |
| Interest | 24 | |
| Income from Fidelity Central Funds | 142 | |
| Total income | 22,952 | |
| Expenses | ||
| Management fee | ||
| Basic fee | $5,919 | |
| Performance adjustment | (594) | |
| Transfer agent fees | 2,234 | |
| Distribution and service plan fees | 4,715 | |
| Accounting and security lending fees | 355 | |
| Custodian fees and expenses | 39 | |
| Independent trustees' compensation | 5 | |
| Registration fees | 97 | |
| Audit | 63 | |
| Legal | 6 | |
| Miscellaneous | 7 | |
| Total expenses before reductions | 12,846 | |
| Expense reductions | (50) | 12,796 |
| Net investment income (loss) | 10,156 | |
| Realized and Unrealized Gain (Loss) | ||
| Net realized gain (loss) on: | ||
| Investment securities: | ||
| Unaffiliated issuers | 57,682 | |
| Foreign currency transactions | (25) | |
| Total net realized gain (loss) | 57,657 | |
| Change in net unrealized appreciation (depreciation) on: Investment securities | (74,642) | |
| Assets and liabilities in foreign currencies | 9 | |
| Total change in net unrealized appreciation (depreciation) | (74,633) | |
| Net gain (loss) | (16,976) | |
| Net increase (decrease) in net assets resulting from operations | $(6,820) |
See accompanying notes which are an integral part of the financial statements.
Statement of Changes in Net Assets
| Amounts in thousands | Year ended November 30, 2015 | Year ended November 30, 2014 |
| Increase (Decrease) in Net Assets | ||
| Operations | ||
| Net investment income (loss) | $10,156 | $11,692 |
| Net realized gain (loss) | 57,657 | 133,433 |
| Change in net unrealized appreciation (depreciation) | (74,633) | (1,155) |
| Net increase (decrease) in net assets resulting from operations | (6,820) | 143,970 |
| Distributions to shareholders from net investment income | (9,131) | (4,242) |
| Distributions to shareholders from net realized gain | (113,106) | (420) |
| Total distributions | (122,237) | (4,662) |
| Share transactions - net increase (decrease) | 43,684 | (80,124) |
| Total increase (decrease) in net assets | (85,373) | 59,184 |
| Net Assets | ||
| Beginning of period | 1,119,720 | 1,060,536 |
| End of period (including undistributed net investment income of $8,234 and undistributed net investment income of $9,131, respectively) | $1,034,347 | $1,119,720 |
See accompanying notes which are an integral part of the financial statements.
Financial Highlights — Fidelity Advisor Dividend Growth Fund Class A
| Years ended November 30, | 2015 | 2014 | 2013 | 2012 | 2011 |
| Selected Per–Share Data | |||||
| Net asset value, beginning of period | $19.65 | $17.23 | $13.33 | $11.45 | $11.58 |
| Income from Investment Operations | |||||
| Net investment income (loss)A | .20 | .23B | .13 | .07 | .02 |
| Net realized and unrealized gain (loss) | (.34)C | 2.29 | 3.87 | 1.81 | (.09) |
| Total from investment operations | (.14) | 2.52 | 4.00 | 1.88 | (.07) |
| Distributions from net investment income | (.19) | (.09) | (.10) | – | – |
| Distributions from net realized gain | (1.96) | (.01) | – | – | (.06) |
| Total distributions | (2.16)D | (.10) | (.10) | – | (.06) |
| Net asset value, end of period | $17.35 | $19.65 | $17.23 | $13.33 | $11.45 |
| Total ReturnE,F | (.41)%C | 14.70% | 30.26% | 16.42% | (.63)% |
| Ratios to Average Net AssetsG,H | |||||
| Expenses before reductions | 1.01% | .94% | .98% | 1.21% | 1.36% |
| Expenses net of fee waivers, if any | 1.00% | .94% | .98% | 1.21% | 1.33% |
| Expenses net of all reductions | 1.00% | .94% | .97% | 1.20% | 1.33% |
| Net investment income (loss) | 1.13% | 1.29%B | .87% | .53% | .16% |
| Supplemental Data | |||||
| Net assets, end of period (in millions) | $356 | $386 | $369 | $301 | $295 |
| Portfolio turnover rateI | 56% | 106% | 70% | 64% | 68% |
A Calculated based on average shares outstanding during the period.
B Investment income per share reflects a large, non-recurring dividend which amounted to $.04 per share. Excluding this non-recurring dividend, the ratio of net investment income (loss) to average net assets would have been 1.07%.
C Net realized and unrealized gain (loss) per share reflects proceeds received from litigation which amounted to $.02 per share. Excluding these litigation proceeds, the total return would have been (.51)%.
D Total distributions of $2.16 per share is comprised of distributions from net investment income of $.193 and distributions from net realized gain of $1.962 per share.
E Total returns would have been lower if certain expenses had not been reduced during the applicable periods shown.
F Total returns do not include the effect of the sales charges.
G Fees and expenses of any underlying Fidelity Central Funds are not included in the Fund's expense ratio. The Fund indirectly bears its proportionate share of the expenses of any underlying Fidelity Central Funds.
H Expense ratios reflect operating expenses of the class. Expenses before reductions do not reflect amounts reimbursed by the investment adviser or reductions from brokerage service arrangements or reductions from other expense offset arrangements and do not represent the amount paid by the class during periods when reimbursements or reductions occur. Expenses net of fee waivers reflect expenses after reimbursement by the investment adviser but prior to reductions from brokerage service arrangements or other expense offset arrangements. Expenses net of all reductions represent the net expenses paid by the class.
I Amount does not include the portfolio activity of any underlying Fidelity Central Funds.
See accompanying notes which are an integral part of the financial statements.
Financial Highlights — Fidelity Advisor Dividend Growth Fund Class T
| Years ended November 30, | 2015 | 2014 | 2013 | 2012 | 2011 |
| Selected Per–Share Data | |||||
| Net asset value, beginning of period | $19.55 | $17.15 | $13.26 | $11.42 | $11.55 |
| Income from Investment Operations | |||||
| Net investment income (loss)A | .15 | .19B | .10 | .04 | (.01) |
| Net realized and unrealized gain (loss) | (.34)C | 2.27 | 3.86 | 1.80 | (.09) |
| Total from investment operations | (.19) | 2.46 | 3.96 | 1.84 | (.10) |
| Distributions from net investment income | (.15) | (.06) | (.07) | – | – |
| Distributions from net realized gain | (1.96) | (.01) | – | – | (.03) |
| Total distributions | (2.11) | (.06)D | (.07) | – | (.03) |
| Net asset value, end of period | $17.25 | $19.55 | $17.15 | $13.26 | $11.42 |
| Total ReturnE,F | (.67)%C | 14.41% | 30.05% | 16.11% | (.90)% |
| Ratios to Average Net AssetsG,H | |||||
| Expenses before reductions | 1.24% | 1.18% | 1.20% | 1.42% | 1.57% |
| Expenses net of fee waivers, if any | 1.24% | 1.18% | 1.20% | 1.42% | 1.55% |
| Expenses net of all reductions | 1.24% | 1.17% | 1.19% | 1.42% | 1.54% |
| Net investment income (loss) | .89% | 1.05%B | .65% | .32% | (.06)% |
| Supplemental Data | |||||
| Net assets, end of period (in millions) | $372 | $412 | $375 | $304 | $294 |
| Portfolio turnover rateI | 56% | 106% | 70% | 64% | 68% |
A Calculated based on average shares outstanding during the period.
B Investment income per share reflects a large non-recurring dividend which amounted to $.04 per share. Excluding this non-recurring dividend, the ratio of net investment income (loss) to average net assets would have been .83%.
C Net realized and unrealized gain (loss) per share reflects proceeds received from litigation which amounted to $.02 per share. Excluding these litigation proceeds, the total return would have been (.77)%.
D Total distributions of $.06 per share is comprised of distributions from net investment income of $.055 and distributions from net realized gain of $.007 per share.
E Total returns would have been lower if certain expenses had not been reduced during the applicable periods shown.
F Total returns do not include the effect of the sales charges.
G Fees and expenses of any underlying Fidelity Central Funds are not included in the Fund's expense ratio. The Fund indirectly bears its proportionate share of the expenses of any underlying Fidelity Central Funds.
H Expense ratios reflect operating expenses of the class. Expenses before reductions do not reflect amounts reimbursed by the investment adviser or reductions from brokerage service arrangements or reductions from other expense offset arrangements and do not represent the amount paid by the class during periods when reimbursements or reductions occur. Expenses net of fee waivers reflect expenses after reimbursement by the investment adviser but prior to reductions from brokerage service arrangements or other expense offset arrangements. Expenses net of all reductions represent the net expenses paid by the class.
I Amount does not include the portfolio activity of any underlying Fidelity Central Funds.
See accompanying notes which are an integral part of the financial statements.
Financial Highlights — Fidelity Advisor Dividend Growth Fund Class B
| Years ended November 30, | 2015 | 2014 | 2013 | 2012 | 2011 |
| Selected Per–Share Data | |||||
| Net asset value, beginning of period | $18.84 | $16.57 | $12.82 | $11.11 | $11.26 |
| Income from Investment Operations | |||||
| Net investment income (loss)A | .05 | .08B | .01 | (.03) | (.07) |
| Net realized and unrealized gain (loss) | (.32)C | 2.20 | 3.74 | 1.74 | (.08) |
| Total from investment operations | (.27) | 2.28 | 3.75 | 1.71 | (.15) |
| Distributions from net investment income | (.01) | – | – | – | – |
| Distributions from net realized gain | (1.96) | (.01) | – | – | – |
| Total distributions | (1.97) | (.01) | – | – | – |
| Net asset value, end of period | $16.60 | $18.84 | $16.57 | $12.82 | $11.11 |
| Total ReturnD,E | (1.20)%C | 13.75% | 29.25% | 15.39% | (1.33)% |
| Ratios to Average Net AssetsF,G | |||||
| Expenses before reductions | 1.84% | 1.78% | 1.79% | 1.99% | 2.14% |
| Expenses net of fee waivers, if any | 1.84% | 1.78% | 1.79% | 1.99% | 2.09% |
| Expenses net of all reductions | 1.84% | 1.78% | 1.78% | 1.99% | 2.09% |
| Net investment income (loss) | .29% | .45%B | .06% | (.25)% | (.61)% |
| Supplemental Data | |||||
| Net assets, end of period (in millions) | $6 | $11 | $15 | $17 | $22 |
| Portfolio turnover rateH | 56% | 106% | 70% | 64% | 68% |
A Calculated based on average shares outstanding during the period.
B Investment income per share reflects a large, non-recurring dividend which amounted to $.04 per share. Excluding this non-recurring dividend, the ratio of net investment income (loss) to average net assets would have been .23%.
C Net realized and unrealized gain (loss) per share reflects proceeds received from litigation which amounted to $.02 per share. Excluding these litigation proceeds, the total return would have been (1.30)%.
D Total returns would have been lower if certain expenses had not been reduced during the applicable periods shown.
E Total returns do not include the effect of the contingent deferred sales charge.
F Fees and expenses of any underlying Fidelity Central Funds are not included in the Fund's expense ratio. The Fund indirectly bears its proportionate share of the expenses of any underlying Fidelity Central Funds.
G Expense ratios reflect operating expenses of the class. Expenses before reductions do not reflect amounts reimbursed by the investment adviser or reductions from brokerage service arrangements or reductions from other expense offset arrangements and do not represent the amount paid by the class during periods when reimbursements or reductions occur. Expenses net of fee waivers reflect expenses after reimbursement by the investment adviser but prior to reductions from brokerage service arrangements or other expense offset arrangements. Expenses net of all reductions represent the net expenses paid by the class.
H Amount does not include the portfolio activity of any underlying Fidelity Central Funds.
See accompanying notes which are an integral part of the financial statements.
Financial Highlights — Fidelity Advisor Dividend Growth Fund Class C
| Years ended November 30, | 2015 | 2014 | 2013 | 2012 | 2011 |
| Selected Per–Share Data | |||||
| Net asset value, beginning of period | $18.82 | $16.54 | $12.79 | $11.07 | $11.22 |
| Income from Investment Operations | |||||
| Net investment income (loss)A | .06 | .09B | .02 | (.02) | (.07) |
| Net realized and unrealized gain (loss) | (.32)C | 2.20 | 3.73 | 1.74 | (.08) |
| Total from investment operations | (.26) | 2.29 | 3.75 | 1.72 | (.15) |
| Distributions from net investment income | (.06) | – | – | – | – |
| Distributions from net realized gain | (1.96) | (.01) | – | – | – |
| Total distributions | (2.03)D | (.01) | – | – | – |
| Net asset value, end of period | $16.53 | $18.82 | $16.54 | $12.79 | $11.07 |
| Total ReturnE,F | (1.16)%C | 13.83% | 29.36% | 15.54% | (1.34)% |
| Ratios to Average Net AssetsG,H | |||||
| Expenses before reductions | 1.76% | 1.69% | 1.72% | 1.94% | 2.08% |
| Expenses net of fee waivers, if any | 1.76% | 1.69% | 1.72% | 1.94% | 2.06% |
| Expenses net of all reductions | 1.76% | 1.69% | 1.71% | 1.93% | 2.05% |
| Net investment income (loss) | .37% | .54%B | .13% | (.20)% | (.57)% |
| Supplemental Data | |||||
| Net assets, end of period (in millions) | $167 | $179 | $160 | $123 | $124 |
| Portfolio turnover rateI | 56% | 106% | 70% | 64% | 68% |
A Calculated based on average shares outstanding during the period.
B Investment income per share reflects a large, non-recurring dividend which amounted to $.04 per share. Excluding this non-recurring dividend, the ratio of net investment income (loss) to average net assets would have been .32%.
C Net realized and unrealized gain (loss) per share reflects proceeds received from litigation which amounted to $.02 per share. Excluding these litigation proceeds, the total return would have been (1.26)%.
D Total distributions of $2.03 per share is comprised of distributions from net investment income of $.064 and distributions from net realized gain of $1.962 per share.
E Total returns would have been lower if certain expenses had not been reduced during the applicable periods shown.
F Total returns do not include the effect of the contingent deferred sales charge.
G Fees and expenses of any underlying Fidelity Central Funds are not included in the Fund's expense ratio. The Fund indirectly bears its proportionate share of the expenses of any underlying Fidelity Central Funds.
H Expense ratios reflect operating expenses of the class. Expenses before reductions do not reflect amounts reimbursed by the investment adviser or reductions from brokerage service arrangements or reductions from other expense offset arrangements and do not represent the amount paid by the class during periods when reimbursements or reductions occur. Expenses net of fee waivers reflect expenses after reimbursement by the investment adviser but prior to reductions from brokerage service arrangements or other expense offset arrangements. Expenses net of all reductions represent the net expenses paid by the class.
I Amount does not include the portfolio activity of any underlying Fidelity Central Funds.
See accompanying notes which are an integral part of the financial statements.
Financial Highlights — Fidelity Advisor Dividend Growth Fund Class I
| Years ended November 30, | 2015 | 2014 | 2013 | 2012 | 2011 |
| Selected Per–Share Data | |||||
| Net asset value, beginning of period | $20.42 | $17.91 | $13.86 | $11.88 | $12.00 |
| Income from Investment Operations | |||||
| Net investment income (loss)A | .25 | .29B | .18 | .11 | .06 |
| Net realized and unrealized gain (loss) | (.35)C | 2.37 | 4.02 | 1.87 | (.09) |
| Total from investment operations | (.10) | 2.66 | 4.20 | 1.98 | (.03) |
| Distributions from net investment income | (.24) | (.14) | (.15) | – | (.02) |
| Distributions from net realized gain | (1.96) | (.01) | – | – | (.07) |
| Total distributions | (2.20) | (.15) | (.15) | – | (.09) |
| Net asset value, end of period | $18.12 | $20.42 | $17.91 | $13.86 | $11.88 |
| Total ReturnD | (.14)%C | 14.99% | 30.63% | 16.67% | (.33)% |
| Ratios to Average Net AssetsE,F | |||||
| Expenses before reductions | .76% | .69% | .70% | .91% | 1.04% |
| Expenses net of fee waivers, if any | .76% | .69% | .70% | .91% | 1.03% |
| Expenses net of all reductions | .76% | .69% | .69% | .90% | 1.02% |
| Net investment income (loss) | 1.37% | 1.54%B | 1.15% | .83% | .46% |
| Supplemental Data | |||||
| Net assets, end of period (in millions) | $125 | $131 | $135 | $103 | $83 |
| Portfolio turnover rateG | 56% | 106% | 70% | 64% | 68% |
A Calculated based on average shares outstanding during the period.
B Investment income per share reflects a large, non-recurring dividend which amounted to $.04 per share. Excluding this non-recurring dividend, the ratio of net investment income (loss) to average net assets would have been 1.32%.
C Net realized and unrealized gain (loss) per share reflects proceeds received from litigation which amounted to $.02 per share. Excluding these litigation proceeds, the total return would have been (.24)%.
D Total returns would have been lower if certain expenses had not been reduced during the applicable periods shown.
E Fees and expenses of any underlying Fidelity Central Funds are not included in the Fund's expense ratio. The Fund indirectly bears its proportionate share of the expenses of any underlying Fidelity Central Funds.
F Expense ratios reflect operating expenses of the class. Expenses before reductions do not reflect amounts reimbursed by the investment adviser or reductions from brokerage service arrangements or reductions from other expense offset arrangements and do not represent the amount paid by the class during periods when reimbursements or reductions occur. Expenses net of fee waivers reflect expenses after reimbursement by the investment adviser but prior to reductions from brokerage service arrangements or other expense offset arrangements. Expenses net of all reductions represent the net expenses paid by the class.
G Amount does not include the portfolio activity of any underlying Fidelity Central Funds.
See accompanying notes which are an integral part of the financial statements.
Financial Highlights — Fidelity Advisor Dividend Growth Fund Class Z
| Years ended November 30, | 2015 | 2014 | 2013 A |
| Selected Per–Share Data | |||
| Net asset value, beginning of period | $20.44 | $17.92 | $16.59 |
| Income from Investment Operations | |||
| Net investment income (loss)B | .28 | .31C | .06 |
| Net realized and unrealized gain (loss) | (.35)D | 2.38 | 1.27 |
| Total from investment operations | (.07) | 2.69 | 1.33 |
| Distributions from net investment income | (.05) | (.17) | – |
| Distributions from net realized gain | (1.96) | (.01) | – |
| Total distributions | (2.01) | (.17)E | – |
| Net asset value, end of period | $18.36 | $20.44 | $17.92 |
| Total ReturnF,G | (.01)%D | 15.20% | 8.02% |
| Ratios to Average Net AssetsH,I | |||
| Expenses before reductions | .59% | .52% | .54%J |
| Expenses net of fee waivers, if any | .59% | .52% | .54%J |
| Expenses net of all reductions | .59% | .52% | .52%J |
| Net investment income (loss) | 1.54% | 1.71%C | 1.26%J |
| Supplemental Data | |||
| Net assets, end of period (000 omitted) | $8,642 | $118 | $7,394 |
| Portfolio turnover rateK | 56% | 106% | 70% |
A For the period August 13, 2013 (commencement of sale of shares) to November 30, 2013.
B Calculated based on average shares outstanding during the period.
C Investment income per share reflects a large, non-recurring dividend which amounted to $.04 per share. Excluding this non-recurring dividend, the ratio of net investment income (loss) to average net assets would have been 1.49%.
D Net realized and unrealized gain (loss) per share reflects proceeds received from litigation which amounted to $.02 per share. Excluding these litigation proceeds, the total return would have been (.11)%.
E Total distributions of $.17 per share is comprised of distributions from net investment income of $.166 and distributions from net realized gain of $.007 per share.
F Total returns for periods of less than one year are not annualized.
G Total returns would have been lower if certain expenses had not been reduced during the applicable periods shown.
H Fees and expenses of any underlying Fidelity Central Funds are not included in the Fund's expense ratio. The Fund indirectly bears its proportionate share of the expenses of any underlying Fidelity Central Funds.
I Expense ratios reflect operating expenses of the class. Expenses before reductions do not reflect amounts reimbursed by the investment adviser or reductions from brokerage service arrangements or reductions from other expense offset arrangements and do not represent the amount paid by the class during periods when reimbursements or reductions occur. Expense ratios before reductions for start-up periods may not be representative of longer-term operating periods. Expenses net of fee waivers reflect expenses after reimbursement by the investment adviser but prior to reductions from brokerage service arrangements or other expense offset arrangements. Expenses net of all reductions represent the net expenses paid by the class.
J Annualized
K Amount does not include the portfolio activity of any underlying Fidelity Central Funds.
See accompanying notes which are an integral part of the financial statements.
Notes to Financial Statements
For the period ended November 30, 2015
(Amounts in thousands except percentages)
1. Organization.
Fidelity Advisor Dividend Growth Fund (the Fund) is a fund of Fidelity Advisor Series I (the Trust) and is authorized to issue an unlimited number of shares. The Trust is registered under the Investment Company Act of 1940, as amended (the 1940 Act), as an open-end management investment company organized as a Massachusetts business trust. The Fund offers Class A, Class T, Class C, Class I (formerly Institutional Class) and Class Z shares, each of which, along with Class B shares, has equal rights as to assets and voting privileges. Class B shares are closed to new accounts and additional purchases, except for exchanges and reinvestments. Each class has exclusive voting rights with respect to matters that affect that class. Class B shares will automatically convert to Class A shares after a holding period of seven years from the initial date of purchase.
2. Investments in Fidelity Central Funds.
The Fund invests in Fidelity Central Funds, which are open-end investment companies generally available only to other investment companies and accounts managed by the investment adviser and its affiliates. The Fund's Schedule of Investments lists each of the Fidelity Central Funds held as of period end, if any, as an investment of the Fund, but does not include the underlying holdings of each Fidelity Central Fund. As an Investing Fund, the Fund indirectly bears its proportionate share of the expenses of the underlying Fidelity Central Funds.
The Money Market Central Funds seek preservation of capital and current income and are managed by Fidelity Investments Money Management, Inc. (FIMM), an affiliate of the investment adviser. Annualized expenses of the Money Market Central Funds as of their most recent shareholder report date are less than .005%.
A complete unaudited list of holdings for each Fidelity Central Fund is available upon request or at the Securities and Exchange Commission (the SEC) website at www.sec.gov. In addition, the financial statements of the Fidelity Central Funds, which are not covered by the Fund's Report of Independent Registered Public Accounting Firm, are available on the SEC website or upon request.
3. Significant Accounting Policies.
The financial statements have been prepared in conformity with accounting principles generally accepted in the United States of America (GAAP), which require management to make certain estimates and assumptions at the date of the financial statements. Actual results could differ from those estimates. Subsequent events, if any, through the date that the financial statements were issued have been evaluated in the preparation of the financial statements. The following summarizes the significant accounting policies of the Fund:
Investment Valuation. Investments are valued as of 4:00 p.m. Eastern time on the last calendar day of the period. The Board of Trustees (the Board) has delegated the day to day responsibility for the valuation of the Fund's investments to the Fidelity Management & Research Company (FMR) Fair Value Committee (the Committee). In accordance with valuation policies and procedures approved by the Board, the Fund attempts to obtain prices from one or more third party pricing vendors or brokers to value its investments. When current market prices, quotations or currency exchange rates are not readily available or reliable, investments will be fair valued in good faith by the Committee, in accordance with procedures adopted by the Board. Factors used in determining fair value vary by investment type and may include market or investment specific events, changes in interest rates and credit quality. The frequency with which these procedures are used cannot be predicted and they may be utilized to a significant extent. The Committee oversees the Fund's valuation policies and procedures and reports to the Board on the Committee's activities and fair value determinations. The Board monitors the appropriateness of the procedures used in valuing the Fund's investments and ratifies the fair value determinations of the Committee.
The Fund categorizes the inputs to valuation techniques used to value its investments into a disclosure hierarchy consisting of three levels as shown below:
- Level 1 – quoted prices in active markets for identical investments
- Level 2 – other significant observable inputs (including quoted prices for similar investments, interest rates, prepayment speeds, etc.)
- Level 3 – unobservable inputs (including the Fund's own assumptions based on the best information available)
Valuation techniques used to value the Fund's investments by major category are as follows:
Equity securities, including restricted securities, for which market quotations are readily available, are valued at the last reported sale price or official closing price as reported by a third party pricing vendor on the primary market or exchange on which they are traded and are categorized as Level 1 in the hierarchy. In the event there were no sales during the day or closing prices are not available, securities are valued at the last quoted bid price or may be valued using the last available price and are generally categorized as Level 2 in the hierarchy. For foreign equity securities, when market or security specific events arise, comparisons to the valuation of American Depositary Receipts (ADRs), futures contracts, Exchange-Traded Funds (ETFs) and certain indexes as well as quoted prices for similar securities may be used and would be categorized as Level 2 in the hierarchy. Utilizing these techniques may result in transfers between Level 1 and Level 2. For equity securities, including restricted securities, where observable inputs are limited, assumptions about market activity and risk are used and these securities may be categorized as Level 3 in the hierarchy.
Debt securities, including restricted securities, are valued based on evaluated prices received from third party pricing vendors or from brokers who make markets in such securities. Corporate bonds are valued by pricing vendors who utilize matrix pricing which considers yield or price of bonds of comparable quality, coupon, maturity and type or by broker-supplied prices. When independent prices are unavailable or unreliable, debt securities may be valued utilizing pricing methodologies which consider similar factors that would be used by third party pricing vendors. Debt securities are generally categorized as Level 2 in the hierarchy but may be Level 3 depending on the circumstances.
Investments in open-end mutual funds, including the Fidelity Central Funds, are valued at their closing net asset value (NAV) each business day and are categorized as Level 1 in the hierarchy.
Changes in valuation techniques may result in transfers in or out of an assigned level within the disclosure hierarchy. The aggregate value of investments by input level as of November 30, 2015 is included at the end of the Fund's Schedule of Investments.
Foreign Currency. The Fund may use foreign currency contracts to facilitate transactions in foreign-denominated securities. Gains and losses from these transactions may arise from changes in the value of the foreign currency or if the counterparties do not perform under the contracts' terms.
Foreign-denominated assets, including investment securities, and liabilities are translated into U.S. dollars at the exchange rates at period end. Purchases and sales of investment securities, income and dividends received and expenses denominated in foreign currencies are translated into U.S. dollars at the exchange rate in effect on the transaction date.
The effects of exchange rate fluctuations on investments are included with the net realized and unrealized gain (loss) on investment securities. Other foreign currency transactions resulting in realized and unrealized gain (loss) are disclosed separately.
Investment Transactions and Income. For financial reporting purposes, the Fund's investment holdings and NAV include trades executed through the end of the last business day of the period. The NAV per share for processing shareholder transactions is calculated as of the close of business of the New York Stock Exchange (NYSE), normally 4:00 p.m. Eastern time and includes trades executed through the end of the prior business day. Gains and losses on securities sold are determined on the basis of identified cost and may include proceeds received from litigation. Dividend income is recorded on the ex-dividend date, except for certain dividends from foreign securities where the ex-dividend date may have passed, which are recorded as soon as the Fund is informed of the ex-dividend date. Non-cash dividends included in dividend income, if any, are recorded at the fair market value of the securities received. Income and capital gain distributions from Fidelity Central Funds, if any, are recorded on the ex-dividend date. Distributions received on securities that represent a return of capital or capital gain are recorded as a reduction of cost of investments and/or as a realized gain. Subsequent to ex-dividend date the Fund determines the components of these distributions, based upon receipt of tax filings or other correspondence relating to the underlying investment. Interest income is accrued as earned and includes coupon interest and amortization of premium and accretion of discount on debt securities as applicable. Investment income is recorded net of foreign taxes withheld where recovery of such taxes is uncertain.
Class Allocations and Expenses. Investment income, realized and unrealized capital gains and losses, common expenses of the Fund, and certain fund-level expense reductions, if any, are allocated daily on a pro-rata basis to each class based on the relative net assets of each class to the total net assets of the Fund. Each class differs with respect to transfer agent and distribution and service plan fees incurred. Certain expense reductions may also differ by class. For the reporting period, the allocated portion of income and expenses to each class as a percent of its average net assets may vary due to the timing of recording these transactions in relation to fluctuating net assets of the classes. Expenses directly attributable to a fund are charged to that fund. Expenses attributable to more than one fund are allocated among the respective funds on the basis of relative net assets or other appropriate methods. Expense estimates are accrued in the period to which they relate and adjustments are made when actual amounts are known.
Income Tax Information and Distributions to Shareholders. Each year, the Fund intends to qualify as a regulated investment company under Subchapter M of the Internal Revenue Code, including distributing substantially all of its taxable income and realized gains. As a result, no provision for U.S. Federal income taxes is required. As of November 30, 2015, the Fund did not have any unrecognized tax benefits in the financial statements; nor is the Fund aware of any tax positions for which it is reasonably possible that the total amounts of unrecognized tax benefits will significantly change in the next twelve months. The Fund files a U.S. federal tax return, in addition to state and local tax returns as required. The Fund's federal income tax returns are subject to examination by the Internal Revenue Service (IRS) for a period of three fiscal years after they are filed. State and local tax returns may be subject to examination for an additional fiscal year depending on the jurisdiction. Foreign taxes are provided for based on the Fund's understanding of the tax rules and rates that exist in the foreign markets in which it invests.
Distributions are declared and recorded on the ex-dividend date. Income dividends and capital gain distributions are declared separately for each class. Income and capital gain distributions are determined in accordance with income tax regulations, which may differ from GAAP. In addition, the Fund claimed a portion of the payment made to redeeming shareholders as a distribution for income tax purposes.
Capital accounts within the financial statements are adjusted for permanent book-tax differences. These adjustments have no impact on net assets or the results of operations. Capital accounts are not adjusted for temporary book-tax differences which will reverse in a subsequent period.
Book-tax differences are primarily due to foreign currency transactions, partnerships and losses deferred due to wash sales and excise tax regulations.
The federal tax cost of investment securities and unrealized appreciation (depreciation) as of period end were as follows:
| Gross unrealized appreciation | $179,987 |
| Gross unrealized depreciation | (44,962) |
| Net unrealized appreciation (depreciation) on securities | $135,025 |
| Tax Cost | $903,588 |
The tax-based components of distributable earnings as of period end were as follows:
| Undistributed ordinary income | $8,234 |
| Undistributed long-term capital gain | $56,258 |
| Net unrealized appreciation (depreciation) on securities and other investments | $135,022 |
The fund intends to elect to defer to its next fiscal year $4,451 of capital loss recognized during the period November 1, 2015 to November 30, 2015.
The tax character of distributions paid was as follows:
| November 30, 2015 | November 30, 2014 | |
| Ordinary Income | $23,853 | $ 4,242 |
| Long-term Capital Gains | 98,384 | 420 |
| Total | $122,237 | $ 4,662 |
Restricted Securities. The Fund may invest in securities that are subject to legal or contractual restrictions on resale. These securities generally may be resold in transactions exempt from registration or to the public if the securities are registered. Disposal of these securities may involve time-consuming negotiations and expense, and prompt sale at an acceptable price may be difficult. Information regarding restricted securities is included at the end of the Fund's Schedule of Investments.
4. Purchases and Sales of Investments.
Purchases and sales of securities, other than short-term securities, aggregated $583,377 and $642,751, respectively.
5. Fees and Other Transactions with Affiliates.
Management Fee. Fidelity Management & Research Company (the investment adviser) and its affiliates provide the Fund with investment management related services for which the Fund pays a monthly management fee. The management fee is the sum of an individual fund fee rate that is based on an annual rate of .30% of the Fund's average net assets and an annualized group fee rate that averaged .25% during the period. The group fee rate is based upon the average net assets of all the mutual funds advised by the investment adviser, including any mutual funds previously advised by the investment adviser that are currently advised by Fidelity SelectCo, LLC, an affiliate of the investment adviser. The group fee rate decreases as assets under management increase and increases as assets under management decrease. In addition, the management fee is subject to a performance adjustment (up to a maximum of +/- .20% of the Fund's average net assets over a 36 month performance period). The upward or downward adjustment to the management fee is based on Class I of the Fund as compared to its benchmark index, the S&P 500 Index, over the same 36 month performance period. For the reporting period, the total annual management fee rate, including the performance adjustment, was .49% of the Fund's average net assets. The performance adjustment included in the management fee rate may be higher or lower than the maximum performance adjustment rate due to the difference between the average net assets for the reporting and performance periods.
Distribution and Service Plan Fees. In accordance with Rule 12b-1 of the 1940 Act, the Fund has adopted separate Distribution and Service Plans for each class of shares. Certain classes pay Fidelity Distributors Corporation (FDC), an affiliate of the investment adviser, separate Distribution and Service Fees, each of which is based on an annual percentage of each class' average net assets. In addition, FDC may pay financial intermediaries for selling shares of the Fund and providing shareholder support services. For the period, the Distribution and Service Fee rates, total fees and amounts retained by FDC were as follows:
| Distribution Fee | Service Fee | Total Fees | Retained by FDC | |
| Class A | -% | .25% | $920 | $6 |
| Class T | .25% | .25% | 1,972 | 5 |
| Class B | .75% | .25% | 87 | 66 |
| Class C | .75% | .25% | 1,736 | 114 |
| $4,715 | $191 |
Sales Load. FDC may receive a front-end sales charge of up to 5.75% for selling Class A shares and 3.50% for selling Class T shares, some of which is paid to financial intermediaries for selling shares of the Fund. Depending on the holding period, FDC may receive contingent deferred sales charges levied on Class A, Class T, Class B, and Class C redemptions. The deferred sales charges range from 5.00% to 1.00% for Class B shares, 1.00% for Class C shares, 1.00% for certain purchases of Class A shares and .25% for certain purchases of Class T shares.
For the period, sales charge amounts retained by FDC were as follows:
| Retained by FDC | |
| Class A | $115 |
| Class T | 18 |
| Class B(a) | 3 |
| Class C(a) | 12 |
| $148 |
(a) When Class B and Class C shares are initially sold, FDC pays commissions from its own resources to financial intermediaries through which the sales are made.
Transfer Agent Fees. Fidelity Investments Institutional Operations Company, Inc., (FIIOC), an affiliate of the investment adviser, is the transfer, dividend disbursing and shareholder servicing agent for each class of the Fund. FIIOC receives account fees and asset-based fees that vary according to the account size and type of account of the shareholders of the respective classes of the Fund, except for Class Z. FIIOC receives an asset-based fee of Class Z's average net assets. FIIOC pays for typesetting, printing and mailing of shareholder reports, except proxy statements.
For the period, transfer agent fees for each class were as follows:
| Amount | % of Class-Level Average Net Assets | |
| Class A | $775 | .21 |
| Class T | 777 | .20 |
| Class B | 26 | .30 |
| Class C | 374 | .22 |
| Class I | 279 | .22 |
| Class Z | 3 | .05 |
| $2,234 |
Accounting and Security Lending Fees. Fidelity Service Company, Inc. (FSC), an affiliate of the investment adviser, maintains the Fund's accounting records. The accounting fee is based on the level of average net assets for each month. Under a separate contract, FSC administers the security lending program. The security lending fee is based on the number and duration of lending transactions.
Brokerage Commissions. The Fund placed a portion of its portfolio transactions with brokerage firms which are affiliates of the investment adviser. Brokerage commissions are included in net realized gain (loss) and change in net unrealized appreciation (depreciation) in the Statement of Operations. The commissions paid to these affiliated firms were $10 for the period.
6. Committed Line of Credit.
The Fund participates with other funds managed by the investment adviser or an affiliate in a $4.25 billion credit facility (the "line of credit") to be utilized for temporary or emergency purposes to fund shareholder redemptions or for other short-term liquidity purposes. The Fund has agreed to pay commitment fees on its pro-rata portion of the line of credit, which amounted to $2 and is reflected in Miscellaneous expenses on the Statement of Operations. During the period, the Fund did not borrow on this line of credit.
7. Security Lending.
The Fund lends portfolio securities through a lending agent from time to time in order to earn additional income. For equity securities, a lending agent is used and may loan securities to certain qualified borrowers, including Fidelity Capital Markets (FCM), a broker-dealer affiliated with the Fund. On the settlement date of the loan, the Fund receives collateral (in the form of U.S. Treasury obligations, letters of credit and/or cash) against the loaned securities and maintains collateral in an amount not less than 100% of the market value of the loaned securities during the period of the loan. The market value of the loaned securities is determined at the close of business of the Fund and any additional required collateral is delivered to the Fund on the next business day. The Fund or borrower may terminate the loan at any time, and if the borrower defaults on its obligation to return the securities loaned because of insolvency or other reasons, the Fund may apply collateral received from the borrower against the obligation. The Fund may experience delays and costs in recovering the securities loaned. Any cash collateral received is invested in the Fidelity Securities Lending Cash Central Fund. The value of loaned securities and cash collateral at period end are disclosed on the Fund's Statement of Assets and Liabilities. At period end, there were no security loans outstanding with FCM. Security lending income represents the income earned on investing cash collateral, less rebates paid to borrowers and any lending agent fees associated with the loan, plus any premium payments received for lending certain types of securities. Security lending income is presented in the Statement of Operations as a component of income from Fidelity Central Funds. Total security lending income during the period amounted to $89, including less than five hundred dollars from securities loaned to FCM.
8. Expense Reductions.
Commissions paid to certain brokers with whom the investment adviser, or its affiliates, places trades on behalf of the Fund include an amount in addition to trade execution, which may be rebated back to the Fund to offset certain expenses. This amount totaled $24 for the period.
In addition, during the period the investment adviser reimbursed and/or waived a portion of fund-level operating expenses in the amount of $4 and a portion of class-level operating expenses as follows:
| Amount | |
| Class A | $8 |
| Class T | 8 |
| Class B | –(a) |
| Class C | 4 |
| Class I | 2 |
| $22 |
(a) In the amount of less than five hundred dollars.
9. Distributions to Shareholders.
Distributions to shareholders of each class were as follows:
| Years ended November 30, | 2015 | 2014 |
| From net investment income | ||
| Class A | $3,806 | $1,902 |
| Class T | 3,175 | 1,201 |
| Class B | 5 | – |
| Class C | 609 | – |
| Class I | 1,536 | 1,071 |
| Class Z | –(a) | 68 |
| Total | $9,131 | $4,242 |
| From net realized gain | ||
| Class A | $38,921 | $147 |
| Class T | 41,529 | 152 |
| Class B | 1,164 | 6 |
| Class C | 18,788 | 68 |
| Class I | 12,693 | 44 |
| Class Z | 11 | 3 |
| Total | $113,106 | $420 |
(a) In the amount of less than five hundred dollars.
10. Share Transactions.
Share transactions for each class were as follows and may contain automatic conversions between classes or exchanges between funds:
| Shares | Shares | Dollars | Dollars | |
| Years ended November 30, | 2015 | 2014 | 2015 | 2014 |
| Class A | ||||
| Shares sold | 2,750 | 2,553 | $48,068 | $46,007 |
| Reinvestment of distributions | 2,322 | 107 | 39,381 | 1,806 |
| Shares redeemed | (4,182) | (4,408) | (72,975) | (79,256) |
| Net increase (decrease) | 890 | (1,748) | $14,474 | $(31,443) |
| Class T | ||||
| Shares sold | 3,861 | 3,910 | $67,241 | $70,377 |
| Reinvestment of distributions | 2,576 | 77 | 43,556 | 1,302 |
| Shares redeemed | (5,958) | (4,771) | (103,477) | (85,489) |
| Net increase (decrease) | 479 | (784) | $7,320 | $(13,810) |
| Class B | ||||
| Shares sold | 11 | 29 | $199 | $480 |
| Reinvestment of distributions | 68 | – | 1,105 | 5 |
| Shares redeemed | (286) | (319) | (4,794) | (5,509) |
| Net increase (decrease) | (207) | (290) | $(3,490) | $(5,024) |
| Class C | ||||
| Shares sold | 1,178 | 1,183 | $19,680 | $20,503 |
| Reinvestment of distributions | 1,033 | 3 | 16,812 | 58 |
| Shares redeemed | (1,654) | (1,331) | (27,529) | (23,161) |
| Net increase (decrease) | 557 | (145) | $8,963 | $(2,600) |
| Class I | ||||
| Shares sold | 1,619 | 1,479 | $29,609 | $27,537 |
| Reinvestment of distributions | 752 | 59 | 13,280 | 1,027 |
| Shares redeemed | (1,918) | (2,664) | (35,222) | (48,359) |
| Net increase (decrease) | 453 | (1,126) | $7,667 | $(19,795) |
| Class Z | ||||
| Shares sold | 511 | 23 | $9,593 | $420 |
| Reinvestment of distributions | 1 | 4 | 11 | 71 |
| Shares redeemed | (47) | (434) | (854) | (7,943) |
| Net increase (decrease) | 465 | (407) | $8,750 | $(7,452) |
11. Other.
The Fund's organizational documents provide former and current trustees and officers with a limited indemnification against liabilities arising in connection with the performance of their duties to the Fund. In the normal course of business, the Fund may also enter into contracts that provide general indemnifications. The Fund's maximum exposure under these arrangements is unknown as this would be dependent on future claims that may be made against the Fund. The risk of material loss from such claims is considered remote.
Report of Independent Registered Public Accounting Firm
To the Trustees of Fidelity Advisor Series I and Shareholders of Fidelity Advisor® Dividend Growth Fund:
In our opinion, the accompanying statement of assets and liabilities, including the schedule of investments, and the related statements of operations and of changes in net assets and the financial highlights present fairly, in all material respects, the financial position of Fidelity Advisor® Dividend Growth Fund (a fund of Fidelity Advisor Series I) at November 30, 2015, the results of its operations for the year then ended, the changes in its net assets for each of the two years in the period then ended and the financial highlights for each of the periods indicated, in conformity with accounting principles generally accepted in the United States of America. These financial statements and financial highlights (hereafter referred to as “financial statements”) are the responsibility of the Fidelity Advisor® Dividend Growth Fund’s management. Our responsibility is to express an opinion on these financial statements based on our audits. We conducted our audits of these financial statements in accordance with the standards of the Public Company Accounting Oversight Board (United States). Those standards require that we plan and perform the audit to obtain reasonable assurance about whether the financial statements are free of material misstatement. An audit includes examining, on a test basis, evidence supporting the amounts and disclosures in the financial statements, assessing the accounting principles used and significant estimates made by management, and evaluating the overall financial statement presentation. We believe that our audits, which included confirmation of securities at November 30, 2015 by correspondence with the custodian and brokers, provide a reasonable basis for our opinion.
PricewaterhouseCoopers LLP
Boston, Massachusetts
January 19, 2016
Trustees and Officers
The Trustees, Members of the Advisory Board (if any), and officers of the trust and fund, as applicable, are listed below. The Board of Trustees governs the fund and is responsible for protecting the interests of shareholders. The Trustees are experienced executives who meet periodically throughout the year to oversee the fund's activities, review contractual arrangements with companies that provide services to the fund, oversee management of the risks associated with such activities and contractual arrangements, and review the fund's performance. Each of the Trustees oversees 170 funds.
The Trustees hold office without limit in time except that (a) any Trustee may resign; (b) any Trustee may be removed by written instrument, signed by at least two-thirds of the number of Trustees prior to such removal; (c) any Trustee who requests to be retired or who has become incapacitated by illness or injury may be retired by written instrument signed by a majority of the other Trustees; and (d) any Trustee may be removed at any special meeting of shareholders by a two-thirds vote of the outstanding voting securities of the trust. Each Trustee who is not an interested person (as defined in the 1940 Act) of the trust and the fund is referred to herein as an Independent Trustee. Each Independent Trustee shall retire not later than the last day of the calendar year in which his or her 75th birthday occurs. The Independent Trustees may waive this mandatory retirement age policy with respect to individual Trustees. Officers and Advisory Board Members hold office without limit in time, except that any officer or Advisory Board Member may resign or may be removed by a vote of a majority of the Trustees at any regular meeting or any special meeting of the Trustees. Except as indicated, each individual has held the office shown or other offices in the same company for the past five years.
The fund’s Statement of Additional Information (SAI) includes more information about the Trustees. To request a free copy, call Fidelity at 1-877-208-0098.
Experience, Skills, Attributes, and Qualifications of the Trustees. The Governance and Nominating Committee has adopted a statement of policy that describes the experience, qualifications, attributes, and skills that are necessary and desirable for potential Independent Trustee candidates (Statement of Policy). The Board believes that each Trustee satisfied at the time he or she was initially elected or appointed a Trustee, and continues to satisfy, the standards contemplated by the Statement of Policy. The Governance and Nominating Committee also engages professional search firms to help identify potential Independent Trustee candidates who have the experience, qualifications, attributes, and skills consistent with the Statement of Policy. From time to time, additional criteria based on the composition and skills of the current Independent Trustees, as well as experience or skills that may be appropriate in light of future changes to board composition, business conditions, and regulatory or other developments, have also been considered by the professional search firms and the Governance and Nominating Committee. In addition, the Board takes into account the Trustees' commitment and participation in Board and committee meetings, as well as their leadership of standing and ad hoc committees throughout their tenure.
In determining that a particular Trustee was and continues to be qualified to serve as a Trustee, the Board has considered a variety of criteria, none of which, in isolation, was controlling. The Board believes that, collectively, the Trustees have balanced and diverse experience, qualifications, attributes, and skills, which allow the Board to operate effectively in governing the fund and protecting the interests of shareholders. Information about the specific experience, skills, attributes, and qualifications of each Trustee, which in each case led to the Board's conclusion that the Trustee should serve (or continue to serve) as a trustee of the fund, is provided below.
Board Structure and Oversight Function. James C. Curvey is an interested person and currently serves as Chairman. The Trustees have determined that an interested Chairman is appropriate and benefits shareholders because an interested Chairman has a personal and professional stake in the quality and continuity of services provided to the fund. Independent Trustees exercise their informed business judgment to appoint an individual of their choosing to serve as Chairman, regardless of whether the Trustee happens to be independent or a member of management. The Independent Trustees have determined that they can act independently and effectively without having an Independent Trustee serve as Chairman and that a key structural component for assuring that they are in a position to do so is for the Independent Trustees to constitute a substantial majority for the Board. The Independent Trustees also regularly meet in executive session. Ned C. Lautenbach serves as Chairman of the Independent Trustees and as such (i) acts as a liaison between the Independent Trustees and management with respect to matters important to the Independent Trustees and (ii) with management prepares agendas for Board meetings.
Fidelity® funds are overseen by different Boards of Trustees. The fund's Board oversees Fidelity's high income and certain equity funds, and other Boards oversee Fidelity's investment-grade bond, money market, asset allocation, and sector funds. The asset allocation funds may invest in Fidelity® funds overseen by the fund's Board. The use of separate Boards, each with its own committee structure, allows the Trustees of each group of Fidelity® funds to focus on the unique issues of the funds they oversee, including common research, investment, and operational issues. On occasion, the separate Boards establish joint committees to address issues of overlapping consequences for the Fidelity® funds overseen by each Board.
The Trustees operate using a system of committees to facilitate the timely and efficient consideration of all matters of importance to the Trustees, the fund, and fund shareholders and to facilitate compliance with legal and regulatory requirements and oversight of the fund's activities and associated risks. The Board, acting through its committees, has charged FMR and its affiliates with (i) identifying events or circumstances the occurrence of which could have demonstrably adverse effects on the fund's business and/or reputation; (ii) implementing processes and controls to lessen the possibility that such events or circumstances occur or to mitigate the effects of such events or circumstances if they do occur; and (iii) creating and maintaining a system designed to evaluate continuously business and market conditions in order to facilitate the identification and implementation processes described in (i) and (ii) above. Because the day-to-day operations and activities of the fund are carried out by or through FMR, its affiliates, and other service providers, the fund's exposure to risks is mitigated but not eliminated by the processes overseen by the Trustees. While each of the Board's committees has responsibility for overseeing different aspects of the fund's activities, oversight is exercised primarily through the Operations, Audit, and Compliance Committees. In addition, the Independent Trustees have worked with FMR to enhance the Board's oversight of investment and financial risks, legal and regulatory risks, technology risks, and operational risks, including the development of additional risk reporting to the Board. For example, a working group comprised of Independent Trustees and FMR has worked and continues to work to review the Fidelity® funds' valuation-related activities, reporting and risk management. Appropriate personnel, including but not limited to the fund's Chief Compliance Officer (CCO), FMR's internal auditor, the independent accountants, the fund's Treasurer and portfolio management personnel, make periodic reports to the Board's committees, as appropriate, including an annual review of Fidelity's risk management program for the Fidelity® funds. The responsibilities of each standing committee, including their oversight responsibilities, are described further under "Standing Committees of the Trustees."
Interested Trustees*:
Correspondence intended for a Trustee who is an interested person may be sent to Fidelity Investments, 245 Summer Street, Boston, Massachusetts 02210.
Name, Year of Birth; Principal Occupations and Other Relevant Experience+
James C. Curvey (1935)
Year of Election or Appointment: 2007
Trustee
Chairman of the Board of Trustees
Mr. Curvey also serves as Trustee of other Fidelity® funds. Mr. Curvey is a Director of Fidelity Research & Analysis Co. (investment adviser firm, 2009-present), and Vice Chairman (2007-present) and Director of FMR LLC (diversified financial services company). In addition, Mr. Curvey serves as an Overseer for the Boston Symphony Orchestra and a member of the board of Artis-Naples, Naples, Florida, and as a Trustee for Brewster Academy, Wolfeboro, New Hampshire. Previously, Mr. Curvey served as a Director of Fidelity Investments Money Management, Inc. (investment adviser firm, 2009-2014) and a Director of FMR and FMR Co., Inc. (investment adviser firms, 2007-2014).
Charles S. Morrison (1960)
Year of Election or Appointment: 2014
Trustee
Mr. Morrison also serves as Trustee of other funds. He serves as a Director of Fidelity Investments Money Management, Inc. (FIMM) (investment adviser firm, 2014-present), Director of Fidelity SelectCo, LLC (investment adviser firm, 2014-present), President, Asset Management (2014-present), and is an employee of Fidelity Investments. Previously, Mr. Morrison served as Vice President of Fidelity's Fixed Income and Asset Allocation Funds (2012-2014), President, Fixed Income (2011-2014), Vice President of Fidelity's Money Market Funds (2005-2009), President, Money Market Group Leader of FMR (investment adviser firm, 2009), and Senior Vice President, Money Market Group of FMR (2004-2009). Mr. Morrison also served as Vice President of Fidelity's Bond Funds (2002-2005), certain Balanced Funds (2002-2005), and certain Asset Allocation Funds (2002-2007), and as Senior Vice President (2002-2005) of Fidelity's Bond Division.
* Determined to be an “Interested Trustee” by virtue of, among other things, his or her affiliation with the trust or various entities under common control with FMR.
+ The information includes the Trustee's principal occupation during the last five years and other information relating to the experience, attributes, and skills relevant to the Trustee's qualifications to serve as a Trustee, which led to the conclusion that the Trustee should serve as a Trustee for the fund.
Independent Trustees:
Correspondence intended for an Independent Trustee may be sent to Fidelity Investments, P.O. Box 55235, Boston, Massachusetts 02205-5235.
Name, Year of Birth; Principal Occupations and Other Relevant Experience+
Dennis J. Dirks (1948)
Year of Election or Appointment: 2005
Trustee
Mr. Dirks also serves as Trustee of other Fidelity® funds. Prior to his retirement in May 2003, Mr. Dirks was Chief Operating Officer and a member of the Board of The Depository Trust & Clearing Corporation (DTCC). He also served as President, Chief Operating Officer, and Board member of The Depository Trust Company (DTC) and President and Board member of the National Securities Clearing Corporation (NSCC). In addition, Mr. Dirks served as Chief Executive Officer and Board member of the Government Securities Clearing Corporation, Chief Executive Officer and Board member of the Mortgage-Backed Securities Clearing Corporation, as a Trustee and a member of the Finance Committee of Manhattan College (2005-2008), as a Trustee and a member of the Finance Committee of AHRC of Nassau County (2006-2008), and as a member of the Independent Directors Council (IDC) Governing Council (2010-2015). Mr. Dirks is a member of the Board of Directors for The Brookville Center for Children's Services, Inc. (2009-present).
Alan J. Lacy (1953)
Year of Election or Appointment: 2008
Trustee
Mr. Lacy also serves as Trustee of other Fidelity® funds. Mr. Lacy serves as a member of the Board of Directors of Dave & Buster's Entertainment, Inc. (restaurant and entertainment complexes, 2010-present) and Bristol-Myers Squibb Company (global pharmaceuticals, 2008-present). In addition, Mr. Lacy served as Senior Adviser (2007-2014) of Oak Hill Capital Partners, L.P. (private equity) and also served as Chief Executive Officer (2000-2005) and Vice Chairman (2005-2006) of Sears Holdings Corporation and Sears, Roebuck and Co. (retail). Mr. Lacy is a member of the Board of Trustees of The National Parks Conservation Association (2006-present). Previously, Mr. Lacy served as Chairman of the Board of Trustees of the National Parks Conservation Association (2008-2011) and as a member of the Board of Directors for The Western Union Company (global money transfer, 2006-2011), The Hillman Companies, Inc. (hardware wholesalers, 2010-2014), and Earth Fare, Inc. (retail grocery, 2010-2014).
Ned C. Lautenbach (1944)
Year of Election or Appointment: 2000
Trustee
Chairman of the Independent Trustees
Mr. Lautenbach also serves as Trustee of other Fidelity® funds. Mr. Lautenbach currently serves as the Lead Director of the Eaton Corporation Board of Directors (diversified industrial, 1997-present). Mr. Lautenbach is Chairman of the Board of Directors of Artis-Naples in Naples, Florida (2012-present), a member of the Council on Foreign Relations (1994-present), and a member of the Board of Governors, State University System of Florida (2013-present). Previously, Mr. Lautenbach was a Partner/Advisory Partner at Clayton, Dubilier & Rice, LLC (private equity investment, 1998-2010), as well as a Director of Sony Corporation (2006-2007).
Joseph Mauriello (1944)
Year of Election or Appointment: 2008
Trustee
Mr. Mauriello also serves as Trustee of other Fidelity® funds. Prior to his retirement in January 2006, Mr. Mauriello served in numerous senior management positions including Deputy Chairman and Chief Operating Officer (2004-2005), and Vice Chairman of Financial Services (2002-2004) of KPMG LLP US (professional services, 1965-2005). Mr. Mauriello currently serves as a member of the Board of Directors of XL Group plc. (global insurance and re-insurance, 2006-present) and the Independent Directors Council (IDC) Governing Council (2015-present). Previously, Mr. Mauriello served as a Director of the Hamilton Funds of the Bank of New York (2006-2007) and of Arcadia Resources Inc. (health care services and products, 2007-2012).
Robert W. Selander (1950)
Year of Election or Appointment: 2011
Trustee
Mr. Selander also serves as Trustee of other Fidelity® funds. Mr. Selander serves as a Director of The Western Union Company (global money transfer, 2014-present). Previously, Mr. Selander served as a Member of the Advisory Board of other Fidelity® funds (2011), and Executive Vice Chairman (2010), Chief Executive Officer (2009-2010), and President and Chief Executive Officer (1997-2009) of Mastercard, Inc.
Cornelia M. Small (1944)
Year of Election or Appointment: 2005
Trustee
Ms. Small also serves as Trustee of other Fidelity® funds. Ms. Small is a member of the Board of Directors (2009-present) and Chair of the Investment Committee (2010-present) of the Teagle Foundation. Ms. Small also serves on the Investment Committee of the Berkshire Taconic Community Foundation (2008-present). Previously, Ms. Small served as Chairperson (2002-2008) and a member of the Investment Committee and Chairperson (2008-2012) and a member of the Board of Trustees of Smith College. In addition, Ms. Small served as Chief Investment Officer, Director of Global Equity Investments, and a member of the Board of Directors of Scudder, Stevens & Clark and Scudder Kemper Investments.
William S. Stavropoulos (1939)
Year of Election or Appointment: 2002
Trustee
Vice Chairman of the Independent Trustees
Mr. Stavropoulos also serves as Trustee of other Fidelity® funds. Mr. Stavropoulos serves as President and Founder of the Michigan Baseball Foundation, the Great Lakes Loons (2007-present). Mr. Stavropoulos is Chairman Emeritus of the Board of Directors of The Dow Chemical Company, where he previously served in numerous senior management positions, including President, CEO (1995-2000; 2002-2004), Chairman of the Executive Committee (2000-2006), and as a member of the Board of Directors (1990-2006). Currently, Mr. Stavropoulos is Chairman of the Board of Directors of Univar Inc. (global distributor of commodity and specialty chemicals), a Director of Teradata Corporation (data warehousing and technology solutions), and Maersk Inc. (industrial conglomerate), and a member of the Advisory Board for Metalmark Capital LLC (private equity investment, 2005-present). Mr. Stavropoulos is an operating advisor to Clayton, Dubilier & Rice, LLC (private equity investment). In addition, Mr. Stavropoulos is a member of the University of Notre Dame Advisory Council for the College of Science, a Trustee of the Rollin L. Gerstacker Foundation, and a Director of the Naples Philharmonic Center for the Arts. Previously, Mr. Stavropoulos served as a Director of Chemical Financial Corporation (bank holding company, 1993-2012) and Tyco International, Ltd. (multinational manufacturing and services, 2007-2012).
David M. Thomas (1949)
Year of Election or Appointment: 2008
Trustee
Mr. Thomas also serves as Trustee of other Fidelity® funds. Mr. Thomas serves as Non-Executive Chairman of the Board of Directors of Fortune Brands Home and Security (home and security products, 2011-present), as a member of the Board of Directors (2004-present) and Presiding Director (2013-present) of Interpublic Group of Companies, Inc. (marketing communication), and as a member of the Board of Trustees of the University of Florida (2013-present). Previously, Mr. Thomas served as Executive Chairman (2005-2006) and Chairman and Chief Executive Officer (2000-2005) of IMS Health, Inc. (pharmaceutical and healthcare information solutions), and a Director of Fortune Brands, Inc. (consumer products, 2000-2011).
+ The information includes the Trustee's principal occupation during the last five years and other information relating to the experience, attributes, and skills relevant to the Trustee's qualifications to serve as a Trustee, which led to the conclusion that the Trustee should serve as a Trustee for the fund.
Advisory Board Members and Officers:
Correspondence intended for an officer or Peter S. Lynch may be sent to Fidelity Investments, 245 Summer Street, Boston, Massachusetts 02210. Officers appear below in alphabetical order.
Name, Year of Birth; Principal Occupation
Peter S. Lynch (1944)
Year of Election or Appointment: 2003
Member of the Advisory Board
Mr. Lynch also serves as Member of the Advisory Board of other Fidelity® funds. Mr. Lynch is Vice Chairman and a Director of FMR (investment adviser firm) and FMR Co., Inc. (investment adviser firm). In addition, Mr. Lynch serves as a Trustee of Boston College and as the Chairman of the Inner-City Scholarship Fund. Previously, Mr. Lynch served on the Special Olympics International Board of Directors (1997-2006).
Elizabeth Paige Baumann (1968)
Year of Election or Appointment: 2012
Anti-Money Laundering (AML) Officer
Ms. Baumann also serves as AML Officer of other funds. She is Chief AML Officer of FMR LLC (diversified financial services company, 2012-present) and is an employee of Fidelity Investments. Previously, Ms. Baumann served as Vice President and Deputy Anti-Money Laundering Officer (2007-2012).
Marc R. Bryant (1966)
Year of Election or Appointment: 2015
Secretary and Chief Legal Officer (CLO)
Mr. Bryant also serves as Secretary and CLO of other funds. Mr. Bryant serves as CLO, Secretary, and Senior Vice President of Fidelity Management & Research Company (investment adviser firm, 2015-present) and FMR Co., Inc. (investment adviser firm, 2015-present); Secretary of Fidelity SelectCo, LLC (investment adviser firm, 2015-present) and Fidelity Investments Money Management, Inc. (investment adviser firm, 2015-present); and CLO of Fidelity Management & Research (Hong Kong) Limited (investment adviser firm, 2015-present). He is Senior Vice President and Deputy General Counsel of FMR LLC (diversified financial services company). Previously, Mr. Bryant served as Secretary and CLO of Fidelity Rutland Square Trust II (2010-2014) and Assistant Secretary of Fidelity's Fixed Income and Asset Allocation Funds (2013-2015). Prior to joining Fidelity Investments, Mr. Bryant served as a Senior Vice President and the Head of Global Retail Legal for AllianceBernstein L.P. (2006-2010), and as the General Counsel for ProFund Advisors LLC (2001-2006).
William C. Coffey (1969)
Year of Election or Appointment: 2009
Assistant Secretary
Mr. Coffey also serves as Assistant Secretary of other funds. He is Senior Vice President and Deputy General Counsel of FMR LLC (diversified financial services company, 2010-present), and is an employee of Fidelity Investments. Previously, Mr. Coffey served as Vice President and Associate General Counsel of FMR LLC (2005-2009).
Jonathan Davis (1968)
Year of Election or Appointment: 2010
Assistant Treasurer
Mr. Davis also serves as Assistant Treasurer of other funds, and is an employee of Fidelity Investments. Previously, Mr. Davis served as Vice President and Associate General Counsel of FMR LLC (diversified financial services company, 2003-2010).
Adrien E. Deberghes (1967)
Year of Election or Appointment: 2008
Deputy Treasurer
Mr. Deberghes also serves as an officer of other funds. He is an employee of Fidelity Investments (2008-present). Prior to joining Fidelity Investments, Mr. Deberghes was Senior Vice President of Mutual Fund Administration at State Street Corporation (2007-2008), Senior Director of Mutual Fund Administration at Investors Bank & Trust (2005-2007), and Director of Finance for Dunkin' Brands (2000-2005).
Stephanie J. Dorsey (1969)
Year of Election or Appointment: 2010
Assistant Treasurer
Ms. Dorsey also serves as an officer of other funds. She is an employee of Fidelity Investments (2008-present) and has served in other fund officer roles. Prior to joining Fidelity Investments, Ms. Dorsey served as Treasurer (2004-2008) of the JPMorgan Mutual Funds and Vice President (2004-2008) of JPMorgan Chase Bank.
Howard J. Galligan III (1966)
Year of Election or Appointment: 2014
Chief Financial Officer
Mr. Galligan also serves as Chief Financial Officer of other funds. Mr. Galligan serves as President of Fidelity Pricing and Cash Management Services (FPCMS) (2014-present) and as a Director of Strategic Advisers, Inc. (investment adviser firm, 2008-present). Previously, Mr. Galligan served as Chief Administrative Officer of Asset Management (2011-2014) and Chief Operating Officer and Senior Vice President of Investment Support for Strategic Advisers, Inc. (2003-2011).
Scott C. Goebel (1968)
Year of Election or Appointment: 2015
Vice President
Mr. Goebel serves as Vice President of other funds and is an employee of Fidelity Investments (2001-present). Previously, Mr. Goebel served as Secretary of Fidelity SelectCo, LLC (investment adviser firm, 2013-2015), Fidelity Investments Money Management, Inc. (FIMM) (investment adviser firm, 2010-2015), and Fidelity Research and Analysis Company (FRAC) (investment adviser firm, 2010-2015); General Counsel, Secretary, and Senior Vice President of Fidelity Management & Research Company (investment adviser firm, 2008-2015) and FMR Co., Inc. (investment adviser firm, 2008-2015); Assistant Secretary of Fidelity Management & Research (Japan) Limited (investment adviser firm, 2008-2015) and FMR Investment Management (U.K.) Limited (investment adviser firm, 2008-2015); Chief Legal Officer (CLO) of Fidelity Management & Research (Hong Kong) Limited (investment adviser firm, 2008-2015); Secretary and CLO of certain Fidelity® funds (2008-2015); Assistant Secretary of FIMM (2008-2010), FRAC (2008-2010), and certain funds (2007-2008); and as Vice President and Secretary of Fidelity Distributors Corporation (FDC) (2005-2007).
Thomas C. Hense (1964)
Year of Election or Appointment: 2008, 2010, or 2015
Vice President
Mr. Hense serves as Vice President of Fidelity Advisor® Multi-Asset Income Fund (2015) and other funds (High Income (2008), Small Cap (2008), and Value (2010) funds), and is an employee of Fidelity Investments (1993-present). Previously, Mr. Hense served as a portfolio manager for Fidelity's Institutional Money Management Group (Pyramis) (2003-2008).
Brian B. Hogan (1964)
Year of Election or Appointment: 2009
Vice President
Mr. Hogan also serves as Trustee or Vice President of other funds. Mr. Hogan serves as a Director of Fidelity SelectCo, LLC (investment adviser firm, 2014-present) and President of the Equity Division of FMR (investment adviser firm, 2009-present). Previously, Mr. Hogan served as Senior Vice President, Equity Research of FMR (2006-2009) and as a portfolio manager.
Chris Maher (1972)
Year of Election or Appointment: 2013
Assistant Treasurer
Mr. Maher serves as Assistant Treasurer of other funds. Mr. Maher is Vice President of Valuation Oversight and is an employee of Fidelity Investments. Previously, Mr. Maher served as Vice President of Asset Management Compliance (2013), Vice President of the Program Management Group of FMR (investment adviser firm, 2010-2013), and Vice President of Valuation Oversight (2008-2010).
Kenneth B. Robins (1969)
Year of Election or Appointment: 2008
President and Treasurer
Mr. Robins also serves as an officer of other funds. Mr. Robins serves as Executive Vice President of Fidelity Investments Money Management, Inc. (FIMM) (investment adviser firm, 2013-present) and is an employee of Fidelity Investments (2004-present). Previously, Mr. Robins served in other fund officer roles.
Stacie M. Smith (1974)
Year of Election or Appointment: 2013
Deputy Treasurer
Ms. Smith also serves as an officer of other funds. She is an employee of Fidelity Investments (2009-present) and has served in other fund officer roles. Prior to joining Fidelity Investments, Ms. Smith served as Senior Audit Manager of Ernst & Young LLP (1996-2009).
Renee Stagnone (1975)
Year of Election or Appointment: 2013
Deputy Treasurer
Ms. Stagnone also serves as Deputy Treasurer of other funds. Ms. Stagnone is an employee of Fidelity Investments (1997-present).
Linda J. Wondrack (1964)
Year of Election or Appointment: 2014
Chief Compliance Officer
Ms. Wondrack also serves as Chief Compliance Officer of other funds. Ms. Wondrack is Executive Vice President and head of the Ethics Office and Asset Management Compliance for Fidelity Investments (2012-present). Ms. Wondrack also serves as Chief Compliance Officer of Fidelity SelectCo, LLC (investment adviser firm, 2014-present); Chief Compliance Officer of Impresa Management LLC (2013-present); and Chief Compliance Officer of FMR Co., Inc. (investment adviser firm), Fidelity Investments Money Management, Inc. (investment adviser firm), Fidelity Management & Research (Japan) Limited (investment adviser firm), FMR Investment Management (U.K.) Limited (investment adviser firm), Fidelity Management & Research (Hong Kong) (investment adviser firm), Fidelity Management & Research Company (investment adviser firm), FIAM LLC (investment adviser firm), and Strategic Advisers, Inc. (investment adviser firm), Ballyrock Investment Advisors LLC, and Northern Neck Investors LLC (2012-present). Previously, Ms. Wondrack served as Senior Vice President and Chief Compliance Officer for Columbia Management Investment Advisers, LLC (2005-2012); Chief Compliance Officer for certain funds within the Columbia Family of Funds (2007-2012); and Senior Vice President of Compliance Risk Management at Bank of America (2005-2010).
Joseph F. Zambello (1957)
Year of Election or Appointment: 2011
Deputy Treasurer
Mr. Zambello also serves as Deputy Treasurer of other funds. Mr. Zambello is an employee of Fidelity Investments (1991-present). Previously, Mr. Zambello served as Vice President of the Program Management Group of FMR (investment adviser firm, 2009-2011) and Vice President of the Transfer Agent Oversight Group (2005-2009).
Shareholder Expense Example
As a shareholder of the Fund, you incur two types of costs: (1) transaction costs, including sales charges (loads) on purchase payments or redemption proceeds, and (2) ongoing costs, including management fees, distribution and/or service (12b-1) fees and other Fund expenses. This Example is intended to help you understand your ongoing costs (in dollars) of investing in the Fund and to compare these costs with the ongoing costs of investing in other mutual funds.
The Example is based on an investment of $1,000 invested at the beginning of the period and held for the entire period (June 1, 2015 to November 30, 2015).
Actual Expenses
The first line of the accompanying table for each class of the Fund provides information about actual account values and actual expenses. You may use the information in this line, together with the amount you invested, to estimate the expenses that you paid over the period. Simply divide your account value by $1,000.00 (for example, an $8,600 account value divided by $1,000.00 = 8.6), then multiply the result by the number in the first line for a class of the Fund under the heading entitled "Expenses Paid During Period" to estimate the expenses you paid on your account during this period. In addition, the Fund, as a shareholder in the underlying Fidelity Central Funds, will indirectly bear its pro-rata share of the fees and expenses incurred by the underlying Fidelity Central Funds. These fees and expenses are not included in the Fund's annualized expense ratio used to calculate the expense estimate in the table below.
Hypothetical Example for Comparison Purposes
The second line of the accompanying table for each class of the Fund provides information about hypothetical account values and hypothetical expenses based on a Class' actual expense ratio and an assumed rate of return of 5% per year before expenses, which is not the Class' actual return. The hypothetical account values and expenses may not be used to estimate the actual ending account balance or expenses you paid for the period. You may use this information to compare the ongoing costs of investing in the Fund and other funds. To do so, compare this 5% hypothetical example with the 5% hypothetical examples that appear in the shareholder reports of the other funds. In addition, the Fund, as a shareholder in the underlying Fidelity Central Funds, will indirectly bear its pro-rata share of the fees and expenses incurred by the underlying Fidelity Central Funds. These fees and expenses are not included in the Fund's annualized expense ratio used to calculate the expense estimate in the table below.
Please note that the expenses shown in the table are meant to highlight your ongoing costs only and do not reflect any transaction costs. Therefore, the second line of the table is useful in comparing ongoing costs only, and will not help you determine the relative total costs of owning different funds. In addition, if these transactional costs were included, your costs would have been higher.
| Annualized Expense Ratio-A | Beginning Account Value June 1, 2015 | Ending Account Value November 30, 2015 | Expenses Paid During Period-B June 1, 2015 to November 30, 2015 | |
| Class A | 1.00% | |||
| Actual | $1,000.00 | $971.40 | $4.94 | |
| Hypothetical-C | $1,000.00 | $1,020.05 | $5.06 | |
| Class T | 1.24% | |||
| Actual | $1,000.00 | $970.20 | $6.12 | |
| Hypothetical-C | $1,000.00 | $1,018.85 | $6.28 | |
| Class B | 1.84% | |||
| Actual | $1,000.00 | $967.40 | $9.07 | |
| Hypothetical-C | $1,000.00 | $1,015.84 | $9.30 | |
| Class C | 1.76% | |||
| Actual | $1,000.00 | $967.80 | $8.68 | |
| Hypothetical-C | $1,000.00 | $1,016.24 | $8.90 | |
| Class I | .76% | |||
| Actual | $1,000.00 | $972.60 | $3.76 | |
| Hypothetical-C | $1,000.00 | $1,021.26 | $3.85 | |
| Class Z | .60% | |||
| Actual | $1,000.00 | $973.50 | $2.97 | |
| Hypothetical-C | $1,000.00 | $1,022.06 | $3.04 |
A Annualized expense ratio reflects expenses net of applicable fee waivers.
B Expenses are equal to each Class' annualized expense ratio, multiplied by the average account value over the period, multiplied by 183/365 (to reflect the one-half year period).
C 5% return per year before expenses
Distributions (Unaudited)
The Board of Trustees of Advisor Dividend Growth Fund voted to pay to shareholders of record at the opening of business on record date, the following distributions per share derived from capital gains realized from sales of portfolio securities, and dividends derived from net investment income:
| Pay Date | Record Date | Dividends | Capital Gains | |
| Class Z | 12/14/15 | 12/11/15 | $0.258 | $0.941 |
The fund hereby designates as a capital gain dividend with respect to the taxable year ended November 30, 2015, $63,036,073, or, if subsequently determined to be different, the net capital gain of such year.
Class Z designates 88% of the dividends distributed during the fiscal year as qualifying for the dividends–received deduction for corporate shareholders.
Class Z designates 100%, of the dividends distributed during the fiscal year as amounts which may be taken into account as a dividend for the purposes of the maximum rate under section 1(h)(11) of the Internal Revenue Code.
The fund will notify shareholders in January 2016 of amounts for use in preparing 2015 income tax returns.
Board Approval of Investment Advisory Contracts and Management Fees
Fidelity Advisor Dividend Growth Fund
Each year, the Board of Trustees, including the Independent Trustees (together, the Board), votes on the renewal of the management contract with Fidelity Management & Research Company (FMR) and the sub-advisory agreements (together, the Advisory Contracts) for the fund. The Board, assisted by the advice of fund counsel and Independent Trustees' counsel, requests and considers a broad range of information relevant to the renewal of the Advisory Contracts throughout the year.
The Board meets regularly and, at each of its meetings, covers an extensive agenda of topics and materials and considers factors that are relevant to its annual consideration of the renewal of the fund's Advisory Contracts, including the services and support provided to the fund and its shareholders. The Board has established various standing committees (Committees), each composed of and chaired by Independent Trustees with varying backgrounds, to which the Board has assigned specific subject matter responsibilities in order to enhance effective decision-making by the Board. The Board, acting directly and through its Committees, requests and receives information concerning the annual consideration of the renewal of the fund's Advisory Contracts. The Board also meets as needed to consider matters specifically related to the Board's annual consideration of the renewal of the Advisory Contracts. Members of the Board may also meet with trustees of other Fidelity funds through ad hoc joint committees to discuss certain matters relevant to all of the Fidelity funds.
At its July 2015 meeting, the Board unanimously determined to renew the fund's Advisory Contracts. In reaching its determination, the Board considered all factors it believed relevant, including (i) the nature, extent, and quality of the services to be provided to the fund and its shareholders (including the investment performance of the fund); (ii) the competitiveness of the fund's management fee and total expense ratio relative to peer funds; (iii) the total costs of the services to be provided by and the profits to be realized by Fidelity from its relationship with the fund; and (iv) the extent to which (if any) economies of scale exist and would be realized as the fund grows, and whether any economies of scale are appropriately shared with fund shareholders.
In considering whether to renew the Advisory Contracts for the fund, the Board reached a determination, with the assistance of fund counsel and Independent Trustees' counsel and through the exercise of its business judgment, that the renewal of the Advisory Contracts was in the best interests of the fund and its shareholders and that the compensation payable under the Advisory Contracts was fair and reasonable. The Board's decision to renew the Advisory Contracts was not based on any single factor, but rather was based on a comprehensive consideration of all the information provided to the Board at its meetings throughout the year. The Board, in reaching its determination to renew the Advisory Contracts, was aware that shareholders of the fund have a broad range of investment choices available to them, including a wide choice among funds offered by Fidelity's competitors, and that the fund's shareholders, who have the opportunity to review and weigh the disclosure provided by the fund in its prospectus and other public disclosures, have chosen to invest in this fund, which is part of the Fidelity family of funds.
Nature, Extent, and Quality of Services Provided. The Board considered Fidelity's staffing as it relates to the fund, including the backgrounds of investment personnel of Fidelity, and also considered the fund's investment objective, strategies, and related investment philosophy. The Independent Trustees also had discussions with senior management of Fidelity's investment operations and investment groups. The Board considered the structure of the portfolio manager compensation program and whether this structure provides appropriate incentives to act in the best interests of the fund. Additionally, the Board considered the portfolio managers' investments, if any, in the funds that they manage.Resources Dedicated to Investment Management and Support Services. The Board and the Fund Oversight and Research Committees reviewed the general qualifications and capabilities of Fidelity's investment staff, including its size, education, experience, and resources, as well as Fidelity's approach to recruiting, training, managing, and compensating investment personnel. The Board noted that Fidelity has continued to increase the resources devoted to non-U.S. offices, including expansion of Fidelity's global investment organization. The Board also noted that Fidelity's analysts have extensive resources, tools and capabilities that allow them to conduct sophisticated quantitative and fundamental analysis, as well as credit analysis of issuers, counterparties and guarantors. Further, the Board considered that Fidelity's investment professionals have sufficient access to global information and data so as to provide competitive investment results over time, and that those professionals also have access to sophisticated tools that permit them to assess portfolio construction and risk and performance attribution characteristics continuously, as well as to transmit new information and research conclusions rapidly around the world. Additionally, in its deliberations, the Board considered Fidelity's trading, risk management, and compliance capabilities and resources, which are integral parts of the investment management process.Shareholder and Administrative Services. The Board considered (i) the nature, extent, quality, and cost of advisory, administrative, and shareholder services performed by FMR, the sub-advisers (together with FMR, the Investment Advisers), and their affiliates under the Advisory Contracts and under separate agreements covering transfer agency, pricing and bookkeeping, and securities lending services for the fund; (ii) the nature and extent of the supervision of third party service providers, principally custodians and subcustodians; and (iii) the resources devoted to, and the record of compliance with, the fund's compliance policies and procedures. The Board also reviewed the allocation of fund brokerage, including allocations to brokers affiliated with the Investment Advisers, the use of brokerage commissions to pay fund expenses, and the use of "soft" commission dollars to pay for research services.The Board noted that the growth of fund assets over time across the complex allows Fidelity to reinvest in the development of services designed to enhance the value or convenience of the Fidelity funds as investment vehicles. These services include 24-hour access to account information and market information through telephone representatives and over the Internet, investor education materials and asset allocation tools, and the expanded availability of Fidelity Investor Centers.In 2014, the Board formed an ad hoc Committee on Transfer Agency Fees to review the variety of transfer agency fee structures throughout the industry and Fidelity's competitive positioning with respect to industry participants.Investment in a Large Fund Family. The Board considered the benefits to shareholders of investing in a Fidelity fund, including the benefits of investing in a fund that is part of a large family of funds offering a variety of investment disciplines and providing a large variety of mutual fund investor services. The Board noted that Fidelity had taken, or had made recommendations that resulted in the Fidelity funds taking, a number of actions over the previous year that benefited particular funds, including (i) continuing to dedicate additional resources to investment research and to the support of the senior management team that oversees asset management; (ii) continuing efforts to enhance Fidelity's global research capabilities; (iii) launching new funds and making other enhancements to meet client needs; (iv) reducing management fees and total expenses for certain index funds and diversified international funds; (v) continuing to launch dedicated lower cost underlying funds to meet portfolio construction needs related to expanding underlying fund options for Fidelity funds of funds, specifically for the Freedom Fund product lines; (vi) rationalizing product lines and gaining increased efficiencies through fund mergers; (vii) launching active fixed-income exchange-traded funds; (viii) continuing to develop, acquire and implement systems and technology to improve services to the funds and information security and to increase efficiency; (ix) implementing investment enhancements to further strengthen Fidelity's target date product line to increase investors' probability of success in achieving their goals; (x) modifying the eligibility criteria for certain share classes to accommodate roll-over assets from employer-sponsored retirement plans; (xi) launching a new Class W of the Freedom Index Funds to attract and retain Fidelity record-kept retirement plan assets; and (xii) implementing changes to Fidelity's money market product line in response to recent money market regulatory reforms.Investment Performance. The Board considered whether the fund has operated in accordance with its investment objective, as well as its record of compliance with its investment restrictions and its performance history. The Board noted that there was a portfolio management change for the fund in January 2014.The Board took into account discussions with representatives of the Investment Advisers about fund investment performance that occur at Board meetings throughout the year. In this regard the Board noted that as part of regularly scheduled fund reviews and other reports to the Board on fund performance, the Board considers annualized return information for the fund, for different time periods, measured against a securities market index ("benchmark index") and a peer group of funds with similar objectives ("peer group"), if any. In its evaluation of fund investment performance, the Board gave particular attention to information indicating changes in performance of certain Fidelity funds for specific time periods and discussed with the Investment Advisers the reasons for any overperformance or underperformance.In addition to reviewing absolute and relative fund performance, the Independent Trustees periodically consider the appropriateness of fund performance metrics in evaluating the results achieved. In general, the Independent Trustees believe that fund performance should be evaluated based on net performance (after fees and expenses) of both the highest performing and lowest performing fund share classes, where applicable, compared to appropriate benchmark indices, over appropriate time periods that may include full market cycles, and compared to peer groups, as applicable, over the same periods, taking into account relevant factors including the following: general market conditions; issuer-specific information; and fund cash flows and other factors.The Independent Trustees recognize that shareholders evaluate performance on a net basis over their own holding periods, for which one-, three-, and five-year periods are often used as a proxy. For this reason, the performance information reviewed by the Board also included net cumulative calendar year total return information for the fund and an appropriate benchmark index and peer group for the most recent one-, three-, and five-year periods, as shown below. Returns are shown compared to the 25th percentile (top of box, 75% beaten) and 75th percentile (bottom of box, 25% beaten) of the peer universe.Fidelity Advisor Dividend Growth Fund
Fidelity Advisor Dividend Growth Fund
![]()
ADGFZ-ANN-0116
1.9585503.102
Fidelity Advisor® Large Cap Fund Class A, Class T, Class B and Class C Annual Report November 30, 2015 |
|
Contents
Board Approval of Investment Advisory Contracts and Management Fees |
To view a fund's proxy voting guidelines and proxy voting record for the 12-month period ended June 30, visit http://www.fidelity.com/proxyvotingresults or visit the Securities and Exchange Commission's (SEC) web site at http://www.sec.gov.
You may also call 1-877-208-0098 to request a free copy of the proxy voting guidelines.
Standard & Poor's, S&P and S&P 500 are registered service marks of The McGraw-Hill Companies, Inc. and have been licensed for use by Fidelity Distributors Corporation.
Other third-party marks appearing herein are the property of their respective owners.
All other marks appearing herein are registered or unregistered trademarks or service marks of FMR LLC or an affiliated company. © 2016 FMR LLC. All rights reserved.
This report and the financial statements contained herein are submitted for the general information of the shareholders of the Fund. This report is not authorized for distribution to prospective investors in the Fund unless preceded or accompanied by an effective prospectus.
A fund files its complete schedule of portfolio holdings with the SEC for the first and third quarters of each fiscal year on Form N-Q. Forms N-Q are available on the SEC’s web site at http://www.sec.gov. A fund's Forms N-Q may be reviewed and copied at the SEC’s Public Reference Room in Washington, DC. Information regarding the operation of the SEC's Public Reference Room may be obtained by calling 1-800-SEC-0330.
For a complete list of a fund's portfolio holdings, view the most recent holdings listing, semiannual report, or annual report on Fidelity's web site at http://www.fidelity.com, http://www.advisor.fidelity.com, or http://www.401k.com, as applicable.
NOT FDIC INSURED •MAY LOSE VALUE •NO BANK GUARANTEE
Neither the Fund nor Fidelity Distributors Corporation is a bank.
Performance: The Bottom Line
Average annual total return reflects the change in the value of an investment, assuming reinvestment of distributions from dividend income and capital gains (the profits earned upon the sale of securities that have grown in value, if any) and assuming a constant rate of performance each year.
The hypothetical investment and the average annual total returns do not reflect the deduction of taxes that a shareholder would pay on fund distributions or the redemption of fund shares.
During periods of reimbursement by Fidelity, a fund’s total return will be greater than it would be had the reimbursement not occurred.
How a fund did yesterday is no guarantee of how it will do tomorrow.
Returns reflect the conversion of Class B shares to Class A shares after a maximum of seven years.
Average Annual Total Returns
| For the periods ended November 30, 2015 | Past 1 year | Past 5 years | Past 10 years |
| Class A (incl. 5.75% sales charge) | (7.23)% | 13.11% | 7.19% |
| Class T (incl. 3.50% sales charge) | (5.28)% | 13.35% | 7.17% |
| Class B (incl. contingent deferred sales charge) | (7.16)% | 13.31% | 7.25% |
| Class C (incl. contingent deferred sales charge) | (3.27)% | 13.59% | 7.02% |
Class B shares' contingent deferred sales charges included in the past one year, past five years and past ten years total return figures are 5%, 2% and 0%, respectively.
Class C shares' contingent deferred sales charges included in the past one year, past five years and past ten years total return figures are 1%, 0% and 0%, respectively.
$10,000 Over 10 Years
Let's say hypothetically that $10,000 was invested in Fidelity Advisor® Large Cap Fund - Class A on November 30, 2005, and the current 5.75% sales charge was paid.
The chart shows how the value of your investment would have changed, and also shows how the S&P 500® Index performed over the same period.
| Period Ending Values | ||
| $20,022 | Fidelity Advisor® Large Cap Fund - Class A | |
| $20,574 | S&P 500® Index | |
Management's Discussion of Fund Performance
Market Recap: U.S. stocks gained modestly for the 12 months ending November 30, 2015, despite a steep decline in August and September on concern about slowing economic growth in China. The S&P 500® index rebounded in October and gained 2.75% for the year. Stocks benefited late in the period amid waning expectations for a near-term interest-rate hike by the U.S. Federal Reserve, more economic stimulus in Europe and an interest-rate cut in China. Growth stocks in the benchmark far outpaced their value counterparts, as investors continued to seek growth in a subpar economic environment. Sector performance varied widely, with more than 26 percentage points separating the leader from the laggard. Consumer discretionary (+14%) secured the top spot, benefiting from a combination of rising personal income and still-benign inflation. Information technology (+7%) and health care (+4%) also outpaced the broad market. Conversely, the energy sector (-12%) performed worst, stymied by depressed commodity prices that also hit materials (-5%). Telecommunication services (-5%) and utilities (-4%), considered defensive sectors less sensitive to the economy, also lost ground. At period end, investors remained focused on the potential global implications of a stronger U.S. dollar and how China's transition toward a consumption-led economy may affect corporate earnings.Comments from Portfolio Manager Matthew Fruhan: For the year, the fund's share classes (excluding sales charges, if applicable) declined modestly, meaningfully lagging the benchmark S&P 500®. Some unusual market challenges held back the fund's results the past year. Most notably, investors seemingly favored stocks that offered secure near-term earnings, regardless of valuation. Versus the benchmark, my picks in consumer discretionary were the biggest disappointment, especially not owning online retailer and benchmark component Amazon.com, one of those expensive near-term earners I referred to. I declined to own Amazon because its stock traded at an excessive valuation that more than reflected the company's good short-term fundamentals. Other individual detractors included social-networking company Facebook – a benchmark constituent the fund did not hold until I established a small position on a summertime dip – and QUALCOMM, a maker of communications equipment. In contrast, the fund benefited from my picks among diversified financials stocks. On the positive side, JPMorgan Chase was a strong relative contributor. This financial services giant continued to produce solid financial results, benefiting from its dominant competitive position in multiple businesses, from mortgage origination to commercial lending to asset management.The views expressed above reflect those of the portfolio manager(s) only through the end of the period as stated on the cover of this report and do not necessarily represent the views of Fidelity or any other person in the Fidelity organization. Any such views are subject to change at any time based upon market or other conditions and Fidelity disclaims any responsibility to update such views. These views may not be relied on as investment advice and, because investment decisions for a Fidelity fund are based on numerous factors, may not be relied on as an indication of trading intent on behalf of any Fidelity fund.
Investment Summary (Unaudited)
Top Ten Stocks as of November 30, 2015
| % of fund's net assets | % of fund's net assets 6 months ago | |
| JPMorgan Chase & Co. | 4.3 | 4.2 |
| General Electric Co. | 3.6 | 3.2 |
| Apple, Inc. | 3.4 | 3.6 |
| Bank of America Corp. | 3.0 | 2.6 |
| Microsoft Corp. | 2.8 | 2.4 |
| Citigroup, Inc. | 2.6 | 2.5 |
| Target Corp. | 1.8 | 2.2 |
| Chevron Corp. | 1.8 | 1.5 |
| Procter & Gamble Co. | 1.8 | 1.5 |
| Alphabet, Inc. Class A | 1.8 | 1.5 |
| 26.9 |
Top Five Market Sectors as of November 30, 2015
| % of fund's net assets | % of fund's net assets 6 months ago | |
| Information Technology | 22.7 | 22.0 |
| Financials | 21.8 | 21.6 |
| Industrials | 13.0 | 12.2 |
| Health Care | 12.4 | 12.1 |
| Consumer Discretionary | 9.1 | 9.9 |
Asset Allocation (% of fund's net assets)
| As of November 30, 2015* | ||
| Stocks | 99.2% | |
| Short-Term Investments and Net Other Assets (Liabilities) | 0.8% | |

* Foreign investments - 9.6%
| As of May 31, 2015* | ||
| Stocks | 98.4% | |
| Short-Term Investments and Net Other Assets (Liabilities) | 1.6% | |

* Foreign investments - 10.6%
Investments November 30, 2015
Showing Percentage of Net Assets
| Common Stocks - 99.2% | |||
| Shares | Value | ||
| CONSUMER DISCRETIONARY - 9.1% | |||
| Automobiles - 0.1% | |||
| Harley-Davidson, Inc. | 22,900 | $1,120,268 | |
| Tesla Motors, Inc. (a) | 600 | 138,156 | |
| 1,258,424 | |||
| Diversified Consumer Services - 0.2% | |||
| H&R Block, Inc. | 51,578 | 1,892,397 | |
| ServiceMaster Global Holdings, Inc. (a) | 36,900 | 1,383,012 | |
| 3,275,409 | |||
| Hotels, Restaurants & Leisure - 0.8% | |||
| Las Vegas Sands Corp. | 61,500 | 2,709,690 | |
| Yum! Brands, Inc. | 105,938 | 7,681,564 | |
| 10,391,254 | |||
| Household Durables - 0.3% | |||
| KB Home | 201,800 | 2,843,362 | |
| Taylor Morrison Home Corp. (a) | 112,100 | 1,961,750 | |
| 4,805,112 | |||
| Leisure Products - 0.0% | |||
| NJOY, Inc. (a)(b) | 115,947 | 1 | |
| Media - 4.5% | |||
| Comcast Corp. Class A (special) (non-vtg.) | 358,237 | 21,866,786 | |
| Scripps Networks Interactive, Inc. Class A | 101,600 | 5,770,880 | |
| Sinclair Broadcast Group, Inc. Class A | 150,400 | 5,279,040 | |
| Time Warner, Inc. | 236,159 | 16,526,407 | |
| Viacom, Inc. Class B (non-vtg.) | 200,700 | 9,992,853 | |
| 59,435,966 | |||
| Multiline Retail - 1.8% | |||
| Target Corp. | 336,640 | 24,406,400 | |
| Specialty Retail - 1.3% | |||
| Lowe's Companies, Inc. | 198,379 | 15,195,831 | |
| Lumber Liquidators Holdings, Inc. (a)(c) | 81,000 | 1,265,220 | |
| Sally Beauty Holdings, Inc. (a) | 18,300 | 473,238 | |
| 16,934,289 | |||
| Textiles, Apparel & Luxury Goods - 0.1% | |||
| Michael Kors Holdings Ltd. (a) | 26,200 | 1,127,124 | |
| TOTAL CONSUMER DISCRETIONARY | 121,633,979 | ||
| CONSUMER STAPLES - 6.7% | |||
| Beverages - 2.1% | |||
| Diageo PLC | 265,415 | 7,612,437 | |
| PepsiCo, Inc. | 28,740 | 2,878,598 | |
| The Coca-Cola Co. | 420,075 | 17,903,597 | |
| 28,394,632 | |||
| Food & Staples Retailing - 1.0% | |||
| CVS Health Corp. | 63,511 | 5,975,750 | |
| Tesco PLC | 153,300 | 385,780 | |
| United Natural Foods, Inc. (a) | 52,300 | 2,296,493 | |
| Walgreens Boots Alliance, Inc. | 61,155 | 5,138,855 | |
| 13,796,878 | |||
| Food Products - 0.2% | |||
| Mead Johnson Nutrition Co. Class A | 23,500 | 1,893,865 | |
| Household Products - 1.8% | |||
| Procter & Gamble Co. | 313,852 | 23,488,684 | |
| Tobacco - 1.6% | |||
| British American Tobacco PLC sponsored ADR | 72,131 | 8,348,442 | |
| Philip Morris International, Inc. | 153,629 | 13,425,638 | |
| 21,774,080 | |||
| TOTAL CONSUMER STAPLES | 89,348,139 | ||
| ENERGY - 9.0% | |||
| Energy Equipment & Services - 1.6% | |||
| Ensco PLC Class A | 301,050 | 5,153,976 | |
| Helmerich & Payne, Inc. (c) | 23,800 | 1,386,350 | |
| National Oilwell Varco, Inc. | 101,932 | 3,806,141 | |
| Oceaneering International, Inc. | 126,600 | 5,537,484 | |
| Schlumberger Ltd. | 61,705 | 4,760,541 | |
| 20,644,492 | |||
| Oil, Gas & Consumable Fuels - 7.4% | |||
| Amyris, Inc. (a)(c) | 764,344 | 1,276,454 | |
| Anadarko Petroleum Corp. | 31,100 | 1,862,890 | |
| Apache Corp. | 269,710 | 13,264,338 | |
| Cabot Oil & Gas Corp. | 118,000 | 2,221,940 | |
| Chevron Corp. | 264,907 | 24,191,307 | |
| ConocoPhillips Co. | 150,100 | 8,112,905 | |
| Golar LNG Ltd. | 47,200 | 1,290,920 | |
| Imperial Oil Ltd. | 276,600 | 8,984,917 | |
| Kinder Morgan, Inc. | 133,700 | 3,151,309 | |
| Legacy Reserves LP | 79,400 | 247,728 | |
| Markwest Energy Partners LP | 36,720 | 1,762,560 | |
| Noble Energy, Inc. | 28,800 | 1,056,096 | |
| SM Energy Co. | 24,900 | 731,313 | |
| Suncor Energy, Inc. | 727,300 | 20,096,125 | |
| The Williams Companies, Inc. | 162,725 | 5,949,226 | |
| Williams Partners LP | 165,500 | 4,538,010 | |
| 98,738,038 | |||
| TOTAL ENERGY | 119,382,530 | ||
| FINANCIALS - 21.8% | |||
| Banks - 14.4% | |||
| Bank of America Corp. | 2,290,900 | 39,930,387 | |
| Citigroup, Inc. | 645,097 | 34,893,297 | |
| Comerica, Inc. | 121,400 | 5,626,890 | |
| Fifth Third Bancorp | 133,500 | 2,759,445 | |
| JPMorgan Chase & Co. | 857,573 | 57,182,962 | |
| Lloyds Banking Group PLC | 463,200 | 508,655 | |
| PNC Financial Services Group, Inc. | 45,385 | 4,334,721 | |
| Regions Financial Corp. | 744,900 | 7,553,286 | |
| Standard Chartered PLC: | |||
| rights 12/10/15 (a) | 96,264 | 131,935 | |
| (United Kingdom) | 336,924 | 2,827,463 | |
| SunTrust Banks, Inc. | 330,108 | 14,333,289 | |
| U.S. Bancorp | 315,665 | 13,854,537 | |
| Wells Fargo & Co. | 146,894 | 8,093,859 | |
| 192,030,726 | |||
| Capital Markets - 5.3% | |||
| Charles Schwab Corp. | 305,553 | 10,300,192 | |
| E*TRADE Financial Corp. (a) | 119,600 | 3,639,428 | |
| Franklin Resources, Inc. | 27,000 | 1,131,840 | |
| Goldman Sachs Group, Inc. | 4,800 | 912,096 | |
| KKR & Co. LP | 267,636 | 4,525,725 | |
| Morgan Stanley | 443,843 | 15,223,815 | |
| Northern Trust Corp. | 136,186 | 10,205,779 | |
| PJT Partners, Inc. (a) | 172 | 4,032 | |
| State Street Corp. | 297,758 | 21,611,276 | |
| The Blackstone Group LP | 109,000 | 3,404,070 | |
| 70,958,253 | |||
| Diversified Financial Services - 0.3% | |||
| KKR Renaissance Co-Invest LP unit (a)(b) | 29,500 | 3,788,095 | |
| Insurance - 1.0% | |||
| MetLife, Inc. | 172,985 | 8,837,804 | |
| Principal Financial Group, Inc. | 78,700 | 4,049,902 | |
| 12,887,706 | |||
| Thrifts & Mortgage Finance - 0.8% | |||
| MGIC Investment Corp. (a) | 254,092 | 2,424,038 | |
| Radian Group, Inc. | 606,968 | 8,649,294 | |
| 11,073,332 | |||
| TOTAL FINANCIALS | 290,738,112 | ||
| HEALTH CARE - 12.4% | |||
| Biotechnology - 2.4% | |||
| AbbVie, Inc. | 29,800 | 1,732,870 | |
| Alnylam Pharmaceuticals, Inc. (a) | 11,400 | 1,186,284 | |
| Amgen, Inc. | 59,947 | 9,657,462 | |
| Biogen, Inc. (a) | 28,700 | 8,232,882 | |
| BioMarin Pharmaceutical, Inc. (a) | 25,900 | 2,470,083 | |
| Celldex Therapeutics, Inc. (a) | 5,100 | 91,851 | |
| Discovery Laboratories, Inc. (a) | 535,529 | 161,837 | |
| Genocea Biosciences, Inc. (a) | 18,400 | 117,760 | |
| Insmed, Inc. (a) | 45,387 | 740,262 | |
| Intercept Pharmaceuticals, Inc. (a) | 41,431 | 7,312,986 | |
| Spark Therapeutics, Inc. | 15,800 | 913,082 | |
| 32,617,359 | |||
| Health Care Equipment & Supplies - 3.9% | |||
| Abbott Laboratories | 113,525 | 5,099,543 | |
| Alere, Inc. (a) | 373,668 | 15,421,278 | |
| Boston Scientific Corp. (a) | 908,586 | 16,608,952 | |
| Medtronic PLC | 91,700 | 6,908,678 | |
| Neovasc, Inc. (a) | 35,700 | 177,429 | |
| St. Jude Medical, Inc. | 47,200 | 2,978,320 | |
| Zimmer Biomet Holdings, Inc. | 41,800 | 4,222,218 | |
| 51,416,418 | |||
| Health Care Providers & Services - 1.7% | |||
| Express Scripts Holding Co. (a) | 121,310 | 10,369,579 | |
| McKesson Corp. | 61,496 | 11,644,268 | |
| 22,013,847 | |||
| Health Care Technology - 0.0% | |||
| Castlight Health, Inc. Class B (a) | 34,700 | 138,800 | |
| Life Sciences Tools & Services - 0.2% | |||
| Agilent Technologies, Inc. | 49,100 | 2,053,362 | |
| Pharmaceuticals - 4.2% | |||
| Allergan PLC (a) | 9,029 | 2,834,113 | |
| Bristol-Myers Squibb Co. | 8,500 | 569,585 | |
| GlaxoSmithKline PLC sponsored ADR | 425,839�� | 17,250,738 | |
| Jazz Pharmaceuticals PLC (a) | 29,607 | 4,340,090 | |
| Johnson & Johnson | 126,263 | 12,782,866 | |
| Teva Pharmaceutical Industries Ltd. sponsored ADR | 260,791 | 16,411,578 | |
| TherapeuticsMD, Inc. (a) | 226,900 | 1,704,019 | |
| Theravance, Inc. | 44,700 | 413,475 | |
| 56,306,464 | |||
| TOTAL HEALTH CARE | 164,546,250 | ||
| INDUSTRIALS - 13.0% | |||
| Aerospace & Defense - 1.5% | |||
| KEYW Holding Corp. (a) | 135,382 | 865,091 | |
| The Boeing Co. | 91,963 | 13,376,018 | |
| United Technologies Corp. | 61,472 | 5,904,386 | |
| 20,145,495 | |||
| Air Freight & Logistics - 2.0% | |||
| FedEx Corp. | 46,600 | 7,387,964 | |
| Hub Group, Inc. Class A (a) | 96,900 | 3,733,557 | |
| United Parcel Service, Inc. Class B | 146,675 | 15,108,992 | |
| 26,230,513 | |||
| Building Products - 0.3% | |||
| Caesarstone Sdot-Yam Ltd. | 12,000 | 490,560 | |
| Lennox International, Inc. | 24,100 | 3,275,672 | |
| 3,766,232 | |||
| Commercial Services & Supplies - 0.6% | |||
| ADT Corp. (c) | 215,200 | 7,633,144 | |
| Electrical Equipment - 1.2% | |||
| AMETEK, Inc. | 80,130 | 4,524,140 | |
| Eaton Corp. PLC | 43,400 | 2,524,144 | |
| Emerson Electric Co. | 125,100 | 6,255,000 | |
| Hubbell, Inc. Class B | 26,782 | 2,659,185 | |
| 15,962,469 | |||
| Industrial Conglomerates - 3.6% | |||
| General Electric Co. | 1,598,444 | 47,857,413 | |
| Machinery - 0.9% | |||
| Cummins, Inc. | 9,200 | 923,404 | |
| Deere & Co. | 47,500 | 3,779,575 | |
| Ingersoll-Rand PLC | 46,183 | 2,709,557 | |
| Joy Global, Inc. (c) | 43,100 | 661,585 | |
| Rexnord Corp. (a) | 146,400 | 2,990,952 | |
| Xylem, Inc. | 21,000 | 783,720 | |
| 11,848,793 | |||
| Professional Services - 0.3% | |||
| Acacia Research Corp. (c) | 112,537 | 665,094 | |
| Verisk Analytics, Inc. (a) | 49,600 | 3,717,520 | |
| 4,382,614 | |||
| Road & Rail - 2.4% | |||
| CSX Corp. | 400,601 | 11,389,086 | |
| Genesee & Wyoming, Inc. Class A (a) | 70,400 | 4,876,608 | |
| J.B. Hunt Transport Services, Inc. | 63,300 | 4,952,592 | |
| Kansas City Southern | 50,700 | 4,609,644 | |
| Norfolk Southern Corp. | 42,558 | 4,045,563 | |
| Old Dominion Freight Lines, Inc. (a) | 21,900 | 1,395,249 | |
| Union Pacific Corp. | 8,900 | 747,155 | |
| 32,015,897 | |||
| Trading Companies & Distributors - 0.2% | |||
| HD Supply Holdings, Inc. (a) | 99,100 | 3,134,533 | |
| TOTAL INDUSTRIALS | 172,977,103 | ||
| INFORMATION TECHNOLOGY - 22.7% | |||
| Communications Equipment - 3.1% | |||
| Cisco Systems, Inc. | 734,854 | 20,024,772 | |
| QUALCOMM, Inc. | 451,450 | 22,026,246 | |
| 42,051,018 | |||
| Internet Software & Services - 4.3% | |||
| Alphabet, Inc.: | |||
| Class A (a) | 30,756 | 23,462,215 | |
| Class C | 26,937 | 20,003,416 | |
| Facebook, Inc. Class A (a) | 34,500 | 3,596,280 | |
| Twitter, Inc. (a) | 167,300 | 4,249,420 | |
| Yahoo!, Inc. (a) | 176,634 | 5,971,996 | |
| 57,283,327 | |||
| IT Services - 5.4% | |||
| Cognizant Technology Solutions Corp. Class A (a) | 46,884 | 3,027,769 | |
| First Data Corp. | 205,630 | 3,109,126 | |
| First Data Corp. Class A (a)(c) | 147,400 | 2,476,320 | |
| IBM Corp. | 94,081 | 13,116,773 | |
| MasterCard, Inc. Class A | 157,500 | 15,422,400 | |
| Paychex, Inc. | 159,322 | 8,643,219 | |
| PayPal Holdings, Inc. (a) | 97,800 | 3,448,428 | |
| Unisys Corp. (a) | 286,062 | 3,678,757 | |
| Visa, Inc. Class A | 249,420 | 19,706,674 | |
| 72,629,466 | |||
| Semiconductors & Semiconductor Equipment - 0.7% | |||
| Broadcom Corp. Class A | 115,925 | 6,332,983 | |
| Marvell Technology Group Ltd. | 228,700 | 2,026,282 | |
| Maxim Integrated Products, Inc. | 24,700 | 957,619 | |
| 9,316,884 | |||
| Software - 4.5% | |||
| Adobe Systems, Inc. (a) | 50,810 | 4,647,083 | |
| Autodesk, Inc. (a) | 62,681 | 3,978,363 | |
| Microsoft Corp. | 682,254 | 37,080,505 | |
| Oracle Corp. | 245,950 | 9,584,672 | |
| Salesforce.com, Inc. (a) | 54,650 | 4,355,059 | |
| 59,645,682 | |||
| Technology Hardware, Storage & Peripherals - 4.7% | |||
| Apple, Inc. | 381,621 | 45,145,764 | |
| EMC Corp. | 564,900 | 14,314,566 | |
| HP, Inc. | 57,400 | 719,796 | |
| Western Digital Corp. | 30,600 | 1,909,746 | |
| 62,089,872 | |||
| TOTAL INFORMATION TECHNOLOGY | 303,016,249 | ||
| MATERIALS - 3.1% | |||
| Chemicals - 2.6% | |||
| CF Industries Holdings, Inc. | 48,300 | 2,228,562 | |
| E.I. du Pont de Nemours & Co. | 46,515 | 3,132,320 | |
| Intrepid Potash, Inc. (a) | 291,160 | 1,045,264 | |
| LyondellBasell Industries NV Class A | 19,700 | 1,887,654 | |
| Monsanto Co. | 150,717 | 14,342,230 | |
| Potash Corp. of Saskatchewan, Inc. | 244,300 | 4,944,722 | |
| Syngenta AG (Switzerland) | 17,391 | 6,405,105 | |
| W.R. Grace & Co. (a) | 4,100 | 402,702 | |
| 34,388,559 | |||
| Containers & Packaging - 0.4% | |||
| WestRock Co. | 95,389 | 4,829,545 | |
| Metals & Mining - 0.1% | |||
| Freeport-McMoRan, Inc. | 233,100 | 1,906,758 | |
| TOTAL MATERIALS | 41,124,862 | ||
| TELECOMMUNICATION SERVICES - 0.9% | |||
| Diversified Telecommunication Services - 0.9% | |||
| Verizon Communications, Inc. | 257,394 | 11,698,557 | |
| UTILITIES - 0.5% | |||
| Electric Utilities - 0.4% | |||
| Exelon Corp. | 170,300 | 4,650,893 | |
| Independent Power and Renewable Electricity Producers - 0.1% | |||
| Dynegy, Inc. (a) | 95,100 | 1,533,012 | |
| TOTAL UTILITIES | 6,183,905 | ||
| TOTAL COMMON STOCKS | |||
| (Cost $1,164,657,795) | 1,320,649,686 | ||
| Convertible Preferred Stocks - 0.0% | |||
| CONSUMER DISCRETIONARY - 0.0% | |||
| Leisure Products - 0.0% | |||
| NJOY, Inc. Series C (a)(b) | |||
| (Cost $271,645) | 33,607 | 16,679 | |
| Principal Amount | Value | ||
| Convertible Bonds - 0.0% | |||
| ENERGY - 0.0% | |||
| Oil, Gas & Consumable Fuels - 0.0% | |||
| Amyris, Inc. 9.5% 4/15/19(d) | |||
| (Cost $676,000) | 676,000 | 700,505 | |
| Shares | Value | ||
| Money Market Funds - 1.6% | |||
| Fidelity Cash Central Fund, 0.18% (e) | 9,408,014 | 9,408,014 | |
| Fidelity Securities Lending Cash Central Fund, 0.22% (e)(f) | 11,388,275 | 11,388,275 | |
| TOTAL MONEY MARKET FUNDS | |||
| (Cost $20,796,289) | 20,796,289 | ||
| TOTAL INVESTMENT PORTFOLIO - 100.8% | |||
| (Cost $1,186,401,729) | 1,342,163,159 | ||
| NET OTHER ASSETS (LIABILITIES) - (0.8)% | (10,380,575) | ||
| NET ASSETS - 100% | $1,331,782,584 |
Legend
(a) Non-income producing
(b) Restricted securities - Investment in securities not registered under the Securities Act of 1933 (excluding 144A issues). At the end of the period, the value of restricted securities (excluding 144A issues) amounted to $3,804,775 or 0.3% of net assets.
(c) Security or a portion of the security is on loan at period end.
(d) Security exempt from registration under Rule 144A of the Securities Act of 1933. These securities may be resold in transactions exempt from registration, normally to qualified institutional buyers. At the end of the period, the value of these securities amounted to $700,505 or 0.1% of net assets.
(e) Affiliated fund that is generally available only to investment companies and other accounts managed by Fidelity Investments. The rate quoted is the annualized seven-day yield of the fund at period end. A complete unaudited listing of the fund's holdings as of its most recent quarter end is available upon request. In addition, each Fidelity Central Fund's financial statements, which are not covered by the Fund's Report of Independent Registered Public Accounting Firm, are available on the SEC's website or upon request.
(f) Investment made with cash collateral received from securities on loan.
Additional information on each restricted holding is as follows:
| Security | Acquisition Date | Acquisition Cost |
| KKR Renaissance Co-Invest LP unit | 7/25/13 | $3,112,250 |
| NJOY, Inc. | 9/11/13 - 10/24/13 | $936,852 |
| NJOY, Inc. Series C | 6/7/13 | $271,645 |
Affiliated Central Funds
Information regarding fiscal year to date income earned by the Fund from investments in Fidelity Central Funds is as follows:
| Fund | Income earned |
| Fidelity Cash Central Fund | $23,967 |
| Fidelity Securities Lending Cash Central Fund | 312,822 |
| Total | $336,789 |
Investment Valuation
The following is a summary of the inputs used, as of November 30, 2015, involving the Fund's assets and liabilities carried at fair value. The inputs or methodology used for valuing securities may not be an indication of the risk associated with investing in those securities. For more information on valuation inputs, and their aggregation into the levels used below, please refer to the Investment Valuation section in the accompanying Notes to Financial Statements.
| Valuation Inputs at Reporting Date: | ||||
| Description | Total | Level 1 | Level 2 | Level 3 |
| Investments in Securities: | ||||
| Equities: | ||||
| Consumer Discretionary | $121,650,658 | $121,633,978 | $-- | $16,680 |
| Consumer Staples | 89,348,139 | 81,349,922 | 7,998,217 | -- |
| Energy | 119,382,530 | 119,382,530 | -- | -- |
| Financials | 290,738,112 | 286,441,362 | 508,655 | 3,788,095 |
| Health Care | 164,546,250 | 164,546,250 | -- | -- |
| Industrials | 172,977,103 | 172,977,103 | -- | -- |
| Information Technology | 303,016,249 | 299,907,123 | 3,109,126 | -- |
| Materials | 41,124,862 | 34,719,757 | 6,405,105 | -- |
| Telecommunication Services | 11,698,557 | 11,698,557 | -- | -- |
| Utilities | 6,183,905 | 6,183,905 | -- | -- |
| Corporate Bonds | 700,505 | -- | 700,505 | -- |
| Money Market Funds | 20,796,289 | 20,796,289 | -- | -- |
| Total Investments in Securities: | $1,342,163,159 | $1,319,636,776 | $18,721,608 | $3,804,775 |
See accompanying notes which are an integral part of the financial statements.
Financial Statements
Statement of Assets and Liabilities
| November 30, 2015 | ||
| Assets | ||
| Investment in securities, at value (including securities loaned of $11,407,091) — See accompanying schedule: Unaffiliated issuers (cost $1,165,605,440) | $1,321,366,870 | |
| Fidelity Central Funds (cost $20,796,289) | 20,796,289 | |
| Total Investments (cost $1,186,401,729) | $1,342,163,159 | |
| Receivable for investments sold | 4,847,281 | |
| Receivable for fund shares sold | 790,933 | |
| Dividends receivable | 2,988,971 | |
| Interest receivable | 7,314 | |
| Distributions receivable from Fidelity Central Funds | 28,931 | |
| Prepaid expenses | 3,261 | |
| Other receivables | 858 | |
| Total assets | 1,350,830,708 | |
| Liabilities | ||
| Payable for investments purchased | $2,183,811 | |
| Payable for fund shares redeemed | 4,234,758 | |
| Accrued management fee | 609,818 | |
| Distribution and service plan fees payable | 329,404 | |
| Other affiliated payables | 252,494 | |
| Other payables and accrued expenses | 49,564 | |
| Collateral on securities loaned, at value | 11,388,275 | |
| Total liabilities | 19,048,124 | |
| Net Assets | $1,331,782,584 | |
| Net Assets consist of: | ||
| Paid in capital | $1,142,721,550 | |
| Undistributed net investment income | 9,266,812 | |
| Accumulated undistributed net realized gain (loss) on investments and foreign currency transactions | 24,037,902 | |
| Net unrealized appreciation (depreciation) on investments and assets and liabilities in foreign currencies | 155,756,320 | |
| Net Assets | $1,331,782,584 | |
| Calculation of Maximum Offering Price | ||
| Class A: | ||
| Net Asset Value and redemption price per share ($469,026,196 ÷ 16,679,126 shares) | $28.12 | |
| Maximum offering price per share (100/94.25 of $28.12) | $29.84 | |
| Class T: | ||
| Net Asset Value and redemption price per share ($177,559,883 ÷ 6,336,184 shares) | $28.02 | |
| Maximum offering price per share (100/96.50 of $28.02) | $29.04 | |
| Class B: | ||
| Net Asset Value and offering price per share ($4,835,465 ÷ 185,194 shares)(a) | $26.11 | |
| Class C: | ||
| Net Asset Value and offering price per share ($181,956,807 ÷ 7,080,515 shares)(a) | $25.70 | |
| Class I: | ||
| Net Asset Value, offering price and redemption price per share ($498,404,233 ÷ 17,012,816 shares) | $29.30 |
(a) Redemption price per share is equal to net asset value less any applicable contingent deferred sales charge.
See accompanying notes which are an integral part of the financial statements.
Statement of Operations
| Year ended November 30, 2015 | ||
| Investment Income | ||
| Dividends | $27,054,554 | |
| Interest | 23,447 | |
| Income from Fidelity Central Funds | 336,789 | |
| Total income | 27,414,790 | |
| Expenses | ||
| Management fee | ||
| Basic fee | $7,364,032 | |
| Performance adjustment | 1,354,162 | |
| Transfer agent fees | 2,666,022 | |
| Distribution and service plan fees | 3,947,316 | |
| Accounting and security lending fees | 430,252 | |
| Custodian fees and expenses | 59,524 | |
| Independent trustees' compensation | 5,719 | |
| Registration fees | 125,412 | |
| Audit | 59,790 | |
| Legal | 4,964 | |
| Miscellaneous | 7,427 | |
| Total expenses before reductions | 16,024,620 | |
| Expense reductions | (53,587) | 15,971,033 |
| Net investment income (loss) | 11,443,757 | |
| Realized and Unrealized Gain (Loss) | ||
| Net realized gain (loss) on: | ||
| Investment securities: | ||
| Unaffiliated issuers | 29,710,390 | |
| Foreign currency transactions | 17,228 | |
| Total net realized gain (loss) | 29,727,618 | |
| Change in net unrealized appreciation (depreciation) on: Investment securities | (63,999,185) | |
| Assets and liabilities in foreign currencies | (7,945) | |
| Total change in net unrealized appreciation (depreciation) | (64,007,130) | |
| Net gain (loss) | (34,279,512) | |
| Net increase (decrease) in net assets resulting from operations | $(22,835,755) |
See accompanying notes which are an integral part of the financial statements.
Statement of Changes in Net Assets
| Year ended November 30, 2015 | Year ended November 30, 2014 | |
| Increase (Decrease) in Net Assets | ||
| Operations | ||
| Net investment income (loss) | $11,443,757 | $6,461,156 |
| Net realized gain (loss) | 29,727,618 | 41,893,521 |
| Change in net unrealized appreciation (depreciation) | (64,007,130) | 75,995,975 |
| Net increase (decrease) in net assets resulting from operations | (22,835,755) | 124,350,652 |
| Distributions to shareholders from net investment income | (5,828,260) | (4,161,808) |
| Distributions to shareholders from net realized gain | (37,026,970) | (46,319,957) |
| Total distributions | (42,855,230) | (50,481,765) |
| Share transactions - net increase (decrease) | 119,504,310 | 553,374,307 |
| Total increase (decrease) in net assets | 53,813,325 | 627,243,194 |
| Net Assets | ||
| Beginning of period | 1,277,969,259 | 650,726,065 |
| End of period (including undistributed net investment income of $9,266,812 and undistributed net investment income of $5,775,521, respectively) | $1,331,782,584 | $1,277,969,259 |
See accompanying notes which are an integral part of the financial statements.
Financial Highlights — Fidelity Advisor Large Cap Fund Class A
| Years ended November 30, | 2015 | 2014 | 2013 | 2012 | 2011 |
| Selected Per–Share Data | |||||
| Net asset value, beginning of period | $29.60 | $28.11 | $20.43 | $17.57 | $16.69 |
| Income from Investment Operations | |||||
| Net investment income (loss)A | .25 | .20 | .16 | .15 | .09 |
| Net realized and unrealized gain (loss) | (.74) | 3.45 | 7.61 | 3.30 | .87 |
| Total from investment operations | (.49) | 3.65 | 7.77 | 3.45 | .96 |
| Distributions from net investment income | (.14) | (.22) | (.02) | (.18) | (.06) |
| Distributions from net realized gain | (.85) | (1.94) | (.07) | (.41) | (.02) |
| Total distributions | (.99) | (2.16) | (.09) | (.59) | (.08) |
| Net asset value, end of period | $28.12 | $29.60 | $28.11 | $20.43 | $17.57 |
| Total ReturnB,C | (1.57)% | 14.13% | 38.16% | 19.69% | 5.73% |
| Ratios to Average Net AssetsD,E | |||||
| Expenses before reductions | 1.15% | 1.30% | 1.26% | 1.25% | 1.29% |
| Expenses net of fee waivers, if any | 1.15% | 1.25% | 1.26% | 1.25% | 1.29% |
| Expenses net of all reductions | 1.15% | 1.25% | 1.24% | 1.24% | 1.28% |
| Net investment income (loss) | .90% | .72% | .68% | .76% | .49% |
| Supplemental Data | |||||
| Net assets, end of period (000 omitted) | $469,026 | $414,421 | $214,686 | $123,303 | $103,670 |
| Portfolio turnover rateF | 31% | 28% | 54% | 59% | 83% |
A Calculated based on average shares outstanding during the period.
B Total returns would have been lower if certain expenses had not been reduced during the applicable periods shown.
C Total returns do not include the effect of the sales charges.
D Fees and expenses of any underlying Fidelity Central Funds are not included in the Fund's expense ratio. The Fund indirectly bears its proportionate share of the expenses of any underlying Fidelity Central Funds.
E Expense ratios reflect operating expenses of the class. Expenses before reductions do not reflect amounts reimbursed by the investment adviser or reductions from brokerage service arrangements or reductions from other expense offset arrangements and do not represent the amount paid by the class during periods when reimbursements or reductions occur. Expenses net of fee waivers reflect expenses after reimbursement by the investment adviser but prior to reductions from brokerage service arrangements or other expense offset arrangements. Expenses net of all reductions represent the net expenses paid by the class.
F Amount does not include the portfolio activity of any underlying Fidelity Central Funds.
See accompanying notes which are an integral part of the financial statements.
Financial Highlights — Fidelity Advisor Large Cap Fund Class T
| Years ended November 30, | 2015 | 2014 | 2013 | 2012 | 2011 |
| Selected Per–Share Data | |||||
| Net asset value, beginning of period | $29.50 | $28.02 | $20.41 | $17.51 | $16.63 |
| Income from Investment Operations | |||||
| Net investment income (loss)A | .18 | .13 | .10 | .10 | .04 |
| Net realized and unrealized gain (loss) | (.74) | 3.44 | 7.59 | 3.29 | .87 |
| Total from investment operations | (.56) | 3.57 | 7.69 | 3.39 | .91 |
| Distributions from net investment income | (.07) | (.15) | (.01) | (.10) | –B |
| Distributions from net realized gain | (.85) | (1.94) | (.07) | (.39) | (.02) |
| Total distributions | (.92) | (2.09) | (.08) | (.49) | (.03)C |
| Net asset value, end of period | $28.02 | $29.50 | $28.02 | $20.41 | $17.51 |
| Total ReturnD,E | (1.84)% | 13.83% | 37.82% | 19.39% | 5.44% |
| Ratios to Average Net AssetsF,G | |||||
| Expenses before reductions | 1.41% | 1.56% | 1.51% | 1.49% | 1.54% |
| Expenses net of fee waivers, if any | 1.41% | 1.50% | 1.51% | 1.49% | 1.54% |
| Expenses net of all reductions | 1.41% | 1.50% | 1.49% | 1.49% | 1.53% |
| Net investment income (loss) | .63% | .47% | .42% | .52% | .24% |
| Supplemental Data | |||||
| Net assets, end of period (000 omitted) | $177,560 | $170,613 | $114,864 | $76,151 | $69,678 |
| Portfolio turnover rateH | 31% | 28% | 54% | 59% | 83% |
A Calculated based on average shares outstanding during the period.
B Amount represents less than $.005 per share.
C Total distributions of $.03 per share is comprised of distributions from net investment income of $.004 and distributions from net realized gain of $.021 per share.
D Total returns would have been lower if certain expenses had not been reduced during the applicable periods shown.
E Total returns do not include the effect of the sales charges.
F Fees and expenses of any underlying Fidelity Central Funds are not included in the Fund's expense ratio. The Fund indirectly bears its proportionate share of the expenses of any underlying Fidelity Central Funds.
G Expense ratios reflect operating expenses of the class. Expenses before reductions do not reflect amounts reimbursed by the investment adviser or reductions from brokerage service arrangements or reductions from other expense offset arrangements and do not represent the amount paid by the class during periods when reimbursements or reductions occur. Expenses net of fee waivers reflect expenses after reimbursement by the investment adviser but prior to reductions from brokerage service arrangements or other expense offset arrangements. Expenses net of all reductions represent the net expenses paid by the class.
H Amount does not include the portfolio activity of any underlying Fidelity Central Funds.
See accompanying notes which are an integral part of the financial statements.
Financial Highlights — Fidelity Advisor Large Cap Fund Class B
| Years ended November 30, | 2015 | 2014 | 2013 | 2012 | 2011 |
| Selected Per–Share Data | |||||
| Net asset value, beginning of period | $27.52 | $26.24 | $19.21 | $16.49 | $15.72 |
| Income from Investment Operations | |||||
| Net investment income (loss)A | .01 | (.01) | (.03) | –B | (.05) |
| Net realized and unrealized gain (loss) | (.69) | 3.23 | 7.13 | 3.10 | .82 |
| Total from investment operations | (.68) | 3.22 | 7.10 | 3.10 | .77 |
| Distributions from net investment income | – | – | – | – | – |
| Distributions from net realized gain | (.73) | (1.94) | (.07) | (.38) | – |
| Total distributions | (.73) | (1.94) | (.07) | (.38) | – |
| Net asset value, end of period | $26.11 | $27.52 | $26.24 | $19.21 | $16.49 |
| Total ReturnC,D | (2.42)% | 13.30% | 37.08% | 18.77% | 4.90% |
| Ratios to Average Net AssetsE,F | |||||
| Expenses before reductions | 2.00% | 2.16% | 2.06% | 2.02% | 2.04% |
| Expenses net of fee waivers, if any | 1.99% | 2.00% | 2.06% | 2.02% | 2.04% |
| Expenses net of all reductions | 1.99% | 2.00% | 2.05% | 2.01% | 2.04% |
| Net investment income (loss) | .05% | (.03)% | (.13)% | (.01)% | (.26)% |
| Supplemental Data | |||||
| Net assets, end of period (000 omitted) | $4,835 | $8,401 | $10,499 | $10,535 | $12,839 |
| Portfolio turnover rateG | 31% | 28% | 54% | 59% | 83% |
A Calculated based on average shares outstanding during the period.
B Amount represents less than $.005 per share.
C Total returns would have been lower if certain expenses had not been reduced during the applicable periods shown.
D Total returns do not include the effect of the contingent deferred sales charge.
E Fees and expenses of any underlying Fidelity Central Funds are not included in the Fund's expense ratio. The Fund indirectly bears its proportionate share of the expenses of any underlying Fidelity Central Funds.
F Expense ratios reflect operating expenses of the class. Expenses before reductions do not reflect amounts reimbursed by the investment adviser or reductions from brokerage service arrangements or reductions from other expense offset arrangements and do not represent the amount paid by the class during periods when reimbursements or reductions occur. Expenses net of fee waivers reflect expenses after reimbursement by the investment adviser but prior to reductions from brokerage service arrangements or other expense offset arrangements. Expenses net of all reductions represent the net expenses paid by the class.
G Amount does not include the portfolio activity of any underlying Fidelity Central Funds.
See accompanying notes which are an integral part of the financial statements.
Financial Highlights — Fidelity Advisor Large Cap Fund Class C
| Years ended November 30, | 2015 | 2014 | 2013 | 2012 | 2011 |
| Selected Per–Share Data | |||||
| Net asset value, beginning of period | $27.21 | $26.07 | $19.08 | $16.41 | $15.65 |
| Income from Investment Operations | |||||
| Net investment income (loss)A | .04 | (.01) | (.02) | –B | (.04) |
| Net realized and unrealized gain (loss) | (.69) | 3.19 | 7.08 | 3.09 | .80 |
| Total from investment operations | (.65) | 3.18 | 7.06 | 3.09 | .76 |
| Distributions from net investment income | (.01) | (.10) | –B | (.03) | – |
| Distributions from net realized gain | (.85) | (1.94) | (.07) | (.39) | – |
| Total distributions | (.86) | (2.04) | (.07) | (.42) | – |
| Net asset value, end of period | $25.70 | $27.21 | $26.07 | $19.08 | $16.41 |
| Total ReturnC,D | (2.33)% | 13.31% | 37.14% | 18.83% | 4.86% |
| Ratios to Average Net AssetsE,F | |||||
| Expenses before reductions | 1.90% | 2.05% | 2.00% | 2.00% | 2.03% |
| Expenses net of fee waivers, if any | 1.90% | 2.00% | 2.00% | 2.00% | 2.03% |
| Expenses net of all reductions | 1.90% | 2.00% | 1.99% | 1.99% | 2.03% |
| Net investment income (loss) | .14% | (.03)% | (.07)% | .01% | (.25)% |
| Supplemental Data | |||||
| Net assets, end of period (000 omitted) | $181,957 | $168,763 | $67,780 | $28,856 | $24,197 |
| Portfolio turnover rateG | 31% | 28% | 54% | 59% | 83% |
A Calculated based on average shares outstanding during the period.
B Amount represents less than $.005 per share.
C Total returns would have been lower if certain expenses had not been reduced during the applicable periods shown.
D Total returns do not include the effect of the contingent deferred sales charge.
E Fees and expenses of any underlying Fidelity Central Funds are not included in the Fund's expense ratio. The Fund indirectly bears its proportionate share of the expenses of any underlying Fidelity Central Funds.
F Expense ratios reflect operating expenses of the class. Expenses before reductions do not reflect amounts reimbursed by the investment adviser or reductions from brokerage service arrangements or reductions from other expense offset arrangements and do not represent the amount paid by the class during periods when reimbursements or reductions occur. Expenses net of fee waivers reflect expenses after reimbursement by the investment adviser but prior to reductions from brokerage service arrangements or other expense offset arrangements. Expenses net of all reductions represent the net expenses paid by the class.
G Amount does not include the portfolio activity of any underlying Fidelity Central Funds.
See accompanying notes which are an integral part of the financial statements.
Financial Highlights — Fidelity Advisor Large Cap Fund Class I
| Years ended November 30, | 2015 | 2014 | 2013 | 2012 | 2011 |
| Selected Per–Share Data | |||||
| Net asset value, beginning of period | $30.78 | $29.03 | $21.03 | $18.13 | $17.22 |
| Income from Investment Operations | |||||
| Net investment income (loss)A | .34 | .28 | .24 | .22 | .15 |
| Net realized and unrealized gain (loss) | (.78) | 3.59 | 7.85 | 3.40 | .89 |
| Total from investment operations | (.44) | 3.87 | 8.09 | 3.62 | 1.04 |
| Distributions from net investment income | (.20) | (.18) | (.02) | (.31) | (.11) |
| Distributions from net realized gain | (.85) | (1.94) | (.07) | (.41) | (.02) |
| Total distributions | (1.04)B | (2.12) | (.09) | (.72) | (.13) |
| Net asset value, end of period | $29.30 | $30.78 | $29.03 | $21.03 | $18.13 |
| Total ReturnC | (1.33)% | 14.43% | 38.62% | 20.10% | 6.03% |
| Ratios to Average Net AssetsD,E | |||||
| Expenses before reductions | .89% | 1.04% | .95% | .91% | .95% |
| Expenses net of fee waivers, if any | .89% | 1.00% | .95% | .91% | .95% |
| Expenses net of all reductions | .89% | 1.00% | .94% | .91% | .94% |
| Net investment income (loss) | 1.15% | .97% | .98% | 1.10% | .83% |
| Supplemental Data | |||||
| Net assets, end of period (000 omitted) | $498,404 | $515,771 | $242,897 | $1,071,491 | $1,013,999 |
| Portfolio turnover rateF | 31% | 28% | 54% | 59% | 83% |
A Calculated based on average shares outstanding during the period.
B Total distributions of $1.04 per share is comprised of distributions from net investment income of $.195 and distributions from net realized gain of $.849 per share.
C Total returns would have been lower if certain expenses had not been reduced during the applicable periods shown.
D Fees and expenses of any underlying Fidelity Central Funds are not included in the Fund's expense ratio. The Fund indirectly bears its proportionate share of the expenses of any underlying Fidelity Central Funds.
E Expense ratios reflect operating expenses of the class. Expenses before reductions do not reflect amounts reimbursed by the investment adviser or reductions from brokerage service arrangements or reductions from other expense offset arrangements and do not represent the amount paid by the class during periods when reimbursements or reductions occur. Expenses net of fee waivers reflect expenses after reimbursement by the investment adviser but prior to reductions from brokerage service arrangements or other expense offset arrangements. Expenses net of all reductions represent the net expenses paid by the class.
F Amount does not include the portfolio activity of any underlying Fidelity Central Funds.
See accompanying notes which are an integral part of the financial statements.
Notes to Financial Statements
For the period ended November 30, 2015
1. Organization.
Fidelity Advisor Large Cap Fund (the Fund) is a fund of Fidelity Advisor Series I (the Trust) and is authorized to issue an unlimited number of shares. The Trust is registered under the Investment Company Act of 1940, as amended (the 1940 Act), as an open-end management investment company organized as a Massachusetts business trust. The Fund offers Class A, Class T, Class C and Class I (formerly Institutional Class) shares, each of which, along with Class B shares, has equal rights as to assets and voting privileges. Class B shares are closed to new accounts and additional purchases, except for exchanges and reinvestments. Each class has exclusive voting rights with respect to matters that affect that class. Class B shares will automatically convert to Class A shares after a holding period of seven years from the initial date of purchase.
2. Investments in Fidelity Central Funds.
The Fund invests in Fidelity Central Funds, which are open-end investment companies generally available only to other investment companies and accounts managed by the investment adviser and its affiliates. The Fund's Schedule of Investments lists each of the Fidelity Central Funds held as of period end, if any, as an investment of the Fund, but does not include the underlying holdings of each Fidelity Central Fund. As an Investing Fund, the Fund indirectly bears its proportionate share of the expenses of the underlying Fidelity Central Funds.
The Money Market Central Funds seek preservation of capital and current income and are managed by Fidelity Investments Money Management, Inc. (FIMM), an affiliate of the investment adviser. Annualized expenses of the Money Market Central Funds as of their most recent shareholder report date are less than .005%.
A complete unaudited list of holdings for each Fidelity Central Fund is available upon request or at the Securities and Exchange Commission (the SEC) website at www.sec.gov. In addition, the financial statements of the Fidelity Central Funds, which are not covered by the Fund's Report of Independent Registered Public Accounting Firm, are available on the SEC website or upon request.
3. Significant Accounting Policies.
The financial statements have been prepared in conformity with accounting principles generally accepted in the United States of America (GAAP), which require management to make certain estimates and assumptions at the date of the financial statements. Actual results could differ from those estimates. Subsequent events, if any, through the date that the financial statements were issued have been evaluated in the preparation of the financial statements. The following summarizes the significant accounting policies of the Fund:
Investment Valuation. Investments are valued as of 4:00 p.m. Eastern time on the last calendar day of the period. The Board of Trustees (the Board) has delegated the day to day responsibility for the valuation of the Fund's investments to the Fidelity Management & Research Company (FMR) Fair Value Committee (the Committee). In accordance with valuation policies and procedures approved by the Board, the Fund attempts to obtain prices from one or more third party pricing vendors or brokers to value its investments. When current market prices, quotations or currency exchange rates are not readily available or reliable, investments will be fair valued in good faith by the Committee, in accordance with procedures adopted by the Board. Factors used in determining fair value vary by investment type and may include market or investment specific events, changes in interest rates and credit quality. The frequency with which these procedures are used cannot be predicted and they may be utilized to a significant extent. The Committee oversees the Fund's valuation policies and procedures and reports to the Board on the Committee's activities and fair value determinations. The Board monitors the appropriateness of the procedures used in valuing the Fund's investments and ratifies the fair value determinations of the Committee.
The Fund categorizes the inputs to valuation techniques used to value its investments into a disclosure hierarchy consisting of three levels as shown below:
- Level 1 – quoted prices in active markets for identical investments
- Level 2 – other significant observable inputs (including quoted prices for similar investments, interest rates, prepayment speeds, etc.)
- Level 3 – unobservable inputs (including the Fund's own assumptions based on the best information available)
Valuation techniques used to value the Fund's investments by major category are as follows:
Equity securities, including restricted securities, for which market quotations are readily available, are valued at the last reported sale price or official closing price as reported by a third party pricing vendor on the primary market or exchange on which they are traded and are categorized as Level 1 in the hierarchy. In the event there were no sales during the day or closing prices are not available, securities are valued at the last quoted bid price or may be valued using the last available price and are generally categorized as Level 2 in the hierarchy. For foreign equity securities, when market or security specific events arise, comparisons to the valuation of American Depositary Receipts (ADRs), futures contracts, Exchange-Traded Funds (ETFs) and certain indexes as well as quoted prices for similar securities may be used and would be categorized as Level 2 in the hierarchy. Utilizing these techniques may result in transfers between Level 1 and Level 2. For equity securities, including restricted securities, where observable inputs are limited, assumptions about market activity and risk are used and these securities may be categorized as Level 3 in the hierarchy.
Debt securities, including restricted securities, are valued based on evaluated prices received from third party pricing vendors or from brokers who make markets in such securities. Corporate bonds are valued by pricing vendors who utilize matrix pricing which considers yield or price of bonds of comparable quality, coupon, maturity and type or by broker-supplied prices. When independent prices are unavailable or unreliable, debt securities may be valued utilizing pricing methodologies which consider similar factors that would be used by third party pricing vendors. Debt securities are generally categorized as Level 2 in the hierarchy but may be Level 3 depending on the circumstances.
Investments in open-end mutual funds, including the Fidelity Central Funds, are valued at their closing net asset value (NAV) each business day and are categorized as Level 1 in the hierarchy.
Changes in valuation techniques may result in transfers in or out of an assigned level within the disclosure hierarchy. The aggregate value of investments by input level as of November 30, 2015 is included at the end of the Fund's Schedule of Investments.
Foreign Currency. The Fund may use foreign currency contracts to facilitate transactions in foreign-denominated securities. Gains and losses from these transactions may arise from changes in the value of the foreign currency or if the counterparties do not perform under the contracts' terms.
Foreign-denominated assets, including investment securities, and liabilities are translated into U.S. dollars at the exchange rates at period end. Purchases and sales of investment securities, income and dividends received and expenses denominated in foreign currencies are translated into U.S. dollars at the exchange rate in effect on the transaction date.
The effects of exchange rate fluctuations on investments are included with the net realized and unrealized gain (loss) on investment securities. Other foreign currency transactions resulting in realized and unrealized gain (loss) are disclosed separately.
Investment Transactions and Income. For financial reporting purposes, the Fund's investment holdings and NAV include trades executed through the end of the last business day of the period. The NAV per share for processing shareholder transactions is calculated as of the close of business of the New York Stock Exchange (NYSE), normally 4:00 p.m. Eastern time and includes trades executed through the end of the prior business day. Gains and losses on securities sold are determined on the basis of identified cost and may include proceeds received from litigation. Dividend income is recorded on the ex-dividend date, except for certain dividends from foreign securities where the ex-dividend date may have passed, which are recorded as soon as the Fund is informed of the ex-dividend date. Non-cash dividends included in dividend income, if any, are recorded at the fair market value of the securities received. Income and capital gain distributions from Fidelity Central Funds, if any, are recorded on the ex-dividend date. Distributions received on securities that represent a return of capital or capital gain are recorded as a reduction of cost of investments and/or as a realized gain. Subsequent to ex-dividend date the Fund determines the components of these distributions, based upon receipt of tax filings or other correspondence relating to the underlying investment. Interest income is accrued as earned and includes coupon interest and amortization of premium and accretion of discount on debt securities as applicable. Investment income is recorded net of foreign taxes withheld where recovery of such taxes is uncertain.
Class Allocations and Expenses. Investment income, realized and unrealized capital gains and losses, common expenses of the Fund, and certain fund-level expense reductions, if any, are allocated daily on a pro-rata basis to each class based on the relative net assets of each class to the total net assets of the Fund. Each class differs with respect to transfer agent and distribution and service plan fees incurred. Certain expense reductions may also differ by class. For the reporting period, the allocated portion of income and expenses to each class as a percent of its average net assets may vary due to the timing of recording these transactions in relation to fluctuating net assets of the classes. Expenses directly attributable to a fund are charged to that fund. Expenses attributable to more than one fund are allocated among the respective funds on the basis of relative net assets or other appropriate methods. Expense estimates are accrued in the period to which they relate and adjustments are made when actual amounts are known.
Income Tax Information and Distributions to Shareholders. Each year, the Fund intends to qualify as a regulated investment company under Subchapter M of the Internal Revenue Code, including distributing substantially all of its taxable income and realized gains. As a result, no provision for U.S. Federal income taxes is required. As of November 30, 2015, the Fund did not have any unrecognized tax benefits in the financial statements; nor is the Fund aware of any tax positions for which it is reasonably possible that the total amounts of unrecognized tax benefits will significantly change in the next twelve months. The Fund files a U.S. federal tax return, in addition to state and local tax returns as required. The Fund's federal income tax returns are subject to examination by the Internal Revenue Service (IRS) for a period of three fiscal years after they are filed. State and local tax returns may be subject to examination for an additional fiscal year depending on the jurisdiction. Foreign taxes are provided for based on the Fund's understanding of the tax rules and rates that exist in the foreign markets in which it invests.
Distributions are declared and recorded on the ex-dividend date. Income dividends and capital gain distributions are declared separately for each class. Income and capital gain distributions are determined in accordance with income tax regulations, which may differ from GAAP. In addition, the Fund claimed a portion of the payment made to redeeming shareholders as a distribution for income tax purposes.
Capital accounts within the financial statements are adjusted for permanent book-tax differences. These adjustments have no impact on net assets or the results of operations. Capital accounts are not adjusted for temporary book-tax differences which will reverse in a subsequent period.
Book-tax differences are primarily due to partnerships, foreign currency transactions, deferred trustees compensation and losses deferred due to wash sales.
The federal tax cost of investment securities and unrealized appreciation (depreciation) as of period end were as follows:
| Gross unrealized appreciation | $248,701,371 |
| Gross unrealized depreciation | (97,078,194) |
| Net unrealized appreciation (depreciation) on securities | $151,623,177 |
| Tax Cost | $1,190,539,982 |
The tax-based components of distributable earnings as of period end were as follows:
| Undistributed ordinary income | $9,266,825 |
| Undistributed long-term capital gain | $28,176,155 |
| Net unrealized appreciation (depreciation) on securities and other investments | $151,618,067 |
The tax character of distributions paid was as follows:
| November 30, 2015 | November 30, 2014 | |
| Ordinary Income | $11,250,007 | $ 4,161,808 |
| Long-term Capital Gains | 31,605,223 | 46,319,957 |
| Total | $42,855,230 | $ 50,481,765 |
Restricted Securities. The Fund may invest in securities that are subject to legal or contractual restrictions on resale. These securities generally may be resold in transactions exempt from registration or to the public if the securities are registered. Disposal of these securities may involve time-consuming negotiations and expense, and prompt sale at an acceptable price may be difficult. Information regarding restricted securities is included at the end of the Fund's Schedule of Investments.
4. Purchases and Sales of Investments.
Purchases and sales of securities, other than short-term securities, aggregated $519,590,858 and $404,008,132, respectively.
5. Fees and Other Transactions with Affiliates.
Management Fee. Fidelity Management & Research Company (the investment adviser) and its affiliates provide the Fund with investment management related services for which the Fund pays a monthly management fee. The management fee is the sum of an individual fund fee rate that is based on an annual rate of .30% of the Fund's average net assets and an annualized group fee rate that averaged .25% during the period. The group fee rate is based upon the average net assets of all the mutual funds advised by the investment adviser, including any mutual funds previously advised by the investment adviser that are currently advised by Fidelity SelectCo, LLC, an affiliate of the investment adviser. The group fee rate decreases as assets under management increase and increases as assets under management decrease. In addition, the management fee is subject to a performance adjustment (up to a maximum of +/- .20% of the Fund's average net assets over a 36 month performance period). The upward or downward adjustment to the management fee is based on the relative investment performance of Class I of the Fund as compared to its benchmark index, the S&P 500 Index, over the same 36 month performance period. For the reporting period, the total annual management fee rate, including the performance adjustment, was .65% of the Fund's average net assets. The performance adjustment included in the management fee rate may be higher or lower than the maximum performance adjustment rate due to the difference between the average net assets for the reporting and performance periods.
Distribution and Service Plan Fees. In accordance with Rule 12b-1 of the 1940 Act, the Fund has adopted separate Distribution and Service Plans for each class of shares. Certain classes pay Fidelity Distributors Corporation (FDC), an affiliate of the investment adviser, separate Distribution and Service Fees, each of which is based on an annual percentage of each class' average net assets. In addition, FDC may pay financial intermediaries for selling shares of the Fund and providing shareholder support services. For the period, the Distribution and Service Fee rates, total fees and amounts retained by FDC were as follows:
| Distribution Fee | Service Fee | Total Fees | Retained by FDC | |
| Class A | -% | .25% | $1,153,574 | $44,899 |
| Class T | .25% | .25% | 897,464 | 1,279 |
| Class B | .75% | .25% | 64,851 | 49,204 |
| Class C | .75% | .25% | 1,831,427 | 727,520 |
| $3,947,316 | $822,902 |
Sales Load. FDC may receive a front-end sales charge of up to 5.75% for selling Class A shares and 3.50% for selling Class T shares, some of which is paid to financial intermediaries for selling shares of the Fund. Depending on the holding period, FDC may receive contingent deferred sales charges levied on Class A, Class T, Class B, and Class C redemptions. The deferred sales charges range from 5.00% to 1.00% for Class B shares, 1.00% for Class C shares, 1.00% for certain purchases of Class A shares and .25% for certain purchases of Class T shares.
For the period, sales charge amounts retained by FDC were as follows:
| Retained by FDC | |
| Class A | $217,284 |
| Class T | 30,621 |
| Class B(a) | 1,454 |
| Class C(a) | 39,172 |
| $288,531 |
(a) When Class B and Class C shares are initially sold, FDC pays commissions from its own resources to financial intermediaries through which the sales are made.
Transfer Agent Fees. Fidelity Investments Institutional Operations Company, Inc., (FIIOC), an affiliate of the investment adviser, is the transfer, dividend disbursing and shareholder servicing agent for each class of the Fund. FIIOC receives account fees and asset-based fees that vary according to the account size and type of account of the shareholders of the respective classes of the Fund. FIIOC pays for typesetting, printing and mailing of shareholder reports, except proxy statements.
For the period, transfer agent fees for each class were as follows:
| Amount | % of Class-Level Average Net Assets | |
| Class A | $914,888 | .20 |
| Class T | 379,869 | .21 |
| Class B | 19,635 | .30 |
| Class C | 373,434 | .20 |
| Class I | 978,196 | .19 |
| $2,666,022 |
Accounting and Security Lending Fees. Fidelity Service Company, Inc. (FSC), an affiliate of the investment adviser, maintains the Fund's accounting records. The accounting fee is based on the level of average net assets for each month. Under a separate contract, FSC administers the security lending program. The security lending fee is based on the number and duration of lending transactions.
Brokerage Commissions. The Fund placed a portion of its portfolio transactions with brokerage firms which are affiliates of the investment adviser. Brokerage commissions are included in net realized gain (loss) and change in net unrealized appreciation (depreciation) in the Statement of Operations. The commissions paid to these affiliated firms were $8,062 for the period.
6. Committed Line of Credit.
The Fund participates with other funds managed by the investment adviser or an affiliate in a $4.25 billion credit facility (the "line of credit") to be utilized for temporary or emergency purposes to fund shareholder redemptions or for other short-term liquidity purposes. The Fund has agreed to pay commitment fees on its pro-rata portion of the line of credit, which amounted to $1,889 and is reflected in Miscellaneous expenses on the Statement of Operations. During the period, the Fund did not borrow on this line of credit.
7. Security Lending.
The Fund lends portfolio securities through a lending agent from time to time in order to earn additional income. For equity securities, a lending agent is used and may loan securities to certain qualified borrowers, including Fidelity Capital Markets (FCM), a broker-dealer affiliated with the Fund. On the settlement date of the loan, the Fund receives collateral (in the form of U.S. Treasury obligations, letters of credit and/or cash) against the loaned securities and maintains collateral in an amount not less than 100% of the market value of the loaned securities during the period of the loan. The market value of the loaned securities is determined at the close of business of the Fund and any additional required collateral is delivered to the Fund on the next business day. The Fund or borrower may terminate the loan at any time, and if the borrower defaults on its obligation to return the securities loaned because of insolvency or other reasons, the Fund may apply collateral received from the borrower against the obligation. The Fund may experience delays and costs in recovering the securities loaned. Any cash collateral received is invested in the Fidelity Securities Lending Cash Central Fund. The value of loaned securities and cash collateral at period end are disclosed on the Fund's Statement of Assets and Liabilities. At period end, there were no security loans outstanding with FCM. Security lending income represents the income earned on investing cash collateral, less rebates paid to borrowers and any lending agent fees associated with the loan, plus any premium payments received for lending certain types of securities. Security lending income is presented in the Statement of Operations as a component of income from Fidelity Central Funds. Total security lending income during the period amounted to $312,822, including $199 from securities loaned to FCM.
8. Expense Reductions.
The investment adviser contractually agreed to reimburse each class to the extent annual operating expenses exceeded certain levels of average net assets as noted in the table below. This reimbursement remained in place through January 31, 2015. Some expenses, for example interest expense, including commitment fees, are excluded from this reimbursement.
The following classes were in reimbursement during the period:
| Expense Limitations | Reimbursement | |
| Class B | 2.00% | $ 900 |
Effective February 1, 2015 the expense limitations were discontinued.
Commissions paid to certain brokers with whom the investment adviser, or its affiliates, places trades on behalf of the Fund include an amount in addition to trade execution, which may be rebated back to the Fund to offset certain expenses. This amount totaled $23,306 for the period. Through arrangements with the Fund's custodian, credits realized as a result of certain uninvested cash balances were used to reduce the Fund's expenses. During the period, these credits reduced the Fund's expenses by $57.
In addition, during the period the investment adviser reimbursed and/or waived a portion of fund-level operating expenses in the amount of $5,590 and a portion of the class-level operating expenses as follows:
| Amount | |
| Class A | $6,444 |
| Class T | 3,051 |
| Class B | 21 |
| Class C | 2,393 |
| Class I | 11,825 |
| $23,734 |
9. Distributions to Shareholders.
Distributions to shareholders of each class were as follows:
| Years ended November 30, | 2015 | 2014 |
| From net investment income | ||
| Class A | $2,028,918 | $1,725,330 |
| Class T | 401,622 | 631,390 |
| Class C | 82,446 | 276,842 |
| Class I | 3,315,274 | 1,528,246 |
| Total | $5,828,260 | $4,161,808 |
| From net realized gain | ||
| Class A | $12,045,812 | $15,246,732 |
| Class T | 4,941,694 | 8,130,692 |
| Class B | 220,894 | 772,695 |
| Class C | 5,384,378 | 5,278,471 |
| Class I | 14,434,192 | 16,891,367 |
| Total | $37,026,970 | $46,319,957 |
10. Share Transactions.
Share transactions for each class were as follows and may contain automatic conversions between classes or exchanges between funds:
| Shares | Shares | Dollars | Dollars | |
| Years ended November 30, | 2015 | 2014 | 2015 | 2014 |
| Class A | ||||
| Shares sold | 6,318,731 | 8,408,316 | $179,805,007 | $235,098,861 |
| Reinvestment of distributions | 488,972 | 597,961 | 13,432,055 | 15,576,063 |
| Shares redeemed | (4,126,969) | (2,644,637) | (116,797,696) | (73,404,808) |
| Net increase (decrease) | 2,680,734 | 6,361,640 | $76,439,366 | $177,270,116 |
| Class T | ||||
| Shares sold | 1,467,747 | 2,252,343 | $41,749,475 | $62,382,415 |
| Reinvestment of distributions | 188,811 | 330,308 | 5,182,860 | 8,595,867 |
| Shares redeemed | (1,103,079) | (899,697) | (31,222,052) | (24,855,772) |
| Net increase (decrease) | 553,479 | 1,682,954 | $15,710,283 | $46,122,510 |
| Class B | ||||
| Shares sold | 8,184 | 30,155 | $216,847 | $767,030 |
| Reinvestment of distributions | 8,005 | 28,643 | 205,898 | 699,228 |
| Shares redeemed | (136,299) | (153,665) | (3,621,450) | (3,963,597) |
| Net increase (decrease) | (120,110) | (94,867) | $(3,198,705) | $(2,497,339) |
| Class C | ||||
| Shares sold | 2,311,592 | 3,985,252 | $60,389,767 | $102,765,440 |
| Reinvestment of distributions | 182,523 | 203,409 | 4,616,012 | 4,911,069 |
| Shares redeemed | (1,616,562) | (585,466) | (41,900,226) | (14,978,915) |
| Net increase (decrease) | 877,553 | 3,603,195 | $23,105,553 | $92,697,594 |
| Class I | ||||
| Shares sold | 7,784,685 | 11,292,139 | $230,249,704 | $325,660,606 |
| Reinvestment of distributions | 563,541 | 653,047 | 16,089,097 | 17,642,167 |
| Shares redeemed | (8,094,060) | (3,554,189) | (238,890,988) | (103,521,347) |
| Net increase (decrease) | 254,166 | 8,390,997 | $7,447,813 | $239,781,426 |
11. Other.
The Fund's organizational documents provide former and current trustees and officers with a limited indemnification against liabilities arising in connection with the performance of their duties to the Fund. In the normal course of business, the Fund may also enter into contracts that provide general indemnifications. The Fund's maximum exposure under these arrangements is unknown as this would be dependent on future claims that may be made against the Fund. The risk of material loss from such claims is considered remote.
Report of Independent Registered Public Accounting Firm
To the Trustees of Fidelity Advisor Series I and Shareholders of Fidelity Advisor® Large Cap Fund:
We have audited the accompanying statement of assets and liabilities of Fidelity Advisor® Large Cap Fund (the Fund), a fund of Fidelity Advisor Series I, including the schedule of investments, as of November 30, 2015, and the related statement of operations for the year then ended, the statement of changes in net assets for each of the two years in the period then ended, and the financial highlights for each of the five years in the period then ended. These financial statements and financial highlights are the responsibility of the Fund's management. Our responsibility is to express an opinion on these financial statements and financial highlights based on our audits.
We conducted our audits in accordance with the standards of the Public Company Accounting Oversight Board (United States). Those standards require that we plan and perform the audit to obtain reasonable assurance about whether the financial statements and financial highlights are free of material misstatement. The Fund is not required to have, nor were we engaged to perform, an audit of its internal control over financial reporting. Our audits included consideration of internal control over financial reporting as a basis for designing audit procedures that are appropriate in the circumstances, but not for the purpose of expressing an opinion on the effectiveness of the Fund's internal control over financial reporting. Accordingly, we express no such opinion. An audit also includes examining, on a test basis, evidence supporting the amounts and disclosures in the financial statements, assessing the accounting principles used and significant estimates made by management, as well as evaluating the overall financial statement presentation. Our procedures included confirmation of securities owned as of November 30, 2015, by correspondence with the custodians and brokers; when replies were not received from brokers, we performed other auditing procedures. We believe that our audits provide a reasonable basis for our opinion.
In our opinion, such financial statements and financial highlights referred to above present fairly, in all material respects, the financial position of Fidelity Advisor® Large Cap Fund as of November 30, 2015, the results of its operations for the year then ended, the changes in its net assets for each of the two years in the period then ended, and the financial highlights for each of the five years in the period then ended, in conformity with accounting principles generally accepted in the United States of America.
DELOITTE & TOUCHE LLP
Boston, Massachusetts
January 14, 2016
Trustees and Officers
The Trustees, Members of the Advisory Board (if any), and officers of the trust and fund, as applicable, are listed below. The Board of Trustees governs the fund and is responsible for protecting the interests of shareholders. The Trustees are experienced executives who meet periodically throughout the year to oversee the fund's activities, review contractual arrangements with companies that provide services to the fund, oversee management of the risks associated with such activities and contractual arrangements, and review the fund's performance. Each of the Trustees oversees 170 funds.
The Trustees hold office without limit in time except that (a) any Trustee may resign; (b) any Trustee may be removed by written instrument, signed by at least two-thirds of the number of Trustees prior to such removal; (c) any Trustee who requests to be retired or who has become incapacitated by illness or injury may be retired by written instrument signed by a majority of the other Trustees; and (d) any Trustee may be removed at any special meeting of shareholders by a two-thirds vote of the outstanding voting securities of the trust. Each Trustee who is not an interested person (as defined in the 1940 Act) of the trust and the fund is referred to herein as an Independent Trustee. Each Independent Trustee shall retire not later than the last day of the calendar year in which his or her 75th birthday occurs. The Independent Trustees may waive this mandatory retirement age policy with respect to individual Trustees. Officers and Advisory Board Members hold office without limit in time, except that any officer or Advisory Board Member may resign or may be removed by a vote of a majority of the Trustees at any regular meeting or any special meeting of the Trustees. Except as indicated, each individual has held the office shown or other offices in the same company for the past five years.
The fund’s Statement of Additional Information (SAI) includes more information about the Trustees. To request a free copy, call Fidelity at 1-877-208-0098.
Experience, Skills, Attributes, and Qualifications of the Trustees. The Governance and Nominating Committee has adopted a statement of policy that describes the experience, qualifications, attributes, and skills that are necessary and desirable for potential Independent Trustee candidates (Statement of Policy). The Board believes that each Trustee satisfied at the time he or she was initially elected or appointed a Trustee, and continues to satisfy, the standards contemplated by the Statement of Policy. The Governance and Nominating Committee also engages professional search firms to help identify potential Independent Trustee candidates who have the experience, qualifications, attributes, and skills consistent with the Statement of Policy. From time to time, additional criteria based on the composition and skills of the current Independent Trustees, as well as experience or skills that may be appropriate in light of future changes to board composition, business conditions, and regulatory or other developments, have also been considered by the professional search firms and the Governance and Nominating Committee. In addition, the Board takes into account the Trustees' commitment and participation in Board and committee meetings, as well as their leadership of standing and ad hoc committees throughout their tenure.
In determining that a particular Trustee was and continues to be qualified to serve as a Trustee, the Board has considered a variety of criteria, none of which, in isolation, was controlling. The Board believes that, collectively, the Trustees have balanced and diverse experience, qualifications, attributes, and skills, which allow the Board to operate effectively in governing the fund and protecting the interests of shareholders. Information about the specific experience, skills, attributes, and qualifications of each Trustee, which in each case led to the Board's conclusion that the Trustee should serve (or continue to serve) as a trustee of the fund, is provided below.
Board Structure and Oversight Function. James C. Curvey is an interested person and currently serves as Chairman. The Trustees have determined that an interested Chairman is appropriate and benefits shareholders because an interested Chairman has a personal and professional stake in the quality and continuity of services provided to the fund. Independent Trustees exercise their informed business judgment to appoint an individual of their choosing to serve as Chairman, regardless of whether the Trustee happens to be independent or a member of management. The Independent Trustees have determined that they can act independently and effectively without having an Independent Trustee serve as Chairman and that a key structural component for assuring that they are in a position to do so is for the Independent Trustees to constitute a substantial majority for the Board. The Independent Trustees also regularly meet in executive session. Ned C. Lautenbach serves as Chairman of the Independent Trustees and as such (i) acts as a liaison between the Independent Trustees and management with respect to matters important to the Independent Trustees and (ii) with management prepares agendas for Board meetings.
Fidelity® funds are overseen by different Boards of Trustees. The fund's Board oversees Fidelity's high income and certain equity funds, and other Boards oversee Fidelity's investment-grade bond, money market, asset allocation, and sector funds. The asset allocation funds may invest in Fidelity® funds overseen by the fund's Board. The use of separate Boards, each with its own committee structure, allows the Trustees of each group of Fidelity® funds to focus on the unique issues of the funds they oversee, including common research, investment, and operational issues. On occasion, the separate Boards establish joint committees to address issues of overlapping consequences for the Fidelity® funds overseen by each Board.
The Trustees operate using a system of committees to facilitate the timely and efficient consideration of all matters of importance to the Trustees, the fund, and fund shareholders and to facilitate compliance with legal and regulatory requirements and oversight of the fund's activities and associated risks. The Board, acting through its committees, has charged FMR and its affiliates with (i) identifying events or circumstances the occurrence of which could have demonstrably adverse effects on the fund's business and/or reputation; (ii) implementing processes and controls to lessen the possibility that such events or circumstances occur or to mitigate the effects of such events or circumstances if they do occur; and (iii) creating and maintaining a system designed to evaluate continuously business and market conditions in order to facilitate the identification and implementation processes described in (i) and (ii) above. Because the day-to-day operations and activities of the fund are carried out by or through FMR, its affiliates, and other service providers, the fund's exposure to risks is mitigated but not eliminated by the processes overseen by the Trustees. While each of the Board's committees has responsibility for overseeing different aspects of the fund's activities, oversight is exercised primarily through the Operations, Audit, and Compliance Committees. In addition, the Independent Trustees have worked with FMR to enhance the Board's oversight of investment and financial risks, legal and regulatory risks, technology risks, and operational risks, including the development of additional risk reporting to the Board. For example, a working group comprised of Independent Trustees and FMR has worked and continues to work to review the Fidelity® funds' valuation-related activities, reporting and risk management. Appropriate personnel, including but not limited to the fund's Chief Compliance Officer (CCO), FMR's internal auditor, the independent accountants, the fund's Treasurer and portfolio management personnel, make periodic reports to the Board's committees, as appropriate, including an annual review of Fidelity's risk management program for the Fidelity® funds. The responsibilities of each standing committee, including their oversight responsibilities, are described further under "Standing Committees of the Trustees."
Interested Trustees*:
Correspondence intended for a Trustee who is an interested person may be sent to Fidelity Investments, 245 Summer Street, Boston, Massachusetts 02210.
Name, Year of Birth; Principal Occupations and Other Relevant Experience+
James C. Curvey (1935)
Year of Election or Appointment: 2007
Trustee
Chairman of the Board of Trustees
Mr. Curvey also serves as Trustee of other Fidelity® funds. Mr. Curvey is a Director of Fidelity Research & Analysis Co. (investment adviser firm, 2009-present), and Vice Chairman (2007-present) and Director of FMR LLC (diversified financial services company). In addition, Mr. Curvey serves as an Overseer for the Boston Symphony Orchestra and a member of the board of Artis-Naples, Naples, Florida, and as a Trustee for Brewster Academy, Wolfeboro, New Hampshire. Previously, Mr. Curvey served as a Director of Fidelity Investments Money Management, Inc. (investment adviser firm, 2009-2014) and a Director of FMR and FMR Co., Inc. (investment adviser firms, 2007-2014).
Charles S. Morrison (1960)
Year of Election or Appointment: 2014
Trustee
Mr. Morrison also serves as Trustee of other funds. He serves as a Director of Fidelity Investments Money Management, Inc. (FIMM) (investment adviser firm, 2014-present), Director of Fidelity SelectCo, LLC (investment adviser firm, 2014-present), President, Asset Management (2014-present), and is an employee of Fidelity Investments. Previously, Mr. Morrison served as Vice President of Fidelity's Fixed Income and Asset Allocation Funds (2012-2014), President, Fixed Income (2011-2014), Vice President of Fidelity's Money Market Funds (2005-2009), President, Money Market Group Leader of FMR (investment adviser firm, 2009), and Senior Vice President, Money Market Group of FMR (2004-2009). Mr. Morrison also served as Vice President of Fidelity's Bond Funds (2002-2005), certain Balanced Funds (2002-2005), and certain Asset Allocation Funds (2002-2007), and as Senior Vice President (2002-2005) of Fidelity's Bond Division.
* Determined to be an “Interested Trustee” by virtue of, among other things, his or her affiliation with the trust or various entities under common control with FMR.
+ The information includes the Trustee's principal occupation during the last five years and other information relating to the experience, attributes, and skills relevant to the Trustee's qualifications to serve as a Trustee, which led to the conclusion that the Trustee should serve as a Trustee for the fund.
Independent Trustees:
Correspondence intended for an Independent Trustee may be sent to Fidelity Investments, P.O. Box 55235, Boston, Massachusetts 02205-5235.
Name, Year of Birth; Principal Occupations and Other Relevant Experience+
Dennis J. Dirks (1948)
Year of Election or Appointment: 2005
Trustee
Mr. Dirks also serves as Trustee of other Fidelity® funds. Prior to his retirement in May 2003, Mr. Dirks was Chief Operating Officer and a member of the Board of The Depository Trust & Clearing Corporation (DTCC). He also served as President, Chief Operating Officer, and Board member of The Depository Trust Company (DTC) and President and Board member of the National Securities Clearing Corporation (NSCC). In addition, Mr. Dirks served as Chief Executive Officer and Board member of the Government Securities Clearing Corporation, Chief Executive Officer and Board member of the Mortgage-Backed Securities Clearing Corporation, as a Trustee and a member of the Finance Committee of Manhattan College (2005-2008), as a Trustee and a member of the Finance Committee of AHRC of Nassau County (2006-2008), and as a member of the Independent Directors Council (IDC) Governing Council (2010-2015). Mr. Dirks is a member of the Board of Directors for The Brookville Center for Children's Services, Inc. (2009-present).
Alan J. Lacy (1953)
Year of Election or Appointment: 2008
Trustee
Mr. Lacy also serves as Trustee of other Fidelity® funds. Mr. Lacy serves as a member of the Board of Directors of Dave & Buster's Entertainment, Inc. (restaurant and entertainment complexes, 2010-present) and Bristol-Myers Squibb Company (global pharmaceuticals, 2008-present). In addition, Mr. Lacy served as Senior Adviser (2007-2014) of Oak Hill Capital Partners, L.P. (private equity) and also served as Chief Executive Officer (2000-2005) and Vice Chairman (2005-2006) of Sears Holdings Corporation and Sears, Roebuck and Co. (retail). Mr. Lacy is a member of the Board of Trustees of The National Parks Conservation Association (2006-present). Previously, Mr. Lacy served as Chairman of the Board of Trustees of the National Parks Conservation Association (2008-2011) and as a member of the Board of Directors for The Western Union Company (global money transfer, 2006-2011), The Hillman Companies, Inc. (hardware wholesalers, 2010-2014), and Earth Fare, Inc. (retail grocery, 2010-2014).
Ned C. Lautenbach (1944)
Year of Election or Appointment: 2000
Trustee
Chairman of the Independent Trustees
Mr. Lautenbach also serves as Trustee of other Fidelity® funds. Mr. Lautenbach currently serves as the Lead Director of the Eaton Corporation Board of Directors (diversified industrial, 1997-present). Mr. Lautenbach is Chairman of the Board of Directors of Artis-Naples in Naples, Florida (2012-present), a member of the Council on Foreign Relations (1994-present), and a member of the Board of Governors, State University System of Florida (2013-present). Previously, Mr. Lautenbach was a Partner/Advisory Partner at Clayton, Dubilier & Rice, LLC (private equity investment, 1998-2010), as well as a Director of Sony Corporation (2006-2007).
Joseph Mauriello (1944)
Year of Election or Appointment: 2008
Trustee
Mr. Mauriello also serves as Trustee of other Fidelity® funds. Prior to his retirement in January 2006, Mr. Mauriello served in numerous senior management positions including Deputy Chairman and Chief Operating Officer (2004-2005), and Vice Chairman of Financial Services (2002-2004) of KPMG LLP US (professional services, 1965-2005). Mr. Mauriello currently serves as a member of the Board of Directors of XL Group plc. (global insurance and re-insurance, 2006-present) and the Independent Directors Council (IDC) Governing Council (2015-present). Previously, Mr. Mauriello served as a Director of the Hamilton Funds of the Bank of New York (2006-2007) and of Arcadia Resources Inc. (health care services and products, 2007-2012).
Robert W. Selander (1950)
Year of Election or Appointment: 2011
Trustee
Mr. Selander also serves as Trustee of other Fidelity® funds. Mr. Selander serves as a Director of The Western Union Company (global money transfer, 2014-present). Previously, Mr. Selander served as a Member of the Advisory Board of other Fidelity® funds (2011), and Executive Vice Chairman (2010), Chief Executive Officer (2009-2010), and President and Chief Executive Officer (1997-2009) of Mastercard, Inc.
Cornelia M. Small (1944)
Year of Election or Appointment: 2005
Trustee
Ms. Small also serves as Trustee of other Fidelity® funds. Ms. Small is a member of the Board of Directors (2009-present) and Chair of the Investment Committee (2010-present) of the Teagle Foundation. Ms. Small also serves on the Investment Committee of the Berkshire Taconic Community Foundation (2008-present). Previously, Ms. Small served as Chairperson (2002-2008) and a member of the Investment Committee and Chairperson (2008-2012) and a member of the Board of Trustees of Smith College. In addition, Ms. Small served as Chief Investment Officer, Director of Global Equity Investments, and a member of the Board of Directors of Scudder, Stevens & Clark and Scudder Kemper Investments.
William S. Stavropoulos (1939)
Year of Election or Appointment: 2002
Trustee
Vice Chairman of the Independent Trustees
Mr. Stavropoulos also serves as Trustee of other Fidelity® funds. Mr. Stavropoulos serves as President and Founder of the Michigan Baseball Foundation, the Great Lakes Loons (2007-present). Mr. Stavropoulos is Chairman Emeritus of the Board of Directors of The Dow Chemical Company, where he previously served in numerous senior management positions, including President, CEO (1995-2000; 2002-2004), Chairman of the Executive Committee (2000-2006), and as a member of the Board of Directors (1990-2006). Currently, Mr. Stavropoulos is Chairman of the Board of Directors of Univar Inc. (global distributor of commodity and specialty chemicals), a Director of Teradata Corporation (data warehousing and technology solutions), and Maersk Inc. (industrial conglomerate), and a member of the Advisory Board for Metalmark Capital LLC (private equity investment, 2005-present). Mr. Stavropoulos is an operating advisor to Clayton, Dubilier & Rice, LLC (private equity investment). In addition, Mr. Stavropoulos is a member of the University of Notre Dame Advisory Council for the College of Science, a Trustee of the Rollin L. Gerstacker Foundation, and a Director of the Naples Philharmonic Center for the Arts. Previously, Mr. Stavropoulos served as a Director of Chemical Financial Corporation (bank holding company, 1993-2012) and Tyco International, Ltd. (multinational manufacturing and services, 2007-2012).
David M. Thomas (1949)
Year of Election or Appointment: 2008
Trustee
Mr. Thomas also serves as Trustee of other Fidelity® funds. Mr. Thomas serves as Non-Executive Chairman of the Board of Directors of Fortune Brands Home and Security (home and security products, 2011-present), as a member of the Board of Directors (2004-present) and Presiding Director (2013-present) of Interpublic Group of Companies, Inc. (marketing communication), and as a member of the Board of Trustees of the University of Florida (2013-present). Previously, Mr. Thomas served as Executive Chairman (2005-2006) and Chairman and Chief Executive Officer (2000-2005) of IMS Health, Inc. (pharmaceutical and healthcare information solutions), and a Director of Fortune Brands, Inc. (consumer products, 2000-2011).
+ The information includes the Trustee's principal occupation during the last five years and other information relating to the experience, attributes, and skills relevant to the Trustee's qualifications to serve as a Trustee, which led to the conclusion that the Trustee should serve as a Trustee for the fund.
Advisory Board Members and Officers:
Correspondence intended for an officer or Peter S. Lynch may be sent to Fidelity Investments, 245 Summer Street, Boston, Massachusetts 02210. Officers appear below in alphabetical order.
Name, Year of Birth; Principal Occupation
Peter S. Lynch (1944)
Year of Election or Appointment: 2003
Member of the Advisory Board
Mr. Lynch also serves as Member of the Advisory Board of other Fidelity® funds. Mr. Lynch is Vice Chairman and a Director of FMR (investment adviser firm) and FMR Co., Inc. (investment adviser firm). In addition, Mr. Lynch serves as a Trustee of Boston College and as the Chairman of the Inner-City Scholarship Fund. Previously, Mr. Lynch served on the Special Olympics International Board of Directors (1997-2006).
Elizabeth Paige Baumann (1968)
Year of Election or Appointment: 2012
Anti-Money Laundering (AML) Officer
Ms. Baumann also serves as AML Officer of other funds. She is Chief AML Officer of FMR LLC (diversified financial services company, 2012-present) and is an employee of Fidelity Investments. Previously, Ms. Baumann served as Vice President and Deputy Anti-Money Laundering Officer (2007-2012).
Marc R. Bryant (1966)
Year of Election or Appointment: 2015
Secretary and Chief Legal Officer (CLO)
Mr. Bryant also serves as Secretary and CLO of other funds. Mr. Bryant serves as CLO, Secretary, and Senior Vice President of Fidelity Management & Research Company (investment adviser firm, 2015-present) and FMR Co., Inc. (investment adviser firm, 2015-present); Secretary of Fidelity SelectCo, LLC (investment adviser firm, 2015-present) and Fidelity Investments Money Management, Inc. (investment adviser firm, 2015-present); and CLO of Fidelity Management & Research (Hong Kong) Limited (investment adviser firm, 2015-present). He is Senior Vice President and Deputy General Counsel of FMR LLC (diversified financial services company). Previously, Mr. Bryant served as Secretary and CLO of Fidelity Rutland Square Trust II (2010-2014) and Assistant Secretary of Fidelity's Fixed Income and Asset Allocation Funds (2013-2015). Prior to joining Fidelity Investments, Mr. Bryant served as a Senior Vice President and the Head of Global Retail Legal for AllianceBernstein L.P. (2006-2010), and as the General Counsel for ProFund Advisors LLC (2001-2006).
William C. Coffey (1969)
Year of Election or Appointment: 2009
Assistant Secretary
Mr. Coffey also serves as Assistant Secretary of other funds. He is Senior Vice President and Deputy General Counsel of FMR LLC (diversified financial services company, 2010-present), and is an employee of Fidelity Investments. Previously, Mr. Coffey served as Vice President and Associate General Counsel of FMR LLC (2005-2009).
Jonathan Davis (1968)
Year of Election or Appointment: 2010
Assistant Treasurer
Mr. Davis also serves as Assistant Treasurer of other funds, and is an employee of Fidelity Investments. Previously, Mr. Davis served as Vice President and Associate General Counsel of FMR LLC (diversified financial services company, 2003-2010).
Adrien E. Deberghes (1967)
Year of Election or Appointment: 2008
Deputy Treasurer
Mr. Deberghes also serves as an officer of other funds. He is an employee of Fidelity Investments (2008-present). Prior to joining Fidelity Investments, Mr. Deberghes was Senior Vice President of Mutual Fund Administration at State Street Corporation (2007-2008), Senior Director of Mutual Fund Administration at Investors Bank & Trust (2005-2007), and Director of Finance for Dunkin' Brands (2000-2005).
Stephanie J. Dorsey (1969)
Year of Election or Appointment: 2010
Assistant Treasurer
Ms. Dorsey also serves as an officer of other funds. She is an employee of Fidelity Investments (2008-present) and has served in other fund officer roles. Prior to joining Fidelity Investments, Ms. Dorsey served as Treasurer (2004-2008) of the JPMorgan Mutual Funds and Vice President (2004-2008) of JPMorgan Chase Bank.
Howard J. Galligan III (1966)
Year of Election or Appointment: 2014
Chief Financial Officer
Mr. Galligan also serves as Chief Financial Officer of other funds. Mr. Galligan serves as President of Fidelity Pricing and Cash Management Services (FPCMS) (2014-present) and as a Director of Strategic Advisers, Inc. (investment adviser firm, 2008-present). Previously, Mr. Galligan served as Chief Administrative Officer of Asset Management (2011-2014) and Chief Operating Officer and Senior Vice President of Investment Support for Strategic Advisers, Inc. (2003-2011).
Scott C. Goebel (1968)
Year of Election or Appointment: 2015
Vice President
Mr. Goebel serves as Vice President of other funds and is an employee of Fidelity Investments (2001-present). Previously, Mr. Goebel served as Secretary of Fidelity SelectCo, LLC (investment adviser firm, 2013-2015), Fidelity Investments Money Management, Inc. (FIMM) (investment adviser firm, 2010-2015), and Fidelity Research and Analysis Company (FRAC) (investment adviser firm, 2010-2015); General Counsel, Secretary, and Senior Vice President of Fidelity Management & Research Company (investment adviser firm, 2008-2015) and FMR Co., Inc. (investment adviser firm, 2008-2015); Assistant Secretary of Fidelity Management & Research (Japan) Limited (investment adviser firm, 2008-2015) and FMR Investment Management (U.K.) Limited (investment adviser firm, 2008-2015); Chief Legal Officer (CLO) of Fidelity Management & Research (Hong Kong) Limited (investment adviser firm, 2008-2015); Secretary and CLO of certain Fidelity® funds (2008-2015); Assistant Secretary of FIMM (2008-2010), FRAC (2008-2010), and certain funds (2007-2008); and as Vice President and Secretary of Fidelity Distributors Corporation (FDC) (2005-2007).
Thomas C. Hense (1964)
Year of Election or Appointment: 2008, 2010, or 2015
Vice President
Mr. Hense serves as Vice President of Fidelity Advisor® Multi-Asset Income Fund (2015) and other funds (High Income (2008), Small Cap (2008), and Value (2010) funds), and is an employee of Fidelity Investments (1993-present). Previously, Mr. Hense served as a portfolio manager for Fidelity's Institutional Money Management Group (Pyramis) (2003-2008).
Brian B. Hogan (1964)
Year of Election or Appointment: 2009
Vice President
Mr. Hogan also serves as Trustee or Vice President of other funds. Mr. Hogan serves as a Director of Fidelity SelectCo, LLC (investment adviser firm, 2014-present) and President of the Equity Division of FMR (investment adviser firm, 2009-present). Previously, Mr. Hogan served as Senior Vice President, Equity Research of FMR (2006-2009) and as a portfolio manager.
Chris Maher (1972)
Year of Election or Appointment: 2013
Assistant Treasurer
Mr. Maher serves as Assistant Treasurer of other funds. Mr. Maher is Vice President of Valuation Oversight and is an employee of Fidelity Investments. Previously, Mr. Maher served as Vice President of Asset Management Compliance (2013), Vice President of the Program Management Group of FMR (investment adviser firm, 2010-2013), and Vice President of Valuation Oversight (2008-2010).
Kenneth B. Robins (1969)
Year of Election or Appointment: 2008
President and Treasurer
Mr. Robins also serves as an officer of other funds. Mr. Robins serves as Executive Vice President of Fidelity Investments Money Management, Inc. (FIMM) (investment adviser firm, 2013-present) and is an employee of Fidelity Investments (2004-present). Previously, Mr. Robins served in other fund officer roles.
Stacie M. Smith (1974)
Year of Election or Appointment: 2013
Deputy Treasurer
Ms. Smith also serves as an officer of other funds. She is an employee of Fidelity Investments (2009-present) and has served in other fund officer roles. Prior to joining Fidelity Investments, Ms. Smith served as Senior Audit Manager of Ernst & Young LLP (1996-2009).
Renee Stagnone (1975)
Year of Election or Appointment: 2013
Deputy Treasurer
Ms. Stagnone also serves as Deputy Treasurer of other funds. Ms. Stagnone is an employee of Fidelity Investments (1997-present).
Linda J. Wondrack (1964)
Year of Election or Appointment: 2014
Chief Compliance Officer
Ms. Wondrack also serves as Chief Compliance Officer of other funds. Ms. Wondrack is Executive Vice President and head of the Ethics Office and Asset Management Compliance for Fidelity Investments (2012-present). Ms. Wondrack also serves as Chief Compliance Officer of Fidelity SelectCo, LLC (investment adviser firm, 2014-present); Chief Compliance Officer of Impresa Management LLC (2013-present); and Chief Compliance Officer of FMR Co., Inc. (investment adviser firm), Fidelity Investments Money Management, Inc. (investment adviser firm), Fidelity Management & Research (Japan) Limited (investment adviser firm), FMR Investment Management (U.K.) Limited (investment adviser firm), Fidelity Management & Research (Hong Kong) (investment adviser firm), Fidelity Management & Research Company (investment adviser firm), FIAM LLC (investment adviser firm), and Strategic Advisers, Inc. (investment adviser firm), Ballyrock Investment Advisors LLC, and Northern Neck Investors LLC (2012-present). Previously, Ms. Wondrack served as Senior Vice President and Chief Compliance Officer for Columbia Management Investment Advisers, LLC (2005-2012); Chief Compliance Officer for certain funds within the Columbia Family of Funds (2007-2012); and Senior Vice President of Compliance Risk Management at Bank of America (2005-2010).
Joseph F. Zambello (1957)
Year of Election or Appointment: 2011
Deputy Treasurer
Mr. Zambello also serves as Deputy Treasurer of other funds. Mr. Zambello is an employee of Fidelity Investments (1991-present). Previously, Mr. Zambello served as Vice President of the Program Management Group of FMR (investment adviser firm, 2009-2011) and Vice President of the Transfer Agent Oversight Group (2005-2009).
Shareholder Expense Example
As a shareholder of the Fund, you incur two types of costs: (1) transaction costs, including sales charges (loads) on purchase payments or redemption proceeds, and (2) ongoing costs, including management fees, distribution and/or service (12b-1) fees and other Fund expenses. This Example is intended to help you understand your ongoing costs (in dollars) of investing in the Fund and to compare these costs with the ongoing costs of investing in other mutual funds.
The Example is based on an investment of $1,000 invested at the beginning of the period and held for the entire period (June 1, 2015 to November 30, 2015).
Actual Expenses
The first line of the accompanying table for each class of the Fund provides information about actual account values and actual expenses. You may use the information in this line, together with the amount you invested, to estimate the expenses that you paid over the period. Simply divide your account value by $1,000.00 (for example, an $8,600 account value divided by $1,000.00 = 8.6), then multiply the result by the number in the first line for a class of the Fund under the heading entitled "Expenses Paid During Period" to estimate the expenses you paid on your account during this period. In addition, the Fund, as a shareholder in the underlying Fidelity Central Funds, will indirectly bear its pro-rata share of the fees and expenses incurred by the underlying Fidelity Central Funds. These fees and expenses are not included in the Fund's annualized expense ratio used to calculate the expense estimate in the table below.
Hypothetical Example for Comparison Purposes
The second line of the accompanying table for each class of the Fund provides information about hypothetical account values and hypothetical expenses based on a Class' actual expense ratio and an assumed rate of return of 5% per year before expenses, which is not the Class' actual return. The hypothetical account values and expenses may not be used to estimate the actual ending account balance or expenses you paid for the period. You may use this information to compare the ongoing costs of investing in the Fund and other funds. To do so, compare this 5% hypothetical example with the 5% hypothetical examples that appear in the shareholder reports of the other funds. In addition, the Fund, as a shareholder in the underlying Fidelity Central Funds, will indirectly bear its pro-rata share of the fees and expenses incurred by the underlying Fidelity Central Funds. These fees and expenses are not included in the Fund's annualized expense ratio used to calculate the expense estimate in the table below.
Please note that the expenses shown in the table are meant to highlight your ongoing costs only and do not reflect any transaction costs. Therefore, the second line of the table is useful in comparing ongoing costs only, and will not help you determine the relative total costs of owning different funds. In addition, if these transactional costs were included, your costs would have been higher.
| Annualized Expense Ratio-A | Beginning Account Value June 1, 2015 | Ending Account Value November 30, 2015 | Expenses Paid During Period-B June 1, 2015 to November 30, 2015 | |
| Class A | 1.11% | |||
| Actual | $1,000.00 | $954.50 | $5.44 | |
| Hypothetical-C | $1,000.00 | $1,019.50 | $5.62 | |
| Class T | 1.37% | |||
| Actual | $1,000.00 | $953.10 | $6.71 | |
| Hypothetical-C | $1,000.00 | $1,018.20 | $6.93 | |
| Class B | 1.95% | |||
| Actual | $1,000.00 | $950.50 | $9.53 | |
| Hypothetical-C | $1,000.00 | $1,015.29 | $9.85 | |
| Class C | 1.87% | |||
| Actual | $1,000.00 | $950.80 | $9.14 | |
| Hypothetical-C | $1,000.00 | $1,015.69 | $9.45 | |
| Class I | .85% | |||
| Actual | $1,000.00 | $956.00 | $4.17 | |
| Hypothetical-C | $1,000.00 | $1,020.81 | $4.31 |
A Annualized expense ratio reflects expenses net of applicable fee waivers.
B Expenses are equal to each Class' annualized expense ratio, multiplied by the average account value over the period, multiplied by 183/365 (to reflect the one-half year period).
C 5% return per year before expenses
Distributions (Unaudited)
The Board of Trustees of Advisor Large Cap Fund voted to pay to shareholders of record at the opening of business on record date, the following distributions per share derived from capital gains realized from sales of portfolio securities, and dividends derived from net investment income:
| Pay Date | Record Date | Dividends | Capital Gains | |
| Class A | 12/14/15 | 12/11/15 | $0.231 | $0.570 |
| Class A | 01/11/16 | 01/08/16 | $0.000 | $0.031 |
| Class T | 12/14/15 | 12/11/15 | $0.155 | $0.570 |
| Class T | 01/11/16 | 01/08/16 | $0.000 | $0.031 |
| Class B | 12/14/15 | 12/11/15 | $0.000 | $0.570 |
| Class B | 01/11/16 | 01/08/16 | $0.000 | $0.031 |
| Class C | 12/14/15 | 12/11/15 | $0.042 | $0.570 |
| Class C | 01/11/16 | 01/08/16 | $0.000 | $0.031 |
The fund hereby designates as a capital gain dividend with respect to the taxable year ended November 30, 2015, $31,580,039, or, if subsequently determined to be different, the net capital gain of such year.
Class A, Class T, Class B and Class C designates 100% of each; of the dividends distributed during the fiscal year as qualifying for the dividends-received deduction for corporate shareholders.
Class A, Class T, Class B and Class C designates 100% of the dividends distributed during the fiscal year as amounts which may be taken into account as a dividend for purposes of the maximum rate under section 1(h)(11) of the Internal Revenue Code.
The fund will notify shareholders in January 2016 of amounts for use in preparing 2015 income tax returns.
Board Approval of Investment Advisory Contracts and Management Fees
Fidelity Advisor Large Cap Fund
Each year, the Board of Trustees, including the Independent Trustees (together, the Board), votes on the renewal of the management contract with Fidelity Management & Research Company (FMR) and the sub-advisory agreements (together, the Advisory Contracts) for the fund. The Board, assisted by the advice of fund counsel and Independent Trustees' counsel, requests and considers a broad range of information relevant to the renewal of the Advisory Contracts throughout the year.
The Board meets regularly and, at each of its meetings, covers an extensive agenda of topics and materials and considers factors that are relevant to its annual consideration of the renewal of the fund's Advisory Contracts, including the services and support provided to the fund and its shareholders. The Board has established various standing committees (Committees), each composed of and chaired by Independent Trustees with varying backgrounds, to which the Board has assigned specific subject matter responsibilities in order to enhance effective decision-making by the Board. The Board, acting directly and through its Committees, requests and receives information concerning the annual consideration of the renewal of the fund's Advisory Contracts. The Board also meets as needed to consider matters specifically related to the Board's annual consideration of the renewal of the Advisory Contracts. Members of the Board may also meet with trustees of other Fidelity funds through ad hoc joint committees to discuss certain matters relevant to all of the Fidelity funds.
At its July 2015 meeting, the Board unanimously determined to renew the fund's Advisory Contracts. In reaching its determination, the Board considered all factors it believed relevant, including (i) the nature, extent, and quality of the services to be provided to the fund and its shareholders (including the investment performance of the fund); (ii) the competitiveness of the fund's management fee and total expense ratio relative to peer funds; (iii) the total costs of the services to be provided by and the profits to be realized by Fidelity from its relationship with the fund; and (iv) the extent to which (if any) economies of scale exist and would be realized as the fund grows, and whether any economies of scale are appropriately shared with fund shareholders.
In considering whether to renew the Advisory Contracts for the fund, the Board reached a determination, with the assistance of fund counsel and Independent Trustees' counsel and through the exercise of its business judgment, that the renewal of the Advisory Contracts was in the best interests of the fund and its shareholders and that the compensation payable under the Advisory Contracts was fair and reasonable. The Board's decision to renew the Advisory Contracts was not based on any single factor, but rather was based on a comprehensive consideration of all the information provided to the Board at its meetings throughout the year. The Board, in reaching its determination to renew the Advisory Contracts, was aware that shareholders of the fund have a broad range of investment choices available to them, including a wide choice among funds offered by Fidelity's competitors, and that the fund's shareholders, who have the opportunity to review and weigh the disclosure provided by the fund in its prospectus and other public disclosures, have chosen to invest in this fund, which is part of the Fidelity family of funds.
Nature, Extent, and Quality of Services Provided. The Board considered Fidelity's staffing as it relates to the fund, including the backgrounds of investment personnel of Fidelity, and also considered the fund's investment objective, strategies, and related investment philosophy. The Independent Trustees also had discussions with senior management of Fidelity's investment operations and investment groups. The Board considered the structure of the portfolio manager compensation program and whether this structure provides appropriate incentives to act in the best interests of the fund. Additionally, the Board considered the portfolio managers' investments, if any, in the funds that they manage.Resources Dedicated to Investment Management and Support Services. The Board and the Fund Oversight and Research Committees reviewed the general qualifications and capabilities of Fidelity's investment staff, including its size, education, experience, and resources, as well as Fidelity's approach to recruiting, training, managing, and compensating investment personnel. The Board noted that Fidelity has continued to increase the resources devoted to non-U.S. offices, including expansion of Fidelity's global investment organization. The Board also noted that Fidelity's analysts have extensive resources, tools and capabilities that allow them to conduct sophisticated quantitative and fundamental analysis, as well as credit analysis of issuers, counterparties and guarantors. Further, the Board considered that Fidelity's investment professionals have sufficient access to global information and data so as to provide competitive investment results over time, and that those professionals also have access to sophisticated tools that permit them to assess portfolio construction and risk and performance attribution characteristics continuously, as well as to transmit new information and research conclusions rapidly around the world. Additionally, in its deliberations, the Board considered Fidelity's trading, risk management, and compliance capabilities and resources, which are integral parts of the investment management process.Shareholder and Administrative Services. The Board considered (i) the nature, extent, quality, and cost of advisory, administrative, and shareholder services performed by FMR, the sub-advisers (together with FMR, the Investment Advisers), and their affiliates under the Advisory Contracts and under separate agreements covering transfer agency, pricing and bookkeeping, and securities lending services for the fund; (ii) the nature and extent of the supervision of third party service providers, principally custodians and subcustodians; and (iii) the resources devoted to, and the record of compliance with, the fund's compliance policies and procedures. The Board also reviewed the allocation of fund brokerage, including allocations to brokers affiliated with the Investment Advisers, the use of brokerage commissions to pay fund expenses, and the use of "soft" commission dollars to pay for research services.The Board noted that the growth of fund assets over time across the complex allows Fidelity to reinvest in the development of services designed to enhance the value or convenience of the Fidelity funds as investment vehicles. These services include 24-hour access to account information and market information through telephone representatives and over the Internet, investor education materials and asset allocation tools, and the expanded availability of Fidelity Investor Centers.In 2014, the Board formed an ad hoc Committee on Transfer Agency Fees to review the variety of transfer agency fee structures throughout the industry and Fidelity's competitive positioning with respect to industry participants.Investment in a Large Fund Family. The Board considered the benefits to shareholders of investing in a Fidelity fund, including the benefits of investing in a fund that is part of a large family of funds offering a variety of investment disciplines and providing a large variety of mutual fund investor services. The Board noted that Fidelity had taken, or had made recommendations that resulted in the Fidelity funds taking, a number of actions over the previous year that benefited particular funds, including (i) continuing to dedicate additional resources to investment research and to the support of the senior management team that oversees asset management; (ii) continuing efforts to enhance Fidelity's global research capabilities; (iii) launching new funds and making other enhancements to meet client needs; (iv) reducing management fees and total expenses for certain index funds and diversified international funds; (v) continuing to launch dedicated lower cost underlying funds to meet portfolio construction needs related to expanding underlying fund options for Fidelity funds of funds, specifically for the Freedom Fund product lines; (vi) rationalizing product lines and gaining increased efficiencies through fund mergers; (vii) launching active fixed-income exchange-traded funds; (viii) continuing to develop, acquire and implement systems and technology to improve services to the funds and information security and to increase efficiency; (ix) implementing investment enhancements to further strengthen Fidelity's target date product line to increase investors' probability of success in achieving their goals; (x) modifying the eligibility criteria for certain share classes to accommodate roll-over assets from employer-sponsored retirement plans; (xi) launching a new Class W of the Freedom Index Funds to attract and retain Fidelity record-kept retirement plan assets; and (xii) implementing changes to Fidelity's money market product line in response to recent money market regulatory reforms.Investment Performance. The Board considered whether the fund has operated in accordance with its investment objective, as well as its record of compliance with its investment restrictions and its performance history.The Board took into account discussions with representatives of the Investment Advisers about fund investment performance that occur at Board meetings throughout the year. In this regard the Board noted that as part of regularly scheduled fund reviews and other reports to the Board on fund performance, the Board considers annualized return information for the fund, for different time periods, measured against a securities market index ("benchmark index") and a peer group of funds with similar objectives ("peer group"), if any. In its evaluation of fund investment performance, the Board gave particular attention to information indicating changes in performance of certain Fidelity funds for specific time periods and discussed with the Investment Advisers the reasons for any overperformance or underperformance.In addition to reviewing absolute and relative fund performance, the Independent Trustees periodically consider the appropriateness of fund performance metrics in evaluating the results achieved. In general, the Independent Trustees believe that fund performance should be evaluated based on net performance (after fees and expenses) of both the highest performing and lowest performing fund share classes, where applicable, compared to appropriate benchmark indices, over appropriate time periods that may include full market cycles, and compared to peer groups, as applicable, over the same periods, taking into account relevant factors including the following: general market conditions; issuer-specific information; and fund cash flows and other factors.The Independent Trustees recognize that shareholders evaluate performance on a net basis over their own holding periods, for which one-, three-, and five-year periods are often used as a proxy. For this reason, the performance information reviewed by the Board also included net cumulative calendar year total return information for the fund and an appropriate benchmark index and peer group for the most recent one-, three-, and five-year periods, as shown below. Returns are shown compared to the 25th percentile (top of box, 75% beaten) and 75th percentile (bottom of box, 25% beaten) of the peer universe.Fidelity Advisor Large Cap Fund
Fidelity Advisor Large Cap Fund
![]()
LC-ANN-0116
1.539156.118
Fidelity Advisor® Value Strategies Fund Class A, Class T, Class B and Class C Annual Report November 30, 2015 |
|
Contents
Board Approval of Investment Advisory Contracts and Management Fees |
To view a fund's proxy voting guidelines and proxy voting record for the 12-month period ended June 30, visit http://www.fidelity.com/proxyvotingresults or visit the Securities and Exchange Commission's (SEC) web site at http://www.sec.gov.
You may also call 1-877-208-0098 to request a free copy of the proxy voting guidelines.
Standard & Poor's, S&P and S&P 500 are registered service marks of The McGraw-Hill Companies, Inc. and have been licensed for use by Fidelity Distributors Corporation.
Other third-party marks appearing herein are the property of their respective owners.
All other marks appearing herein are registered or unregistered trademarks or service marks of FMR LLC or an affiliated company. © 2016 FMR LLC. All rights reserved.
This report and the financial statements contained herein are submitted for the general information of the shareholders of the Fund. This report is not authorized for distribution to prospective investors in the Fund unless preceded or accompanied by an effective prospectus.
A fund files its complete schedule of portfolio holdings with the SEC for the first and third quarters of each fiscal year on Form N-Q. Forms N-Q are available on the SEC’s web site at http://www.sec.gov. A fund's Forms N-Q may be reviewed and copied at the SEC’s Public Reference Room in Washington, DC. Information regarding the operation of the SEC's Public Reference Room may be obtained by calling 1-800-SEC-0330.
For a complete list of a fund's portfolio holdings, view the most recent holdings listing, semiannual report, or annual report on Fidelity's web site at http://www.fidelity.com, http://www.advisor.fidelity.com, or http://www.401k.com, as applicable.
NOT FDIC INSURED •MAY LOSE VALUE •NO BANK GUARANTEE
Neither the Fund nor Fidelity Distributors Corporation is a bank.
Performance: The Bottom Line
Average annual total return reflects the change in the value of an investment, assuming reinvestment of distributions from dividend income and capital gains (the profits earned upon the sale of securities that have grown in value, if any) and assuming a constant rate of performance each year.
The hypothetical investment and the average annual total returns do not reflect the deduction of taxes that a shareholder would pay on fund distributions or the redemption of fund shares.
During periods of reimbursement by Fidelity, a fund’s total return will be greater than it would be had the reimbursement not occurred.
How a fund did yesterday is no guarantee of how it will do tomorrow.
Returns reflect the conversion of Class B shares to Class A shares after a maximum of seven years.
Average Annual Total Returns
| For the periods ended November 30, 2015 | Past 1 year | Past 5 years | Past 10 years |
| Class A (incl. 5.75% sales charge) | (4.74)% | 10.27% | 6.19% |
| Class T (incl. 3.50% sales charge) | (2.67)% | 10.58% | 6.24% |
| Class B (incl. contingent deferred sales charge) | (4.75)% | 10.44% | 6.25% |
| Class C (incl. contingent deferred sales charge) | (0.67)% | 10.75% | 6.01% |
Class B shares' contingent deferred sales charges included in the past one year, past five years and past ten years total return figures are 5%, 2% and 0%, respectively.
Class C shares' contingent deferred sales charges included in the past one year, past five years and past ten years total return figures are 1%, 0% and 0%, respectively.
$10,000 Over 10 Years
Let's say hypothetically that $10,000 was invested in Fidelity Advisor® Value Strategies Fund - Class A on November 30, 2005, and the current 5.75% sales charge was paid.
The chart shows how the value of your investment would have changed, and also shows how the Russell Midcap® Value Index performed over the same period.
| Period Ending Values | ||
| $18,230 | Fidelity Advisor® Value Strategies Fund - Class A | |
| $21,688 | Russell Midcap® Value Index | |
Management's Discussion of Fund Performance
Market Recap: U.S. stocks gained modestly for the 12 months ending November 30, 2015, despite a steep decline in August and September on concern about slowing economic growth in China. The S&P 500® index rebounded in October and gained 2.75% for the year. Stocks benefited late in the period amid waning expectations for a near-term interest-rate hike by the U.S. Federal Reserve, more economic stimulus in Europe and an interest-rate cut in China. Growth stocks in the benchmark far outpaced their value counterparts, as investors continued to seek growth in a subpar economic environment. Sector performance varied widely, with more than 26 percentage points separating the leader from the laggard. Consumer discretionary (+14%) secured the top spot, benefiting from a combination of rising personal income and still-benign inflation. Information technology (+7%) and health care (+4%) also outpaced the broad market. Conversely, the energy sector (-12%) performed worst, stymied by depressed commodity prices that also hit materials (-5%). Telecommunication services (-5%) and utilities (-4%), considered defensive sectors less sensitive to the economy, also lost ground. At period end, investors remained focused on the potential global implications of a stronger U.S. dollar and how China’s transition toward a consumption-led economy may affect corporate earnings.Comments from Portfolio Manager Tom Soviero: For the year, the fund’s share classes (excluding sales charges, if applicable) gained modestly, beating the -1.00% return of the benchmark Russell Midcap® Value Index. Security selection drove performance versus the benchmark, especially picks in the consumer discretionary, materials and energy sectors. Underweighting energy also helped. Our biggest individual contributor was top holding LyondellBasell Industries, a Netherlands-based multinational plastics, chemicals and refining company dependent on natural-gas derivatives. Although Lyondell lost its cost advantage when oil prices plunged early in the period, the quality of its assets and strong free cash flow lifted the stock. Another standout was Cott, which bought a water company, diluting its dependence on carbonated beverages and boosting its earnings-growth prospects. Additionally, the fund’s foreign holdings bolstered performance despite the stronger U.S. dollar. By contrast, stock picks in information technology and health care, as well as a sizable underweighting in financials, detracted. Disappointments included Micron Technology, a semiconductor company hurt by more capacity coming online as industry demand slowed. Lastly, not owning for-profit health insurer and index component Cigna hurt. Lyondell, Cott and Micron were all non-index holdings.The views expressed above reflect those of the portfolio manager(s) only through the end of the period as stated on the cover of this report and do not necessarily represent the views of Fidelity or any other person in the Fidelity organization. Any such views are subject to change at any time based upon market or other conditions and Fidelity disclaims any responsibility to update such views. These views may not be relied on as investment advice and, because investment decisions for a Fidelity fund are based on numerous factors, may not be relied on as an indication of trading intent on behalf of any Fidelity fund.
Investment Summary (Unaudited)
Top Ten Stocks as of November 30, 2015
| % of fund's net assets | % of fund's net assets 6 months ago | |
| LyondellBasell Industries NV Class A | 6.5 | 5.3 |
| Bank of America Corp. | 4.1 | 3.6 |
| Apple, Inc. | 3.4 | 4.8 |
| General Motors Co. | 3.3 | 3.0 |
| Citigroup, Inc. | 3.0 | 0.8 |
| Delphi Automotive PLC | 3.0 | 4.1 |
| U.S. Bancorp | 2.7 | 2.4 |
| Cott Corp. | 2.6 | 2.2 |
| Universal Health Services, Inc. Class B | 2.4 | 2.3 |
| Boston Scientific Corp. | 2.3 | 2.1 |
| 33.3 |
Top Five Market Sectors as of November 30, 2015
| % of fund's net assets | % of fund's net assets 6 months ago | |
| Consumer Discretionary | 19.8 | 23.0 |
| Financials | 15.2 | 12.8 |
| Health Care | 14.5 | 16.3 |
| Materials | 10.0 | 8.6 |
| Information Technology | 8.1 | 13.7 |
Asset Allocation (% of fund's net assets)
| As of November 30, 2015 * | ||
| Stocks | 88.9% | |
| Bonds | 0.1% | |
| Short-Term Investments and Net Other Assets (Liabilities) | 11.0% | |

* Foreign investments - 15.9%
| As of May 31, 2015 * | ||
| Stocks | 97.1% | |
| Bonds | 0.5% | |
| Short-Term Investments and Net Other Assets (Liabilities) | 2.4% | |

* Foreign investments - 17.5%
Investments November 30, 2015
Showing Percentage of Net Assets
| Common Stocks - 88.9% | |||
| Shares | Value (000s) | ||
| CONSUMER DISCRETIONARY - 19.8% | |||
| Auto Components - 3.3% | |||
| Delphi Automotive PLC | 474,177 | $41,671 | |
| Tenneco, Inc. (a) | 90,224 | 4,861 | |
| 46,532 | |||
| Automobiles - 3.3% | |||
| General Motors Co. | 1,284,836 | 46,511 | |
| Diversified Consumer Services - 1.3% | |||
| Service Corp. International | 691,750 | 19,265 | |
| Hotels, Restaurants & Leisure - 2.0% | |||
| Cedar Fair LP (depositary unit) | 227,420 | 12,808 | |
| Wyndham Worldwide Corp. | 199,867 | 15,174 | |
| 27,982 | |||
| Household Durables - 4.1% | |||
| CalAtlantic Group, Inc. | 527,581 | 22,211 | |
| Lennar Corp. Class A (b) | 424,700 | 21,749 | |
| PulteGroup, Inc. | 744,504 | 14,503 | |
| 58,463 | |||
| Leisure Products - 3.1% | |||
| Hasbro, Inc. | 266,797 | 19,500 | |
| Vista Outdoor, Inc. (a) | 557,700 | 24,567 | |
| 44,067 | |||
| Media - 1.1% | |||
| Omnicom Group, Inc. | 120,112 | 8,879 | |
| Regal Entertainment Group Class A (b) | 330,800 | 6,203 | |
| 15,082 | |||
| Specialty Retail - 1.4% | |||
| Asbury Automotive Group, Inc. (a) | 111,241 | 8,354 | |
| GameStop Corp. Class A (b) | 313,213 | 10,972 | |
| 19,326 | |||
| Textiles, Apparel & Luxury Goods - 0.2% | |||
| PVH Corp. | 36,500 | 3,332 | |
| TOTAL CONSUMER DISCRETIONARY | 280,560 | ||
| CONSUMER STAPLES - 5.9% | |||
| Beverages - 2.6% | |||
| Cott Corp. | 3,511,564 | 36,787 | |
| Food & Staples Retailing - 1.6% | |||
| CVS Health Corp. | 237,100 | 22,309 | |
| Food Products - 0.9% | |||
| Calavo Growers, Inc. | 232,028 | 13,128 | |
| Household Products - 0.8% | |||
| Procter & Gamble Co. | 142,100 | 10,635 | |
| TOTAL CONSUMER STAPLES | 82,859 | ||
| ENERGY - 3.3% | |||
| Energy Equipment & Services - 0.5% | |||
| Halliburton Co. | 183,600 | 7,316 | |
| Oil, Gas & Consumable Fuels - 2.8% | |||
| ConocoPhillips Co. | 117,100 | 6,329 | |
| EP Energy Corp. (a)(b) | 274,600 | 1,554 | |
| HollyFrontier Corp. | 76,400 | 3,673 | |
| Kinder Morgan, Inc. | 170,400 | 4,016 | |
| Valero Energy Corp. | 327,300 | 23,520 | |
| 39,092 | |||
| TOTAL ENERGY | 46,408 | ||
| FINANCIALS - 15.2% | |||
| Banks - 13.9% | |||
| Bank of America Corp. | 3,355,213 | 58,481 | |
| CIT Group, Inc. | 157,349 | 6,760 | |
| Citigroup, Inc. | 796,323 | 43,073 | |
| JPMorgan Chase & Co. | 314,200 | 20,951 | |
| Regions Financial Corp. | 778,163 | 7,891 | |
| U.S. Bancorp | 862,484 | 37,854 | |
| Wells Fargo & Co. | 377,370 | 20,793 | |
| 195,803 | |||
| Capital Markets - 0.6% | |||
| PJT Partners, Inc. (a) | 6,685 | 157 | |
| The Blackstone Group LP | 267,400 | 8,351 | |
| 8,508 | |||
| Insurance - 0.7% | |||
| AFLAC, Inc. | 158,186 | 10,320 | |
| TOTAL FINANCIALS | 214,631 | ||
| HEALTH CARE - 14.5% | |||
| Health Care Equipment & Supplies - 5.5% | |||
| Alere, Inc. (a) | 172,283 | 7,110 | |
| Boston Scientific Corp. (a) | 1,785,400 | 32,637 | |
| St. Jude Medical, Inc. | 463,300 | 29,234 | |
| Zimmer Biomet Holdings, Inc. | 87,600 | 8,848 | |
| 77,829 | |||
| Health Care Providers & Services - 3.2% | |||
| DaVita HealthCare Partners, Inc. (a) | 158,496 | 11,577 | |
| Universal Health Services, Inc. Class B | 278,914 | 33,894 | |
| 45,471 | |||
| Life Sciences Tools & Services - 0.8% | |||
| PerkinElmer, Inc. | 207,500 | 11,031 | |
| Pharmaceuticals - 5.0% | |||
| Johnson & Johnson | 187,800 | 19,013 | |
| Merck & Co., Inc. | 390,800 | 20,716 | |
| Sanofi SA sponsored ADR | 720,344 | 31,854 | |
| 71,583 | |||
| TOTAL HEALTH CARE | 205,914 | ||
| INDUSTRIALS - 7.7% | |||
| Aerospace & Defense - 4.6% | |||
| Esterline Technologies Corp. (a) | 180,022 | 17,116 | |
| Honeywell International, Inc. | 139,500 | 14,501 | |
| Orbital ATK, Inc. | 278,850 | 23,956 | |
| Textron, Inc. | 223,717 | 9,546 | |
| 65,119 | |||
| Machinery - 1.8% | |||
| Deere & Co. (b) | 164,900 | 13,121 | |
| Ingersoll-Rand PLC | 208,100 | 12,209 | |
| 25,330 | |||
| Road & Rail - 0.6% | |||
| Hertz Global Holdings, Inc. (a) | 557,200 | 8,837 | |
| Trading Companies & Distributors - 0.7% | |||
| Aircastle Ltd. | 467,200 | 9,793 | |
| TOTAL INDUSTRIALS | 109,079 | ||
| INFORMATION TECHNOLOGY - 8.1% | |||
| IT Services - 0.7% | |||
| Fidelity National Information Services, Inc. | 165,730 | 10,552 | |
| Semiconductors & Semiconductor Equipment - 2.3% | |||
| Cypress Semiconductor Corp. (b) | 1,507,475 | 16,311 | |
| Micron Technology, Inc. (a) | 559,183 | 8,908 | |
| ON Semiconductor Corp. (a) | 646,970 | 7,091 | |
| 32,310 | |||
| Software - 1.7% | |||
| Microsoft Corp. | 429,324 | 23,334 | |
| Technology Hardware, Storage & Peripherals - 3.4% | |||
| Apple, Inc. | 407,860 | 48,250 | |
| TOTAL INFORMATION TECHNOLOGY | 114,446 | ||
| MATERIALS - 10.0% | |||
| Chemicals - 8.8% | |||
| Ashland, Inc. | 83,100 | 9,361 | |
| Axiall Corp. | 284,126 | 5,921 | |
| LyondellBasell Industries NV Class A | 965,892 | 92,551 | |
| PPG Industries, Inc. | 154,592 | 16,347 | |
| 124,180 | |||
| Containers & Packaging - 1.2% | |||
| WestRock Co. | 347,900 | 17,614 | |
| TOTAL MATERIALS | 141,794 | ||
| TELECOMMUNICATION SERVICES - 2.0% | |||
| Diversified Telecommunication Services - 2.0% | |||
| Level 3 Communications, Inc. (a) | 558,139 | 28,370 | |
| UTILITIES - 2.4% | |||
| Independent Power and Renewable Electricity Producers - 1.1% | |||
| Calpine Corp. (a) | 567,563 | 8,389 | |
| Dynegy, Inc. (a) | 441,400 | 7,115 | |
| 15,504 | |||
| Multi-Utilities - 1.3% | |||
| Sempra Energy | 179,639 | 17,826 | |
| TOTAL UTILITIES | 33,330 | ||
| TOTAL COMMON STOCKS | |||
| (Cost $794,484) | 1,257,391 | ||
| Principal Amount (000s) | Value (000s) | ||
| Nonconvertible Bonds - 0.1% | |||
| ENERGY - 0.1% | |||
| Oil, Gas & Consumable Fuels - 0.1% | |||
| Peabody Energy Corp. 6.25% 11/15/21 (Cost $14,230) | 15,405 | 2,426 | |
| Shares | Value (000s) | ||
| Money Market Funds - 3.8% | |||
| Fidelity Cash Central Fund, 0.18% (c) | 23,178,091 | 23,178 | |
| Fidelity Securities Lending Cash Central Fund, 0.22% (c)(d) | 30,384,778 | 30,385 | |
| TOTAL MONEY MARKET FUNDS | |||
| (Cost $53,563) | 53,563 | ||
| TOTAL INVESTMENT PORTFOLIO - 92.8% | |||
| (Cost $862,277) | 1,313,380 | ||
| NET OTHER ASSETS (LIABILITIES) - 7.2% | 101,256 | ||
| NET ASSETS - 100% | $1,414,636 |
Legend
(a) Non-income producing
(b) Security or a portion of the security is on loan at period end.
(c) Affiliated fund that is generally available only to investment companies and other accounts managed by Fidelity Investments. The rate quoted is the annualized seven-day yield of the fund at period end. A complete unaudited listing of the fund's holdings as of its most recent quarter end is available upon request. In addition, each Fidelity Central Fund's financial statements, which are not covered by the Fund's Report of Independent Registered Public Accounting Firm, are available on the SEC's website or upon request.
(d) Investment made with cash collateral received from securities on loan.
Affiliated Central Funds
Information regarding fiscal year to date income earned by the Fund from investments in Fidelity Central Funds is as follows:
| Fund | Income earned |
| (Amounts in thousands) | |
| Fidelity Cash Central Fund | $50 |
| Fidelity Securities Lending Cash Central Fund | 791 |
| Total | $841 |
Investment Valuation
The following is a summary of the inputs used, as of November 30, 2015, involving the Fund's assets and liabilities carried at fair value. The inputs or methodology used for valuing securities may not be an indication of the risk associated with investing in those securities. For more information on valuation inputs, and their aggregation into the levels used below, please refer to the Investment Valuation section in the accompanying Notes to Financial Statements.
| Valuation Inputs at Reporting Date: | ||||
| Description | Total | Level 1 | Level 2 | Level 3 |
| (Amounts in thousands) | ||||
| Investments in Securities: | ||||
| Equities: | ||||
| Consumer Discretionary | $280,560 | $280,560 | $-- | $-- |
| Consumer Staples | 82,859 | 82,859 | -- | -- |
| Energy | 46,408 | 46,408 | -- | -- |
| Financials | 214,631 | 214,631 | -- | -- |
| Health Care | 205,914 | 205,914 | -- | -- |
| Industrials | 109,079 | 109,079 | -- | -- |
| Information Technology | 114,446 | 114,446 | -- | -- |
| Materials | 141,794 | 141,794 | -- | -- |
| Telecommunication Services | 28,370 | 28,370 | -- | -- |
| Utilities | 33,330 | 33,330 | -- | -- |
| Corporate Bonds | 2,426 | -- | 2,426 | -- |
| Money Market Funds | 53,563 | 53,563 | -- | -- |
| Total Investments in Securities: | $1,313,380 | $1,310,954 | $2,426 | $-- |
Other Information
Distribution of investments by country or territory of incorporation, as a percentage of Total Net Assets, is as follows (Unaudited):
| United States of America | 84.1% |
| Netherlands | 6.5% |
| Bailiwick of Jersey | 3.0% |
| Canada | 2.6% |
| France | 2.2% |
| Others (Individually Less Than 1%) | 1.6% |
| 100.0% |
See accompanying notes which are an integral part of the financial statements.
Financial Statements
Statement of Assets and Liabilities
| Amounts in thousands (except per-share amounts) | November 30, 2015 | |
| Assets | ||
| Investment in securities, at value (including securities loaned of $29,334) — See accompanying schedule: Unaffiliated issuers (cost $808,714) | $1,259,817 | |
| Fidelity Central Funds (cost $53,563) | 53,563 | |
| Total Investments (cost $862,277) | $1,313,380 | |
| Receivable for investments sold | 379 | |
| Receivable for fund shares sold | 131,840 | |
| Dividends receivable | 2,389 | |
| Interest receivable | 43 | |
| Distributions receivable from Fidelity Central Funds | 52 | |
| Prepaid expenses | 3 | |
| Other receivables | 13 | |
| Total assets | 1,448,099 | |
| Liabilities | ||
| Payable for fund shares redeemed | $2,215 | |
| Accrued management fee | 358 | |
| Distribution and service plan fees payable | 211 | |
| Other affiliated payables | 250 | |
| Other payables and accrued expenses | 44 | |
| Collateral on securities loaned, at value | 30,385 | |
| Total liabilities | 33,463 | |
| Net Assets | $1,414,636 | |
| Net Assets consist of: | ||
| Paid in capital | $1,086,894 | |
| Undistributed net investment income | 12,741 | |
| Accumulated undistributed net realized gain (loss) on investments and foreign currency transactions | (136,102) | |
| Net unrealized appreciation (depreciation) on investments and assets and liabilities in foreign currencies | 451,103 | |
| Net Assets | $1,414,636 | |
| Calculation of Maximum Offering Price | ||
| Class A: | ||
| Net Asset Value and redemption price per share ($215,141 ÷ 5,514.662 shares) | $39.01 | |
| Maximum offering price per share (100/94.25 of $39.01) | $41.39 | |
| Class T: | ||
| Net Asset Value and redemption price per share ($294,097 ÷ 7,279.753 shares) | $40.40 | |
| Maximum offering price per share (100/96.50 of $40.40) | $41.87 | |
| Class B: | ||
| Net Asset Value and offering price per share ($3,911 ÷ 110.061 shares)(a) | $35.53 | |
| Class C: | ||
| Net Asset Value and offering price per share ($49,140 ÷ 1,399.392 shares)(a) | $35.12 | |
| Fidelity Value Strategies Fund: | ||
| Net Asset Value, offering price and redemption price per share ($715,837 ÷ 16,373.120 shares) | $43.72 | |
| Class K: | ||
| Net Asset Value, offering price and redemption price per share ($71,635 ÷ 1,637.769 shares) | $43.74 | |
| Class I: | ||
| Net Asset Value, offering price and redemption price per share ($64,875 ÷ 1,555.559 shares) | $41.71 |
(a) Redemption price per share is equal to net asset value less any applicable contingent deferred sales charge.
See accompanying notes which are an integral part of the financial statements.
Statement of Operations
| Amounts in thousands | Year ended November 30, 2015 | |
| Investment Income | ||
| Dividends | $24,333 | |
| Interest | 1,276 | |
| Income from Fidelity Central Funds | 841 | |
| Total income | 26,450 | |
| Expenses | ||
| Management fee | ||
| Basic fee | $7,974 | |
| Performance adjustment | (1,933) | |
| Transfer agent fees | 2,877 | |
| Distribution and service plan fees | 2,725 | |
| Accounting and security lending fees | 465 | |
| Custodian fees and expenses | 15 | |
| Independent trustees' compensation | 6 | |
| Registration fees | 109 | |
| Audit | 65 | |
| Legal | 6 | |
| Miscellaneous | 11 | |
| Total expenses before reductions | 12,320 | |
| Expense reductions | (77) | 12,243 |
| Net investment income (loss) | 14,207 | |
| Realized and Unrealized Gain (Loss) | ||
| Net realized gain (loss) on: | ||
| Investment securities: | ||
| Unaffiliated issuers | 117,277 | |
| Foreign currency transactions | 14 | |
| Total net realized gain (loss) | 117,291 | |
| Change in net unrealized appreciation (depreciation) on: Investment securities | (113,534) | |
| Assets and liabilities in foreign currencies | 3 | |
| Total change in net unrealized appreciation (depreciation) | (113,531) | |
| Net gain (loss) | 3,760 | |
| Net increase (decrease) in net assets resulting from operations | $17,967 |
See accompanying notes which are an integral part of the financial statements.
Statement of Changes in Net Assets
| Amounts in thousands | Year ended November 30, 2015 | Year ended November 30, 2014 |
| Increase (Decrease) in Net Assets | ||
| Operations | ||
| Net investment income (loss) | $14,207 | $12,033 |
| Net realized gain (loss) | 117,291 | 6,319 |
| Change in net unrealized appreciation (depreciation) | (113,531) | 112,825 |
| Net increase (decrease) in net assets resulting from operations | 17,967 | 131,177 |
| Distributions to shareholders from net investment income | (11,929) | (10,331) |
| Distributions to shareholders from net realized gain | (1,090) | – |
| Total distributions | (13,019) | (10,331) |
| Share transactions - net increase (decrease) | (175,423) | (53,813) |
| Total increase (decrease) in net assets | (170,475) | 67,033 |
| Net Assets | ||
| Beginning of period | 1,585,111 | 1,518,078 |
| End of period (including undistributed net investment income of $12,741 and undistributed net investment income of $11,706, respectively) | $1,414,636 | $1,585,111 |
See accompanying notes which are an integral part of the financial statements.
Financial Highlights — Fidelity Advisor Value Strategies Fund Class A
| November 30, | |||||
| Years ended November 30, | 2015 | 2014 | 2013 | 2012 | 2011 |
| Selected Per–Share Data | |||||
| Net asset value, beginning of period | $38.91 | $36.02 | $27.62 | $22.71 | $23.11 |
| Income from Investment Operations | |||||
| Net investment income (loss)A | .35 | .25 | .23 | –B | .13C |
| Net realized and unrealized gain (loss) | .06 | 2.87 | 8.25 | 5.03 | (.49) |
| Total from investment operations | .41 | 3.12 | 8.48 | 5.03 | (.36) |
| Distributions from net investment income | (.28)D | (.23) | (.08) | (.12) | (.03)D |
| Distributions from net realized gain | (.03)D | – | – | – | (.01)D |
| Total distributions | (.31) | (.23) | (.08) | (.12) | (.04) |
| Net asset value, end of period | $39.01 | $38.91 | $36.02 | $27.62 | $22.71 |
| Total ReturnE,F | 1.07% | 8.74% | 30.77% | 22.29% | (1.57)% |
| Ratios to Average Net AssetsG,H | |||||
| Expenses before reductions | .93% | .96% | 1.04% | 1.21% | 1.18% |
| Expenses net of fee waivers, if any | .93% | .96% | 1.04% | 1.21% | 1.18% |
| Expenses net of all reductions | .93% | .96% | 1.03% | 1.21% | 1.17% |
| Net investment income (loss) | .89% | .68% | .73% | - %B | .51%C |
| Supplemental Data | |||||
| Net assets, end of period (in millions) | $215 | $233 | $243 | $203 | $190 |
| Portfolio turnover rateI | 9% | 6% | 22% | 23% | 34% |
A Calculated based on average shares outstanding during the period.
B Investment income per share reflects a large, non-recurring dividend which amounted to $.07 per share. Excluding this non-recurring dividend, the ratio of net investment income (loss) to average net assets would have been (.28) %.
C Investment income per share reflects a large, non-recurring dividend which amounted to $.16 per share. Excluding this non-recurring dividend, the ratio of net investment income (loss) to average net assets would have been (.11) %.
D The amounts shown reflect certain reclassifications related to book to tax differences that were made in the year shown.
E Total returns would have been lower if certain expenses had not been reduced during the applicable periods shown.
F Total returns do not include the effect of the sales charges.
G Fees and expenses of any underlying Fidelity Central Funds are not included in the Fund's expense ratio. The Fund indirectly bears its proportionate share of the expenses of any underlying Fidelity Central Funds.
H Expense ratios reflect operating expenses of the class. Expenses before reductions do not reflect amounts reimbursed by the investment adviser or reductions from brokerage service arrangements or reductions from other expense offset arrangements and do not represent the amount paid by the class during periods when reimbursements or reductions occur. Expenses net of fee waivers reflect expenses after reimbursement by the investment adviser but prior to reductions from brokerage service arrangements or other expense offset arrangements. Expenses net of all reductions represent the net expenses paid by the class.
I Amount does not include the portfolio activity of any underlying Fidelity Central Funds.
See accompanying notes which are an integral part of the financial statements.
Financial Highlights — Fidelity Advisor Value Strategies Fund Class T
| November 30, | |||||
| Years ended November 30, | 2015 | 2014 | 2013 | 2012 | 2011 |
| Selected Per–Share Data | |||||
| Net asset value, beginning of period | $40.28 | $37.28 | $28.58 | $23.48 | $23.90 |
| Income from Investment Operations | |||||
| Net investment income (loss)A | .28 | .18 | .18 | (.05)B | .08C |
| Net realized and unrealized gain (loss) | .06 | 2.98 | 8.54 | 5.22 | (.50) |
| Total from investment operations | .34 | 3.16 | 8.72 | 5.17 | (.42) |
| Distributions from net investment income | (.19)D | (.16) | (.02) | (.07) | – |
| Distributions from net realized gain | (.03)D | – | – | – | – |
| Total distributions | (.22) | (.16) | (.02) | (.07) | – |
| Net asset value, end of period | $40.40 | $40.28 | $37.28 | $28.58 | $23.48 |
| Total ReturnE,F | .86% | 8.51% | 30.52% | 22.08% | (1.76)% |
| Ratios to Average Net AssetsG,H | |||||
| Expenses before reductions | 1.15% | 1.17% | 1.23% | 1.38% | 1.35% |
| Expenses net of fee waivers, if any | 1.14% | 1.17% | 1.23% | 1.38% | 1.35% |
| Expenses net of all reductions | 1.14% | 1.17% | 1.22% | 1.38% | 1.35% |
| Net investment income (loss) | .68% | .47% | .54% | (.17)%B | .33%C |
| Supplemental Data | |||||
| Net assets, end of period (in millions) | $294 | $324 | $335 | $283 | $274 |
| Portfolio turnover rateI | 9% | 6% | 22% | 23% | 34% |
A Calculated based on average shares outstanding during the period.
B Investment income per share reflects a large, non-recurring dividend which amounted to $.07 per share. Excluding this non-recurring dividend, the ratio of net investment income (loss) to average net assets would have been (.45) %.
C Investment income per share reflects a large, non-recurring dividend which amounted to $.16 per share. Excluding this non-recurring dividend, the ratio of net investment income (loss) to average net assets would have been (.29) %.
D The amounts shown reflect certain reclassifications related to book to tax differences that were made in the year shown.
E Total returns would have been lower if certain expenses had not been reduced during the applicable periods shown.
F Total returns do not include the effect of the sales charges.
G Fees and expenses of any underlying Fidelity Central Funds are not included in the Fund's expense ratio. The Fund indirectly bears its proportionate share of the expenses of any underlying Fidelity Central Funds.
H Expense ratios reflect operating expenses of the class. Expenses before reductions do not reflect amounts reimbursed by the investment adviser or reductions from brokerage service arrangements or reductions from other expense offset arrangements and do not represent the amount paid by the class during periods when reimbursements or reductions occur. Expenses net of fee waivers reflect expenses after reimbursement by the investment adviser but prior to reductions from brokerage service arrangements or other expense offset arrangements. Expenses net of all reductions represent the net expenses paid by the class.
I Amount does not include the portfolio activity of any underlying Fidelity Central Funds.
See accompanying notes which are an integral part of the financial statements.
Financial Highlights — Fidelity Advisor Value Strategies Fund Class B
| Years ended November 30, | 2015 | 2014 | 2013 | 2012 | 2011 |
| Selected Per–Share Data | |||||
| Net asset value, beginning of period | $35.44 | $32.86 | $25.34 | $20.87 | $21.37 |
| Income from Investment Operations | |||||
| Net investment income (loss)A | .02 | (.05) | (.02) | (.18)B | (.06)C |
| Net realized and unrealized gain (loss) | .07 | 2.63 | 7.54 | 4.65 | (.44) |
| Total from investment operations | .09 | 2.58 | 7.52 | 4.47 | (.50) |
| Distributions from net investment income | – | – | – | – | – |
| Distributions from net realized gain | – | – | – | – | – |
| Total distributions | – | – | – | – | – |
| Net asset value, end of period | $35.53 | $35.44 | $32.86 | $25.34 | $20.87 |
| Total ReturnD,E | .25% | 7.85% | 29.68% | 21.42% | (2.34)% |
| Ratios to Average Net AssetsF,G | |||||
| Expenses before reductions | 1.77% | 1.78% | 1.83% | 1.97% | 1.93% |
| Expenses net of fee waivers, if any | 1.76% | 1.78% | 1.83% | 1.97% | 1.93% |
| Expenses net of all reductions | 1.76% | 1.78% | 1.82% | 1.97% | 1.93% |
| Net investment income (loss) | .06% | (.14)% | (.07)% | (.76)%B | (.25)%C |
| Supplemental Data | |||||
| Net assets, end of period (in millions) | $4 | $7 | $11 | $13 | $16 |
| Portfolio turnover rateH | 9% | 6% | 22% | 23% | 34% |
A Calculated based on average shares outstanding during the period.
B Investment income per share reflects a large, non-recurring dividend which amounted to $.06 per share. Excluding this non-recurring dividend, the ratio of net investment income (loss) to average net assets would have been (1.04) %.
C Investment income per share reflects a large, non-recurring dividend which amounted to $.16 per share. Excluding this non-recurring dividend, the ratio of net investment income (loss) to average net assets would have been (.87) %.
D Total returns would have been lower if certain expenses had not been reduced during the applicable periods shown.
E Total returns do not include the effect of the contingent deferred sales charge.
F Fees and expenses of any underlying Fidelity Central Funds are not included in the Fund's expense ratio. The Fund indirectly bears its proportionate share of the expenses of any underlying Fidelity Central Funds.
G Expense ratios reflect operating expenses of the class. Expenses before reductions do not reflect amounts reimbursed by the investment adviser or reductions from brokerage service arrangements or reductions from other expense offset arrangements and do not represent the amount paid by the class during periods when reimbursements or reductions occur. Expenses net of fee waivers reflect expenses after reimbursement by the investment adviser but prior to reductions from brokerage service arrangements or other expense offset arrangements. Expenses net of all reductions represent the net expenses paid by the class.
H Amount does not include the portfolio activity of any underlying Fidelity Central Funds.
See accompanying notes which are an integral part of the financial statements.
Financial Highlights — Fidelity Advisor Value Strategies Fund Class C
| November 30, | |||||
| Years ended November 30, | 2015 | 2014 | 2013 | 2012 | 2011 |
| Selected Per–Share Data | |||||
| Net asset value, beginning of period | $35.07 | $32.52 | $25.06 | $20.64 | $21.13 |
| Income from Investment Operations | |||||
| Net investment income (loss)A | .05 | (.03) | (.01) | (.17)B | (.05)C |
| Net realized and unrealized gain (loss) | .07 | 2.60 | 7.47 | 4.59 | (.44) |
| Total from investment operations | .12 | 2.57 | 7.46 | 4.42 | (.49) |
| Distributions from net investment income | (.04)D | (.02) | – | – | – |
| Distributions from net realized gain | (.03)D | – | – | – | – |
| Total distributions | (.07) | (.02) | – | – | – |
| Net asset value, end of period | $35.12 | $35.07 | $32.52 | $25.06 | $20.64 |
| Total ReturnE,F | .33% | 7.91% | 29.77% | 21.41% | (2.32)% |
| Ratios to Average Net AssetsG,H | |||||
| Expenses before reductions | 1.70% | 1.72% | 1.78% | 1.95% | 1.92% |
| Expenses net of fee waivers, if any | 1.69% | 1.72% | 1.78% | 1.95% | 1.92% |
| Expenses net of all reductions | 1.69% | 1.72% | 1.77% | 1.95% | 1.92% |
| Net investment income (loss) | .13% | (.08)% | (.02)% | (.75)%B | (.24)%C |
| Supplemental Data | |||||
| Net assets, end of period (in millions) | $49 | $53 | $54 | $43 | $40 |
| Portfolio turnover rateI | 9% | 6% | 22% | 23% | 34% |
A Calculated based on average shares outstanding during the period.
B Investment income per share reflects a large, non-recurring dividend which amounted to $.06 per share. Excluding this non-recurring dividend, the ratio of net investment income (loss) to average net assets would have been (1.02) %.
C Investment income per share reflects a large, non-recurring dividend which amounted to $.16 per share. Excluding this non-recurring dividend, the ratio of net investment income (loss) to average net assets would have been (.86) %.
D The amounts shown reflect certain reclassifications related to book to tax differences that were made in the year shown.
E Total returns would have been lower if certain expenses had not been reduced during the applicable periods shown.
F Total returns do not include the effect of the contingent deferred sales charge.
G Fees and expenses of any underlying Fidelity Central Funds are not included in the Fund's expense ratio. The Fund indirectly bears its proportionate share of the expenses of any underlying Fidelity Central Funds.
H Expense ratios reflect operating expenses of the class. Expenses before reductions do not reflect amounts reimbursed by the investment adviser or reductions from brokerage service arrangements or reductions from other expense offset arrangements and do not represent the amount paid by the class during periods when reimbursements or reductions occur. Expenses net of fee waivers reflect expenses after reimbursement by the investment adviser but prior to reductions from brokerage service arrangements or other expense offset arrangements. Expenses net of all reductions represent the net expenses paid by the class.
I Amount does not include the portfolio activity of any underlying Fidelity Central Funds.
See accompanying notes which are an integral part of the financial statements.
Financial Highlights — Fidelity Advisor Value Strategies Fund
| November 30, | |||||
| Years ended November 30, | 2015 | 2014 | 2013 | 2012 | 2011 |
| Selected Per–Share Data | |||||
| Net asset value, beginning of period | $43.56 | $40.28 | $30.89 | $25.37 | $25.80 |
| Income from Investment Operations | |||||
| Net investment income (loss)A | .51 | .40 | .37 | .09B | .22C |
| Net realized and unrealized gain (loss) | .07 | 3.21 | 9.20 | 5.62 | (.54) |
| Total from investment operations | .58 | 3.61 | 9.57 | 5.71 | (.32) |
| Distributions from net investment income | (.39)D | (.33) | (.18) | (.19) | (.10)D |
| Distributions from net realized gain | (.03)D | – | – | – | (.01)D |
| Total distributions | (.42) | (.33) | (.18) | (.19) | (.11) |
| Net asset value, end of period | $43.72 | $43.56 | $40.28 | $30.89 | $25.37 |
| Total ReturnE | 1.35% | 9.05% | 31.14% | 22.69% | (1.29)% |
| Ratios to Average Net AssetsF,G | |||||
| Expenses before reductions | .67% | .69% | .73% | .89% | .88% |
| Expenses net of fee waivers, if any | .67% | .69% | .73% | .89% | .88% |
| Expenses net of all reductions | .66% | .69% | .72% | .89% | .88% |
| Net investment income (loss) | 1.16% | .95% | 1.03% | .31%B | .80%C |
| Supplemental Data | |||||
| Net assets, end of period (in millions) | $716 | $786 | $681 | $396 | $284 |
| Portfolio turnover rateH | 9% | 6% | 22% | 23% | 34% |
A Calculated based on average shares outstanding during the period.
B Investment income per share reflects a large, non-recurring dividend which amounted to $.08 per share. Excluding this non-recurring dividend, the ratio of net investment income (loss) to average net assets would have been .04%.
C Investment income per share reflects a large, non-recurring dividends which amounted to $.16 per share. Excluding this non-recurring dividend, the ratio of net investment income (loss) to average net assets would have been .18%.
D The amounts shown reflect certain reclassifications related to book to tax differences that were made in the year shown.
E Total returns would have been lower if certain expenses had not been reduced during the applicable periods shown.
F Fees and expenses of any underlying Fidelity Central Funds are not included in the Fund's expense ratio. The Fund indirectly bears its proportionate share of the expenses of any underlying Fidelity Central Funds.
G Expense ratios reflect operating expenses of the class. Expenses before reductions do not reflect amounts reimbursed by the investment adviser or reductions from brokerage service arrangements or reductions from other expense offset arrangements and do not represent the amount paid by the class during periods when reimbursements or reductions occur. Expenses net of fee waivers reflect expenses after reimbursement by the investment adviser but prior to reductions from brokerage service arrangements or other expense offset arrangements. Expenses net of all reductions represent the net expenses paid by the class.
H Amount does not include the portfolio activity of any underlying Fidelity Central Funds.
See accompanying notes which are an integral part of the financial statements.
Financial Highlights — Fidelity Advisor Value Strategies Fund Class K
| November 30, | |||||
| Years ended November 30, | 2015 | 2014 | 2013 | 2012 | 2011 |
| Selected Per–Share Data | |||||
| Net asset value, beginning of period | $43.57 | $40.28 | $30.89 | $25.38 | $25.82 |
| Income from Investment Operations | |||||
| Net investment income (loss)A | .58 | .47 | .43 | .14B | .28C |
| Net realized and unrealized gain (loss) | .07 | 3.20 | 9.18 | 5.61 | (.55) |
| Total from investment operations | .65 | 3.67 | 9.61 | 5.75 | (.27) |
| Distributions from net investment income | (.45)D | (.38) | (.22) | (.24) | (.16)D |
| Distributions from net realized gain | (.03)D | – | – | – | (.01)D |
| Total distributions | (.48) | (.38) | (.22) | (.24) | (.17) |
| Net asset value, end of period | $43.74 | $43.57 | $40.28 | $30.89 | $25.38 |
| Total ReturnE | 1.51% | 9.21% | 31.34% | 22.93% | (1.11)% |
| Ratios to Average Net AssetsF,G | |||||
| Expenses before reductions | .51% | .53% | .58% | .71% | .68% |
| Expenses net of fee waivers, if any | .51% | .53% | .58% | .71% | .68% |
| Expenses net of all reductions | .51% | .53% | .57% | .71% | .68% |
| Net investment income (loss) | 1.31% | 1.11% | 1.18% | .50%B | 1.00%C |
| Supplemental Data | |||||
| Net assets, end of period (in millions) | $72 | $97 | $119 | $70 | $47 |
| Portfolio turnover rateH | 9% | 6% | 22% | 23% | 34% |
A Calculated based on average shares outstanding during the period.
B Investment income per share reflects a large, non-recurring dividend which amounted to $.08 per share. Excluding this non-recurring dividend, the ratio of net investment income (loss) to average net assets would have been .22%.
C Investment income per share reflects a large, non-recurring dividend which amounted to $.16 per share. Excluding this non-recurring dividend, the ratio of net investment income (loss) to average net assets would have been .38%.
D The amounts shown reflect certain reclassifications related to book to tax differences that were made in the year shown.
E Total returns would have been lower if certain expenses had not been reduced during the applicable periods shown.
F Fees and expenses of any underlying Fidelity Central Funds are not included in the Fund's expense ratio. The Fund indirectly bears its proportionate share of the expenses of any underlying Fidelity Central Funds.
G Expense ratios reflect operating expenses of the class. Expenses before reductions do not reflect amounts reimbursed by the investment adviser or reductions from brokerage service arrangements or reductions from other expense offset arrangements and do not represent the amount paid by the class during periods when reimbursements or reductions occur. Expenses net of fee waivers reflect expenses after reimbursement by the investment adviser but prior to reductions from brokerage service arrangements or other expense offset arrangements. Expenses net of all reductions represent the net expenses paid by the class.
H Amount does not include the portfolio activity of any underlying Fidelity Central Funds.
See accompanying notes which are an integral part of the financial statements.
Financial Highlights — Fidelity Advisor Value Strategies Fund Class I
| November 30, | |||||
| Years ended November 30, | 2015 | 2014 | 2013 | 2012 | 2011 |
| Selected Per–Share Data | |||||
| Net asset value, beginning of period | $41.57 | $38.46 | $29.51 | $24.26 | $24.69 |
| Income from Investment Operations | |||||
| Net investment income (loss)A | .48 | .37 | .34 | .08B | .22C |
| Net realized and unrealized gain (loss) | .08 | 3.06 | 8.79 | 5.37 | (.53) |
| Total from investment operations | .56 | 3.43 | 9.13 | 5.45 | (.31) |
| Distributions from net investment income | (.39)D | (.32) | (.18) | (.20) | (.11)D |
| Distributions from net realized gain | (.03)D | – | – | – | (.01)D |
| Total distributions | (.42) | (.32) | (.18) | (.20) | (.12) |
| Net asset value, end of period | $41.71 | $41.57 | $38.46 | $29.51 | $24.26 |
| Total ReturnE | 1.36% | 9.01% | 31.11% | 22.67% | (1.30)% |
| Ratios to Average Net AssetsF,G | |||||
| Expenses before reductions | .68% | .71% | .76% | .90% | .86% |
| Expenses net of fee waivers, if any | .68% | .71% | .76% | .90% | .86% |
| Expenses net of all reductions | .68% | .71% | .75% | .90% | .86% |
| Net investment income (loss) | 1.14% | .93% | 1.00% | .31%B | .82%C |
| Supplemental Data | |||||
| Net assets, end of period (in millions) | $65 | $86 | $74 | $66 | $52 |
| Portfolio turnover rateH | 9% | 6% | 22% | 23% | 34% |
A Calculated based on average shares outstanding during the period.
B Investment income per share reflects a large, non-recurring dividend which amounted to $.08 per share. Excluding this non-recurring dividend, the ratio of net investment income (loss) to average net assets would have been .03%.
C Investment income per share reflects a large, non-recurring dividend which amounted to $.16 per share. Excluding this non-recurring dividend, the ratio of net investment income (loss) to average net assets would have been .20%.
D The amounts shown reflect certain reclassifications related to book to tax differences that were made in the year shown.
E Total returns would have been lower if certain expenses had not been reduced during the applicable periods shown.
F Fees and expenses of any underlying Fidelity Central Funds are not included in the Fund's expense ratio. The Fund indirectly bears its proportionate share of the expenses of any underlying Fidelity Central Funds.
G Expense ratios reflect operating expenses of the class. Expenses before reductions do not reflect amounts reimbursed by the investment adviser or reductions from brokerage service arrangements or reductions from other expense offset arrangements and do not represent the amount paid by the class during periods when reimbursements or reductions occur. Expenses net of fee waivers reflect expenses after reimbursement by the investment adviser but prior to reductions from brokerage service arrangements or other expense offset arrangements. Expenses net of all reductions represent the net expenses paid by the class.
H Amount does not include the portfolio activity of any underlying Fidelity Central Funds.
See accompanying notes which are an integral part of the financial statements.
Notes to Financial Statements
For the period ended November 30, 2015
(Amounts in thousands except percentages)
1. Organization.
Fidelity Advisor Value Strategies Fund (the Fund) is a fund of Fidelity Advisor Series I (the Trust) and is authorized to issue an unlimited number of shares. The Trust is registered under the Investment Company Act of 1940, as amended (the 1940 Act), as an open-end management investment company organized as a Massachusetts business trust. The Fund offers Class A, Class T, Class C, Fidelity Value Strategies Fund, Class K and Class I (formerly Institutional Class) shares, each of which, along with Class B shares, has equal rights as to assets and voting privileges. Class B shares are closed to new accounts and additional purchases, except for exchanges and reinvestments. Each class has exclusive voting rights with respect to matters that affect that class. Class B shares will automatically convert to Class A shares after a holding period of seven years from the initial date of purchase.
2. Investments in Fidelity Central Funds.
The Fund invests in Fidelity Central Funds, which are open-end investment companies generally available only to other investment companies and accounts managed by the investment adviser and its affiliates. The Fund's Schedule of Investments lists each of the Fidelity Central Funds held as of period end, if any, as an investment of the Fund, but does not include the underlying holdings of each Fidelity Central Fund. As an Investing Fund, the Fund indirectly bears its proportionate share of the expenses of the underlying Fidelity Central Funds.
The Money Market Central Funds seek preservation of capital and current income and are managed by Fidelity Investments Money Management, Inc. (FIMM), an affiliate of the investment adviser. Annualized expenses of the Money Market Central Funds as of their most recent shareholder report date are less than .005%.
A complete unaudited list of holdings for each Fidelity Central Fund is available upon request or at the Securities and Exchange Commission (the SEC) website at www.sec.gov. In addition, the financial statements of the Fidelity Central Funds, which are not covered by the Fund's Report of Independent Registered Public Accounting Firm, are available on the SEC website or upon request.
3. Significant Accounting Policies.
The financial statements have been prepared in conformity with accounting principles generally accepted in the United States of America (GAAP), which require management to make certain estimates and assumptions at the date of the financial statements. Actual results could differ from those estimates. Subsequent events, if any, through the date that the financial statements were issued have been evaluated in the preparation of the financial statements. The following summarizes the significant accounting policies of the Fund:
Investment Valuation. Investments are valued as of 4:00 p.m. Eastern time on the last calendar day of the period. The Board of Trustees (the Board) has delegated the day to day responsibility for the valuation of the Fund's investments to the Fidelity Management & Research Company (FMR) Fair Value Committee (the Committee). In accordance with valuation policies and procedures approved by the Board, the Fund attempts to obtain prices from one or more third party pricing vendors or brokers to value its investments. When current market prices, quotations or currency exchange rates are not readily available or reliable, investments will be fair valued in good faith by the Committee, in accordance with procedures adopted by the Board. Factors used in determining fair value vary by investment type and may include market or investment specific events, changes in interest rates and credit quality. The frequency with which these procedures are used cannot be predicted and they may be utilized to a significant extent. The Committee oversees the Fund's valuation policies and procedures and reports to the Board on the Committee's activities and fair value determinations. The Board monitors the appropriateness of the procedures used in valuing the Fund's investments and ratifies the fair value determinations of the Committee.
The Fund categorizes the inputs to valuation techniques used to value its investments into a disclosure hierarchy consisting of three levels as shown below:
- Level 1 – quoted prices in active markets for identical investments
- Level 2 – other significant observable inputs (including quoted prices for similar investments, interest rates, prepayment speeds, etc.)
- Level 3 – unobservable inputs (including the Fund's own assumptions based on the best information available)
Valuation techniques used to value the Fund's investments by major category are as follows:
Equity securities, including restricted securities, for which market quotations are readily available, are valued at the last reported sale price or official closing price as reported by a third party pricing vendor on the primary market or exchange on which they are traded and are categorized as Level 1 in the hierarchy. In the event there were no sales during the day or closing prices are not available, securities are valued at the last quoted bid price or may be valued using the last available price and are generally categorized as Level 2 in the hierarchy. For foreign equity securities, when market or security specific events arise, comparisons to the valuation of American Depositary Receipts (ADRs), futures contracts, Exchange-Traded Funds (ETFs) and certain indexes as well as quoted prices for similar securities may be used and would be categorized as Level 2 in the hierarchy. Utilizing these techniques may result in transfers between Level 1 and Level 2. For equity securities, including restricted securities, where observable inputs are limited, assumptions about market activity and risk are used and these securities may be categorized as Level 3 in the hierarchy.
Debt securities, including restricted securities, are valued based on evaluated prices received from third party pricing vendors or from brokers who make markets in such securities. Corporate bonds are valued by pricing vendors who utilize matrix pricing which considers yield or price of bonds of comparable quality, coupon, maturity and type or by broker-supplied prices. When independent prices are unavailable or unreliable, debt securities may be valued utilizing pricing methodologies which consider similar factors that would be used by third party pricing vendors. Debt securities are generally categorized as Level 2 in the hierarchy but may be Level 3 depending on the circumstances.
Investments in open-end mutual funds, including the Fidelity Central Funds, are valued at their closing net asset value (NAV) each business day and are categorized as Level 1 in the hierarchy.
Changes in valuation techniques may result in transfers in or out of an assigned level within the disclosure hierarchy. The aggregate value of investments by input level as of November 30, 2015, is included at the end of the Fund's Schedule of Investments.
Foreign Currency. The Fund may use foreign currency contracts to facilitate transactions in foreign-denominated securities. Gains and losses from these transactions may arise from changes in the value of the foreign currency or if the counterparties do not perform under the contracts' terms.
Foreign-denominated assets, including investment securities, and liabilities are translated into U.S. dollars at the exchange rates at period end. Purchases and sales of investment securities, income and dividends received and expenses denominated in foreign currencies are translated into U.S. dollars at the exchange rate in effect on the transaction date.
The effects of exchange rate fluctuations on investments are included with the net realized and unrealized gain (loss) on investment securities. Other foreign currency transactions resulting in realized and unrealized gain (loss) are disclosed separately.
Investment Transactions and Income. For financial reporting purposes, the Fund's investment holdings and NAV include trades executed through the end of the last business day of the period. The NAV per share for processing shareholder transactions is calculated as of the close of business of the New York Stock Exchange (NYSE), normally 4:00 p.m. Eastern time and includes trades executed through the end of the prior business day. Gains and losses on securities sold are determined on the basis of identified cost and may include proceeds received from litigation. Dividend income is recorded on the ex-dividend date, except for certain dividends from foreign securities where the ex-dividend date may have passed, which are recorded as soon as the Fund is informed of the ex-dividend date. Non-cash dividends included in dividend income, if any, are recorded at the fair market value of the securities received. Income and capital gain distributions from Fidelity Central Funds, if any, are recorded on the ex-dividend date. Distributions received on securities that represent a return of capital or capital gain are recorded as a reduction of cost of investments and/or as a realized gain. Subsequent to ex-dividend date the Fund determines the components of these distributions, based upon receipt of tax filings or other correspondence relating to the underlying investment. Interest income is accrued as earned and includes coupon interest and amortization of premium and accretion of discount on debt securities as applicable. Investment income is recorded net of foreign taxes withheld where recovery of such taxes is uncertain.
Class Allocations and Expenses. Investment income, realized and unrealized capital gains and losses, common expenses of the Fund, and certain fund-level expense reductions, if any, are allocated daily on a pro-rata basis to each class based on the relative net assets of each class to the total net assets of the Fund. Each class differs with respect to transfer agent and distribution and service plan fees incurred. Certain expense reductions may also differ by class. For the reporting period, the allocated portion of income and expenses to each class as a percent of its average net assets may vary due to the timing of recording these transactions in relation to fluctuating net assets of the classes. Expenses directly attributable to a fund are charged to that fund. Expenses attributable to more than one fund are allocated among the respective funds on the basis of relative net assets or other appropriate methods. Expense estimates are accrued in the period to which they relate and adjustments are made when actual amounts are known.
Income Tax Information and Distributions to Shareholders. Each year, the Fund intends to qualify as a regulated investment company under Subchapter M of the Internal Revenue Code, including distributing substantially all of its taxable income and realized gains. As a result, no provision for U.S. Federal income taxes is required. As of November 30, 2015, the Fund did not have any unrecognized tax benefits in the financial statements; nor is the Fund aware of any tax positions for which it is reasonably possible that the total amounts of unrecognized tax benefits will significantly change in the next twelve months. The Fund files a U.S. federal tax return, in addition to state and local tax returns as required. The Fund's federal income tax returns are subject to examination by the Internal Revenue Service (IRS) for a period of three fiscal years after they are filed. State and local tax returns may be subject to examination for an additional fiscal year depending on the jurisdiction. Foreign taxes are provided for based on the Fund's understanding of the tax rules and rates that exist in the foreign markets in which it invests.
Distributions are declared and recorded on the ex-dividend date. Income dividends and capital gain distributions are declared separately for each class. Income and capital gain distributions are determined in accordance with income tax regulations, which may differ from GAAP. These differences resulted in distribution reclassifications.
Capital accounts within the financial statements are adjusted for permanent book-tax differences. These adjustments have no impact on net assets or the results of operations. Capital accounts are not adjusted for temporary book-tax differences which will reverse in a subsequent period.
Book-tax differences are primarily due to foreign currency transactions, passive foreign investment companies (PFIC), partnerships, market discount, deferred trustees compensation, capital loss carryforwards and losses deferred due to wash sales and tax regulations.
The federal tax cost of investment securities and unrealized appreciation (depreciation) as of period end were as follows:
| Gross unrealized appreciation | $487,259 |
| Gross unrealized depreciation | (37,739) |
| Net unrealized appreciation (depreciation) on securities | $449,520 |
| Tax Cost | $863,860 |
The tax-based components of distributable earnings as of period end were as follows:
| Undistributed ordinary income | $12,594 |
| Capital loss carryforward | $(133,637) |
| Net unrealized appreciation (depreciation) on securities and other investments | $449,520 |
Capital loss carryforwards are only available to offset future capital gains of the Fund to the extent provided by regulations and may be limited. Under the Regulated Investment Company Modernization Act of 2010 (the Act), the Fund is permitted to carry forward capital losses incurred in taxable years beginning after December 22, 2010 for an unlimited period and such capital losses are required to be used prior to any losses that expire. The capital loss carryforward information presented below, including any applicable limitation, is estimated as of fiscal period end and is subject to adjustment.
| Fiscal year of expiration | |
| 2017 | $(133,637) |
The Fund intends to elect to defer to its next fiscal year $734 of capital losses recognized during the period November 1, 2015 to November 30, 2015.
The tax character of distributions paid was as follows:
| November 30, 2015 | November 30, 2014 | |
| Ordinary Income | $13,019 | $ 10,331 |
4. Purchases and Sales of Investments.
Purchases and sales of securities, other than short-term securities, aggregated $129,951 and $350,153, respectively.
5. Fees and Other Transactions with Affiliates.
Management Fee. Fidelity Management & Research Company (the investment adviser) and its affiliates provide the Fund with investment management related services for which the Fund pays a monthly management fee. The management fee is the sum of an individual fund fee rate that is based on an annual rate of .30% of the Fund's average net assets and an annualized group fee rate that averaged .25% during the period. The group fee rate is based upon the average net assets of all the mutual funds advised by the investment adviser, including any mutual funds previously advised by the investment adviser that are currently advised by Fidelity SelectCo, LLC, an affiliate of the investment adviser. The group fee rate decreases as assets under management increase and increases as assets under management decrease. In addition, the management fee is subject to a performance adjustment (up to a maximum of +/- .20% of the Fund's average net assets over a 36 month performance period). The upward or downward adjustment to the management fee is based on the relative investment performance of Fidelity Value Strategies Fund as compared to its benchmark index, the Russell Midcap Value Index, over the same 36 month performance period. For the reporting period, the total annual management fee rate, including the performance adjustment, was .42% of the Fund's average net assets. The performance adjustment included in the management fee rate may be higher or lower than the maximum performance adjustment rate due to the difference between the average net assets for the reporting and performance periods.
Distribution and Service Plan Fees. In accordance with Rule 12b-1 of the 1940 Act, the Fund has adopted separate Distribution and Service Plans for each class of shares. Certain classes pay Fidelity Distributors Corporation (FDC), an affiliate of the investment adviser, separate Distribution and Service Fees, each of which is based on an annual percentage of each class' average net assets. In addition, FDC may pay financial intermediaries for selling shares of the Fund and providing shareholder support services. For the period, the Distribution and Service Fee rates, total fees and amounts retained by FDC were as follows:
| Distribution Fee | Service Fee | Total Fees | Retained by FDC | |
| Class A | -% | .25% | $573 | $5 |
| Class T | .25% | .25% | 1,574 | 12 |
| Class B | .75% | .25% | 56 | 42 |
| Class C | .75% | .25% | 522 | 24 |
| $2,725 | $83 |
Sales Load. FDC may receive a front-end sales charge of up to 5.75% for selling Class A shares and 3.50% for selling Class T shares, some of which is paid to financial intermediaries for selling shares of the Fund. Depending on the holding period, FDC may receive contingent deferred sales charges levied on Class A, Class T, Class B, and Class C redemptions. The deferred sales charges range from 5.00% to 1.00% for Class B shares, 1.00% for Class C shares, 1.00% for certain purchases of Class A shares and .25% for certain purchases of Class T shares.
For the period, sales charge amounts retained by FDC were as follows:
| Retained by FDC | |
| Class A | $21 |
| Class T | 8 |
| Class B(a) | 2 |
| Class C(a) | 2 |
| $33 |
(a) When Class B and Class C shares are initially sold, FDC pays commissions from its own resources to financial intermediaries through which the sales are made.
Transfer Agent Fees. Fidelity Investments Institutional Operations Company, Inc., (FIIOC), an affiliate of the investment adviser, is the transfer, dividend disbursing and shareholder servicing agent for each class of the Fund. FIIOC receives account fees and asset-based fees that vary according to the account size and type of account of the shareholders of the respective classes of the Fund, except for Class K. FIIOC receives an asset-based fee of Class K's average net assets. FIIOC pays for typesetting, printing and mailing of shareholder reports, except proxy statements.
For the period, transfer agent fees for each class were as follows:
| Amount | % of Class-Level Average Net Assets | |
| Class A | $508 | .22 |
| Class T | 583 | .19 |
| Class B | 17 | .30 |
| Class C | 122 | .23 |
| Fidelity Value Strategies Fund | 1,437 | .21 |
| Class K | 37 | .05 |
| Class I | 173 | .22 |
| $2,877 |
Accounting and Security Lending Fees. Fidelity Service Company, Inc. (FSC), an affiliate of the investment adviser, maintains the Fund's accounting records. The accounting fee is based on the level of average net assets for each month. Under a separate contract, FSC administers the security lending program. The security lending fee is based on the number and duration of lending transactions.
Brokerage Commissions. The Fund placed a portion of its portfolio transactions with brokerage firms which are affiliates of the investment adviser. Brokerage commissions are included in net realized gain (loss) and change in net unrealized appreciation (depreciation) in the Statement of Operations. The commissions paid to these affiliated firms were $5 for the period.
6. Committed Line of Credit.
The Fund participates with other funds managed by the investment adviser or an affiliate in a $4.25 billion credit facility (the "line of credit") to be utilized for temporary or emergency purposes to fund shareholder redemptions or for other short-term liquidity purposes. The Fund has agreed to pay commitment fees on its pro-rata portion of the line of credit, which amounted to $2 and is reflected in Miscellaneous expenses on the Statement of Operations. During the period, the Fund did not borrow on this line of credit.
7. Security Lending.
The Fund lends portfolio securities through a lending agent from time to time in order to earn additional income. For equity securities, a lending agent is used and may loan securities to certain qualified borrowers, including Fidelity Capital Markets (FCM), a broker-dealer affiliated with the Fund. On the settlement date of the loan, the Fund receives collateral (in the form of U.S. Treasury obligations, letters of credit and/or cash) against the loaned securities and maintains collateral in an amount not less than 100% of the market value of the loaned securities during the period of the loan. The market value of the loaned securities is determined at the close of business of the Fund and any additional required collateral is delivered to the Fund on the next business day. The Fund or borrower may terminate the loan at any time, and if the borrower defaults on its obligation to return the securities loaned because of insolvency or other reasons, the Fund may apply collateral received from the borrower against the obligation. The Fund may experience delays and costs in recovering the securities loaned. Any cash collateral received is invested in the Fidelity Securities Lending Cash Central Fund. The value of loaned securities and cash collateral at period end are disclosed on the Fund's Statement of Assets and Liabilities. At period end, there were no security loans outstanding with FCM. Security lending income represents the income earned on investing cash collateral, less rebates paid to borrowers and any lending agent fees associated with the loan, plus any premium payments received for lending certain types of securities. Security lending income is presented in the Statement of Operations as a component of income from Fidelity Central Funds. Total security lending income during the period amounted to $791, including $3 from securities loaned to FCM.
8. Expense Reductions.
Commissions paid to certain brokers with whom the investment adviser, or its affiliates, places trades on behalf of the Fund include an amount in addition to trade execution, which may be rebated back to the Fund to offset certain expenses. This amount totaled $39 for the period.
In addition, during the period the investment adviser reimbursed and/or waived a portion of fund-level operating expenses in the amount of $6 and a portion of class-level operating expenses as follows:
| Amount | |
| Class A | $5 |
| Class T | 8 |
| Class B | –(a) |
| Class C | 1 |
| Fidelity Value Strategies Fund | 17 |
| Class I | 1 |
| $32 |
(a) In the amount of less than five hundred dollars.
9. Distributions to Shareholders.
Distributions to shareholders of each class were as follows:
| Years ended November 30, | 2015 | 2014 |
| From net investment income | ||
| Class A | $1,691 | $1,567 |
| Class T | 1,553 | 1,415 |
| Class C | 56 | 32 |
| Fidelity Value Strategies Fund | 6,934 | 5,578 |
| Class K | 896 | 1,131 |
| Class I | 799 | 608 |
| Total | $11,929 | $10,331 |
| From net realized gain | ||
| Class A | $174 | $– |
| Class T | 234 | – |
| Class C | 44 | – |
| Fidelity Value Strategies Fund | 520 | – |
| Class K | 58 | – |
| Class I | 60 | – |
| Total | $1,090 | $– |
10. Share Transactions.
Share transactions for each class were as follows and may contain automatic conversions between classes or exchanges between funds:
| Shares | Shares | Dollars | Dollars | |
| Years ended November 30, | 2015 | 2014 | 2015 | 2014 |
| Class A | ||||
| Shares sold | 391 | 546 | $15,470 | $20,399 |
| Reinvestment of distributions | 46 | 41 | 1,760 | 1,447 |
| Shares redeemed | (904) | (1,342) | (35,567) | (50,201) |
| Net increase (decrease) | (467) | (755) | $(18,337) | $(28,355) |
| Class T | ||||
| Shares sold | 486 | 435 | $19,926 | $16,774 |
| Reinvestment of distributions | 41 | 35 | 1,646 | 1,293 |
| Shares redeemed | (1,296) | (1,420) | (52,610) | (54,916) |
| Net increase (decrease) | (769) | (950) | $(31,038) | $(36,849) |
| Class B | ||||
| Shares sold | – | 1 | $12 | $30 |
| Reinvestment of distributions | – | – | – | – |
| Shares redeemed | (95) | (140) | (3,438) | (4,799) |
| Net increase (decrease) | (95) | (139) | $(3,426) | $(4,769) |
| Class C | ||||
| Shares sold | 131 | 125 | $4,724 | $4,210 |
| Reinvestment of distributions | 3 | 1 | 95 | 29 |
| Shares redeemed | (237) | (282) | (8,407) | (9,502) |
| Net increase (decrease) | (103) | (156) | $(3,588) | $(5,263) |
| Fidelity Value Strategies Fund | ||||
| Shares sold | 3,980 | 7,626 | $174,437 | $315,612 |
| Reinvestment of distributions | 106 | 127 | 4,551 | 4,998 |
| Shares redeemed | (5,750) | (6,627) | (250,149) | (273,372) |
| Net increase (decrease) | (1,664) | 1,126 | $(71,161) | $47,238 |
| Class K | ||||
| Shares sold | 390 | 669 | $17,106 | $27,831 |
| Reinvestment of distributions | 22 | 29 | 954 | 1,131 |
| Shares redeemed | (1,001) | (1,437) | (44,142) | (60,236) |
| Net increase (decrease) | (589) | (739) | $(26,082) | $(31,274) |
| Class I | ||||
| Shares sold | 288 | 522 | $12,081 | $20,905 |
| Reinvestment of distributions | 18 | 14 | 748 | 523 |
| Shares redeemed | (809) | (403) | (34,620) | (15,969) |
| Net increase (decrease) | (503) | 133 | $(21,791) | $5,459 |
11. Other.
The Fund's organizational documents provide former and current trustees and officers with a limited indemnification against liabilities arising in connection with the performance of their duties to the Fund. In the normal course of business, the Fund may also enter into contracts that provide general indemnifications. The Fund's maximum exposure under these arrangements is unknown as this would be dependent on future claims that may be made against the Fund. The risk of material loss from such claims is considered remote.
Report of Independent Registered Public Accounting Firm
To the Trustees of Fidelity Advisor Series I and Shareholders of Fidelity Advisor® Value Strategies Fund:
We have audited the accompanying statement of assets and liabilities of Fidelity Advisor® Value Strategies Fund (the Fund), a fund of Fidelity Advisor Series I, including the schedule of investments, as of November 30, 2015, and the related statement of operations for the year then ended, the statement of changes in net assets for each of the two years in the period then ended, and the financial highlights for each of the five years in the period then ended. These financial statements and financial highlights are the responsibility of the Fund's management. Our responsibility is to express an opinion on these financial statements and financial highlights based on our audits.
We conducted our audits in accordance with the standards of the Public Company Accounting Oversight Board (United States). Those standards require that we plan and perform the audit to obtain reasonable assurance about whether the financial statements and financial highlights are free of material misstatement. The Fund is not required to have, nor were we engaged to perform, an audit of its internal control over financial reporting. Our audits included consideration of internal control over financial reporting as a basis for designing audit procedures that are appropriate in the circumstances, but not for the purpose of expressing an opinion on the effectiveness of the Fund's internal control over financial reporting. Accordingly, we express no such opinion. An audit also includes examining, on a test basis, evidence supporting the amounts and disclosures in the financial statements, assessing the accounting principles used and significant estimates made by management, as well as evaluating the overall financial statement presentation. Our procedures included confirmation of securities owned as of November 30, 2015, by correspondence with the custodians and brokers. We believe that our audits provide a reasonable basis for our opinion.
In our opinion, such financial statements and financial highlights referred to above present fairly, in all material respects, the financial position of Fidelity Advisor® Value Strategies Fund as of November 30, 2015, the results of its operations for the year then ended, the changes in its net assets for each of the two years in the period then ended, and the financial highlights for each of the five years in the period then ended, in conformity with accounting principles generally accepted in the United States of America.
DELOITTE & TOUCHE LLP
Boston, Massachusetts
January 15, 2016
Trustees and Officers
The Trustees, Members of the Advisory Board (if any), and officers of the trust and fund, as applicable, are listed below. The Board of Trustees governs the fund and is responsible for protecting the interests of shareholders. The Trustees are experienced executives who meet periodically throughout the year to oversee the fund's activities, review contractual arrangements with companies that provide services to the fund, oversee management of the risks associated with such activities and contractual arrangements, and review the fund's performance. Each of the Trustees oversees 170 funds.
The Trustees hold office without limit in time except that (a) any Trustee may resign; (b) any Trustee may be removed by written instrument, signed by at least two-thirds of the number of Trustees prior to such removal; (c) any Trustee who requests to be retired or who has become incapacitated by illness or injury may be retired by written instrument signed by a majority of the other Trustees; and (d) any Trustee may be removed at any special meeting of shareholders by a two-thirds vote of the outstanding voting securities of the trust. Each Trustee who is not an interested person (as defined in the 1940 Act) of the trust and the fund is referred to herein as an Independent Trustee. Each Independent Trustee shall retire not later than the last day of the calendar year in which his or her 75th birthday occurs. The Independent Trustees may waive this mandatory retirement age policy with respect to individual Trustees. Officers and Advisory Board Members hold office without limit in time, except that any officer or Advisory Board Member may resign or may be removed by a vote of a majority of the Trustees at any regular meeting or any special meeting of the Trustees. Except as indicated, each individual has held the office shown or other offices in the same company for the past five years.
The fund’s Statement of Additional Information (SAI) includes more information about the Trustees. To request a free copy, call Fidelity at 1-877-208-0098.
Experience, Skills, Attributes, and Qualifications of the Trustees. The Governance and Nominating Committee has adopted a statement of policy that describes the experience, qualifications, attributes, and skills that are necessary and desirable for potential Independent Trustee candidates (Statement of Policy). The Board believes that each Trustee satisfied at the time he or she was initially elected or appointed a Trustee, and continues to satisfy, the standards contemplated by the Statement of Policy. The Governance and Nominating Committee also engages professional search firms to help identify potential Independent Trustee candidates who have the experience, qualifications, attributes, and skills consistent with the Statement of Policy. From time to time, additional criteria based on the composition and skills of the current Independent Trustees, as well as experience or skills that may be appropriate in light of future changes to board composition, business conditions, and regulatory or other developments, have also been considered by the professional search firms and the Governance and Nominating Committee. In addition, the Board takes into account the Trustees' commitment and participation in Board and committee meetings, as well as their leadership of standing and ad hoc committees throughout their tenure.
In determining that a particular Trustee was and continues to be qualified to serve as a Trustee, the Board has considered a variety of criteria, none of which, in isolation, was controlling. The Board believes that, collectively, the Trustees have balanced and diverse experience, qualifications, attributes, and skills, which allow the Board to operate effectively in governing the fund and protecting the interests of shareholders. Information about the specific experience, skills, attributes, and qualifications of each Trustee, which in each case led to the Board's conclusion that the Trustee should serve (or continue to serve) as a trustee of the fund, is provided below.
Board Structure and Oversight Function. James C. Curvey is an interested person and currently serves as Chairman. The Trustees have determined that an interested Chairman is appropriate and benefits shareholders because an interested Chairman has a personal and professional stake in the quality and continuity of services provided to the fund. Independent Trustees exercise their informed business judgment to appoint an individual of their choosing to serve as Chairman, regardless of whether the Trustee happens to be independent or a member of management. The Independent Trustees have determined that they can act independently and effectively without having an Independent Trustee serve as Chairman and that a key structural component for assuring that they are in a position to do so is for the Independent Trustees to constitute a substantial majority for the Board. The Independent Trustees also regularly meet in executive session. Ned C. Lautenbach serves as Chairman of the Independent Trustees and as such (i) acts as a liaison between the Independent Trustees and management with respect to matters important to the Independent Trustees and (ii) with management prepares agendas for Board meetings.
Fidelity® funds are overseen by different Boards of Trustees. The fund's Board oversees Fidelity's high income and certain equity funds, and other Boards oversee Fidelity's investment-grade bond, money market, asset allocation, and sector funds. The asset allocation funds may invest in Fidelity® funds overseen by the fund's Board. The use of separate Boards, each with its own committee structure, allows the Trustees of each group of Fidelity® funds to focus on the unique issues of the funds they oversee, including common research, investment, and operational issues. On occasion, the separate Boards establish joint committees to address issues of overlapping consequences for the Fidelity® funds overseen by each Board.
The Trustees operate using a system of committees to facilitate the timely and efficient consideration of all matters of importance to the Trustees, the fund, and fund shareholders and to facilitate compliance with legal and regulatory requirements and oversight of the fund's activities and associated risks. The Board, acting through its committees, has charged FMR and its affiliates with (i) identifying events or circumstances the occurrence of which could have demonstrably adverse effects on the fund's business and/or reputation; (ii) implementing processes and controls to lessen the possibility that such events or circumstances occur or to mitigate the effects of such events or circumstances if they do occur; and (iii) creating and maintaining a system designed to evaluate continuously business and market conditions in order to facilitate the identification and implementation processes described in (i) and (ii) above. Because the day-to-day operations and activities of the fund are carried out by or through FMR, its affiliates, and other service providers, the fund's exposure to risks is mitigated but not eliminated by the processes overseen by the Trustees. While each of the Board's committees has responsibility for overseeing different aspects of the fund's activities, oversight is exercised primarily through the Operations, Audit, and Compliance Committees. In addition, the Independent Trustees have worked with FMR to enhance the Board's oversight of investment and financial risks, legal and regulatory risks, technology risks, and operational risks, including the development of additional risk reporting to the Board. For example, a working group comprised of Independent Trustees and FMR has worked and continues to work to review the Fidelity® funds' valuation-related activities, reporting and risk management. Appropriate personnel, including but not limited to the fund's Chief Compliance Officer (CCO), FMR's internal auditor, the independent accountants, the fund's Treasurer and portfolio management personnel, make periodic reports to the Board's committees, as appropriate, including an annual review of Fidelity's risk management program for the Fidelity® funds. The responsibilities of each standing committee, including their oversight responsibilities, are described further under "Standing Committees of the Trustees."
Interested Trustees*:
Correspondence intended for a Trustee who is an interested person may be sent to Fidelity Investments, 245 Summer Street, Boston, Massachusetts 02210.
Name, Year of Birth; Principal Occupations and Other Relevant Experience+
James C. Curvey (1935)
Year of Election or Appointment: 2007
Trustee
Chairman of the Board of Trustees
Mr. Curvey also serves as Trustee of other Fidelity® funds. Mr. Curvey is a Director of Fidelity Research & Analysis Co. (investment adviser firm, 2009-present), and Vice Chairman (2007-present) and Director of FMR LLC (diversified financial services company). In addition, Mr. Curvey serves as an Overseer for the Boston Symphony Orchestra and a member of the board of Artis-Naples, Naples, Florida, and as a Trustee for Brewster Academy, Wolfeboro, New Hampshire. Previously, Mr. Curvey served as a Director of Fidelity Investments Money Management, Inc. (investment adviser firm, 2009-2014) and a Director of FMR and FMR Co., Inc. (investment adviser firms, 2007-2014).
Charles S. Morrison (1960)
Year of Election or Appointment: 2014
Trustee
Mr. Morrison also serves as Trustee of other funds. He serves as a Director of Fidelity Investments Money Management, Inc. (FIMM) (investment adviser firm, 2014-present), Director of Fidelity SelectCo, LLC (investment adviser firm, 2014-present), President, Asset Management (2014-present), and is an employee of Fidelity Investments. Previously, Mr. Morrison served as Vice President of Fidelity's Fixed Income and Asset Allocation Funds (2012-2014), President, Fixed Income (2011-2014), Vice President of Fidelity's Money Market Funds (2005-2009), President, Money Market Group Leader of FMR (investment adviser firm, 2009), and Senior Vice President, Money Market Group of FMR (2004-2009). Mr. Morrison also served as Vice President of Fidelity's Bond Funds (2002-2005), certain Balanced Funds (2002-2005), and certain Asset Allocation Funds (2002-2007), and as Senior Vice President (2002-2005) of Fidelity's Bond Division.
* Determined to be an “Interested Trustee” by virtue of, among other things, his or her affiliation with the trust or various entities under common control with FMR.
+ The information includes the Trustee's principal occupation during the last five years and other information relating to the experience, attributes, and skills relevant to the Trustee's qualifications to serve as a Trustee, which led to the conclusion that the Trustee should serve as a Trustee for the fund.
Independent Trustees:
Correspondence intended for an Independent Trustee may be sent to Fidelity Investments, P.O. Box 55235, Boston, Massachusetts 02205-5235.
Name, Year of Birth; Principal Occupations and Other Relevant Experience+
Dennis J. Dirks (1948)
Year of Election or Appointment: 2005
Trustee
Mr. Dirks also serves as Trustee of other Fidelity® funds. Prior to his retirement in May 2003, Mr. Dirks was Chief Operating Officer and a member of the Board of The Depository Trust & Clearing Corporation (DTCC). He also served as President, Chief Operating Officer, and Board member of The Depository Trust Company (DTC) and President and Board member of the National Securities Clearing Corporation (NSCC). In addition, Mr. Dirks served as Chief Executive Officer and Board member of the Government Securities Clearing Corporation, Chief Executive Officer and Board member of the Mortgage-Backed Securities Clearing Corporation, as a Trustee and a member of the Finance Committee of Manhattan College (2005-2008), as a Trustee and a member of the Finance Committee of AHRC of Nassau County (2006-2008), and as a member of the Independent Directors Council (IDC) Governing Council (2010-2015). Mr. Dirks is a member of the Board of Directors for The Brookville Center for Children's Services, Inc. (2009-present).
Alan J. Lacy (1953)
Year of Election or Appointment: 2008
Trustee
Mr. Lacy also serves as Trustee of other Fidelity® funds. Mr. Lacy serves as a member of the Board of Directors of Dave & Buster's Entertainment, Inc. (restaurant and entertainment complexes, 2010-present) and Bristol-Myers Squibb Company (global pharmaceuticals, 2008-present). In addition, Mr. Lacy served as Senior Adviser (2007-2014) of Oak Hill Capital Partners, L.P. (private equity) and also served as Chief Executive Officer (2000-2005) and Vice Chairman (2005-2006) of Sears Holdings Corporation and Sears, Roebuck and Co. (retail). Mr. Lacy is a member of the Board of Trustees of The National Parks Conservation Association (2006-present). Previously, Mr. Lacy served as Chairman of the Board of Trustees of the National Parks Conservation Association (2008-2011) and as a member of the Board of Directors for The Western Union Company (global money transfer, 2006-2011), The Hillman Companies, Inc. (hardware wholesalers, 2010-2014), and Earth Fare, Inc. (retail grocery, 2010-2014).
Ned C. Lautenbach (1944)
Year of Election or Appointment: 2000
Trustee
Chairman of the Independent Trustees
Mr. Lautenbach also serves as Trustee of other Fidelity® funds. Mr. Lautenbach currently serves as the Lead Director of the Eaton Corporation Board of Directors (diversified industrial, 1997-present). Mr. Lautenbach is Chairman of the Board of Directors of Artis-Naples in Naples, Florida (2012-present), a member of the Council on Foreign Relations (1994-present), and a member of the Board of Governors, State University System of Florida (2013-present). Previously, Mr. Lautenbach was a Partner/Advisory Partner at Clayton, Dubilier & Rice, LLC (private equity investment, 1998-2010), as well as a Director of Sony Corporation (2006-2007).
Joseph Mauriello (1944)
Year of Election or Appointment: 2008
Trustee
Mr. Mauriello also serves as Trustee of other Fidelity® funds. Prior to his retirement in January 2006, Mr. Mauriello served in numerous senior management positions including Deputy Chairman and Chief Operating Officer (2004-2005), and Vice Chairman of Financial Services (2002-2004) of KPMG LLP US (professional services, 1965-2005). Mr. Mauriello currently serves as a member of the Board of Directors of XL Group plc. (global insurance and re-insurance, 2006-present) and the Independent Directors Council (IDC) Governing Council (2015-present). Previously, Mr. Mauriello served as a Director of the Hamilton Funds of the Bank of New York (2006-2007) and of Arcadia Resources Inc. (health care services and products, 2007-2012).
Robert W. Selander (1950)
Year of Election or Appointment: 2011
Trustee
Mr. Selander also serves as Trustee of other Fidelity® funds. Mr. Selander serves as a Director of The Western Union Company (global money transfer, 2014-present). Previously, Mr. Selander served as a Member of the Advisory Board of other Fidelity® funds (2011), and Executive Vice Chairman (2010), Chief Executive Officer (2009-2010), and President and Chief Executive Officer (1997-2009) of Mastercard, Inc.
Cornelia M. Small (1944)
Year of Election or Appointment: 2005
Trustee
Ms. Small also serves as Trustee of other Fidelity® funds. Ms. Small is a member of the Board of Directors (2009-present) and Chair of the Investment Committee (2010-present) of the Teagle Foundation. Ms. Small also serves on the Investment Committee of the Berkshire Taconic Community Foundation (2008-present). Previously, Ms. Small served as Chairperson (2002-2008) and a member of the Investment Committee and Chairperson (2008-2012) and a member of the Board of Trustees of Smith College. In addition, Ms. Small served as Chief Investment Officer, Director of Global Equity Investments, and a member of the Board of Directors of Scudder, Stevens & Clark and Scudder Kemper Investments.
William S. Stavropoulos (1939)
Year of Election or Appointment: 2002
Trustee
Vice Chairman of the Independent Trustees
Mr. Stavropoulos also serves as Trustee of other Fidelity® funds. Mr. Stavropoulos serves as President and Founder of the Michigan Baseball Foundation, the Great Lakes Loons (2007-present). Mr. Stavropoulos is Chairman Emeritus of the Board of Directors of The Dow Chemical Company, where he previously served in numerous senior management positions, including President, CEO (1995-2000; 2002-2004), Chairman of the Executive Committee (2000-2006), and as a member of the Board of Directors (1990-2006). Currently, Mr. Stavropoulos is Chairman of the Board of Directors of Univar Inc. (global distributor of commodity and specialty chemicals), a Director of Teradata Corporation (data warehousing and technology solutions), and Maersk Inc. (industrial conglomerate), and a member of the Advisory Board for Metalmark Capital LLC (private equity investment, 2005-present). Mr. Stavropoulos is an operating advisor to Clayton, Dubilier & Rice, LLC (private equity investment). In addition, Mr. Stavropoulos is a member of the University of Notre Dame Advisory Council for the College of Science, a Trustee of the Rollin L. Gerstacker Foundation, and a Director of the Naples Philharmonic Center for the Arts. Previously, Mr. Stavropoulos served as a Director of Chemical Financial Corporation (bank holding company, 1993-2012) and Tyco International, Ltd. (multinational manufacturing and services, 2007-2012).
David M. Thomas (1949)
Year of Election or Appointment: 2008
Trustee
Mr. Thomas also serves as Trustee of other Fidelity® funds. Mr. Thomas serves as Non-Executive Chairman of the Board of Directors of Fortune Brands Home and Security (home and security products, 2011-present), as a member of the Board of Directors (2004-present) and Presiding Director (2013-present) of Interpublic Group of Companies, Inc. (marketing communication), and as a member of the Board of Trustees of the University of Florida (2013-present). Previously, Mr. Thomas served as Executive Chairman (2005-2006) and Chairman and Chief Executive Officer (2000-2005) of IMS Health, Inc. (pharmaceutical and healthcare information solutions), and a Director of Fortune Brands, Inc. (consumer products, 2000-2011).
+ The information includes the Trustee's principal occupation during the last five years and other information relating to the experience, attributes, and skills relevant to the Trustee's qualifications to serve as a Trustee, which led to the conclusion that the Trustee should serve as a Trustee for the fund.
Advisory Board Members and Officers:
Correspondence intended for an officer or Peter S. Lynch may be sent to Fidelity Investments, 245 Summer Street, Boston, Massachusetts 02210. Officers appear below in alphabetical order.
Name, Year of Birth; Principal Occupation
Peter S. Lynch (1944)
Year of Election or Appointment: 2003
Member of the Advisory Board
Mr. Lynch also serves as Member of the Advisory Board of other Fidelity® funds. Mr. Lynch is Vice Chairman and a Director of FMR (investment adviser firm) and FMR Co., Inc. (investment adviser firm). In addition, Mr. Lynch serves as a Trustee of Boston College and as the Chairman of the Inner-City Scholarship Fund. Previously, Mr. Lynch served on the Special Olympics International Board of Directors (1997-2006).
Elizabeth Paige Baumann (1968)
Year of Election or Appointment: 2012
Anti-Money Laundering (AML) Officer
Ms. Baumann also serves as AML Officer of other funds. She is Chief AML Officer of FMR LLC (diversified financial services company, 2012-present) and is an employee of Fidelity Investments. Previously, Ms. Baumann served as Vice President and Deputy Anti-Money Laundering Officer (2007-2012).
Marc R. Bryant (1966)
Year of Election or Appointment: 2015
Secretary and Chief Legal Officer (CLO)
Mr. Bryant also serves as Secretary and CLO of other funds. Mr. Bryant serves as CLO, Secretary, and Senior Vice President of Fidelity Management & Research Company (investment adviser firm, 2015-present) and FMR Co., Inc. (investment adviser firm, 2015-present); Secretary of Fidelity SelectCo, LLC (investment adviser firm, 2015-present) and Fidelity Investments Money Management, Inc. (investment adviser firm, 2015-present); and CLO of Fidelity Management & Research (Hong Kong) Limited (investment adviser firm, 2015-present). He is Senior Vice President and Deputy General Counsel of FMR LLC (diversified financial services company). Previously, Mr. Bryant served as Secretary and CLO of Fidelity Rutland Square Trust II (2010-2014) and Assistant Secretary of Fidelity's Fixed Income and Asset Allocation Funds (2013-2015). Prior to joining Fidelity Investments, Mr. Bryant served as a Senior Vice President and the Head of Global Retail Legal for AllianceBernstein L.P. (2006-2010), and as the General Counsel for ProFund Advisors LLC (2001-2006).
William C. Coffey (1969)
Year of Election or Appointment: 2009
Assistant Secretary
Mr. Coffey also serves as Assistant Secretary of other funds. He is Senior Vice President and Deputy General Counsel of FMR LLC (diversified financial services company, 2010-present), and is an employee of Fidelity Investments. Previously, Mr. Coffey served as Vice President and Associate General Counsel of FMR LLC (2005-2009).
Jonathan Davis (1968)
Year of Election or Appointment: 2010
Assistant Treasurer
Mr. Davis also serves as Assistant Treasurer of other funds, and is an employee of Fidelity Investments. Previously, Mr. Davis served as Vice President and Associate General Counsel of FMR LLC (diversified financial services company, 2003-2010).
Adrien E. Deberghes (1967)
Year of Election or Appointment: 2008
Deputy Treasurer
Mr. Deberghes also serves as an officer of other funds. He is an employee of Fidelity Investments (2008-present). Prior to joining Fidelity Investments, Mr. Deberghes was Senior Vice President of Mutual Fund Administration at State Street Corporation (2007-2008), Senior Director of Mutual Fund Administration at Investors Bank & Trust (2005-2007), and Director of Finance for Dunkin' Brands (2000-2005).
Stephanie J. Dorsey (1969)
Year of Election or Appointment: 2010
Assistant Treasurer
Ms. Dorsey also serves as an officer of other funds. She is an employee of Fidelity Investments (2008-present) and has served in other fund officer roles. Prior to joining Fidelity Investments, Ms. Dorsey served as Treasurer (2004-2008) of the JPMorgan Mutual Funds and Vice President (2004-2008) of JPMorgan Chase Bank.
Howard J. Galligan III (1966)
Year of Election or Appointment: 2014
Chief Financial Officer
Mr. Galligan also serves as Chief Financial Officer of other funds. Mr. Galligan serves as President of Fidelity Pricing and Cash Management Services (FPCMS) (2014-present) and as a Director of Strategic Advisers, Inc. (investment adviser firm, 2008-present). Previously, Mr. Galligan served as Chief Administrative Officer of Asset Management (2011-2014) and Chief Operating Officer and Senior Vice President of Investment Support for Strategic Advisers, Inc. (2003-2011).
Scott C. Goebel (1968)
Year of Election or Appointment: 2015
Vice President
Mr. Goebel serves as Vice President of other funds and is an employee of Fidelity Investments (2001-present). Previously, Mr. Goebel served as Secretary of Fidelity SelectCo, LLC (investment adviser firm, 2013-2015), Fidelity Investments Money Management, Inc. (FIMM) (investment adviser firm, 2010-2015), and Fidelity Research and Analysis Company (FRAC) (investment adviser firm, 2010-2015); General Counsel, Secretary, and Senior Vice President of Fidelity Management & Research Company (investment adviser firm, 2008-2015) and FMR Co., Inc. (investment adviser firm, 2008-2015); Assistant Secretary of Fidelity Management & Research (Japan) Limited (investment adviser firm, 2008-2015) and FMR Investment Management (U.K.) Limited (investment adviser firm, 2008-2015); Chief Legal Officer (CLO) of Fidelity Management & Research (Hong Kong) Limited (investment adviser firm, 2008-2015); Secretary and CLO of certain Fidelity® funds (2008-2015); Assistant Secretary of FIMM (2008-2010), FRAC (2008-2010), and certain funds (2007-2008); and as Vice President and Secretary of Fidelity Distributors Corporation (FDC) (2005-2007).
Thomas C. Hense (1964)
Year of Election or Appointment: 2008, 2010, or 2015
Vice President
Mr. Hense serves as Vice President of Fidelity Advisor® Multi-Asset Income Fund (2015) and other funds (High Income (2008), Small Cap (2008), and Value (2010) funds), and is an employee of Fidelity Investments (1993-present). Previously, Mr. Hense served as a portfolio manager for Fidelity's Institutional Money Management Group (Pyramis) (2003-2008).
Brian B. Hogan (1964)
Year of Election or Appointment: 2009
Vice President
Mr. Hogan also serves as Trustee or Vice President of other funds. Mr. Hogan serves as a Director of Fidelity SelectCo, LLC (investment adviser firm, 2014-present) and President of the Equity Division of FMR (investment adviser firm, 2009-present). Previously, Mr. Hogan served as Senior Vice President, Equity Research of FMR (2006-2009) and as a portfolio manager.
Chris Maher (1972)
Year of Election or Appointment: 2013
Assistant Treasurer
Mr. Maher serves as Assistant Treasurer of other funds. Mr. Maher is Vice President of Valuation Oversight and is an employee of Fidelity Investments. Previously, Mr. Maher served as Vice President of Asset Management Compliance (2013), Vice President of the Program Management Group of FMR (investment adviser firm, 2010-2013), and Vice President of Valuation Oversight (2008-2010).
Kenneth B. Robins (1969)
Year of Election or Appointment: 2008
President and Treasurer
Mr. Robins also serves as an officer of other funds. Mr. Robins serves as Executive Vice President of Fidelity Investments Money Management, Inc. (FIMM) (investment adviser firm, 2013-present) and is an employee of Fidelity Investments (2004-present). Previously, Mr. Robins served in other fund officer roles.
Stacie M. Smith (1974)
Year of Election or Appointment: 2013
Deputy Treasurer
Ms. Smith also serves as an officer of other funds. She is an employee of Fidelity Investments (2009-present) and has served in other fund officer roles. Prior to joining Fidelity Investments, Ms. Smith served as Senior Audit Manager of Ernst & Young LLP (1996-2009).
Renee Stagnone (1975)
Year of Election or Appointment: 2013
Deputy Treasurer
Ms. Stagnone also serves as Deputy Treasurer of other funds. Ms. Stagnone is an employee of Fidelity Investments (1997-present).
Linda J. Wondrack (1964)
Year of Election or Appointment: 2014
Chief Compliance Officer
Ms. Wondrack also serves as Chief Compliance Officer of other funds. Ms. Wondrack is Executive Vice President and head of the Ethics Office and Asset Management Compliance for Fidelity Investments (2012-present). Ms. Wondrack also serves as Chief Compliance Officer of Fidelity SelectCo, LLC (investment adviser firm, 2014-present); Chief Compliance Officer of Impresa Management LLC (2013-present); and Chief Compliance Officer of FMR Co., Inc. (investment adviser firm), Fidelity Investments Money Management, Inc. (investment adviser firm), Fidelity Management & Research (Japan) Limited (investment adviser firm), FMR Investment Management (U.K.) Limited (investment adviser firm), Fidelity Management & Research (Hong Kong) (investment adviser firm), Fidelity Management & Research Company (investment adviser firm), FIAM LLC (investment adviser firm), and Strategic Advisers, Inc. (investment adviser firm), Ballyrock Investment Advisors LLC, and Northern Neck Investors LLC (2012-present). Previously, Ms. Wondrack served as Senior Vice President and Chief Compliance Officer for Columbia Management Investment Advisers, LLC (2005-2012); Chief Compliance Officer for certain funds within the Columbia Family of Funds (2007-2012); and Senior Vice President of Compliance Risk Management at Bank of America (2005-2010).
Joseph F. Zambello (1957)
Year of Election or Appointment: 2011
Deputy Treasurer
Mr. Zambello also serves as Deputy Treasurer of other funds. Mr. Zambello is an employee of Fidelity Investments (1991-present). Previously, Mr. Zambello served as Vice President of the Program Management Group of FMR (investment adviser firm, 2009-2011) and Vice President of the Transfer Agent Oversight Group (2005-2009).
Shareholder Expense Example
As a shareholder of the Fund, you incur two types of costs: (1) transaction costs, including sales charges (loads) on purchase payments or redemption proceeds, and (2) ongoing costs, including management fees, distribution and/or service (12b-1) fees and other Fund expenses. This Example is intended to help you understand your ongoing costs (in dollars) of investing in the Fund and to compare these costs with the ongoing costs of investing in other mutual funds.
The Example is based on an investment of $1,000 invested at the beginning of the period and held for the entire period (June 1, 2015 to November 30, 2015).
Actual Expenses
The first line of the accompanying table for each class of the Fund provides information about actual account values and actual expenses. You may use the information in this line, together with the amount you invested, to estimate the expenses that you paid over the period. Simply divide your account value by $1,000.00 (for example, an $8,600 account value divided by $1,000.00 = 8.6), then multiply the result by the number in the first line for a class of the Fund under the heading entitled "Expenses Paid During Period" to estimate the expenses you paid on your account during this period. A small balance maintenance fee of $12.00 that is charged once a year may apply for certain accounts with a value of less than $2,000. This fee is not included in the table below. If it was, the estimate of expenses you paid during the period would be higher, and your ending account value lower, by this amount. In addition, the Fund, as a shareholder in the underlying Fidelity Central Funds, will indirectly bear its pro-rata share of the fees and expenses incurred by the underlying Fidelity Central Funds. These fees and expenses are not included in the Fund's annualized expense ratio used to calculate the expense estimate in the table below.
Hypothetical Example for Comparison Purposes
The second line of the accompanying table for each class of the Fund provides information about hypothetical account values and hypothetical expenses based on a Class' actual expense ratio and an assumed rate of return of 5% per year before expenses, which is not the Class' actual return. The hypothetical account values and expenses may not be used to estimate the actual ending account balance or expenses you paid for the period. You may use this information to compare the ongoing costs of investing in the Fund and other funds. To do so, compare this 5% hypothetical example with the 5% hypothetical examples that appear in the shareholder reports of the other funds. A small balance maintenance fee of $12.00 that is charged once a year may apply for certain accounts with a value of less than $2,000. This fee is not included in the table below. If it was, the estimate of expenses you paid during the period would be higher, and your ending account value lower, by this amount. In addition, the Fund, as a shareholder in the underlying Fidelity Central Funds, will indirectly bear its pro-rata share of the fees and expenses incurred by the underlying Fidelity Central Funds. These fees and expenses are not included in the Fund's annualized expense ratio used to calculate the expense estimate in the table below.
Please note that the expenses shown in the table are meant to highlight your ongoing costs only and do not reflect any transaction costs. Therefore, the second line of the table is useful in comparing ongoing costs only, and will not help you determine the relative total costs of owning different funds. In addition, if these transactional costs were included, your costs would have been higher.
| Annualized Expense Ratio-A | Beginning Account Value June 1, 2015 | Ending Account Value November 30, 2015 | Expenses Paid During Period-B June 1, 2015 to November 30, 2015 | |
| Class A | .91% | |||
| Actual | $1,000.00 | $943.40 | $4.43 | |
| Hypothetical-C | $1,000.00 | $1,020.51 | $4.61 | |
| Class T | 1.12% | |||
| Actual | $1,000.00 | $942.60 | $5.45 | |
| Hypothetical-C | $1,000.00 | $1,019.45 | $5.67 | |
| Class B | 1.73% | |||
| Actual | $1,000.00 | $939.70 | $8.41 | |
| Hypothetical-C | $1,000.00 | $1,016.39 | $8.74 | |
| Class C | 1.67% | |||
| Actual | $1,000.00 | $940.00 | $8.12 | |
| Hypothetical-C | $1,000.00 | $1,016.70 | $8.44 | |
| Fidelity Value Strategies Fund | .65% | |||
| Actual | $1,000.00 | $944.70 | $3.17 | |
| Hypothetical-C | $1,000.00 | $1,021.81 | $3.29 | |
| Class K | .49% | |||
| Actual | $1,000.00 | $945.50 | $2.39 | |
| Hypothetical-C | $1,000.00 | $1,022.61 | $2.48 | |
| Class I | .66% | |||
| Actual | $1,000.00 | $944.70 | $3.22 | |
| Hypothetical-C | $1,000.00 | $1,021.76 | $3.35 |
A Annualized expense ratio reflects expenses net of applicable fee waivers.
B Expenses are equal to each Class' annualized expense ratio, multiplied by the average account value over the period, multiplied by 183/365 (to reflect the one-half year period).
C 5% return per year before expenses
Distributions (Unaudited)
Class A, Class T and Class C designate 100% of the dividends distributed during the fiscal year as qualifying for the dividends–received deduction for corporate shareholders.
Class A, Class T and Class C designate 100% of the dividends distributed during the fiscal year as amounts which may be taken into account as a dividend for purposes of the maximum rate under section 1(h)(11) of the Internal Revenue Code.
The fund will notify shareholders in January 2016 of amounts for use in preparing 2015 income tax returns.
Board Approval of Investment Advisory Contracts and Management Fees
Fidelity Advisor Value Strategies Fund
Each year, the Board of Trustees, including the Independent Trustees (together, the Board), votes on the renewal of the management contract with Fidelity Management & Research Company (FMR) and the sub-advisory agreements (together, the Advisory Contracts) for the fund. The Board, assisted by the advice of fund counsel and Independent Trustees' counsel, requests and considers a broad range of information relevant to the renewal of the Advisory Contracts throughout the year.
The Board meets regularly and, at each of its meetings, covers an extensive agenda of topics and materials and considers factors that are relevant to its annual consideration of the renewal of the fund's Advisory Contracts, including the services and support provided to the fund and its shareholders. The Board has established various standing committees (Committees), each composed of and chaired by Independent Trustees with varying backgrounds, to which the Board has assigned specific subject matter responsibilities in order to enhance effective decision-making by the Board. The Board, acting directly and through its Committees, requests and receives information concerning the annual consideration of the renewal of the fund's Advisory Contracts. The Board also meets as needed to consider matters specifically related to the Board's annual consideration of the renewal of the Advisory Contracts. Members of the Board may also meet with trustees of other Fidelity funds through ad hoc joint committees to discuss certain matters relevant to all of the Fidelity funds.
At its July 2015 meeting, the Board unanimously determined to renew the fund's Advisory Contracts. In reaching its determination, the Board considered all factors it believed relevant, including (i) the nature, extent, and quality of the services to be provided to the fund and its shareholders (including the investment performance of the fund); (ii) the competitiveness of the fund's management fee and total expense ratio relative to peer funds; (iii) the total costs of the services to be provided by and the profits to be realized by Fidelity from its relationship with the fund; and (iv) the extent to which (if any) economies of scale exist and would be realized as the fund grows, and whether any economies of scale are appropriately shared with fund shareholders.
In considering whether to renew the Advisory Contracts for the fund, the Board reached a determination, with the assistance of fund counsel and Independent Trustees' counsel and through the exercise of its business judgment, that the renewal of the Advisory Contracts was in the best interests of the fund and its shareholders and that the compensation payable under the Advisory Contracts was fair and reasonable. The Board's decision to renew the Advisory Contracts was not based on any single factor, but rather was based on a comprehensive consideration of all the information provided to the Board at its meetings throughout the year. The Board, in reaching its determination to renew the Advisory Contracts, was aware that shareholders of the fund have a broad range of investment choices available to them, including a wide choice among funds offered by Fidelity's competitors, and that the fund's shareholders, who have the opportunity to review and weigh the disclosure provided by the fund in its prospectus and other public disclosures, have chosen to invest in this fund, which is part of the Fidelity family of funds.
Nature, Extent, and Quality of Services Provided. The Board considered Fidelity's staffing as it relates to the fund, including the backgrounds of investment personnel of Fidelity, and also considered the fund's investment objective, strategies, and related investment philosophy. The Independent Trustees also had discussions with senior management of Fidelity's investment operations and investment groups. The Board considered the structure of the portfolio manager compensation program and whether this structure provides appropriate incentives to act in the best interests of the fund. Additionally, the Board considered the portfolio managers' investments, if any, in the funds that they manage.Resources Dedicated to Investment Management and Support Services. The Board and the Fund Oversight and Research Committees reviewed the general qualifications and capabilities of Fidelity's investment staff, including its size, education, experience, and resources, as well as Fidelity's approach to recruiting, training, managing, and compensating investment personnel. The Board noted that Fidelity has continued to increase the resources devoted to non-U.S. offices, including expansion of Fidelity's global investment organization. The Board also noted that Fidelity's analysts have extensive resources, tools and capabilities that allow them to conduct sophisticated quantitative and fundamental analysis, as well as credit analysis of issuers, counterparties and guarantors. Further, the Board considered that Fidelity's investment professionals have sufficient access to global information and data so as to provide competitive investment results over time, and that those professionals also have access to sophisticated tools that permit them to assess portfolio construction and risk and performance attribution characteristics continuously, as well as to transmit new information and research conclusions rapidly around the world. Additionally, in its deliberations, the Board considered Fidelity's trading, risk management, and compliance capabilities and resources, which are integral parts of the investment management process.Shareholder and Administrative Services. The Board considered (i) the nature, extent, quality, and cost of advisory, administrative, and shareholder services performed by FMR, the sub-advisers (together with FMR, the Investment Advisers), and their affiliates under the Advisory Contracts and under separate agreements covering transfer agency, pricing and bookkeeping, and securities lending services for the fund; (ii) the nature and extent of the supervision of third party service providers, principally custodians and subcustodians; and (iii) the resources devoted to, and the record of compliance with, the fund's compliance policies and procedures. The Board also reviewed the allocation of fund brokerage, including allocations to brokers affiliated with the Investment Advisers, the use of brokerage commissions to pay fund expenses, and the use of "soft" commission dollars to pay for research services.The Board noted that the growth of fund assets over time across the complex allows Fidelity to reinvest in the development of services designed to enhance the value or convenience of the Fidelity funds as investment vehicles. These services include 24-hour access to account information and market information through telephone representatives and over the Internet, investor education materials and asset allocation tools, and the expanded availability of Fidelity Investor Centers.In 2014, the Board formed an ad hoc Committee on Transfer Agency Fees to review the variety of transfer agency fee structures throughout the industry and Fidelity's competitive positioning with respect to industry participants.Investment in a Large Fund Family. The Board considered the benefits to shareholders of investing in a Fidelity fund, including the benefits of investing in a fund that is part of a large family of funds offering a variety of investment disciplines and providing a large variety of mutual fund investor services. The Board noted that Fidelity had taken, or had made recommendations that resulted in the Fidelity funds taking, a number of actions over the previous year that benefited particular funds, including (i) continuing to dedicate additional resources to investment research and to the support of the senior management team that oversees asset management; (ii) continuing efforts to enhance Fidelity's global research capabilities; (iii) launching new funds and making other enhancements to meet client needs; (iv) reducing management fees and total expenses for certain index funds and diversified international funds; (v) continuing to launch dedicated lower cost underlying funds to meet portfolio construction needs related to expanding underlying fund options for Fidelity funds of funds, specifically for the Freedom Fund product lines; (vi) rationalizing product lines and gaining increased efficiencies through fund mergers; (vii) launching active fixed-income exchange-traded funds; (viii) continuing to develop, acquire and implement systems and technology to improve services to the funds and information security and to increase efficiency; (ix) implementing investment enhancements to further strengthen Fidelity's target date product line to increase investors' probability of success in achieving their goals; (x) modifying the eligibility criteria for certain share classes to accommodate roll-over assets from employer-sponsored retirement plans; (xi) launching a new Class W of the Freedom Index Funds to attract and retain Fidelity record-kept retirement plan assets; and (xii) implementing changes to Fidelity's money market product line in response to recent money market regulatory reforms.Investment Performance. The Board considered whether the fund has operated in accordance with its investment objective, as well as its record of compliance with its investment restrictions and its performance history.The Board took into account discussions with representatives of the Investment Advisers about fund investment performance that occur at Board meetings throughout the year. In this regard the Board noted that as part of regularly scheduled fund reviews and other reports to the Board on fund performance, the Board considers annualized return information for the fund, for different time periods, measured against a securities market index ("benchmark index") and a peer group of funds with similar objectives ("peer group"), if any. In its evaluation of fund investment performance, the Board gave particular attention to information indicating changes in performance of certain Fidelity funds for specific time periods and discussed with the Investment Advisers the reasons for any overperformance or underperformance.In addition to reviewing absolute and relative fund performance, the Independent Trustees periodically consider the appropriateness of fund performance metrics in evaluating the results achieved. In general, the Independent Trustees believe that fund performance should be evaluated based on net performance (after fees and expenses) of both the highest performing and lowest performing fund share classes, where applicable, compared to appropriate benchmark indices, over appropriate time periods that may include full market cycles, and compared to peer groups, as applicable, over the same periods, taking into account relevant factors including the following: general market conditions; issuer-specific information; and fund cash flows and other factors.The Independent Trustees recognize that shareholders evaluate performance on a net basis over their own holding periods, for which one-, three-, and five-year periods are often used as a proxy. For this reason, the performance information reviewed by the Board also included net cumulative calendar year total return information for the fund and an appropriate benchmark index and peer group for the most recent one-, three-, and five-year periods, as shown below. Returns are shown compared to the 25th percentile (top of box, 75% beaten) and 75th percentile (bottom of box, 25% beaten) of the peer universe.Fidelity Advisor Value Strategies Fund
Fidelity Advisor Value Strategies Fund
![]()
SO-ANN-0116
1.539180.118
Fidelity Advisor® Growth Opportunities Fund Class I (formerly Institutional Class) Annual Report November 30, 2015 |
|
Contents
Board Approval of Investment Advisory Contracts and Management Fees |
To view a fund's proxy voting guidelines and proxy voting record for the 12-month period ended June 30, visit http://www.fidelity.com/proxyvotingresults or visit the Securities and Exchange Commission's (SEC) web site at http://www.sec.gov.
You may also call 1-877-208-0098 to request a free copy of the proxy voting guidelines.
Standard & Poor's, S&P and S&P 500 are registered service marks of The McGraw-Hill Companies, Inc. and have been licensed for use by Fidelity Distributors Corporation.
Other third-party marks appearing herein are the property of their respective owners.
All other marks appearing herein are registered or unregistered trademarks or service marks of FMR LLC or an affiliated company. © 2016 FMR LLC. All rights reserved.
This report and the financial statements contained herein are submitted for the general information of the shareholders of the Fund. This report is not authorized for distribution to prospective investors in the Fund unless preceded or accompanied by an effective prospectus.
A fund files its complete schedule of portfolio holdings with the SEC for the first and third quarters of each fiscal year on Form N-Q. Forms N-Q are available on the SEC’s web site at http://www.sec.gov. A fund's Forms N-Q may be reviewed and copied at the SEC’s Public Reference Room in Washington, DC. Information regarding the operation of the SEC's Public Reference Room may be obtained by calling 1-800-SEC-0330.
For a complete list of a fund's portfolio holdings, view the most recent holdings listing, semiannual report, or annual report on Fidelity's web site at http://www.fidelity.com, http://www.advisor.fidelity.com, or http://www.401k.com, as applicable.
NOT FDIC INSURED •MAY LOSE VALUE •NO BANK GUARANTEE
Neither the Fund nor Fidelity Distributors Corporation is a bank.
Performance: The Bottom Line
Average annual total return reflects the change in the value of an investment, assuming reinvestment of distributions from dividend income and capital gains (the profits earned upon the sale of securities that have grown in value, if any) and assuming a constant rate of performance each year.
The hypothetical investment and the average annual total returns do not reflect the deduction of taxes that a shareholder would pay on fund distributions or the redemption of fund shares.
During periods of reimbursement by Fidelity, a fund’s total return will be greater than it would be had the reimbursement not occurred.
How a fund did yesterday is no guarantee of how it will do tomorrow.
Average Annual Total Returns
| For the periods ended November 30, 2015 | Past 1 year | Past 5 years | Past 10 years |
| Class I | 5.58% | 16.02% | 7.87% |
Prior to February 1, 2007, the fund operated under certain different investment policies and compared its performance to a different index. The fund's historical performance may not represent its current investment policies.
$10,000 Over 10 Years
Let's say hypothetically that $10,000 was invested in Fidelity Advisor® Growth Opportunities Fund - Class I on November 30, 2005.
The chart shows how the value of your investment would have changed, and also shows how the Russell 1000® Growth Index performed over the same period.

| Period Ending Values | ||
| $21,334 | Fidelity Advisor® Growth Opportunities Fund - Class I | |
| $22,947 | Russell 1000® Growth Index | |
Management's Discussion of Fund Performance
Market Recap: U.S. stocks gained modestly for the 12 months ending November 30, 2015, despite a steep decline in August and September on concern about slowing economic growth in China. The S&P 500® index rebounded in October and gained 2.75% for the year. Stocks benefited late in the period amid waning expectations for a near-term interest-rate hike by the U.S. Federal Reserve, more economic stimulus in Europe and an interest-rate cut in China. Growth stocks in the benchmark far outpaced their value counterparts, as investors continued to seek growth in a subpar economic environment. Sector performance varied widely, with more than 26 percentage points separating the leader from the laggard. Consumer discretionary (+14%) secured the top spot, benefiting from a combination of rising personal income and still-benign inflation. Information technology (+7%) and health care (+4%) also outpaced the broad market. Conversely, the energy sector (-12%) performed worst, stymied by depressed commodity prices that also hit materials (-5%). Telecommunication services (-5%) and utilities (-4%), considered defensive sectors less sensitive to the economy, also lost ground. At period end, investors remained focused on the potential global implications of a stronger U.S. dollar and how China's transition toward a consumption-led economy may affect corporate earnings.Comments from Lead Portfolio Manager Kyle Weaver: For the year, the fund's share classes posted gains in the mid-single digits but lagged the 6.12% return of the benchmark Russell 1000® Growth Index. Stock selection in the consumer staples, consumer discretionary and industrials sectors meaningfully detracted versus the benchmark. A large overweighting in Keurig Green Mountain, an innovator in single-serve beverage products, was the fund's biggest relative detractor, as sales and profitability of the company's products were pressured by cheaper knock-offs. I considerably reduced this position but remained overweighted at period end. Other noteworthy detractors included non-index positions in Lumber Liquidators Holdings, which I sold, and Endurance International Group Holdings, a Web-hosting company. Conversely, picks in health care and information technology added significant value. Regeneron Pharmaceuticals, the fund's top relative contributor, and Alkermes are two biotechnology stocks that strongly outperformed. Salesforce.com, a provider of cloud-based marketing and customer relationship management solutions, also was a strong performer this period. I reduced our stake in all three contributors noted but maintained overweightings in each case.Note to shareholders: Kyle Weaver was named Lead Portfolio Manager of the fund, and Steven Wymer Co-Manager, on July 14, 2015, succeeding Gopal Reddy.The views expressed above reflect those of the portfolio manager(s) only through the end of the period as stated on the cover of this report and do not necessarily represent the views of Fidelity or any other person in the Fidelity organization. Any such views are subject to change at any time based upon market or other conditions and Fidelity disclaims any responsibility to update such views. These views may not be relied on as investment advice and, because investment decisions for a Fidelity fund are based on numerous factors, may not be relied on as an indication of trading intent on behalf of any Fidelity fund.
Investment Summary (Unaudited)
Top Ten Stocks as of November 30, 2015
| % of fund's net assets | % of fund's net assets 6 months ago | |
| Apple, Inc. | 7.0 | 6.6 |
| Alphabet, Inc. Class A | 3.0 | 2.3 |
| Alphabet, Inc. Class C | 3.0 | 2.2 |
| Facebook, Inc. Class A | 2.4 | 2.1 |
| Amazon.com, Inc. | 2.2 | 1.6 |
| American Tower Corp. | 2.1 | 0.0 |
| Visa, Inc. Class A | 2.0 | 1.8 |
| Salesforce.com, Inc. | 1.8 | 4.5 |
| Cognizant Technology Solutions Corp. Class A | 1.7 | 0.2 |
| Endurance International Group Holdings, Inc. | 1.5 | 0.0 |
| 26.7 |
Top Five Market Sectors as of November 30, 2015
| % of fund's net assets | % of fund's net assets 6 months ago | |
| Information Technology | 38.6 | 36.0 |
| Health Care | 18.4 | 23.5 |
| Consumer Discretionary | 17.0 | 16.0 |
| Industrials | 8.3 | 6.8 |
| Consumer Staples | 6.1 | 8.4 |
Asset Allocation (% of fund's net assets)
| As of November 30, 2015* | ||
| Stocks | 99.2% | |
| Convertible Securities | 0.8% | |

* Foreign investments - 10.6%
| As of May 31, 2015* | ||
| Stocks | 98.8% | |
| Convertible Securities | 0.7% | |
| Short-Term Investments and Net Other Assets (Liabilities) | 0.5% | |

* Foreign investments - 6.8%
Percentages shown as 0.0% may reflect amounts less than 0.05%.
Investments November 30, 2015
Showing Percentage of Net Assets
| Common Stocks - 99.2% | |||
| Shares | Value (000s) | ||
| CONSUMER DISCRETIONARY - 17.0% | |||
| Auto Components - 0.5% | |||
| Tenneco, Inc. (a) | 286,400 | $15,431 | |
| Automobiles - 0.6% | |||
| Tesla Motors, Inc. (a)(b) | 95,700 | 22,036 | |
| Diversified Consumer Services - 0.1% | |||
| ServiceMaster Global Holdings, Inc. (a) | 100,900 | 3,782 | |
| Hotels, Restaurants & Leisure - 2.8% | |||
| Buffalo Wild Wings, Inc. (a) | 66,200 | 10,608 | |
| Chipotle Mexican Grill, Inc. (a) | 51,500 | 29,847 | |
| Domino's Pizza, Inc. | 47,000 | 5,051 | |
| Dunkin' Brands Group, Inc. (b) | 165,200 | 7,008 | |
| Las Vegas Sands Corp. | 277,692 | 12,235 | |
| Starbucks Corp. | 421,800 | 25,894 | |
| Starwood Hotels & Resorts Worldwide, Inc. | 54,100 | 3,887 | |
| 94,530 | |||
| Internet & Catalog Retail - 3.7% | |||
| Amazon.com, Inc. (a) | 115,600 | 76,851 | |
| Netflix, Inc. (a) | 137,500 | 16,958 | |
| Priceline Group, Inc. (a) | 14,400 | 17,983 | |
| Travelport Worldwide Ltd. (b) | 1,174,200 | 15,629 | |
| 127,421 | |||
| Media - 4.9% | |||
| AMC Networks, Inc. Class A (a) | 109,300 | 8,887 | |
| Charter Communications, Inc. Class A (a)(b) | 270,200 | 50,625 | |
| Comcast Corp. Class A | 668,900 | 40,709 | |
| Liberty Global PLC Class A (a) | 403,700 | 17,121 | |
| Lions Gate Entertainment Corp. (b) | 217,800 | 7,392 | |
| The Walt Disney Co. | 355,300 | 40,316 | |
| Twenty-First Century Fox, Inc. Class A | 10,500 | 310 | |
| Zee Entertainment Enterprises Ltd. | 679,770 | 4,174 | |
| 169,534 | |||
| Multiline Retail - 0.2% | |||
| Dollar General Corp. | 96,600 | 6,319 | |
| Specialty Retail - 1.4% | |||
| CarMax, Inc. (a) | 231,000 | 13,236 | |
| Home Depot, Inc. | 108,300 | 14,499 | |
| TJX Companies, Inc. | 270,200 | 19,076 | |
| 46,811 | |||
| Textiles, Apparel & Luxury Goods - 2.8% | |||
| lululemon athletica, Inc. (a) | 516,216 | 24,685 | |
| Michael Kors Holdings Ltd. (a) | 88,400 | 3,803 | |
| NIKE, Inc. Class B | 273,300 | 36,152 | |
| Skechers U.S.A., Inc. Class A (sub. vtg.) (a) | 458,898 | 13,859 | |
| Under Armour, Inc. Class A (sub. vtg.) (a)(b) | 123,600 | 10,657 | |
| VF Corp. | 133,400 | 8,631 | |
| 97,787 | |||
| TOTAL CONSUMER DISCRETIONARY | 583,651 | ||
| CONSUMER STAPLES - 5.9% | |||
| Beverages - 1.7% | |||
| Monster Beverage Corp. | 126,600 | 19,574 | |
| PepsiCo, Inc. | 136,900 | 13,712 | |
| The Coca-Cola Co. | 555,200 | 23,663 | |
| 56,949 | |||
| Food & Staples Retailing - 2.5% | |||
| Costco Wholesale Corp. | 227,500 | 36,723 | |
| CVS Health Corp. | 332,800 | 31,313 | |
| Walgreens Boots Alliance, Inc. | 188,200 | 15,814 | |
| Whole Foods Market, Inc. | 109,400 | 3,189 | |
| 87,039 | |||
| Food Products - 0.6% | |||
| Keurig Green Mountain, Inc. | 168,200 | 8,814 | |
| Mead Johnson Nutrition Co. Class A | 83,700 | 6,745 | |
| Mondelez International, Inc. | 110,100 | 4,807 | |
| 20,366 | |||
| Household Products - 0.6% | |||
| Procter & Gamble Co. | 182,900 | 13,688 | |
| Svenska Cellulosa AB (SCA) (B Shares) | 238,500 | 6,864 | |
| 20,552 | |||
| Personal Products - 0.2% | |||
| Herbalife Ltd. (a) | 122,400 | 7,066 | |
| Tobacco - 0.3% | |||
| Altria Group, Inc. | 179,200 | 10,322 | |
| TOTAL CONSUMER STAPLES | 202,294 | ||
| ENERGY - 1.2% | |||
| Energy Equipment & Services - 0.5% | |||
| Dril-Quip, Inc. (a) | 109,400 | 6,904 | |
| Oceaneering International, Inc. | 201,500 | 8,814 | |
| 15,718 | |||
| Oil, Gas & Consumable Fuels - 0.7% | |||
| Cabot Oil & Gas Corp. | 798,900 | 15,043 | |
| Golar LNG Ltd. | 28,700 | 785 | |
| PDC Energy, Inc. (a) | 136,800 | 7,728 | |
| 23,556 | |||
| TOTAL ENERGY | 39,274 | ||
| FINANCIALS - 5.3% | |||
| Banks - 1.5% | |||
| HDFC Bank Ltd. sponsored ADR | 246,900 | 14,350 | |
| JPMorgan Chase & Co. | 531,800 | 35,460 | |
| 49,810 | |||
| Capital Markets - 1.2% | |||
| BlackRock, Inc. Class A | 74,200 | 26,988 | |
| Charles Schwab Corp. | 452,200 | 15,244 | |
| Goldman Sachs Group, Inc. | 41 | 8 | |
| 42,240 | |||
| Consumer Finance - 0.4% | |||
| American Express Co. | 55,900 | 4,005 | |
| Discover Financial Services | 185,233 | 10,514 | |
| 14,519 | |||
| Diversified Financial Services - 0.1% | |||
| MSCI, Inc. Class A | 49,900 | 3,499 | |
| Real Estate Investment Trusts - 2.1% | |||
| American Tower Corp. | 726,600 | 72,210 | |
| TOTAL FINANCIALS | 182,278 | ||
| HEALTH CARE - 18.4% | |||
| Biotechnology - 12.8% | |||
| AbbVie, Inc. | 573,600 | 33,355 | |
| ACADIA Pharmaceuticals, Inc. (a) | 194,600 | 7,385 | |
| Aduro Biotech, Inc. (b) | 78,600 | 2,436 | |
| Agios Pharmaceuticals, Inc. (a) | 75,400 | 4,870 | |
| Alexion Pharmaceuticals, Inc. (a) | 129,400 | 23,090 | |
| Alkermes PLC (a) | 513,400 | 37,663 | |
| Alnylam Pharmaceuticals, Inc. (a) | 229,500 | 23,882 | |
| Amgen, Inc. | 214,300 | 34,524 | |
| Amicus Therapeutics, Inc. (a) | 641,000 | 6,878 | |
| Asterias Biotherapeutics, Inc. (a)(b) | 50,950 | 245 | |
| aTyr Pharma, Inc. (c) | 124,876 | 1,063 | |
| Avalanche Biotechnologies, Inc. (a) | 31,748 | 333 | |
| Baxalta, Inc. | 37,600 | 1,293 | |
| Biogen, Inc. (a) | 71,400 | 20,482 | |
| BioMarin Pharmaceutical, Inc. (a) | 169,500 | 16,165 | |
| BioTime, Inc. warrants 10/1/18 (a) | 62,345 | 52 | |
| bluebird bio, Inc. (a) | 107,000 | 9,496 | |
| Celgene Corp. (a) | 97,670 | 10,690 | |
| Celldex Therapeutics, Inc. (a) | 165,600 | 2,982 | |
| Edge Therapeutics, Inc. (a) | 173,400 | 2,407 | |
| Esperion Therapeutics, Inc. (a) | 77,500 | 2,202 | |
| Gilead Sciences, Inc. | 353,400 | 37,446 | |
| Insmed, Inc. (a) | 375,379 | 6,122 | |
| Intercept Pharmaceuticals, Inc. (a) | 10,235 | 1,807 | |
| Isis Pharmaceuticals, Inc. (a)(b) | 703,053 | 42,914 | |
| Lexicon Pharmaceuticals, Inc. (a) | 114,596 | 1,577 | |
| Merrimack Pharmaceuticals, Inc. (a) | 437,800 | 4,120 | |
| Novavax, Inc. (a) | 887,700 | 7,599 | |
| Ophthotech Corp. (a) | 151,000 | 9,599 | |
| Prothena Corp. PLC (a) | 123,802 | 8,733 | |
| Regeneron Pharmaceuticals, Inc. (a) | 88,700 | 48,297 | |
| Regulus Therapeutics, Inc. (a) | 318,000 | 3,202 | |
| Rigel Pharmaceuticals, Inc. (a) | 667,248 | 2,189 | |
| Seattle Genetics, Inc. (a)(b) | 152,367 | 6,396 | |
| Seres Therapeutics, Inc. | 21,900 | 785 | |
| Spark Therapeutics, Inc. (b) | 3,500 | 202 | |
| Transition Therapeutics, Inc. (a)(b) | 761,897 | 1,432 | |
| Vertex Pharmaceuticals, Inc. (a) | 99,390 | 12,857 | |
| XOMA Corp. (a)(b) | 1,084,759 | 1,443 | |
| 438,213 | |||
| Health Care Equipment & Supplies - 0.4% | |||
| Boston Scientific Corp. (a) | 476,700 | 8,714 | |
| Penumbra, Inc. (a) | 4,200 | 211 | |
| Stryker Corp. | 37,000 | 3,569 | |
| 12,494 | |||
| Health Care Providers & Services - 2.0% | |||
| Express Scripts Holding Co. (a) | 109,767 | 9,383 | |
| McKesson Corp. | 251,900 | 47,697 | |
| UnitedHealth Group, Inc. | 97,100 | 10,944 | |
| 68,024 | |||
| Health Care Technology - 0.4% | |||
| athenahealth, Inc. (a)(b) | 89,700 | 15,047 | |
| Castlight Health, Inc. Class B (a) | 116,700 | 467 | |
| 15,514 | |||
| Pharmaceuticals - 2.8% | |||
| AcelRx Pharmaceuticals, Inc. (a) | 714,917 | 4,089 | |
| Allergan PLC (a) | 58,490 | 18,359 | |
| Bristol-Myers Squibb Co. | 269,000 | 18,026 | |
| Endo Health Solutions, Inc. (a) | 276,800 | 17,018 | |
| Intra-Cellular Therapies, Inc. (a) | 36,700 | 1,957 | |
| Mylan N.V. | 66,000 | 3,386 | |
| Teva Pharmaceutical Industries Ltd. sponsored ADR | 560,500 | 35,272 | |
| 98,107 | |||
| TOTAL HEALTH CARE | 632,352 | ||
| INDUSTRIALS - 8.3% | |||
| Aerospace & Defense - 0.9% | |||
| Honeywell International, Inc. | 114,400 | 11,892 | |
| The Boeing Co. | 137,100 | 19,941 | |
| 31,833 | |||
| Air Freight & Logistics - 0.4% | |||
| FedEx Corp. | 33,900 | 5,375 | |
| United Parcel Service, Inc. Class B | 82,500 | 8,498 | |
| 13,873 | |||
| Airlines - 2.5% | |||
| American Airlines Group, Inc. | 180,400 | 7,443 | |
| Controladora Vuela Compania de Aviacion S.A.B. de CV (a) | 1,097,300 | 1,935 | |
| Controladora Vuela Compania de Aviacion S.A.B. de CV ADR (a) | 105,300 | 1,863 | |
| Delta Air Lines, Inc. | 354,300 | 16,461 | |
| JetBlue Airways Corp. (a) | 66,000 | 1,633 | |
| Southwest Airlines Co. | 829,400 | 38,053 | |
| Spirit Airlines, Inc. (a) | 292,900 | 10,770 | |
| United Continental Holdings, Inc. (a) | 86,100 | 4,798 | |
| WestJet Airlines Ltd. | 199,300 | 3,170 | |
| 86,126 | |||
| Building Products - 0.0% | |||
| Caesarstone Sdot-Yam Ltd. | 36,100 | 1,476 | |
| Electrical Equipment - 1.2% | |||
| Acuity Brands, Inc. | 32,800 | 7,573 | |
| SolarCity Corp. (a)(b) | 1,101,700 | 31,685 | |
| Sunrun, Inc. (a)(b) | 241,300 | 1,605 | |
| 40,863 | |||
| Industrial Conglomerates - 0.9% | |||
| 3M Co. | 62,200 | 9,739 | |
| Danaher Corp. | 230,700 | 22,237 | |
| 31,976 | |||
| Professional Services - 0.7% | |||
| TriNet Group, Inc. (a) | 938,300 | 18,531 | |
| Verisk Analytics, Inc. (a) | 47,700 | 3,575 | |
| 22,106 | |||
| Road & Rail - 1.4% | |||
| Genesee & Wyoming, Inc. Class A (a) | 123,700 | 8,569 | |
| Hertz Global Holdings, Inc. (a) | 135,400 | 2,147 | |
| J.B. Hunt Transport Services, Inc. | 212,200 | 16,603 | |
| TransForce, Inc. | 295,200 | 5,626 | |
| Union Pacific Corp. | 163,200 | 13,701 | |
| 46,646 | |||
| Trading Companies & Distributors - 0.3% | |||
| HD Supply Holdings, Inc. (a) | 345,700 | 10,934 | |
| TOTAL INDUSTRIALS | 285,833 | ||
| INFORMATION TECHNOLOGY - 38.2% | |||
| Communications Equipment - 0.6% | |||
| Infinera Corp. (a) | 423,581 | 9,539 | |
| QUALCOMM, Inc. | 201,165 | 9,815 | |
| 19,354 | |||
| Electronic Equipment & Components - 0.0% | |||
| CDW Corp. | 38,400 | 1,658 | |
| Internet Software & Services - 13.1% | |||
| Alibaba Group Holding Ltd. sponsored ADR (a)(b) | 402,300 | 33,825 | |
| Alphabet, Inc.: | |||
| Class A (a) | 133,665 | 101,966 | |
| Class C | 137,175 | 101,866 | |
| Demandware, Inc. (a)(b) | 150,000 | 7,673 | |
| Endurance International Group Holdings, Inc. (a)(b) | 3,676,340 | 51,358 | |
| Facebook, Inc. Class A (a) | 804,841 | 83,897 | |
| GoDaddy, Inc. (a)(b) | 1,429,000 | 44,399 | |
| LinkedIn Corp. Class A (a) | 9,400 | 2,285 | |
| Rackspace Hosting, Inc. (a) | 176,202 | 5,043 | |
| Wix.com Ltd. (a) | 705,135 | 17,523 | |
| 449,835 | |||
| IT Services - 8.8% | |||
| Alliance Data Systems Corp. (a) | 113,600 | 32,586 | |
| Booz Allen Hamilton Holding Corp. Class A | 231,200 | 7,040 | |
| Cognizant Technology Solutions Corp. Class A (a) | 885,892 | 57,211 | |
| EPAM Systems, Inc. (a) | 451,300 | 35,531 | |
| Fidelity National Information Services, Inc. | 23,771 | 1,513 | |
| Gartner, Inc. Class A (a) | 79,900 | 7,455 | |
| MasterCard, Inc. Class A | 459,200 | 44,965 | |
| PayPal Holdings, Inc. (a) | 235,600 | 8,307 | |
| Sabre Corp. | 1,108,600 | 32,438 | |
| Square, Inc. | 129,100 | 1,554 | |
| Visa, Inc. Class A | 885,300 | 69,948 | |
| WEX, Inc. (a) | 28,500 | 2,687 | |
| 301,235 | |||
| Semiconductors & Semiconductor Equipment - 3.4% | |||
| Avago Technologies Ltd. | 171,700 | 22,398 | |
| Broadcom Corp. Class A | 322,500 | 17,618 | |
| Cypress Semiconductor Corp. (b) | 763,766 | 8,264 | |
| Micron Technology, Inc. (a) | 126,600 | 2,017 | |
| NVIDIA Corp. | 361,030 | 11,452 | |
| NXP Semiconductors NV (a) | 257,500 | 24,066 | |
| Qorvo, Inc. (a) | 440,800 | 25,597 | |
| SolarEdge Technologies, Inc. (b) | 217,900 | 4,277 | |
| SunEdison, Inc. (a)(b) | 245,000 | 782 | |
| 116,471 | |||
| Software - 4.7% | |||
| Adobe Systems, Inc. (a) | 119,300 | 10,911 | |
| Electronic Arts, Inc.(a) | 121,400 | 8,230 | |
| Fortinet, Inc. (a) | 47,600 | 1,715 | |
| Interactive Intelligence Group, Inc. (a) | 189,200 | 6,520 | |
| Microsoft Corp. | 935,900 | 50,866 | |
| Oracle Corp. | 90,600 | 3,531 | |
| Red Hat, Inc. (a) | 43,830 | 3,568 | |
| Salesforce.com, Inc. (a) | 765,700 | 61,019 | |
| ServiceNow, Inc. (a) | 126,200 | 10,981 | |
| Workday, Inc. Class A (a) | 65,200 | 5,458 | |
| 162,799 | |||
| Technology Hardware, Storage & Peripherals - 7.6% | |||
| Apple, Inc. | 2,017,706 | 238,689 | |
| Electronics for Imaging, Inc. (a) | 352,400 | 17,296 | |
| Nimble Storage, Inc. (a)(b) | 477,400 | 4,998 | |
| Pure Storage, Inc. Class A (a) | 31,100 | 402 | |
| 261,385 | |||
| TOTAL INFORMATION TECHNOLOGY | 1,312,737 | ||
| MATERIALS - 3.5% | |||
| Chemicals - 3.0% | |||
| E.I. du Pont de Nemours & Co. | 123,700 | 8,330 | |
| Ecolab, Inc. | 29,300 | 3,491 | |
| LyondellBasell Industries NV Class A | 535,800 | 51,340 | |
| PPG Industries, Inc. | 262,900 | 27,799 | |
| The Chemours Co. LLC | 19,160 | 120 | |
| The Dow Chemical Co. | 235,700 | 12,287 | |
| 103,367 | |||
| Containers & Packaging - 0.5% | |||
| Sealed Air Corp. | 334,700 | 15,182 | |
| TOTAL MATERIALS | 118,549 | ||
| TELECOMMUNICATION SERVICES - 1.4% | |||
| Diversified Telecommunication Services - 0.2% | |||
| Verizon Communications, Inc. | 147,300 | 6,695 | |
| Wireless Telecommunication Services - 1.2% | |||
| SBA Communications Corp. Class A (a) | 117,500 | 12,356 | |
| T-Mobile U.S., Inc. (a) | 840,500 | 29,838 | |
| 42,194 | |||
| TOTAL TELECOMMUNICATION SERVICES | 48,889 | ||
| UTILITIES - 0.0% | |||
| Independent Power and Renewable Electricity Producers - 0.0% | |||
| Terraform Power, Inc. (b) | 145,700 | 1,005 | |
| TOTAL COMMON STOCKS | |||
| (Cost $2,296,893) | 3,406,862 | ||
| Convertible Preferred Stocks - 0.8% | |||
| CONSUMER STAPLES - 0.2% | |||
| Food & Staples Retailing - 0.1% | |||
| Blue Apron, Inc. Series D (d) | 217,605 | 2,900 | |
| Tobacco - 0.1% | |||
| PAX Labs, Inc. Series C (d) | 1,069,313 | 4,128 | |
| TOTAL CONSUMER STAPLES | 7,028 | ||
| FINANCIALS - 0.2% | |||
| Real Estate Management & Development - 0.2% | |||
| Redfin Corp. Series G (d) | 1,081,736 | 4,067 | |
| INFORMATION TECHNOLOGY - 0.4% | |||
| Internet Software & Services - 0.2% | |||
| Uber Technologies, Inc. Series D, 8.00% (a)(d) | 221,104 | 8,765 | |
| Software - 0.2% | |||
| Cloudera, Inc. Series F (a)(d) | 41,786 | 1,372 | |
| MongoDB, Inc. Series F, 8.00% (a)(d) | 515,124 | 4,008 | |
| 5,380 | |||
| TOTAL INFORMATION TECHNOLOGY | 14,145 | ||
| TOTAL CONVERTIBLE PREFERRED STOCKS | |||
| (Cost $23,237) | 25,240 | ||
| Money Market Funds - 5.6% | |||
| Fidelity Cash Central Fund, 0.18% (e) | 10,486,486 | 10,486 | |
| Fidelity Securities Lending Cash Central Fund, 0.22% (e)(f) | 182,358,373 | 182,358 | |
| TOTAL MONEY MARKET FUNDS | |||
| (Cost $192,844) | 192,844 | ||
| TOTAL INVESTMENT PORTFOLIO - 105.6% | |||
| (Cost $2,512,974) | 3,624,946 | ||
| NET OTHER ASSETS (LIABILITIES) - (5.6)% | (190,651) | ||
| NET ASSETS - 100% | $3,434,295 |
Legend
(a) Non-income producing
(b) Security or a portion of the security is on loan at period end.
(c) Security exempt from registration under Rule 144A of the Securities Act of 1933. These securities may be resold in transactions exempt from registration, normally to qualified institutional buyers. At the end of the period, the value of these securities amounted to $1,063,000 or 0.0% of net assets.
(d) Restricted securities - Investment in securities not registered under the Securities Act of 1933 (excluding 144A issues). At the end of the period, the value of restricted securities (excluding 144A issues) amounted to $25,240,000 or 0.7% of net assets.
(e) Affiliated fund that is generally available only to investment companies and other accounts managed by Fidelity Investments. The rate quoted is the annualized seven-day yield of the fund at period end. A complete unaudited listing of the fund's holdings as of its most recent quarter end is available upon request. In addition, each Fidelity Central Fund's financial statements, which are not covered by the Fund's Report of Independent Registered Public Accounting Firm, are available on the SEC's website or upon request.
(f) Investment made with cash collateral received from securities on loan.
Additional information on each restricted holding is as follows:
| Security | Acquisition Date | Acquisition Cost (000s) |
| Blue Apron, Inc. Series D | 5/18/15 | $2,900 |
| Cloudera, Inc. Series F | 2/5/14 | $608 |
| MongoDB, Inc. Series F, 8.00% | 10/2/13 | $8,615 |
| PAX Labs, Inc. Series C | 5/22/15 | $4,117 |
| Redfin Corp. Series G | 12/16/14 | $3,567 |
| Uber Technologies, Inc. Series D, 8.00% | 6/6/14 | $3,430 |
Affiliated Central Funds
Information regarding fiscal year to date income earned by the Fund from investments in Fidelity Central Funds is as follows:
| Fund | Income earned |
| (Amounts in thousands) | |
| Fidelity Cash Central Fund | $35 |
| Fidelity Securities Lending Cash Central Fund | 882 |
| Total | $917 |
Investment Valuation
The following is a summary of the inputs used, as of November 30, 2015, involving the Fund's assets and liabilities carried at fair value. The inputs or methodology used for valuing securities may not be an indication of the risk associated with investing in those securities. For more information on valuation inputs, and their aggregation into the levels used below, please refer to the Investment Valuation section in the accompanying Notes to Financial Statements.
| Valuation Inputs at Reporting Date: | ||||
| Description | Total | Level 1 | Level 2 | Level 3 |
| (Amounts in thousands) | ||||
| Investments in Securities: | ||||
| Equities: | ||||
| Consumer Discretionary | $583,651 | $583,651 | $-- | $-- |
| Consumer Staples | 209,322 | 195,430 | 6,864 | 7,028 |
| Energy | 39,274 | 39,274 | -- | -- |
| Financials | 186,345 | 182,278 | -- | 4,067 |
| Health Care | 632,352 | 632,352 | -- | -- |
| Industrials | 285,833 | 285,833 | -- | -- |
| Information Technology | 1,326,882 | 1,312,737 | -- | 14,145 |
| Materials | 118,549 | 118,549 | -- | -- |
| Telecommunication Services | 48,889 | 48,889 | -- | -- |
| Utilities | 1,005 | 1,005 | -- | -- |
| Money Market Funds | 192,844 | 192,844 | -- | -- |
| Total Investments in Securities: | $3,624,946 | $3,592,842 | $6,864 | $25,240 |
Other Information
Distribution of investments by country or territory of incorporation, as a percentage of Total Net Assets, is as follows (Unaudited):
| United States of America | 89.4% |
| Ireland | 2.4% |
| Netherlands | 2.3% |
| Israel | 1.5% |
| Cayman Islands | 1.2% |
| Others (Individually Less Than 1%) | 3.2% |
| 100.0% |
See accompanying notes which are an integral part of the financial statements.
Financial Statements
Statement of Assets and Liabilities
| Amounts in thousands (except per-share amounts) | November 30, 2015 | |
| Assets | ||
| Investment in securities, at value (including securities loaned of $177,242) — See accompanying schedule: Unaffiliated issuers (cost $2,320,130) | $3,432,102 | |
| Fidelity Central Funds (cost $192,844) | 192,844 | |
| Total Investments (cost $2,512,974) | $3,624,946 | |
| Receivable for investments sold | 8,550 | |
| Receivable for fund shares sold | 1,885 | |
| Dividends receivable | 2,505 | |
| Distributions receivable from Fidelity Central Funds | 134 | |
| Prepaid expenses | 8 | |
| Other receivables | 147 | |
| Total assets | 3,638,175 | |
| Liabilities | ||
| Payable for investments purchased | $8,383 | |
| Payable for fund shares redeemed | 9,798 | |
| Accrued management fee | 1,591 | |
| Distribution and service plan fees payable | 950 | |
| Other affiliated payables | 607 | |
| Other payables and accrued expenses | 193 | |
| Collateral on securities loaned, at value | 182,358 | |
| Total liabilities | 203,880 | |
| Net Assets | $3,434,295 | |
| Net Assets consist of: | ||
| Paid in capital | $1,961,636 | |
| Accumulated net investment loss | (4,687) | |
| Accumulated undistributed net realized gain (loss) on investments and foreign currency transactions | 365,375 | |
| Net unrealized appreciation (depreciation) on investments and assets and liabilities in foreign currencies | 1,111,971 | |
| Net Assets | $3,434,295 | |
| Calculation of Maximum Offering Price | ||
| Class A: | ||
| Net Asset Value and redemption price per share ($664,134 ÷ 9,931.66 shares) | $66.87 | |
| Maximum offering price per share (100/94.25 of $66.87) | $70.95 | |
| Class T: | ||
| Net Asset Value and redemption price per share ($1,461,197 ÷ 21,890.00 shares) | $66.75 | |
| Maximum offering price per share (100/96.50 of $66.75) | $69.17 | |
| Class B: | ||
| Net Asset Value and offering price per share ($5,831 ÷ 95.67 shares)(a) | $60.95 | |
| Class C: | ||
| Net Asset Value and offering price per share ($237,894 ÷ 3,873.23 shares)(a) | $61.42 | |
| Class I: | ||
| Net Asset Value, offering price and redemption price per share ($1,060,642 ÷ 15,142.22 shares) | $70.05 | |
| Class Z: | ||
| Net Asset Value, offering price and redemption price per share ($4,597 ÷ 65.42 shares) | $70.27 |
(a) Redemption price per share is equal to net asset value less any applicable contingent deferred sales charge.
See accompanying notes which are an integral part of the financial statements.
Statement of Operations
| Amounts in thousands | Year ended November 30, 2015 | |
| Investment Income | ||
| Dividends | $32,275 | |
| Income from Fidelity Central Funds | 917 | |
| Total income | 33,192 | |
| Expenses | ||
| Management fee | ||
| Basic fee | $19,666 | |
| Performance adjustment | 317 | |
| Transfer agent fees | 6,720 | |
| Distribution and service plan fees | 11,405 | |
| Accounting and security lending fees | 1,039 | |
| Custodian fees and expenses | 53 | |
| Independent trustees' compensation | 16 | |
| Registration fees | 144 | |
| Audit | 65 | |
| Legal | 15 | |
| Interest | 13 | |
| Miscellaneous | 26 | |
| Total expenses before reductions | 39,479 | |
| Expense reductions | (172) | 39,307 |
| Net investment income (loss) | (6,115) | |
| Realized and Unrealized Gain (Loss) | ||
| Net realized gain (loss) on: | ||
| Investment securities: | ||
| Unaffiliated issuers | 500,027 | |
| Foreign currency transactions | 1 | |
| Total net realized gain (loss) | 500,028 | |
| Change in net unrealized appreciation (depreciation) on: Investment securities | (309,232) | |
| Total change in net unrealized appreciation (depreciation) | (309,232) | |
| Net gain (loss) | 190,796 | |
| Net increase (decrease) in net assets resulting from operations | $184,681 |
See accompanying notes which are an integral part of the financial statements.
Statement of Changes in Net Assets
| Amounts in thousands | Year ended November 30, 2015 | Year ended November 30, 2014 |
| Increase (Decrease) in Net Assets | ||
| Operations | ||
| Net investment income (loss) | $(6,115) | $(7,776) |
| Net realized gain (loss) | 500,028 | 148,379 |
| Change in net unrealized appreciation (depreciation) | (309,232) | 368,352 |
| Net increase (decrease) in net assets resulting from operations | 184,681 | 508,955 |
| Share transactions - net increase (decrease) | (483,133) | (40,304) |
| Total increase (decrease) in net assets | (298,452) | 468,651 |
| Net Assets | ||
| Beginning of period | 3,732,747 | 3,264,096 |
| End of period (including accumulated net investment loss of $4,687 and accumulated net investment loss of $3,051, respectively) | $3,434,295 | $3,732,747 |
See accompanying notes which are an integral part of the financial statements.
Financial Highlights — Fidelity Advisor Growth Opportunities Fund Class A
| November 30, | |||||
| Years ended November 30, | 2015 | 2014 | 2013 | 2012 | 2011 |
| Selected Per–Share Data | |||||
| Net asset value, beginning of period | $63.52 | $54.89 | $41.34 | $35.39 | $32.30 |
| Income from Investment Operations | |||||
| Net investment income (loss)A | (.08) | (.11) | (.10) | (.11) | (.08) |
| Net realized and unrealized gain (loss) | 3.43 | 8.74 | 13.65 | 6.06 | 3.17 |
| Total from investment operations | 3.35 | 8.63 | 13.55 | 5.95 | 3.09 |
| Net asset value, end of period | $66.87 | $63.52 | $54.89 | $41.34 | $35.39 |
| Total ReturnB,C | 5.27% | 15.72% | 32.78% | 16.81% | 9.57% |
| Ratios to Average Net AssetsD,E | |||||
| Expenses before reductions | 1.05% | 1.08% | 1.23% | 1.30% | 1.08% |
| Expenses net of fee waivers, if any | 1.05% | 1.08% | 1.23% | 1.29% | 1.08% |
| Expenses net of all reductions | 1.05% | 1.08% | 1.23% | 1.29% | 1.07% |
| Net investment income (loss) | (.12)% | (.18)% | (.20)% | (.29)% | (.23)% |
| Supplemental Data | |||||
| Net assets, end of period (in millions) | $664 | $648 | $555 | $359 | $267 |
| Portfolio turnover rateF | 51% | 13% | 17% | 34% | 31% |
A Calculated based on average shares outstanding during the period.
B Total returns would have been lower if certain expenses had not been reduced during the applicable periods shown.
C Total returns do not include the effect of the sales charges.
D Fees and expenses of any underlying Fidelity Central Funds are not included in the Fund's expense ratio. The Fund indirectly bears its proportionate share of the expenses of any underlying Fidelity Central Funds.
E Expense ratios reflect operating expenses of the class. Expenses before reductions do not reflect amounts reimbursed by the investment adviser or reductions from brokerage service arrangements or reductions from other expense offset arrangements and do not represent the amount paid by the class during periods when reimbursements or reductions occur. Expenses net of fee waivers reflect expenses after reimbursement by the investment adviser but prior to reductions from brokerage service arrangements or other expense offset arrangements. Expenses net of all reductions represent the net expenses paid by the class.
F Amount does not include the portfolio activity of any underlying Fidelity Central Funds.
See accompanying notes which are an integral part of the financial statements.
Financial Highlights — Fidelity Advisor Growth Opportunities Fund Class T
| November 30, | |||||
| Years ended November 30, | 2015 | 2014 | 2013 | 2012 | 2011 |
| Selected Per–Share Data | |||||
| Net asset value, beginning of period | $63.55 | $55.04 | $41.54 | $35.62 | $32.58 |
| Income from Investment Operations | |||||
| Net investment income (loss)A | (.23) | (.24) | (.19) | (.19) | (.15) |
| Net realized and unrealized gain (loss) | 3.43 | 8.75 | 13.69 | 6.11 | 3.19 |
| Total from investment operations | 3.20 | 8.51 | 13.50 | 5.92 | 3.04 |
| Net asset value, end of period | $66.75 | $63.55 | $55.04 | $41.54 | $35.62 |
| Total ReturnB,C | 5.04% | 15.46% | 32.50% | 16.62% | 9.33% |
| Ratios to Average Net AssetsD,E | |||||
| Expenses before reductions | 1.28% | 1.31% | 1.43% | 1.48% | 1.25% |
| Expenses net of fee waivers, if any | 1.28% | 1.31% | 1.43% | 1.48% | 1.25% |
| Expenses net of all reductions | 1.28% | 1.31% | 1.43% | 1.48% | 1.25% |
| Net investment income (loss) | (.35)% | (.40)% | (.40)% | (.48)% | (.40)% |
| Supplemental Data | |||||
| Net assets, end of period (in millions) | $1,461 | $1,504 | $1,426 | $1,187 | $1,102 |
| Portfolio turnover rateF | 51% | 13% | 17% | 34% | 31% |
A Calculated based on average shares outstanding during the period.
B Total returns would have been lower if certain expenses had not been reduced during the applicable periods shown.
C Total returns do not include the effect of the sales charges.
D Fees and expenses of any underlying Fidelity Central Funds are not included in the Fund's expense ratio. The Fund indirectly bears its proportionate share of the expenses of any underlying Fidelity Central Funds.
E Expense ratios reflect operating expenses of the class. Expenses before reductions do not reflect amounts reimbursed by the investment adviser or reductions from brokerage service arrangements or reductions from other expense offset arrangements and do not represent the amount paid by the class during periods when reimbursements or reductions occur. Expenses net of fee waivers reflect expenses after reimbursement by the investment adviser but prior to reductions from brokerage service arrangements or other expense offset arrangements. Expenses net of all reductions represent the net expenses paid by the class.
F Amount does not include the portfolio activity of any underlying Fidelity Central Funds.
See accompanying notes which are an integral part of the financial statements.
Financial Highlights — Fidelity Advisor Growth Opportunities Fund Class B
| November 30, | |||||
| Years ended November 30, | 2015 | 2014 | 2013 | 2012 | 2011 |
| Selected Per–Share Data | |||||
| Net asset value, beginning of period | $58.39 | $50.87 | $38.62 | $33.31 | $30.64 |
| Income from Investment Operations | |||||
| Net investment income (loss)A | (.58) | (.55) | (.44) | (.39) | (.33) |
| Net realized and unrealized gain (loss) | 3.14 | 8.07 | 12.69 | 5.70 | 3.00 |
| Total from investment operations | 2.56 | 7.52 | 12.25 | 5.31 | 2.67 |
| Net asset value, end of period | $60.95 | $58.39 | $50.87 | $38.62 | $33.31 |
| Total ReturnB,C | 4.38% | 14.78% | 31.72% | 15.94% | 8.71% |
| Ratios to Average Net AssetsD,E | |||||
| Expenses before reductions | 1.90% | 1.92% | 2.03% | 2.07% | 1.83% |
| Expenses net of fee waivers, if any | 1.90% | 1.92% | 2.03% | 2.05% | 1.83% |
| Expenses net of all reductions | 1.90% | 1.92% | 2.03% | 2.05% | 1.83% |
| Net investment income (loss) | (.97)% | (1.02)% | (1.00)% | (1.05)% | (.98)% |
| Supplemental Data | |||||
| Net assets, end of period (in millions) | $6 | $9 | $12 | $13 | $14 |
| Portfolio turnover rateF | 51% | 13% | 17% | 34% | 31% |
A Calculated based on average shares outstanding during the period.
B Total returns would have been lower if certain expenses had not been reduced during the applicable periods shown.
C Total returns do not include the effect of the contingent deferred sales charge.
D Fees and expenses of any underlying Fidelity Central Funds are not included in the Fund's expense ratio. The Fund indirectly bears its proportionate share of the expenses of any underlying Fidelity Central Funds.
E Expense ratios reflect operating expenses of the class. Expenses before reductions do not reflect amounts reimbursed by the investment adviser or reductions from brokerage service arrangements or reductions from other expense offset arrangements and do not represent the amount paid by the class during periods when reimbursements or reductions occur. Expenses net of fee waivers reflect expenses after reimbursement by the investment adviser but prior to reductions from brokerage service arrangements or other expense offset arrangements. Expenses net of all reductions represent the net expenses paid by the class.
F Amount does not include the portfolio activity of any underlying Fidelity Central Funds.
See accompanying notes which are an integral part of the financial statements.
Financial Highlights — Fidelity Advisor Growth Opportunities Fund Class C
| November 30, | |||||
| Years ended November 30, | 2015 | 2014 | 2013 | 2012 | 2011 |
| Selected Per–Share Data | |||||
| Net asset value, beginning of period | $58.78 | $51.17 | $38.83 | $33.48 | $30.79 |
| Income from Investment Operations | |||||
| Net investment income (loss)A | (.52) | (.50) | (.42) | (.38) | (.33) |
| Net realized and unrealized gain (loss) | 3.16 | 8.11 | 12.76 | 5.73 | 3.02 |
| Total from investment operations | 2.64 | 7.61 | 12.34 | 5.35 | 2.69 |
| Net asset value, end of period | $61.42 | $58.78 | $51.17 | $38.83 | $33.48 |
| Total ReturnB,C | 4.49% | 14.87% | 31.78% | 15.98% | 8.74% |
| Ratios to Average Net AssetsD,E | |||||
| Expenses before reductions | 1.80% | 1.83% | 1.96% | 2.04% | 1.82% |
| Expenses net of fee waivers, if any | 1.80% | 1.83% | 1.96% | 2.03% | 1.82% |
| Expenses net of all reductions | 1.80% | 1.83% | 1.96% | 2.02% | 1.82% |
| Net investment income (loss) | (.87)% | (.93)% | (.93)% | (1.02)% | (.97)% |
| Supplemental Data | |||||
| Net assets, end of period (in millions) | $238 | $212 | $159 | $71 | $47 |
| Portfolio turnover rateF | 51% | 13% | 17% | 34% | 31% |
A Calculated based on average shares outstanding during the period.
B Total returns would have been lower if certain expenses had not been reduced during the applicable periods shown.
C Total returns do not include the effect of the contingent deferred sales charge.
D Fees and expenses of any underlying Fidelity Central Funds are not included in the Fund's expense ratio. The Fund indirectly bears its proportionate share of the expenses of any underlying Fidelity Central Funds.
E Expense ratios reflect operating expenses of the class. Expenses before reductions do not reflect amounts reimbursed by the investment adviser or reductions from brokerage service arrangements or reductions from other expense offset arrangements and do not represent the amount paid by the class during periods when reimbursements or reductions occur. Expenses net of fee waivers reflect expenses after reimbursement by the investment adviser but prior to reductions from brokerage service arrangements or other expense offset arrangements. Expenses net of all reductions represent the net expenses paid by the class.
F Amount does not include the portfolio activity of any underlying Fidelity Central Funds.
See accompanying notes which are an integral part of the financial statements.
Financial Highlights — Fidelity Advisor Growth Opportunities Fund Class I
| November 30, | |||||
| Years ended November 30, | 2015 | 2014 | 2013 | 2012 | 2011 |
| Selected Per–Share Data | |||||
| Net asset value, beginning of period | $66.35 | $57.18 | $42.94 | $36.63 | $33.33 |
| Income from Investment Operations | |||||
| Net investment income (loss)A | .11 | .05 | .05 | .01 | .05 |
| Net realized and unrealized gain (loss) | 3.59 | 9.12 | 14.19 | 6.30 | 3.25 |
| Total from investment operations | 3.70 | 9.17 | 14.24 | 6.31 | 3.30 |
| Net asset value, end of period | $70.05 | $66.35 | $57.18 | $42.94 | $36.63 |
| Total ReturnB | 5.58% | 16.04% | 33.16% | 17.23% | 9.90% |
| Ratios to Average Net AssetsC,D | |||||
| Expenses before reductions | .77% | .81% | .93% | .97% | .72% |
| Expenses net of fee waivers, if any | .77% | .81% | .93% | .97% | .72% |
| Expenses net of all reductions | .77% | .81% | .93% | .97% | .72% |
| Net investment income (loss) | .16% | .09% | .09% | .04% | .13% |
| Supplemental Data | |||||
| Net assets, end of period (in millions) | $1,061 | $1,357 | $1,112 | $475 | $215 |
| Portfolio turnover rateE | 51% | 13% | 17% | 34% | 31% |
A Calculated based on average shares outstanding during the period.
B Total returns would have been lower if certain expenses had not been reduced during the applicable periods shown.
C Fees and expenses of any underlying Fidelity Central Funds are not included in the Fund's expense ratio. The Fund indirectly bears its proportionate share of the expenses of any underlying Fidelity Central Funds.
D Expense ratios reflect operating expenses of the class. Expenses before reductions do not reflect amounts reimbursed by the investment adviser or reductions from brokerage service arrangements or reductions from other expense offset arrangements and do not represent the amount paid by the class during periods when reimbursements or reductions occur. Expenses net of fee waivers reflect expenses after reimbursement by the investment adviser but prior to reductions from brokerage service arrangements or other expense offset arrangements. Expenses net of all reductions represent the net expenses paid by the class.
E Amount does not include the portfolio activity of any underlying Fidelity Central Funds.
See accompanying notes which are an integral part of the financial statements.
Financial Highlights — Fidelity Advisor Growth Opportunities Fund Class Z
| November 30, | |||
| Years ended November 30, | 2015 | 2014 | 2013 A |
| Selected Per–Share Data | |||
| Net asset value, beginning of period | $66.48 | $57.20 | $53.30 |
| Income from Investment Operations | |||
| Net investment income (loss)B | .20 | .14 | .02 |
| Net realized and unrealized gain (loss) | 3.59 | 9.14 | 3.88 |
| Total from investment operations | 3.79 | 9.28 | 3.90 |
| Net asset value, end of period | $70.27 | $66.48 | $57.20 |
| Total ReturnC,D | 5.70% | 16.22% | 7.32% |
| Ratios to Average Net AssetsE,F | |||
| Expenses before reductions | .64% | .67% | .78%G |
| Expenses net of fee waivers, if any | .64% | .67% | .78%G |
| Expenses net of all reductions | .64% | .67% | .78%G |
| Net investment income (loss) | .29% | .24% | .14%G |
| Supplemental Data | |||
| Net assets, end of period (000 omitted) | $4,597 | $2,955 | $107 |
| Portfolio turnover rateH | 51% | 13% | 17% |
A For the period August 13, 2013 (commencement of sale of shares) to November 30, 2013.
B Calculated based on average shares outstanding during the period.
C Total returns for periods of less than one year are not annualized.
D Total returns would have been lower if certain expenses had not been reduced during the applicable periods shown.
E Fees and expenses of any underlying Fidelity Central Funds are not included in the Fund's expense ratio. The Fund indirectly bears its proportionate share of the expenses of any underlying Fidelity Central Funds.
F Expense ratios reflect operating expenses of the class. Expenses before reductions do not reflect amounts reimbursed by the investment adviser or reductions from brokerage service arrangements or reductions from other expense offset arrangements and do not represent the amount paid by the class during periods when reimbursements or reductions occur. Expense ratios before reductions for start-up periods may not be representative of longer-term operating periods. Expenses net of fee waivers reflect expenses after reimbursement by the investment adviser but prior to reductions from brokerage service arrangements or other expense offset arrangements. Expenses net of all reductions represent the net expenses paid by the class.
G Annualized
H Amount does not include the portfolio activity of any underlying Fidelity Central Funds.
See accompanying notes which are an integral part of the financial statements.
Notes to Financial Statements
For the period ended November 30, 2015
(Amounts in thousands except percentages)
1. Organization.
Fidelity Advisor Growth Opportunities Fund (the Fund) is a fund of Fidelity Advisor Series I (the Trust) and is authorized to issue an unlimited number of shares. The Trust is registered under the Investment Company Act of 1940, as amended (the 1940 Act), as an open-end management investment company organized as a Massachusetts business trust. The Fund offers Class A, Class T, Class C, Class I (formerly Institutional Class) and Class Z shares, each of which, along with Class B shares, has equal rights as to assets and voting privileges. Class B shares are closed to new accounts and additional purchases, except for exchanges and reinvestments. Each class has exclusive voting rights with respect to matters that affect that class. Class B shares will automatically convert to Class A shares after a holding period of seven years from the initial date of purchase.
2. Investments in Fidelity Central Funds.
The Fund invests in Fidelity Central Funds, which are open-end investment companies generally available only to other investment companies and accounts managed by the investment adviser and its affiliates. The Fund's Schedule of Investments lists each of the Fidelity Central Funds held as of period end, if any, as an investment of the Fund, but does not include the underlying holdings of each Fidelity Central Fund. As an Investing Fund, the Fund indirectly bears its proportionate share of the expenses of the underlying Fidelity Central Funds.
The Money Market Central Funds seek preservation of capital and current income and are managed by Fidelity Investments Money Management, Inc. (FIMM), an affiliate of the investment adviser. Annualized expenses of the Money Market Central Funds as of their most recent shareholder report date are less than .01%.
A complete unaudited list of holdings for each Fidelity Central Fund is available upon request or at the Securities and Exchange Commission (the SEC) website at www.sec.gov. In addition, the financial statements of the Fidelity Central Funds, which are not covered by the Fund's Report of Independent Registered Public Accounting Firm, are available on the SEC website or upon request.
3. Significant Accounting Policies.
The financial statements have been prepared in conformity with accounting principles generally accepted in the United States of America (GAAP), which require management to make certain estimates and assumptions at the date of the financial statements. Actual results could differ from those estimates. Subsequent events, if any, through the date that the financial statements were issued have been evaluated in the preparation of the financial statements. The following summarizes the significant accounting policies of the Fund:
Investment Valuation. Investments are valued as of 4:00 p.m. Eastern time on the last calendar day of the period. The Board of Trustees (the Board) has delegated the day to day responsibility for the valuation of the Fund's investments to the Fidelity Management & Research Company (FMR) Fair Value Committee (the Committee). In accordance with valuation policies and procedures approved by the Board, the Fund attempts to obtain prices from one or more third party pricing vendors or brokers to value its investments. When current market prices, quotations or currency exchange rates are not readily available or reliable, investments will be fair valued in good faith by the Committee, in accordance with procedures adopted by the Board. Factors used in determining fair value vary by investment type and may include market or investment specific events. The frequency with which these procedures are used cannot be predicted and they may be utilized to a significant extent. The Committee oversees the Fund's valuation policies and procedures and reports to the Board on the Committee's activities and fair value determinations. The Board monitors the appropriateness of the procedures used in valuing the Fund's investments and ratifies the fair value determinations of the Committee.
The Fund categorizes the inputs to valuation techniques used to value its investments into a disclosure hierarchy consisting of three levels as shown below:
- Level 1 – quoted prices in active markets for identical investments
- Level 2 – other significant observable inputs (including quoted prices for similar investments, interest rates, prepayment speeds, etc.)
- Level 3 – unobservable inputs (including the Fund's own assumptions based on the best information available)
Valuation techniques used to value the Fund's investments by major category are as follows:
Equity securities, including restricted securities, for which market quotations are readily available, are valued at the last reported sale price or official closing price as reported by a third party pricing vendor on the primary market or exchange on which they are traded and are categorized as Level 1 in the hierarchy. In the event there were no sales during the day or closing prices are not available, securities are valued at the last quoted bid price or may be valued using the last available price and are generally categorized as Level 2 in the hierarchy. For foreign equity securities, when market or security specific events arise, comparisons to the valuation of American Depositary Receipts (ADRs), futures contracts, Exchange-Traded Funds (ETFs) and certain indexes as well as quoted prices for similar securities may be used and would be categorized as Level 2 in the hierarchy. Utilizing these techniques may result in transfers between Level 1 and Level 2. For equity securities, including restricted securities, where observable inputs are limited, assumptions about market activity and risk are used and these securities may be categorized as Level 3 in the hierarchy.
Investments in open-end mutual funds, including the Fidelity Central Funds, are valued at their closing net asset value (NAV) each business day and are categorized as Level 1 in the hierarchy.
Changes in valuation techniques may result in transfers in or out of an assigned level within the disclosure hierarchy. The aggregate value of investments by input level as of November 30, 2015 is included at the end of the each Fund's Schedule of Investments.
Foreign Currency. The Fund may use foreign currency contracts to facilitate transactions in foreign-denominated securities. Gains and losses from these transactions may arise from changes in the value of the foreign currency or if the counterparties do not perform under the contracts' terms.
Foreign-denominated assets, including investment securities, and liabilities are translated into U.S. dollars at the exchange rates at period end. Purchases and sales of investment securities, income and dividends received and expenses denominated in foreign currencies are translated into U.S. dollars at the exchange rate in effect on the transaction date.
The effects of exchange rate fluctuations on investments are included with the net realized and unrealized gain (loss) on investment securities. Other foreign currency transactions resulting in realized and unrealized gain (loss) are disclosed separately.
Investment Transactions and Income. For financial reporting purposes, the Fund's investment holdings and NAV include trades executed through the end of the last business day of the period. The NAV per share for processing shareholder transactions is calculated as of the close of business of the New York Stock Exchange (NYSE), normally 4:00 p.m. Eastern time and includes trades executed through the end of the prior business day. Gains and losses on securities sold are determined on the basis of identified cost and may include proceeds received from litigation. Dividend income is recorded on the ex-dividend date, except for certain dividends from foreign securities where the ex-dividend date may have passed, which are recorded as soon as the Fund is informed of the ex-dividend date. Non-cash dividends included in dividend income, if any, are recorded at the fair market value of the securities received. Income and capital gain distributions from Fidelity Central Funds, if any, are recorded on the ex-dividend date. Distributions received on securities that represent a return of capital or capital gain are recorded as a reduction of cost of investments and/or as a realized gain. Subsequent to ex-dividend date the Fund determines the components of these distributions, based upon receipt of tax filings or other correspondence relating to the underlying investment. Interest income is accrued as earned and includes coupon interest and amortization of premium and accretion of discount on debt securities as applicable. Investment income is recorded net of foreign taxes withheld where recovery of such taxes is uncertain.
Class Allocations and Expenses. Investment income, realized and unrealized capital gains and losses, common expenses of the Fund, and certain fund-level expense reductions, if any, are allocated daily on a pro-rata basis to each class based on the relative net assets of each class to the total net assets of the Fund. Each class differs with respect to transfer agent and distribution and service plan fees incurred. Certain expense reductions may also differ by class. For the reporting period, the allocated portion of income and expenses to each class as a percent of its average net assets may vary due to the timing of recording these transactions in relation to fluctuating net assets of the classes. Expenses directly attributable to a fund are charged to that fund. Expenses attributable to more than one fund are allocated among the respective funds on the basis of relative net assets or other appropriate methods. Expense estimates are accrued in the period to which they relate and adjustments are made when actual amounts are known.
Deferred Trustee Compensation. Under a Deferred Compensation Plan (the Plan), independent Trustees may elect to defer receipt of a portion of their annual compensation. Deferred amounts are invested in a cross-section of Fidelity funds, are marked-to-market and remain in the Fund until distributed in accordance with the Plan. The investment of deferred amounts and the offsetting payable to the Trustees are included in the accompanying Statement of Assets and Liabilities.
Income Tax Information and Distributions to Shareholders. Each year, the Fund intends to qualify as a regulated investment company under Subchapter M of the Internal Revenue Code, including distributing substantially all of its taxable income and realized gains. As a result, no provision for U.S. Federal income taxes is required. As of November 30, 2015, the Fund did not have any unrecognized tax benefits in the financial statements; nor is the Fund aware of any tax positions for which it is reasonably possible that the total amounts of unrecognized tax benefits will significantly change in the next twelve months. The Fund files a U.S. federal tax return, in addition to state and local tax returns as required. The Fund's federal income tax returns are subject to examination by the Internal Revenue Service (IRS) for a period of three fiscal years after they are filed. State and local tax returns may be subject to examination for an additional fiscal year depending on the jurisdiction. Foreign taxes are provided for based on the Fund's understanding of the tax rules and rates that exist in the foreign markets in which it invests.
Distributions are declared and recorded on the ex-dividend date. Income dividends and capital gain distributions are declared separately for each class. Income and capital gain distributions are determined in accordance with income tax regulations, which may differ from GAAP. In addition, the Fund claimed a portion of the payment made to redeeming shareholders as a distribution for income tax purposes.
Capital accounts within the financial statements are adjusted for permanent book-tax differences. These adjustments have no impact on net assets or the results of operations. Capital accounts are not adjusted for temporary book-tax differences which will reverse in a subsequent period.
Book-tax differences are primarily due to foreign currency transactions, partnerships, passive foreign investment companies (PFIC), deferred trustees compensation, net operating losses, capital loss carryforwards and losses deferred due to wash sales and excise tax regulations.
The federal tax cost of investment securities and unrealized appreciation (depreciation) as of period end were as follows:
| Gross unrealized appreciation | $1,210,982 |
| Gross unrealized depreciation | (105,168) |
| Net unrealized appreciation (depreciation) on securities | $1,105,814 |
| Tax Cost | $2,519,132 |
The tax-based components of distributable earnings as of period end were as follows:
| Undistributed long-term capital gain | $371,533 |
| Net unrealized appreciation (depreciation) on securities and other investments | $1,105,813 |
Restricted Securities. The Fund may invest in securities that are subject to legal or contractual restrictions on resale. These securities generally may be resold in transactions exempt from registration or to the public if the securities are registered. Disposal of these securities may involve time-consuming negotiations and expense, and prompt sale at an acceptable price may be difficult. Information regarding restricted securities is included at the end of the Fund's Schedule of Investments.
4. Purchases and Sales of Investments.
Purchases and sales of securities, other than short-term securities, aggregated $1,801,736 and $2,284,611, respectively.
5. Fees and Other Transactions with Affiliates.
Management Fee. Fidelity Management & Research Company (the investment adviser) and its affiliates provide the Fund with investment management related services for which the Fund pays a monthly management fee. The management fee is the sum of an individual fund fee rate that is based on an annual rate of .30% of the Fund's average net assets and an annualized group fee rate that averaged .25% during the period. The group fee rate is based upon the average net assets of all the mutual funds advised by the investment adviser, including any mutual funds previously advised by the investment adviser that are currently advised by Fidelity SelectCo, LLC, an affiliate of the investment adviser. The group fee rate decreases as assets under management increase and increases as assets under management decrease. In addition, the management fee is subject to a performance adjustment (up to a maximum of +/- .20% of the Fund's average net assets over a 36 month performance period). The upward or downward adjustment to the management fee is based on the investment performance of the asset-weighted return of all classes as compared to its benchmark index, the Russell 1000 Growth Index, over the same 36 month performance period. For the reporting period, the total annual management fee rate, including the performance adjustment, was .56% of the Fund's average net assets. The performance adjustment included in the management fee rate may be higher or lower than the maximum performance adjustment rate due to the difference between the average net assets for the reporting and performance periods.
Distribution and Service Plan Fees. In accordance with Rule 12b-1 of the 1940 Act, the Fund has adopted separate Distribution and Service Plans for each class of shares. Certain classes pay Fidelity Distributors Corporation (FDC), an affiliate of the investment adviser, separate Distribution and Service Fees, each of which is based on an annual percentage of each class' average net assets. In addition, FDC may pay financial intermediaries for selling shares of the Fund and providing shareholder support services. For the period, the Distribution and Service Fee rates, total fees and amounts retained by FDC were as follows:
| Distribution Fee | Service Fee | Total Fees | Retained by FDC | |
| Class A | -% | .25% | $1,638 | $28 |
| Class T | .25% | .25% | 7,406 | 18 |
| Class B | .75% | .25% | 71 | 53 |
| Class C | .75% | .25% | 2,290 | 401 |
| $11,405 | $500 |
Sales Load. FDC may receive a front-end sales charge of up to 5.75% for selling Class A shares and 3.50% for selling Class T shares, some of which is paid to financial intermediaries for selling shares of the Fund. Depending on the holding period, FDC may receive contingent deferred sales charges levied on Class A, Class T, Class B, and Class C redemptions. The deferred sales charges range from 5.00% to 1.00% for Class B shares, 1.00% for Class C shares, 1.00% for certain purchases of Class A shares and .25% for certain purchases of Class T shares.
For the period, sales charge amounts retained by FDC were as follows:
| Retained by FDC | |
| Class A | $145 |
| Class T | 44 |
| Class B(a) | 2 |
| Class C(a) | 19 |
| $210 |
(a) When Class B and Class C shares are initially sold, FDC pays commissions from its own resources to financial intermediaries through which the sales are made.
Transfer Agent Fees. Fidelity Investments Institutional Operations Company, Inc., (FIIOC), an affiliate of the investment adviser, is the transfer, dividend disbursing and shareholder servicing agent for each class of the Fund. FIIOC receives account fees and asset-based fees that vary according to the account size and type of account of the shareholders of the respective classes of the Fund, except for Class Z. FIIOC pays for typesetting, printing and mailing of shareholder reports, except proxy statements.
For the period, transfer agent fees for each applicable class were as follows:
| Amount | % of Class-Level Average Net Assets | |
| Class A | $1,357 | .21 |
| Class T | 2,743 | .19 |
| Class B | 21 | .30 |
| Class C | 466 | .20 |
| Class I | 2,132 | .18 |
| Class Z | 1 | .05 |
| $6,720 |
Accounting and Security Lending Fees. Fidelity Service Company, Inc. (FSC), an affiliate of the investment adviser, maintains the Fund's accounting records. The accounting fee is based on the level of average net assets for each month. Under a separate contract, FSC administers the security lending program. The security lending fee is based on the number and duration of lending transactions.
Brokerage Commissions. The Fund placed a portion of its portfolio transactions with brokerage firms which are affiliates of the investment adviser. Brokerage commissions are included in net realized gain (loss) and change in net unrealized appreciation (depreciation) in the Statement of Operations. The commissions paid to these affiliated firms were $50 for the period.
Interfund Lending Program. Pursuant to an Exemptive Order issued by the SEC, the Fund, along with other registered investment companies having management contracts with FMR or other affiliated entities of FMR, may participate in an interfund lending program. This program provides an alternative credit facility allowing the funds to borrow from, or lend money to, other participating affiliated funds. The Fund's activity in this program during the period for which loans were outstanding was as follows:
| Borrower or Lender | Average Loan Balance | Weighted Average Interest Rate | Interest Expense |
| Borrower | $43,534 | .35% | $13 |
6. Committed Line of Credit.
The Fund participates with other funds managed by the investment adviser or an affiliate in a $4.25 billion credit facility (the "line of credit") to be utilized for temporary or emergency purposes to fund shareholder redemptions or for other short-term liquidity purposes. The Fund has agreed to pay commitment fees on its pro-rata portion of the line of credit, which amounted to $5 and is reflected in Miscellaneous expenses on the Statement of Operations. During the period, the Fund did not borrow on this line of credit.
7. Security Lending.
The Fund lends portfolio securities through a lending agent from time to time in order to earn additional income. For equity securities, a lending agent is used and may loan securities to certain qualified borrowers, including Fidelity Capital Markets (FCM), a broker-dealer affiliated with the Fund. On the settlement date of the loan, the Fund receives collateral (in the form of U.S. Treasury obligations, letters of credit and/or cash) against the loaned securities and maintains collateral in an amount not less than 100% of the market value of the loaned securities during the period of the loan. The market value of the loaned securities is determined at the close of business of the Fund and any additional required collateral is delivered to the Fund on the next business day. The Fund or borrower may terminate the loan at any time, and if the borrower defaults on its obligation to return the securities loaned because of insolvency or other reasons, the Fund may apply collateral received from the borrower against the obligation. The Fund may experience delays and costs in recovering the securities loaned. Any cash collateral received is invested in the Fidelity Securities Lending Cash Central Fund. The value of loaned securities and cash collateral at period end are disclosed on the Fund's Statement of Assets and Liabilities. The value of securities loaned to FCM at period end was $5,403. Security lending income represents the income earned on investing cash collateral, less rebates paid to borrowers and any lending agent fees associated with the loan, plus any premium payments received for lending certain types of securities. Security lending income is presented in the Statement of Operations as a component of income from Fidelity Central Funds. Total security lending income during the period amounted to $882, including $26 from securities loaned to FCM.
8. Expense Reductions.
Commissions paid to certain brokers with whom the investment adviser, or its affiliates, places trades on behalf of the Fund include an amount in addition to trade execution, which may be rebated back to the Fund to offset certain expenses. This amount totaled $84 for the period.
In addition, during the period the investment adviser reimbursed and/or waived a portion of fund-level operating expenses in the amount of $14 and a portion of class-level operating expenses as follows:
| Amount | |
| Class A | $13 |
| Class T | 32 |
| Class B | -* |
| Class C | 4 |
| Class I | 25 |
| $74 |
* In the amount of less than five hundred dollars.
9. Share Transactions.
Share transactions for each class were as follows and may contain automatic conversions between classes or exchanges between funds:
| Shares | Shares | Dollars | Dollars | |
| Years ended November 30, | 2015 | 2014 | 2015 | 2014 |
| Class A | ||||
| Shares sold | 2,042 | 3,210 | $132,799 | $185,879 |
| Shares redeemed | (2,310) | (3,125) | (150,069) | (181,042) |
| Net increase (decrease) | (268) | 85 | $(17,270) | $4,837 |
| Class T | ||||
| Shares sold | 2,048 | 2,463 | $132,934 | $142,596 |
| Shares redeemed | (3,816) | (4,710) | (247,857) | (273,249) |
| Net increase (decrease) | (1,768) | (2,247) | $(114,923) | $(130,653) |
| Class B | ||||
| Shares sold | 8 | 9 | $496 | $456 |
| Shares redeemed | (60) | (101) | (3,572) | (5,359) |
| Net increase (decrease) | (52) | (92) | $(3,076) | $(4,903) |
| Class C | ||||
| Shares sold | 976 | 1,386 | $58,121 | $74,498 |
| Shares redeemed | (715) | (882) | (42,885) | (47,157) |
| Net increase (decrease) | 261 | 504 | $15,236 | $27,341 |
| Class I | ||||
| Shares sold | 3,352 | 6,174 | $227,344 | $372,705 |
| Shares redeemed | (8,670) | (5,157) | (591,814) | (312,379) |
| Net increase (decrease) | (5,318) | 1,017 | $(364,470) | $60,326 |
| Class Z | ||||
| Shares sold | 30 | 43 | $1,991 | $2,754 |
| Shares redeemed | (9) | -* | (621) | (6) |
| Net increase (decrease) | 21 | 43 | $1,370 | $2,748 |
* In the amount of less than 500 shares.
10. Other.
The Fund's organizational documents provide former and current trustees and officers with a limited indemnification against liabilities arising in connection with the performance of their duties to the Fund. In the normal course of business, the Fund may also enter into contracts that provide general indemnifications. The Fund's maximum exposure under these arrangements is unknown as this would be dependent on future claims that may be made against the Fund. The risk of material loss from such claims is considered remote.
Report of Independent Registered Public Accounting Firm
To the Trustees of Fidelity Advisor Series I and Shareholders of Fidelity Advisor® Growth Opportunities Fund:
We have audited the accompanying statement of assets and liabilities of Fidelity Advisor® Growth Opportunities Fund (the Fund), a fund of Fidelity Advisor Series I, including the schedule of investments, as of November 30, 2015, and the related statement of operations for the year then ended, the statement of changes in net assets for each of the two years in the period then ended, and the financial highlights for each of the five years in the period then ended. These financial statements and financial highlights are the responsibility of the Fund's management. Our responsibility is to express an opinion on these financial statements and financial highlights based on our audits.
We conducted our audits in accordance with the standards of the Public Company Accounting Oversight Board (United States). Those standards require that we plan and perform the audit to obtain reasonable assurance about whether the financial statements and financial highlights are free of material misstatement. The Fund is not required to have, nor were we engaged to perform, an audit of its internal control over financial reporting. Our audits included consideration of internal control over financial reporting as a basis for designing audit procedures that are appropriate in the circumstances, but not for the purpose of expressing an opinion on the effectiveness of the Fund's internal control over financial reporting. Accordingly, we express no such opinion. An audit also includes examining, on a test basis, evidence supporting the amounts and disclosures in the financial statements, assessing the accounting principles used and significant estimates made by management, as well as evaluating the overall financial statement presentation. Our procedures included confirmation of securities owned as of November 30, 2015, by correspondence with the custodians and brokers; when replies were not received from brokers, we performed other auditing procedures. We believe that our audits provide a reasonable basis for our opinion.
In our opinion, such financial statements and financial highlights referred to above present fairly, in all material respects, the financial position of Fidelity Advisor® Growth Opportunities Fund as of November 30, 2015, the results of its operations for the year then ended, the changes in its net assets for each of the two years in the period then ended, and the financial highlights for the five years in the period then ended, in conformity with accounting principles generally accepted in the United States of America.
DELOITTE & TOUCHE LLP
Boston, Massachusetts
January 14, 2016
Trustees and Officers
The Trustees, Members of the Advisory Board (if any), and officers of the trust and fund, as applicable, are listed below. The Board of Trustees governs the fund and is responsible for protecting the interests of shareholders. The Trustees are experienced executives who meet periodically throughout the year to oversee the fund's activities, review contractual arrangements with companies that provide services to the fund, oversee management of the risks associated with such activities and contractual arrangements, and review the fund's performance. Each of the Trustees oversees 170 funds.
The Trustees hold office without limit in time except that (a) any Trustee may resign; (b) any Trustee may be removed by written instrument, signed by at least two-thirds of the number of Trustees prior to such removal; (c) any Trustee who requests to be retired or who has become incapacitated by illness or injury may be retired by written instrument signed by a majority of the other Trustees; and (d) any Trustee may be removed at any special meeting of shareholders by a two-thirds vote of the outstanding voting securities of the trust. Each Trustee who is not an interested person (as defined in the 1940 Act) of the trust and the fund is referred to herein as an Independent Trustee. Each Independent Trustee shall retire not later than the last day of the calendar year in which his or her 75th birthday occurs. The Independent Trustees may waive this mandatory retirement age policy with respect to individual Trustees. Officers and Advisory Board Members hold office without limit in time, except that any officer or Advisory Board Member may resign or may be removed by a vote of a majority of the Trustees at any regular meeting or any special meeting of the Trustees. Except as indicated, each individual has held the office shown or other offices in the same company for the past five years.
The fund’s Statement of Additional Information (SAI) includes more information about the Trustees. To request a free copy, call Fidelity at 1-877-208-0098.
Experience, Skills, Attributes, and Qualifications of the Trustees. The Governance and Nominating Committee has adopted a statement of policy that describes the experience, qualifications, attributes, and skills that are necessary and desirable for potential Independent Trustee candidates (Statement of Policy). The Board believes that each Trustee satisfied at the time he or she was initially elected or appointed a Trustee, and continues to satisfy, the standards contemplated by the Statement of Policy. The Governance and Nominating Committee also engages professional search firms to help identify potential Independent Trustee candidates who have the experience, qualifications, attributes, and skills consistent with the Statement of Policy. From time to time, additional criteria based on the composition and skills of the current Independent Trustees, as well as experience or skills that may be appropriate in light of future changes to board composition, business conditions, and regulatory or other developments, have also been considered by the professional search firms and the Governance and Nominating Committee. In addition, the Board takes into account the Trustees' commitment and participation in Board and committee meetings, as well as their leadership of standing and ad hoc committees throughout their tenure.
In determining that a particular Trustee was and continues to be qualified to serve as a Trustee, the Board has considered a variety of criteria, none of which, in isolation, was controlling. The Board believes that, collectively, the Trustees have balanced and diverse experience, qualifications, attributes, and skills, which allow the Board to operate effectively in governing the fund and protecting the interests of shareholders. Information about the specific experience, skills, attributes, and qualifications of each Trustee, which in each case led to the Board's conclusion that the Trustee should serve (or continue to serve) as a trustee of the fund, is provided below.
Board Structure and Oversight Function. James C. Curvey is an interested person and currently serves as Chairman. The Trustees have determined that an interested Chairman is appropriate and benefits shareholders because an interested Chairman has a personal and professional stake in the quality and continuity of services provided to the fund. Independent Trustees exercise their informed business judgment to appoint an individual of their choosing to serve as Chairman, regardless of whether the Trustee happens to be independent or a member of management. The Independent Trustees have determined that they can act independently and effectively without having an Independent Trustee serve as Chairman and that a key structural component for assuring that they are in a position to do so is for the Independent Trustees to constitute a substantial majority for the Board. The Independent Trustees also regularly meet in executive session. Ned C. Lautenbach serves as Chairman of the Independent Trustees and as such (i) acts as a liaison between the Independent Trustees and management with respect to matters important to the Independent Trustees and (ii) with management prepares agendas for Board meetings.
Fidelity® funds are overseen by different Boards of Trustees. The fund's Board oversees Fidelity's high income and certain equity funds, and other Boards oversee Fidelity's investment-grade bond, money market, asset allocation, and sector funds. The asset allocation funds may invest in Fidelity® funds overseen by the fund's Board. The use of separate Boards, each with its own committee structure, allows the Trustees of each group of Fidelity® funds to focus on the unique issues of the funds they oversee, including common research, investment, and operational issues. On occasion, the separate Boards establish joint committees to address issues of overlapping consequences for the Fidelity® funds overseen by each Board.
The Trustees operate using a system of committees to facilitate the timely and efficient consideration of all matters of importance to the Trustees, the fund, and fund shareholders and to facilitate compliance with legal and regulatory requirements and oversight of the fund's activities and associated risks. The Board, acting through its committees, has charged FMR and its affiliates with (i) identifying events or circumstances the occurrence of which could have demonstrably adverse effects on the fund's business and/or reputation; (ii) implementing processes and controls to lessen the possibility that such events or circumstances occur or to mitigate the effects of such events or circumstances if they do occur; and (iii) creating and maintaining a system designed to evaluate continuously business and market conditions in order to facilitate the identification and implementation processes described in (i) and (ii) above. Because the day-to-day operations and activities of the fund are carried out by or through FMR, its affiliates, and other service providers, the fund's exposure to risks is mitigated but not eliminated by the processes overseen by the Trustees. While each of the Board's committees has responsibility for overseeing different aspects of the fund's activities, oversight is exercised primarily through the Operations, Audit, and Compliance Committees. In addition, the Independent Trustees have worked with FMR to enhance the Board's oversight of investment and financial risks, legal and regulatory risks, technology risks, and operational risks, including the development of additional risk reporting to the Board. For example, a working group comprised of Independent Trustees and FMR has worked and continues to work to review the Fidelity® funds' valuation-related activities, reporting and risk management. Appropriate personnel, including but not limited to the fund's Chief Compliance Officer (CCO), FMR's internal auditor, the independent accountants, the fund's Treasurer and portfolio management personnel, make periodic reports to the Board's committees, as appropriate, including an annual review of Fidelity's risk management program for the Fidelity® funds. The responsibilities of each standing committee, including their oversight responsibilities, are described further under "Standing Committees of the Trustees."
Interested Trustees*:
Correspondence intended for a Trustee who is an interested person may be sent to Fidelity Investments, 245 Summer Street, Boston, Massachusetts 02210.
Name, Year of Birth; Principal Occupations and Other Relevant Experience+
James C. Curvey (1935)
Year of Election or Appointment: 2007
Trustee
Chairman of the Board of Trustees
Mr. Curvey also serves as Trustee of other Fidelity® funds. Mr. Curvey is a Director of Fidelity Research & Analysis Co. (investment adviser firm, 2009-present), and Vice Chairman (2007-present) and Director of FMR LLC (diversified financial services company). In addition, Mr. Curvey serves as an Overseer for the Boston Symphony Orchestra and a member of the board of Artis-Naples, Naples, Florida, and as a Trustee for Brewster Academy, Wolfeboro, New Hampshire. Previously, Mr. Curvey served as a Director of Fidelity Investments Money Management, Inc. (investment adviser firm, 2009-2014) and a Director of FMR and FMR Co., Inc. (investment adviser firms, 2007-2014).
Charles S. Morrison (1960)
Year of Election or Appointment: 2014
Trustee
Mr. Morrison also serves as Trustee of other funds. He serves as a Director of Fidelity Investments Money Management, Inc. (FIMM) (investment adviser firm, 2014-present), Director of Fidelity SelectCo, LLC (investment adviser firm, 2014-present), President, Asset Management (2014-present), and is an employee of Fidelity Investments. Previously, Mr. Morrison served as Vice President of Fidelity's Fixed Income and Asset Allocation Funds (2012-2014), President, Fixed Income (2011-2014), Vice President of Fidelity's Money Market Funds (2005-2009), President, Money Market Group Leader of FMR (investment adviser firm, 2009), and Senior Vice President, Money Market Group of FMR (2004-2009). Mr. Morrison also served as Vice President of Fidelity's Bond Funds (2002-2005), certain Balanced Funds (2002-2005), and certain Asset Allocation Funds (2002-2007), and as Senior Vice President (2002-2005) of Fidelity's Bond Division.
* Determined to be an “Interested Trustee” by virtue of, among other things, his or her affiliation with the trust or various entities under common control with FMR.
+ The information includes the Trustee's principal occupation during the last five years and other information relating to the experience, attributes, and skills relevant to the Trustee's qualifications to serve as a Trustee, which led to the conclusion that the Trustee should serve as a Trustee for the fund.
Independent Trustees:
Correspondence intended for an Independent Trustee may be sent to Fidelity Investments, P.O. Box 55235, Boston, Massachusetts 02205-5235.
Name, Year of Birth; Principal Occupations and Other Relevant Experience+
Dennis J. Dirks (1948)
Year of Election or Appointment: 2005
Trustee
Mr. Dirks also serves as Trustee of other Fidelity® funds. Prior to his retirement in May 2003, Mr. Dirks was Chief Operating Officer and a member of the Board of The Depository Trust & Clearing Corporation (DTCC). He also served as President, Chief Operating Officer, and Board member of The Depository Trust Company (DTC) and President and Board member of the National Securities Clearing Corporation (NSCC). In addition, Mr. Dirks served as Chief Executive Officer and Board member of the Government Securities Clearing Corporation, Chief Executive Officer and Board member of the Mortgage-Backed Securities Clearing Corporation, as a Trustee and a member of the Finance Committee of Manhattan College (2005-2008), as a Trustee and a member of the Finance Committee of AHRC of Nassau County (2006-2008), and as a member of the Independent Directors Council (IDC) Governing Council (2010-2015). Mr. Dirks is a member of the Board of Directors for The Brookville Center for Children's Services, Inc. (2009-present).
Alan J. Lacy (1953)
Year of Election or Appointment: 2008
Trustee
Mr. Lacy also serves as Trustee of other Fidelity® funds. Mr. Lacy serves as a member of the Board of Directors of Dave & Buster's Entertainment, Inc. (restaurant and entertainment complexes, 2010-present) and Bristol-Myers Squibb Company (global pharmaceuticals, 2008-present). In addition, Mr. Lacy served as Senior Adviser (2007-2014) of Oak Hill Capital Partners, L.P. (private equity) and also served as Chief Executive Officer (2000-2005) and Vice Chairman (2005-2006) of Sears Holdings Corporation and Sears, Roebuck and Co. (retail). Mr. Lacy is a member of the Board of Trustees of The National Parks Conservation Association (2006-present). Previously, Mr. Lacy served as Chairman of the Board of Trustees of the National Parks Conservation Association (2008-2011) and as a member of the Board of Directors for The Western Union Company (global money transfer, 2006-2011), The Hillman Companies, Inc. (hardware wholesalers, 2010-2014), and Earth Fare, Inc. (retail grocery, 2010-2014).
Ned C. Lautenbach (1944)
Year of Election or Appointment: 2000
Trustee
Chairman of the Independent Trustees
Mr. Lautenbach also serves as Trustee of other Fidelity® funds. Mr. Lautenbach currently serves as the Lead Director of the Eaton Corporation Board of Directors (diversified industrial, 1997-present). Mr. Lautenbach is Chairman of the Board of Directors of Artis-Naples in Naples, Florida (2012-present), a member of the Council on Foreign Relations (1994-present), and a member of the Board of Governors, State University System of Florida (2013-present). Previously, Mr. Lautenbach was a Partner/Advisory Partner at Clayton, Dubilier & Rice, LLC (private equity investment, 1998-2010), as well as a Director of Sony Corporation (2006-2007).
Joseph Mauriello (1944)
Year of Election or Appointment: 2008
Trustee
Mr. Mauriello also serves as Trustee of other Fidelity® funds. Prior to his retirement in January 2006, Mr. Mauriello served in numerous senior management positions including Deputy Chairman and Chief Operating Officer (2004-2005), and Vice Chairman of Financial Services (2002-2004) of KPMG LLP US (professional services, 1965-2005). Mr. Mauriello currently serves as a member of the Board of Directors of XL Group plc. (global insurance and re-insurance, 2006-present) and the Independent Directors Council (IDC) Governing Council (2015-present). Previously, Mr. Mauriello served as a Director of the Hamilton Funds of the Bank of New York (2006-2007) and of Arcadia Resources Inc. (health care services and products, 2007-2012).
Robert W. Selander (1950)
Year of Election or Appointment: 2011
Trustee
Mr. Selander also serves as Trustee of other Fidelity® funds. Mr. Selander serves as a Director of The Western Union Company (global money transfer, 2014-present). Previously, Mr. Selander served as a Member of the Advisory Board of other Fidelity® funds (2011), and Executive Vice Chairman (2010), Chief Executive Officer (2009-2010), and President and Chief Executive Officer (1997-2009) of Mastercard, Inc.
Cornelia M. Small (1944)
Year of Election or Appointment: 2005
Trustee
Ms. Small also serves as Trustee of other Fidelity® funds. Ms. Small is a member of the Board of Directors (2009-present) and Chair of the Investment Committee (2010-present) of the Teagle Foundation. Ms. Small also serves on the Investment Committee of the Berkshire Taconic Community Foundation (2008-present). Previously, Ms. Small served as Chairperson (2002-2008) and a member of the Investment Committee and Chairperson (2008-2012) and a member of the Board of Trustees of Smith College. In addition, Ms. Small served as Chief Investment Officer, Director of Global Equity Investments, and a member of the Board of Directors of Scudder, Stevens & Clark and Scudder Kemper Investments.
William S. Stavropoulos (1939)
Year of Election or Appointment: 2002
Trustee
Vice Chairman of the Independent Trustees
Mr. Stavropoulos also serves as Trustee of other Fidelity® funds. Mr. Stavropoulos serves as President and Founder of the Michigan Baseball Foundation, the Great Lakes Loons (2007-present). Mr. Stavropoulos is Chairman Emeritus of the Board of Directors of The Dow Chemical Company, where he previously served in numerous senior management positions, including President, CEO (1995-2000; 2002-2004), Chairman of the Executive Committee (2000-2006), and as a member of the Board of Directors (1990-2006). Currently, Mr. Stavropoulos is Chairman of the Board of Directors of Univar Inc. (global distributor of commodity and specialty chemicals), a Director of Teradata Corporation (data warehousing and technology solutions), and Maersk Inc. (industrial conglomerate), and a member of the Advisory Board for Metalmark Capital LLC (private equity investment, 2005-present). Mr. Stavropoulos is an operating advisor to Clayton, Dubilier & Rice, LLC (private equity investment). In addition, Mr. Stavropoulos is a member of the University of Notre Dame Advisory Council for the College of Science, a Trustee of the Rollin L. Gerstacker Foundation, and a Director of the Naples Philharmonic Center for the Arts. Previously, Mr. Stavropoulos served as a Director of Chemical Financial Corporation (bank holding company, 1993-2012) and Tyco International, Ltd. (multinational manufacturing and services, 2007-2012).
David M. Thomas (1949)
Year of Election or Appointment: 2008
Trustee
Mr. Thomas also serves as Trustee of other Fidelity® funds. Mr. Thomas serves as Non-Executive Chairman of the Board of Directors of Fortune Brands Home and Security (home and security products, 2011-present), as a member of the Board of Directors (2004-present) and Presiding Director (2013-present) of Interpublic Group of Companies, Inc. (marketing communication), and as a member of the Board of Trustees of the University of Florida (2013-present). Previously, Mr. Thomas served as Executive Chairman (2005-2006) and Chairman and Chief Executive Officer (2000-2005) of IMS Health, Inc. (pharmaceutical and healthcare information solutions), and a Director of Fortune Brands, Inc. (consumer products, 2000-2011).
+ The information includes the Trustee's principal occupation during the last five years and other information relating to the experience, attributes, and skills relevant to the Trustee's qualifications to serve as a Trustee, which led to the conclusion that the Trustee should serve as a Trustee for the fund.
Advisory Board Members and Officers:
Correspondence intended for an officer or Peter S. Lynch may be sent to Fidelity Investments, 245 Summer Street, Boston, Massachusetts 02210. Officers appear below in alphabetical order.
Name, Year of Birth; Principal Occupation
Peter S. Lynch (1944)
Year of Election or Appointment: 2003
Member of the Advisory Board
Mr. Lynch also serves as Member of the Advisory Board of other Fidelity® funds. Mr. Lynch is Vice Chairman and a Director of FMR (investment adviser firm) and FMR Co., Inc. (investment adviser firm). In addition, Mr. Lynch serves as a Trustee of Boston College and as the Chairman of the Inner-City Scholarship Fund. Previously, Mr. Lynch served on the Special Olympics International Board of Directors (1997-2006).
Elizabeth Paige Baumann (1968)
Year of Election or Appointment: 2012
Anti-Money Laundering (AML) Officer
Ms. Baumann also serves as AML Officer of other funds. She is Chief AML Officer of FMR LLC (diversified financial services company, 2012-present) and is an employee of Fidelity Investments. Previously, Ms. Baumann served as Vice President and Deputy Anti-Money Laundering Officer (2007-2012).
Marc R. Bryant (1966)
Year of Election or Appointment: 2015
Secretary and Chief Legal Officer (CLO)
Mr. Bryant also serves as Secretary and CLO of other funds. Mr. Bryant serves as CLO, Secretary, and Senior Vice President of Fidelity Management & Research Company (investment adviser firm, 2015-present) and FMR Co., Inc. (investment adviser firm, 2015-present); Secretary of Fidelity SelectCo, LLC (investment adviser firm, 2015-present) and Fidelity Investments Money Management, Inc. (investment adviser firm, 2015-present); and CLO of Fidelity Management & Research (Hong Kong) Limited (investment adviser firm, 2015-present). He is Senior Vice President and Deputy General Counsel of FMR LLC (diversified financial services company). Previously, Mr. Bryant served as Secretary and CLO of Fidelity Rutland Square Trust II (2010-2014) and Assistant Secretary of Fidelity's Fixed Income and Asset Allocation Funds (2013-2015). Prior to joining Fidelity Investments, Mr. Bryant served as a Senior Vice President and the Head of Global Retail Legal for AllianceBernstein L.P. (2006-2010), and as the General Counsel for ProFund Advisors LLC (2001-2006).
William C. Coffey (1969)
Year of Election or Appointment: 2009
Assistant Secretary
Mr. Coffey also serves as Assistant Secretary of other funds. He is Senior Vice President and Deputy General Counsel of FMR LLC (diversified financial services company, 2010-present), and is an employee of Fidelity Investments. Previously, Mr. Coffey served as Vice President and Associate General Counsel of FMR LLC (2005-2009).
Jonathan Davis (1968)
Year of Election or Appointment: 2010
Assistant Treasurer
Mr. Davis also serves as Assistant Treasurer of other funds, and is an employee of Fidelity Investments. Previously, Mr. Davis served as Vice President and Associate General Counsel of FMR LLC (diversified financial services company, 2003-2010).
Adrien E. Deberghes (1967)
Year of Election or Appointment: 2008
Deputy Treasurer
Mr. Deberghes also serves as an officer of other funds. He is an employee of Fidelity Investments (2008-present). Prior to joining Fidelity Investments, Mr. Deberghes was Senior Vice President of Mutual Fund Administration at State Street Corporation (2007-2008), Senior Director of Mutual Fund Administration at Investors Bank & Trust (2005-2007), and Director of Finance for Dunkin' Brands (2000-2005).
Stephanie J. Dorsey (1969)
Year of Election or Appointment: 2010
Assistant Treasurer
Ms. Dorsey also serves as an officer of other funds. She is an employee of Fidelity Investments (2008-present) and has served in other fund officer roles. Prior to joining Fidelity Investments, Ms. Dorsey served as Treasurer (2004-2008) of the JPMorgan Mutual Funds and Vice President (2004-2008) of JPMorgan Chase Bank.
Howard J. Galligan III (1966)
Year of Election or Appointment: 2014
Chief Financial Officer
Mr. Galligan also serves as Chief Financial Officer of other funds. Mr. Galligan serves as President of Fidelity Pricing and Cash Management Services (FPCMS) (2014-present) and as a Director of Strategic Advisers, Inc. (investment adviser firm, 2008-present). Previously, Mr. Galligan served as Chief Administrative Officer of Asset Management (2011-2014) and Chief Operating Officer and Senior Vice President of Investment Support for Strategic Advisers, Inc. (2003-2011).
Scott C. Goebel (1968)
Year of Election or Appointment: 2015
Vice President
Mr. Goebel serves as Vice President of other funds and is an employee of Fidelity Investments (2001-present). Previously, Mr. Goebel served as Secretary of Fidelity SelectCo, LLC (investment adviser firm, 2013-2015), Fidelity Investments Money Management, Inc. (FIMM) (investment adviser firm, 2010-2015), and Fidelity Research and Analysis Company (FRAC) (investment adviser firm, 2010-2015); General Counsel, Secretary, and Senior Vice President of Fidelity Management & Research Company (investment adviser firm, 2008-2015) and FMR Co., Inc. (investment adviser firm, 2008-2015); Assistant Secretary of Fidelity Management & Research (Japan) Limited (investment adviser firm, 2008-2015) and FMR Investment Management (U.K.) Limited (investment adviser firm, 2008-2015); Chief Legal Officer (CLO) of Fidelity Management & Research (Hong Kong) Limited (investment adviser firm, 2008-2015); Secretary and CLO of certain Fidelity® funds (2008-2015); Assistant Secretary of FIMM (2008-2010), FRAC (2008-2010), and certain funds (2007-2008); and as Vice President and Secretary of Fidelity Distributors Corporation (FDC) (2005-2007).
Brian B. Hogan (1964)
Year of Election or Appointment: 2009
Vice President
Mr. Hogan also serves as Trustee or Vice President of other funds. Mr. Hogan serves as a Director of Fidelity SelectCo, LLC (investment adviser firm, 2014-present) and President of the Equity Division of FMR (investment adviser firm, 2009-present). Previously, Mr. Hogan served as Senior Vice President, Equity Research of FMR (2006-2009) and as a portfolio manager.
Chris Maher (1972)
Year of Election or Appointment: 2013
Assistant Treasurer
Mr. Maher serves as Assistant Treasurer of other funds. Mr. Maher is Vice President of Valuation Oversight and is an employee of Fidelity Investments. Previously, Mr. Maher served as Vice President of Asset Management Compliance (2013), Vice President of the Program Management Group of FMR (investment adviser firm, 2010-2013), and Vice President of Valuation Oversight (2008-2010).
Melissa M. Reilly (1971)
Year of Election or Appointment: 2014
Vice President of certain Equity Funds
Ms. Reilly also serves as Vice President of other funds. Ms. Reilly is an employee of Fidelity Investments (2004-present).
Kenneth B. Robins (1969)
Year of Election or Appointment: 2008
President and Treasurer
Mr. Robins also serves as an officer of other funds. Mr. Robins serves as Executive Vice President of Fidelity Investments Money Management, Inc. (FIMM) (investment adviser firm, 2013-present) and is an employee of Fidelity Investments (2004-present). Previously, Mr. Robins served in other fund officer roles.
Stacie M. Smith (1974)
Year of Election or Appointment: 2013
Deputy Treasurer
Ms. Smith also serves as an officer of other funds. She is an employee of Fidelity Investments (2009-present) and has served in other fund officer roles. Prior to joining Fidelity Investments, Ms. Smith served as Senior Audit Manager of Ernst & Young LLP (1996-2009).
Renee Stagnone (1975)
Year of Election or Appointment: 2013
Deputy Treasurer
Ms. Stagnone also serves as Deputy Treasurer of other funds. Ms. Stagnone is an employee of Fidelity Investments (1997-present).
Linda J. Wondrack (1964)
Year of Election or Appointment: 2014
Chief Compliance Officer
Ms. Wondrack also serves as Chief Compliance Officer of other funds. Ms. Wondrack is Executive Vice President and head of the Ethics Office and Asset Management Compliance for Fidelity Investments (2012-present). Ms. Wondrack also serves as Chief Compliance Officer of Fidelity SelectCo, LLC (investment adviser firm, 2014-present); Chief Compliance Officer of Impresa Management LLC (2013-present); and Chief Compliance Officer of FMR Co., Inc. (investment adviser firm), Fidelity Investments Money Management, Inc. (investment adviser firm), Fidelity Management & Research (Japan) Limited (investment adviser firm), FMR Investment Management (U.K.) Limited (investment adviser firm), Fidelity Management & Research (Hong Kong) (investment adviser firm), Fidelity Management & Research Company (investment adviser firm), FIAM LLC (investment adviser firm), and Strategic Advisers, Inc. (investment adviser firm), Ballyrock Investment Advisors LLC, and Northern Neck Investors LLC (2012-present). Previously, Ms. Wondrack served as Senior Vice President and Chief Compliance Officer for Columbia Management Investment Advisers, LLC (2005-2012); Chief Compliance Officer for certain funds within the Columbia Family of Funds (2007-2012); and Senior Vice President of Compliance Risk Management at Bank of America (2005-2010).
Joseph F. Zambello (1957)
Year of Election or Appointment: 2011
Deputy Treasurer
Mr. Zambello also serves as Deputy Treasurer of other funds. Mr. Zambello is an employee of Fidelity Investments (1991-present). Previously, Mr. Zambello served as Vice President of the Program Management Group of FMR (investment adviser firm, 2009-2011) and Vice President of the Transfer Agent Oversight Group (2005-2009).
Shareholder Expense Example
As a shareholder of the Fund, you incur two types of costs: (1) transaction costs, including sales charges (loads) on purchase payments or redemption proceeds, and (2) ongoing costs, including management fees, distribution and/or service (12b-1) fees and other Fund expenses. This Example is intended to help you understand your ongoing costs (in dollars) of investing in the Fund and to compare these costs with the ongoing costs of investing in other mutual funds.
The Example is based on an investment of $1,000 invested at the beginning of the period and held for the entire period (June 1, 2015 to November 30, 2015).
Actual Expenses
The first line of the accompanying table for each class of the Fund provides information about actual account values and actual expenses. You may use the information in this line, together with the amount you invested, to estimate the expenses that you paid over the period. Simply divide your account value by $1,000.00 (for example, an $8,600 account value divided by $1,000.00 = 8.6), then multiply the result by the number in the first line for a class of the Fund under the heading entitled "Expenses Paid During Period" to estimate the expenses you paid on your account during this period. In addition, the Fund, as a shareholder in the underlying Fidelity Central Funds, will indirectly bear its pro-rata share of the fees and expenses incurred by the underlying Fidelity Central Funds. These fees and expenses are not included in the Fund's annualized expense ratio used to calculate the expense estimate in the table below.
Hypothetical Example for Comparison Purposes
The second line of the accompanying table for each class of the Fund provides information about hypothetical account values and hypothetical expenses based on a Class' actual expense ratio and an assumed rate of return of 5% per year before expenses, which is not the Class' actual return. The hypothetical account values and expenses may not be used to estimate the actual ending account balance or expenses you paid for the period. You may use this information to compare the ongoing costs of investing in the Fund and other funds. To do so, compare this 5% hypothetical example with the 5% hypothetical examples that appear in the shareholder reports of the other funds. In addition, the Fund, as a shareholder in the underlying Fidelity Central Funds, will indirectly bear its pro-rata share of the fees and expenses incurred by the underlying Fidelity Central Funds. These fees and expenses are not included in the Fund's annualized expense ratio used to calculate the expense estimate in the table below.
Please note that the expenses shown in the table are meant to highlight your ongoing costs only and do not reflect any transaction costs. Therefore, the second line of the table is useful in comparing ongoing costs only, and will not help you determine the relative total costs of owning different funds. In addition, if these transactional costs were included, your costs would have been higher.
| Annualized Expense Ratio-A | Beginning Account Value June 1, 2015 | Ending Account Value November 30, 2015 | Expenses Paid During Period-B June 1, 2015 to November 30, 2015 | |
| Class A | 1.04% | |||
| Actual | $1,000.00 | $1,000.90 | $5.22 | |
| Hypothetical-C | $1,000.00 | $1,019.85 | $5.27 | |
| Class T | 1.27% | |||
| Actual | $1,000.00 | $999.70 | $6.37 | |
| Hypothetical-C | $1,000.00 | $1,018.70 | $6.43 | |
| Class B | 1.89% | |||
| Actual | $1,000.00 | $996.70 | $9.46 | |
| Hypothetical-C | $1,000.00 | $1,015.59 | $9.55 | |
| Class C | 1.79% | |||
| Actual | $1,000.00 | $997.20 | $8.96 | |
| Hypothetical-C | $1,000.00 | $1,016.09 | $9.05 | |
| Class I | .76% | |||
| Actual | $1,000.00 | $1,002.30 | $3.81 | |
| Hypothetical-C | $1,000.00 | $1,021.26 | $3.85 | |
| Class Z | .64% | |||
| Actual | $1,000.00 | $1,002.90 | $3.21 | |
| Hypothetical-C | $1,000.00 | $1,021.86 | $3.24 |
A Annualized expense ratio reflects expenses net of applicable fee waivers.
B Expenses are equal to each Class' annualized expense ratio, multiplied by the average account value over the period, multiplied by 183/365 (to reflect the one-half year period).
C 5% return per year before expenses
Distributions (Unaudited)
The Board of Trustees of Fidelity Advisor Growth Opportunities Fund voted to pay to shareholders of record at the opening of business on record date, the following distributions per share derived from capital gains realized from sales of portfolio securities:
| Pay Date | Record Date | Capital Gains | ||
| Class I | 12/07/15 | 12/04/15 | $6.636 | |
| 01/11/16 | 01/08/16 | $0.605 |
The fund hereby designates as a capital gain dividend with respect to the taxable year ended November 30, 2015, $404,021,582, or, if subsequently determined to be different, the net capital gain of such year.
The fund will notify shareholders in January 2016 of amounts for use in preparing 2015 income tax returns.
Board Approval of Investment Advisory Contracts and Management Fees
Fidelity Advisor Growth Opportunities Fund
Each year, the Board of Trustees, including the Independent Trustees (together, the Board), votes on the renewal of the management contract with Fidelity Management & Research Company (FMR) and the sub-advisory agreements (together, the Advisory Contracts) for the fund. The Board, assisted by the advice of fund counsel and Independent Trustees' counsel, requests and considers a broad range of information relevant to the renewal of the Advisory Contracts throughout the year.
The Board meets regularly and, at each of its meetings, covers an extensive agenda of topics and materials and considers factors that are relevant to its annual consideration of the renewal of the fund's Advisory Contracts, including the services and support provided to the fund and its shareholders. The Board has established various standing committees (Committees), each composed of and chaired by Independent Trustees with varying backgrounds, to which the Board has assigned specific subject matter responsibilities in order to enhance effective decision-making by the Board. The Board, acting directly and through its Committees, requests and receives information concerning the annual consideration of the renewal of the fund's Advisory Contracts. The Board also meets as needed to consider matters specifically related to the Board's annual consideration of the renewal of the Advisory Contracts. Members of the Board may also meet with trustees of other Fidelity funds through ad hoc joint committees to discuss certain matters relevant to all of the Fidelity funds.
At its July 2015 meeting, the Board unanimously determined to renew the fund's Advisory Contracts. In reaching its determination, the Board considered all factors it believed relevant, including (i) the nature, extent, and quality of the services to be provided to the fund and its shareholders (including the investment performance of the fund); (ii) the competitiveness of the fund's management fee and total expense ratio relative to peer funds; (iii) the total costs of the services to be provided by and the profits to be realized by Fidelity from its relationship with the fund; and (iv) the extent to which (if any) economies of scale exist and would be realized as the fund grows, and whether any economies of scale are appropriately shared with fund shareholders.
In considering whether to renew the Advisory Contracts for the fund, the Board reached a determination, with the assistance of fund counsel and Independent Trustees' counsel and through the exercise of its business judgment, that the renewal of the Advisory Contracts was in the best interests of the fund and its shareholders and that the compensation payable under the Advisory Contracts was fair and reasonable. The Board's decision to renew the Advisory Contracts was not based on any single factor, but rather was based on a comprehensive consideration of all the information provided to the Board at its meetings throughout the year. The Board, in reaching its determination to renew the Advisory Contracts, was aware that shareholders of the fund have a broad range of investment choices available to them, including a wide choice among funds offered by Fidelity's competitors, and that the fund's shareholders, who have the opportunity to review and weigh the disclosure provided by the fund in its prospectus and other public disclosures, have chosen to invest in this fund, which is part of the Fidelity family of funds.
Nature, Extent, and Quality of Services Provided. The Board considered Fidelity's staffing as it relates to the fund, including the backgrounds of investment personnel of Fidelity, and also considered the fund's investment objective, strategies, and related investment philosophy. The Independent Trustees also had discussions with senior management of Fidelity's investment operations and investment groups. The Board considered the structure of the portfolio manager compensation program and whether this structure provides appropriate incentives to act in the best interests of the fund. Additionally, the Board considered the portfolio managers' investments, if any, in the funds that they manage.Resources Dedicated to Investment Management and Support Services. The Board and the Fund Oversight and Research Committees reviewed the general qualifications and capabilities of Fidelity's investment staff, including its size, education, experience, and resources, as well as Fidelity's approach to recruiting, training, managing, and compensating investment personnel. The Board noted that Fidelity has continued to increase the resources devoted to non-U.S. offices, including expansion of Fidelity's global investment organization. The Board also noted that Fidelity's analysts have extensive resources, tools and capabilities that allow them to conduct sophisticated quantitative and fundamental analysis, as well as credit analysis of issuers, counterparties and guarantors. Further, the Board considered that Fidelity's investment professionals have sufficient access to global information and data so as to provide competitive investment results over time, and that those professionals also have access to sophisticated tools that permit them to assess portfolio construction and risk and performance attribution characteristics continuously, as well as to transmit new information and research conclusions rapidly around the world. Additionally, in its deliberations, the Board considered Fidelity's trading, risk management, and compliance capabilities and resources, which are integral parts of the investment management process.Shareholder and Administrative Services. The Board considered (i) the nature, extent, quality, and cost of advisory, administrative, and shareholder services performed by FMR, the sub-advisers (together with FMR, the Investment Advisers), and their affiliates under the Advisory Contracts and under separate agreements covering transfer agency, pricing and bookkeeping, and securities lending services for the fund; (ii) the nature and extent of the supervision of third party service providers, principally custodians and subcustodians; and (iii) the resources devoted to, and the record of compliance with, the fund's compliance policies and procedures. The Board also reviewed the allocation of fund brokerage, including allocations to brokers affiliated with the Investment Advisers, the use of brokerage commissions to pay fund expenses, and the use of "soft" commission dollars to pay for research services.The Board noted that the growth of fund assets over time across the complex allows Fidelity to reinvest in the development of services designed to enhance the value or convenience of the Fidelity funds as investment vehicles. These services include 24-hour access to account information and market information through telephone representatives and over the Internet, investor education materials and asset allocation tools, and the expanded availability of Fidelity Investor Centers.In 2014, the Board formed an ad hoc Committee on Transfer Agency Fees to review the variety of transfer agency fee structures throughout the industry and Fidelity's competitive positioning with respect to industry participants.Investment in a Large Fund Family. The Board considered the benefits to shareholders of investing in a Fidelity fund, including the benefits of investing in a fund that is part of a large family of funds offering a variety of investment disciplines and providing a large variety of mutual fund investor services. The Board noted that Fidelity had taken, or had made recommendations that resulted in the Fidelity funds taking, a number of actions over the previous year that benefited particular funds, including (i) continuing to dedicate additional resources to investment research and to the support of the senior management team that oversees asset management; (ii) continuing efforts to enhance Fidelity's global research capabilities; (iii) launching new funds and making other enhancements to meet client needs; (iv) reducing management fees and total expenses for certain index funds and diversified international funds; (v) continuing to launch dedicated lower cost underlying funds to meet portfolio construction needs related to expanding underlying fund options for Fidelity funds of funds, specifically for the Freedom Fund product lines; (vi) rationalizing product lines and gaining increased efficiencies through fund mergers; (vii) launching active fixed-income exchange-traded funds; (viii) continuing to develop, acquire and implement systems and technology to improve services to the funds and information security and to increase efficiency; (ix) implementing investment enhancements to further strengthen Fidelity's target date product line to increase investors' probability of success in achieving their goals; (x) modifying the eligibility criteria for certain share classes to accommodate roll-over assets from employer-sponsored retirement plans; (xi) launching a new Class W of the Freedom Index Funds to attract and retain Fidelity record-kept retirement plan assets; and (xii) implementing changes to Fidelity's money market product line in response to recent money market regulatory reforms.Investment Performance. The Board considered whether the fund has operated in accordance with its investment objective, as well as its record of compliance with its investment restrictions and its performance history. The Board noted that there were portfolio management changes for the fund in October 2012 and March 2015.The Board took into account discussions with representatives of the Investment Advisers about fund investment performance that occur at Board meetings throughout the year. In this regard the Board noted that as part of regularly scheduled fund reviews and other reports to the Board on fund performance, the Board considers annualized return information for the fund, for different time periods, measured against a securities market index ("benchmark index") and a peer group of funds with similar objectives ("peer group"), if any. In its evaluation of fund investment performance, the Board gave particular attention to information indicating changes in performance of certain Fidelity funds for specific time periods and discussed with the Investment Advisers the reasons for any overperformance or underperformance.In addition to reviewing absolute and relative fund performance, the Independent Trustees periodically consider the appropriateness of fund performance metrics in evaluating the results achieved. In general, the Independent Trustees believe that fund performance should be evaluated based on net performance (after fees and expenses) of both the highest performing and lowest performing fund share classes, where applicable, compared to appropriate benchmark indices, over appropriate time periods that may include full market cycles, and compared to peer groups, as applicable, over the same periods, taking into account relevant factors including the following: general market conditions; issuer-specific information; and fund cash flows and other factors.The Independent Trustees recognize that shareholders evaluate performance on a net basis over their own holding periods, for which one-, three-, and five-year periods are often used as a proxy. For this reason, the performance information reviewed by the Board also included net cumulative calendar year total return information for the fund and an appropriate benchmark index and peer group for the most recent one-, three-, and five-year periods, as shown below. Returns are shown compared to the 25th percentile (top of box, 75% beaten) and 75th percentile (bottom of box, 25% beaten) of the peer universe.Fidelity Advisor Growth Opportunities Fund
Fidelity Advisor Growth Opportunities Fund
![]()
GOI-ANN-0116
1.539096.118
Fidelity Advisor® Equity Income Fund Class I (formerly Institutional Class) Annual Report November 30, 2015 |
|
Contents
Board Approval of Investment Advisory Contracts and Management Fees |
To view a fund's proxy voting guidelines and proxy voting record for the 12-month period ended June 30, visit http://www.fidelity.com/proxyvotingresults or visit the Securities and Exchange Commission's (SEC) web site at http://www.sec.gov.
You may also call 1-877-208-0098 to request a free copy of the proxy voting guidelines.
Standard & Poor's, S&P and S&P 500 are registered service marks of The McGraw-Hill Companies, Inc. and have been licensed for use by Fidelity Distributors Corporation.
Other third-party marks appearing herein are the property of their respective owners.
All other marks appearing herein are registered or unregistered trademarks or service marks of FMR LLC or an affiliated company. © 2016 FMR LLC. All rights reserved.
This report and the financial statements contained herein are submitted for the general information of the shareholders of the Fund. This report is not authorized for distribution to prospective investors in the Fund unless preceded or accompanied by an effective prospectus.
A fund files its complete schedule of portfolio holdings with the SEC for the first and third quarters of each fiscal year on Form N-Q. Forms N-Q are available on the SEC’s web site at http://www.sec.gov. A fund's Forms N-Q may be reviewed and copied at the SEC’s Public Reference Room in Washington, DC. Information regarding the operation of the SEC's Public Reference Room may be obtained by calling 1-800-SEC-0330.
For a complete list of a fund's portfolio holdings, view the most recent holdings listing, semiannual report, or annual report on Fidelity's web site at http://www.fidelity.com, http://www.advisor.fidelity.com, or http://www.401k.com, as applicable.
NOT FDIC INSURED •MAY LOSE VALUE •NO BANK GUARANTEE
Neither the Fund nor Fidelity Distributors Corporation is a bank.
Performance: The Bottom Line
Average annual total return reflects the change in the value of an investment, assuming reinvestment of distributions from dividend income and capital gains (the profits earned upon the sale of securities that have grown in value, if any) and assuming a constant rate of performance each year.
The hypothetical investment and the average annual total returns do not reflect the deduction of taxes that a shareholder would pay on fund distributions or the redemption of fund shares.
During periods of reimbursement by Fidelity, a fund’s total return will be greater than it would be had the reimbursement not occurred.
How a fund did yesterday is no guarantee of how it will do tomorrow.
Average Annual Total Returns
| For the periods ended November 30, 2015 | Past 1 year | Past 5 years | Past 10 years |
| Class I | (3.37)% | 11.69% | 5.09% |
$10,000 Over 10 Years
Let's say hypothetically that $10,000 was invested in Fidelity Advisor® Equity Income Fund - Class I on November 30, 2005.
The chart shows how the value of your investment would have changed, and also shows how the Russell 3000® Value Index performed over the same period.

| Period Ending Values | ||
| $16,427 | Fidelity Advisor® Equity Income Fund - Class I | |
| $18,627 | Russell 3000® Value Index | |
Management's Discussion of Fund Performance
Market Recap: U.S. stocks gained modestly for the 12 months ending November 30, 2015, despite a steep decline in August and September on concern about slowing economic growth in China. The S&P 500® index rebounded in October and gained 2.75% for the year. Stocks benefited late in the period amid waning expectations for a near-term interest-rate hike by the U.S. Federal Reserve, more economic stimulus in Europe and an interest-rate cut in China. Growth stocks in the benchmark far outpaced their value counterparts, as investors continued to seek growth in a subpar economic environment. Sector performance varied widely, with more than 26 percentage points separating the leader from the laggard. Consumer discretionary (+14%) secured the top spot, benefiting from a combination of rising personal income and still-benign inflation. Information technology (+7%) and health care (+4%) also outpaced the broad market. Conversely, the energy sector (-12%) performed worst, stymied by depressed commodity prices that also hit materials (-5%). Telecommunication services (-5%) and utilities (-4%), considered defensive sectors less sensitive to the economy, also lost ground. At period end, investors remained focused on the potential global implications of a stronger U.S. dollar and how China’s transition toward a consumption-led economy may affect corporate earnings.Comments from Portfolio Manager James Morrow: For the year, fund’s share classes (excluding sales charges, if applicable) struggled to low-single-digit declines, significantly trailing the -1.01% return of the benchmark Russell 3000® Value Index. The fund was hurt most by poor stock picking in the energy and materials sectors, especially master limited partnership Williams Partners and its majority-owner, energy transportation company Williams Companies. Both of these non-benchmark entities were hard hit by upheaval in the energy business. CONSOL Energy, a producer of coal and natural gas, also detracted. Despite the multiple challenges we saw in energy, the fund benefited from largely avoiding Exxon Mobil and not owning ConocoPhillips, two integrated energy firms whose risk/reward trade-off struck me as less attractive than others. In contrast, JPMorgan Chase, among the fund’s largest holdings and a notable overweighting, contributed meaningfully. I saw JPMorgan as a relatively inexpensive stock in an increasingly expensive market. The fund also was helped by a position in Chubb, a provider of property and casualty insurance. During the period, insurance company ACE Limited agreed to acquire Chubb for a significant premium. Although I did not anticipate this event, I’m not surprised that a buyer emerged for a company I, too, found to be a very well-priced company.The views expressed above reflect those of the portfolio manager(s) only through the end of the period as stated on the cover of this report and do not necessarily represent the views of Fidelity or any other person in the Fidelity organization. Any such views are subject to change at any time based upon market or other conditions and Fidelity disclaims any responsibility to update such views. These views may not be relied on as investment advice and, because investment decisions for a Fidelity fund are based on numerous factors, may not be relied on as an indication of trading intent on behalf of any Fidelity fund.
Investment Summary (Unaudited)
Top Ten Stocks as of November 30, 2015
| % of fund's net assets | % of fund's net assets 6 months ago | |
| Johnson & Johnson | 5.4 | 4.3 |
| General Electric Co.(a) | 3.9 | 3.8 |
| Chevron Corp. | 3.7 | 2.8 |
| JPMorgan Chase & Co. | 3.3 | 4.5 |
| Procter & Gamble Co. | 3.1 | 2.4 |
| United Parcel Service, Inc. Class B(a) | 2.5 | 2.1 |
| AT&T, Inc. | 2.0 | 1.3 |
| Cisco Systems, Inc. | 1.9 | 2.0 |
| MetLife, Inc. | 1.8 | 1.5 |
| Verizon Communications, Inc. | 1.8 | 1.7 |
| 29.4 |
(a) Security or a portion of the security is pledged as collateral for call options written.
Top Five Market Sectors as of November 30, 2015
| % of fund's net assets | % of fund's net assets 6 months ago | |
| Financials | 24.8 | 27.4 |
| Industrials | 11.8 | 11.8 |
| Information Technology | 11.6 | 12.5 |
| Health Care | 10.4 | 9.9 |
| Energy | 9.8 | 10.2 |
Asset Allocation (% of fund's net assets)
| As of November 30, 2015*,** | ||
| Stocks | 94.7% | |
| Bonds | 0.1% | |
| Convertible Securities | 0.6% | |
| Other Investments | 0.1% | |
| Short-Term Investments and Net Other Assets (Liabilities) | 4.5% | |

* Foreign investments - 9.1%
** Written options - (0.1)%
| As of May 31, 2015*,** | ||
| Stocks | 93.8% | |
| Bonds | 0.2% | |
| Convertible Securities | 1.5% | |
| Other Investments | 0.1% | |
| Short-Term Investments and Net Other Assets (Liabilities) | 4.4% | |

* Written options - 0.0%
** Foreign investments - 10.4%
Investments November 30, 2015
Showing Percentage of Net Assets
| Common Stocks - 94.5% | |||
| Shares | Value (000s) | ||
| CONSUMER DISCRETIONARY - 7.7% | |||
| Automobiles - 1.1% | |||
| General Motors Co. | 620,600 | $22,466 | |
| Hotels, Restaurants & Leisure - 1.3% | |||
| Compass Group PLC | 13,500 | 235 | |
| Dunkin' Brands Group, Inc. (a) | 119,400 | 5,065 | |
| McDonald's Corp. (b) | 131,417 | 15,003 | |
| Whitbread PLC | 15,604 | 1,069 | |
| Yum! Brands, Inc. (b) | 90,721 | 6,578 | |
| 27,950 | |||
| Household Durables - 0.6% | |||
| M.D.C. Holdings, Inc. | 185,600 | 4,868 | |
| Tupperware Brands Corp. | 149,800 | 8,504 | |
| 13,372 | |||
| Leisure Products - 0.9% | |||
| Mattel, Inc. (a) | 422,600 | 10,506 | |
| New Academy Holding Co. LLC unit (c)(d)(e) | 52,800 | 7,983 | |
| 18,489 | |||
| Media - 1.6% | |||
| Comcast Corp. Class A | 487,374 | 29,662 | |
| Time Warner, Inc. | 60,800 | 4,255 | |
| 33,917 | |||
| Multiline Retail - 1.6% | |||
| Kohl's Corp. | 97,648 | 4,602 | |
| Macy's, Inc. | 185,100 | 7,234 | |
| Target Corp. | 316,955 | 22,979 | |
| 34,815 | |||
| Specialty Retail - 0.6% | |||
| Foot Locker, Inc. | 97,100 | 6,312 | |
| GNC Holdings, Inc. | 167,000 | 4,978 | |
| Stage Stores, Inc. (a) | 284,361 | 2,201 | |
| 13,491 | |||
| TOTAL CONSUMER DISCRETIONARY | 164,500 | ||
| CONSUMER STAPLES - 8.8% | |||
| Beverages - 1.7% | |||
| Anheuser-Busch InBev SA NV ADR | 53,000 | 6,808 | |
| Molson Coors Brewing Co. Class B (b) | 93,505 | 8,605 | |
| The Coca-Cola Co. | 480,200 | 20,466 | |
| 35,879 | |||
| Food & Staples Retailing - 2.7% | |||
| CVS Health Corp. | 324,000 | 30,485 | |
| Tesco PLC | 677,700 | 1,705 | |
| Wal-Mart Stores, Inc. | 251,850 | 14,819 | |
| Walgreens Boots Alliance, Inc. | 98,744 | 8,297 | |
| Whole Foods Market, Inc. | 91,200 | 2,658 | |
| 57,964 | |||
| Food Products - 1.1% | |||
| B&G Foods, Inc. Class A | 136,354 | 5,151 | |
| Sanderson Farms, Inc. (a) | 35,200 | 2,633 | |
| The Hershey Co. (b) | 196,900 | 16,994 | |
| 24,778 | |||
| Household Products - 3.1% | |||
| Procter & Gamble Co. | 888,617 | 66,504 | |
| Personal Products - 0.2% | |||
| Avon Products, Inc. (a) | 1,151,900 | 3,974 | |
| TOTAL CONSUMER STAPLES | 189,099 | ||
| ENERGY - 9.6% | |||
| Energy Equipment & Services - 0.4% | |||
| Ensco PLC Class A | 243,224 | 4,164 | |
| National Oilwell Varco, Inc. | 73,949 | 2,761 | |
| Oceaneering International, Inc. | 63,100 | 2,760 | |
| 9,685 | |||
| Oil, Gas & Consumable Fuels - 9.2% | |||
| Anadarko Petroleum Corp. | 100,545 | 6,023 | |
| Apache Corp. | 258,227 | 12,700 | |
| Avance Gas Holding Ltd. (a) | 179,455 | 2,437 | |
| BW LPG Ltd. | 350,634 | 3,026 | |
| Cameco Corp. | 123,900 | 1,514 | |
| Chevron Corp. | 875,869 | 79,984 | |
| CONSOL Energy, Inc. (a) | 320,375 | 2,525 | |
| Foresight Energy LP (a) | 257,600 | 1,108 | |
| Golar LNG Ltd. | 68,300 | 1,868 | |
| Imperial Oil Ltd. | 48,000 | 1,559 | |
| Kinder Morgan, Inc. | 359,300 | 8,469 | |
| Legacy Reserves LP | 505,299 | 1,577 | |
| Markwest Energy Partners LP | 235,991 | 11,328 | |
| Noble Energy, Inc. | 138,200 | 5,068 | |
| Suncor Energy, Inc. | 795,700 | 21,986 | |
| The Williams Companies, Inc. | 555,950 | 20,326 | |
| Williams Partners LP | 547,815 | 15,021 | |
| 196,519 | |||
| TOTAL ENERGY | 206,204 | ||
| FINANCIALS - 24.6% | |||
| Banks - 11.4% | |||
| Bank of America Corp. | 1,549,400 | 27,006 | |
| BB&T Corp. | 26,700 | 1,031 | |
| Comerica, Inc. | 232,180 | 10,762 | |
| First Niagara Financial Group, Inc. | 724,200 | 7,807 | |
| FirstMerit Corp. | 348,340 | 7,047 | |
| JPMorgan Chase & Co. | 1,055,557 | 70,385 | |
| KeyCorp | 533,000 | 6,988 | |
| Lloyds Banking Group PLC | 1,703,700 | 1,871 | |
| M&T Bank Corp. | 245,517 | 30,771 | |
| Regions Financial Corp. | 1,332,300 | 13,510 | |
| Standard Chartered PLC: | |||
| rights 12/10/15 (d) | 116,110 | 159 | |
| (United Kingdom) | 406,386 | 3,410 | |
| SunTrust Banks, Inc. | 373,100 | 16,200 | |
| U.S. Bancorp | 452,700 | 19,869 | |
| Wells Fargo & Co. (b) | 486,550 | 26,809 | |
| 243,625 | |||
| Capital Markets - 5.5% | |||
| Apollo Global Management LLC Class A | 35,500 | 580 | |
| Apollo Investment Corp. (a) | 790,757 | 5,021 | |
| Ares Capital Corp. | 375,042 | 5,933 | |
| Ares Management LP | 170,880 | 2,404 | |
| KKR & Co. LP | 1,844,596 | 31,192 | |
| Morgan Stanley | 231,342 | 7,935 | |
| PJT Partners, Inc. (d) | 27,955 | 655 | |
| State Street Corp. | 356,899 | 25,904 | |
| The Blackstone Group LP | 1,141,703 | 35,655 | |
| TPG Specialty Lending, Inc. | 143,100 | 2,463 | |
| 117,742 | |||
| Consumer Finance - 0.4% | |||
| Synchrony Financial (d) | 251,257 | 7,998 | |
| Insurance - 4.8% | |||
| ACE Ltd. | 105,911 | 12,164 | |
| MetLife, Inc. | 769,857 | 39,332 | |
| Prudential Financial, Inc. | 169,198 | 14,644 | |
| The Chubb Corp. | 213,667 | 27,890 | |
| The Travelers Companies, Inc. | 81,649 | 9,355 | |
| 103,385 | |||
| Real Estate Investment Trusts - 2.3% | |||
| American Capital Agency Corp. | 213,080 | 3,825 | |
| American Tower Corp. | 11,800 | 1,173 | |
| Annaly Capital Management, Inc. | 402,294 | 3,854 | |
| Care Capital Properties, Inc. | 15,273 | 483 | |
| Coresite Realty Corp. | 31,220 | 1,829 | |
| Cousins Properties, Inc. | 356,400 | 3,503 | |
| Crown Castle International Corp. | 77,900 | 6,692 | |
| Duke Realty LP | 294,600 | 5,995 | |
| First Potomac Realty Trust | 452,777 | 5,261 | |
| Piedmont Office Realty Trust, Inc. Class A | 249,935 | 4,871 | |
| Public Storage | 10,600 | 2,545 | |
| Retail Properties America, Inc. | 165,897 | 2,538 | |
| Sabra Health Care REIT, Inc. | 70,700 | 1,462 | |
| Two Harbors Investment Corp. | 301,541 | 2,563 | |
| Ventas, Inc. | 61,094 | 3,259 | |
| 49,853 | |||
| Thrifts & Mortgage Finance - 0.2% | |||
| Radian Group, Inc. | 239,290 | 3,410 | |
| TOTAL FINANCIALS | 526,013 | ||
| HEALTH CARE - 10.3% | |||
| Biotechnology - 1.0% | |||
| AbbVie, Inc. | 119,100 | 6,926 | |
| Amgen, Inc. | 57,949 | 9,336 | |
| Gilead Sciences, Inc. | 50,400 | 5,340 | |
| 21,602 | |||
| Health Care Equipment & Supplies - 1.7% | |||
| DENTSPLY International, Inc. | 81,300 | 4,932 | |
| Medtronic PLC (b) | 369,982 | 27,874 | |
| St. Jude Medical, Inc. | 66,462 | 4,194 | |
| 37,000 | |||
| Health Care Providers & Services - 0.0% | |||
| Anthem, Inc. | 44 | 6 | |
| Pharmaceuticals - 7.6% | |||
| GlaxoSmithKline PLC | 914,000 | 18,575 | |
| Johnson & Johnson | 1,137,318 | 115,136 | |
| Merck & Co., Inc. | 100,700 | 5,338 | |
| Pfizer, Inc. | 240,513 | 7,882 | |
| Sanofi SA | 73,234 | 6,509 | |
| Teva Pharmaceutical Industries Ltd. sponsored ADR | 135,700 | 8,540 | |
| 161,980 | |||
| TOTAL HEALTH CARE | 220,588 | ||
| INDUSTRIALS - 11.8% | |||
| Aerospace & Defense - 2.8% | |||
| General Dynamics Corp. | 52,200 | 7,645 | |
| Raytheon Co. | 71,000 | 8,806 | |
| The Boeing Co. (b) | 124,200 | 18,065 | |
| United Technologies Corp. | 262,907 | 25,252 | |
| 59,768 | |||
| Air Freight & Logistics - 3.0% | |||
| C.H. Robinson Worldwide, Inc. | 80,979 | 5,460 | |
| PostNL NV (d) | 1,871,900 | 6,256 | |
| United Parcel Service, Inc. Class B (b) | 518,790 | 53,441 | |
| 65,157 | |||
| Airlines - 0.2% | |||
| Copa Holdings SA Class A | 82,000 | 4,235 | |
| Commercial Services & Supplies - 0.5% | |||
| KAR Auction Services, Inc. | 215,104 | 8,159 | |
| Republic Services, Inc. | 60,089 | 2,640 | |
| 10,799 | |||
| Electrical Equipment - 1.3% | |||
| Eaton Corp. PLC | 203,500 | 11,836 | |
| Emerson Electric Co. | 299,370 | 14,969 | |
| 26,805 | |||
| Industrial Conglomerates - 3.9% | |||
| General Electric Co. (b) | 2,769,054 | 82,905 | |
| Machinery - 0.1% | |||
| Cummins, Inc. | 26,100 | 2,620 | |
| Professional Services - 0.0% | |||
| Acacia Research Corp. (a) | 153,060 | 905 | |
| TOTAL INDUSTRIALS | 253,194 | ||
| INFORMATION TECHNOLOGY - 11.4% | |||
| Communications Equipment - 2.9% | |||
| Cisco Systems, Inc. | 1,473,353 | 40,149 | |
| QUALCOMM, Inc. | 468,889 | 22,877 | |
| 63,026 | |||
| Electronic Equipment & Components - 0.5% | |||
| Hitachi Ltd. | 536,000 | 3,164 | |
| TE Connectivity Ltd. | 98,930 | 6,637 | |
| 9,801 | |||
| Internet Software & Services - 0.4% | |||
| Yahoo!, Inc. (d) | 278,200 | 9,406 | |
| IT Services - 2.9% | |||
| First Data Corp. | 779,769 | 11,790 | |
| First Data Corp. Class A (d) | 24,000 | 403 | |
| IBM Corp. | 218,423 | 30,453 | |
| Paychex, Inc. (b) | 367,878 | 19,957 | |
| 62,603 | |||
| Semiconductors & Semiconductor Equipment - 1.4% | |||
| Applied Materials, Inc. | 951,877 | 17,867 | |
| Maxim Integrated Products, Inc. | 288,600 | 11,189 | |
| 29,056 | |||
| Software - 0.8% | |||
| Microsoft Corp. (b) | 321,338 | 17,465 | |
| Technology Hardware, Storage & Peripherals - 2.5% | |||
| Apple, Inc. | 187,700 | 22,205 | |
| EMC Corp. | 1,069,300 | 27,096 | |
| Seagate Technology LLC | 103,600 | 3,723 | |
| 53,024 | |||
| TOTAL INFORMATION TECHNOLOGY | 244,381 | ||
| MATERIALS - 1.4% | |||
| Chemicals - 0.6% | |||
| LyondellBasell Industries NV Class A | 60,200 | 5,768 | |
| Potash Corp. of Saskatchewan, Inc. | 291,100 | 5,892 | |
| Syngenta AG sponsored ADR | 4,500 | 333 | |
| Tronox Ltd. Class A | 174,965 | 1,018 | |
| 13,011 | |||
| Containers & Packaging - 0.5% | |||
| Packaging Corp. of America | 89,600 | 6,092 | |
| WestRock Co. | 99,000 | 5,012 | |
| 11,104 | |||
| Metals & Mining - 0.3% | |||
| Freeport-McMoRan, Inc. | 202,514 | 1,657 | |
| Nucor Corp. | 103,100 | 4,273 | |
| 5,930 | |||
| TOTAL MATERIALS | 30,045 | ||
| TELECOMMUNICATION SERVICES - 4.0% | |||
| Diversified Telecommunication Services - 3.9% | |||
| AT&T, Inc. | 1,250,127 | 42,092 | |
| TDC A/S | 226,900 | 1,192 | |
| Verizon Communications, Inc. | 851,590 | 38,705 | |
| 81,989 | |||
| Wireless Telecommunication Services - 0.1% | |||
| KDDI Corp. | 94,900 | 2,354 | |
| TOTAL TELECOMMUNICATION SERVICES | 84,343 | ||
| UTILITIES - 4.9% | |||
| Electric Utilities - 4.7% | |||
| American Electric Power Co., Inc. | 210,515 | 11,791 | |
| Entergy Corp. | 118,500 | 7,896 | |
| Exelon Corp. | 1,108,700 | 30,279 | |
| NextEra Energy, Inc. | 18,986 | 1,896 | |
| PPL Corp. | 658,000 | 22,398 | |
| Southern Co. | 501,525 | 22,338 | |
| Xcel Energy, Inc. | 100,900 | 3,598 | |
| 100,196 | |||
| Multi-Utilities - 0.2% | |||
| CenterPoint Energy, Inc. | 299,400 | 5,075 | |
| TOTAL UTILITIES | 105,271 | ||
| TOTAL COMMON STOCKS | |||
| (Cost $1,902,926) | 2,023,638 | ||
| Preferred Stocks - 0.4% | |||
| Convertible Preferred Stocks - 0.2% | |||
| HEALTH CARE - 0.1% | |||
| Health Care Providers & Services - 0.1% | |||
| AmSurg Corp. Series A-1, 5.25% | 5,900 | 938 | |
| Pharmaceuticals - 0.0% | |||
| Allergan PLC 5.50% | 880 | 922 | |
| TOTAL HEALTH CARE | 1,860 | ||
| TELECOMMUNICATION SERVICES - 0.0% | |||
| Wireless Telecommunication Services - 0.0% | |||
| T-Mobile U.S., Inc. Series A 5.50% | 14,600 | 902 | |
| UTILITIES - 0.1% | |||
| Independent Power and Renewable Electricity Producers - 0.0% | |||
| Dynegy, Inc. 5.375% | 11,400 | 705 | |
| Multi-Utilities - 0.1% | |||
| CenterPoint Energy, Inc. 2.00% ZENS (d) | 12,700 | 752 | |
| TOTAL UTILITIES | 1,457 | ||
| TOTAL CONVERTIBLE PREFERRED STOCKS | 4,219 | ||
| Nonconvertible Preferred Stocks - 0.2% | |||
| CONSUMER DISCRETIONARY - 0.1% | |||
| Automobiles - 0.1% | |||
| Volkswagen AG | 16,608 | 2,302 | |
| FINANCIALS - 0.1% | |||
| Consumer Finance - 0.1% | |||
| Ally Financial, Inc. 7.00% (f) | 2,265 | 2,281 | |
| TOTAL NONCONVERTIBLE PREFERRED STOCKS | 4,583 | ||
| TOTAL PREFERRED STOCKS | |||
| (Cost $9,164) | 8,802 | ||
| Principal Amount (000s)(g) | Value (000s) | ||
| Corporate Bonds - 0.5% | |||
| Convertible Bonds - 0.4% | |||
| CONSUMER DISCRETIONARY - 0.0% | |||
| Household Durables - 0.0% | |||
| Jarden Corp. 1.875% 9/15/18 | 460 | 709 | |
| ENERGY - 0.2% | |||
| Oil, Gas & Consumable Fuels - 0.2% | |||
| Amyris, Inc. 3% 2/27/17 | 516 | 469 | |
| Scorpio Tankers, Inc. 2.375% 7/1/19 (f) | 2,860 | 2,812 | |
| Whiting Petroleum Corp. 1.25% 4/1/20 (f) | 840 | 739 | |
| 4,020 | |||
| INFORMATION TECHNOLOGY - 0.2% | |||
| Communications Equipment - 0.1% | |||
| InterDigital, Inc. 1.5% 3/1/20 (f) | 1,800 | 1,789 | |
| Semiconductors & Semiconductor Equipment - 0.1% | |||
| GT Advanced Technologies, Inc.: | |||
| 3% 10/1/17 (h) | 1,510 | 14 | |
| 3% 12/15/20 (h) | 2,160 | 20 | |
| Micron Technology, Inc. 3.125% 5/1/32 | 450 | 784 | |
| NXP Semiconductors NV 1% 12/1/19 (f) | 910 | 1,051 | |
| 1,869 | |||
| TOTAL INFORMATION TECHNOLOGY | 3,658 | ||
| TOTAL CONVERTIBLE BONDS | 8,387 | ||
| Nonconvertible Bonds - 0.1% | |||
| CONSUMER DISCRETIONARY - 0.1% | |||
| Media - 0.1% | |||
| Altice SA 7.625% 2/15/25 (f) | 1,240 | 1,085 | |
| CONSUMER STAPLES - 0.0% | |||
| Tobacco - 0.0% | |||
| Vector Group Ltd. 7.75% 2/15/21 | 905 | 962 | |
| MATERIALS - 0.0% | |||
| Metals & Mining - 0.0% | |||
| Walter Energy, Inc. 8.5% 4/15/21 (h) | 2,030 | 5 | |
| TOTAL NONCONVERTIBLE BONDS | 2,052 | ||
| TOTAL CORPORATE BONDS | |||
| (Cost $16,967) | 10,439 | ||
| Preferred Securities - 0.1% | |||
| FINANCIALS - 0.1% | |||
| Diversified Financial Services - 0.1% | |||
| Baggot Securities Ltd. 10.24%(f)(i) | |||
| (Cost $1,520) | EUR | 990 | 1,137 |
| Shares | Value (000s) | ||
| Money Market Funds - 5.4% | |||
| Fidelity Cash Central Fund, 0.18% (j) | 92,725,145 | 92,725 | |
| Fidelity Securities Lending Cash Central Fund, 0.22% (j)(k) | 23,547,494 | 23,547 | |
| TOTAL MONEY MARKET FUNDS | |||
| (Cost $116,272) | 116,272 | ||
| TOTAL INVESTMENT PORTFOLIO - 100.9% | |||
| (Cost $2,046,849) | 2,160,288 | ||
| NET OTHER ASSETS (LIABILITIES) - (0.9)% | (19,886) | ||
| NET ASSETS - 100% | $2,140,402 |
| Written Options | ||||
| Expiration Date/Exercise Price | Number of Contracts | Premium (000s) | Value (000s) | |
| Call Options | ||||
| General Electric Co. | 1/15/16 - $31.00 | 9,926 | $303 | $(253) |
| McDonald's Corp. | 1/15/16 - $115.00 | 458 | 83 | (109) |
| Medtronic PLC | 1/15/16 - $77.50 | 1,215 | 229 | (117) |
| Microsoft Corp. | 12/18/15 - $55.00 | 1,366 | 123 | (92) |
| Molson Coors Brewing Co. Class B | 1/15/16 - $100.00 | 305 | 36 | (15) |
| Paychex, Inc. | 12/18/15 - $50.00 | 1,853 | 152 | (788) |
| The Boeing Co. | 1/15/16 - $150.00 | 409 | 157 | (74) |
| The Hershey Co. | 2/19/16 - $90.00 | 646 | 82 | (111) |
| United Parcel Service, Inc. Class B | 1/15/16 - $105.00 | 1,710 | 313 | (255) |
| Wells Fargo & Co. | 1/15/16 - $57.50 | 1,622 | 111 | (74) |
| Yum! Brands, Inc. | 1/15/16 - $75.00 | 293 | 51 | (71) |
| TOTAL WRITTEN OPTIONS | $1,640 | $(1,959) |
Currency Abbreviations
EUR – European Monetary Unit
Legend
(a) Security or a portion of the security is on loan at period end.
(b) Security or a portion of the security is pledged as collateral for call options written. At period end, the value of securities pledged amounted to $104,585,000.
(c) Restricted securities - Investment in securities not registered under the Securities Act of 1933 (excluding 144A issues). At the end of the period, the value of restricted securities (excluding 144A issues) amounted to $7,983,000 or 0.4% of net assets.
(d) Non-income producing
(e) Investment is owned by an entity that is treated as a U.S. Corporation for tax purposes in which the Fund holds a percentage ownership.
(f) Security exempt from registration under Rule 144A of the Securities Act of 1933. These securities may be resold in transactions exempt from registration, normally to qualified institutional buyers. At the end of the period, the value of these securities amounted to $10,894,000 or 0.5% of net assets.
(g) Amount is stated in United States dollars unless otherwise noted.
(h) Non-income producing - Security is in default.
(i) Security is perpetual in nature with no stated maturity date.
(j) Affiliated fund that is generally available only to investment companies and other accounts managed by Fidelity Investments. The rate quoted is the annualized seven-day yield of the fund at period end. A complete unaudited listing of the fund's holdings as of its most recent quarter end is available upon request. In addition, each Fidelity Central Fund's financial statements, which are not covered by the Fund's Report of Independent Registered Public Accounting Firm, are available on the SEC's website or upon request.
(k) Investment made with cash collateral received from securities on loan.
Additional information on each restricted holding is as follows:
| Security | Acquisition Date | Acquisition Cost (000s) |
| New Academy Holding Co. LLC unit | 8/1/11 | $5,565 |
Affiliated Central Funds
Information regarding fiscal year to date income earned by the Fund from investments in Fidelity Central Funds is as follows:
| Fund | Income earned |
| (Amounts in thousands) | |
| Fidelity Cash Central Fund | $126 |
| Fidelity Securities Lending Cash Central Fund | 180 |
| Total | $306 |
Investment Valuation
The following is a summary of the inputs used, as of November 30, 2015, involving the Fund's assets and liabilities carried at fair value. The inputs or methodology used for valuing securities may not be an indication of the risk associated with investing in those securities. For more information on valuation inputs, and their aggregation into the levels used below, please refer to the Investment Valuation section in the accompanying Notes to Financial Statements.
| Valuation Inputs at Reporting Date: | ||||
| Description | Total | Level 1 | Level 2 | Level 3 |
| (Amounts in thousands) | ||||
| Investments in Securities: | ||||
| Equities: | ||||
| Consumer Discretionary | $166,802 | $156,282 | $2,537 | $7,983 |
| Consumer Staples | 189,099 | 187,394 | 1,705 | -- |
| Energy | 206,204 | 206,204 | -- | -- |
| Financials | 528,294 | 524,142 | 4,152 | -- |
| Health Care | 222,448 | 196,426 | 26,022 | -- |
| Industrials | 253,194 | 253,194 | -- | -- |
| Information Technology | 244,381 | 232,591 | 11,790 | -- |
| Materials | 30,045 | 30,045 | -- | -- |
| Telecommunication Services | 85,245 | 82,891 | 2,354 | -- |
| Utilities | 106,728 | 105,976 | 752 | -- |
| Corporate Bonds | 10,439 | -- | 10,439 | -- |
| Preferred Securities | 1,137 | -- | 1,137 | -- |
| Money Market Funds | 116,272 | 116,272 | -- | -- |
| Total Investments in Securities: | $2,160,288 | $2,091,417 | $60,888 | $7,983 |
| Derivative Instruments: | ||||
| Liabilities | ||||
| Written Options | $(1,959) | $(1,959) | $-- | $-- |
| Total Liabilities | $(1,959) | $(1,959) | $-- | $-- |
| Total Derivative Instruments: | $(1,959) | $(1,959) | $-- | $-- |
Value of Derivative Instruments
The following table is a summary of the Fund's value of derivative instruments by primary risk exposure as of November 30, 2015. For additional information on derivative instruments, please refer to the Derivative Instruments section in the accompanying Notes to Financial Statements.
| Primary Risk Exposure / Derivative Type | Value | |
| (Amounts in thousands) | Asset | Liability |
| Equity Risk | ||
| Written Options(a) | $0 | $(1,959) |
| Total Equity Risk | $0 | $(1,959) |
| Total Value of Derivatives | $0 | $(1,959) |
(a) Gross value is presented in the Statement of Assets and Liabilities in the written options, at value line-item.
See accompanying notes which are an integral part of the financial statements.
Financial Statements
Statement of Assets and Liabilities
| Amounts in thousands (except per-share amounts) | November 30, 2015 | |
| Assets | ||
| Investment in securities, at value (including securities loaned of $23,187) — See accompanying schedule: Unaffiliated issuers (cost $1,930,577) | $2,044,016 | |
| Fidelity Central Funds (cost $116,272) | 116,272 | |
| Total Investments (cost $2,046,849) | $2,160,288 | |
| Receivable for investments sold | 3,887 | |
| Receivable for fund shares sold | 674 | |
| Dividends receivable | 7,838 | |
| Interest receivable | 85 | |
| Distributions receivable from Fidelity Central Funds | 33 | |
| Prepaid expenses | 6 | |
| Other receivables | 106 | |
| Total assets | 2,172,917 | |
| Liabilities | ||
| Payable to custodian bank | $6 | |
| Payable for investments purchased | 90 | |
| Payable for fund shares redeemed | 4,887 | |
| Accrued management fee | 808 | |
| Distribution and service plan fees payable | 652 | |
| Written options, at value (premium received $1,640) | 1,959 | |
| Other affiliated payables | 416 | |
| Other payables and accrued expenses | 150 | |
| Collateral on securities loaned, at value | 23,547 | |
| Total liabilities | 32,515 | |
| Net Assets | $2,140,402 | |
| Net Assets consist of: | ||
| Paid in capital | $1,867,306 | |
| Undistributed net investment income | 16,088 | |
| Accumulated undistributed net realized gain (loss) on investments and foreign currency transactions | 143,904 | |
| Net unrealized appreciation (depreciation) on investments and assets and liabilities in foreign currencies | 113,104 | |
| Net Assets | $2,140,402 | |
| Calculation of Maximum Offering Price | ||
| Class A: | ||
| Net Asset Value and redemption price per share ($687,822 ÷ 22,116.10 shares) | $31.10 | |
| Maximum offering price per share (100/94.25 of $31.10) | $33.00 | |
| Class T: | ||
| Net Asset Value and redemption price per share ($812,999 ÷ 25,697.37 shares) | $31.64 | |
| Maximum offering price per share (100/96.50 of $31.64) | $32.79 | |
| Class B: | ||
| Net Asset Value and offering price per share ($10,079 ÷ 321.57 shares)(a) | $31.34 | |
| Class C: | ||
| Net Asset Value and offering price per share ($187,196 ÷ 5,992.07 shares)(a) | $31.24 | |
| Class I: | ||
| Net Asset Value, offering price and redemption price per share ($428,052 ÷ 13,288.20 shares) | $32.21 | |
| Class Z: | ||
| Net Asset Value, offering price and redemption price per share ($14,254 ÷ 442.57 shares) | $32.21 |
(a) Redemption price per share is equal to net asset value less any applicable contingent deferred sales charge.
See accompanying notes which are an integral part of the financial statements.
Statement of Operations
| Amounts in thousands | Year ended November 30, 2015 | |
| Investment Income | ||
| Dividends | $86,344 | |
| Interest | 1,590 | |
| Income from Fidelity Central Funds | 306 | |
| Total income | 88,240 | |
| Expenses | ||
| Management fee | $10,432 | |
| Transfer agent fees | 4,662 | |
| Distribution and service plan fees | 8,483 | |
| Accounting and security lending fees | 702 | |
| Custodian fees and expenses | 58 | |
| Independent trustees' compensation | 10 | |
| Registration fees | 104 | |
| Audit | 70 | |
| Legal | 10 | |
| Miscellaneous | 28 | |
| Total expenses before reductions | 24,559 | |
| Expense reductions | (179) | 24,380 |
| Net investment income (loss) | 63,860 | |
| Realized and Unrealized Gain (Loss) | ||
| Net realized gain (loss) on: | ||
| Investment securities: | ||
| Unaffiliated issuers | 149,314 | |
| Foreign currency transactions | (35) | |
| Written options | 5,913 | |
| Total net realized gain (loss) | 155,192 | |
| Change in net unrealized appreciation (depreciation) on: Investment securities | (305,822) | |
| Assets and liabilities in foreign currencies | 16 | |
| Written options | 303 | |
| Total change in net unrealized appreciation (depreciation) | (305,503) | |
| Net gain (loss) | (150,311) | |
| Net increase (decrease) in net assets resulting from operations | $(86,451) |
See accompanying notes which are an integral part of the financial statements.
Statement of Changes in Net Assets
| Amounts in thousands | Year ended November 30, 2015 | Year ended November 30, 2014 |
| Increase (Decrease) in Net Assets | ||
| Operations | ||
| Net investment income (loss) | $63,860 | $60,679 |
| Net realized gain (loss) | 155,192 | 202,288 |
| Change in net unrealized appreciation (depreciation) | (305,503) | 813 |
| Net increase (decrease) in net assets resulting from operations | (86,451) | 263,780 |
| Distributions to shareholders from net investment income | (66,216) | (45,196) |
| Distributions to shareholders from net realized gain | (81,483) | (2,749) |
| Total distributions | (147,699) | (47,945) |
| Share transactions - net increase (decrease) | (126,756) | (180,981) |
| Total increase (decrease) in net assets | (360,906) | 34,854 |
| Net Assets | ||
| Beginning of period | 2,501,308 | 2,466,454 |
| End of period (including undistributed net investment income of $16,088 and undistributed net investment income of $22,526, respectively) | $2,140,402 | $2,501,308 |
See accompanying notes which are an integral part of the financial statements.
Financial Highlights — Fidelity Advisor Equity Income Fund Class A
| November 30, | |||||
| Years ended November 30, | 2015 | 2014 | 2013 | 2012 | 2011 |
| Selected Per–Share Data | |||||
| Net asset value, beginning of period | $34.44 | $31.60 | $25.55 | $22.18 | $21.07 |
| Income from Investment Operations | |||||
| Net investment income (loss)A | .92 | .84B | .60 | .61 | .42 |
| Net realized and unrealized gain (loss) | (2.15) | 2.67 | 6.06 | 3.32 | 1.11 |
| Total from investment operations | (1.23) | 3.51 | 6.66 | 3.93 | 1.53 |
| Distributions from net investment income | (.98) | (.64) | (.58) | (.56) | (.42) |
| Distributions from net realized gain | (1.14) | (.04) | (.03) | – | – |
| Total distributions | (2.11)C | (.67)D | (.61) | (.56) | (.42) |
| Net asset value, end of period | $31.10 | $34.44 | $31.60 | $25.55 | $22.18 |
| Total ReturnE,F | (3.61)% | 11.28% | 26.43% | 17.90% | 7.25% |
| Ratios to Average Net AssetsG,H | |||||
| Expenses before reductions | .95% | .96% | .98% | 1.02% | 1.03% |
| Expenses net of fee waivers, if any | .95% | .96% | .98% | 1.02% | 1.03% |
| Expenses net of all reductions | .94% | .95% | .97% | 1.01% | 1.02% |
| Net investment income (loss) | 2.85% | 2.55%B | 2.07% | 2.52% | 1.82% |
| Supplemental Data | |||||
| Net assets, end of period (in millions) | $688 | $794 | $777 | $646 | $634 |
| Portfolio turnover rateI | 53% | 33% | 34% | 49% | 89% |
A Calculated based on average shares outstanding during the period.
B Investment income per share reflects a large, non-recurring dividend which amounted to $.11 per share. Excluding this non-recurring dividend, the ratio of net investment income (loss) to average net assets would have been 2.21%.
C Total distributions of $2.11 per share is comprised of distributions from net investment income of $.975 and distributions from net realized gain of $1.136 per share.
D Total distributions of $.67 per share is comprised of distributions from net investment income of $.636 and distributions from net realized gain of $.038 per share.
E Total returns would have been lower if certain expenses had not been reduced during the applicable periods shown.
F Total returns do not include the effect of the sales charges.
G Fees and expenses of any underlying Fidelity Central Funds are not included in the Fund's expense ratio. The Fund indirectly bears its proportionate share of the expenses of any underlying Fidelity Central Funds.
H Expense ratios reflect operating expenses of the class. Expenses before reductions do not reflect amounts reimbursed by the investment adviser or reductions from brokerage service arrangements or reductions from other expense offset arrangements and do not represent the amount paid by the class during periods when reimbursements or reductions occur. Expenses net of fee waivers reflect expenses after reimbursement by the investment adviser but prior to reductions from brokerage service arrangements or other expense offset arrangements. Expenses net of all reductions represent the net expenses paid by the class.
I Amount does not include the portfolio activity of any underlying Fidelity Central Funds.
See accompanying notes which are an integral part of the financial statements.
Financial Highlights — Fidelity Advisor Equity Income Fund Class T
| November 30, | |||||
| Years ended November 30, | 2015 | 2014 | 2013 | 2012 | 2011 |
| Selected Per–Share Data | |||||
| Net asset value, beginning of period | $34.99 | $32.09 | $25.94 | $22.50 | $21.37 |
| Income from Investment Operations | |||||
| Net investment income (loss)A | .86 | .78B | .55 | .57 | .38 |
| Net realized and unrealized gain (loss) | (2.18) | 2.72 | 6.15 | 3.37 | 1.13 |
| Total from investment operations | (1.32) | 3.50 | 6.70 | 3.94 | 1.51 |
| Distributions from net investment income | (.89) | (.56) | (.52) | (.50) | (.38) |
| Distributions from net realized gain | (1.14) | (.04) | (.03) | – | – |
| Total distributions | (2.03) | (.60) | (.55) | (.50) | (.38) |
| Net asset value, end of period | $31.64 | $34.99 | $32.09 | $25.94 | $22.50 |
| Total ReturnC,D | (3.83)% | 11.04% | 26.14% | 17.70% | 7.02% |
| Ratios to Average Net AssetsE,F | |||||
| Expenses before reductions | 1.18% | 1.18% | 1.19% | 1.21% | 1.22% |
| Expenses net of fee waivers, if any | 1.18% | 1.18% | 1.19% | 1.21% | 1.22% |
| Expenses net of all reductions | 1.17% | 1.18% | 1.18% | 1.21% | 1.21% |
| Net investment income (loss) | 2.62% | 2.33%B | 1.86% | 2.32% | 1.63% |
| Supplemental Data | |||||
| Net assets, end of period (in millions) | $813 | $974 | $984 | $854 | $862 |
| Portfolio turnover rateG | 53% | 33% | 34% | 49% | 89% |
A Calculated based on average shares outstanding during the period.
B Investment income per share reflects a large, non-recurring dividend which amounted to $.11 per share. Excluding this non-recurring dividend, the ratio of net investment income (loss) to average net assets would have been 1.98%.
C Total returns would have been lower if certain expenses had not been reduced during the applicable periods shown.
D Total returns do not include the effect of the sales charges.
E Fees and expenses of any underlying Fidelity Central Funds are not included in the Fund's expense ratio. The Fund indirectly bears its proportionate share of the expenses of any underlying Fidelity Central Funds.
F Expense ratios reflect operating expenses of the class. Expenses before reductions do not reflect amounts reimbursed by the investment adviser or reductions from brokerage service arrangements or reductions from other expense offset arrangements and do not represent the amount paid by the class during periods when reimbursements or reductions occur. Expenses net of fee waivers reflect expenses after reimbursement by the investment adviser but prior to reductions from brokerage service arrangements or other expense offset arrangements. Expenses net of all reductions represent the net expenses paid by the class.
G Amount does not include the portfolio activity of any underlying Fidelity Central Funds.
See accompanying notes which are an integral part of the financial statements.
Financial Highlights — Fidelity Advisor Equity Income Fund Class B
| November 30, | |||||
| Years ended November 30, | 2015 | 2014 | 2013 | 2012 | 2011 |
| Selected Per–Share Data | |||||
| Net asset value, beginning of period | $34.65 | $31.79 | $25.69 | $22.29 | $21.16 |
| Income from Investment Operations | |||||
| Net investment income (loss)A | .66 | .57B | .36 | .42 | .24 |
| Net realized and unrealized gain (loss) | (2.17) | 2.69 | 6.10 | 3.34 | 1.12 |
| Total from investment operations | (1.51) | 3.26 | 6.46 | 3.76 | 1.36 |
| Distributions from net investment income | (.67) | (.37) | (.33) | (.36) | (.23) |
| Distributions from net realized gain | (1.14) | (.04) | (.03) | – | – |
| Total distributions | (1.80)C | (.40)D | (.36) | (.36) | (.23) |
| Net asset value, end of period | $31.34 | $34.65 | $31.79 | $25.69 | $22.29 |
| Total ReturnE,F | (4.43)% | 10.37% | 25.39% | 16.97% | 6.43% |
| Ratios to Average Net AssetsG,H | |||||
| Expenses before reductions | 1.79% | 1.79% | 1.80% | 1.80% | 1.81% |
| Expenses net of fee waivers, if any | 1.79% | 1.79% | 1.80% | 1.80% | 1.81% |
| Expenses net of all reductions | 1.79% | 1.79% | 1.79% | 1.80% | 1.80% |
| Net investment income (loss) | 2.01% | 1.71%B | 1.26% | 1.73% | 1.04% |
| Supplemental Data | |||||
| Net assets, end of period (in millions) | $10 | $19 | $27 | $31 | $42 |
| Portfolio turnover rateI | 53% | 33% | 34% | 49% | 89% |
A Calculated based on average shares outstanding during the period.
B Investment income per share reflects a large, non-recurring dividend which amounted to $.11 per share. Excluding this non-recurring dividend, the ratio of net investment income (loss) to average net assets would have been 1.37%.
C Total distributions of $1.80 per share is comprised of distributions from net investment income of $.665 and distributions from net realized gain of $1.136 per share.
D Total distributions of $.40 per share is comprised of distributions from net investment income of $.366 and distributions from net realized gain of $.038 per share.
E Total returns would have been lower if certain expenses had not been reduced during the applicable periods shown.
F Total returns do not include the effect of the contingent deferred sales charge.
G Fees and expenses of any underlying Fidelity Central Funds are not included in the Fund's expense ratio. The Fund indirectly bears its proportionate share of the expenses of any underlying Fidelity Central Funds.
H Expense ratios reflect operating expenses of the class. Expenses before reductions do not reflect amounts reimbursed by the investment adviser or reductions from brokerage service arrangements or reductions from other expense offset arrangements and do not represent the amount paid by the class during periods when reimbursements or reductions occur. Expenses net of fee waivers reflect expenses after reimbursement by the investment adviser but prior to reductions from brokerage service arrangements or other expense offset arrangements. Expenses net of all reductions represent the net expenses paid by the class.
I Amount does not include the portfolio activity of any underlying Fidelity Central Funds.
See accompanying notes which are an integral part of the financial statements.
Financial Highlights — Fidelity Advisor Equity Income Fund Class C
| November 30, | |||||
| Years ended November 30, | 2015 | 2014 | 2013 | 2012 | 2011 |
| Selected Per–Share Data | |||||
| Net asset value, beginning of period | $34.57 | $31.73 | $25.66 | $22.27 | $21.16 |
| Income from Investment Operations | |||||
| Net investment income (loss)A | .68 | .59B | .38 | .43 | .25 |
| Net realized and unrealized gain (loss) | (2.15) | 2.69 | 6.09 | 3.33 | 1.11 |
| Total from investment operations | (1.47) | 3.28 | 6.47 | 3.76 | 1.36 |
| Distributions from net investment income | (.72) | (.40) | (.37) | (.37) | (.25) |
| Distributions from net realized gain | (1.14) | (.04) | (.03) | – | – |
| Total distributions | (1.86) | (.44) | (.40) | (.37) | (.25) |
| Net asset value, end of period | $31.24 | $34.57 | $31.73 | $25.66 | $22.27 |
| Total ReturnC,D | (4.34)% | 10.44% | 25.46% | 17.03% | 6.40% |
| Ratios to Average Net AssetsE,F | |||||
| Expenses before reductions | 1.72% | 1.72% | 1.74% | 1.77% | 1.78% |
| Expenses net of fee waivers, if any | 1.71% | 1.72% | 1.74% | 1.77% | 1.78% |
| Expenses net of all reductions | 1.71% | 1.71% | 1.73% | 1.77% | 1.77% |
| Net investment income (loss) | 2.09% | 1.79%B | 1.32% | 1.76% | 1.06% |
| Supplemental Data | |||||
| Net assets, end of period (in millions) | $187 | $214 | $195 | $143 | $134 |
| Portfolio turnover rateG | 53% | 33% | 34% | 49% | 89% |
A Calculated based on average shares outstanding during the period.
B Investment income per share reflects a large, non-recurring dividend which amounted to $.11 per share. Excluding this non-recurring dividend, the ratio of net investment income (loss) to average net assets would have been 1.45%.
C Total returns would have been lower if certain expenses had not been reduced during the applicable periods shown.
D Total returns do not include the effect of the contingent deferred sales charge.
E Fees and expenses of any underlying Fidelity Central Funds are not included in the Fund's expense ratio. The Fund indirectly bears its proportionate share of the expenses of any underlying Fidelity Central Funds.
F Expense ratios reflect operating expenses of the class. Expenses before reductions do not reflect amounts reimbursed by the investment adviser or reductions from brokerage service arrangements or reductions from other expense offset arrangements and do not represent the amount paid by the class during periods when reimbursements or reductions occur. Expenses net of fee waivers reflect expenses after reimbursement by the investment adviser but prior to reductions from brokerage service arrangements or other expense offset arrangements. Expenses net of all reductions represent the net expenses paid by the class.
G Amount does not include the portfolio activity of any underlying Fidelity Central Funds.
See accompanying notes which are an integral part of the financial statements.
Financial Highlights — Fidelity Advisor Equity Income Fund Class I
| November 30, | |||||
| Years ended November 30, | 2015 | 2014 | 2013 | 2012 | 2011 |
| Selected Per–Share Data | |||||
| Net asset value, beginning of period | $35.59 | $32.62 | $26.36 | $22.86 | $21.70 |
| Income from Investment Operations | |||||
| Net investment income (loss)A | 1.04 | .95B | .70 | .70 | .50 |
| Net realized and unrealized gain (loss) | (2.23) | 2.77 | 6.24 | 3.43 | 1.14 |
| Total from investment operations | (1.19) | 3.72 | 6.94 | 4.13 | 1.64 |
| Distributions from net investment income | (1.06) | (.72) | (.65) | (.63) | (.48) |
| Distributions from net realized gain | (1.14) | (.04) | (.03) | – | – |
| Total distributions | (2.19)C | (.75)D | (.68) | (.63) | (.48) |
| Net asset value, end of period | $32.21 | $35.59 | $32.62 | $26.36 | $22.86 |
| Total ReturnE | (3.37)% | 11.59% | 26.72% | 18.27% | 7.55% |
| Ratios to Average Net AssetsF,G | |||||
| Expenses before reductions | .69% | .70% | .72% | .73% | .74% |
| Expenses net of fee waivers, if any | .69% | .70% | .72% | .73% | .74% |
| Expenses net of all reductions | .69% | .70% | .71% | .73% | .73% |
| Net investment income (loss) | 3.11% | 2.81%B | 2.34% | 2.80% | 2.10% |
| Supplemental Data | |||||
| Net assets, end of period (in millions) | $428 | $496 | $483 | $445 | $360 |
| Portfolio turnover rateH | 53% | 33% | 34% | 49% | 89% |
A Calculated based on average shares outstanding during the period.
B Investment income per share reflects a large, non-recurring dividend which amounted to $.12 per share. Excluding this non-recurring dividend, the ratio of net investment income (loss) to average net assets would have been 2.46%.
C Total distributions of $2.19 per share is comprised of distributions from net investment income of $1.058 and distributions from net realized gain of $1.136 per share.
D Total distributions of $.75 per share is comprised of distributions from net investment income of $.716 and distributions from net realized gain of $.038 per share.
E Total returns would have been lower if certain expenses had not been reduced during the applicable periods shown.
F Fees and expenses of any underlying Fidelity Central Funds are not included in the Fund's expense ratio. The Fund indirectly bears its proportionate share of the expenses of any underlying Fidelity Central Funds.
G Expense ratios reflect operating expenses of the class. Expenses before reductions do not reflect amounts reimbursed by the investment adviser or reductions from brokerage service arrangements or reductions from other expense offset arrangements and do not represent the amount paid by the class during periods when reimbursements or reductions occur. Expenses net of fee waivers reflect expenses after reimbursement by the investment adviser but prior to reductions from brokerage service arrangements or other expense offset arrangements. Expenses net of all reductions represent the net expenses paid by the class.
H Amount does not include the portfolio activity of any underlying Fidelity Central Funds.
See accompanying notes which are an integral part of the financial statements.
Financial Highlights — Fidelity Advisor Equity Income Fund Class Z
| November 30, | |||
| Years ended November 30, | 2015 | 2014 | 2013 A |
| Selected Per–Share Data | |||
| Net asset value, beginning of period | $35.59 | $32.63 | $31.44 |
| Income from Investment Operations | |||
| Net investment income (loss)B | 1.08 | 1.03C | .23 |
| Net realized and unrealized gain (loss) | (2.21) | 2.74 | 1.12 |
| Total from investment operations | (1.13) | 3.77 | 1.35 |
| Distributions from net investment income | (1.11) | (.78) | (.16) |
| Distributions from net realized gain | (1.14) | (.04) | – |
| Total distributions | (2.25) | (.81)D | (.16) |
| Net asset value, end of period | $32.21 | $35.59 | $32.63 |
| Total ReturnE,F | (3.20)% | 11.75% | 4.30% |
| Ratios to Average Net AssetsG,H | |||
| Expenses before reductions | .54% | .54% | .54%I |
| Expenses net of fee waivers, if any | .54% | .54% | .54%I |
| Expenses net of all reductions | .53% | .54% | .54%I |
| Net investment income (loss) | 3.26% | 2.97%C | 2.37%I |
| Supplemental Data | |||
| Net assets, end of period (000s omitted) | $14,254 | $4,060 | $104 |
| Portfolio turnover rateJ | 53% | 33% | 34% |
A For the period August 13, 2013 (commencement of sale of shares) to November 30, 2013.
B Calculated based on average shares outstanding during the period.
C Investment income per share reflects a large, non-recurring dividend which amounted to $.12 per share. Excluding this non-recurring dividend, the ratio of net investment income (loss) to average net assets would have been 2.62%.
D Total distributions of $.81 per share is comprised of distributions from net investment income of $.775 and distributions from net realized gain of $.038 per share.
E Total returns for periods of less than one year are not annualized.
F Total returns would have been lower if certain expenses had not been reduced during the applicable periods shown.
G Fees and expenses of any underlying Fidelity Central Funds are not included in the Fund's expense ratio. The Fund indirectly bears its proportionate share of the expenses of any underlying Fidelity Central Funds.
H Expense ratios reflect operating expenses of the class. Expenses before reductions do not reflect amounts reimbursed by the investment adviser or reductions from brokerage service arrangements or reductions from other expense offset arrangements and do not represent the amount paid by the class during periods when reimbursements or reductions occur. Expense ratios before reductions for start-up periods may not be representative of longer-term operating periods. Expenses net of fee waivers reflect expenses after reimbursement by the investment adviser but prior to reductions from brokerage service arrangements or other expense offset arrangements. Expenses net of all reductions represent the net expenses paid by the class.
I Annualized
J Amount does not include the portfolio activity of any underlying Fidelity Central Funds.
See accompanying notes which are an integral part of the financial statements.
Notes to Financial Statements
For the period ended November 30, 2015
(Amounts in thousands except percentages)
1. Organization.
Fidelity Advisor Equity Income Fund (the Fund) is a fund of Fidelity Advisor Series I (the Trust) and is authorized to issue an unlimited number of shares. The Trust is registered under the Investment Company Act of 1940, as amended (the 1940 Act), as an open-end management investment company organized as a Massachusetts business trust. The Fund offers Class A, Class T, Class C, Class I (formerly Institutional Class) and Class Z shares, each of which, along with Class B shares, has equal rights as to assets and voting privileges. Class B shares are closed to new accounts and additional purchases, except for exchanges and reinvestments. Each class has exclusive voting rights with respect to matters that affect that class. Class B shares will automatically convert to Class A shares after a holding period of seven years from the initial date of purchase.
2. Investments in Fidelity Central Funds.
The Fund invests in Fidelity Central Funds, which are open-end investment companies generally available only to other investment companies and accounts managed by the investment adviser and its affiliates. The Fund's Schedule of Investments lists each of the Fidelity Central Funds held as of period end, if any, as an investment of the Fund, but does not include the underlying holdings of each Fidelity Central Fund. As an Investing Fund, the Fund indirectly bears its proportionate share of the expenses of the underlying Fidelity Central Funds.
The Money Market Central Funds seek preservation of capital and current income and are managed by Fidelity Investments Money Management, Inc. (FIMM), an affiliate of the investment adviser. Annualized expenses of the Money Market Central Funds as of their most recent shareholder report date are less than .005%.
A complete unaudited list of holdings for each Fidelity Central Fund is available upon request or at the Securities and Exchange Commission (the SEC) website at www.sec.gov. In addition, the financial statements of the Fidelity Central Funds, which are not covered by the Fund's Report of Independent Registered Public Accounting Firm, are available on the SEC website or upon request.
3. Significant Accounting Policies.
The financial statements have been prepared in conformity with accounting principles generally accepted in the United States of America (GAAP), which require management to make certain estimates and assumptions at the date of the financial statements. Actual results could differ from those estimates. Subsequent events, if any, through the date that the financial statements were issued have been evaluated in the preparation of the financial statements. The following summarizes the significant accounting policies of the Fund:
Investment Valuation. Investments are valued as of 4:00 p.m. Eastern time on the last calendar day of the period. The Board of Trustees (the Board) has delegated the day to day responsibility for the valuation of the Fund's investments to the Fidelity Management & Research Company (FMR) Fair Value Committee (the Committee). In accordance with valuation policies and procedures approved by the Board, the Fund attempts to obtain prices from one or more third party pricing vendors or brokers to value its investments. When current market prices, quotations or currency exchange rates are not readily available or reliable, investments will be fair valued in good faith by the Committee, in accordance with procedures adopted by the Board. Factors used in determining fair value vary by investment type and may include market or investment specific events, changes in interest rates and credit quality. The frequency with which these procedures are used cannot be predicted and they may be utilized to a significant extent. The Committee oversees the Fund's valuation policies and procedures and reports to the Board on the Committee's activities and fair value determinations. The Board monitors the appropriateness of the procedures used in valuing the Fund's investments and ratifies the fair value determinations of the Committee.
The Fund categorizes the inputs to valuation techniques used to value its investments into a disclosure hierarchy consisting of three levels as shown below:
- Level 1 – quoted prices in active markets for identical investments
- Level 2 – other significant observable inputs (including quoted prices for similar investments, interest rates, prepayment speeds, etc.)
- Level 3 – unobservable inputs (including the Fund's own assumptions based on the best information available)
Valuation techniques used to value the Fund's investments by major category are as follows:
Equity securities, including restricted securities, for which market quotations are readily available, are valued at the last reported sale price or official closing price as reported by a third party pricing vendor on the primary market or exchange on which they are traded and are categorized as Level 1 in the hierarchy. In the event there were no sales during the day or closing prices are not available, securities are valued at the last quoted bid price or may be valued using the last available price and are generally categorized as Level 2 in the hierarchy. For foreign equity securities, when market or security specific events arise, comparisons to the valuation of American Depositary Receipts (ADRs), futures contracts, Exchange-Traded Funds (ETFs) and certain indexes as well as quoted prices for similar securities may be used and would be categorized as Level 2 in the hierarchy. Utilizing these techniques may result in transfers between Level 1 and Level 2. For equity securities, including restricted securities, where observable inputs are limited, assumptions about market activity and risk are used and these securities may be categorized as Level 3 in the hierarchy.
Debt securities, including restricted securities, are valued based on evaluated prices received from third party pricing vendors or from brokers who make markets in such securities. Corporate bonds and preferred securities are valued by pricing vendors who utilize matrix pricing which considers yield or price of bonds of comparable quality, coupon, maturity and type or by broker-supplied prices. When independent prices are unavailable or unreliable, debt securities may be valued utilizing pricing methodologies which consider similar factors that would be used by third party pricing vendors. Debt securities are generally categorized as Level 2 in the hierarchy but may be Level 3 depending on the circumstances.
Exchange-traded options are valued using the last sale price or, in the absence of a sale, the last offering price and are categorized as Level 1 in the hierarchy. Investments in open-end mutual funds, including the Fidelity Central Funds, are valued at their closing net asset value (NAV) each business day and are categorized as Level 1 in the hierarchy.
Changes in valuation techniques may result in transfers in or out of an assigned level within the disclosure hierarchy. The aggregate value of investments by input level as of November 30, 2015, is included at the end of the Fund's Schedule of Investments.
Foreign Currency. The Fund may use foreign currency contracts to facilitate transactions in foreign-denominated securities. Gains and losses from these transactions may arise from changes in the value of the foreign currency or if the counterparties do not perform under the contracts' terms.
Foreign-denominated assets, including investment securities, and liabilities are translated into U.S. dollars at the exchange rates at period end. Purchases and sales of investment securities, income and dividends received and expenses denominated in foreign currencies are translated into U.S. dollars at the exchange rate in effect on the transaction date.
The effects of exchange rate fluctuations on investments are included with the net realized and unrealized gain (loss) on investment securities. Other foreign currency transactions resulting in realized and unrealized gain (loss) are disclosed separately.
Investment Transactions and Income. For financial reporting purposes, the Fund's investment holdings and NAV include trades executed through the end of the last business day of the period. The NAV per share for processing shareholder transactions is calculated as of the close of business of the New York Stock Exchange (NYSE), normally 4:00 p.m. Eastern time and includes trades executed through the end of the prior business day. Gains and losses on securities sold are determined on the basis of identified cost and may include proceeds received from litigation. Dividend income is recorded on the ex-dividend date, except for certain dividends from foreign securities where the ex-dividend date may have passed, which are recorded as soon as the Fund is informed of the ex-dividend date. Non-cash dividends included in dividend income, if any, are recorded at the fair market value of the securities received. Income and capital gain distributions from Fidelity Central Funds, if any, are recorded on the ex-dividend date. Distributions received on securities that represent a return of capital or capital gain are recorded as a reduction of cost of investments and/or as a realized gain. Subsequent to ex-dividend date the Fund determines the components of these distributions, based upon receipt of tax filings or other correspondence relating to the underlying investment. Interest income is accrued as earned and includes coupon interest and amortization of premium and accretion of discount on debt securities as applicable. Investment income is recorded net of foreign taxes withheld where recovery of such taxes is uncertain. Debt obligations may be placed on non-accrual status and related interest income may be reduced by ceasing current accruals and writing off interest receivables when the collection of all or a portion of interest has become doubtful based on consistently applied procedures. A debt obligation is removed from non-accrual status when the issuer resumes interest payments or when collectability of interest is reasonably assured.
Class Allocations and Expenses. Investment income, realized and unrealized capital gains and losses, common expenses of the Fund, and certain fund-level expense reductions, if any, are allocated daily on a pro-rata basis to each class based on the relative net assets of each class to the total net assets of the Fund. Each class differs with respect to transfer agent and distribution and service plan fees incurred. Certain expense reductions may also differ by class. For the reporting period, the allocated portion of income and expenses to each class as a percent of its average net assets may vary due to the timing of recording these transactions in relation to fluctuating net assets of the classes. Expenses directly attributable to a fund are charged to that fund. Expenses attributable to more than one fund are allocated among the respective funds on the basis of relative net assets or other appropriate methods. Expense estimates are accrued in the period to which they relate and adjustments are made when actual amounts are known.
Deferred Trustee Compensation. Under a Deferred Compensation Plan (the Plan), independent Trustees may elect to defer receipt of a portion of their annual compensation. Deferred amounts are invested in a cross-section of Fidelity funds, are marked-to-market and remain in the Fund until distributed in accordance with the Plan. The investment of deferred amounts and the offsetting payable to the Trustees are included in the accompanying Statement of Assets and Liabilities.
Income Tax Information and Distributions to Shareholders. Each year, the Fund intends to qualify as a regulated investment company under Subchapter M of the Internal Revenue Code, including distributing substantially all of its taxable income and realized gains. As a result, no provision for U.S. Federal income taxes is required. As of November 30, 2015, the Fund did not have any unrecognized tax benefits in the financial statements; nor is the Fund aware of any tax positions for which it is reasonably possible that the total amounts of unrecognized tax benefits will significantly change in the next twelve months. The Fund files a U.S. federal tax return, in addition to state and local tax returns as required. The Fund's federal income tax returns are subject to examination by the Internal Revenue Service (IRS) for a period of three fiscal years after they are filed. State and local tax returns may be subject to examination for an additional fiscal year depending on the jurisdiction. Foreign taxes are provided for based on the Fund's understanding of the tax rules and rates that exist in the foreign markets in which it invests.
Distributions are declared and recorded on the ex-dividend date. Income dividends and capital gain distributions are declared separately for each class. Income and capital gain distributions are determined in accordance with income tax regulations, which may differ from GAAP. In addition, the Fund claimed a portion of the payment made to redeeming shareholders as a distribution for income tax purposes.
Capital accounts within the financial statements are adjusted for permanent book-tax differences. These adjustments have no impact on net assets or the results of operations. Capital accounts are not adjusted for temporary book-tax differences which will reverse in a subsequent period.
Book-tax differences are primarily due to foreign currency transactions, partnerships, market discount, deferred trustees compensation, contingent interest, certain conversion ratio adjustments, equity-debt classifications and losses deferred due to wash sales.
The federal tax cost of investment securities and unrealized appreciation (depreciation) as of period end were as follows:
| Gross unrealized appreciation | $301,303 |
| Gross unrealized depreciation | (187,028) |
| Net unrealized appreciation (depreciation) on securities | $114,275 |
| Tax Cost | $2,046,013 |
The tax-based components of distributable earnings as of period end were as follows:
| Undistributed ordinary income | $17,222 |
| Undistributed long-term capital gain | $142,032 |
| Net unrealized appreciation (depreciation) on securities and other investments | $113,940 |
The tax character of distributions paid was as follows:
| November 30, 2015 | November 30, 2014 | |
| Ordinary Income | $66,216 | $ 47,945 |
| Long-term Capital Gains | 81,483 | – |
| Total | $147,699 | $ 47,945 |
Restricted Securities. The Fund may invest in securities that are subject to legal or contractual restrictions on resale. These securities generally may be resold in transactions exempt from registration or to the public if the securities are registered. Disposal of these securities may involve time-consuming negotiations and expense, and prompt sale at an acceptable price may be difficult. Information regarding restricted securities is included at the end of the Fund's Schedule of Investments.
4. Derivative Instruments.
Risk Exposures and the Use of Derivative Instruments. The Fund's investment objective allows the Fund to enter into various types of derivative contracts, including options. Derivatives are investments whose value is primarily derived from underlying assets, indices or reference rates and may be transacted on an exchange or over-the-counter (OTC). Derivatives may involve a future commitment to buy or sell a specified asset based on specified terms, to exchange future cash flows at periodic intervals based on a notional principal amount, or for one party to make one or more payments upon the occurrence of specified events in exchange for periodic payments from the other party.
The Fund used derivatives to increase returns and to manage exposure to certain risks as defined below. The success of any strategy involving derivatives depends on analysis of numerous economic factors, and if the strategies for investment do not work as intended, the Fund may not achieve its objectives.
The Fund's use of derivatives increased or decreased its exposure to the following risk:
| Equity Risk | Equity risk relates to the fluctuations in the value of financial instruments as a result of changes in market prices (other than those arising from interest rate risk or foreign exchange risk), whether caused by factors specific to an individual investment, its issuer, or all factors affecting all instruments traded in a market or market segment. |
The Fund is also exposed to additional risks from investing in derivatives, such as liquidity risk and counterparty credit risk. Liquidity risk is the risk that the Fund will be unable to close out the derivative in the open market in a timely manner. Counterparty credit risk is the risk that the counterparty will not be able to fulfill its obligation to the Fund. Counterparty credit risk related to exchange-traded options may be mitigated by the protection provided by the exchange on which they trade.
Investing in derivatives may involve greater risks than investing in the underlying assets directly and, to varying degrees, may involve risk of loss in excess of any initial investment and collateral received and amounts recognized in the Statement of Assets and Liabilities. In addition, there may be the risk that the change in value of the derivative contract does not correspond to the change in value of the underlying instrument.
Options. Options give the purchaser the right, but not the obligation, to buy (call) or sell (put) an underlying security or financial instrument at an agreed exercise or strike price between or on certain dates. Options obligate the seller (writer) to buy (put) or sell (call) an underlying instrument at the exercise or strike price or cash settle an underlying derivative instrument if the holder exercises the option on or before the expiration date.
The Fund (the Fund) used exchange-traded written covered call options to manage its exposure to the market. When the Fund writes a covered call option, the Fund holds the underlying instrument which must be delivered to the holder upon the exercise of the option.
Upon entering into a written options contract, the Fund will receive a premium. Premiums received are reflected as a liability on the Statement of Assets and Liabilities. Options are valued daily and any unrealized appreciation (depreciation) is reflected on the Statement of Assets and Liabilities. When a written option is exercised, the premium is added to the proceeds from the sale of the underlying instrument in determining the gain or loss realized on that investment. When an option is closed the Fund will realize a gain or loss depending on whether the proceeds or amount paid for the closing sale transaction are greater or less than the premium received. When an option expires, gains and losses are realized to the extent of premiums received. The net realized gain (loss) on closed and expired written options and the change in net unrealized appreciation (depreciation) on written options are reflected separately on the Statement of Operations.
Writing call options tends to decrease exposure to the underlying instrument and risk of loss is the change in value in excess of the premium received.
Any open options at period end are presented in the Schedule of Investments under the caption "Written Options" and are representative of volume of activity during the period.
During the period, the Fund recognized net realized gain (loss) of $5,913 and a change in net unrealized appreciation (depreciation) of $302 related to its investment in written options. This amount is included in the Statement of Operations.
The following is a summary of the Fund's written options activity:
Written Options
| Number of Contracts | Amount of Premiums | |
| Outstanding at beginning of period | 10 | $912 |
| Options Opened | 119 | 10,886 |
| Options Exercised | (37) | (3,340) |
| Options Closed | (36) | (3,531) |
| Options Expired | (36) | (3,287) |
| Outstanding at end of period | 20 | $1,640 |
5. Purchases and Sales of Investments.
Purchases and sales of securities, other than short-term securities, aggregated $1,190,348 and $1,300,637, respectively.
6. Fees and Other Transactions with Affiliates.
Management Fee. Fidelity Management & Research Company (the investment adviser) and its affiliates provide the Fund with investment management related services for which the Fund pays a monthly management fee. The management fee is the sum of an individual fund fee rate that is based on an annual rate of .20% of the Fund's average net assets and an annualized group fee rate that averaged .25% during the period. The group fee rate is based upon the average net assets of all the mutual funds advised by the investment adviser, including any mutual funds previously advised by the investment adviser that are currently advised by Fidelity SelectCo, LLC, an affiliate of the investment adviser. The group fee rate decreases as assets under management increase and increases as assets under management decrease. For the reporting period, the total annual management fee rate was .45% of the Fund's average net assets.
Distribution and Service Plan Fees. In accordance with Rule 12b-1 of the 1940 Act, the Fund has adopted separate Distribution and Service Plans for each class of shares. Certain classes pay Fidelity Distributors Corporation (FDC), an affiliate of the investment adviser, separate Distribution and Service Fees, each of which is based on an annual percentage of each class' average net assets. In addition, FDC may pay financial intermediaries for selling shares of the Fund and providing shareholder support services. For the period, the Distribution and Service Fee rates, total fees and amounts retained by FDC were as follows:
| Distribution Fee | Service Fee | Total Fees | Retained by FDC | |
| Class A | -% | .25% | $1,861 | $12 |
| Class T | .25% | .25% | 4,477 | 7 |
| Class B | .75% | .25% | 143 | 107 |
| Class C | .75% | .25% | 2,002 | 149 |
| $8,483 | $275 |
Sales Load. FDC may receive a front-end sales charge of up to 5.75% for selling Class A shares and 3.50% for selling Class T shares, some of which is paid to financial intermediaries for selling shares of the Fund. Depending on the holding period, FDC may receive contingent deferred sales charges levied on Class A, Class T, Class B, and Class C redemptions. The deferred sales charges range from 5.00% to 1.00% for Class B shares, 1.00% for Class C shares, 1.00% for certain purchases of Class A shares and .25% for certain purchases of Class T shares.
For the period, sales charge amounts retained by FDC were as follows:
| Retained by FDC | |
| Class A | $123 |
| Class T | 34 |
| Class B(a) | 4 |
| Class C(a) | 14 |
| $175 |
(a) When Class B and Class C shares are initially sold, FDC pays commissions from its own resources to financial intermediaries through which the sales are made.
Transfer Agent Fees. Fidelity Investments Institutional Operations Company, Inc., (FIIOC), an affiliate of the investment adviser, is the transfer, dividend disbursing and shareholder servicing agent for each class of the Fund. FIIOC receives account fees and asset-based fees that vary according to the account size and type of account of the shareholders of the respective classes of the Fund, except for Class Z. FIIOC receives an asset-based fee of Class Z's average net assets. FIIOC pays for typesetting, printing and mailing of shareholder reports, except proxy statements.
For the period, transfer agent fees for each class were as follows:
| Amount | % of Class-Level Average Net Assets | |
| Class A | $1,555 | .21 |
| Class T | 1,678 | .19 |
| Class B | 43 | .30 |
| Class C | 452 | .23 |
| Class I | 928 | .20 |
| Class Z | 6 | .05 |
| $4,662 |
Accounting and Security Lending Fees. Fidelity Service Company, Inc. (FSC), an affiliate of the investment adviser, maintains the Fund's accounting records. The accounting fee is based on the level of average net assets for each month. Under a separate contract, FSC administers the security lending program. The security lending fee is based on the number and duration of lending transactions.
Brokerage Commissions. The Fund placed a portion of its portfolio transactions with brokerage firms which are affiliates of the investment adviser. Brokerage commissions are included in net realized gain (loss) and change in net unrealized appreciation (depreciation) in the Statement of Operations. The commissions paid to these affiliated firms were $12 for the period.
7. Committed Line of Credit.
The Fund participates with other funds managed by the investment adviser or an affiliate in a $4.25 billion credit facility (the "line of credit") to be utilized for temporary or emergency purposes to fund shareholder redemptions or for other short-term liquidity purposes. The Fund has agreed to pay commitment fees on its pro-rata portion of the line of credit, which amounted to $3 and is reflected in Miscellaneous expenses on the Statement of Operations. During the period, the Fund did not borrow on this line of credit.
8. Security Lending.
The Fund lends portfolio securities through a lending agent from time to time in order to earn additional income. For equity securities, a lending agent is used and may loan securities to certain qualified borrowers, including Fidelity Capital Markets (FCM), a broker-dealer affiliated with the Fund. On the settlement date of the loan, the Fund receives collateral (in the form of U.S. Treasury obligations, letters of credit and/or cash) against the loaned securities and maintains collateral in an amount not less than 100% of the market value of the loaned securities during the period of the loan. The market value of the loaned securities is determined at the close of business of the Fund and any additional required collateral is delivered to the Fund on the next business day. The Fund or borrower may terminate the loan at any time, and if the borrower defaults on its obligation to return the securities loaned because of insolvency or other reasons, the Fund may apply collateral received from the borrower against the obligation. The Fund may experience delays and costs in recovering the securities loaned. Any cash collateral received is invested in the Fidelity Securities Lending Cash Central Fund. The value of loaned securities and cash collateral at period end are disclosed on the Fund's Statement of Assets and Liabilities. At period end, there were no security loans outstanding with FCM. Security lending income represents the income earned on investing cash collateral, less rebates paid to borrowers and any lending agent fees associated with the loan, plus any premium payments received for lending certain types of securities. Security lending income is presented in the Statement of Operations as a component of income from Fidelity Central Funds. Total security lending income during the period amounted to $180, including $1 from securities loaned to FCM.
9. Expense Reductions.
Commissions paid to certain brokers with whom the investment adviser, or its affiliates, places trades on behalf of the Fund include an amount in addition to trade execution, which may be rebated back to the Fund to offset certain expenses. This amount totaled $116 for the period.
In addition, during the period the investment adviser reimbursed and/or waived a portion of fund-level operating expenses in the amount of $9 and a portion of class-level operating expenses as follows:
| Amount | |
| Class A | $18 |
| Class T | 22 |
| Class B | -* |
| Class C | 5 |
| Class I | 9 |
| $54 |
* In the Amount of less than five hundred dollars.
10. Distributions to Shareholders.
Distributions to shareholders of each class were as follows:
| Years ended November 30, | 2015 | 2014 |
| From net investment income | ||
| Class A | $22,360 | $15,398 |
| Class T | 24,297 | 16,652 |
| Class B | 312 | 284 |
| Class C | 4,432 | 2,480 |
| Class I | 14,486 | 10,355 |
| Class Z | 329 | 27 |
| Total | $66,216 | $45,196 |
| From net realized gain | ||
| Class A | $26,221 | $885 |
| Class T | 31,523 | 1,072 |
| Class B | 619 | 22 |
| Class C | 7,102 | 235 |
| Class I | 15,863 | 531 |
| Class Z | 155 | 4 |
| Total | $81,483 | $2,749 |
11. Share Transactions.
Share transactions for each class were as follows and may contain automatic conversions between classes or exchanges between funds:
| Shares | Shares | Dollars | Dollars | |
| Years ended November 30, | 2015 | 2014 | 2015 | 2014 |
| Class A | ||||
| Shares sold | 2,362 | 2,874 | $75,894 | $94,044 |
| Reinvestment of distributions | 1,433 | 468 | 45,794 | 15,075 |
| Shares redeemed | (4,745) | (4,883) | (152,883) | (160,473) |
| Net increase (decrease) | (950) | (1,541) | $(31,195) | $(51,354) |
| Class T | ||||
| Shares sold | 2,316 | 2,961 | $76,171 | $98,369 |
| Reinvestment of distributions | 1,671 | 523 | 54,352 | 17,076 |
| Shares redeemed | (6,115) | (6,341) | (200,386) | (211,072) |
| Net increase (decrease) | (2,128) | (2,857) | $(69,863) | $(95,627) |
| Class B | ||||
| Shares sold | 9 | 28 | $284 | $933 |
| Reinvestment of distributions | 26 | 9 | 855 | 278 |
| Shares redeemed | (270) | (335) | (8,810) | (11,003) |
| Net increase (decrease) | (235) | (298) | $(7,671) | $(9,792) |
| Class C | ||||
| Shares sold | 655 | 952 | $21,329 | $31,255 |
| Reinvestment of distributions | 323 | 74 | 10,405 | 2,385 |
| Shares redeemed | (1,186) | (962) | (38,343) | (31,695) |
| Net increase (decrease) | (208) | 64 | $(6,609) | $1,945 |
| Class I | ||||
| Shares sold | 1,946 | 2,911 | $64,288 | $97,428 |
| Reinvestment of distributions | 888 | 313 | 29,367 | 10,419 |
| Shares redeemed | (3,471) | (4,089) | (116,106) | (137,936) |
| Net increase (decrease) | (637) | (865) | $(22,451) | $(30,089) |
| Class Z | ||||
| Shares sold | 374 | 113 | $12,522 | $4,010 |
| Reinvestment of distributions | 15 | 1 | 484 | 31 |
| Shares redeemed | (60) | (3) | (1,973) | (105) |
| Net increase (decrease) | 329 | 111 | $11,033 | $3,936 |
12. Other.
The Fund's organizational documents provide former and current trustees and officers with a limited indemnification against liabilities arising in connection with the performance of their duties to the Fund. In the normal course of business, the Fund may also enter into contracts that provide general indemnifications. The Fund's maximum exposure under these arrangements is unknown as this would be dependent on future claims that may be made against the Fund. The risk of material loss from such claims is considered remote.
Report of Independent Registered Public Accounting Firm
To the Trustees of Fidelity Advisor Series I and Shareholders of Fidelity Advisor® Equity Income Fund:
We have audited the accompanying statement of assets and liabilities of Fidelity Advisor® Equity Income Fund (the Fund), a fund of Fidelity Advisor Series I, including the schedule of investments, as of November 30, 2015, and the related statement of operations for the year then ended, the statement of changes in net assets for each of the two years in the period then ended, and the financial highlights for each of the five years in the period then ended. These financial statements and financial highlights are the responsibility of the Fund's management. Our responsibility is to express an opinion on these financial statements and financial highlights based on our audits.
We conducted our audits in accordance with the standards of the Public Company Accounting Oversight Board (United States). Those standards require that we plan and perform the audit to obtain reasonable assurance about whether the financial statements and financial highlights are free of material misstatement. The Fund is not required to have, nor were we engaged to perform, an audit of its internal control over financial reporting. Our audits included consideration of internal control over financial reporting as a basis for designing audit procedures that are appropriate in the circumstances, but not for the purpose of expressing an opinion on the effectiveness of the Fund's internal control over financial reporting. Accordingly, we express no such opinion. An audit also includes examining, on a test basis, evidence supporting the amounts and disclosures in the financial statements, assessing the accounting principles used and significant estimates made by management, as well as evaluating the overall financial statement presentation. Our procedures included confirmation of securities owned as of November 30, 2015, by correspondence with the custodians and brokers; when replies were not received from brokers, we performed other auditing procedures. We believe that our audits provide a reasonable basis for our opinion.
In our opinion, such financial statements and financial highlights referred to above present fairly, in all material respects, the financial position of Fidelity Advisor® Equity Income Fund as of November 30, 2015, the results of its operations for the year then ended, the changes in its net assets for each of the two years in the period then ended, and the financial highlights for each of the five years in the period then ended, in conformity with accounting principles generally accepted in the United States of America.
DELOITTE & TOUCHE LLP
Boston, Massachusetts
January 20, 2016
Trustees and Officers
The Trustees, Members of the Advisory Board (if any), and officers of the trust and fund, as applicable, are listed below. The Board of Trustees governs the fund and is responsible for protecting the interests of shareholders. The Trustees are experienced executives who meet periodically throughout the year to oversee the fund's activities, review contractual arrangements with companies that provide services to the fund, oversee management of the risks associated with such activities and contractual arrangements, and review the fund's performance. Each of the Trustees oversees 170 funds.
The Trustees hold office without limit in time except that (a) any Trustee may resign; (b) any Trustee may be removed by written instrument, signed by at least two-thirds of the number of Trustees prior to such removal; (c) any Trustee who requests to be retired or who has become incapacitated by illness or injury may be retired by written instrument signed by a majority of the other Trustees; and (d) any Trustee may be removed at any special meeting of shareholders by a two-thirds vote of the outstanding voting securities of the trust. Each Trustee who is not an interested person (as defined in the 1940 Act) of the trust and the fund is referred to herein as an Independent Trustee. Each Independent Trustee shall retire not later than the last day of the calendar year in which his or her 75th birthday occurs. The Independent Trustees may waive this mandatory retirement age policy with respect to individual Trustees. Officers and Advisory Board Members hold office without limit in time, except that any officer or Advisory Board Member may resign or may be removed by a vote of a majority of the Trustees at any regular meeting or any special meeting of the Trustees. Except as indicated, each individual has held the office shown or other offices in the same company for the past five years.
The fund’s Statement of Additional Information (SAI) includes more information about the Trustees. To request a free copy, call Fidelity at 1-877-208-0098.
Experience, Skills, Attributes, and Qualifications of the Trustees. The Governance and Nominating Committee has adopted a statement of policy that describes the experience, qualifications, attributes, and skills that are necessary and desirable for potential Independent Trustee candidates (Statement of Policy). The Board believes that each Trustee satisfied at the time he or she was initially elected or appointed a Trustee, and continues to satisfy, the standards contemplated by the Statement of Policy. The Governance and Nominating Committee also engages professional search firms to help identify potential Independent Trustee candidates who have the experience, qualifications, attributes, and skills consistent with the Statement of Policy. From time to time, additional criteria based on the composition and skills of the current Independent Trustees, as well as experience or skills that may be appropriate in light of future changes to board composition, business conditions, and regulatory or other developments, have also been considered by the professional search firms and the Governance and Nominating Committee. In addition, the Board takes into account the Trustees' commitment and participation in Board and committee meetings, as well as their leadership of standing and ad hoc committees throughout their tenure.
In determining that a particular Trustee was and continues to be qualified to serve as a Trustee, the Board has considered a variety of criteria, none of which, in isolation, was controlling. The Board believes that, collectively, the Trustees have balanced and diverse experience, qualifications, attributes, and skills, which allow the Board to operate effectively in governing the fund and protecting the interests of shareholders. Information about the specific experience, skills, attributes, and qualifications of each Trustee, which in each case led to the Board's conclusion that the Trustee should serve (or continue to serve) as a trustee of the fund, is provided below.
Board Structure and Oversight Function. James C. Curvey is an interested person and currently serves as Chairman. The Trustees have determined that an interested Chairman is appropriate and benefits shareholders because an interested Chairman has a personal and professional stake in the quality and continuity of services provided to the fund. Independent Trustees exercise their informed business judgment to appoint an individual of their choosing to serve as Chairman, regardless of whether the Trustee happens to be independent or a member of management. The Independent Trustees have determined that they can act independently and effectively without having an Independent Trustee serve as Chairman and that a key structural component for assuring that they are in a position to do so is for the Independent Trustees to constitute a substantial majority for the Board. The Independent Trustees also regularly meet in executive session. Ned C. Lautenbach serves as Chairman of the Independent Trustees and as such (i) acts as a liaison between the Independent Trustees and management with respect to matters important to the Independent Trustees and (ii) with management prepares agendas for Board meetings.
Fidelity® funds are overseen by different Boards of Trustees. The fund's Board oversees Fidelity's high income and certain equity funds, and other Boards oversee Fidelity's investment-grade bond, money market, asset allocation, and sector funds. The asset allocation funds may invest in Fidelity® funds overseen by the fund's Board. The use of separate Boards, each with its own committee structure, allows the Trustees of each group of Fidelity® funds to focus on the unique issues of the funds they oversee, including common research, investment, and operational issues. On occasion, the separate Boards establish joint committees to address issues of overlapping consequences for the Fidelity® funds overseen by each Board.
The Trustees operate using a system of committees to facilitate the timely and efficient consideration of all matters of importance to the Trustees, the fund, and fund shareholders and to facilitate compliance with legal and regulatory requirements and oversight of the fund's activities and associated risks. The Board, acting through its committees, has charged FMR and its affiliates with (i) identifying events or circumstances the occurrence of which could have demonstrably adverse effects on the fund's business and/or reputation; (ii) implementing processes and controls to lessen the possibility that such events or circumstances occur or to mitigate the effects of such events or circumstances if they do occur; and (iii) creating and maintaining a system designed to evaluate continuously business and market conditions in order to facilitate the identification and implementation processes described in (i) and (ii) above. Because the day-to-day operations and activities of the fund are carried out by or through FMR, its affiliates, and other service providers, the fund's exposure to risks is mitigated but not eliminated by the processes overseen by the Trustees. While each of the Board's committees has responsibility for overseeing different aspects of the fund's activities, oversight is exercised primarily through the Operations, Audit, and Compliance Committees. In addition, the Independent Trustees have worked with FMR to enhance the Board's oversight of investment and financial risks, legal and regulatory risks, technology risks, and operational risks, including the development of additional risk reporting to the Board. For example, a working group comprised of Independent Trustees and FMR has worked and continues to work to review the Fidelity® funds' valuation-related activities, reporting and risk management. Appropriate personnel, including but not limited to the fund's Chief Compliance Officer (CCO), FMR's internal auditor, the independent accountants, the fund's Treasurer and portfolio management personnel, make periodic reports to the Board's committees, as appropriate, including an annual review of Fidelity's risk management program for the Fidelity® funds. The responsibilities of each standing committee, including their oversight responsibilities, are described further under "Standing Committees of the Trustees."
Interested Trustees*:
Correspondence intended for a Trustee who is an interested person may be sent to Fidelity Investments, 245 Summer Street, Boston, Massachusetts 02210.
Name, Year of Birth; Principal Occupations and Other Relevant Experience+
James C. Curvey (1935)
Year of Election or Appointment: 2007
Trustee
Chairman of the Board of Trustees
Mr. Curvey also serves as Trustee of other Fidelity® funds. Mr. Curvey is a Director of Fidelity Research & Analysis Co. (investment adviser firm, 2009-present), and Vice Chairman (2007-present) and Director of FMR LLC (diversified financial services company). In addition, Mr. Curvey serves as an Overseer for the Boston Symphony Orchestra and a member of the board of Artis-Naples, Naples, Florida, and as a Trustee for Brewster Academy, Wolfeboro, New Hampshire. Previously, Mr. Curvey served as a Director of Fidelity Investments Money Management, Inc. (investment adviser firm, 2009-2014) and a Director of FMR and FMR Co., Inc. (investment adviser firms, 2007-2014).
Charles S. Morrison (1960)
Year of Election or Appointment: 2014
Trustee
Mr. Morrison also serves as Trustee of other funds. He serves as a Director of Fidelity Investments Money Management, Inc. (FIMM) (investment adviser firm, 2014-present), Director of Fidelity SelectCo, LLC (investment adviser firm, 2014-present), President, Asset Management (2014-present), and is an employee of Fidelity Investments. Previously, Mr. Morrison served as Vice President of Fidelity's Fixed Income and Asset Allocation Funds (2012-2014), President, Fixed Income (2011-2014), Vice President of Fidelity's Money Market Funds (2005-2009), President, Money Market Group Leader of FMR (investment adviser firm, 2009), and Senior Vice President, Money Market Group of FMR (2004-2009). Mr. Morrison also served as Vice President of Fidelity's Bond Funds (2002-2005), certain Balanced Funds (2002-2005), and certain Asset Allocation Funds (2002-2007), and as Senior Vice President (2002-2005) of Fidelity's Bond Division.
* Determined to be an “Interested Trustee” by virtue of, among other things, his or her affiliation with the trust or various entities under common control with FMR.
+ The information includes the Trustee's principal occupation during the last five years and other information relating to the experience, attributes, and skills relevant to the Trustee's qualifications to serve as a Trustee, which led to the conclusion that the Trustee should serve as a Trustee for the fund.
Independent Trustees:
Correspondence intended for an Independent Trustee may be sent to Fidelity Investments, P.O. Box 55235, Boston, Massachusetts 02205-5235.
Name, Year of Birth; Principal Occupations and Other Relevant Experience+
Dennis J. Dirks (1948)
Year of Election or Appointment: 2005
Trustee
Mr. Dirks also serves as Trustee of other Fidelity® funds. Prior to his retirement in May 2003, Mr. Dirks was Chief Operating Officer and a member of the Board of The Depository Trust & Clearing Corporation (DTCC). He also served as President, Chief Operating Officer, and Board member of The Depository Trust Company (DTC) and President and Board member of the National Securities Clearing Corporation (NSCC). In addition, Mr. Dirks served as Chief Executive Officer and Board member of the Government Securities Clearing Corporation, Chief Executive Officer and Board member of the Mortgage-Backed Securities Clearing Corporation, as a Trustee and a member of the Finance Committee of Manhattan College (2005-2008), as a Trustee and a member of the Finance Committee of AHRC of Nassau County (2006-2008), and as a member of the Independent Directors Council (IDC) Governing Council (2010-2015). Mr. Dirks is a member of the Board of Directors for The Brookville Center for Children's Services, Inc. (2009-present).
Alan J. Lacy (1953)
Year of Election or Appointment: 2008
Trustee
Mr. Lacy also serves as Trustee of other Fidelity® funds. Mr. Lacy serves as a member of the Board of Directors of Dave & Buster's Entertainment, Inc. (restaurant and entertainment complexes, 2010-present) and Bristol-Myers Squibb Company (global pharmaceuticals, 2008-present). In addition, Mr. Lacy served as Senior Adviser (2007-2014) of Oak Hill Capital Partners, L.P. (private equity) and also served as Chief Executive Officer (2000-2005) and Vice Chairman (2005-2006) of Sears Holdings Corporation and Sears, Roebuck and Co. (retail). Mr. Lacy is a member of the Board of Trustees of The National Parks Conservation Association (2006-present). Previously, Mr. Lacy served as Chairman of the Board of Trustees of the National Parks Conservation Association (2008-2011) and as a member of the Board of Directors for The Western Union Company (global money transfer, 2006-2011), The Hillman Companies, Inc. (hardware wholesalers, 2010-2014), and Earth Fare, Inc. (retail grocery, 2010-2014).
Ned C. Lautenbach (1944)
Year of Election or Appointment: 2000
Trustee
Chairman of the Independent Trustees
Mr. Lautenbach also serves as Trustee of other Fidelity® funds. Mr. Lautenbach currently serves as the Lead Director of the Eaton Corporation Board of Directors (diversified industrial, 1997-present). Mr. Lautenbach is Chairman of the Board of Directors of Artis-Naples in Naples, Florida (2012-present), a member of the Council on Foreign Relations (1994-present), and a member of the Board of Governors, State University System of Florida (2013-present). Previously, Mr. Lautenbach was a Partner/Advisory Partner at Clayton, Dubilier & Rice, LLC (private equity investment, 1998-2010), as well as a Director of Sony Corporation (2006-2007).
Joseph Mauriello (1944)
Year of Election or Appointment: 2008
Trustee
Mr. Mauriello also serves as Trustee of other Fidelity® funds. Prior to his retirement in January 2006, Mr. Mauriello served in numerous senior management positions including Deputy Chairman and Chief Operating Officer (2004-2005), and Vice Chairman of Financial Services (2002-2004) of KPMG LLP US (professional services, 1965-2005). Mr. Mauriello currently serves as a member of the Board of Directors of XL Group plc. (global insurance and re-insurance, 2006-present) and the Independent Directors Council (IDC) Governing Council (2015-present). Previously, Mr. Mauriello served as a Director of the Hamilton Funds of the Bank of New York (2006-2007) and of Arcadia Resources Inc. (health care services and products, 2007-2012).
Robert W. Selander (1950)
Year of Election or Appointment: 2011
Trustee
Mr. Selander also serves as Trustee of other Fidelity® funds. Mr. Selander serves as a Director of The Western Union Company (global money transfer, 2014-present). Previously, Mr. Selander served as a Member of the Advisory Board of other Fidelity® funds (2011), and Executive Vice Chairman (2010), Chief Executive Officer (2009-2010), and President and Chief Executive Officer (1997-2009) of Mastercard, Inc.
Cornelia M. Small (1944)
Year of Election or Appointment: 2005
Trustee
Ms. Small also serves as Trustee of other Fidelity® funds. Ms. Small is a member of the Board of Directors (2009-present) and Chair of the Investment Committee (2010-present) of the Teagle Foundation. Ms. Small also serves on the Investment Committee of the Berkshire Taconic Community Foundation (2008-present). Previously, Ms. Small served as Chairperson (2002-2008) and a member of the Investment Committee and Chairperson (2008-2012) and a member of the Board of Trustees of Smith College. In addition, Ms. Small served as Chief Investment Officer, Director of Global Equity Investments, and a member of the Board of Directors of Scudder, Stevens & Clark and Scudder Kemper Investments.
William S. Stavropoulos (1939)
Year of Election or Appointment: 2002
Trustee
Vice Chairman of the Independent Trustees
Mr. Stavropoulos also serves as Trustee of other Fidelity® funds. Mr. Stavropoulos serves as President and Founder of the Michigan Baseball Foundation, the Great Lakes Loons (2007-present). Mr. Stavropoulos is Chairman Emeritus of the Board of Directors of The Dow Chemical Company, where he previously served in numerous senior management positions, including President, CEO (1995-2000; 2002-2004), Chairman of the Executive Committee (2000-2006), and as a member of the Board of Directors (1990-2006). Currently, Mr. Stavropoulos is Chairman of the Board of Directors of Univar Inc. (global distributor of commodity and specialty chemicals), a Director of Teradata Corporation (data warehousing and technology solutions), and Maersk Inc. (industrial conglomerate), and a member of the Advisory Board for Metalmark Capital LLC (private equity investment, 2005-present). Mr. Stavropoulos is an operating advisor to Clayton, Dubilier & Rice, LLC (private equity investment). In addition, Mr. Stavropoulos is a member of the University of Notre Dame Advisory Council for the College of Science, a Trustee of the Rollin L. Gerstacker Foundation, and a Director of the Naples Philharmonic Center for the Arts. Previously, Mr. Stavropoulos served as a Director of Chemical Financial Corporation (bank holding company, 1993-2012) and Tyco International, Ltd. (multinational manufacturing and services, 2007-2012).
David M. Thomas (1949)
Year of Election or Appointment: 2008
Trustee
Mr. Thomas also serves as Trustee of other Fidelity® funds. Mr. Thomas serves as Non-Executive Chairman of the Board of Directors of Fortune Brands Home and Security (home and security products, 2011-present), as a member of the Board of Directors (2004-present) and Presiding Director (2013-present) of Interpublic Group of Companies, Inc. (marketing communication), and as a member of the Board of Trustees of the University of Florida (2013-present). Previously, Mr. Thomas served as Executive Chairman (2005-2006) and Chairman and Chief Executive Officer (2000-2005) of IMS Health, Inc. (pharmaceutical and healthcare information solutions), and a Director of Fortune Brands, Inc. (consumer products, 2000-2011).
+ The information includes the Trustee's principal occupation during the last five years and other information relating to the experience, attributes, and skills relevant to the Trustee's qualifications to serve as a Trustee, which led to the conclusion that the Trustee should serve as a Trustee for the fund.
Advisory Board Members and Officers:
Correspondence intended for an officer or Peter S. Lynch may be sent to Fidelity Investments, 245 Summer Street, Boston, Massachusetts 02210. Officers appear below in alphabetical order.
Name, Year of Birth; Principal Occupation
Peter S. Lynch (1944)
Year of Election or Appointment: 2003
Member of the Advisory Board
Mr. Lynch also serves as Member of the Advisory Board of other Fidelity® funds. Mr. Lynch is Vice Chairman and a Director of FMR (investment adviser firm) and FMR Co., Inc. (investment adviser firm). In addition, Mr. Lynch serves as a Trustee of Boston College and as the Chairman of the Inner-City Scholarship Fund. Previously, Mr. Lynch served on the Special Olympics International Board of Directors (1997-2006).
Elizabeth Paige Baumann (1968)
Year of Election or Appointment: 2012
Anti-Money Laundering (AML) Officer
Ms. Baumann also serves as AML Officer of other funds. She is Chief AML Officer of FMR LLC (diversified financial services company, 2012-present) and is an employee of Fidelity Investments. Previously, Ms. Baumann served as Vice President and Deputy Anti-Money Laundering Officer (2007-2012).
Marc R. Bryant (1966)
Year of Election or Appointment: 2015
Secretary and Chief Legal Officer (CLO)
Mr. Bryant also serves as Secretary and CLO of other funds. Mr. Bryant serves as CLO, Secretary, and Senior Vice President of Fidelity Management & Research Company (investment adviser firm, 2015-present) and FMR Co., Inc. (investment adviser firm, 2015-present); Secretary of Fidelity SelectCo, LLC (investment adviser firm, 2015-present) and Fidelity Investments Money Management, Inc. (investment adviser firm, 2015-present); and CLO of Fidelity Management & Research (Hong Kong) Limited (investment adviser firm, 2015-present). He is Senior Vice President and Deputy General Counsel of FMR LLC (diversified financial services company). Previously, Mr. Bryant served as Secretary and CLO of Fidelity Rutland Square Trust II (2010-2014) and Assistant Secretary of Fidelity's Fixed Income and Asset Allocation Funds (2013-2015). Prior to joining Fidelity Investments, Mr. Bryant served as a Senior Vice President and the Head of Global Retail Legal for AllianceBernstein L.P. (2006-2010), and as the General Counsel for ProFund Advisors LLC (2001-2006).
William C. Coffey (1969)
Year of Election or Appointment: 2009
Assistant Secretary
Mr. Coffey also serves as Assistant Secretary of other funds. He is Senior Vice President and Deputy General Counsel of FMR LLC (diversified financial services company, 2010-present), and is an employee of Fidelity Investments. Previously, Mr. Coffey served as Vice President and Associate General Counsel of FMR LLC (2005-2009).
Jonathan Davis (1968)
Year of Election or Appointment: 2010
Assistant Treasurer
Mr. Davis also serves as Assistant Treasurer of other funds, and is an employee of Fidelity Investments. Previously, Mr. Davis served as Vice President and Associate General Counsel of FMR LLC (diversified financial services company, 2003-2010).
Adrien E. Deberghes (1967)
Year of Election or Appointment: 2008
Deputy Treasurer
Mr. Deberghes also serves as an officer of other funds. He is an employee of Fidelity Investments (2008-present). Prior to joining Fidelity Investments, Mr. Deberghes was Senior Vice President of Mutual Fund Administration at State Street Corporation (2007-2008), Senior Director of Mutual Fund Administration at Investors Bank & Trust (2005-2007), and Director of Finance for Dunkin' Brands (2000-2005).
Stephanie J. Dorsey (1969)
Year of Election or Appointment: 2010
Assistant Treasurer
Ms. Dorsey also serves as an officer of other funds. She is an employee of Fidelity Investments (2008-present) and has served in other fund officer roles. Prior to joining Fidelity Investments, Ms. Dorsey served as Treasurer (2004-2008) of the JPMorgan Mutual Funds and Vice President (2004-2008) of JPMorgan Chase Bank.
Howard J. Galligan III (1966)
Year of Election or Appointment: 2014
Chief Financial Officer
Mr. Galligan also serves as Chief Financial Officer of other funds. Mr. Galligan serves as President of Fidelity Pricing and Cash Management Services (FPCMS) (2014-present) and as a Director of Strategic Advisers, Inc. (investment adviser firm, 2008-present). Previously, Mr. Galligan served as Chief Administrative Officer of Asset Management (2011-2014) and Chief Operating Officer and Senior Vice President of Investment Support for Strategic Advisers, Inc. (2003-2011).
Scott C. Goebel (1968)
Year of Election or Appointment: 2015
Vice President
Mr. Goebel serves as Vice President of other funds and is an employee of Fidelity Investments (2001-present). Previously, Mr. Goebel served as Secretary of Fidelity SelectCo, LLC (investment adviser firm, 2013-2015), Fidelity Investments Money Management, Inc. (FIMM) (investment adviser firm, 2010-2015), and Fidelity Research and Analysis Company (FRAC) (investment adviser firm, 2010-2015); General Counsel, Secretary, and Senior Vice President of Fidelity Management & Research Company (investment adviser firm, 2008-2015) and FMR Co., Inc. (investment adviser firm, 2008-2015); Assistant Secretary of Fidelity Management & Research (Japan) Limited (investment adviser firm, 2008-2015) and FMR Investment Management (U.K.) Limited (investment adviser firm, 2008-2015); Chief Legal Officer (CLO) of Fidelity Management & Research (Hong Kong) Limited (investment adviser firm, 2008-2015); Secretary and CLO of certain Fidelity® funds (2008-2015); Assistant Secretary of FIMM (2008-2010), FRAC (2008-2010), and certain funds (2007-2008); and as Vice President and Secretary of Fidelity Distributors Corporation (FDC) (2005-2007).
Thomas C. Hense (1964)
Year of Election or Appointment: 2008, 2010, or 2015
Vice President
Mr. Hense serves as Vice President of Fidelity Advisor® Multi-Asset Income Fund (2015) and other funds (High Income (2008), Small Cap (2008), and Value (2010) funds), and is an employee of Fidelity Investments (1993-present). Previously, Mr. Hense served as a portfolio manager for Fidelity's Institutional Money Management Group (Pyramis) (2003-2008).
Brian B. Hogan (1964)
Year of Election or Appointment: 2009
Vice President
Mr. Hogan also serves as Trustee or Vice President of other funds. Mr. Hogan serves as a Director of Fidelity SelectCo, LLC (investment adviser firm, 2014-present) and President of the Equity Division of FMR (investment adviser firm, 2009-present). Previously, Mr. Hogan served as Senior Vice President, Equity Research of FMR (2006-2009) and as a portfolio manager.
Chris Maher (1972)
Year of Election or Appointment: 2013
Assistant Treasurer
Mr. Maher serves as Assistant Treasurer of other funds. Mr. Maher is Vice President of Valuation Oversight and is an employee of Fidelity Investments. Previously, Mr. Maher served as Vice President of Asset Management Compliance (2013), Vice President of the Program Management Group of FMR (investment adviser firm, 2010-2013), and Vice President of Valuation Oversight (2008-2010).
Kenneth B. Robins (1969)
Year of Election or Appointment: 2008
President and Treasurer
Mr. Robins also serves as an officer of other funds. Mr. Robins serves as Executive Vice President of Fidelity Investments Money Management, Inc. (FIMM) (investment adviser firm, 2013-present) and is an employee of Fidelity Investments (2004-present). Previously, Mr. Robins served in other fund officer roles.
Stacie M. Smith (1974)
Year of Election or Appointment: 2013
Deputy Treasurer
Ms. Smith also serves as an officer of other funds. She is an employee of Fidelity Investments (2009-present) and has served in other fund officer roles. Prior to joining Fidelity Investments, Ms. Smith served as Senior Audit Manager of Ernst & Young LLP (1996-2009).
Renee Stagnone (1975)
Year of Election or Appointment: 2013
Deputy Treasurer
Ms. Stagnone also serves as Deputy Treasurer of other funds. Ms. Stagnone is an employee of Fidelity Investments (1997-present).
Linda J. Wondrack (1964)
Year of Election or Appointment: 2014
Chief Compliance Officer
Ms. Wondrack also serves as Chief Compliance Officer of other funds. Ms. Wondrack is Executive Vice President and head of the Ethics Office and Asset Management Compliance for Fidelity Investments (2012-present). Ms. Wondrack also serves as Chief Compliance Officer of Fidelity SelectCo, LLC (investment adviser firm, 2014-present); Chief Compliance Officer of Impresa Management LLC (2013-present); and Chief Compliance Officer of FMR Co., Inc. (investment adviser firm), Fidelity Investments Money Management, Inc. (investment adviser firm), Fidelity Management & Research (Japan) Limited (investment adviser firm), FMR Investment Management (U.K.) Limited (investment adviser firm), Fidelity Management & Research (Hong Kong) (investment adviser firm), Fidelity Management & Research Company (investment adviser firm), FIAM LLC (investment adviser firm), and Strategic Advisers, Inc. (investment adviser firm), Ballyrock Investment Advisors LLC, and Northern Neck Investors LLC (2012-present). Previously, Ms. Wondrack served as Senior Vice President and Chief Compliance Officer for Columbia Management Investment Advisers, LLC (2005-2012); Chief Compliance Officer for certain funds within the Columbia Family of Funds (2007-2012); and Senior Vice President of Compliance Risk Management at Bank of America (2005-2010).
Joseph F. Zambello (1957)
Year of Election or Appointment: 2011
Deputy Treasurer
Mr. Zambello also serves as Deputy Treasurer of other funds. Mr. Zambello is an employee of Fidelity Investments (1991-present). Previously, Mr. Zambello served as Vice President of the Program Management Group of FMR (investment adviser firm, 2009-2011) and Vice President of the Transfer Agent Oversight Group (2005-2009).
Shareholder Expense Example
As a shareholder of the Fund, you incur two types of costs: (1) transaction costs, including sales charges (loads) on purchase payments or redemption proceeds, and (2) ongoing costs, including management fees, distribution and/or service (12b-1) fees and other Fund expenses. This Example is intended to help you understand your ongoing costs (in dollars) of investing in the Fund and to compare these costs with the ongoing costs of investing in other mutual funds.
The Example is based on an investment of $1,000 invested at the beginning of the period and held for the entire period (June 1, 2015 to November 30, 2015).
Actual Expenses
The first line of the accompanying table for each class of the Fund provides information about actual account values and actual expenses. You may use the information in this line, together with the amount you invested, to estimate the expenses that you paid over the period. Simply divide your account value by $1,000.00 (for example, an $8,600 account value divided by $1,000.00 = 8.6), then multiply the result by the number in the first line for a class of the Fund under the heading entitled "Expenses Paid During Period" to estimate the expenses you paid on your account during this period. In addition, the Fund, as a shareholder in the underlying Fidelity Central Funds, will indirectly bear its pro-rata share of the fees and expenses incurred by the underlying Fidelity Central Funds. These fees and expenses are not included in the Fund's annualized expense ratio used to calculate the expense estimate in the table below.
Hypothetical Example for Comparison Purposes
The second line of the accompanying table for each class of the Fund provides information about hypothetical account values and hypothetical expenses based on a Class' actual expense ratio and an assumed rate of return of 5% per year before expenses, which is not the Class' actual return. The hypothetical account values and expenses may not be used to estimate the actual ending account balance or expenses you paid for the period. You may use this information to compare the ongoing costs of investing in the Fund and other funds. To do so, compare this 5% hypothetical example with the 5% hypothetical examples that appear in the shareholder reports of the other funds. In addition, the Fund, as a shareholder in the underlying Fidelity Central Funds, will indirectly bear its pro-rata share of the fees and expenses incurred by the underlying Fidelity Central Funds. These fees and expenses are not included in the Fund's annualized expense ratio used to calculate the expense estimate in the table below.
Please note that the expenses shown in the table are meant to highlight your ongoing costs only and do not reflect any transaction costs. Therefore, the second line of the table is useful in comparing ongoing costs only, and will not help you determine the relative total costs of owning different funds. In addition, if these transactional costs were included, your costs would have been higher.
| Annualized Expense Ratio-A | Beginning Account Value June 1, 2015 | Ending Account Value November 30, 2015 | Expenses Paid During Period-B June 1, 2015 to November 30, 2015 | |
| Class A | .94% | |||
| Actual | $1,000.00 | $944.20 | $4.58 | |
| Hypothetical-C | $1,000.00 | $1,020.36 | $4.76 | |
| Class T | 1.17% | |||
| Actual | $1,000.00 | $943.00 | $5.70 | |
| Hypothetical-C | $1,000.00 | $1,019.20 | $5.92 | |
| Class B | 1.78% | |||
| Actual | $1,000.00 | $939.90 | $8.66 | |
| Hypothetical-C | $1,000.00 | $1,016.14 | $9.00 | |
| Class C | 1.71% | |||
| Actual | $1,000.00 | $940.30 | $8.32 | |
| Hypothetical-C | $1,000.00 | $1,016.50 | $8.64 | |
| Class I | .68% | |||
| Actual | $1,000.00 | $945.20 | $3.32 | |
| Hypothetical-C | $1,000.00 | $1,021.66 | $3.45 | |
| Class Z | .54% | |||
| Actual | $1,000.00 | $946.30 | $2.63 | |
| Hypothetical-C | $1,000.00 | $1,022.36 | $2.74 |
A Annualized expense ratio reflects expenses net of applicable fee waivers.
B Expenses are equal to each Class' annualized expense ratio, multiplied by the average account value over the period, multiplied by 183/365 (to reflect the one-half year period).
C 5% return per year before expenses
Distributions (Unaudited)
The Board of Trustees of Fidelity Advisor Equity Income Fund voted to pay to shareholders of record at the opening of business on record date, the following distributions per share derived from capital gains realized from sales of portfolio securities, and dividends derived from net investment income:
| Pay Date | Record Date | Dividends | Capital Gains | |
| Class I | 12/14/15 | 12/11/15 | $0.369 | $1.823 |
| Class I | 01/19/16 | 01/15/16 | $0.000 | $0.283 |
The fund hereby designates as a capital gain dividend with respect to the taxable year ended November 30, 2015, $144,048,258, or, if subsequently determined to be different, the net capital gain of such year.
A total of 0.04% of the dividends distributed during the fiscal year was derived from interest on U.S. Government securities which is generally exempt from state income tax.
Class I designates 76%, 100%, 100% and 100% of the dividends distributed in December 2014, April 2015, July 2015 and October 2015, respectively during the fiscal year as qualifying for the dividends-received deduction for corporate shareholders.
Class I designates 100% of the dividends distributed during the fiscal year as amounts which may be taken into account as a dividend for purposes of the maximum rate under section 1(h) (11) of the Internal Revenue Code.
The fund will notify shareholders in January 2016 of amounts for use in preparing 2015 income tax returns.
Board Approval of Investment Advisory Contracts and Management Fees
Fidelity Advisor Equity Income Fund
Each year, the Board of Trustees, including the Independent Trustees (together, the Board), votes on the renewal of the management contract with Fidelity Management & Research Company (FMR) and the sub-advisory agreements (together, the Advisory Contracts) for the fund. The Board, assisted by the advice of fund counsel and Independent Trustees' counsel, requests and considers a broad range of information relevant to the renewal of the Advisory Contracts throughout the year.
The Board meets regularly and, at each of its meetings, covers an extensive agenda of topics and materials and considers factors that are relevant to its annual consideration of the renewal of the fund's Advisory Contracts, including the services and support provided to the fund and its shareholders. The Board has established various standing committees (Committees), each composed of and chaired by Independent Trustees with varying backgrounds, to which the Board has assigned specific subject matter responsibilities in order to enhance effective decision-making by the Board. The Board, acting directly and through its Committees, requests and receives information concerning the annual consideration of the renewal of the fund's Advisory Contracts. The Board also meets as needed to consider matters specifically related to the Board's annual consideration of the renewal of the Advisory Contracts. Members of the Board may also meet with trustees of other Fidelity funds through ad hoc joint committees to discuss certain matters relevant to all of the Fidelity funds.
At its July 2015 meeting, the Board unanimously determined to renew the fund's Advisory Contracts. In reaching its determination, the Board considered all factors it believed relevant, including (i) the nature, extent, and quality of the services to be provided to the fund and its shareholders (including the investment performance of the fund); (ii) the competitiveness of the fund's management fee and total expense ratio relative to peer funds; (iii) the total costs of the services to be provided by and the profits to be realized by Fidelity from its relationship with the fund; and (iv) the extent to which (if any) economies of scale exist and would be realized as the fund grows, and whether any economies of scale are appropriately shared with fund shareholders.
In considering whether to renew the Advisory Contracts for the fund, the Board reached a determination, with the assistance of fund counsel and Independent Trustees' counsel and through the exercise of its business judgment, that the renewal of the Advisory Contracts was in the best interests of the fund and its shareholders and that the compensation payable under the Advisory Contracts was fair and reasonable. The Board's decision to renew the Advisory Contracts was not based on any single factor, but rather was based on a comprehensive consideration of all the information provided to the Board at its meetings throughout the year. The Board, in reaching its determination to renew the Advisory Contracts, was aware that shareholders of the fund have a broad range of investment choices available to them, including a wide choice among funds offered by Fidelity's competitors, and that the fund's shareholders, who have the opportunity to review and weigh the disclosure provided by the fund in its prospectus and other public disclosures, have chosen to invest in this fund, which is part of the Fidelity family of funds.
Nature, Extent, and Quality of Services Provided. The Board considered Fidelity's staffing as it relates to the fund, including the backgrounds of investment personnel of Fidelity, and also considered the fund's investment objective, strategies, and related investment philosophy. The Independent Trustees also had discussions with senior management of Fidelity's investment operations and investment groups. The Board considered the structure of the portfolio manager compensation program and whether this structure provides appropriate incentives to act in the best interests of the fund. Additionally, the Board considered the portfolio managers' investments, if any, in the funds that they manage.Resources Dedicated to Investment Management and Support Services. The Board and the Fund Oversight and Research Committees reviewed the general qualifications and capabilities of Fidelity's investment staff, including its size, education, experience, and resources, as well as Fidelity's approach to recruiting, training, managing, and compensating investment personnel. The Board noted that Fidelity has continued to increase the resources devoted to non-U.S. offices, including expansion of Fidelity's global investment organization. The Board also noted that Fidelity's analysts have extensive resources, tools and capabilities that allow them to conduct sophisticated quantitative and fundamental analysis, as well as credit analysis of issuers, counterparties and guarantors. Further, the Board considered that Fidelity's investment professionals have sufficient access to global information and data so as to provide competitive investment results over time, and that those professionals also have access to sophisticated tools that permit them to assess portfolio construction and risk and performance attribution characteristics continuously, as well as to transmit new information and research conclusions rapidly around the world. Additionally, in its deliberations, the Board considered Fidelity's trading, risk management, and compliance capabilities and resources, which are integral parts of the investment management process.Shareholder and Administrative Services. The Board considered (i) the nature, extent, quality, and cost of advisory, administrative, and shareholder services performed by FMR, the sub-advisers (together with FMR, the Investment Advisers), and their affiliates under the Advisory Contracts and under separate agreements covering transfer agency, pricing and bookkeeping, and securities lending services for the fund; (ii) the nature and extent of the supervision of third party service providers, principally custodians and subcustodians; and (iii) the resources devoted to, and the record of compliance with, the fund's compliance policies and procedures. The Board also reviewed the allocation of fund brokerage, including allocations to brokers affiliated with the Investment Advisers, the use of brokerage commissions to pay fund expenses, and the use of "soft" commission dollars to pay for research services.The Board noted that the growth of fund assets over time across the complex allows Fidelity to reinvest in the development of services designed to enhance the value or convenience of the Fidelity funds as investment vehicles. These services include 24-hour access to account information and market information through telephone representatives and over the Internet, investor education materials and asset allocation tools, and the expanded availability of Fidelity Investor Centers.In 2014, the Board formed an ad hoc Committee on Transfer Agency Fees to review the variety of transfer agency fee structures throughout the industry and Fidelity's competitive positioning with respect to industry participants.Investment in a Large Fund Family. The Board considered the benefits to shareholders of investing in a Fidelity fund, including the benefits of investing in a fund that is part of a large family of funds offering a variety of investment disciplines and providing a large variety of mutual fund investor services. The Board noted that Fidelity had taken, or had made recommendations that resulted in the Fidelity funds taking, a number of actions over the previous year that benefited particular funds, including (i) continuing to dedicate additional resources to investment research and to the support of the senior management team that oversees asset management; (ii) continuing efforts to enhance Fidelity's global research capabilities; (iii) launching new funds and making other enhancements to meet client needs; (iv) reducing management fees and total expenses for certain index funds and diversified international funds; (v) continuing to launch dedicated lower cost underlying funds to meet portfolio construction needs related to expanding underlying fund options for Fidelity funds of funds, specifically for the Freedom Fund product lines; (vi) rationalizing product lines and gaining increased efficiencies through fund mergers; (vii) launching active fixed-income exchange-traded funds; (viii) continuing to develop, acquire and implement systems and technology to improve services to the funds and information security and to increase efficiency; (ix) implementing investment enhancements to further strengthen Fidelity's target date product line to increase investors' probability of success in achieving their goals; (x) modifying the eligibility criteria for certain share classes to accommodate roll-over assets from employer-sponsored retirement plans; (xi) launching a new Class W of the Freedom Index Funds to attract and retain Fidelity record-kept retirement plan assets; and (xii) implementing changes to Fidelity's money market product line in response to recent money market regulatory reforms.Investment Performance. The Board considered whether the fund has operated in accordance with its investment objective, as well as its record of compliance with its investment restrictions and its performance history.The Board took into account discussions with representatives of the Investment Advisers about fund investment performance that occur at Board meetings throughout the year. In this regard the Board noted that as part of regularly scheduled fund reviews and other reports to the Board on fund performance, the Board considers annualized return information for the fund, for different time periods, measured against a securities market index ("benchmark index") and a peer group of funds with similar objectives ("peer group"), if any. In its evaluation of fund investment performance, the Board gave particular attention to information indicating changes in performance of certain Fidelity funds for specific time periods and discussed with the Investment Advisers the reasons for any overperformance or underperformance.In addition to reviewing absolute and relative fund performance, the Independent Trustees periodically consider the appropriateness of fund performance metrics in evaluating the results achieved. In general, the Independent Trustees believe that fund performance should be evaluated based on net performance (after fees and expenses) of both the highest performing and lowest performing fund share classes, where applicable, compared to appropriate benchmark indices, over appropriate time periods that may include full market cycles, and compared to peer groups, as applicable, over the same periods, taking into account relevant factors including the following: general market conditions; issuer-specific information; and fund cash flows and other factors.The Independent Trustees recognize that shareholders evaluate performance on a net basis over their own holding periods, for which one-, three-, and five-year periods are often used as a proxy. For this reason, the performance information reviewed by the Board also included net cumulative calendar year total return information for the fund and an appropriate benchmark index and peer group for the most recent one-, three-, and five-year periods, as shown below. Returns are shown compared to the 25th percentile (top of box, 75% beaten) and 75th percentile (bottom of box, 25% beaten) of the peer universe.Fidelity Advisor Equity Income Fund
Fidelity Advisor Equity Income Fund
![]()
EPII-ANN-0116
1.539450.118
Fidelity Advisor® Small Cap Fund Class I (formerly Institutional Class) Annual Report November 30, 2015 |
|
Contents
Board Approval of Investment Advisory Contracts and Management Fees |
To view a fund's proxy voting guidelines and proxy voting record for the 12-month period ended June 30, visit http://www.fidelity.com/proxyvotingresults or visit the Securities and Exchange Commission's (SEC) web site at http://www.sec.gov.
You may also call 1-877-208-0098 to request a free copy of the proxy voting guidelines.
Standard & Poor's, S&P and S&P 500 are registered service marks of The McGraw-Hill Companies, Inc. and have been licensed for use by Fidelity Distributors Corporation.
Other third-party marks appearing herein are the property of their respective owners.
All other marks appearing herein are registered or unregistered trademarks or service marks of FMR LLC or an affiliated company. © 2016 FMR LLC. All rights reserved.
This report and the financial statements contained herein are submitted for the general information of the shareholders of the Fund. This report is not authorized for distribution to prospective investors in the Fund unless preceded or accompanied by an effective prospectus.
A fund files its complete schedule of portfolio holdings with the SEC for the first and third quarters of each fiscal year on Form N-Q. Forms N-Q are available on the SEC’s web site at http://www.sec.gov. A fund's Forms N-Q may be reviewed and copied at the SEC’s Public Reference Room in Washington, DC. Information regarding the operation of the SEC's Public Reference Room may be obtained by calling 1-800-SEC-0330.
For a complete list of a fund's portfolio holdings, view the most recent holdings listing, semiannual report, or annual report on Fidelity's web site at http://www.fidelity.com, http://www.advisor.fidelity.com, or http://www.401k.com, as applicable.
NOT FDIC INSURED •MAY LOSE VALUE •NO BANK GUARANTEE
Neither the Fund nor Fidelity Distributors Corporation is a bank.
Performance: The Bottom Line
Average annual total return reflects the change in the value of an investment, assuming reinvestment of distributions from dividend income and capital gains (the profits earned upon the sale of securities that have grown in value, if any) and assuming a constant rate of performance each year.
The hypothetical investment and the average annual total returns do not reflect the deduction of taxes that a shareholder would pay on fund distributions or the redemption of fund shares.
During periods of reimbursement by Fidelity, a fund’s total return will be greater than it would be had the reimbursement not occurred.
How a fund did yesterday is no guarantee of how it will do tomorrow.
Average Annual Total Returns
| For the periods ended November 30, 2015 | Past 1 year | Past 5 years | Past 10 years |
| Class I | 4.46% | 11.09% | 8.28% |
$10,000 Over 10 Years
Let's say hypothetically that $10,000 was invested in Fidelity Advisor® Small Cap Fund - Class I on November 30, 2005.
The chart shows how the value of your investment would have changed, and also shows how the Russell 2000® Index performed over the same period.

| Period Ending Values | ||
| $22,147 | Fidelity Advisor® Small Cap Fund - Class I | |
| $20,242 | Russell 2000® Index | |
Management's Discussion of Fund Performance
Market Recap: U.S. stocks gained modestly for the 12 months ending November 30, 2015, despite a steep decline in August and September on concern about slowing economic growth in China. The S&P 500® index rebounded in October and gained 2.75% for the year. Stocks benefited late in the period amid waning expectations for a near-term interest-rate hike by the U.S. Federal Reserve, more economic stimulus in Europe and an interest-rate cut in China. Growth stocks in the benchmark far outpaced their value counterparts, as investors continued to seek growth in a subpar economic environment. Sector performance varied widely, with more than 26 percentage points separating the leader from the laggard. Consumer discretionary (+14%) secured the top spot, benefiting from a combination of rising personal income and still-benign inflation. Information technology (+7%) and health care (+4%) also outpaced the broad market. Conversely, the energy sector (-12%) performed worst, stymied by depressed commodity prices that also hit materials (-5%). Telecommunication services (-5%) and utilities (-4%), considered defensive sectors less sensitive to the economy, also lost ground. At period end, investors remained focused on the potential global implications of a stronger U.S. dollar and how China's transition toward a consumption-led economy may affect corporate earnings.Comments from Portfolio Manager James Harmon: For the year, a majority of the fund's share classes (excluding sales charges, if applicable) outperformed the 3.51% gain of the benchmark Russell 2000® Index. Relative to the benchmark, the fund benefited from strong security selection in the information technology, materials and consumer staples sectors. Global Payments, a provider of payment technology services, was a standout contributor. Also adding value were positions in Stamps.com, which allows businesses and consumers to print their own postage, and Zensar Technologies, an Indian IT outsourcing company. The fund's foreign holdings contributed to performance, despite the strength of the U.S. dollar. Although stock selection in health care detracted, a position in outpatient surgical center provider AmSurg was an exception. In contrast, weak stock selection in consumer discretionary nicked results, especially a position in Fossil Group, a maker of watches and other fashion accessories that was weighed down by business challenges at customer Michael Kors. Other meaningful detractors were conference call services provider West, and Genesco, a shoe and hat retailer no longer held at period end. Of the stocks mentioned, only Global Payments, Zensar and Fossil were not in the benchmark.The views expressed above reflect those of the portfolio manager(s) only through the end of the period as stated on the cover of this report and do not necessarily represent the views of Fidelity or any other person in the Fidelity organization. Any such views are subject to change at any time based upon market or other conditions and Fidelity disclaims any responsibility to update such views. These views may not be relied on as investment advice and, because investment decisions for a Fidelity fund are based on numerous factors, may not be relied on as an indication of trading intent on behalf of any Fidelity fund.
Investment Summary (Unaudited)
Top Ten Stocks as of November 30, 2015
| % of fund's net assets | % of fund's net assets 6 months ago | |
| CDW Corp. | 2.4 | 2.3 |
| Primerica, Inc. | 2.2 | 1.8 |
| Syntel, Inc. | 2.2 | 1.2 |
| West Corp. | 2.0 | 2.2 |
| Zensar Technologies Ltd. | 1.9 | 1.4 |
| The Ensign Group, Inc. | 1.9 | 1.8 |
| Global Payments, Inc. | 1.9 | 2.8 |
| CNO Financial Group, Inc. | 1.8 | 1.3 |
| United Therapeutics Corp. | 1.8 | 2.1 |
| Zebra Technologies Corp. Class A | 1.7 | 1.7 |
| 19.8 |
Top Five Market Sectors as of November 30, 2015
| % of fund's net assets | % of fund's net assets 6 months ago | |
| Information Technology | 22.4 | 21.4 |
| Financials | 21.3 | 21.0 |
| Industrials | 15.6 | 14.3 |
| Health Care | 13.1 | 14.4 |
| Consumer Discretionary | 8.9 | 14.9 |
Asset Allocation (% of fund's net assets)
| As of November 30, 2015* | ||
| Stocks, Investment Companies and Equity Futures | 98.6% | |
| Other Investments | 0.5% | |
| Short-Term Investments and Net Other Assets (Liabilities) | 0.9% | |

* Foreign investments - 15.4%
| As of May 31, 2015* | ||
| Stocks and Equity Futures | 98.9% | |
| Other Investments | 0.4% | |
| Short-Term Investments and Net Other Assets (Liabilities) | 0.7% | |

* Foreign investments - 14.2%
Investments November 30, 2015
Showing Percentage of Net Assets
| Common Stocks - 88.7% | |||
| Shares | Value (000s) | ||
| CONSUMER DISCRETIONARY - 8.9% | |||
| Auto Components - 0.1% | |||
| Horizon Global Corp. (a) | 292,022 | $2,538 | |
| Diversified Consumer Services - 1.2% | |||
| Meiko Network Japan Co. Ltd. (b) | 1,577,900 | 17,932 | |
| Tsukada Global Holdings, Inc. (b)(c) | 2,800,000 | 18,583 | |
| 36,515 | |||
| Household Durables - 0.8% | |||
| Tupperware Brands Corp. (c) | 440,000 | 24,979 | |
| Leisure Products - 0.8% | |||
| Smith & Wesson Holding Corp. (a) | 1,265,100 | 23,202 | |
| Media - 0.2% | |||
| Crown Media Holdings, Inc. Class A (a) | 1,006,821 | 5,709 | |
| Specialty Retail - 5.3% | |||
| Aarons, Inc. Class A | 1,072,000 | 26,017 | |
| Hibbett Sports, Inc. (a)(c) | 800,000 | 26,248 | |
| Jumbo SA | 303,981 | 3,099 | |
| Office Depot, Inc. (a) | 6,514,200 | 42,929 | |
| Sally Beauty Holdings, Inc. (a) | 1,000,000 | 25,860 | |
| Select Comfort Corp. (a) | 1,400,000 | 33,068 | |
| Staples, Inc. | 200,000 | 2,414 | |
| 159,635 | |||
| Textiles, Apparel & Luxury Goods - 0.5% | |||
| Fossil Group, Inc. (a)(c) | 400,000 | 15,388 | |
| TOTAL CONSUMER DISCRETIONARY | 267,966 | ||
| CONSUMER STAPLES - 2.7% | |||
| Food & Staples Retailing - 2.7% | |||
| Ain Holdings, Inc. | 115,000 | 5,409 | |
| Sundrug Co. Ltd. | 400,000 | 25,768 | |
| Tsuruha Holdings, Inc. | 425,000 | 37,977 | |
| United Natural Foods, Inc. (a) | 300,000 | 13,173 | |
| 82,327 | |||
| ENERGY - 2.1% | |||
| Energy Equipment & Services - 0.0% | |||
| Cathedral Energy Services Ltd. (b) | 3,363,407 | 1,461 | |
| Oil, Gas & Consumable Fuels - 2.1% | |||
| Delek Logistics Partners LP | 400,000 | 14,604 | |
| World Fuel Services Corp. | 1,091,300 | 47,570 | |
| 62,174 | |||
| TOTAL ENERGY | 63,635 | ||
| FINANCIALS - 20.8% | |||
| Banks - 5.9% | |||
| Allegiance Bancshares, Inc. (a) | 119,542 | 2,925 | |
| Bank of the Ozarks, Inc. | 500,000 | 27,140 | |
| ConnectOne Bancorp, Inc. (b) | 1,550,000 | 30,241 | |
| First NBC Bank Holding Co. (a)(b) | 1,026,364 | 43,456 | |
| German American Bancorp, Inc. | 33,344 | 1,150 | |
| Investors Bancorp, Inc. | 3,316,299 | 42,515 | |
| Wilshire Bancorp, Inc. | 2,350,000 | 28,999 | |
| 176,426 | |||
| Consumer Finance - 1.9% | |||
| Credit Acceptance Corp. (a)(c) | 6,300 | 1,263 | |
| PRA Group, Inc. (a)(c) | 800,000 | 33,048 | |
| SLM Corp. (a) | 3,385,800 | 22,871 | |
| 57,182 | |||
| Insurance - 7.9% | |||
| CNO Financial Group, Inc. | 2,700,000 | 54,621 | |
| Enstar Group Ltd. (a) | 150,000 | 23,117 | |
| Hanover Insurance Group, Inc. | 226,842 | 19,191 | |
| James River Group Holdings Ltd. | 617,952 | 19,836 | |
| National Western Life Group, Inc. | 20,000 | 5,265 | |
| Primerica, Inc. | 1,307,265 | 66,984 | |
| Reinsurance Group of America, Inc. | 550,000 | 50,534 | |
| 239,548 | |||
| Real Estate Investment Trusts - 2.4% | |||
| EPR Properties | 330,000 | 18,493 | |
| MFA Financial, Inc. | 3,900,000 | 27,222 | |
| VEREIT, Inc. | 3,200,000 | 26,656 | |
| 72,371 | |||
| Real Estate Management & Development - 0.5% | |||
| Relo Holdings Corp. | 140,000 | 15,160 | |
| Thrifts & Mortgage Finance - 2.2% | |||
| BofI Holding, Inc. (a)(c) | 2,400,000 | 48,072 | |
| Meridian Bancorp, Inc. | 1,095,110 | 16,054 | |
| Oritani Financial Corp. | 200,000 | 3,468 | |
| 67,594 | |||
| TOTAL FINANCIALS | 628,281 | ||
| HEALTH CARE - 13.1% | |||
| Biotechnology - 1.8% | |||
| United Therapeutics Corp. (a) | 350,000 | 53,421 | |
| Health Care Equipment & Supplies - 0.8% | |||
| Fukuda Denshi Co. Ltd. | 125,000 | 6,651 | |
| The Cooper Companies, Inc. | 115,000 | 16,819 | |
| 23,470 | |||
| Health Care Providers & Services - 8.6% | |||
| Aceto Corp. | 1,200,000 | 33,852 | |
| AmSurg Corp. (a) | 313,000 | 26,311 | |
| Community Health Systems, Inc. (a) | 1,600,000 | 46,304 | |
| HealthSouth Corp. | 800,000 | 28,152 | |
| MEDNAX, Inc. (a) | 300,000 | 21,411 | |
| Message Co. Ltd. | 523,200 | 12,321 | |
| Providence Service Corp. (a) | 600,000 | 29,052 | |
| Ryman Healthcare Group Ltd. | 900,000 | 4,651 | |
| Sigma Pharmaceuticals Ltd. | 3,000,000 | 1,888 | |
| The Ensign Group, Inc. | 1,200,000 | 57,084 | |
| 261,026 | |||
| Life Sciences Tools & Services - 0.6% | |||
| VWR Corp. (a)(c) | 681,000 | 18,169 | |
| Pharmaceuticals - 1.3% | |||
| Jazz Pharmaceuticals PLC (a) | 150,000 | 21,989 | |
| Sawai Pharmaceutical Co. Ltd. | 300,000 | 17,206 | |
| 39,195 | |||
| TOTAL HEALTH CARE | 395,281 | ||
| INDUSTRIALS - 15.6% | |||
| Aerospace & Defense - 3.2% | |||
| BWX Technologies, Inc. | 1,050,000 | 31,973 | |
| Engility Holdings, Inc. | 600,000 | 20,760 | |
| Moog, Inc. Class A (a) | 400,000 | 26,428 | |
| Teledyne Technologies, Inc. (a) | 200,000 | 18,502 | |
| 97,663 | |||
| Commercial Services & Supplies - 5.6% | |||
| Coor Service Management Holding AB (a) | 1,535,502 | 5,986 | |
| Deluxe Corp. | 800,000 | 46,920 | |
| Mitie Group PLC | 5,600,000 | 26,913 | |
| UniFirst Corp. | 250,000 | 27,145 | |
| West Corp. | 2,400,000 | 61,200 | |
| 168,164 | |||
| Electrical Equipment - 1.2% | |||
| EnerSys | 625,550 | 36,845 | |
| Machinery - 4.1% | |||
| Federal Signal Corp. | 1,800,000 | 30,348 | |
| Hy-Lok Corp. (b) | 700,000 | 15,207 | |
| Standex International Corp. | 550,000 | 49,154 | |
| TriMas Corp. (a) | 1,350,000 | 29,201 | |
| 123,910 | |||
| Marine - 0.3% | |||
| SITC International Holdings Co. Ltd. | 19,000,000 | 9,606 | |
| Professional Services - 0.7% | |||
| Benefit One, Inc. | 1,150,000 | 21,692 | |
| Transportation Infrastructure - 0.5% | |||
| Wesco Aircraft Holdings, Inc. (a) | 1,000,000 | 13,380 | |
| TOTAL INDUSTRIALS | 471,260 | ||
| INFORMATION TECHNOLOGY - 22.4% | |||
| Electronic Equipment & Components - 7.9% | |||
| Belden, Inc. | 400,000 | 25,108 | |
| CDW Corp. | 1,700,000 | 73,385 | |
| Insight Enterprises, Inc. (a) | 1,400,000 | 37,492 | |
| SYNNEX Corp. | 530,913 | 50,049 | |
| Zebra Technologies Corp. Class A (a) | 650,000 | 52,130 | |
| 238,164 | |||
| Internet Software & Services - 1.1% | |||
| Stamps.com, Inc. (a) | 325,000 | 32,942 | |
| IT Services - 9.0% | |||
| Blackhawk Network Holdings, Inc. (a) | 900,000 | 42,615 | |
| Cardtronics, Inc. (a) | 1,000,000 | 37,610 | |
| EVERTEC, Inc. | 1,365,000 | 23,451 | |
| Global Payments, Inc. | 800,000 | 56,680 | |
| MoneyGram International, Inc. (a) | 1,838,009 | 16,138 | |
| Perficient, Inc. (a) | 800,000 | 13,984 | |
| Syntel, Inc. (a) | 1,350,000 | 65,381 | |
| WEX, Inc. (a) | 170,000 | 16,026 | |
| 271,885 | |||
| Software - 4.4% | |||
| NIIT Technologies Ltd. (b) | 3,800,000 | 32,572 | |
| Sword Group (b) | 587,339 | 14,676 | |
| Verint Systems, Inc. (a) | 620,000 | 29,047 | |
| Zensar Technologies Ltd. (b) | 3,500,000 | 57,126 | |
| 133,421 | |||
| TOTAL INFORMATION TECHNOLOGY | 676,412 | ||
| MATERIALS - 2.6% | |||
| Chemicals - 1.9% | |||
| Innospec, Inc. | 200,000 | 11,680 | |
| PolyOne Corp. | 1,300,000 | 46,774 | |
| 58,454 | |||
| Paper & Forest Products - 0.7% | |||
| Neenah Paper, Inc. | 300,000 | 19,941 | |
| TOTAL MATERIALS | 78,395 | ||
| TELECOMMUNICATION SERVICES - 0.4% | |||
| Diversified Telecommunication Services - 0.3% | |||
| APT Satellite Holdings Ltd. | 3,150,000 | 2,669 | |
| Asia Satellite Telecommunications Holdings Ltd. | 800,000 | 1,156 | |
| Vocus Communications Ltd. (c) | 784,380 | 4,101 | |
| 7,926 | |||
| Wireless Telecommunication Services - 0.1% | |||
| Cellcom Israel Ltd. (Israel) (a) | 200,000 | 1,426 | |
| Partner Communications Co. Ltd. (a) | 293,027 | 1,328 | |
| 2,754 | |||
| TOTAL TELECOMMUNICATION SERVICES | 10,680 | ||
| UTILITIES - 0.1% | |||
| Gas Utilities - 0.1% | |||
| Star Gas Partners LP | 600,000 | 4,632 | |
| TOTAL COMMON STOCKS | |||
| (Cost $2,121,588) | 2,678,869 | ||
| Investment Companies - 1.6% | |||
| iShares Russell 2000 Index ETF (c) | |||
| (Cost $48,715) | 417,100 | 49,672 | |
| Principal Amount (000s)(d) | Value (000s) | ||
| U.S. Treasury Obligations - 0.4% | |||
| U.S. Treasury Bills, yield at date of purchase 0.04% to 0.15% 1/28/16 to 2/25/16 (e) | |||
| (Cost $11,588) | 11,590 | 11,588 | |
| Preferred Securities - 0.5% | |||
| FINANCIALS - 0.5% | |||
| Diversified Financial Services - 0.5% | |||
| Baggot Securities Ltd. 10.24% (f)(g) (Cost $18,643) | $12,000 | $13,780 | |
| Shares | Value (000s) | ||
| Money Market Funds - 12.6% | |||
| Fidelity Cash Central Fund, 0.18% (h) | 278,295,789 | 278,296 | |
| Fidelity Securities Lending Cash Central Fund, 0.22% (h)(i) | 102,156,853 | 102,157 | |
| TOTAL MONEY MARKET FUNDS | |||
| (Cost $380,453) | 380,453 | ||
| TOTAL INVESTMENT PORTFOLIO - 103.8% | |||
| (Cost $2,580,987) | 3,134,362 | ||
| NET OTHER ASSETS (LIABILITIES) - (3.8)% | (115,618) | ||
| NET ASSETS - 100% | $3,018,744 |
| Futures Contracts | |||
| Expiration Date | Underlying Face Amount at Value (000s) | Unrealized Appreciation/(Depreciation) (000s) | |
| Purchased | |||
| Equity Index Contracts | |||
| 2,107 ICE Russell 2000 Index Contracts (United States) | Dec. 2015 | 251,976 | $6,815 |
The face value of futures purchased as a percentage of Net Assets is 8.3%
Currency Abbreviations
EUR – European Monetary Unit
Security Type Abbreviations
ETF – Exchange-Traded Fund
Legend
(a) Non-income producing
(b) Affiliated company
(c) Security or a portion of the security is on loan at period end.
(d) Amount is stated in United States dollars unless otherwise noted.
(e) Security or a portion of the security was pledged to cover margin requirements for futures contracts. At period end, the value of securities pledged amounted to $11,588,000.
(f) Security exempt from registration under Rule 144A of the Securities Act of 1933. These securities may be resold in transactions exempt from registration, normally to qualified institutional buyers. At the end of the period, the value of these securities amounted to $13,780,000 or 0.5% of net assets.
(g) Security is perpetual in nature with no stated maturity date.
(h) Affiliated fund that is generally available only to investment companies and other accounts managed by Fidelity Investments. The rate quoted is the annualized seven-day yield of the fund at period end. A complete unaudited listing of the fund's holdings as of its most recent quarter end is available upon request. In addition, each Fidelity Central Fund's financial statements, which are not covered by the Fund's Report of Independent Registered Public Accounting Firm, are available on the SEC's website or upon request.
(i) Investment made with cash collateral received from securities on loan.
Affiliated Central Funds
Information regarding fiscal year to date income earned by the Fund from investments in Fidelity Central Funds is as follows:
| Fund | Income earned |
| (Amounts in thousands) | |
| Fidelity Cash Central Fund | $355 |
| Fidelity Securities Lending Cash Central Fund | 292 |
| Total | $647 |
Other Affiliated Issuers
An affiliated company is a company in which the Fund has ownership of at least 5% of the voting securities. Fiscal year to date transactions with companies which are or were affiliates are as follows:
| Affiliate (Amounts in thousands) | Value, beginning of period | Purchases | Sales Proceeds | Dividend Income | Value, end of period |
| Cathedral Energy Services Ltd. | $8,984 | $376 | $-- | $453 | $1,461 |
| ConnectOne Bancorp, Inc. | -- | 30,386 | -- | 276 | 30,241 |
| First NBC Bank Holding Co. | 29,120 | 8,512 | -- | -- | 43,456 |
| Hy-Lok Corp. | 19,901 | -- | -- | 212 | 15,207 |
| Meiko Network Japan Co. Ltd. | 16,216 | -- | -- | 403 | 17,932 |
| NIIT Technologies Ltd. | 23,245 | -- | -- | 566 | 32,572 |
| Stamps.com, Inc. | 40,163 | -- | 37,361 | -- | -- |
| Sword Group | 12,905 | -- | -- | 668 | 14,676 |
| The Ensign Group, Inc. | 47,304 | -- | -- | 360 | -- |
| Tsukada Global Holdings, Inc. | 17,524 | -- | -- | 206 | 18,583 |
| Zensar Technologies Ltd. | 33,225 | -- | -- | 614 | 57,126 |
| Total | $248,587 | $39,274 | $37,361 | $3,758 | $231,254 |
Investment Valuation
The following is a summary of the inputs used, as of November 30, 2015, involving the Fund's assets and liabilities carried at fair value. The inputs or methodology used for valuing securities may not be an indication of the risk associated with investing in those securities. For more information on valuation inputs, and their aggregation into the levels used below, please refer to the Investment Valuation section in the accompanying Notes to Financial Statements.
| Valuation Inputs at Reporting Date: | ||||
| Description | Total | Level 1 | Level 2 | Level 3 |
| (Amounts in thousands) | ||||
| Investments in Securities: | ||||
| Equities: | ||||
| Consumer Discretionary | $267,966 | $267,966 | $-- | $-- |
| Consumer Staples | 82,327 | 82,327 | -- | -- |
| Energy | 63,635 | 63,635 | -- | -- |
| Financials | 628,281 | 628,281 | -- | -- |
| Health Care | 395,281 | 395,281 | -- | -- |
| Industrials | 471,260 | 471,260 | -- | -- |
| Information Technology | 676,412 | 676,412 | -- | -- |
| Materials | 78,395 | 78,395 | -- | -- |
| Telecommunication Services | 10,680 | 10,680 | -- | -- |
| Utilities | 4,632 | 4,632 | -- | -- |
| Investment Companies | 49,672 | 49,672 | -- | -- |
| U.S. Government and Government Agency Obligations | 11,588 | -- | 11,588 | -- |
| Preferred Securities | 13,780 | -- | 13,780 | -- |
| Money Market Funds | 380,453 | 380,453 | -- | -- |
| Total Investments in Securities: | $3,134,362 | $3,108,994 | $25,368 | $-- |
| Derivative Instruments: | ||||
| Assets | ||||
| Futures Contracts | $6,815 | $6,815 | $-- | $-- |
| Total Assets | $6,815 | $6,815 | $-- | $-- |
| Total Derivative Instruments: | $6,815 | $6,815 | $-- | $-- |
Value of Derivative Instruments
The following table is a summary of the Fund's value of derivative instruments by primary risk exposure as of November 30, 2015. For additional information on derivative instruments, please refer to the Derivative Instruments section in the accompanying Notes to Financial Statements.
| Primary Risk Exposure / Derivative Type | Value | |
| (Amounts in thousands) | Asset | Liability |
| Equity Risk | ||
| Futures Contracts(a) | $6,815 | $0 |
| Total Equity Risk | 6,815 | 0 |
| Total Value of Derivatives | $6,815 | $0 |
(a) Reflects gross cumulative appreciation (depreciation) on futures contracts as presented in the Schedule of Investments. Only the period end receivable or payable for daily variation margin and net unrealized appreciation (depreciation) are presented in the Statement of Assets and Liabilities.
Other Information
Distribution of investments by country or territory of incorporation, as a percentage of Total Net Assets, is as follows (Unaudited):
| United States of America | 84.6% |
| Japan | 5.9% |
| India | 3.0% |
| Bermuda | 1.6% |
| Ireland | 1.2% |
| Others (Individually Less Than 1%) | 3.7% |
| 100.0% |
See accompanying notes which are an integral part of the financial statements.
Financial Statements
Statement of Assets and Liabilities
| Amounts in thousands (except per-share amounts) | November 30, 2015 | |
| Assets | ||
| Investment in securities, at value (including securities loaned of $99,108) — See accompanying schedule: Unaffiliated issuers (cost $2,019,444) | $2,522,655 | |
| Fidelity Central Funds (cost $380,453) | 380,453 | |
| Other affiliated issuers (cost $181,090) | 231,254 | |
| Total Investments (cost $2,580,987) | $3,134,362 | |
| Receivable for investments sold | 9,564 | |
| Receivable for fund shares sold | 2,093 | |
| Dividends receivable | 1,785 | |
| Distributions receivable from Fidelity Central Funds | 86 | |
| Prepaid expenses | 7 | |
| Other receivables | 3 | |
| Total assets | 3,147,900 | |
| Liabilities | ||
| Payable to custodian bank | $2,317 | |
| Payable for investments purchased | 14,906 | |
| Payable for fund shares redeemed | 5,140 | |
| Accrued management fee | 2,123 | |
| Distribution and service plan fees payable | 866 | |
| Payable for daily variation margin for derivative instruments | 1,010 | |
| Other affiliated payables | 575 | |
| Other payables and accrued expenses | 62 | |
| Collateral on securities loaned, at value | 102,157 | |
| Total liabilities | 129,156 | |
| Net Assets | $3,018,744 | |
| Net Assets consist of: | ||
| Paid in capital | $2,219,498 | |
| Accumulated net investment loss | (3,498) | |
| Accumulated undistributed net realized gain (loss) on investments and foreign currency transactions | 242,608 | |
| Net unrealized appreciation (depreciation) on investments and assets and liabilities in foreign currencies | 560,136 | |
| Net Assets | $3,018,744 | |
| Calculation of Maximum Offering Price | ||
| Class A: | ||
| Net Asset Value and redemption price per share ($1,046,645 ÷ 37,972.4 shares) | $27.56 | |
| Maximum offering price per share (100/94.25 of $27.56) | $29.24 | |
| Class T: | ||
| Net Asset Value and redemption price per share ($888,348 ÷ 34,177.5 shares) | $25.99 | |
| Maximum offering price per share (100/96.50 of $25.99) | $26.93 | |
| Class B: | ||
| Net Asset Value and offering price per share ($21,075 ÷ 955.9 shares)(a) | $22.05 | |
| Class C: | ||
| Net Asset Value and offering price per share ($317,907 ÷ 14,168.4 shares)(a) | $22.44 | |
| Class I: | ||
| Net Asset Value, offering price and redemption price per share ($703,678 ÷ 23,780.2 shares) | $29.59 | |
| Class Z: | ||
| Net Asset Value, offering price and redemption price per share ($41,091 ÷ 1,391.4 shares) | $29.53 |
(a) Redemption price per share is equal to net asset value less any applicable contingent deferred sales charge.
See accompanying notes which are an integral part of the financial statements.
Statement of Operations
| Amounts in thousands | Year ended November 30, 2015 | |
| Investment Income | ||
| Dividends (including $3,758 earned from other affiliated issuers) | $32,816 | |
| Special dividends | 6,860 | |
| Interest | 163 | |
| Income from Fidelity Central Funds | 647 | |
| Total income | 40,486 | |
| Expenses | ||
| Management fee | ||
| Basic fee | $21,376 | |
| Performance adjustment | 1,695 | |
| Transfer agent fees | 6,233 | |
| Distribution and service plan fees | 10,852 | |
| Accounting and security lending fees | 911 | |
| Custodian fees and expenses | 119 | |
| Independent trustees' compensation | 13 | |
| Registration fees | 138 | |
| Audit | 62 | |
| Legal | 10 | |
| Miscellaneous | 18 | |
| Total expenses before reductions | 41,427 | |
| Expense reductions | (157) | 41,270 |
| Net investment income (loss) | (784) | |
| Realized and Unrealized Gain (Loss) | ||
| Net realized gain (loss) on: | ||
| Investment securities: | ||
| Unaffiliated issuers | 256,467 | |
| Other affiliated issuers | 25,828 | |
| Foreign currency transactions | (386) | |
| Futures contracts | (9,056) | |
| Total net realized gain (loss) | 272,853 | |
| Change in net unrealized appreciation (depreciation) on: Investment securities | (159,608) | |
| Assets and liabilities in foreign currencies | 74 | |
| Futures contracts | 6,738 | |
| Total change in net unrealized appreciation (depreciation) | (152,796) | |
| Net gain (loss) | 120,057 | |
| Net increase (decrease) in net assets resulting from operations | $119,273 |
See accompanying notes which are an integral part of the financial statements.
Statement of Changes in Net Assets
| Amounts in thousands | Year ended November 30, 2015 | Year ended November 30, 2014 |
| Increase (Decrease) in Net Assets | ||
| Operations | ||
| Net investment income (loss) | $(784) | $1,228 |
| Net realized gain (loss) | 272,853 | 448,042 |
| Change in net unrealized appreciation (depreciation) | (152,796) | (182,506) |
| Net increase (decrease) in net assets resulting from operations | 119,273 | 266,764 |
| Distributions to shareholders from net investment income | (1,701) | (1,611) |
| Distributions to shareholders from net realized gain | (353,938) | (400,188) |
| Total distributions | (355,639) | (401,799) |
| Share transactions - net increase (decrease) | 204,314 | (287,435) |
| Total increase (decrease) in net assets | (32,052) | (422,470) |
| Net Assets | ||
| Beginning of period | 3,050,796 | 3,473,266 |
| End of period (including accumulated net investment loss of $3,498 and $0, respectively) | $3,018,744 | $3,050,796 |
See accompanying notes which are an integral part of the financial statements.
Financial Highlights — Fidelity Advisor Small Cap Fund Class A
| Years ended November 30, | 2015 | 2014 | 2013 | 2012 | 2011 |
| Selected Per–Share Data | |||||
| Net asset value, beginning of period | $29.85 | $30.96 | $22.45 | $23.60 | $24.35 |
| Income from Investment Operations | |||||
| Net investment income (loss)A | .02B | .04 | .12C | (.03) | (.09)D |
| Net realized and unrealized gain (loss) | 1.10 | 2.36 | 8.45 | .79 | .67 |
| Total from investment operations | 1.12 | 2.40 | 8.57 | .76 | .58 |
| Distributions from net investment income | – | (.01) | (.05) | – | – |
| Distributions from net realized gain | (3.41) | (3.50) | (.01) | (1.91) | (1.33) |
| Total distributions | (3.41) | (3.51) | (.06) | (1.91) | (1.33) |
| Net asset value, end of period | $27.56 | $29.85 | $30.96 | $22.45 | $23.60 |
| Total ReturnE,F | 4.17% | 9.06% | 38.30% | 3.87% | 2.17% |
| Ratios to Average Net AssetsG,H | |||||
| Expenses before reductions | 1.26% | .98% | 1.01% | 1.06% | 1.31% |
| Expenses net of fee waivers, if any | 1.26% | .98% | 1.01% | 1.06% | 1.31% |
| Expenses net of all reductions | 1.25% | .97% | 1.00% | 1.06% | 1.31% |
| Net investment income (loss) | .07%B | .14% | .46%C | (.13)% | (.35)%D |
| Supplemental Data | |||||
| Net assets, end of period (in millions) | $1,047 | $1,097 | $1,263 | $1,212 | $1,461 |
| Portfolio turnover rateI | 33% | 39% | 34% | 69% | 38% |
A Calculated based on average shares outstanding during the period.
B Investment income per share reflects a large, non-recurring dividend which amounted to $.06 per share. Excluding this non-recurring dividend, the ratio of net investment income (loss) to average net assets would have been (.16) %.
C Investment income per share reflects a large, non-recurring dividend which amounted to $.04 per share. Excluding this non-recurring dividend, the ratio of net investment income (loss) to average net assets would have been .29%.
D Investment income per share reflects a large, non-recurring dividend which amounted to $.04 per share. Excluding this non-recurring dividend, the ratio of net investment income (loss) to average net assets would have been (.50) %.
E Total returns would have been lower if certain expenses had not been reduced during the applicable periods shown.
F Total returns do not include the effect of the sales charges.
G Fees and expenses of any underlying Fidelity Central Funds are not included in the Fund's expense ratio. The Fund indirectly bears its proportionate share of the expenses of any underlying Fidelity Central Funds.
H Expense ratios reflect operating expenses of the class. Expenses before reductions do not reflect amounts reimbursed by the investment adviser or reductions from brokerage service arrangements or reductions from other expense offset arrangements and do not represent the amount paid by the class during periods when reimbursements or reductions occur. Expenses net of fee waivers reflect expenses after reimbursement by the investment adviser but prior to reductions from brokerage service arrangements or other expense offset arrangements. Expenses net of all reductions represent the net expenses paid by the class.
I Amount does not include the portfolio activity of any underlying Fidelity Central Funds.
See accompanying notes which are an integral part of the financial statements.
Financial Highlights — Fidelity Advisor Small Cap Fund Class T
| Years ended November 30, | 2015 | 2014 | 2013 | 2012 | 2011 |
| Selected Per–Share Data | |||||
| Net asset value, beginning of period | $28.40 | $29.69 | $21.52 | $22.75 | $23.57 |
| Income from Investment Operations | |||||
| Net investment income (loss)A | (.04)B | (.02) | .06C | (.07) | (.13)D |
| Net realized and unrealized gain (loss) | 1.04 | 2.23 | 8.13 | .75 | .64 |
| Total from investment operations | 1.00 | 2.21 | 8.19 | .68 | .51 |
| Distributions from net investment income | – | – | (.01) | – | – |
| Distributions from net realized gain | (3.41) | (3.50) | (.01) | (1.91) | (1.33) |
| Total distributions | (3.41) | (3.50) | (.02) | (1.91) | (1.33) |
| Net asset value, end of period | $25.99 | $28.40 | $29.69 | $21.52 | $22.75 |
| Total ReturnE,F | 3.93% | 8.79% | 38.11% | 3.64% | 1.94% |
| Ratios to Average Net AssetsG,H | |||||
| Expenses before reductions | 1.49% | 1.20% | 1.22% | 1.26% | 1.51% |
| Expenses net of fee waivers, if any | 1.49% | 1.20% | 1.22% | 1.26% | 1.51% |
| Expenses net of all reductions | 1.49% | 1.20% | 1.21% | 1.25% | 1.51% |
| Net investment income (loss) | (.16)%B | (.08)% | .25%C | (.33)% | (.55)%D |
| Supplemental Data | |||||
| Net assets, end of period (in millions) | $888 | $958 | $1,113 | $1,054 | $1,244 |
| Portfolio turnover rateI | 33% | 39% | 34% | 69% | 38% |
A Calculated based on average shares outstanding during the period.
B Investment income per share reflects a large, non-recurring dividend which amounted to $.06 per share. Excluding this non-recurring dividend, the ratio of net investment income (loss) to average net assets would have been (.39) %.
C Investment income per share reflects a large, non-recurring dividend which amounted to $.04 per share. Excluding this non-recurring dividend, the ratio of net investment income (loss) to average net assets would have been .09%.
D Investment income per share reflects a large, non-recurring dividend which amounted to $.04 per share. Excluding this non-recurring dividend, the ratio of net investment income (loss) to average net assets would have been (.70) %.
E Total returns would have been lower if certain expenses had not been reduced during the applicable periods shown.
F Total returns do not include the effect of the sales charges.
G Fees and expenses of any underlying Fidelity Central Funds are not included in the Fund's expense ratio. The Fund indirectly bears its proportionate share of the expenses of any underlying Fidelity Central Funds.
H Expense ratios reflect operating expenses of the class. Expenses before reductions do not reflect amounts reimbursed by the investment adviser or reductions from brokerage service arrangements or reductions from other expense offset arrangements and do not represent the amount paid by the class during periods when reimbursements or reductions occur. Expenses net of fee waivers reflect expenses after reimbursement by the investment adviser but prior to reductions from brokerage service arrangements or other expense offset arrangements. Expenses net of all reductions represent the net expenses paid by the class.
I Amount does not include the portfolio activity of any underlying Fidelity Central Funds.
See accompanying notes which are an integral part of the financial statements.
Financial Highlights — Fidelity Advisor Small Cap Fund Class B
| Years ended November 30, | 2015 | 2014 | 2013 | 2012 | 2011 |
| Selected Per–Share Data | |||||
| Net asset value, beginning of period | $24.73 | $26.45 | $19.27 | $20.69 | $21.66 |
| Income from Investment Operations | |||||
| Net investment income (loss)A | (.17)B | (.16) | (.08)C | (.18) | (.25)D |
| Net realized and unrealized gain (loss) | .90 | 1.94 | 7.26 | .67 | .61 |
| Total from investment operations | .73 | 1.78 | 7.18 | .49 | .36 |
| Distributions from net realized gain | (3.41) | (3.50) | – | (1.91) | (1.33) |
| Net asset value, end of period | $22.05 | $24.73 | $26.45 | $19.27 | $20.69 |
| Total ReturnE,F | 3.35% | 8.16% | 37.26% | 3.03% | 1.39% |
| Ratios to Average Net AssetsG,H | |||||
| Expenses before reductions | 2.07% | 1.80% | 1.81% | 1.85% | 2.10% |
| Expenses net of fee waivers, if any | 2.06% | 1.80% | 1.81% | 1.85% | 2.10% |
| Expenses net of all reductions | 2.06% | 1.79% | 1.80% | 1.84% | 2.10% |
| Net investment income (loss) | (.74)%B | (.68)% | (.34)%C | (.92)% | (1.14)%D |
| Supplemental Data | |||||
| Net assets, end of period (in millions) | $21 | $31 | $40 | $40 | $55 |
| Portfolio turnover rateI | 33% | 39% | 34% | 69% | 38% |
A Calculated based on average shares outstanding during the period.
B Investment income per share reflects a large, non-recurring dividend which amounted to $.05 per share. Excluding this non-recurring dividend, the ratio of net investment income (loss) to average net assets would have been (.96) %.
C Investment income per share reflects a large, non-recurring dividend which amounted to $.04 per share. Excluding this non-recurring dividend, the ratio of net investment income (loss) to average net assets would have been (.51) %.
D Investment income per share reflects a large, non-recurring dividend which amounted to $.03 per share. Excluding this non-recurring dividend, the ratio of net investment income (loss) to average net assets would have been (1.29) %.
E Total returns would have been lower if certain expenses had not been reduced during the applicable periods shown.
F Total returns do not include the effect of the contingent deferred sales charge.
G Fees and expenses of any underlying Fidelity Central Funds are not included in the Fund's expense ratio. The Fund indirectly bears its proportionate share of the expenses of any underlying Fidelity Central Funds.
H Expense ratios reflect operating expenses of the class. Expenses before reductions do not reflect amounts reimbursed by the investment adviser or reductions from brokerage service arrangements or reductions from other expense offset arrangements and do not represent the amount paid by the class during periods when reimbursements or reductions occur. Expenses net of fee waivers reflect expenses after reimbursement by the investment adviser but prior to reductions from brokerage service arrangements or other expense offset arrangements. Expenses net of all reductions represent the net expenses paid by the class.
I Amount does not include the portfolio activity of any underlying Fidelity Central Funds.
See accompanying notes which are an integral part of the financial statements.
Financial Highlights — Fidelity Advisor Small Cap Fund Class C
| Years ended November 30, | 2015 | 2014 | 2013 | 2012 | 2011 |
| Selected Per–Share Data | |||||
| Net asset value, beginning of period | $25.10 | $26.77 | $19.50 | $20.90 | $21.87 |
| Income from Investment Operations | |||||
| Net investment income (loss)A | (.16)B | (.15) | (.07)C | (.17) | (.24)D |
| Net realized and unrealized gain (loss) | .91 | 1.98 | 7.34 | .68 | .60 |
| Total from investment operations | .75 | 1.83 | 7.27 | .51 | .36 |
| Distributions from net realized gain | (3.41) | (3.50) | – | (1.91) | (1.33) |
| Net asset value, end of period | $22.44 | $25.10 | $26.77 | $19.50 | $20.90 |
| Total ReturnE,F | 3.38% | 8.26% | 37.28% | 3.10% | 1.37% |
| Ratios to Average Net AssetsG,H | |||||
| Expenses before reductions | 2.02% | 1.73% | 1.76% | 1.81% | 2.06% |
| Expenses net of fee waivers, if any | 2.02% | 1.73% | 1.76% | 1.81% | 2.06% |
| Expenses net of all reductions | 2.01% | 1.73% | 1.75% | 1.80% | 2.05% |
| Net investment income (loss) | (.69)%B | (.62)% | (.29)%C | (.88)% | (1.10)%D |
| Supplemental Data | |||||
| Net assets, end of period (in millions) | $318 | $317 | $334 | $284 | $328 |
| Portfolio turnover rateI | 33% | 39% | 34% | 69% | 38% |
A Calculated based on average shares outstanding during the period.
B Investment income per share reflects a large, non-recurring dividend which amounted to $.05 per share. Excluding this non-recurring dividend, the ratio of net investment income (loss) to average net assets would have been (.91) %.
C Investment income per share reflects a large, non-recurring dividend which amounted to $.04 per share. Excluding this non-recurring dividend, the ratio of net investment income (loss) to average net assets would have been (.45) %.
D Investment income per share reflects a large, non-recurring dividend which amounted to $.03 per share. Excluding this non-recurring dividend, the ratio of net investment income (loss) to average net assets would have been (1.25) %.
E Total returns would have been lower if certain expenses had not been reduced during the applicable periods shown.
F Total returns do not include the effect of the contingent deferred sales charge.
G Fees and expenses of any underlying Fidelity Central Funds are not included in the Fund's expense ratio. The Fund indirectly bears its proportionate share of the expenses of any underlying Fidelity Central Funds.
H Expense ratios reflect operating expenses of the class. Expenses before reductions do not reflect amounts reimbursed by the investment adviser or reductions from brokerage service arrangements or reductions from other expense offset arrangements and do not represent the amount paid by the class during periods when reimbursements or reductions occur. Expenses net of fee waivers reflect expenses after reimbursement by the investment adviser but prior to reductions from brokerage service arrangements or other expense offset arrangements. Expenses net of all reductions represent the net expenses paid by the class.
I Amount does not include the portfolio activity of any underlying Fidelity Central Funds.
See accompanying notes which are an integral part of the financial statements.
Financial Highlights — Fidelity Advisor Small Cap Fund Class I
| Years ended November 30, | 2015 | 2014 | 2013 | 2012 | 2011 |
| Selected Per–Share Data | |||||
| Net asset value, beginning of period | $31.80 | $32.73 | $23.73 | $24.77 | $25.42 |
| Income from Investment Operations | |||||
| Net investment income (loss)A | .10B | .13 | .21C | .04 | (.01)D |
| Net realized and unrealized gain (loss) | 1.18 | 2.50 | 8.94 | .83 | .69 |
| Total from investment operations | 1.28 | 2.63 | 9.15 | .87 | .68 |
| Distributions from net investment income | (.08) | (.06) | (.13) | – | – |
| Distributions from net realized gain | (3.41) | (3.50) | (.01) | (1.91) | (1.33) |
| Total distributions | (3.49) | (3.56) | (.15)E | (1.91) | (1.33) |
| Net asset value, end of period | $29.59 | $31.80 | $32.73 | $23.73 | $24.77 |
| Total ReturnF | 4.46% | 9.33% | 38.79% | 4.15% | 2.49% |
| Ratios to Average Net AssetsG,H | |||||
| Expenses before reductions | .99% | .70% | .71% | .75% | 1.01% |
| Expenses net of fee waivers, if any | .99% | .70% | .71% | .75% | 1.01% |
| Expenses net of all reductions | .99% | .70% | .70% | .74% | 1.00% |
| Net investment income (loss) | .34%B | .41% | .76%C | .18% | (.05)%D |
| Supplemental Data | |||||
| Net assets, end of period (in millions) | $704 | $627 | $718 | $1,141 | $1,314 |
| Portfolio turnover rateI | 33% | 39% | 34% | 69% | 38% |
A Calculated based on average shares outstanding during the period.
B Investment income per share reflects a large, non-recurring dividend which amounted to $.07 per share. Excluding this non-recurring dividend, the ratio of net investment income (loss) to average net assets would have been .11%.
C Investment income per share reflects a large, non-recurring dividend which amounted to $.05 per share. Excluding this non-recurring dividend, the ratio of net investment income (loss) to average net assets would have been .59%.
D Investment income per share reflects a large, non-recurring dividend which amounted to $.04 per share. Excluding this non-recurring dividend, the ratio of net investment income (loss) to average net assets would have been (.19) %.
E Total distributions of $.15 per share is comprised of distributions from net investment income of $.133 and distributions from net realized gain of $.014 per share.
F Total returns would have been lower if certain expenses had not been reduced during the applicable periods shown.
G Fees and expenses of any underlying Fidelity Central Funds are not included in the Fund's expense ratio. The Fund indirectly bears its proportionate share of the expenses of any underlying Fidelity Central Funds.
H Expense ratios reflect operating expenses of the class. Expenses before reductions do not reflect amounts reimbursed by the investment adviser or reductions from brokerage service arrangements or reductions from other expense offset arrangements and do not represent the amount paid by the class during periods when reimbursements or reductions occur. Expenses net of fee waivers reflect expenses after reimbursement by the investment adviser but prior to reductions from brokerage service arrangements or other expense offset arrangements. Expenses net of all reductions represent the net expenses paid by the class.
I Amount does not include the portfolio activity of any underlying Fidelity Central Funds.
See accompanying notes which are an integral part of the financial statements.
Financial Highlights — Fidelity Advisor Small Cap Fund Class Z
| Years ended November 30, | 2015 | 2014 | 2013 A |
| Selected Per–Share Data | |||
| Net asset value, beginning of period | $31.76 | $32.74 | $29.79 |
| Income from Investment Operations | |||
| Net investment income (loss)B | .14C | .17 | .02D |
| Net realized and unrealized gain (loss) | 1.17 | 2.51 | 2.93 |
| Total from investment operations | 1.31 | 2.68 | 2.95 |
| Distributions from net investment income | (.14) | (.16) | – |
| Distributions from net realized gain | (3.41) | (3.50) | – |
| Total distributions | (3.54)E | (3.66) | – |
| Net asset value, end of period | $29.53 | $31.76 | $32.74 |
| Total ReturnF,G | 4.59% | 9.52% | 9.90% |
| Ratios to Average Net AssetsH,I | |||
| Expenses before reductions | .84% | .55% | .56%J |
| Expenses net of fee waivers, if any | .84% | .55% | .56%J |
| Expenses net of all reductions | .84% | .54% | .55%J |
| Net investment income (loss) | .48%C | .57% | .26%D,J |
| Supplemental Data | |||
| Net assets, end of period (in millions) | $41 | $20 | $5 |
| Portfolio turnover rateK | 33% | 39% | 34% |
A For the period August 13, 2013 (commencement of sale of shares) to November 30, 2013.
B Calculated based on average shares outstanding during the period.
C Investment income per share reflects a large, non-recurring dividend which amounted to $.07 per share. Excluding this non-recurring dividend, the ratio of net investment income (loss) to average net assets would have been .26%.
D Investment income per share reflects a large, non-recurring dividend which amounted to $.01 per share. Excluding this non-recurring dividend, the ratio of net investment income (loss) to average net assets would have been .09%.
E Total distributions of $3.54 per share is comprised of distributions from net investment income of $.136 and distributions from net realized gain of $3.406 per share.
F Total returns for periods of less than one year are not annualized.
G Total returns would have been lower if certain expenses had not been reduced during the applicable periods shown.
H Fees and expenses of any underlying Fidelity Central Funds are not included in the Fund's expense ratio. The Fund indirectly bears its proportionate share of the expenses of any underlying Fidelity Central Funds.
I Expense ratios reflect operating expenses of the class. Expenses before reductions do not reflect amounts reimbursed by the investment adviser or reductions from brokerage service arrangements or reductions from other expense offset arrangements and do not represent the amount paid by the class during periods when reimbursements or reductions occur. Expense ratios before reductions for start-up periods may not be representative of longer-term operating periods. Expenses net of fee waivers reflect expenses after reimbursement by the investment adviser but prior to reductions from brokerage service arrangements or other expense offset arrangements. Expenses net of all reductions represent the net expenses paid by the class.
J Annualized
K Amount does not include the portfolio activity of any underlying Fidelity Central Funds.
See accompanying notes which are an integral part of the financial statements.
Notes to Financial Statements
For the period ended November 30, 2015
(Amounts in thousands except percentages)
1. Organization.
Fidelity Advisor Small Cap Fund (the Fund) is a fund of Fidelity Advisor Series I (the Trust) and is authorized to issue an unlimited number of shares. The Trust is registered under the Investment Company Act of 1940, as amended (the 1940 Act), as an open-end management investment company organized as a Massachusetts business trust. The Fund offers Class A, Class T, Class C, Class I (formerly Institutional Class) and Class Z shares, each of which, along with Class B shares, has equal rights as to assets and voting privileges. Class B shares are closed to new accounts and additional purchases, except for exchanges and reinvestments. Each class has exclusive voting rights with respect to matters that affect that class. Class B shares will automatically convert to Class A shares after a holding period of seven years from the initial date of purchase.
2. Investments in Fidelity Central Funds.
The Fund invests in Fidelity Central Funds, which are open-end investment companies generally available only to other investment companies and accounts managed by the investment adviser and its affiliates. The Fund's Schedule of Investments lists each of the Fidelity Central Funds held as of period end, if any, as an investment of the Fund, but does not include the underlying holdings of each Fidelity Central Fund. As an Investing Fund, the Fund indirectly bears its proportionate share of the expenses of the underlying Fidelity Central Funds.
The Money Market Central Funds seek preservation of capital and current income and are managed by Fidelity Investments Money Management, Inc. (FIMM), an affiliate of the investment adviser. Annualized expenses of the Money Market Central Funds as of their most recent shareholder report date are less than .005%.
A complete unaudited list of holdings for each Fidelity Central Fund is available upon request or at the Securities and Exchange Commission (the SEC) website at www.sec.gov. In addition, the financial statements of the Fidelity Central Funds, which are not covered by the Fund's Report of Independent Registered Public Accounting Firm, are available on the SEC website or upon request.
3. Significant Accounting Policies.
The financial statements have been prepared in conformity with accounting principles generally accepted in the United States of America (GAAP), which require management to make certain estimates and assumptions at the date of the financial statements. Actual results could differ from those estimates. Subsequent events, if any, through the date that the financial statements were issued have been evaluated in the preparation of the financial statements. The following summarizes the significant accounting policies of the Fund:
Investment Valuation. Investments are valued as of 4:00 p.m. Eastern time on the last calendar day of the period. The Board of Trustees (the Board) has delegated the day to day responsibility for the valuation of the Fund's investments to the Fidelity Management & Research Company (FMR) Fair Value Committee (the Committee). In accordance with valuation policies and procedures approved by the Board, the Fund attempts to obtain prices from one or more third party pricing vendors or brokers to value its investments. When current market prices, quotations or currency exchange rates are not readily available or reliable, investments will be fair valued in good faith by the Committee, in accordance with procedures adopted by the Board. Factors used in determining fair value vary by investment type and may include market or investment specific events, changes in interest rates and credit quality. The frequency with which these procedures are used cannot be predicted and they may be utilized to a significant extent. The Committee oversees the Fund's valuation policies and procedures and reports to the Board on the Committee's activities and fair value determinations. The Board monitors the appropriateness of the procedures used in valuing the Fund's investments and ratifies the fair value determinations of the Committee.
The Fund categorizes the inputs to valuation techniques used to value its investments into a disclosure hierarchy consisting of three levels as shown below:
- Level 1 – quoted prices in active markets for identical investments
- Level 2 – other significant observable inputs (including quoted prices for similar investments, interest rates, prepayment speeds, etc.)
- Level 3 – unobservable inputs (including the Fund's own assumptions based on the best information available)
Valuation techniques used to value the Fund's investments by major category are as follows:
Equity securities, including restricted securities, for which market quotations are readily available, are valued at the last reported sale price or official closing price as reported by a third party pricing vendor on the primary market or exchange on which they are traded and are categorized as Level 1 in the hierarchy. In the event there were no sales during the day or closing prices are not available, securities are valued at the last quoted bid price or may be valued using the last available price and are generally categorized as Level 2 in the hierarchy. For foreign equity securities, when market or security specific events arise, comparisons to the valuation of American Depositary Receipts (ADRs), futures contracts, Exchange-Traded Funds (ETFs) and certain indexes as well as quoted prices for similar securities may be used and would be categorized as Level 2 in the hierarchy. Utilizing these techniques may result in transfers between Level 1 and Level 2. For equity securities, including restricted securities, where observable inputs are limited, assumptions about market activity and risk are used and these securities may be categorized as Level 3 in the hierarchy.
Debt securities, including restricted securities, are valued based on evaluated prices received from third party pricing vendors or from brokers who make markets in such securities. Preferred securities and U.S. government and government agency obligations, are valued by pricing vendors who utilize matrix pricing which considers yield or price of bonds of comparable quality, coupon, maturity and type or by broker-supplied prices. When independent prices are unavailable or unreliable, debt securities may be valued utilizing pricing methodologies which consider similar factors that would be used by third party pricing vendors. Debt securities are generally categorized as Level 2 in the hierarchy but may be Level 3 depending on the circumstances. ETFs are valued at their last sale price or official closing price as reported by a third party pricing vendor on the primary market or exchange on which they are traded and are categorized as Level 1 in the hierarchy. In the event there were no sales during the day but the exchange reports a closing bid level, ETFs are valued at the closing bid and would be categorized as Level 1 in the hierarchy. In the event there was no closing bid, ETFs may be valued by another method that the Board believes reflects fair value in accordance with the Board's fair value pricing policies and may be categorized as Level 2 in the hierarchy.
Futures contracts are valued at the settlement price established each day by the board of trade or exchange on which they are traded and are categorized as Level 1 in the hierarchy. Investments in open-end mutual funds, including the Fidelity Central Funds, are valued at their closing net asset value (NAV) each business day and are categorized as Level 1 in the hierarchy.
Changes in valuation techniques may result in transfers in or out of an assigned level within the disclosure hierarchy. The aggregate value of investments by input level as of November 30, 2015 is included at the end of the Fund's Schedule of Investments.
Foreign Currency. The Fund may use foreign currency contracts to facilitate transactions in foreign-denominated securities. Gains and losses from these transactions may arise from changes in the value of the foreign currency or if the counterparties do not perform under the contracts' terms.
Foreign-denominated assets, including investment securities, and liabilities are translated into U.S. dollars at the exchange rates at period end. Purchases and sales of investment securities, income and dividends received and expenses denominated in foreign currencies are translated into U.S. dollars at the exchange rate in effect on the transaction date.
The effects of exchange rate fluctuations on investments are included with the net realized and unrealized gain (loss) on investment securities. Other foreign currency transactions resulting in realized and unrealized gain (loss) are disclosed separately.
Investment Transactions and Income. For financial reporting purposes, the Fund's investment holdings and NAV include trades executed through the end of the last business day of the period. The NAV per share for processing shareholder transactions is calculated as of the close of business of the New York Stock Exchange (NYSE), normally 4:00 p.m. Eastern time and includes trades executed through the end of the prior business day. Gains and losses on securities sold are determined on the basis of identified cost and may include proceeds received from litigation. Dividend income is recorded on the ex-dividend date, except for certain dividends from foreign securities where the ex-dividend date may have passed, which are recorded as soon as the Fund is informed of the ex-dividend date. Non-cash dividends included in dividend income, if any, are recorded at the fair market value of the securities received. Income and capital gain distributions from Fidelity Central Funds, if any, are recorded on the ex-dividend date. Distributions received on securities that represent a return of capital or capital gain are recorded as a reduction of cost of investments and/or as a realized gain. Subsequent to ex-dividend date the Fund determines the components of these distributions, based upon receipt of tax filings or other correspondence relating to the underlying investment. Large, non-recurring dividends recognized by the Fund are presented separately on the Statement of Operations as "Special Dividends" and the impact of these dividends is presented in the Financial Highlights. Interest income is accrued as earned and includes coupon interest and amortization of premium and accretion of discount on debt securities as applicable. Investment income is recorded net of foreign taxes withheld where recovery of such taxes is uncertain.
Class Allocations and Expenses. Investment income, realized and unrealized capital gains and losses, common expenses of the Fund, and certain fund-level expense reductions, if any, are allocated daily on a pro-rata basis to each class based on the relative net assets of each class to the total net assets of the Fund. Each class differs with respect to transfer agent and distribution and service plan fees incurred. Certain expense reductions may also differ by class. For the reporting period, the allocated portion of income and expenses to each class as a percent of its average net assets may vary due to the timing of recording these transactions in relation to fluctuating net assets of the classes. Expenses directly attributable to a fund are charged to that fund. Expenses attributable to more than one fund are allocated among the respective funds on the basis of relative net assets or other appropriate methods. Expense estimates are accrued in the period to which they relate and adjustments are made when actual amounts are known.
Income Tax Information and Distributions to Shareholders. Each year, the Fund intends to qualify as a regulated investment company under Subchapter M of the Internal Revenue Code, including distributing substantially all of its taxable income and realized gains. As a result, no provision for U.S. Federal income taxes is required. As of November 30, 2015, the Fund did not have any unrecognized tax benefits in the financial statements; nor is the Fund aware of any tax positions for which it is reasonably possible that the total amounts of unrecognized tax benefits will significantly change in the next twelve months. The Fund files a U.S. federal tax return, in addition to state and local tax returns as required. The Fund's federal income tax returns are subject to examination by the Internal Revenue Service (IRS) for a period of three fiscal years after they are filed. State and local tax returns may be subject to examination for an additional fiscal year depending on the jurisdiction. Foreign taxes are provided for based on the Fund's understanding of the tax rules and rates that exist in the foreign markets in which it invests.
Distributions are declared and recorded on the ex-dividend date. Income dividends and capital gain distributions are declared separately for each class. Income and capital gain distributions are determined in accordance with income tax regulations, which may differ from GAAP. In addition, the Fund claimed a portion of the payment made to redeeming shareholders as a distribution for income tax purposes.
Capital accounts within the financial statements are adjusted for permanent book-tax differences. These adjustments have no impact on net assets or the results of operations. Capital accounts are not adjusted for temporary book-tax differences which will reverse in a subsequent period.
Book-tax differences are primarily due to futures contracts, market discount, foreign currency transactions, partnerships and losses deferred due to wash sales and excise tax regulations.
The federal tax cost of investment securities and unrealized appreciation (depreciation) as of period end were as follows:
| Gross unrealized appreciation | $739,926 |
| Gross unrealized depreciation | (185,981) |
| Net unrealized appreciation (depreciation) on securities | $553,945 |
| Tax Cost | $2,580,417 |
The tax-based components of distributable earnings as of period end were as follows:
| Undistributed long-term capital gain | $248,855 |
| Net unrealized appreciation (depreciation) on securities and other investments | $553,891 |
The tax character of distributions paid was as follows:
| November 30, 2015 | November 30, 2014 | |
| Ordinary Income | $1,701 | $ 1,611 |
| Long-term Capital Gains | 353,938 | 400,188 |
| Total | $355,639 | $ 401,799 |
The Fund intends to elect to defer to its next fiscal year $3,499 of ordinary losses recognized during the period January 1, 2015 to November 30, 2015.
Restricted Securities. The Fund may invest in securities that are subject to legal or contractual restrictions on resale. These securities generally may be resold in transactions exempt from registration or to the public if the securities are registered. Disposal of these securities may involve time-consuming negotiations and expense, and prompt sale at an acceptable price may be difficult. Information regarding restricted securities is included at the end of the Fund's Schedule of Investments.
4. Derivative Instruments.
Risk Exposures and the Use of Derivative Instruments. The Fund's investment objective allows the Fund to enter into various types of derivative contracts, including futures contracts. Derivatives are investments whose value is primarily derived from underlying assets, indices or reference rates and may be transacted on an exchange or over-the-counter (OTC). Derivatives may involve a future commitment to buy or sell a specified asset based on specified terms, to exchange future cash flows at periodic intervals based on a notional principal amount, or for one party to make one or more payments upon the occurrence of specified events in exchange for periodic payments from the other party.
The Fund used derivatives to increase returns and to manage exposure to certain risks as defined below. The success of any strategy involving derivatives depends on analysis of numerous economic factors, and if the strategies for investment do not work as intended, the Fund may not achieve its objectives.
The Fund's use of derivatives increased or decreased its exposure to the following risk:
| Equity Risk | Equity risk relates to the fluctuations in the value of financial instruments as a result of changes in market prices (other than those arising from interest rate risk or foreign exchange risk), whether caused by factors specific to an individual investment, its issuer, or all factors affecting all instruments traded in a market or market segment. |
The Fund is also exposed to additional risks from investing in derivatives, such as liquidity risk and counterparty credit risk. Liquidity risk is the risk that the Fund will be unable to close out the derivative in the open market in a timely manner. Counterparty credit risk is the risk that the counterparty will not be able to fulfill its obligation to the Fund. Counterparty credit risk related to exchange-traded futures contracts may be mitigated by the protection provided by the exchange on which they trade.
Investing in derivatives may involve greater risks than investing in the underlying assets directly and, to varying degrees, may involve risk of loss in excess of any initial investment and collateral received and amounts recognized in the Statement of Assets and Liabilities. In addition, there may be the risk that the change in value of the derivative contract does not correspond to the change in value of the underlying instrument.
Futures Contracts. A futures contract is an agreement between two parties to buy or sell a specified underlying instrument for a fixed price at a specified future date. The Fund used futures contracts to manage its exposure to the stock market.
Upon entering into a futures contract, a fund is required to deposit either cash or securities (initial margin) with a clearing broker in an amount equal to a certain percentage of the face value of the contract. Futures contracts are marked-to-market daily and subsequent daily payments (variation margin) are made or received by a fund depending on the daily fluctuations in the value of the futures contracts and are recorded as unrealized appreciation or (depreciation). This receivable and/or payable, if any, is included in daily variation margin for derivative instruments in the Statement of Assets and Liabilities. Realized gain or (loss) is recorded upon the expiration or closing of a futures contract.
Any open futures contracts at period end are presented in the Schedule of Investments under the caption "Futures Contracts". The underlying face amount at value reflects each contract's exposure to the underlying instrument or index at period end and is representative of volume of activity during the period. Securities deposited to meet initial margin requirements are identified in the Schedule of Investments.
During the period the Fund recognized net realized gain (loss) of $(9,056) and a change in net unrealized appreciation (depreciation) of $6,738 related to its investment in futures contracts. These amounts are included in the Statement of Operations.
5. Purchases and Sales of Investments.
Purchases and sales of securities, other than short-term securities, aggregated $924,163 and $1,325,153, respectively.
6. Fees and Other Transactions with Affiliates.
Management Fee. Fidelity Management & Research Company (the investment adviser) and its affiliates provide the Fund with investment management related services for which the Fund pays a monthly management fee. The management fee is the sum of an individual fund fee rate that is based on an annual rate of .45% of the Fund's average net assets and an annualized group fee rate that averaged .25% during the period. The group fee rate is based upon the average net assets of all the mutual funds advised by the investment adviser, including any mutual funds previously advised by the investment adviser that are currently advised by Fidelity SelectCo, LLC, an affiliate of the investment adviser. The group fee rate decreases as assets under management increase and increases as assets under management decrease. In addition, the management fee is subject to a performance adjustment (up to a maximum of +/- .20% of the Fund's average net assets over a 36 month performance period). The upward or downward adjustment to the management fee is based on the relative investment performance of Class I of the Fund as compared to its benchmark index, the Russell 2000 Index, over the same 36 month performance period. For the reporting period, the total annual management fee rate, including the performance adjustment, was .75% of the Fund's average net assets. The performance adjustment included in the management fee rate may be higher or lower than the maximum performance adjustment rate due to the difference between the average net assets for the reporting and performance periods.
Distribution and Service Plan Fees. In accordance with Rule 12b-1 of the 1940 Act, the Fund has adopted separate Distribution and Service Plans for each class of shares. Certain classes pay Fidelity Distributors Corporation (FDC), an affiliate of the investment adviser, separate Distribution and Service Fees, each of which is based on an annual percentage of each class' average net assets. In addition, FDC may pay financial intermediaries for selling shares of the Fund and providing shareholder support services. For the period, the Distribution and Service Fee rates, total fees and amounts retained by FDC were as follows:
| Distribution Fee | Service Fee | Total Fees | Retained by FDC | |
| Class A | -% | .25% | $2,694 | $12 |
| Class T | .25% | .25% | 4,668 | - |
| Class B | .75% | .25% | 269 | 202 |
| Class C | .75% | .25% | 3,221 | 196 |
| $10,852 | $410 |
Sales Load. FDC may receive a front-end sales charge of up to 5.75% for selling Class A shares and 3.50% for selling Class T shares, some of which is paid to financial intermediaries for selling shares of the Fund. Depending on the holding period, FDC may receive contingent deferred sales charges levied on Class A, Class T, Class B, and Class C redemptions. The deferred sales charges range from 5.00% to 1.00% for Class B shares, 1.00% for Class C shares, 1.00% for certain purchases of Class A shares and .25% for certain purchases of Class T shares.
For the period, sales charge amounts retained by FDC were as follows:
| Retained by FDC | |
| Class A | $174 |
| Class T | 29 |
| Class B(a) | 9 |
| Class C(a) | 16 |
| $228 |
(a) When Class B and Class C shares are initially sold, FDC pays commissions from its own resources to financial intermediaries through which the sales are made.
Transfer Agent Fees. Fidelity Investments Institutional Operations Company, Inc., (FIIOC), an affiliate of the investment adviser, is the transfer, dividend disbursing and shareholder servicing agent for each class of the Fund. FIIOC receives account fees and asset-based fees that vary according to the account size and type of account of the shareholders of the respective classes of the Fund, except for Class Z. FIIOC receives an asset-based fee of Class Z's average net assets. FIIOC pays for typesetting, printing and mailing of shareholder reports, except proxy statements.
For the period, transfer agent fees for each class were as follows:
| Amount | % of Class-Level Average Net Assets | |
| Class A | $2,307 | .21 |
| Class T | 1,826 | .20 |
| Class B | 72 | .27 |
| Class C | 718 | .22 |
| Class I | 1,291 | .20 |
| Class Z | 19 | .05 |
| $6,233 |
Accounting and Security Lending Fees. Fidelity Service Company, Inc. (FSC), an affiliate of the investment adviser, maintains the Fund's accounting records. The accounting fee is based on the level of average net assets for each month. Under a separate contract, FSC administers the security lending program. The security lending fee is based on the number and duration of lending transactions.
Brokerage Commissions. The Fund placed a portion of its portfolio transactions with brokerage firms which are affiliates of the investment adviser. Brokerage commissions are included in net realized gain (loss) and change in net unrealized appreciation (depreciation) in the Statement of Operations. The commissions paid to these affiliated firms were $35 for the period.
Other. During the period, the investment adviser reimbursed the Fund for certain losses in the amount of $3.
7. Committed Line of Credit.
The Fund participates with other funds managed by the investment adviser or an affiliate in a $4.25 billion credit facility (the "line of credit") to be utilized for temporary or emergency purposes to fund shareholder redemptions or for other short-term liquidity purposes. The Fund has agreed to pay commitment fees on its pro-rata portion of the line of credit, which amounted to $4 and is reflected in Miscellaneous expenses on the Statement of Operations. During the period, the Fund did not borrow on this line of credit.
8. Security Lending.
The Fund lends portfolio securities through a lending agent from time to time in order to earn additional income. For equity securities, a lending agent is used and may loan securities to certain qualified borrowers, including Fidelity Capital Markets (FCM), a broker-dealer affiliated with the Fund. On the settlement date of the loan, the Fund receives collateral (in the form of U.S. Treasury obligations, letters of credit and/or cash) against the loaned securities and maintains collateral in an amount not less than 100% of the market value of the loaned securities during the period of the loan. The market value of the loaned securities is determined at the close of business of the Fund and any additional required collateral is delivered to the Fund on the next business day. The Fund or borrower may terminate the loan at any time, and if the borrower defaults on its obligation to return the securities loaned because of insolvency or other reasons, the Fund may apply collateral received from the borrower against the obligation. The Fund may experience delays and costs in recovering the securities loaned. Any cash collateral received is invested in the Fidelity Securities Lending Cash Central Fund. The value of loaned securities and cash collateral at period end are disclosed on the Fund's Statement of Assets and Liabilities. The value of securities loaned to FCM at period end was $17,865. Security lending income represents the income earned on investing cash collateral, less rebates paid to borrowers and any lending agent fees associated with the loan, plus any premium payments received for lending certain types of securities. Security lending income is presented in the Statement of Operations as a component of income from Fidelity Central Funds. Total security lending income during the period amounted to $292, including $4 from securities loaned to FCM.
9. Expense Reductions.
Commissions paid to certain brokers with whom the investment adviser, or its affiliates, places trades on behalf of the Fund include an amount in addition to trade execution, which may be rebated back to the Fund to offset certain expenses. This amount totaled $70 for the period.
In addition, during the period the investment adviser reimbursed and/or waived a portion of fund-level operating expenses in the amount of $13 and a portion of class-level operating expenses as follows:
| Amount | |
| Class A | $26 |
| Class T | 23 |
| Class B | 1 |
| Class C | 7 |
| Class I | 17 |
| $74 |
10. Distributions to Shareholders.
Distributions to shareholders of each class were as follows:
| Years ended November 30, | 2015 | 2014 |
| From net investment income | ||
| Class A | $–(a) | $284 |
| Class I | 1,619 | 1,305 |
| Class Z | 82 | 22 |
| Total | $1,701 | $1,611 |
| From net realized gain | ||
| Class A | $123,666 | $142,771 |
| Class T | 113,567 | 131,371 |
| Class B | 4,225 | 5,267 |
| Class C | 42,961 | 43,783 |
| Class I | 67,403 | 76,492 |
| Class Z | 2,116 | 504 |
| Total | $353,938 | $400,188 |
(a) In the amount of less than five hundred dollars.
11. Share Transactions.
Share transactions for each class were as follows and may contain automatic conversions between classes or exchanges between funds:
| Shares | Shares | Dollars | Dollars | |
| Years ended November 30, | 2015 | 2014 | 2015 | 2014 |
| Class A | ||||
| Shares sold | 7,266 | 5,882 | $201,961 | $166,699 |
| Reinvestment of distributions | 4,474 | 4,985 | 119,319 | 134,212 |
| Shares redeemed | (10,527) | (14,908) | (292,656) | (422,262) |
| Net increase (decrease) | 1,213 | (4,041) | $28,624 | $(121,351) |
| Class T | ||||
| Shares sold | 6,096 | 5,277 | $160,232 | $141,817 |
| Reinvestment of distributions | 4,384 | 4,931 | 110,516 | 126,640 |
| Shares redeemed | (10,046) | (13,972) | (263,505) | (376,684) |
| Net increase (decrease) | 434 | (3,764) | $7,243 | $(108,227) |
| Class B | ||||
| Shares sold | 21 | 13 | $461 | $288 |
| Reinvestment of distributions | 189 | 220 | 4,069 | 4,958 |
| Shares redeemed | (510) | (484) | (11,385) | (11,378) |
| Net increase (decrease) | (300) | (251) | $(6,855) | $(6,132) |
| Class C | ||||
| Shares sold | 1,967 | 1,271 | $44,618 | $30,236 |
| Reinvestment of distributions | 1,812 | 1,754 | 39,668 | 40,042 |
| Shares redeemed | (2,262) | (2,841) | (51,403) | (67,748) |
| Net increase (decrease) | 1,517 | 184 | $32,883 | $2,530 |
| Class I | ||||
| Shares sold | 8,618 | 5,735 | $256,826 | $172,958 |
| Reinvestment of distributions | 2,131 | 2,348 | 60,822 | 67,135 |
| Shares redeemed | (6,687) | (10,306) | (197,913) | (308,759) |
| Net increase (decrease) | 4,062 | (2,223) | $119,735 | $(68,666) |
| Class Z | ||||
| Shares sold | 1,152 | 611 | $33,575 | $18,714 |
| Reinvestment of distributions | 77 | 18 | 2,198 | 526 |
| Shares redeemed | (454) | (159) | (13,089) | (4,829) |
| Net increase (decrease) | 775 | 470 | $22,684 | $14,411 |
12. Other.
The Fund's organizational documents provide former and current trustees and officers with a limited indemnification against liabilities arising in connection with the performance of their duties to the Fund. In the normal course of business, the Fund may also enter into contracts that provide general indemnifications. The Fund's maximum exposure under these arrangements is unknown as this would be dependent on future claims that may be made against the Fund. The risk of material loss from such claims is considered remote.
Report of Independent Registered Public Accounting Firm
To the Trustees of Fidelity Advisor Series I and Shareholders of Fidelity Advisor® Small Cap Fund:
In our opinion, the accompanying statement of assets and liabilities, including the schedule of investments, and the related statements of operations and of changes in net assets and the financial highlights present fairly, in all material respects, the financial position of Fidelity Advisor® Small Cap Fund (a fund of Fidelity Advisor Series I) at November 30, 2015, the results of its operations for the year then ended, the changes in its net assets for each of the two years in the period then ended and the financial highlights for each of the periods indicated, in conformity with accounting principles generally accepted in the United States of America. These financial statements and financial highlights (hereafter referred to as “financial statements”) are the responsibility of the Fidelity Advisor® Small Cap Fund’s management. Our responsibility is to express an opinion on these financial statements based on our audits. We conducted our audits of these financial statements in accordance with the standards of the Public Company Accounting Oversight Board (United States). Those standards require that we plan and perform the audit to obtain reasonable assurance about whether the financial statements are free of material misstatement. An audit includes examining, on a test basis, evidence supporting the amounts and disclosures in the financial statements, assessing the accounting principles used and significant estimates made by management, and evaluating the overall financial statement presentation. We believe that our audits, which included confirmation of securities at November 30, 2015 by correspondence with the custodian and brokers, provide a reasonable basis for our opinion.
PricewaterhouseCoopers LLP
Boston, Massachusetts
January 15, 2016
Trustees and Officers
The Trustees, Members of the Advisory Board (if any), and officers of the trust and fund, as applicable, are listed below. The Board of Trustees governs the fund and is responsible for protecting the interests of shareholders. The Trustees are experienced executives who meet periodically throughout the year to oversee the fund's activities, review contractual arrangements with companies that provide services to the fund, oversee management of the risks associated with such activities and contractual arrangements, and review the fund's performance. Each of the Trustees oversees 170 funds.
The Trustees hold office without limit in time except that (a) any Trustee may resign; (b) any Trustee may be removed by written instrument, signed by at least two-thirds of the number of Trustees prior to such removal; (c) any Trustee who requests to be retired or who has become incapacitated by illness or injury may be retired by written instrument signed by a majority of the other Trustees; and (d) any Trustee may be removed at any special meeting of shareholders by a two-thirds vote of the outstanding voting securities of the trust. Each Trustee who is not an interested person (as defined in the 1940 Act) of the trust and the fund is referred to herein as an Independent Trustee. Each Independent Trustee shall retire not later than the last day of the calendar year in which his or her 75th birthday occurs. The Independent Trustees may waive this mandatory retirement age policy with respect to individual Trustees. Officers and Advisory Board Members hold office without limit in time, except that any officer or Advisory Board Member may resign or may be removed by a vote of a majority of the Trustees at any regular meeting or any special meeting of the Trustees. Except as indicated, each individual has held the office shown or other offices in the same company for the past five years.
The fund’s Statement of Additional Information (SAI) includes more information about the Trustees. To request a free copy, call Fidelity at 1-877-208-0098.
Experience, Skills, Attributes, and Qualifications of the Trustees. The Governance and Nominating Committee has adopted a statement of policy that describes the experience, qualifications, attributes, and skills that are necessary and desirable for potential Independent Trustee candidates (Statement of Policy). The Board believes that each Trustee satisfied at the time he or she was initially elected or appointed a Trustee, and continues to satisfy, the standards contemplated by the Statement of Policy. The Governance and Nominating Committee also engages professional search firms to help identify potential Independent Trustee candidates who have the experience, qualifications, attributes, and skills consistent with the Statement of Policy. From time to time, additional criteria based on the composition and skills of the current Independent Trustees, as well as experience or skills that may be appropriate in light of future changes to board composition, business conditions, and regulatory or other developments, have also been considered by the professional search firms and the Governance and Nominating Committee. In addition, the Board takes into account the Trustees' commitment and participation in Board and committee meetings, as well as their leadership of standing and ad hoc committees throughout their tenure.
In determining that a particular Trustee was and continues to be qualified to serve as a Trustee, the Board has considered a variety of criteria, none of which, in isolation, was controlling. The Board believes that, collectively, the Trustees have balanced and diverse experience, qualifications, attributes, and skills, which allow the Board to operate effectively in governing the fund and protecting the interests of shareholders. Information about the specific experience, skills, attributes, and qualifications of each Trustee, which in each case led to the Board's conclusion that the Trustee should serve (or continue to serve) as a trustee of the fund, is provided below.
Board Structure and Oversight Function. James C. Curvey is an interested person and currently serves as Chairman. The Trustees have determined that an interested Chairman is appropriate and benefits shareholders because an interested Chairman has a personal and professional stake in the quality and continuity of services provided to the fund. Independent Trustees exercise their informed business judgment to appoint an individual of their choosing to serve as Chairman, regardless of whether the Trustee happens to be independent or a member of management. The Independent Trustees have determined that they can act independently and effectively without having an Independent Trustee serve as Chairman and that a key structural component for assuring that they are in a position to do so is for the Independent Trustees to constitute a substantial majority for the Board. The Independent Trustees also regularly meet in executive session. Ned C. Lautenbach serves as Chairman of the Independent Trustees and as such (i) acts as a liaison between the Independent Trustees and management with respect to matters important to the Independent Trustees and (ii) with management prepares agendas for Board meetings.
Fidelity® funds are overseen by different Boards of Trustees. The fund's Board oversees Fidelity's high income and certain equity funds, and other Boards oversee Fidelity's investment-grade bond, money market, asset allocation, and sector funds. The asset allocation funds may invest in Fidelity® funds overseen by the fund's Board. The use of separate Boards, each with its own committee structure, allows the Trustees of each group of Fidelity® funds to focus on the unique issues of the funds they oversee, including common research, investment, and operational issues. On occasion, the separate Boards establish joint committees to address issues of overlapping consequences for the Fidelity® funds overseen by each Board.
The Trustees operate using a system of committees to facilitate the timely and efficient consideration of all matters of importance to the Trustees, the fund, and fund shareholders and to facilitate compliance with legal and regulatory requirements and oversight of the fund's activities and associated risks. The Board, acting through its committees, has charged FMR and its affiliates with (i) identifying events or circumstances the occurrence of which could have demonstrably adverse effects on the fund's business and/or reputation; (ii) implementing processes and controls to lessen the possibility that such events or circumstances occur or to mitigate the effects of such events or circumstances if they do occur; and (iii) creating and maintaining a system designed to evaluate continuously business and market conditions in order to facilitate the identification and implementation processes described in (i) and (ii) above. Because the day-to-day operations and activities of the fund are carried out by or through FMR, its affiliates, and other service providers, the fund's exposure to risks is mitigated but not eliminated by the processes overseen by the Trustees. While each of the Board's committees has responsibility for overseeing different aspects of the fund's activities, oversight is exercised primarily through the Operations, Audit, and Compliance Committees. In addition, the Independent Trustees have worked with FMR to enhance the Board's oversight of investment and financial risks, legal and regulatory risks, technology risks, and operational risks, including the development of additional risk reporting to the Board. For example, a working group comprised of Independent Trustees and FMR has worked and continues to work to review the Fidelity® funds' valuation-related activities, reporting and risk management. Appropriate personnel, including but not limited to the fund's Chief Compliance Officer (CCO), FMR's internal auditor, the independent accountants, the fund's Treasurer and portfolio management personnel, make periodic reports to the Board's committees, as appropriate, including an annual review of Fidelity's risk management program for the Fidelity® funds. The responsibilities of each standing committee, including their oversight responsibilities, are described further under "Standing Committees of the Trustees."
Interested Trustees*:
Correspondence intended for a Trustee who is an interested person may be sent to Fidelity Investments, 245 Summer Street, Boston, Massachusetts 02210.
Name, Year of Birth; Principal Occupations and Other Relevant Experience+
James C. Curvey (1935)
Year of Election or Appointment: 2007
Trustee
Chairman of the Board of Trustees
Mr. Curvey also serves as Trustee of other Fidelity® funds. Mr. Curvey is a Director of Fidelity Research & Analysis Co. (investment adviser firm, 2009-present), and Vice Chairman (2007-present) and Director of FMR LLC (diversified financial services company). In addition, Mr. Curvey serves as an Overseer for the Boston Symphony Orchestra and a member of the board of Artis-Naples, Naples, Florida, and as a Trustee for Brewster Academy, Wolfeboro, New Hampshire. Previously, Mr. Curvey served as a Director of Fidelity Investments Money Management, Inc. (investment adviser firm, 2009-2014) and a Director of FMR and FMR Co., Inc. (investment adviser firms, 2007-2014).
Charles S. Morrison (1960)
Year of Election or Appointment: 2014
Trustee
Mr. Morrison also serves as Trustee of other funds. He serves as a Director of Fidelity Investments Money Management, Inc. (FIMM) (investment adviser firm, 2014-present), Director of Fidelity SelectCo, LLC (investment adviser firm, 2014-present), President, Asset Management (2014-present), and is an employee of Fidelity Investments. Previously, Mr. Morrison served as Vice President of Fidelity's Fixed Income and Asset Allocation Funds (2012-2014), President, Fixed Income (2011-2014), Vice President of Fidelity's Money Market Funds (2005-2009), President, Money Market Group Leader of FMR (investment adviser firm, 2009), and Senior Vice President, Money Market Group of FMR (2004-2009). Mr. Morrison also served as Vice President of Fidelity's Bond Funds (2002-2005), certain Balanced Funds (2002-2005), and certain Asset Allocation Funds (2002-2007), and as Senior Vice President (2002-2005) of Fidelity's Bond Division.
* Determined to be an “Interested Trustee” by virtue of, among other things, his or her affiliation with the trust or various entities under common control with FMR.
+ The information includes the Trustee's principal occupation during the last five years and other information relating to the experience, attributes, and skills relevant to the Trustee's qualifications to serve as a Trustee, which led to the conclusion that the Trustee should serve as a Trustee for the fund.
Independent Trustees:
Correspondence intended for an Independent Trustee may be sent to Fidelity Investments, P.O. Box 55235, Boston, Massachusetts 02205-5235.
Name, Year of Birth; Principal Occupations and Other Relevant Experience+
Dennis J. Dirks (1948)
Year of Election or Appointment: 2005
Trustee
Mr. Dirks also serves as Trustee of other Fidelity® funds. Prior to his retirement in May 2003, Mr. Dirks was Chief Operating Officer and a member of the Board of The Depository Trust & Clearing Corporation (DTCC). He also served as President, Chief Operating Officer, and Board member of The Depository Trust Company (DTC) and President and Board member of the National Securities Clearing Corporation (NSCC). In addition, Mr. Dirks served as Chief Executive Officer and Board member of the Government Securities Clearing Corporation, Chief Executive Officer and Board member of the Mortgage-Backed Securities Clearing Corporation, as a Trustee and a member of the Finance Committee of Manhattan College (2005-2008), as a Trustee and a member of the Finance Committee of AHRC of Nassau County (2006-2008), and as a member of the Independent Directors Council (IDC) Governing Council (2010-2015). Mr. Dirks is a member of the Board of Directors for The Brookville Center for Children's Services, Inc. (2009-present).
Alan J. Lacy (1953)
Year of Election or Appointment: 2008
Trustee
Mr. Lacy also serves as Trustee of other Fidelity® funds. Mr. Lacy serves as a member of the Board of Directors of Dave & Buster's Entertainment, Inc. (restaurant and entertainment complexes, 2010-present) and Bristol-Myers Squibb Company (global pharmaceuticals, 2008-present). In addition, Mr. Lacy served as Senior Adviser (2007-2014) of Oak Hill Capital Partners, L.P. (private equity) and also served as Chief Executive Officer (2000-2005) and Vice Chairman (2005-2006) of Sears Holdings Corporation and Sears, Roebuck and Co. (retail). Mr. Lacy is a member of the Board of Trustees of The National Parks Conservation Association (2006-present). Previously, Mr. Lacy served as Chairman of the Board of Trustees of the National Parks Conservation Association (2008-2011) and as a member of the Board of Directors for The Western Union Company (global money transfer, 2006-2011), The Hillman Companies, Inc. (hardware wholesalers, 2010-2014), and Earth Fare, Inc. (retail grocery, 2010-2014).
Ned C. Lautenbach (1944)
Year of Election or Appointment: 2000
Trustee
Chairman of the Independent Trustees
Mr. Lautenbach also serves as Trustee of other Fidelity® funds. Mr. Lautenbach currently serves as the Lead Director of the Eaton Corporation Board of Directors (diversified industrial, 1997-present). Mr. Lautenbach is Chairman of the Board of Directors of Artis-Naples in Naples, Florida (2012-present), a member of the Council on Foreign Relations (1994-present), and a member of the Board of Governors, State University System of Florida (2013-present). Previously, Mr. Lautenbach was a Partner/Advisory Partner at Clayton, Dubilier & Rice, LLC (private equity investment, 1998-2010), as well as a Director of Sony Corporation (2006-2007).
Joseph Mauriello (1944)
Year of Election or Appointment: 2008
Trustee
Mr. Mauriello also serves as Trustee of other Fidelity® funds. Prior to his retirement in January 2006, Mr. Mauriello served in numerous senior management positions including Deputy Chairman and Chief Operating Officer (2004-2005), and Vice Chairman of Financial Services (2002-2004) of KPMG LLP US (professional services, 1965-2005). Mr. Mauriello currently serves as a member of the Board of Directors of XL Group plc. (global insurance and re-insurance, 2006-present) and the Independent Directors Council (IDC) Governing Council (2015-present). Previously, Mr. Mauriello served as a Director of the Hamilton Funds of the Bank of New York (2006-2007) and of Arcadia Resources Inc. (health care services and products, 2007-2012).
Robert W. Selander (1950)
Year of Election or Appointment: 2011
Trustee
Mr. Selander also serves as Trustee of other Fidelity® funds. Mr. Selander serves as a Director of The Western Union Company (global money transfer, 2014-present). Previously, Mr. Selander served as a Member of the Advisory Board of other Fidelity® funds (2011), and Executive Vice Chairman (2010), Chief Executive Officer (2009-2010), and President and Chief Executive Officer (1997-2009) of Mastercard, Inc.
Cornelia M. Small (1944)
Year of Election or Appointment: 2005
Trustee
Ms. Small also serves as Trustee of other Fidelity® funds. Ms. Small is a member of the Board of Directors (2009-present) and Chair of the Investment Committee (2010-present) of the Teagle Foundation. Ms. Small also serves on the Investment Committee of the Berkshire Taconic Community Foundation (2008-present). Previously, Ms. Small served as Chairperson (2002-2008) and a member of the Investment Committee and Chairperson (2008-2012) and a member of the Board of Trustees of Smith College. In addition, Ms. Small served as Chief Investment Officer, Director of Global Equity Investments, and a member of the Board of Directors of Scudder, Stevens & Clark and Scudder Kemper Investments.
William S. Stavropoulos (1939)
Year of Election or Appointment: 2002
Trustee
Vice Chairman of the Independent Trustees
Mr. Stavropoulos also serves as Trustee of other Fidelity® funds. Mr. Stavropoulos serves as President and Founder of the Michigan Baseball Foundation, the Great Lakes Loons (2007-present). Mr. Stavropoulos is Chairman Emeritus of the Board of Directors of The Dow Chemical Company, where he previously served in numerous senior management positions, including President, CEO (1995-2000; 2002-2004), Chairman of the Executive Committee (2000-2006), and as a member of the Board of Directors (1990-2006). Currently, Mr. Stavropoulos is Chairman of the Board of Directors of Univar Inc. (global distributor of commodity and specialty chemicals), a Director of Teradata Corporation (data warehousing and technology solutions), and Maersk Inc. (industrial conglomerate), and a member of the Advisory Board for Metalmark Capital LLC (private equity investment, 2005-present). Mr. Stavropoulos is an operating advisor to Clayton, Dubilier & Rice, LLC (private equity investment). In addition, Mr. Stavropoulos is a member of the University of Notre Dame Advisory Council for the College of Science, a Trustee of the Rollin L. Gerstacker Foundation, and a Director of the Naples Philharmonic Center for the Arts. Previously, Mr. Stavropoulos served as a Director of Chemical Financial Corporation (bank holding company, 1993-2012) and Tyco International, Ltd. (multinational manufacturing and services, 2007-2012).
David M. Thomas (1949)
Year of Election or Appointment: 2008
Trustee
Mr. Thomas also serves as Trustee of other Fidelity® funds. Mr. Thomas serves as Non-Executive Chairman of the Board of Directors of Fortune Brands Home and Security (home and security products, 2011-present), as a member of the Board of Directors (2004-present) and Presiding Director (2013-present) of Interpublic Group of Companies, Inc. (marketing communication), and as a member of the Board of Trustees of the University of Florida (2013-present). Previously, Mr. Thomas served as Executive Chairman (2005-2006) and Chairman and Chief Executive Officer (2000-2005) of IMS Health, Inc. (pharmaceutical and healthcare information solutions), and a Director of Fortune Brands, Inc. (consumer products, 2000-2011).
+ The information includes the Trustee's principal occupation during the last five years and other information relating to the experience, attributes, and skills relevant to the Trustee's qualifications to serve as a Trustee, which led to the conclusion that the Trustee should serve as a Trustee for the fund.
Advisory Board Members and Officers:
Correspondence intended for an officer or Peter S. Lynch may be sent to Fidelity Investments, 245 Summer Street, Boston, Massachusetts 02210. Officers appear below in alphabetical order.
Name, Year of Birth; Principal Occupation
Peter S. Lynch (1944)
Year of Election or Appointment: 2003
Member of the Advisory Board
Mr. Lynch also serves as Member of the Advisory Board of other Fidelity® funds. Mr. Lynch is Vice Chairman and a Director of FMR (investment adviser firm) and FMR Co., Inc. (investment adviser firm). In addition, Mr. Lynch serves as a Trustee of Boston College and as the Chairman of the Inner-City Scholarship Fund. Previously, Mr. Lynch served on the Special Olympics International Board of Directors (1997-2006).
Elizabeth Paige Baumann (1968)
Year of Election or Appointment: 2012
Anti-Money Laundering (AML) Officer
Ms. Baumann also serves as AML Officer of other funds. She is Chief AML Officer of FMR LLC (diversified financial services company, 2012-present) and is an employee of Fidelity Investments. Previously, Ms. Baumann served as Vice President and Deputy Anti-Money Laundering Officer (2007-2012).
Marc R. Bryant (1966)
Year of Election or Appointment: 2015
Secretary and Chief Legal Officer (CLO)
Mr. Bryant also serves as Secretary and CLO of other funds. Mr. Bryant serves as CLO, Secretary, and Senior Vice President of Fidelity Management & Research Company (investment adviser firm, 2015-present) and FMR Co., Inc. (investment adviser firm, 2015-present); Secretary of Fidelity SelectCo, LLC (investment adviser firm, 2015-present) and Fidelity Investments Money Management, Inc. (investment adviser firm, 2015-present); and CLO of Fidelity Management & Research (Hong Kong) Limited (investment adviser firm, 2015-present). He is Senior Vice President and Deputy General Counsel of FMR LLC (diversified financial services company). Previously, Mr. Bryant served as Secretary and CLO of Fidelity Rutland Square Trust II (2010-2014) and Assistant Secretary of Fidelity's Fixed Income and Asset Allocation Funds (2013-2015). Prior to joining Fidelity Investments, Mr. Bryant served as a Senior Vice President and the Head of Global Retail Legal for AllianceBernstein L.P. (2006-2010), and as the General Counsel for ProFund Advisors LLC (2001-2006).
William C. Coffey (1969)
Year of Election or Appointment: 2009
Assistant Secretary
Mr. Coffey also serves as Assistant Secretary of other funds. He is Senior Vice President and Deputy General Counsel of FMR LLC (diversified financial services company, 2010-present), and is an employee of Fidelity Investments. Previously, Mr. Coffey served as Vice President and Associate General Counsel of FMR LLC (2005-2009).
Jonathan Davis (1968)
Year of Election or Appointment: 2010
Assistant Treasurer
Mr. Davis also serves as Assistant Treasurer of other funds, and is an employee of Fidelity Investments. Previously, Mr. Davis served as Vice President and Associate General Counsel of FMR LLC (diversified financial services company, 2003-2010).
Adrien E. Deberghes (1967)
Year of Election or Appointment: 2008
Deputy Treasurer
Mr. Deberghes also serves as an officer of other funds. He is an employee of Fidelity Investments (2008-present). Prior to joining Fidelity Investments, Mr. Deberghes was Senior Vice President of Mutual Fund Administration at State Street Corporation (2007-2008), Senior Director of Mutual Fund Administration at Investors Bank & Trust (2005-2007), and Director of Finance for Dunkin' Brands (2000-2005).
Stephanie J. Dorsey (1969)
Year of Election or Appointment: 2010
Assistant Treasurer
Ms. Dorsey also serves as an officer of other funds. She is an employee of Fidelity Investments (2008-present) and has served in other fund officer roles. Prior to joining Fidelity Investments, Ms. Dorsey served as Treasurer (2004-2008) of the JPMorgan Mutual Funds and Vice President (2004-2008) of JPMorgan Chase Bank.
Howard J. Galligan III (1966)
Year of Election or Appointment: 2014
Chief Financial Officer
Mr. Galligan also serves as Chief Financial Officer of other funds. Mr. Galligan serves as President of Fidelity Pricing and Cash Management Services (FPCMS) (2014-present) and as a Director of Strategic Advisers, Inc. (investment adviser firm, 2008-present). Previously, Mr. Galligan served as Chief Administrative Officer of Asset Management (2011-2014) and Chief Operating Officer and Senior Vice President of Investment Support for Strategic Advisers, Inc. (2003-2011).
Scott C. Goebel (1968)
Year of Election or Appointment: 2015
Vice President
Mr. Goebel serves as Vice President of other funds and is an employee of Fidelity Investments (2001-present). Previously, Mr. Goebel served as Secretary of Fidelity SelectCo, LLC (investment adviser firm, 2013-2015), Fidelity Investments Money Management, Inc. (FIMM) (investment adviser firm, 2010-2015), and Fidelity Research and Analysis Company (FRAC) (investment adviser firm, 2010-2015); General Counsel, Secretary, and Senior Vice President of Fidelity Management & Research Company (investment adviser firm, 2008-2015) and FMR Co., Inc. (investment adviser firm, 2008-2015); Assistant Secretary of Fidelity Management & Research (Japan) Limited (investment adviser firm, 2008-2015) and FMR Investment Management (U.K.) Limited (investment adviser firm, 2008-2015); Chief Legal Officer (CLO) of Fidelity Management & Research (Hong Kong) Limited (investment adviser firm, 2008-2015); Secretary and CLO of certain Fidelity® funds (2008-2015); Assistant Secretary of FIMM (2008-2010), FRAC (2008-2010), and certain funds (2007-2008); and as Vice President and Secretary of Fidelity Distributors Corporation (FDC) (2005-2007).
Thomas C. Hense (1964)
Year of Election or Appointment: 2008, 2010, or 2015
Vice President
Mr. Hense serves as Vice President of Fidelity Advisor® Multi-Asset Income Fund (2015) and other funds (High Income (2008), Small Cap (2008), and Value (2010) funds), and is an employee of Fidelity Investments (1993-present). Previously, Mr. Hense served as a portfolio manager for Fidelity's Institutional Money Management Group (Pyramis) (2003-2008).
Brian B. Hogan (1964)
Year of Election or Appointment: 2009
Vice President
Mr. Hogan also serves as Trustee or Vice President of other funds. Mr. Hogan serves as a Director of Fidelity SelectCo, LLC (investment adviser firm, 2014-present) and President of the Equity Division of FMR (investment adviser firm, 2009-present). Previously, Mr. Hogan served as Senior Vice President, Equity Research of FMR (2006-2009) and as a portfolio manager.
Chris Maher (1972)
Year of Election or Appointment: 2013
Assistant Treasurer
Mr. Maher serves as Assistant Treasurer of other funds. Mr. Maher is Vice President of Valuation Oversight and is an employee of Fidelity Investments. Previously, Mr. Maher served as Vice President of Asset Management Compliance (2013), Vice President of the Program Management Group of FMR (investment adviser firm, 2010-2013), and Vice President of Valuation Oversight (2008-2010).
Kenneth B. Robins (1969)
Year of Election or Appointment: 2008
President and Treasurer
Mr. Robins also serves as an officer of other funds. Mr. Robins serves as Executive Vice President of Fidelity Investments Money Management, Inc. (FIMM) (investment adviser firm, 2013-present) and is an employee of Fidelity Investments (2004-present). Previously, Mr. Robins served in other fund officer roles.
Stacie M. Smith (1974)
Year of Election or Appointment: 2013
Deputy Treasurer
Ms. Smith also serves as an officer of other funds. She is an employee of Fidelity Investments (2009-present) and has served in other fund officer roles. Prior to joining Fidelity Investments, Ms. Smith served as Senior Audit Manager of Ernst & Young LLP (1996-2009).
Renee Stagnone (1975)
Year of Election or Appointment: 2013
Deputy Treasurer
Ms. Stagnone also serves as Deputy Treasurer of other funds. Ms. Stagnone is an employee of Fidelity Investments (1997-present).
Linda J. Wondrack (1964)
Year of Election or Appointment: 2014
Chief Compliance Officer
Ms. Wondrack also serves as Chief Compliance Officer of other funds. Ms. Wondrack is Executive Vice President and head of the Ethics Office and Asset Management Compliance for Fidelity Investments (2012-present). Ms. Wondrack also serves as Chief Compliance Officer of Fidelity SelectCo, LLC (investment adviser firm, 2014-present); Chief Compliance Officer of Impresa Management LLC (2013-present); and Chief Compliance Officer of FMR Co., Inc. (investment adviser firm), Fidelity Investments Money Management, Inc. (investment adviser firm), Fidelity Management & Research (Japan) Limited (investment adviser firm), FMR Investment Management (U.K.) Limited (investment adviser firm), Fidelity Management & Research (Hong Kong) (investment adviser firm), Fidelity Management & Research Company (investment adviser firm), FIAM LLC (investment adviser firm), and Strategic Advisers, Inc. (investment adviser firm), Ballyrock Investment Advisors LLC, and Northern Neck Investors LLC (2012-present). Previously, Ms. Wondrack served as Senior Vice President and Chief Compliance Officer for Columbia Management Investment Advisers, LLC (2005-2012); Chief Compliance Officer for certain funds within the Columbia Family of Funds (2007-2012); and Senior Vice President of Compliance Risk Management at Bank of America (2005-2010).
Joseph F. Zambello (1957)
Year of Election or Appointment: 2011
Deputy Treasurer
Mr. Zambello also serves as Deputy Treasurer of other funds. Mr. Zambello is an employee of Fidelity Investments (1991-present). Previously, Mr. Zambello served as Vice President of the Program Management Group of FMR (investment adviser firm, 2009-2011) and Vice President of the Transfer Agent Oversight Group (2005-2009).
Shareholder Expense Example
As a shareholder of the Fund, you incur two types of costs: (1) transaction costs, including sales charges (loads) on purchase payments or redemption proceeds, and (2) ongoing costs, including management fees, distribution and/or service (12b-1) fees and other Fund expenses. This Example is intended to help you understand your ongoing costs (in dollars) of investing in the Fund and to compare these costs with the ongoing costs of investing in other mutual funds.
The Example is based on an investment of $1,000 invested at the beginning of the period and held for the entire period (June 1, 2015 to November 30, 2015).
Actual Expenses
The first line of the accompanying table for each class of the Fund provides information about actual account values and actual expenses. You may use the information in this line, together with the amount you invested, to estimate the expenses that you paid over the period. Simply divide your account value by $1,000.00 (for example, an $8,600 account value divided by $1,000.00 = 8.6), then multiply the result by the number in the first line for a class of the Fund under the heading entitled "Expenses Paid During Period" to estimate the expenses you paid on your account during this period. In addition, the Fund, as a shareholder in the underlying Fidelity Central Funds, will indirectly bear its pro-rata share of the fees and expenses incurred by the underlying Fidelity Central Funds. These fees and expenses are not included in the Fund's annualized expense ratio used to calculate the expense estimate in the table below.
Hypothetical Example for Comparison Purposes
The second line of the accompanying table for each class of the Fund provides information about hypothetical account values and hypothetical expenses based on a Class' actual expense ratio and an assumed rate of return of 5% per year before expenses, which is not the Class' actual return. The hypothetical account values and expenses may not be used to estimate the actual ending account balance or expenses you paid for the period. You may use this information to compare the ongoing costs of investing in the Fund and other funds. To do so, compare this 5% hypothetical example with the 5% hypothetical examples that appear in the shareholder reports of the other funds. In addition, the Fund, as a shareholder in the underlying Fidelity Central Funds, will indirectly bear its pro-rata share of the fees and expenses incurred by the underlying Fidelity Central Funds. These fees and expenses are not included in the Fund's annualized expense ratio used to calculate the expense estimate in the table below.
Please note that the expenses shown in the table are meant to highlight your ongoing costs only and do not reflect any transaction costs. Therefore, the second line of the table is useful in comparing ongoing costs only, and will not help you determine the relative total costs of owning different funds. In addition, if these transactional costs were included, your costs would have been higher.
| Annualized Expense Ratio-A | Beginning Account Value June 1, 2015 | Ending Account Value November 30, 2015 | Expenses Paid During Period-B June 1, 2015 to November 30, 2015 | |
| Class A | 1.41% | |||
| Actual | $1,000.00 | $964.60 | $6.94 | |
| Hypothetical-C | $1,000.00 | $1,018.00 | $7.13 | |
| Class T | 1.64% | |||
| Actual | $1,000.00 | $963.70 | $8.07 | |
| Hypothetical-C | $1,000.00 | $1,016.85 | $8.29 | |
| Class B | 2.24% | |||
| Actual | $1,000.00 | $961.20 | $11.01 | |
| Hypothetical-C | $1,000.00 | $1,013.84 | $11.31 | |
| Class C | 2.16% | |||
| Actual | $1,000.00 | $961.40 | $10.62 | |
| Hypothetical-C | $1,000.00 | $1,014.24 | $10.91 | |
| Class I | 1.13% | |||
| Actual | $1,000.00 | $966.00 | $5.57 | |
| Hypothetical-C | $1,000.00 | $1,019.40 | $5.72 | |
| Class Z | .97% | |||
| Actual | $1,000.00 | $966.90 | $4.78 | |
| Hypothetical-C | $1,000.00 | $1,020.21 | $4.91 |
A Annualized expense ratio reflects expenses net of applicable fee waivers.
B Expenses are equal to each Class' annualized expense ratio, multiplied by the average account value over the period, multiplied by 183/365 (to reflect the one-half year period).
C 5% return per year before expenses
Distributions (Unaudited)
The Board of Trustees of Advisor Small Cap Fund voted to pay to shareholders of record at the opening of business on record date, the following distributions per share derived from capital gains realized from sales of portfolio securities and dividends from net investment income:
| Pay Date | Record Date | Dividends | Capital Gains | |
| Class I | 12/21/2015 | 12/18/2015 | $0.00 | $1.933 |
| 01/11/2016 | 01/08/2016 | $0.00 | $0.278 | |
The fund hereby designates as a capital gain dividend with respect to the taxable year ended November 30, 2015 $280,500,766 or, if subsequently determined to be different, the net capital gain of such year.
Class I designates 100% of the dividends distributed during the fiscal year as qualifying for the dividends-received deduction for corporate shareholders.
Class I designates 100% of dividends distributed during the fiscal year as amounts which may be taken into account as a dividend for purposes of the maximum rate under section 1(h)(11) of the Internal Revenue Code.
The fund will notify shareholders in January 2016 of amounts for use in preparing 2015 income tax returns.
Board Approval of Investment Advisory Contracts and Management Fees
Fidelity Advisor Small Cap Fund
Each year, the Board of Trustees, including the Independent Trustees (together, the Board), votes on the renewal of the management contract with Fidelity Management & Research Company (FMR) and the sub-advisory agreements (together, the Advisory Contracts) for the fund. The Board, assisted by the advice of fund counsel and Independent Trustees' counsel, requests and considers a broad range of information relevant to the renewal of the Advisory Contracts throughout the year.
The Board meets regularly and, at each of its meetings, covers an extensive agenda of topics and materials and considers factors that are relevant to its annual consideration of the renewal of the fund's Advisory Contracts, including the services and support provided to the fund and its shareholders. The Board has established various standing committees (Committees), each composed of and chaired by Independent Trustees with varying backgrounds, to which the Board has assigned specific subject matter responsibilities in order to enhance effective decision-making by the Board. The Board, acting directly and through its Committees, requests and receives information concerning the annual consideration of the renewal of the fund's Advisory Contracts. The Board also meets as needed to consider matters specifically related to the Board's annual consideration of the renewal of the Advisory Contracts. Members of the Board may also meet with trustees of other Fidelity funds through ad hoc joint committees to discuss certain matters relevant to all of the Fidelity funds.
At its July 2015 meeting, the Board unanimously determined to renew the fund's Advisory Contracts. In reaching its determination, the Board considered all factors it believed relevant, including (i) the nature, extent, and quality of the services to be provided to the fund and its shareholders (including the investment performance of the fund); (ii) the competitiveness of the fund's management fee and total expense ratio relative to peer funds; (iii) the total costs of the services to be provided by and the profits to be realized by Fidelity from its relationship with the fund; and (iv) the extent to which (if any) economies of scale exist and would be realized as the fund grows, and whether any economies of scale are appropriately shared with fund shareholders.
In considering whether to renew the Advisory Contracts for the fund, the Board reached a determination, with the assistance of fund counsel and Independent Trustees' counsel and through the exercise of its business judgment, that the renewal of the Advisory Contracts was in the best interests of the fund and its shareholders and that the compensation payable under the Advisory Contracts was fair and reasonable. The Board's decision to renew the Advisory Contracts was not based on any single factor, but rather was based on a comprehensive consideration of all the information provided to the Board at its meetings throughout the year. The Board, in reaching its determination to renew the Advisory Contracts, was aware that shareholders of the fund have a broad range of investment choices available to them, including a wide choice among funds offered by Fidelity's competitors, and that the fund's shareholders, who have the opportunity to review and weigh the disclosure provided by the fund in its prospectus and other public disclosures, have chosen to invest in this fund, which is part of the Fidelity family of funds.
Nature, Extent, and Quality of Services Provided. The Board considered Fidelity's staffing as it relates to the fund, including the backgrounds of investment personnel of Fidelity, and also considered the fund's investment objective, strategies, and related investment philosophy. The Independent Trustees also had discussions with senior management of Fidelity's investment operations and investment groups. The Board considered the structure of the portfolio manager compensation program and whether this structure provides appropriate incentives to act in the best interests of the fund. Additionally, the Board considered the portfolio managers' investments, if any, in the funds that they manage.Resources Dedicated to Investment Management and Support Services. The Board and the Fund Oversight and Research Committees reviewed the general qualifications and capabilities of Fidelity's investment staff, including its size, education, experience, and resources, as well as Fidelity's approach to recruiting, training, managing, and compensating investment personnel. The Board noted that Fidelity has continued to increase the resources devoted to non-U.S. offices, including expansion of Fidelity's global investment organization. The Board also noted that Fidelity's analysts have extensive resources, tools and capabilities that allow them to conduct sophisticated quantitative and fundamental analysis, as well as credit analysis of issuers, counterparties and guarantors. Further, the Board considered that Fidelity's investment professionals have sufficient access to global information and data so as to provide competitive investment results over time, and that those professionals also have access to sophisticated tools that permit them to assess portfolio construction and risk and performance attribution characteristics continuously, as well as to transmit new information and research conclusions rapidly around the world. Additionally, in its deliberations, the Board considered Fidelity's trading, risk management, and compliance capabilities and resources, which are integral parts of the investment management process.Shareholder and Administrative Services. The Board considered (i) the nature, extent, quality, and cost of advisory, administrative, and shareholder services performed by FMR, the sub-advisers (together with FMR, the Investment Advisers), and their affiliates under the Advisory Contracts and under separate agreements covering transfer agency, pricing and bookkeeping, and securities lending services for the fund; (ii) the nature and extent of the supervision of third party service providers, principally custodians and subcustodians; and (iii) the resources devoted to, and the record of compliance with, the fund's compliance policies and procedures. The Board also reviewed the allocation of fund brokerage, including allocations to brokers affiliated with the Investment Advisers, the use of brokerage commissions to pay fund expenses, and the use of "soft" commission dollars to pay for research services.The Board noted that the growth of fund assets over time across the complex allows Fidelity to reinvest in the development of services designed to enhance the value or convenience of the Fidelity funds as investment vehicles. These services include 24-hour access to account information and market information through telephone representatives and over the Internet, investor education materials and asset allocation tools, and the expanded availability of Fidelity Investor Centers.In 2014, the Board formed an ad hoc Committee on Transfer Agency Fees to review the variety of transfer agency fee structures throughout the industry and Fidelity's competitive positioning with respect to industry participants.Investment in a Large Fund Family. The Board considered the benefits to shareholders of investing in a Fidelity fund, including the benefits of investing in a fund that is part of a large family of funds offering a variety of investment disciplines and providing a large variety of mutual fund investor services. The Board noted that Fidelity had taken, or had made recommendations that resulted in the Fidelity funds taking, a number of actions over the previous year that benefited particular funds, including (i) continuing to dedicate additional resources to investment research and to the support of the senior management team that oversees asset management; (ii) continuing efforts to enhance Fidelity's global research capabilities; (iii) launching new funds and making other enhancements to meet client needs; (iv) reducing management fees and total expenses for certain index funds and diversified international funds; (v) continuing to launch dedicated lower cost underlying funds to meet portfolio construction needs related to expanding underlying fund options for Fidelity funds of funds, specifically for the Freedom Fund product lines; (vi) rationalizing product lines and gaining increased efficiencies through fund mergers; (vii) launching active fixed-income exchange-traded funds; (viii) continuing to develop, acquire and implement systems and technology to improve services to the funds and information security and to increase efficiency; (ix) implementing investment enhancements to further strengthen Fidelity's target date product line to increase investors' probability of success in achieving their goals; (x) modifying the eligibility criteria for certain share classes to accommodate roll-over assets from employer-sponsored retirement plans; (xi) launching a new Class W of the Freedom Index Funds to attract and retain Fidelity record-kept retirement plan assets; and (xii) implementing changes to Fidelity's money market product line in response to recent money market regulatory reforms.Investment Performance. The Board considered whether the fund has operated in accordance with its investment objective, as well as its record of compliance with its investment restrictions and its performance history.The Board took into account discussions with representatives of the Investment Advisers about fund investment performance that occur at Board meetings throughout the year. In this regard the Board noted that as part of regularly scheduled fund reviews and other reports to the Board on fund performance, the Board considers annualized return information for the fund, for different time periods, measured against a securities market index ("benchmark index") and a peer group of funds with similar objectives ("peer group"), if any. In its evaluation of fund investment performance, the Board gave particular attention to information indicating changes in performance of certain Fidelity funds for specific time periods and discussed with the Investment Advisers the reasons for any overperformance or underperformance.In addition to reviewing absolute and relative fund performance, the Independent Trustees periodically consider the appropriateness of fund performance metrics in evaluating the results achieved. In general, the Independent Trustees believe that fund performance should be evaluated based on net performance (after fees and expenses) of both the highest performing and lowest performing fund share classes, where applicable, compared to appropriate benchmark indices, over appropriate time periods that may include full market cycles, and compared to peer groups, as applicable, over the same periods, taking into account relevant factors including the following: general market conditions; issuer-specific information; and fund cash flows and other factors.The Independent Trustees recognize that shareholders evaluate performance on a net basis over their own holding periods, for which one-, three-, and five-year periods are often used as a proxy. For this reason, the performance information reviewed by the Board also included net cumulative calendar year total return information for the fund and an appropriate benchmark index and peer group for the most recent one-, three-, and five-year periods, as shown below. Returns are shown compared to the 25th percentile (top of box, 75% beaten) and 75th percentile (bottom of box, 25% beaten) of the peer universe.Fidelity Advisor Small Cap Fund
Fidelity Advisor Small Cap Fund
![]()
ASCFI-ANN-0116
1.713165.118
Fidelity® Stock Selector Mid Cap Fund Annual Report November 30, 2015 (A class of Fidelity Advisor® Stock Selector Mid Cap Fund) |
|
Contents
Board Approval of Investment Advisory Contracts and Management Fees |
To view a fund's proxy voting guidelines and proxy voting record for the 12-month period ended June 30, visit http://www.fidelity.com/proxyvotingresults or visit the Securities and Exchange Commission's (SEC) web site at http://www.sec.gov.
You may also call 1-800-544-8544 to request a free copy of the proxy voting guidelines.
Standard & Poor's, S&P and S&P 500 are registered service marks of The McGraw-Hill Companies, Inc. and have been licensed for use by Fidelity Distributors Corporation.
Other third-party marks appearing herein are the property of their respective owners.
All other marks appearing herein are registered or unregistered trademarks or service marks of FMR LLC or an affiliated company. © 2016 FMR LLC. All rights reserved.
This report and the financial statements contained herein are submitted for the general information of the shareholders of the Fund. This report is not authorized for distribution to prospective investors in the Fund unless preceded or accompanied by an effective prospectus.
A fund files its complete schedule of portfolio holdings with the SEC for the first and third quarters of each fiscal year on Form N-Q. Forms N-Q are available on the SEC’s web site at http://www.sec.gov. A fund's Forms N-Q may be reviewed and copied at the SEC’s Public Reference Room in Washington, DC. Information regarding the operation of the SEC's Public Reference Room may be obtained by calling 1-800-SEC-0330.
For a complete list of a fund's portfolio holdings, view the most recent holdings listing, semiannual report, or annual report on Fidelity's web site at http://www.fidelity.com, http://www.advisor.fidelity.com, or http://www.401k.com, as applicable.
NOT FDIC INSURED •MAY LOSE VALUE •NO BANK GUARANTEE
Neither the Fund nor Fidelity Distributors Corporation is a bank.
Performance: The Bottom Line
Average annual total return reflects the change in the value of an investment, assuming reinvestment of distributions from dividend income and capital gains (the profits earned upon the sale of securities that have grown in value, if any) and assuming a constant rate of performance each year.
The hypothetical investment and the average annual total returns do not reflect the deduction of taxes that a shareholder would pay on fund distributions or the redemption of fund shares.
During periods of reimbursement by Fidelity, a fund’s total return will be greater than it would be had the reimbursement not occurred.
How a fund did yesterday is no guarantee of how it will do tomorrow.
Average Annual Total Returns
| For the periods ended November 30, 2015 | Past 1 year | Past 5 years | Past 10 years |
| Fidelity® Stock Selector Mid Cap Fund | 0.90% | 11.33% | 6.17% |
The initial offering of Fidelity® Stock Selector Mid Cap Fund took place on June 6, 2012. Returns prior to June 6, 2012, are those of Class I.
$10,000 Over 10 Years
Let's say hypothetically that $10,000 was invested in Fidelity® Stock Selector Mid Cap Fund, a class of the fund, on November 30, 2005.
The chart shows how the value of your investment would have changed, and also shows how the S&P MidCap 400® Index performed over the same period.
See previous page for additional information regarding the performance of Fidelity® Stock Selector Mid Cap Fund.
| Period Ending Values | ||
| $18,195 | Fidelity® Stock Selector Mid Cap Fund | |
| $23,058 | S&P MidCap 400® Index | |
Management's Discussion of Fund Performance
Market Recap: U.S. stocks gained modestly for the 12 months ending November 30, 2015, helped by a strong October that largely erased a steep decline in August and September on concern about slowing economic growth emanating from China. Stocks benefited late in the period amid waning expectations for a near-term interest-rate hike by the U.S. Federal Reserve, additional economic stimulus in Europe and an interest-rate cut in China. The bellwether S&P 500® index advanced 2.75% for the period, with growth stocks in the benchmark far outpacing their value counterparts, as investors continued to seek growth in a subpar economic environment. Sector performance also varied widely, with more than 26 percentage points separating the leader from the laggard. Consumer discretionary (+14%) secured the top spot, benefiting from a combination of rising personal income and still-benign inflation. Information technology (+7%) and health care (+4%) also outpaced the broad market. Conversely, energy (-12%) performed worst, stymied by depressed commodity prices that also hit materials (-5%). Telecommunication services (-5%) and utilities (-4%), considered defensive sectors less sensitive to the economy, also lost ground. At period end, investors remained focused on the potential global implications of a stronger U.S. dollar and how China's transition toward a consumption-led economy may affect corporate earnings.Comments from Co-Portfolio Manager Shadman Riaz: For the year, most of the fund’s share classes (excluding sales charges, if applicable) delivered a modestly positive return, but lagged the 2.92% result of the benchmark S&P MidCap 400® Index. Stock selection was the primary source of the fund’s relative underperformance, especially in financials. Several out-of-index positions hurt performance, particularly mortgage servicer Ocwen Financial. We did not anticipate the severe impact of the New York Department of Financial Services’ regulatory action related to allegations of Ocwen’s financial irregularities. We eliminated the position by period end. Stock picks in information technology hurt, particularly within software & services. Out-of-benchmark semiconductor firm Marvell Technology Group, cloud-computing company Rackspace Holdings and semiconductor maker Skyworks Solutions all negatively affected the fund's return. Conversely, choices in the capital goods segment of industrials was beneficial, led by a stake in non-benchmark diversified technology company Roper Technologies. Interactive Brokers Group, an out-of-index global electronic broker, also helped on a relative basis.The views expressed above reflect those of the portfolio manager(s) only through the end of the period as stated on the cover of this report and do not necessarily represent the views of Fidelity or any other person in the Fidelity organization. Any such views are subject to change at any time based upon market or other conditions and Fidelity disclaims any responsibility to update such views. These views may not be relied on as investment advice and, because investment decisions for a Fidelity fund are based on numerous factors, may not be relied on as an indication of trading intent on behalf of any Fidelity fund.
Investment Summary (Unaudited)
Top Ten Stocks as of November 30, 2015
| % of fund's net assets | % of fund's net assets 6 months ago | |
| AMETEK, Inc. | 3.5 | 2.6 |
| Roper Technologies, Inc. | 3.2 | 2.5 |
| IDEX Corp. | 2.5 | 0.0 |
| Wabtec Corp. | 2.1 | 0.0 |
| PPG Industries, Inc. | 1.5 | 1.0 |
| Ecolab, Inc. | 1.5 | 1.6 |
| Jarden Corp. | 1.4 | 1.5 |
| Capital One Financial Corp. | 1.4 | 1.3 |
| NVR, Inc. | 1.3 | 0.9 |
| Teledyne Technologies, Inc. | 1.3 | 0.0 |
| 19.7 |
Top Five Market Sectors as of November 30, 2015
| % of fund's net assets | % of fund's net assets 6 months ago | |
| Financials | 24.8 | 22.9 |
| Information Technology | 16.9 | 17.1 |
| Industrials | 14.8 | 16.2 |
| Consumer Discretionary | 13.1 | 13.2 |
| Health Care | 8.3 | 8.5 |
Asset Allocation (% of fund's net assets)
| As of November 30, 2015 * | ||
| Stocks and Equity Futures | 96.8% | |
| Short-Term Investments and Net Other Assets (Liabilities) | 3.2% | |

* Foreign investments - 6.0%
| As of May 31, 2015 * | ||
| Stocks and Equity Futures | 98.4% | |
| Short-Term Investments and Net Other Assets (Liabilities) | 1.6% | |

* Foreign investments - 6.2%
Percentages shown as 0.0% may reflect amounts less than 0.05%.
Investments November 30, 2015
Showing Percentage of Net Assets
| Common Stocks - 96.3% | |||
| Shares | Value (000s) | ||
| CONSUMER DISCRETIONARY - 13.1% | |||
| Auto Components - 0.4% | |||
| Dorman Products, Inc. (a)(b) | 186,700 | $8,909 | |
| Automobiles - 0.7% | |||
| Harley-Davidson, Inc. | 337,800 | 16,525 | |
| Distributors - 0.4% | |||
| LKQ Corp. (a) | 313,300 | 9,239 | |
| Household Durables - 3.4% | |||
| Jarden Corp. (a) | 733,072 | 34,220 | |
| NVR, Inc. (a) | 18,900 | 31,799 | |
| Tupperware Brands Corp. | 264,500 | 15,016 | |
| 81,035 | |||
| Internet & Catalog Retail - 0.5% | |||
| Liberty Interactive Corp. QVC Group Series A (a) | 473,510 | 12,539 | |
| Media - 1.8% | |||
| AMC Networks, Inc. Class A (a) | 195,300 | 15,880 | |
| Liberty Broadband Corp. Class A (a) | 57,081 | 3,026 | |
| Scripps Networks Interactive, Inc. Class A | 222,200 | 12,621 | |
| Viacom, Inc. Class B (non-vtg.) | 266,100 | 13,249 | |
| 44,776 | |||
| Multiline Retail - 0.9% | |||
| Dollar General Corp. | 341,300 | 22,324 | |
| Specialty Retail - 4.5% | |||
| AutoNation, Inc. (a) | 341,200 | 21,810 | |
| Bed Bath & Beyond, Inc. (a) | 165,800 | 9,039 | |
| Best Buy Co., Inc. | 232,900 | 7,402 | |
| DSW, Inc. Class A | 295,800 | 6,792 | |
| Foot Locker, Inc. | 311,600 | 20,254 | |
| GameStop Corp. Class A | 234,900 | 8,229 | |
| Ross Stores, Inc.�� | 357,500 | 18,594 | |
| Sally Beauty Holdings, Inc. (a) | 617,400 | 15,966 | |
| 108,086 | |||
| Textiles, Apparel & Luxury Goods - 0.5% | |||
| Deckers Outdoor Corp. (a) | 12,700 | 622 | |
| Ralph Lauren Corp. | 90,000 | 11,179 | |
| 11,801 | |||
| TOTAL CONSUMER DISCRETIONARY | 315,234 | ||
| CONSUMER STAPLES - 4.2% | |||
| Beverages - 1.1% | |||
| Coca-Cola Enterprises, Inc. | 193,600 | 9,738 | |
| Dr. Pepper Snapple Group, Inc. | 77,900 | 6,992 | |
| Molson Coors Brewing Co. Class B | 93,300 | 8,586 | |
| 25,316 | |||
| Food & Staples Retailing - 0.4% | |||
| United Natural Foods, Inc. (a) | 169,200 | 7,430 | |
| Whole Foods Market, Inc. | 96,800 | 2,822 | |
| 10,252 | |||
| Food Products - 0.9% | |||
| Campbell Soup Co. | 158,900 | 8,301 | |
| ConAgra Foods, Inc. | 51,200 | 2,096 | |
| Mead Johnson Nutrition Co. Class A | 67,900 | 5,472 | |
| Nomad Foods Ltd. (a) | 62,478 | 775 | |
| The J.M. Smucker Co. | 40,903 | 4,957 | |
| 21,601 | |||
| Household Products - 1.0% | |||
| Church & Dwight Co., Inc. | 187,800 | 16,108 | |
| Energizer Holdings, Inc. | 232,700 | 7,870 | |
| 23,978 | |||
| Personal Products - 0.5% | |||
| Edgewell Personal Care Co. (a) | 154,700 | 12,453 | |
| Tobacco - 0.3% | |||
| Universal Corp. (b) | 102,200 | 5,778 | |
| TOTAL CONSUMER STAPLES | 99,378 | ||
| ENERGY - 3.2% | |||
| Energy Equipment & Services - 1.0% | |||
| Bristow Group, Inc. | 170,700 | 5,215 | |
| Dril-Quip, Inc. (a) | 168,800 | 10,653 | |
| Oil States International, Inc. (a) | 221,000 | 7,010 | |
| 22,878 | |||
| Oil, Gas & Consumable Fuels - 2.2% | |||
| Cabot Oil & Gas Corp. | 247,700 | 4,664 | |
| Cimarex Energy Co. | 56,600 | 6,737 | |
| Energen Corp. | 213,500 | 12,658 | |
| HollyFrontier Corp. | 366,300 | 17,612 | |
| PDC Energy, Inc. (a) | 75,100 | 4,242 | |
| Stone Energy Corp. (a) | 506,400 | 3,692 | |
| Whiting Petroleum Corp. (a) | 271,000 | 4,474 | |
| 54,079 | |||
| TOTAL ENERGY | 76,957 | ||
| FINANCIALS - 24.8% | |||
| Banks - 3.7% | |||
| Aldermore Group PLC | 2,108,400 | 7,462 | |
| Comerica, Inc. | 126,100 | 5,845 | |
| Huntington Bancshares, Inc. | 1,521,178 | 17,783 | |
| Prosperity Bancshares, Inc. | 151,100 | 8,372 | |
| Shawbrook Group PLC | 1,538,100 | 7,707 | |
| Signature Bank (a) | 118,700 | 18,772 | |
| Synovus Financial Corp. | 591,727 | 19,752 | |
| The Jammu & Kashmir Bank Ltd. | 2,642,702 | 3,377 | |
| 89,070 | |||
| Capital Markets - 1.9% | |||
| Fortress Investment Group LLC | 478,300 | 2,612 | |
| Interactive Brokers Group, Inc. | 571,967 | 24,800 | |
| KCG Holdings, Inc. Class A (a) | 315,344 | 4,071 | |
| MLP AG | 1,566,600 | 6,372 | |
| Oaktree Capital Group LLC Class A | 102,900 | 5,025 | |
| Vontobel Holdings AG | 81,403 | 3,659 | |
| 46,539 | |||
| Consumer Finance - 2.8% | |||
| Capital One Financial Corp. | 429,900 | 33,751 | |
| Enova International, Inc. (a) | 295,067 | 2,219 | |
| Navient Corp. | 593,916 | 7,074 | |
| OneMain Holdings, Inc. (a) | 227,080 | 11,004 | |
| SLM Corp. (a) | 1,781,916 | 12,037 | |
| 66,085 | |||
| Diversified Financial Services - 1.1% | |||
| Alexander Forbes Group Holding | 8,160,135 | 3,697 | |
| MSCI, Inc. Class A | 332,000 | 23,280 | |
| 26,977 | |||
| Insurance - 4.9% | |||
| Allied World Assurance Co. Holdings AG | 200,000 | 7,264 | |
| AmTrust Financial Services, Inc. | 194,200 | 12,139 | |
| Arthur J. Gallagher & Co. | 687,500 | 30,078 | |
| CNO Financial Group, Inc. | 665,900 | 13,471 | |
| Direct Line Insurance Group PLC | 3,189,858 | 19,784 | |
| Fairfax Financial Holdings Ltd. (sub. vtg.) | 20,400 | 9,794 | |
| Hanover Insurance Group, Inc. | 201,500 | 17,047 | |
| ProAssurance Corp. | 164,300 | 8,693 | |
| 118,270 | |||
| Real Estate Investment Trusts - 9.4% | |||
| Altisource Residential Corp. Class B | 432,521 | 5,727 | |
| Cousins Properties, Inc. | 595,858 | 5,857 | |
| DCT Industrial Trust, Inc. | 202,400 | 7,726 | |
| Empire State Realty Trust, Inc. | 367,100 | 6,751 | |
| Equity Lifestyle Properties, Inc. | 215,500 | 13,443 | |
| Essex Property Trust, Inc. | 42,000 | 9,693 | |
| Extra Space Storage, Inc. | 233,700 | 19,572 | |
| FelCor Lodging Trust, Inc. | 1,315,200 | 10,548 | |
| Healthcare Realty Trust, Inc. | 244,500 | 6,648 | |
| InfraReit, Inc. | 210,500 | 4,246 | |
| Liberty Property Trust (SBI) | 68,500 | 2,322 | |
| Mack-Cali Realty Corp. | 624,700 | 14,680 | |
| Mid-America Apartment Communities, Inc. | 212,250 | 18,797 | |
| Outfront Media, Inc. | 285,800 | 6,531 | |
| Parkway Properties, Inc. | 621,100 | 10,608 | |
| Potlatch Corp. | 190,900 | 6,380 | |
| Ramco-Gershenson Properties Trust (SBI) | 762,300 | 12,860 | |
| Redwood Trust, Inc. | 358,100 | 4,935 | |
| Sabra Health Care REIT, Inc. | 485,000 | 10,030 | |
| SL Green Realty Corp. | 29,965 | 3,538 | |
| Store Capital Corp. | 324,700 | 7,390 | |
| Taubman Centers, Inc. | 183,700 | 13,203 | |
| The GEO Group, Inc. | 138,450 | 4,059 | |
| Urban Edge Properties | 861,500 | 20,667 | |
| 226,211 | |||
| Real Estate Management & Development - 0.4% | |||
| CBRE Group, Inc. (a) | 239,650 | 8,980 | |
| Thrifts & Mortgage Finance - 0.6% | |||
| Essent Group Ltd. (a) | 330,800 | 8,177 | |
| LIC Housing Finance Ltd. (a) | 790,000 | 5,759 | |
| 13,936 | |||
| TOTAL FINANCIALS | 596,068 | ||
| HEALTH CARE - 8.3% | |||
| Biotechnology - 0.8% | |||
| AMAG Pharmaceuticals, Inc. (a) | 180,000 | 4,792 | |
| Puma Biotechnology, Inc. (a) | 50,000 | 3,765 | |
| Vertex Pharmaceuticals, Inc. (a) | 88,000 | 11,384 | |
| 19,941 | |||
| Health Care Equipment & Supplies - 3.4% | |||
| Boston Scientific Corp. (a) | 1,040,000 | 19,011 | |
| CONMED Corp. | 170,000 | 7,225 | |
| Nevro Corp. | 150,000 | 9,057 | |
| The Cooper Companies, Inc. | 140,000 | 20,475 | |
| Wright Medical Group NV (a) | 620,000 | 13,280 | |
| Zimmer Biomet Holdings, Inc. | 120,000 | 12,121 | |
| 81,169 | |||
| Health Care Providers & Services - 1.8% | |||
| Adeptus Health, Inc. Class A (a)(b) | 116,000 | 6,970 | |
| HCA Holdings, Inc. (a) | 128,000 | 8,712 | |
| MEDNAX, Inc. (a) | 270,000 | 19,270 | |
| Surgical Care Affiliates, Inc. (a) | 230,000 | 8,549 | |
| 43,501 | |||
| Life Sciences Tools & Services - 0.6% | |||
| Agilent Technologies, Inc. | 330,000 | 13,801 | |
| Pharmaceuticals - 1.7% | |||
| Catalent, Inc. (a) | 560,000 | 15,596 | |
| Endo Health Solutions, Inc. (a) | 255,000 | 15,677 | |
| Prestige Brands Holdings, Inc. (a) | 190,000 | 9,669 | |
| 40,942 | |||
| TOTAL HEALTH CARE | 199,354 | ||
| INDUSTRIALS - 14.8% | |||
| Aerospace & Defense - 1.3% | |||
| Teledyne Technologies, Inc. (a) | 338,336 | 31,299 | |
| Electrical Equipment - 3.5% | |||
| AMETEK, Inc. | 1,497,390 | 84,543 | |
| Industrial Conglomerates - 3.2% | |||
| Roper Technologies, Inc. | 404,220 | 78,213 | |
| Machinery - 5.7% | |||
| IDEX Corp. | 755,100 | 59,502 | |
| WABCO Holdings, Inc. (a) | 247,950 | 26,650 | |
| Wabtec Corp. | 630,100 | 50,484 | |
| 136,636 | |||
| Road & Rail - 0.8% | |||
| J.B. Hunt Transport Services, Inc. | 236,440 | 18,499 | |
| Trading Companies & Distributors - 0.3% | |||
| AerCap Holdings NV (a) | 146,500 | 6,657 | |
| TOTAL INDUSTRIALS | 355,847 | ||
| INFORMATION TECHNOLOGY - 16.9% | |||
| Communications Equipment - 0.4% | |||
| F5 Networks, Inc. (a) | 97,230 | 10,015 | |
| Electronic Equipment & Components - 2.4% | |||
| CDW Corp. | 445,700 | 19,241 | |
| IPG Photonics Corp. (a)(b) | 161,700 | 14,745 | |
| Trimble Navigation Ltd. (a) | 968,700 | 22,183 | |
| 56,169 | |||
| Internet Software & Services - 1.2% | |||
| IAC/InterActiveCorp | 123,600 | 7,761 | |
| Rackspace Hosting, Inc. (a) | 748,200 | 21,413 | |
| Velti PLC (a)(c) | 215,084 | 1 | |
| 29,175 | |||
| IT Services - 4.8% | |||
| Alliance Data Systems Corp. (a) | 88,900 | 25,501 | |
| Blackhawk Network Holdings, Inc. (a) | 170,000 | 8,050 | |
| Cognizant Technology Solutions Corp. Class A (a) | 367,600 | 23,740 | |
| Maximus, Inc. | 545,500 | 30,957 | |
| PayPal Holdings, Inc. (a) | 176,100 | 6,209 | |
| Total System Services, Inc. | 292,300 | 16,357 | |
| Virtusa Corp. (a) | 102,200 | 5,033 | |
| 115,847 | |||
| Semiconductors & Semiconductor Equipment - 3.4% | |||
| Cirrus Logic, Inc. (a) | 301,300 | 9,961 | |
| Cree, Inc. (a)(b) | 558,600 | 15,440 | |
| Cypress Semiconductor Corp. (b) | 918,500 | 9,938 | |
| Lam Research Corp. | 57,800 | 4,520 | |
| Marvell Technology Group Ltd. | 1,344,500 | 11,912 | |
| Micron Technology, Inc. (a) | 500,600 | 7,975 | |
| NXP Semiconductors NV (a) | 153,600 | 14,355 | |
| Skyworks Solutions, Inc. | 74,200 | 6,160 | |
| 80,261 | |||
| Software - 3.3% | |||
| Adobe Systems, Inc. (a) | 68,900 | 6,302 | |
| Citrix Systems, Inc. (a) | 198,000 | 15,181 | |
| CommVault Systems, Inc. (a) | 340,800 | 13,966 | |
| Fair Isaac Corp. | 209,600 | 19,964 | |
| Rovi Corp. (a) | 179,170 | 2,116 | |
| Salesforce.com, Inc. (a) | 134,600 | 10,726 | |
| Synchronoss Technologies, Inc. (a) | 25,100 | 988 | |
| VMware, Inc. Class A (a)(b) | 68,700 | 4,219 | |
| Workday, Inc. Class A (a) | 77,000 | 6,446 | |
| 79,908 | |||
| Technology Hardware, Storage & Peripherals - 1.4% | |||
| SanDisk Corp. | 144,200 | 10,652 | |
| Western Digital Corp. | 376,000 | 23,466 | |
| 34,118 | |||
| TOTAL INFORMATION TECHNOLOGY | 405,493 | ||
| MATERIALS - 6.5% | |||
| Chemicals - 5.9% | |||
| CF Industries Holdings, Inc. | 388,000 | 17,902 | |
| Eastman Chemical Co. | 217,800 | 15,823 | |
| Ecolab, Inc. | 297,579 | 35,460 | |
| PPG Industries, Inc. | 336,700 | 35,603 | |
| Sherwin-Williams Co. | 77,800 | 21,478 | |
| W.R. Grace & Co. (a) | 165,397 | 16,245 | |
| 142,511 | |||
| Containers & Packaging - 0.6% | |||
| WestRock Co. | 267,400 | 13,538 | |
| TOTAL MATERIALS | 156,049 | ||
| TELECOMMUNICATION SERVICES - 0.1% | |||
| Diversified Telecommunication Services - 0.1% | |||
| Cogent Communications Group, Inc. | 38,700 | 1,299 | |
| Zayo Group Holdings, Inc. (a) | 38,300 | 931 | |
| 2,230 | |||
| Wireless Telecommunication Services - 0.0% | |||
| T-Mobile U.S., Inc. (a) | 26,900 | 955 | |
| TOTAL TELECOMMUNICATION SERVICES | 3,185 | ||
| UTILITIES - 4.4% | |||
| Electric Utilities - 2.2% | |||
| Hawaiian Electric Industries, Inc. | 135,000 | 3,858 | |
| OGE Energy Corp. | 492,126 | 12,849 | |
| Pinnacle West Capital Corp. | 132,900 | 8,421 | |
| PNM Resources, Inc. | 656,600 | 19,041 | |
| Portland General Electric Co. | 95,300 | 3,518 | |
| Westar Energy, Inc. | 152,803 | 6,522 | |
| 54,209 | |||
| Gas Utilities - 1.5% | |||
| Atmos Energy Corp. | 210,940 | 13,144 | |
| National Fuel Gas Co. | 191,111 | 8,738 | |
| Questar Corp. | 279,900 | 5,304 | |
| Southwest Gas Corp. | 143,263 | 8,034 | |
| 35,220 | |||
| Independent Power and Renewable Electricity Producers - 0.7% | |||
| Black Hills Corp. (b) | 198,735 | 8,530 | |
| Calpine Corp. (a) | 500,300 | 7,394 | |
| 15,924 | |||
| TOTAL UTILITIES | 105,353 | ||
| TOTAL COMMON STOCKS | |||
| (Cost $2,306,814) | 2,312,918 | ||
| Principal Amount (000s) | Value (000s) | ||
| U.S. Treasury Obligations - 0.0% | |||
| U.S. Treasury Bills, yield at date of purchase 0.1% 1/28/16 (d) | |||
| (Cost $660) | 660 | 660 | |
| Shares | Value (000s) | ||
| Money Market Funds - 6.1% | |||
| Fidelity Cash Central Fund, 0.18% (e) | 91,429,328 | $91,429 | |
| Fidelity Securities Lending Cash Central Fund, 0.22% (e)(f) | 55,766,450 | 55,766 | |
| TOTAL MONEY MARKET FUNDS | |||
| (Cost $147,195) | 147,195 | ||
| TOTAL INVESTMENT PORTFOLIO - 102.4% | |||
| (Cost $2,454,669) | 2,460,773 | ||
| NET OTHER ASSETS (LIABILITIES) - (2.4)% | (57,656) | ||
| NET ASSETS - 100% | $2,403,117 |
| Futures Contracts | |||
| Expiration Date | Underlying Face Amount at Value (000s) | Unrealized Appreciation/(Depreciation) (000s) | |
| Purchased | |||
| Equity Index Contracts | |||
| 75 CME E-mini S&P MidCap 400 Index Contracts (United States) | Dec. 2015 | 10,951 | $219 |
The face value of futures purchased as a percentage of Net Assets is 0.5%
For the period, the average monthly underlying face amount at value for futures contracts in the aggregate was $6,856,000.
Legend
(a) Non-income producing
(b) Security or a portion of the security is on loan at period end.
(c) Restricted securities - Investment in securities not registered under the Securities Act of 1933 (excluding 144A issues). At the end of the period, the value of restricted securities (excluding 144A issues) amounted to $1,000 or 0.0% of net assets.
(d) Security or a portion of the security was pledged to cover margin requirements for futures contracts. At period end, the value of securities pledged amounted to $660,000.
(e) Affiliated fund that is generally available only to investment companies and other accounts managed by Fidelity Investments. The rate quoted is the annualized seven-day yield of the fund at period end. A complete unaudited listing of the fund's holdings as of its most recent quarter end is available upon request. In addition, each Fidelity Central Fund's financial statements , which are not covered by the Fund's Report of Independent Registered Public Accounting Firm, are available on the SEC's website or upon request.
(f) Investment made with cash collateral received from securities on loan.
Additional information on each restricted holding is as follows:
| Security | Acquisition Date | Acquisition Cost (000s) |
| Velti PLC | 4/19/13 | $323 |
Affiliated Central Funds
Information regarding fiscal year to date income earned by the Fund from investments in Fidelity Central Funds is as follows:
| Fund | Income earned |
| (Amounts in thousands) | |
| Fidelity Cash Central Fund | $88 |
| Fidelity Securities Lending Cash Central Fund | 295 |
| Total | $383 |
Investment Valuation
The following is a summary of the inputs used, as of November 30, 2015, involving the Fund's assets and liabilities carried at fair value. The inputs or methodology used for valuing securities may not be an indication of the risk associated with investing in those securities. For more information on valuation inputs, and their aggregation into the levels used below, please refer to the Investment Valuation section in the accompanying Notes to Financial Statements.
| Valuation Inputs at Reporting Date: | ||||
| Description | Total | Level 1 | Level 2 | Level 3 |
| (Amounts in thousands) | ||||
| Investments in Securities: | ||||
| Equities: | ||||
| Consumer Discretionary | $315,234 | $315,234 | $-- | $-- |
| Consumer Staples | 99,378 | 99,378 | -- | -- |
| Energy | 76,957 | 76,957 | -- | -- |
| Financials | 596,068 | 596,068 | -- | -- |
| Health Care | 199,354 | 199,354 | -- | -- |
| Industrials | 355,847 | 355,847 | -- | -- |
| Information Technology | 405,493 | 405,492 | 1 | -- |
| Materials | 156,049 | 156,049 | -- | -- |
| Telecommunication Services | 3,185 | 3,185 | -- | -- |
| Utilities | 105,353 | 105,353 | -- | -- |
| U.S. Government and Government Agency Obligations | 660 | -- | 660 | -- |
| Money Market Funds | 147,195 | 147,195 | -- | -- |
| Total Investments in Securities: | $2,460,773 | $2,460,112 | $661 | $-- |
| Derivative Instruments: | ||||
| Assets | ||||
| Futures Contracts | $219 | $219 | $-- | $-- |
| Total Assets | $219 | $219 | $-- | $-- |
| Total Derivative Instruments: | $219 | $219 | $-- | $-- |
Value of Derivative Instruments
The following table is a summary of the Fund's value of derivative instruments by primary risk exposure as of November 30, 2015. For additional information on derivative instruments, please refer to the Derivative Instruments section in the accompanying Notes to Financial Statements.
| Primary Risk Exposure / Derivative Type | Value | |
| (Amounts in thousands) | ||
| Asset | Liability | |
| Equity Risk | ||
| Futures Contracts(a) | $219 | $0 |
| Total Equity Risk | $219 | $0 |
| Total Value of Derivatives | $219 | $0 |
(a) Reflects gross cumulative appreciation (depreciation) on futures contracts as presented in the Schedule of Investments. Only the period end receivable or payable for daily variation margin and net unrealized appreciation (depreciation) are presented in the Statement of Assets and Liabilities.
See accompanying notes which are an integral part of the financial statements.
Financial Statements
Statement of Assets and Liabilities
| Amounts in thousands (except per-share amounts) | November 30, 2015 | |
| Assets | ||
| Investment in securities, at value (including securities loaned of $54,545) — See accompanying schedule: Unaffiliated issuers (cost $2,307,474) | $2,313,578 | |
| Fidelity Central Funds (cost $147,195) | 147,195 | |
| Total Investments (cost $2,454,669) | $2,460,773 | |
| Cash | 84 | |
| Receivable for investments sold | 5,727 | |
| Receivable for fund shares sold | 1,407 | |
| Dividends receivable | 1,423 | |
| Distributions receivable from Fidelity Central Funds | 40 | |
| Prepaid expenses | 6 | |
| Other receivables | 26 | |
| Total assets | 2,469,486 | |
| Liabilities | ||
| Payable for investments purchased | $4,256 | |
| Payable for fund shares redeemed | 4,322 | |
| Accrued management fee | 843 | |
| Distribution and service plan fees payable | 543 | |
| Payable for daily variation margin for derivative instruments | 82 | |
| Other affiliated payables | 498 | |
| Other payables and accrued expenses | 59 | |
| Collateral on securities loaned, at value | 55,766 | |
| Total liabilities | 66,369 | |
| Net Assets | $2,403,117 | |
| Net Assets consist of: | ||
| Paid in capital | $2,358,912 | |
| Undistributed net investment income | 1,101 | |
| Accumulated undistributed net realized gain (loss) on investments and foreign currency transactions | 36,800 | |
| Net unrealized appreciation (depreciation) on investments and assets and liabilities in foreign currencies | 6,304 | |
| Net Assets | $2,403,117 | |
| Calculation of Maximum Offering Price | ||
| Class A: | ||
| Net Asset Value and redemption price per share ($592,521 ÷ 18,511.05 shares) | $32.01 | |
| Maximum offering price per share (100/94.25 of $32.01) | $33.96 | |
| Class T: | ||
| Net Asset Value and redemption price per share ($681,417 ÷ 21,191.40 shares) | $32.16 | |
| Maximum offering price per share (100/96.50 of $32.16) | $33.33 | |
| Class B: | ||
| Net Asset Value and offering price per share ($9,548 ÷ 324.61 shares)(a) | $29.41 | |
| Class C: | ||
| Net Asset Value and offering price per share ($154,546 ÷ 5,242.53 shares)(a) | $29.48 | |
| Fidelity Stock Selector Mid Cap Fund: | ||
| Net Asset Value, offering price and redemption price per share ($486,252 ÷ 14,586.72 shares) | $33.34 | |
| Class I: | ||
| Net Asset Value, offering price and redemption price per share ($478,833 ÷ 14,339.82 shares) | $33.39 |
(a) Redemption price per share is equal to net asset value less any applicable contingent deferred sales charge.
See accompanying notes which are an integral part of the financial statements.
Statement of Operations
| Amounts in thousands | Year ended November 30, 2015 | |
| Investment Income | ||
| Dividends | $30,394 | |
| Interest | 1 | |
| Income from Fidelity Central Funds | 383 | |
| Total income | 30,778 | |
| Expenses | ||
| Management fee | ||
| Basic fee | $13,923 | |
| Performance adjustment | (1,608) | |
| Transfer agent fees | 5,607 | |
| Distribution and service plan fees | 7,168 | |
| Accounting and security lending fees | 771 | |
| Custodian fees and expenses | 69 | |
| Independent trustees' compensation | 11 | |
| Registration fees | 116 | |
| Audit | 62 | |
| Legal | 20 | |
| Miscellaneous | 17 | |
| Total expenses before reductions | 26,156 | |
| Expense reductions | (255) | 25,901 |
| Net investment income (loss) | 4,877 | |
| Realized and Unrealized Gain (Loss) | ||
| Net realized gain (loss) on: | ||
| Investment securities: | ||
| Unaffiliated issuers | 273,424 | |
| Foreign currency transactions | (26) | |
| Futures contracts | 1,414 | |
| Total net realized gain (loss) | 274,812 | |
| Change in net unrealized appreciation (depreciation) on: Investment securities (net of increase in deferred foreign taxes of $7) | (264,738) | |
| Assets and liabilities in foreign currencies | (7) | |
| Futures contracts | 243 | |
| Total change in net unrealized appreciation (depreciation) | (264,502) | |
| Net gain (loss) | 10,310 | |
| Net increase (decrease) in net assets resulting from operations | $15,187 |
See accompanying notes which are an integral part of the financial statements.
Statement of Changes in Net Assets
| Amounts in thousands | Year ended November 30, 2015 | Year ended November 30, 2014 |
| Increase (Decrease) in Net Assets | ||
| Operations | ||
| Net investment income (loss) | $4,877 | $3,875 |
| Net realized gain (loss) | 274,812 | 302,104 |
| Change in net unrealized appreciation (depreciation) | (264,502) | (34,271) |
| Net increase (decrease) in net assets resulting from operations | 15,187 | 271,708 |
| Distributions to shareholders from net investment income | (2,753) | (1,252) |
| Share transactions - net increase (decrease) | (166,510) | 147,034 |
| Total increase (decrease) in net assets | (154,076) | 417,490 |
| Net Assets | ||
| Beginning of period | 2,557,193 | 2,139,703 |
| End of period (including undistributed net investment income of $1,101 and undistributed net investment income of $708, respectively) | $2,403,117 | $2,557,193 |
See accompanying notes which are an integral part of the financial statements.
Financial Highlights — Fidelity Advisor Stock Selector Mid Cap Fund Class A
| November 30, | |||||
| Years ended November 30, | 2015 | 2014 | 2013 | 2012 | 2011 |
| Selected Per–Share Data | |||||
| Net asset value, beginning of period | $31.80 | $28.37 | $22.16 | $19.15 | $19.22 |
| Income from Investment Operations | |||||
| Net investment income (loss)A | .08 | .08 | .10 | .09 | .08B |
| Net realized and unrealized gain (loss) | .13 | 3.36 | 6.29 | 3.02 | (.15) |
| Total from investment operations | .21 | 3.44 | 6.39 | 3.11 | (.07) |
| Distributions from net investment income | – | (.01) | (.14) | (.10) | – |
| Distributions from net realized gain | – | – | (.04) | – | – |
| Total distributions | – | (.01) | (.18) | (.10) | – |
| Net asset value, end of period | $32.01 | $31.80 | $28.37 | $22.16 | $19.15 |
| Total ReturnC,D | .66% | 12.11% | 29.07% | 16.32% | (.36)% |
| Ratios to Average Net AssetsE,F | |||||
| Expenses before reductions | .98% | 1.05% | .95% | .94% | .92% |
| Expenses net of fee waivers, if any | .98% | 1.05% | .95% | .94% | .92% |
| Expenses net of all reductions | .97% | 1.05% | .92% | .94% | .91% |
| Net investment income (loss) | .24% | .26% | .39% | .41% | .39%B |
| Supplemental Data | |||||
| Net assets, end of period (in millions) | $593 | $652 | $692 | $593 | $644 |
| Portfolio turnover rateG | 109% | 89% | 79%H | 72% | 198% |
A Calculated based on average shares outstanding during the period.
B Investment income per share reflects a large, non-recurring dividend which amounted to $.05 per share. Excluding this non-recurring dividend, the ratio of net investment income (loss) to average net assets would have been .12%.
C Total returns would have been lower if certain expenses had not been reduced during the applicable periods shown.
D Total returns do not include the effect of the sales charges.
E Fees and expenses of any underlying Fidelity Central Funds are not included in the Fund's expense ratio. The Fund indirectly bears its proportionate share of the expenses of any underlying Fidelity Central Funds.
F Expense ratios reflect operating expenses of the class. Expenses before reductions do not reflect amounts reimbursed by the investment adviser or reductions from brokerage service arrangements or reductions from other expense offset arrangements and do not represent the amount paid by the class during periods when reimbursements or reductions occur. Expenses net of fee waivers reflect expenses after reimbursement by the investment adviser but prior to reductions from brokerage service arrangements or other expense offset arrangements. Expenses net of all reductions represent the net expenses paid by the class.
G Amount does not include the portfolio activity of any underlying Fidelity Central Funds.
H The portfolio turnover rate does not include the assets acquired in the merger.
See accompanying notes which are an integral part of the financial statements.
Financial Highlights — Fidelity Advisor Stock Selector Mid Cap Fund Class T
| November 30, | |||||
| Years ended November 30, | 2015 | 2014 | 2013 | 2012 | 2011 |
| Selected Per–Share Data | |||||
| Net asset value, beginning of period | $32.02 | $28.63 | $22.36 | $19.30 | $19.41 |
| Income from Investment Operations | |||||
| Net investment income (loss)A | – | .01 | .04 | .05 | .04B |
| Net realized and unrealized gain (loss) | .14 | 3.38 | 6.36 | 3.05 | (.15) |
| Total from investment operations | .14 | 3.39 | 6.40 | 3.10 | (.11) |
| Distributions from net investment income | – | – | (.09) | (.04) | – |
| Distributions from net realized gain | – | – | (.04) | – | – |
| Total distributions | – | – | (.13) | (.04) | – |
| Net asset value, end of period | $32.16 | $32.02 | $28.63 | $22.36 | $19.30 |
| Total ReturnC,D | .44% | 11.84% | 28.80% | 16.12% | (.57)% |
| Ratios to Average Net AssetsE,F | |||||
| Expenses before reductions | 1.22% | 1.28% | 1.16% | 1.14% | 1.11% |
| Expenses net of fee waivers, if any | 1.21% | 1.28% | 1.16% | 1.14% | 1.11% |
| Expenses net of all reductions | 1.21% | 1.27% | 1.13% | 1.13% | 1.10% |
| Net investment income (loss) | .01% | .03% | .17% | .22% | .20%B |
| Supplemental Data | |||||
| Net assets, end of period (in millions) | $681 | $794 | $817 | $755 | $871 |
| Portfolio turnover rateG | 109% | 89% | 79%H | 72% | 198% |
A Calculated based on average shares outstanding during the period.
B Investment income per share reflects a large, non-recurring dividend which amounted to $.05 per share. Excluding this non-recurring dividend, the ratio of net investment income (loss) to average net assets would have been (.07) %.
C Total returns would have been lower if certain expenses had not been reduced during the applicable periods shown.
D Total returns do not include the effect of the sales charges.
E Fees and expenses of any underlying Fidelity Central Funds are not included in the Fund's expense ratio. The Fund indirectly bears its proportionate share of the expenses of any underlying Fidelity Central Funds.
F Expense ratios reflect operating expenses of the class. Expenses before reductions do not reflect amounts reimbursed by the investment adviser or reductions from brokerage service arrangements or reductions from other expense offset arrangements and do not represent the amount paid by the class during periods when reimbursements or reductions occur. Expenses net of fee waivers reflect expenses after reimbursement by the investment adviser but prior to reductions from brokerage service arrangements or other expense offset arrangements. Expenses net of all reductions represent the net expenses paid by the class.
G Amount does not include the portfolio activity of any underlying Fidelity Central Funds.
H The portfolio turnover rate does not include the assets acquired in the merger.
See accompanying notes which are an integral part of the financial statements.
Financial Highlights — Fidelity Advisor Stock Selector Mid Cap Fund Class B
| November 30, | |||||
| Years ended November 30, | 2015 | 2014 | 2013 | 2012 | 2011 |
| Selected Per–Share Data | |||||
| Net asset value, beginning of period | $29.47 | $26.51 | $20.71 | $17.94 | $18.15 |
| Income from Investment Operations | |||||
| Net investment income (loss)A | (.18) | (.16) | (.10) | (.07) | (.07)B |
| Net realized and unrealized gain (loss) | .12 | 3.12 | 5.90 | 2.84 | (.14) |
| Total from investment operations | (.06) | 2.96 | 5.80 | 2.77 | (.21) |
| Distributions from net investment income | – | – | – | – | – |
| Distributions from net realized gain | – | – | – | – | – |
| Total distributions | – | – | – | – | – |
| Net asset value, end of period | $29.41 | $29.47 | $26.51 | $20.71 | $17.94 |
| Total ReturnC,D | (.20)% | 11.17% | 28.01% | 15.44% | (1.16)% |
| Ratios to Average Net AssetsE,F | |||||
| Expenses before reductions | 1.83% | 1.89% | 1.76% | 1.73% | 1.71% |
| Expenses net of fee waivers, if any | 1.83% | 1.89% | 1.76% | 1.73% | 1.71% |
| Expenses net of all reductions | 1.82% | 1.88% | 1.74% | 1.73% | 1.70% |
| Net investment income (loss) | (.61)% | (.58)% | (.43)% | (.38)% | (.40)%B |
| Supplemental Data | |||||
| Net assets, end of period (in millions) | $10 | $16 | $21 | $22 | $28 |
| Portfolio turnover rateG | 109% | 89% | 79%H | 72% | 198% |
A Calculated based on average shares outstanding during the period.
B Investment income per share reflects a large, non-recurring dividend which amounted to $.05 per share. Excluding this non-recurring dividend, the ratio of net investment income (loss) to average net assets would have been (.67) %.
C Total returns would have been lower if certain expenses had not been reduced during the applicable periods shown.
D Total returns do not include the effect of the contingent deferred sales charge.
E Fees and expenses of any underlying Fidelity Central Funds are not included in the Fund's expense ratio. The Fund indirectly bears its proportionate share of the expenses of any underlying Fidelity Central Funds.
F Expense ratios reflect operating expenses of the class. Expenses before reductions do not reflect amounts reimbursed by the investment adviser or reductions from brokerage service arrangements or reductions from other expense offset arrangements and do not represent the amount paid by the class during periods when reimbursements or reductions occur. Expenses net of fee waivers reflect expenses after reimbursement by the investment adviser but prior to reductions from brokerage service arrangements or other expense offset arrangements. Expenses net of all reductions represent the net expenses paid by the class.
G Amount does not include the portfolio activity of any underlying Fidelity Central Funds.
H The portfolio turnover rate does not include the assets acquired in the merger.
See accompanying notes which are an integral part of the financial statements.
Financial Highlights — Fidelity Advisor Stock Selector Mid Cap Fund Class C
| November 30, | |||||
| Years ended November 30, | 2015 | 2014 | 2013 | 2012 | 2011 |
| Selected Per–Share Data | |||||
| Net asset value, beginning of period | $29.51 | $26.52 | $20.73 | $17.95 | $18.15 |
| Income from Investment Operations | |||||
| Net investment income (loss)A | (.15) | (.14) | (.09) | (.06) | (.07)B |
| Net realized and unrealized gain (loss) | .12 | 3.13 | 5.91 | 2.84 | (.13) |
| Total from investment operations | (.03) | 2.99 | 5.82 | 2.78 | (.20) |
| Distributions from net investment income | – | – | (.02) | – | – |
| Distributions from net realized gain | – | – | (.01) | – | – |
| Total distributions | – | – | (.03) | – | – |
| Net asset value, end of period | $29.48 | $29.51 | $26.52 | $20.73 | $17.95 |
| Total ReturnC,D | (.10)% | 11.27% | 28.09% | 15.49% | (1.10)% |
| Ratios to Average Net AssetsE,F | |||||
| Expenses before reductions | 1.74% | 1.80% | 1.69% | 1.68% | 1.66% |
| Expenses net of fee waivers, if any | 1.73% | 1.80% | 1.69% | 1.68% | 1.66% |
| Expenses net of all reductions | 1.73% | 1.80% | 1.67% | 1.68% | 1.65% |
| Net investment income (loss) | (.51)% | (.49)% | (.36)% | (.33)% | (.35)%B |
| Supplemental Data | |||||
| Net assets, end of period (in millions) | $155 | $172 | $172 | $141 | $150 |
| Portfolio turnover rateG | 109% | 89% | 79%H | 72% | 198% |
A Calculated based on average shares outstanding during the period.
B Investment income per share reflects a large, non-recurring dividend which amounted to $.05 per share. Excluding this non-recurring dividend, the ratio of net investment income (loss) to average net assets would have been (.62) %.
C Total returns would have been lower if certain expenses had not been reduced during the applicable periods shown.
D Total returns do not include the effect of the contingent deferred sales charge.
E Fees and expenses of any underlying Fidelity Central Funds are not included in the Fund's expense ratio. The Fund indirectly bears its proportionate share of the expenses of any underlying Fidelity Central Funds.
F Expense ratios reflect operating expenses of the class. Expenses before reductions do not reflect amounts reimbursed by the investment adviser or reductions from brokerage service arrangements or reductions from other expense offset arrangements and do not represent the amount paid by the class during periods when reimbursements or reductions occur. Expenses net of fee waivers reflect expenses after reimbursement by the investment adviser but prior to reductions from brokerage service arrangements or other expense offset arrangements. Expenses net of all reductions represent the net expenses paid by the class.
G Amount does not include the portfolio activity of any underlying Fidelity Central Funds.
H The portfolio turnover rate does not include the assets acquired in the merger.
See accompanying notes which are an integral part of the financial statements.
Financial Highlights — Fidelity Stock Selector Mid Cap Fund
| November 30, | ||||
| Years ended November 30, | 2015 | 2014 | 2013 | 2012 A |
| Selected Per–Share Data | ||||
| Net asset value, beginning of period | $33.14 | $29.56 | $23.14 | $21.20 |
| Income from Investment Operations | ||||
| Net investment income (loss)B | .16 | .16 | .17 | .09 |
| Net realized and unrealized gain (loss) | .14 | 3.49 | 6.54 | 1.85 |
| Total from investment operations | .30 | 3.65 | 6.71 | 1.94 |
| Distributions from net investment income | (.10) | (.07) | (.25) | – |
| Distributions from net realized gain | – | – | (.04) | – |
| Total distributions | (.10) | (.07) | (.29) | – |
| Net asset value, end of period | $33.34 | $33.14 | $29.56 | $23.14 |
| Total ReturnC,D | .90% | 12.38% | 29.36% | 9.15% |
| Ratios to Average Net AssetsE,F | ||||
| Expenses before reductions | .75% | .81% | .71% | .59%G |
| Expenses net of fee waivers, if any | .74% | .81% | .71% | .59%G |
| Expenses net of all reductions | .74% | .81% | .69% | .58%G |
| Net investment income (loss) | .48% | .50% | .62% | .86%G |
| Supplemental Data | ||||
| Net assets, end of period (in millions) | $486 | $553 | $225 | $1 |
| Portfolio turnover rateH | 109% | 89% | 79%I | 72% |
A For the period June 6, 2012 (commencement of sale of shares) to November 30, 2012.
B Calculated based on average shares outstanding during the period.
C Total returns for periods of less than one year are not annualized.
D Total returns would have been lower if certain expenses had not been reduced during the applicable periods shown.
E Fees and expenses of any underlying Fidelity Central Funds are not included in the Fund's expense ratio. The Fund indirectly bears its proportionate share of the expenses of any underlying Fidelity Central Funds.
F Expense ratios reflect operating expenses of the class. Expenses before reductions do not reflect amounts reimbursed by the investment adviser or reductions from brokerage service arrangements or reductions from other expense offset arrangements and do not represent the amount paid by the class during periods when reimbursements or reductions occur. Expense ratios before reductions for start-up periods may not be representative of longer-term operating periods. Expenses net of fee waivers reflect expenses after reimbursement by the investment adviser but prior to reductions from brokerage service arrangements or other expense offset arrangements. Expenses net of all reductions represent the net expenses paid by the class.
G Annualized
H Amount does not include the portfolio activity of any underlying Fidelity Central Funds.
I The portfolio turnover rate does not include the assets acquired in the merger.
See accompanying notes which are an integral part of the financial statements.
Financial Highlights — Fidelity Advisor Stock Selector Mid Cap Fund Class I
| November 30, | |||||
| Years ended November 30, | 2015 | 2014 | 2013 | 2012 | 2011 |
| Selected Per–Share Data | |||||
| Net asset value, beginning of period | $33.22 | $29.64 | $23.14 | $20.01 | $20.02 |
| Income from Investment Operations | |||||
| Net investment income (loss)A | .13 | .16 | .18 | .15 | .14B |
| Net realized and unrealized gain (loss) | .14 | 3.50 | 6.56 | 3.15 | (.15) |
| Total from investment operations | .27 | 3.66 | 6.74 | 3.30 | (.01) |
| Distributions from net investment income | (.10) | (.08) | (.20) | (.17) | – |
| Distributions from net realized gain | – | – | (.04) | – | – |
| Total distributions | (.10) | (.08) | (.24) | (.17) | – |
| Net asset value, end of period | $33.39 | $33.22 | $29.64 | $23.14 | $20.01 |
| Total ReturnC | .80% | 12.39% | 29.44% | 16.66% | (.05)% |
| Ratios to Average Net AssetsD,E | |||||
| Expenses before reductions | .83% | .80% | .67% | .65% | .62% |
| Expenses net of fee waivers, if any | .83% | .80% | .67% | .65% | .62% |
| Expenses net of all reductions | .82% | .80% | .65% | .64% | .61% |
| Net investment income (loss) | .39% | .51% | .66% | .71% | .69%B |
| Supplemental Data | |||||
| Net assets, end of period (in millions) | $479 | $371 | $214 | $172 | $234 |
| Portfolio turnover rateF | 109% | 89% | 79%G | 72% | 198% |
A Calculated based on average shares outstanding during the period.
B Investment income per share reflects a large, non-recurring dividend which amounted to $.06 per share. Excluding this non-recurring dividend, the ratio of net investment income (loss) to average net assets would have been .42%.
C Total returns would have been lower if certain expenses had not been reduced during the applicable periods shown.
D Fees and expenses of any underlying Fidelity Central Funds are not included in the Fund's expense ratio. The Fund indirectly bears its proportionate share of the expenses of any underlying Fidelity Central Funds.
E Expense ratios reflect operating expenses of the class. Expenses before reductions do not reflect amounts reimbursed by the investment adviser or reductions from brokerage service arrangements or reductions from other expense offset arrangements and do not represent the amount paid by the class during periods when reimbursements or reductions occur. Expenses net of fee waivers reflect expenses after reimbursement by the investment adviser but prior to reductions from brokerage service arrangements or other expense offset arrangements. Expenses net of all reductions represent the net expenses paid by the class.
F Amount does not include the portfolio activity of any underlying Fidelity Central Funds.
G The portfolio turnover rate does not include the assets acquired in the merger.
See accompanying notes which are an integral part of the financial statements.
Notes to Financial Statements
For the period ended November 30, 2015
(Amounts in thousands except percentages)
1. Organization.
Fidelity Advisor Stock Selector Mid Cap Fund (the Fund) is a fund of Fidelity Advisor Series I (the Trust) and is authorized to issue an unlimited number of shares. The Trust is registered under the Investment Company Act of 1940, as amended (the 1940 Act), as an open-end management investment company organized as a Massachusetts business trust. The Fund offers Class A, Class T, Class C, Fidelity Stock Selector Mid Cap Fund and Class I (formerly Institutional Class) shares, each of which, along with Class B shares, has equal rights as to assets and voting privileges. Class B shares are closed to new accounts and additional purchases, except for exchanges and reinvestments. Each class has exclusive voting rights with respect to matters that affect that class. Class B shares will automatically convert to Class A shares after a holding period of seven years from the initial date of purchase.
2. Investments in Fidelity Central Funds.
The Fund invests in Fidelity Central Funds, which are open-end investment companies generally available only to other investment companies and accounts managed by the investment adviser and its affiliates. The Fund's Schedule of Investments lists each of the Fidelity Central Funds held as of period end, if any, as an investment of the Fund, but does not include the underlying holdings of each Fidelity Central Fund. As an Investing Fund, the Fund indirectly bears its proportionate share of the expenses of the underlying Fidelity Central Funds.
The Money Market Central Funds seek preservation of capital and current income and are managed by Fidelity Investments Money Management, Inc. (FIMM), an affiliate of the investment adviser. Annualized expenses of the Money Market Central Funds as of their most recent shareholder report date are less than .005%.
A complete unaudited list of holdings for each Fidelity Central Fund is available upon request or at the Securities and Exchange Commission (the SEC) website at www.sec.gov. In addition, the financial statements of the Fidelity Central Funds, which are not covered by the Fund's Report of Independent Registered Public Accounting Firm, are available on the SEC website or upon request.
3. Significant Accounting Policies.
The financial statements have been prepared in conformity with accounting principles generally accepted in the United States of America (GAAP), which require management to make certain estimates and assumptions at the date of the financial statements. Actual results could differ from those estimates. Subsequent events, if any, through the date that the financial statements were issued have been evaluated in the preparation of the financial statements. The following summarizes the significant accounting policies of the Fund:
Investment Valuation. Investments are valued as of 4:00 p.m. Eastern time on the last calendar day of the period. The Board of Trustees (the Board) has delegated the day to day responsibility for the valuation of the Fund's investments to the Fidelity Management & Research Company (FMR) Fair Value Committee (the Committee). In accordance with valuation policies and procedures approved by the Board, the Fund attempts to obtain prices from one or more third party pricing vendors or brokers to value its investments. When current market prices, quotations or currency exchange rates are not readily available or reliable, investments will be fair valued in good faith by the Committee, in accordance with procedures adopted by the Board. Factors used in determining fair value vary by investment type and may include market or investment specific events, changes in interest rates and credit quality. The frequency with which these procedures are used cannot be predicted and they may be utilized to a significant extent. The Committee oversees the Fund's valuation policies and procedures and reports to the Board on the Committee's activities and fair value determinations. The Board monitors the appropriateness of the procedures used in valuing the Fund's investments and ratifies the fair value determinations of the Committee.
The Fund categorizes the inputs to valuation techniques used to value its investments into a disclosure hierarchy consisting of three levels as shown below:
- Level 1 – quoted prices in active markets for identical investments
- Level 2 – other significant observable inputs (including quoted prices for similar investments, interest rates, prepayment speeds, etc.)
- Level 3 – unobservable inputs (including the Fund's own assumptions based on the best information available)
Valuation techniques used to value the Fund's investments by major category are as follows:
Equity securities, including restricted securities, for which market quotations are readily available, are valued at the last reported sale price or official closing price as reported by a third party pricing vendor on the primary market or exchange on which they are traded and are categorized as Level 1 in the hierarchy. In the event there were no sales during the day or closing prices are not available, securities are valued at the last quoted bid price or may be valued using the last available price and are generally categorized as Level 2 in the hierarchy. For foreign equity securities, when market or security specific events arise, comparisons to the valuation of American Depositary Receipts (ADRs), futures contracts, Exchange-Traded Funds (ETFs) and certain indexes as well as quoted prices for similar securities may be used and would be categorized as Level 2 in the hierarchy. Utilizing these techniques may result in transfers between Level 1 and Level 2. For equity securities, including restricted securities, where observable inputs are limited, assumptions about market activity and risk are used and these securities may be categorized as Level 3 in the hierarchy.
Debt securities, including restricted securities, are valued based on evaluated prices received from third party pricing vendors or from brokers who make markets in such securities. U.S. government and government agency obligations are valued by pricing vendors who utilize matrix pricing which considers prepayment speed assumptions, attributes of the collateral, yield or price of bonds of comparable quality, coupon, maturity and type or by broker-supplied prices. When independent prices are unavailable or unreliable, debt securities may be valued utilizing pricing methodologies which consider similar factors that would be used by third party pricing vendors. Debt securities are generally categorized as Level 2 in the hierarchy but may be Level 3 depending on the circumstances.
Futures contracts are valued at the settlement price established each day by the board of trade or exchange on which they are traded and are categorized as Level 1 in the hierarchy. Investments in open-end mutual funds, including the Fidelity Central Funds, are valued at their closing net asset value (NAV) each business day and are categorized as Level 1 in the hierarchy.
Changes in valuation techniques may result in transfers in or out of an assigned level within the disclosure hierarchy. The aggregate value of investments by input level as of November 30, 2015, is included at the end of the Fund's Schedule of Investments.
Foreign Currency. The Fund may use foreign currency contracts to facilitate transactions in foreign-denominated securities. Gains and losses from these transactions may arise from changes in the value of the foreign currency or if the counterparties do not perform under the contracts' terms.
Foreign-denominated assets, including investment securities, and liabilities are translated into U.S. dollars at the exchange rates at period end. Purchases and sales of investment securities, income and dividends received and expenses denominated in foreign currencies are translated into U.S. dollars at the exchange rate in effect on the transaction date.
The effects of exchange rate fluctuations on investments are included with the net realized and unrealized gain (loss) on investment securities. Other foreign currency transactions resulting in realized and unrealized gain (loss) are disclosed separately.
Investment Transactions and Income. For financial reporting purposes, the Fund's investment holdings and NAV include trades executed through the end of the last business day of the period. The NAV per share for processing shareholder transactions is calculated as of the close of business of the New York Stock Exchange (NYSE), normally 4:00 p.m. Eastern time and includes trades executed through the end of the prior business day. Gains and losses on securities sold are determined on the basis of identified cost and may include proceeds received from litigation. Dividend income is recorded on the ex-dividend date, except for certain dividends from foreign securities where the ex-dividend date may have passed, which are recorded as soon as the Fund is informed of the ex-dividend date. Non-cash dividends included in dividend income, if any, are recorded at the fair market value of the securities received. Income and capital gain distributions from Fidelity Central Funds, if any, are recorded on the ex-dividend date. Distributions received on securities that represent a return of capital or capital gain are recorded as a reduction of cost of investments and/or as a realized gain. Subsequent to ex-dividend date the Fund determines the components of these distributions, based upon receipt of tax filings or other correspondence relating to the underlying investment. Interest income is accrued as earned and includes coupon interest and amortization of premium and accretion of discount on debt securities as applicable. Investment income is recorded net of foreign taxes withheld where recovery of such taxes is uncertain.
Class Allocations and Expenses. Investment income, realized and unrealized capital gains and losses, common expenses of the Fund, and certain fund-level expense reductions, if any, are allocated daily on a pro-rata basis to each class based on the relative net assets of each class to the total net assets of the Fund. Each class differs with respect to transfer agent and distribution and service plan fees incurred. Certain expense reductions may also differ by class. For the reporting period, the allocated portion of income and expenses to each class as a percent of its average net assets may vary due to the timing of recording these transactions in relation to fluctuating net assets of the classes. Expenses directly attributable to a fund are charged to that fund. Expenses attributable to more than one fund are allocated among the respective funds on the basis of relative net assets or other appropriate methods. Expense estimates are accrued in the period to which they relate and adjustments are made when actual amounts are known.
Income Tax Information and Distributions to Shareholders. Each year, the Fund intends to qualify as a regulated investment company under Subchapter M of the Internal Revenue Code, including distributing substantially all of its taxable income and realized gains. As a result, no provision for U.S. Federal income taxes is required. As of November 30, 2015, the Fund did not have any unrecognized tax benefits in the financial statements; nor is the Fund aware of any tax positions for which it is reasonably possible that the total amounts of unrecognized tax benefits will significantly change in the next twelve months. The Fund files a U.S. federal tax return, in addition to state and local tax returns as required. The Fund's federal income tax returns are subject to examination by the Internal Revenue Service (IRS) for a period of three fiscal years after they are filed. State and local tax returns may be subject to examination for an additional fiscal year depending on the jurisdiction. Foreign taxes are provided for based on the Fund's understanding of the tax rules and rates that exist in the foreign markets in which it invests. The Fund is subject to a tax imposed on capital gains by certain countries in which it invests. An estimated deferred tax liability for net unrealized appreciation on the applicable securities is included in Other payables and accrued expenses on the Statement of Assets & Liabilities.
Distributions are declared and recorded on the ex-dividend date. Income dividends and capital gain distributions are declared separately for each class. Income and capital gain distributions are determined in accordance with income tax regulations, which may differ from GAAP. In addition, the Fund claimed a portion of the payment made to redeeming shareholders as a distribution for income tax purposes.
Capital accounts within the financial statements are adjusted for permanent book-tax differences. These adjustments have no impact on net assets or the results of operations. Capital accounts are not adjusted for temporary book-tax differences which will reverse in a subsequent period.
Book-tax differences are primarily due to futures contracts, market discount, foreign currency transactions, partnerships, deferred trustees compensation, capital loss carryforwards and losses deferred due to wash sales.
The federal tax cost of investment securities and unrealized appreciation (depreciation) as of period end were as follows:
| Gross unrealized appreciation | $219,576 |
| Gross unrealized depreciation | (215,300) |
| Net unrealized appreciation (depreciation) on securities | $4,276 |
| Tax Cost | $2,456,497 |
The tax-based components of distributable earnings as of period end were as follows:
| Undistributed ordinary income | $1,101 |
| Undistributed long-term capital gain | $39,098 |
| Net unrealized appreciation (depreciation) on securities and other investments | $4,263 |
Capital loss carryforwards are only available to offset future capital gains of the Fund to the extent provided by regulations and may be limited Under the Regulated Investment Company Modernization Act of 2010 (the Act), the Fund is permitted to carry forward capital losses incurred in taxable years beginning after December 22, 2010 for an unlimited period and such capital losses are required to be used prior to any losses that expire The capital loss carryforward information presented below, including any applicable limitation, is estimated as of fiscal period end and is subject to adjustment.
| Fiscal Year of expiration | |
| 2016 | $(250) |
The tax character of distributions paid was as follows:
| 2015 | 2014 | |
| Ordinary Income | $2,753 | $ 1,252 |
Restricted Securities. The Fund may invest in securities that are subject to legal or contractual restrictions on resale. These securities generally may be resold in transactions exempt from registration or to the public if the securities are registered. Disposal of these securities may involve time-consuming negotiations and expense, and prompt sale at an acceptable price may be difficult. Information regarding restricted securities is included at the end of the Fund's Schedule of Investments.
4. Derivative Instruments.
Risk Exposures and the Use of Derivative Instruments. The Fund's investment objective allows the Fund to enter into various types of derivative contracts, including futures contracts. Derivatives are investments whose value is primarily derived from underlying assets, indices or reference rates and may be transacted on an exchange or over-the-counter (OTC). Derivatives may involve a future commitment to buy or sell a specified asset based on specified terms, to exchange future cash flows at periodic intervals based on a notional principal amount, or for one party to make one or more payments upon the occurrence of specified events in exchange for periodic payments from the other party.
The Fund used derivatives to increase returns and to manage exposure to certain risks as defined below. The success of any strategy involving derivatives depends on analysis of numerous economic factors, and if the strategies for investment do not work as intended, the Fund may not achieve its objectives.
The Fund's use of derivatives increased or decreased its exposure to the following risk:
| Equity Risk | Equity risk relates to the fluctuations in the value of financial instruments as a result of changes in market prices (other than those arising from interest rate risk or foreign exchange risk), whether caused by factors specific to an individual investment, its issuer, or all factors affecting all instruments traded in a market or market segment. |
The Fund is also exposed to additional risks from investing in derivatives, such as liquidity risk and counterparty credit risk. Liquidity risk is the risk that the Fund will be unable to close out the derivative in the open market in a timely manner. Counterparty credit risk is the risk that the counterparty will not be able to fulfill its obligation to the Fund. Counterparty credit risk related to exchange-traded futures contracts may be mitigated by the protection provided by the exchange on which they trade.
Investing in derivatives may involve greater risks than investing in the underlying assets directly and, to varying degrees, may involve risk of loss in excess of any initial investment and collateral received and amounts recognized in the Statement of Assets and Liabilities. In addition, there may be the risk that the change in value of the derivative contract does not correspond to the change in value of the underlying instrument.
Futures Contracts. A futures contract is an agreement between two parties to buy or sell a specified underlying instrument for a fixed price at a specified future date. The Fund used futures contracts to manage its exposure to the stock market.
Upon entering into a futures contract, a fund is required to deposit either cash or securities (initial margin) with a clearing broker in an amount equal to a certain percentage of the face value of the contract. Futures contracts are marked-to-market daily and subsequent daily payments (variation margin) are made or received by a fund depending on the daily fluctuations in the value of the futures contracts and are recorded as unrealized appreciation or (depreciation). This receivable and/or payable, if any, is included in daily variation margin for derivative instruments in the Statement of Assets and Liabilities. Realized gain or (loss) is recorded upon the expiration or closing of a futures contract.
Any open futures contracts at period end are presented in the Schedule of Investments under the caption "Futures Contracts". The underlying face amount at value reflects each contract's exposure to the underlying instrument or index at period end. Securities deposited to meet initial margin requirements are identified in the Schedule of Investments.
During the period the Fund recognized net realized gain (loss) of $1,414 and a change in net unrealized appreciation (depreciation) of $243 related to its investment in futures contracts. These amounts are included in the Statement of Operations.
5. Purchases and Sales of Investments.
Purchases and sales of securities, other than short-term securities, aggregated $2,694,262 and $2,894,464, respectively.
6. Fees and Other Transactions with Affiliates.
Management Fee. Fidelity Management & Research Company (the investment adviser) and its affiliates provide the Fund with investment management related services for which the Fund pays a monthly management fee. The management fee is the sum of an individual fund fee rate that is based on an annual rate of .30% of the Fund's average net assets and an annualized group fee rate that averaged .25% during the period. The group fee rate is based upon the average net assets of all the mutual funds advised by the investment adviser, including any mutual funds previously advised by the investment adviser that are currently advised by Fidelity SelectCo, LLC, an affiliate of the investment adviser. The group fee rate decreases as assets under management increase and increases as assets under management decrease. In addition, the management fee is subject to a performance adjustment (up to a maximum of +/- .20% of the Fund's average net assets over a 36 month performance period). The upward or downward adjustment to the management fee is based on the relative investment performance of the Institutional Class of the Fund as compared to its benchmark index, the S&P MidCap 400 Index, over the same 36 month performance period. For the reporting period, the total annual management fee rate, including the performance adjustment, was .49% of the Fund's average net assets. The performance adjustment included in the management fee rate may be higher or lower than the maximum performance adjustment rate due to the difference between the average net assets for the reporting and performance periods.
Distribution and Service Plan Fees. In accordance with Rule 12b-1 of the 1940 Act, the Fund has adopted separate Distribution and Service Plans for each class of shares. Certain classes pay Fidelity Distributors Corporation (FDC), an affiliate of the investment adviser, separate Distribution and Service Fees, each of which is based on an annual percentage of each class' average net assets. In addition, FDC may pay financial intermediaries for selling shares of the Fund and providing shareholder support services. For the period, the Distribution and Service Fee rates, total fees and amounts retained by FDC were as follows:
| Distribution Fee | Service Fee | Total Fees | Retained by FDC | |
| Class A | -% | .25% | $1,588 | $4 |
| Class T | .25% | .25% | 3,773 | 8 |
| Class B | .75% | .25% | 130 | 98 |
| Class C | .75% | .25% | 1,677 | 26 |
| $7,168 | $136 |
Sales Load. FDC may receive a front-end sales charge of up to 5.75% for selling Class A shares and 3.50% for selling Class T shares, some of which is paid to financial intermediaries for selling shares of the Fund. Depending on the holding period, FDC may receive contingent deferred sales charges levied on Class A, Class T, Class B, and Class C redemptions. The deferred sales charges range from 5.00% to 1.00% for Class B shares, 1.00% for Class C shares, 1.00% for certain purchases of Class A shares and .25% for certain purchases of Class T shares.
For the period, sales charge amounts retained by FDC were as follows:
| Retained by FDC | |
| Class A | $37 |
| Class T | 19 |
| Class B(a) | 3 |
| Class C(a) | 7 |
| $66 |
(a) When Class B and Class C shares are initially sold, FDC pays commissions from its own resources to financial intermediaries through which the sales are made.
Transfer Agent Fees. Fidelity Investments Institutional Operations Company, Inc., (FIIOC), an affiliate of the investment adviser, is the transfer, dividend disbursing and shareholder servicing agent for each class of the Fund. FIIOC receives account fees and asset-based fees that vary according to the account size and type of account of the shareholders of the respective classes of the Fund. FIIOC pays for typesetting, printing and mailing of shareholder reports, except proxy statements.
For the period, transfer agent fees for each class were as follows:
| Amount | % of Class-Level Average Net Assets | |
| Class A | $1,304 | .21 |
| Class T | 1,431 | .19 |
| Class B | 39 | .30 |
| Class C | 350 | .21 |
| Fidelity Stock Selector Mid Cap Fund | 1,196 | .22 |
| Class I | 1,287 | .30 |
| $5,607 |
Accounting and Security Lending Fees. Fidelity Service Company, Inc. (FSC), an affiliate of the investment adviser, maintains the Fund's accounting records. The accounting fee is based on the level of average net assets for each month. Under a separate contract, FSC administers the security lending program. The security lending fee is based on the number and duration of lending transactions.
Brokerage Commissions. The Fund placed a portion of its portfolio transactions with brokerage firms which are affiliates of the investment adviser. Brokerage commissions are included in net realized gain (loss) and change in net unrealized appreciation (depreciation) in the Statement of Operations. The commissions paid to these affiliated firms were $42 for the period.
7. Committed Line of Credit.
The Fund participates with other funds managed by the investment adviser or an affiliate in a $4.25 billion credit facility (the "line of credit") to be utilized for temporary or emergency purposes to fund shareholder redemptions or for other short-term liquidity purposes. The Fund has agreed to pay commitment fees on its pro-rata portion of the line of credit, which amounted to $4 and is reflected in Miscellaneous expenses on the Statement of Operations. During the period, the Fund did not borrow on this line of credit.
8. Security Lending.
The Fund lends portfolio securities through a lending agent from time to time in order to earn additional income. For equity securities, a lending agent is used and may loan securities to certain qualified borrowers, including Fidelity Capital Markets (FCM), a broker-dealer affiliated with the Fund. On the settlement date of the loan, the Fund receives collateral (in the form of U.S. Treasury obligations, letters of credit and/or cash) against the loaned securities and maintains collateral in an amount not less than 100% of the market value of the loaned securities during the period of the loan. The market value of the loaned securities is determined at the close of business of the Fund and any additional required collateral is delivered to the Fund on the next business day. The Fund or borrower may terminate the loan at any time, and if the borrower defaults on its obligation to return the securities loaned because of insolvency or other reasons, the Fund may apply collateral received from the borrower against the obligation. The Fund may experience delays and costs in recovering the securities loaned. Any cash collateral received is invested in the Fidelity Securities Lending Cash Central Fund. The value of loaned securities and cash collateral at period end are disclosed on the Fund's Statement of Assets and Liabilities. The value of securities loaned to FCM at period end was $2,673. Security lending income represents the income earned on investing cash collateral, less rebates paid to borrowers and any lending agent fees associated with the loan, plus any premium payments received for lending certain types of securities. Security lending income is presented in the Statement of Operations as a component of income from Fidelity Central Funds. Total security lending income during the period amounted to $295, including $10 from securities loaned to FCM.
9. Expense Reductions.
Commissions paid to certain brokers with whom the investment adviser, or its affiliates, places trades on behalf of the Fund include an amount in addition to trade execution, which may be rebated back to the Fund to offset certain expenses. This amount totaled $195 for the period.
In addition, during the period the investment adviser reimbursed and/or waived a portion of fund-level operating expenses in the amount of $10 and a portion of class-level operating expenses as follows:
| Amount | |
| Class A | $15 |
| Class T | 19 |
| Class B | –(a) |
| Class C | 4 |
| Fidelity Stock Selector Mid Cap Fund | 8 |
| Class I | 4 |
| $50 |
(a) In the amount of less than five hundred dollars.
10. Distributions to Shareholders.
Distributions to shareholders of each class were as follows:
| Years ended November 30, | 2015 | 2014 |
| From net investment income | ||
| Class A | $– | $146 |
| Fidelity Stock Selector Mid Cap Fund | 1,667 | 530 |
| Class I | 1,086 | 576 |
| Total | $2,753 | $1,252 |
11. Share Transactions.
Share transactions for each class were as follows and may contain automatic conversions between classes or exchanges between funds:
| Shares | Shares | Dollars | Dollars | |
| Years ended November 30, | 2015 | 2014 | 2015 | 2014 |
| Class A | ||||
| Shares sold | 1,378 | 1,462 | $44,847 | $44,155 |
| Reinvestment of distributions | – | 5 | – | 134 |
| Shares redeemed | (3,369) | (5,341) | (109,342) | (162,259) |
| Net increase (decrease) | (1,991) | (3,874) | $(64,495) | $(117,970) |
| Class T | ||||
| Shares sold | 1,615 | 1,902 | $53,028 | $57,696 |
| Shares redeemed | (5,214) | (5,637) | (170,224) | (170,461) |
| Net increase (decrease) | (3,599) | (3,735) | $(117,196) | $(112,765) |
| Class B | ||||
| Shares sold | 2 | 3 | $36 | $76 |
| Shares redeemed | (219) | (244) | (6,583) | (6,801) |
| Net increase (decrease) | (217) | (241) | $(6,547) | $(6,725) |
| Class C | ||||
| Shares sold | 234 | 175 | $7,096 | $4,902 |
| Shares redeemed | (818) | (833) | (24,477) | (23,364) |
| Net increase (decrease) | (584) | (658) | $(17,381) | $(18,462) |
| Fidelity Stock Selector Mid Cap Fund | ||||
| Shares sold | 939 | 10,810 | $31,733 | $334,414 |
| Reinvestment of distributions | 49 | 18 | 1,651 | 518 |
| Shares redeemed | (3,087) | (1,745) | (101,545) | (54,485) |
| Net increase (decrease) | (2,099) | 9,083 | $(68,161) | $280,447 |
| Class I | ||||
| Shares sold | 5,194 | 5,585 | $175,072 | $173,899 |
| Reinvestment of distributions | 30 | 17 | 1,015 | 502 |
| Shares redeemed | (2,041) | (1,659) | (68,817) | (51,892) |
| Net increase (decrease) | 3,183 | 3,943 | $107,270 | $122,509 |
12. Other.
The Fund's organizational documents provide former and current trustees and officers with a limited indemnification against liabilities arising in connection with the performance of their duties to the Fund. In the normal course of business, the Fund may also enter into contracts that provide general indemnifications. The Fund's maximum exposure under these arrangements is unknown as this would be dependent on future claims that may be made against the Fund. The risk of material loss from such claims is considered remote.
At the end of the period, Strategic Advisers Small-Mid Cap Fund was the owner of record of approximately 11% of the total outstanding shares of the Fund.
Report of Independent Registered Public Accounting Firm
To the Trustees of Fidelity Advisor Series I and Shareholders of Fidelity Advisor® Stock Selector Mid Cap Fund:
We have audited the accompanying statement of assets and liabilities of Fidelity Advisor® Stock Selector Mid Cap Fund (the Fund), a fund of Fidelity Advisor Series I, including the schedule of investments, as of November 30, 2015, and the related statement of operations for the year then ended, the statement of changes in net assets for each of the two years in the period then ended, and the financial highlights for each of the five years in the period then ended. These financial statements and financial highlights are the responsibility of the Fund's management. Our responsibility is to express an opinion on these financial statements and financial highlights based on our audits.
We conducted our audits in accordance with the standards of the Public Company Accounting Oversight Board (United States). Those standards require that we plan and perform the audit to obtain reasonable assurance about whether the financial statements and financial highlights are free of material misstatement. The Fund is not required to have, nor were we engaged to perform, an audit of its internal control over financial reporting. Our audits included consideration of internal control over financial reporting as a basis for designing audit procedures that are appropriate in the circumstances, but not for the purpose of expressing an opinion on the effectiveness of the Fund's internal control over financial reporting. Accordingly, we express no such opinion. An audit also includes examining, on a test basis, evidence supporting the amounts and disclosures in the financial statements, assessing the accounting principles used and significant estimates made by management, as well as evaluating the overall financial statement presentation. Our procedures included confirmation of securities owned as of November 30, 2015, by correspondence with the custodians and brokers; when replies were not received from brokers, we performed other auditing procedures. We believe our audits provide a reasonable basis for our opinion.
In our opinion, such financial statements and financial highlights referred to above present fairly, in all material respects, the financial position of Fidelity Advisor® Stock Selector Mid Cap Fund as of November 30, 2015, the results of its operations for the year then ended, the changes in its net assets for each of the two years in the period then ended, and the financial highlights for each of the five years in the period then ended, in conformity with accounting principles generally accepted in the United States of America.
DELOITTE & TOUCHE LLP
Boston, Massachusetts
January 20, 2016
Trustees and Officers
The Trustees, Members of the Advisory Board (if any), and officers of the trust and fund, as applicable, are listed below. The Board of Trustees governs the fund and is responsible for protecting the interests of shareholders. The Trustees are experienced executives who meet periodically throughout the year to oversee the fund's activities, review contractual arrangements with companies that provide services to the fund, oversee management of the risks associated with such activities and contractual arrangements, and review the fund's performance. Each of the Trustees oversees 170 funds.
The Trustees hold office without limit in time except that (a) any Trustee may resign; (b) any Trustee may be removed by written instrument, signed by at least two-thirds of the number of Trustees prior to such removal; (c) any Trustee who requests to be retired or who has become incapacitated by illness or injury may be retired by written instrument signed by a majority of the other Trustees; and (d) any Trustee may be removed at any special meeting of shareholders by a two-thirds vote of the outstanding voting securities of the trust. Each Trustee who is not an interested person (as defined in the 1940 Act) of the trust and the fund is referred to herein as an Independent Trustee. Each Independent Trustee shall retire not later than the last day of the calendar year in which his or her 75th birthday occurs. The Independent Trustees may waive this mandatory retirement age policy with respect to individual Trustees. Officers and Advisory Board Members hold office without limit in time, except that any officer or Advisory Board Member may resign or may be removed by a vote of a majority of the Trustees at any regular meeting or any special meeting of the Trustees. Except as indicated, each individual has held the office shown or other offices in the same company for the past five years.
The fund’s Statement of Additional Information (SAI) includes more information about the Trustees. To request a free copy, call Fidelity at 1-800-544-8544.
Experience, Skills, Attributes, and Qualifications of the Trustees. The Governance and Nominating Committee has adopted a statement of policy that describes the experience, qualifications, attributes, and skills that are necessary and desirable for potential Independent Trustee candidates (Statement of Policy). The Board believes that each Trustee satisfied at the time he or she was initially elected or appointed a Trustee, and continues to satisfy, the standards contemplated by the Statement of Policy. The Governance and Nominating Committee also engages professional search firms to help identify potential Independent Trustee candidates who have the experience, qualifications, attributes, and skills consistent with the Statement of Policy. From time to time, additional criteria based on the composition and skills of the current Independent Trustees, as well as experience or skills that may be appropriate in light of future changes to board composition, business conditions, and regulatory or other developments, have also been considered by the professional search firms and the Governance and Nominating Committee. In addition, the Board takes into account the Trustees' commitment and participation in Board and committee meetings, as well as their leadership of standing and ad hoc committees throughout their tenure.
In determining that a particular Trustee was and continues to be qualified to serve as a Trustee, the Board has considered a variety of criteria, none of which, in isolation, was controlling. The Board believes that, collectively, the Trustees have balanced and diverse experience, qualifications, attributes, and skills, which allow the Board to operate effectively in governing the fund and protecting the interests of shareholders. Information about the specific experience, skills, attributes, and qualifications of each Trustee, which in each case led to the Board's conclusion that the Trustee should serve (or continue to serve) as a trustee of the fund, is provided below.
Board Structure and Oversight Function. James C. Curvey is an interested person and currently serves as Chairman. The Trustees have determined that an interested Chairman is appropriate and benefits shareholders because an interested Chairman has a personal and professional stake in the quality and continuity of services provided to the fund. Independent Trustees exercise their informed business judgment to appoint an individual of their choosing to serve as Chairman, regardless of whether the Trustee happens to be independent or a member of management. The Independent Trustees have determined that they can act independently and effectively without having an Independent Trustee serve as Chairman and that a key structural component for assuring that they are in a position to do so is for the Independent Trustees to constitute a substantial majority for the Board. The Independent Trustees also regularly meet in executive session. Ned C. Lautenbach serves as Chairman of the Independent Trustees and as such (i) acts as a liaison between the Independent Trustees and management with respect to matters important to the Independent Trustees and (ii) with management prepares agendas for Board meetings.
Fidelity® funds are overseen by different Boards of Trustees. The fund's Board oversees Fidelity's high income and certain equity funds, and other Boards oversee Fidelity's investment-grade bond, money market, asset allocation, and sector funds. The asset allocation funds may invest in Fidelity® funds overseen by the fund's Board. The use of separate Boards, each with its own committee structure, allows the Trustees of each group of Fidelity® funds to focus on the unique issues of the funds they oversee, including common research, investment, and operational issues. On occasion, the separate Boards establish joint committees to address issues of overlapping consequences for the Fidelity® funds overseen by each Board.
The Trustees operate using a system of committees to facilitate the timely and efficient consideration of all matters of importance to the Trustees, the fund, and fund shareholders and to facilitate compliance with legal and regulatory requirements and oversight of the fund's activities and associated risks. The Board, acting through its committees, has charged FMR and its affiliates with (i) identifying events or circumstances the occurrence of which could have demonstrably adverse effects on the fund's business and/or reputation; (ii) implementing processes and controls to lessen the possibility that such events or circumstances occur or to mitigate the effects of such events or circumstances if they do occur; and (iii) creating and maintaining a system designed to evaluate continuously business and market conditions in order to facilitate the identification and implementation processes described in (i) and (ii) above. Because the day-to-day operations and activities of the fund are carried out by or through FMR, its affiliates, and other service providers, the fund's exposure to risks is mitigated but not eliminated by the processes overseen by the Trustees. While each of the Board's committees has responsibility for overseeing different aspects of the fund's activities, oversight is exercised primarily through the Operations, Audit, and Compliance Committees. In addition, the Independent Trustees have worked with FMR to enhance the Board's oversight of investment and financial risks, legal and regulatory risks, technology risks, and operational risks, including the development of additional risk reporting to the Board. For example, a working group comprised of Independent Trustees and FMR has worked and continues to work to review the Fidelity® funds' valuation-related activities, reporting and risk management. Appropriate personnel, including but not limited to the fund's Chief Compliance Officer (CCO), FMR's internal auditor, the independent accountants, the fund's Treasurer and portfolio management personnel, make periodic reports to the Board's committees, as appropriate, including an annual review of Fidelity's risk management program for the Fidelity® funds. The responsibilities of each standing committee, including their oversight responsibilities, are described further under "Standing Committees of the Trustees."
Interested Trustees*:
Correspondence intended for a Trustee who is an interested person may be sent to Fidelity Investments, 245 Summer Street, Boston, Massachusetts 02210.
Name, Year of Birth; Principal Occupations and Other Relevant Experience+
James C. Curvey (1935)
Year of Election or Appointment: 2007
Trustee
Chairman of the Board of Trustees
Mr. Curvey also serves as Trustee of other Fidelity® funds. Mr. Curvey is a Director of Fidelity Research & Analysis Co. (investment adviser firm, 2009-present), and Vice Chairman (2007-present) and Director of FMR LLC (diversified financial services company). In addition, Mr. Curvey serves as an Overseer for the Boston Symphony Orchestra and a member of the board of Artis-Naples, Naples, Florida, and as a Trustee for Brewster Academy, Wolfeboro, New Hampshire. Previously, Mr. Curvey served as a Director of Fidelity Investments Money Management, Inc. (investment adviser firm, 2009-2014) and a Director of FMR and FMR Co., Inc. (investment adviser firms, 2007-2014).
Charles S. Morrison (1960)
Year of Election or Appointment: 2014
Trustee
Mr. Morrison also serves as Trustee of other funds. He serves as a Director of Fidelity Investments Money Management, Inc. (FIMM) (investment adviser firm, 2014-present), Director of Fidelity SelectCo, LLC (investment adviser firm, 2014-present), President, Asset Management (2014-present), and is an employee of Fidelity Investments. Previously, Mr. Morrison served as Vice President of Fidelity's Fixed Income and Asset Allocation Funds (2012-2014), President, Fixed Income (2011-2014), Vice President of Fidelity's Money Market Funds (2005-2009), President, Money Market Group Leader of FMR (investment adviser firm, 2009), and Senior Vice President, Money Market Group of FMR (2004-2009). Mr. Morrison also served as Vice President of Fidelity's Bond Funds (2002-2005), certain Balanced Funds (2002-2005), and certain Asset Allocation Funds (2002-2007), and as Senior Vice President (2002-2005) of Fidelity's Bond Division.
* Determined to be an “Interested Trustee” by virtue of, among other things, his or her affiliation with the trust or various entities under common control with FMR.
+ The information includes the Trustee's principal occupation during the last five years and other information relating to the experience, attributes, and skills relevant to the Trustee's qualifications to serve as a Trustee, which led to the conclusion that the Trustee should serve as a Trustee for the fund.
Independent Trustees:
Correspondence intended for an Independent Trustee may be sent to Fidelity Investments, P.O. Box 55235, Boston, Massachusetts 02205-5235.
Name, Year of Birth; Principal Occupations and Other Relevant Experience+
Dennis J. Dirks (1948)
Year of Election or Appointment: 2005
Trustee
Mr. Dirks also serves as Trustee of other Fidelity® funds. Prior to his retirement in May 2003, Mr. Dirks was Chief Operating Officer and a member of the Board of The Depository Trust & Clearing Corporation (DTCC). He also served as President, Chief Operating Officer, and Board member of The Depository Trust Company (DTC) and President and Board member of the National Securities Clearing Corporation (NSCC). In addition, Mr. Dirks served as Chief Executive Officer and Board member of the Government Securities Clearing Corporation, Chief Executive Officer and Board member of the Mortgage-Backed Securities Clearing Corporation, as a Trustee and a member of the Finance Committee of Manhattan College (2005-2008), as a Trustee and a member of the Finance Committee of AHRC of Nassau County (2006-2008), and as a member of the Independent Directors Council (IDC) Governing Council (2010-2015). Mr. Dirks is a member of the Board of Directors for The Brookville Center for Children's Services, Inc. (2009-present).
Alan J. Lacy (1953)
Year of Election or Appointment: 2008
Trustee
Mr. Lacy also serves as Trustee of other Fidelity® funds. Mr. Lacy serves as a member of the Board of Directors of Dave & Buster's Entertainment, Inc. (restaurant and entertainment complexes, 2010-present) and Bristol-Myers Squibb Company (global pharmaceuticals, 2008-present). In addition, Mr. Lacy served as Senior Adviser (2007-2014) of Oak Hill Capital Partners, L.P. (private equity) and also served as Chief Executive Officer (2000-2005) and Vice Chairman (2005-2006) of Sears Holdings Corporation and Sears, Roebuck and Co. (retail). Mr. Lacy is a member of the Board of Trustees of The National Parks Conservation Association (2006-present). Previously, Mr. Lacy served as Chairman of the Board of Trustees of the National Parks Conservation Association (2008-2011) and as a member of the Board of Directors for The Western Union Company (global money transfer, 2006-2011), The Hillman Companies, Inc. (hardware wholesalers, 2010-2014), and Earth Fare, Inc. (retail grocery, 2010-2014).
Ned C. Lautenbach (1944)
Year of Election or Appointment: 2000
Trustee
Chairman of the Independent Trustees
Mr. Lautenbach also serves as Trustee of other Fidelity® funds. Mr. Lautenbach currently serves as the Lead Director of the Eaton Corporation Board of Directors (diversified industrial, 1997-present). Mr. Lautenbach is Chairman of the Board of Directors of Artis-Naples in Naples, Florida (2012-present), a member of the Council on Foreign Relations (1994-present), and a member of the Board of Governors, State University System of Florida (2013-present). Previously, Mr. Lautenbach was a Partner/Advisory Partner at Clayton, Dubilier & Rice, LLC (private equity investment, 1998-2010), as well as a Director of Sony Corporation (2006-2007).
Joseph Mauriello (1944)
Year of Election or Appointment: 2008
Trustee
Mr. Mauriello also serves as Trustee of other Fidelity® funds. Prior to his retirement in January 2006, Mr. Mauriello served in numerous senior management positions including Deputy Chairman and Chief Operating Officer (2004-2005), and Vice Chairman of Financial Services (2002-2004) of KPMG LLP US (professional services, 1965-2005). Mr. Mauriello currently serves as a member of the Board of Directors of XL Group plc. (global insurance and re-insurance, 2006-present) and the Independent Directors Council (IDC) Governing Council (2015-present). Previously, Mr. Mauriello served as a Director of the Hamilton Funds of the Bank of New York (2006-2007) and of Arcadia Resources Inc. (health care services and products, 2007-2012).
Robert W. Selander (1950)
Year of Election or Appointment: 2011
Trustee
Mr. Selander also serves as Trustee of other Fidelity® funds. Mr. Selander serves as a Director of The Western Union Company (global money transfer, 2014-present). Previously, Mr. Selander served as a Member of the Advisory Board of other Fidelity® funds (2011), and Executive Vice Chairman (2010), Chief Executive Officer (2009-2010), and President and Chief Executive Officer (1997-2009) of Mastercard, Inc.
Cornelia M. Small (1944)
Year of Election or Appointment: 2005
Trustee
Ms. Small also serves as Trustee of other Fidelity® funds. Ms. Small is a member of the Board of Directors (2009-present) and Chair of the Investment Committee (2010-present) of the Teagle Foundation. Ms. Small also serves on the Investment Committee of the Berkshire Taconic Community Foundation (2008-present). Previously, Ms. Small served as Chairperson (2002-2008) and a member of the Investment Committee and Chairperson (2008-2012) and a member of the Board of Trustees of Smith College. In addition, Ms. Small served as Chief Investment Officer, Director of Global Equity Investments, and a member of the Board of Directors of Scudder, Stevens & Clark and Scudder Kemper Investments.
William S. Stavropoulos (1939)
Year of Election or Appointment: 2002
Trustee
Vice Chairman of the Independent Trustees
Mr. Stavropoulos also serves as Trustee of other Fidelity® funds. Mr. Stavropoulos serves as President and Founder of the Michigan Baseball Foundation, the Great Lakes Loons (2007-present). Mr. Stavropoulos is Chairman Emeritus of the Board of Directors of The Dow Chemical Company, where he previously served in numerous senior management positions, including President, CEO (1995-2000; 2002-2004), Chairman of the Executive Committee (2000-2006), and as a member of the Board of Directors (1990-2006). Currently, Mr. Stavropoulos is Chairman of the Board of Directors of Univar Inc. (global distributor of commodity and specialty chemicals), a Director of Teradata Corporation (data warehousing and technology solutions), and Maersk Inc. (industrial conglomerate), and a member of the Advisory Board for Metalmark Capital LLC (private equity investment, 2005-present). Mr. Stavropoulos is an operating advisor to Clayton, Dubilier & Rice, LLC (private equity investment). In addition, Mr. Stavropoulos is a member of the University of Notre Dame Advisory Council for the College of Science, a Trustee of the Rollin L. Gerstacker Foundation, and a Director of the Naples Philharmonic Center for the Arts. Previously, Mr. Stavropoulos served as a Director of Chemical Financial Corporation (bank holding company, 1993-2012) and Tyco International, Ltd. (multinational manufacturing and services, 2007-2012).
David M. Thomas (1949)
Year of Election or Appointment: 2008
Trustee
Mr. Thomas also serves as Trustee of other Fidelity® funds. Mr. Thomas serves as Non-Executive Chairman of the Board of Directors of Fortune Brands Home and Security (home and security products, 2011-present), as a member of the Board of Directors (2004-present) and Presiding Director (2013-present) of Interpublic Group of Companies, Inc. (marketing communication), and as a member of the Board of Trustees of the University of Florida (2013-present). Previously, Mr. Thomas served as Executive Chairman (2005-2006) and Chairman and Chief Executive Officer (2000-2005) of IMS Health, Inc. (pharmaceutical and healthcare information solutions), and a Director of Fortune Brands, Inc. (consumer products, 2000-2011).
+ The information includes the Trustee's principal occupation during the last five years and other information relating to the experience, attributes, and skills relevant to the Trustee's qualifications to serve as a Trustee, which led to the conclusion that the Trustee should serve as a Trustee for the fund.
Advisory Board Members and Officers:
Correspondence intended for an officer or Peter S. Lynch may be sent to Fidelity Investments, 245 Summer Street, Boston, Massachusetts 02210. Officers appear below in alphabetical order.
Name, Year of Birth; Principal Occupation
Peter S. Lynch (1944)
Year of Election or Appointment: 2003
Member of the Advisory Board
Mr. Lynch also serves as Member of the Advisory Board of other Fidelity® funds. Mr. Lynch is Vice Chairman and a Director of FMR (investment adviser firm) and FMR Co., Inc. (investment adviser firm). In addition, Mr. Lynch serves as a Trustee of Boston College and as the Chairman of the Inner-City Scholarship Fund. Previously, Mr. Lynch served on the Special Olympics International Board of Directors (1997-2006).
Elizabeth Paige Baumann (1968)
Year of Election or Appointment: 2012
Anti-Money Laundering (AML) Officer
Ms. Baumann also serves as AML Officer of other funds. She is Chief AML Officer of FMR LLC (diversified financial services company, 2012-present) and is an employee of Fidelity Investments. Previously, Ms. Baumann served as Vice President and Deputy Anti-Money Laundering Officer (2007-2012).
Marc R. Bryant (1966)
Year of Election or Appointment: 2015
Secretary and Chief Legal Officer (CLO)
Mr. Bryant also serves as Secretary and CLO of other funds. Mr. Bryant serves as CLO, Secretary, and Senior Vice President of Fidelity Management & Research Company (investment adviser firm, 2015-present) and FMR Co., Inc. (investment adviser firm, 2015-present); Secretary of Fidelity SelectCo, LLC (investment adviser firm, 2015-present) and Fidelity Investments Money Management, Inc. (investment adviser firm, 2015-present); and CLO of Fidelity Management & Research (Hong Kong) Limited (investment adviser firm, 2015-present). He is Senior Vice President and Deputy General Counsel of FMR LLC (diversified financial services company). Previously, Mr. Bryant served as Secretary and CLO of Fidelity Rutland Square Trust II (2010-2014) and Assistant Secretary of Fidelity's Fixed Income and Asset Allocation Funds (2013-2015). Prior to joining Fidelity Investments, Mr. Bryant served as a Senior Vice President and the Head of Global Retail Legal for AllianceBernstein L.P. (2006-2010), and as the General Counsel for ProFund Advisors LLC (2001-2006).
William C. Coffey (1969)
Year of Election or Appointment: 2009
Assistant Secretary
Mr. Coffey also serves as Assistant Secretary of other funds. He is Senior Vice President and Deputy General Counsel of FMR LLC (diversified financial services company, 2010-present), and is an employee of Fidelity Investments. Previously, Mr. Coffey served as Vice President and Associate General Counsel of FMR LLC (2005-2009).
Jonathan Davis (1968)
Year of Election or Appointment: 2010
Assistant Treasurer
Mr. Davis also serves as Assistant Treasurer of other funds, and is an employee of Fidelity Investments. Previously, Mr. Davis served as Vice President and Associate General Counsel of FMR LLC (diversified financial services company, 2003-2010).
Adrien E. Deberghes (1967)
Year of Election or Appointment: 2008
Deputy Treasurer
Mr. Deberghes also serves as an officer of other funds. He is an employee of Fidelity Investments (2008-present). Prior to joining Fidelity Investments, Mr. Deberghes was Senior Vice President of Mutual Fund Administration at State Street Corporation (2007-2008), Senior Director of Mutual Fund Administration at Investors Bank & Trust (2005-2007), and Director of Finance for Dunkin' Brands (2000-2005).
Stephanie J. Dorsey (1969)
Year of Election or Appointment: 2010
Assistant Treasurer
Ms. Dorsey also serves as an officer of other funds. She is an employee of Fidelity Investments (2008-present) and has served in other fund officer roles. Prior to joining Fidelity Investments, Ms. Dorsey served as Treasurer (2004-2008) of the JPMorgan Mutual Funds and Vice President (2004-2008) of JPMorgan Chase Bank.
Howard J. Galligan III (1966)
Year of Election or Appointment: 2014
Chief Financial Officer
Mr. Galligan also serves as Chief Financial Officer of other funds. Mr. Galligan serves as President of Fidelity Pricing and Cash Management Services (FPCMS) (2014-present) and as a Director of Strategic Advisers, Inc. (investment adviser firm, 2008-present). Previously, Mr. Galligan served as Chief Administrative Officer of Asset Management (2011-2014) and Chief Operating Officer and Senior Vice President of Investment Support for Strategic Advisers, Inc. (2003-2011).
Scott C. Goebel (1968)
Year of Election or Appointment: 2015
Vice President
Mr. Goebel serves as Vice President of other funds and is an employee of Fidelity Investments (2001-present). Previously, Mr. Goebel served as Secretary of Fidelity SelectCo, LLC (investment adviser firm, 2013-2015), Fidelity Investments Money Management, Inc. (FIMM) (investment adviser firm, 2010-2015), and Fidelity Research and Analysis Company (FRAC) (investment adviser firm, 2010-2015); General Counsel, Secretary, and Senior Vice President of Fidelity Management & Research Company (investment adviser firm, 2008-2015) and FMR Co., Inc. (investment adviser firm, 2008-2015); Assistant Secretary of Fidelity Management & Research (Japan) Limited (investment adviser firm, 2008-2015) and FMR Investment Management (U.K.) Limited (investment adviser firm, 2008-2015); Chief Legal Officer (CLO) of Fidelity Management & Research (Hong Kong) Limited (investment adviser firm, 2008-2015); Secretary and CLO of certain Fidelity® funds (2008-2015); Assistant Secretary of FIMM (2008-2010), FRAC (2008-2010), and certain funds (2007-2008); and as Vice President and Secretary of Fidelity Distributors Corporation (FDC) (2005-2007).
Thomas C. Hense (1964)
Year of Election or Appointment: 2008, 2010, or 2015
Vice President
Mr. Hense serves as Vice President of Fidelity Advisor® Multi-Asset Income Fund (2015) and other funds (High Income (2008), Small Cap (2008), and Value (2010) funds), and is an employee of Fidelity Investments (1993-present). Previously, Mr. Hense served as a portfolio manager for Fidelity's Institutional Money Management Group (Pyramis) (2003-2008).
Brian B. Hogan (1964)
Year of Election or Appointment: 2009
Vice President
Mr. Hogan also serves as Trustee or Vice President of other funds. Mr. Hogan serves as a Director of Fidelity SelectCo, LLC (investment adviser firm, 2014-present) and President of the Equity Division of FMR (investment adviser firm, 2009-present). Previously, Mr. Hogan served as Senior Vice President, Equity Research of FMR (2006-2009) and as a portfolio manager.
Chris Maher (1972)
Year of Election or Appointment: 2013
Assistant Treasurer
Mr. Maher serves as Assistant Treasurer of other funds. Mr. Maher is Vice President of Valuation Oversight and is an employee of Fidelity Investments. Previously, Mr. Maher served as Vice President of Asset Management Compliance (2013), Vice President of the Program Management Group of FMR (investment adviser firm, 2010-2013), and Vice President of Valuation Oversight (2008-2010).
Kenneth B. Robins (1969)
Year of Election or Appointment: 2008
President and Treasurer
Mr. Robins also serves as an officer of other funds. Mr. Robins serves as Executive Vice President of Fidelity Investments Money Management, Inc. (FIMM) (investment adviser firm, 2013-present) and is an employee of Fidelity Investments (2004-present). Previously, Mr. Robins served in other fund officer roles.
Stacie M. Smith (1974)
Year of Election or Appointment: 2013
Deputy Treasurer
Ms. Smith also serves as an officer of other funds. She is an employee of Fidelity Investments (2009-present) and has served in other fund officer roles. Prior to joining Fidelity Investments, Ms. Smith served as Senior Audit Manager of Ernst & Young LLP (1996-2009).
Renee Stagnone (1975)
Year of Election or Appointment: 2013
Deputy Treasurer
Ms. Stagnone also serves as Deputy Treasurer of other funds. Ms. Stagnone is an employee of Fidelity Investments (1997-present).
Linda J. Wondrack (1964)
Year of Election or Appointment: 2014
Chief Compliance Officer
Ms. Wondrack also serves as Chief Compliance Officer of other funds. Ms. Wondrack is Executive Vice President and head of the Ethics Office and Asset Management Compliance for Fidelity Investments (2012-present). Ms. Wondrack also serves as Chief Compliance Officer of Fidelity SelectCo, LLC (investment adviser firm, 2014-present); Chief Compliance Officer of Impresa Management LLC (2013-present); and Chief Compliance Officer of FMR Co., Inc. (investment adviser firm), Fidelity Investments Money Management, Inc. (investment adviser firm), Fidelity Management & Research (Japan) Limited (investment adviser firm), FMR Investment Management (U.K.) Limited (investment adviser firm), Fidelity Management & Research (Hong Kong) (investment adviser firm), Fidelity Management & Research Company (investment adviser firm), FIAM LLC (investment adviser firm), and Strategic Advisers, Inc. (investment adviser firm), Ballyrock Investment Advisors LLC, and Northern Neck Investors LLC (2012-present). Previously, Ms. Wondrack served as Senior Vice President and Chief Compliance Officer for Columbia Management Investment Advisers, LLC (2005-2012); Chief Compliance Officer for certain funds within the Columbia Family of Funds (2007-2012); and Senior Vice President of Compliance Risk Management at Bank of America (2005-2010).
Joseph F. Zambello (1957)
Year of Election or Appointment: 2011
Deputy Treasurer
Mr. Zambello also serves as Deputy Treasurer of other funds. Mr. Zambello is an employee of Fidelity Investments (1991-present). Previously, Mr. Zambello served as Vice President of the Program Management Group of FMR (investment adviser firm, 2009-2011) and Vice President of the Transfer Agent Oversight Group (2005-2009).
Shareholder Expense Example
As a shareholder of the Fund, you incur two types of costs: (1) transaction costs, including sales charges (loads) on purchase payments or redemption proceeds, and (2) ongoing costs, including management fees, distribution and/or service (12b-1) fees and other Fund expenses. This Example is intended to help you understand your ongoing costs (in dollars) of investing in the Fund and to compare these costs with the ongoing costs of investing in other mutual funds.
The Example is based on an investment of $1,000 invested at the beginning of the period and held for the entire period (June 1, 2015 to November 30, 2015).
Actual Expenses
The first line of the accompanying table for each class of the Fund provides information about actual account values and actual expenses. You may use the information in this line, together with the amount you invested, to estimate the expenses that you paid over the period. Simply divide your account value by $1,000.00 (for example, an $8,600 account value divided by $1,000.00 = 8.6), then multiply the result by the number in the first line for a class of the Fund under the heading entitled "Expenses Paid During Period" to estimate the expenses you paid on your account during this period. A small balance maintenance fee of $12.00 that is charged once a year may apply for certain accounts with a value of less than $2,000. This fee is not included in the table below. If it was, the estimate of expenses you paid during the period would be higher, and your ending account value lower, by this amount. In addition, the Fund, as a shareholder in the underlying Fidelity Central Funds, will indirectly bear its pro-rata share of the fees and expenses incurred by the underlying Fidelity Central Funds. These fees and expenses are not included in the Fund's annualized expense ratio used to calculate the expense estimate in the table below.
Hypothetical Example for Comparison Purposes
The second line of the accompanying table for each class of the Fund provides information about hypothetical account values and hypothetical expenses based on a Class' actual expense ratio and an assumed rate of return of 5% per year before expenses, which is not the Class' actual return. The hypothetical account values and expenses may not be used to estimate the actual ending account balance or expenses you paid for the period. You may use this information to compare the ongoing costs of investing in the Fund and other funds. To do so, compare this 5% hypothetical example with the 5% hypothetical examples that appear in the shareholder reports of the other funds. A small balance maintenance fee of $12.00 that is charged once a year may apply for certain accounts with a value of less than $2,000. This fee is not included in the table below. If it was, the estimate of expenses you paid during the period would be higher, and your ending account value lower, by this amount. In addition, the Fund, as a shareholder in the underlying Fidelity Central Funds, will indirectly bear its pro-rata share of the fees and expenses incurred by the underlying Fidelity Central Funds. These fees and expenses are not included in the Fund's annualized expense ratio used to calculate the expense estimate in the table below.
Please note that the expenses shown in the table are meant to highlight your ongoing costs only and do not reflect any transaction costs. Therefore, the second line of the table is useful in comparing ongoing costs only, and will not help you determine the relative total costs of owning different funds. In addition, if these transactional costs were included, your costs would have been higher.
| Annualized Expense Ratio-A | Beginning Account Value June 1, 2015 | Ending Account Value November 30, 2015 | Expenses Paid During Period-B June 1, 2015 to November 30, 2015 | |
| Class A | .94% | |||
| Actual | $1,000.00 | $951.50 | $4.60 | |
| Hypothetical-C | $1,000.00 | $1,020.36 | $4.76 | |
| Class T | 1.17% | |||
| Actual | $1,000.00 | $950.60 | $5.72 | |
| Hypothetical-C | $1,000.00 | $1,019.20 | $5.92 | |
| Class B | 1.78% | |||
| Actual | $1,000.00 | $947.20 | $8.69 | |
| Hypothetical-C | $1,000.00 | $1,016.14 | $9.00 | |
| Class C | 1.69% | |||
| Actual | $1,000.00 | $947.90 | $8.25 | |
| Hypothetical-C | $1,000.00 | $1,016.60 | $8.54 | |
| Fidelity Stock Selector Mid Cap Fund | .70% | |||
| Actual | $1,000.00 | $952.80 | $3.43 | |
| Hypothetical-C | $1,000.00 | $1,021.56 | $3.55 | |
| Class I | .80% | |||
| Actual | $1,000.00 | $952.10 | $3.91 | |
| Hypothetical-C | $1,000.00 | $1,021.06 | $4.05 |
A Annualized expense ratio reflects expenses net of applicable fee waivers.
B Expenses are equal to each Class' annualized expense ratio, multiplied by the average account value over the period, multiplied by 183/365 (to reflect the one-half year period).
C 5% return per year before expenses
Distributions (Unaudited)
The Board of Trustees of Fidelity Stock Selector Mid Cap Fund voted to pay to shareholders of record at the opening of business on record date, the following distributions per share derived from capital gains realized from sales of portfolio securities, and dividends derived from net investment income:
| Pay Date | Record Date | Dividends | Capital Gains | |
| Fidelity Stock Selector Mid Cap Fund | 12/21/15 | 12/18/15 | $0.115 | $0.470 |
| 01/19/16 | 01/15/16 | $0.000 | $0.059 |
The fund hereby designates as a capital gain dividend with respect to the taxable year ended November 30, 2015 $41,177,168 or, if subsequently determined to be different, the net capital gain of such year.
A percentage of the dividends distributed during the fiscal year qualify for the dividends-received deduction for corporate shareholders:
| December 19, 2014 | December 29, 2014 | |
| Fidelity Stock Selector Mid Cap Fund | 91% | 90% |
Fidelity Stock Selector Mid Cap Fund designates 100% of the dividends distributed during the fiscal year as amounts which may be taken into account as a dividend for purposes of the maximum rate under section 1(h) (11) of the Internal Revenue Code.
The fund will notify shareholders in January 2016 of amounts for use in preparing 2015 income tax returns.
Board Approval of Investment Advisory Contracts and Management Fees
Fidelity Advisor Stock Selector Mid Cap Fund
Each year, the Board of Trustees, including the Independent Trustees (together, the Board), votes on the renewal of the management contract with Fidelity Management & Research Company (FMR) and the sub-advisory agreements (together, the Advisory Contracts) for the fund. The Board, assisted by the advice of fund counsel and Independent Trustees' counsel, requests and considers a broad range of information relevant to the renewal of the Advisory Contracts throughout the year.
The Board meets regularly and, at each of its meetings, covers an extensive agenda of topics and materials and considers factors that are relevant to its annual consideration of the renewal of the fund's Advisory Contracts, including the services and support provided to the fund and its shareholders. The Board has established various standing committees (Committees), each composed of and chaired by Independent Trustees with varying backgrounds, to which the Board has assigned specific subject matter responsibilities in order to enhance effective decision-making by the Board. The Board, acting directly and through its Committees, requests and receives information concerning the annual consideration of the renewal of the fund's Advisory Contracts. The Board also meets as needed to consider matters specifically related to the Board's annual consideration of the renewal of the Advisory Contracts. Members of the Board may also meet with trustees of other Fidelity funds through ad hoc joint committees to discuss certain matters relevant to all of the Fidelity funds.
At its July 2015 meeting, the Board unanimously determined to renew the fund's Advisory Contracts. In reaching its determination, the Board considered all factors it believed relevant, including (i) the nature, extent, and quality of the services to be provided to the fund and its shareholders (including the investment performance of the fund); (ii) the competitiveness of the fund's management fee and total expense ratio relative to peer funds; (iii) the total costs of the services to be provided by and the profits to be realized by Fidelity from its relationship with the fund; and (iv) the extent to which (if any) economies of scale exist and would be realized as the fund grows, and whether any economies of scale are appropriately shared with fund shareholders.
In considering whether to renew the Advisory Contracts for the fund, the Board reached a determination, with the assistance of fund counsel and Independent Trustees' counsel and through the exercise of its business judgment, that the renewal of the Advisory Contracts was in the best interests of the fund and its shareholders and that the compensation payable under the Advisory Contracts was fair and reasonable. The Board's decision to renew the Advisory Contracts was not based on any single factor, but rather was based on a comprehensive consideration of all the information provided to the Board at its meetings throughout the year. The Board, in reaching its determination to renew the Advisory Contracts, was aware that shareholders of the fund have a broad range of investment choices available to them, including a wide choice among funds offered by Fidelity's competitors, and that the fund's shareholders, who have the opportunity to review and weigh the disclosure provided by the fund in its prospectus and other public disclosures, have chosen to invest in this fund, which is part of the Fidelity family of funds.
Nature, Extent, and Quality of Services Provided. The Board considered Fidelity's staffing as it relates to the fund, including the backgrounds of investment personnel of Fidelity, and also considered the fund's investment objective, strategies, and related investment philosophy. The Independent Trustees also had discussions with senior management of Fidelity's investment operations and investment groups. The Board considered the structure of the portfolio manager compensation program and whether this structure provides appropriate incentives to act in the best interests of the fund. Additionally, the Board considered the portfolio managers' investments, if any, in the funds that they manage.Resources Dedicated to Investment Management and Support Services. The Board and the Fund Oversight and Research Committees reviewed the general qualifications and capabilities of Fidelity's investment staff, including its size, education, experience, and resources, as well as Fidelity's approach to recruiting, training, managing, and compensating investment personnel. The Board noted that Fidelity has continued to increase the resources devoted to non-U.S. offices, including expansion of Fidelity's global investment organization. The Board also noted that Fidelity's analysts have extensive resources, tools and capabilities that allow them to conduct sophisticated quantitative and fundamental analysis, as well as credit analysis of issuers, counterparties and guarantors. Further, the Board considered that Fidelity's investment professionals have sufficient access to global information and data so as to provide competitive investment results over time, and that those professionals also have access to sophisticated tools that permit them to assess portfolio construction and risk and performance attribution characteristics continuously, as well as to transmit new information and research conclusions rapidly around the world. Additionally, in its deliberations, the Board considered Fidelity's trading, risk management, and compliance capabilities and resources, which are integral parts of the investment management process.Shareholder and Administrative Services. The Board considered (i) the nature, extent, quality, and cost of advisory, administrative, and shareholder services performed by FMR, the sub-advisers (together with FMR, the Investment Advisers), and their affiliates under the Advisory Contracts and under separate agreements covering transfer agency, pricing and bookkeeping, and securities lending services for the fund; (ii) the nature and extent of the supervision of third party service providers, principally custodians and subcustodians; and (iii) the resources devoted to, and the record of compliance with, the fund's compliance policies and procedures. The Board also reviewed the allocation of fund brokerage, including allocations to brokers affiliated with the Investment Advisers, the use of brokerage commissions to pay fund expenses, and the use of "soft" commission dollars to pay for research services.The Board noted that the growth of fund assets over time across the complex allows Fidelity to reinvest in the development of services designed to enhance the value or convenience of the Fidelity funds as investment vehicles. These services include 24-hour access to account information and market information through telephone representatives and over the Internet, investor education materials and asset allocation tools, and the expanded availability of Fidelity Investor Centers.In 2014, the Board formed an ad hoc Committee on Transfer Agency Fees to review the variety of transfer agency fee structures throughout the industry and Fidelity's competitive positioning with respect to industry participants.Investment in a Large Fund Family. The Board considered the benefits to shareholders of investing in a Fidelity fund, including the benefits of investing in a fund that is part of a large family of funds offering a variety of investment disciplines and providing a large variety of mutual fund investor services. The Board noted that Fidelity had taken, or had made recommendations that resulted in the Fidelity funds taking, a number of actions over the previous year that benefited particular funds, including (i) continuing to dedicate additional resources to investment research and to the support of the senior management team that oversees asset management; (ii) continuing efforts to enhance Fidelity's global research capabilities; (iii) launching new funds and making other enhancements to meet client needs; (iv) reducing management fees and total expenses for certain index funds and diversified international funds; (v) continuing to launch dedicated lower cost underlying funds to meet portfolio construction needs related to expanding underlying fund options for Fidelity funds of funds, specifically for the Freedom Fund product lines; (vi) rationalizing product lines and gaining increased efficiencies through fund mergers; (vii) launching active fixed-income exchange-traded funds; (viii) continuing to develop, acquire and implement systems and technology to improve services to the funds and information security and to increase efficiency; (ix) implementing investment enhancements to further strengthen Fidelity's target date product line to increase investors' probability of success in achieving their goals; (x) modifying the eligibility criteria for certain share classes to accommodate roll-over assets from employer-sponsored retirement plans; (xi) launching a new Class W of the Freedom Index Funds to attract and retain Fidelity record-kept retirement plan assets; and (xii) implementing changes to Fidelity's money market product line in response to recent money market regulatory reforms.Investment Performance. The Board considered whether the fund has operated in accordance with its investment objective, as well as its record of compliance with its investment restrictions and its performance history. The Board noted that there was a portfolio management change for the fund in October 2012.The Board took into account discussions with representatives of the Investment Advisers about fund investment performance that occur at Board meetings throughout the year. In this regard the Board noted that as part of regularly scheduled fund reviews and other reports to the Board on fund performance, the Board considers annualized return information for the fund, for different time periods, measured against a securities market index ("benchmark index") and a peer group of funds with similar objectives ("peer group"), if any. In its evaluation of fund investment performance, the Board gave particular attention to information indicating changes in performance of certain Fidelity funds for specific time periods and discussed with the Investment Advisers the reasons for any overperformance or underperformance.In addition to reviewing absolute and relative fund performance, the Independent Trustees periodically consider the appropriateness of fund performance metrics in evaluating the results achieved. In general, the Independent Trustees believe that fund performance should be evaluated based on net performance (after fees and expenses) of both the highest performing and lowest performing fund share classes, where applicable, compared to appropriate benchmark indices, over appropriate time periods that may include full market cycles, and compared to peer groups, as applicable, over the same periods, taking into account relevant factors including the following: general market conditions; issuer-specific information; and fund cash flows and other factors.The Independent Trustees recognize that shareholders evaluate performance on a net basis over their own holding periods, for which one-, three-, and five-year periods are often used as a proxy. For this reason, the performance information reviewed by the Board also included net cumulative calendar year total return information for the fund and an appropriate benchmark index and peer group for the most recent one-, three-, and five-year periods, as shown below. Returns are shown compared to the 25th percentile (top of box, 75% beaten) and 75th percentile (bottom of box, 25% beaten) of the peer universe.Fidelity Advisor Stock Selector Mid Cap Fund
Fidelity Advisor Stock Selector Mid Cap Fund
![]()
Corporate Headquarters
245 Summer St.
Boston, MA 02210
www.fidelity.com
SKD-ANN-0116
1.940899.103
Fidelity Advisor® Equity Income Fund Class Z Annual Report November 30, 2015 |
|
Contents
Board Approval of Investment Advisory Contracts and Management Fees |
To view a fund's proxy voting guidelines and proxy voting record for the 12-month period ended June 30, visit http://www.fidelity.com/proxyvotingresults or visit the Securities and Exchange Commission's (SEC) web site at http://www.sec.gov.
You may also call 1-877-208-0098 to request a free copy of the proxy voting guidelines.
Standard & Poor's, S&P and S&P 500 are registered service marks of The McGraw-Hill Companies, Inc. and have been licensed for use by Fidelity Distributors Corporation.
Other third-party marks appearing herein are the property of their respective owners.
All other marks appearing herein are registered or unregistered trademarks or service marks of FMR LLC or an affiliated company. © 2016 FMR LLC. All rights reserved.
This report and the financial statements contained herein are submitted for the general information of the shareholders of the Fund. This report is not authorized for distribution to prospective investors in the Fund unless preceded or accompanied by an effective prospectus.
A fund files its complete schedule of portfolio holdings with the SEC for the first and third quarters of each fiscal year on Form N-Q. Forms N-Q are available on the SEC’s web site at http://www.sec.gov. A fund's Forms N-Q may be reviewed and copied at the SEC’s Public Reference Room in Washington, DC. Information regarding the operation of the SEC's Public Reference Room may be obtained by calling 1-800-SEC-0330.
For a complete list of a fund's portfolio holdings, view the most recent holdings listing, semiannual report, or annual report on Fidelity's web site at http://www.fidelity.com, http://www.advisor.fidelity.com, or http://www.401k.com, as applicable.
NOT FDIC INSURED •MAY LOSE VALUE •NO BANK GUARANTEE
Neither the Fund nor Fidelity Distributors Corporation is a bank.
Performance: The Bottom Line
Average annual total return reflects the change in the value of an investment, assuming reinvestment of distributions from dividend income and capital gains (the profits earned upon the sale of securities that have grown in value, if any) and assuming a constant rate of performance each year.
The hypothetical investment and the average annual total returns do not reflect the deduction of taxes that a shareholder would pay on fund distributions or the redemption of fund shares.
During periods of reimbursement by Fidelity, a fund’s total return will be greater than it would be had the reimbursement not occurred.
How a fund did yesterday is no guarantee of how it will do tomorrow.
Average Annual Total Returns
| For the periods ended November 30, 2015 | Past 1 year | Past 5 years | Past 10 years |
| Class Z | (3.20)% | 11.78% | 5.13% |
The initial offering of Class Z shares took place on August 13, 2013. Returns prior to August 13, 2013, are those of Class I.
$10,000 Over 10 Years
Let's say hypothetically that $10,000 was invested in Fidelity Advisor® Equity Income Fund - Class Z on November 30, 2005.
The chart shows how the value of your investment would have changed, and also shows how the Russell 3000® Value Index performed over the same period.
See previous page for additional information regarding the performance of Class Z.
| Period Ending Values | ||
| $16,492 | Fidelity Advisor® Equity Income Fund - Class Z | |
| $18,627 | Russell 3000® Value Index | |
Management's Discussion of Fund Performance
Market Recap: U.S. stocks gained modestly for the 12 months ending November 30, 2015, despite a steep decline in August and September on concern about slowing economic growth in China. The S&P 500® index rebounded in October and gained 2.75% for the year. Stocks benefited late in the period amid waning expectations for a near-term interest-rate hike by the U.S. Federal Reserve, more economic stimulus in Europe and an interest-rate cut in China. Growth stocks in the benchmark far outpaced their value counterparts, as investors continued to seek growth in a subpar economic environment. Sector performance varied widely, with more than 26 percentage points separating the leader from the laggard. Consumer discretionary (+14%) secured the top spot, benefiting from a combination of rising personal income and still-benign inflation. Information technology (+7%) and health care (+4%) also outpaced the broad market. Conversely, the energy sector (-12%) performed worst, stymied by depressed commodity prices that also hit materials (-5%). Telecommunication services (-5%) and utilities (-4%), considered defensive sectors less sensitive to the economy, also lost ground. At period end, investors remained focused on the potential global implications of a stronger U.S. dollar and how China’s transition toward a consumption-led economy may affect corporate earnings.Comments from Portfolio Manager James Morrow: For the year, fund’s share classes (excluding sales charges, if applicable) struggled to low-single-digit declines, significantly trailing the -1.01% return of the benchmark Russell 3000® Value Index. The fund was hurt most by poor stock picking in the energy and materials sectors, especially master limited partnership Williams Partners and its majority-owner, energy transportation company Williams Companies. Both of these non-benchmark entities were hard hit by upheaval in the energy business. CONSOL Energy, a producer of coal and natural gas, also detracted. Despite the multiple challenges we saw in energy, the fund benefited from largely avoiding Exxon Mobil and not owning ConocoPhillips, two integrated energy firms whose risk/reward trade-off struck me as less attractive than others. In contrast, JPMorgan Chase, among the fund’s largest holdings and a notable overweighting, contributed meaningfully. I saw JPMorgan as a relatively inexpensive stock in an increasingly expensive market. The fund also was helped by a position in Chubb, a provider of property and casualty insurance. During the period, insurance company ACE Limited agreed to acquire Chubb for a significant premium. Although I did not anticipate this event, I’m not surprised that a buyer emerged for a company I, too, found to be a very well-priced company.The views expressed above reflect those of the portfolio manager(s) only through the end of the period as stated on the cover of this report and do not necessarily represent the views of Fidelity or any other person in the Fidelity organization. Any such views are subject to change at any time based upon market or other conditions and Fidelity disclaims any responsibility to update such views. These views may not be relied on as investment advice and, because investment decisions for a Fidelity fund are based on numerous factors, may not be relied on as an indication of trading intent on behalf of any Fidelity fund.
Investment Summary (Unaudited)
Top Ten Stocks as of November 30, 2015
| % of fund's net assets | % of fund's net assets 6 months ago | |
| Johnson & Johnson | 5.4 | 4.3 |
| General Electric Co.(a) | 3.9 | 3.8 |
| Chevron Corp. | 3.7 | 2.8 |
| JPMorgan Chase & Co. | 3.3 | 4.5 |
| Procter & Gamble Co. | 3.1 | 2.4 |
| United Parcel Service, Inc. Class B(a) | 2.5 | 2.1 |
| AT&T, Inc. | 2.0 | 1.3 |
| Cisco Systems, Inc. | 1.9 | 2.0 |
| MetLife, Inc. | 1.8 | 1.5 |
| Verizon Communications, Inc. | 1.8 | 1.7 |
| 29.4 |
(a) Security or a portion of the security is pledged as collateral for call options written.
Top Five Market Sectors as of November 30, 2015
| % of fund's net assets | % of fund's net assets 6 months ago | |
| Financials | 24.8 | 27.4 |
| Industrials | 11.8 | 11.8 |
| Information Technology | 11.6 | 12.5 |
| Health Care | 10.4 | 9.9 |
| Energy | 9.8 | 10.2 |
Asset Allocation (% of fund's net assets)
| As of November 30, 2015*,** | ||
| Stocks | 94.7% | |
| Bonds | 0.1% | |
| Convertible Securities | 0.6% | |
| Other Investments | 0.1% | |
| Short-Term Investments and Net Other Assets (Liabilities) | 4.5% | |

* Written options - (0.1)%
** Foreign investments - 9.1%
| As of May 31, 2015*,** | ||
| Stocks | 93.8% | |
| Bonds | 0.2% | |
| Convertible Securities | 1.5% | |
| Other Investments | 0.1% | |
| Short-Term Investments and Net Other Assets (Liabilities) | 4.4% | |

* Written options - 0.0%
** Foreign investments - 10.4%
Investments November 30, 2015
Showing Percentage of Net Assets
| Common Stocks - 94.5% | |||
| Shares | Value (000s) | ||
| CONSUMER DISCRETIONARY - 7.7% | |||
| Automobiles - 1.1% | |||
| General Motors Co. | 620,600 | $22,466 | |
| Hotels, Restaurants & Leisure - 1.3% | |||
| Compass Group PLC | 13,500 | 235 | |
| Dunkin' Brands Group, Inc. (a) | 119,400 | 5,065 | |
| McDonald's Corp. (b) | 131,417 | 15,003 | |
| Whitbread PLC | 15,604 | 1,069 | |
| Yum! Brands, Inc. (b) | 90,721 | 6,578 | |
| 27,950 | |||
| Household Durables - 0.6% | |||
| M.D.C. Holdings, Inc. | 185,600 | 4,868 | |
| Tupperware Brands Corp. | 149,800 | 8,504 | |
| 13,372 | |||
| Leisure Products - 0.9% | |||
| Mattel, Inc. (a) | 422,600 | 10,506 | |
| New Academy Holding Co. LLC unit (c)(d)(e) | 52,800 | 7,983 | |
| 18,489 | |||
| Media - 1.6% | |||
| Comcast Corp. Class A | 487,374 | 29,662 | |
| Time Warner, Inc. | 60,800 | 4,255 | |
| 33,917 | |||
| Multiline Retail - 1.6% | |||
| Kohl's Corp. | 97,648 | 4,602 | |
| Macy's, Inc. | 185,100 | 7,234 | |
| Target Corp. | 316,955 | 22,979 | |
| 34,815 | |||
| Specialty Retail - 0.6% | |||
| Foot Locker, Inc. | 97,100 | 6,312 | |
| GNC Holdings, Inc. | 167,000 | 4,978 | |
| Stage Stores, Inc. (a) | 284,361 | 2,201 | |
| 13,491 | |||
| TOTAL CONSUMER DISCRETIONARY | 164,500 | ||
| CONSUMER STAPLES - 8.8% | |||
| Beverages - 1.7% | |||
| Anheuser-Busch InBev SA NV ADR | 53,000 | 6,808 | |
| Molson Coors Brewing Co. Class B (b) | 93,505 | 8,605 | |
| The Coca-Cola Co. | 480,200 | 20,466 | |
| 35,879 | |||
| Food & Staples Retailing - 2.7% | |||
| CVS Health Corp. | 324,000 | 30,485 | |
| Tesco PLC | 677,700 | 1,705 | |
| Wal-Mart Stores, Inc. | 251,850 | 14,819 | |
| Walgreens Boots Alliance, Inc. | 98,744 | 8,297 | |
| Whole Foods Market, Inc. | 91,200 | 2,658 | |
| 57,964 | |||
| Food Products - 1.1% | |||
| B&G Foods, Inc. Class A | 136,354 | 5,151 | |
| Sanderson Farms, Inc. (a) | 35,200 | 2,633 | |
| The Hershey Co. (b) | 196,900 | 16,994 | |
| 24,778 | |||
| Household Products - 3.1% | |||
| Procter & Gamble Co. | 888,617 | 66,504 | |
| Personal Products - 0.2% | |||
| Avon Products, Inc. (a) | 1,151,900 | 3,974 | |
| TOTAL CONSUMER STAPLES | 189,099 | ||
| ENERGY - 9.6% | |||
| Energy Equipment & Services - 0.4% | |||
| Ensco PLC Class A | 243,224 | 4,164 | |
| National Oilwell Varco, Inc. | 73,949 | 2,761 | |
| Oceaneering International, Inc. | 63,100 | 2,760 | |
| 9,685 | |||
| Oil, Gas & Consumable Fuels - 9.2% | |||
| Anadarko Petroleum Corp. | 100,545 | 6,023 | |
| Apache Corp. | 258,227 | 12,700 | |
| Avance Gas Holding Ltd. (a) | 179,455 | 2,437 | |
| BW LPG Ltd. | 350,634 | 3,026 | |
| Cameco Corp. | 123,900 | 1,514 | |
| Chevron Corp. | 875,869 | 79,984 | |
| CONSOL Energy, Inc. (a) | 320,375 | 2,525 | |
| Foresight Energy LP (a) | 257,600 | 1,108 | |
| Golar LNG Ltd. | 68,300 | 1,868 | |
| Imperial Oil Ltd. | 48,000 | 1,559 | |
| Kinder Morgan, Inc. | 359,300 | 8,469 | |
| Legacy Reserves LP | 505,299 | 1,577 | |
| Markwest Energy Partners LP | 235,991 | 11,328 | |
| Noble Energy, Inc. | 138,200 | 5,068 | |
| Suncor Energy, Inc. | 795,700 | 21,986 | |
| The Williams Companies, Inc. | 555,950 | 20,326 | |
| Williams Partners LP | 547,815 | 15,021 | |
| 196,519 | |||
| TOTAL ENERGY | 206,204 | ||
| FINANCIALS - 24.6% | |||
| Banks - 11.4% | |||
| Bank of America Corp. | 1,549,400 | 27,006 | |
| BB&T Corp. | 26,700 | 1,031 | |
| Comerica, Inc. | 232,180 | 10,762 | |
| First Niagara Financial Group, Inc. | 724,200 | 7,807 | |
| FirstMerit Corp. | 348,340 | 7,047 | |
| JPMorgan Chase & Co. | 1,055,557 | 70,385 | |
| KeyCorp | 533,000 | 6,988 | |
| Lloyds Banking Group PLC | 1,703,700 | 1,871 | |
| M&T Bank Corp. | 245,517 | 30,771 | |
| Regions Financial Corp. | 1,332,300 | 13,510 | |
| Standard Chartered PLC: | |||
| rights 12/10/15 (d) | 116,110 | 159 | |
| (United Kingdom) | 406,386 | 3,410 | |
| SunTrust Banks, Inc. | 373,100 | 16,200 | |
| U.S. Bancorp | 452,700 | 19,869 | |
| Wells Fargo & Co. (b) | 486,550 | 26,809 | |
| 243,625 | |||
| Capital Markets - 5.5% | |||
| Apollo Global Management LLC Class A | 35,500 | 580 | |
| Apollo Investment Corp. (a) | 790,757 | 5,021 | |
| Ares Capital Corp. | 375,042 | 5,933 | |
| Ares Management LP | 170,880 | 2,404 | |
| KKR & Co. LP | 1,844,596 | 31,192 | |
| Morgan Stanley | 231,342 | 7,935 | |
| PJT Partners, Inc. (d) | 27,955 | 655 | |
| State Street Corp. | 356,899 | 25,904 | |
| The Blackstone Group LP | 1,141,703 | 35,655 | |
| TPG Specialty Lending, Inc. | 143,100 | 2,463 | |
| 117,742 | |||
| Consumer Finance - 0.4% | |||
| Synchrony Financial (d) | 251,257 | 7,998 | |
| Insurance - 4.8% | |||
| ACE Ltd. | 105,911 | 12,164 | |
| MetLife, Inc. | 769,857 | 39,332 | |
| Prudential Financial, Inc. | 169,198 | 14,644 | |
| The Chubb Corp. | 213,667 | 27,890 | |
| The Travelers Companies, Inc. | 81,649 | 9,355 | |
| 103,385 | |||
| Real Estate Investment Trusts - 2.3% | |||
| American Capital Agency Corp. | 213,080 | 3,825 | |
| American Tower Corp. | 11,800 | 1,173 | |
| Annaly Capital Management, Inc. | 402,294 | 3,854 | |
| Care Capital Properties, Inc. | 15,273 | 483 | |
| Coresite Realty Corp. | 31,220 | 1,829 | |
| Cousins Properties, Inc. | 356,400 | 3,503 | |
| Crown Castle International Corp. | 77,900 | 6,692 | |
| Duke Realty LP | 294,600 | 5,995 | |
| First Potomac Realty Trust | 452,777 | 5,261 | |
| Piedmont Office Realty Trust, Inc. Class A | 249,935 | 4,871 | |
| Public Storage | 10,600 | 2,545 | |
| Retail Properties America, Inc. | 165,897 | 2,538 | |
| Sabra Health Care REIT, Inc. | 70,700 | 1,462 | |
| Two Harbors Investment Corp. | 301,541 | 2,563 | |
| Ventas, Inc. | 61,094 | 3,259 | |
| 49,853 | |||
| Thrifts & Mortgage Finance - 0.2% | |||
| Radian Group, Inc. | 239,290 | 3,410 | |
| TOTAL FINANCIALS | 526,013 | ||
| HEALTH CARE - 10.3% | |||
| Biotechnology - 1.0% | |||
| AbbVie, Inc. | 119,100 | 6,926 | |
| Amgen, Inc. | 57,949 | 9,336 | |
| Gilead Sciences, Inc. | 50,400 | 5,340 | |
| 21,602 | |||
| Health Care Equipment & Supplies - 1.7% | |||
| DENTSPLY International, Inc. | 81,300 | 4,932 | |
| Medtronic PLC (b) | 369,982 | 27,874 | |
| St. Jude Medical, Inc. | 66,462 | 4,194 | |
| 37,000 | |||
| Health Care Providers & Services - 0.0% | |||
| Anthem, Inc. | 44 | 6 | |
| Pharmaceuticals - 7.6% | |||
| GlaxoSmithKline PLC | 914,000 | 18,575 | |
| Johnson & Johnson | 1,137,318 | 115,136 | |
| Merck & Co., Inc. | 100,700 | 5,338 | |
| Pfizer, Inc. | 240,513 | 7,882 | |
| Sanofi SA | 73,234 | 6,509 | |
| Teva Pharmaceutical Industries Ltd. sponsored ADR | 135,700 | 8,540 | |
| 161,980 | |||
| TOTAL HEALTH CARE | 220,588 | ||
| INDUSTRIALS - 11.8% | |||
| Aerospace & Defense - 2.8% | |||
| General Dynamics Corp. | 52,200 | 7,645 | |
| Raytheon Co. | 71,000 | 8,806 | |
| The Boeing Co. (b) | 124,200 | 18,065 | |
| United Technologies Corp. | 262,907 | 25,252 | |
| 59,768 | |||
| Air Freight & Logistics - 3.0% | |||
| C.H. Robinson Worldwide, Inc. | 80,979 | 5,460 | |
| PostNL NV (d) | 1,871,900 | 6,256 | |
| United Parcel Service, Inc. Class B (b) | 518,790 | 53,441 | |
| 65,157 | |||
| Airlines - 0.2% | |||
| Copa Holdings SA Class A | 82,000 | 4,235 | |
| Commercial Services & Supplies - 0.5% | |||
| KAR Auction Services, Inc. | 215,104 | 8,159 | |
| Republic Services, Inc. | 60,089 | 2,640 | |
| 10,799 | |||
| Electrical Equipment - 1.3% | |||
| Eaton Corp. PLC | 203,500 | 11,836 | |
| Emerson Electric Co. | 299,370 | 14,969 | |
| 26,805 | |||
| Industrial Conglomerates - 3.9% | |||
| General Electric Co. (b) | 2,769,054 | 82,905 | |
| Machinery - 0.1% | |||
| Cummins, Inc. | 26,100 | 2,620 | |
| Professional Services - 0.0% | |||
| Acacia Research Corp. (a) | 153,060 | 905 | |
| TOTAL INDUSTRIALS | 253,194 | ||
| INFORMATION TECHNOLOGY - 11.4% | |||
| Communications Equipment - 2.9% | |||
| Cisco Systems, Inc. | 1,473,353 | 40,149 | |
| QUALCOMM, Inc. | 468,889 | 22,877 | |
| 63,026 | |||
| Electronic Equipment & Components - 0.5% | |||
| Hitachi Ltd. | 536,000 | 3,164 | |
| TE Connectivity Ltd. | 98,930 | 6,637 | |
| 9,801 | |||
| Internet Software & Services - 0.4% | |||
| Yahoo!, Inc. (d) | 278,200 | 9,406 | |
| IT Services - 2.9% | |||
| First Data Corp. | 779,769 | 11,790 | |
| First Data Corp. Class A (d) | 24,000 | 403 | |
| IBM Corp. | 218,423 | 30,453 | |
| Paychex, Inc. (b) | 367,878 | 19,957 | |
| 62,603 | |||
| Semiconductors & Semiconductor Equipment - 1.4% | |||
| Applied Materials, Inc. | 951,877 | 17,867 | |
| Maxim Integrated Products, Inc. | 288,600 | 11,189 | |
| 29,056 | |||
| Software - 0.8% | |||
| Microsoft Corp. (b) | 321,338 | 17,465 | |
| Technology Hardware, Storage & Peripherals - 2.5% | |||
| Apple, Inc. | 187,700 | 22,205 | |
| EMC Corp. | 1,069,300 | 27,096 | |
| Seagate Technology LLC | 103,600 | 3,723 | |
| 53,024 | |||
| TOTAL INFORMATION TECHNOLOGY | 244,381 | ||
| MATERIALS - 1.4% | |||
| Chemicals - 0.6% | |||
| LyondellBasell Industries NV Class A | 60,200 | 5,768 | |
| Potash Corp. of Saskatchewan, Inc. | 291,100 | 5,892 | |
| Syngenta AG sponsored ADR | 4,500 | 333 | |
| Tronox Ltd. Class A | 174,965 | 1,018 | |
| 13,011 | |||
| Containers & Packaging - 0.5% | |||
| Packaging Corp. of America | 89,600 | 6,092 | |
| WestRock Co. | 99,000 | 5,012 | |
| 11,104 | |||
| Metals & Mining - 0.3% | |||
| Freeport-McMoRan, Inc. | 202,514 | 1,657 | |
| Nucor Corp. | 103,100 | 4,273 | |
| 5,930 | |||
| TOTAL MATERIALS | 30,045 | ||
| TELECOMMUNICATION SERVICES - 4.0% | |||
| Diversified Telecommunication Services - 3.9% | |||
| AT&T, Inc. | 1,250,127 | 42,092 | |
| TDC A/S | 226,900 | 1,192 | |
| Verizon Communications, Inc. | 851,590 | 38,705 | |
| 81,989 | |||
| Wireless Telecommunication Services - 0.1% | |||
| KDDI Corp. | 94,900 | 2,354 | |
| TOTAL TELECOMMUNICATION SERVICES | 84,343 | ||
| UTILITIES - 4.9% | |||
| Electric Utilities - 4.7% | |||
| American Electric Power Co., Inc. | 210,515 | 11,791 | |
| Entergy Corp. | 118,500 | 7,896 | |
| Exelon Corp. | 1,108,700 | 30,279 | |
| NextEra Energy, Inc. | 18,986 | 1,896 | |
| PPL Corp. | 658,000 | 22,398 | |
| Southern Co. | 501,525 | 22,338 | |
| Xcel Energy, Inc. | 100,900 | 3,598 | |
| 100,196 | |||
| Multi-Utilities - 0.2% | |||
| CenterPoint Energy, Inc. | 299,400 | 5,075 | |
| TOTAL UTILITIES | 105,271 | ||
| TOTAL COMMON STOCKS | |||
| (Cost $1,902,926) | 2,023,638 | ||
| Preferred Stocks - 0.4% | |||
| Convertible Preferred Stocks - 0.2% | |||
| HEALTH CARE - 0.1% | |||
| Health Care Providers & Services - 0.1% | |||
| AmSurg Corp. Series A-1, 5.25% | 5,900 | 938 | |
| Pharmaceuticals - 0.0% | |||
| Allergan PLC 5.50% | 880 | 922 | |
| TOTAL HEALTH CARE | 1,860 | ||
| TELECOMMUNICATION SERVICES - 0.0% | |||
| Wireless Telecommunication Services - 0.0% | |||
| T-Mobile U.S., Inc. Series A 5.50% | 14,600 | 902 | |
| UTILITIES - 0.1% | |||
| Independent Power and Renewable Electricity Producers - 0.0% | |||
| Dynegy, Inc. 5.375% | 11,400 | 705 | |
| Multi-Utilities - 0.1% | |||
| CenterPoint Energy, Inc. 2.00% ZENS (d) | 12,700 | 752 | |
| TOTAL UTILITIES | 1,457 | ||
| TOTAL CONVERTIBLE PREFERRED STOCKS | 4,219 | ||
| Nonconvertible Preferred Stocks - 0.2% | |||
| CONSUMER DISCRETIONARY - 0.1% | |||
| Automobiles - 0.1% | |||
| Volkswagen AG | 16,608 | 2,302 | |
| FINANCIALS - 0.1% | |||
| Consumer Finance - 0.1% | |||
| Ally Financial, Inc. 7.00% (f) | 2,265 | 2,281 | |
| TOTAL NONCONVERTIBLE PREFERRED STOCKS | 4,583 | ||
| TOTAL PREFERRED STOCKS | |||
| (Cost $9,164) | 8,802 | ||
| Principal Amount (000s)(g) | Value (000s) | ||
| Corporate Bonds - 0.5% | |||
| Convertible Bonds - 0.4% | |||
| CONSUMER DISCRETIONARY - 0.0% | |||
| Household Durables - 0.0% | |||
| Jarden Corp. 1.875% 9/15/18 | 460 | 709 | |
| ENERGY - 0.2% | |||
| Oil, Gas & Consumable Fuels - 0.2% | |||
| Amyris, Inc. 3% 2/27/17 | 516 | 469 | |
| Scorpio Tankers, Inc. 2.375% 7/1/19 (f) | 2,860 | 2,812 | |
| Whiting Petroleum Corp. 1.25% 4/1/20 (f) | 840 | 739 | |
| 4,020 | |||
| INFORMATION TECHNOLOGY - 0.2% | |||
| Communications Equipment - 0.1% | |||
| InterDigital, Inc. 1.5% 3/1/20 (f) | 1,800 | 1,789 | |
| Semiconductors & Semiconductor Equipment - 0.1% | |||
| GT Advanced Technologies, Inc.: | |||
| 3% 10/1/17 (h) | 1,510 | 14 | |
| 3% 12/15/20 (h) | 2,160 | 20 | |
| Micron Technology, Inc. 3.125% 5/1/32 | 450 | 784 | |
| NXP Semiconductors NV 1% 12/1/19 (f) | 910 | 1,051 | |
| 1,869 | |||
| TOTAL INFORMATION TECHNOLOGY | 3,658 | ||
| TOTAL CONVERTIBLE BONDS | 8,387 | ||
| Nonconvertible Bonds - 0.1% | |||
| CONSUMER DISCRETIONARY - 0.1% | |||
| Media - 0.1% | |||
| Altice SA 7.625% 2/15/25 (f) | 1,240 | 1,085 | |
| CONSUMER STAPLES - 0.0% | |||
| Tobacco - 0.0% | |||
| Vector Group Ltd. 7.75% 2/15/21 | 905 | 962 | |
| MATERIALS - 0.0% | |||
| Metals & Mining - 0.0% | |||
| Walter Energy, Inc. 8.5% 4/15/21 (h) | 2,030 | 5 | |
| TOTAL NONCONVERTIBLE BONDS | 2,052 | ||
| TOTAL CORPORATE BONDS | |||
| (Cost $16,967) | 10,439 | ||
| Preferred Securities - 0.1% | |||
| FINANCIALS - 0.1% | |||
| Diversified Financial Services - 0.1% | |||
| Baggot Securities Ltd. 10.24%(f)(i) | |||
| (Cost $1,520) | EUR | 990 | 1,137 |
| Shares | Value (000s) | ||
| Money Market Funds - 5.4% | |||
| Fidelity Cash Central Fund, 0.18% (j) | 92,725,145 | 92,725 | |
| Fidelity Securities Lending Cash Central Fund, 0.22% (j)(k) | 23,547,494 | 23,547 | |
| TOTAL MONEY MARKET FUNDS | |||
| (Cost $116,272) | 116,272 | ||
| TOTAL INVESTMENT PORTFOLIO - 100.9% | |||
| (Cost $2,046,849) | 2,160,288 | ||
| NET OTHER ASSETS (LIABILITIES) - (0.9)% | (19,886) | ||
| NET ASSETS - 100% | $2,140,402 |
| Written Options | ||||
| Expiration Date/Exercise Price | Number of Contracts | Premium (000s) | Value (000s) | |
| Call Options | ||||
| General Electric Co. | 1/15/16 - $31.00 | 9,926 | $303 | $(253) |
| McDonald's Corp. | 1/15/16 - $115.00 | 458 | 83 | (109) |
| Medtronic PLC | 1/15/16 - $77.50 | 1,215 | 229 | (117) |
| Microsoft Corp. | 12/18/15 - $55.00 | 1,366 | 123 | (92) |
| Molson Coors Brewing Co. Class B | 1/15/16 - $100.00 | 305 | 36 | (15) |
| Paychex, Inc. | 12/18/15 - $50.00 | 1,853 | 152 | (788) |
| The Boeing Co. | 1/15/16 - $150.00 | 409 | 157 | (74) |
| The Hershey Co. | 2/19/16 - $90.00 | 646 | 82 | (111) |
| United Parcel Service, Inc. Class B | 1/15/16 - $105.00 | 1,710 | 313 | (255) |
| Wells Fargo & Co. | 1/15/16 - $57.50 | 1,622 | 111 | (74) |
| Yum! Brands, Inc. | 1/15/16 - $75.00 | 293 | 51 | (71) |
| TOTAL WRITTEN OPTIONS | $1,640 | $(1,959) |
Currency Abbreviations
EUR – European Monetary Unit
Legend
(a) Security or a portion of the security is on loan at period end.
(b) Security or a portion of the security is pledged as collateral for call options written. At period end, the value of securities pledged amounted to $104,585,000.
(c) Restricted securities - Investment in securities not registered under the Securities Act of 1933 (excluding 144A issues). At the end of the period, the value of restricted securities (excluding 144A issues) amounted to $7,983,000 or 0.4% of net assets.
(d) Non-income producing
(e) Investment is owned by an entity that is treated as a U.S. Corporation for tax purposes in which the Fund holds a percentage ownership.
(f) Security exempt from registration under Rule 144A of the Securities Act of 1933. These securities may be resold in transactions exempt from registration, normally to qualified institutional buyers. At the end of the period, the value of these securities amounted to $10,894,000 or 0.5% of net assets.
(g) Amount is stated in United States dollars unless otherwise noted.
(h) Non-income producing - Security is in default.
(i) Security is perpetual in nature with no stated maturity date.
(j) Affiliated fund that is generally available only to investment companies and other accounts managed by Fidelity Investments. The rate quoted is the annualized seven-day yield of the fund at period end. A complete unaudited listing of the fund's holdings as of its most recent quarter end is available upon request. In addition, each Fidelity Central Fund's financial statements, which are not covered by the Fund's Report of Independent Registered Public Accounting Firm, are available on the SEC's website or upon request.
(k) Investment made with cash collateral received from securities on loan.
Additional information on each restricted holding is as follows:
| Security | Acquisition Date | Acquisition Cost (000s) |
| New Academy Holding Co. LLC unit | 8/1/11 | $5,565 |
Affiliated Central Funds
Information regarding fiscal year to date income earned by the Fund from investments in Fidelity Central Funds is as follows:
| Fund | Income earned |
| (Amounts in thousands) | |
| Fidelity Cash Central Fund | $126 |
| Fidelity Securities Lending Cash Central Fund | 180 |
| Total | $306 |
Investment Valuation
The following is a summary of the inputs used, as of November 30, 2015, involving the Fund's assets and liabilities carried at fair value. The inputs or methodology used for valuing securities may not be an indication of the risk associated with investing in those securities. For more information on valuation inputs, and their aggregation into the levels used below, please refer to the Investment Valuation section in the accompanying Notes to Financial Statements.
| Valuation Inputs at Reporting Date: | ||||
| Description | Total | Level 1 | Level 2 | Level 3 |
| (Amounts in thousands) | ||||
| Investments in Securities: | ||||
| Equities: | ||||
| Consumer Discretionary | $166,802 | $156,282 | $2,537 | $7,983 |
| Consumer Staples | 189,099 | 187,394 | 1,705 | -- |
| Energy | 206,204 | 206,204 | -- | -- |
| Financials | 528,294 | 524,142 | 4,152 | -- |
| Health Care | 222,448 | 196,426 | 26,022 | -- |
| Industrials | 253,194 | 253,194 | -- | -- |
| Information Technology | 244,381 | 232,591 | 11,790 | -- |
| Materials | 30,045 | 30,045 | -- | -- |
| Telecommunication Services | 85,245 | 82,891 | 2,354 | -- |
| Utilities | 106,728 | 105,976 | 752 | -- |
| Corporate Bonds | 10,439 | -- | 10,439 | -- |
| Preferred Securities | 1,137 | -- | 1,137 | -- |
| Money Market Funds | 116,272 | 116,272 | -- | -- |
| Total Investments in Securities: | $2,160,288 | $2,091,417 | $60,888 | $7,983 |
| Derivative Instruments: | ||||
| Liabilities | ||||
| Written Options | $(1,959) | $(1,959) | $-- | $-- |
| Total Liabilities | $(1,959) | $(1,959) | $-- | $-- |
| Total Derivative Instruments: | $(1,959) | $(1,959) | $-- | $-- |
Value of Derivative Instruments
The following table is a summary of the Fund's value of derivative instruments by primary risk exposure as of November 30, 2015. For additional information on derivative instruments, please refer to the Derivative Instruments section in the accompanying Notes to Financial Statements.
| Primary Risk Exposure / Derivative Type | Value | |
| (Amounts in thousands) | Asset | Liability |
| Equity Risk | ||
| Written Options(a) | $0 | $(1,959) |
| Total Equity Risk | $0 | $(1,959) |
| Total Value of Derivatives | $0 | $(1,959) |
(a) Gross value is presented in the Statement of Assets and Liabilities in the written options, at value line-item.
See accompanying notes which are an integral part of the financial statements.
Financial Statements
Statement of Assets and Liabilities
| Amounts in thousands (except per-share amounts) | November 30, 2015 | |
| Assets | ||
| Investment in securities, at value (including securities loaned of $23,187) — See accompanying schedule: Unaffiliated issuers (cost $1,930,577) | $2,044,016 | |
| Fidelity Central Funds (cost $116,272) | 116,272 | |
| Total Investments (cost $2,046,849) | $2,160,288 | |
| Receivable for investments sold | 3,887 | |
| Receivable for fund shares sold | 674 | |
| Dividends receivable | 7,838 | |
| Interest receivable | 85 | |
| Distributions receivable from Fidelity Central Funds | 33 | |
| Prepaid expenses | 6 | |
| Other receivables | 106 | |
| Total assets | 2,172,917 | |
| Liabilities | ||
| Payable to custodian bank | $6 | |
| Payable for investments purchased | 90 | |
| Payable for fund shares redeemed | 4,887 | |
| Accrued management fee | 808 | |
| Distribution and service plan fees payable | 652 | |
| Written options, at value (premium received $1,640) | 1,959 | |
| Other affiliated payables | 416 | |
| Other payables and accrued expenses | 150 | |
| Collateral on securities loaned, at value | 23,547 | |
| Total liabilities | 32,515 | |
| Net Assets | $2,140,402 | |
| Net Assets consist of: | ||
| Paid in capital | $1,867,306 | |
| Undistributed net investment income | 16,088 | |
| Accumulated undistributed net realized gain (loss) on investments and foreign currency transactions | 143,904 | |
| Net unrealized appreciation (depreciation) on investments and assets and liabilities in foreign currencies | 113,104 | |
| Net Assets | $2,140,402 | |
| Calculation of Maximum Offering Price | ||
| Class A: | ||
| Net Asset Value and redemption price per share ($687,822 ÷ 22,116.10 shares) | $31.10 | |
| Maximum offering price per share (100/94.25 of $31.10) | $33.00 | |
| Class T: | ||
| Net Asset Value and redemption price per share ($812,999 ÷ 25,697.37 shares) | $31.64 | |
| Maximum offering price per share (100/96.50 of $31.64) | $32.79 | |
| Class B: | ||
| Net Asset Value and offering price per share ($10,079 ÷ 321.57 shares)(a) | $31.34 | |
| Class C: | ||
| Net Asset Value and offering price per share ($187,196 ÷ 5,992.07 shares)(a) | $31.24 | |
| Class I: | ||
| Net Asset Value, offering price and redemption price per share ($428,052 ÷ 13,288.20 shares) | $32.21 | |
| Class Z: | ||
| Net Asset Value, offering price and redemption price per share ($14,254 ÷ 442.57 shares) | $32.21 |
(a) Redemption price per share is equal to net asset value less any applicable contingent deferred sales charge.
See accompanying notes which are an integral part of the financial statements.
Statement of Operations
| Amounts in thousands | Year ended November 30, 2015 | |
| Investment Income | ||
| Dividends | $86,344 | |
| Interest | 1,590 | |
| Income from Fidelity Central Funds | 306 | |
| Total income | 88,240 | |
| Expenses | ||
| Management fee | $10,432 | |
| Transfer agent fees | 4,662 | |
| Distribution and service plan fees | 8,483 | |
| Accounting and security lending fees | 702 | |
| Custodian fees and expenses | 58 | |
| Independent trustees' compensation | 10 | |
| Registration fees | 104 | |
| Audit | 70 | |
| Legal | 10 | |
| Miscellaneous | 28 | |
| Total expenses before reductions | 24,559 | |
| Expense reductions | (179) | 24,380 |
| Net investment income (loss) | 63,860 | |
| Realized and Unrealized Gain (Loss) | ||
| Net realized gain (loss) on: | ||
| Investment securities: | ||
| Unaffiliated issuers | 149,314 | |
| Foreign currency transactions | (35) | |
| Written options | 5,913 | |
| Total net realized gain (loss) | 155,192 | |
| Change in net unrealized appreciation (depreciation) on: Investment securities | (305,822) | |
| Assets and liabilities in foreign currencies | 16 | |
| Written options | 303 | |
| Total change in net unrealized appreciation (depreciation) | (305,503) | |
| Net gain (loss) | (150,311) | |
| Net increase (decrease) in net assets resulting from operations | $(86,451) |
See accompanying notes which are an integral part of the financial statements.
Statement of Changes in Net Assets
| Amounts in thousands | Year ended November 30, 2015 | Year ended November 30, 2014 |
| Increase (Decrease) in Net Assets | ||
| Operations | ||
| Net investment income (loss) | $63,860 | $60,679 |
| Net realized gain (loss) | 155,192 | 202,288 |
| Change in net unrealized appreciation (depreciation) | (305,503) | 813 |
| Net increase (decrease) in net assets resulting from operations | (86,451) | 263,780 |
| Distributions to shareholders from net investment income | (66,216) | (45,196) |
| Distributions to shareholders from net realized gain | (81,483) | (2,749) |
| Total distributions | (147,699) | (47,945) |
| Share transactions - net increase (decrease) | (126,756) | (180,981) |
| Total increase (decrease) in net assets | (360,906) | 34,854 |
| Net Assets | ||
| Beginning of period | 2,501,308 | 2,466,454 |
| End of period (including undistributed net investment income of $16,088 and undistributed net investment income of $22,526, respectively) | $2,140,402 | $2,501,308 |
See accompanying notes which are an integral part of the financial statements.
Financial Highlights — Fidelity Advisor Equity Income Fund Class A
| November 30, | |||||
| Years ended November 30, | 2015 | 2014 | 2013 | 2012 | 2011 |
| Selected Per–Share Data | |||||
| Net asset value, beginning of period | $34.44 | $31.60 | $25.55 | $22.18 | $21.07 |
| Income from Investment Operations | |||||
| Net investment income (loss)A | .92 | .84B | .60 | .61 | .42 |
| Net realized and unrealized gain (loss) | (2.15) | 2.67 | 6.06 | 3.32 | 1.11 |
| Total from investment operations | (1.23) | 3.51 | 6.66 | 3.93 | 1.53 |
| Distributions from net investment income | (.98) | (.64) | (.58) | (.56) | (.42) |
| Distributions from net realized gain | (1.14) | (.04) | (.03) | – | – |
| Total distributions | (2.11)C | (.67)D | (.61) | (.56) | (.42) |
| Net asset value, end of period | $31.10 | $34.44 | $31.60 | $25.55 | $22.18 |
| Total ReturnE,F | (3.61)% | 11.28% | 26.43% | 17.90% | 7.25% |
| Ratios to Average Net AssetsG,H | |||||
| Expenses before reductions | .95% | .96% | .98% | 1.02% | 1.03% |
| Expenses net of fee waivers, if any | .95% | .96% | .98% | 1.02% | 1.03% |
| Expenses net of all reductions | .94% | .95% | .97% | 1.01% | 1.02% |
| Net investment income (loss) | 2.85% | 2.55%B | 2.07% | 2.52% | 1.82% |
| Supplemental Data | |||||
| Net assets, end of period (in millions) | $688 | $794 | $777 | $646 | $634 |
| Portfolio turnover rateI | 53% | 33% | 34% | 49% | 89% |
A Calculated based on average shares outstanding during the period.
B Investment income per share reflects a large, non-recurring dividend which amounted to $.11 per share. Excluding this non-recurring dividend, the ratio of net investment income (loss) to average net assets would have been 2.21%.
C Total distributions of $2.11 per share is comprised of distributions from net investment income of $.975 and distributions from net realized gain of $1.136 per share.
D Total distributions of $.67 per share is comprised of distributions from net investment income of $.636 and distributions from net realized gain of $.038 per share.
E Total returns would have been lower if certain expenses had not been reduced during the applicable periods shown.
F Total returns do not include the effect of the sales charges.
G Fees and expenses of any underlying Fidelity Central Funds are not included in the Fund's expense ratio. The Fund indirectly bears its proportionate share of the expenses of any underlying Fidelity Central Funds.
H Expense ratios reflect operating expenses of the class. Expenses before reductions do not reflect amounts reimbursed by the investment adviser or reductions from brokerage service arrangements or reductions from other expense offset arrangements and do not represent the amount paid by the class during periods when reimbursements or reductions occur. Expenses net of fee waivers reflect expenses after reimbursement by the investment adviser but prior to reductions from brokerage service arrangements or other expense offset arrangements. Expenses net of all reductions represent the net expenses paid by the class.
I Amount does not include the portfolio activity of any underlying Fidelity Central Funds.
See accompanying notes which are an integral part of the financial statements.
Financial Highlights — Fidelity Advisor Equity Income Fund Class T
| November 30, | |||||
| Years ended November 30, | 2015 | 2014 | 2013 | 2012 | 2011 |
| Selected Per–Share Data | |||||
| Net asset value, beginning of period | $34.99 | $32.09 | $25.94 | $22.50 | $21.37 |
| Income from Investment Operations | |||||
| Net investment income (loss)A | .86 | .78B | .55 | .57 | .38 |
| Net realized and unrealized gain (loss) | (2.18) | 2.72 | 6.15 | 3.37 | 1.13 |
| Total from investment operations | (1.32) | 3.50 | 6.70 | 3.94 | 1.51 |
| Distributions from net investment income | (.89) | (.56) | (.52) | (.50) | (.38) |
| Distributions from net realized gain | (1.14) | (.04) | (.03) | – | – |
| Total distributions | (2.03) | (.60) | (.55) | (.50) | (.38) |
| Net asset value, end of period | $31.64 | $34.99 | $32.09 | $25.94 | $22.50 |
| Total ReturnC,D | (3.83)% | 11.04% | 26.14% | 17.70% | 7.02% |
| Ratios to Average Net AssetsE,F | |||||
| Expenses before reductions | 1.18% | 1.18% | 1.19% | 1.21% | 1.22% |
| Expenses net of fee waivers, if any | 1.18% | 1.18% | 1.19% | 1.21% | 1.22% |
| Expenses net of all reductions | 1.17% | 1.18% | 1.18% | 1.21% | 1.21% |
| Net investment income (loss) | 2.62% | 2.33%B | 1.86% | 2.32% | 1.63% |
| Supplemental Data | |||||
| Net assets, end of period (in millions) | $813 | $974 | $984 | $854 | $862 |
| Portfolio turnover rateG | 53% | 33% | 34% | 49% | 89% |
A Calculated based on average shares outstanding during the period.
B Investment income per share reflects a large, non-recurring dividend which amounted to $.11 per share. Excluding this non-recurring dividend, the ratio of net investment income (loss) to average net assets would have been 1.98%.
C Total returns would have been lower if certain expenses had not been reduced during the applicable periods shown.
D Total returns do not include the effect of the sales charges.
E Fees and expenses of any underlying Fidelity Central Funds are not included in the Fund's expense ratio. The Fund indirectly bears its proportionate share of the expenses of any underlying Fidelity Central Funds.
F Expense ratios reflect operating expenses of the class. Expenses before reductions do not reflect amounts reimbursed by the investment adviser or reductions from brokerage service arrangements or reductions from other expense offset arrangements and do not represent the amount paid by the class during periods when reimbursements or reductions occur. Expenses net of fee waivers reflect expenses after reimbursement by the investment adviser but prior to reductions from brokerage service arrangements or other expense offset arrangements. Expenses net of all reductions represent the net expenses paid by the class.
G Amount does not include the portfolio activity of any underlying Fidelity Central Funds.
See accompanying notes which are an integral part of the financial statements.
Financial Highlights — Fidelity Advisor Equity Income Fund Class B
| November 30, | |||||
| Years ended November 30, | 2015 | 2014 | 2013 | 2012 | 2011 |
| Selected Per–Share Data | |||||
| Net asset value, beginning of period | $34.65 | $31.79 | $25.69 | $22.29 | $21.16 |
| Income from Investment Operations | |||||
| Net investment income (loss)A | .66 | .57B | .36 | .42 | .24 |
| Net realized and unrealized gain (loss) | (2.17) | 2.69 | 6.10 | 3.34 | 1.12 |
| Total from investment operations | (1.51) | 3.26 | 6.46 | 3.76 | 1.36 |
| Distributions from net investment income | (.67) | (.37) | (.33) | (.36) | (.23) |
| Distributions from net realized gain | (1.14) | (.04) | (.03) | – | – |
| Total distributions | (1.80)C | (.40)D | (.36) | (.36) | (.23) |
| Net asset value, end of period | $31.34 | $34.65 | $31.79 | $25.69 | $22.29 |
| Total ReturnE,F | (4.43)% | 10.37% | 25.39% | 16.97% | 6.43% |
| Ratios to Average Net AssetsG,H | |||||
| Expenses before reductions | 1.79% | 1.79% | 1.80% | 1.80% | 1.81% |
| Expenses net of fee waivers, if any | 1.79% | 1.79% | 1.80% | 1.80% | 1.81% |
| Expenses net of all reductions | 1.79% | 1.79% | 1.79% | 1.80% | 1.80% |
| Net investment income (loss) | 2.01% | 1.71%B | 1.26% | 1.73% | 1.04% |
| Supplemental Data | |||||
| Net assets, end of period (in millions) | $10 | $19 | $27 | $31 | $42 |
| Portfolio turnover rateI | 53% | 33% | 34% | 49% | 89% |
A Calculated based on average shares outstanding during the period.
B Investment income per share reflects a large, non-recurring dividend which amounted to $.11 per share. Excluding this non-recurring dividend, the ratio of net investment income (loss) to average net assets would have been 1.37%.
C Total distributions of $1.80 per share is comprised of distributions from net investment income of $.665 and distributions from net realized gain of $1.136 per share.
D Total distributions of $.40 per share is comprised of distributions from net investment income of $.366 and distributions from net realized gain of $.038 per share.
E Total returns would have been lower if certain expenses had not been reduced during the applicable periods shown.
F Total returns do not include the effect of the contingent deferred sales charge.
G Fees and expenses of any underlying Fidelity Central Funds are not included in the Fund's expense ratio. The Fund indirectly bears its proportionate share of the expenses of any underlying Fidelity Central Funds.
H Expense ratios reflect operating expenses of the class. Expenses before reductions do not reflect amounts reimbursed by the investment adviser or reductions from brokerage service arrangements or reductions from other expense offset arrangements and do not represent the amount paid by the class during periods when reimbursements or reductions occur. Expenses net of fee waivers reflect expenses after reimbursement by the investment adviser but prior to reductions from brokerage service arrangements or other expense offset arrangements. Expenses net of all reductions represent the net expenses paid by the class.
I Amount does not include the portfolio activity of any underlying Fidelity Central Funds.
See accompanying notes which are an integral part of the financial statements.
Financial Highlights — Fidelity Advisor Equity Income Fund Class C
| November 30, | |||||
| Years ended November 30, | 2015 | 2014 | 2013 | 2012 | 2011 |
| Selected Per–Share Data | |||||
| Net asset value, beginning of period | $34.57 | $31.73 | $25.66 | $22.27 | $21.16 |
| Income from Investment Operations | |||||
| Net investment income (loss)A | .68 | .59B | .38 | .43 | .25 |
| Net realized and unrealized gain (loss) | (2.15) | 2.69 | 6.09 | 3.33 | 1.11 |
| Total from investment operations | (1.47) | 3.28 | 6.47 | 3.76 | 1.36 |
| Distributions from net investment income | (.72) | (.40) | (.37) | (.37) | (.25) |
| Distributions from net realized gain | (1.14) | (.04) | (.03) | – | – |
| Total distributions | (1.86) | (.44) | (.40) | (.37) | (.25) |
| Net asset value, end of period | $31.24 | $34.57 | $31.73 | $25.66 | $22.27 |
| Total ReturnC,D | (4.34)% | 10.44% | 25.46% | 17.03% | 6.40% |
| Ratios to Average Net AssetsE,F | |||||
| Expenses before reductions | 1.72% | 1.72% | 1.74% | 1.77% | 1.78% |
| Expenses net of fee waivers, if any | 1.71% | 1.72% | 1.74% | 1.77% | 1.78% |
| Expenses net of all reductions | 1.71% | 1.71% | 1.73% | 1.77% | 1.77% |
| Net investment income (loss) | 2.09% | 1.79%B | 1.32% | 1.76% | 1.06% |
| Supplemental Data | |||||
| Net assets, end of period (in millions) | $187 | $214 | $195 | $143 | $134 |
| Portfolio turnover rateG | 53% | 33% | 34% | 49% | 89% |
A Calculated based on average shares outstanding during the period.
B Investment income per share reflects a large, non-recurring dividend which amounted to $.11 per share. Excluding this non-recurring dividend, the ratio of net investment income (loss) to average net assets would have been 1.45%.
C Total returns would have been lower if certain expenses had not been reduced during the applicable periods shown.
D Total returns do not include the effect of the contingent deferred sales charge.
E Fees and expenses of any underlying Fidelity Central Funds are not included in the Fund's expense ratio. The Fund indirectly bears its proportionate share of the expenses of any underlying Fidelity Central Funds.
F Expense ratios reflect operating expenses of the class. Expenses before reductions do not reflect amounts reimbursed by the investment adviser or reductions from brokerage service arrangements or reductions from other expense offset arrangements and do not represent the amount paid by the class during periods when reimbursements or reductions occur. Expenses net of fee waivers reflect expenses after reimbursement by the investment adviser but prior to reductions from brokerage service arrangements or other expense offset arrangements. Expenses net of all reductions represent the net expenses paid by the class.
G Amount does not include the portfolio activity of any underlying Fidelity Central Funds.
See accompanying notes which are an integral part of the financial statements.
Financial Highlights — Fidelity Advisor Equity Income Fund Class I
| November 30, | |||||
| Years ended November 30, | 2015 | 2014 | 2013 | 2012 | 2011 |
| Selected Per–Share Data | |||||
| Net asset value, beginning of period | $35.59 | $32.62 | $26.36 | $22.86 | $21.70 |
| Income from Investment Operations | |||||
| Net investment income (loss)A | 1.04 | .95B | .70 | .70 | .50 |
| Net realized and unrealized gain (loss) | (2.23) | 2.77 | 6.24 | 3.43 | 1.14 |
| Total from investment operations | (1.19) | 3.72 | 6.94 | 4.13 | 1.64 |
| Distributions from net investment income | (1.06) | (.72) | (.65) | (.63) | (.48) |
| Distributions from net realized gain | (1.14) | (.04) | (.03) | – | – |
| Total distributions | (2.19)C | (.75)D | (.68) | (.63) | (.48) |
| Net asset value, end of period | $32.21 | $35.59 | $32.62 | $26.36 | $22.86 |
| Total ReturnE | (3.37)% | 11.59% | 26.72% | 18.27% | 7.55% |
| Ratios to Average Net AssetsF,G | |||||
| Expenses before reductions | .69% | .70% | .72% | .73% | .74% |
| Expenses net of fee waivers, if any | .69% | .70% | .72% | .73% | .74% |
| Expenses net of all reductions | .69% | .70% | .71% | .73% | .73% |
| Net investment income (loss) | 3.11% | 2.81%B | 2.34% | 2.80% | 2.10% |
| Supplemental Data | |||||
| Net assets, end of period (in millions) | $428 | $496 | $483 | $445 | $360 |
| Portfolio turnover rateH | 53% | 33% | 34% | 49% | 89% |
A Calculated based on average shares outstanding during the period.
B Investment income per share reflects a large, non-recurring dividend which amounted to $.12 per share. Excluding this non-recurring dividend, the ratio of net investment income (loss) to average net assets would have been 2.46%.
C Total distributions of $2.19 per share is comprised of distributions from net investment income of $1.058 and distributions from net realized gain of $1.136 per share.
D Total distributions of $.75 per share is comprised of distributions from net investment income of $.716 and distributions from net realized gain of $.038 per share.
E Total returns would have been lower if certain expenses had not been reduced during the applicable periods shown.
F Fees and expenses of any underlying Fidelity Central Funds are not included in the Fund's expense ratio. The Fund indirectly bears its proportionate share of the expenses of any underlying Fidelity Central Funds.
G Expense ratios reflect operating expenses of the class. Expenses before reductions do not reflect amounts reimbursed by the investment adviser or reductions from brokerage service arrangements or reductions from other expense offset arrangements and do not represent the amount paid by the class during periods when reimbursements or reductions occur. Expenses net of fee waivers reflect expenses after reimbursement by the investment adviser but prior to reductions from brokerage service arrangements or other expense offset arrangements. Expenses net of all reductions represent the net expenses paid by the class.
H Amount does not include the portfolio activity of any underlying Fidelity Central Funds.
See accompanying notes which are an integral part of the financial statements.
Financial Highlights — Fidelity Advisor Equity Income Fund Class Z
| November 30, | |||
| Years ended November 30, | 2015 | 2014 | 2013 A |
| Selected Per–Share Data | |||
| Net asset value, beginning of period | $35.59 | $32.63 | $31.44 |
| Income from Investment Operations | |||
| Net investment income (loss)B | 1.08 | 1.03C | .23 |
| Net realized and unrealized gain (loss) | (2.21) | 2.74 | 1.11 |
| Total from investment operations | (1.13) | 3.77 | 1.34 |
| Distributions from net investment income | (1.11) | (.78) | (.16) |
| Distributions from net realized gain | (1.14) | (.04) | – |
| Total distributions | (2.25) | (.81)D | (.16) |
| Net asset value, end of period | $32.21 | $35.59 | $32.63 |
| Total ReturnE,F | (3.20)% | 11.75% | 4.30% |
| Ratios to Average Net AssetsG,H | |||
| Expenses before reductions | .54% | .54% | .54%I |
| Expenses net of fee waivers, if any | .54% | .54% | .54%I |
| Expenses net of all reductions | .53% | .54% | .54%I |
| Net investment income (loss) | 3.26% | 2.97%C | 2.37%I |
| Supplemental Data | |||
| Net assets, end of period (000s omitted) | $14,254 | $4,060 | $104 |
| Portfolio turnover rateJ | 53% | 33% | 34% |
A For the period August 13, 2013 (commencement of sale of shares) to November 30, 2013.
B Calculated based on average shares outstanding during the period.
C Investment income per share reflects a large, non-recurring dividend which amounted to $.12 per share. Excluding this non-recurring dividend, the ratio of net investment income (loss) to average net assets would have been 2.62%.
D Total distributions of $.81 per share is comprised of distributions from net investment income of $.775 and distributions from net realized gain of $.038 per share.
E Total returns for periods of less than one year are not annualized.
F Total returns would have been lower if certain expenses had not been reduced during the applicable periods shown.
G Fees and expenses of any underlying Fidelity Central Funds are not included in the Fund's expense ratio. The Fund indirectly bears its proportionate share of the expenses of any underlying Fidelity Central Funds.
H Expense ratios reflect operating expenses of the class. Expenses before reductions do not reflect amounts reimbursed by the investment adviser or reductions from brokerage service arrangements or reductions from other expense offset arrangements and do not represent the amount paid by the class during periods when reimbursements or reductions occur. Expense ratios before reductions for start-up periods may not be representative of longer-term operating periods. Expenses net of fee waivers reflect expenses after reimbursement by the investment adviser but prior to reductions from brokerage service arrangements or other expense offset arrangements. Expenses net of all reductions represent the net expenses paid by the class.
I Annualized
J Amount does not include the portfolio activity of any underlying Fidelity Central Funds.
See accompanying notes which are an integral part of the financial statements.
Notes to Financial Statements
For the period ended November 30, 2015
(Amounts in thousands except percentages)
1. Organization.
Fidelity Advisor Equity Income Fund (the Fund) is a fund of Fidelity Advisor Series I (the Trust) and is authorized to issue an unlimited number of shares. The Trust is registered under the Investment Company Act of 1940, as amended (the 1940 Act), as an open-end management investment company organized as a Massachusetts business trust. The Fund offers Class A, Class T, Class C, Class I (formerly Institutional Class) and Class Z shares, each of which, along with Class B shares, has equal rights as to assets and voting privileges. Class B shares are closed to new accounts and additional purchases, except for exchanges and reinvestments. Each class has exclusive voting rights with respect to matters that affect that class. Class B shares will automatically convert to Class A shares after a holding period of seven years from the initial date of purchase.
2. Investments in Fidelity Central Funds.
The Fund invests in Fidelity Central Funds, which are open-end investment companies generally available only to other investment companies and accounts managed by the investment adviser and its affiliates. The Fund's Schedule of Investments lists each of the Fidelity Central Funds held as of period end, if any, as an investment of the Fund, but does not include the underlying holdings of each Fidelity Central Fund. As an Investing Fund, the Fund indirectly bears its proportionate share of the expenses of the underlying Fidelity Central Funds.
The Money Market Central Funds seek preservation of capital and current income and are managed by Fidelity Investments Money Management, Inc. (FIMM), an affiliate of the investment adviser. Annualized expenses of the Money Market Central Funds as of their most recent shareholder report date are less than .005%.
A complete unaudited list of holdings for each Fidelity Central Fund is available upon request or at the Securities and Exchange Commission (the SEC) website at www.sec.gov. In addition, the financial statements of the Fidelity Central Funds, which are not covered by the Fund's Report of Independent Registered Public Accounting Firm, are available on the SEC website or upon request.
3. Significant Accounting Policies.
The financial statements have been prepared in conformity with accounting principles generally accepted in the United States of America (GAAP), which require management to make certain estimates and assumptions at the date of the financial statements. Actual results could differ from those estimates. Subsequent events, if any, through the date that the financial statements were issued have been evaluated in the preparation of the financial statements. The following summarizes the significant accounting policies of the Fund:
Investment Valuation. Investments are valued as of 4:00 p.m. Eastern time on the last calendar day of the period. The Board of Trustees (the Board) has delegated the day to day responsibility for the valuation of the Fund's investments to the Fidelity Management & Research Company (FMR) Fair Value Committee (the Committee). In accordance with valuation policies and procedures approved by the Board, the Fund attempts to obtain prices from one or more third party pricing vendors or brokers to value its investments. When current market prices, quotations or currency exchange rates are not readily available or reliable, investments will be fair valued in good faith by the Committee, in accordance with procedures adopted by the Board. Factors used in determining fair value vary by investment type and may include market or investment specific events, changes in interest rates and credit quality. The frequency with which these procedures are used cannot be predicted and they may be utilized to a significant extent. The Committee oversees the Fund's valuation policies and procedures and reports to the Board on the Committee's activities and fair value determinations. The Board monitors the appropriateness of the procedures used in valuing the Fund's investments and ratifies the fair value determinations of the Committee.
The Fund categorizes the inputs to valuation techniques used to value its investments into a disclosure hierarchy consisting of three levels as shown below:
- Level 1 – quoted prices in active markets for identical investments
- Level 2 – other significant observable inputs (including quoted prices for similar investments, interest rates, prepayment speeds, etc.)
- Level 3 – unobservable inputs (including the Fund's own assumptions based on the best information available)
Valuation techniques used to value the Fund's investments by major category are as follows:
Equity securities, including restricted securities, for which market quotations are readily available, are valued at the last reported sale price or official closing price as reported by a third party pricing vendor on the primary market or exchange on which they are traded and are categorized as Level 1 in the hierarchy. In the event there were no sales during the day or closing prices are not available, securities are valued at the last quoted bid price or may be valued using the last available price and are generally categorized as Level 2 in the hierarchy. For foreign equity securities, when market or security specific events arise, comparisons to the valuation of American Depositary Receipts (ADRs), futures contracts, Exchange-Traded Funds (ETFs) and certain indexes as well as quoted prices for similar securities may be used and would be categorized as Level 2 in the hierarchy. Utilizing these techniques may result in transfers between Level 1 and Level 2. For equity securities, including restricted securities, where observable inputs are limited, assumptions about market activity and risk are used and these securities may be categorized as Level 3 in the hierarchy.
Debt securities, including restricted securities, are valued based on evaluated prices received from third party pricing vendors or from brokers who make markets in such securities. Corporate bonds and preferred securities are valued by pricing vendors who utilize matrix pricing which considers yield or price of bonds of comparable quality, coupon, maturity and type or by broker-supplied prices. When independent prices are unavailable or unreliable, debt securities may be valued utilizing pricing methodologies which consider similar factors that would be used by third party pricing vendors. Debt securities are generally categorized as Level 2 in the hierarchy but may be Level 3 depending on the circumstances.
Exchange-traded options are valued using the last sale price or, in the absence of a sale, the last offering price and are categorized as Level 1 in the hierarchy. Investments in open-end mutual funds, including the Fidelity Central Funds, are valued at their closing net asset value (NAV) each business day and are categorized as Level 1 in the hierarchy.
Changes in valuation techniques may result in transfers in or out of an assigned level within the disclosure hierarchy. The aggregate value of investments by input level as of November 30, 2015, is included at the end of the Fund's Schedule of Investments.
Foreign Currency. The Fund may use foreign currency contracts to facilitate transactions in foreign-denominated securities. Gains and losses from these transactions may arise from changes in the value of the foreign currency or if the counterparties do not perform under the contracts' terms.
Foreign-denominated assets, including investment securities, and liabilities are translated into U.S. dollars at the exchange rates at period end. Purchases and sales of investment securities, income and dividends received and expenses denominated in foreign currencies are translated into U.S. dollars at the exchange rate in effect on the transaction date.
The effects of exchange rate fluctuations on investments are included with the net realized and unrealized gain (loss) on investment securities. Other foreign currency transactions resulting in realized and unrealized gain (loss) are disclosed separately.
Investment Transactions and Income. For financial reporting purposes, the Fund's investment holdings and NAV include trades executed through the end of the last business day of the period. The NAV per share for processing shareholder transactions is calculated as of the close of business of the New York Stock Exchange (NYSE), normally 4:00 p.m. Eastern time and includes trades executed through the end of the prior business day. Gains and losses on securities sold are determined on the basis of identified cost and may include proceeds received from litigation. Dividend income is recorded on the ex-dividend date, except for certain dividends from foreign securities where the ex-dividend date may have passed, which are recorded as soon as the Fund is informed of the ex-dividend date. Non-cash dividends included in dividend income, if any, are recorded at the fair market value of the securities received. Income and capital gain distributions from Fidelity Central Funds, if any, are recorded on the ex-dividend date. Distributions received on securities that represent a return of capital or capital gain are recorded as a reduction of cost of investments and/or as a realized gain. Subsequent to ex-dividend date the Fund determines the components of these distributions, based upon receipt of tax filings or other correspondence relating to the underlying investment. Interest income is accrued as earned and includes coupon interest and amortization of premium and accretion of discount on debt securities as applicable. Investment income is recorded net of foreign taxes withheld where recovery of such taxes is uncertain. Debt obligations may be placed on non-accrual status and related interest income may be reduced by ceasing current accruals and writing off interest receivables when the collection of all or a portion of interest has become doubtful based on consistently applied procedures. A debt obligation is removed from non-accrual status when the issuer resumes interest payments or when collectability of interest is reasonably assured.
Class Allocations and Expenses. Investment income, realized and unrealized capital gains and losses, common expenses of the Fund, and certain fund-level expense reductions, if any, are allocated daily on a pro-rata basis to each class based on the relative net assets of each class to the total net assets of the Fund. Each class differs with respect to transfer agent and distribution and service plan fees incurred. Certain expense reductions may also differ by class. For the reporting period, the allocated portion of income and expenses to each class as a percent of its average net assets may vary due to the timing of recording these transactions in relation to fluctuating net assets of the classes. Expenses directly attributable to a fund are charged to that fund. Expenses attributable to more than one fund are allocated among the respective funds on the basis of relative net assets or other appropriate methods. Expense estimates are accrued in the period to which they relate and adjustments are made when actual amounts are known.
Deferred Trustee Compensation. Under a Deferred Compensation Plan (the Plan), independent Trustees may elect to defer receipt of a portion of their annual compensation. Deferred amounts are invested in a cross-section of Fidelity funds, are marked-to-market and remain in the Fund until distributed in accordance with the Plan. The investment of deferred amounts and the offsetting payable to the Trustees are included in the accompanying Statement of Assets and Liabilities.
Income Tax Information and Distributions to Shareholders. Each year, the Fund intends to qualify as a regulated investment company under Subchapter M of the Internal Revenue Code, including distributing substantially all of its taxable income and realized gains. As a result, no provision for U.S. Federal income taxes is required. As of November 30, 2015, the Fund did not have any unrecognized tax benefits in the financial statements; nor is the Fund aware of any tax positions for which it is reasonably possible that the total amounts of unrecognized tax benefits will significantly change in the next twelve months. The Fund files a U.S. federal tax return, in addition to state and local tax returns as required. The Fund's federal income tax returns are subject to examination by the Internal Revenue Service (IRS) for a period of three fiscal years after they are filed. State and local tax returns may be subject to examination for an additional fiscal year depending on the jurisdiction. Foreign taxes are provided for based on the Fund's understanding of the tax rules and rates that exist in the foreign markets in which it invests.
Distributions are declared and recorded on the ex-dividend date. Income dividends and capital gain distributions are declared separately for each class. Income and capital gain distributions are determined in accordance with income tax regulations, which may differ from GAAP. In addition, the Fund claimed a portion of the payment made to redeeming shareholders as a distribution for income tax purposes.
Capital accounts within the financial statements are adjusted for permanent book-tax differences. These adjustments have no impact on net assets or the results of operations. Capital accounts are not adjusted for temporary book-tax differences which will reverse in a subsequent period.
Book-tax differences are primarily due to foreign currency transactions, partnerships, market discount, deferred trustees compensation, contingent interest, certain conversion ratio adjustments, equity-debt classifications and losses deferred due to wash sales.
The federal tax cost of investment securities and unrealized appreciation (depreciation) as of period end were as follows:
| Gross unrealized appreciation | $301,303 |
| Gross unrealized depreciation | (187,028) |
| Net unrealized appreciation (depreciation) on securities | $114,275 |
| Tax Cost | $2,046,013 |
The tax-based components of distributable earnings as of period end were as follows:
| Undistributed ordinary income | $17,222 |
| Undistributed long-term capital gain | $142,032 |
| Net unrealized appreciation (depreciation) on securities and other investments | $113,940 |
The tax character of distributions paid was as follows:
| November 30, 2015 | November 30, 2014 | |
| Ordinary Income | $66,216 | $ 47,945 |
| Long-term Capital Gains | 81,483 | – |
| Total | $147,699 | $ 47,945 |
Restricted Securities. The Fund may invest in securities that are subject to legal or contractual restrictions on resale. These securities generally may be resold in transactions exempt from registration or to the public if the securities are registered. Disposal of these securities may involve time-consuming negotiations and expense, and prompt sale at an acceptable price may be difficult. Information regarding restricted securities is included at the end of the Fund's Schedule of Investments.
4. Derivative Instruments.
Risk Exposures and the Use of Derivative Instruments. The Fund's investment objective allows the Fund to enter into various types of derivative contracts, including options. Derivatives are investments whose value is primarily derived from underlying assets, indices or reference rates and may be transacted on an exchange or over-the-counter (OTC). Derivatives may involve a future commitment to buy or sell a specified asset based on specified terms, to exchange future cash flows at periodic intervals based on a notional principal amount, or for one party to make one or more payments upon the occurrence of specified events in exchange for periodic payments from the other party.
The Fund used derivatives to increase returns and to manage exposure to certain risks as defined below. The success of any strategy involving derivatives depends on analysis of numerous economic factors, and if the strategies for investment do not work as intended, the Fund may not achieve its objectives.
The Fund's use of derivatives increased or decreased its exposure to the following risk:
| Equity Risk | Equity risk relates to the fluctuations in the value of financial instruments as a result of changes in market prices (other than those arising from interest rate risk or foreign exchange risk), whether caused by factors specific to an individual investment, its issuer, or all factors affecting all instruments traded in a market or market segment. |
The Fund is also exposed to additional risks from investing in derivatives, such as liquidity risk and counterparty credit risk. Liquidity risk is the risk that the Fund will be unable to close out the derivative in the open market in a timely manner. Counterparty credit risk is the risk that the counterparty will not be able to fulfill its obligation to the Fund. Counterparty credit risk related to exchange-traded options may be mitigated by the protection provided by the exchange on which they trade.
Investing in derivatives may involve greater risks than investing in the underlying assets directly and, to varying degrees, may involve risk of loss in excess of any initial investment and collateral received and amounts recognized in the Statement of Assets and Liabilities. In addition, there may be the risk that the change in value of the derivative contract does not correspond to the change in value of the underlying instrument.
Options. Options give the purchaser the right, but not the obligation, to buy (call) or sell (put) an underlying security or financial instrument at an agreed exercise or strike price between or on certain dates. Options obligate the seller (writer) to buy (put) or sell (call) an underlying instrument at the exercise or strike price or cash settle an underlying derivative instrument if the holder exercises the option on or before the expiration date.
The Fund (the Fund) used exchange-traded written covered call options to manage its exposure to the market. When the Fund writes a covered call option, the Fund holds the underlying instrument which must be delivered to the holder upon the exercise of the option.
Upon entering into a written options contract, the Fund will receive a premium. Premiums received are reflected as a liability on the Statement of Assets and Liabilities. Options are valued daily and any unrealized appreciation (depreciation) is reflected on the Statement of Assets and Liabilities. When a written option is exercised, the premium is added to the proceeds from the sale of the underlying instrument in determining the gain or loss realized on that investment. When an option is closed the Fund will realize a gain or loss depending on whether the proceeds or amount paid for the closing sale transaction are greater or less than the premium received. When an option expires, gains and losses are realized to the extent of premiums received. The net realized gain (loss) on closed and expired written options and the change in net unrealized appreciation (depreciation) on written options are reflected separately on the Statement of Operations.
Writing call options tends to decrease exposure to the underlying instrument and risk of loss is the change in value in excess of the premium received.
Any open options at period end are presented in the Schedule of Investments under the caption "Written Options" and are representative of volume of activity during the period.
During the period, the Fund recognized net realized gain (loss) of $5,913 and a change in net unrealized appreciation (depreciation) of $302 related to its investment in written options. This amount is included in the Statement of Operations.
The following is a summary of the Fund's written options activity:
Written Options
| Number of Contracts | Amount of Premiums | |
| Outstanding at beginning of period | 10 | $912 |
| Options Opened | 119 | 10,886 |
| Options Exercised | (37) | (3,340) |
| Options Closed | (36) | (3,531) |
| Options Expired | (36) | (3,287) |
| Outstanding at end of period | 20 | $1,640 |
5. Purchases and Sales of Investments.
Purchases and sales of securities, other than short-term securities, aggregated $1,190,348 and $1,300,637, respectively.
6. Fees and Other Transactions with Affiliates.
Management Fee. Fidelity Management & Research Company (the investment adviser) and its affiliates provide the Fund with investment management related services for which the Fund pays a monthly management fee. The management fee is the sum of an individual fund fee rate that is based on an annual rate of .20% of the Fund's average net assets and an annualized group fee rate that averaged .25% during the period. The group fee rate is based upon the average net assets of all the mutual funds advised by the investment adviser, including any mutual funds previously advised by the investment adviser that are currently advised by Fidelity SelectCo, LLC, an affiliate of the investment adviser. The group fee rate decreases as assets under management increase and increases as assets under management decrease. For the reporting period, the total annual management fee rate was .45% of the Fund's average net assets.
Distribution and Service Plan Fees. In accordance with Rule 12b-1 of the 1940 Act, the Fund has adopted separate Distribution and Service Plans for each class of shares. Certain classes pay Fidelity Distributors Corporation (FDC), an affiliate of the investment adviser, separate Distribution and Service Fees, each of which is based on an annual percentage of each class' average net assets. In addition, FDC may pay financial intermediaries for selling shares of the Fund and providing shareholder support services. For the period, the Distribution and Service Fee rates, total fees and amounts retained by FDC were as follows:
| Distribution Fee | Service Fee | Total Fees | Retained by FDC | |
| Class A | -% | .25% | $1,861 | $12 |
| Class T | .25% | .25% | 4,477 | 7 |
| Class B | .75% | .25% | 143 | 107 |
| Class C | .75% | .25% | 2,002 | 149 |
| $8,483 | $275 |
Sales Load. FDC may receive a front-end sales charge of up to 5.75% for selling Class A shares and 3.50% for selling Class T shares, some of which is paid to financial intermediaries for selling shares of the Fund. Depending on the holding period, FDC may receive contingent deferred sales charges levied on Class A, Class T, Class B, and Class C redemptions. The deferred sales charges range from 5.00% to 1.00% for Class B shares, 1.00% for Class C shares, 1.00% for certain purchases of Class A shares and .25% for certain purchases of Class T shares.
For the period, sales charge amounts retained by FDC were as follows:
| Retained by FDC | |
| Class A | $123 |
| Class T | 34 |
| Class B(a) | 4 |
| Class C(a) | 14 |
| $175 |
(a) When Class B and Class C shares are initially sold, FDC pays commissions from its own resources to financial intermediaries through which the sales are made.
Transfer Agent Fees. Fidelity Investments Institutional Operations Company, Inc., (FIIOC), an affiliate of the investment adviser, is the transfer, dividend disbursing and shareholder servicing agent for each class of the Fund. FIIOC receives account fees and asset-based fees that vary according to the account size and type of account of the shareholders of the respective classes of the Fund, except for Class Z. FIIOC receives an asset-based fee of Class Z's average net assets. FIIOC pays for typesetting, printing and mailing of shareholder reports, except proxy statements.
For the period, transfer agent fees for each class were as follows:
| Amount | % of Class-Level Average Net Assets | |
| Class A | $1,555 | .21 |
| Class T | 1,678 | .19 |
| Class B | 43 | .30 |
| Class C | 452 | .23 |
| Class I | 928 | .20 |
| Class Z | 6 | .05 |
| $4,662 |
Accounting and Security Lending Fees. Fidelity Service Company, Inc. (FSC), an affiliate of the investment adviser, maintains the Fund's accounting records. The accounting fee is based on the level of average net assets for each month. Under a separate contract, FSC administers the security lending program. The security lending fee is based on the number and duration of lending transactions.
Brokerage Commissions. The Fund placed a portion of its portfolio transactions with brokerage firms which are affiliates of the investment adviser. Brokerage commissions are included in net realized gain (loss) and change in net unrealized appreciation (depreciation) in the Statement of Operations. The commissions paid to these affiliated firms were $12 for the period.
7. Committed Line of Credit.
The Fund participates with other funds managed by the investment adviser or an affiliate in a $4.25 billion credit facility (the "line of credit") to be utilized for temporary or emergency purposes to fund shareholder redemptions or for other short-term liquidity purposes. The Fund has agreed to pay commitment fees on its pro-rata portion of the line of credit, which amounted to $3 and is reflected in Miscellaneous expenses on the Statement of Operations. During the period, the Fund did not borrow on this line of credit.
8. Security Lending.
The Fund lends portfolio securities through a lending agent from time to time in order to earn additional income. For equity securities, a lending agent is used and may loan securities to certain qualified borrowers, including Fidelity Capital Markets (FCM), a broker-dealer affiliated with the Fund. On the settlement date of the loan, the Fund receives collateral (in the form of U.S. Treasury obligations, letters of credit and/or cash) against the loaned securities and maintains collateral in an amount not less than 100% of the market value of the loaned securities during the period of the loan. The market value of the loaned securities is determined at the close of business of the Fund and any additional required collateral is delivered to the Fund on the next business day. The Fund or borrower may terminate the loan at any time, and if the borrower defaults on its obligation to return the securities loaned because of insolvency or other reasons, the Fund may apply collateral received from the borrower against the obligation. The Fund may experience delays and costs in recovering the securities loaned. Any cash collateral received is invested in the Fidelity Securities Lending Cash Central Fund. The value of loaned securities and cash collateral at period end are disclosed on the Fund's Statement of Assets and Liabilities. At period end, there were no security loans outstanding with FCM. Security lending income represents the income earned on investing cash collateral, less rebates paid to borrowers and any lending agent fees associated with the loan, plus any premium payments received for lending certain types of securities. Security lending income is presented in the Statement of Operations as a component of income from Fidelity Central Funds. Total security lending income during the period amounted to $180, including $1 from securities loaned to FCM.
9. Expense Reductions.
Commissions paid to certain brokers with whom the investment adviser, or its affiliates, places trades on behalf of the Fund include an amount in addition to trade execution, which may be rebated back to the Fund to offset certain expenses. This amount totaled $116 for the period.
In addition, during the period the investment adviser reimbursed and/or waived a portion of fund-level operating expenses in the amount of $9 and a portion of class-level operating expenses as follows:
| Amount | |
| Class A | $18 |
| Class T | 22 |
| Class B | -* |
| Class C | 5 |
| Class I | 9 |
| $54 |
* In the Amount of less than five hundred dollars.
10. Distributions to Shareholders.
Distributions to shareholders of each class were as follows:
| Years ended November 30, | 2015 | 2014 |
| From net investment income | ||
| Class A | $22,360 | $15,398 |
| Class T | 24,297 | 16,652 |
| Class B | 312 | 284 |
| Class C | 4,432 | 2,480 |
| Class I | 14,486 | 10,355 |
| Class Z | 329 | 27 |
| Total | $66,216 | $45,196 |
| From net realized gain | ||
| Class A | $26,221 | $885 |
| Class T | 31,523 | 1,072 |
| Class B | 619 | 22 |
| Class C | 7,102 | 235 |
| Class I | 15,863 | 531 |
| Class Z | 155 | 4 |
| Total | $81,483 | $2,749 |
11. Share Transactions.
Share transactions for each class were as follows and may contain automatic conversions between classes or exchanges between funds:
| Shares | Shares | Dollars | Dollars | |
| Years ended November 30, | 2015 | 2014 | 2015 | 2014 |
| Class A | ||||
| Shares sold | 2,362 | 2,874 | $75,894 | $94,044 |
| Reinvestment of distributions | 1,433 | 468 | 45,794 | 15,075 |
| Shares redeemed | (4,745) | (4,883) | (152,883) | (160,473) |
| Net increase (decrease) | (950) | (1,541) | $(31,195) | $(51,354) |
| Class T | ||||
| Shares sold | 2,316 | 2,961 | $76,171 | $98,369 |
| Reinvestment of distributions | 1,671 | 523 | 54,352 | 17,076 |
| Shares redeemed | (6,115) | (6,341) | (200,386) | (211,072) |
| Net increase (decrease) | (2,128) | (2,857) | $(69,863) | $(95,627) |
| Class B | ||||
| Shares sold | 9 | 28 | $284 | $933 |
| Reinvestment of distributions | 26 | 9 | 855 | 278 |
| Shares redeemed | (270) | (335) | (8,810) | (11,003) |
| Net increase (decrease) | (235) | (298) | $(7,671) | $(9,792) |
| Class C | ||||
| Shares sold | 655 | 952 | $21,329 | $31,255 |
| Reinvestment of distributions | 323 | 74 | 10,405 | 2,385 |
| Shares redeemed | (1,186) | (962) | (38,343) | (31,695) |
| Net increase (decrease) | (208) | 64 | $(6,609) | $1,945 |
| Class I | ||||
| Shares sold | 1,946 | 2,911 | $64,288 | $97,428 |
| Reinvestment of distributions | 888 | 313 | 29,367 | 10,419 |
| Shares redeemed | (3,471) | (4,089) | (116,106) | (137,936) |
| Net increase (decrease) | (637) | (865) | $(22,451) | $(30,089) |
| Class Z | ||||
| Shares sold | 374 | 113 | $12,522 | $4,010 |
| Reinvestment of distributions | 15 | 1 | 484 | 31 |
| Shares redeemed | (60) | (3) | (1,973) | (105) |
| Net increase (decrease) | 329 | 111 | $11,033 | $3,936 |
12. Other.
The Fund's organizational documents provide former and current trustees and officers with a limited indemnification against liabilities arising in connection with the performance of their duties to the Fund. In the normal course of business, the Fund may also enter into contracts that provide general indemnifications. The Fund's maximum exposure under these arrangements is unknown as this would be dependent on future claims that may be made against the Fund. The risk of material loss from such claims is considered remote.
Report of Independent Registered Public Accounting Firm
To the Trustees of Fidelity Advisor Series I and Shareholders of Fidelity Advisor® Equity Income Fund:
We have audited the accompanying statement of assets and liabilities of Fidelity Advisor® Equity Income Fund (the Fund), a fund of Fidelity Advisor Series I, including the schedule of investments, as of November 30, 2015, and the related statement of operations for the year then ended, the statement of changes in net assets for each of the two years in the period then ended, and the financial highlights for each of the five years in the period then ended. These financial statements and financial highlights are the responsibility of the Fund's management. Our responsibility is to express an opinion on these financial statements and financial highlights based on our audits.
We conducted our audits in accordance with the standards of the Public Company Accounting Oversight Board (United States). Those standards require that we plan and perform the audit to obtain reasonable assurance about whether the financial statements and financial highlights are free of material misstatement. The Fund is not required to have, nor were we engaged to perform, an audit of its internal control over financial reporting. Our audits included consideration of internal control over financial reporting as a basis for designing audit procedures that are appropriate in the circumstances, but not for the purpose of expressing an opinion on the effectiveness of the Fund's internal control over financial reporting. Accordingly, we express no such opinion. An audit also includes examining, on a test basis, evidence supporting the amounts and disclosures in the financial statements, assessing the accounting principles used and significant estimates made by management, as well as evaluating the overall financial statement presentation. Our procedures included confirmation of securities owned as of November 30, 2015, by correspondence with the custodians and brokers; when replies were not received from brokers, we performed other auditing procedures. We believe that our audits provide a reasonable basis for our opinion.
In our opinion, such financial statements and financial highlights referred to above present fairly, in all material respects, the financial position of Fidelity Advisor® Equity Income Fund as of November 30, 2015, the results of its operations for the year then ended, the changes in its net assets for each of the two years in the period then ended, and the financial highlights for each of the five years in the period then ended, in conformity with accounting principles generally accepted in the United States of America.
DELOITTE & TOUCHE LLP
Boston, Massachusetts
January 20, 2016
Trustees and Officers
The Trustees, Members of the Advisory Board (if any), and officers of the trust and fund, as applicable, are listed below. The Board of Trustees governs the fund and is responsible for protecting the interests of shareholders. The Trustees are experienced executives who meet periodically throughout the year to oversee the fund's activities, review contractual arrangements with companies that provide services to the fund, oversee management of the risks associated with such activities and contractual arrangements, and review the fund's performance. Each of the Trustees oversees 170 funds.
The Trustees hold office without limit in time except that (a) any Trustee may resign; (b) any Trustee may be removed by written instrument, signed by at least two-thirds of the number of Trustees prior to such removal; (c) any Trustee who requests to be retired or who has become incapacitated by illness or injury may be retired by written instrument signed by a majority of the other Trustees; and (d) any Trustee may be removed at any special meeting of shareholders by a two-thirds vote of the outstanding voting securities of the trust. Each Trustee who is not an interested person (as defined in the 1940 Act) of the trust and the fund is referred to herein as an Independent Trustee. Each Independent Trustee shall retire not later than the last day of the calendar year in which his or her 75th birthday occurs. The Independent Trustees may waive this mandatory retirement age policy with respect to individual Trustees. Officers and Advisory Board Members hold office without limit in time, except that any officer or Advisory Board Member may resign or may be removed by a vote of a majority of the Trustees at any regular meeting or any special meeting of the Trustees. Except as indicated, each individual has held the office shown or other offices in the same company for the past five years.
The fund’s Statement of Additional Information (SAI) includes more information about the Trustees. To request a free copy, call Fidelity at 1-877-208-0098.
Experience, Skills, Attributes, and Qualifications of the Trustees. The Governance and Nominating Committee has adopted a statement of policy that describes the experience, qualifications, attributes, and skills that are necessary and desirable for potential Independent Trustee candidates (Statement of Policy). The Board believes that each Trustee satisfied at the time he or she was initially elected or appointed a Trustee, and continues to satisfy, the standards contemplated by the Statement of Policy. The Governance and Nominating Committee also engages professional search firms to help identify potential Independent Trustee candidates who have the experience, qualifications, attributes, and skills consistent with the Statement of Policy. From time to time, additional criteria based on the composition and skills of the current Independent Trustees, as well as experience or skills that may be appropriate in light of future changes to board composition, business conditions, and regulatory or other developments, have also been considered by the professional search firms and the Governance and Nominating Committee. In addition, the Board takes into account the Trustees' commitment and participation in Board and committee meetings, as well as their leadership of standing and ad hoc committees throughout their tenure.
In determining that a particular Trustee was and continues to be qualified to serve as a Trustee, the Board has considered a variety of criteria, none of which, in isolation, was controlling. The Board believes that, collectively, the Trustees have balanced and diverse experience, qualifications, attributes, and skills, which allow the Board to operate effectively in governing the fund and protecting the interests of shareholders. Information about the specific experience, skills, attributes, and qualifications of each Trustee, which in each case led to the Board's conclusion that the Trustee should serve (or continue to serve) as a trustee of the fund, is provided below.
Board Structure and Oversight Function. James C. Curvey is an interested person and currently serves as Chairman. The Trustees have determined that an interested Chairman is appropriate and benefits shareholders because an interested Chairman has a personal and professional stake in the quality and continuity of services provided to the fund. Independent Trustees exercise their informed business judgment to appoint an individual of their choosing to serve as Chairman, regardless of whether the Trustee happens to be independent or a member of management. The Independent Trustees have determined that they can act independently and effectively without having an Independent Trustee serve as Chairman and that a key structural component for assuring that they are in a position to do so is for the Independent Trustees to constitute a substantial majority for the Board. The Independent Trustees also regularly meet in executive session. Ned C. Lautenbach serves as Chairman of the Independent Trustees and as such (i) acts as a liaison between the Independent Trustees and management with respect to matters important to the Independent Trustees and (ii) with management prepares agendas for Board meetings.
Fidelity® funds are overseen by different Boards of Trustees. The fund's Board oversees Fidelity's high income and certain equity funds, and other Boards oversee Fidelity's investment-grade bond, money market, asset allocation, and sector funds. The asset allocation funds may invest in Fidelity® funds overseen by the fund's Board. The use of separate Boards, each with its own committee structure, allows the Trustees of each group of Fidelity® funds to focus on the unique issues of the funds they oversee, including common research, investment, and operational issues. On occasion, the separate Boards establish joint committees to address issues of overlapping consequences for the Fidelity® funds overseen by each Board.
The Trustees operate using a system of committees to facilitate the timely and efficient consideration of all matters of importance to the Trustees, the fund, and fund shareholders and to facilitate compliance with legal and regulatory requirements and oversight of the fund's activities and associated risks. The Board, acting through its committees, has charged FMR and its affiliates with (i) identifying events or circumstances the occurrence of which could have demonstrably adverse effects on the fund's business and/or reputation; (ii) implementing processes and controls to lessen the possibility that such events or circumstances occur or to mitigate the effects of such events or circumstances if they do occur; and (iii) creating and maintaining a system designed to evaluate continuously business and market conditions in order to facilitate the identification and implementation processes described in (i) and (ii) above. Because the day-to-day operations and activities of the fund are carried out by or through FMR, its affiliates, and other service providers, the fund's exposure to risks is mitigated but not eliminated by the processes overseen by the Trustees. While each of the Board's committees has responsibility for overseeing different aspects of the fund's activities, oversight is exercised primarily through the Operations, Audit, and Compliance Committees. In addition, the Independent Trustees have worked with FMR to enhance the Board's oversight of investment and financial risks, legal and regulatory risks, technology risks, and operational risks, including the development of additional risk reporting to the Board. For example, a working group comprised of Independent Trustees and FMR has worked and continues to work to review the Fidelity® funds' valuation-related activities, reporting and risk management. Appropriate personnel, including but not limited to the fund's Chief Compliance Officer (CCO), FMR's internal auditor, the independent accountants, the fund's Treasurer and portfolio management personnel, make periodic reports to the Board's committees, as appropriate, including an annual review of Fidelity's risk management program for the Fidelity® funds. The responsibilities of each standing committee, including their oversight responsibilities, are described further under "Standing Committees of the Trustees."
Interested Trustees*:
Correspondence intended for a Trustee who is an interested person may be sent to Fidelity Investments, 245 Summer Street, Boston, Massachusetts 02210.
Name, Year of Birth; Principal Occupations and Other Relevant Experience+
James C. Curvey (1935)
Year of Election or Appointment: 2007
Trustee
Chairman of the Board of Trustees
Mr. Curvey also serves as Trustee of other Fidelity® funds. Mr. Curvey is a Director of Fidelity Research & Analysis Co. (investment adviser firm, 2009-present), and Vice Chairman (2007-present) and Director of FMR LLC (diversified financial services company). In addition, Mr. Curvey serves as an Overseer for the Boston Symphony Orchestra and a member of the board of Artis-Naples, Naples, Florida, and as a Trustee for Brewster Academy, Wolfeboro, New Hampshire. Previously, Mr. Curvey served as a Director of Fidelity Investments Money Management, Inc. (investment adviser firm, 2009-2014) and a Director of FMR and FMR Co., Inc. (investment adviser firms, 2007-2014).
Charles S. Morrison (1960)
Year of Election or Appointment: 2014
Trustee
Mr. Morrison also serves as Trustee of other funds. He serves as a Director of Fidelity Investments Money Management, Inc. (FIMM) (investment adviser firm, 2014-present), Director of Fidelity SelectCo, LLC (investment adviser firm, 2014-present), President, Asset Management (2014-present), and is an employee of Fidelity Investments. Previously, Mr. Morrison served as Vice President of Fidelity's Fixed Income and Asset Allocation Funds (2012-2014), President, Fixed Income (2011-2014), Vice President of Fidelity's Money Market Funds (2005-2009), President, Money Market Group Leader of FMR (investment adviser firm, 2009), and Senior Vice President, Money Market Group of FMR (2004-2009). Mr. Morrison also served as Vice President of Fidelity's Bond Funds (2002-2005), certain Balanced Funds (2002-2005), and certain Asset Allocation Funds (2002-2007), and as Senior Vice President (2002-2005) of Fidelity's Bond Division.
* Determined to be an “Interested Trustee” by virtue of, among other things, his or her affiliation with the trust or various entities under common control with FMR.
+ The information includes the Trustee's principal occupation during the last five years and other information relating to the experience, attributes, and skills relevant to the Trustee's qualifications to serve as a Trustee, which led to the conclusion that the Trustee should serve as a Trustee for the fund.
Independent Trustees:
Correspondence intended for an Independent Trustee may be sent to Fidelity Investments, P.O. Box 55235, Boston, Massachusetts 02205-5235.
Name, Year of Birth; Principal Occupations and Other Relevant Experience+
Dennis J. Dirks (1948)
Year of Election or Appointment: 2005
Trustee
Mr. Dirks also serves as Trustee of other Fidelity® funds. Prior to his retirement in May 2003, Mr. Dirks was Chief Operating Officer and a member of the Board of The Depository Trust & Clearing Corporation (DTCC). He also served as President, Chief Operating Officer, and Board member of The Depository Trust Company (DTC) and President and Board member of the National Securities Clearing Corporation (NSCC). In addition, Mr. Dirks served as Chief Executive Officer and Board member of the Government Securities Clearing Corporation, Chief Executive Officer and Board member of the Mortgage-Backed Securities Clearing Corporation, as a Trustee and a member of the Finance Committee of Manhattan College (2005-2008), as a Trustee and a member of the Finance Committee of AHRC of Nassau County (2006-2008), and as a member of the Independent Directors Council (IDC) Governing Council (2010-2015). Mr. Dirks is a member of the Board of Directors for The Brookville Center for Children's Services, Inc. (2009-present).
Alan J. Lacy (1953)
Year of Election or Appointment: 2008
Trustee
Mr. Lacy also serves as Trustee of other Fidelity® funds. Mr. Lacy serves as a member of the Board of Directors of Dave & Buster's Entertainment, Inc. (restaurant and entertainment complexes, 2010-present) and Bristol-Myers Squibb Company (global pharmaceuticals, 2008-present). In addition, Mr. Lacy served as Senior Adviser (2007-2014) of Oak Hill Capital Partners, L.P. (private equity) and also served as Chief Executive Officer (2000-2005) and Vice Chairman (2005-2006) of Sears Holdings Corporation and Sears, Roebuck and Co. (retail). Mr. Lacy is a member of the Board of Trustees of The National Parks Conservation Association (2006-present). Previously, Mr. Lacy served as Chairman of the Board of Trustees of the National Parks Conservation Association (2008-2011) and as a member of the Board of Directors for The Western Union Company (global money transfer, 2006-2011), The Hillman Companies, Inc. (hardware wholesalers, 2010-2014), and Earth Fare, Inc. (retail grocery, 2010-2014).
Ned C. Lautenbach (1944)
Year of Election or Appointment: 2000
Trustee
Chairman of the Independent Trustees
Mr. Lautenbach also serves as Trustee of other Fidelity® funds. Mr. Lautenbach currently serves as the Lead Director of the Eaton Corporation Board of Directors (diversified industrial, 1997-present). Mr. Lautenbach is Chairman of the Board of Directors of Artis-Naples in Naples, Florida (2012-present), a member of the Council on Foreign Relations (1994-present), and a member of the Board of Governors, State University System of Florida (2013-present). Previously, Mr. Lautenbach was a Partner/Advisory Partner at Clayton, Dubilier & Rice, LLC (private equity investment, 1998-2010), as well as a Director of Sony Corporation (2006-2007).
Joseph Mauriello (1944)
Year of Election or Appointment: 2008
Trustee
Mr. Mauriello also serves as Trustee of other Fidelity® funds. Prior to his retirement in January 2006, Mr. Mauriello served in numerous senior management positions including Deputy Chairman and Chief Operating Officer (2004-2005), and Vice Chairman of Financial Services (2002-2004) of KPMG LLP US (professional services, 1965-2005). Mr. Mauriello currently serves as a member of the Board of Directors of XL Group plc. (global insurance and re-insurance, 2006-present) and the Independent Directors Council (IDC) Governing Council (2015-present). Previously, Mr. Mauriello served as a Director of the Hamilton Funds of the Bank of New York (2006-2007) and of Arcadia Resources Inc. (health care services and products, 2007-2012).
Robert W. Selander (1950)
Year of Election or Appointment: 2011
Trustee
Mr. Selander also serves as Trustee of other Fidelity® funds. Mr. Selander serves as a Director of The Western Union Company (global money transfer, 2014-present). Previously, Mr. Selander served as a Member of the Advisory Board of other Fidelity® funds (2011), and Executive Vice Chairman (2010), Chief Executive Officer (2009-2010), and President and Chief Executive Officer (1997-2009) of Mastercard, Inc.
Cornelia M. Small (1944)
Year of Election or Appointment: 2005
Trustee
Ms. Small also serves as Trustee of other Fidelity® funds. Ms. Small is a member of the Board of Directors (2009-present) and Chair of the Investment Committee (2010-present) of the Teagle Foundation. Ms. Small also serves on the Investment Committee of the Berkshire Taconic Community Foundation (2008-present). Previously, Ms. Small served as Chairperson (2002-2008) and a member of the Investment Committee and Chairperson (2008-2012) and a member of the Board of Trustees of Smith College. In addition, Ms. Small served as Chief Investment Officer, Director of Global Equity Investments, and a member of the Board of Directors of Scudder, Stevens & Clark and Scudder Kemper Investments.
William S. Stavropoulos (1939)
Year of Election or Appointment: 2002
Trustee
Vice Chairman of the Independent Trustees
Mr. Stavropoulos also serves as Trustee of other Fidelity® funds. Mr. Stavropoulos serves as President and Founder of the Michigan Baseball Foundation, the Great Lakes Loons (2007-present). Mr. Stavropoulos is Chairman Emeritus of the Board of Directors of The Dow Chemical Company, where he previously served in numerous senior management positions, including President, CEO (1995-2000; 2002-2004), Chairman of the Executive Committee (2000-2006), and as a member of the Board of Directors (1990-2006). Currently, Mr. Stavropoulos is Chairman of the Board of Directors of Univar Inc. (global distributor of commodity and specialty chemicals), a Director of Teradata Corporation (data warehousing and technology solutions), and Maersk Inc. (industrial conglomerate), and a member of the Advisory Board for Metalmark Capital LLC (private equity investment, 2005-present). Mr. Stavropoulos is an operating advisor to Clayton, Dubilier & Rice, LLC (private equity investment). In addition, Mr. Stavropoulos is a member of the University of Notre Dame Advisory Council for the College of Science, a Trustee of the Rollin L. Gerstacker Foundation, and a Director of the Naples Philharmonic Center for the Arts. Previously, Mr. Stavropoulos served as a Director of Chemical Financial Corporation (bank holding company, 1993-2012) and Tyco International, Ltd. (multinational manufacturing and services, 2007-2012).
David M. Thomas (1949)
Year of Election or Appointment: 2008
Trustee
Mr. Thomas also serves as Trustee of other Fidelity® funds. Mr. Thomas serves as Non-Executive Chairman of the Board of Directors of Fortune Brands Home and Security (home and security products, 2011-present), as a member of the Board of Directors (2004-present) and Presiding Director (2013-present) of Interpublic Group of Companies, Inc. (marketing communication), and as a member of the Board of Trustees of the University of Florida (2013-present). Previously, Mr. Thomas served as Executive Chairman (2005-2006) and Chairman and Chief Executive Officer (2000-2005) of IMS Health, Inc. (pharmaceutical and healthcare information solutions), and a Director of Fortune Brands, Inc. (consumer products, 2000-2011).
+ The information includes the Trustee's principal occupation during the last five years and other information relating to the experience, attributes, and skills relevant to the Trustee's qualifications to serve as a Trustee, which led to the conclusion that the Trustee should serve as a Trustee for the fund.
Advisory Board Members and Officers:
Correspondence intended for an officer or Peter S. Lynch may be sent to Fidelity Investments, 245 Summer Street, Boston, Massachusetts 02210. Officers appear below in alphabetical order.
Name, Year of Birth; Principal Occupation
Peter S. Lynch (1944)
Year of Election or Appointment: 2003
Member of the Advisory Board
Mr. Lynch also serves as Member of the Advisory Board of other Fidelity® funds. Mr. Lynch is Vice Chairman and a Director of FMR (investment adviser firm) and FMR Co., Inc. (investment adviser firm). In addition, Mr. Lynch serves as a Trustee of Boston College and as the Chairman of the Inner-City Scholarship Fund. Previously, Mr. Lynch served on the Special Olympics International Board of Directors (1997-2006).
Elizabeth Paige Baumann (1968)
Year of Election or Appointment: 2012
Anti-Money Laundering (AML) Officer
Ms. Baumann also serves as AML Officer of other funds. She is Chief AML Officer of FMR LLC (diversified financial services company, 2012-present) and is an employee of Fidelity Investments. Previously, Ms. Baumann served as Vice President and Deputy Anti-Money Laundering Officer (2007-2012).
Marc R. Bryant (1966)
Year of Election or Appointment: 2015
Secretary and Chief Legal Officer (CLO)
Mr. Bryant also serves as Secretary and CLO of other funds. Mr. Bryant serves as CLO, Secretary, and Senior Vice President of Fidelity Management & Research Company (investment adviser firm, 2015-present) and FMR Co., Inc. (investment adviser firm, 2015-present); Secretary of Fidelity SelectCo, LLC (investment adviser firm, 2015-present) and Fidelity Investments Money Management, Inc. (investment adviser firm, 2015-present); and CLO of Fidelity Management & Research (Hong Kong) Limited (investment adviser firm, 2015-present). He is Senior Vice President and Deputy General Counsel of FMR LLC (diversified financial services company). Previously, Mr. Bryant served as Secretary and CLO of Fidelity Rutland Square Trust II (2010-2014) and Assistant Secretary of Fidelity's Fixed Income and Asset Allocation Funds (2013-2015). Prior to joining Fidelity Investments, Mr. Bryant served as a Senior Vice President and the Head of Global Retail Legal for AllianceBernstein L.P. (2006-2010), and as the General Counsel for ProFund Advisors LLC (2001-2006).
William C. Coffey (1969)
Year of Election or Appointment: 2009
Assistant Secretary
Mr. Coffey also serves as Assistant Secretary of other funds. He is Senior Vice President and Deputy General Counsel of FMR LLC (diversified financial services company, 2010-present), and is an employee of Fidelity Investments. Previously, Mr. Coffey served as Vice President and Associate General Counsel of FMR LLC (2005-2009).
Jonathan Davis (1968)
Year of Election or Appointment: 2010
Assistant Treasurer
Mr. Davis also serves as Assistant Treasurer of other funds, and is an employee of Fidelity Investments. Previously, Mr. Davis served as Vice President and Associate General Counsel of FMR LLC (diversified financial services company, 2003-2010).
Adrien E. Deberghes (1967)
Year of Election or Appointment: 2008
Deputy Treasurer
Mr. Deberghes also serves as an officer of other funds. He is an employee of Fidelity Investments (2008-present). Prior to joining Fidelity Investments, Mr. Deberghes was Senior Vice President of Mutual Fund Administration at State Street Corporation (2007-2008), Senior Director of Mutual Fund Administration at Investors Bank & Trust (2005-2007), and Director of Finance for Dunkin' Brands (2000-2005).
Stephanie J. Dorsey (1969)
Year of Election or Appointment: 2010
Assistant Treasurer
Ms. Dorsey also serves as an officer of other funds. She is an employee of Fidelity Investments (2008-present) and has served in other fund officer roles. Prior to joining Fidelity Investments, Ms. Dorsey served as Treasurer (2004-2008) of the JPMorgan Mutual Funds and Vice President (2004-2008) of JPMorgan Chase Bank.
Howard J. Galligan III (1966)
Year of Election or Appointment: 2014
Chief Financial Officer
Mr. Galligan also serves as Chief Financial Officer of other funds. Mr. Galligan serves as President of Fidelity Pricing and Cash Management Services (FPCMS) (2014-present) and as a Director of Strategic Advisers, Inc. (investment adviser firm, 2008-present). Previously, Mr. Galligan served as Chief Administrative Officer of Asset Management (2011-2014) and Chief Operating Officer and Senior Vice President of Investment Support for Strategic Advisers, Inc. (2003-2011).
Scott C. Goebel (1968)
Year of Election or Appointment: 2015
Vice President
Mr. Goebel serves as Vice President of other funds and is an employee of Fidelity Investments (2001-present). Previously, Mr. Goebel served as Secretary of Fidelity SelectCo, LLC (investment adviser firm, 2013-2015), Fidelity Investments Money Management, Inc. (FIMM) (investment adviser firm, 2010-2015), and Fidelity Research and Analysis Company (FRAC) (investment adviser firm, 2010-2015); General Counsel, Secretary, and Senior Vice President of Fidelity Management & Research Company (investment adviser firm, 2008-2015) and FMR Co., Inc. (investment adviser firm, 2008-2015); Assistant Secretary of Fidelity Management & Research (Japan) Limited (investment adviser firm, 2008-2015) and FMR Investment Management (U.K.) Limited (investment adviser firm, 2008-2015); Chief Legal Officer (CLO) of Fidelity Management & Research (Hong Kong) Limited (investment adviser firm, 2008-2015); Secretary and CLO of certain Fidelity® funds (2008-2015); Assistant Secretary of FIMM (2008-2010), FRAC (2008-2010), and certain funds (2007-2008); and as Vice President and Secretary of Fidelity Distributors Corporation (FDC) (2005-2007).
Thomas C. Hense (1964)
Year of Election or Appointment: 2008, 2010, or 2015
Vice President
Mr. Hense serves as Vice President of Fidelity Advisor® Multi-Asset Income Fund (2015) and other funds (High Income (2008), Small Cap (2008), and Value (2010) funds), and is an employee of Fidelity Investments (1993-present). Previously, Mr. Hense served as a portfolio manager for Fidelity's Institutional Money Management Group (Pyramis) (2003-2008).
Brian B. Hogan (1964)
Year of Election or Appointment: 2009
Vice President
Mr. Hogan also serves as Trustee or Vice President of other funds. Mr. Hogan serves as a Director of Fidelity SelectCo, LLC (investment adviser firm, 2014-present) and President of the Equity Division of FMR (investment adviser firm, 2009-present). Previously, Mr. Hogan served as Senior Vice President, Equity Research of FMR (2006-2009) and as a portfolio manager.
Chris Maher (1972)
Year of Election or Appointment: 2013
Assistant Treasurer
Mr. Maher serves as Assistant Treasurer of other funds. Mr. Maher is Vice President of Valuation Oversight and is an employee of Fidelity Investments. Previously, Mr. Maher served as Vice President of Asset Management Compliance (2013), Vice President of the Program Management Group of FMR (investment adviser firm, 2010-2013), and Vice President of Valuation Oversight (2008-2010).
Kenneth B. Robins (1969)
Year of Election or Appointment: 2008
President and Treasurer
Mr. Robins also serves as an officer of other funds. Mr. Robins serves as Executive Vice President of Fidelity Investments Money Management, Inc. (FIMM) (investment adviser firm, 2013-present) and is an employee of Fidelity Investments (2004-present). Previously, Mr. Robins served in other fund officer roles.
Stacie M. Smith (1974)
Year of Election or Appointment: 2013
Deputy Treasurer
Ms. Smith also serves as an officer of other funds. She is an employee of Fidelity Investments (2009-present) and has served in other fund officer roles. Prior to joining Fidelity Investments, Ms. Smith served as Senior Audit Manager of Ernst & Young LLP (1996-2009).
Renee Stagnone (1975)
Year of Election or Appointment: 2013
Deputy Treasurer
Ms. Stagnone also serves as Deputy Treasurer of other funds. Ms. Stagnone is an employee of Fidelity Investments (1997-present).
Linda J. Wondrack (1964)
Year of Election or Appointment: 2014
Chief Compliance Officer
Ms. Wondrack also serves as Chief Compliance Officer of other funds. Ms. Wondrack is Executive Vice President and head of the Ethics Office and Asset Management Compliance for Fidelity Investments (2012-present). Ms. Wondrack also serves as Chief Compliance Officer of Fidelity SelectCo, LLC (investment adviser firm, 2014-present); Chief Compliance Officer of Impresa Management LLC (2013-present); and Chief Compliance Officer of FMR Co., Inc. (investment adviser firm), Fidelity Investments Money Management, Inc. (investment adviser firm), Fidelity Management & Research (Japan) Limited (investment adviser firm), FMR Investment Management (U.K.) Limited (investment adviser firm), Fidelity Management & Research (Hong Kong) (investment adviser firm), Fidelity Management & Research Company (investment adviser firm), FIAM LLC (investment adviser firm), and Strategic Advisers, Inc. (investment adviser firm), Ballyrock Investment Advisors LLC, and Northern Neck Investors LLC (2012-present). Previously, Ms. Wondrack served as Senior Vice President and Chief Compliance Officer for Columbia Management Investment Advisers, LLC (2005-2012); Chief Compliance Officer for certain funds within the Columbia Family of Funds (2007-2012); and Senior Vice President of Compliance Risk Management at Bank of America (2005-2010).
Joseph F. Zambello (1957)
Year of Election or Appointment: 2011
Deputy Treasurer
Mr. Zambello also serves as Deputy Treasurer of other funds. Mr. Zambello is an employee of Fidelity Investments (1991-present). Previously, Mr. Zambello served as Vice President of the Program Management Group of FMR (investment adviser firm, 2009-2011) and Vice President of the Transfer Agent Oversight Group (2005-2009).
Shareholder Expense Example
As a shareholder of the Fund, you incur two types of costs: (1) transaction costs, including sales charges (loads) on purchase payments or redemption proceeds, and (2) ongoing costs, including management fees, distribution and/or service (12b-1) fees and other Fund expenses. This Example is intended to help you understand your ongoing costs (in dollars) of investing in the Fund and to compare these costs with the ongoing costs of investing in other mutual funds.
The Example is based on an investment of $1,000 invested at the beginning of the period and held for the entire period (June 1, 2015 to November 30, 2015).
Actual Expenses
The first line of the accompanying table for each class of the Fund provides information about actual account values and actual expenses. You may use the information in this line, together with the amount you invested, to estimate the expenses that you paid over the period. Simply divide your account value by $1,000.00 (for example, an $8,600 account value divided by $1,000.00 = 8.6), then multiply the result by the number in the first line for a class of the Fund under the heading entitled "Expenses Paid During Period" to estimate the expenses you paid on your account during this period. In addition, the Fund, as a shareholder in the underlying Fidelity Central Funds, will indirectly bear its pro-rata share of the fees and expenses incurred by the underlying Fidelity Central Funds. These fees and expenses are not included in the Fund's annualized expense ratio used to calculate the expense estimate in the table below.
Hypothetical Example for Comparison Purposes
The second line of the accompanying table for each class of the Fund provides information about hypothetical account values and hypothetical expenses based on a Class' actual expense ratio and an assumed rate of return of 5% per year before expenses, which is not the Class' actual return. The hypothetical account values and expenses may not be used to estimate the actual ending account balance or expenses you paid for the period. You may use this information to compare the ongoing costs of investing in the Fund and other funds. To do so, compare this 5% hypothetical example with the 5% hypothetical examples that appear in the shareholder reports of the other funds. In addition, the Fund, as a shareholder in the underlying Fidelity Central Funds, will indirectly bear its pro-rata share of the fees and expenses incurred by the underlying Fidelity Central Funds. These fees and expenses are not included in the Fund's annualized expense ratio used to calculate the expense estimate in the table below.
Please note that the expenses shown in the table are meant to highlight your ongoing costs only and do not reflect any transaction costs. Therefore, the second line of the table is useful in comparing ongoing costs only, and will not help you determine the relative total costs of owning different funds. In addition, if these transactional costs were included, your costs would have been higher.
| Annualized Expense Ratio-A | Beginning Account Value June 1, 2015 | Ending Account Value November 30, 2015 | Expenses Paid During Period-B June 1, 2015 to November 30, 2015 | |
| Class A | .94% | |||
| Actual | $1,000.00 | $944.20 | $4.58 | |
| Hypothetical-C | $1,000.00 | $1,020.36 | $4.76 | |
| Class T | 1.17% | |||
| Actual | $1,000.00 | $943.00 | $5.70 | |
| Hypothetical-C | $1,000.00 | $1,019.20 | $5.92 | |
| Class B | 1.78% | |||
| Actual | $1,000.00 | $939.90 | $8.66 | |
| Hypothetical-C | $1,000.00 | $1,016.14 | $9.00 | |
| Class C | 1.71% | |||
| Actual | $1,000.00 | $940.30 | $8.32 | |
| Hypothetical-C | $1,000.00 | $1,016.50 | $8.64 | |
| Class I | .68% | |||
| Actual | $1,000.00 | $945.20 | $3.32 | |
| Hypothetical-C | $1,000.00 | $1,021.66 | $3.45 | |
| Class Z | .54% | |||
| Actual | $1,000.00 | $946.30 | $2.63 | |
| Hypothetical-C | $1,000.00 | $1,022.36 | $2.74 |
A Annualized expense ratio reflects expenses net of applicable fee waivers.
B Expenses are equal to each Class' annualized expense ratio, multiplied by the average account value over the period, multiplied by 183/365 (to reflect the one-half year period).
C 5% return per year before expenses
Distributions (Unaudited)
The Board of Trustees of Fidelity Advisor Equity Income Fund voted to pay to shareholders of record at the opening of business on record date, the following distributions per share derived from capital gains realized from sales of portfolio securities, and dividends derived from net investment income:
| Pay Date | Record Date | Dividends | Capital Gains | |
| Class Z | 12/14/15 | 12/11/15 | $0.382 | $1.823 |
| Class Z | 01/19/16 | 01/15/16 | $0.000 | $0.283 |
The fund hereby designates as a capital gain dividend with respect to the taxable year ended November 30, 2015, $144,048,258, or, if subsequently determined to be different, the net capital gain of such year.
A total of 0.04% of the dividends distributed during the fiscal year was derived from interest on U.S. Government securities which is generally exempt from state income tax.
Class Z designates 73%, 100%, 100% and 100% of the dividends distributed in December 2014, April 2015, July 2015 and October 2015, respectively during the fiscal year as qualifying for the dividends-received deduction for corporate shareholders.
Class Z designates 100% of the dividends distributed during the fiscal year as amounts which may be taken into account as a dividend for purposes of the maximum rate under section 1(h) (11) of the Internal Revenue Code.
The fund will notify shareholders in January 2016 of amounts for use in preparing 2015 income tax returns.
Board Approval of Investment Advisory Contracts and Management Fees
Fidelity Advisor Equity Income Fund
Each year, the Board of Trustees, including the Independent Trustees (together, the Board), votes on the renewal of the management contract with Fidelity Management & Research Company (FMR) and the sub-advisory agreements (together, the Advisory Contracts) for the fund. The Board, assisted by the advice of fund counsel and Independent Trustees' counsel, requests and considers a broad range of information relevant to the renewal of the Advisory Contracts throughout the year.
The Board meets regularly and, at each of its meetings, covers an extensive agenda of topics and materials and considers factors that are relevant to its annual consideration of the renewal of the fund's Advisory Contracts, including the services and support provided to the fund and its shareholders. The Board has established various standing committees (Committees), each composed of and chaired by Independent Trustees with varying backgrounds, to which the Board has assigned specific subject matter responsibilities in order to enhance effective decision-making by the Board. The Board, acting directly and through its Committees, requests and receives information concerning the annual consideration of the renewal of the fund's Advisory Contracts. The Board also meets as needed to consider matters specifically related to the Board's annual consideration of the renewal of the Advisory Contracts. Members of the Board may also meet with trustees of other Fidelity funds through ad hoc joint committees to discuss certain matters relevant to all of the Fidelity funds.
At its July 2015 meeting, the Board unanimously determined to renew the fund's Advisory Contracts. In reaching its determination, the Board considered all factors it believed relevant, including (i) the nature, extent, and quality of the services to be provided to the fund and its shareholders (including the investment performance of the fund); (ii) the competitiveness of the fund's management fee and total expense ratio relative to peer funds; (iii) the total costs of the services to be provided by and the profits to be realized by Fidelity from its relationship with the fund; and (iv) the extent to which (if any) economies of scale exist and would be realized as the fund grows, and whether any economies of scale are appropriately shared with fund shareholders.
In considering whether to renew the Advisory Contracts for the fund, the Board reached a determination, with the assistance of fund counsel and Independent Trustees' counsel and through the exercise of its business judgment, that the renewal of the Advisory Contracts was in the best interests of the fund and its shareholders and that the compensation payable under the Advisory Contracts was fair and reasonable. The Board's decision to renew the Advisory Contracts was not based on any single factor, but rather was based on a comprehensive consideration of all the information provided to the Board at its meetings throughout the year. The Board, in reaching its determination to renew the Advisory Contracts, was aware that shareholders of the fund have a broad range of investment choices available to them, including a wide choice among funds offered by Fidelity's competitors, and that the fund's shareholders, who have the opportunity to review and weigh the disclosure provided by the fund in its prospectus and other public disclosures, have chosen to invest in this fund, which is part of the Fidelity family of funds.
Nature, Extent, and Quality of Services Provided. The Board considered Fidelity's staffing as it relates to the fund, including the backgrounds of investment personnel of Fidelity, and also considered the fund's investment objective, strategies, and related investment philosophy. The Independent Trustees also had discussions with senior management of Fidelity's investment operations and investment groups. The Board considered the structure of the portfolio manager compensation program and whether this structure provides appropriate incentives to act in the best interests of the fund. Additionally, the Board considered the portfolio managers' investments, if any, in the funds that they manage.Resources Dedicated to Investment Management and Support Services. The Board and the Fund Oversight and Research Committees reviewed the general qualifications and capabilities of Fidelity's investment staff, including its size, education, experience, and resources, as well as Fidelity's approach to recruiting, training, managing, and compensating investment personnel. The Board noted that Fidelity has continued to increase the resources devoted to non-U.S. offices, including expansion of Fidelity's global investment organization. The Board also noted that Fidelity's analysts have extensive resources, tools and capabilities that allow them to conduct sophisticated quantitative and fundamental analysis, as well as credit analysis of issuers, counterparties and guarantors. Further, the Board considered that Fidelity's investment professionals have sufficient access to global information and data so as to provide competitive investment results over time, and that those professionals also have access to sophisticated tools that permit them to assess portfolio construction and risk and performance attribution characteristics continuously, as well as to transmit new information and research conclusions rapidly around the world. Additionally, in its deliberations, the Board considered Fidelity's trading, risk management, and compliance capabilities and resources, which are integral parts of the investment management process.Shareholder and Administrative Services. The Board considered (i) the nature, extent, quality, and cost of advisory, administrative, and shareholder services performed by FMR, the sub-advisers (together with FMR, the Investment Advisers), and their affiliates under the Advisory Contracts and under separate agreements covering transfer agency, pricing and bookkeeping, and securities lending services for the fund; (ii) the nature and extent of the supervision of third party service providers, principally custodians and subcustodians; and (iii) the resources devoted to, and the record of compliance with, the fund's compliance policies and procedures. The Board also reviewed the allocation of fund brokerage, including allocations to brokers affiliated with the Investment Advisers, the use of brokerage commissions to pay fund expenses, and the use of "soft" commission dollars to pay for research services.The Board noted that the growth of fund assets over time across the complex allows Fidelity to reinvest in the development of services designed to enhance the value or convenience of the Fidelity funds as investment vehicles. These services include 24-hour access to account information and market information through telephone representatives and over the Internet, investor education materials and asset allocation tools, and the expanded availability of Fidelity Investor Centers.In 2014, the Board formed an ad hoc Committee on Transfer Agency Fees to review the variety of transfer agency fee structures throughout the industry and Fidelity's competitive positioning with respect to industry participants.Investment in a Large Fund Family. The Board considered the benefits to shareholders of investing in a Fidelity fund, including the benefits of investing in a fund that is part of a large family of funds offering a variety of investment disciplines and providing a large variety of mutual fund investor services. The Board noted that Fidelity had taken, or had made recommendations that resulted in the Fidelity funds taking, a number of actions over the previous year that benefited particular funds, including (i) continuing to dedicate additional resources to investment research and to the support of the senior management team that oversees asset management; (ii) continuing efforts to enhance Fidelity's global research capabilities; (iii) launching new funds and making other enhancements to meet client needs; (iv) reducing management fees and total expenses for certain index funds and diversified international funds; (v) continuing to launch dedicated lower cost underlying funds to meet portfolio construction needs related to expanding underlying fund options for Fidelity funds of funds, specifically for the Freedom Fund product lines; (vi) rationalizing product lines and gaining increased efficiencies through fund mergers; (vii) launching active fixed-income exchange-traded funds; (viii) continuing to develop, acquire and implement systems and technology to improve services to the funds and information security and to increase efficiency; (ix) implementing investment enhancements to further strengthen Fidelity's target date product line to increase investors' probability of success in achieving their goals; (x) modifying the eligibility criteria for certain share classes to accommodate roll-over assets from employer-sponsored retirement plans; (xi) launching a new Class W of the Freedom Index Funds to attract and retain Fidelity record-kept retirement plan assets; and (xii) implementing changes to Fidelity's money market product line in response to recent money market regulatory reforms.Investment Performance. The Board considered whether the fund has operated in accordance with its investment objective, as well as its record of compliance with its investment restrictions and its performance history.The Board took into account discussions with representatives of the Investment Advisers about fund investment performance that occur at Board meetings throughout the year. In this regard the Board noted that as part of regularly scheduled fund reviews and other reports to the Board on fund performance, the Board considers annualized return information for the fund, for different time periods, measured against a securities market index ("benchmark index") and a peer group of funds with similar objectives ("peer group"), if any. In its evaluation of fund investment performance, the Board gave particular attention to information indicating changes in performance of certain Fidelity funds for specific time periods and discussed with the Investment Advisers the reasons for any overperformance or underperformance.In addition to reviewing absolute and relative fund performance, the Independent Trustees periodically consider the appropriateness of fund performance metrics in evaluating the results achieved. In general, the Independent Trustees believe that fund performance should be evaluated based on net performance (after fees and expenses) of both the highest performing and lowest performing fund share classes, where applicable, compared to appropriate benchmark indices, over appropriate time periods that may include full market cycles, and compared to peer groups, as applicable, over the same periods, taking into account relevant factors including the following: general market conditions; issuer-specific information; and fund cash flows and other factors.The Independent Trustees recognize that shareholders evaluate performance on a net basis over their own holding periods, for which one-, three-, and five-year periods are often used as a proxy. For this reason, the performance information reviewed by the Board also included net cumulative calendar year total return information for the fund and an appropriate benchmark index and peer group for the most recent one-, three-, and five-year periods, as shown below. Returns are shown compared to the 25th percentile (top of box, 75% beaten) and 75th percentile (bottom of box, 25% beaten) of the peer universe.Fidelity Advisor Equity Income Fund
Fidelity Advisor Equity Income Fund
![]()
EPIZ-ANN-0116
1.9585508.102
Fidelity Advisor® Small Cap Fund Class A, Class T, Class B and Class C Annual Report November 30, 2015 |
|
Contents
Board Approval of Investment Advisory Contracts and Management Fees |
To view a fund's proxy voting guidelines and proxy voting record for the 12-month period ended June 30, visit http://www.fidelity.com/proxyvotingresults or visit the Securities and Exchange Commission's (SEC) web site at http://www.sec.gov.
You may also call 1-877-208-0098 to request a free copy of the proxy voting guidelines.
Standard & Poor's, S&P and S&P 500 are registered service marks of The McGraw-Hill Companies, Inc. and have been licensed for use by Fidelity Distributors Corporation.
Other third-party marks appearing herein are the property of their respective owners.
All other marks appearing herein are registered or unregistered trademarks or service marks of FMR LLC or an affiliated company. © 2016 FMR LLC. All rights reserved.
This report and the financial statements contained herein are submitted for the general information of the shareholders of the Fund. This report is not authorized for distribution to prospective investors in the Fund unless preceded or accompanied by an effective prospectus.
A fund files its complete schedule of portfolio holdings with the SEC for the first and third quarters of each fiscal year on Form N-Q. Forms N-Q are available on the SEC’s web site at http://www.sec.gov. A fund's Forms N-Q may be reviewed and copied at the SEC’s Public Reference Room in Washington, DC. Information regarding the operation of the SEC's Public Reference Room may be obtained by calling 1-800-SEC-0330.
For a complete list of a fund's portfolio holdings, view the most recent holdings listing, semiannual report, or annual report on Fidelity's web site at http://www.fidelity.com, http://www.advisor.fidelity.com, or http://www.401k.com, as applicable.
NOT FDIC INSURED •MAY LOSE VALUE •NO BANK GUARANTEE
Neither the Fund nor Fidelity Distributors Corporation is a bank.
Performance: The Bottom Line
Average annual total return reflects the change in the value of an investment, assuming reinvestment of distributions from dividend income and capital gains (the profits earned upon the sale of securities that have grown in value, if any) and assuming a constant rate of performance each year.
The hypothetical investment and the average annual total returns do not reflect the deduction of taxes that a shareholder would pay on fund distributions or the redemption of fund shares.
During periods of reimbursement by Fidelity, a fund’s total return will be greater than it would be had the reimbursement not occurred.
How a fund did yesterday is no guarantee of how it will do tomorrow.
Returns reflect the conversion of Class B shares to Class A shares after a maximum of seven years.
Average Annual Total Returns
| For the periods ended November 30, 2015 | Past 1 year | Past 5 years | Past 10 years |
| Class A (incl. 5.75% sales charge) | (1.82)% | 9.46% | 7.32% |
| Class T (incl. 3.50% sales charge) | 0.29% | 9.74% | 7.34% |
| Class B (incl. contingent deferred sales charge) | (1.11)% | 9.62% | 7.37% |
| Class C (incl. contingent deferred sales charge) | 2.49% | 9.94% | 7.15% |
Class B shares' contingent deferred sales charges included in the past one year, past five years and past ten years total return figures are 5%, 2% and 0%, respectively.
Class C shares' contingent deferred sales charges included in the past one year, past five years and past ten years total return figures are 1%, 0% and 0%, respectively.
$10,000 Over 10 Years
Let's say hypothetically that $10,000 was invested in Fidelity Advisor® Small Cap Fund - Class A on November 30, 2005, and the current 5.75% sales charge was paid.
The chart shows how the value of your investment would have changed, and also shows how the Russell 2000® Index performed over the same period.
| Period Ending Values | ||
| $20,261 | Fidelity Advisor® Small Cap Fund - Class A | |
| $20,242 | Russell 2000® Index | |
Management's Discussion of Fund Performance
Market Recap: U.S. stocks gained modestly for the 12 months ending November 30, 2015, despite a steep decline in August and September on concern about slowing economic growth in China. The S&P 500® index rebounded in October and gained 2.75% for the year. Stocks benefited late in the period amid waning expectations for a near-term interest-rate hike by the U.S. Federal Reserve, more economic stimulus in Europe and an interest-rate cut in China. Growth stocks in the benchmark far outpaced their value counterparts, as investors continued to seek growth in a subpar economic environment. Sector performance varied widely, with more than 26 percentage points separating the leader from the laggard. Consumer discretionary (+14%) secured the top spot, benefiting from a combination of rising personal income and still-benign inflation. Information technology (+7%) and health care (+4%) also outpaced the broad market. Conversely, the energy sector (-12%) performed worst, stymied by depressed commodity prices that also hit materials (-5%). Telecommunication services (-5%) and utilities (-4%), considered defensive sectors less sensitive to the economy, also lost ground. At period end, investors remained focused on the potential global implications of a stronger U.S. dollar and how China's transition toward a consumption-led economy may affect corporate earnings.Comments from Portfolio Manager James Harmon: For the year, a majority of the fund's share classes (excluding sales charges, if applicable) outperformed the 3.51% gain of the benchmark Russell 2000® Index. Relative to the benchmark, the fund benefited from strong security selection in the information technology, materials and consumer staples sectors. Global Payments, a provider of payment technology services, was a standout contributor. Also adding value were positions in Stamps.com, which allows businesses and consumers to print their own postage, and Zensar Technologies, an Indian IT outsourcing company. The fund's foreign holdings contributed to performance, despite the strength of the U.S. dollar. Although stock selection in health care detracted, a position in outpatient surgical center provider AmSurg was an exception. In contrast, weak stock selection in consumer discretionary nicked results, especially a position in Fossil Group, a maker of watches and other fashion accessories that was weighed down by business challenges at customer Michael Kors. Other meaningful detractors were conference call services provider West, and Genesco, a shoe and hat retailer no longer held at period end. Of the stocks mentioned, only Global Payments, Zensar and Fossil were not in the benchmark.The views expressed above reflect those of the portfolio manager(s) only through the end of the period as stated on the cover of this report and do not necessarily represent the views of Fidelity or any other person in the Fidelity organization. Any such views are subject to change at any time based upon market or other conditions and Fidelity disclaims any responsibility to update such views. These views may not be relied on as investment advice and, because investment decisions for a Fidelity fund are based on numerous factors, may not be relied on as an indication of trading intent on behalf of any Fidelity fund.
Investment Summary (Unaudited)
Top Ten Stocks as of November 30, 2015
| % of fund's net assets | % of fund's net assets 6 months ago | |
| CDW Corp. | 2.4 | 2.3 |
| Primerica, Inc. | 2.2 | 1.8 |
| Syntel, Inc. | 2.2 | 1.2 |
| West Corp. | 2.0 | 2.2 |
| Zensar Technologies Ltd. | 1.9 | 1.4 |
| The Ensign Group, Inc. | 1.9 | 1.8 |
| Global Payments, Inc. | 1.9 | 2.8 |
| CNO Financial Group, Inc. | 1.8 | 1.3 |
| United Therapeutics Corp. | 1.8 | 2.1 |
| Zebra Technologies Corp. Class A | 1.7 | 1.7 |
| 19.8 |
Top Five Market Sectors as of November 30, 2015
| % of fund's net assets | % of fund's net assets 6 months ago | |
| Information Technology | 22.4 | 21.4 |
| Financials | 21.3 | 21.0 |
| Industrials | 15.6 | 14.3 |
| Health Care | 13.1 | 14.4 |
| Consumer Discretionary | 8.9 | 14.9 |
Asset Allocation (% of fund's net assets)
| As of November 30, 2015* | ||
| Stocks, Investment Companies and Equity Futures | 98.6% | |
| Other Investments | 0.5% | |
| Short-Term Investments and Net Other Assets (Liabilities) | 0.9% | |

* Foreign investments - 15.4%
| As of May 31, 2015 * | ||
| Stocks and Equity Futures | 98.9% | |
| Other Investments | 0.4% | |
| Short-Term Investments and Net Other Assets (Liabilities) | 0.7% | |

* Foreign investments - 14.2%
Investments November 30, 2015
Showing Percentage of Net Assets
| Common Stocks - 88.7% | |||
| Shares | Value (000s) | ||
| CONSUMER DISCRETIONARY - 8.9% | |||
| Auto Components - 0.1% | |||
| Horizon Global Corp. (a) | 292,022 | $2,538 | |
| Diversified Consumer Services - 1.2% | |||
| Meiko Network Japan Co. Ltd. (b) | 1,577,900 | 17,932 | |
| Tsukada Global Holdings, Inc. (b)(c) | 2,800,000 | 18,583 | |
| 36,515 | |||
| Household Durables - 0.8% | |||
| Tupperware Brands Corp. (c) | 440,000 | 24,979 | |
| Leisure Products - 0.8% | |||
| Smith & Wesson Holding Corp. (a) | 1,265,100 | 23,202 | |
| Media - 0.2% | |||
| Crown Media Holdings, Inc. Class A (a) | 1,006,821 | 5,709 | |
| Specialty Retail - 5.3% | |||
| Aarons, Inc. Class A | 1,072,000 | 26,017 | |
| Hibbett Sports, Inc. (a)(c) | 800,000 | 26,248 | |
| Jumbo SA | 303,981 | 3,099 | |
| Office Depot, Inc. (a) | 6,514,200 | 42,929 | |
| Sally Beauty Holdings, Inc. (a) | 1,000,000 | 25,860 | |
| Select Comfort Corp. (a) | 1,400,000 | 33,068 | |
| Staples, Inc. | 200,000 | 2,414 | |
| 159,635 | |||
| Textiles, Apparel & Luxury Goods - 0.5% | |||
| Fossil Group, Inc. (a)(c) | 400,000 | 15,388 | |
| TOTAL CONSUMER DISCRETIONARY | 267,966 | ||
| CONSUMER STAPLES - 2.7% | |||
| Food & Staples Retailing - 2.7% | |||
| Ain Holdings, Inc. | 115,000 | 5,409 | |
| Sundrug Co. Ltd. | 400,000 | 25,768 | |
| Tsuruha Holdings, Inc. | 425,000 | 37,977 | |
| United Natural Foods, Inc. (a) | 300,000 | 13,173 | |
| 82,327 | |||
| ENERGY - 2.1% | |||
| Energy Equipment & Services - 0.0% | |||
| Cathedral Energy Services Ltd. (b) | 3,363,407 | 1,461 | |
| Oil, Gas & Consumable Fuels - 2.1% | |||
| Delek Logistics Partners LP | 400,000 | 14,604 | |
| World Fuel Services Corp. | 1,091,300 | 47,570 | |
| 62,174 | |||
| TOTAL ENERGY | 63,635 | ||
| FINANCIALS - 20.8% | |||
| Banks - 5.9% | |||
| Allegiance Bancshares, Inc. (a) | 119,542 | 2,925 | |
| Bank of the Ozarks, Inc. | 500,000 | 27,140 | |
| ConnectOne Bancorp, Inc. (b) | 1,550,000 | 30,241 | |
| First NBC Bank Holding Co. (a)(b) | 1,026,364 | 43,456 | |
| German American Bancorp, Inc. | 33,344 | 1,150 | |
| Investors Bancorp, Inc. | 3,316,299 | 42,515 | |
| Wilshire Bancorp, Inc. | 2,350,000 | 28,999 | |
| 176,426 | |||
| Consumer Finance - 1.9% | |||
| Credit Acceptance Corp. (a)(c) | 6,300 | 1,263 | |
| PRA Group, Inc. (a)(c) | 800,000 | 33,048 | |
| SLM Corp. (a) | 3,385,800 | 22,871 | |
| 57,182 | |||
| Insurance - 7.9% | |||
| CNO Financial Group, Inc. | 2,700,000 | 54,621 | |
| Enstar Group Ltd. (a) | 150,000 | 23,117 | |
| Hanover Insurance Group, Inc. | 226,842 | 19,191 | |
| James River Group Holdings Ltd. | 617,952 | 19,836 | |
| National Western Life Group, Inc. | 20,000 | 5,265 | |
| Primerica, Inc. | 1,307,265 | 66,984 | |
| Reinsurance Group of America, Inc. | 550,000 | 50,534 | |
| 239,548 | |||
| Real Estate Investment Trusts - 2.4% | |||
| EPR Properties | 330,000 | 18,493 | |
| MFA Financial, Inc. | 3,900,000 | 27,222 | |
| VEREIT, Inc. | 3,200,000 | 26,656 | |
| 72,371 | |||
| Real Estate Management & Development - 0.5% | |||
| Relo Holdings Corp. | 140,000 | 15,160 | |
| Thrifts & Mortgage Finance - 2.2% | |||
| BofI Holding, Inc. (a)(c) | 2,400,000 | 48,072 | |
| Meridian Bancorp, Inc. | 1,095,110 | 16,054 | |
| Oritani Financial Corp. | 200,000 | 3,468 | |
| 67,594 | |||
| TOTAL FINANCIALS | 628,281 | ||
| HEALTH CARE - 13.1% | |||
| Biotechnology - 1.8% | |||
| United Therapeutics Corp. (a) | 350,000 | 53,421 | |
| Health Care Equipment & Supplies - 0.8% | |||
| Fukuda Denshi Co. Ltd. | 125,000 | 6,651 | |
| The Cooper Companies, Inc. | 115,000 | 16,819 | |
| 23,470 | |||
| Health Care Providers & Services - 8.6% | |||
| Aceto Corp. | 1,200,000 | 33,852 | |
| AmSurg Corp. (a) | 313,000 | 26,311 | |
| Community Health Systems, Inc. (a) | 1,600,000 | 46,304 | |
| HealthSouth Corp. | 800,000 | 28,152 | |
| MEDNAX, Inc. (a) | 300,000 | 21,411 | |
| Message Co. Ltd. | 523,200 | 12,321 | |
| Providence Service Corp. (a) | 600,000 | 29,052 | |
| Ryman Healthcare Group Ltd. | 900,000 | 4,651 | |
| Sigma Pharmaceuticals Ltd. | 3,000,000 | 1,888 | |
| The Ensign Group, Inc. | 1,200,000 | 57,084 | |
| 261,026 | |||
| Life Sciences Tools & Services - 0.6% | |||
| VWR Corp. (a)(c) | 681,000 | 18,169 | |
| Pharmaceuticals - 1.3% | |||
| Jazz Pharmaceuticals PLC (a) | 150,000 | 21,989 | |
| Sawai Pharmaceutical Co. Ltd. | 300,000 | 17,206 | |
| 39,195 | |||
| TOTAL HEALTH CARE | 395,281 | ||
| INDUSTRIALS - 15.6% | |||
| Aerospace & Defense - 3.2% | |||
| BWX Technologies, Inc. | 1,050,000 | 31,973 | |
| Engility Holdings, Inc. | 600,000 | 20,760 | |
| Moog, Inc. Class A (a) | 400,000 | 26,428 | |
| Teledyne Technologies, Inc. (a) | 200,000 | 18,502 | |
| 97,663 | |||
| Commercial Services & Supplies - 5.6% | |||
| Coor Service Management Holding AB (a) | 1,535,502 | 5,986 | |
| Deluxe Corp. | 800,000 | 46,920 | |
| Mitie Group PLC | 5,600,000 | 26,913 | |
| UniFirst Corp. | 250,000 | 27,145 | |
| West Corp. | 2,400,000 | 61,200 | |
| 168,164 | |||
| Electrical Equipment - 1.2% | |||
| EnerSys | 625,550 | 36,845 | |
| Machinery - 4.1% | |||
| Federal Signal Corp. | 1,800,000 | 30,348 | |
| Hy-Lok Corp. (b) | 700,000 | 15,207 | |
| Standex International Corp. | 550,000 | 49,154 | |
| TriMas Corp. (a) | 1,350,000 | 29,201 | |
| 123,910 | |||
| Marine - 0.3% | |||
| SITC International Holdings Co. Ltd. | 19,000,000 | 9,606 | |
| Professional Services - 0.7% | |||
| Benefit One, Inc. | 1,150,000 | 21,692 | |
| Transportation Infrastructure - 0.5% | |||
| Wesco Aircraft Holdings, Inc. (a) | 1,000,000 | 13,380 | |
| TOTAL INDUSTRIALS | 471,260 | ||
| INFORMATION TECHNOLOGY - 22.4% | |||
| Electronic Equipment & Components - 7.9% | |||
| Belden, Inc. | 400,000 | 25,108 | |
| CDW Corp. | 1,700,000 | 73,385 | |
| Insight Enterprises, Inc. (a) | 1,400,000 | 37,492 | |
| SYNNEX Corp. | 530,913 | 50,049 | |
| Zebra Technologies Corp. Class A (a) | 650,000 | 52,130 | |
| 238,164 | |||
| Internet Software & Services - 1.1% | |||
| Stamps.com, Inc. (a) | 325,000 | 32,942 | |
| IT Services - 9.0% | |||
| Blackhawk Network Holdings, Inc. (a) | 900,000 | 42,615 | |
| Cardtronics, Inc. (a) | 1,000,000 | 37,610 | |
| EVERTEC, Inc. | 1,365,000 | 23,451 | |
| Global Payments, Inc. | 800,000 | 56,680 | |
| MoneyGram International, Inc. (a) | 1,838,009 | 16,138 | |
| Perficient, Inc. (a) | 800,000 | 13,984 | |
| Syntel, Inc. (a) | 1,350,000 | 65,381 | |
| WEX, Inc. (a) | 170,000 | 16,026 | |
| 271,885 | |||
| Software - 4.4% | |||
| NIIT Technologies Ltd. (b) | 3,800,000 | 32,572 | |
| Sword Group (b) | 587,339 | 14,676 | |
| Verint Systems, Inc. (a) | 620,000 | 29,047 | |
| Zensar Technologies Ltd. (b) | 3,500,000 | 57,126 | |
| 133,421 | |||
| TOTAL INFORMATION TECHNOLOGY | 676,412 | ||
| MATERIALS - 2.6% | |||
| Chemicals - 1.9% | |||
| Innospec, Inc. | 200,000 | 11,680 | |
| PolyOne Corp. | 1,300,000 | 46,774 | |
| 58,454 | |||
| Paper & Forest Products - 0.7% | |||
| Neenah Paper, Inc. | 300,000 | 19,941 | |
| TOTAL MATERIALS | 78,395 | ||
| TELECOMMUNICATION SERVICES - 0.4% | |||
| Diversified Telecommunication Services - 0.3% | |||
| APT Satellite Holdings Ltd. | 3,150,000 | 2,669 | |
| Asia Satellite Telecommunications Holdings Ltd. | 800,000 | 1,156 | |
| Vocus Communications Ltd. (c) | 784,380 | 4,101 | |
| 7,926 | |||
| Wireless Telecommunication Services - 0.1% | |||
| Cellcom Israel Ltd. (Israel) (a) | 200,000 | 1,426 | |
| Partner Communications Co. Ltd. (a) | 293,027 | 1,328 | |
| 2,754 | |||
| TOTAL TELECOMMUNICATION SERVICES | 10,680 | ||
| UTILITIES - 0.1% | |||
| Gas Utilities - 0.1% | |||
| Star Gas Partners LP | 600,000 | 4,632 | |
| TOTAL COMMON STOCKS | |||
| (Cost $2,121,588) | 2,678,869 | ||
| Investment Companies - 1.6% | |||
| iShares Russell 2000 Index ETF (c) | |||
| (Cost $48,715) | 417,100 | 49,672 | |
| Principal Amount (000s)(d) | Value (000s) | ||
| U.S. Treasury Obligations - 0.4% | |||
| U.S. Treasury Bills, yield at date of purchase 0.04% to 0.15% 1/28/16 to 2/25/16 (e) | |||
| (Cost $11,588) | 11,590 | 11,588 | |
| Preferred Securities - 0.5% | |||
| FINANCIALS - 0.5% | |||
| Diversified Financial Services - 0.5% | |||
| Baggot Securities Ltd. 10.24% (f)(g) (Cost $18,643) | $12,000 | $13,780 | |
| Shares | Value (000s) | ||
| Money Market Funds - 12.6% | |||
| Fidelity Cash Central Fund, 0.18% (h) | 278,295,789 | 278,296 | |
| Fidelity Securities Lending Cash Central Fund, 0.22% (h)(i) | 102,156,853 | 102,157 | |
| TOTAL MONEY MARKET FUNDS | |||
| (Cost $380,453) | 380,453 | ||
| TOTAL INVESTMENT PORTFOLIO - 103.8% | |||
| (Cost $2,580,987) | 3,134,362 | ||
| NET OTHER ASSETS (LIABILITIES) - (3.8)% | (115,618) | ||
| NET ASSETS - 100% | $3,018,744 |
| Futures Contracts | |||
| Expiration Date | Underlying Face Amount at Value (000s) | Unrealized Appreciation/(Depreciation) (000s) | |
| Purchased | |||
| Equity Index Contracts | |||
| 2,107 ICE Russell 2000 Index Contracts (United States) | Dec. 2015 | 251,976 | $6,815 |
The face value of futures purchased as a percentage of Net Assets is 8.3%
Currency Abbreviations
EUR – European Monetary Unit
Security Type Abbreviations
ETF – Exchange-Traded Fund
Legend
(a) Non-income producing
(b) Affiliated company
(c) Security or a portion of the security is on loan at period end.
(d) Amount is stated in United States dollars unless otherwise noted.
(e) Security or a portion of the security was pledged to cover margin requirements for futures contracts. At period end, the value of securities pledged amounted to $11,588,000.
(f) Security exempt from registration under Rule 144A of the Securities Act of 1933. These securities may be resold in transactions exempt from registration, normally to qualified institutional buyers. At the end of the period, the value of these securities amounted to $13,780,000 or 0.5% of net assets.
(g) Security is perpetual in nature with no stated maturity date.
(h) Affiliated fund that is generally available only to investment companies and other accounts managed by Fidelity Investments. The rate quoted is the annualized seven-day yield of the fund at period end. A complete unaudited listing of the fund's holdings as of its most recent quarter end is available upon request. In addition, each Fidelity Central Fund's financial statements, which are not covered by the Fund's Report of Independent Registered Public Accounting Firm, are available on the SEC's website or upon request.
(i) Investment made with cash collateral received from securities on loan.
Affiliated Central Funds
Information regarding fiscal year to date income earned by the Fund from investments in Fidelity Central Funds is as follows:
| Fund | Income earned |
| (Amounts in thousands) | |
| Fidelity Cash Central Fund | $355 |
| Fidelity Securities Lending Cash Central Fund | 292 |
| Total | $647 |
Other Affiliated Issuers
An affiliated company is a company in which the Fund has ownership of at least 5% of the voting securities. Fiscal year to date transactions with companies which are or were affiliates are as follows:
| Affiliate (Amounts in thousands) | Value, beginning of period | Purchases | Sales Proceeds | Dividend Income | Value, end of period |
| Cathedral Energy Services Ltd. | $8,984 | $376 | $-- | $453 | $1,461 |
| ConnectOne Bancorp, Inc. | -- | 30,386 | -- | 276 | 30,241 |
| First NBC Bank Holding Co. | 29,120 | 8,512 | -- | -- | 43,456 |
| Hy-Lok Corp. | 19,901 | -- | -- | 212 | 15,207 |
| Meiko Network Japan Co. Ltd. | 16,216 | -- | -- | 403 | 17,932 |
| NIIT Technologies Ltd. | 23,245 | -- | -- | 566 | 32,572 |
| Stamps.com, Inc. | 40,163 | -- | 37,361 | -- | -- |
| Sword Group | 12,905 | -- | -- | 668 | 14,676 |
| The Ensign Group, Inc. | 47,304 | -- | -- | 360 | -- |
| Tsukada Global Holdings, Inc. | 17,524 | -- | -- | 206 | 18,583 |
| Zensar Technologies Ltd. | 33,225 | -- | -- | 614 | 57,126 |
| Total | $248,587 | $39,274 | $37,361 | $3,758 | $231,254 |
Investment Valuation
The following is a summary of the inputs used, as of November 30, 2015, involving the Fund's assets and liabilities carried at fair value. The inputs or methodology used for valuing securities may not be an indication of the risk associated with investing in those securities. For more information on valuation inputs, and their aggregation into the levels used below, please refer to the Investment Valuation section in the accompanying Notes to Financial Statements.
| Valuation Inputs at Reporting Date: | ||||
| Description | Total | Level 1 | Level 2 | Level 3 |
| (Amounts in thousands) | ||||
| Investments in Securities: | ||||
| Equities: | ||||
| Consumer Discretionary | $267,966 | $267,966 | $-- | $-- |
| Consumer Staples | 82,327 | 82,327 | -- | -- |
| Energy | 63,635 | 63,635 | -- | -- |
| Financials | 628,281 | 628,281 | -- | -- |
| Health Care | 395,281 | 395,281 | -- | -- |
| Industrials | 471,260 | 471,260 | -- | -- |
| Information Technology | 676,412 | 676,412 | -- | -- |
| Materials | 78,395 | 78,395 | -- | -- |
| Telecommunication Services | 10,680 | 10,680 | -- | -- |
| Utilities | 4,632 | 4,632 | -- | -- |
| Investment Companies | 49,672 | 49,672 | -- | -- |
| U.S. Government and Government Agency Obligations | 11,588 | -- | 11,588 | -- |
| Preferred Securities | 13,780 | -- | 13,780 | -- |
| Money Market Funds | 380,453 | 380,453 | -- | -- |
| Total Investments in Securities: | $3,134,362 | $3,108,994 | $25,368 | $-- |
| Derivative Instruments: | ||||
| Assets | ||||
| Futures Contracts | $6,815 | $6,815 | $-- | $-- |
| Total Assets | $6,815 | $6,815 | $-- | $-- |
| Total Derivative Instruments: | $6,815 | $6,815 | $-- | $-- |
Value of Derivative Instruments
The following table is a summary of the Fund's value of derivative instruments by primary risk exposure as of November 30, 2015. For additional information on derivative instruments, please refer to the Derivative Instruments section in the accompanying Notes to Financial Statements.
| Primary Risk Exposure / Derivative Type | Value | |
| (Amounts in thousands) | Asset | Liability |
| Equity Risk | ||
| Futures Contracts(a) | $6,815 | $0 |
| Total Equity Risk | 6,815 | 0 |
| Total Value of Derivatives | $6,815 | $0 |
(a) Reflects gross cumulative appreciation (depreciation) on futures contracts as presented in the Schedule of Investments. Only the period end receivable or payable for daily variation margin and net unrealized appreciation (depreciation) are presented in the Statement of Assets and Liabilities.
Other Information
Distribution of investments by country or territory of incorporation, as a percentage of Total Net Assets, is as follows (Unaudited):
| United States of America | 84.6% |
| Japan | 5.9% |
| India | 3.0% |
| Bermuda | 1.6% |
| Ireland | 1.2% |
| Others (Individually Less Than 1%) | 3.7% |
| 100.0% |
See accompanying notes which are an integral part of the financial statements.
Financial Statements
Statement of Assets and Liabilities
| Amounts in thousands (except per-share amounts) | November 30, 2015 | |
| Assets | ||
| Investment in securities, at value (including securities loaned of $99,108) — See accompanying schedule: Unaffiliated issuers (cost $2,019,444) | $2,522,655 | |
| Fidelity Central Funds (cost $380,453) | 380,453 | |
| Other affiliated issuers (cost $181,090) | 231,254 | |
| Total Investments (cost $2,580,987) | $3,134,362 | |
| Receivable for investments sold | 9,564 | |
| Receivable for fund shares sold | 2,093 | |
| Dividends receivable | 1,785 | |
| Distributions receivable from Fidelity Central Funds | 86 | |
| Prepaid expenses | 7 | |
| Other receivables | 3 | |
| Total assets | 3,147,900 | |
| Liabilities | ||
| Payable to custodian bank | $2,317 | |
| Payable for investments purchased | 14,906 | |
| Payable for fund shares redeemed | 5,140 | |
| Accrued management fee | 2,123 | |
| Distribution and service plan fees payable | 866 | |
| Payable for daily variation margin for derivative instruments | 1,010 | |
| Other affiliated payables | 575 | |
| Other payables and accrued expenses | 62 | |
| Collateral on securities loaned, at value | 102,157 | |
| Total liabilities | 129,156 | |
| Net Assets | $3,018,744 | |
| Net Assets consist of: | ||
| Paid in capital | $2,219,498 | |
| Accumulated net investment loss | (3,498) | |
| Accumulated undistributed net realized gain (loss) on investments and foreign currency transactions | 242,608 | |
| Net unrealized appreciation (depreciation) on investments and assets and liabilities in foreign currencies | 560,136 | |
| Net Assets | $3,018,744 | |
| Calculation of Maximum Offering Price | ||
| Class A: | ||
| Net Asset Value and redemption price per share ($1,046,645 ÷ 37,972.4 shares) | $27.56 | |
| Maximum offering price per share (100/94.25 of $27.56) | $29.24 | |
| Class T: | ||
| Net Asset Value and redemption price per share ($888,348 ÷ 34,177.5 shares) | $25.99 | |
| Maximum offering price per share (100/96.50 of $25.99) | $26.93 | |
| Class B: | ||
| Net Asset Value and offering price per share ($21,075 ÷ 955.9 shares)(a) | $22.05 | |
| Class C: | ||
| Net Asset Value and offering price per share ($317,907 ÷ 14,168.4 shares)(a) | $22.44 | |
| Class I: | ||
| Net Asset Value, offering price and redemption price per share ($703,678 ÷ 23,780.2 shares) | $29.59 | |
| Class Z: | ||
| Net Asset Value, offering price and redemption price per share ($41,091 ÷ 1,391.4 shares) | $29.53 |
(a) Redemption price per share is equal to net asset value less any applicable contingent deferred sales charge.
See accompanying notes which are an integral part of the financial statements.
Statement of Operations
| Amounts in thousands | Year ended November 30, 2015 | |
| Investment Income | ||
| Dividends (including $3,758 earned from other affiliated issuers) | $32,816 | |
| Special dividends | 6,860 | |
| Interest | 163 | |
| Income from Fidelity Central Funds | 647 | |
| Total income | 40,486 | |
| Expenses | ||
| Management fee | ||
| Basic fee | $21,376 | |
| Performance adjustment | 1,695 | |
| Transfer agent fees | 6,233 | |
| Distribution and service plan fees | 10,852 | |
| Accounting and security lending fees | 911 | |
| Custodian fees and expenses | 119 | |
| Independent trustees' compensation | 13 | |
| Registration fees | 138 | |
| Audit | 62 | |
| Legal | 10 | |
| Miscellaneous | 18 | |
| Total expenses before reductions | 41,427 | |
| Expense reductions | (157) | 41,270 |
| Net investment income (loss) | (784) | |
| Realized and Unrealized Gain (Loss) | ||
| Net realized gain (loss) on: | ||
| Investment securities: | ||
| Unaffiliated issuers | 256,467 | |
| Other affiliated issuers | 25,828 | |
| Foreign currency transactions | (386) | |
| Futures contracts | (9,056) | |
| Total net realized gain (loss) | 272,853 | |
| Change in net unrealized appreciation (depreciation) on: Investment securities | (159,608) | |
| Assets and liabilities in foreign currencies | 74 | |
| Futures contracts | 6,738 | |
| Total change in net unrealized appreciation (depreciation) | (152,796) | |
| Net gain (loss) | 120,057 | |
| Net increase (decrease) in net assets resulting from operations | $119,273 |
See accompanying notes which are an integral part of the financial statements.
Statement of Changes in Net Assets
| Amounts in thousands | Year ended November 30, 2015 | Year ended November 30, 2014 |
| Increase (Decrease) in Net Assets | ||
| Operations | ||
| Net investment income (loss) | $(784) | $1,228 |
| Net realized gain (loss) | 272,853 | 448,042 |
| Change in net unrealized appreciation (depreciation) | (152,796) | (182,506) |
| Net increase (decrease) in net assets resulting from operations | 119,273 | 266,764 |
| Distributions to shareholders from net investment income | (1,701) | (1,611) |
| Distributions to shareholders from net realized gain | (353,938) | (400,188) |
| Total distributions | (355,639) | (401,799) |
| Share transactions - net increase (decrease) | 204,314 | (287,435) |
| Total increase (decrease) in net assets | (32,052) | (422,470) |
| Net Assets | ||
| Beginning of period | 3,050,796 | 3,473,266 |
| End of period (including accumulated net investment loss of $3,498 and $0, respectively) | $3,018,744 | $3,050,796 |
See accompanying notes which are an integral part of the financial statements.
Financial Highlights — Fidelity Advisor Small Cap Fund Class A
| Years ended November 30, | 2015 | 2014 | 2013 | 2012 | 2011 |
| Selected Per–Share Data | |||||
| Net asset value, beginning of period | $29.85 | $30.96 | $22.45 | $23.60 | $24.35 |
| Income from Investment Operations | |||||
| Net investment income (loss)A | .02B | .04 | .12C | (.03) | (.09)D |
| Net realized and unrealized gain (loss) | 1.10 | 2.36 | 8.45 | .79 | .67 |
| Total from investment operations | 1.12 | 2.40 | 8.57 | .76 | .58 |
| Distributions from net investment income | – | (.01) | (.05) | – | – |
| Distributions from net realized gain | (3.41) | (3.50) | (.01) | (1.91) | (1.33) |
| Total distributions | (3.41) | (3.51) | (.06) | (1.91) | (1.33) |
| Net asset value, end of period | $27.56 | $29.85 | $30.96 | $22.45 | $23.60 |
| Total ReturnE,F | 4.17% | 9.06% | 38.30% | 3.87% | 2.17% |
| Ratios to Average Net AssetsG,H | |||||
| Expenses before reductions | 1.26% | .98% | 1.01% | 1.06% | 1.31% |
| Expenses net of fee waivers, if any | 1.26% | .98% | 1.01% | 1.06% | 1.31% |
| Expenses net of all reductions | 1.25% | .97% | 1.00% | 1.06% | 1.31% |
| Net investment income (loss) | .07%B | .14% | .46%C | (.13)% | (.35)%D |
| Supplemental Data | |||||
| Net assets, end of period (in millions) | $1,047 | $1,097 | $1,263 | $1,212 | $1,461 |
| Portfolio turnover rateI | 33% | 39% | 34% | 69% | 38% |
A Calculated based on average shares outstanding during the period.
B Investment income per share reflects a large, non-recurring dividend which amounted to $.06 per share. Excluding this non-recurring dividend, the ratio of net investment income (loss) to average net assets would have been (.16) %.
C Investment income per share reflects a large, non-recurring dividend which amounted to $.04 per share. Excluding this non-recurring dividend, the ratio of net investment income (loss) to average net assets would have been .29%.
D Investment income per share reflects a large, non-recurring dividend which amounted to $.04 per share. Excluding this non-recurring dividend, the ratio of net investment income (loss) to average net assets would have been (.50) %.
E Total returns would have been lower if certain expenses had not been reduced during the applicable periods shown.
F Total returns do not include the effect of the sales charges.
G Fees and expenses of any underlying Fidelity Central Funds are not included in the Fund's expense ratio. The Fund indirectly bears its proportionate share of the expenses of any underlying Fidelity Central Funds.
H Expense ratios reflect operating expenses of the class. Expenses before reductions do not reflect amounts reimbursed by the investment adviser or reductions from brokerage service arrangements or reductions from other expense offset arrangements and do not represent the amount paid by the class during periods when reimbursements or reductions occur. Expenses net of fee waivers reflect expenses after reimbursement by the investment adviser but prior to reductions from brokerage service arrangements or other expense offset arrangements. Expenses net of all reductions represent the net expenses paid by the class.
I Amount does not include the portfolio activity of any underlying Fidelity Central Funds.
See accompanying notes which are an integral part of the financial statements.
Financial Highlights — Fidelity Advisor Small Cap Fund Class T
| Years ended November 30, | 2015 | 2014 | 2013 | 2012 | 2011 |
| Selected Per–Share Data | |||||
| Net asset value, beginning of period | $28.40 | $29.69 | $21.52 | $22.75 | $23.57 |
| Income from Investment Operations | |||||
| Net investment income (loss)A | (.04)B | (.02) | .06C | (.07) | (.13)D |
| Net realized and unrealized gain (loss) | 1.04 | 2.23 | 8.13 | .75 | .64 |
| Total from investment operations | 1.00 | 2.21 | 8.19 | .68 | .51 |
| Distributions from net investment income | – | – | (.01) | – | – |
| Distributions from net realized gain | (3.41) | (3.50) | (.01) | (1.91) | (1.33) |
| Total distributions | (3.41) | (3.50) | (.02) | (1.91) | (1.33) |
| Net asset value, end of period | $25.99 | $28.40 | $29.69 | $21.52 | $22.75 |
| Total ReturnE,F | 3.93% | 8.79% | 38.11% | 3.64% | 1.94% |
| Ratios to Average Net AssetsG,H | |||||
| Expenses before reductions | 1.49% | 1.20% | 1.22% | 1.26% | 1.51% |
| Expenses net of fee waivers, if any | 1.49% | 1.20% | 1.22% | 1.26% | 1.51% |
| Expenses net of all reductions | 1.49% | 1.20% | 1.21% | 1.25% | 1.51% |
| Net investment income (loss) | (.16)%B | (.08)% | .25%C | (.33)% | (.55)%D |
| Supplemental Data | |||||
| Net assets, end of period (in millions) | $888 | $958 | $1,113 | $1,054 | $1,244 |
| Portfolio turnover rateI | 33% | 39% | 34% | 69% | 38% |
A Calculated based on average shares outstanding during the period.
B Investment income per share reflects a large, non-recurring dividend which amounted to $.06 per share. Excluding this non-recurring dividend, the ratio of net investment income (loss) to average net assets would have been (.39) %.
C Investment income per share reflects a large, non-recurring dividend which amounted to $.04 per share. Excluding this non-recurring dividend, the ratio of net investment income (loss) to average net assets would have been .09%.
D Investment income per share reflects a large, non-recurring dividend which amounted to $.04 per share. Excluding this non-recurring dividend, the ratio of net investment income (loss) to average net assets would have been (.70) %.
E Total returns would have been lower if certain expenses had not been reduced during the applicable periods shown.
F Total returns do not include the effect of the sales charges.
G Fees and expenses of any underlying Fidelity Central Funds are not included in the Fund's expense ratio. The Fund indirectly bears its proportionate share of the expenses of any underlying Fidelity Central Funds.
H Expense ratios reflect operating expenses of the class. Expenses before reductions do not reflect amounts reimbursed by the investment adviser or reductions from brokerage service arrangements or reductions from other expense offset arrangements and do not represent the amount paid by the class during periods when reimbursements or reductions occur. Expenses net of fee waivers reflect expenses after reimbursement by the investment adviser but prior to reductions from brokerage service arrangements or other expense offset arrangements. Expenses net of all reductions represent the net expenses paid by the class.
I Amount does not include the portfolio activity of any underlying Fidelity Central Funds.
See accompanying notes which are an integral part of the financial statements.
Financial Highlights — Fidelity Advisor Small Cap Fund Class B
| Years ended November 30, | 2015 | 2014 | 2013 | 2012 | 2011 |
| Selected Per–Share Data | |||||
| Net asset value, beginning of period | $24.73 | $26.45 | $19.27 | $20.69 | $21.66 |
| Income from Investment Operations | |||||
| Net investment income (loss)A | (.17)B | (.16) | (.08)C | (.18) | (.25)D |
| Net realized and unrealized gain (loss) | .90 | 1.94 | 7.26 | .67 | .61 |
| Total from investment operations | .73 | 1.78 | 7.18 | .49 | .36 |
| Distributions from net realized gain | (3.41) | (3.50) | – | (1.91) | (1.33) |
| Net asset value, end of period | $22.05 | $24.73 | $26.45 | $19.27 | $20.69 |
| Total ReturnE,F | 3.35% | 8.16% | 37.26% | 3.03% | 1.39% |
| Ratios to Average Net AssetsG,H | |||||
| Expenses before reductions | 2.07% | 1.80% | 1.81% | 1.85% | 2.10% |
| Expenses net of fee waivers, if any | 2.06% | 1.80% | 1.81% | 1.85% | 2.10% |
| Expenses net of all reductions | 2.06% | 1.79% | 1.80% | 1.84% | 2.10% |
| Net investment income (loss) | (.74)%B | (.68)% | (.34)%C | (.92)% | (1.14)%D |
| Supplemental Data | |||||
| Net assets, end of period (in millions) | $21 | $31 | $40 | $40 | $55 |
| Portfolio turnover rateI | 33% | 39% | 34% | 69% | 38% |
A Calculated based on average shares outstanding during the period.
B Investment income per share reflects a large, non-recurring dividend which amounted to $.05 per share. Excluding this non-recurring dividend, the ratio of net investment income (loss) to average net assets would have been (.96) %.
C Investment income per share reflects a large, non-recurring dividend which amounted to $.04 per share. Excluding this non-recurring dividend, the ratio of net investment income (loss) to average net assets would have been (.51) %.
D Investment income per share reflects a large, non-recurring dividend which amounted to $.03 per share. Excluding this non-recurring dividend, the ratio of net investment income (loss) to average net assets would have been (1.29) %.
E Total returns would have been lower if certain expenses had not been reduced during the applicable periods shown.
F Total returns do not include the effect of the contingent deferred sales charge.
G Fees and expenses of any underlying Fidelity Central Funds are not included in the Fund's expense ratio. The Fund indirectly bears its proportionate share of the expenses of any underlying Fidelity Central Funds.
H Expense ratios reflect operating expenses of the class. Expenses before reductions do not reflect amounts reimbursed by the investment adviser or reductions from brokerage service arrangements or reductions from other expense offset arrangements and do not represent the amount paid by the class during periods when reimbursements or reductions occur. Expenses net of fee waivers reflect expenses after reimbursement by the investment adviser but prior to reductions from brokerage service arrangements or other expense offset arrangements. Expenses net of all reductions represent the net expenses paid by the class.
I Amount does not include the portfolio activity of any underlying Fidelity Central Funds.
See accompanying notes which are an integral part of the financial statements.
Financial Highlights — Fidelity Advisor Small Cap Fund Class C
| Years ended November 30, | 2015 | 2014 | 2013 | 2012 | 2011 |
| Selected Per–Share Data | |||||
| Net asset value, beginning of period | $25.10 | $26.77 | $19.50 | $20.90 | $21.87 |
| Income from Investment Operations | |||||
| Net investment income (loss)A | (.16)B | (.15) | (.07)C | (.17) | (.24)D |
| Net realized and unrealized gain (loss) | .91 | 1.98 | 7.34 | .68 | .60 |
| Total from investment operations | .75 | 1.83 | 7.27 | .51 | .36 |
| Distributions from net realized gain | (3.41) | (3.50) | – | (1.91) | (1.33) |
| Net asset value, end of period | $22.44 | $25.10 | $26.77 | $19.50 | $20.90 |
| Total ReturnE,F | 3.38% | 8.26% | 37.28% | 3.10% | 1.37% |
| Ratios to Average Net AssetsG,H | |||||
| Expenses before reductions | 2.02% | 1.73% | 1.76% | 1.81% | 2.06% |
| Expenses net of fee waivers, if any | 2.02% | 1.73% | 1.76% | 1.81% | 2.06% |
| Expenses net of all reductions | 2.01% | 1.73% | 1.75% | 1.80% | 2.05% |
| Net investment income (loss) | (.69)%B | (.62)% | (.29)%C | (.88)% | (1.10)%D |
| Supplemental Data | |||||
| Net assets, end of period (in millions) | $318 | $317 | $334 | $284 | $328 |
| Portfolio turnover rateI | 33% | 39% | 34% | 69% | 38% |
A Calculated based on average shares outstanding during the period.
B Investment income per share reflects a large, non-recurring dividend which amounted to $.05 per share. Excluding this non-recurring dividend, the ratio of net investment income (loss) to average net assets would have been (.91) %.
C Investment income per share reflects a large, non-recurring dividend which amounted to $.04 per share. Excluding this non-recurring dividend, the ratio of net investment income (loss) to average net assets would have been (.45) %.
D Investment income per share reflects a large, non-recurring dividend which amounted to $.03 per share. Excluding this non-recurring dividend, the ratio of net investment income (loss) to average net assets would have been (1.25) %.
E Total returns would have been lower if certain expenses had not been reduced during the applicable periods shown.
F Total returns do not include the effect of the contingent deferred sales charge.
G Fees and expenses of any underlying Fidelity Central Funds are not included in the Fund's expense ratio. The Fund indirectly bears its proportionate share of the expenses of any underlying Fidelity Central Funds.
H Expense ratios reflect operating expenses of the class. Expenses before reductions do not reflect amounts reimbursed by the investment adviser or reductions from brokerage service arrangements or reductions from other expense offset arrangements and do not represent the amount paid by the class during periods when reimbursements or reductions occur. Expenses net of fee waivers reflect expenses after reimbursement by the investment adviser but prior to reductions from brokerage service arrangements or other expense offset arrangements. Expenses net of all reductions represent the net expenses paid by the class.
I Amount does not include the portfolio activity of any underlying Fidelity Central Funds.
See accompanying notes which are an integral part of the financial statements.
Financial Highlights — Fidelity Advisor Small Cap Fund Class I
| Years ended November 30, | 2015 | 2014 | 2013 | 2012 | 2011 |
| Selected Per–Share Data | |||||
| Net asset value, beginning of period | $31.80 | $32.73 | $23.73 | $24.77 | $25.42 |
| Income from Investment Operations | |||||
| Net investment income (loss)A | .10B | .13 | .21C | .04 | (.01)D |
| Net realized and unrealized gain (loss) | 1.18 | 2.50 | 8.94 | .83 | .69 |
| Total from investment operations | 1.28 | 2.63 | 9.15 | .87 | .68 |
| Distributions from net investment income | (.08) | (.06) | (.13) | – | – |
| Distributions from net realized gain | (3.41) | (3.50) | (.01) | (1.91) | (1.33) |
| Total distributions | (3.49) | (3.56) | (.15)E | (1.91) | (1.33) |
| Net asset value, end of period | $29.59 | $31.80 | $32.73 | $23.73 | $24.77 |
| Total ReturnF | 4.46% | 9.33% | 38.79% | 4.15% | 2.49% |
| Ratios to Average Net AssetsG,H | |||||
| Expenses before reductions | .99% | .70% | .71% | .75% | 1.01% |
| Expenses net of fee waivers, if any | .99% | .70% | .71% | .75% | 1.01% |
| Expenses net of all reductions | .99% | .70% | .70% | .74% | 1.00% |
| Net investment income (loss) | .34%B | .41% | .76%C | .18% | (.05)%D |
| Supplemental Data | |||||
| Net assets, end of period (in millions) | $704 | $627 | $718 | $1,141 | $1,314 |
| Portfolio turnover rateI | 33% | 39% | 34% | 69% | 38% |
A Calculated based on average shares outstanding during the period.
B Investment income per share reflects a large, non-recurring dividend which amounted to $.07 per share. Excluding this non-recurring dividend, the ratio of net investment income (loss) to average net assets would have been .11%.
C Investment income per share reflects a large, non-recurring dividend which amounted to $.05 per share. Excluding this non-recurring dividend, the ratio of net investment income (loss) to average net assets would have been .59%.
D Investment income per share reflects a large, non-recurring dividend which amounted to $.04 per share. Excluding this non-recurring dividend, the ratio of net investment income (loss) to average net assets would have been (.19) %.
E Total distributions of $.15 per share is comprised of distributions from net investment income of $.133 and distributions from net realized gain of $.014 per share.
F Total returns would have been lower if certain expenses had not been reduced during the applicable periods shown.
G Fees and expenses of any underlying Fidelity Central Funds are not included in the Fund's expense ratio. The Fund indirectly bears its proportionate share of the expenses of any underlying Fidelity Central Funds.
H Expense ratios reflect operating expenses of the class. Expenses before reductions do not reflect amounts reimbursed by the investment adviser or reductions from brokerage service arrangements or reductions from other expense offset arrangements and do not represent the amount paid by the class during periods when reimbursements or reductions occur. Expenses net of fee waivers reflect expenses after reimbursement by the investment adviser but prior to reductions from brokerage service arrangements or other expense offset arrangements. Expenses net of all reductions represent the net expenses paid by the class.
I Amount does not include the portfolio activity of any underlying Fidelity Central Funds.
See accompanying notes which are an integral part of the financial statements.
Financial Highlights — Fidelity Advisor Small Cap Fund Class Z
| Years ended November 30, | 2015 | 2014 | 2013 A |
| Selected Per–Share Data | |||
| Net asset value, beginning of period | $31.76 | $32.74 | $29.79 |
| Income from Investment Operations | |||
| Net investment income (loss)B | .14C | .17 | .02D |
| Net realized and unrealized gain (loss) | 1.17 | 2.51 | 2.93 |
| Total from investment operations | 1.31 | 2.68 | 2.95 |
| Distributions from net investment income | (.14) | (.16) | – |
| Distributions from net realized gain | (3.41) | (3.50) | – |
| Total distributions | (3.54)E | (3.66) | – |
| Net asset value, end of period | $29.53 | $31.76 | $32.74 |
| Total ReturnF,G | 4.59% | 9.52% | 9.90% |
| Ratios to Average Net AssetsH,I | |||
| Expenses before reductions | .84% | .55% | .56%J |
| Expenses net of fee waivers, if any | .84% | .55% | .56%J |
| Expenses net of all reductions | .84% | .54% | .55%J |
| Net investment income (loss) | .48%C | .57% | .26%D,J |
| Supplemental Data | |||
| Net assets, end of period (in millions) | $41 | $20 | $5 |
| Portfolio turnover rateK | 33% | 39% | 34% |
A For the period August 13, 2013 (commencement of sale of shares) to November 30, 2013.
B Calculated based on average shares outstanding during the period.
C Investment income per share reflects a large, non-recurring dividend which amounted to $.07 per share. Excluding this non-recurring dividend, the ratio of net investment income (loss) to average net assets would have been .26%.
D Investment income per share reflects a large, non-recurring dividend which amounted to $.01 per share. Excluding this non-recurring dividend, the ratio of net investment income (loss) to average net assets would have been .09%.
E Total distributions of $3.54 per share is comprised of distributions from net investment income of $.136 and distributions from net realized gain of $3.406 per share.
F Total returns for periods of less than one year are not annualized.
G Total returns would have been lower if certain expenses had not been reduced during the applicable periods shown.
H Fees and expenses of any underlying Fidelity Central Funds are not included in the Fund's expense ratio. The Fund indirectly bears its proportionate share of the expenses of any underlying Fidelity Central Funds.
I Expense ratios reflect operating expenses of the class. Expenses before reductions do not reflect amounts reimbursed by the investment adviser or reductions from brokerage service arrangements or reductions from other expense offset arrangements and do not represent the amount paid by the class during periods when reimbursements or reductions occur. Expense ratios before reductions for start-up periods may not be representative of longer-term operating periods. Expenses net of fee waivers reflect expenses after reimbursement by the investment adviser but prior to reductions from brokerage service arrangements or other expense offset arrangements. Expenses net of all reductions represent the net expenses paid by the class.
J Annualized
K Amount does not include the portfolio activity of any underlying Fidelity Central Funds.
See accompanying notes which are an integral part of the financial statements.
Notes to Financial Statements
For the period ended November 30, 2015
(Amounts in thousands except percentages)
1. Organization.
Fidelity Advisor Small Cap Fund (the Fund) is a fund of Fidelity Advisor Series I (the Trust) and is authorized to issue an unlimited number of shares. The Trust is registered under the Investment Company Act of 1940, as amended (the 1940 Act), as an open-end management investment company organized as a Massachusetts business trust. The Fund offers Class A, Class T, Class C, Class I (formerly Institutional Class) and Class Z shares, each of which, along with Class B shares, has equal rights as to assets and voting privileges. Class B shares are closed to new accounts and additional purchases, except for exchanges and reinvestments. Each class has exclusive voting rights with respect to matters that affect that class. Class B shares will automatically convert to Class A shares after a holding period of seven years from the initial date of purchase.
2. Investments in Fidelity Central Funds.
The Fund invests in Fidelity Central Funds, which are open-end investment companies generally available only to other investment companies and accounts managed by the investment adviser and its affiliates. The Fund's Schedule of Investments lists each of the Fidelity Central Funds held as of period end, if any, as an investment of the Fund, but does not include the underlying holdings of each Fidelity Central Fund. As an Investing Fund, the Fund indirectly bears its proportionate share of the expenses of the underlying Fidelity Central Funds.
The Money Market Central Funds seek preservation of capital and current income and are managed by Fidelity Investments Money Management, Inc. (FIMM), an affiliate of the investment adviser. Annualized expenses of the Money Market Central Funds as of their most recent shareholder report date are less than .005%.
A complete unaudited list of holdings for each Fidelity Central Fund is available upon request or at the Securities and Exchange Commission (the SEC) website at www.sec.gov. In addition, the financial statements of the Fidelity Central Funds, which are not covered by the Fund's Report of Independent Registered Public Accounting Firm, are available on the SEC website or upon request.
3. Significant Accounting Policies.
The financial statements have been prepared in conformity with accounting principles generally accepted in the United States of America (GAAP), which require management to make certain estimates and assumptions at the date of the financial statements. Actual results could differ from those estimates. Subsequent events, if any, through the date that the financial statements were issued have been evaluated in the preparation of the financial statements. The following summarizes the significant accounting policies of the Fund:
Investment Valuation. Investments are valued as of 4:00 p.m. Eastern time on the last calendar day of the period. The Board of Trustees (the Board) has delegated the day to day responsibility for the valuation of the Fund's investments to the Fidelity Management & Research Company (FMR) Fair Value Committee (the Committee). In accordance with valuation policies and procedures approved by the Board, the Fund attempts to obtain prices from one or more third party pricing vendors or brokers to value its investments. When current market prices, quotations or currency exchange rates are not readily available or reliable, investments will be fair valued in good faith by the Committee, in accordance with procedures adopted by the Board. Factors used in determining fair value vary by investment type and may include market or investment specific events, changes in interest rates and credit quality. The frequency with which these procedures are used cannot be predicted and they may be utilized to a significant extent. The Committee oversees the Fund's valuation policies and procedures and reports to the Board on the Committee's activities and fair value determinations. The Board monitors the appropriateness of the procedures used in valuing the Fund's investments and ratifies the fair value determinations of the Committee.
The Fund categorizes the inputs to valuation techniques used to value its investments into a disclosure hierarchy consisting of three levels as shown below:
- Level 1 – quoted prices in active markets for identical investments
- Level 2 – other significant observable inputs (including quoted prices for similar investments, interest rates, prepayment speeds, etc.)
- Level 3 – unobservable inputs (including the Fund's own assumptions based on the best information available)
Valuation techniques used to value the Fund's investments by major category are as follows:
Equity securities, including restricted securities, for which market quotations are readily available, are valued at the last reported sale price or official closing price as reported by a third party pricing vendor on the primary market or exchange on which they are traded and are categorized as Level 1 in the hierarchy. In the event there were no sales during the day or closing prices are not available, securities are valued at the last quoted bid price or may be valued using the last available price and are generally categorized as Level 2 in the hierarchy. For foreign equity securities, when market or security specific events arise, comparisons to the valuation of American Depositary Receipts (ADRs), futures contracts, Exchange-Traded Funds (ETFs) and certain indexes as well as quoted prices for similar securities may be used and would be categorized as Level 2 in the hierarchy. Utilizing these techniques may result in transfers between Level 1 and Level 2. For equity securities, including restricted securities, where observable inputs are limited, assumptions about market activity and risk are used and these securities may be categorized as Level 3 in the hierarchy.
Debt securities, including restricted securities, are valued based on evaluated prices received from third party pricing vendors or from brokers who make markets in such securities. Preferred securities and U.S. government and government agency obligations, are valued by pricing vendors who utilize matrix pricing which considers yield or price of bonds of comparable quality, coupon, maturity and type or by broker-supplied prices. When independent prices are unavailable or unreliable, debt securities may be valued utilizing pricing methodologies which consider similar factors that would be used by third party pricing vendors. Debt securities are generally categorized as Level 2 in the hierarchy but may be Level 3 depending on the circumstances. ETFs are valued at their last sale price or official closing price as reported by a third party pricing vendor on the primary market or exchange on which they are traded and are categorized as Level 1 in the hierarchy. In the event there were no sales during the day but the exchange reports a closing bid level, ETFs are valued at the closing bid and would be categorized as Level 1 in the hierarchy. In the event there was no closing bid, ETFs may be valued by another method that the Board believes reflects fair value in accordance with the Board's fair value pricing policies and may be categorized as Level 2 in the hierarchy.
Futures contracts are valued at the settlement price established each day by the board of trade or exchange on which they are traded and are categorized as Level 1 in the hierarchy. Investments in open-end mutual funds, including the Fidelity Central Funds, are valued at their closing net asset value (NAV) each business day and are categorized as Level 1 in the hierarchy.
Changes in valuation techniques may result in transfers in or out of an assigned level within the disclosure hierarchy. The aggregate value of investments by input level as of November 30, 2015 is included at the end of the Fund's Schedule of Investments.
Foreign Currency. The Fund may use foreign currency contracts to facilitate transactions in foreign-denominated securities. Gains and losses from these transactions may arise from changes in the value of the foreign currency or if the counterparties do not perform under the contracts' terms.
Foreign-denominated assets, including investment securities, and liabilities are translated into U.S. dollars at the exchange rates at period end. Purchases and sales of investment securities, income and dividends received and expenses denominated in foreign currencies are translated into U.S. dollars at the exchange rate in effect on the transaction date.
The effects of exchange rate fluctuations on investments are included with the net realized and unrealized gain (loss) on investment securities. Other foreign currency transactions resulting in realized and unrealized gain (loss) are disclosed separately.
Investment Transactions and Income. For financial reporting purposes, the Fund's investment holdings and NAV include trades executed through the end of the last business day of the period. The NAV per share for processing shareholder transactions is calculated as of the close of business of the New York Stock Exchange (NYSE), normally 4:00 p.m. Eastern time and includes trades executed through the end of the prior business day. Gains and losses on securities sold are determined on the basis of identified cost and may include proceeds received from litigation. Dividend income is recorded on the ex-dividend date, except for certain dividends from foreign securities where the ex-dividend date may have passed, which are recorded as soon as the Fund is informed of the ex-dividend date. Non-cash dividends included in dividend income, if any, are recorded at the fair market value of the securities received. Income and capital gain distributions from Fidelity Central Funds, if any, are recorded on the ex-dividend date. Distributions received on securities that represent a return of capital or capital gain are recorded as a reduction of cost of investments and/or as a realized gain. Subsequent to ex-dividend date the Fund determines the components of these distributions, based upon receipt of tax filings or other correspondence relating to the underlying investment. Large, non-recurring dividends recognized by the Fund are presented separately on the Statement of Operations as "Special Dividends" and the impact of these dividends is presented in the Financial Highlights. Interest income is accrued as earned and includes coupon interest and amortization of premium and accretion of discount on debt securities as applicable. Investment income is recorded net of foreign taxes withheld where recovery of such taxes is uncertain.
Class Allocations and Expenses. Investment income, realized and unrealized capital gains and losses, common expenses of the Fund, and certain fund-level expense reductions, if any, are allocated daily on a pro-rata basis to each class based on the relative net assets of each class to the total net assets of the Fund. Each class differs with respect to transfer agent and distribution and service plan fees incurred. Certain expense reductions may also differ by class. For the reporting period, the allocated portion of income and expenses to each class as a percent of its average net assets may vary due to the timing of recording these transactions in relation to fluctuating net assets of the classes. Expenses directly attributable to a fund are charged to that fund. Expenses attributable to more than one fund are allocated among the respective funds on the basis of relative net assets or other appropriate methods. Expense estimates are accrued in the period to which they relate and adjustments are made when actual amounts are known.
Income Tax Information and Distributions to Shareholders. Each year, the Fund intends to qualify as a regulated investment company under Subchapter M of the Internal Revenue Code, including distributing substantially all of its taxable income and realized gains. As a result, no provision for U.S. Federal income taxes is required. As of November 30, 2015, the Fund did not have any unrecognized tax benefits in the financial statements; nor is the Fund aware of any tax positions for which it is reasonably possible that the total amounts of unrecognized tax benefits will significantly change in the next twelve months. The Fund files a U.S. federal tax return, in addition to state and local tax returns as required. The Fund's federal income tax returns are subject to examination by the Internal Revenue Service (IRS) for a period of three fiscal years after they are filed. State and local tax returns may be subject to examination for an additional fiscal year depending on the jurisdiction. Foreign taxes are provided for based on the Fund's understanding of the tax rules and rates that exist in the foreign markets in which it invests.
Distributions are declared and recorded on the ex-dividend date. Income dividends and capital gain distributions are declared separately for each class. Income and capital gain distributions are determined in accordance with income tax regulations, which may differ from GAAP. In addition, the Fund claimed a portion of the payment made to redeeming shareholders as a distribution for income tax purposes.
Capital accounts within the financial statements are adjusted for permanent book-tax differences. These adjustments have no impact on net assets or the results of operations. Capital accounts are not adjusted for temporary book-tax differences which will reverse in a subsequent period.
Book-tax differences are primarily due to futures contracts, market discount, foreign currency transactions, partnerships and losses deferred due to wash sales and excise tax regulations.
The federal tax cost of investment securities and unrealized appreciation (depreciation) as of period end were as follows:
| Gross unrealized appreciation | $739,926 |
| Gross unrealized depreciation | (185,981) |
| Net unrealized appreciation (depreciation) on securities | $553,945 |
| Tax Cost | $2,580,417 |
The tax-based components of distributable earnings as of period end were as follows:
| Undistributed long-term capital gain | $248,855 |
| Net unrealized appreciation (depreciation) on securities and other investments | $553,891 |
The tax character of distributions paid was as follows:
| November 30, 2015 | November 30, 2014 | |
| Ordinary Income | $1,701 | $ 1,611 |
| Long-term Capital Gains | 353,938 | 400,188 |
| Total | $355,639 | $ 401,799 |
The Fund intends to elect to defer to its next fiscal year $3,499 of ordinary losses recognized during the period January 1, 2015 to November 30, 2015.
Restricted Securities. The Fund may invest in securities that are subject to legal or contractual restrictions on resale. These securities generally may be resold in transactions exempt from registration or to the public if the securities are registered. Disposal of these securities may involve time-consuming negotiations and expense, and prompt sale at an acceptable price may be difficult. Information regarding restricted securities is included at the end of the Fund's Schedule of Investments.
4. Derivative Instruments.
Risk Exposures and the Use of Derivative Instruments. The Fund's investment objective allows the Fund to enter into various types of derivative contracts, including futures contracts. Derivatives are investments whose value is primarily derived from underlying assets, indices or reference rates and may be transacted on an exchange or over-the-counter (OTC). Derivatives may involve a future commitment to buy or sell a specified asset based on specified terms, to exchange future cash flows at periodic intervals based on a notional principal amount, or for one party to make one or more payments upon the occurrence of specified events in exchange for periodic payments from the other party.
The Fund used derivatives to increase returns and to manage exposure to certain risks as defined below. The success of any strategy involving derivatives depends on analysis of numerous economic factors, and if the strategies for investment do not work as intended, the Fund may not achieve its objectives.
The Fund's use of derivatives increased or decreased its exposure to the following risk:
| Equity Risk | Equity risk relates to the fluctuations in the value of financial instruments as a result of changes in market prices (other than those arising from interest rate risk or foreign exchange risk), whether caused by factors specific to an individual investment, its issuer, or all factors affecting all instruments traded in a market or market segment. |
The Fund is also exposed to additional risks from investing in derivatives, such as liquidity risk and counterparty credit risk. Liquidity risk is the risk that the Fund will be unable to close out the derivative in the open market in a timely manner. Counterparty credit risk is the risk that the counterparty will not be able to fulfill its obligation to the Fund. Counterparty credit risk related to exchange-traded futures contracts may be mitigated by the protection provided by the exchange on which they trade.
Investing in derivatives may involve greater risks than investing in the underlying assets directly and, to varying degrees, may involve risk of loss in excess of any initial investment and collateral received and amounts recognized in the Statement of Assets and Liabilities. In addition, there may be the risk that the change in value of the derivative contract does not correspond to the change in value of the underlying instrument.
Futures Contracts. A futures contract is an agreement between two parties to buy or sell a specified underlying instrument for a fixed price at a specified future date. The Fund used futures contracts to manage its exposure to the stock market.
Upon entering into a futures contract, a fund is required to deposit either cash or securities (initial margin) with a clearing broker in an amount equal to a certain percentage of the face value of the contract. Futures contracts are marked-to-market daily and subsequent daily payments (variation margin) are made or received by a fund depending on the daily fluctuations in the value of the futures contracts and are recorded as unrealized appreciation or (depreciation). This receivable and/or payable, if any, is included in daily variation margin for derivative instruments in the Statement of Assets and Liabilities. Realized gain or (loss) is recorded upon the expiration or closing of a futures contract.
Any open futures contracts at period end are presented in the Schedule of Investments under the caption "Futures Contracts". The underlying face amount at value reflects each contract's exposure to the underlying instrument or index at period end and is representative of volume of activity during the period. Securities deposited to meet initial margin requirements are identified in the Schedule of Investments.
During the period the Fund recognized net realized gain (loss) of $(9,056) and a change in net unrealized appreciation (depreciation) of $6,738 related to its investment in futures contracts. These amounts are included in the Statement of Operations.
5. Purchases and Sales of Investments.
Purchases and sales of securities, other than short-term securities, aggregated $924,163 and $1,325,153, respectively.
6. Fees and Other Transactions with Affiliates.
Management Fee. Fidelity Management & Research Company (the investment adviser) and its affiliates provide the Fund with investment management related services for which the Fund pays a monthly management fee. The management fee is the sum of an individual fund fee rate that is based on an annual rate of .45% of the Fund's average net assets and an annualized group fee rate that averaged .25% during the period. The group fee rate is based upon the average net assets of all the mutual funds advised by the investment adviser, including any mutual funds previously advised by the investment adviser that are currently advised by Fidelity SelectCo, LLC, an affiliate of the investment adviser. The group fee rate decreases as assets under management increase and increases as assets under management decrease. In addition, the management fee is subject to a performance adjustment (up to a maximum of +/- .20% of the Fund's average net assets over a 36 month performance period). The upward or downward adjustment to the management fee is based on the relative investment performance of Class I of the Fund as compared to its benchmark index, the Russell 2000 Index, over the same 36 month performance period. For the reporting period, the total annual management fee rate, including the performance adjustment, was .75% of the Fund's average net assets. The performance adjustment included in the management fee rate may be higher or lower than the maximum performance adjustment rate due to the difference between the average net assets for the reporting and performance periods.
Distribution and Service Plan Fees. In accordance with Rule 12b-1 of the 1940 Act, the Fund has adopted separate Distribution and Service Plans for each class of shares. Certain classes pay Fidelity Distributors Corporation (FDC), an affiliate of the investment adviser, separate Distribution and Service Fees, each of which is based on an annual percentage of each class' average net assets. In addition, FDC may pay financial intermediaries for selling shares of the Fund and providing shareholder support services. For the period, the Distribution and Service Fee rates, total fees and amounts retained by FDC were as follows:
| Distribution Fee | Service Fee | Total Fees | Retained by FDC | |
| Class A | -% | .25% | $2,694 | $12 |
| Class T | .25% | .25% | 4,668 | - |
| Class B | .75% | .25% | 269 | 202 |
| Class C | .75% | .25% | 3,221 | 196 |
| $10,852 | $410 |
Sales Load. FDC may receive a front-end sales charge of up to 5.75% for selling Class A shares and 3.50% for selling Class T shares, some of which is paid to financial intermediaries for selling shares of the Fund. Depending on the holding period, FDC may receive contingent deferred sales charges levied on Class A, Class T, Class B, and Class C redemptions. The deferred sales charges range from 5.00% to 1.00% for Class B shares, 1.00% for Class C shares, 1.00% for certain purchases of Class A shares and .25% for certain purchases of Class T shares.
For the period, sales charge amounts retained by FDC were as follows:
| Retained by FDC | |
| Class A | $174 |
| Class T | 29 |
| Class B(a) | 9 |
| Class C(a) | 16 |
| $228 |
(a) When Class B and Class C shares are initially sold, FDC pays commissions from its own resources to financial intermediaries through which the sales are made.
Transfer Agent Fees. Fidelity Investments Institutional Operations Company, Inc., (FIIOC), an affiliate of the investment adviser, is the transfer, dividend disbursing and shareholder servicing agent for each class of the Fund. FIIOC receives account fees and asset-based fees that vary according to the account size and type of account of the shareholders of the respective classes of the Fund, except for Class Z. FIIOC receives an asset-based fee of Class Z's average net assets. FIIOC pays for typesetting, printing and mailing of shareholder reports, except proxy statements.
For the period, transfer agent fees for each class were as follows:
| Amount | % of Class-Level Average Net Assets | |
| Class A | $2,307 | .21 |
| Class T | 1,826 | .20 |
| Class B | 72 | .27 |
| Class C | 718 | .22 |
| Class I | 1,291 | .20 |
| Class Z | 19 | .05 |
| $6,233 |
Accounting and Security Lending Fees. Fidelity Service Company, Inc. (FSC), an affiliate of the investment adviser, maintains the Fund's accounting records. The accounting fee is based on the level of average net assets for each month. Under a separate contract, FSC administers the security lending program. The security lending fee is based on the number and duration of lending transactions.
Brokerage Commissions. The Fund placed a portion of its portfolio transactions with brokerage firms which are affiliates of the investment adviser. Brokerage commissions are included in net realized gain (loss) and change in net unrealized appreciation (depreciation) in the Statement of Operations. The commissions paid to these affiliated firms were $35 for the period.
Other. During the period, the investment adviser reimbursed the Fund for certain losses in the amount of $3.
7. Committed Line of Credit.
The Fund participates with other funds managed by the investment adviser or an affiliate in a $4.25 billion credit facility (the "line of credit") to be utilized for temporary or emergency purposes to fund shareholder redemptions or for other short-term liquidity purposes. The Fund has agreed to pay commitment fees on its pro-rata portion of the line of credit, which amounted to $4 and is reflected in Miscellaneous expenses on the Statement of Operations. During the period, the Fund did not borrow on this line of credit.
8. Security Lending.
The Fund lends portfolio securities through a lending agent from time to time in order to earn additional income. For equity securities, a lending agent is used and may loan securities to certain qualified borrowers, including Fidelity Capital Markets (FCM), a broker-dealer affiliated with the Fund. On the settlement date of the loan, the Fund receives collateral (in the form of U.S. Treasury obligations, letters of credit and/or cash) against the loaned securities and maintains collateral in an amount not less than 100% of the market value of the loaned securities during the period of the loan. The market value of the loaned securities is determined at the close of business of the Fund and any additional required collateral is delivered to the Fund on the next business day. The Fund or borrower may terminate the loan at any time, and if the borrower defaults on its obligation to return the securities loaned because of insolvency or other reasons, the Fund may apply collateral received from the borrower against the obligation. The Fund may experience delays and costs in recovering the securities loaned. Any cash collateral received is invested in the Fidelity Securities Lending Cash Central Fund. The value of loaned securities and cash collateral at period end are disclosed on the Fund's Statement of Assets and Liabilities. The value of securities loaned to FCM at period end was $17,865. Security lending income represents the income earned on investing cash collateral, less rebates paid to borrowers and any lending agent fees associated with the loan, plus any premium payments received for lending certain types of securities. Security lending income is presented in the Statement of Operations as a component of income from Fidelity Central Funds. Total security lending income during the period amounted to $292, including $4 from securities loaned to FCM.
9. Expense Reductions.
Commissions paid to certain brokers with whom the investment adviser, or its affiliates, places trades on behalf of the Fund include an amount in addition to trade execution, which may be rebated back to the Fund to offset certain expenses. This amount totaled $70 for the period.
In addition, during the period the investment adviser reimbursed and/or waived a portion of fund-level operating expenses in the amount of $13 and a portion of class-level operating expenses as follows:
| Amount | |
| Class A | $26 |
| Class T | 23 |
| Class B | 1 |
| Class C | 7 |
| Class I | 17 |
| $74 |
10. Distributions to Shareholders.
Distributions to shareholders of each class were as follows:
| Years ended November 30, | 2015 | 2014 |
| From net investment income | ||
| Class A | $–(a) | $284 |
| Class I | 1,619 | 1,305 |
| Class Z | 82 | 22 |
| Total | $1,701 | $1,611 |
| From net realized gain | ||
| Class A | $123,666 | $142,771 |
| Class T | 113,567 | 131,371 |
| Class B | 4,225 | 5,267 |
| Class C | 42,961 | 43,783 |
| Class I | 67,403 | 76,492 |
| Class Z | 2,116 | 504 |
| Total | $353,938 | $400,188 |
(a) In the amount of less than five hundred dollars.
11. Share Transactions.
Share transactions for each class were as follows and may contain automatic conversions between classes or exchanges between funds:
| Shares | Shares | Dollars | Dollars | |
| Years ended November 30, | 2015 | 2014 | 2015 | 2014 |
| Class A | ||||
| Shares sold | 7,266 | 5,882 | $201,961 | $166,699 |
| Reinvestment of distributions | 4,474 | 4,985 | 119,319 | 134,212 |
| Shares redeemed | (10,527) | (14,908) | (292,656) | (422,262) |
| Net increase (decrease) | 1,213 | (4,041) | $28,624 | $(121,351) |
| Class T | ||||
| Shares sold | 6,096 | 5,277 | $160,232 | $141,817 |
| Reinvestment of distributions | 4,384 | 4,931 | 110,516 | 126,640 |
| Shares redeemed | (10,046) | (13,972) | (263,505) | (376,684) |
| Net increase (decrease) | 434 | (3,764) | $7,243 | $(108,227) |
| Class B | ||||
| Shares sold | 21 | 13 | $461 | $288 |
| Reinvestment of distributions | 189 | 220 | 4,069 | 4,958 |
| Shares redeemed | (510) | (484) | (11,385) | (11,378) |
| Net increase (decrease) | (300) | (251) | $(6,855) | $(6,132) |
| Class C | ||||
| Shares sold | 1,967 | 1,271 | $44,618 | $30,236 |
| Reinvestment of distributions | 1,812 | 1,754 | 39,668 | 40,042 |
| Shares redeemed | (2,262) | (2,841) | (51,403) | (67,748) |
| Net increase (decrease) | 1,517 | 184 | $32,883 | $2,530 |
| Class I | ||||
| Shares sold | 8,618 | 5,735 | $256,826 | $172,958 |
| Reinvestment of distributions | 2,131 | 2,348 | 60,822 | 67,135 |
| Shares redeemed | (6,687) | (10,306) | (197,913) | (308,759) |
| Net increase (decrease) | 4,062 | (2,223) | $119,735 | $(68,666) |
| Class Z | ||||
| Shares sold | 1,152 | 611 | $33,575 | $18,714 |
| Reinvestment of distributions | 77 | 18 | 2,198 | 526 |
| Shares redeemed | (454) | (159) | (13,089) | (4,829) |
| Net increase (decrease) | 775 | 470 | $22,684 | $14,411 |
12. Other.
The Fund's organizational documents provide former and current trustees and officers with a limited indemnification against liabilities arising in connection with the performance of their duties to the Fund. In the normal course of business, the Fund may also enter into contracts that provide general indemnifications. The Fund's maximum exposure under these arrangements is unknown as this would be dependent on future claims that may be made against the Fund. The risk of material loss from such claims is considered remote.
Report of Independent Registered Public Accounting Firm
To the Trustees of Fidelity Advisor Series I and Shareholders of Fidelity Advisor® Small Cap Fund:
In our opinion, the accompanying statement of assets and liabilities, including the schedule of investments, and the related statements of operations and of changes in net assets and the financial highlights present fairly, in all material respects, the financial position of Fidelity Advisor® Small Cap Fund (a fund of Fidelity Advisor Series I) at November 30, 2015, the results of its operations for the year then ended, the changes in its net assets for each of the two years in the period then ended and the financial highlights for each of the periods indicated, in conformity with accounting principles generally accepted in the United States of America. These financial statements and financial highlights (hereafter referred to as “financial statements”) are the responsibility of the Fidelity Advisor® Small Cap Fund’s management. Our responsibility is to express an opinion on these financial statements based on our audits. We conducted our audits of these financial statements in accordance with the standards of the Public Company Accounting Oversight Board (United States). Those standards require that we plan and perform the audit to obtain reasonable assurance about whether the financial statements are free of material misstatement. An audit includes examining, on a test basis, evidence supporting the amounts and disclosures in the financial statements, assessing the accounting principles used and significant estimates made by management, and evaluating the overall financial statement presentation. We believe that our audits, which included confirmation of securities at November 30, 2015 by correspondence with the custodian and brokers, provide a reasonable basis for our opinion.
PricewaterhouseCoopers LLP
Boston, Massachusetts
January 15, 2016
Trustees and Officers
The Trustees, Members of the Advisory Board (if any), and officers of the trust and fund, as applicable, are listed below. The Board of Trustees governs the fund and is responsible for protecting the interests of shareholders. The Trustees are experienced executives who meet periodically throughout the year to oversee the fund's activities, review contractual arrangements with companies that provide services to the fund, oversee management of the risks associated with such activities and contractual arrangements, and review the fund's performance. Each of the Trustees oversees 170 funds.
The Trustees hold office without limit in time except that (a) any Trustee may resign; (b) any Trustee may be removed by written instrument, signed by at least two-thirds of the number of Trustees prior to such removal; (c) any Trustee who requests to be retired or who has become incapacitated by illness or injury may be retired by written instrument signed by a majority of the other Trustees; and (d) any Trustee may be removed at any special meeting of shareholders by a two-thirds vote of the outstanding voting securities of the trust. Each Trustee who is not an interested person (as defined in the 1940 Act) of the trust and the fund is referred to herein as an Independent Trustee. Each Independent Trustee shall retire not later than the last day of the calendar year in which his or her 75th birthday occurs. The Independent Trustees may waive this mandatory retirement age policy with respect to individual Trustees. Officers and Advisory Board Members hold office without limit in time, except that any officer or Advisory Board Member may resign or may be removed by a vote of a majority of the Trustees at any regular meeting or any special meeting of the Trustees. Except as indicated, each individual has held the office shown or other offices in the same company for the past five years.
The fund’s Statement of Additional Information (SAI) includes more information about the Trustees. To request a free copy, call Fidelity at 1-877-208-0098.
Experience, Skills, Attributes, and Qualifications of the Trustees. The Governance and Nominating Committee has adopted a statement of policy that describes the experience, qualifications, attributes, and skills that are necessary and desirable for potential Independent Trustee candidates (Statement of Policy). The Board believes that each Trustee satisfied at the time he or she was initially elected or appointed a Trustee, and continues to satisfy, the standards contemplated by the Statement of Policy. The Governance and Nominating Committee also engages professional search firms to help identify potential Independent Trustee candidates who have the experience, qualifications, attributes, and skills consistent with the Statement of Policy. From time to time, additional criteria based on the composition and skills of the current Independent Trustees, as well as experience or skills that may be appropriate in light of future changes to board composition, business conditions, and regulatory or other developments, have also been considered by the professional search firms and the Governance and Nominating Committee. In addition, the Board takes into account the Trustees' commitment and participation in Board and committee meetings, as well as their leadership of standing and ad hoc committees throughout their tenure.
In determining that a particular Trustee was and continues to be qualified to serve as a Trustee, the Board has considered a variety of criteria, none of which, in isolation, was controlling. The Board believes that, collectively, the Trustees have balanced and diverse experience, qualifications, attributes, and skills, which allow the Board to operate effectively in governing the fund and protecting the interests of shareholders. Information about the specific experience, skills, attributes, and qualifications of each Trustee, which in each case led to the Board's conclusion that the Trustee should serve (or continue to serve) as a trustee of the fund, is provided below.
Board Structure and Oversight Function. James C. Curvey is an interested person and currently serves as Chairman. The Trustees have determined that an interested Chairman is appropriate and benefits shareholders because an interested Chairman has a personal and professional stake in the quality and continuity of services provided to the fund. Independent Trustees exercise their informed business judgment to appoint an individual of their choosing to serve as Chairman, regardless of whether the Trustee happens to be independent or a member of management. The Independent Trustees have determined that they can act independently and effectively without having an Independent Trustee serve as Chairman and that a key structural component for assuring that they are in a position to do so is for the Independent Trustees to constitute a substantial majority for the Board. The Independent Trustees also regularly meet in executive session. Ned C. Lautenbach serves as Chairman of the Independent Trustees and as such (i) acts as a liaison between the Independent Trustees and management with respect to matters important to the Independent Trustees and (ii) with management prepares agendas for Board meetings.
Fidelity® funds are overseen by different Boards of Trustees. The fund's Board oversees Fidelity's high income and certain equity funds, and other Boards oversee Fidelity's investment-grade bond, money market, asset allocation, and sector funds. The asset allocation funds may invest in Fidelity® funds overseen by the fund's Board. The use of separate Boards, each with its own committee structure, allows the Trustees of each group of Fidelity® funds to focus on the unique issues of the funds they oversee, including common research, investment, and operational issues. On occasion, the separate Boards establish joint committees to address issues of overlapping consequences for the Fidelity® funds overseen by each Board.
The Trustees operate using a system of committees to facilitate the timely and efficient consideration of all matters of importance to the Trustees, the fund, and fund shareholders and to facilitate compliance with legal and regulatory requirements and oversight of the fund's activities and associated risks. The Board, acting through its committees, has charged FMR and its affiliates with (i) identifying events or circumstances the occurrence of which could have demonstrably adverse effects on the fund's business and/or reputation; (ii) implementing processes and controls to lessen the possibility that such events or circumstances occur or to mitigate the effects of such events or circumstances if they do occur; and (iii) creating and maintaining a system designed to evaluate continuously business and market conditions in order to facilitate the identification and implementation processes described in (i) and (ii) above. Because the day-to-day operations and activities of the fund are carried out by or through FMR, its affiliates, and other service providers, the fund's exposure to risks is mitigated but not eliminated by the processes overseen by the Trustees. While each of the Board's committees has responsibility for overseeing different aspects of the fund's activities, oversight is exercised primarily through the Operations, Audit, and Compliance Committees. In addition, the Independent Trustees have worked with FMR to enhance the Board's oversight of investment and financial risks, legal and regulatory risks, technology risks, and operational risks, including the development of additional risk reporting to the Board. For example, a working group comprised of Independent Trustees and FMR has worked and continues to work to review the Fidelity® funds' valuation-related activities, reporting and risk management. Appropriate personnel, including but not limited to the fund's Chief Compliance Officer (CCO), FMR's internal auditor, the independent accountants, the fund's Treasurer and portfolio management personnel, make periodic reports to the Board's committees, as appropriate, including an annual review of Fidelity's risk management program for the Fidelity® funds. The responsibilities of each standing committee, including their oversight responsibilities, are described further under "Standing Committees of the Trustees."
Interested Trustees*:
Correspondence intended for a Trustee who is an interested person may be sent to Fidelity Investments, 245 Summer Street, Boston, Massachusetts 02210.
Name, Year of Birth; Principal Occupations and Other Relevant Experience+
James C. Curvey (1935)
Year of Election or Appointment: 2007
Trustee
Chairman of the Board of Trustees
Mr. Curvey also serves as Trustee of other Fidelity® funds. Mr. Curvey is a Director of Fidelity Research & Analysis Co. (investment adviser firm, 2009-present), and Vice Chairman (2007-present) and Director of FMR LLC (diversified financial services company). In addition, Mr. Curvey serves as an Overseer for the Boston Symphony Orchestra and a member of the board of Artis-Naples, Naples, Florida, and as a Trustee for Brewster Academy, Wolfeboro, New Hampshire. Previously, Mr. Curvey served as a Director of Fidelity Investments Money Management, Inc. (investment adviser firm, 2009-2014) and a Director of FMR and FMR Co., Inc. (investment adviser firms, 2007-2014).
Charles S. Morrison (1960)
Year of Election or Appointment: 2014
Trustee
Mr. Morrison also serves as Trustee of other funds. He serves as a Director of Fidelity Investments Money Management, Inc. (FIMM) (investment adviser firm, 2014-present), Director of Fidelity SelectCo, LLC (investment adviser firm, 2014-present), President, Asset Management (2014-present), and is an employee of Fidelity Investments. Previously, Mr. Morrison served as Vice President of Fidelity's Fixed Income and Asset Allocation Funds (2012-2014), President, Fixed Income (2011-2014), Vice President of Fidelity's Money Market Funds (2005-2009), President, Money Market Group Leader of FMR (investment adviser firm, 2009), and Senior Vice President, Money Market Group of FMR (2004-2009). Mr. Morrison also served as Vice President of Fidelity's Bond Funds (2002-2005), certain Balanced Funds (2002-2005), and certain Asset Allocation Funds (2002-2007), and as Senior Vice President (2002-2005) of Fidelity's Bond Division.
* Determined to be an “Interested Trustee” by virtue of, among other things, his or her affiliation with the trust or various entities under common control with FMR.
+ The information includes the Trustee's principal occupation during the last five years and other information relating to the experience, attributes, and skills relevant to the Trustee's qualifications to serve as a Trustee, which led to the conclusion that the Trustee should serve as a Trustee for the fund.
Independent Trustees:
Correspondence intended for an Independent Trustee may be sent to Fidelity Investments, P.O. Box 55235, Boston, Massachusetts 02205-5235.
Name, Year of Birth; Principal Occupations and Other Relevant Experience+
Dennis J. Dirks (1948)
Year of Election or Appointment: 2005
Trustee
Mr. Dirks also serves as Trustee of other Fidelity® funds. Prior to his retirement in May 2003, Mr. Dirks was Chief Operating Officer and a member of the Board of The Depository Trust & Clearing Corporation (DTCC). He also served as President, Chief Operating Officer, and Board member of The Depository Trust Company (DTC) and President and Board member of the National Securities Clearing Corporation (NSCC). In addition, Mr. Dirks served as Chief Executive Officer and Board member of the Government Securities Clearing Corporation, Chief Executive Officer and Board member of the Mortgage-Backed Securities Clearing Corporation, as a Trustee and a member of the Finance Committee of Manhattan College (2005-2008), as a Trustee and a member of the Finance Committee of AHRC of Nassau County (2006-2008), and as a member of the Independent Directors Council (IDC) Governing Council (2010-2015). Mr. Dirks is a member of the Board of Directors for The Brookville Center for Children's Services, Inc. (2009-present).
Alan J. Lacy (1953)
Year of Election or Appointment: 2008
Trustee
Mr. Lacy also serves as Trustee of other Fidelity® funds. Mr. Lacy serves as a member of the Board of Directors of Dave & Buster's Entertainment, Inc. (restaurant and entertainment complexes, 2010-present) and Bristol-Myers Squibb Company (global pharmaceuticals, 2008-present). In addition, Mr. Lacy served as Senior Adviser (2007-2014) of Oak Hill Capital Partners, L.P. (private equity) and also served as Chief Executive Officer (2000-2005) and Vice Chairman (2005-2006) of Sears Holdings Corporation and Sears, Roebuck and Co. (retail). Mr. Lacy is a member of the Board of Trustees of The National Parks Conservation Association (2006-present). Previously, Mr. Lacy served as Chairman of the Board of Trustees of the National Parks Conservation Association (2008-2011) and as a member of the Board of Directors for The Western Union Company (global money transfer, 2006-2011), The Hillman Companies, Inc. (hardware wholesalers, 2010-2014), and Earth Fare, Inc. (retail grocery, 2010-2014).
Ned C. Lautenbach (1944)
Year of Election or Appointment: 2000
Trustee
Chairman of the Independent Trustees
Mr. Lautenbach also serves as Trustee of other Fidelity® funds. Mr. Lautenbach currently serves as the Lead Director of the Eaton Corporation Board of Directors (diversified industrial, 1997-present). Mr. Lautenbach is Chairman of the Board of Directors of Artis-Naples in Naples, Florida (2012-present), a member of the Council on Foreign Relations (1994-present), and a member of the Board of Governors, State University System of Florida (2013-present). Previously, Mr. Lautenbach was a Partner/Advisory Partner at Clayton, Dubilier & Rice, LLC (private equity investment, 1998-2010), as well as a Director of Sony Corporation (2006-2007).
Joseph Mauriello (1944)
Year of Election or Appointment: 2008
Trustee
Mr. Mauriello also serves as Trustee of other Fidelity® funds. Prior to his retirement in January 2006, Mr. Mauriello served in numerous senior management positions including Deputy Chairman and Chief Operating Officer (2004-2005), and Vice Chairman of Financial Services (2002-2004) of KPMG LLP US (professional services, 1965-2005). Mr. Mauriello currently serves as a member of the Board of Directors of XL Group plc. (global insurance and re-insurance, 2006-present) and the Independent Directors Council (IDC) Governing Council (2015-present). Previously, Mr. Mauriello served as a Director of the Hamilton Funds of the Bank of New York (2006-2007) and of Arcadia Resources Inc. (health care services and products, 2007-2012).
Robert W. Selander (1950)
Year of Election or Appointment: 2011
Trustee
Mr. Selander also serves as Trustee of other Fidelity® funds. Mr. Selander serves as a Director of The Western Union Company (global money transfer, 2014-present). Previously, Mr. Selander served as a Member of the Advisory Board of other Fidelity® funds (2011), and Executive Vice Chairman (2010), Chief Executive Officer (2009-2010), and President and Chief Executive Officer (1997-2009) of Mastercard, Inc.
Cornelia M. Small (1944)
Year of Election or Appointment: 2005
Trustee
Ms. Small also serves as Trustee of other Fidelity® funds. Ms. Small is a member of the Board of Directors (2009-present) and Chair of the Investment Committee (2010-present) of the Teagle Foundation. Ms. Small also serves on the Investment Committee of the Berkshire Taconic Community Foundation (2008-present). Previously, Ms. Small served as Chairperson (2002-2008) and a member of the Investment Committee and Chairperson (2008-2012) and a member of the Board of Trustees of Smith College. In addition, Ms. Small served as Chief Investment Officer, Director of Global Equity Investments, and a member of the Board of Directors of Scudder, Stevens & Clark and Scudder Kemper Investments.
William S. Stavropoulos (1939)
Year of Election or Appointment: 2002
Trustee
Vice Chairman of the Independent Trustees
Mr. Stavropoulos also serves as Trustee of other Fidelity® funds. Mr. Stavropoulos serves as President and Founder of the Michigan Baseball Foundation, the Great Lakes Loons (2007-present). Mr. Stavropoulos is Chairman Emeritus of the Board of Directors of The Dow Chemical Company, where he previously served in numerous senior management positions, including President, CEO (1995-2000; 2002-2004), Chairman of the Executive Committee (2000-2006), and as a member of the Board of Directors (1990-2006). Currently, Mr. Stavropoulos is Chairman of the Board of Directors of Univar Inc. (global distributor of commodity and specialty chemicals), a Director of Teradata Corporation (data warehousing and technology solutions), and Maersk Inc. (industrial conglomerate), and a member of the Advisory Board for Metalmark Capital LLC (private equity investment, 2005-present). Mr. Stavropoulos is an operating advisor to Clayton, Dubilier & Rice, LLC (private equity investment). In addition, Mr. Stavropoulos is a member of the University of Notre Dame Advisory Council for the College of Science, a Trustee of the Rollin L. Gerstacker Foundation, and a Director of the Naples Philharmonic Center for the Arts. Previously, Mr. Stavropoulos served as a Director of Chemical Financial Corporation (bank holding company, 1993-2012) and Tyco International, Ltd. (multinational manufacturing and services, 2007-2012).
David M. Thomas (1949)
Year of Election or Appointment: 2008
Trustee
Mr. Thomas also serves as Trustee of other Fidelity® funds. Mr. Thomas serves as Non-Executive Chairman of the Board of Directors of Fortune Brands Home and Security (home and security products, 2011-present), as a member of the Board of Directors (2004-present) and Presiding Director (2013-present) of Interpublic Group of Companies, Inc. (marketing communication), and as a member of the Board of Trustees of the University of Florida (2013-present). Previously, Mr. Thomas served as Executive Chairman (2005-2006) and Chairman and Chief Executive Officer (2000-2005) of IMS Health, Inc. (pharmaceutical and healthcare information solutions), and a Director of Fortune Brands, Inc. (consumer products, 2000-2011).
+ The information includes the Trustee's principal occupation during the last five years and other information relating to the experience, attributes, and skills relevant to the Trustee's qualifications to serve as a Trustee, which led to the conclusion that the Trustee should serve as a Trustee for the fund.
Advisory Board Members and Officers:
Correspondence intended for an officer or Peter S. Lynch may be sent to Fidelity Investments, 245 Summer Street, Boston, Massachusetts 02210. Officers appear below in alphabetical order.
Name, Year of Birth; Principal Occupation
Peter S. Lynch (1944)
Year of Election or Appointment: 2003
Member of the Advisory Board
Mr. Lynch also serves as Member of the Advisory Board of other Fidelity® funds. Mr. Lynch is Vice Chairman and a Director of FMR (investment adviser firm) and FMR Co., Inc. (investment adviser firm). In addition, Mr. Lynch serves as a Trustee of Boston College and as the Chairman of the Inner-City Scholarship Fund. Previously, Mr. Lynch served on the Special Olympics International Board of Directors (1997-2006).
Elizabeth Paige Baumann (1968)
Year of Election or Appointment: 2012
Anti-Money Laundering (AML) Officer
Ms. Baumann also serves as AML Officer of other funds. She is Chief AML Officer of FMR LLC (diversified financial services company, 2012-present) and is an employee of Fidelity Investments. Previously, Ms. Baumann served as Vice President and Deputy Anti-Money Laundering Officer (2007-2012).
Marc R. Bryant (1966)
Year of Election or Appointment: 2015
Secretary and Chief Legal Officer (CLO)
Mr. Bryant also serves as Secretary and CLO of other funds. Mr. Bryant serves as CLO, Secretary, and Senior Vice President of Fidelity Management & Research Company (investment adviser firm, 2015-present) and FMR Co., Inc. (investment adviser firm, 2015-present); Secretary of Fidelity SelectCo, LLC (investment adviser firm, 2015-present) and Fidelity Investments Money Management, Inc. (investment adviser firm, 2015-present); and CLO of Fidelity Management & Research (Hong Kong) Limited (investment adviser firm, 2015-present). He is Senior Vice President and Deputy General Counsel of FMR LLC (diversified financial services company). Previously, Mr. Bryant served as Secretary and CLO of Fidelity Rutland Square Trust II (2010-2014) and Assistant Secretary of Fidelity's Fixed Income and Asset Allocation Funds (2013-2015). Prior to joining Fidelity Investments, Mr. Bryant served as a Senior Vice President and the Head of Global Retail Legal for AllianceBernstein L.P. (2006-2010), and as the General Counsel for ProFund Advisors LLC (2001-2006).
William C. Coffey (1969)
Year of Election or Appointment: 2009
Assistant Secretary
Mr. Coffey also serves as Assistant Secretary of other funds. He is Senior Vice President and Deputy General Counsel of FMR LLC (diversified financial services company, 2010-present), and is an employee of Fidelity Investments. Previously, Mr. Coffey served as Vice President and Associate General Counsel of FMR LLC (2005-2009).
Jonathan Davis (1968)
Year of Election or Appointment: 2010
Assistant Treasurer
Mr. Davis also serves as Assistant Treasurer of other funds, and is an employee of Fidelity Investments. Previously, Mr. Davis served as Vice President and Associate General Counsel of FMR LLC (diversified financial services company, 2003-2010).
Adrien E. Deberghes (1967)
Year of Election or Appointment: 2008
Deputy Treasurer
Mr. Deberghes also serves as an officer of other funds. He is an employee of Fidelity Investments (2008-present). Prior to joining Fidelity Investments, Mr. Deberghes was Senior Vice President of Mutual Fund Administration at State Street Corporation (2007-2008), Senior Director of Mutual Fund Administration at Investors Bank & Trust (2005-2007), and Director of Finance for Dunkin' Brands (2000-2005).
Stephanie J. Dorsey (1969)
Year of Election or Appointment: 2010
Assistant Treasurer
Ms. Dorsey also serves as an officer of other funds. She is an employee of Fidelity Investments (2008-present) and has served in other fund officer roles. Prior to joining Fidelity Investments, Ms. Dorsey served as Treasurer (2004-2008) of the JPMorgan Mutual Funds and Vice President (2004-2008) of JPMorgan Chase Bank.
Howard J. Galligan III (1966)
Year of Election or Appointment: 2014
Chief Financial Officer
Mr. Galligan also serves as Chief Financial Officer of other funds. Mr. Galligan serves as President of Fidelity Pricing and Cash Management Services (FPCMS) (2014-present) and as a Director of Strategic Advisers, Inc. (investment adviser firm, 2008-present). Previously, Mr. Galligan served as Chief Administrative Officer of Asset Management (2011-2014) and Chief Operating Officer and Senior Vice President of Investment Support for Strategic Advisers, Inc. (2003-2011).
Scott C. Goebel (1968)
Year of Election or Appointment: 2015
Vice President
Mr. Goebel serves as Vice President of other funds and is an employee of Fidelity Investments (2001-present). Previously, Mr. Goebel served as Secretary of Fidelity SelectCo, LLC (investment adviser firm, 2013-2015), Fidelity Investments Money Management, Inc. (FIMM) (investment adviser firm, 2010-2015), and Fidelity Research and Analysis Company (FRAC) (investment adviser firm, 2010-2015); General Counsel, Secretary, and Senior Vice President of Fidelity Management & Research Company (investment adviser firm, 2008-2015) and FMR Co., Inc. (investment adviser firm, 2008-2015); Assistant Secretary of Fidelity Management & Research (Japan) Limited (investment adviser firm, 2008-2015) and FMR Investment Management (U.K.) Limited (investment adviser firm, 2008-2015); Chief Legal Officer (CLO) of Fidelity Management & Research (Hong Kong) Limited (investment adviser firm, 2008-2015); Secretary and CLO of certain Fidelity® funds (2008-2015); Assistant Secretary of FIMM (2008-2010), FRAC (2008-2010), and certain funds (2007-2008); and as Vice President and Secretary of Fidelity Distributors Corporation (FDC) (2005-2007).
Thomas C. Hense (1964)
Year of Election or Appointment: 2008, 2010, or 2015
Vice President
Mr. Hense serves as Vice President of Fidelity Advisor® Multi-Asset Income Fund (2015) and other funds (High Income (2008), Small Cap (2008), and Value (2010) funds), and is an employee of Fidelity Investments (1993-present). Previously, Mr. Hense served as a portfolio manager for Fidelity's Institutional Money Management Group (Pyramis) (2003-2008).
Brian B. Hogan (1964)
Year of Election or Appointment: 2009
Vice President
Mr. Hogan also serves as Trustee or Vice President of other funds. Mr. Hogan serves as a Director of Fidelity SelectCo, LLC (investment adviser firm, 2014-present) and President of the Equity Division of FMR (investment adviser firm, 2009-present). Previously, Mr. Hogan served as Senior Vice President, Equity Research of FMR (2006-2009) and as a portfolio manager.
Chris Maher (1972)
Year of Election or Appointment: 2013
Assistant Treasurer
Mr. Maher serves as Assistant Treasurer of other funds. Mr. Maher is Vice President of Valuation Oversight and is an employee of Fidelity Investments. Previously, Mr. Maher served as Vice President of Asset Management Compliance (2013), Vice President of the Program Management Group of FMR (investment adviser firm, 2010-2013), and Vice President of Valuation Oversight (2008-2010).
Kenneth B. Robins (1969)
Year of Election or Appointment: 2008
President and Treasurer
Mr. Robins also serves as an officer of other funds. Mr. Robins serves as Executive Vice President of Fidelity Investments Money Management, Inc. (FIMM) (investment adviser firm, 2013-present) and is an employee of Fidelity Investments (2004-present). Previously, Mr. Robins served in other fund officer roles.
Stacie M. Smith (1974)
Year of Election or Appointment: 2013
Deputy Treasurer
Ms. Smith also serves as an officer of other funds. She is an employee of Fidelity Investments (2009-present) and has served in other fund officer roles. Prior to joining Fidelity Investments, Ms. Smith served as Senior Audit Manager of Ernst & Young LLP (1996-2009).
Renee Stagnone (1975)
Year of Election or Appointment: 2013
Deputy Treasurer
Ms. Stagnone also serves as Deputy Treasurer of other funds. Ms. Stagnone is an employee of Fidelity Investments (1997-present).
Linda J. Wondrack (1964)
Year of Election or Appointment: 2014
Chief Compliance Officer
Ms. Wondrack also serves as Chief Compliance Officer of other funds. Ms. Wondrack is Executive Vice President and head of the Ethics Office and Asset Management Compliance for Fidelity Investments (2012-present). Ms. Wondrack also serves as Chief Compliance Officer of Fidelity SelectCo, LLC (investment adviser firm, 2014-present); Chief Compliance Officer of Impresa Management LLC (2013-present); and Chief Compliance Officer of FMR Co., Inc. (investment adviser firm), Fidelity Investments Money Management, Inc. (investment adviser firm), Fidelity Management & Research (Japan) Limited (investment adviser firm), FMR Investment Management (U.K.) Limited (investment adviser firm), Fidelity Management & Research (Hong Kong) (investment adviser firm), Fidelity Management & Research Company (investment adviser firm), FIAM LLC (investment adviser firm), and Strategic Advisers, Inc. (investment adviser firm), Ballyrock Investment Advisors LLC, and Northern Neck Investors LLC (2012-present). Previously, Ms. Wondrack served as Senior Vice President and Chief Compliance Officer for Columbia Management Investment Advisers, LLC (2005-2012); Chief Compliance Officer for certain funds within the Columbia Family of Funds (2007-2012); and Senior Vice President of Compliance Risk Management at Bank of America (2005-2010).
Joseph F. Zambello (1957)
Year of Election or Appointment: 2011
Deputy Treasurer
Mr. Zambello also serves as Deputy Treasurer of other funds. Mr. Zambello is an employee of Fidelity Investments (1991-present). Previously, Mr. Zambello served as Vice President of the Program Management Group of FMR (investment adviser firm, 2009-2011) and Vice President of the Transfer Agent Oversight Group (2005-2009).
Shareholder Expense Example
As a shareholder of the Fund, you incur two types of costs: (1) transaction costs, including sales charges (loads) on purchase payments or redemption proceeds, and (2) ongoing costs, including management fees, distribution and/or service (12b-1) fees and other Fund expenses. This Example is intended to help you understand your ongoing costs (in dollars) of investing in the Fund and to compare these costs with the ongoing costs of investing in other mutual funds.
The Example is based on an investment of $1,000 invested at the beginning of the period and held for the entire period (June 1, 2015 to November 30, 2015).
Actual Expenses
The first line of the accompanying table for each class of the Fund provides information about actual account values and actual expenses. You may use the information in this line, together with the amount you invested, to estimate the expenses that you paid over the period. Simply divide your account value by $1,000.00 (for example, an $8,600 account value divided by $1,000.00 = 8.6), then multiply the result by the number in the first line for a class of the Fund under the heading entitled "Expenses Paid During Period" to estimate the expenses you paid on your account during this period. In addition, the Fund, as a shareholder in the underlying Fidelity Central Funds, will indirectly bear its pro-rata share of the fees and expenses incurred by the underlying Fidelity Central Funds. These fees and expenses are not included in the Fund's annualized expense ratio used to calculate the expense estimate in the table below.
Hypothetical Example for Comparison Purposes
The second line of the accompanying table for each class of the Fund provides information about hypothetical account values and hypothetical expenses based on a Class' actual expense ratio and an assumed rate of return of 5% per year before expenses, which is not the Class' actual return. The hypothetical account values and expenses may not be used to estimate the actual ending account balance or expenses you paid for the period. You may use this information to compare the ongoing costs of investing in the Fund and other funds. To do so, compare this 5% hypothetical example with the 5% hypothetical examples that appear in the shareholder reports of the other funds. In addition, the Fund, as a shareholder in the underlying Fidelity Central Funds, will indirectly bear its pro-rata share of the fees and expenses incurred by the underlying Fidelity Central Funds. These fees and expenses are not included in the Fund's annualized expense ratio used to calculate the expense estimate in the table below.
Please note that the expenses shown in the table are meant to highlight your ongoing costs only and do not reflect any transaction costs. Therefore, the second line of the table is useful in comparing ongoing costs only, and will not help you determine the relative total costs of owning different funds. In addition, if these transactional costs were included, your costs would have been higher.
| Annualized Expense Ratio-A | Beginning Account Value June 1, 2015 | Ending Account Value November 30, 2015 | Expenses Paid During Period-B June 1, 2015 to November 30, 2015 | |
| Class A | 1.41% | |||
| Actual | $1,000.00 | $964.60 | $6.94 | |
| Hypothetical-C | $1,000.00 | $1,018.00 | $7.13 | |
| Class T | 1.64% | |||
| Actual | $1,000.00 | $963.70 | $8.07 | |
| Hypothetical-C | $1,000.00 | $1,016.85 | $8.29 | |
| Class B | 2.24% | |||
| Actual | $1,000.00 | $961.20 | $11.01 | |
| Hypothetical-C | $1,000.00 | $1,013.84 | $11.31 | |
| Class C | 2.16% | |||
| Actual | $1,000.00 | $961.40 | $10.62 | |
| Hypothetical-C | $1,000.00 | $1,014.24 | $10.91 | |
| Class I | 1.13% | |||
| Actual | $1,000.00 | $966.00 | $5.57 | |
| Hypothetical-C | $1,000.00 | $1,019.40 | $5.72 | |
| Class Z | .97% | |||
| Actual | $1,000.00 | $966.90 | $4.78 | |
| Hypothetical-C | $1,000.00 | $1,020.21 | $4.91 |
A Annualized expense ratio reflects expenses net of applicable fee waivers.
B Expenses are equal to each Class' annualized expense ratio, multiplied by the average account value over the period, multiplied by 183/365 (to reflect the one-half year period).
C 5% return per year before expenses
Distributions (Unaudited)
The Board of Trustees of Advisor Small Cap Fund voted to pay to shareholders of record at the opening of business on record date, the following distributions per share derived from capital gains realized from sales of portfolio securities and dividends from net investment income:
| Pay Date | Record Date | Dividends | Capital Gains | |
| Class A | 12/21/2015 | 12/18/2015 | $0.00 | $1.933 |
| 01/11/2016 | 01/08/2016 | $0.00 | $0.278 | |
| Class T | 12/21/2015 | 12/18/2015 | $0.00 | $1.933 |
| 01/11/2016 | 01/08/2016 | $0.00 | $0.278 | |
| Class B | 12/21/2015 | 12/18/2015 | $0.00 | $1.933 |
| 01/11/2016 | 01/08/2016 | $0.00 | $0.278 | |
| Class C | 12/21/2015 | 12/18/2015 | $0.00 | $1.933 |
| 01/11/2016 | 01/08/2016 | $0.00 | $0.278 |
The fund hereby designates as a capital gain dividend with respect to the taxable year ended November 30, 2015 $280,500,766 or, if subsequently determined to be different, the net capital gain of such year.
The fund will notify shareholders in January 2016 of amounts for use in preparing 2015 income tax returns.
Board Approval of Investment Advisory Contracts and Management Fees
Fidelity Advisor Small Cap Fund
Each year, the Board of Trustees, including the Independent Trustees (together, the Board), votes on the renewal of the management contract with Fidelity Management & Research Company (FMR) and the sub-advisory agreements (together, the Advisory Contracts) for the fund. The Board, assisted by the advice of fund counsel and Independent Trustees' counsel, requests and considers a broad range of information relevant to the renewal of the Advisory Contracts throughout the year.
The Board meets regularly and, at each of its meetings, covers an extensive agenda of topics and materials and considers factors that are relevant to its annual consideration of the renewal of the fund's Advisory Contracts, including the services and support provided to the fund and its shareholders. The Board has established various standing committees (Committees), each composed of and chaired by Independent Trustees with varying backgrounds, to which the Board has assigned specific subject matter responsibilities in order to enhance effective decision-making by the Board. The Board, acting directly and through its Committees, requests and receives information concerning the annual consideration of the renewal of the fund's Advisory Contracts. The Board also meets as needed to consider matters specifically related to the Board's annual consideration of the renewal of the Advisory Contracts. Members of the Board may also meet with trustees of other Fidelity funds through ad hoc joint committees to discuss certain matters relevant to all of the Fidelity funds.
At its July 2015 meeting, the Board unanimously determined to renew the fund's Advisory Contracts. In reaching its determination, the Board considered all factors it believed relevant, including (i) the nature, extent, and quality of the services to be provided to the fund and its shareholders (including the investment performance of the fund); (ii) the competitiveness of the fund's management fee and total expense ratio relative to peer funds; (iii) the total costs of the services to be provided by and the profits to be realized by Fidelity from its relationship with the fund; and (iv) the extent to which (if any) economies of scale exist and would be realized as the fund grows, and whether any economies of scale are appropriately shared with fund shareholders.
In considering whether to renew the Advisory Contracts for the fund, the Board reached a determination, with the assistance of fund counsel and Independent Trustees' counsel and through the exercise of its business judgment, that the renewal of the Advisory Contracts was in the best interests of the fund and its shareholders and that the compensation payable under the Advisory Contracts was fair and reasonable. The Board's decision to renew the Advisory Contracts was not based on any single factor, but rather was based on a comprehensive consideration of all the information provided to the Board at its meetings throughout the year. The Board, in reaching its determination to renew the Advisory Contracts, was aware that shareholders of the fund have a broad range of investment choices available to them, including a wide choice among funds offered by Fidelity's competitors, and that the fund's shareholders, who have the opportunity to review and weigh the disclosure provided by the fund in its prospectus and other public disclosures, have chosen to invest in this fund, which is part of the Fidelity family of funds.
Nature, Extent, and Quality of Services Provided. The Board considered Fidelity's staffing as it relates to the fund, including the backgrounds of investment personnel of Fidelity, and also considered the fund's investment objective, strategies, and related investment philosophy. The Independent Trustees also had discussions with senior management of Fidelity's investment operations and investment groups. The Board considered the structure of the portfolio manager compensation program and whether this structure provides appropriate incentives to act in the best interests of the fund. Additionally, the Board considered the portfolio managers' investments, if any, in the funds that they manage.Resources Dedicated to Investment Management and Support Services. The Board and the Fund Oversight and Research Committees reviewed the general qualifications and capabilities of Fidelity's investment staff, including its size, education, experience, and resources, as well as Fidelity's approach to recruiting, training, managing, and compensating investment personnel. The Board noted that Fidelity has continued to increase the resources devoted to non-U.S. offices, including expansion of Fidelity's global investment organization. The Board also noted that Fidelity's analysts have extensive resources, tools and capabilities that allow them to conduct sophisticated quantitative and fundamental analysis, as well as credit analysis of issuers, counterparties and guarantors. Further, the Board considered that Fidelity's investment professionals have sufficient access to global information and data so as to provide competitive investment results over time, and that those professionals also have access to sophisticated tools that permit them to assess portfolio construction and risk and performance attribution characteristics continuously, as well as to transmit new information and research conclusions rapidly around the world. Additionally, in its deliberations, the Board considered Fidelity's trading, risk management, and compliance capabilities and resources, which are integral parts of the investment management process.Shareholder and Administrative Services. The Board considered (i) the nature, extent, quality, and cost of advisory, administrative, and shareholder services performed by FMR, the sub-advisers (together with FMR, the Investment Advisers), and their affiliates under the Advisory Contracts and under separate agreements covering transfer agency, pricing and bookkeeping, and securities lending services for the fund; (ii) the nature and extent of the supervision of third party service providers, principally custodians and subcustodians; and (iii) the resources devoted to, and the record of compliance with, the fund's compliance policies and procedures. The Board also reviewed the allocation of fund brokerage, including allocations to brokers affiliated with the Investment Advisers, the use of brokerage commissions to pay fund expenses, and the use of "soft" commission dollars to pay for research services.The Board noted that the growth of fund assets over time across the complex allows Fidelity to reinvest in the development of services designed to enhance the value or convenience of the Fidelity funds as investment vehicles. These services include 24-hour access to account information and market information through telephone representatives and over the Internet, investor education materials and asset allocation tools, and the expanded availability of Fidelity Investor Centers.In 2014, the Board formed an ad hoc Committee on Transfer Agency Fees to review the variety of transfer agency fee structures throughout the industry and Fidelity's competitive positioning with respect to industry participants.Investment in a Large Fund Family. The Board considered the benefits to shareholders of investing in a Fidelity fund, including the benefits of investing in a fund that is part of a large family of funds offering a variety of investment disciplines and providing a large variety of mutual fund investor services. The Board noted that Fidelity had taken, or had made recommendations that resulted in the Fidelity funds taking, a number of actions over the previous year that benefited particular funds, including (i) continuing to dedicate additional resources to investment research and to the support of the senior management team that oversees asset management; (ii) continuing efforts to enhance Fidelity's global research capabilities; (iii) launching new funds and making other enhancements to meet client needs; (iv) reducing management fees and total expenses for certain index funds and diversified international funds; (v) continuing to launch dedicated lower cost underlying funds to meet portfolio construction needs related to expanding underlying fund options for Fidelity funds of funds, specifically for the Freedom Fund product lines; (vi) rationalizing product lines and gaining increased efficiencies through fund mergers; (vii) launching active fixed-income exchange-traded funds; (viii) continuing to develop, acquire and implement systems and technology to improve services to the funds and information security and to increase efficiency; (ix) implementing investment enhancements to further strengthen Fidelity's target date product line to increase investors' probability of success in achieving their goals; (x) modifying the eligibility criteria for certain share classes to accommodate roll-over assets from employer-sponsored retirement plans; (xi) launching a new Class W of the Freedom Index Funds to attract and retain Fidelity record-kept retirement plan assets; and (xii) implementing changes to Fidelity's money market product line in response to recent money market regulatory reforms.Investment Performance. The Board considered whether the fund has operated in accordance with its investment objective, as well as its record of compliance with its investment restrictions and its performance history.The Board took into account discussions with representatives of the Investment Advisers about fund investment performance that occur at Board meetings throughout the year. In this regard the Board noted that as part of regularly scheduled fund reviews and other reports to the Board on fund performance, the Board considers annualized return information for the fund, for different time periods, measured against a securities market index ("benchmark index") and a peer group of funds with similar objectives ("peer group"), if any. In its evaluation of fund investment performance, the Board gave particular attention to information indicating changes in performance of certain Fidelity funds for specific time periods and discussed with the Investment Advisers the reasons for any overperformance or underperformance.In addition to reviewing absolute and relative fund performance, the Independent Trustees periodically consider the appropriateness of fund performance metrics in evaluating the results achieved. In general, the Independent Trustees believe that fund performance should be evaluated based on net performance (after fees and expenses) of both the highest performing and lowest performing fund share classes, where applicable, compared to appropriate benchmark indices, over appropriate time periods that may include full market cycles, and compared to peer groups, as applicable, over the same periods, taking into account relevant factors including the following: general market conditions; issuer-specific information; and fund cash flows and other factors.The Independent Trustees recognize that shareholders evaluate performance on a net basis over their own holding periods, for which one-, three-, and five-year periods are often used as a proxy. For this reason, the performance information reviewed by the Board also included net cumulative calendar year total return information for the fund and an appropriate benchmark index and peer group for the most recent one-, three-, and five-year periods, as shown below. Returns are shown compared to the 25th percentile (top of box, 75% beaten) and 75th percentile (bottom of box, 25% beaten) of the peer universe.Fidelity Advisor Small Cap Fund
Fidelity Advisor Small Cap Fund
![]()
ASCF-ANN-0116
1.713164.118
Fidelity Advisor® Dividend Growth Fund Class I (formerly Institutional Class) Annual Report November 30, 2015 |
|
Contents
Board Approval of Investment Advisory Contracts and Management Fees |
To view a fund's proxy voting guidelines and proxy voting record for the 12-month period ended June 30, visit http://www.fidelity.com/proxyvotingresults or visit the Securities and Exchange Commission's (SEC) web site at http://www.sec.gov.
You may also call 1-877-208-0098 to request a free copy of the proxy voting guidelines.
Standard & Poor's, S&P and S&P 500 are registered service marks of The McGraw-Hill Companies, Inc. and have been licensed for use by Fidelity Distributors Corporation.
Other third-party marks appearing herein are the property of their respective owners.
All other marks appearing herein are registered or unregistered trademarks or service marks of FMR LLC or an affiliated company. © 2016 FMR LLC. All rights reserved.
This report and the financial statements contained herein are submitted for the general information of the shareholders of the Fund. This report is not authorized for distribution to prospective investors in the Fund unless preceded or accompanied by an effective prospectus.
A fund files its complete schedule of portfolio holdings with the SEC for the first and third quarters of each fiscal year on Form N-Q. Forms N-Q are available on the SEC’s web site at http://www.sec.gov. A fund's Forms N-Q may be reviewed and copied at the SEC’s Public Reference Room in Washington, DC. Information regarding the operation of the SEC's Public Reference Room may be obtained by calling 1-800-SEC-0330.
For a complete list of a fund's portfolio holdings, view the most recent holdings listing, semiannual report, or annual report on Fidelity's web site at http://www.fidelity.com, http://www.advisor.fidelity.com, or http://www.401k.com, as applicable.
NOT FDIC INSURED •MAY LOSE VALUE •NO BANK GUARANTEE
Neither the Fund nor Fidelity Distributors Corporation is a bank.
Performance: The Bottom Line
Average annual total return reflects the change in the value of an investment, assuming reinvestment of distributions from dividend income and capital gains (the profits earned upon the sale of securities that have grown in value, if any) and assuming a constant rate of performance each year.
The hypothetical investment and the average annual total returns do not reflect the deduction of taxes that a shareholder would pay on fund distributions or the redemption of fund shares.
During periods of reimbursement by Fidelity, a fund’s total return will be greater than it would be had the reimbursement not occurred.
How a fund did yesterday is no guarantee of how it will do tomorrow.
Average Annual Total Returns
| For the periods ended November 30, 2015 | Past 1 year | Past 5 years | Past 10 years |
| Class I | (0.14)% | 11.77% | 6.96% |
$10,000 Over 10 Years
Let's say hypothetically that $10,000 was invested in Fidelity Advisor® Dividend Growth Fund - Class I on November 30, 2005.
The chart shows how the value of your investment would have changed, and also shows how the S&P 500® Index performed over the same period.
| Period Ending Values | ||
| $19,604 | Fidelity Advisor® Dividend Growth Fund - Class I | |
| $20,574 | S&P 500® Index | |
Management's Discussion of Fund Performance
Market Recap: U.S. stocks gained modestly for the 12 months ending November 30, 2015, despite a steep decline in August and September on concern about slowing economic growth in China. The S&P 500® index rebounded in October and gained 2.75% for the year. Stocks benefited late in the period amid waning expectations for a near-term interest-rate hike by the U.S. Federal Reserve, more economic stimulus in Europe and an interest-rate cut in China. Growth stocks in the benchmark far outpaced their value counterparts, as investors continued to seek growth in a subpar economic environment. Sector performance varied widely, with more than 26 percentage points separating the leader from the laggard. Consumer discretionary (+14%) secured the top spot, benefiting from a combination of rising personal income and still-benign inflation. Information technology (+7%) and health care (+4%) also outpaced the broad market. Conversely, the energy sector (-12%) performed worst, stymied by depressed commodity prices that also hit materials (-5%). Telecommunication services (-5%) and utilities (-4%), considered defensive sectors less sensitive to the economy, also lost ground. At period end, investors remained focused on the potential global implications of a stronger U.S. dollar and how China’s transition toward a consumption-led economy may affect corporate earnings.Comments from Portfolio Manager Ramona Persaud: For the year, the fund’s share classes (excluding sales charges, if applicable) declined modestly, lagging the benchmark S&P 500® index. The market's preference for growth-oriented names the past year made it a challenging environment for our value- and quality-focused stock-picking approach. Among sectors, positioning in consumer discretionary was by far the biggest relative detractor, followed by stock picking in information technology and health care. Looking at individual stocks, I avoided index component and e-commerce giant Amazon.com because it did not fit my investment philosophy. Unfortunately for the fund, the stock outperformed the past year, which dragged on the fund's relative result. Of note, the fund’s foreign holdings hurt against a rising dollar. Included was a non-index stake in Canada-based Potash Corp of Saskatchewan, which hurt as the stock tumbled amid lower demand and declining potash prices. Turning to positives, successful positioning in industrials contributed meaningfully to performance. The fund’s stake in videogame publisher Activision Blizzard contributed.The views expressed above reflect those of the portfolio manager(s) only through the end of the period as stated on the cover of this report and do not necessarily represent the views of Fidelity or any other person in the Fidelity organization. Any such views are subject to change at any time based upon market or other conditions and Fidelity disclaims any responsibility to update such views. These views may not be relied on as investment advice and, because investment decisions for a Fidelity fund are based on numerous factors, may not be relied on as an indication of trading intent on behalf of any Fidelity fund.
Investment Summary (Unaudited)
Top Ten Stocks as of November 30, 2015
| % of fund's net assets | % of fund's net assets 6 months ago | |
| Apple, Inc. | 4.8 | 4.6 |
| Microsoft Corp. | 3.1 | 2.4 |
| Johnson & Johnson | 3.0 | 2.5 |
| General Electric Co. | 3.0 | 2.1 |
| JPMorgan Chase & Co. | 2.8 | 2.6 |
| Wells Fargo & Co. | 2.5 | 2.3 |
| Exxon Mobil Corp. | 2.4 | 2.2 |
| Alphabet, Inc. Class C | 2.2 | 2.2 |
| Chevron Corp. | 2.1 | 2.2 |
| Bank of America Corp. | 1.8 | 1.7 |
| 27.7 |
Top Five Market Sectors as of November 30, 2015
| % of fund's net assets | % of fund's net assets 6 months ago | |
| Information Technology | 24.1 | 21.8 |
| Financials | 16.4 | 16.0 |
| Consumer Staples | 13.2 | 10.5 |
| Health Care | 12.9 | 16.4 |
| Industrials | 9.8 | 8.6 |
Asset Allocation (% of fund's net assets)
| As of November 30, 2015* | ||
| Stocks | 95.3% | |
| Convertible Securities | 0.1% | |
| Short-Term Investments and Net Other Assets (Liabilities) | 4.6% | |

* Foreign investments - 14.2%
| As of May 31, 2015* | ||
| Stocks | 97.8% | |
| Convertible Securities | 0.1% | |
| Short-Term Investments and Net Other Assets (Liabilities) | 2.1% | |

* Foreign investments - 16.3%
Investments November 30, 2015
Showing Percentage of Net Assets
| Common Stocks - 95.3% | |||
| Shares | Value (000s) | ||
| CONSUMER DISCRETIONARY - 7.8% | |||
| Diversified Consumer Services - 0.3% | |||
| H&R Block, Inc. | 95,806 | $3,515 | |
| Hotels, Restaurants & Leisure - 1.2% | |||
| Las Vegas Sands Corp. | 80,400 | 3,542 | |
| Wyndham Worldwide Corp. | 116,852 | 8,871 | |
| 12,413 | |||
| Leisure Products - 0.1% | |||
| Vista Outdoor, Inc. (a) | 33,900 | 1,493 | |
| Media - 1.7% | |||
| Altice NV Class A (a) | 195,300 | 3,000 | |
| Comcast Corp. Class A | 242,425 | 14,754 | |
| 17,754 | |||
| Multiline Retail - 2.1% | |||
| Dillard's, Inc. Class A | 91,400 | 6,855 | |
| Target Corp. | 199,100 | 14,435 | |
| 21,290 | |||
| Specialty Retail - 1.9% | |||
| AutoZone, Inc. (a) | 10,400 | 8,151 | |
| Foot Locker, Inc. | 156,391 | 10,165 | |
| Kingfisher PLC | 4,010 | 21 | |
| Staples, Inc. | 115,300 | 1,392 | |
| 19,729 | |||
| Textiles, Apparel & Luxury Goods - 0.5% | |||
| VF Corp. | 73,600 | 4,762 | |
| TOTAL CONSUMER DISCRETIONARY | 80,956 | ||
| CONSUMER STAPLES - 13.2% | |||
| Beverages - 4.7% | |||
| Constellation Brands, Inc. Class A (sub. vtg.) | 56,400 | 7,911 | |
| Dr. Pepper Snapple Group, Inc. | 87,311 | 7,836 | |
| PepsiCo, Inc. | 170,500 | 17,077 | |
| The Coca-Cola Co. | 373,410 | 15,915 | |
| 48,739 | |||
| Food & Staples Retailing - 3.6% | |||
| CVS Health Corp. | 183,391 | 17,255 | |
| Kroger Co. | 118,720 | 4,471 | |
| Rami Levi Chain Stores Hashikma Marketing 2006 Ltd. | 68,693 | 3,185 | |
| Walgreens Boots Alliance, Inc. | 148,523 | 12,480 | |
| 37,391 | |||
| Food Products - 0.6% | |||
| Greencore Group PLC | 812,005 | 4,130 | |
| Hilton Food Group PLC | 242,144 | 1,893 | |
| 6,023 | |||
| Household Products - 1.8% | |||
| Procter & Gamble Co. | 247,700 | 18,538 | |
| Personal Products - 0.2% | |||
| Edgewell Personal Care Co. (a) | 23,300 | 1,876 | |
| Tobacco - 2.3% | |||
| British American Tobacco PLC (United Kingdom) | 132,257 | 7,697 | |
| Imperial Tobacco Group PLC | 124,702 | 6,739 | |
| Reynolds American, Inc. | 213,700 | 9,884 | |
| 24,320 | |||
| TOTAL CONSUMER STAPLES | 136,887 | ||
| ENERGY - 6.3% | |||
| Oil, Gas & Consumable Fuels - 6.3% | |||
| Chevron Corp. | 234,990 | 21,459 | |
| Emerald Oil, Inc. warrants 2/4/16 (a) | 826 | 0 | |
| Exxon Mobil Corp. | 311,022 | 25,398 | |
| Imperial Oil Ltd. | 222,634 | 7,232 | |
| Kinder Morgan, Inc. | 26,538 | 626 | |
| Northern Oil & Gas, Inc. (a) | 128,694 | 660 | |
| PrairieSky Royalty Ltd. (b) | 121,700 | 2,337 | |
| Suncor Energy, Inc. | 253,380 | 7,001 | |
| 64,713 | |||
| FINANCIALS - 16.4% | |||
| Banks - 11.7% | |||
| Bank of America Corp. | 1,102,803 | 19,222 | |
| Citigroup, Inc. | 303,223 | 16,401 | |
| JPMorgan Chase & Co. | 437,993 | 29,205 | |
| PacWest Bancorp | 159,000 | 7,476 | |
| SunTrust Banks, Inc. | 181,900 | 7,898 | |
| U.S. Bancorp | 346,817 | 15,222 | |
| Wells Fargo & Co. | 467,790 | 25,775 | |
| 121,199 | |||
| Capital Markets - 0.9% | |||
| Diamond Hill Investment Group, Inc. | 7,501 | 1,652 | |
| Franklin Resources, Inc. | 84,400 | 3,538 | |
| The Blackstone Group LP | 116,290 | 3,632 | |
| 8,822 | |||
| Consumer Finance - 0.6% | |||
| American Express Co. | 82,200 | 5,889 | |
| Imperial Holdings, Inc. warrants 4/11/19 (a) | 4,481 | 1 | |
| 5,890 | |||
| Diversified Financial Services - 1.3% | |||
| McGraw Hill Financial, Inc. | 124,267 | 11,988 | |
| MSCI, Inc. Class A | 20,900 | 1,466 | |
| 13,454 | |||
| Insurance - 1.3% | |||
| ACE Ltd. | 76,000 | 8,729 | |
| MetLife, Inc. | 93,300 | 4,767 | |
| 13,496 | |||
| Real Estate Investment Trusts - 0.6% | |||
| American Tower Corp. | 66,000 | 6,559 | |
| TOTAL FINANCIALS | 169,420 | ||
| HEALTH CARE - 12.9% | |||
| Biotechnology - 2.2% | |||
| AbbVie, Inc. | 203,200 | 11,816 | |
| Amgen, Inc. | 69,737 | 11,235 | |
| 23,051 | |||
| Health Care Equipment & Supplies - 2.4% | |||
| Medtronic PLC | 254,102 | 19,144 | |
| The Cooper Companies, Inc. | 37,590 | 5,498 | |
| 24,642 | |||
| Health Care Providers & Services - 1.0% | |||
| McKesson Corp. | 51,232 | 9,701 | |
| Health Care Technology - 0.2% | |||
| CompuGroup Medical AG | 68,579 | 2,399 | |
| Pharmaceuticals - 7.1% | |||
| Allergan PLC (a) | 27,800 | 8,726 | |
| Astellas Pharma, Inc. | 355,300 | 5,001 | |
| Johnson & Johnson | 307,302 | 31,111 | |
| Sanofi SA sponsored ADR | 163,300 | 7,221 | |
| Shire PLC | 72,800 | 5,068 | |
| Teva Pharmaceutical Industries Ltd. sponsored ADR | 256,400 | 16,135 | |
| 73,262 | |||
| TOTAL HEALTH CARE | 133,055 | ||
| INDUSTRIALS - 9.8% | |||
| Aerospace & Defense - 2.7% | |||
| BWX Technologies, Inc. | 322,100 | 9,808 | |
| General Dynamics Corp. | 28,800 | 4,218 | |
| The Boeing Co. | 98,403 | 14,313 | |
| 28,339 | |||
| Air Freight & Logistics - 0.3% | |||
| C.H. Robinson Worldwide, Inc. | 45,700 | 3,082 | |
| Commercial Services & Supplies - 0.1% | |||
| Deluxe Corp. | 23,100 | 1,355 | |
| Construction & Engineering - 0.1% | |||
| Astaldi SpA (b) | 143,400 | 861 | |
| Electrical Equipment - 0.5% | |||
| AMETEK, Inc. | 62,072 | 3,505 | |
| EnerSys | 23,100 | 1,361 | |
| 4,866 | |||
| Industrial Conglomerates - 5.9% | |||
| Danaher Corp. | 166,394 | 16,039 | |
| General Electric Co. | 1,036,700 | 31,039 | |
| Roper Industries, Inc. | 70,196 | 13,582 | |
| 60,660 | |||
| Professional Services - 0.2% | |||
| CEB, Inc. | 28,900 | 2,233 | |
| Trading Companies & Distributors - 0.0% | |||
| Now, Inc. (a)(b) | 17,720 | 326 | |
| TOTAL INDUSTRIALS | 101,722 | ||
| INFORMATION TECHNOLOGY - 24.1% | |||
| Communications Equipment - 3.2% | |||
| Cisco Systems, Inc. | 657,379 | 17,914 | |
| QUALCOMM, Inc. | 314,378 | 15,339 | |
| 33,253 | |||
| Electronic Equipment & Components - 0.6% | |||
| TE Connectivity Ltd. | 85,313 | 5,724 | |
| Internet Software & Services - 2.2% | |||
| Alphabet, Inc. Class C | 31,263 | 23,216 | |
| IT Services - 4.5% | |||
| Accenture PLC Class A | 83,100 | 8,910 | |
| ASAC II LP (a)(c) | 298,480 | 7,721 | |
| Fidelity National Information Services, Inc. | 132,798 | 8,455 | |
| IBM Corp. | 77,400 | 10,791 | |
| Leidos Holdings, Inc. | 54,200 | 3,140 | |
| Total System Services, Inc. | 137,200 | 7,678 | |
| 46,695 | |||
| Semiconductors & Semiconductor Equipment - 0.4% | |||
| Broadcom Corp. Class A | 81,500 | 4,452 | |
| Software - 5.7% | |||
| Activision Blizzard, Inc. | 207,867 | 7,828 | |
| Micro Focus International PLC | 246,900 | 4,771 | |
| Microsoft Corp. | 593,063 | 32,233 | |
| Oracle Corp. | 359,828 | 14,022 | |
| 58,854 | |||
| Technology Hardware, Storage & Peripherals - 7.5% | |||
| Apple, Inc. | 419,024 | 49,570 | |
| EMC Corp. | 517,100 | 13,103 | |
| Hewlett Packard Enterprise Co. | 421,100 | 6,258 | |
| HP, Inc. | 421,100 | 5,281 | |
| Western Digital Corp. | 47,800 | 2,983 | |
| 77,195 | |||
| TOTAL INFORMATION TECHNOLOGY | 249,389 | ||
| MATERIALS - 3.2% | |||
| Chemicals - 2.9% | |||
| CF Industries Holdings, Inc. | 131,100 | 6,049 | |
| E.I. du Pont de Nemours & Co. | 151,800 | 10,222 | |
| LyondellBasell Industries NV Class A | 104,200 | 9,984 | |
| PPG Industries, Inc. | 31,400 | 3,320 | |
| 29,575 | |||
| Containers & Packaging - 0.3% | |||
| Ball Corp. | 46,662 | 3,239 | |
| TOTAL MATERIALS | 32,814 | ||
| TELECOMMUNICATION SERVICES - 1.6% | |||
| Diversified Telecommunication Services - 1.6% | |||
| AT&T, Inc. | 499,700 | 16,825 | |
| TOTAL COMMON STOCKS | |||
| (Cost $848,886) | 985,781 | ||
| Principal Amount (000s) | Value (000s) | ||
| Convertible Bonds - 0.1% | |||
| ENERGY - 0.1% | |||
| Oil, Gas & Consumable Fuels - 0.1% | |||
| Amyris, Inc. 3% 2/27/17 (Cost $791) | 791 | 719 | |
| Shares | Value (000s) | ||
| Money Market Funds - 5.0% | |||
| Fidelity Cash Central Fund, 0.18% (d) | 48,550,476 | 48,550 | |
| Fidelity Securities Lending Cash Central Fund, 0.22% (d)(e) | 3,563,031 | 3,563 | |
| TOTAL MONEY MARKET FUNDS | |||
| (Cost $52,113) | 52,113 | ||
| TOTAL INVESTMENT PORTFOLIO - 100.4% | |||
| (Cost $901,790) | 1,038,613 | ||
| NET OTHER ASSETS (LIABILITIES) - (0.4)% | (4,266) | ||
| NET ASSETS - 100% | $1,034,347 |
Values shown as $0 may reflect amounts less than $500.
Legend
(a) Non-income producing
(b) Security or a portion of the security is on loan at period end.
(c) Restricted securities - Investment in securities not registered under the Securities Act of 1933 (excluding 144A issues). At the end of the period, the value of restricted securities (excluding 144A issues) amounted to $7,721,000 or 0.7% of net assets.
(d) Affiliated fund that is generally available only to investment companies and other accounts managed by Fidelity Investments. The rate quoted is the annualized seven-day yield of the fund at period end. A complete unaudited listing of the fund's holdings as of its most recent quarter end is available upon request. In addition, each Fidelity Central Fund's financial statements, which are not covered by the Fund's Report of Independent Registered Public Accounting Firm, are available on the SEC's website or upon request.
(e) Investment made with cash collateral received from securities on loan.
Additional information on each restricted holding is as follows:
| Security | Acquisition Date | Acquisition Cost (000s) |
| ASAC II LP | 10/10/13 | $2,985 |
Affiliated Central Funds
Information regarding fiscal year to date income earned by the Fund from investments in Fidelity Central Funds is as follows:
| Fund | Income earned |
| (Amounts in thousands) | |
| Fidelity Cash Central Fund | $53 |
| Fidelity Securities Lending Cash Central Fund | 89 |
| Total | $142 |
Investment Valuation
The following is a summary of the inputs used, as of November 30, 2015, involving the Fund's assets and liabilities carried at fair value. The inputs or methodology used for valuing securities may not be an indication of the risk associated with investing in those securities. For more information on valuation inputs, and their aggregation into the levels used below, please refer to the Investment Valuation section in the accompanying Notes to Financial Statements.
| Valuation Inputs at Reporting Date: | ||||
| Description | Total | Level 1 | Level 2 | Level 3 |
| (Amounts in thousands) | ||||
| Investments in Securities: | ||||
| Equities: | ||||
| Consumer Discretionary | $80,956 | $80,935 | $21 | $-- |
| Consumer Staples | 136,887 | 129,190 | 7,697 | -- |
| Energy | 64,713 | 64,713 | -- | -- |
| Financials | 169,420 | 169,419 | 1 | -- |
| Health Care | 133,055 | 122,986 | 10,069 | -- |
| Industrials | 101,722 | 101,722 | -- | -- |
| Information Technology | 249,389 | 241,668 | -- | 7,721 |
| Materials | 32,814 | 32,814 | -- | -- |
| Telecommunication Services | 16,825 | 16,825 | -- | -- |
| Corporate Bonds | 719 | -- | 719 | -- |
| Money Market Funds | 52,113 | 52,113 | -- | -- |
| Total Investments in Securities: | $1,038,613 | $1,012,385 | $18,507 | $7,721 |
Other Information
Distribution of investments by country or territory of incorporation, as a percentage of Total Net Assets, is as follows (Unaudited):
| United States of America | 85.8% |
| Ireland | 4.0% |
| United Kingdom | 2.0% |
| Israel | 1.9% |
| Canada | 1.6% |
| Switzerland | 1.4% |
| Netherlands | 1.3% |
| Others (Individually Less Than 1%) | 2.0% |
| 100.0% |
See accompanying notes which are an integral part of the financial statements.
Financial Statements
Statement of Assets and Liabilities
| Amounts in thousands (except per-share amounts) | November 30, 2015 | |
| Assets | ||
| Investment in securities, at value (including securities loaned of $3,399) — See accompanying schedule: Unaffiliated issuers (cost $849,677) | $986,500 | |
| Fidelity Central Funds (cost $52,113) | 52,113 | |
| Total Investments (cost $901,790) | $1,038,613 | |
| Receivable for investments sold | 6,167 | |
| Receivable for fund shares sold | 471 | |
| Dividends receivable | 2,418 | |
| Interest receivable | 6 | |
| Distributions receivable from Fidelity Central Funds | 8 | |
| Prepaid expenses | 3 | |
| Other receivables | 2 | |
| Total assets | 1,047,688 | |
| Liabilities | ||
| Payable for investments purchased | $7,269 | |
| Payable for fund shares redeemed | 1,513 | |
| Accrued management fee | 359 | |
| Distribution and service plan fees payable | 375 | |
| Other affiliated payables | 205 | |
| Other payables and accrued expenses | 57 | |
| Collateral on securities loaned, at value | 3,563 | |
| Total liabilities | 13,341 | |
| Net Assets | $1,034,347 | |
| Net Assets consist of: | ||
| Paid in capital | $839,284 | |
| Undistributed net investment income | 8,234 | |
| Accumulated undistributed net realized gain (loss) on investments and foreign currency transactions | 50,009 | |
| Net unrealized appreciation (depreciation) on investments and assets and liabilities in foreign currencies | 136,820 | |
| Net Assets | $1,034,347 | |
| Calculation of Maximum Offering Price | ||
| Class A: | ||
| Net Asset Value and redemption price per share ($356,355 ÷ 20,539.91 shares) | $17.35 | |
| Maximum offering price per share (100/94.25 of $17.35) | $18.41 | |
| Class T: | ||
| Net Asset Value and redemption price per share ($371,725 ÷ 21,548.72 shares) | $17.25 | |
| Maximum offering price per share (100/96.50 of $17.25) | $17.88 | |
| Class B: | ||
| Net Asset Value and offering price per share ($6,495 ÷ 391.35 shares)(a) | $16.60 | |
| Class C: | ||
| Net Asset Value and offering price per share ($166,529 ÷ 10,075.72 shares)(a) | $16.53 | |
| Class I: | ||
| Net Asset Value, offering price and redemption price per share ($124,601 ÷ 6,878.03 shares) | $18.12 | |
| Class Z: | ||
| Net Asset Value, offering price and redemption price per share ($8,642 ÷ 470.82 shares) | $18.36 |
(a) Redemption price per share is equal to net asset value less any applicable contingent deferred sales charge.
See accompanying notes which are an integral part of the financial statements.
Statement of Operations
| Amounts in thousands | Year ended November 30, 2015 | |
| Investment Income | ||
| Dividends | $22,786 | |
| Interest | 24 | |
| Income from Fidelity Central Funds | 142 | |
| Total income | 22,952 | |
| Expenses | ||
| Management fee | ||
| Basic fee | $5,919 | |
| Performance adjustment | (594) | |
| Transfer agent fees | 2,234 | |
| Distribution and service plan fees | 4,715 | |
| Accounting and security lending fees | 355 | |
| Custodian fees and expenses | 39 | |
| Independent trustees' compensation | 5 | |
| Registration fees | 97 | |
| Audit | 63 | |
| Legal | 6 | |
| Miscellaneous | 7 | |
| Total expenses before reductions | 12,846 | |
| Expense reductions | (50) | 12,796 |
| Net investment income (loss) | 10,156 | |
| Realized and Unrealized Gain (Loss) | ||
| Net realized gain (loss) on: | ||
| Investment securities: | ||
| Unaffiliated issuers | 57,682 | |
| Foreign currency transactions | (25) | |
| Total net realized gain (loss) | 57,657 | |
| Change in net unrealized appreciation (depreciation) on: Investment securities | (74,642) | |
| Assets and liabilities in foreign currencies | 9 | |
| Total change in net unrealized appreciation (depreciation) | (74,633) | |
| Net gain (loss) | (16,976) | |
| Net increase (decrease) in net assets resulting from operations | $(6,820) |
See accompanying notes which are an integral part of the financial statements.
Statement of Changes in Net Assets
| Amounts in thousands | Year ended November 30, 2015 | Year ended November 30, 2014 |
| Increase (Decrease) in Net Assets | ||
| Operations | ||
| Net investment income (loss) | $10,156 | $11,692 |
| Net realized gain (loss) | 57,657 | 133,433 |
| Change in net unrealized appreciation (depreciation) | (74,633) | (1,155) |
| Net increase (decrease) in net assets resulting from operations | (6,820) | 143,970 |
| Distributions to shareholders from net investment income | (9,131) | (4,242) |
| Distributions to shareholders from net realized gain | (113,106) | (420) |
| Total distributions | (122,237) | (4,662) |
| Share transactions - net increase (decrease) | 43,684 | (80,124) |
| Total increase (decrease) in net assets | (85,373) | 59,184 |
| Net Assets | ||
| Beginning of period | 1,119,720 | 1,060,536 |
| End of period (including undistributed net investment income of $8,234 and undistributed net investment income of $9,131, respectively) | $1,034,347 | $1,119,720 |
See accompanying notes which are an integral part of the financial statements.
Financial Highlights — Fidelity Advisor Dividend Growth Fund Class A
| Years ended November 30, | 2015 | 2014 | 2013 | 2012 | 2011 |
| Selected Per–Share Data | |||||
| Net asset value, beginning of period | $19.65 | $17.23 | $13.33 | $11.45 | $11.58 |
| Income from Investment Operations | |||||
| Net investment income (loss)A | .20 | .23B | .13 | .07 | .02 |
| Net realized and unrealized gain (loss) | (.34)C | 2.29 | 3.87 | 1.81 | (.09) |
| Total from investment operations | (.14) | 2.52 | 4.00 | 1.88 | (.07) |
| Distributions from net investment income | (.19) | (.09) | (.10) | – | – |
| Distributions from net realized gain | (1.96) | (.01) | – | – | (.06) |
| Total distributions | (2.16)D | (.10) | (.10) | – | (.06) |
| Net asset value, end of period | $17.35 | $19.65 | $17.23 | $13.33 | $11.45 |
| Total ReturnE,F | (.41)%C | 14.70% | 30.26% | 16.42% | (.63)% |
| Ratios to Average Net AssetsG,H | |||||
| Expenses before reductions | 1.01% | .94% | .98% | 1.21% | 1.36% |
| Expenses net of fee waivers, if any | 1.00% | .94% | .98% | 1.21% | 1.33% |
| Expenses net of all reductions | 1.00% | .94% | .97% | 1.20% | 1.33% |
| Net investment income (loss) | 1.13% | 1.29%B | .87% | .53% | .16% |
| Supplemental Data | |||||
| Net assets, end of period (in millions) | $356 | $386 | $369 | $301 | $295 |
| Portfolio turnover rateI | 56% | 106% | 70% | 64% | 68% |
A Calculated based on average shares outstanding during the period.
B Investment income per share reflects a large, non-recurring dividend which amounted to $.04 per share. Excluding this non-recurring dividend, the ratio of net investment income (loss) to average net assets would have been 1.07%.
C Net realized and unrealized gain (loss) per share reflects proceeds received from litigation which amounted to $.02 per share. Excluding these litigation proceeds, the total return would have been (.51)%.
D Total distributions of $2.16 per share is comprised of distributions from net investment income of $.193 and distributions from net realized gain of $1.962 per share.
E Total returns would have been lower if certain expenses had not been reduced during the applicable periods shown.
F Total returns do not include the effect of the sales charges.
G Fees and expenses of any underlying Fidelity Central Funds are not included in the Fund's expense ratio. The Fund indirectly bears its proportionate share of the expenses of any underlying Fidelity Central Funds.
H Expense ratios reflect operating expenses of the class. Expenses before reductions do not reflect amounts reimbursed by the investment adviser or reductions from brokerage service arrangements or reductions from other expense offset arrangements and do not represent the amount paid by the class during periods when reimbursements or reductions occur. Expenses net of fee waivers reflect expenses after reimbursement by the investment adviser but prior to reductions from brokerage service arrangements or other expense offset arrangements. Expenses net of all reductions represent the net expenses paid by the class.
I Amount does not include the portfolio activity of any underlying Fidelity Central Funds.
See accompanying notes which are an integral part of the financial statements.
Financial Highlights — Fidelity Advisor Dividend Growth Fund Class T
| Years ended November 30, | 2015 | 2014 | 2013 | 2012 | 2011 |
| Selected Per–Share Data | |||||
| Net asset value, beginning of period | $19.55 | $17.15 | $13.26 | $11.42 | $11.55 |
| Income from Investment Operations | |||||
| Net investment income (loss)A | .15 | .19B | .10 | .04 | (.01) |
| Net realized and unrealized gain (loss) | (.34)C | 2.27 | 3.86 | 1.80 | (.09) |
| Total from investment operations | (.19) | 2.46 | 3.96 | 1.84 | (.10) |
| Distributions from net investment income | (.15) | (.06) | (.07) | – | – |
| Distributions from net realized gain | (1.96) | (.01) | – | – | (.03) |
| Total distributions | (2.11) | (.06)D | (.07) | – | (.03) |
| Net asset value, end of period | $17.25 | $19.55 | $17.15 | $13.26 | $11.42 |
| Total ReturnE,F | (.67)%C | 14.41% | 30.05% | 16.11% | (.90)% |
| Ratios to Average Net AssetsG,H | |||||
| Expenses before reductions | 1.24% | 1.18% | 1.20% | 1.42% | 1.57% |
| Expenses net of fee waivers, if any | 1.24% | 1.18% | 1.20% | 1.42% | 1.55% |
| Expenses net of all reductions | 1.24% | 1.17% | 1.19% | 1.42% | 1.54% |
| Net investment income (loss) | .89% | 1.05%B | .65% | .32% | (.06)% |
| Supplemental Data | |||||
| Net assets, end of period (in millions) | $372 | $412 | $375 | $304 | $294 |
| Portfolio turnover rateI | 56% | 106% | 70% | 64% | 68% |
A Calculated based on average shares outstanding during the period.
B Investment income per share reflects a large non-recurring dividend which amounted to $.04 per share. Excluding this non-recurring dividend, the ratio of net investment income (loss) to average net assets would have been .83%.
C Net realized and unrealized gain (loss) per share reflects proceeds received from litigation which amounted to $.02 per share. Excluding these litigation proceeds, the total return would have been (.77)%.
D Total distributions of $.06 per share is comprised of distributions from net investment income of $.055 and distributions from net realized gain of $.007 per share.
E Total returns would have been lower if certain expenses had not been reduced during the applicable periods shown.
F Total returns do not include the effect of the sales charges.
G Fees and expenses of any underlying Fidelity Central Funds are not included in the Fund's expense ratio. The Fund indirectly bears its proportionate share of the expenses of any underlying Fidelity Central Funds.
H Expense ratios reflect operating expenses of the class. Expenses before reductions do not reflect amounts reimbursed by the investment adviser or reductions from brokerage service arrangements or reductions from other expense offset arrangements and do not represent the amount paid by the class during periods when reimbursements or reductions occur. Expenses net of fee waivers reflect expenses after reimbursement by the investment adviser but prior to reductions from brokerage service arrangements or other expense offset arrangements. Expenses net of all reductions represent the net expenses paid by the class.
I Amount does not include the portfolio activity of any underlying Fidelity Central Funds.
See accompanying notes which are an integral part of the financial statements.
Financial Highlights — Fidelity Advisor Dividend Growth Fund Class B
| Years ended November 30, | 2015 | 2014 | 2013 | 2012 | 2011 |
| Selected Per–Share Data | |||||
| Net asset value, beginning of period | $18.84 | $16.57 | $12.82 | $11.11 | $11.26 |
| Income from Investment Operations | |||||
| Net investment income (loss)A | .05 | .08B | .01 | (.03) | (.07) |
| Net realized and unrealized gain (loss) | (.32)C | 2.20 | 3.74 | 1.74 | (.08) |
| Total from investment operations | (.27) | 2.28 | 3.75 | 1.71 | (.15) |
| Distributions from net investment income | (.01) | – | – | – | – |
| Distributions from net realized gain | (1.96) | (.01) | – | – | – |
| Total distributions | (1.97) | (.01) | – | – | – |
| Net asset value, end of period | $16.60 | $18.84 | $16.57 | $12.82 | $11.11 |
| Total ReturnD,E | (1.20)%C | 13.75% | 29.25% | 15.39% | (1.33)% |
| Ratios to Average Net AssetsF,G | |||||
| Expenses before reductions | 1.84% | 1.78% | 1.79% | 1.99% | 2.14% |
| Expenses net of fee waivers, if any | 1.84% | 1.78% | 1.79% | 1.99% | 2.09% |
| Expenses net of all reductions | 1.84% | 1.78% | 1.78% | 1.99% | 2.09% |
| Net investment income (loss) | .29% | .45%B | .06% | (.25)% | (.61)% |
| Supplemental Data | |||||
| Net assets, end of period (in millions) | $6 | $11 | $15 | $17 | $22 |
| Portfolio turnover rateH | 56% | 106% | 70% | 64% | 68% |
A Calculated based on average shares outstanding during the period.
B Investment income per share reflects a large, non-recurring dividend which amounted to $.04 per share. Excluding this non-recurring dividend, the ratio of net investment income (loss) to average net assets would have been .23%.
C Net realized and unrealized gain (loss) per share reflects proceeds received from litigation which amounted to $.02 per share. Excluding these litigation proceeds, the total return would have been (1.30)%.
D Total returns would have been lower if certain expenses had not been reduced during the applicable periods shown.
E Total returns do not include the effect of the contingent deferred sales charge.
F Fees and expenses of any underlying Fidelity Central Funds are not included in the Fund's expense ratio. The Fund indirectly bears its proportionate share of the expenses of any underlying Fidelity Central Funds.
G Expense ratios reflect operating expenses of the class. Expenses before reductions do not reflect amounts reimbursed by the investment adviser or reductions from brokerage service arrangements or reductions from other expense offset arrangements and do not represent the amount paid by the class during periods when reimbursements or reductions occur. Expenses net of fee waivers reflect expenses after reimbursement by the investment adviser but prior to reductions from brokerage service arrangements or other expense offset arrangements. Expenses net of all reductions represent the net expenses paid by the class.
H Amount does not include the portfolio activity of any underlying Fidelity Central Funds.
See accompanying notes which are an integral part of the financial statements.
Financial Highlights — Fidelity Advisor Dividend Growth Fund Class C
| Years ended November 30, | 2015 | 2014 | 2013 | 2012 | 2011 |
| Selected Per–Share Data | |||||
| Net asset value, beginning of period | $18.82 | $16.54 | $12.79 | $11.07 | $11.22 |
| Income from Investment Operations | |||||
| Net investment income (loss)A | .06 | .09B | .02 | (.02) | (.07) |
| Net realized and unrealized gain (loss) | (.32)C | 2.20 | 3.73 | 1.74 | (.08) |
| Total from investment operations | (.26) | 2.29 | 3.75 | 1.72 | (.15) |
| Distributions from net investment income | (.06) | – | – | – | – |
| Distributions from net realized gain | (1.96) | (.01) | – | – | – |
| Total distributions | (2.03)D | (.01) | – | – | – |
| Net asset value, end of period | $16.53 | $18.82 | $16.54 | $12.79 | $11.07 |
| Total ReturnE,F | (1.16)%C | 13.83% | 29.36% | 15.54% | (1.34)% |
| Ratios to Average Net AssetsG,H | |||||
| Expenses before reductions | 1.76% | 1.69% | 1.72% | 1.94% | 2.08% |
| Expenses net of fee waivers, if any | 1.76% | 1.69% | 1.72% | 1.94% | 2.06% |
| Expenses net of all reductions | 1.76% | 1.69% | 1.71% | 1.93% | 2.05% |
| Net investment income (loss) | .37% | .54%B | .13% | (.20)% | (.57)% |
| Supplemental Data | |||||
| Net assets, end of period (in millions) | $167 | $179 | $160 | $123 | $124 |
| Portfolio turnover rateI | 56% | 106% | 70% | 64% | 68% |
A Calculated based on average shares outstanding during the period.
B Investment income per share reflects a large, non-recurring dividend which amounted to $.04 per share. Excluding this non-recurring dividend, the ratio of net investment income (loss) to average net assets would have been .32%.
C Net realized and unrealized gain (loss) per share reflects proceeds received from litigation which amounted to $.02 per share. Excluding these litigation proceeds, the total return would have been (1.26)%.
D Total distributions of $2.03 per share is comprised of distributions from net investment income of $.064 and distributions from net realized gain of $1.962 per share.
E Total returns would have been lower if certain expenses had not been reduced during the applicable periods shown.
F Total returns do not include the effect of the contingent deferred sales charge.
G Fees and expenses of any underlying Fidelity Central Funds are not included in the Fund's expense ratio. The Fund indirectly bears its proportionate share of the expenses of any underlying Fidelity Central Funds.
H Expense ratios reflect operating expenses of the class. Expenses before reductions do not reflect amounts reimbursed by the investment adviser or reductions from brokerage service arrangements or reductions from other expense offset arrangements and do not represent the amount paid by the class during periods when reimbursements or reductions occur. Expenses net of fee waivers reflect expenses after reimbursement by the investment adviser but prior to reductions from brokerage service arrangements or other expense offset arrangements. Expenses net of all reductions represent the net expenses paid by the class.
I Amount does not include the portfolio activity of any underlying Fidelity Central Funds.
See accompanying notes which are an integral part of the financial statements.
Financial Highlights — Fidelity Advisor Dividend Growth Fund Class I
| Years ended November 30, | 2015 | 2014 | 2013 | 2012 | 2011 |
| Selected Per–Share Data | |||||
| Net asset value, beginning of period | $20.42 | $17.91 | $13.86 | $11.88 | $12.00 |
| Income from Investment Operations | |||||
| Net investment income (loss)A | .25 | .29B | .18 | .11 | .06 |
| Net realized and unrealized gain (loss) | (.35)C | 2.37 | 4.02 | 1.87 | (.09) |
| Total from investment operations | (.10) | 2.66 | 4.20 | 1.98 | (.03) |
| Distributions from net investment income | (.24) | (.14) | (.15) | – | (.02) |
| Distributions from net realized gain | (1.96) | (.01) | – | – | (.07) |
| Total distributions | (2.20) | (.15) | (.15) | – | (.09) |
| Net asset value, end of period | $18.12 | $20.42 | $17.91 | $13.86 | $11.88 |
| Total ReturnD | (.14)%C | 14.99% | 30.63% | 16.67% | (.33)% |
| Ratios to Average Net AssetsE,F | |||||
| Expenses before reductions | .76% | .69% | .70% | .91% | 1.04% |
| Expenses net of fee waivers, if any | .76% | .69% | .70% | .91% | 1.03% |
| Expenses net of all reductions | .76% | .69% | .69% | .90% | 1.02% |
| Net investment income (loss) | 1.37% | 1.54%B | 1.15% | .83% | .46% |
| Supplemental Data | |||||
| Net assets, end of period (in millions) | $125 | $131 | $135 | $103 | $83 |
| Portfolio turnover rateG | 56% | 106% | 70% | 64% | 68% |
A Calculated based on average shares outstanding during the period.
B Investment income per share reflects a large, non-recurring dividend which amounted to $.04 per share. Excluding this non-recurring dividend, the ratio of net investment income (loss) to average net assets would have been 1.32%.
C Net realized and unrealized gain (loss) per share reflects proceeds received from litigation which amounted to $.02 per share. Excluding these litigation proceeds, the total return would have been (.24)%.
D Total returns would have been lower if certain expenses had not been reduced during the applicable periods shown.
E Fees and expenses of any underlying Fidelity Central Funds are not included in the Fund's expense ratio. The Fund indirectly bears its proportionate share of the expenses of any underlying Fidelity Central Funds.
F Expense ratios reflect operating expenses of the class. Expenses before reductions do not reflect amounts reimbursed by the investment adviser or reductions from brokerage service arrangements or reductions from other expense offset arrangements and do not represent the amount paid by the class during periods when reimbursements or reductions occur. Expenses net of fee waivers reflect expenses after reimbursement by the investment adviser but prior to reductions from brokerage service arrangements or other expense offset arrangements. Expenses net of all reductions represent the net expenses paid by the class.
G Amount does not include the portfolio activity of any underlying Fidelity Central Funds.
See accompanying notes which are an integral part of the financial statements.
Financial Highlights — Fidelity Advisor Dividend Growth Fund Class Z
| Years ended November 30, | 2015 | 2014 | 2013 A |
| Selected Per–Share Data | |||
| Net asset value, beginning of period | $20.44 | $17.92 | $16.59 |
| Income from Investment Operations | |||
| Net investment income (loss)B | .28 | .31C | .06 |
| Net realized and unrealized gain (loss) | (.35)D | 2.38 | 1.27 |
| Total from investment operations | (.07) | 2.69 | 1.33 |
| Distributions from net investment income | (.05) | (.17) | – |
| Distributions from net realized gain | (1.96) | (.01) | – |
| Total distributions | (2.01) | (.17)E | – |
| Net asset value, end of period | $18.36 | $20.44 | $17.92 |
| Total ReturnF,G | (.01)%D | 15.20% | 8.02% |
| Ratios to Average Net AssetsH,I | |||
| Expenses before reductions | .59% | .52% | .54%J |
| Expenses net of fee waivers, if any | .59% | .52% | .54%J |
| Expenses net of all reductions | .59% | .52% | .52%J |
| Net investment income (loss) | 1.54% | 1.71%C | 1.26%J |
| Supplemental Data | |||
| Net assets, end of period (000 omitted) | $8,642 | $118 | $7,394 |
| Portfolio turnover rateK | 56% | 106% | 70% |
A For the period August 13, 2013 (commencement of sale of shares) to November 30, 2013.
B Calculated based on average shares outstanding during the period.
C Investment income per share reflects a large, non-recurring dividend which amounted to $.04 per share. Excluding this non-recurring dividend, the ratio of net investment income (loss) to average net assets would have been 1.49%.
D Net realized and unrealized gain (loss) per share reflects proceeds received from litigation which amounted to $.02 per share. Excluding these litigation proceeds, the total return would have been (.11)%.
E Total distributions of $.17 per share is comprised of distributions from net investment income of $.166 and distributions from net realized gain of $.007 per share.
F Total returns for periods of less than one year are not annualized.
G Total returns would have been lower if certain expenses had not been reduced during the applicable periods shown.
H Fees and expenses of any underlying Fidelity Central Funds are not included in the Fund's expense ratio. The Fund indirectly bears its proportionate share of the expenses of any underlying Fidelity Central Funds.
I Expense ratios reflect operating expenses of the class. Expenses before reductions do not reflect amounts reimbursed by the investment adviser or reductions from brokerage service arrangements or reductions from other expense offset arrangements and do not represent the amount paid by the class during periods when reimbursements or reductions occur. Expense ratios before reductions for start-up periods may not be representative of longer-term operating periods. Expenses net of fee waivers reflect expenses after reimbursement by the investment adviser but prior to reductions from brokerage service arrangements or other expense offset arrangements. Expenses net of all reductions represent the net expenses paid by the class.
J Annualized
K Amount does not include the portfolio activity of any underlying Fidelity Central Funds.
See accompanying notes which are an integral part of the financial statements.
Notes to Financial Statements
For the period ended November 30, 2015
(Amounts in thousands except percentages)
1. Organization.
Fidelity Advisor Dividend Growth Fund (the Fund) is a fund of Fidelity Advisor Series I (the Trust) and is authorized to issue an unlimited number of shares. The Trust is registered under the Investment Company Act of 1940, as amended (the 1940 Act), as an open-end management investment company organized as a Massachusetts business trust. The Fund offers Class A, Class T, Class C, Class I (formerly Institutional Class) and Class Z shares, each of which, along with Class B shares, has equal rights as to assets and voting privileges. Class B shares are closed to new accounts and additional purchases, except for exchanges and reinvestments. Each class has exclusive voting rights with respect to matters that affect that class. Class B shares will automatically convert to Class A shares after a holding period of seven years from the initial date of purchase.
2. Investments in Fidelity Central Funds.
The Fund invests in Fidelity Central Funds, which are open-end investment companies generally available only to other investment companies and accounts managed by the investment adviser and its affiliates. The Fund's Schedule of Investments lists each of the Fidelity Central Funds held as of period end, if any, as an investment of the Fund, but does not include the underlying holdings of each Fidelity Central Fund. As an Investing Fund, the Fund indirectly bears its proportionate share of the expenses of the underlying Fidelity Central Funds.
The Money Market Central Funds seek preservation of capital and current income and are managed by Fidelity Investments Money Management, Inc. (FIMM), an affiliate of the investment adviser. Annualized expenses of the Money Market Central Funds as of their most recent shareholder report date are less than .005%.
A complete unaudited list of holdings for each Fidelity Central Fund is available upon request or at the Securities and Exchange Commission (the SEC) website at www.sec.gov. In addition, the financial statements of the Fidelity Central Funds, which are not covered by the Fund's Report of Independent Registered Public Accounting Firm, are available on the SEC website or upon request.
3. Significant Accounting Policies.
The financial statements have been prepared in conformity with accounting principles generally accepted in the United States of America (GAAP), which require management to make certain estimates and assumptions at the date of the financial statements. Actual results could differ from those estimates. Subsequent events, if any, through the date that the financial statements were issued have been evaluated in the preparation of the financial statements. The following summarizes the significant accounting policies of the Fund:
Investment Valuation. Investments are valued as of 4:00 p.m. Eastern time on the last calendar day of the period. The Board of Trustees (the Board) has delegated the day to day responsibility for the valuation of the Fund's investments to the Fidelity Management & Research Company (FMR) Fair Value Committee (the Committee). In accordance with valuation policies and procedures approved by the Board, the Fund attempts to obtain prices from one or more third party pricing vendors or brokers to value its investments. When current market prices, quotations or currency exchange rates are not readily available or reliable, investments will be fair valued in good faith by the Committee, in accordance with procedures adopted by the Board. Factors used in determining fair value vary by investment type and may include market or investment specific events, changes in interest rates and credit quality. The frequency with which these procedures are used cannot be predicted and they may be utilized to a significant extent. The Committee oversees the Fund's valuation policies and procedures and reports to the Board on the Committee's activities and fair value determinations. The Board monitors the appropriateness of the procedures used in valuing the Fund's investments and ratifies the fair value determinations of the Committee.
The Fund categorizes the inputs to valuation techniques used to value its investments into a disclosure hierarchy consisting of three levels as shown below:
- Level 1 – quoted prices in active markets for identical investments
- Level 2 – other significant observable inputs (including quoted prices for similar investments, interest rates, prepayment speeds, etc.)
- Level 3 – unobservable inputs (including the Fund's own assumptions based on the best information available)
Valuation techniques used to value the Fund's investments by major category are as follows:
Equity securities, including restricted securities, for which market quotations are readily available, are valued at the last reported sale price or official closing price as reported by a third party pricing vendor on the primary market or exchange on which they are traded and are categorized as Level 1 in the hierarchy. In the event there were no sales during the day or closing prices are not available, securities are valued at the last quoted bid price or may be valued using the last available price and are generally categorized as Level 2 in the hierarchy. For foreign equity securities, when market or security specific events arise, comparisons to the valuation of American Depositary Receipts (ADRs), futures contracts, Exchange-Traded Funds (ETFs) and certain indexes as well as quoted prices for similar securities may be used and would be categorized as Level 2 in the hierarchy. Utilizing these techniques may result in transfers between Level 1 and Level 2. For equity securities, including restricted securities, where observable inputs are limited, assumptions about market activity and risk are used and these securities may be categorized as Level 3 in the hierarchy.
Debt securities, including restricted securities, are valued based on evaluated prices received from third party pricing vendors or from brokers who make markets in such securities. Corporate bonds are valued by pricing vendors who utilize matrix pricing which considers yield or price of bonds of comparable quality, coupon, maturity and type or by broker-supplied prices. When independent prices are unavailable or unreliable, debt securities may be valued utilizing pricing methodologies which consider similar factors that would be used by third party pricing vendors. Debt securities are generally categorized as Level 2 in the hierarchy but may be Level 3 depending on the circumstances.
Investments in open-end mutual funds, including the Fidelity Central Funds, are valued at their closing net asset value (NAV) each business day and are categorized as Level 1 in the hierarchy.
Changes in valuation techniques may result in transfers in or out of an assigned level within the disclosure hierarchy. The aggregate value of investments by input level as of November 30, 2015 is included at the end of the Fund's Schedule of Investments.
Foreign Currency. The Fund may use foreign currency contracts to facilitate transactions in foreign-denominated securities. Gains and losses from these transactions may arise from changes in the value of the foreign currency or if the counterparties do not perform under the contracts' terms.
Foreign-denominated assets, including investment securities, and liabilities are translated into U.S. dollars at the exchange rates at period end. Purchases and sales of investment securities, income and dividends received and expenses denominated in foreign currencies are translated into U.S. dollars at the exchange rate in effect on the transaction date.
The effects of exchange rate fluctuations on investments are included with the net realized and unrealized gain (loss) on investment securities. Other foreign currency transactions resulting in realized and unrealized gain (loss) are disclosed separately.
Investment Transactions and Income. For financial reporting purposes, the Fund's investment holdings and NAV include trades executed through the end of the last business day of the period. The NAV per share for processing shareholder transactions is calculated as of the close of business of the New York Stock Exchange (NYSE), normally 4:00 p.m. Eastern time and includes trades executed through the end of the prior business day. Gains and losses on securities sold are determined on the basis of identified cost and may include proceeds received from litigation. Dividend income is recorded on the ex-dividend date, except for certain dividends from foreign securities where the ex-dividend date may have passed, which are recorded as soon as the Fund is informed of the ex-dividend date. Non-cash dividends included in dividend income, if any, are recorded at the fair market value of the securities received. Income and capital gain distributions from Fidelity Central Funds, if any, are recorded on the ex-dividend date. Distributions received on securities that represent a return of capital or capital gain are recorded as a reduction of cost of investments and/or as a realized gain. Subsequent to ex-dividend date the Fund determines the components of these distributions, based upon receipt of tax filings or other correspondence relating to the underlying investment. Interest income is accrued as earned and includes coupon interest and amortization of premium and accretion of discount on debt securities as applicable. Investment income is recorded net of foreign taxes withheld where recovery of such taxes is uncertain.
Class Allocations and Expenses. Investment income, realized and unrealized capital gains and losses, common expenses of the Fund, and certain fund-level expense reductions, if any, are allocated daily on a pro-rata basis to each class based on the relative net assets of each class to the total net assets of the Fund. Each class differs with respect to transfer agent and distribution and service plan fees incurred. Certain expense reductions may also differ by class. For the reporting period, the allocated portion of income and expenses to each class as a percent of its average net assets may vary due to the timing of recording these transactions in relation to fluctuating net assets of the classes. Expenses directly attributable to a fund are charged to that fund. Expenses attributable to more than one fund are allocated among the respective funds on the basis of relative net assets or other appropriate methods. Expense estimates are accrued in the period to which they relate and adjustments are made when actual amounts are known.
Income Tax Information and Distributions to Shareholders. Each year, the Fund intends to qualify as a regulated investment company under Subchapter M of the Internal Revenue Code, including distributing substantially all of its taxable income and realized gains. As a result, no provision for U.S. Federal income taxes is required. As of November 30, 2015, the Fund did not have any unrecognized tax benefits in the financial statements; nor is the Fund aware of any tax positions for which it is reasonably possible that the total amounts of unrecognized tax benefits will significantly change in the next twelve months. The Fund files a U.S. federal tax return, in addition to state and local tax returns as required. The Fund's federal income tax returns are subject to examination by the Internal Revenue Service (IRS) for a period of three fiscal years after they are filed. State and local tax returns may be subject to examination for an additional fiscal year depending on the jurisdiction. Foreign taxes are provided for based on the Fund's understanding of the tax rules and rates that exist in the foreign markets in which it invests.
Distributions are declared and recorded on the ex-dividend date. Income dividends and capital gain distributions are declared separately for each class. Income and capital gain distributions are determined in accordance with income tax regulations, which may differ from GAAP. In addition, the Fund claimed a portion of the payment made to redeeming shareholders as a distribution for income tax purposes.
Capital accounts within the financial statements are adjusted for permanent book-tax differences. These adjustments have no impact on net assets or the results of operations. Capital accounts are not adjusted for temporary book-tax differences which will reverse in a subsequent period.
Book-tax differences are primarily due to foreign currency transactions, partnerships and losses deferred due to wash sales and excise tax regulations.
The federal tax cost of investment securities and unrealized appreciation (depreciation) as of period end were as follows:
| Gross unrealized appreciation | $179,987 |
| Gross unrealized depreciation | (44,962) |
| Net unrealized appreciation (depreciation) on securities | $135,025 |
| Tax Cost | $903,588 |
The tax-based components of distributable earnings as of period end were as follows:
| Undistributed ordinary income | $8,234 |
| Undistributed long-term capital gain | $56,258 |
| Net unrealized appreciation (depreciation) on securities and other investments | $135,022 |
The fund intends to elect to defer to its next fiscal year $4,451 of capital loss recognized during the period November 1, 2015 to November 30, 2015.
The tax character of distributions paid was as follows:
| November 30, 2015 | November 30, 2014 | |
| Ordinary Income | $23,853 | $ 4,242 |
| Long-term Capital Gains | 98,384 | 420 |
| Total | $122,237 | $ 4,662 |
Restricted Securities. The Fund may invest in securities that are subject to legal or contractual restrictions on resale. These securities generally may be resold in transactions exempt from registration or to the public if the securities are registered. Disposal of these securities may involve time-consuming negotiations and expense, and prompt sale at an acceptable price may be difficult. Information regarding restricted securities is included at the end of the Fund's Schedule of Investments.
4. Purchases and Sales of Investments.
Purchases and sales of securities, other than short-term securities, aggregated $583,377 and $642,751, respectively.
5. Fees and Other Transactions with Affiliates.
Management Fee. Fidelity Management & Research Company (the investment adviser) and its affiliates provide the Fund with investment management related services for which the Fund pays a monthly management fee. The management fee is the sum of an individual fund fee rate that is based on an annual rate of .30% of the Fund's average net assets and an annualized group fee rate that averaged .25% during the period. The group fee rate is based upon the average net assets of all the mutual funds advised by the investment adviser, including any mutual funds previously advised by the investment adviser that are currently advised by Fidelity SelectCo, LLC, an affiliate of the investment adviser. The group fee rate decreases as assets under management increase and increases as assets under management decrease. In addition, the management fee is subject to a performance adjustment (up to a maximum of +/- .20% of the Fund's average net assets over a 36 month performance period). The upward or downward adjustment to the management fee is based on Class I of the Fund as compared to its benchmark index, the S&P 500 Index, over the same 36 month performance period. For the reporting period, the total annual management fee rate, including the performance adjustment, was .49% of the Fund's average net assets. The performance adjustment included in the management fee rate may be higher or lower than the maximum performance adjustment rate due to the difference between the average net assets for the reporting and performance periods.
Distribution and Service Plan Fees. In accordance with Rule 12b-1 of the 1940 Act, the Fund has adopted separate Distribution and Service Plans for each class of shares. Certain classes pay Fidelity Distributors Corporation (FDC), an affiliate of the investment adviser, separate Distribution and Service Fees, each of which is based on an annual percentage of each class' average net assets. In addition, FDC may pay financial intermediaries for selling shares of the Fund and providing shareholder support services. For the period, the Distribution and Service Fee rates, total fees and amounts retained by FDC were as follows:
| Distribution Fee | Service Fee | Total Fees | Retained by FDC | |
| Class A | -% | .25% | $920 | $6 |
| Class T | .25% | .25% | 1,972 | 5 |
| Class B | .75% | .25% | 87 | 66 |
| Class C | .75% | .25% | 1,736 | 114 |
| $4,715 | $191 |
Sales Load. FDC may receive a front-end sales charge of up to 5.75% for selling Class A shares and 3.50% for selling Class T shares, some of which is paid to financial intermediaries for selling shares of the Fund. Depending on the holding period, FDC may receive contingent deferred sales charges levied on Class A, Class T, Class B, and Class C redemptions. The deferred sales charges range from 5.00% to 1.00% for Class B shares, 1.00% for Class C shares, 1.00% for certain purchases of Class A shares and .25% for certain purchases of Class T shares.
For the period, sales charge amounts retained by FDC were as follows:
| Retained by FDC | |
| Class A | $115 |
| Class T | 18 |
| Class B(a) | 3 |
| Class C(a) | 12 |
| $148 |
(a) When Class B and Class C shares are initially sold, FDC pays commissions from its own resources to financial intermediaries through which the sales are made.
Transfer Agent Fees. Fidelity Investments Institutional Operations Company, Inc., (FIIOC), an affiliate of the investment adviser, is the transfer, dividend disbursing and shareholder servicing agent for each class of the Fund. FIIOC receives account fees and asset-based fees that vary according to the account size and type of account of the shareholders of the respective classes of the Fund, except for Class Z. FIIOC receives an asset-based fee of Class Z's average net assets. FIIOC pays for typesetting, printing and mailing of shareholder reports, except proxy statements.
For the period, transfer agent fees for each class were as follows:
| Amount | % of Class-Level Average Net Assets | |
| Class A | $775 | .21 |
| Class T | 777 | .20 |
| Class B | 26 | .30 |
| Class C | 374 | .22 |
| Class I | 279 | .22 |
| Class Z | 3 | .05 |
| $2,234 |
Accounting and Security Lending Fees. Fidelity Service Company, Inc. (FSC), an affiliate of the investment adviser, maintains the Fund's accounting records. The accounting fee is based on the level of average net assets for each month. Under a separate contract, FSC administers the security lending program. The security lending fee is based on the number and duration of lending transactions.
Brokerage Commissions. The Fund placed a portion of its portfolio transactions with brokerage firms which are affiliates of the investment adviser. Brokerage commissions are included in net realized gain (loss) and change in net unrealized appreciation (depreciation) in the Statement of Operations. The commissions paid to these affiliated firms were $10 for the period.
6. Committed Line of Credit.
The Fund participates with other funds managed by the investment adviser or an affiliate in a $4.25 billion credit facility (the "line of credit") to be utilized for temporary or emergency purposes to fund shareholder redemptions or for other short-term liquidity purposes. The Fund has agreed to pay commitment fees on its pro-rata portion of the line of credit, which amounted to $2 and is reflected in Miscellaneous expenses on the Statement of Operations. During the period, the Fund did not borrow on this line of credit.
7. Security Lending.
The Fund lends portfolio securities through a lending agent from time to time in order to earn additional income. For equity securities, a lending agent is used and may loan securities to certain qualified borrowers, including Fidelity Capital Markets (FCM), a broker-dealer affiliated with the Fund. On the settlement date of the loan, the Fund receives collateral (in the form of U.S. Treasury obligations, letters of credit and/or cash) against the loaned securities and maintains collateral in an amount not less than 100% of the market value of the loaned securities during the period of the loan. The market value of the loaned securities is determined at the close of business of the Fund and any additional required collateral is delivered to the Fund on the next business day. The Fund or borrower may terminate the loan at any time, and if the borrower defaults on its obligation to return the securities loaned because of insolvency or other reasons, the Fund may apply collateral received from the borrower against the obligation. The Fund may experience delays and costs in recovering the securities loaned. Any cash collateral received is invested in the Fidelity Securities Lending Cash Central Fund. The value of loaned securities and cash collateral at period end are disclosed on the Fund's Statement of Assets and Liabilities. At period end, there were no security loans outstanding with FCM. Security lending income represents the income earned on investing cash collateral, less rebates paid to borrowers and any lending agent fees associated with the loan, plus any premium payments received for lending certain types of securities. Security lending income is presented in the Statement of Operations as a component of income from Fidelity Central Funds. Total security lending income during the period amounted to $89, including less than five hundred dollars from securities loaned to FCM.
8. Expense Reductions.
Commissions paid to certain brokers with whom the investment adviser, or its affiliates, places trades on behalf of the Fund include an amount in addition to trade execution, which may be rebated back to the Fund to offset certain expenses. This amount totaled $24 for the period.
In addition, during the period the investment adviser reimbursed and/or waived a portion of fund-level operating expenses in the amount of $4 and a portion of class-level operating expenses as follows:
| Amount | |
| Class A | $8 |
| Class T | 8 |
| Class B | –(a) |
| Class C | 4 |
| Class I | 2 |
| $22 |
(a) In the amount of less than five hundred dollars.
9. Distributions to Shareholders.
Distributions to shareholders of each class were as follows:
| Years ended November 30, | 2015 | 2014 |
| From net investment income | ||
| Class A | $3,806 | $1,902 |
| Class T | 3,175 | 1,201 |
| Class B | 5 | – |
| Class C | 609 | – |
| Class I | 1,536 | 1,071 |
| Class Z | –(a) | 68 |
| Total | $9,131 | $4,242 |
| From net realized gain | ||
| Class A | $38,921 | $147 |
| Class T | 41,529 | 152 |
| Class B | 1,164 | 6 |
| Class C | 18,788 | 68 |
| Class I | 12,693 | 44 |
| Class Z | 11 | 3 |
| Total | $113,106 | $420 |
(a) In the amount of less than five hundred dollars.
10. Share Transactions.
Share transactions for each class were as follows and may contain automatic conversions between classes or exchanges between funds:
| Shares | Shares | Dollars | Dollars | |
| Years ended November 30, | 2015 | 2014 | 2015 | 2014 |
| Class A | ||||
| Shares sold | 2,750 | 2,553 | $48,068 | $46,007 |
| Reinvestment of distributions | 2,322 | 107 | 39,381 | 1,806 |
| Shares redeemed | (4,182) | (4,408) | (72,975) | (79,256) |
| Net increase (decrease) | 890 | (1,748) | $14,474 | $(31,443) |
| Class T | ||||
| Shares sold | 3,861 | 3,910 | $67,241 | $70,377 |
| Reinvestment of distributions | 2,576 | 77 | 43,556 | 1,302 |
| Shares redeemed | (5,958) | (4,771) | (103,477) | (85,489) |
| Net increase (decrease) | 479 | (784) | $7,320 | $(13,810) |
| Class B | ||||
| Shares sold | 11 | 29 | $199 | $480 |
| Reinvestment of distributions | 68 | – | 1,105 | 5 |
| Shares redeemed | (286) | (319) | (4,794) | (5,509) |
| Net increase (decrease) | (207) | (290) | $(3,490) | $(5,024) |
| Class C | ||||
| Shares sold | 1,178 | 1,183 | $19,680 | $20,503 |
| Reinvestment of distributions | 1,033 | 3 | 16,812 | 58 |
| Shares redeemed | (1,654) | (1,331) | (27,529) | (23,161) |
| Net increase (decrease) | 557 | (145) | $8,963 | $(2,600) |
| Class I | ||||
| Shares sold | 1,619 | 1,479 | $29,609 | $27,537 |
| Reinvestment of distributions | 752 | 59 | 13,280 | 1,027 |
| Shares redeemed | (1,918) | (2,664) | (35,222) | (48,359) |
| Net increase (decrease) | 453 | (1,126) | $7,667 | $(19,795) |
| Class Z | ||||
| Shares sold | 511 | 23 | $9,593 | $420 |
| Reinvestment of distributions | 1 | 4 | 11 | 71 |
| Shares redeemed | (47) | (434) | (854) | (7,943) |
| Net increase (decrease) | 465 | (407) | $8,750 | $(7,452) |
11. Other.
The Fund's organizational documents provide former and current trustees and officers with a limited indemnification against liabilities arising in connection with the performance of their duties to the Fund. In the normal course of business, the Fund may also enter into contracts that provide general indemnifications. The Fund's maximum exposure under these arrangements is unknown as this would be dependent on future claims that may be made against the Fund. The risk of material loss from such claims is considered remote.
Report of Independent Registered Public Accounting Firm
To the Trustees of Fidelity Advisor Series I and Shareholders of Fidelity Advisor® Dividend Growth Fund:
In our opinion, the accompanying statement of assets and liabilities, including the schedule of investments, and the related statements of operations and of changes in net assets and the financial highlights present fairly, in all material respects, the financial position of Fidelity Advisor® Dividend Growth Fund (a fund of Fidelity Advisor Series I) at November 30, 2015, the results of its operations for the year then ended, the changes in its net assets for each of the two years in the period then ended and the financial highlights for each of the periods indicated, in conformity with accounting principles generally accepted in the United States of America. These financial statements and financial highlights (hereafter referred to as “financial statements”) are the responsibility of the Fidelity Advisor® Dividend Growth Fund’s management. Our responsibility is to express an opinion on these financial statements based on our audits. We conducted our audits of these financial statements in accordance with the standards of the Public Company Accounting Oversight Board (United States). Those standards require that we plan and perform the audit to obtain reasonable assurance about whether the financial statements are free of material misstatement. An audit includes examining, on a test basis, evidence supporting the amounts and disclosures in the financial statements, assessing the accounting principles used and significant estimates made by management, and evaluating the overall financial statement presentation. We believe that our audits, which included confirmation of securities at November 30, 2015 by correspondence with the custodian and brokers, provide a reasonable basis for our opinion.
PricewaterhouseCoopers LLP
Boston, Massachusetts
January 19, 2016
Trustees and Officers
The Trustees, Members of the Advisory Board (if any), and officers of the trust and fund, as applicable, are listed below. The Board of Trustees governs the fund and is responsible for protecting the interests of shareholders. The Trustees are experienced executives who meet periodically throughout the year to oversee the fund's activities, review contractual arrangements with companies that provide services to the fund, oversee management of the risks associated with such activities and contractual arrangements, and review the fund's performance. Each of the Trustees oversees 170 funds.
The Trustees hold office without limit in time except that (a) any Trustee may resign; (b) any Trustee may be removed by written instrument, signed by at least two-thirds of the number of Trustees prior to such removal; (c) any Trustee who requests to be retired or who has become incapacitated by illness or injury may be retired by written instrument signed by a majority of the other Trustees; and (d) any Trustee may be removed at any special meeting of shareholders by a two-thirds vote of the outstanding voting securities of the trust. Each Trustee who is not an interested person (as defined in the 1940 Act) of the trust and the fund is referred to herein as an Independent Trustee. Each Independent Trustee shall retire not later than the last day of the calendar year in which his or her 75th birthday occurs. The Independent Trustees may waive this mandatory retirement age policy with respect to individual Trustees. Officers and Advisory Board Members hold office without limit in time, except that any officer or Advisory Board Member may resign or may be removed by a vote of a majority of the Trustees at any regular meeting or any special meeting of the Trustees. Except as indicated, each individual has held the office shown or other offices in the same company for the past five years.
The fund’s Statement of Additional Information (SAI) includes more information about the Trustees. To request a free copy, call Fidelity at 1-877-208-0098.
Experience, Skills, Attributes, and Qualifications of the Trustees. The Governance and Nominating Committee has adopted a statement of policy that describes the experience, qualifications, attributes, and skills that are necessary and desirable for potential Independent Trustee candidates (Statement of Policy). The Board believes that each Trustee satisfied at the time he or she was initially elected or appointed a Trustee, and continues to satisfy, the standards contemplated by the Statement of Policy. The Governance and Nominating Committee also engages professional search firms to help identify potential Independent Trustee candidates who have the experience, qualifications, attributes, and skills consistent with the Statement of Policy. From time to time, additional criteria based on the composition and skills of the current Independent Trustees, as well as experience or skills that may be appropriate in light of future changes to board composition, business conditions, and regulatory or other developments, have also been considered by the professional search firms and the Governance and Nominating Committee. In addition, the Board takes into account the Trustees' commitment and participation in Board and committee meetings, as well as their leadership of standing and ad hoc committees throughout their tenure.
In determining that a particular Trustee was and continues to be qualified to serve as a Trustee, the Board has considered a variety of criteria, none of which, in isolation, was controlling. The Board believes that, collectively, the Trustees have balanced and diverse experience, qualifications, attributes, and skills, which allow the Board to operate effectively in governing the fund and protecting the interests of shareholders. Information about the specific experience, skills, attributes, and qualifications of each Trustee, which in each case led to the Board's conclusion that the Trustee should serve (or continue to serve) as a trustee of the fund, is provided below.
Board Structure and Oversight Function. James C. Curvey is an interested person and currently serves as Chairman. The Trustees have determined that an interested Chairman is appropriate and benefits shareholders because an interested Chairman has a personal and professional stake in the quality and continuity of services provided to the fund. Independent Trustees exercise their informed business judgment to appoint an individual of their choosing to serve as Chairman, regardless of whether the Trustee happens to be independent or a member of management. The Independent Trustees have determined that they can act independently and effectively without having an Independent Trustee serve as Chairman and that a key structural component for assuring that they are in a position to do so is for the Independent Trustees to constitute a substantial majority for the Board. The Independent Trustees also regularly meet in executive session. Ned C. Lautenbach serves as Chairman of the Independent Trustees and as such (i) acts as a liaison between the Independent Trustees and management with respect to matters important to the Independent Trustees and (ii) with management prepares agendas for Board meetings.
Fidelity® funds are overseen by different Boards of Trustees. The fund's Board oversees Fidelity's high income and certain equity funds, and other Boards oversee Fidelity's investment-grade bond, money market, asset allocation, and sector funds. The asset allocation funds may invest in Fidelity® funds overseen by the fund's Board. The use of separate Boards, each with its own committee structure, allows the Trustees of each group of Fidelity® funds to focus on the unique issues of the funds they oversee, including common research, investment, and operational issues. On occasion, the separate Boards establish joint committees to address issues of overlapping consequences for the Fidelity® funds overseen by each Board.
The Trustees operate using a system of committees to facilitate the timely and efficient consideration of all matters of importance to the Trustees, the fund, and fund shareholders and to facilitate compliance with legal and regulatory requirements and oversight of the fund's activities and associated risks. The Board, acting through its committees, has charged FMR and its affiliates with (i) identifying events or circumstances the occurrence of which could have demonstrably adverse effects on the fund's business and/or reputation; (ii) implementing processes and controls to lessen the possibility that such events or circumstances occur or to mitigate the effects of such events or circumstances if they do occur; and (iii) creating and maintaining a system designed to evaluate continuously business and market conditions in order to facilitate the identification and implementation processes described in (i) and (ii) above. Because the day-to-day operations and activities of the fund are carried out by or through FMR, its affiliates, and other service providers, the fund's exposure to risks is mitigated but not eliminated by the processes overseen by the Trustees. While each of the Board's committees has responsibility for overseeing different aspects of the fund's activities, oversight is exercised primarily through the Operations, Audit, and Compliance Committees. In addition, the Independent Trustees have worked with FMR to enhance the Board's oversight of investment and financial risks, legal and regulatory risks, technology risks, and operational risks, including the development of additional risk reporting to the Board. For example, a working group comprised of Independent Trustees and FMR has worked and continues to work to review the Fidelity® funds' valuation-related activities, reporting and risk management. Appropriate personnel, including but not limited to the fund's Chief Compliance Officer (CCO), FMR's internal auditor, the independent accountants, the fund's Treasurer and portfolio management personnel, make periodic reports to the Board's committees, as appropriate, including an annual review of Fidelity's risk management program for the Fidelity® funds. The responsibilities of each standing committee, including their oversight responsibilities, are described further under "Standing Committees of the Trustees."
Interested Trustees*:
Correspondence intended for a Trustee who is an interested person may be sent to Fidelity Investments, 245 Summer Street, Boston, Massachusetts 02210.
Name, Year of Birth; Principal Occupations and Other Relevant Experience+
James C. Curvey (1935)
Year of Election or Appointment: 2007
Trustee
Chairman of the Board of Trustees
Mr. Curvey also serves as Trustee of other Fidelity® funds. Mr. Curvey is a Director of Fidelity Research & Analysis Co. (investment adviser firm, 2009-present), and Vice Chairman (2007-present) and Director of FMR LLC (diversified financial services company). In addition, Mr. Curvey serves as an Overseer for the Boston Symphony Orchestra and a member of the board of Artis-Naples, Naples, Florida, and as a Trustee for Brewster Academy, Wolfeboro, New Hampshire. Previously, Mr. Curvey served as a Director of Fidelity Investments Money Management, Inc. (investment adviser firm, 2009-2014) and a Director of FMR and FMR Co., Inc. (investment adviser firms, 2007-2014).
Charles S. Morrison (1960)
Year of Election or Appointment: 2014
Trustee
Mr. Morrison also serves as Trustee of other funds. He serves as a Director of Fidelity Investments Money Management, Inc. (FIMM) (investment adviser firm, 2014-present), Director of Fidelity SelectCo, LLC (investment adviser firm, 2014-present), President, Asset Management (2014-present), and is an employee of Fidelity Investments. Previously, Mr. Morrison served as Vice President of Fidelity's Fixed Income and Asset Allocation Funds (2012-2014), President, Fixed Income (2011-2014), Vice President of Fidelity's Money Market Funds (2005-2009), President, Money Market Group Leader of FMR (investment adviser firm, 2009), and Senior Vice President, Money Market Group of FMR (2004-2009). Mr. Morrison also served as Vice President of Fidelity's Bond Funds (2002-2005), certain Balanced Funds (2002-2005), and certain Asset Allocation Funds (2002-2007), and as Senior Vice President (2002-2005) of Fidelity's Bond Division.
* Determined to be an “Interested Trustee” by virtue of, among other things, his or her affiliation with the trust or various entities under common control with FMR.
+ The information includes the Trustee's principal occupation during the last five years and other information relating to the experience, attributes, and skills relevant to the Trustee's qualifications to serve as a Trustee, which led to the conclusion that the Trustee should serve as a Trustee for the fund.
Independent Trustees:
Correspondence intended for an Independent Trustee may be sent to Fidelity Investments, P.O. Box 55235, Boston, Massachusetts 02205-5235.
Name, Year of Birth; Principal Occupations and Other Relevant Experience+
Dennis J. Dirks (1948)
Year of Election or Appointment: 2005
Trustee
Mr. Dirks also serves as Trustee of other Fidelity® funds. Prior to his retirement in May 2003, Mr. Dirks was Chief Operating Officer and a member of the Board of The Depository Trust & Clearing Corporation (DTCC). He also served as President, Chief Operating Officer, and Board member of The Depository Trust Company (DTC) and President and Board member of the National Securities Clearing Corporation (NSCC). In addition, Mr. Dirks served as Chief Executive Officer and Board member of the Government Securities Clearing Corporation, Chief Executive Officer and Board member of the Mortgage-Backed Securities Clearing Corporation, as a Trustee and a member of the Finance Committee of Manhattan College (2005-2008), as a Trustee and a member of the Finance Committee of AHRC of Nassau County (2006-2008), and as a member of the Independent Directors Council (IDC) Governing Council (2010-2015). Mr. Dirks is a member of the Board of Directors for The Brookville Center for Children's Services, Inc. (2009-present).
Alan J. Lacy (1953)
Year of Election or Appointment: 2008
Trustee
Mr. Lacy also serves as Trustee of other Fidelity® funds. Mr. Lacy serves as a member of the Board of Directors of Dave & Buster's Entertainment, Inc. (restaurant and entertainment complexes, 2010-present) and Bristol-Myers Squibb Company (global pharmaceuticals, 2008-present). In addition, Mr. Lacy served as Senior Adviser (2007-2014) of Oak Hill Capital Partners, L.P. (private equity) and also served as Chief Executive Officer (2000-2005) and Vice Chairman (2005-2006) of Sears Holdings Corporation and Sears, Roebuck and Co. (retail). Mr. Lacy is a member of the Board of Trustees of The National Parks Conservation Association (2006-present). Previously, Mr. Lacy served as Chairman of the Board of Trustees of the National Parks Conservation Association (2008-2011) and as a member of the Board of Directors for The Western Union Company (global money transfer, 2006-2011), The Hillman Companies, Inc. (hardware wholesalers, 2010-2014), and Earth Fare, Inc. (retail grocery, 2010-2014).
Ned C. Lautenbach (1944)
Year of Election or Appointment: 2000
Trustee
Chairman of the Independent Trustees
Mr. Lautenbach also serves as Trustee of other Fidelity® funds. Mr. Lautenbach currently serves as the Lead Director of the Eaton Corporation Board of Directors (diversified industrial, 1997-present). Mr. Lautenbach is Chairman of the Board of Directors of Artis-Naples in Naples, Florida (2012-present), a member of the Council on Foreign Relations (1994-present), and a member of the Board of Governors, State University System of Florida (2013-present). Previously, Mr. Lautenbach was a Partner/Advisory Partner at Clayton, Dubilier & Rice, LLC (private equity investment, 1998-2010), as well as a Director of Sony Corporation (2006-2007).
Joseph Mauriello (1944)
Year of Election or Appointment: 2008
Trustee
Mr. Mauriello also serves as Trustee of other Fidelity® funds. Prior to his retirement in January 2006, Mr. Mauriello served in numerous senior management positions including Deputy Chairman and Chief Operating Officer (2004-2005), and Vice Chairman of Financial Services (2002-2004) of KPMG LLP US (professional services, 1965-2005). Mr. Mauriello currently serves as a member of the Board of Directors of XL Group plc. (global insurance and re-insurance, 2006-present) and the Independent Directors Council (IDC) Governing Council (2015-present). Previously, Mr. Mauriello served as a Director of the Hamilton Funds of the Bank of New York (2006-2007) and of Arcadia Resources Inc. (health care services and products, 2007-2012).
Robert W. Selander (1950)
Year of Election or Appointment: 2011
Trustee
Mr. Selander also serves as Trustee of other Fidelity® funds. Mr. Selander serves as a Director of The Western Union Company (global money transfer, 2014-present). Previously, Mr. Selander served as a Member of the Advisory Board of other Fidelity® funds (2011), and Executive Vice Chairman (2010), Chief Executive Officer (2009-2010), and President and Chief Executive Officer (1997-2009) of Mastercard, Inc.
Cornelia M. Small (1944)
Year of Election or Appointment: 2005
Trustee
Ms. Small also serves as Trustee of other Fidelity® funds. Ms. Small is a member of the Board of Directors (2009-present) and Chair of the Investment Committee (2010-present) of the Teagle Foundation. Ms. Small also serves on the Investment Committee of the Berkshire Taconic Community Foundation (2008-present). Previously, Ms. Small served as Chairperson (2002-2008) and a member of the Investment Committee and Chairperson (2008-2012) and a member of the Board of Trustees of Smith College. In addition, Ms. Small served as Chief Investment Officer, Director of Global Equity Investments, and a member of the Board of Directors of Scudder, Stevens & Clark and Scudder Kemper Investments.
William S. Stavropoulos (1939)
Year of Election or Appointment: 2002
Trustee
Vice Chairman of the Independent Trustees
Mr. Stavropoulos also serves as Trustee of other Fidelity® funds. Mr. Stavropoulos serves as President and Founder of the Michigan Baseball Foundation, the Great Lakes Loons (2007-present). Mr. Stavropoulos is Chairman Emeritus of the Board of Directors of The Dow Chemical Company, where he previously served in numerous senior management positions, including President, CEO (1995-2000; 2002-2004), Chairman of the Executive Committee (2000-2006), and as a member of the Board of Directors (1990-2006). Currently, Mr. Stavropoulos is Chairman of the Board of Directors of Univar Inc. (global distributor of commodity and specialty chemicals), a Director of Teradata Corporation (data warehousing and technology solutions), and Maersk Inc. (industrial conglomerate), and a member of the Advisory Board for Metalmark Capital LLC (private equity investment, 2005-present). Mr. Stavropoulos is an operating advisor to Clayton, Dubilier & Rice, LLC (private equity investment). In addition, Mr. Stavropoulos is a member of the University of Notre Dame Advisory Council for the College of Science, a Trustee of the Rollin L. Gerstacker Foundation, and a Director of the Naples Philharmonic Center for the Arts. Previously, Mr. Stavropoulos served as a Director of Chemical Financial Corporation (bank holding company, 1993-2012) and Tyco International, Ltd. (multinational manufacturing and services, 2007-2012).
David M. Thomas (1949)
Year of Election or Appointment: 2008
Trustee
Mr. Thomas also serves as Trustee of other Fidelity® funds. Mr. Thomas serves as Non-Executive Chairman of the Board of Directors of Fortune Brands Home and Security (home and security products, 2011-present), as a member of the Board of Directors (2004-present) and Presiding Director (2013-present) of Interpublic Group of Companies, Inc. (marketing communication), and as a member of the Board of Trustees of the University of Florida (2013-present). Previously, Mr. Thomas served as Executive Chairman (2005-2006) and Chairman and Chief Executive Officer (2000-2005) of IMS Health, Inc. (pharmaceutical and healthcare information solutions), and a Director of Fortune Brands, Inc. (consumer products, 2000-2011).
+ The information includes the Trustee's principal occupation during the last five years and other information relating to the experience, attributes, and skills relevant to the Trustee's qualifications to serve as a Trustee, which led to the conclusion that the Trustee should serve as a Trustee for the fund.
Advisory Board Members and Officers:
Correspondence intended for an officer or Peter S. Lynch may be sent to Fidelity Investments, 245 Summer Street, Boston, Massachusetts 02210. Officers appear below in alphabetical order.
Name, Year of Birth; Principal Occupation
Peter S. Lynch (1944)
Year of Election or Appointment: 2003
Member of the Advisory Board
Mr. Lynch also serves as Member of the Advisory Board of other Fidelity® funds. Mr. Lynch is Vice Chairman and a Director of FMR (investment adviser firm) and FMR Co., Inc. (investment adviser firm). In addition, Mr. Lynch serves as a Trustee of Boston College and as the Chairman of the Inner-City Scholarship Fund. Previously, Mr. Lynch served on the Special Olympics International Board of Directors (1997-2006).
Elizabeth Paige Baumann (1968)
Year of Election or Appointment: 2012
Anti-Money Laundering (AML) Officer
Ms. Baumann also serves as AML Officer of other funds. She is Chief AML Officer of FMR LLC (diversified financial services company, 2012-present) and is an employee of Fidelity Investments. Previously, Ms. Baumann served as Vice President and Deputy Anti-Money Laundering Officer (2007-2012).
Marc R. Bryant (1966)
Year of Election or Appointment: 2015
Secretary and Chief Legal Officer (CLO)
Mr. Bryant also serves as Secretary and CLO of other funds. Mr. Bryant serves as CLO, Secretary, and Senior Vice President of Fidelity Management & Research Company (investment adviser firm, 2015-present) and FMR Co., Inc. (investment adviser firm, 2015-present); Secretary of Fidelity SelectCo, LLC (investment adviser firm, 2015-present) and Fidelity Investments Money Management, Inc. (investment adviser firm, 2015-present); and CLO of Fidelity Management & Research (Hong Kong) Limited (investment adviser firm, 2015-present). He is Senior Vice President and Deputy General Counsel of FMR LLC (diversified financial services company). Previously, Mr. Bryant served as Secretary and CLO of Fidelity Rutland Square Trust II (2010-2014) and Assistant Secretary of Fidelity's Fixed Income and Asset Allocation Funds (2013-2015). Prior to joining Fidelity Investments, Mr. Bryant served as a Senior Vice President and the Head of Global Retail Legal for AllianceBernstein L.P. (2006-2010), and as the General Counsel for ProFund Advisors LLC (2001-2006).
William C. Coffey (1969)
Year of Election or Appointment: 2009
Assistant Secretary
Mr. Coffey also serves as Assistant Secretary of other funds. He is Senior Vice President and Deputy General Counsel of FMR LLC (diversified financial services company, 2010-present), and is an employee of Fidelity Investments. Previously, Mr. Coffey served as Vice President and Associate General Counsel of FMR LLC (2005-2009).
Jonathan Davis (1968)
Year of Election or Appointment: 2010
Assistant Treasurer
Mr. Davis also serves as Assistant Treasurer of other funds, and is an employee of Fidelity Investments. Previously, Mr. Davis served as Vice President and Associate General Counsel of FMR LLC (diversified financial services company, 2003-2010).
Adrien E. Deberghes (1967)
Year of Election or Appointment: 2008
Deputy Treasurer
Mr. Deberghes also serves as an officer of other funds. He is an employee of Fidelity Investments (2008-present). Prior to joining Fidelity Investments, Mr. Deberghes was Senior Vice President of Mutual Fund Administration at State Street Corporation (2007-2008), Senior Director of Mutual Fund Administration at Investors Bank & Trust (2005-2007), and Director of Finance for Dunkin' Brands (2000-2005).
Stephanie J. Dorsey (1969)
Year of Election or Appointment: 2010
Assistant Treasurer
Ms. Dorsey also serves as an officer of other funds. She is an employee of Fidelity Investments (2008-present) and has served in other fund officer roles. Prior to joining Fidelity Investments, Ms. Dorsey served as Treasurer (2004-2008) of the JPMorgan Mutual Funds and Vice President (2004-2008) of JPMorgan Chase Bank.
Howard J. Galligan III (1966)
Year of Election or Appointment: 2014
Chief Financial Officer
Mr. Galligan also serves as Chief Financial Officer of other funds. Mr. Galligan serves as President of Fidelity Pricing and Cash Management Services (FPCMS) (2014-present) and as a Director of Strategic Advisers, Inc. (investment adviser firm, 2008-present). Previously, Mr. Galligan served as Chief Administrative Officer of Asset Management (2011-2014) and Chief Operating Officer and Senior Vice President of Investment Support for Strategic Advisers, Inc. (2003-2011).
Scott C. Goebel (1968)
Year of Election or Appointment: 2015
Vice President
Mr. Goebel serves as Vice President of other funds and is an employee of Fidelity Investments (2001-present). Previously, Mr. Goebel served as Secretary of Fidelity SelectCo, LLC (investment adviser firm, 2013-2015), Fidelity Investments Money Management, Inc. (FIMM) (investment adviser firm, 2010-2015), and Fidelity Research and Analysis Company (FRAC) (investment adviser firm, 2010-2015); General Counsel, Secretary, and Senior Vice President of Fidelity Management & Research Company (investment adviser firm, 2008-2015) and FMR Co., Inc. (investment adviser firm, 2008-2015); Assistant Secretary of Fidelity Management & Research (Japan) Limited (investment adviser firm, 2008-2015) and FMR Investment Management (U.K.) Limited (investment adviser firm, 2008-2015); Chief Legal Officer (CLO) of Fidelity Management & Research (Hong Kong) Limited (investment adviser firm, 2008-2015); Secretary and CLO of certain Fidelity® funds (2008-2015); Assistant Secretary of FIMM (2008-2010), FRAC (2008-2010), and certain funds (2007-2008); and as Vice President and Secretary of Fidelity Distributors Corporation (FDC) (2005-2007).
Thomas C. Hense (1964)
Year of Election or Appointment: 2008, 2010, or 2015
Vice President
Mr. Hense serves as Vice President of Fidelity Advisor® Multi-Asset Income Fund (2015) and other funds (High Income (2008), Small Cap (2008), and Value (2010) funds), and is an employee of Fidelity Investments (1993-present). Previously, Mr. Hense served as a portfolio manager for Fidelity's Institutional Money Management Group (Pyramis) (2003-2008).
Brian B. Hogan (1964)
Year of Election or Appointment: 2009
Vice President
Mr. Hogan also serves as Trustee or Vice President of other funds. Mr. Hogan serves as a Director of Fidelity SelectCo, LLC (investment adviser firm, 2014-present) and President of the Equity Division of FMR (investment adviser firm, 2009-present). Previously, Mr. Hogan served as Senior Vice President, Equity Research of FMR (2006-2009) and as a portfolio manager.
Chris Maher (1972)
Year of Election or Appointment: 2013
Assistant Treasurer
Mr. Maher serves as Assistant Treasurer of other funds. Mr. Maher is Vice President of Valuation Oversight and is an employee of Fidelity Investments. Previously, Mr. Maher served as Vice President of Asset Management Compliance (2013), Vice President of the Program Management Group of FMR (investment adviser firm, 2010-2013), and Vice President of Valuation Oversight (2008-2010).
Kenneth B. Robins (1969)
Year of Election or Appointment: 2008
President and Treasurer
Mr. Robins also serves as an officer of other funds. Mr. Robins serves as Executive Vice President of Fidelity Investments Money Management, Inc. (FIMM) (investment adviser firm, 2013-present) and is an employee of Fidelity Investments (2004-present). Previously, Mr. Robins served in other fund officer roles.
Stacie M. Smith (1974)
Year of Election or Appointment: 2013
Deputy Treasurer
Ms. Smith also serves as an officer of other funds. She is an employee of Fidelity Investments (2009-present) and has served in other fund officer roles. Prior to joining Fidelity Investments, Ms. Smith served as Senior Audit Manager of Ernst & Young LLP (1996-2009).
Renee Stagnone (1975)
Year of Election or Appointment: 2013
Deputy Treasurer
Ms. Stagnone also serves as Deputy Treasurer of other funds. Ms. Stagnone is an employee of Fidelity Investments (1997-present).
Linda J. Wondrack (1964)
Year of Election or Appointment: 2014
Chief Compliance Officer
Ms. Wondrack also serves as Chief Compliance Officer of other funds. Ms. Wondrack is Executive Vice President and head of the Ethics Office and Asset Management Compliance for Fidelity Investments (2012-present). Ms. Wondrack also serves as Chief Compliance Officer of Fidelity SelectCo, LLC (investment adviser firm, 2014-present); Chief Compliance Officer of Impresa Management LLC (2013-present); and Chief Compliance Officer of FMR Co., Inc. (investment adviser firm), Fidelity Investments Money Management, Inc. (investment adviser firm), Fidelity Management & Research (Japan) Limited (investment adviser firm), FMR Investment Management (U.K.) Limited (investment adviser firm), Fidelity Management & Research (Hong Kong) (investment adviser firm), Fidelity Management & Research Company (investment adviser firm), FIAM LLC (investment adviser firm), and Strategic Advisers, Inc. (investment adviser firm), Ballyrock Investment Advisors LLC, and Northern Neck Investors LLC (2012-present). Previously, Ms. Wondrack served as Senior Vice President and Chief Compliance Officer for Columbia Management Investment Advisers, LLC (2005-2012); Chief Compliance Officer for certain funds within the Columbia Family of Funds (2007-2012); and Senior Vice President of Compliance Risk Management at Bank of America (2005-2010).
Joseph F. Zambello (1957)
Year of Election or Appointment: 2011
Deputy Treasurer
Mr. Zambello also serves as Deputy Treasurer of other funds. Mr. Zambello is an employee of Fidelity Investments (1991-present). Previously, Mr. Zambello served as Vice President of the Program Management Group of FMR (investment adviser firm, 2009-2011) and Vice President of the Transfer Agent Oversight Group (2005-2009).
Shareholder Expense Example
As a shareholder of the Fund, you incur two types of costs: (1) transaction costs, including sales charges (loads) on purchase payments or redemption proceeds, and (2) ongoing costs, including management fees, distribution and/or service (12b-1) fees and other Fund expenses. This Example is intended to help you understand your ongoing costs (in dollars) of investing in the Fund and to compare these costs with the ongoing costs of investing in other mutual funds.
The Example is based on an investment of $1,000 invested at the beginning of the period and held for the entire period (June 1, 2015 to November 30, 2015).
Actual Expenses
The first line of the accompanying table for each class of the Fund provides information about actual account values and actual expenses. You may use the information in this line, together with the amount you invested, to estimate the expenses that you paid over the period. Simply divide your account value by $1,000.00 (for example, an $8,600 account value divided by $1,000.00 = 8.6), then multiply the result by the number in the first line for a class of the Fund under the heading entitled "Expenses Paid During Period" to estimate the expenses you paid on your account during this period. In addition, the Fund, as a shareholder in the underlying Fidelity Central Funds, will indirectly bear its pro-rata share of the fees and expenses incurred by the underlying Fidelity Central Funds. These fees and expenses are not included in the Fund's annualized expense ratio used to calculate the expense estimate in the table below.
Hypothetical Example for Comparison Purposes
The second line of the accompanying table for each class of the Fund provides information about hypothetical account values and hypothetical expenses based on a Class' actual expense ratio and an assumed rate of return of 5% per year before expenses, which is not the Class' actual return. The hypothetical account values and expenses may not be used to estimate the actual ending account balance or expenses you paid for the period. You may use this information to compare the ongoing costs of investing in the Fund and other funds. To do so, compare this 5% hypothetical example with the 5% hypothetical examples that appear in the shareholder reports of the other funds. In addition, the Fund, as a shareholder in the underlying Fidelity Central Funds, will indirectly bear its pro-rata share of the fees and expenses incurred by the underlying Fidelity Central Funds. These fees and expenses are not included in the Fund's annualized expense ratio used to calculate the expense estimate in the table below.
Please note that the expenses shown in the table are meant to highlight your ongoing costs only and do not reflect any transaction costs. Therefore, the second line of the table is useful in comparing ongoing costs only, and will not help you determine the relative total costs of owning different funds. In addition, if these transactional costs were included, your costs would have been higher.
| Annualized Expense Ratio-A | Beginning Account Value June 1, 2015 | Ending Account Value November 30, 2015 | Expenses Paid During Period-B June 1, 2015 to November 30, 2015 | |
| Class A | 1.00% | |||
| Actual | $1,000.00 | $971.40 | $4.94 | |
| Hypothetical-C | $1,000.00 | $1,020.05 | $5.06 | |
| Class T | 1.24% | |||
| Actual | $1,000.00 | $970.20 | $6.12 | |
| Hypothetical-C | $1,000.00 | $1,018.85 | $6.28 | |
| Class B | 1.84% | |||
| Actual | $1,000.00 | $967.40 | $9.07 | |
| Hypothetical-C | $1,000.00 | $1,015.84 | $9.30 | |
| Class C | 1.76% | |||
| Actual | $1,000.00 | $967.80 | $8.68 | |
| Hypothetical-C | $1,000.00 | $1,016.24 | $8.90 | |
| Class I | .76% | |||
| Actual | $1,000.00 | $972.60 | $3.76 | |
| Hypothetical-C | $1,000.00 | $1,021.26 | $3.85 | |
| Class Z | .60% | |||
| Actual | $1,000.00 | $973.50 | $2.97 | |
| Hypothetical-C | $1,000.00 | $1,022.06 | $3.04 |
A Annualized expense ratio reflects expenses net of applicable fee waivers.
B Expenses are equal to each Class' annualized expense ratio, multiplied by the average account value over the period, multiplied by 183/365 (to reflect the one-half year period).
C 5% return per year before expenses
Distributions (Unaudited)
The Board of Trustees of Advisor Dividend Growth Fund voted to pay to shareholders of record at the opening of business on record date, the following distributions per share derived from capital gains realized from sales of portfolio securities, and dividends derived from net investment income:
| Pay Date | Record Date | Dividends | Capital Gains | |
| Class I | 12/14/15 | 12/11/15 | $0.244 | $0.941 |
The fund hereby designates as a capital gain dividend with respect to the taxable year ended November 30, 2015, $63,036,073 , or, if subsequently determined to be different, the net capital gain of such year.
Class I designates 54% of the dividends distributed during the fiscal year as qualifying for the dividends–received deduction for corporate shareholders.
Class I designates 72%, of the dividends distributed during the fiscal year as amounts which may be taken into account as a dividend for the purposes of the maximum rate under section 1(h)(11) of the Internal Revenue Code.
The fund will notify shareholders in January 2016 of amounts for use in preparing 2015 income tax returns.
Board Approval of Investment Advisory Contracts and Management Fees
Fidelity Advisor Dividend Growth Fund
Each year, the Board of Trustees, including the Independent Trustees (together, the Board), votes on the renewal of the management contract with Fidelity Management & Research Company (FMR) and the sub-advisory agreements (together, the Advisory Contracts) for the fund. The Board, assisted by the advice of fund counsel and Independent Trustees' counsel, requests and considers a broad range of information relevant to the renewal of the Advisory Contracts throughout the year.
The Board meets regularly and, at each of its meetings, covers an extensive agenda of topics and materials and considers factors that are relevant to its annual consideration of the renewal of the fund's Advisory Contracts, including the services and support provided to the fund and its shareholders. The Board has established various standing committees (Committees), each composed of and chaired by Independent Trustees with varying backgrounds, to which the Board has assigned specific subject matter responsibilities in order to enhance effective decision-making by the Board. The Board, acting directly and through its Committees, requests and receives information concerning the annual consideration of the renewal of the fund's Advisory Contracts. The Board also meets as needed to consider matters specifically related to the Board's annual consideration of the renewal of the Advisory Contracts. Members of the Board may also meet with trustees of other Fidelity funds through ad hoc joint committees to discuss certain matters relevant to all of the Fidelity funds.
At its July 2015 meeting, the Board unanimously determined to renew the fund's Advisory Contracts. In reaching its determination, the Board considered all factors it believed relevant, including (i) the nature, extent, and quality of the services to be provided to the fund and its shareholders (including the investment performance of the fund); (ii) the competitiveness of the fund's management fee and total expense ratio relative to peer funds; (iii) the total costs of the services to be provided by and the profits to be realized by Fidelity from its relationship with the fund; and (iv) the extent to which (if any) economies of scale exist and would be realized as the fund grows, and whether any economies of scale are appropriately shared with fund shareholders.
In considering whether to renew the Advisory Contracts for the fund, the Board reached a determination, with the assistance of fund counsel and Independent Trustees' counsel and through the exercise of its business judgment, that the renewal of the Advisory Contracts was in the best interests of the fund and its shareholders and that the compensation payable under the Advisory Contracts was fair and reasonable. The Board's decision to renew the Advisory Contracts was not based on any single factor, but rather was based on a comprehensive consideration of all the information provided to the Board at its meetings throughout the year. The Board, in reaching its determination to renew the Advisory Contracts, was aware that shareholders of the fund have a broad range of investment choices available to them, including a wide choice among funds offered by Fidelity's competitors, and that the fund's shareholders, who have the opportunity to review and weigh the disclosure provided by the fund in its prospectus and other public disclosures, have chosen to invest in this fund, which is part of the Fidelity family of funds.
Nature, Extent, and Quality of Services Provided. The Board considered Fidelity's staffing as it relates to the fund, including the backgrounds of investment personnel of Fidelity, and also considered the fund's investment objective, strategies, and related investment philosophy. The Independent Trustees also had discussions with senior management of Fidelity's investment operations and investment groups. The Board considered the structure of the portfolio manager compensation program and whether this structure provides appropriate incentives to act in the best interests of the fund. Additionally, the Board considered the portfolio managers' investments, if any, in the funds that they manage.Resources Dedicated to Investment Management and Support Services. The Board and the Fund Oversight and Research Committees reviewed the general qualifications and capabilities of Fidelity's investment staff, including its size, education, experience, and resources, as well as Fidelity's approach to recruiting, training, managing, and compensating investment personnel. The Board noted that Fidelity has continued to increase the resources devoted to non-U.S. offices, including expansion of Fidelity's global investment organization. The Board also noted that Fidelity's analysts have extensive resources, tools and capabilities that allow them to conduct sophisticated quantitative and fundamental analysis, as well as credit analysis of issuers, counterparties and guarantors. Further, the Board considered that Fidelity's investment professionals have sufficient access to global information and data so as to provide competitive investment results over time, and that those professionals also have access to sophisticated tools that permit them to assess portfolio construction and risk and performance attribution characteristics continuously, as well as to transmit new information and research conclusions rapidly around the world. Additionally, in its deliberations, the Board considered Fidelity's trading, risk management, and compliance capabilities and resources, which are integral parts of the investment management process.Shareholder and Administrative Services. The Board considered (i) the nature, extent, quality, and cost of advisory, administrative, and shareholder services performed by FMR, the sub-advisers (together with FMR, the Investment Advisers), and their affiliates under the Advisory Contracts and under separate agreements covering transfer agency, pricing and bookkeeping, and securities lending services for the fund; (ii) the nature and extent of the supervision of third party service providers, principally custodians and subcustodians; and (iii) the resources devoted to, and the record of compliance with, the fund's compliance policies and procedures. The Board also reviewed the allocation of fund brokerage, including allocations to brokers affiliated with the Investment Advisers, the use of brokerage commissions to pay fund expenses, and the use of "soft" commission dollars to pay for research services.The Board noted that the growth of fund assets over time across the complex allows Fidelity to reinvest in the development of services designed to enhance the value or convenience of the Fidelity funds as investment vehicles. These services include 24-hour access to account information and market information through telephone representatives and over the Internet, investor education materials and asset allocation tools, and the expanded availability of Fidelity Investor Centers.In 2014, the Board formed an ad hoc Committee on Transfer Agency Fees to review the variety of transfer agency fee structures throughout the industry and Fidelity's competitive positioning with respect to industry participants.Investment in a Large Fund Family. The Board considered the benefits to shareholders of investing in a Fidelity fund, including the benefits of investing in a fund that is part of a large family of funds offering a variety of investment disciplines and providing a large variety of mutual fund investor services. The Board noted that Fidelity had taken, or had made recommendations that resulted in the Fidelity funds taking, a number of actions over the previous year that benefited particular funds, including (i) continuing to dedicate additional resources to investment research and to the support of the senior management team that oversees asset management; (ii) continuing efforts to enhance Fidelity's global research capabilities; (iii) launching new funds and making other enhancements to meet client needs; (iv) reducing management fees and total expenses for certain index funds and diversified international funds; (v) continuing to launch dedicated lower cost underlying funds to meet portfolio construction needs related to expanding underlying fund options for Fidelity funds of funds, specifically for the Freedom Fund product lines; (vi) rationalizing product lines and gaining increased efficiencies through fund mergers; (vii) launching active fixed-income exchange-traded funds; (viii) continuing to develop, acquire and implement systems and technology to improve services to the funds and information security and to increase efficiency; (ix) implementing investment enhancements to further strengthen Fidelity's target date product line to increase investors' probability of success in achieving their goals; (x) modifying the eligibility criteria for certain share classes to accommodate roll-over assets from employer-sponsored retirement plans; (xi) launching a new Class W of the Freedom Index Funds to attract and retain Fidelity record-kept retirement plan assets; and (xii) implementing changes to Fidelity's money market product line in response to recent money market regulatory reforms.Investment Performance. The Board considered whether the fund has operated in accordance with its investment objective, as well as its record of compliance with its investment restrictions and its performance history. The Board noted that there was a portfolio management change for the fund in January 2014.The Board took into account discussions with representatives of the Investment Advisers about fund investment performance that occur at Board meetings throughout the year. In this regard the Board noted that as part of regularly scheduled fund reviews and other reports to the Board on fund performance, the Board considers annualized return information for the fund, for different time periods, measured against a securities market index ("benchmark index") and a peer group of funds with similar objectives ("peer group"), if any. In its evaluation of fund investment performance, the Board gave particular attention to information indicating changes in performance of certain Fidelity funds for specific time periods and discussed with the Investment Advisers the reasons for any overperformance or underperformance.In addition to reviewing absolute and relative fund performance, the Independent Trustees periodically consider the appropriateness of fund performance metrics in evaluating the results achieved. In general, the Independent Trustees believe that fund performance should be evaluated based on net performance (after fees and expenses) of both the highest performing and lowest performing fund share classes, where applicable, compared to appropriate benchmark indices, over appropriate time periods that may include full market cycles, and compared to peer groups, as applicable, over the same periods, taking into account relevant factors including the following: general market conditions; issuer-specific information; and fund cash flows and other factors.The Independent Trustees recognize that shareholders evaluate performance on a net basis over their own holding periods, for which one-, three-, and five-year periods are often used as a proxy. For this reason, the performance information reviewed by the Board also included net cumulative calendar year total return information for the fund and an appropriate benchmark index and peer group for the most recent one-, three-, and five-year periods, as shown below. Returns are shown compared to the 25th percentile (top of box, 75% beaten) and 75th percentile (bottom of box, 25% beaten) of the peer universe.Fidelity Advisor Dividend Growth Fund
Fidelity Advisor Dividend Growth Fund
![]()
ADGFI-ANN-0116
1.733549.116
Fidelity Advisor® Value Strategies Fund Class I (formerly Institutional Class) Annual Report November 30, 2015 |
|
Contents
Board Approval of Investment Advisory Contracts and Management Fees |
To view a fund's proxy voting guidelines and proxy voting record for the 12-month period ended June 30, visit http://www.fidelity.com/proxyvotingresults or visit the Securities and Exchange Commission's (SEC) web site at http://www.sec.gov.
You may also call 1-877-208-0098 to request a free copy of the proxy voting guidelines.
Standard & Poor's, S&P and S&P 500 are registered service marks of The McGraw-Hill Companies, Inc. and have been licensed for use by Fidelity Distributors Corporation.
Other third-party marks appearing herein are the property of their respective owners.
All other marks appearing herein are registered or unregistered trademarks or service marks of FMR LLC or an affiliated company. © 2016 FMR LLC. All rights reserved.
This report and the financial statements contained herein are submitted for the general information of the shareholders of the Fund. This report is not authorized for distribution to prospective investors in the Fund unless preceded or accompanied by an effective prospectus.
A fund files its complete schedule of portfolio holdings with the SEC for the first and third quarters of each fiscal year on Form N-Q. Forms N-Q are available on the SEC’s web site at http://www.sec.gov. A fund's Forms N-Q may be reviewed and copied at the SEC’s Public Reference Room in Washington, DC. Information regarding the operation of the SEC's Public Reference Room may be obtained by calling 1-800-SEC-0330.
For a complete list of a fund's portfolio holdings, view the most recent holdings listing, semiannual report, or annual report on Fidelity's web site at http://www.fidelity.com, http://www.advisor.fidelity.com, or http://www.401k.com, as applicable.
NOT FDIC INSURED •MAY LOSE VALUE •NO BANK GUARANTEE
Neither the Fund nor Fidelity Distributors Corporation is a bank.
Performance: The Bottom Line
Average annual total return reflects the change in the value of an investment, assuming reinvestment of distributions from dividend income and capital gains (the profits earned upon the sale of securities that have grown in value, if any) and assuming a constant rate of performance each year.
The hypothetical investment and the average annual total returns do not reflect the deduction of taxes that a shareholder would pay on fund distributions or the redemption of fund shares.
During periods of reimbursement by Fidelity, a fund’s total return will be greater than it would be had the reimbursement not occurred.
How a fund did yesterday is no guarantee of how it will do tomorrow.
Average Annual Total Returns
| For the periods ended November 30, 2015 | Past 1 year | Past 5 years | Past 10 years |
| Class I | 1.36% | 11.89% | 7.15% |
$10,000 Over 10 Years
Let's say hypothetically that $10,000 was invested in Fidelity Advisor® Value Strategies Fund - Class I on November 30, 2005.
The chart shows how the value of your investment would have changed, and also shows how the Russell Midcap® Value Index performed over the same period.
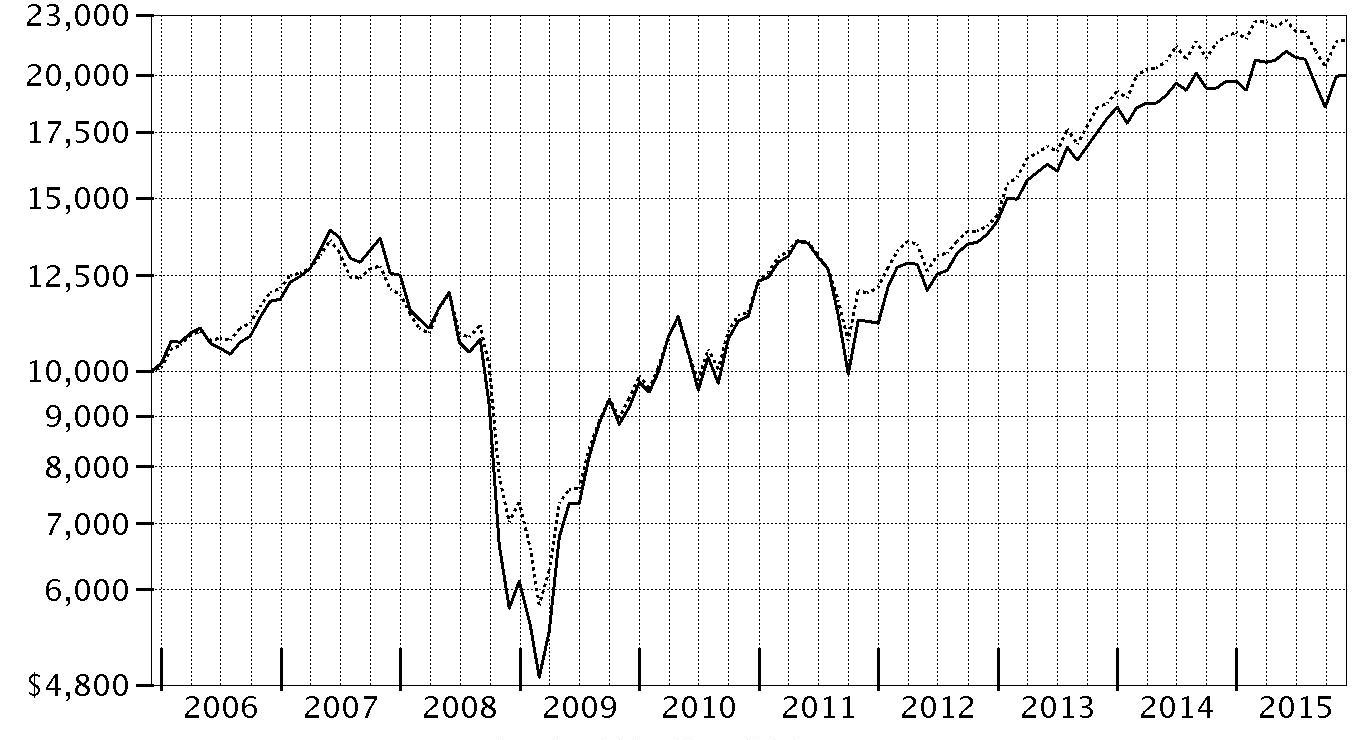
| Period Ending Values | ||
| $19,957 | Fidelity Advisor® Value Strategies Fund - Class I | |
| $21,688 | Russell Midcap® Value Index | |
Management's Discussion of Fund Performance
Market Recap: U.S. stocks gained modestly for the 12 months ending November 30, 2015, despite a steep decline in August and September on concern about slowing economic growth in China. The S&P 500® index rebounded in October and gained 2.75% for the year. Stocks benefited late in the period amid waning expectations for a near-term interest-rate hike by the U.S. Federal Reserve, more economic stimulus in Europe and an interest-rate cut in China. Growth stocks in the benchmark far outpaced their value counterparts, as investors continued to seek growth in a subpar economic environment. Sector performance varied widely, with more than 26 percentage points separating the leader from the laggard. Consumer discretionary (+14%) secured the top spot, benefiting from a combination of rising personal income and still-benign inflation. Information technology (+7%) and health care (+4%) also outpaced the broad market. Conversely, the energy sector (-12%) performed worst, stymied by depressed commodity prices that also hit materials (-5%). Telecommunication services (-5%) and utilities (-4%), considered defensive sectors less sensitive to the economy, also lost ground. At period end, investors remained focused on the potential global implications of a stronger U.S. dollar and how China’s transition toward a consumption-led economy may affect corporate earnings.Comments from Portfolio Manager Tom Soviero: For the year, the fund’s share classes (excluding sales charges, if applicable) gained modestly, beating the -1.00% return of the benchmark Russell Midcap® Value Index. Security selection drove performance versus the benchmark, especially picks in the consumer discretionary, materials and energy sectors. Underweighting energy also helped. Our biggest individual contributor was top holding LyondellBasell Industries, a Netherlands-based multinational plastics, chemicals and refining company dependent on natural-gas derivatives. Although Lyondell lost its cost advantage when oil prices plunged early in the period, the quality of its assets and strong free cash flow lifted the stock. Another standout was Cott, which bought a water company, diluting its dependence on carbonated beverages and boosting its earnings-growth prospects. Additionally, the fund’s foreign holdings bolstered performance despite the stronger U.S. dollar. By contrast, stock picks in information technology and health care, as well as a sizable underweighting in financials, detracted. Disappointments included Micron Technology, a semiconductor company hurt by more capacity coming online as industry demand slowed. Lastly, not owning for-profit health insurer and index component Cigna hurt. Lyondell, Cott and Micron were all non-index holdings.The views expressed above reflect those of the portfolio manager(s) only through the end of the period as stated on the cover of this report and do not necessarily represent the views of Fidelity or any other person in the Fidelity organization. Any such views are subject to change at any time based upon market or other conditions and Fidelity disclaims any responsibility to update such views. These views may not be relied on as investment advice and, because investment decisions for a Fidelity fund are based on numerous factors, may not be relied on as an indication of trading intent on behalf of any Fidelity fund.
Investment Summary (Unaudited)
Top Ten Stocks as of November 30, 2015
| % of fund's net assets | % of fund's net assets 6 months ago | |
| LyondellBasell Industries NV Class A | 6.5 | 5.3 |
| Bank of America Corp. | 4.1 | 3.6 |
| Apple, Inc. | 3.4 | 4.8 |
| General Motors Co. | 3.3 | 3.0 |
| Citigroup, Inc. | 3.0 | 0.8 |
| Delphi Automotive PLC | 3.0 | 4.1 |
| U.S. Bancorp | 2.7 | 2.4 |
| Cott Corp. | 2.6 | 2.2 |
| Universal Health Services, Inc. Class B | 2.4 | 2.3 |
| Boston Scientific Corp. | 2.3 | 2.1 |
| 33.3 |
Top Five Market Sectors as of November 30, 2015
| % of fund's net assets | % of fund's net assets 6 months ago | |
| Consumer Discretionary | 19.8 | 23.0 |
| Financials | 15.2 | 12.8 |
| Health Care | 14.5 | 16.3 |
| Materials | 10.0 | 8.6 |
| Information Technology | 8.1 | 13.7 |
Asset Allocation (% of fund's net assets)
| As of November 30, 2015 * | ||
| Stocks | 88.9% | |
| Bonds | 0.1% | |
| Short-Term Investments and Net Other Assets (Liabilities) | 11.0% | |

* Foreign investments - 15.9%
| As of May 31, 2015 * | ||
| Stocks | 97.1% | |
| Bonds | 0.5% | |
| Short-Term Investments and Net Other Assets (Liabilities) | 2.4% | |

* Foreign investments - 17.5%
Investments November 30, 2015
Showing Percentage of Net Assets
| Common Stocks - 88.9% | |||
| Shares | Value (000s) | ||
| CONSUMER DISCRETIONARY - 19.8% | |||
| Auto Components - 3.3% | |||
| Delphi Automotive PLC | 474,177 | $41,671 | |
| Tenneco, Inc. (a) | 90,224 | 4,861 | |
| 46,532 | |||
| Automobiles - 3.3% | |||
| General Motors Co. | 1,284,836 | 46,511 | |
| Diversified Consumer Services - 1.3% | |||
| Service Corp. International | 691,750 | 19,265 | |
| Hotels, Restaurants & Leisure - 2.0% | |||
| Cedar Fair LP (depositary unit) | 227,420 | 12,808 | |
| Wyndham Worldwide Corp. | 199,867 | 15,174 | |
| 27,982 | |||
| Household Durables - 4.1% | |||
| CalAtlantic Group, Inc. | 527,581 | 22,211 | |
| Lennar Corp. Class A (b) | 424,700 | 21,749 | |
| PulteGroup, Inc. | 744,504 | 14,503 | |
| 58,463 | |||
| Leisure Products - 3.1% | |||
| Hasbro, Inc. | 266,797 | 19,500 | |
| Vista Outdoor, Inc. (a) | 557,700 | 24,567 | |
| 44,067 | |||
| Media - 1.1% | |||
| Omnicom Group, Inc. | 120,112 | 8,879 | |
| Regal Entertainment Group Class A (b) | 330,800 | 6,203 | |
| 15,082 | |||
| Specialty Retail - 1.4% | |||
| Asbury Automotive Group, Inc. (a) | 111,241 | 8,354 | |
| GameStop Corp. Class A (b) | 313,213 | 10,972 | |
| 19,326 | |||
| Textiles, Apparel & Luxury Goods - 0.2% | |||
| PVH Corp. | 36,500 | 3,332 | |
| TOTAL CONSUMER DISCRETIONARY | 280,560 | ||
| CONSUMER STAPLES - 5.9% | |||
| Beverages - 2.6% | |||
| Cott Corp. | 3,511,564 | 36,787 | |
| Food & Staples Retailing - 1.6% | |||
| CVS Health Corp. | 237,100 | 22,309 | |
| Food Products - 0.9% | |||
| Calavo Growers, Inc. | 232,028 | 13,128 | |
| Household Products - 0.8% | |||
| Procter & Gamble Co. | 142,100 | 10,635 | |
| TOTAL CONSUMER STAPLES | 82,859 | ||
| ENERGY - 3.3% | |||
| Energy Equipment & Services - 0.5% | |||
| Halliburton Co. | 183,600 | 7,316 | |
| Oil, Gas & Consumable Fuels - 2.8% | |||
| ConocoPhillips Co. | 117,100 | 6,329 | |
| EP Energy Corp. (a)(b) | 274,600 | 1,554 | |
| HollyFrontier Corp. | 76,400 | 3,673 | |
| Kinder Morgan, Inc. | 170,400 | 4,016 | |
| Valero Energy Corp. | 327,300 | 23,520 | |
| 39,092 | |||
| TOTAL ENERGY | 46,408 | ||
| FINANCIALS - 15.2% | |||
| Banks - 13.9% | |||
| Bank of America Corp. | 3,355,213 | 58,481 | |
| CIT Group, Inc. | 157,349 | 6,760 | |
| Citigroup, Inc. | 796,323 | 43,073 | |
| JPMorgan Chase & Co. | 314,200 | 20,951 | |
| Regions Financial Corp. | 778,163 | 7,891 | |
| U.S. Bancorp | 862,484 | 37,854 | |
| Wells Fargo & Co. | 377,370 | 20,793 | |
| 195,803 | |||
| Capital Markets - 0.6% | |||
| PJT Partners, Inc. (a) | 6,685 | 157 | |
| The Blackstone Group LP | 267,400 | 8,351 | |
| 8,508 | |||
| Insurance - 0.7% | |||
| AFLAC, Inc. | 158,186 | 10,320 | |
| TOTAL FINANCIALS | 214,631 | ||
| HEALTH CARE - 14.5% | |||
| Health Care Equipment & Supplies - 5.5% | |||
| Alere, Inc. (a) | 172,283 | 7,110 | |
| Boston Scientific Corp. (a) | 1,785,400 | 32,637 | |
| St. Jude Medical, Inc. | 463,300 | 29,234 | |
| Zimmer Biomet Holdings, Inc. | 87,600 | 8,848 | |
| 77,829 | |||
| Health Care Providers & Services - 3.2% | |||
| DaVita HealthCare Partners, Inc. (a) | 158,496 | 11,577 | |
| Universal Health Services, Inc. Class B | 278,914 | 33,894 | |
| 45,471 | |||
| Life Sciences Tools & Services - 0.8% | |||
| PerkinElmer, Inc. | 207,500 | 11,031 | |
| Pharmaceuticals - 5.0% | |||
| Johnson & Johnson | 187,800 | 19,013 | |
| Merck & Co., Inc. | 390,800 | 20,716 | |
| Sanofi SA sponsored ADR | 720,344 | 31,854 | |
| 71,583 | |||
| TOTAL HEALTH CARE | 205,914 | ||
| INDUSTRIALS - 7.7% | |||
| Aerospace & Defense - 4.6% | |||
| Esterline Technologies Corp. (a) | 180,022 | 17,116 | |
| Honeywell International, Inc. | 139,500 | 14,501 | |
| Orbital ATK, Inc. | 278,850 | 23,956 | |
| Textron, Inc. | 223,717 | 9,546 | |
| 65,119 | |||
| Machinery - 1.8% | |||
| Deere & Co. (b) | 164,900 | 13,121 | |
| Ingersoll-Rand PLC | 208,100 | 12,209 | |
| 25,330 | |||
| Road & Rail - 0.6% | |||
| Hertz Global Holdings, Inc. (a) | 557,200 | 8,837 | |
| Trading Companies & Distributors - 0.7% | |||
| Aircastle Ltd. | 467,200 | 9,793 | |
| TOTAL INDUSTRIALS | 109,079 | ||
| INFORMATION TECHNOLOGY - 8.1% | |||
| IT Services - 0.7% | |||
| Fidelity National Information Services, Inc. | 165,730 | 10,552 | |
| Semiconductors & Semiconductor Equipment - 2.3% | |||
| Cypress Semiconductor Corp. (b) | 1,507,475 | 16,311 | |
| Micron Technology, Inc. (a) | 559,183 | 8,908 | |
| ON Semiconductor Corp. (a) | 646,970 | 7,091 | |
| 32,310 | |||
| Software - 1.7% | |||
| Microsoft Corp. | 429,324 | 23,334 | |
| Technology Hardware, Storage & Peripherals - 3.4% | |||
| Apple, Inc. | 407,860 | 48,250 | |
| TOTAL INFORMATION TECHNOLOGY | 114,446 | ||
| MATERIALS - 10.0% | |||
| Chemicals - 8.8% | |||
| Ashland, Inc. | 83,100 | 9,361 | |
| Axiall Corp. | 284,126 | 5,921 | |
| LyondellBasell Industries NV Class A | 965,892 | 92,551 | |
| PPG Industries, Inc. | 154,592 | 16,347 | |
| 124,180 | |||
| Containers & Packaging - 1.2% | |||
| WestRock Co. | 347,900 | 17,614 | |
| TOTAL MATERIALS | 141,794 | ||
| TELECOMMUNICATION SERVICES - 2.0% | |||
| Diversified Telecommunication Services - 2.0% | |||
| Level 3 Communications, Inc. (a) | 558,139 | 28,370 | |
| UTILITIES - 2.4% | |||
| Independent Power and Renewable Electricity Producers - 1.1% | |||
| Calpine Corp. (a) | 567,563 | 8,389 | |
| Dynegy, Inc. (a) | 441,400 | 7,115 | |
| 15,504 | |||
| Multi-Utilities - 1.3% | |||
| Sempra Energy | 179,639 | 17,826 | |
| TOTAL UTILITIES | 33,330 | ||
| TOTAL COMMON STOCKS | |||
| (Cost $794,484) | 1,257,391 | ||
| Principal Amount (000s) | Value (000s) | ||
| Nonconvertible Bonds - 0.1% | |||
| ENERGY - 0.1% | |||
| Oil, Gas & Consumable Fuels - 0.1% | |||
| Peabody Energy Corp. 6.25% 11/15/21 (Cost $14,230) | 15,405 | 2,426 | |
| Shares | Value (000s) | ||
| Money Market Funds - 3.8% | |||
| Fidelity Cash Central Fund, 0.18% (c) | 23,178,091 | 23,178 | |
| Fidelity Securities Lending Cash Central Fund, 0.22% (c)(d) | 30,384,778 | 30,385 | |
| TOTAL MONEY MARKET FUNDS | |||
| (Cost $53,563) | 53,563 | ||
| TOTAL INVESTMENT PORTFOLIO - 92.8% | |||
| (Cost $862,277) | 1,313,380 | ||
| NET OTHER ASSETS (LIABILITIES) - 7.2% | 101,256 | ||
| NET ASSETS - 100% | $1,414,636 |
Legend
(a) Non-income producing
(b) Security or a portion of the security is on loan at period end.
(c) Affiliated fund that is generally available only to investment companies and other accounts managed by Fidelity Investments. The rate quoted is the annualized seven-day yield of the fund at period end. A complete unaudited listing of the fund's holdings as of its most recent quarter end is available upon request. In addition, each Fidelity Central Fund's financial statements, which are not covered by the Fund's Report of Independent Registered Public Accounting Firm, are available on the SEC's website or upon request.
(d) Investment made with cash collateral received from securities on loan.
Affiliated Central Funds
Information regarding fiscal year to date income earned by the Fund from investments in Fidelity Central Funds is as follows:
| Fund | Income earned |
| (Amounts in thousands) | |
| Fidelity Cash Central Fund | $50 |
| Fidelity Securities Lending Cash Central Fund | 791 |
| Total | $841 |
Investment Valuation
The following is a summary of the inputs used, as of November 30, 2015, involving the Fund's assets and liabilities carried at fair value. The inputs or methodology used for valuing securities may not be an indication of the risk associated with investing in those securities. For more information on valuation inputs, and their aggregation into the levels used below, please refer to the Investment Valuation section in the accompanying Notes to Financial Statements.
| Valuation Inputs at Reporting Date: | ||||
| Description | Total | Level 1 | Level 2 | Level 3 |
| (Amounts in thousands) | ||||
| Investments in Securities: | ||||
| Equities: | ||||
| Consumer Discretionary | $280,560 | $280,560 | $-- | $-- |
| Consumer Staples | 82,859 | 82,859 | -- | -- |
| Energy | 46,408 | 46,408 | -- | -- |
| Financials | 214,631 | 214,631 | -- | -- |
| Health Care | 205,914 | 205,914 | -- | -- |
| Industrials | 109,079 | 109,079 | -- | -- |
| Information Technology | 114,446 | 114,446 | -- | -- |
| Materials | 141,794 | 141,794 | -- | -- |
| Telecommunication Services | 28,370 | 28,370 | -- | -- |
| Utilities | 33,330 | 33,330 | -- | -- |
| Corporate Bonds | 2,426 | -- | 2,426 | -- |
| Money Market Funds | 53,563 | 53,563 | -- | -- |
| Total Investments in Securities: | $1,313,380 | $1,310,954 | $2,426 | $-- |
Other Information
Distribution of investments by country or territory of incorporation, as a percentage of Total Net Assets, is as follows (Unaudited):
| United States of America | 84.1% |
| Netherlands | 6.5% |
| Bailiwick of Jersey | 3.0% |
| Canada | 2.6% |
| France | 2.2% |
| Others (Individually Less Than 1%) | 1.6% |
| 100.0% |
See accompanying notes which are an integral part of the financial statements.
Financial Statements
Statement of Assets and Liabilities
| Amounts in thousands (except per-share amounts) | November 30, 2015 | |
| Assets | ||
| Investment in securities, at value (including securities loaned of $29,334) — See accompanying schedule: Unaffiliated issuers (cost $808,714) | $1,259,817 | |
| Fidelity Central Funds (cost $53,563) | 53,563 | |
| Total Investments (cost $862,277) | $1,313,380 | |
| Receivable for investments sold | 379 | |
| Receivable for fund shares sold | 131,840 | |
| Dividends receivable | 2,389 | |
| Interest receivable | 43 | |
| Distributions receivable from Fidelity Central Funds | 52 | |
| Prepaid expenses | 3 | |
| Other receivables | 13 | |
| Total assets | 1,448,099 | |
| Liabilities | ||
| Payable for fund shares redeemed | $2,215 | |
| Accrued management fee | 358 | |
| Distribution and service plan fees payable | 211 | |
| Other affiliated payables | 250 | |
| Other payables and accrued expenses | 44 | |
| Collateral on securities loaned, at value | 30,385 | |
| Total liabilities | 33,463 | |
| Net Assets | $1,414,636 | |
| Net Assets consist of: | ||
| Paid in capital | $1,086,894 | |
| Undistributed net investment income | 12,741 | |
| Accumulated undistributed net realized gain (loss) on investments and foreign currency transactions | (136,102) | |
| Net unrealized appreciation (depreciation) on investments and assets and liabilities in foreign currencies | 451,103 | |
| Net Assets | $1,414,636 | |
| Calculation of Maximum Offering Price | ||
| Class A: | ||
| Net Asset Value and redemption price per share ($215,141 ÷ 5,514.662 shares) | $39.01 | |
| Maximum offering price per share (100/94.25 of $39.01) | $41.39 | |
| Class T: | ||
| Net Asset Value and redemption price per share ($294,097 ÷ 7,279.753 shares) | $40.40 | |
| Maximum offering price per share (100/96.50 of $40.40) | $41.87 | |
| Class B: | ||
| Net Asset Value and offering price per share ($3,911 ÷ 110.061 shares)(a) | $35.53 | |
| Class C: | ||
| Net Asset Value and offering price per share ($49,140 ÷ 1,399.392 shares)(a) | $35.12 | |
| Fidelity Value Strategies Fund: | ||
| Net Asset Value, offering price and redemption price per share ($715,837 ÷ 16,373.120 shares) | $43.72 | |
| Class K: | ||
| Net Asset Value, offering price and redemption price per share ($71,635 ÷ 1,637.769 shares) | $43.74 | |
| Class I: | ||
| Net Asset Value, offering price and redemption price per share ($64,875 ÷ 1,555.559 shares) | $41.71 |
(a) Redemption price per share is equal to net asset value less any applicable contingent deferred sales charge.
See accompanying notes which are an integral part of the financial statements.
Statement of Operations
| Amounts in thousands | Year ended November 30, 2015 | |
| Investment Income | ||
| Dividends | $24,333 | |
| Interest | 1,276 | |
| Income from Fidelity Central Funds | 841 | |
| Total income | 26,450 | |
| Expenses | ||
| Management fee | ||
| Basic fee | $7,974 | |
| Performance adjustment | (1,933) | |
| Transfer agent fees | 2,877 | |
| Distribution and service plan fees | 2,725 | |
| Accounting and security lending fees | 465 | |
| Custodian fees and expenses | 15 | |
| Independent trustees' compensation | 6 | |
| Registration fees | 109 | |
| Audit | 65 | |
| Legal | 6 | |
| Miscellaneous | 11 | |
| Total expenses before reductions | 12,320 | |
| Expense reductions | (77) | 12,243 |
| Net investment income (loss) | 14,207 | |
| Realized and Unrealized Gain (Loss) | ||
| Net realized gain (loss) on: | ||
| Investment securities: | ||
| Unaffiliated issuers | 117,277 | |
| Foreign currency transactions | 14 | |
| Total net realized gain (loss) | 117,291 | |
| Change in net unrealized appreciation (depreciation) on: Investment securities | (113,534) | |
| Assets and liabilities in foreign currencies | 3 | |
| Total change in net unrealized appreciation (depreciation) | (113,531) | |
| Net gain (loss) | 3,760 | |
| Net increase (decrease) in net assets resulting from operations | $17,967 |
See accompanying notes which are an integral part of the financial statements.
Statement of Changes in Net Assets
| Amounts in thousands | Year ended November 30, 2015 | Year ended November 30, 2014 |
| Increase (Decrease) in Net Assets | ||
| Operations | ||
| Net investment income (loss) | $14,207 | $12,033 |
| Net realized gain (loss) | 117,291 | 6,319 |
| Change in net unrealized appreciation (depreciation) | (113,531) | 112,825 |
| Net increase (decrease) in net assets resulting from operations | 17,967 | 131,177 |
| Distributions to shareholders from net investment income | (11,929) | (10,331) |
| Distributions to shareholders from net realized gain | (1,090) | – |
| Total distributions | (13,019) | (10,331) |
| Share transactions - net increase (decrease) | (175,423) | (53,813) |
| Total increase (decrease) in net assets | (170,475) | 67,033 |
| Net Assets | ||
| Beginning of period | 1,585,111 | 1,518,078 |
| End of period (including undistributed net investment income of $12,741 and undistributed net investment income of $11,706, respectively) | $1,414,636 | $1,585,111 |
See accompanying notes which are an integral part of the financial statements.
Financial Highlights — Fidelity Advisor Value Strategies Fund Class A
| November 30, | |||||
| Years ended November 30, | 2015 | 2014 | 2013 | 2012 | 2011 |
| Selected Per–Share Data | |||||
| Net asset value, beginning of period | $38.91 | $36.02 | $27.62 | $22.71 | $23.11 |
| Income from Investment Operations | |||||
| Net investment income (loss)A | .35 | .25 | .23 | –B | .13C |
| Net realized and unrealized gain (loss) | .06 | 2.87 | 8.25 | 5.03 | (.49) |
| Total from investment operations | .41 | 3.12 | 8.48 | 5.03 | (.36) |
| Distributions from net investment income | (.28)D | (.23) | (.08) | (.12) | (.03)D |
| Distributions from net realized gain | (.03)D | – | – | – | (.01)D |
| Total distributions | (.31) | (.23) | (.08) | (.12) | (.04) |
| Net asset value, end of period | $39.01 | $38.91 | $36.02 | $27.62 | $22.71 |
| Total ReturnE,F | 1.07% | 8.74% | 30.77% | 22.29% | (1.57)% |
| Ratios to Average Net AssetsG,H | |||||
| Expenses before reductions | .93% | .96% | 1.04% | 1.21% | 1.18% |
| Expenses net of fee waivers, if any | .93% | .96% | 1.04% | 1.21% | 1.18% |
| Expenses net of all reductions | .93% | .96% | 1.03% | 1.21% | 1.17% |
| Net investment income (loss) | .89% | .68% | .73% | - %B | .51%C |
| Supplemental Data | |||||
| Net assets, end of period (in millions) | $215 | $233 | $243 | $203 | $190 |
| Portfolio turnover rateI | 9% | 6% | 22% | 23% | 34% |
A Calculated based on average shares outstanding during the period.
B Investment income per share reflects a large, non-recurring dividend which amounted to $.07 per share. Excluding this non-recurring dividend, the ratio of net investment income (loss) to average net assets would have been (.28) %.
C Investment income per share reflects a large, non-recurring dividend which amounted to $.16 per share. Excluding this non-recurring dividend, the ratio of net investment income (loss) to average net assets would have been (.11) %.
D The amounts shown reflect certain reclassifications related to book to tax differences that were made in the year shown.
E Total returns would have been lower if certain expenses had not been reduced during the applicable periods shown.
F Total returns do not include the effect of the sales charges.
G Fees and expenses of any underlying Fidelity Central Funds are not included in the Fund's expense ratio. The Fund indirectly bears its proportionate share of the expenses of any underlying Fidelity Central Funds.
H Expense ratios reflect operating expenses of the class. Expenses before reductions do not reflect amounts reimbursed by the investment adviser or reductions from brokerage service arrangements or reductions from other expense offset arrangements and do not represent the amount paid by the class during periods when reimbursements or reductions occur. Expenses net of fee waivers reflect expenses after reimbursement by the investment adviser but prior to reductions from brokerage service arrangements or other expense offset arrangements. Expenses net of all reductions represent the net expenses paid by the class.
I Amount does not include the portfolio activity of any underlying Fidelity Central Funds.
See accompanying notes which are an integral part of the financial statements.
Financial Highlights — Fidelity Advisor Value Strategies Fund Class T
| November 30, | |||||
| Years ended November 30, | 2015 | 2014 | 2013 | 2012 | 2011 |
| Selected Per–Share Data | |||||
| Net asset value, beginning of period | $40.28 | $37.28 | $28.58 | $23.48 | $23.90 |
| Income from Investment Operations | |||||
| Net investment income (loss)A | .28 | .18 | .18 | (.05)B | .08C |
| Net realized and unrealized gain (loss) | .06 | 2.98 | 8.54 | 5.22 | (.50) |
| Total from investment operations | .34 | 3.16 | 8.72 | 5.17 | (.42) |
| Distributions from net investment income | (.19)D | (.16) | (.02) | (.07) | – |
| Distributions from net realized gain | (.03)D | – | – | – | – |
| Total distributions | (.22) | (.16) | (.02) | (.07) | – |
| Net asset value, end of period | $40.40 | $40.28 | $37.28 | $28.58 | $23.48 |
| Total ReturnE,F | .86% | 8.51% | 30.52% | 22.08% | (1.76)% |
| Ratios to Average Net AssetsG,H | |||||
| Expenses before reductions | 1.15% | 1.17% | 1.23% | 1.38% | 1.35% |
| Expenses net of fee waivers, if any | 1.14% | 1.17% | 1.23% | 1.38% | 1.35% |
| Expenses net of all reductions | 1.14% | 1.17% | 1.22% | 1.38% | 1.35% |
| Net investment income (loss) | .68% | .47% | .54% | (.17)%B | .33%C |
| Supplemental Data | |||||
| Net assets, end of period (in millions) | $294 | $324 | $335 | $283 | $274 |
| Portfolio turnover rateI | 9% | 6% | 22% | 23% | 34% |
A Calculated based on average shares outstanding during the period.
B Investment income per share reflects a large, non-recurring dividend which amounted to $.07 per share. Excluding this non-recurring dividend, the ratio of net investment income (loss) to average net assets would have been (.45) %.
C Investment income per share reflects a large, non-recurring dividend which amounted to $.16 per share. Excluding this non-recurring dividend, the ratio of net investment income (loss) to average net assets would have been (.29) %.
D The amounts shown reflect certain reclassifications related to book to tax differences that were made in the year shown.
E Total returns would have been lower if certain expenses had not been reduced during the applicable periods shown.
F Total returns do not include the effect of the sales charges.
G Fees and expenses of any underlying Fidelity Central Funds are not included in the Fund's expense ratio. The Fund indirectly bears its proportionate share of the expenses of any underlying Fidelity Central Funds.
H Expense ratios reflect operating expenses of the class. Expenses before reductions do not reflect amounts reimbursed by the investment adviser or reductions from brokerage service arrangements or reductions from other expense offset arrangements and do not represent the amount paid by the class during periods when reimbursements or reductions occur. Expenses net of fee waivers reflect expenses after reimbursement by the investment adviser but prior to reductions from brokerage service arrangements or other expense offset arrangements. Expenses net of all reductions represent the net expenses paid by the class.
I Amount does not include the portfolio activity of any underlying Fidelity Central Funds.
See accompanying notes which are an integral part of the financial statements.
Financial Highlights — Fidelity Advisor Value Strategies Fund Class B
| Years ended November 30, | 2015 | 2014 | 2013 | 2012 | 2011 |
| Selected Per–Share Data | |||||
| Net asset value, beginning of period | $35.44 | $32.86 | $25.34 | $20.87 | $21.37 |
| Income from Investment Operations | |||||
| Net investment income (loss)A | .02 | (.05) | (.02) | (.18)B | (.06)C |
| Net realized and unrealized gain (loss) | .07 | 2.63 | 7.54 | 4.65 | (.44) |
| Total from investment operations | .09 | 2.58 | 7.52 | 4.47 | (.50) |
| Distributions from net investment income | – | – | – | – | – |
| Distributions from net realized gain | – | – | – | – | – |
| Total distributions | – | – | – | – | – |
| Net asset value, end of period | $35.53 | $35.44 | $32.86 | $25.34 | $20.87 |
| Total ReturnD,E | .25% | 7.85% | 29.68% | 21.42% | (2.34)% |
| Ratios to Average Net AssetsF,G | |||||
| Expenses before reductions | 1.77% | 1.78% | 1.83% | 1.97% | 1.93% |
| Expenses net of fee waivers, if any | 1.76% | 1.78% | 1.83% | 1.97% | 1.93% |
| Expenses net of all reductions | 1.76% | 1.78% | 1.82% | 1.97% | 1.93% |
| Net investment income (loss) | .06% | (.14)% | (.07)% | (.76)%B | (.25)%C |
| Supplemental Data | |||||
| Net assets, end of period (in millions) | $4 | $7 | $11 | $13 | $16 |
| Portfolio turnover rateH | 9% | 6% | 22% | 23% | 34% |
A Calculated based on average shares outstanding during the period.
B Investment income per share reflects a large, non-recurring dividend which amounted to $.06 per share. Excluding this non-recurring dividend, the ratio of net investment income (loss) to average net assets would have been (1.04) %.
C Investment income per share reflects a large, non-recurring dividend which amounted to $.16 per share. Excluding this non-recurring dividend, the ratio of net investment income (loss) to average net assets would have been (.87) %.
D Total returns would have been lower if certain expenses had not been reduced during the applicable periods shown.
E Total returns do not include the effect of the contingent deferred sales charge.
F Fees and expenses of any underlying Fidelity Central Funds are not included in the Fund's expense ratio. The Fund indirectly bears its proportionate share of the expenses of any underlying Fidelity Central Funds.
G Expense ratios reflect operating expenses of the class. Expenses before reductions do not reflect amounts reimbursed by the investment adviser or reductions from brokerage service arrangements or reductions from other expense offset arrangements and do not represent the amount paid by the class during periods when reimbursements or reductions occur. Expenses net of fee waivers reflect expenses after reimbursement by the investment adviser but prior to reductions from brokerage service arrangements or other expense offset arrangements. Expenses net of all reductions represent the net expenses paid by the class.
H Amount does not include the portfolio activity of any underlying Fidelity Central Funds.
See accompanying notes which are an integral part of the financial statements.
Financial Highlights — Fidelity Advisor Value Strategies Fund Class C
| November 30, | |||||
| Years ended November 30, | 2015 | 2014 | 2013 | 2012 | 2011 |
| Selected Per–Share Data | |||||
| Net asset value, beginning of period | $35.07 | $32.52 | $25.06 | $20.64 | $21.13 |
| Income from Investment Operations | |||||
| Net investment income (loss)A | .05 | (.03) | (.01) | (.17)B | (.05)C |
| Net realized and unrealized gain (loss) | .07 | 2.60 | 7.47 | 4.59 | (.44) |
| Total from investment operations | .12 | 2.57 | 7.46 | 4.42 | (.49) |
| Distributions from net investment income | (.04)D | (.02) | – | – | – |
| Distributions from net realized gain | (.03)D | – | – | – | – |
| Total distributions | (.07) | (.02) | – | – | – |
| Net asset value, end of period | $35.12 | $35.07 | $32.52 | $25.06 | $20.64 |
| Total ReturnE,F | .33% | 7.91% | 29.77% | 21.41% | (2.32)% |
| Ratios to Average Net AssetsG,H | |||||
| Expenses before reductions | 1.70% | 1.72% | 1.78% | 1.95% | 1.92% |
| Expenses net of fee waivers, if any | 1.69% | 1.72% | 1.78% | 1.95% | 1.92% |
| Expenses net of all reductions | 1.69% | 1.72% | 1.77% | 1.95% | 1.92% |
| Net investment income (loss) | .13% | (.08)% | (.02)% | (.75)%B | (.24)%C |
| Supplemental Data | |||||
| Net assets, end of period (in millions) | $49 | $53 | $54 | $43 | $40 |
| Portfolio turnover rateI | 9% | 6% | 22% | 23% | 34% |
A Calculated based on average shares outstanding during the period.
B Investment income per share reflects a large, non-recurring dividend which amounted to $.06 per share. Excluding this non-recurring dividend, the ratio of net investment income (loss) to average net assets would have been (1.02) %.
C Investment income per share reflects a large, non-recurring dividend which amounted to $.16 per share. Excluding this non-recurring dividend, the ratio of net investment income (loss) to average net assets would have been (.86) %.
D The amounts shown reflect certain reclassifications related to book to tax differences that were made in the year shown.
E Total returns would have been lower if certain expenses had not been reduced during the applicable periods shown.
F Total returns do not include the effect of the contingent deferred sales charge.
G Fees and expenses of any underlying Fidelity Central Funds are not included in the Fund's expense ratio. The Fund indirectly bears its proportionate share of the expenses of any underlying Fidelity Central Funds.
H Expense ratios reflect operating expenses of the class. Expenses before reductions do not reflect amounts reimbursed by the investment adviser or reductions from brokerage service arrangements or reductions from other expense offset arrangements and do not represent the amount paid by the class during periods when reimbursements or reductions occur. Expenses net of fee waivers reflect expenses after reimbursement by the investment adviser but prior to reductions from brokerage service arrangements or other expense offset arrangements. Expenses net of all reductions represent the net expenses paid by the class.
I Amount does not include the portfolio activity of any underlying Fidelity Central Funds.
See accompanying notes which are an integral part of the financial statements.
Financial Highlights — Fidelity Advisor Value Strategies Fund
| November 30, | |||||
| Years ended November 30, | 2015 | 2014 | 2013 | 2012 | 2011 |
| Selected Per–Share Data | |||||
| Net asset value, beginning of period | $43.56 | $40.28 | $30.89 | $25.37 | $25.80 |
| Income from Investment Operations | |||||
| Net investment income (loss)A | .51 | .40 | .37 | .09B | .22C |
| Net realized and unrealized gain (loss) | .07 | 3.21 | 9.20 | 5.62 | (.54) |
| Total from investment operations | .58 | 3.61 | 9.57 | 5.71 | (.32) |
| Distributions from net investment income | (.39)D | (.33) | (.18) | (.19) | (.10)D |
| Distributions from net realized gain | (.03)D | – | – | – | (.01)D |
| Total distributions | (.42) | (.33) | (.18) | (.19) | (.11) |
| Net asset value, end of period | $43.72 | $43.56 | $40.28 | $30.89 | $25.37 |
| Total ReturnE | 1.35% | 9.05% | 31.14% | 22.69% | (1.29)% |
| Ratios to Average Net AssetsF,G | |||||
| Expenses before reductions | .67% | .69% | .73% | .89% | .88% |
| Expenses net of fee waivers, if any | .67% | .69% | .73% | .89% | .88% |
| Expenses net of all reductions | .66% | .69% | .72% | .89% | .88% |
| Net investment income (loss) | 1.16% | .95% | 1.03% | .31%B | .80%C |
| Supplemental Data | |||||
| Net assets, end of period (in millions) | $716 | $786 | $681 | $396 | $284 |
| Portfolio turnover rateH | 9% | 6% | 22% | 23% | 34% |
A Calculated based on average shares outstanding during the period.
B Investment income per share reflects a large, non-recurring dividend which amounted to $.08 per share. Excluding this non-recurring dividend, the ratio of net investment income (loss) to average net assets would have been .04%.
C Investment income per share reflects a large, non-recurring dividends which amounted to $.16 per share. Excluding this non-recurring dividend, the ratio of net investment income (loss) to average net assets would have been .18%.
D The amounts shown reflect certain reclassifications related to book to tax differences that were made in the year shown.
E Total returns would have been lower if certain expenses had not been reduced during the applicable periods shown.
F Fees and expenses of any underlying Fidelity Central Funds are not included in the Fund's expense ratio. The Fund indirectly bears its proportionate share of the expenses of any underlying Fidelity Central Funds.
G Expense ratios reflect operating expenses of the class. Expenses before reductions do not reflect amounts reimbursed by the investment adviser or reductions from brokerage service arrangements or reductions from other expense offset arrangements and do not represent the amount paid by the class during periods when reimbursements or reductions occur. Expenses net of fee waivers reflect expenses after reimbursement by the investment adviser but prior to reductions from brokerage service arrangements or other expense offset arrangements. Expenses net of all reductions represent the net expenses paid by the class.
H Amount does not include the portfolio activity of any underlying Fidelity Central Funds.
See accompanying notes which are an integral part of the financial statements.
Financial Highlights — Fidelity Advisor Value Strategies Fund Class K
| November 30, | |||||
| Years ended November 30, | 2015 | 2014 | 2013 | 2012 | 2011 |
| Selected Per–Share Data | |||||
| Net asset value, beginning of period | $43.57 | $40.28 | $30.89 | $25.38 | $25.82 |
| Income from Investment Operations | |||||
| Net investment income (loss)A | .58 | .47 | .43 | .14B | .28C |
| Net realized and unrealized gain (loss) | .07 | 3.20 | 9.18 | 5.61 | (.55) |
| Total from investment operations | .65 | 3.67 | 9.61 | 5.75 | (.27) |
| Distributions from net investment income | (.45)D | (.38) | (.22) | (.24) | (.16)D |
| Distributions from net realized gain | (.03)D | – | – | – | (.01)D |
| Total distributions | (.48) | (.38) | (.22) | (.24) | (.17) |
| Net asset value, end of period | $43.74 | $43.57 | $40.28 | $30.89 | $25.38 |
| Total ReturnE | 1.51% | 9.21% | 31.34% | 22.93% | (1.11)% |
| Ratios to Average Net AssetsF,G | |||||
| Expenses before reductions | .51% | .53% | .58% | .71% | .68% |
| Expenses net of fee waivers, if any | .51% | .53% | .58% | .71% | .68% |
| Expenses net of all reductions | .51% | .53% | .57% | .71% | .68% |
| Net investment income (loss) | 1.31% | 1.11% | 1.18% | .50%B | 1.00%C |
| Supplemental Data | |||||
| Net assets, end of period (in millions) | $72 | $97 | $119 | $70 | $47 |
| Portfolio turnover rateH | 9% | 6% | 22% | 23% | 34% |
A Calculated based on average shares outstanding during the period.
B Investment income per share reflects a large, non-recurring dividend which amounted to $.08 per share. Excluding this non-recurring dividend, the ratio of net investment income (loss) to average net assets would have been .22%.
C Investment income per share reflects a large, non-recurring dividend which amounted to $.16 per share. Excluding this non-recurring dividend, the ratio of net investment income (loss) to average net assets would have been .38%.
D The amounts shown reflect certain reclassifications related to book to tax differences that were made in the year shown.
E Total returns would have been lower if certain expenses had not been reduced during the applicable periods shown.
F Fees and expenses of any underlying Fidelity Central Funds are not included in the Fund's expense ratio. The Fund indirectly bears its proportionate share of the expenses of any underlying Fidelity Central Funds.
G Expense ratios reflect operating expenses of the class. Expenses before reductions do not reflect amounts reimbursed by the investment adviser or reductions from brokerage service arrangements or reductions from other expense offset arrangements and do not represent the amount paid by the class during periods when reimbursements or reductions occur. Expenses net of fee waivers reflect expenses after reimbursement by the investment adviser but prior to reductions from brokerage service arrangements or other expense offset arrangements. Expenses net of all reductions represent the net expenses paid by the class.
H Amount does not include the portfolio activity of any underlying Fidelity Central Funds.
See accompanying notes which are an integral part of the financial statements.
Financial Highlights — Fidelity Advisor Value Strategies Fund Class I
| November 30, | |||||
| Years ended November 30, | 2015 | 2014 | 2013 | 2012 | 2011 |
| Selected Per–Share Data | |||||
| Net asset value, beginning of period | $41.57 | $38.46 | $29.51 | $24.26 | $24.69 |
| Income from Investment Operations | |||||
| Net investment income (loss)A | .48 | .37 | .34 | .08B | .22C |
| Net realized and unrealized gain (loss) | .08 | 3.06 | 8.79 | 5.37 | (.53) |
| Total from investment operations | .56 | 3.43 | 9.13 | 5.45 | (.31) |
| Distributions from net investment income | (.39)D | (.32) | (.18) | (.20) | (.11)D |
| Distributions from net realized gain | (.03)D | – | – | – | (.01)D |
| Total distributions | (.42) | (.32) | (.18) | (.20) | (.12) |
| Net asset value, end of period | $41.71 | $41.57 | $38.46 | $29.51 | $24.26 |
| Total ReturnE | 1.36% | 9.01% | 31.11% | 22.67% | (1.30)% |
| Ratios to Average Net AssetsF,G | |||||
| Expenses before reductions | .68% | .71% | .76% | .90% | .86% |
| Expenses net of fee waivers, if any | .68% | .71% | .76% | .90% | .86% |
| Expenses net of all reductions | .68% | .71% | .75% | .90% | .86% |
| Net investment income (loss) | 1.14% | .93% | 1.00% | .31%B | .82%C |
| Supplemental Data | |||||
| Net assets, end of period (in millions) | $65 | $86 | $74 | $66 | $52 |
| Portfolio turnover rateH | 9% | 6% | 22% | 23% | 34% |
A Calculated based on average shares outstanding during the period.
B Investment income per share reflects a large, non-recurring dividend which amounted to $.08 per share. Excluding this non-recurring dividend, the ratio of net investment income (loss) to average net assets would have been .03%.
C Investment income per share reflects a large, non-recurring dividend which amounted to $.16 per share. Excluding this non-recurring dividend, the ratio of net investment income (loss) to average net assets would have been .20%.
D The amounts shown reflect certain reclassifications related to book to tax differences that were made in the year shown.
E Total returns would have been lower if certain expenses had not been reduced during the applicable periods shown.
F Fees and expenses of any underlying Fidelity Central Funds are not included in the Fund's expense ratio. The Fund indirectly bears its proportionate share of the expenses of any underlying Fidelity Central Funds.
G Expense ratios reflect operating expenses of the class. Expenses before reductions do not reflect amounts reimbursed by the investment adviser or reductions from brokerage service arrangements or reductions from other expense offset arrangements and do not represent the amount paid by the class during periods when reimbursements or reductions occur. Expenses net of fee waivers reflect expenses after reimbursement by the investment adviser but prior to reductions from brokerage service arrangements or other expense offset arrangements. Expenses net of all reductions represent the net expenses paid by the class.
H Amount does not include the portfolio activity of any underlying Fidelity Central Funds.
See accompanying notes which are an integral part of the financial statements.
Notes to Financial Statements
For the period ended November 30, 2015
(Amounts in thousands except percentages)
1. Organization.
Fidelity Advisor Value Strategies Fund (the Fund) is a fund of Fidelity Advisor Series I (the Trust) and is authorized to issue an unlimited number of shares. The Trust is registered under the Investment Company Act of 1940, as amended (the 1940 Act), as an open-end management investment company organized as a Massachusetts business trust. The Fund offers Class A, Class T, Class C, Fidelity Value Strategies Fund, Class K and Class I (formerly Institutional Class) shares, each of which, along with Class B shares, has equal rights as to assets and voting privileges. Class B shares are closed to new accounts and additional purchases, except for exchanges and reinvestments. Each class has exclusive voting rights with respect to matters that affect that class. Class B shares will automatically convert to Class A shares after a holding period of seven years from the initial date of purchase.
2. Investments in Fidelity Central Funds.
The Fund invests in Fidelity Central Funds, which are open-end investment companies generally available only to other investment companies and accounts managed by the investment adviser and its affiliates. The Fund's Schedule of Investments lists each of the Fidelity Central Funds held as of period end, if any, as an investment of the Fund, but does not include the underlying holdings of each Fidelity Central Fund. As an Investing Fund, the Fund indirectly bears its proportionate share of the expenses of the underlying Fidelity Central Funds.
The Money Market Central Funds seek preservation of capital and current income and are managed by Fidelity Investments Money Management, Inc. (FIMM), an affiliate of the investment adviser. Annualized expenses of the Money Market Central Funds as of their most recent shareholder report date are less than .005%.
A complete unaudited list of holdings for each Fidelity Central Fund is available upon request or at the Securities and Exchange Commission (the SEC) website at www.sec.gov. In addition, the financial statements of the Fidelity Central Funds, which are not covered by the Fund's Report of Independent Registered Public Accounting Firm, are available on the SEC website or upon request.
3. Significant Accounting Policies.
The financial statements have been prepared in conformity with accounting principles generally accepted in the United States of America (GAAP), which require management to make certain estimates and assumptions at the date of the financial statements. Actual results could differ from those estimates. Subsequent events, if any, through the date that the financial statements were issued have been evaluated in the preparation of the financial statements. The following summarizes the significant accounting policies of the Fund:
Investment Valuation. Investments are valued as of 4:00 p.m. Eastern time on the last calendar day of the period. The Board of Trustees (the Board) has delegated the day to day responsibility for the valuation of the Fund's investments to the Fidelity Management & Research Company (FMR) Fair Value Committee (the Committee). In accordance with valuation policies and procedures approved by the Board, the Fund attempts to obtain prices from one or more third party pricing vendors or brokers to value its investments. When current market prices, quotations or currency exchange rates are not readily available or reliable, investments will be fair valued in good faith by the Committee, in accordance with procedures adopted by the Board. Factors used in determining fair value vary by investment type and may include market or investment specific events, changes in interest rates and credit quality. The frequency with which these procedures are used cannot be predicted and they may be utilized to a significant extent. The Committee oversees the Fund's valuation policies and procedures and reports to the Board on the Committee's activities and fair value determinations. The Board monitors the appropriateness of the procedures used in valuing the Fund's investments and ratifies the fair value determinations of the Committee.
The Fund categorizes the inputs to valuation techniques used to value its investments into a disclosure hierarchy consisting of three levels as shown below:
- Level 1 – quoted prices in active markets for identical investments
- Level 2 – other significant observable inputs (including quoted prices for similar investments, interest rates, prepayment speeds, etc.)
- Level 3 – unobservable inputs (including the Fund's own assumptions based on the best information available)
Valuation techniques used to value the Fund's investments by major category are as follows:
Equity securities, including restricted securities, for which market quotations are readily available, are valued at the last reported sale price or official closing price as reported by a third party pricing vendor on the primary market or exchange on which they are traded and are categorized as Level 1 in the hierarchy. In the event there were no sales during the day or closing prices are not available, securities are valued at the last quoted bid price or may be valued using the last available price and are generally categorized as Level 2 in the hierarchy. For foreign equity securities, when market or security specific events arise, comparisons to the valuation of American Depositary Receipts (ADRs), futures contracts, Exchange-Traded Funds (ETFs) and certain indexes as well as quoted prices for similar securities may be used and would be categorized as Level 2 in the hierarchy. Utilizing these techniques may result in transfers between Level 1 and Level 2. For equity securities, including restricted securities, where observable inputs are limited, assumptions about market activity and risk are used and these securities may be categorized as Level 3 in the hierarchy.
Debt securities, including restricted securities, are valued based on evaluated prices received from third party pricing vendors or from brokers who make markets in such securities. Corporate bonds are valued by pricing vendors who utilize matrix pricing which considers yield or price of bonds of comparable quality, coupon, maturity and type or by broker-supplied prices. When independent prices are unavailable or unreliable, debt securities may be valued utilizing pricing methodologies which consider similar factors that would be used by third party pricing vendors. Debt securities are generally categorized as Level 2 in the hierarchy but may be Level 3 depending on the circumstances.
Investments in open-end mutual funds, including the Fidelity Central Funds, are valued at their closing net asset value (NAV) each business day and are categorized as Level 1 in the hierarchy.
Changes in valuation techniques may result in transfers in or out of an assigned level within the disclosure hierarchy. The aggregate value of investments by input level as of November 30, 2015, is included at the end of the Fund's Schedule of Investments.
Foreign Currency. The Fund may use foreign currency contracts to facilitate transactions in foreign-denominated securities. Gains and losses from these transactions may arise from changes in the value of the foreign currency or if the counterparties do not perform under the contracts' terms.
Foreign-denominated assets, including investment securities, and liabilities are translated into U.S. dollars at the exchange rates at period end. Purchases and sales of investment securities, income and dividends received and expenses denominated in foreign currencies are translated into U.S. dollars at the exchange rate in effect on the transaction date.
The effects of exchange rate fluctuations on investments are included with the net realized and unrealized gain (loss) on investment securities. Other foreign currency transactions resulting in realized and unrealized gain (loss) are disclosed separately.
Investment Transactions and Income. For financial reporting purposes, the Fund's investment holdings and NAV include trades executed through the end of the last business day of the period. The NAV per share for processing shareholder transactions is calculated as of the close of business of the New York Stock Exchange (NYSE), normally 4:00 p.m. Eastern time and includes trades executed through the end of the prior business day. Gains and losses on securities sold are determined on the basis of identified cost and may include proceeds received from litigation. Dividend income is recorded on the ex-dividend date, except for certain dividends from foreign securities where the ex-dividend date may have passed, which are recorded as soon as the Fund is informed of the ex-dividend date. Non-cash dividends included in dividend income, if any, are recorded at the fair market value of the securities received. Income and capital gain distributions from Fidelity Central Funds, if any, are recorded on the ex-dividend date. Distributions received on securities that represent a return of capital or capital gain are recorded as a reduction of cost of investments and/or as a realized gain. Subsequent to ex-dividend date the Fund determines the components of these distributions, based upon receipt of tax filings or other correspondence relating to the underlying investment. Interest income is accrued as earned and includes coupon interest and amortization of premium and accretion of discount on debt securities as applicable. Investment income is recorded net of foreign taxes withheld where recovery of such taxes is uncertain.
Class Allocations and Expenses. Investment income, realized and unrealized capital gains and losses, common expenses of the Fund, and certain fund-level expense reductions, if any, are allocated daily on a pro-rata basis to each class based on the relative net assets of each class to the total net assets of the Fund. Each class differs with respect to transfer agent and distribution and service plan fees incurred. Certain expense reductions may also differ by class. For the reporting period, the allocated portion of income and expenses to each class as a percent of its average net assets may vary due to the timing of recording these transactions in relation to fluctuating net assets of the classes. Expenses directly attributable to a fund are charged to that fund. Expenses attributable to more than one fund are allocated among the respective funds on the basis of relative net assets or other appropriate methods. Expense estimates are accrued in the period to which they relate and adjustments are made when actual amounts are known.
Income Tax Information and Distributions to Shareholders. Each year, the Fund intends to qualify as a regulated investment company under Subchapter M of the Internal Revenue Code, including distributing substantially all of its taxable income and realized gains. As a result, no provision for U.S. Federal income taxes is required. As of November 30, 2015, the Fund did not have any unrecognized tax benefits in the financial statements; nor is the Fund aware of any tax positions for which it is reasonably possible that the total amounts of unrecognized tax benefits will significantly change in the next twelve months. The Fund files a U.S. federal tax return, in addition to state and local tax returns as required. The Fund's federal income tax returns are subject to examination by the Internal Revenue Service (IRS) for a period of three fiscal years after they are filed. State and local tax returns may be subject to examination for an additional fiscal year depending on the jurisdiction. Foreign taxes are provided for based on the Fund's understanding of the tax rules and rates that exist in the foreign markets in which it invests.
Distributions are declared and recorded on the ex-dividend date. Income dividends and capital gain distributions are declared separately for each class. Income and capital gain distributions are determined in accordance with income tax regulations, which may differ from GAAP. These differences resulted in distribution reclassifications.
Capital accounts within the financial statements are adjusted for permanent book-tax differences. These adjustments have no impact on net assets or the results of operations. Capital accounts are not adjusted for temporary book-tax differences which will reverse in a subsequent period.
Book-tax differences are primarily due to foreign currency transactions, passive foreign investment companies (PFIC), partnerships, market discount, deferred trustees compensation, capital loss carryforwards and losses deferred due to wash sales and tax regulations.
The federal tax cost of investment securities and unrealized appreciation (depreciation) as of period end were as follows:
| Gross unrealized appreciation | $487,259 |
| Gross unrealized depreciation | (37,739) |
| Net unrealized appreciation (depreciation) on securities | $449,520 |
| Tax Cost | $863,860 |
The tax-based components of distributable earnings as of period end were as follows:
| Undistributed ordinary income | $12,594 |
| Capital loss carryforward | $(133,637) |
| Net unrealized appreciation (depreciation) on securities and other investments | $449,520 |
Capital loss carryforwards are only available to offset future capital gains of the Fund to the extent provided by regulations and may be limited. Under the Regulated Investment Company Modernization Act of 2010 (the Act), the Fund is permitted to carry forward capital losses incurred in taxable years beginning after December 22, 2010 for an unlimited period and such capital losses are required to be used prior to any losses that expire. The capital loss carryforward information presented below, including any applicable limitation, is estimated as of fiscal period end and is subject to adjustment.
| Fiscal year of expiration | |
| 2017 | $(133,637) |
The Fund intends to elect to defer to its next fiscal year $734 of capital losses recognized during the period November 1, 2015 to November 30, 2015.
The tax character of distributions paid was as follows:
| November 30, 2015 | November 30, 2014 | |
| Ordinary Income | $13,019 | $ 10,331 |
4. Purchases and Sales of Investments.
Purchases and sales of securities, other than short-term securities, aggregated $129,951 and $350,153, respectively.
5. Fees and Other Transactions with Affiliates.
Management Fee. Fidelity Management & Research Company (the investment adviser) and its affiliates provide the Fund with investment management related services for which the Fund pays a monthly management fee. The management fee is the sum of an individual fund fee rate that is based on an annual rate of .30% of the Fund's average net assets and an annualized group fee rate that averaged .25% during the period. The group fee rate is based upon the average net assets of all the mutual funds advised by the investment adviser, including any mutual funds previously advised by the investment adviser that are currently advised by Fidelity SelectCo, LLC, an affiliate of the investment adviser. The group fee rate decreases as assets under management increase and increases as assets under management decrease. In addition, the management fee is subject to a performance adjustment (up to a maximum of +/- .20% of the Fund's average net assets over a 36 month performance period). The upward or downward adjustment to the management fee is based on the relative investment performance of Fidelity Value Strategies Fund as compared to its benchmark index, the Russell Midcap Value Index, over the same 36 month performance period. For the reporting period, the total annual management fee rate, including the performance adjustment, was .42% of the Fund's average net assets. The performance adjustment included in the management fee rate may be higher or lower than the maximum performance adjustment rate due to the difference between the average net assets for the reporting and performance periods.
Distribution and Service Plan Fees. In accordance with Rule 12b-1 of the 1940 Act, the Fund has adopted separate Distribution and Service Plans for each class of shares. Certain classes pay Fidelity Distributors Corporation (FDC), an affiliate of the investment adviser, separate Distribution and Service Fees, each of which is based on an annual percentage of each class' average net assets. In addition, FDC may pay financial intermediaries for selling shares of the Fund and providing shareholder support services. For the period, the Distribution and Service Fee rates, total fees and amounts retained by FDC were as follows:
| Distribution Fee | Service Fee | Total Fees | Retained by FDC | |
| Class A | -% | .25% | $573 | $5 |
| Class T | .25% | .25% | 1,574 | 12 |
| Class B | .75% | .25% | 56 | 42 |
| Class C | .75% | .25% | 522 | 24 |
| $2,725 | $83 |
Sales Load. FDC may receive a front-end sales charge of up to 5.75% for selling Class A shares and 3.50% for selling Class T shares, some of which is paid to financial intermediaries for selling shares of the Fund. Depending on the holding period, FDC may receive contingent deferred sales charges levied on Class A, Class T, Class B, and Class C redemptions. The deferred sales charges range from 5.00% to 1.00% for Class B shares, 1.00% for Class C shares, 1.00% for certain purchases of Class A shares and .25% for certain purchases of Class T shares.
For the period, sales charge amounts retained by FDC were as follows:
| Retained by FDC | |
| Class A | $21 |
| Class T | 8 |
| Class B(a) | 2 |
| Class C(a) | 2 |
| $33 |
(a) When Class B and Class C shares are initially sold, FDC pays commissions from its own resources to financial intermediaries through which the sales are made.
Transfer Agent Fees. Fidelity Investments Institutional Operations Company, Inc., (FIIOC), an affiliate of the investment adviser, is the transfer, dividend disbursing and shareholder servicing agent for each class of the Fund. FIIOC receives account fees and asset-based fees that vary according to the account size and type of account of the shareholders of the respective classes of the Fund, except for Class K. FIIOC receives an asset-based fee of Class K's average net assets. FIIOC pays for typesetting, printing and mailing of shareholder reports, except proxy statements.
For the period, transfer agent fees for each class were as follows:
| Amount | % of Class-Level Average Net Assets | |
| Class A | $508 | .22 |
| Class T | 583 | .19 |
| Class B | 17 | .30 |
| Class C | 122 | .23 |
| Fidelity Value Strategies Fund | 1,437 | .21 |
| Class K | 37 | .05 |
| Class I | 173 | .22 |
| $2,877 |
Accounting and Security Lending Fees. Fidelity Service Company, Inc. (FSC), an affiliate of the investment adviser, maintains the Fund's accounting records. The accounting fee is based on the level of average net assets for each month. Under a separate contract, FSC administers the security lending program. The security lending fee is based on the number and duration of lending transactions.
Brokerage Commissions. The Fund placed a portion of its portfolio transactions with brokerage firms which are affiliates of the investment adviser. Brokerage commissions are included in net realized gain (loss) and change in net unrealized appreciation (depreciation) in the Statement of Operations. The commissions paid to these affiliated firms were $5 for the period.
6. Committed Line of Credit.
The Fund participates with other funds managed by the investment adviser or an affiliate in a $4.25 billion credit facility (the "line of credit") to be utilized for temporary or emergency purposes to fund shareholder redemptions or for other short-term liquidity purposes. The Fund has agreed to pay commitment fees on its pro-rata portion of the line of credit, which amounted to $2 and is reflected in Miscellaneous expenses on the Statement of Operations. During the period, the Fund did not borrow on this line of credit.
7. Security Lending.
The Fund lends portfolio securities through a lending agent from time to time in order to earn additional income. For equity securities, a lending agent is used and may loan securities to certain qualified borrowers, including Fidelity Capital Markets (FCM), a broker-dealer affiliated with the Fund. On the settlement date of the loan, the Fund receives collateral (in the form of U.S. Treasury obligations, letters of credit and/or cash) against the loaned securities and maintains collateral in an amount not less than 100% of the market value of the loaned securities during the period of the loan. The market value of the loaned securities is determined at the close of business of the Fund and any additional required collateral is delivered to the Fund on the next business day. The Fund or borrower may terminate the loan at any time, and if the borrower defaults on its obligation to return the securities loaned because of insolvency or other reasons, the Fund may apply collateral received from the borrower against the obligation. The Fund may experience delays and costs in recovering the securities loaned. Any cash collateral received is invested in the Fidelity Securities Lending Cash Central Fund. The value of loaned securities and cash collateral at period end are disclosed on the Fund's Statement of Assets and Liabilities. At period end, there were no security loans outstanding with FCM. Security lending income represents the income earned on investing cash collateral, less rebates paid to borrowers and any lending agent fees associated with the loan, plus any premium payments received for lending certain types of securities. Security lending income is presented in the Statement of Operations as a component of income from Fidelity Central Funds. Total security lending income during the period amounted to $791, including $3 from securities loaned to FCM.
8. Expense Reductions.
Commissions paid to certain brokers with whom the investment adviser, or its affiliates, places trades on behalf of the Fund include an amount in addition to trade execution, which may be rebated back to the Fund to offset certain expenses. This amount totaled $39 for the period.
In addition, during the period the investment adviser reimbursed and/or waived a portion of fund-level operating expenses in the amount of $6 and a portion of class-level operating expenses as follows:
| Amount | |
| Class A | $5 |
| Class T | 8 |
| Class B | –(a) |
| Class C | 1 |
| Fidelity Value Strategies Fund | 17 |
| Class I | 1 |
| $32 |
(a) In the amount of less than five hundred dollars.
9. Distributions to Shareholders.
Distributions to shareholders of each class were as follows:
| Years ended November 30, | 2015 | 2014 |
| From net investment income | ||
| Class A | $1,691 | $1,567 |
| Class T | 1,553 | 1,415 |
| Class C | 56 | 32 |
| Fidelity Value Strategies Fund | 6,934 | 5,578 |
| Class K | 896 | 1,131 |
| Class I | 799 | 608 |
| Total | $11,929 | $10,331 |
| From net realized gain | ||
| Class A | $174 | $– |
| Class T | 234 | – |
| Class C | 44 | – |
| Fidelity Value Strategies Fund | 520 | – |
| Class K | 58 | – |
| Class I | 60 | – |
| Total | $1,090 | $– |
10. Share Transactions.
Share transactions for each class were as follows and may contain automatic conversions between classes or exchanges between funds:
| Shares | Shares | Dollars | Dollars | |
| Years ended November 30, | 2015 | 2014 | 2015 | 2014 |
| Class A | ||||
| Shares sold | 391 | 546 | $15,470 | $20,399 |
| Reinvestment of distributions | 46 | 41 | 1,760 | 1,447 |
| Shares redeemed | (904) | (1,342) | (35,567) | (50,201) |
| Net increase (decrease) | (467) | (755) | $(18,337) | $(28,355) |
| Class T | ||||
| Shares sold | 486 | 435 | $19,926 | $16,774 |
| Reinvestment of distributions | 41 | 35 | 1,646 | 1,293 |
| Shares redeemed | (1,296) | (1,420) | (52,610) | (54,916) |
| Net increase (decrease) | (769) | (950) | $(31,038) | $(36,849) |
| Class B | ||||
| Shares sold | – | 1 | $12 | $30 |
| Reinvestment of distributions | – | – | – | – |
| Shares redeemed | (95) | (140) | (3,438) | (4,799) |
| Net increase (decrease) | (95) | (139) | $(3,426) | $(4,769) |
| Class C | ||||
| Shares sold | 131 | 125 | $4,724 | $4,210 |
| Reinvestment of distributions | 3 | 1 | 95 | 29 |
| Shares redeemed | (237) | (282) | (8,407) | (9,502) |
| Net increase (decrease) | (103) | (156) | $(3,588) | $(5,263) |
| Fidelity Value Strategies Fund | ||||
| Shares sold | 3,980 | 7,626 | $174,437 | $315,612 |
| Reinvestment of distributions | 106 | 127 | 4,551 | 4,998 |
| Shares redeemed | (5,750) | (6,627) | (250,149) | (273,372) |
| Net increase (decrease) | (1,664) | 1,126 | $(71,161) | $47,238 |
| Class K | ||||
| Shares sold | 390 | 669 | $17,106 | $27,831 |
| Reinvestment of distributions | 22 | 29 | 954 | 1,131 |
| Shares redeemed | (1,001) | (1,437) | (44,142) | (60,236) |
| Net increase (decrease) | (589) | (739) | $(26,082) | $(31,274) |
| Class I | ||||
| Shares sold | 288 | 522 | $12,081 | $20,905 |
| Reinvestment of distributions | 18 | 14 | 748 | 523 |
| Shares redeemed | (809) | (403) | (34,620) | (15,969) |
| Net increase (decrease) | (503) | 133 | $(21,791) | $5,459 |
11. Other.
The Fund's organizational documents provide former and current trustees and officers with a limited indemnification against liabilities arising in connection with the performance of their duties to the Fund. In the normal course of business, the Fund may also enter into contracts that provide general indemnifications. The Fund's maximum exposure under these arrangements is unknown as this would be dependent on future claims that may be made against the Fund. The risk of material loss from such claims is considered remote.
Report of Independent Registered Public Accounting Firm
To the Trustees of Fidelity Advisor Series I and Shareholders of Fidelity Advisor® Value Strategies Fund:
We have audited the accompanying statement of assets and liabilities of Fidelity Advisor® Value Strategies Fund (the Fund), a fund of Fidelity Advisor Series I, including the schedule of investments, as of November 30, 2015, and the related statement of operations for the year then ended, the statement of changes in net assets for each of the two years in the period then ended, and the financial highlights for each of the five years in the period then ended. These financial statements and financial highlights are the responsibility of the Fund's management. Our responsibility is to express an opinion on these financial statements and financial highlights based on our audits.
We conducted our audits in accordance with the standards of the Public Company Accounting Oversight Board (United States). Those standards require that we plan and perform the audit to obtain reasonable assurance about whether the financial statements and financial highlights are free of material misstatement. The Fund is not required to have, nor were we engaged to perform, an audit of its internal control over financial reporting. Our audits included consideration of internal control over financial reporting as a basis for designing audit procedures that are appropriate in the circumstances, but not for the purpose of expressing an opinion on the effectiveness of the Fund's internal control over financial reporting. Accordingly, we express no such opinion. An audit also includes examining, on a test basis, evidence supporting the amounts and disclosures in the financial statements, assessing the accounting principles used and significant estimates made by management, as well as evaluating the overall financial statement presentation. Our procedures included confirmation of securities owned as of November 30, 2015, by correspondence with the custodians and brokers. We believe that our audits provide a reasonable basis for our opinion.
In our opinion, such financial statements and financial highlights referred to above present fairly, in all material respects, the financial position of Fidelity Advisor® Value Strategies Fund as of November 30, 2015, the results of its operations for the year then ended, the changes in its net assets for each of the two years in the period then ended, and the financial highlights for each of the five years in the period then ended, in conformity with accounting principles generally accepted in the United States of America.
DELOITTE & TOUCHE LLP
Boston, Massachusetts
January 15, 2016
Trustees and Officers
The Trustees, Members of the Advisory Board (if any), and officers of the trust and fund, as applicable, are listed below. The Board of Trustees governs the fund and is responsible for protecting the interests of shareholders. The Trustees are experienced executives who meet periodically throughout the year to oversee the fund's activities, review contractual arrangements with companies that provide services to the fund, oversee management of the risks associated with such activities and contractual arrangements, and review the fund's performance. Each of the Trustees oversees 170 funds.
The Trustees hold office without limit in time except that (a) any Trustee may resign; (b) any Trustee may be removed by written instrument, signed by at least two-thirds of the number of Trustees prior to such removal; (c) any Trustee who requests to be retired or who has become incapacitated by illness or injury may be retired by written instrument signed by a majority of the other Trustees; and (d) any Trustee may be removed at any special meeting of shareholders by a two-thirds vote of the outstanding voting securities of the trust. Each Trustee who is not an interested person (as defined in the 1940 Act) of the trust and the fund is referred to herein as an Independent Trustee. Each Independent Trustee shall retire not later than the last day of the calendar year in which his or her 75th birthday occurs. The Independent Trustees may waive this mandatory retirement age policy with respect to individual Trustees. Officers and Advisory Board Members hold office without limit in time, except that any officer or Advisory Board Member may resign or may be removed by a vote of a majority of the Trustees at any regular meeting or any special meeting of the Trustees. Except as indicated, each individual has held the office shown or other offices in the same company for the past five years.
The fund’s Statement of Additional Information (SAI) includes more information about the Trustees. To request a free copy, call Fidelity at 1-877-208-0098.
Experience, Skills, Attributes, and Qualifications of the Trustees. The Governance and Nominating Committee has adopted a statement of policy that describes the experience, qualifications, attributes, and skills that are necessary and desirable for potential Independent Trustee candidates (Statement of Policy). The Board believes that each Trustee satisfied at the time he or she was initially elected or appointed a Trustee, and continues to satisfy, the standards contemplated by the Statement of Policy. The Governance and Nominating Committee also engages professional search firms to help identify potential Independent Trustee candidates who have the experience, qualifications, attributes, and skills consistent with the Statement of Policy. From time to time, additional criteria based on the composition and skills of the current Independent Trustees, as well as experience or skills that may be appropriate in light of future changes to board composition, business conditions, and regulatory or other developments, have also been considered by the professional search firms and the Governance and Nominating Committee. In addition, the Board takes into account the Trustees' commitment and participation in Board and committee meetings, as well as their leadership of standing and ad hoc committees throughout their tenure.
In determining that a particular Trustee was and continues to be qualified to serve as a Trustee, the Board has considered a variety of criteria, none of which, in isolation, was controlling. The Board believes that, collectively, the Trustees have balanced and diverse experience, qualifications, attributes, and skills, which allow the Board to operate effectively in governing the fund and protecting the interests of shareholders. Information about the specific experience, skills, attributes, and qualifications of each Trustee, which in each case led to the Board's conclusion that the Trustee should serve (or continue to serve) as a trustee of the fund, is provided below.
Board Structure and Oversight Function. James C. Curvey is an interested person and currently serves as Chairman. The Trustees have determined that an interested Chairman is appropriate and benefits shareholders because an interested Chairman has a personal and professional stake in the quality and continuity of services provided to the fund. Independent Trustees exercise their informed business judgment to appoint an individual of their choosing to serve as Chairman, regardless of whether the Trustee happens to be independent or a member of management. The Independent Trustees have determined that they can act independently and effectively without having an Independent Trustee serve as Chairman and that a key structural component for assuring that they are in a position to do so is for the Independent Trustees to constitute a substantial majority for the Board. The Independent Trustees also regularly meet in executive session. Ned C. Lautenbach serves as Chairman of the Independent Trustees and as such (i) acts as a liaison between the Independent Trustees and management with respect to matters important to the Independent Trustees and (ii) with management prepares agendas for Board meetings.
Fidelity® funds are overseen by different Boards of Trustees. The fund's Board oversees Fidelity's high income and certain equity funds, and other Boards oversee Fidelity's investment-grade bond, money market, asset allocation, and sector funds. The asset allocation funds may invest in Fidelity® funds overseen by the fund's Board. The use of separate Boards, each with its own committee structure, allows the Trustees of each group of Fidelity® funds to focus on the unique issues of the funds they oversee, including common research, investment, and operational issues. On occasion, the separate Boards establish joint committees to address issues of overlapping consequences for the Fidelity® funds overseen by each Board.
The Trustees operate using a system of committees to facilitate the timely and efficient consideration of all matters of importance to the Trustees, the fund, and fund shareholders and to facilitate compliance with legal and regulatory requirements and oversight of the fund's activities and associated risks. The Board, acting through its committees, has charged FMR and its affiliates with (i) identifying events or circumstances the occurrence of which could have demonstrably adverse effects on the fund's business and/or reputation; (ii) implementing processes and controls to lessen the possibility that such events or circumstances occur or to mitigate the effects of such events or circumstances if they do occur; and (iii) creating and maintaining a system designed to evaluate continuously business and market conditions in order to facilitate the identification and implementation processes described in (i) and (ii) above. Because the day-to-day operations and activities of the fund are carried out by or through FMR, its affiliates, and other service providers, the fund's exposure to risks is mitigated but not eliminated by the processes overseen by the Trustees. While each of the Board's committees has responsibility for overseeing different aspects of the fund's activities, oversight is exercised primarily through the Operations, Audit, and Compliance Committees. In addition, the Independent Trustees have worked with FMR to enhance the Board's oversight of investment and financial risks, legal and regulatory risks, technology risks, and operational risks, including the development of additional risk reporting to the Board. For example, a working group comprised of Independent Trustees and FMR has worked and continues to work to review the Fidelity® funds' valuation-related activities, reporting and risk management. Appropriate personnel, including but not limited to the fund's Chief Compliance Officer (CCO), FMR's internal auditor, the independent accountants, the fund's Treasurer and portfolio management personnel, make periodic reports to the Board's committees, as appropriate, including an annual review of Fidelity's risk management program for the Fidelity® funds. The responsibilities of each standing committee, including their oversight responsibilities, are described further under "Standing Committees of the Trustees."
Interested Trustees*:
Correspondence intended for a Trustee who is an interested person may be sent to Fidelity Investments, 245 Summer Street, Boston, Massachusetts 02210.
Name, Year of Birth; Principal Occupations and Other Relevant Experience+
James C. Curvey (1935)
Year of Election or Appointment: 2007
Trustee
Chairman of the Board of Trustees
Mr. Curvey also serves as Trustee of other Fidelity® funds. Mr. Curvey is a Director of Fidelity Research & Analysis Co. (investment adviser firm, 2009-present), and Vice Chairman (2007-present) and Director of FMR LLC (diversified financial services company). In addition, Mr. Curvey serves as an Overseer for the Boston Symphony Orchestra and a member of the board of Artis-Naples, Naples, Florida, and as a Trustee for Brewster Academy, Wolfeboro, New Hampshire. Previously, Mr. Curvey served as a Director of Fidelity Investments Money Management, Inc. (investment adviser firm, 2009-2014) and a Director of FMR and FMR Co., Inc. (investment adviser firms, 2007-2014).
Charles S. Morrison (1960)
Year of Election or Appointment: 2014
Trustee
Mr. Morrison also serves as Trustee of other funds. He serves as a Director of Fidelity Investments Money Management, Inc. (FIMM) (investment adviser firm, 2014-present), Director of Fidelity SelectCo, LLC (investment adviser firm, 2014-present), President, Asset Management (2014-present), and is an employee of Fidelity Investments. Previously, Mr. Morrison served as Vice President of Fidelity's Fixed Income and Asset Allocation Funds (2012-2014), President, Fixed Income (2011-2014), Vice President of Fidelity's Money Market Funds (2005-2009), President, Money Market Group Leader of FMR (investment adviser firm, 2009), and Senior Vice President, Money Market Group of FMR (2004-2009). Mr. Morrison also served as Vice President of Fidelity's Bond Funds (2002-2005), certain Balanced Funds (2002-2005), and certain Asset Allocation Funds (2002-2007), and as Senior Vice President (2002-2005) of Fidelity's Bond Division.
* Determined to be an “Interested Trustee” by virtue of, among other things, his or her affiliation with the trust or various entities under common control with FMR.
+ The information includes the Trustee's principal occupation during the last five years and other information relating to the experience, attributes, and skills relevant to the Trustee's qualifications to serve as a Trustee, which led to the conclusion that the Trustee should serve as a Trustee for the fund.
Independent Trustees:
Correspondence intended for an Independent Trustee may be sent to Fidelity Investments, P.O. Box 55235, Boston, Massachusetts 02205-5235.
Name, Year of Birth; Principal Occupations and Other Relevant Experience+
Dennis J. Dirks (1948)
Year of Election or Appointment: 2005
Trustee
Mr. Dirks also serves as Trustee of other Fidelity® funds. Prior to his retirement in May 2003, Mr. Dirks was Chief Operating Officer and a member of the Board of The Depository Trust & Clearing Corporation (DTCC). He also served as President, Chief Operating Officer, and Board member of The Depository Trust Company (DTC) and President and Board member of the National Securities Clearing Corporation (NSCC). In addition, Mr. Dirks served as Chief Executive Officer and Board member of the Government Securities Clearing Corporation, Chief Executive Officer and Board member of the Mortgage-Backed Securities Clearing Corporation, as a Trustee and a member of the Finance Committee of Manhattan College (2005-2008), as a Trustee and a member of the Finance Committee of AHRC of Nassau County (2006-2008), and as a member of the Independent Directors Council (IDC) Governing Council (2010-2015). Mr. Dirks is a member of the Board of Directors for The Brookville Center for Children's Services, Inc. (2009-present).
Alan J. Lacy (1953)
Year of Election or Appointment: 2008
Trustee
Mr. Lacy also serves as Trustee of other Fidelity® funds. Mr. Lacy serves as a member of the Board of Directors of Dave & Buster's Entertainment, Inc. (restaurant and entertainment complexes, 2010-present) and Bristol-Myers Squibb Company (global pharmaceuticals, 2008-present). In addition, Mr. Lacy served as Senior Adviser (2007-2014) of Oak Hill Capital Partners, L.P. (private equity) and also served as Chief Executive Officer (2000-2005) and Vice Chairman (2005-2006) of Sears Holdings Corporation and Sears, Roebuck and Co. (retail). Mr. Lacy is a member of the Board of Trustees of The National Parks Conservation Association (2006-present). Previously, Mr. Lacy served as Chairman of the Board of Trustees of the National Parks Conservation Association (2008-2011) and as a member of the Board of Directors for The Western Union Company (global money transfer, 2006-2011), The Hillman Companies, Inc. (hardware wholesalers, 2010-2014), and Earth Fare, Inc. (retail grocery, 2010-2014).
Ned C. Lautenbach (1944)
Year of Election or Appointment: 2000
Trustee
Chairman of the Independent Trustees
Mr. Lautenbach also serves as Trustee of other Fidelity® funds. Mr. Lautenbach currently serves as the Lead Director of the Eaton Corporation Board of Directors (diversified industrial, 1997-present). Mr. Lautenbach is Chairman of the Board of Directors of Artis-Naples in Naples, Florida (2012-present), a member of the Council on Foreign Relations (1994-present), and a member of the Board of Governors, State University System of Florida (2013-present). Previously, Mr. Lautenbach was a Partner/Advisory Partner at Clayton, Dubilier & Rice, LLC (private equity investment, 1998-2010), as well as a Director of Sony Corporation (2006-2007).
Joseph Mauriello (1944)
Year of Election or Appointment: 2008
Trustee
Mr. Mauriello also serves as Trustee of other Fidelity® funds. Prior to his retirement in January 2006, Mr. Mauriello served in numerous senior management positions including Deputy Chairman and Chief Operating Officer (2004-2005), and Vice Chairman of Financial Services (2002-2004) of KPMG LLP US (professional services, 1965-2005). Mr. Mauriello currently serves as a member of the Board of Directors of XL Group plc. (global insurance and re-insurance, 2006-present) and the Independent Directors Council (IDC) Governing Council (2015-present). Previously, Mr. Mauriello served as a Director of the Hamilton Funds of the Bank of New York (2006-2007) and of Arcadia Resources Inc. (health care services and products, 2007-2012).
Robert W. Selander (1950)
Year of Election or Appointment: 2011
Trustee
Mr. Selander also serves as Trustee of other Fidelity® funds. Mr. Selander serves as a Director of The Western Union Company (global money transfer, 2014-present). Previously, Mr. Selander served as a Member of the Advisory Board of other Fidelity® funds (2011), and Executive Vice Chairman (2010), Chief Executive Officer (2009-2010), and President and Chief Executive Officer (1997-2009) of Mastercard, Inc.
Cornelia M. Small (1944)
Year of Election or Appointment: 2005
Trustee
Ms. Small also serves as Trustee of other Fidelity® funds. Ms. Small is a member of the Board of Directors (2009-present) and Chair of the Investment Committee (2010-present) of the Teagle Foundation. Ms. Small also serves on the Investment Committee of the Berkshire Taconic Community Foundation (2008-present). Previously, Ms. Small served as Chairperson (2002-2008) and a member of the Investment Committee and Chairperson (2008-2012) and a member of the Board of Trustees of Smith College. In addition, Ms. Small served as Chief Investment Officer, Director of Global Equity Investments, and a member of the Board of Directors of Scudder, Stevens & Clark and Scudder Kemper Investments.
William S. Stavropoulos (1939)
Year of Election or Appointment: 2002
Trustee
Vice Chairman of the Independent Trustees
Mr. Stavropoulos also serves as Trustee of other Fidelity® funds. Mr. Stavropoulos serves as President and Founder of the Michigan Baseball Foundation, the Great Lakes Loons (2007-present). Mr. Stavropoulos is Chairman Emeritus of the Board of Directors of The Dow Chemical Company, where he previously served in numerous senior management positions, including President, CEO (1995-2000; 2002-2004), Chairman of the Executive Committee (2000-2006), and as a member of the Board of Directors (1990-2006). Currently, Mr. Stavropoulos is Chairman of the Board of Directors of Univar Inc. (global distributor of commodity and specialty chemicals), a Director of Teradata Corporation (data warehousing and technology solutions), and Maersk Inc. (industrial conglomerate), and a member of the Advisory Board for Metalmark Capital LLC (private equity investment, 2005-present). Mr. Stavropoulos is an operating advisor to Clayton, Dubilier & Rice, LLC (private equity investment). In addition, Mr. Stavropoulos is a member of the University of Notre Dame Advisory Council for the College of Science, a Trustee of the Rollin L. Gerstacker Foundation, and a Director of the Naples Philharmonic Center for the Arts. Previously, Mr. Stavropoulos served as a Director of Chemical Financial Corporation (bank holding company, 1993-2012) and Tyco International, Ltd. (multinational manufacturing and services, 2007-2012).
David M. Thomas (1949)
Year of Election or Appointment: 2008
Trustee
Mr. Thomas also serves as Trustee of other Fidelity® funds. Mr. Thomas serves as Non-Executive Chairman of the Board of Directors of Fortune Brands Home and Security (home and security products, 2011-present), as a member of the Board of Directors (2004-present) and Presiding Director (2013-present) of Interpublic Group of Companies, Inc. (marketing communication), and as a member of the Board of Trustees of the University of Florida (2013-present). Previously, Mr. Thomas served as Executive Chairman (2005-2006) and Chairman and Chief Executive Officer (2000-2005) of IMS Health, Inc. (pharmaceutical and healthcare information solutions), and a Director of Fortune Brands, Inc. (consumer products, 2000-2011).
+ The information includes the Trustee's principal occupation during the last five years and other information relating to the experience, attributes, and skills relevant to the Trustee's qualifications to serve as a Trustee, which led to the conclusion that the Trustee should serve as a Trustee for the fund.
Advisory Board Members and Officers:
Correspondence intended for an officer or Peter S. Lynch may be sent to Fidelity Investments, 245 Summer Street, Boston, Massachusetts 02210. Officers appear below in alphabetical order.
Name, Year of Birth; Principal Occupation
Peter S. Lynch (1944)
Year of Election or Appointment: 2003
Member of the Advisory Board
Mr. Lynch also serves as Member of the Advisory Board of other Fidelity® funds. Mr. Lynch is Vice Chairman and a Director of FMR (investment adviser firm) and FMR Co., Inc. (investment adviser firm). In addition, Mr. Lynch serves as a Trustee of Boston College and as the Chairman of the Inner-City Scholarship Fund. Previously, Mr. Lynch served on the Special Olympics International Board of Directors (1997-2006).
Elizabeth Paige Baumann (1968)
Year of Election or Appointment: 2012
Anti-Money Laundering (AML) Officer
Ms. Baumann also serves as AML Officer of other funds. She is Chief AML Officer of FMR LLC (diversified financial services company, 2012-present) and is an employee of Fidelity Investments. Previously, Ms. Baumann served as Vice President and Deputy Anti-Money Laundering Officer (2007-2012).
Marc R. Bryant (1966)
Year of Election or Appointment: 2015
Secretary and Chief Legal Officer (CLO)
Mr. Bryant also serves as Secretary and CLO of other funds. Mr. Bryant serves as CLO, Secretary, and Senior Vice President of Fidelity Management & Research Company (investment adviser firm, 2015-present) and FMR Co., Inc. (investment adviser firm, 2015-present); Secretary of Fidelity SelectCo, LLC (investment adviser firm, 2015-present) and Fidelity Investments Money Management, Inc. (investment adviser firm, 2015-present); and CLO of Fidelity Management & Research (Hong Kong) Limited (investment adviser firm, 2015-present). He is Senior Vice President and Deputy General Counsel of FMR LLC (diversified financial services company). Previously, Mr. Bryant served as Secretary and CLO of Fidelity Rutland Square Trust II (2010-2014) and Assistant Secretary of Fidelity's Fixed Income and Asset Allocation Funds (2013-2015). Prior to joining Fidelity Investments, Mr. Bryant served as a Senior Vice President and the Head of Global Retail Legal for AllianceBernstein L.P. (2006-2010), and as the General Counsel for ProFund Advisors LLC (2001-2006).
William C. Coffey (1969)
Year of Election or Appointment: 2009
Assistant Secretary
Mr. Coffey also serves as Assistant Secretary of other funds. He is Senior Vice President and Deputy General Counsel of FMR LLC (diversified financial services company, 2010-present), and is an employee of Fidelity Investments. Previously, Mr. Coffey served as Vice President and Associate General Counsel of FMR LLC (2005-2009).
Jonathan Davis (1968)
Year of Election or Appointment: 2010
Assistant Treasurer
Mr. Davis also serves as Assistant Treasurer of other funds, and is an employee of Fidelity Investments. Previously, Mr. Davis served as Vice President and Associate General Counsel of FMR LLC (diversified financial services company, 2003-2010).
Adrien E. Deberghes (1967)
Year of Election or Appointment: 2008
Deputy Treasurer
Mr. Deberghes also serves as an officer of other funds. He is an employee of Fidelity Investments (2008-present). Prior to joining Fidelity Investments, Mr. Deberghes was Senior Vice President of Mutual Fund Administration at State Street Corporation (2007-2008), Senior Director of Mutual Fund Administration at Investors Bank & Trust (2005-2007), and Director of Finance for Dunkin' Brands (2000-2005).
Stephanie J. Dorsey (1969)
Year of Election or Appointment: 2010
Assistant Treasurer
Ms. Dorsey also serves as an officer of other funds. She is an employee of Fidelity Investments (2008-present) and has served in other fund officer roles. Prior to joining Fidelity Investments, Ms. Dorsey served as Treasurer (2004-2008) of the JPMorgan Mutual Funds and Vice President (2004-2008) of JPMorgan Chase Bank.
Howard J. Galligan III (1966)
Year of Election or Appointment: 2014
Chief Financial Officer
Mr. Galligan also serves as Chief Financial Officer of other funds. Mr. Galligan serves as President of Fidelity Pricing and Cash Management Services (FPCMS) (2014-present) and as a Director of Strategic Advisers, Inc. (investment adviser firm, 2008-present). Previously, Mr. Galligan served as Chief Administrative Officer of Asset Management (2011-2014) and Chief Operating Officer and Senior Vice President of Investment Support for Strategic Advisers, Inc. (2003-2011).
Scott C. Goebel (1968)
Year of Election or Appointment: 2015
Vice President
Mr. Goebel serves as Vice President of other funds and is an employee of Fidelity Investments (2001-present). Previously, Mr. Goebel served as Secretary of Fidelity SelectCo, LLC (investment adviser firm, 2013-2015), Fidelity Investments Money Management, Inc. (FIMM) (investment adviser firm, 2010-2015), and Fidelity Research and Analysis Company (FRAC) (investment adviser firm, 2010-2015); General Counsel, Secretary, and Senior Vice President of Fidelity Management & Research Company (investment adviser firm, 2008-2015) and FMR Co., Inc. (investment adviser firm, 2008-2015); Assistant Secretary of Fidelity Management & Research (Japan) Limited (investment adviser firm, 2008-2015) and FMR Investment Management (U.K.) Limited (investment adviser firm, 2008-2015); Chief Legal Officer (CLO) of Fidelity Management & Research (Hong Kong) Limited (investment adviser firm, 2008-2015); Secretary and CLO of certain Fidelity® funds (2008-2015); Assistant Secretary of FIMM (2008-2010), FRAC (2008-2010), and certain funds (2007-2008); and as Vice President and Secretary of Fidelity Distributors Corporation (FDC) (2005-2007).
Thomas C. Hense (1964)
Year of Election or Appointment: 2008, 2010, or 2015
Vice President
Mr. Hense serves as Vice President of Fidelity Advisor® Multi-Asset Income Fund (2015) and other funds (High Income (2008), Small Cap (2008), and Value (2010) funds), and is an employee of Fidelity Investments (1993-present). Previously, Mr. Hense served as a portfolio manager for Fidelity's Institutional Money Management Group (Pyramis) (2003-2008).
Brian B. Hogan (1964)
Year of Election or Appointment: 2009
Vice President
Mr. Hogan also serves as Trustee or Vice President of other funds. Mr. Hogan serves as a Director of Fidelity SelectCo, LLC (investment adviser firm, 2014-present) and President of the Equity Division of FMR (investment adviser firm, 2009-present). Previously, Mr. Hogan served as Senior Vice President, Equity Research of FMR (2006-2009) and as a portfolio manager.
Chris Maher (1972)
Year of Election or Appointment: 2013
Assistant Treasurer
Mr. Maher serves as Assistant Treasurer of other funds. Mr. Maher is Vice President of Valuation Oversight and is an employee of Fidelity Investments. Previously, Mr. Maher served as Vice President of Asset Management Compliance (2013), Vice President of the Program Management Group of FMR (investment adviser firm, 2010-2013), and Vice President of Valuation Oversight (2008-2010).
Kenneth B. Robins (1969)
Year of Election or Appointment: 2008
President and Treasurer
Mr. Robins also serves as an officer of other funds. Mr. Robins serves as Executive Vice President of Fidelity Investments Money Management, Inc. (FIMM) (investment adviser firm, 2013-present) and is an employee of Fidelity Investments (2004-present). Previously, Mr. Robins served in other fund officer roles.
Stacie M. Smith (1974)
Year of Election or Appointment: 2013
Deputy Treasurer
Ms. Smith also serves as an officer of other funds. She is an employee of Fidelity Investments (2009-present) and has served in other fund officer roles. Prior to joining Fidelity Investments, Ms. Smith served as Senior Audit Manager of Ernst & Young LLP (1996-2009).
Renee Stagnone (1975)
Year of Election or Appointment: 2013
Deputy Treasurer
Ms. Stagnone also serves as Deputy Treasurer of other funds. Ms. Stagnone is an employee of Fidelity Investments (1997-present).
Linda J. Wondrack (1964)
Year of Election or Appointment: 2014
Chief Compliance Officer
Ms. Wondrack also serves as Chief Compliance Officer of other funds. Ms. Wondrack is Executive Vice President and head of the Ethics Office and Asset Management Compliance for Fidelity Investments (2012-present). Ms. Wondrack also serves as Chief Compliance Officer of Fidelity SelectCo, LLC (investment adviser firm, 2014-present); Chief Compliance Officer of Impresa Management LLC (2013-present); and Chief Compliance Officer of FMR Co., Inc. (investment adviser firm), Fidelity Investments Money Management, Inc. (investment adviser firm), Fidelity Management & Research (Japan) Limited (investment adviser firm), FMR Investment Management (U.K.) Limited (investment adviser firm), Fidelity Management & Research (Hong Kong) (investment adviser firm), Fidelity Management & Research Company (investment adviser firm), FIAM LLC (investment adviser firm), and Strategic Advisers, Inc. (investment adviser firm), Ballyrock Investment Advisors LLC, and Northern Neck Investors LLC (2012-present). Previously, Ms. Wondrack served as Senior Vice President and Chief Compliance Officer for Columbia Management Investment Advisers, LLC (2005-2012); Chief Compliance Officer for certain funds within the Columbia Family of Funds (2007-2012); and Senior Vice President of Compliance Risk Management at Bank of America (2005-2010).
Joseph F. Zambello (1957)
Year of Election or Appointment: 2011
Deputy Treasurer
Mr. Zambello also serves as Deputy Treasurer of other funds. Mr. Zambello is an employee of Fidelity Investments (1991-present). Previously, Mr. Zambello served as Vice President of the Program Management Group of FMR (investment adviser firm, 2009-2011) and Vice President of the Transfer Agent Oversight Group (2005-2009).
Shareholder Expense Example
As a shareholder of the Fund, you incur two types of costs: (1) transaction costs, including sales charges (loads) on purchase payments or redemption proceeds, and (2) ongoing costs, including management fees, distribution and/or service (12b-1) fees and other Fund expenses. This Example is intended to help you understand your ongoing costs (in dollars) of investing in the Fund and to compare these costs with the ongoing costs of investing in other mutual funds.
The Example is based on an investment of $1,000 invested at the beginning of the period and held for the entire period (June 1, 2015 to November 30, 2015).
Actual Expenses
The first line of the accompanying table for each class of the Fund provides information about actual account values and actual expenses. You may use the information in this line, together with the amount you invested, to estimate the expenses that you paid over the period. Simply divide your account value by $1,000.00 (for example, an $8,600 account value divided by $1,000.00 = 8.6), then multiply the result by the number in the first line for a class of the Fund under the heading entitled "Expenses Paid During Period" to estimate the expenses you paid on your account during this period. A small balance maintenance fee of $12.00 that is charged once a year may apply for certain accounts with a value of less than $2,000. This fee is not included in the table below. If it was, the estimate of expenses you paid during the period would be higher, and your ending account value lower, by this amount. In addition, the Fund, as a shareholder in the underlying Fidelity Central Funds, will indirectly bear its pro-rata share of the fees and expenses incurred by the underlying Fidelity Central Funds. These fees and expenses are not included in the Fund's annualized expense ratio used to calculate the expense estimate in the table below.
Hypothetical Example for Comparison Purposes
The second line of the accompanying table for each class of the Fund provides information about hypothetical account values and hypothetical expenses based on a Class' actual expense ratio and an assumed rate of return of 5% per year before expenses, which is not the Class' actual return. The hypothetical account values and expenses may not be used to estimate the actual ending account balance or expenses you paid for the period. You may use this information to compare the ongoing costs of investing in the Fund and other funds. To do so, compare this 5% hypothetical example with the 5% hypothetical examples that appear in the shareholder reports of the other funds. A small balance maintenance fee of $12.00 that is charged once a year may apply for certain accounts with a value of less than $2,000. This fee is not included in the table below. If it was, the estimate of expenses you paid during the period would be higher, and your ending account value lower, by this amount. In addition, the Fund, as a shareholder in the underlying Fidelity Central Funds, will indirectly bear its pro-rata share of the fees and expenses incurred by the underlying Fidelity Central Funds. These fees and expenses are not included in the Fund's annualized expense ratio used to calculate the expense estimate in the table below.
Please note that the expenses shown in the table are meant to highlight your ongoing costs only and do not reflect any transaction costs. Therefore, the second line of the table is useful in comparing ongoing costs only, and will not help you determine the relative total costs of owning different funds. In addition, if these transactional costs were included, your costs would have been higher.
| Annualized Expense Ratio-A | Beginning Account Value June 1, 2015 | Ending Account Value November 30, 2015 | Expenses Paid During Period-B June 1, 2015 to November 30, 2015 | |
| Class A | .91% | |||
| Actual | $1,000.00 | $943.40 | $4.43 | |
| Hypothetical-C | $1,000.00 | $1,020.51 | $4.61 | |
| Class T | 1.12% | |||
| Actual | $1,000.00 | $942.60 | $5.45 | |
| Hypothetical-C | $1,000.00 | $1,019.45 | $5.67 | |
| Class B | 1.73% | |||
| Actual | $1,000.00 | $939.70 | $8.41 | |
| Hypothetical-C | $1,000.00 | $1,016.39 | $8.74 | |
| Class C | 1.67% | |||
| Actual | $1,000.00 | $940.00 | $8.12 | |
| Hypothetical-C | $1,000.00 | $1,016.70 | $8.44 | |
| Fidelity Value Strategies Fund | .65% | |||
| Actual | $1,000.00 | $944.70 | $3.17 | |
| Hypothetical-C | $1,000.00 | $1,021.81 | $3.29 | |
| Class K | .49% | |||
| Actual | $1,000.00 | $945.50 | $2.39 | |
| Hypothetical-C | $1,000.00 | $1,022.61 | $2.48 | |
| Class I | .66% | |||
| Actual | $1,000.00 | $944.70 | $3.22 | |
| Hypothetical-C | $1,000.00 | $1,021.76 | $3.35 |
A Annualized expense ratio reflects expenses net of applicable fee waivers.
B Expenses are equal to each Class' annualized expense ratio, multiplied by the average account value over the period, multiplied by 183/365 (to reflect the one-half year period).
C 5% return per year before expenses
Distributions (Unaudited)
Class I designates 100% of the dividends distributed during the fiscal year as qualifying for the dividends–received deduction for corporate shareholders.
Class I designates 100% of the dividends distributed during the fiscal year as amounts which may be taken into account as a dividend for purposes of the maximum rate under section 1(h)(11) of the Internal Revenue Code.
The fund will notify shareholders in January 2016 of amounts for use in preparing 2015 income tax returns.
Board Approval of Investment Advisory Contracts and Management Fees
Fidelity Advisor Value Strategies Fund
Each year, the Board of Trustees, including the Independent Trustees (together, the Board), votes on the renewal of the management contract with Fidelity Management & Research Company (FMR) and the sub-advisory agreements (together, the Advisory Contracts) for the fund. The Board, assisted by the advice of fund counsel and Independent Trustees' counsel, requests and considers a broad range of information relevant to the renewal of the Advisory Contracts throughout the year.
The Board meets regularly and, at each of its meetings, covers an extensive agenda of topics and materials and considers factors that are relevant to its annual consideration of the renewal of the fund's Advisory Contracts, including the services and support provided to the fund and its shareholders. The Board has established various standing committees (Committees), each composed of and chaired by Independent Trustees with varying backgrounds, to which the Board has assigned specific subject matter responsibilities in order to enhance effective decision-making by the Board. The Board, acting directly and through its Committees, requests and receives information concerning the annual consideration of the renewal of the fund's Advisory Contracts. The Board also meets as needed to consider matters specifically related to the Board's annual consideration of the renewal of the Advisory Contracts. Members of the Board may also meet with trustees of other Fidelity funds through ad hoc joint committees to discuss certain matters relevant to all of the Fidelity funds.
At its July 2015 meeting, the Board unanimously determined to renew the fund's Advisory Contracts. In reaching its determination, the Board considered all factors it believed relevant, including (i) the nature, extent, and quality of the services to be provided to the fund and its shareholders (including the investment performance of the fund); (ii) the competitiveness of the fund's management fee and total expense ratio relative to peer funds; (iii) the total costs of the services to be provided by and the profits to be realized by Fidelity from its relationship with the fund; and (iv) the extent to which (if any) economies of scale exist and would be realized as the fund grows, and whether any economies of scale are appropriately shared with fund shareholders.
In considering whether to renew the Advisory Contracts for the fund, the Board reached a determination, with the assistance of fund counsel and Independent Trustees' counsel and through the exercise of its business judgment, that the renewal of the Advisory Contracts was in the best interests of the fund and its shareholders and that the compensation payable under the Advisory Contracts was fair and reasonable. The Board's decision to renew the Advisory Contracts was not based on any single factor, but rather was based on a comprehensive consideration of all the information provided to the Board at its meetings throughout the year. The Board, in reaching its determination to renew the Advisory Contracts, was aware that shareholders of the fund have a broad range of investment choices available to them, including a wide choice among funds offered by Fidelity's competitors, and that the fund's shareholders, who have the opportunity to review and weigh the disclosure provided by the fund in its prospectus and other public disclosures, have chosen to invest in this fund, which is part of the Fidelity family of funds.
Nature, Extent, and Quality of Services Provided. The Board considered Fidelity's staffing as it relates to the fund, including the backgrounds of investment personnel of Fidelity, and also considered the fund's investment objective, strategies, and related investment philosophy. The Independent Trustees also had discussions with senior management of Fidelity's investment operations and investment groups. The Board considered the structure of the portfolio manager compensation program and whether this structure provides appropriate incentives to act in the best interests of the fund. Additionally, the Board considered the portfolio managers' investments, if any, in the funds that they manage.Resources Dedicated to Investment Management and Support Services. The Board and the Fund Oversight and Research Committees reviewed the general qualifications and capabilities of Fidelity's investment staff, including its size, education, experience, and resources, as well as Fidelity's approach to recruiting, training, managing, and compensating investment personnel. The Board noted that Fidelity has continued to increase the resources devoted to non-U.S. offices, including expansion of Fidelity's global investment organization. The Board also noted that Fidelity's analysts have extensive resources, tools and capabilities that allow them to conduct sophisticated quantitative and fundamental analysis, as well as credit analysis of issuers, counterparties and guarantors. Further, the Board considered that Fidelity's investment professionals have sufficient access to global information and data so as to provide competitive investment results over time, and that those professionals also have access to sophisticated tools that permit them to assess portfolio construction and risk and performance attribution characteristics continuously, as well as to transmit new information and research conclusions rapidly around the world. Additionally, in its deliberations, the Board considered Fidelity's trading, risk management, and compliance capabilities and resources, which are integral parts of the investment management process.Shareholder and Administrative Services. The Board considered (i) the nature, extent, quality, and cost of advisory, administrative, and shareholder services performed by FMR, the sub-advisers (together with FMR, the Investment Advisers), and their affiliates under the Advisory Contracts and under separate agreements covering transfer agency, pricing and bookkeeping, and securities lending services for the fund; (ii) the nature and extent of the supervision of third party service providers, principally custodians and subcustodians; and (iii) the resources devoted to, and the record of compliance with, the fund's compliance policies and procedures. The Board also reviewed the allocation of fund brokerage, including allocations to brokers affiliated with the Investment Advisers, the use of brokerage commissions to pay fund expenses, and the use of "soft" commission dollars to pay for research services.The Board noted that the growth of fund assets over time across the complex allows Fidelity to reinvest in the development of services designed to enhance the value or convenience of the Fidelity funds as investment vehicles. These services include 24-hour access to account information and market information through telephone representatives and over the Internet, investor education materials and asset allocation tools, and the expanded availability of Fidelity Investor Centers.In 2014, the Board formed an ad hoc Committee on Transfer Agency Fees to review the variety of transfer agency fee structures throughout the industry and Fidelity's competitive positioning with respect to industry participants.Investment in a Large Fund Family. The Board considered the benefits to shareholders of investing in a Fidelity fund, including the benefits of investing in a fund that is part of a large family of funds offering a variety of investment disciplines and providing a large variety of mutual fund investor services. The Board noted that Fidelity had taken, or had made recommendations that resulted in the Fidelity funds taking, a number of actions over the previous year that benefited particular funds, including (i) continuing to dedicate additional resources to investment research and to the support of the senior management team that oversees asset management; (ii) continuing efforts to enhance Fidelity's global research capabilities; (iii) launching new funds and making other enhancements to meet client needs; (iv) reducing management fees and total expenses for certain index funds and diversified international funds; (v) continuing to launch dedicated lower cost underlying funds to meet portfolio construction needs related to expanding underlying fund options for Fidelity funds of funds, specifically for the Freedom Fund product lines; (vi) rationalizing product lines and gaining increased efficiencies through fund mergers; (vii) launching active fixed-income exchange-traded funds; (viii) continuing to develop, acquire and implement systems and technology to improve services to the funds and information security and to increase efficiency; (ix) implementing investment enhancements to further strengthen Fidelity's target date product line to increase investors' probability of success in achieving their goals; (x) modifying the eligibility criteria for certain share classes to accommodate roll-over assets from employer-sponsored retirement plans; (xi) launching a new Class W of the Freedom Index Funds to attract and retain Fidelity record-kept retirement plan assets; and (xii) implementing changes to Fidelity's money market product line in response to recent money market regulatory reforms.Investment Performance. The Board considered whether the fund has operated in accordance with its investment objective, as well as its record of compliance with its investment restrictions and its performance history.The Board took into account discussions with representatives of the Investment Advisers about fund investment performance that occur at Board meetings throughout the year. In this regard the Board noted that as part of regularly scheduled fund reviews and other reports to the Board on fund performance, the Board considers annualized return information for the fund, for different time periods, measured against a securities market index ("benchmark index") and a peer group of funds with similar objectives ("peer group"), if any. In its evaluation of fund investment performance, the Board gave particular attention to information indicating changes in performance of certain Fidelity funds for specific time periods and discussed with the Investment Advisers the reasons for any overperformance or underperformance.In addition to reviewing absolute and relative fund performance, the Independent Trustees periodically consider the appropriateness of fund performance metrics in evaluating the results achieved. In general, the Independent Trustees believe that fund performance should be evaluated based on net performance (after fees and expenses) of both the highest performing and lowest performing fund share classes, where applicable, compared to appropriate benchmark indices, over appropriate time periods that may include full market cycles, and compared to peer groups, as applicable, over the same periods, taking into account relevant factors including the following: general market conditions; issuer-specific information; and fund cash flows and other factors.The Independent Trustees recognize that shareholders evaluate performance on a net basis over their own holding periods, for which one-, three-, and five-year periods are often used as a proxy. For this reason, the performance information reviewed by the Board also included net cumulative calendar year total return information for the fund and an appropriate benchmark index and peer group for the most recent one-, three-, and five-year periods, as shown below. Returns are shown compared to the 25th percentile (top of box, 75% beaten) and 75th percentile (bottom of box, 25% beaten) of the peer universe.Fidelity Advisor Value Strategies Fund
Fidelity Advisor Value Strategies Fund
![]()
ISO-ANN-0116
1.539181.118
Fidelity Advisor® Growth Opportunities Fund Class A, Class T, Class B and Class C Annual Report November 30, 2015 |
|
Contents
Board Approval of Investment Advisory Contracts and Management Fees |
To view a fund's proxy voting guidelines and proxy voting record for the 12-month period ended June 30, visit http://www.fidelity.com/proxyvotingresults or visit the Securities and Exchange Commission's (SEC) web site at http://www.sec.gov.
You may also call 1-877-208-0098 to request a free copy of the proxy voting guidelines.
Standard & Poor's, S&P and S&P 500 are registered service marks of The McGraw-Hill Companies, Inc. and have been licensed for use by Fidelity Distributors Corporation.
Other third-party marks appearing herein are the property of their respective owners.
All other marks appearing herein are registered or unregistered trademarks or service marks of FMR LLC or an affiliated company. © 2016 FMR LLC. All rights reserved.
This report and the financial statements contained herein are submitted for the general information of the shareholders of the Fund. This report is not authorized for distribution to prospective investors in the Fund unless preceded or accompanied by an effective prospectus.
A fund files its complete schedule of portfolio holdings with the SEC for the first and third quarters of each fiscal year on Form N-Q. Forms N-Q are available on the SEC’s web site at http://www.sec.gov. A fund's Forms N-Q may be reviewed and copied at the SEC’s Public Reference Room in Washington, DC. Information regarding the operation of the SEC's Public Reference Room may be obtained by calling 1-800-SEC-0330.
For a complete list of a fund's portfolio holdings, view the most recent holdings listing, semiannual report, or annual report on Fidelity's web site at http://www.fidelity.com, http://www.advisor.fidelity.com, or http://www.401k.com, as applicable.
NOT FDIC INSURED •MAY LOSE VALUE •NO BANK GUARANTEE
Neither the Fund nor Fidelity Distributors Corporation is a bank.
Performance: The Bottom Line
Average annual total return reflects the change in the value of an investment, assuming reinvestment of distributions from dividend income and capital gains (the profits earned upon the sale of securities that have grown in value, if any) and assuming a constant rate of performance each year.
The hypothetical investment and the average annual total returns do not reflect the deduction of taxes that a shareholder would pay on fund distributions or the redemption of fund shares.
During periods of reimbursement by Fidelity, a fund’s total return will be greater than it would be had the reimbursement not occurred.
How a fund did yesterday is no guarantee of how it will do tomorrow.
Returns reflect the conversion of Class B shares to Class A shares after a maximum of seven years.
Average Annual Total Returns
| For the periods ended November 30, 2015 | Past 1 year | Past 5 years | Past 10 years |
| Class A (incl. 5.75% sales charge) | (0.78)% | 14.30% | 6.87% |
| Class T (incl. 3.50% sales charge) | 1.36% | 14.61% | 6.91% |
| Class B (incl. contingent deferred sales charge) | (0.62)% | 14.51% | 6.94% |
| Class C (incl. contingent deferred sales charge) | 3.49% | 14.81% | 6.71% |
Class B shares' contingent deferred sales charges included in the past one year, past five years and past ten years total return figures are 5%, 2% and 0%, respectively.
Class C shares' contingent deferred sales charges included in the past one year, past five years and past ten years total return figures are 1%, 0% and 0%, respectively.
Prior to February 1, 2007, the fund operated under certain different investment policies and compared its performance to a different index. The fund's historical performance may not represent its current investment policies.
$10,000 Over 10 Years
Let's say hypothetically that $10,000 was invested in Fidelity Advisor® Growth Opportunities Fund - Class A on November 30, 2005, and the current 5.75% sales charge was paid.
The chart shows how the value of your investment would have changed, and also shows how the Russell 1000® Growth Index performed over the same period.
| Period Ending Values | ||
| $19,432 | Fidelity Advisor® Growth Opportunities Fund - Class A | |
| $22,947 | Russell 1000® Growth Index | |
Management's Discussion of Fund Performance
Market Recap: U.S. stocks gained modestly for the 12 months ending November 30, 2015, despite a steep decline in August and September on concern about slowing economic growth in China. The S&P 500® index rebounded in October and gained 2.75% for the year. Stocks benefited late in the period amid waning expectations for a near-term interest-rate hike by the U.S. Federal Reserve, more economic stimulus in Europe and an interest-rate cut in China. Growth stocks in the benchmark far outpaced their value counterparts, as investors continued to seek growth in a subpar economic environment. Sector performance varied widely, with more than 26 percentage points separating the leader from the laggard. Consumer discretionary (+14%) secured the top spot, benefiting from a combination of rising personal income and still-benign inflation. Information technology (+7%) and health care (+4%) also outpaced the broad market. Conversely, the energy sector (-12%) performed worst, stymied by depressed commodity prices that also hit materials (-5%). Telecommunication services (-5%) and utilities (-4%), considered defensive sectors less sensitive to the economy, also lost ground. At period end, investors remained focused on the potential global implications of a stronger U.S. dollar and how China's transition toward a consumption-led economy may affect corporate earnings.Comments from Lead Portfolio Manager Kyle Weaver: For the year, the fund's share classes posted gains in the mid-single digits but lagged the 6.12% return of the benchmark Russell 1000® Growth Index. Stock selection in the consumer staples, consumer discretionary and industrials sectors meaningfully detracted versus the benchmark. A large overweighting in Keurig Green Mountain, an innovator in single-serve beverage products, was the fund's biggest relative detractor, as sales and profitability of the company's products were pressured by cheaper knock-offs. I considerably reduced this position but remained overweighted at period end. Other noteworthy detractors included non-index positions in Lumber Liquidators Holdings, which I sold, and Endurance International Group Holdings, a Web-hosting company. Conversely, picks in health care and information technology added significant value. Regeneron Pharmaceuticals, the fund's top relative contributor, and Alkermes are two biotechnology stocks that strongly outperformed. Salesforce.com, a provider of cloud-based marketing and customer relationship management solutions, also was a strong performer this period. I reduced our stake in all three contributors noted but maintained overweightings in each case.Note to shareholders: Kyle Weaver was named Lead Portfolio Manager of the fund, and Steven Wymer Co-Manager, on July 14, 2015, succeeding Gopal Reddy.The views expressed above reflect those of the portfolio manager(s) only through the end of the period as stated on the cover of this report and do not necessarily represent the views of Fidelity or any other person in the Fidelity organization. Any such views are subject to change at any time based upon market or other conditions and Fidelity disclaims any responsibility to update such views. These views may not be relied on as investment advice and, because investment decisions for a Fidelity fund are based on numerous factors, may not be relied on as an indication of trading intent on behalf of any Fidelity fund.
Investment Summary (Unaudited)
Top Ten Stocks as of November 30, 2015
| % of fund's net assets | % of fund's net assets 6 months ago | |
| Apple, Inc. | 7.0 | 6.6 |
| Alphabet, Inc. Class A | 3.0 | 2.3 |
| Alphabet, Inc. Class C | 3.0 | 2.2 |
| Facebook, Inc. Class A | 2.4 | 2.1 |
| Amazon.com, Inc. | 2.2 | 1.6 |
| American Tower Corp. | 2.1 | 0.0 |
| Visa, Inc. Class A | 2.0 | 1.8 |
| Salesforce.com, Inc. | 1.8 | 4.5 |
| Cognizant Technology Solutions Corp. Class A | 1.7 | 0.2 |
| Endurance International Group Holdings, Inc. | 1.5 | 0.0 |
| 26.7 |
Top Five Market Sectors as of November 30, 2015
| % of fund's net assets | % of fund's net assets 6 months ago | |
| Information Technology | 38.6 | 36.0 |
| Health Care | 18.4 | 23.5 |
| Consumer Discretionary | 17.0 | 16.0 |
| Industrials | 8.3 | 6.8 |
| Consumer Staples | 6.1 | 8.4 |
Asset Allocation (% of fund's net assets)
| As of November 30, 2015* | ||
| Stocks | 99.2% | |
| Convertible Securities | 0.8% | |

* Foreign investments - 9.1%
| As of May 31, 2015* | ||
| Stocks | 98.8% | |
| Convertible Securities | 0.7% | |
| Short-Term Investments and Net Other Assets (Liabilities) | 0.5% | |

* Foreign investments - 6.8%
Percentages shown as 0.0% may reflect amounts less than 0.05%.
Investments November 30, 2015
Showing Percentage of Net Assets
| Common Stocks - 99.2% | |||
| Shares | Value (000s) | ||
| CONSUMER DISCRETIONARY - 17.0% | |||
| Auto Components - 0.5% | |||
| Tenneco, Inc. (a) | 286,400 | $15,431 | |
| Automobiles - 0.6% | |||
| Tesla Motors, Inc. (a)(b) | 95,700 | 22,036 | |
| Diversified Consumer Services - 0.1% | |||
| ServiceMaster Global Holdings, Inc. (a) | 100,900 | 3,782 | |
| Hotels, Restaurants & Leisure - 2.8% | |||
| Buffalo Wild Wings, Inc. (a) | 66,200 | 10,608 | |
| Chipotle Mexican Grill, Inc. (a) | 51,500 | 29,847 | |
| Domino's Pizza, Inc. | 47,000 | 5,051 | |
| Dunkin' Brands Group, Inc. (b) | 165,200 | 7,008 | |
| Las Vegas Sands Corp. | 277,692 | 12,235 | |
| Starbucks Corp. | 421,800 | 25,894 | |
| Starwood Hotels & Resorts Worldwide, Inc. | 54,100 | 3,887 | |
| 94,530 | |||
| Internet & Catalog Retail - 3.7% | |||
| Amazon.com, Inc. (a) | 115,600 | 76,851 | |
| Netflix, Inc. (a) | 137,500 | 16,958 | |
| Priceline Group, Inc. (a) | 14,400 | 17,983 | |
| Travelport Worldwide Ltd. (b) | 1,174,200 | 15,629 | |
| 127,421 | |||
| Media - 4.9% | |||
| AMC Networks, Inc. Class A (a) | 109,300 | 8,887 | |
| Charter Communications, Inc. Class A (a)(b) | 270,200 | 50,625 | |
| Comcast Corp. Class A | 668,900 | 40,709 | |
| Liberty Global PLC Class A (a) | 403,700 | 17,121 | |
| Lions Gate Entertainment Corp. (b) | 217,800 | 7,392 | |
| The Walt Disney Co. | 355,300 | 40,316 | |
| Twenty-First Century Fox, Inc. Class A | 10,500 | 310 | |
| Zee Entertainment Enterprises Ltd. | 679,770 | 4,174 | |
| 169,534 | |||
| Multiline Retail - 0.2% | |||
| Dollar General Corp. | 96,600 | 6,319 | |
| Specialty Retail - 1.4% | |||
| CarMax, Inc. (a) | 231,000 | 13,236 | |
| Home Depot, Inc. | 108,300 | 14,499 | |
| TJX Companies, Inc. | 270,200 | 19,076 | |
| 46,811 | |||
| Textiles, Apparel & Luxury Goods - 2.8% | |||
| lululemon athletica, Inc. (a) | 516,216 | 24,685 | |
| Michael Kors Holdings Ltd. (a) | 88,400 | 3,803 | |
| NIKE, Inc. Class B | 273,300 | 36,152 | |
| Skechers U.S.A., Inc. Class A (sub. vtg.) (a) | 458,898 | 13,859 | |
| Under Armour, Inc. Class A (sub. vtg.) (a)(b) | 123,600 | 10,657 | |
| VF Corp. | 133,400 | 8,631 | |
| 97,787 | |||
| TOTAL CONSUMER DISCRETIONARY | 583,651 | ||
| CONSUMER STAPLES - 5.9% | |||
| Beverages - 1.7% | |||
| Monster Beverage Corp. | 126,600 | 19,574 | |
| PepsiCo, Inc. | 136,900 | 13,712 | |
| The Coca-Cola Co. | 555,200 | 23,663 | |
| 56,949 | |||
| Food & Staples Retailing - 2.5% | |||
| Costco Wholesale Corp. | 227,500 | 36,723 | |
| CVS Health Corp. | 332,800 | 31,313 | |
| Walgreens Boots Alliance, Inc. | 188,200 | 15,814 | |
| Whole Foods Market, Inc. | 109,400 | 3,189 | |
| 87,039 | |||
| Food Products - 0.6% | |||
| Keurig Green Mountain, Inc. | 168,200 | 8,814 | |
| Mead Johnson Nutrition Co. Class A | 83,700 | 6,745 | |
| Mondelez International, Inc. | 110,100 | 4,807 | |
| 20,366 | |||
| Household Products - 0.6% | |||
| Procter & Gamble Co. | 182,900 | 13,688 | |
| Svenska Cellulosa AB (SCA) (B Shares) | 238,500 | 6,864 | |
| 20,552 | |||
| Personal Products - 0.2% | |||
| Herbalife Ltd. (a) | 122,400 | 7,066 | |
| Tobacco - 0.3% | |||
| Altria Group, Inc. | 179,200 | 10,322 | |
| TOTAL CONSUMER STAPLES | 202,294 | ||
| ENERGY - 1.2% | |||
| Energy Equipment & Services - 0.5% | |||
| Dril-Quip, Inc. (a) | 109,400 | 6,904 | |
| Oceaneering International, Inc. | 201,500 | 8,814 | |
| 15,718 | |||
| Oil, Gas & Consumable Fuels - 0.7% | |||
| Cabot Oil & Gas Corp. | 798,900 | 15,043 | |
| Golar LNG Ltd. | 28,700 | 785 | |
| PDC Energy, Inc. (a) | 136,800 | 7,728 | |
| 23,556 | |||
| TOTAL ENERGY | 39,274 | ||
| FINANCIALS - 5.3% | |||
| Banks - 1.5% | |||
| HDFC Bank Ltd. sponsored ADR | 246,900 | 14,350 | |
| JPMorgan Chase & Co. | 531,800 | 35,460 | |
| 49,810 | |||
| Capital Markets - 1.2% | |||
| BlackRock, Inc. Class A | 74,200 | 26,988 | |
| Charles Schwab Corp. | 452,200 | 15,244 | |
| Goldman Sachs Group, Inc. | 41 | 8 | |
| 42,240 | |||
| Consumer Finance - 0.4% | |||
| American Express Co. | 55,900 | 4,005 | |
| Discover Financial Services | 185,233 | 10,514 | |
| 14,519 | |||
| Diversified Financial Services - 0.1% | |||
| MSCI, Inc. Class A | 49,900 | 3,499 | |
| Real Estate Investment Trusts - 2.1% | |||
| American Tower Corp. | 726,600 | 72,210 | |
| TOTAL FINANCIALS | 182,278 | ||
| HEALTH CARE - 18.4% | |||
| Biotechnology - 12.8% | |||
| AbbVie, Inc. | 573,600 | 33,355 | |
| ACADIA Pharmaceuticals, Inc. (a) | 194,600 | 7,385 | |
| Aduro Biotech, Inc. (b) | 78,600 | 2,436 | |
| Agios Pharmaceuticals, Inc. (a) | 75,400 | 4,870 | |
| Alexion Pharmaceuticals, Inc. (a) | 129,400 | 23,090 | |
| Alkermes PLC (a) | 513,400 | 37,663 | |
| Alnylam Pharmaceuticals, Inc. (a) | 229,500 | 23,882 | |
| Amgen, Inc. | 214,300 | 34,524 | |
| Amicus Therapeutics, Inc. (a) | 641,000 | 6,878 | |
| Asterias Biotherapeutics, Inc. (a)(b) | 50,950 | 245 | |
| aTyr Pharma, Inc. (c) | 124,876 | 1,063 | |
| Avalanche Biotechnologies, Inc. (a) | 31,748 | 333 | |
| Baxalta, Inc. | 37,600 | 1,293 | |
| Biogen, Inc. (a) | 71,400 | 20,482 | |
| BioMarin Pharmaceutical, Inc. (a) | 169,500 | 16,165 | |
| BioTime, Inc. warrants 10/1/18 (a) | 62,345 | 52 | |
| bluebird bio, Inc. (a) | 107,000 | 9,496 | |
| Celgene Corp. (a) | 97,670 | 10,690 | |
| Celldex Therapeutics, Inc. (a) | 165,600 | 2,982 | |
| Edge Therapeutics, Inc. (a) | 173,400 | 2,407 | |
| Esperion Therapeutics, Inc. (a) | 77,500 | 2,202 | |
| Gilead Sciences, Inc. | 353,400 | 37,446 | |
| Insmed, Inc. (a) | 375,379 | 6,122 | |
| Intercept Pharmaceuticals, Inc. (a) | 10,235 | 1,807 | |
| Isis Pharmaceuticals, Inc. (a)(b) | 703,053 | 42,914 | |
| Lexicon Pharmaceuticals, Inc. (a) | 114,596 | 1,577 | |
| Merrimack Pharmaceuticals, Inc. (a) | 437,800 | 4,120 | |
| Novavax, Inc. (a) | 887,700 | 7,599 | |
| Ophthotech Corp. (a) | 151,000 | 9,599 | |
| Prothena Corp. PLC (a) | 123,802 | 8,733 | |
| Regeneron Pharmaceuticals, Inc. (a) | 88,700 | 48,297 | |
| Regulus Therapeutics, Inc. (a) | 318,000 | 3,202 | |
| Rigel Pharmaceuticals, Inc. (a) | 667,248 | 2,189 | |
| Seattle Genetics, Inc. (a)(b) | 152,367 | 6,396 | |
| Seres Therapeutics, Inc. | 21,900 | 785 | |
| Spark Therapeutics, Inc. (b) | 3,500 | 202 | |
| Transition Therapeutics, Inc. (a)(b) | 761,897 | 1,432 | |
| Vertex Pharmaceuticals, Inc. (a) | 99,390 | 12,857 | |
| XOMA Corp. (a)(b) | 1,084,759 | 1,443 | |
| 438,213 | |||
| Health Care Equipment & Supplies - 0.4% | |||
| Boston Scientific Corp. (a) | 476,700 | 8,714 | |
| Penumbra, Inc. (a) | 4,200 | 211 | |
| Stryker Corp. | 37,000 | 3,569 | |
| 12,494 | |||
| Health Care Providers & Services - 2.0% | |||
| Express Scripts Holding Co. (a) | 109,767 | 9,383 | |
| McKesson Corp. | 251,900 | 47,697 | |
| UnitedHealth Group, Inc. | 97,100 | 10,944 | |
| 68,024 | |||
| Health Care Technology - 0.4% | |||
| athenahealth, Inc. (a)(b) | 89,700 | 15,047 | |
| Castlight Health, Inc. Class B (a) | 116,700 | 467 | |
| 15,514 | |||
| Pharmaceuticals - 2.8% | |||
| AcelRx Pharmaceuticals, Inc. (a) | 714,917 | 4,089 | |
| Allergan PLC (a) | 58,490 | 18,359 | |
| Bristol-Myers Squibb Co. | 269,000 | 18,026 | |
| Endo Health Solutions, Inc. (a) | 276,800 | 17,018 | |
| Intra-Cellular Therapies, Inc. (a) | 36,700 | 1,957 | |
| Mylan N.V. | 66,000 | 3,386 | |
| Teva Pharmaceutical Industries Ltd. sponsored ADR | 560,500 | 35,272 | |
| 98,107 | |||
| TOTAL HEALTH CARE | 632,352 | ||
| INDUSTRIALS - 8.3% | |||
| Aerospace & Defense - 0.9% | |||
| Honeywell International, Inc. | 114,400 | 11,892 | |
| The Boeing Co. | 137,100 | 19,941 | |
| 31,833 | |||
| Air Freight & Logistics - 0.4% | |||
| FedEx Corp. | 33,900 | 5,375 | |
| United Parcel Service, Inc. Class B | 82,500 | 8,498 | |
| 13,873 | |||
| Airlines - 2.5% | |||
| American Airlines Group, Inc. | 180,400 | 7,443 | |
| Controladora Vuela Compania de Aviacion S.A.B. de CV (a) | 1,097,300 | 1,935 | |
| Controladora Vuela Compania de Aviacion S.A.B. de CV ADR (a) | 105,300 | 1,863 | |
| Delta Air Lines, Inc. | 354,300 | 16,461 | |
| JetBlue Airways Corp. (a) | 66,000 | 1,633 | |
| Southwest Airlines Co. | 829,400 | 38,053 | |
| Spirit Airlines, Inc. (a) | 292,900 | 10,770 | |
| United Continental Holdings, Inc. (a) | 86,100 | 4,798 | |
| WestJet Airlines Ltd. | 199,300 | 3,170 | |
| 86,126 | |||
| Building Products - 0.0% | |||
| Caesarstone Sdot-Yam Ltd. | 36,100 | 1,476 | |
| Electrical Equipment - 1.2% | |||
| Acuity Brands, Inc. | 32,800 | 7,573 | |
| SolarCity Corp. (a)(b) | 1,101,700 | 31,685 | |
| Sunrun, Inc. (a)(b) | 241,300 | 1,605 | |
| 40,863 | |||
| Industrial Conglomerates - 0.9% | |||
| 3M Co. | 62,200 | 9,739 | |
| Danaher Corp. | 230,700 | 22,237 | |
| 31,976 | |||
| Professional Services - 0.7% | |||
| TriNet Group, Inc. (a) | 938,300 | 18,531 | |
| Verisk Analytics, Inc. (a) | 47,700 | 3,575 | |
| 22,106 | |||
| Road & Rail - 1.4% | |||
| Genesee & Wyoming, Inc. Class A (a) | 123,700 | 8,569 | |
| Hertz Global Holdings, Inc. (a) | 135,400 | 2,147 | |
| J.B. Hunt Transport Services, Inc. | 212,200 | 16,603 | |
| TransForce, Inc. | 295,200 | 5,626 | |
| Union Pacific Corp. | 163,200 | 13,701 | |
| 46,646 | |||
| Trading Companies & Distributors - 0.3% | |||
| HD Supply Holdings, Inc. (a) | 345,700 | 10,934 | |
| TOTAL INDUSTRIALS | 285,833 | ||
| INFORMATION TECHNOLOGY - 38.2% | |||
| Communications Equipment - 0.6% | |||
| Infinera Corp. (a) | 423,581 | 9,539 | |
| QUALCOMM, Inc. | 201,165 | 9,815 | |
| 19,354 | |||
| Electronic Equipment & Components - 0.0% | |||
| CDW Corp. | 38,400 | 1,658 | |
| Internet Software & Services - 13.1% | |||
| Alibaba Group Holding Ltd. sponsored ADR (a)(b) | 402,300 | 33,825 | |
| Alphabet, Inc.: | |||
| Class A (a) | 133,665 | 101,966 | |
| Class C | 137,175 | 101,866 | |
| Demandware, Inc. (a)(b) | 150,000 | 7,673 | |
| Endurance International Group Holdings, Inc. (a)(b) | 3,676,340 | 51,358 | |
| Facebook, Inc. Class A (a) | 804,841 | 83,897 | |
| GoDaddy, Inc. (a)(b) | 1,429,000 | 44,399 | |
| LinkedIn Corp. Class A (a) | 9,400 | 2,285 | |
| Rackspace Hosting, Inc. (a) | 176,202 | 5,043 | |
| Wix.com Ltd. (a) | 705,135 | 17,523 | |
| 449,835 | |||
| IT Services - 8.8% | |||
| Alliance Data Systems Corp. (a) | 113,600 | 32,586 | |
| Booz Allen Hamilton Holding Corp. Class A | 231,200 | 7,040 | |
| Cognizant Technology Solutions Corp. Class A (a) | 885,892 | 57,211 | |
| EPAM Systems, Inc. (a) | 451,300 | 35,531 | |
| Fidelity National Information Services, Inc. | 23,771 | 1,513 | |
| Gartner, Inc. Class A (a) | 79,900 | 7,455 | |
| MasterCard, Inc. Class A | 459,200 | 44,965 | |
| PayPal Holdings, Inc. (a) | 235,600 | 8,307 | |
| Sabre Corp. | 1,108,600 | 32,438 | |
| Square, Inc. | 129,100 | 1,554 | |
| Visa, Inc. Class A | 885,300 | 69,948 | |
| WEX, Inc. (a) | 28,500 | 2,687 | |
| 301,235 | |||
| Semiconductors & Semiconductor Equipment - 3.4% | |||
| Avago Technologies Ltd. | 171,700 | 22,398 | |
| Broadcom Corp. Class A | 322,500 | 17,618 | |
| Cypress Semiconductor Corp. (b) | 763,766 | 8,264 | |
| Micron Technology, Inc. (a) | 126,600 | 2,017 | |
| NVIDIA Corp. | 361,030 | 11,452 | |
| NXP Semiconductors NV (a) | 257,500 | 24,066 | |
| Qorvo, Inc. (a) | 440,800 | 25,597 | |
| SolarEdge Technologies, Inc. (b) | 217,900 | 4,277 | |
| SunEdison, Inc. (a)(b) | 245,000 | 782 | |
| 116,471 | |||
| Software - 4.7% | |||
| Adobe Systems, Inc. (a) | 119,300 | 10,911 | |
| Electronic Arts, Inc.(a) | 121,400 | 8,230 | |
| Fortinet, Inc. (a) | 47,600 | 1,715 | |
| Interactive Intelligence Group, Inc. (a) | 189,200 | 6,520 | |
| Microsoft Corp. | 935,900 | 50,866 | |
| Oracle Corp. | 90,600 | 3,531 | |
| Red Hat, Inc. (a) | 43,830 | 3,568 | |
| Salesforce.com, Inc. (a) | 765,700 | 61,019 | |
| ServiceNow, Inc. (a) | 126,200 | 10,981 | |
| Workday, Inc. Class A (a) | 65,200 | 5,458 | |
| 162,799 | |||
| Technology Hardware, Storage & Peripherals - 7.6% | |||
| Apple, Inc. | 2,017,706 | 238,689 | |
| Electronics for Imaging, Inc. (a) | 352,400 | 17,296 | |
| Nimble Storage, Inc. (a)(b) | 477,400 | 4,998 | |
| Pure Storage, Inc. Class A (a) | 31,100 | 402 | |
| 261,385 | |||
| TOTAL INFORMATION TECHNOLOGY | 1,312,737 | ||
| MATERIALS - 3.5% | |||
| Chemicals - 3.0% | |||
| E.I. du Pont de Nemours & Co. | 123,700 | 8,330 | |
| Ecolab, Inc. | 29,300 | 3,491 | |
| LyondellBasell Industries NV Class A | 535,800 | 51,340 | |
| PPG Industries, Inc. | 262,900 | 27,799 | |
| The Chemours Co. LLC | 19,160 | 120 | |
| The Dow Chemical Co. | 235,700 | 12,287 | |
| 103,367 | |||
| Containers & Packaging - 0.5% | |||
| Sealed Air Corp. | 334,700 | 15,182 | |
| TOTAL MATERIALS | 118,549 | ||
| TELECOMMUNICATION SERVICES - 1.4% | |||
| Diversified Telecommunication Services - 0.2% | |||
| Verizon Communications, Inc. | 147,300 | 6,695 | |
| Wireless Telecommunication Services - 1.2% | |||
| SBA Communications Corp. Class A (a) | 117,500 | 12,356 | |
| T-Mobile U.S., Inc. (a) | 840,500 | 29,838 | |
| 42,194 | |||
| TOTAL TELECOMMUNICATION SERVICES | 48,889 | ||
| UTILITIES - 0.0% | |||
| Independent Power and Renewable Electricity Producers - 0.0% | |||
| Terraform Power, Inc. (b) | 145,700 | 1,005 | |
| TOTAL COMMON STOCKS | |||
| (Cost $2,296,893) | 3,406,862 | ||
| Convertible Preferred Stocks - 0.8% | |||
| CONSUMER STAPLES - 0.2% | |||
| Food & Staples Retailing - 0.1% | |||
| Blue Apron, Inc. Series D (d) | 217,605 | 2,900 | |
| Tobacco - 0.1% | |||
| PAX Labs, Inc. Series C (d) | 1,069,313 | 4,128 | |
| TOTAL CONSUMER STAPLES | 7,028 | ||
| FINANCIALS - 0.2% | |||
| Real Estate Management & Development - 0.2% | |||
| Redfin Corp. Series G (d) | 1,081,736 | 4,067 | |
| INFORMATION TECHNOLOGY - 0.4% | |||
| Internet Software & Services - 0.2% | |||
| Uber Technologies, Inc. Series D, 8.00% (a)(d) | 221,104 | 8,765 | |
| Software - 0.2% | |||
| Cloudera, Inc. Series F (a)(d) | 41,786 | 1,372 | |
| MongoDB, Inc. Series F, 8.00% (a)(d) | 515,124 | 4,008 | |
| 5,380 | |||
| TOTAL INFORMATION TECHNOLOGY | 14,145 | ||
| TOTAL CONVERTIBLE PREFERRED STOCKS | |||
| (Cost $23,237) | 25,240 | ||
| Money Market Funds - 5.6% | |||
| Fidelity Cash Central Fund, 0.18% (e) | 10,486,486 | 10,486 | |
| Fidelity Securities Lending Cash Central Fund, 0.22% (e)(f) | 182,358,373 | 182,358 | |
| TOTAL MONEY MARKET FUNDS | |||
| (Cost $192,844) | 192,844 | ||
| TOTAL INVESTMENT PORTFOLIO - 105.6% | |||
| (Cost $2,512,974) | 3,624,946 | ||
| NET OTHER ASSETS (LIABILITIES) - (5.6)% | (190,651) | ||
| NET ASSETS - 100% | $3,434,295 |
Legend
(a) Non-income producing
(b) Security or a portion of the security is on loan at period end.
(c) Security exempt from registration under Rule 144A of the Securities Act of 1933. These securities may be resold in transactions exempt from registration, normally to qualified institutional buyers. At the end of the period, the value of these securities amounted to $1,063,000 or 0.0% of net assets.
(d) Restricted securities - Investment in securities not registered under the Securities Act of 1933 (excluding 144A issues). At the end of the period, the value of restricted securities (excluding 144A issues) amounted to $25,240,000 or 0.7% of net assets.
(e) Affiliated fund that is generally available only to investment companies and other accounts managed by Fidelity Investments. The rate quoted is the annualized seven-day yield of the fund at period end. A complete unaudited listing of the fund's holdings as of its most recent quarter end is available upon request. In addition, each Fidelity Central Fund's financial statements, which are not covered by the Fund's Report of Independent Registered Public Accounting Firm, are available on the SEC's website or upon request.
(f) Investment made with cash collateral received from securities on loan.
Additional information on each restricted holding is as follows:
| Security | Acquisition Date | Acquisition Cost (000s) |
| Blue Apron, Inc. Series D | 5/18/15 | $2,900 |
| Cloudera, Inc. Series F | 2/5/14 | $608 |
| MongoDB, Inc. Series F, 8.00% | 10/2/13 | $8,615 |
| PAX Labs, Inc. Series C | 5/22/15 | $4,117 |
| Redfin Corp. Series G | 12/16/14 | $3,567 |
| Uber Technologies, Inc. Series D, 8.00% | 6/6/14 | $3,430 |
Affiliated Central Funds
Information regarding fiscal year to date income earned by the Fund from investments in Fidelity Central Funds is as follows:
| Fund | Income earned |
| (Amounts in thousands) | |
| Fidelity Cash Central Fund | $35 |
| Fidelity Securities Lending Cash Central Fund | 882 |
| Total | $917 |
Investment Valuation
The following is a summary of the inputs used, as of November 30, 2015, involving the Fund's assets and liabilities carried at fair value. The inputs or methodology used for valuing securities may not be an indication of the risk associated with investing in those securities. For more information on valuation inputs, and their aggregation into the levels used below, please refer to the Investment Valuation section in the accompanying Notes to Financial Statements.
| Valuation Inputs at Reporting Date: | ||||
| Description | Total | Level 1 | Level 2 | Level 3 |
| (Amounts in thousands) | ||||
| Investments in Securities: | ||||
| Equities: | ||||
| Consumer Discretionary | $583,651 | $583,651 | $-- | $-- |
| Consumer Staples | 209,322 | 195,430 | 6,864 | 7,028 |
| Energy | 39,274 | 39,274 | -- | -- |
| Financials | 186,345 | 182,278 | -- | 4,067 |
| Health Care | 632,352 | 632,352 | -- | -- |
| Industrials | 285,833 | 285,833 | -- | -- |
| Information Technology | 1,326,882 | 1,312,737 | -- | 14,145 |
| Materials | 118,549 | 118,549 | -- | -- |
| Telecommunication Services | 48,889 | 48,889 | -- | -- |
| Utilities | 1,005 | 1,005 | -- | -- |
| Money Market Funds | 192,844 | 192,844 | -- | -- |
| Total Investments in Securities: | $3,624,946 | $3,592,842 | $6,864 | $25,240 |
Other Information
Distribution of investments by country or territory of incorporation, as a percentage of Total Net Assets, is as follows (Unaudited):
| United States of America | 89.4% |
| Ireland | 2.4% |
| Netherlands | 2.3% |
| Israel | 1.5% |
| Cayman Islands | 1.2% |
| Others (Individually Less Than 1%) | 3.2% |
| 100.0% |
See accompanying notes which are an integral part of the financial statements.
Financial Statements
Statement of Assets and Liabilities
| Amounts in thousands (except per-share amounts) | November 30, 2015 | |
| Assets | ||
| Investment in securities, at value (including securities loaned of $177,242) — See accompanying schedule: Unaffiliated issuers (cost $2,320,130) | $3,432,102 | |
| Fidelity Central Funds (cost $192,844) | 192,844 | |
| Total Investments (cost $2,512,974) | $3,624,946 | |
| Receivable for investments sold | 8,550 | |
| Receivable for fund shares sold | 1,885 | |
| Dividends receivable | 2,505 | |
| Distributions receivable from Fidelity Central Funds | 134 | |
| Prepaid expenses | 8 | |
| Other receivables | 147 | |
| Total assets | 3,638,175 | |
| Liabilities | ||
| Payable for investments purchased | $8,383 | |
| Payable for fund shares redeemed | 9,798 | |
| Accrued management fee | 1,591 | |
| Distribution and service plan fees payable | 950 | |
| Other affiliated payables | 607 | |
| Other payables and accrued expenses | 193 | |
| Collateral on securities loaned, at value | 182,358 | |
| Total liabilities | 203,880 | |
| Net Assets | $3,434,295 | |
| Net Assets consist of: | ||
| Paid in capital | $1,961,636 | |
| Accumulated net investment loss | (4,687) | |
| Accumulated undistributed net realized gain (loss) on investments and foreign currency transactions | 365,375 | |
| Net unrealized appreciation (depreciation) on investments and assets and liabilities in foreign currencies | 1,111,971 | |
| Net Assets | $3,434,295 | |
| Calculation of Maximum Offering Price | ||
| Class A: | ||
| Net Asset Value and redemption price per share ($664,134 ÷ 9,931.66 shares) | $66.87 | |
| Maximum offering price per share (100/94.25 of $66.87) | $70.95 | |
| Class T: | ||
| Net Asset Value and redemption price per share ($1,461,197 ÷ 21,890.00 shares) | $66.75 | |
| Maximum offering price per share (100/96.50 of $66.75) | $69.17 | |
| Class B: | ||
| Net Asset Value and offering price per share ($5,831 ÷ 95.67 shares)(a) | $60.95 | |
| Class C: | ||
| Net Asset Value and offering price per share ($237,894 ÷ 3,873.23 shares)(a) | $61.42 | |
| Class I: | ||
| Net Asset Value, offering price and redemption price per share ($1,060,642 ÷ 15,142.22 shares) | $70.05 | |
| Class Z: | ||
| Net Asset Value, offering price and redemption price per share ($4,597 ÷ 65.42 shares) | $70.27 |
(a) Redemption price per share is equal to net asset value less any applicable contingent deferred sales charge.
See accompanying notes which are an integral part of the financial statements.
Statement of Operations
| Amounts in thousands | Year ended November 30, 2015 | |
| Investment Income | ||
| Dividends | $32,275 | |
| Income from Fidelity Central Funds | 917 | |
| Total income | 33,192 | |
| Expenses | ||
| Management fee | ||
| Basic fee | $19,666 | |
| Performance adjustment | 317 | |
| Transfer agent fees | 6,720 | |
| Distribution and service plan fees | 11,405 | |
| Accounting and security lending fees | 1,039 | |
| Custodian fees and expenses | 53 | |
| Independent trustees' compensation | 16 | |
| Registration fees | 144 | |
| Audit | 65 | |
| Legal | 15 | |
| Interest | 13 | |
| Miscellaneous | 26 | |
| Total expenses before reductions | 39,479 | |
| Expense reductions | (172) | 39,307 |
| Net investment income (loss) | (6,115) | |
| Realized and Unrealized Gain (Loss) | ||
| Net realized gain (loss) on: | ||
| Investment securities: | ||
| Unaffiliated issuers | 500,027 | |
| Foreign currency transactions | 1 | |
| Total net realized gain (loss) | 500,028 | |
| Change in net unrealized appreciation (depreciation) on: Investment securities | (309,232) | |
| Total change in net unrealized appreciation (depreciation) | (309,232) | |
| Net gain (loss) | 190,796 | |
| Net increase (decrease) in net assets resulting from operations | $184,681 |
See accompanying notes which are an integral part of the financial statements.
Statement of Changes in Net Assets
| Amounts in thousands | Year ended November 30, 2015 | Year ended November 30, 2014 |
| Increase (Decrease) in Net Assets | ||
| Operations | ||
| Net investment income (loss) | $(6,115) | $(7,776) |
| Net realized gain (loss) | 500,028 | 148,379 |
| Change in net unrealized appreciation (depreciation) | (309,232) | 368,352 |
| Net increase (decrease) in net assets resulting from operations | 184,681 | 508,955 |
| Share transactions - net increase (decrease) | (483,133) | (40,304) |
| Total increase (decrease) in net assets | (298,452) | 468,651 |
| Net Assets | ||
| Beginning of period | 3,732,747 | 3,264,096 |
| End of period (including accumulated net investment loss of $4,687 and accumulated net investment loss of $3,051, respectively) | $3,434,295 | $3,732,747 |
See accompanying notes which are an integral part of the financial statements.
Financial Highlights — Fidelity Advisor Growth Opportunities Fund Class A
| November 30, | |||||
| Years ended November 30, | 2015 | 2014 | 2013 | 2012 | 2011 |
| Selected Per–Share Data | |||||
| Net asset value, beginning of period | $63.52 | $54.89 | $41.34 | $35.39 | $32.30 |
| Income from Investment Operations | |||||
| Net investment income (loss)A | (.08) | (.11) | (.10) | (.11) | (.08) |
| Net realized and unrealized gain (loss) | 3.43 | 8.74 | 13.65 | 6.06 | 3.17 |
| Total from investment operations | 3.35 | 8.63 | 13.55 | 5.95 | 3.09 |
| Net asset value, end of period | $66.87 | $63.52 | $54.89 | $41.34 | $35.39 |
| Total ReturnB,C | 5.27% | 15.72% | 32.78% | 16.81% | 9.57% |
| Ratios to Average Net AssetsD,E | |||||
| Expenses before reductions | 1.05% | 1.08% | 1.23% | 1.30% | 1.08% |
| Expenses net of fee waivers, if any | 1.05% | 1.08% | 1.23% | 1.29% | 1.08% |
| Expenses net of all reductions | 1.05% | 1.08% | 1.23% | 1.29% | 1.07% |
| Net investment income (loss) | (.12)% | (.18)% | (.20)% | (.29)% | (.23)% |
| Supplemental Data | |||||
| Net assets, end of period (in millions) | $664 | $648 | $555 | $359 | $267 |
| Portfolio turnover rateF | 51% | 13% | 17% | 34% | 31% |
A Calculated based on average shares outstanding during the period.
B Total returns would have been lower if certain expenses had not been reduced during the applicable periods shown.
C Total returns do not include the effect of the sales charges.
D Fees and expenses of any underlying Fidelity Central Funds are not included in the Fund's expense ratio. The Fund indirectly bears its proportionate share of the expenses of any underlying Fidelity Central Funds.
E Expense ratios reflect operating expenses of the class. Expenses before reductions do not reflect amounts reimbursed by the investment adviser or reductions from brokerage service arrangements or reductions from other expense offset arrangements and do not represent the amount paid by the class during periods when reimbursements or reductions occur. Expenses net of fee waivers reflect expenses after reimbursement by the investment adviser but prior to reductions from brokerage service arrangements or other expense offset arrangements. Expenses net of all reductions represent the net expenses paid by the class.
F Amount does not include the portfolio activity of any underlying Fidelity Central Funds.
See accompanying notes which are an integral part of the financial statements.
Financial Highlights — Fidelity Advisor Growth Opportunities Fund Class T
| November 30, | |||||
| Years ended November 30, | 2015 | 2014 | 2013 | 2012 | 2011 |
| Selected Per–Share Data | |||||
| Net asset value, beginning of period | $63.55 | $55.04 | $41.54 | $35.62 | $32.58 |
| Income from Investment Operations | |||||
| Net investment income (loss)A | (.23) | (.24) | (.19) | (.19) | (.15) |
| Net realized and unrealized gain (loss) | 3.43 | 8.75 | 13.69 | 6.11 | 3.19 |
| Total from investment operations | 3.20 | 8.51 | 13.50 | 5.92 | 3.04 |
| Net asset value, end of period | $66.75 | $63.55 | $55.04 | $41.54 | $35.62 |
| Total ReturnB,C | 5.04% | 15.46% | 32.50% | 16.62% | 9.33% |
| Ratios to Average Net AssetsD,E | |||||
| Expenses before reductions | 1.28% | 1.31% | 1.43% | 1.48% | 1.25% |
| Expenses net of fee waivers, if any | 1.28% | 1.31% | 1.43% | 1.48% | 1.25% |
| Expenses net of all reductions | 1.28% | 1.31% | 1.43% | 1.48% | 1.25% |
| Net investment income (loss) | (.35)% | (.40)% | (.40)% | (.48)% | (.40)% |
| Supplemental Data | |||||
| Net assets, end of period (in millions) | $1,461 | $1,504 | $1,426 | $1,187 | $1,102 |
| Portfolio turnover rateF | 51% | 13% | 17% | 34% | 31% |
A Calculated based on average shares outstanding during the period.
B Total returns would have been lower if certain expenses had not been reduced during the applicable periods shown.
C Total returns do not include the effect of the sales charges.
D Fees and expenses of any underlying Fidelity Central Funds are not included in the Fund's expense ratio. The Fund indirectly bears its proportionate share of the expenses of any underlying Fidelity Central Funds.
E Expense ratios reflect operating expenses of the class. Expenses before reductions do not reflect amounts reimbursed by the investment adviser or reductions from brokerage service arrangements or reductions from other expense offset arrangements and do not represent the amount paid by the class during periods when reimbursements or reductions occur. Expenses net of fee waivers reflect expenses after reimbursement by the investment adviser but prior to reductions from brokerage service arrangements or other expense offset arrangements. Expenses net of all reductions represent the net expenses paid by the class.
F Amount does not include the portfolio activity of any underlying Fidelity Central Funds.
See accompanying notes which are an integral part of the financial statements.
Financial Highlights — Fidelity Advisor Growth Opportunities Fund Class B
| November 30, | |||||
| Years ended November 30, | 2015 | 2014 | 2013 | 2012 | 2011 |
| Selected Per–Share Data | |||||
| Net asset value, beginning of period | $58.39 | $50.87 | $38.62 | $33.31 | $30.64 |
| Income from Investment Operations | |||||
| Net investment income (loss)A | (.58) | (.55) | (.44) | (.39) | (.33) |
| Net realized and unrealized gain (loss) | 3.14 | 8.07 | 12.69 | 5.70 | 3.00 |
| Total from investment operations | 2.56 | 7.52 | 12.25 | 5.31 | 2.67 |
| Net asset value, end of period | $60.95 | $58.39 | $50.87 | $38.62 | $33.31 |
| Total ReturnB,C | 4.38% | 14.78% | 31.72% | 15.94% | 8.71% |
| Ratios to Average Net AssetsD,E | |||||
| Expenses before reductions | 1.90% | 1.92% | 2.03% | 2.07% | 1.83% |
| Expenses net of fee waivers, if any | 1.90% | 1.92% | 2.03% | 2.05% | 1.83% |
| Expenses net of all reductions | 1.90% | 1.92% | 2.03% | 2.05% | 1.83% |
| Net investment income (loss) | (.97)% | (1.02)% | (1.00)% | (1.05)% | (.98)% |
| Supplemental Data | |||||
| Net assets, end of period (in millions) | $6 | $9 | $12 | $13 | $14 |
| Portfolio turnover rateF | 51% | 13% | 17% | 34% | 31% |
A Calculated based on average shares outstanding during the period.
B Total returns would have been lower if certain expenses had not been reduced during the applicable periods shown.
C Total returns do not include the effect of the contingent deferred sales charge.
D Fees and expenses of any underlying Fidelity Central Funds are not included in the Fund's expense ratio. The Fund indirectly bears its proportionate share of the expenses of any underlying Fidelity Central Funds.
E Expense ratios reflect operating expenses of the class. Expenses before reductions do not reflect amounts reimbursed by the investment adviser or reductions from brokerage service arrangements or reductions from other expense offset arrangements and do not represent the amount paid by the class during periods when reimbursements or reductions occur. Expenses net of fee waivers reflect expenses after reimbursement by the investment adviser but prior to reductions from brokerage service arrangements or other expense offset arrangements. Expenses net of all reductions represent the net expenses paid by the class.
F Amount does not include the portfolio activity of any underlying Fidelity Central Funds.
See accompanying notes which are an integral part of the financial statements.
Financial Highlights — Fidelity Advisor Growth Opportunities Fund Class C
| November 30, | |||||
| Years ended November 30, | 2015 | 2014 | 2013 | 2012 | 2011 |
| Selected Per–Share Data | |||||
| Net asset value, beginning of period | $58.78 | $51.17 | $38.83 | $33.48 | $30.79 |
| Income from Investment Operations | |||||
| Net investment income (loss)A | (.52) | (.50) | (.42) | (.38) | (.33) |
| Net realized and unrealized gain (loss) | 3.16 | 8.11 | 12.76 | 5.73 | 3.02 |
| Total from investment operations | 2.64 | 7.61 | 12.34 | 5.35 | 2.69 |
| Net asset value, end of period | $61.42 | $58.78 | $51.17 | $38.83 | $33.48 |
| Total ReturnB,C | 4.49% | 14.87% | 31.78% | 15.98% | 8.74% |
| Ratios to Average Net AssetsD,E | |||||
| Expenses before reductions | 1.80% | 1.83% | 1.96% | 2.04% | 1.82% |
| Expenses net of fee waivers, if any | 1.80% | 1.83% | 1.96% | 2.03% | 1.82% |
| Expenses net of all reductions | 1.80% | 1.83% | 1.96% | 2.02% | 1.82% |
| Net investment income (loss) | (.87)% | (.93)% | (.93)% | (1.02)% | (.97)% |
| Supplemental Data | |||||
| Net assets, end of period (in millions) | $238 | $212 | $159 | $71 | $47 |
| Portfolio turnover rateF | 51% | 13% | 17% | 34% | 31% |
A Calculated based on average shares outstanding during the period.
B Total returns would have been lower if certain expenses had not been reduced during the applicable periods shown.
C Total returns do not include the effect of the contingent deferred sales charge.
D Fees and expenses of any underlying Fidelity Central Funds are not included in the Fund's expense ratio. The Fund indirectly bears its proportionate share of the expenses of any underlying Fidelity Central Funds.
E Expense ratios reflect operating expenses of the class. Expenses before reductions do not reflect amounts reimbursed by the investment adviser or reductions from brokerage service arrangements or reductions from other expense offset arrangements and do not represent the amount paid by the class during periods when reimbursements or reductions occur. Expenses net of fee waivers reflect expenses after reimbursement by the investment adviser but prior to reductions from brokerage service arrangements or other expense offset arrangements. Expenses net of all reductions represent the net expenses paid by the class.
F Amount does not include the portfolio activity of any underlying Fidelity Central Funds.
See accompanying notes which are an integral part of the financial statements.
Financial Highlights — Fidelity Advisor Growth Opportunities Fund Class I
| November 30, | |||||
| Years ended November 30, | 2015 | 2014 | 2013 | 2012 | 2011 |
| Selected Per–Share Data | |||||
| Net asset value, beginning of period | $66.35 | $57.18 | $42.94 | $36.63 | $33.33 |
| Income from Investment Operations | |||||
| Net investment income (loss)A | .11 | .05 | .05 | .01 | .05 |
| Net realized and unrealized gain (loss) | 3.59 | 9.12 | 14.19 | 6.30 | 3.25 |
| Total from investment operations | 3.70 | 9.17 | 14.24 | 6.31 | 3.30 |
| Net asset value, end of period | $70.05 | $66.35 | $57.18 | $42.94 | $36.63 |
| Total ReturnB | 5.58% | 16.04% | 33.16% | 17.23% | 9.90% |
| Ratios to Average Net AssetsC,D | |||||
| Expenses before reductions | .77% | .81% | .93% | .97% | .72% |
| Expenses net of fee waivers, if any | .77% | .81% | .93% | .97% | .72% |
| Expenses net of all reductions | .77% | .81% | .93% | .97% | .72% |
| Net investment income (loss) | .16% | .09% | .09% | .04% | .13% |
| Supplemental Data | |||||
| Net assets, end of period (in millions) | $1,061 | $1,357 | $1,112 | $475 | $215 |
| Portfolio turnover rateE | 51% | 13% | 17% | 34% | 31% |
A Calculated based on average shares outstanding during the period.
B Total returns would have been lower if certain expenses had not been reduced during the applicable periods shown.
C Fees and expenses of any underlying Fidelity Central Funds are not included in the Fund's expense ratio. The Fund indirectly bears its proportionate share of the expenses of any underlying Fidelity Central Funds.
D Expense ratios reflect operating expenses of the class. Expenses before reductions do not reflect amounts reimbursed by the investment adviser or reductions from brokerage service arrangements or reductions from other expense offset arrangements and do not represent the amount paid by the class during periods when reimbursements or reductions occur. Expenses net of fee waivers reflect expenses after reimbursement by the investment adviser but prior to reductions from brokerage service arrangements or other expense offset arrangements. Expenses net of all reductions represent the net expenses paid by the class.
E Amount does not include the portfolio activity of any underlying Fidelity Central Funds.
See accompanying notes which are an integral part of the financial statements.
Financial Highlights — Fidelity Advisor Growth Opportunities Fund Class Z
| November 30, | |||
| Years ended November 30, | 2015 | 2014 | 2013 A |
| Selected Per–Share Data | |||
| Net asset value, beginning of period | $66.48 | $57.20 | $53.30 |
| Income from Investment Operations | |||
| Net investment income (loss)B | .20 | .14 | .02 |
| Net realized and unrealized gain (loss) | 3.59 | 9.14 | 3.88 |
| Total from investment operations | 3.79 | 9.28 | 3.90 |
| Net asset value, end of period | $70.27 | $66.48 | $57.20 |
| Total ReturnC,D | 5.70% | 16.22% | 7.32% |
| Ratios to Average Net AssetsE,F | |||
| Expenses before reductions | .64% | .67% | .78%G |
| Expenses net of fee waivers, if any | .64% | .67% | .78%G |
| Expenses net of all reductions | .64% | .67% | .78%G |
| Net investment income (loss) | .29% | .24% | .14%G |
| Supplemental Data | |||
| Net assets, end of period (000 omitted) | $4,597 | $2,955 | $107 |
| Portfolio turnover rateH | 51% | 13% | 17% |
A For the period August 13, 2013 (commencement of sale of shares) to November 30, 2013.
B Calculated based on average shares outstanding during the period.
C Total returns for periods of less than one year are not annualized.
D Total returns would have been lower if certain expenses had not been reduced during the applicable periods shown.
E Fees and expenses of any underlying Fidelity Central Funds are not included in the Fund's expense ratio. The Fund indirectly bears its proportionate share of the expenses of any underlying Fidelity Central Funds.
F Expense ratios reflect operating expenses of the class. Expenses before reductions do not reflect amounts reimbursed by the investment adviser or reductions from brokerage service arrangements or reductions from other expense offset arrangements and do not represent the amount paid by the class during periods when reimbursements or reductions occur. Expense ratios before reductions for start-up periods may not be representative of longer-term operating periods. Expenses net of fee waivers reflect expenses after reimbursement by the investment adviser but prior to reductions from brokerage service arrangements or other expense offset arrangements. Expenses net of all reductions represent the net expenses paid by the class.
G Annualized
H Amount does not include the portfolio activity of any underlying Fidelity Central Funds.
See accompanying notes which are an integral part of the financial statements.
Notes to Financial Statements
For the period ended November 30, 2015
(Amounts in thousands except percentages)
1. Organization.
Fidelity Advisor Growth Opportunities Fund (the Fund) is a fund of Fidelity Advisor Series I (the Trust) and is authorized to issue an unlimited number of shares. The Trust is registered under the Investment Company Act of 1940, as amended (the 1940 Act), as an open-end management investment company organized as a Massachusetts business trust. The Fund offers Class A, Class T, Class C, Class I (formerly Institutional Class) and Class Z shares, each of which, along with Class B shares, has equal rights as to assets and voting privileges. Class B shares are closed to new accounts and additional purchases, except for exchanges and reinvestments. Each class has exclusive voting rights with respect to matters that affect that class. Class B shares will automatically convert to Class A shares after a holding period of seven years from the initial date of purchase.
2. Investments in Fidelity Central Funds.
The Fund invests in Fidelity Central Funds, which are open-end investment companies generally available only to other investment companies and accounts managed by the investment adviser and its affiliates. The Fund's Schedule of Investments lists each of the Fidelity Central Funds held as of period end, if any, as an investment of the Fund, but does not include the underlying holdings of each Fidelity Central Fund. As an Investing Fund, the Fund indirectly bears its proportionate share of the expenses of the underlying Fidelity Central Funds.
The Money Market Central Funds seek preservation of capital and current income and are managed by Fidelity Investments Money Management, Inc. (FIMM), an affiliate of the investment adviser. Annualized expenses of the Money Market Central Funds as of their most recent shareholder report date are less than .01%.
A complete unaudited list of holdings for each Fidelity Central Fund is available upon request or at the Securities and Exchange Commission (the SEC) website at www.sec.gov. In addition, the financial statements of the Fidelity Central Funds, which are not covered by the Fund's Report of Independent Registered Public Accounting Firm, are available on the SEC website or upon request.
3. Significant Accounting Policies.
The financial statements have been prepared in conformity with accounting principles generally accepted in the United States of America (GAAP), which require management to make certain estimates and assumptions at the date of the financial statements. Actual results could differ from those estimates. Subsequent events, if any, through the date that the financial statements were issued have been evaluated in the preparation of the financial statements. The following summarizes the significant accounting policies of the Fund:
Investment Valuation. Investments are valued as of 4:00 p.m. Eastern time on the last calendar day of the period. The Board of Trustees (the Board) has delegated the day to day responsibility for the valuation of the Fund's investments to the Fidelity Management & Research Company (FMR) Fair Value Committee (the Committee). In accordance with valuation policies and procedures approved by the Board, the Fund attempts to obtain prices from one or more third party pricing vendors or brokers to value its investments. When current market prices, quotations or currency exchange rates are not readily available or reliable, investments will be fair valued in good faith by the Committee, in accordance with procedures adopted by the Board. Factors used in determining fair value vary by investment type and may include market or investment specific events. The frequency with which these procedures are used cannot be predicted and they may be utilized to a significant extent. The Committee oversees the Fund's valuation policies and procedures and reports to the Board on the Committee's activities and fair value determinations. The Board monitors the appropriateness of the procedures used in valuing the Fund's investments and ratifies the fair value determinations of the Committee.
The Fund categorizes the inputs to valuation techniques used to value its investments into a disclosure hierarchy consisting of three levels as shown below:
- Level 1 – quoted prices in active markets for identical investments
- Level 2 – other significant observable inputs (including quoted prices for similar investments, interest rates, prepayment speeds, etc.)
- Level 3 – unobservable inputs (including the Fund's own assumptions based on the best information available)
Valuation techniques used to value the Fund's investments by major category are as follows:
Equity securities, including restricted securities, for which market quotations are readily available, are valued at the last reported sale price or official closing price as reported by a third party pricing vendor on the primary market or exchange on which they are traded and are categorized as Level 1 in the hierarchy. In the event there were no sales during the day or closing prices are not available, securities are valued at the last quoted bid price or may be valued using the last available price and are generally categorized as Level 2 in the hierarchy. For foreign equity securities, when market or security specific events arise, comparisons to the valuation of American Depositary Receipts (ADRs), futures contracts, Exchange-Traded Funds (ETFs) and certain indexes as well as quoted prices for similar securities may be used and would be categorized as Level 2 in the hierarchy. Utilizing these techniques may result in transfers between Level 1 and Level 2. For equity securities, including restricted securities, where observable inputs are limited, assumptions about market activity and risk are used and these securities may be categorized as Level 3 in the hierarchy.
Investments in open-end mutual funds, including the Fidelity Central Funds, are valued at their closing net asset value (NAV) each business day and are categorized as Level 1 in the hierarchy.
Changes in valuation techniques may result in transfers in or out of an assigned level within the disclosure hierarchy. The aggregate value of investments by input level as of November 30, 2015 is included at the end of the each Fund's Schedule of Investments.
Foreign Currency. The Fund may use foreign currency contracts to facilitate transactions in foreign-denominated securities. Gains and losses from these transactions may arise from changes in the value of the foreign currency or if the counterparties do not perform under the contracts' terms.
Foreign-denominated assets, including investment securities, and liabilities are translated into U.S. dollars at the exchange rates at period end. Purchases and sales of investment securities, income and dividends received and expenses denominated in foreign currencies are translated into U.S. dollars at the exchange rate in effect on the transaction date.
The effects of exchange rate fluctuations on investments are included with the net realized and unrealized gain (loss) on investment securities. Other foreign currency transactions resulting in realized and unrealized gain (loss) are disclosed separately.
Investment Transactions and Income. For financial reporting purposes, the Fund's investment holdings and NAV include trades executed through the end of the last business day of the period. The NAV per share for processing shareholder transactions is calculated as of the close of business of the New York Stock Exchange (NYSE), normally 4:00 p.m. Eastern time and includes trades executed through the end of the prior business day. Gains and losses on securities sold are determined on the basis of identified cost and may include proceeds received from litigation. Dividend income is recorded on the ex-dividend date, except for certain dividends from foreign securities where the ex-dividend date may have passed, which are recorded as soon as the Fund is informed of the ex-dividend date. Non-cash dividends included in dividend income, if any, are recorded at the fair market value of the securities received. Income and capital gain distributions from Fidelity Central Funds, if any, are recorded on the ex-dividend date. Distributions received on securities that represent a return of capital or capital gain are recorded as a reduction of cost of investments and/or as a realized gain. Subsequent to ex-dividend date the Fund determines the components of these distributions, based upon receipt of tax filings or other correspondence relating to the underlying investment. Interest income is accrued as earned and includes coupon interest and amortization of premium and accretion of discount on debt securities as applicable. Investment income is recorded net of foreign taxes withheld where recovery of such taxes is uncertain.
Class Allocations and Expenses. Investment income, realized and unrealized capital gains and losses, common expenses of the Fund, and certain fund-level expense reductions, if any, are allocated daily on a pro-rata basis to each class based on the relative net assets of each class to the total net assets of the Fund. Each class differs with respect to transfer agent and distribution and service plan fees incurred. Certain expense reductions may also differ by class. For the reporting period, the allocated portion of income and expenses to each class as a percent of its average net assets may vary due to the timing of recording these transactions in relation to fluctuating net assets of the classes. Expenses directly attributable to a fund are charged to that fund. Expenses attributable to more than one fund are allocated among the respective funds on the basis of relative net assets or other appropriate methods. Expense estimates are accrued in the period to which they relate and adjustments are made when actual amounts are known.
Deferred Trustee Compensation. Under a Deferred Compensation Plan (the Plan), independent Trustees may elect to defer receipt of a portion of their annual compensation. Deferred amounts are invested in a cross-section of Fidelity funds, are marked-to-market and remain in the Fund until distributed in accordance with the Plan. The investment of deferred amounts and the offsetting payable to the Trustees are included in the accompanying Statement of Assets and Liabilities.
Income Tax Information and Distributions to Shareholders. Each year, the Fund intends to qualify as a regulated investment company under Subchapter M of the Internal Revenue Code, including distributing substantially all of its taxable income and realized gains. As a result, no provision for U.S. Federal income taxes is required. As of November 30, 2015, the Fund did not have any unrecognized tax benefits in the financial statements; nor is the Fund aware of any tax positions for which it is reasonably possible that the total amounts of unrecognized tax benefits will significantly change in the next twelve months. The Fund files a U.S. federal tax return, in addition to state and local tax returns as required. The Fund's federal income tax returns are subject to examination by the Internal Revenue Service (IRS) for a period of three fiscal years after they are filed. State and local tax returns may be subject to examination for an additional fiscal year depending on the jurisdiction. Foreign taxes are provided for based on the Fund's understanding of the tax rules and rates that exist in the foreign markets in which it invests.
Distributions are declared and recorded on the ex-dividend date. Income dividends and capital gain distributions are declared separately for each class. Income and capital gain distributions are determined in accordance with income tax regulations, which may differ from GAAP. In addition, the Fund claimed a portion of the payment made to redeeming shareholders as a distribution for income tax purposes.
Capital accounts within the financial statements are adjusted for permanent book-tax differences. These adjustments have no impact on net assets or the results of operations. Capital accounts are not adjusted for temporary book-tax differences which will reverse in a subsequent period.
Book-tax differences are primarily due to foreign currency transactions, partnerships, passive foreign investment companies (PFIC), deferred trustees compensation, net operating losses, capital loss carryforwards and losses deferred due to wash sales and excise tax regulations.
The federal tax cost of investment securities and unrealized appreciation (depreciation) as of period end were as follows:
| Gross unrealized appreciation | $1,210,982 |
| Gross unrealized depreciation | (105,168) |
| Net unrealized appreciation (depreciation) on securities | $1,105,814 |
| Tax Cost | $2,519,132 |
The tax-based components of distributable earnings as of period end were as follows:
| Undistributed long-term capital gain | $371,533 |
| Net unrealized appreciation (depreciation) on securities and other investments | $1,105,813 |
Restricted Securities. The Fund may invest in securities that are subject to legal or contractual restrictions on resale. These securities generally may be resold in transactions exempt from registration or to the public if the securities are registered. Disposal of these securities may involve time-consuming negotiations and expense, and prompt sale at an acceptable price may be difficult. Information regarding restricted securities is included at the end of the Fund's Schedule of Investments.
4. Purchases and Sales of Investments.
Purchases and sales of securities, other than short-term securities, aggregated $1,801,736 and $2,284,611, respectively.
5. Fees and Other Transactions with Affiliates.
Management Fee. Fidelity Management & Research Company (the investment adviser) and its affiliates provide the Fund with investment management related services for which the Fund pays a monthly management fee. The management fee is the sum of an individual fund fee rate that is based on an annual rate of .30% of the Fund's average net assets and an annualized group fee rate that averaged .25% during the period. The group fee rate is based upon the average net assets of all the mutual funds advised by the investment adviser, including any mutual funds previously advised by the investment adviser that are currently advised by Fidelity SelectCo, LLC, an affiliate of the investment adviser. The group fee rate decreases as assets under management increase and increases as assets under management decrease. In addition, the management fee is subject to a performance adjustment (up to a maximum of +/- .20% of the Fund's average net assets over a 36 month performance period). The upward or downward adjustment to the management fee is based on the investment performance of the asset-weighted return of all classes as compared to its benchmark index, the Russell 1000 Growth Index, over the same 36 month performance period. For the reporting period, the total annual management fee rate, including the performance adjustment, was .56% of the Fund's average net assets. The performance adjustment included in the management fee rate may be higher or lower than the maximum performance adjustment rate due to the difference between the average net assets for the reporting and performance periods.
Distribution and Service Plan Fees. In accordance with Rule 12b-1 of the 1940 Act, the Fund has adopted separate Distribution and Service Plans for each class of shares. Certain classes pay Fidelity Distributors Corporation (FDC), an affiliate of the investment adviser, separate Distribution and Service Fees, each of which is based on an annual percentage of each class' average net assets. In addition, FDC may pay financial intermediaries for selling shares of the Fund and providing shareholder support services. For the period, the Distribution and Service Fee rates, total fees and amounts retained by FDC were as follows:
| Distribution Fee | Service Fee | Total Fees | Retained by FDC | |
| Class A | -% | .25% | $1,638 | $28 |
| Class T | .25% | .25% | 7,406 | 18 |
| Class B | .75% | .25% | 71 | 53 |
| Class C | .75% | .25% | 2,290 | 401 |
| $11,405 | $500 |
Sales Load. FDC may receive a front-end sales charge of up to 5.75% for selling Class A shares and 3.50% for selling Class T shares, some of which is paid to financial intermediaries for selling shares of the Fund. Depending on the holding period, FDC may receive contingent deferred sales charges levied on Class A, Class T, Class B, and Class C redemptions. The deferred sales charges range from 5.00% to 1.00% for Class B shares, 1.00% for Class C shares, 1.00% for certain purchases of Class A shares and .25% for certain purchases of Class T shares.
For the period, sales charge amounts retained by FDC were as follows:
| Retained by FDC | |
| Class A | $145 |
| Class T | 44 |
| Class B(a) | 2 |
| Class C(a) | 19 |
| $210 |
(a) When Class B and Class C shares are initially sold, FDC pays commissions from its own resources to financial intermediaries through which the sales are made.
Transfer Agent Fees. Fidelity Investments Institutional Operations Company, Inc., (FIIOC), an affiliate of the investment adviser, is the transfer, dividend disbursing and shareholder servicing agent for each class of the Fund. FIIOC receives account fees and asset-based fees that vary according to the account size and type of account of the shareholders of the respective classes of the Fund, except for Class Z. FIIOC pays for typesetting, printing and mailing of shareholder reports, except proxy statements.
For the period, transfer agent fees for each applicable class were as follows:
| Amount | % of Class-Level Average Net Assets | |
| Class A | $1,357 | .21 |
| Class T | 2,743 | .19 |
| Class B | 21 | .30 |
| Class C | 466 | .20 |
| Class I | 2,132 | .18 |
| Class Z | 1 | .05 |
| $6,720 |
Accounting and Security Lending Fees. Fidelity Service Company, Inc. (FSC), an affiliate of the investment adviser, maintains the Fund's accounting records. The accounting fee is based on the level of average net assets for each month. Under a separate contract, FSC administers the security lending program. The security lending fee is based on the number and duration of lending transactions.
Brokerage Commissions. The Fund placed a portion of its portfolio transactions with brokerage firms which are affiliates of the investment adviser. Brokerage commissions are included in net realized gain (loss) and change in net unrealized appreciation (depreciation) in the Statement of Operations. The commissions paid to these affiliated firms were $50 for the period.
Interfund Lending Program. Pursuant to an Exemptive Order issued by the SEC, the Fund, along with other registered investment companies having management contracts with FMR or other affiliated entities of FMR, may participate in an interfund lending program. This program provides an alternative credit facility allowing the funds to borrow from, or lend money to, other participating affiliated funds. The Fund's activity in this program during the period for which loans were outstanding was as follows:
| Borrower or Lender | Average Loan Balance | Weighted Average Interest Rate | Interest Expense |
| Borrower | $43,534 | .35% | $13 |
6. Committed Line of Credit.
The Fund participates with other funds managed by the investment adviser or an affiliate in a $4.25 billion credit facility (the "line of credit") to be utilized for temporary or emergency purposes to fund shareholder redemptions or for other short-term liquidity purposes. The Fund has agreed to pay commitment fees on its pro-rata portion of the line of credit, which amounted to $5 and is reflected in Miscellaneous expenses on the Statement of Operations. During the period, the Fund did not borrow on this line of credit.
7. Security Lending.
The Fund lends portfolio securities through a lending agent from time to time in order to earn additional income. For equity securities, a lending agent is used and may loan securities to certain qualified borrowers, including Fidelity Capital Markets (FCM), a broker-dealer affiliated with the Fund. On the settlement date of the loan, the Fund receives collateral (in the form of U.S. Treasury obligations, letters of credit and/or cash) against the loaned securities and maintains collateral in an amount not less than 100% of the market value of the loaned securities during the period of the loan. The market value of the loaned securities is determined at the close of business of the Fund and any additional required collateral is delivered to the Fund on the next business day. The Fund or borrower may terminate the loan at any time, and if the borrower defaults on its obligation to return the securities loaned because of insolvency or other reasons, the Fund may apply collateral received from the borrower against the obligation. The Fund may experience delays and costs in recovering the securities loaned. Any cash collateral received is invested in the Fidelity Securities Lending Cash Central Fund. The value of loaned securities and cash collateral at period end are disclosed on the Fund's Statement of Assets and Liabilities. The value of securities loaned to FCM at period end was $5,403. Security lending income represents the income earned on investing cash collateral, less rebates paid to borrowers and any lending agent fees associated with the loan, plus any premium payments received for lending certain types of securities. Security lending income is presented in the Statement of Operations as a component of income from Fidelity Central Funds. Total security lending income during the period amounted to $882, including $26 from securities loaned to FCM.
8. Expense Reductions.
Commissions paid to certain brokers with whom the investment adviser, or its affiliates, places trades on behalf of the Fund include an amount in addition to trade execution, which may be rebated back to the Fund to offset certain expenses. This amount totaled $84 for the period.
In addition, during the period the investment adviser reimbursed and/or waived a portion of fund-level operating expenses in the amount of $14 and a portion of class-level operating expenses as follows:
| Amount | |
| Class A | $13 |
| Class T | 32 |
| Class B | -* |
| Class C | 4 |
| Class I | 25 |
| $74 |
* In the amount of less than five hundred dollars.
9. Share Transactions.
Share transactions for each class were as follows and may contain automatic conversions between classes or exchanges between funds:
| Shares | Shares | Dollars | Dollars | |
| Years ended November 30, | 2015 | 2014 | 2015 | 2014 |
| Class A | ||||
| Shares sold | 2,042 | 3,210 | $132,799 | $185,879 |
| Shares redeemed | (2,310) | (3,125) | (150,069) | (181,042) |
| Net increase (decrease) | (268) | 85 | $(17,270) | $4,837 |
| Class T | ||||
| Shares sold | 2,048 | 2,463 | $132,934 | $142,596 |
| Shares redeemed | (3,816) | (4,710) | (247,857) | (273,249) |
| Net increase (decrease) | (1,768) | (2,247) | $(114,923) | $(130,653) |
| Class B | ||||
| Shares sold | 8 | 9 | $496 | $456 |
| Shares redeemed | (60) | (101) | (3,572) | (5,359) |
| Net increase (decrease) | (52) | (92) | $(3,076) | $(4,903) |
| Class C | ||||
| Shares sold | 976 | 1,386 | $58,121 | $74,498 |
| Shares redeemed | (715) | (882) | (42,885) | (47,157) |
| Net increase (decrease) | 261 | 504 | $15,236 | $27,341 |
| Class I | ||||
| Shares sold | 3,352 | 6,174 | $227,344 | $372,705 |
| Shares redeemed | (8,670) | (5,157) | (591,814) | (312,379) |
| Net increase (decrease) | (5,318) | 1,017 | $(364,470) | $60,326 |
| Class Z | ||||
| Shares sold | 30 | 43 | $1,991 | $2,754 |
| Shares redeemed | (9) | -* | (621) | (6) |
| Net increase (decrease) | 21 | 43 | $1,370 | $2,748 |
* In the amount of less than 500 shares.
10. Other.
The Fund's organizational documents provide former and current trustees and officers with a limited indemnification against liabilities arising in connection with the performance of their duties to the Fund. In the normal course of business, the Fund may also enter into contracts that provide general indemnifications. The Fund's maximum exposure under these arrangements is unknown as this would be dependent on future claims that may be made against the Fund. The risk of material loss from such claims is considered remote.
Report of Independent Registered Public Accounting Firm
To the Trustees of Fidelity Advisor Series I and Shareholders of Fidelity Advisor® Growth Opportunities Fund:
We have audited the accompanying statement of assets and liabilities of Fidelity Advisor® Growth Opportunities Fund (the Fund), a fund of Fidelity Advisor Series I, including the schedule of investments, as of November 30, 2015, and the related statement of operations for the year then ended, the statement of changes in net assets for each of the two years in the period then ended, and the financial highlights for each of the five years in the period then ended. These financial statements and financial highlights are the responsibility of the Fund's management. Our responsibility is to express an opinion on these financial statements and financial highlights based on our audits.
We conducted our audits in accordance with the standards of the Public Company Accounting Oversight Board (United States). Those standards require that we plan and perform the audit to obtain reasonable assurance about whether the financial statements and financial highlights are free of material misstatement. The Fund is not required to have, nor were we engaged to perform, an audit of its internal control over financial reporting. Our audits included consideration of internal control over financial reporting as a basis for designing audit procedures that are appropriate in the circumstances, but not for the purpose of expressing an opinion on the effectiveness of the Fund's internal control over financial reporting. Accordingly, we express no such opinion. An audit also includes examining, on a test basis, evidence supporting the amounts and disclosures in the financial statements, assessing the accounting principles used and significant estimates made by management, as well as evaluating the overall financial statement presentation. Our procedures included confirmation of securities owned as of November 30, 2015, by correspondence with the custodians and brokers; when replies were not received from brokers, we performed other auditing procedures. We believe that our audits provide a reasonable basis for our opinion.
In our opinion, such financial statements and financial highlights referred to above present fairly, in all material respects, the financial position of Fidelity Advisor® Growth Opportunities Fund as of November 30, 2015, the results of its operations for the year then ended, the changes in its net assets for each of the two years in the period then ended, and the financial highlights for each of the five years in the period then ended, in conformity with accounting principles generally accepted in the United States of America.
DELOITTE & TOUCHE LLP
Boston, Massachusetts
January 14, 2016
Trustees and Officers
The Trustees, Members of the Advisory Board (if any), and officers of the trust and fund, as applicable, are listed below. The Board of Trustees governs the fund and is responsible for protecting the interests of shareholders. The Trustees are experienced executives who meet periodically throughout the year to oversee the fund's activities, review contractual arrangements with companies that provide services to the fund, oversee management of the risks associated with such activities and contractual arrangements, and review the fund's performance. Each of the Trustees oversees 170 funds.
The Trustees hold office without limit in time except that (a) any Trustee may resign; (b) any Trustee may be removed by written instrument, signed by at least two-thirds of the number of Trustees prior to such removal; (c) any Trustee who requests to be retired or who has become incapacitated by illness or injury may be retired by written instrument signed by a majority of the other Trustees; and (d) any Trustee may be removed at any special meeting of shareholders by a two-thirds vote of the outstanding voting securities of the trust. Each Trustee who is not an interested person (as defined in the 1940 Act) of the trust and the fund is referred to herein as an Independent Trustee. Each Independent Trustee shall retire not later than the last day of the calendar year in which his or her 75th birthday occurs. The Independent Trustees may waive this mandatory retirement age policy with respect to individual Trustees. Officers and Advisory Board Members hold office without limit in time, except that any officer or Advisory Board Member may resign or may be removed by a vote of a majority of the Trustees at any regular meeting or any special meeting of the Trustees. Except as indicated, each individual has held the office shown or other offices in the same company for the past five years.
The fund’s Statement of Additional Information (SAI) includes more information about the Trustees. To request a free copy, call Fidelity at 1-877-208-0098.
Experience, Skills, Attributes, and Qualifications of the Trustees. The Governance and Nominating Committee has adopted a statement of policy that describes the experience, qualifications, attributes, and skills that are necessary and desirable for potential Independent Trustee candidates (Statement of Policy). The Board believes that each Trustee satisfied at the time he or she was initially elected or appointed a Trustee, and continues to satisfy, the standards contemplated by the Statement of Policy. The Governance and Nominating Committee also engages professional search firms to help identify potential Independent Trustee candidates who have the experience, qualifications, attributes, and skills consistent with the Statement of Policy. From time to time, additional criteria based on the composition and skills of the current Independent Trustees, as well as experience or skills that may be appropriate in light of future changes to board composition, business conditions, and regulatory or other developments, have also been considered by the professional search firms and the Governance and Nominating Committee. In addition, the Board takes into account the Trustees' commitment and participation in Board and committee meetings, as well as their leadership of standing and ad hoc committees throughout their tenure.
In determining that a particular Trustee was and continues to be qualified to serve as a Trustee, the Board has considered a variety of criteria, none of which, in isolation, was controlling. The Board believes that, collectively, the Trustees have balanced and diverse experience, qualifications, attributes, and skills, which allow the Board to operate effectively in governing the fund and protecting the interests of shareholders. Information about the specific experience, skills, attributes, and qualifications of each Trustee, which in each case led to the Board's conclusion that the Trustee should serve (or continue to serve) as a trustee of the fund, is provided below.
Board Structure and Oversight Function. James C. Curvey is an interested person and currently serves as Chairman. The Trustees have determined that an interested Chairman is appropriate and benefits shareholders because an interested Chairman has a personal and professional stake in the quality and continuity of services provided to the fund. Independent Trustees exercise their informed business judgment to appoint an individual of their choosing to serve as Chairman, regardless of whether the Trustee happens to be independent or a member of management. The Independent Trustees have determined that they can act independently and effectively without having an Independent Trustee serve as Chairman and that a key structural component for assuring that they are in a position to do so is for the Independent Trustees to constitute a substantial majority for the Board. The Independent Trustees also regularly meet in executive session. Ned C. Lautenbach serves as Chairman of the Independent Trustees and as such (i) acts as a liaison between the Independent Trustees and management with respect to matters important to the Independent Trustees and (ii) with management prepares agendas for Board meetings.
Fidelity® funds are overseen by different Boards of Trustees. The fund's Board oversees Fidelity's high income and certain equity funds, and other Boards oversee Fidelity's investment-grade bond, money market, asset allocation, and sector funds. The asset allocation funds may invest in Fidelity® funds overseen by the fund's Board. The use of separate Boards, each with its own committee structure, allows the Trustees of each group of Fidelity® funds to focus on the unique issues of the funds they oversee, including common research, investment, and operational issues. On occasion, the separate Boards establish joint committees to address issues of overlapping consequences for the Fidelity® funds overseen by each Board.
The Trustees operate using a system of committees to facilitate the timely and efficient consideration of all matters of importance to the Trustees, the fund, and fund shareholders and to facilitate compliance with legal and regulatory requirements and oversight of the fund's activities and associated risks. The Board, acting through its committees, has charged FMR and its affiliates with (i) identifying events or circumstances the occurrence of which could have demonstrably adverse effects on the fund's business and/or reputation; (ii) implementing processes and controls to lessen the possibility that such events or circumstances occur or to mitigate the effects of such events or circumstances if they do occur; and (iii) creating and maintaining a system designed to evaluate continuously business and market conditions in order to facilitate the identification and implementation processes described in (i) and (ii) above. Because the day-to-day operations and activities of the fund are carried out by or through FMR, its affiliates, and other service providers, the fund's exposure to risks is mitigated but not eliminated by the processes overseen by the Trustees. While each of the Board's committees has responsibility for overseeing different aspects of the fund's activities, oversight is exercised primarily through the Operations, Audit, and Compliance Committees. In addition, the Independent Trustees have worked with FMR to enhance the Board's oversight of investment and financial risks, legal and regulatory risks, technology risks, and operational risks, including the development of additional risk reporting to the Board. For example, a working group comprised of Independent Trustees and FMR has worked and continues to work to review the Fidelity® funds' valuation-related activities, reporting and risk management. Appropriate personnel, including but not limited to the fund's Chief Compliance Officer (CCO), FMR's internal auditor, the independent accountants, the fund's Treasurer and portfolio management personnel, make periodic reports to the Board's committees, as appropriate, including an annual review of Fidelity's risk management program for the Fidelity® funds. The responsibilities of each standing committee, including their oversight responsibilities, are described further under "Standing Committees of the Trustees."
Interested Trustees*:
Correspondence intended for a Trustee who is an interested person may be sent to Fidelity Investments, 245 Summer Street, Boston, Massachusetts 02210.
Name, Year of Birth; Principal Occupations and Other Relevant Experience+
James C. Curvey (1935)
Year of Election or Appointment: 2007
Trustee
Chairman of the Board of Trustees
Mr. Curvey also serves as Trustee of other Fidelity® funds. Mr. Curvey is a Director of Fidelity Research & Analysis Co. (investment adviser firm, 2009-present), and Vice Chairman (2007-present) and Director of FMR LLC (diversified financial services company). In addition, Mr. Curvey serves as an Overseer for the Boston Symphony Orchestra and a member of the board of Artis-Naples, Naples, Florida, and as a Trustee for Brewster Academy, Wolfeboro, New Hampshire. Previously, Mr. Curvey served as a Director of Fidelity Investments Money Management, Inc. (investment adviser firm, 2009-2014) and a Director of FMR and FMR Co., Inc. (investment adviser firms, 2007-2014).
Charles S. Morrison (1960)
Year of Election or Appointment: 2014
Trustee
Mr. Morrison also serves as Trustee of other funds. He serves as a Director of Fidelity Investments Money Management, Inc. (FIMM) (investment adviser firm, 2014-present), Director of Fidelity SelectCo, LLC (investment adviser firm, 2014-present), President, Asset Management (2014-present), and is an employee of Fidelity Investments. Previously, Mr. Morrison served as Vice President of Fidelity's Fixed Income and Asset Allocation Funds (2012-2014), President, Fixed Income (2011-2014), Vice President of Fidelity's Money Market Funds (2005-2009), President, Money Market Group Leader of FMR (investment adviser firm, 2009), and Senior Vice President, Money Market Group of FMR (2004-2009). Mr. Morrison also served as Vice President of Fidelity's Bond Funds (2002-2005), certain Balanced Funds (2002-2005), and certain Asset Allocation Funds (2002-2007), and as Senior Vice President (2002-2005) of Fidelity's Bond Division.
* Determined to be an “Interested Trustee” by virtue of, among other things, his or her affiliation with the trust or various entities under common control with FMR.
+ The information includes the Trustee's principal occupation during the last five years and other information relating to the experience, attributes, and skills relevant to the Trustee's qualifications to serve as a Trustee, which led to the conclusion that the Trustee should serve as a Trustee for the fund.
Independent Trustees:
Correspondence intended for an Independent Trustee may be sent to Fidelity Investments, P.O. Box 55235, Boston, Massachusetts 02205-5235.
Name, Year of Birth; Principal Occupations and Other Relevant Experience+
Dennis J. Dirks (1948)
Year of Election or Appointment: 2005
Trustee
Mr. Dirks also serves as Trustee of other Fidelity® funds. Prior to his retirement in May 2003, Mr. Dirks was Chief Operating Officer and a member of the Board of The Depository Trust & Clearing Corporation (DTCC). He also served as President, Chief Operating Officer, and Board member of The Depository Trust Company (DTC) and President and Board member of the National Securities Clearing Corporation (NSCC). In addition, Mr. Dirks served as Chief Executive Officer and Board member of the Government Securities Clearing Corporation, Chief Executive Officer and Board member of the Mortgage-Backed Securities Clearing Corporation, as a Trustee and a member of the Finance Committee of Manhattan College (2005-2008), as a Trustee and a member of the Finance Committee of AHRC of Nassau County (2006-2008), and as a member of the Independent Directors Council (IDC) Governing Council (2010-2015). Mr. Dirks is a member of the Board of Directors for The Brookville Center for Children's Services, Inc. (2009-present).
Alan J. Lacy (1953)
Year of Election or Appointment: 2008
Trustee
Mr. Lacy also serves as Trustee of other Fidelity® funds. Mr. Lacy serves as a member of the Board of Directors of Dave & Buster's Entertainment, Inc. (restaurant and entertainment complexes, 2010-present) and Bristol-Myers Squibb Company (global pharmaceuticals, 2008-present). In addition, Mr. Lacy served as Senior Adviser (2007-2014) of Oak Hill Capital Partners, L.P. (private equity) and also served as Chief Executive Officer (2000-2005) and Vice Chairman (2005-2006) of Sears Holdings Corporation and Sears, Roebuck and Co. (retail). Mr. Lacy is a member of the Board of Trustees of The National Parks Conservation Association (2006-present). Previously, Mr. Lacy served as Chairman of the Board of Trustees of the National Parks Conservation Association (2008-2011) and as a member of the Board of Directors for The Western Union Company (global money transfer, 2006-2011), The Hillman Companies, Inc. (hardware wholesalers, 2010-2014), and Earth Fare, Inc. (retail grocery, 2010-2014).
Ned C. Lautenbach (1944)
Year of Election or Appointment: 2000
Trustee
Chairman of the Independent Trustees
Mr. Lautenbach also serves as Trustee of other Fidelity® funds. Mr. Lautenbach currently serves as the Lead Director of the Eaton Corporation Board of Directors (diversified industrial, 1997-present). Mr. Lautenbach is Chairman of the Board of Directors of Artis-Naples in Naples, Florida (2012-present), a member of the Council on Foreign Relations (1994-present), and a member of the Board of Governors, State University System of Florida (2013-present). Previously, Mr. Lautenbach was a Partner/Advisory Partner at Clayton, Dubilier & Rice, LLC (private equity investment, 1998-2010), as well as a Director of Sony Corporation (2006-2007).
Joseph Mauriello (1944)
Year of Election or Appointment: 2008
Trustee
Mr. Mauriello also serves as Trustee of other Fidelity® funds. Prior to his retirement in January 2006, Mr. Mauriello served in numerous senior management positions including Deputy Chairman and Chief Operating Officer (2004-2005), and Vice Chairman of Financial Services (2002-2004) of KPMG LLP US (professional services, 1965-2005). Mr. Mauriello currently serves as a member of the Board of Directors of XL Group plc. (global insurance and re-insurance, 2006-present) and the Independent Directors Council (IDC) Governing Council (2015-present). Previously, Mr. Mauriello served as a Director of the Hamilton Funds of the Bank of New York (2006-2007) and of Arcadia Resources Inc. (health care services and products, 2007-2012).
Robert W. Selander (1950)
Year of Election or Appointment: 2011
Trustee
Mr. Selander also serves as Trustee of other Fidelity® funds. Mr. Selander serves as a Director of The Western Union Company (global money transfer, 2014-present). Previously, Mr. Selander served as a Member of the Advisory Board of other Fidelity® funds (2011), and Executive Vice Chairman (2010), Chief Executive Officer (2009-2010), and President and Chief Executive Officer (1997-2009) of Mastercard, Inc.
Cornelia M. Small (1944)
Year of Election or Appointment: 2005
Trustee
Ms. Small also serves as Trustee of other Fidelity® funds. Ms. Small is a member of the Board of Directors (2009-present) and Chair of the Investment Committee (2010-present) of the Teagle Foundation. Ms. Small also serves on the Investment Committee of the Berkshire Taconic Community Foundation (2008-present). Previously, Ms. Small served as Chairperson (2002-2008) and a member of the Investment Committee and Chairperson (2008-2012) and a member of the Board of Trustees of Smith College. In addition, Ms. Small served as Chief Investment Officer, Director of Global Equity Investments, and a member of the Board of Directors of Scudder, Stevens & Clark and Scudder Kemper Investments.
William S. Stavropoulos (1939)
Year of Election or Appointment: 2002
Trustee
Vice Chairman of the Independent Trustees
Mr. Stavropoulos also serves as Trustee of other Fidelity® funds. Mr. Stavropoulos serves as President and Founder of the Michigan Baseball Foundation, the Great Lakes Loons (2007-present). Mr. Stavropoulos is Chairman Emeritus of the Board of Directors of The Dow Chemical Company, where he previously served in numerous senior management positions, including President, CEO (1995-2000; 2002-2004), Chairman of the Executive Committee (2000-2006), and as a member of the Board of Directors (1990-2006). Currently, Mr. Stavropoulos is Chairman of the Board of Directors of Univar Inc. (global distributor of commodity and specialty chemicals), a Director of Teradata Corporation (data warehousing and technology solutions), and Maersk Inc. (industrial conglomerate), and a member of the Advisory Board for Metalmark Capital LLC (private equity investment, 2005-present). Mr. Stavropoulos is an operating advisor to Clayton, Dubilier & Rice, LLC (private equity investment). In addition, Mr. Stavropoulos is a member of the University of Notre Dame Advisory Council for the College of Science, a Trustee of the Rollin L. Gerstacker Foundation, and a Director of the Naples Philharmonic Center for the Arts. Previously, Mr. Stavropoulos served as a Director of Chemical Financial Corporation (bank holding company, 1993-2012) and Tyco International, Ltd. (multinational manufacturing and services, 2007-2012).
David M. Thomas (1949)
Year of Election or Appointment: 2008
Trustee
Mr. Thomas also serves as Trustee of other Fidelity® funds. Mr. Thomas serves as Non-Executive Chairman of the Board of Directors of Fortune Brands Home and Security (home and security products, 2011-present), as a member of the Board of Directors (2004-present) and Presiding Director (2013-present) of Interpublic Group of Companies, Inc. (marketing communication), and as a member of the Board of Trustees of the University of Florida (2013-present). Previously, Mr. Thomas served as Executive Chairman (2005-2006) and Chairman and Chief Executive Officer (2000-2005) of IMS Health, Inc. (pharmaceutical and healthcare information solutions), and a Director of Fortune Brands, Inc. (consumer products, 2000-2011).
+ The information includes the Trustee's principal occupation during the last five years and other information relating to the experience, attributes, and skills relevant to the Trustee's qualifications to serve as a Trustee, which led to the conclusion that the Trustee should serve as a Trustee for the fund.
Advisory Board Members and Officers:
Correspondence intended for an officer or Peter S. Lynch may be sent to Fidelity Investments, 245 Summer Street, Boston, Massachusetts 02210. Officers appear below in alphabetical order.
Name, Year of Birth; Principal Occupation
Peter S. Lynch (1944)
Year of Election or Appointment: 2003
Member of the Advisory Board
Mr. Lynch also serves as Member of the Advisory Board of other Fidelity® funds. Mr. Lynch is Vice Chairman and a Director of FMR (investment adviser firm) and FMR Co., Inc. (investment adviser firm). In addition, Mr. Lynch serves as a Trustee of Boston College and as the Chairman of the Inner-City Scholarship Fund. Previously, Mr. Lynch served on the Special Olympics International Board of Directors (1997-2006).
Elizabeth Paige Baumann (1968)
Year of Election or Appointment: 2012
Anti-Money Laundering (AML) Officer
Ms. Baumann also serves as AML Officer of other funds. She is Chief AML Officer of FMR LLC (diversified financial services company, 2012-present) and is an employee of Fidelity Investments. Previously, Ms. Baumann served as Vice President and Deputy Anti-Money Laundering Officer (2007-2012).
Marc R. Bryant (1966)
Year of Election or Appointment: 2015
Secretary and Chief Legal Officer (CLO)
Mr. Bryant also serves as Secretary and CLO of other funds. Mr. Bryant serves as CLO, Secretary, and Senior Vice President of Fidelity Management & Research Company (investment adviser firm, 2015-present) and FMR Co., Inc. (investment adviser firm, 2015-present); Secretary of Fidelity SelectCo, LLC (investment adviser firm, 2015-present) and Fidelity Investments Money Management, Inc. (investment adviser firm, 2015-present); and CLO of Fidelity Management & Research (Hong Kong) Limited (investment adviser firm, 2015-present). He is Senior Vice President and Deputy General Counsel of FMR LLC (diversified financial services company). Previously, Mr. Bryant served as Secretary and CLO of Fidelity Rutland Square Trust II (2010-2014) and Assistant Secretary of Fidelity's Fixed Income and Asset Allocation Funds (2013-2015). Prior to joining Fidelity Investments, Mr. Bryant served as a Senior Vice President and the Head of Global Retail Legal for AllianceBernstein L.P. (2006-2010), and as the General Counsel for ProFund Advisors LLC (2001-2006).
William C. Coffey (1969)
Year of Election or Appointment: 2009
Assistant Secretary
Mr. Coffey also serves as Assistant Secretary of other funds. He is Senior Vice President and Deputy General Counsel of FMR LLC (diversified financial services company, 2010-present), and is an employee of Fidelity Investments. Previously, Mr. Coffey served as Vice President and Associate General Counsel of FMR LLC (2005-2009).
Jonathan Davis (1968)
Year of Election or Appointment: 2010
Assistant Treasurer
Mr. Davis also serves as Assistant Treasurer of other funds, and is an employee of Fidelity Investments. Previously, Mr. Davis served as Vice President and Associate General Counsel of FMR LLC (diversified financial services company, 2003-2010).
Adrien E. Deberghes (1967)
Year of Election or Appointment: 2008
Deputy Treasurer
Mr. Deberghes also serves as an officer of other funds. He is an employee of Fidelity Investments (2008-present). Prior to joining Fidelity Investments, Mr. Deberghes was Senior Vice President of Mutual Fund Administration at State Street Corporation (2007-2008), Senior Director of Mutual Fund Administration at Investors Bank & Trust (2005-2007), and Director of Finance for Dunkin' Brands (2000-2005).
Stephanie J. Dorsey (1969)
Year of Election or Appointment: 2010
Assistant Treasurer
Ms. Dorsey also serves as an officer of other funds. She is an employee of Fidelity Investments (2008-present) and has served in other fund officer roles. Prior to joining Fidelity Investments, Ms. Dorsey served as Treasurer (2004-2008) of the JPMorgan Mutual Funds and Vice President (2004-2008) of JPMorgan Chase Bank.
Howard J. Galligan III (1966)
Year of Election or Appointment: 2014
Chief Financial Officer
Mr. Galligan also serves as Chief Financial Officer of other funds. Mr. Galligan serves as President of Fidelity Pricing and Cash Management Services (FPCMS) (2014-present) and as a Director of Strategic Advisers, Inc. (investment adviser firm, 2008-present). Previously, Mr. Galligan served as Chief Administrative Officer of Asset Management (2011-2014) and Chief Operating Officer and Senior Vice President of Investment Support for Strategic Advisers, Inc. (2003-2011).
Scott C. Goebel (1968)
Year of Election or Appointment: 2015
Vice President
Mr. Goebel serves as Vice President of other funds and is an employee of Fidelity Investments (2001-present). Previously, Mr. Goebel served as Secretary of Fidelity SelectCo, LLC (investment adviser firm, 2013-2015), Fidelity Investments Money Management, Inc. (FIMM) (investment adviser firm, 2010-2015), and Fidelity Research and Analysis Company (FRAC) (investment adviser firm, 2010-2015); General Counsel, Secretary, and Senior Vice President of Fidelity Management & Research Company (investment adviser firm, 2008-2015) and FMR Co., Inc. (investment adviser firm, 2008-2015); Assistant Secretary of Fidelity Management & Research (Japan) Limited (investment adviser firm, 2008-2015) and FMR Investment Management (U.K.) Limited (investment adviser firm, 2008-2015); Chief Legal Officer (CLO) of Fidelity Management & Research (Hong Kong) Limited (investment adviser firm, 2008-2015); Secretary and CLO of certain Fidelity® funds (2008-2015); Assistant Secretary of FIMM (2008-2010), FRAC (2008-2010), and certain funds (2007-2008); and as Vice President and Secretary of Fidelity Distributors Corporation (FDC) (2005-2007).
Brian B. Hogan (1964)
Year of Election or Appointment: 2009
Vice President
Mr. Hogan also serves as Trustee or Vice President of other funds. Mr. Hogan serves as a Director of Fidelity SelectCo, LLC (investment adviser firm, 2014-present) and President of the Equity Division of FMR (investment adviser firm, 2009-present). Previously, Mr. Hogan served as Senior Vice President, Equity Research of FMR (2006-2009) and as a portfolio manager.
Chris Maher (1972)
Year of Election or Appointment: 2013
Assistant Treasurer
Mr. Maher serves as Assistant Treasurer of other funds. Mr. Maher is Vice President of Valuation Oversight and is an employee of Fidelity Investments. Previously, Mr. Maher served as Vice President of Asset Management Compliance (2013), Vice President of the Program Management Group of FMR (investment adviser firm, 2010-2013), and Vice President of Valuation Oversight (2008-2010).
Melissa M. Reilly (1971)
Year of Election or Appointment: 2014
Vice President of certain Equity Funds
Ms. Reilly also serves as Vice President of other funds. Ms. Reilly is an employee of Fidelity Investments (2004-present).
Kenneth B. Robins (1969)
Year of Election or Appointment: 2008
President and Treasurer
Mr. Robins also serves as an officer of other funds. Mr. Robins serves as Executive Vice President of Fidelity Investments Money Management, Inc. (FIMM) (investment adviser firm, 2013-present) and is an employee of Fidelity Investments (2004-present). Previously, Mr. Robins served in other fund officer roles.
Stacie M. Smith (1974)
Year of Election or Appointment: 2013
Deputy Treasurer
Ms. Smith also serves as an officer of other funds. She is an employee of Fidelity Investments (2009-present) and has served in other fund officer roles. Prior to joining Fidelity Investments, Ms. Smith served as Senior Audit Manager of Ernst & Young LLP (1996-2009).
Renee Stagnone (1975)
Year of Election or Appointment: 2013
Deputy Treasurer
Ms. Stagnone also serves as Deputy Treasurer of other funds. Ms. Stagnone is an employee of Fidelity Investments (1997-present).
Linda J. Wondrack (1964)
Year of Election or Appointment: 2014
Chief Compliance Officer
Ms. Wondrack also serves as Chief Compliance Officer of other funds. Ms. Wondrack is Executive Vice President and head of the Ethics Office and Asset Management Compliance for Fidelity Investments (2012-present). Ms. Wondrack also serves as Chief Compliance Officer of Fidelity SelectCo, LLC (investment adviser firm, 2014-present); Chief Compliance Officer of Impresa Management LLC (2013-present); and Chief Compliance Officer of FMR Co., Inc. (investment adviser firm), Fidelity Investments Money Management, Inc. (investment adviser firm), Fidelity Management & Research (Japan) Limited (investment adviser firm), FMR Investment Management (U.K.) Limited (investment adviser firm), Fidelity Management & Research (Hong Kong) (investment adviser firm), Fidelity Management & Research Company (investment adviser firm), FIAM LLC (investment adviser firm), and Strategic Advisers, Inc. (investment adviser firm), Ballyrock Investment Advisors LLC, and Northern Neck Investors LLC (2012-present). Previously, Ms. Wondrack served as Senior Vice President and Chief Compliance Officer for Columbia Management Investment Advisers, LLC (2005-2012); Chief Compliance Officer for certain funds within the Columbia Family of Funds (2007-2012); and Senior Vice President of Compliance Risk Management at Bank of America (2005-2010).
Joseph F. Zambello (1957)
Year of Election or Appointment: 2011
Deputy Treasurer
Mr. Zambello also serves as Deputy Treasurer of other funds. Mr. Zambello is an employee of Fidelity Investments (1991-present). Previously, Mr. Zambello served as Vice President of the Program Management Group of FMR (investment adviser firm, 2009-2011) and Vice President of the Transfer Agent Oversight Group (2005-2009).
Shareholder Expense Example
As a shareholder of the Fund, you incur two types of costs: (1) transaction costs, including sales charges (loads) on purchase payments or redemption proceeds, and (2) ongoing costs, including management fees, distribution and/or service (12b-1) fees and other Fund expenses. This Example is intended to help you understand your ongoing costs (in dollars) of investing in the Fund and to compare these costs with the ongoing costs of investing in other mutual funds.
The Example is based on an investment of $1,000 invested at the beginning of the period and held for the entire period (June 1, 2015 to November 30, 2015).
Actual Expenses
The first line of the accompanying table for each class of the Fund provides information about actual account values and actual expenses. You may use the information in this line, together with the amount you invested, to estimate the expenses that you paid over the period. Simply divide your account value by $1,000.00 (for example, an $8,600 account value divided by $1,000.00 = 8.6), then multiply the result by the number in the first line for a class of the Fund under the heading entitled "Expenses Paid During Period" to estimate the expenses you paid on your account during this period. In addition, the Fund, as a shareholder in the underlying Fidelity Central Funds, will indirectly bear its pro-rata share of the fees and expenses incurred by the underlying Fidelity Central Funds. These fees and expenses are not included in the Fund's annualized expense ratio used to calculate the expense estimate in the table below.
Hypothetical Example for Comparison Purposes
The second line of the accompanying table for each class of the Fund provides information about hypothetical account values and hypothetical expenses based on a Class' actual expense ratio and an assumed rate of return of 5% per year before expenses, which is not the Class' actual return. The hypothetical account values and expenses may not be used to estimate the actual ending account balance or expenses you paid for the period. You may use this information to compare the ongoing costs of investing in the Fund and other funds. To do so, compare this 5% hypothetical example with the 5% hypothetical examples that appear in the shareholder reports of the other funds. In addition, the Fund, as a shareholder in the underlying Fidelity Central Funds, will indirectly bear its pro-rata share of the fees and expenses incurred by the underlying Fidelity Central Funds. These fees and expenses are not included in the Fund's annualized expense ratio used to calculate the expense estimate in the table below.
Please note that the expenses shown in the table are meant to highlight your ongoing costs only and do not reflect any transaction costs. Therefore, the second line of the table is useful in comparing ongoing costs only, and will not help you determine the relative total costs of owning different funds. In addition, if these transactional costs were included, your costs would have been higher.
| Annualized Expense Ratio-A | Beginning Account Value June 1, 2015 | Ending Account Value November 30, 2015 | Expenses Paid During Period-B June 1, 2015 to November 30, 2015 | |
| Class A | 1.04% | |||
| Actual | $1,000.00 | $1,000.90 | $5.22 | |
| Hypothetical-C | $1,000.00 | $1,019.85 | $5.27 | |
| Class T | 1.27% | |||
| Actual | $1,000.00 | $999.70 | $6.37 | |
| Hypothetical-C | $1,000.00 | $1,018.70 | $6.43 | |
| Class B | 1.89% | |||
| Actual | $1,000.00 | $996.70 | $9.46 | |
| Hypothetical-C | $1,000.00 | $1,015.59 | $9.55 | |
| Class C | 1.79% | |||
| Actual | $1,000.00 | $997.20 | $8.96 | |
| Hypothetical-C | $1,000.00 | $1,016.09 | $9.05 | |
| Class I | .76% | |||
| Actual | $1,000.00 | $1,002.30 | $3.81 | |
| Hypothetical-C | $1,000.00 | $1,021.26 | $3.85 | |
| Class Z | .64% | |||
| Actual | $1,000.00 | $1,002.90 | $3.21 | |
| Hypothetical-C | $1,000.00 | $1,021.86 | $3.24 |
A Annualized expense ratio reflects expenses net of applicable fee waivers.
B Expenses are equal to each Class' annualized expense ratio, multiplied by the average account value over the period, multiplied by 183/365 (to reflect the one-half year period).
C 5% return per year before expenses
Distributions (Unaudited)
The Board of Trustees of Fidelity Advisor Growth Opportunities Fund voted to pay to shareholders of record at the opening of business on record date, the following distributions per share derived from capital gains realized from sales of portfolio securities:
| Pay Date | Record Date | Capital Gains | |
| Class A | 12/07/15 | 12/04/15 | $6.636 |
| 01/11/16 | 01/08/16 | $0.605 | |
| Class T | 12/07/15 | 12/04/15 | $6.636 |
| 01/11/16 | 01/08/16 | $0.605 | |
| Class B | 12/07/15 | 12/04/15 | $6.636 |
| 01/11/16 | 01/08/16 | $0.605 | |
| Class C | 12/07/15 | 12/04/15 | $6.636 |
| 01/11/16 | 01/08/16 | $0.605 |
The fund hereby designates as a capital gain dividend with respect to the taxable year ended November 30, 2015, $404,021,582, or, if subsequently determined to be different, the net capital gain of such year.
The fund will notify shareholders in January 2016 of amounts for use in preparing 2015 income tax returns.
Board Approval of Investment Advisory Contracts and Management Fees
Fidelity Advisor Growth Opportunities Fund
Each year, the Board of Trustees, including the Independent Trustees (together, the Board), votes on the renewal of the management contract with Fidelity Management & Research Company (FMR) and the sub-advisory agreements (together, the Advisory Contracts) for the fund. The Board, assisted by the advice of fund counsel and Independent Trustees' counsel, requests and considers a broad range of information relevant to the renewal of the Advisory Contracts throughout the year.
The Board meets regularly and, at each of its meetings, covers an extensive agenda of topics and materials and considers factors that are relevant to its annual consideration of the renewal of the fund's Advisory Contracts, including the services and support provided to the fund and its shareholders. The Board has established various standing committees (Committees), each composed of and chaired by Independent Trustees with varying backgrounds, to which the Board has assigned specific subject matter responsibilities in order to enhance effective decision-making by the Board. The Board, acting directly and through its Committees, requests and receives information concerning the annual consideration of the renewal of the fund's Advisory Contracts. The Board also meets as needed to consider matters specifically related to the Board's annual consideration of the renewal of the Advisory Contracts. Members of the Board may also meet with trustees of other Fidelity funds through ad hoc joint committees to discuss certain matters relevant to all of the Fidelity funds.
At its July 2015 meeting, the Board unanimously determined to renew the fund's Advisory Contracts. In reaching its determination, the Board considered all factors it believed relevant, including (i) the nature, extent, and quality of the services to be provided to the fund and its shareholders (including the investment performance of the fund); (ii) the competitiveness of the fund's management fee and total expense ratio relative to peer funds; (iii) the total costs of the services to be provided by and the profits to be realized by Fidelity from its relationship with the fund; and (iv) the extent to which (if any) economies of scale exist and would be realized as the fund grows, and whether any economies of scale are appropriately shared with fund shareholders.
In considering whether to renew the Advisory Contracts for the fund, the Board reached a determination, with the assistance of fund counsel and Independent Trustees' counsel and through the exercise of its business judgment, that the renewal of the Advisory Contracts was in the best interests of the fund and its shareholders and that the compensation payable under the Advisory Contracts was fair and reasonable. The Board's decision to renew the Advisory Contracts was not based on any single factor, but rather was based on a comprehensive consideration of all the information provided to the Board at its meetings throughout the year. The Board, in reaching its determination to renew the Advisory Contracts, was aware that shareholders of the fund have a broad range of investment choices available to them, including a wide choice among funds offered by Fidelity's competitors, and that the fund's shareholders, who have the opportunity to review and weigh the disclosure provided by the fund in its prospectus and other public disclosures, have chosen to invest in this fund, which is part of the Fidelity family of funds.
Nature, Extent, and Quality of Services Provided. The Board considered Fidelity's staffing as it relates to the fund, including the backgrounds of investment personnel of Fidelity, and also considered the fund's investment objective, strategies, and related investment philosophy. The Independent Trustees also had discussions with senior management of Fidelity's investment operations and investment groups. The Board considered the structure of the portfolio manager compensation program and whether this structure provides appropriate incentives to act in the best interests of the fund. Additionally, the Board considered the portfolio managers' investments, if any, in the funds that they manage.Resources Dedicated to Investment Management and Support Services. The Board and the Fund Oversight and Research Committees reviewed the general qualifications and capabilities of Fidelity's investment staff, including its size, education, experience, and resources, as well as Fidelity's approach to recruiting, training, managing, and compensating investment personnel. The Board noted that Fidelity has continued to increase the resources devoted to non-U.S. offices, including expansion of Fidelity's global investment organization. The Board also noted that Fidelity's analysts have extensive resources, tools and capabilities that allow them to conduct sophisticated quantitative and fundamental analysis, as well as credit analysis of issuers, counterparties and guarantors. Further, the Board considered that Fidelity's investment professionals have sufficient access to global information and data so as to provide competitive investment results over time, and that those professionals also have access to sophisticated tools that permit them to assess portfolio construction and risk and performance attribution characteristics continuously, as well as to transmit new information and research conclusions rapidly around the world. Additionally, in its deliberations, the Board considered Fidelity's trading, risk management, and compliance capabilities and resources, which are integral parts of the investment management process.Shareholder and Administrative Services. The Board considered (i) the nature, extent, quality, and cost of advisory, administrative, and shareholder services performed by FMR, the sub-advisers (together with FMR, the Investment Advisers), and their affiliates under the Advisory Contracts and under separate agreements covering transfer agency, pricing and bookkeeping, and securities lending services for the fund; (ii) the nature and extent of the supervision of third party service providers, principally custodians and subcustodians; and (iii) the resources devoted to, and the record of compliance with, the fund's compliance policies and procedures. The Board also reviewed the allocation of fund brokerage, including allocations to brokers affiliated with the Investment Advisers, the use of brokerage commissions to pay fund expenses, and the use of "soft" commission dollars to pay for research services.The Board noted that the growth of fund assets over time across the complex allows Fidelity to reinvest in the development of services designed to enhance the value or convenience of the Fidelity funds as investment vehicles. These services include 24-hour access to account information and market information through telephone representatives and over the Internet, investor education materials and asset allocation tools, and the expanded availability of Fidelity Investor Centers.In 2014, the Board formed an ad hoc Committee on Transfer Agency Fees to review the variety of transfer agency fee structures throughout the industry and Fidelity's competitive positioning with respect to industry participants.Investment in a Large Fund Family. The Board considered the benefits to shareholders of investing in a Fidelity fund, including the benefits of investing in a fund that is part of a large family of funds offering a variety of investment disciplines and providing a large variety of mutual fund investor services. The Board noted that Fidelity had taken, or had made recommendations that resulted in the Fidelity funds taking, a number of actions over the previous year that benefited particular funds, including (i) continuing to dedicate additional resources to investment research and to the support of the senior management team that oversees asset management; (ii) continuing efforts to enhance Fidelity's global research capabilities; (iii) launching new funds and making other enhancements to meet client needs; (iv) reducing management fees and total expenses for certain index funds and diversified international funds; (v) continuing to launch dedicated lower cost underlying funds to meet portfolio construction needs related to expanding underlying fund options for Fidelity funds of funds, specifically for the Freedom Fund product lines; (vi) rationalizing product lines and gaining increased efficiencies through fund mergers; (vii) launching active fixed-income exchange-traded funds; (viii) continuing to develop, acquire and implement systems and technology to improve services to the funds and information security and to increase efficiency; (ix) implementing investment enhancements to further strengthen Fidelity's target date product line to increase investors' probability of success in achieving their goals; (x) modifying the eligibility criteria for certain share classes to accommodate roll-over assets from employer-sponsored retirement plans; (xi) launching a new Class W of the Freedom Index Funds to attract and retain Fidelity record-kept retirement plan assets; and (xii) implementing changes to Fidelity's money market product line in response to recent money market regulatory reforms.Investment Performance. The Board considered whether the fund has operated in accordance with its investment objective, as well as its record of compliance with its investment restrictions and its performance history. The Board noted that there were portfolio management changes for the fund in October 2012 and March 2015.The Board took into account discussions with representatives of the Investment Advisers about fund investment performance that occur at Board meetings throughout the year. In this regard the Board noted that as part of regularly scheduled fund reviews and other reports to the Board on fund performance, the Board considers annualized return information for the fund, for different time periods, measured against a securities market index ("benchmark index") and a peer group of funds with similar objectives ("peer group"), if any. In its evaluation of fund investment performance, the Board gave particular attention to information indicating changes in performance of certain Fidelity funds for specific time periods and discussed with the Investment Advisers the reasons for any overperformance or underperformance.In addition to reviewing absolute and relative fund performance, the Independent Trustees periodically consider the appropriateness of fund performance metrics in evaluating the results achieved. In general, the Independent Trustees believe that fund performance should be evaluated based on net performance (after fees and expenses) of both the highest performing and lowest performing fund share classes, where applicable, compared to appropriate benchmark indices, over appropriate time periods that may include full market cycles, and compared to peer groups, as applicable, over the same periods, taking into account relevant factors including the following: general market conditions; issuer-specific information; and fund cash flows and other factors.The Independent Trustees recognize that shareholders evaluate performance on a net basis over their own holding periods, for which one-, three-, and five-year periods are often used as a proxy. For this reason, the performance information reviewed by the Board also included net cumulative calendar year total return information for the fund and an appropriate benchmark index and peer group for the most recent one-, three-, and five-year periods, as shown below. Returns are shown compared to the 25th percentile (top of box, 75% beaten) and 75th percentile (bottom of box, 25% beaten) of the peer universe.Fidelity Advisor Growth Opportunities Fund
Fidelity Advisor Growth Opportunities Fund
![]()
GO-ANN-0116
1.704314.118
Item 2.
Code of Ethics
As of the end of the period, November 30, 2015, Fidelity Advisor Series I (the trust) has adopted a code of ethics, as defined in Item 2 of Form N-CSR, that applies to its
President and Treasurer and its Chief Financial Officer. A copy of the code of ethics is filed as an exhibit to this Form N-CSR.
Item 3.
Audit Committee Financial Expert
The Board of Trustees of the trust has determined that Joseph Mauriello is an audit committee financial expert, as defined in Item 3 of Form N-CSR. Mr. Mauriello is independent for purposes of Item 3 of Form N-CSR.
Item 4.
Principal Accountant Fees and Services
Fees and Services
The following table presents fees billed by Deloitte & Touche LLP, the member firms of Deloitte Touche Tohmatsu, and their respective affiliates (collectively, “Deloitte Entities”) in each of the last two fiscal years for services rendered to Fidelity Advisor Equity Growth Fund, Fidelity Advisor Equity Income Fund, Fidelity Advisor Equity Value Fund, Fidelity Advisor Growth & Income Fund, Fidelity Advisor Growth Opportunities Fund, Fidelity Advisor Large Cap Fund, Fidelity Advisor Series Growth Opportunities Fund, Fidelity Advisor Stock Selector Mid Cap Fund, and Fidelity Advisor Value Strategies Fund (the “Funds”):
Services Billed by Deloitte Entities
November 30, 2015 FeesA
| Audit Fees | Audit-Related Fees | Tax Fees | All Other Fees |
Fidelity Advisor Equity Growth Fund | $54,000 | $- | $6,100 | $1,200 |
Fidelity Advisor Equity Income Fund | $45,000 | $- | $8,600 | $1,100 |
Fidelity Advisor Equity Value Fund | $49,000 | $- | $6,400 | $700 |
Fidelity Advisor Growth & Income Fund | $44,000 | $- | $6,000 | $700 |
Fidelity Advisor Growth Opportunities Fund | $50,000 | $- | $5,800 | $1,400 |
Fidelity Advisor Large Cap Fund | $44,000 | $- | $6,100 | $900 |
Fidelity Advisor Series Growth Opportunities Fund | $46,000 | $- | $5,800 | $800 |
Fidelity Advisor Stock Selector Mid Cap Fund | $45,000 | $- | $5,500 | $1,200 |
Fidelity Advisor Value Strategies Fund | $45,000 | $- | $6,900 | $900 |
November 30, 2014 FeesA
| Audit Fees | Audit-Related Fees | Tax Fees | All Other Fees |
Fidelity Advisor Equity Growth Fund | $48,000 | $- | $6,000 | $1,300 |
Fidelity Advisor Equity Income Fund | $44,000 | $- | $6,600 | $1,100 |
Fidelity Advisor Equity Value Fund | $47,000 | $- | $6,200 | $600 |
Fidelity Advisor Growth & Income Fund | $52,000 | $- | $5,700 | $700 |
Fidelity Advisor Growth Opportunities Fund | $48,000 | $- | $5,800 | $1,300 |
Fidelity Advisor Large Cap Fund | $46,000 | $- | $5,300 | $800 |
Fidelity Advisor Series Growth Opportunities Fund | $46,000 | $- | $6,100 | $800 |
Fidelity Advisor Stock Selector Mid Cap Fund | $43,000 | $- | $4,800 | $1,100 |
Fidelity Advisor Value Strategies Fund | $44,000 | $- | $6,600 | $900 |
A Amounts may reflect rounding.
The following table presents fees billed by PricewaterhouseCoopers LLP (“PwC”) in each of the last two fiscal years for services rendered to Fidelity Advisor Dividend Growth Fund, Fidelity Advisor Series Equity Growth Fund, Fidelity Advisor Series Small Cap Fund, and Fidelity Advisor Small Cap Fund (the “Funds”):
Services Billed by PwC
November 30, 2015 FeesA
| Audit Fees | Audit-Related Fees | Tax Fees | All Other Fees |
Fidelity Advisor Dividend Growth Fund | $57,000 | $- | $5,400 | $2,100 |
Fidelity Advisor Series Equity Growth Fund | $32,000 | $- | $3,100 | $2,000 |
Fidelity Advisor Series Small Cap Fund | $45,000 | $- | $3,700 | $1,900 |
Fidelity Advisor Small Cap Fund | $50,000 | $- | $3,700 | $2,800 |
November 30, 2014 FeesA,B
| Audit Fees | Audit-Related Fees | Tax Fees | All Other Fees |
Fidelity Advisor Dividend Growth Fund | $54,000 | $- | $3,800 | $2,000 |
Fidelity Advisor Series Equity Growth Fund | $29,000 | $- | $2,800 | $900 |
Fidelity Advisor Series Small Cap Fund | $42,000 | $- | $3,400 | $1,800 |
Fidelity Advisor Small Cap Fund | $49,000 | $- | $3,600 | $2,800 |
|
|
|
|
|
A Amounts may reflect rounding.
B Fidelity Advisor Series Equity Growth Fund commenced operations on June 6, 2014.
The following table presents fees billed by PwC and Deloitte Entities that were required to be approved by the Audit Committee for services that relate directly to the operations and financial reporting of the Funds and that are rendered on behalf of Fidelity Management & Research Company (“FMR”) and entities controlling, controlled by, or under common control with FMR (not including any sub-adviser whose role is primarily portfolio management and is subcontracted with or overseen by another investment adviser) that provide ongoing services to the Funds (“Fund Service Providers”):
Services Billed by Deloitte Entities
| November 30, 2015A | November 30, 2014A |
Audit-Related Fees | $- | $- |
Tax Fees | $10,000 | $- |
All Other Fees | $10,000 | $640,000 |
A Amounts may reflect rounding.
Services Billed by PwC
| November 30, 2015A | November 30, 2014A,B |
Audit-Related Fees | $5,890,000 | $5,185,000 |
Tax Fees | $- | $- |
All Other Fees | $- | $- |
A Amounts may reflect rounding.
B May include amounts billed prior to the Fidelity Advisor Series Equity Growth Fund’s commencement of operations.
“Audit-Related Fees” represent fees billed for assurance and related services that are reasonably related to the performance of the fund audit or the review of the fund's financial statements and that are not reported under Audit Fees.
“Tax Fees” represent fees billed for tax compliance, tax advice or tax planning that relate directly to the operations and financial reporting of the fund.
“All Other Fees” represent fees billed for services provided to the fund or Fund Service Provider, a significant portion of which are assurance related, that relate directly to the operations and financial reporting of the fund, excluding those services that are reported under Audit Fees, Audit-Related Fees or Tax Fees.
Assurance services must be performed by an independent public accountant.
* * *
The aggregate non-audit fees billed by PwC and Deloitte Entities for services rendered to the Funds, FMR (not including any sub-adviser whose role is primarily portfolio management and is subcontracted with or overseen by another investment adviser), and any Fund Service Provider for each of the last two fiscal years of the Funds are as follows:
Billed By | November 30, 2015 A | November 30, 2014 A,B |
PwC | $7,075,000 | $6,500,000 |
Deloitte Entities | $195,000 | $1,775,000 |
A Amounts may reflect rounding.
B May include amounts billed prior to the Fidelity Advisor Series Equity Growth Fund’s commencement of operations.
The trust's Audit Committee has considered non-audit services that were not pre-approved that were provided by PwC and Deloitte Entities to Fund Service Providers to be compatible with maintaining the independence of PwC and Deloitte Entities in their audits of the Funds, taking into account representations from PwC and Deloitte Entities, in accordance with Public Company Accounting Oversight Board rules, regarding their independence from the Funds and their related entities and FMR’s review of the appropriateness and permissibility under applicable law of such non-audit services prior to their provision to the Fund Service Providers.
Audit Committee Pre-Approval Policies and Procedures
The trust’s Audit Committee must pre-approve all audit and non-audit services provided by a fund’s independent registered public accounting firm relating to the operations or financial reporting of the fund. Prior to the commencement of any audit or non-audit services to a fund, the Audit Committee reviews the services to determine whether they are appropriate and permissible under applicable law.
The Audit Committee has adopted policies and procedures to, among other purposes, provide a framework for the Committee’s consideration of non-audit services by the audit firms that audit the Fidelity funds. The policies and procedures require that any non-audit service provided by a fund audit firm to a Fidelity fund and any non-audit service provided by a fund auditor to a Fund Service Provider that relates directly to the operations and financial reporting of a Fidelity fund (“Covered Service”) are subject to approval by the Audit Committee before such service is provided.
All Covered Services must be approved in advance of provision of the service either: (i) by formal resolution of the Audit Committee, or (ii) by oral or written approval of the service by the Chair of the Audit Committee (or if the Chair is unavailable, such other member of the Audit Committee as may be designated by the Chair to act in the Chair’s absence). The approval contemplated by (ii) above is permitted where the Treasurer determines that action on such an engagement is necessary before the next meeting of the Audit Committee.
Non-audit services provided by a fund audit firm to a Fund Service Provider that do not relate directly to the operations and financial reporting of a Fidelity fund are reported to the Audit Committee on a periodic basis.
Non-Audit Services Approved Pursuant to Rule 2-01(c)(7)(i)(C) and (ii) of Regulation S-X (“De Minimis Exception”)
There were no non-audit services approved or required to be approved by the Audit Committee pursuant to the De Minimis Exception during the Funds’ last two fiscal years relating to services provided to (i) the Funds or (ii) any Fund Service Provider that relate directly to the operations and financial reporting of the Funds.
Item 5.
Audit Committee of Listed Registrants
Not applicable.
Item 6.
Investments
(a)
Not applicable.
(b)
Not applicable
Item 7.
Disclosure of Proxy Voting Policies and Procedures for Closed-End Management Investment Companies
Not applicable.
Item 8.
Portfolio Managers of Closed-End Management Investment Companies
Not applicable.
Item 9.
Purchase of Equity Securities by Closed-End Management Investment Company and Affiliated Purchasers
Not applicable.
Item 10.
Submission of Matters to a Vote of Security Holders
There were no material changes to the procedures by which shareholders may recommend nominees to the trust’s Board of Trustees.
Item 11.
Controls and Procedures
(a)(i) The President and Treasurer and the Chief Financial Officer have concluded that the disclosure controls and procedures (as defined in Rule 30a-3(c) under the Investment Company Act) for each Fund provide reasonable assurances that material information relating to such Fund is made known to them by the appropriate persons, based on their evaluation of these controls and procedures as of a date within 90 days of the filing date of this report.
(a)(ii) There was no change in a Fund’s internal control over financial reporting (as defined in Rule 30a-3(d) under the Investment Company Act) that occurred during the second fiscal quarter of the period covered by this report that has materially affected, or is reasonably likely to materially affect, a Fund’s internal control over financial reporting.
Item 12.
Exhibits
(a) | (1) | Code of Ethics pursuant to Item 2 of Form N-CSR is filed and attached hereto as EX-99.CODE ETH. |
(a) | (2) | Certification pursuant to Rule 30a-2(a) under the Investment Company Act of 1940 (17 CFR 270.30a-2(a)) is filed and attached hereto as Exhibit 99.CERT. |
(a) | (3) | Not applicable. |
(b) |
| Certification pursuant to Rule 30a-2(b) under the Investment Company Act of 1940 (17 CFR 270.30a-2(b)) is furnished and attached hereto as Exhibit 99.906CERT. |
SIGNATURES
Pursuant to the requirements of the Securities Exchange Act of 1934 and the Investment Company Act of 1940, the registrant has duly caused this report to be signed on its behalf by the undersigned, thereunto duly authorized.
Fidelity Advisor Series I
By: | /s/Kenneth B. Robins |
| Kenneth B. Robins |
| President and Treasurer |
|
|
Date: | January 27, 2016 |
Pursuant to the requirements of the Securities Exchange Act of 1934 and the Investment Company Act of 1940, this report has been signed below by the following persons on behalf of the registrant and in the capacities and on the dates indicated.
By: | /s/Kenneth B. Robins |
| Kenneth B. Robins |
| President and Treasurer |
|
|
Date: | January 27, 2016 |
By: | /s/Howard J. Galligan III |
| Howard J. Galligan III |
| Chief Financial Officer |
|
|
Date: | January 27, 2016 |