UNITED STATES
SECURITIES AND EXCHANGE COMMISSION
Washington, D.C. 20549
FORM N-CSR
CERTIFIED SHAREHOLDER REPORT OF REGISTERED MANAGEMENT
INVESTMENT COMPANIES
Investment Company Act file number | 811-03940 | |||||
|
| |||||
| BNY Mellon Strategic Funds, Inc. |
| ||||
| (Exact name of Registrant as specified in charter) |
| ||||
|
|
| ||||
|
c/o BNY Mellon Investment Adviser, Inc. 240 Greenwich Street New York, New York 10286 |
| ||||
| (Address of principal executive offices) (Zip code) |
| ||||
|
|
| ||||
| Bennett A. MacDougall, Esq. 240 Greenwich Street New York, New York 10286 |
| ||||
| (Name and address of agent for service) |
| ||||
| ||||||
Registrant's telephone number, including area code: | (212) 922-6400 | |||||
|
| |||||
Date of fiscal year end:
| 11/30 |
| ||||
Date of reporting period: | 11/30/19
|
| ||||
The following N-CSR relates only to the Registrant's series listed below and does not relate to any series of the Registrant with a different fiscal year end and, therefore, different N-CSR reporting requirements. A separate N-CSR will be filed for any series with a different fiscal year end, as appropriate.
BNY Mellon Select Managers Small Cap Value Fund
BNY Mellon U.S. Equity Fund
BNY Mellon Global Stock Fund
BNY Mellon International Stock Fund
FORM N-CSR
Item 1. Reports to Stockholders.
BNY Mellon Global Stock Fund
ANNUAL REPORT November 30, 2019 |
|

Save time. Save paper. View your next shareholder report online as soon as it’s available. Log into www.bnymellonim.com/us and sign up for eCommunications. It’s simple and only takes a few minutes. |
The views expressed in this report reflect those of the portfolio manager(s) only through the end of the period covered and do not necessarily represent the views of BNY Mellon Investment Adviser, Inc. or any other person in the BNY Mellon Investment Adviser, Inc. organization. Any such views are subject to change at any time based upon market or other conditions and BNY Mellon Investment Adviser, Inc. disclaims any responsibility to update such views. These views may not be relied on as investment advice and, because investment decisions for a fund in the BNY Mellon Family of Funds are based on numerous factors, may not be relied on as an indication of trading intent on behalf of any fund in the BNY Mellon Family of Funds. |
Not FDIC-Insured • Not Bank-Guaranteed • May Lose Value |
Contents
THE FUND
BNY Mellon Investment Adviser, Inc. | |
With Those of Other Funds | |
in Affiliated Issuers | |
Currency Exchange Contracts | |
Public Accounting Firm | |
the Fund’s Management and | |
Sub-Investment | |
Advisory Agreements | |
FOR MORE INFORMATION
Back Cover
| The Fund |
A LETTER FROM THE PRESIDENT OF BNY MELLON INVESTMENT ADVISER, INC.
Dear Shareholder:
We are pleased to present this annual report for BNY Mellon Global Stock Fund (formerly, Global Stock Fund), covering the 12-month period from December 1, 2018 through November 30, 2019. For information about how the fund performed during the reporting period, as well as general market perspectives, we provide a Discussion of Fund Performance on the pages that follow.
In December 2018, stocks experienced a sharp sell-off, as it appeared that the U.S. Federal Reserve (the “Fed”) would maintain its hawkish stance on monetary policy. In January 2019, a pivot in stance from the Fed helped stimulate a rebound across equity markets that continued into the second quarter. Escalating trade tensions disrupted equity markets again in May. The dip was short-lived, as markets rose once again in June and July of 2019, when a trade deal appeared more likely, and the pace of U.S. economic growth remained steady. Nevertheless, concerns over slowing global growth persisted, resulting in bouts of market volatility in August 2019. Stocks rebounded in September and continued an upward path through most of October 2019, supported in part by central bank policy and consistent consumer spending. Near the end of the period, an announcement by President Trump that the first phase of a trade deal with China had been achieved sent U.S. markets to record highs.
In fixed-income markets, a risk-off mentality prevailed to start the period, fueled in part by equity market volatility. A flight to quality supported price increases for U.S. Treasuries, which continued through the end of 2018, leading to a flattening yield curve. After the Fed’s supportive statements in January 2019, other developed-market central banks followed suit and reiterated their abilities to bolster flagging growth by continuing accommodative policies. After taking into account the 25-basis-point increase in December 2018, there was a net decrease of 50 basis points in the federal funds rate during the reporting period. Rates across much of the Treasury curve saw a slight increase during the month of November. However, demand for fixed-income instruments during much of the reporting period was strong, which helped to support positive bond market returns.
We believe that over the near term, the outlook for the U.S. remains positive, but we will monitor relevant data for any signs of a change. As always, we encourage you to discuss the risks and opportunities in today’s investment environment with your financial advisor.
Thank you for your continued confidence and support.
Sincerely,

Renee LaRoche-Morris
President
BNY Mellon Investment Adviser, Inc.
December 16, 2019
2
DISCUSSION OF FUND PERFORMANCE(Unaudited)
For the period from December 1, 2018 through November 30, 2019, as provided by Charlie Macquaker, Roy Leckie and Jane Henderson, the three members of the Investment Executive at Walter Scott& Partners Limited (WS), Sub-Investment Adviser
Market and Fund Performance Overview
For the12-month period ended November 30, 2019, the BNY Mellon Global Stock Fund (formerly, Global Stock Fund) Class A shares achieved a total return of 17.04%, Class C shares returned 16.12%, Class I shares returned 17.32% and Class Y shares returned 17.36%.1 For the same period, the fund’s benchmark, the MSCI World Index (the “Index”), achieved a total return of 14.53%.2
Global equities advanced despite pockets of volatility during the reporting period, bolstered by supportive central bank policies. Effective stock selection, particularly within the health care and consumer discretionary sectors, contributed to the fund outperforming the Index.
The Fund’s Investment Approach
The fund seeks long-term total return. To pursue its goal, the fund normally invests at least 80% of its net assets, plus any borrowings for investment purposes, in stocks. The fund’s investments will be focused on companies located in developed markets. The fund ordinarily invests in at least three countries and is not geographically limited in its investment selection but, at times, may invest a substantial portion of its assets in a single country. The fund may invest in the securities of companies of any market capitalization. Walter Scott seeks investment opportunities in companies with fundamental strengths that indicate the potential for sustainable growth. Walter Scott focuses on individual stock selection, building the fund’s portfolio from the bottom up through extensive fundamental research. The investment process begins with the screening of reported company financials. Companies that meet certain broad, absolute and trend criteria are candidates for more detailed financial analysis. The fund’s Investment Team collectively reviews and selects those stocks that meet Walter Scott’s criteria, and where the expected growth rate is combined with a reasonable valuation for the underlying equity. Geographic and sector allocations are the result of, not part of, the investment process, because the Investment Team’s sole focus is on the analysis of and investment in individual companies.
Markets Pivot on Central Bank and Trade Activity
During the fourth quarter of 2018, many equity markets felt pressure from slowing global growth, escalating trade issues between the U.S. and China, Brexit difficulties and additional geopolitical issues elsewhere in Europe and the emerging markets. In December 2018, equities reached new lows for the year, as economic and political news continued to unnerve investors. Investors also feared the European Central Bank (ECB) would proceed with its plan to conclude stimulus measures in January, despite moderating growth rates.
January 2019 marked a turnaround in the markets. Talk of a potential trade deal between the U.S. and China helped fuel investor optimism, as equity prices recovered. The ECB announced it would provide additional stimulus to support the eurozone economy. China also announced plans to stoke its slowing economic growth rate. At its first meeting of the year, the U.S. Federal Reserve (the “Fed”) emphasized its focus on data as a primary driver
3
DISCUSSION OF FUND PERFORMANCE(Unaudited) (continued)
for rate-hike decisions, and its ability to suspend additional rate increases when the data is not supportive. These sentiments reassured investors of central bankers’ commitments to support flagging growth. The rebound continued throughout the month of January, and equity markets maintained an upward trajectory through April 2019. However, in May renewed trade tensions between the U.S. and China caused stocks to pull back once again. The dip was short-lived, as markets rose once again in June. At the end of Julyand again in September and October, the Fed cut the federal funds rate by 25 basis points.Supported by supportive central bank policies, optimism regarding United Kingdom election outcomes and a preliminary trade agreement between the U.S. and China, equity markets went on to post solid gains the last several months of the period despite occasional pockets of volatility.
Stock Selection Buoyed Fund Results
The fund’s positive results compared to the Index stemmed from the success of our security selection. Stock picks within the health care and consumer discretionary sectors, as well as among companies within Europe ex-U.K. and the U.S., were particularly additive. Luxury goods company LVMH Moet Hennessy Louis Vuitton benefited from strong consumer demand, stemming in part from a growing Chinese middle class. Its stock price rose throughout much of the period, and it was a top contributor to relative results. Information technology company Mastercard was also among the top overall contributors to portfolio performance. The payment processing company enjoyed high demand for its services, leading to favorable earnings results. U.S.-based health care company Edwards Lifesciences also contributed to overall results for the period. Its new treatment for aortic stenosis has had success in trials leading to a favorable outlook from investors.
Conversely, stock selection within the energy and information technology sectors detracted from relative returns. The top individual detractors included energy companies EOG Resources and Schlumberger, and eyewear companyEssilorLuxottica. U.S.-based energy companies EOG Resources and Schlumberger were hurt by shifts in oil prices during the period. Concerns regarding future demand for oil also continue to weigh on the industry as a whole. Within the sector, China-based CNOOC was also a top detractor. France-based eyewear companyEssilorLuxottica weighed on results. The company has struggled after the merger of the large frame and lens manufacturers. We have since exited the position.
Maintaining a Company-by-Company Approach
Although we do not manage the fund’s investments in response to macroeconomic trends, it is worth noting that while central banks are providing support, it appears as though economic growth rates around the globe may be slowing. We also believe the level of corporate leverage may be rising. We think that when slower growth and higher debt levels combine with reduced profit margins due to rising labor costs, it might begin to separate financially and fundamentally strong companies from the weaker organizations.
In that context, our focus remains very much unchanged. We must continue to identify and invest in market-leading, financially robust companies with the strategic strengths and vision to generate meaningful returns over the long term. Our distinctly long-term lens allows us to focus on the underlying strengths and opportunities of a business. Not only does that approach mean we waste very little time trying to second-guess short-term market moves, but it ensures we are invested in companies that have the attributes we believe are needed to succeed, regardless of the external environment in which they operate. We will continue to
4
look for opportunities that benefit investors, capturing gains when the market rallies and adding to fundamentally strong companies when the market pulls back.
December 16, 2019
1 Total return includes reinvestment of dividends and any capital gains paid and does not take into consideration the maximum initial sales charge in the case of Class A shares, or the applicable contingent deferred sales charge imposed on redemptions in the case of Class C shares. Had these charges been reflected, returns would have been lower. Past performance is no guarantee of future results. Share price, yield and investment return fluctuate such that upon redemption, fund shares may be worth more or less than their original cost.
2 Source: Lipper Inc. — The MSCI World Index is a free float-adjusted market capitalization-weighted index that is designed to measure the equity market performance of developed markets. It reflects reinvestment of net dividends and, where applicable, capital gain distributions. Investors cannot invest directly in any index.
Please note: the position in any security highlighted with italicized typeface was sold during the reporting period.
Equities are subject generally to market, market sector, market liquidity, issuer and investment style risks, among other factors, to varying degrees, all of which are more fully described in the fund’s prospectus.
Investing internationally involves special risks, including changes in currency exchange rates, political, economic, and social instability, a lack of comprehensive company information, differing auditing and legal standards, and less market liquidity. These risks generally are greater with emerging-market countries than with more economically and politically established foreign countries.
The fund may, but is not required to, use derivative instruments, such as options, futures, options on futures, forward contracts and other credit derivatives. A small investment in derivatives could have a potentially large impact on the fund’s performance. The use of derivatives involves risks different from, or possibly greater than, the risks associated with investing directly in the underlying assets.
5
FUND PERFORMANCE(Unaudited)
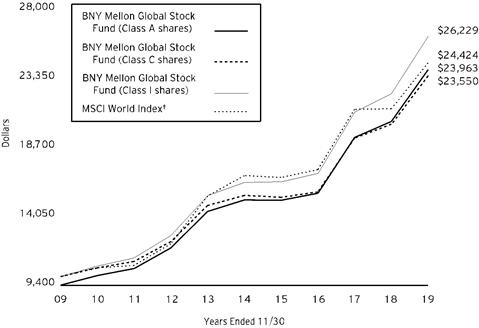
Comparison of change in value of a $10,000 investment in Class A shares, Class C shares and Class I shares of BNY Mellon Global Stock Fund with a hypothetical investment of $10,000 in the MSCI World Index (the “Index”)
† Source: Lipper Inc.
Past performance is not predictive of future performance.
The above graph compares a hypothetical $10,000 investment made in Class A, Class C and Class I shares of BNY Mellon Global Stock Fund on 11/30/09 to a hypothetical investment of $10,000 made in the Index on that date. All dividends and capital gain distributions are reinvested.
The fund’s performance shown in the line graph above takes into account the maximum initial sales charge on Class A shares and all other applicable fees and expenses on Class A, Class C and Class I shares. The Index is a free float-adjusted market capitalization-weighted index that is designed to measure the equity market performance of developed markets. Unlike a mutual fund, the Index is not subject to charges, fees and other expenses. Investors cannot invest directly in any index. Further information relating to fund performance, including expense reimbursements, if applicable, is contained in the Financial Highlights section of the prospectus and elsewhere in this report.
6
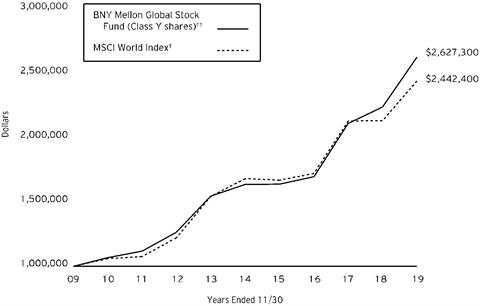
Comparison of change in value of a $1,000,000 investment in Class Y shares of BNY Mellon Global Stock Fund with a hypothetical investment of $1,000,000 in the MSCI World Index (the “Index”)
† Source: Lipper Inc.
†† The total return figures presented for Class Y shares of the fund reflect the performance of the fund’s Class A shares for the period prior to 7/1/13 (the inception date for Class Y shares), not reflecting the applicable sales charges for Class A shares.
Past performance is not predictive of future performance.
The above graph compares a hypothetical $1,000,000 investment made in Class Y shares of BNY Mellon Global Stock Fund on 11/30/09 to a hypothetical investment of $1,000,000 made in the Index on that date. All dividends and capital gain distributions are reinvested.
The fund’s performance shown in the line graph above takes into account all applicable fees and expenses on the fund’s Class Y shares. The Index is a free float-adjusted market capitalization-weighted index that is designed to measure the equity market performance of developed markets. Unlike a mutual fund, the Index is not subject to charges, fees and other expenses. Investors cannot invest directly in any index. Further information relating to fund performance, including expense reimbursements, if applicable, is contained in the Financial Highlights section of the prospectus and elsewhere in this report.
7
FUND PERFORMANCE(Unaudited) (continued)
Average Annual Total Returnsas of 11/30/19 | ||||
| Inception | 1 Year | 5 Years | 10 Years |
Class A shares | ||||
with maximum sales charge (5.75%) | 12/29/06 | 10.29% | 8.29% | 9.13% |
without sales charge | 12/29/06 | 17.04% | 9.58% | 9.78% |
Class C shares | ||||
with applicable redemption charge† | 12/29/06 | 15.12% | 8.76% | 8.94% |
without redemption | 12/29/06 | 16.12% | 8.76% | 8.94% |
Class I shares | 12/29/06 | 17.32% | 9.89% | 10.12% |
Class Y shares | 7/1/13 | 17.36% | 9.94% | 10.14%†† |
MSCI World Index | 14.53% | 7.75% | 9.34% | |
† The maximum contingent deferred sales charge for Class C shares is 1% for shares redeemed within one year of the date of purchase.
†† The total return performance figures presented for Class Y shares of the fund reflect the performance of the fund’s Class A shares for the period prior to 7/1/13 (the inception date for Class Y shares), not reflecting the applicable sales charges for Class A shares.
The performance data quoted represents past performance, which is no guarantee of future results. Share price and investment return fluctuate and an investor’s shares may be worth more or less than original cost upon redemption. Current performance may be lower or higher than the performance quoted. Go to www.bnymellonim.com/us for the fund’s most recent month-end returns.
The fund’s performance shown in the graphs and table does not reflect the deduction of taxes that a shareholder would pay on fund distributions or the redemption of fund shares. In addition to the performance of Class A shares shown with and without a maximum sales charge, the fund’s performance shown in the table takes into account all other applicable fees and expenses on all classes.
8
UNDERSTANDING YOUR FUND’S EXPENSES(Unaudited)
As a mutual fund investor, you pay ongoing expenses, such as management fees and other expenses. Using the information below, you can estimate how these expenses affect your investment and compare them with the expenses of other funds. You also may pay one-time transaction expenses, including sales charges (loads) and redemption fees, which are not shown in this section and would have resulted in higher total expenses. For more information, see your fund’s prospectus or talk to your financial adviser.
Review your fund’s expenses
The table below shows the expenses you would have paid on a $1,000 investment in BNY Mellon Global Stock Fund from June 1, 2019 to November 30, 2019. It also shows how much a $1,000 investment would be worth at the close of the period, assuming actual returns and expenses.
Expenses and Value of a $1,000 Investment |
| |||||
Assume actual returns for the six months ended November 30, 2019 |
| |||||
|
|
|
|
|
|
|
|
| Class A | Class C | Class I | Class Y |
|
Expense paid per $1,000† | $6.49 | $10.46 | $5.06 | $4.74 |
| |
Ending value (after expenses) | $1,122.60 | $1,118.00 | $1,124.20 | $1,123.90 |
| |
COMPARING YOUR FUND’S EXPENSES
WITH THOSE OF OTHER FUNDS(Unaudited)
Using the SEC’s method to compare expenses
The Securities and Exchange Commission (“SEC”) has established guidelines to help investors assess fund expenses. Per these guidelines, the table below shows your fund’s expenses based on a $1,000 investment, assuming a hypothetical 5% annualized return. You can use this information to compare the ongoing expenses (but not transaction expenses or total cost) of investing in the fund with those of other funds. All mutual fund shareholder reports will provide this information to help you make this comparison. Please note that you cannot use this information to estimate your actual ending account balance and expenses paid during the period.
Expenses and Value of a $1,000 Investment |
| |||||
Assuming a hypothetical 5% annualized return for the six months ended November 30, 2019 |
| |||||
|
|
|
|
|
|
|
|
| Class A | Class C | Class I | Class Y |
|
Expense paid per $1,000† | $6.17 | $9.95 | $4.81 | $4.51 |
| |
Ending value (after expenses) | $1,018.95 | $1,015.19 | $1,020.31 | $1,020.61 |
| |
†Expenses are equal to the fund’s annualized expense ratio of 1.22% for Class A, 1.97% for Class C, .95% for Class I and .89% for Class Y, multiplied by the average account value over the period, multiplied by 183/365 (to reflect the one-half year period). | ||||||
9
STATEMENT OF INVESTMENTS
November 30, 2019
Description | Shares | Value ($) | |||||
Common Stocks - 97.0% | |||||||
Australia - 2.3% | |||||||
CSL | 169,700 | 32,539,274 | |||||
Canada - 2.1% | |||||||
Alimentation Couche-Tard, Cl. B | 898,600 | 29,400,855 | |||||
China - 1.6% | |||||||
CNOOC | 15,260,000 | 22,145,183 | |||||
Denmark - 2.2% | |||||||
Novo Nordisk, Cl. B | 551,200 | 30,981,177 | |||||
Finland - 1.0% | |||||||
Kone, Cl. B | 235,400 | 14,735,709 | |||||
France - 4.0% | |||||||
L'Oreal | 92,900 | 26,477,410 | |||||
LVMH Moet Hennessy Louis Vuitton | 65,800 | 29,525,934 | |||||
56,003,344 | |||||||
Hong Kong - 4.6% | |||||||
AIA Group | 3,621,800 | 36,273,289 | |||||
CLP Holdings | 1,301,000 | 13,412,114 | |||||
Hong Kong & China Gas | 8,092,465 | 15,423,966 | |||||
65,109,369 | |||||||
Ireland - 2.0% | |||||||
Experian | 843,000 | 27,944,237 | |||||
Japan - 8.6% | |||||||
FANUC | 138,100 | 26,375,958 | |||||
Keyence | 126,428 | 43,245,757 | |||||
Shin-Etsu Chemical | 307,800 | 32,929,862 | |||||
SMC | 41,500 | 18,809,693 | |||||
121,361,270 | |||||||
Spain - 2.2% | |||||||
Industria de Diseno Textil | 993,900 | 30,944,124 | |||||
Switzerland - 7.7% | |||||||
Alcon | 34,211 | a | 1,888,789 | ||||
Nestle | 254,200 | 26,416,464 | |||||
Novartis | 267,400 | 24,616,844 | |||||
Roche Holding | 115,000 | 35,443,000 | |||||
SGS | 7,900 | 20,555,800 | |||||
108,920,897 | |||||||
Taiwan - 2.6% | |||||||
Taiwan Semiconductor Manufacturing, ADR | 692,000 | b | 36,738,280 | ||||
United Kingdom - 5.7% | |||||||
Compass Group | 1,018,000 | 24,943,561 | |||||
Linde | 140,000 | 28,869,400 | |||||
10
Description | Shares | Value ($) | |||||
Common Stocks - 97.0% (continued) | |||||||
United Kingdom - 5.7% (continued) | |||||||
Reckitt Benckiser Group | 343,000 | 26,909,932 | |||||
80,722,893 | |||||||
United States - 50.4% | |||||||
Adobe | 101,400 | a | 31,386,342 | ||||
Alphabet, Cl. C | 26,297 | a | 34,316,533 | ||||
Amphenol, Cl. A | 277,500 | 28,860,000 | |||||
Automatic Data Processing | 174,900 | 29,869,422 | |||||
Booking Holdings | 14,410 | a | 27,437,072 | ||||
Cerner | 419,400 | 30,024,846 | |||||
Cisco Systems | 523,700 | 23,728,847 | |||||
Cognizant Technology Solutions, Cl. A | 431,461 | 27,660,965 | |||||
Colgate-Palmolive | 358,100 | 24,286,342 | |||||
Edwards Lifesciences | 135,100 | a | 33,091,394 | ||||
EOG Resources | 383,800 | 27,211,420 | |||||
Fastenal | 930,000 | 33,033,600 | |||||
Gilead Sciences | 262,000 | 17,616,880 | |||||
Intuitive Surgical | 50,200 | a | 29,763,580 | ||||
IPG Photonics | 92,700 | a,b | 13,171,743 | ||||
Johnson & Johnson | 186,200 | 25,600,638 | |||||
Mastercard, Cl. A | 124,000 | 36,236,520 | |||||
Microsoft | 258,000 | 39,056,040 | |||||
NIKE, Cl. B | 294,000 | 27,486,060 | |||||
Oracle | 485,300 | 27,244,742 | |||||
Schlumberger | 351,600 | 12,727,920 | |||||
Starbucks | 264,616 | 22,606,145 | |||||
Stryker | 128,200 | 26,263,052 | |||||
The TJX Companies | 499,700 | 30,546,661 | |||||
The Walt Disney Company | 190,400 | 28,860,832 | |||||
Waters | 106,900 | a | 23,739,283 | ||||
711,826,879 | |||||||
Total Common Stocks(cost $707,727,177) | 1,369,373,491 | ||||||
11
STATEMENT OF INVESTMENTS (continued)
Description | 1-Day | Shares | Value ($) | ||||
Investment Companies - 2.8% | |||||||
Registered Investment Companies - 2.8% | |||||||
Dreyfus Institutional Preferred Government Plus Money Market Fund | 1.63 | 39,996,991 | c | 39,996,991 | |||
Total Investments(cost $747,724,168) | 99.8% | 1,409,370,482 | |||||
Cash and Receivables (Net) | .2% | 2,238,286 | |||||
Net Assets | 100.0% | 1,411,608,768 | |||||
ADR—American Depository Receipt
a Non-income producing security.
b Security, or portion thereof, on loan. At November 30, 2019, the value of the fund’s securities on loan was $18,134,122 and the value of the collateral was $18,820,902, consisting of U.S. Government & Agency securities.
c Investment in affiliated issuer. The investment objective of this investment company is publicly available and can be found within the investment company’s prospectus.
Portfolio Summary (Unaudited)† | Value (%) |
Software & Services | 13.5 |
Pharmaceuticals Biotechnology & Life Sciences | 13.5 |
Health Care Equipment & Services | 8.6 |
Technology Hardware & Equipment | 7.7 |
Capital Goods | 6.6 |
Retailing | 6.3 |
Household & Personal Products | 5.5 |
Media & Entertainment | 4.5 |
Energy | 4.4 |
Materials | 4.4 |
Consumer Durables & Apparel | 4.0 |
Commercial & Professional Services | 3.4 |
Consumer Services | 3.4 |
Investment Companies | 2.8 |
Semiconductors & Semiconductor Equipment | 2.6 |
Insurance | 2.6 |
Food & Staples Retailing | 2.1 |
Utilities | 2.0 |
Food, Beverage & Tobacco | 1.9 |
99.8 |
† Based on net assets.
See notes to financial statements.
12
STATEMENT OF INVESTMENTS IN AFFILIATED ISSUERS
Investment Companies | Value | Purchases($) | Sales($) | Value | Net | Dividends/ |
Registered Investment Companies; | ||||||
Dreyfus Institutional Preferred Government Plus Money Market Fund | 23,177,506 | 246,150,478 | 229,330,993 | 39,996,991 | 2.8 | 645,341 |
See notes to financial statements.
13
STATEMENT OF FORWARD FOREIGN CURRENCY EXCHANGE CONTRACTSNovember 30, 2019
Counterparty/ Purchased | Purchased Currency | Currency | Sold | Settlement Date | Unrealized Appreciation (Depreciation)($) |
National Australia Bank | |||||
United States Dollar | 343,364 | Swiss Franc | 342,840 | 12/3/19 | 432 |
United States Dollar | 115,002 | Swiss Franc | 115,032 | 12/2/19 | (53) |
Gross Unrealized Appreciation | 432 | ||||
Gross Unrealized Depreciation | (53) | ||||
See notes to financial statements.
14
STATEMENT OF ASSETS AND LIABILITIES
November 30, 2019
|
|
|
|
|
|
|
|
|
| Cost |
| Value |
|
Assets ($): |
|
|
|
| ||
Investments in securities—See Statement of Investments |
|
|
| |||
Unaffiliated issuers | 707,727,177 |
| 1,369,373,491 |
| ||
Affiliated issuers |
| 39,996,991 |
| 39,996,991 |
| |
Cash denominated in foreign currency |
|
| 64,425 |
| 64,425 |
|
Tax reclaim receivable |
| 1,897,745 |
| |||
Dividends, interest and securities lending income receivable |
| 665,780 |
| |||
Receivable for shares of Common Stock subscribed |
| 636,719 |
| |||
Receivable for investment securities sold |
| 458,244 |
| |||
Unrealized appreciation on forward foreign |
| 432 |
| |||
Prepaid expenses |
|
|
|
| 47,009 |
|
|
|
|
|
| 1,413,140,836 |
|
Liabilities ($): |
|
|
|
| ||
Due to BNY Mellon Investment Adviser, Inc. and affiliates—Note 3(c) |
| 1,019,009 |
| |||
Payable for investment securities purchased |
| 90,531 |
| |||
Payable for shares of Common Stock redeemed |
| 39,306 |
| |||
Directors’ fees and expenses payable |
| 29,138 |
| |||
Unrealized depreciation on forward foreign |
| 53 |
| |||
Other accrued expenses |
|
|
|
| 354,031 |
|
|
|
|
|
| 1,532,068 |
|
Net Assets ($) |
|
| 1,411,608,768 |
| ||
Composition of Net Assets ($): |
|
|
|
| ||
Paid-in capital |
|
|
|
| 679,973,483 |
|
Total distributable earnings (loss) |
|
|
|
| 731,635,285 |
|
Net Assets ($) |
|
| 1,411,608,768 |
| ||
Net Asset Value Per Share | Class A | Class C | Class I | Class Y |
|
Net Assets ($) | 35,891,240 | 11,259,720 | 965,480,862 | 398,976,946 |
|
Shares Outstanding | 1,556,062 | 505,841 | 41,194,420 | 17,042,119 |
|
Net Asset Value Per Share ($) | 23.07 | 22.26 | 23.44 | 23.41 |
|
|
|
|
|
|
|
See notes to financial statements. |
|
|
|
|
|
15
STATEMENT OF OPERATIONS
Year Ended November 30, 2019
|
|
|
|
|
|
|
|
|
|
|
|
|
|
Investment Income ($): |
|
|
|
| ||
Income: |
|
|
|
| ||
Cash dividends (net of $1,555,712 foreign taxes withheld at source): |
| |||||
Unaffiliated issuers |
|
| 21,328,537 |
| ||
Affiliated issuers |
|
| 645,341 |
| ||
Income from securities lending—Note 1(c) |
|
| 390 |
| ||
Total Income |
|
| 21,974,268 |
| ||
Expenses: |
|
|
|
| ||
Management fee—Note 3(a) |
|
| 11,091,098 |
| ||
Shareholder servicing costs—Note 3(c) |
|
| 834,227 |
| ||
Directors’ fees and expenses—Note 3(d) |
|
| 143,108 |
| ||
Registration fees |
|
| 106,715 |
| ||
Professional fees |
|
| 88,346 |
| ||
Distribution fees—Note 3(b) |
|
| 85,193 |
| ||
Custodian fees—Note 3(c) |
|
| 72,177 |
| ||
Loan commitment fees—Note 2 |
|
| 29,771 |
| ||
Prospectus and shareholders’ reports |
|
| 16,521 |
| ||
Interest expense—Note 2 |
|
| 10,121 |
| ||
Miscellaneous |
|
| 50,414 |
| ||
Total Expenses |
|
| 12,527,691 |
| ||
Investment Income—Net |
|
| 9,446,577 |
| ||
Realized and Unrealized Gain (Loss) on Investments—Note 4 ($): |
|
| ||||
Net realized gain (loss) on investments and foreign currency transactions | 60,606,388 |
| ||||
Net realized gain (loss) on forward foreign currency exchange contracts | 62,485 |
| ||||
Net Realized Gain (Loss) |
|
| 60,668,873 |
| ||
Net change in unrealized appreciation (depreciation) on investments | 136,553,296 |
| ||||
Net change in unrealized appreciation (depreciation) on | 379 |
| ||||
Net Change in Unrealized Appreciation (Depreciation) |
|
| 136,553,675 |
| ||
Net Realized and Unrealized Gain (Loss) on Investments |
|
| 197,222,548 |
| ||
Net Increase in Net Assets Resulting from Operations |
| 206,669,125 |
| |||
|
|
|
|
|
|
|
See notes to financial statements. | ||||||
16
STATEMENT OF CHANGES IN NET ASSETS
|
|
|
| Year Ended November 30, | |||||
|
|
|
| 2019 |
| 2018 |
| ||
Operations ($): |
|
|
|
|
|
|
|
| |
Investment income—net |
|
| 9,446,577 |
|
|
| 9,896,253 |
| |
Net realized gain (loss) on investments |
| 60,668,873 |
|
|
| 66,337,018 |
| ||
Net change in unrealized appreciation |
| 136,553,675 |
|
|
| (1,553,679) |
| ||
Net Increase (Decrease) in Net Assets | 206,669,125 |
|
|
| 74,679,592 |
| |||
Distributions ($): |
| ||||||||
Distributions to shareholders: |
|
|
|
|
|
|
|
| |
Class A |
|
| (1,799,691) |
|
|
| (1,955,958) |
| |
Class C |
|
| (640,910) |
|
|
| (813,025) |
| |
Class I |
|
| (51,481,375) |
|
|
| (67,086,813) |
| |
Class Y |
|
| (22,311,843) |
|
|
| (26,820,605) |
| |
Total Distributions |
|
| (76,233,819) |
|
|
| (96,676,401) |
| |
Capital Stock Transactions ($): |
| ||||||||
Net proceeds from shares sold: |
|
|
|
|
|
|
|
| |
Class A |
|
| 12,438,564 |
|
|
| 6,806,536 |
| |
Class C |
|
| 1,796,550 |
|
|
| 1,267,328 |
| |
Class I |
|
| 215,010,563 |
|
|
| 96,404,757 |
| |
Class Y |
|
| 40,324,262 |
|
|
| 22,873,279 |
| |
Distributions reinvested: |
|
|
|
|
|
|
|
| |
Class A |
|
| 1,638,465 |
|
|
| 1,751,194 |
| |
Class C |
|
| 556,100 |
|
|
| 677,592 |
| |
Class I |
|
| 50,175,551 |
|
|
| 65,070,306 |
| |
Class Y |
|
| 12,366,588 |
|
|
| 14,346,019 |
| |
Cost of shares redeemed: |
|
|
|
|
|
|
|
| |
Class A |
|
| (10,710,880) |
|
|
| (4,167,162) |
| |
Class C |
|
| (3,220,482) |
|
|
| (3,825,259) |
| |
Class I |
|
| (247,315,145) |
|
|
| (189,562,441) |
| |
Class Y |
|
| (49,605,893) |
|
|
| (27,820,801) |
| |
Increase (Decrease) in Net Assets | 23,454,243 |
|
|
| (16,178,652) |
| |||
Total Increase (Decrease) in Net Assets | 153,889,549 |
|
|
| (38,175,461) |
| |||
Net Assets ($): |
| ||||||||
Beginning of Period |
|
| 1,257,719,219 |
|
|
| 1,295,894,680 |
| |
End of Period |
|
| 1,411,608,768 |
|
|
| 1,257,719,219 |
| |
17
STATEMENT OF CHANGES IN NET ASSETS (continued)
|
|
|
| Year Ended November 30, | |||||
|
|
|
| 2019 |
| 2018 |
| ||
Capital Share Transactions (Shares): |
| ||||||||
Class Aa,b |
|
|
|
|
|
|
|
| |
Shares sold |
|
| 582,005 |
|
|
| 323,340 |
| |
Shares issued for distributions reinvested |
|
| 88,902 |
|
|
| 87,081 |
| |
Shares redeemed |
|
| (507,747) |
|
|
| (200,912) |
| |
Net Increase (Decrease) in Shares Outstanding | 163,160 |
|
|
| 209,509 |
| |||
Class Cb |
|
|
|
|
|
|
|
| |
Shares sold |
|
| 90,221 |
|
|
| 62,387 |
| |
Shares issued for distributions reinvested |
|
| 31,050 |
|
|
| 34,553 |
| |
Shares redeemed |
|
| (154,777) |
|
|
| (186,150) |
| |
Net Increase (Decrease) in Shares Outstanding | (33,506) |
|
|
| (89,210) |
| |||
Class Ia |
|
|
|
|
|
|
|
| |
Shares sold |
|
| 10,006,624 |
|
|
| 4,533,874 |
| |
Shares issued for distributions reinvested |
|
| 2,684,620 |
|
|
| 3,194,419 |
| |
Shares redeemed |
|
| (11,616,858) |
|
|
| (8,908,304) |
| |
Net Increase (Decrease) in Shares Outstanding | 1,074,386 |
|
|
| (1,180,011) |
| |||
Class Ya |
|
|
|
|
|
|
|
| |
Shares sold |
|
| 1,901,931 |
|
|
| 1,059,610 |
| |
Shares issued for distributions reinvested |
|
| 662,732 |
|
|
| 705,311 |
| |
Shares redeemed |
|
| (2,290,751) |
|
|
| (1,305,570) |
| |
Net Increase (Decrease) in Shares Outstanding | 273,912 |
|
|
| 459,351 |
| |||
|
|
|
|
|
|
|
|
|
|
aDuring the period ended November 30, 2019, 151,556 Class Y shares representing $3,285,319 were exchanged for 151,333 Class I shares, 1,359 Class A shares representing $29,117 were exchanged for 1,339 Class I shares and 82 Class C shares representing $1,754 were exchanged for 78 Class I shares. During the period ended November 30, 2018, 2,769 Class A shares representing $55,424 were exchanged for 2,734 Class I shares, 8,179 Class Y shares representing $174,775 were exchanged for 8,279 Class A shares, 159,334 Class Y shares representing $3,358,669 were exchanged for 159,097 Class I shares. | |||||||||
bDuring the period ended November 30, 2018, 304 Class C shares representing $6,331 were automatically converted to 295 Class A shares. | |||||||||
See notes to financial statements. | |||||||||
18
FINANCIAL HIGHLIGHTS
The following tables describe the performance for each share class for the fiscal periods indicated. All information (except portfolio turnover rate) reflects financial results for a single fund share. Total return shows how much your investment in the fund would have increased (or decreased) during each period, assuming you had reinvested all dividends and distributions. These figures have been derived from the fund’s financial statements.
Year Ended November 30, | ||||||
Class A Shares | 2019 | 2018 | 2017 | 2016 | 2015 | |
Per Share Data ($): | ||||||
Net asset value, beginning of period | 21.08 | 21.53 | 17.51 | 18.66 | 18.89 | |
Investment Operations: | ||||||
Investment income—neta | .10 | .11 | .11 | .11 | .13 | |
Net realized and unrealized | 3.17 | 1.02 | 4.06 | .42 | (.14) | |
Total from Investment Operations | 3.27 | 1.13 | 4.17 | .53 | (.01) | |
Distributions: | ||||||
Dividends from | (.12) | (.15) | (.09) | (.19) | (.13) | |
Dividends from net realized | (1.16) | (1.43) | (.06) | (1.49) | (.09) | |
Total Distributions | (1.28) | (1.58) | (.15) | (1.68) | (.22) | |
Net asset value, end of period | 23.07 | 21.08 | 21.53 | 17.51 | 18.66 | |
Total Return (%) | 17.04 | 5.61 | 24.04 | 3.19 | (.13) | |
Ratios/Supplemental Data (%): | ||||||
Ratio of total expenses | 1.21 | 1.20 | 1.22 | 1.22 | 1.23 | |
Ratio of net expenses | 1.21 | 1.20 | 1.22 | 1.22 | 1.23 | |
Ratio of net investment income | .46 | .52 | .60 | .63 | .71 | |
Portfolio Turnover Rate | 6.62 | 8.15 | 6.50 | 11.79 | 10.82 | |
Net Assets, end of period ($ x 1,000) | 35,891 | 29,369 | 25,477 | 34,844 | 43,698 | |
a Based on average shares outstanding.
b Exclusive of sales charge.
See notes to financial statements.
19
FINANCIAL HIGHLIGHTS (continued)
Year Ended November 30, | ||||||
Class C Shares | 2019 | 2018 | 2017 | 2016 | 2015 | |
Per Share Data ($): | ||||||
Net asset value, beginning of period | 20.41 | 20.89 | 17.03 | 18.18 | 18.42 | |
Investment Operations: | ||||||
Investment (loss)—neta | (.05) | (.05) | (.02) | (.02) | (.01) | |
Net realized and unrealized | 3.06 | 1.00 | 3.94 | .40 | (.14) | |
Total from Investment Operations | 3.01 | .95 | 3.92 | .38 | (.15) | |
Distributions: | ||||||
Dividends from | - | - | - | (.04) | - | |
Dividends from net realized | (1.16) | (1.43) | (.06) | (1.49) | (.09) | |
Total Distributions | (1.16) | (1.43) | (.06) | (1.53) | (.09) | |
Net asset value, end of period | 22.26 | 20.41 | 20.89 | 17.03 | 18.18 | |
Total Return (%)b | 16.12 | 4.85 | 23.11 | 2.36 | (.83) | |
Ratios/Supplemental Data (%): | ||||||
Ratio of total expenses | 1.96 | 1.97 | 1.99 | 1.99 | 1.99 | |
Ratio of net expenses | 1.96 | 1.97 | 1.99 | 1.99 | 1.99 | |
Ratio of net investment | (.25) | (.22) | (.10) | (.13) | (.07) | |
Portfolio Turnover Rate | 6.62 | 8.15 | 6.50 | 11.79 | 10.82 | |
Net Assets, end of period ($ x 1,000) | 11,260 | 11,008 | 13,132 | 13,258 | 16,303 | |
a Based on average shares outstanding.
b Exclusive of sales charge.
See notes to financial statements.
20
Year Ended November 30, | ||||||
Class I Shares | 2019 | 2018 | 2017 | 2016 | 2015 | |
Per Share Data ($): | ||||||
Net asset value, beginning of period | 21.41 | 21.83 | 17.76 | 18.92 | 19.18 | |
Investment Operations: | ||||||
Investment income—neta | .15 | .17 | .18 | .16 | .20 | |
Net realized and unrealized | 3.21 | 1.04 | 4.10 | .43 | (.16) | |
Total from Investment Operations | 3.36 | 1.21 | 4.28 | .59 | .04 | |
Distributions: | ||||||
Dividends from | (.17) | (.20) | (.15) | (.26) | (.21) | |
Dividends from net realized | (1.16) | (1.43) | (.06) | (1.49) | (.09) | |
Total Distributions | (1.33) | (1.63) | (.21) | (1.75) | (.30) | |
Net asset value, end of period | 23.44 | 21.41 | 21.83 | 17.76 | 18.92 | |
Total Return (%) | 17.32 | 5.89 | 24.40 | 3.50 | .20 | |
Ratios/Supplemental Data (%): | ||||||
Ratio of total expenses | .97 | .94 | .98 | .91 | .91 | |
Ratio of net expenses | .97 | .94 | .98 | .91 | .91 | |
Ratio of net investment income | .71 | .78 | .92 | .93 | 1.05 | |
Portfolio Turnover Rate | 6.62 | 8.15 | 6.50 | 11.79 | 10.82 | |
Net Assets, end of period ($ x 1,000) | 965,481 | 858,817 | 901,556 | 915,049 | 809,432 | |
a Based on average shares outstanding.
See notes to financial statements.
21
FINANCIAL HIGHLIGHTS (continued)
Year Ended November 30, | ||||||
Class Y Shares | 2019 | 2018 | 2017 | 2016 | 2015 | |
Per Share Data ($): | ||||||
Net asset value, beginning of period | 21.38 | 21.81 | 17.74 | 18.90 | 19.16 | |
Investment Operations: | ||||||
Investment income—neta | .17 | .18 | .19 | .17 | .19 | |
Net realized and unrealized | 3.20 | 1.04 | 4.10 | .42 | (.15) | |
Total from Investment Operations | 3.37 | 1.22 | 4.29 | .59 | .04 | |
Distributions: | ||||||
Dividends from | (.18) | (.22) | (.16) | (.26) | (.21) | |
Dividends from net realized | (1.16) | (1.43) | (.06) | (1.49) | (.09) | |
Total Distributions | (1.34) | (1.65) | (.22) | (1.75) | (.30) | |
Net asset value, end of period | 23.41 | 21.38 | 21.81 | 17.74 | 18.90 | |
Total Return (%) | 17.36 | 5.98 | 24.47 | 3.51 | .21 | |
Ratios/Supplemental Data (%): | ||||||
Ratio of total expenses | .89 | .89 | .90 | .89 | .90 | |
Ratio of net expenses | .89 | .89 | .90 | .89 | .90 | |
Ratio of net investment income | .80 | .85 | .99 | .95 | 1.03 | |
Portfolio Turnover Rate | 6.62 | 8.15 | 6.50 | 11.79 | 10.82 | |
Net Assets, end of period ($ x 1,000) | 398,977 | 358,526 | 355,729 | 304,547 | 341,823 | |
a Based on average shares outstanding.
See notes to financial statements.
22
NOTES TO FINANCIAL STATEMENTS
NOTE 1—Significant Accounting Policies:
BNY Mellon Global Stock Fund (the “fund”) is a separate diversified series of BNY Mellon Strategic Funds, Inc. (the “Company”), which is registered under the Investment Company Act of 1940, as amended (the “Act”), as an open-end management investment company and operates as a series company currently offering six series, including the fund. The fund’s investment objective is to seek long-term total return. BNY Mellon Investment Adviser, Inc. (the “Adviser”), a wholly-owned subsidiary of The Bank of New York Mellon Corporation (“BNY Mellon”), serves as the fund’s investment adviser. Walter Scott & Partners Limited (the “Sub-Adviser”), a wholly-owned subsidiary of BNY Mellon and an affiliate of the Adviser, serves as the fund’s sub-investment adviser.
Effective June 3, 2019, the fund changed its name from Global Stock Fund to BNY Mellon Global Stock Fund and the Company changed its name from Strategic Funds, Inc. to BNY Mellon Strategic Funds, Inc. In addition, The Dreyfus Corporation, the fund’s investment adviser, changed its name to “BNY Mellon Investment Adviser, Inc.”, MBSC Securities Corporation, the fund’s distributor, changed its name to “BNY Mellon Securities Corporation” and Dreyfus Transfer, Inc., the fund’s transfer agent, changed its name to “BNY Mellon Transfer, Inc.”
BNY Mellon Securities Corporation (the “Distributor”), a wholly-owned subsidiary of the Adviser, is the distributor of the fund’s shares. The fund is authorized to issue 600 million shares of $.001 par value Common Stock. The fund currently has authorized five classes of shares: Class A (100 million shares authorized), Class C (100 million shares authorized), Class I (200 million shares authorized), Class T (100 million shares authorized) and Class Y (100 million shares authorized). Class A and Class T shares generally are subject to a sales charge imposed at the time of purchase. Class C shares are subject to a contingent deferred sales charge (“CDSC”) imposed on Class C shares redeemed within one year of purchase. Class C shares automatically convert to Class A shares ten years after the date of purchase, without the imposition of a sales charge. Class I and Class Y shares are sold at net asset value per share generally to institutional investors. As of the date of this report, the fund did not offer Class T shares for purchase. Other differences between the classes include the services offered to and the expenses borne by each class, the allocation of certain transfer agency costs and certain voting rights. Income, expenses (other than expenses attributable to a specific class), and realized and
23
NOTES TO FINANCIAL STATEMENTS(continued)
unrealized gains or losses on investments are allocated to each class of shares based on its relative net assets.
The Company accounts separately for the assets, liabilities and operations of each series. Expenses directly attributable to each series are charged to that series’ operations; expenses which are applicable to all series are allocated among them on a pro rata basis.
The Financial Accounting Standards Board (“FASB”) Accounting Standards Codification (“ASC”) is the exclusive reference of authoritative U.S. generally accepted accounting principles (“GAAP”) recognized by the FASB to be applied by nongovernmental entities. Rules and interpretive releases of the Securities and Exchange Commission (“SEC”) under authority of federal laws are also sources of authoritative GAAP for SEC registrants. The fund is an investment company and applies the accounting and reporting guidance of the FASB ASC Topic 946 Financial Services-Investment Companies. The fund’s financial statements are prepared in accordance with GAAP, which may require the use of management estimates and assumptions. Actual results could differ from those estimates.
The Companyenters into contracts that contain a variety of indemnifications. The fund’s maximum exposure under these arrangements is unknown. The fund does not anticipate recognizing any loss related to these arrangements.
(a) Portfolio valuation: The fair value of a financial instrument is the amount that would be received to sell an asset or paid to transfer a liability in an orderly transaction between market participants at the measurement date (i.e., the exit price). GAAP establishes a fair value hierarchy that prioritizes the inputs of valuation techniques used to measure fair value. This hierarchy gives the highest priority to unadjusted quoted prices in active markets for identical assets or liabilities (Level 1 measurements) and the lowest priority to unobservable inputs (Level 3 measurements).
Additionally, GAAP provides guidance on determining whether the volume and activity in a market has decreased significantly and whether such a decrease in activity results in transactions that are not orderly. GAAP requires enhanced disclosures around valuation inputs and techniques used during annual and interim periods.
Various inputs are used in determining the value of the fund’s investments relating to fair value measurements. These inputs are summarized in the three broad levels listed below:
24
Level 1—unadjusted quoted prices in active markets for identical investments.
Level 2—other significant observable inputs (including quoted prices for similar investments, interest rates, prepayment speeds, credit risk, etc.).
Level 3—significant unobservable inputs (including the fund’s own assumptions in determining the fair value of investments).
The inputs or methodology used for valuing securities are not necessarily an indication of the risk associated with investing in those securities.
Changes in valuation techniques may result in transfers in or out of an assigned level within the disclosure hierarchy. Valuation techniques used to value the fund’s investments are as follows:
Investments in equity securities are valued at the last sales price on the securities exchange or national securities market on which such securities are primarily traded. Securities listed on the National Market System for which market quotations are available are valued at the official closing price or, if there is no official closing price that day, at the last sales price. For open short positions, asked prices are used for valuation purposes. Bid price is used when no asked price is available. Registered investment companies that are not traded on an exchange are valued at their net asset value. All of the preceding securities are generally categorized within Level 1 of the fair value hierarchy.
Securities not listed on an exchange or the national securities market, or securities for which there were no transactions, are valued at the average of the most recent bid and asked prices. These securities are generally categorized within Level 2 of the fair value hierarchy.
Fair valuing of securities may be determined with the assistance of a pricing service using calculations based on indices of domestic securities and other appropriate indicators, such as prices of relevant ADRs and futures. Utilizing these techniques may result in transfers between Level 1 and Level 2 of the fair value hierarchy.
When market quotations or official closing prices are not readily available, or are determined not to accurately reflect fair value, such as when the value of a security has been significantly affected by events after the close of the exchange or market on which the security is principally traded (for example, a foreign exchange or market), but before the fund calculates its net asset value, the fund may value these investments at fair value as determined in accordance with the procedures approved by the Company’s Board of Directors (the “Board”). Certain factors may be considered when
25
NOTES TO FINANCIAL STATEMENTS(continued)
fair valuing investments such as: fundamental analytical data, the nature and duration of restrictions on disposition, an evaluation of the forces that influence the market in which the securities are purchased and sold, and public trading in similar securities of the issuer or comparable issuers. These securities are either categorized within Level 2 or 3 of the fair value hierarchy depending on the relevant inputs used.
For restricted securities where observable inputs are limited, assumptions about market activity and risk are used and such securities are generally categorized within Level 3 of the fair value hierarchy.
Investments denominated in foreign currencies are translated to U.S. dollars at the prevailing rates of exchange.
Forward foreign currency exchange contracts (“forward contracts”) are valued at the forward rate and are generally categorized within Level 2 of the fair value hierarchy.
The following is a summary of the inputs used as of November 30, 2019in valuing the fund’s investments:
Level 1- Unadjusted Quoted Prices | Level 2 - Other Significant Observable Inputs | Level 3- Significant Unobservable Inputs | Total | |
Assets ($) | ||||
Investments in Securities: † | ||||
Equity Securities - Domestic Common Stocks | 1,369,373,491 | - | - | 1,369,373,491 |
Investment Companies | 39,996,991 | - | - | 39,996,991 |
Other Financial Instruments: | ||||
Forward Foreign Currency Exchange Contracts†† | - | 432 | - | 432 |
Liabilities ($) | ||||
Other Financial Instruments: | ||||
Forward Foreign Currency Exchange Contracts†† | - | (53) | - | (53) |
† See Statement of Investments for additional detailed categorizations, if any.
†† Amount shown represents unrealized appreciation (depreciation) at period end, but only variation margin on exchanged traded and centrally cleared derivatives, if any, are reported in the Statement of Assets and Liabilities.
(b) Foreign currency transactions: The fund does not isolate that portion of the results of operations resulting from changes in foreign exchange rates on investments from the fluctuations arising from changes
26
in the market prices of securities held. Such fluctuations are included with the net realized and unrealized gain or loss on investments.
Net realized foreign exchange gains or losses arise from sales of foreign currencies, currency gains or losses realized on securities transactions between trade and settlement date, and the difference between the amounts of dividends, interest and foreign withholding taxes recorded on the fund’s books and the U.S. dollar equivalent of the amounts actually received or paid. Net unrealized foreign exchange gains and losses arise from changes in the value of assets and liabilities other than investments resulting from changes in exchange rates. Foreign currency gains and losses on foreign currency transactions are also included with net realized and unrealized gain or loss on investments.
(c)Securities transactions and investment income: Securities transactions are recorded on a trade date basis. Realized gains and losses from securities transactions are recorded on the identified cost basis. Dividend income is recognized on the ex-dividend date and interest income, including, where applicable, accretion of discount and amortization of premium on investments, is recognized on the accrual basis.
Pursuant to a securities lending agreement with The Bank of New York Mellon, a subsidiary of BNY Mellon and an affiliate of the Adviser, the fund may lend securities to qualified institutions. It is the fund’s policy that, at origination, all loans are secured by collateral of at least 102% of the value of U.S. securities loaned and 105% of the value of foreign securities loaned. Collateral equivalent to at least 100% of the market value of securities on loan is maintained at all times. Collateral is either in the form of cash, which can be invested in certain money market mutual funds managed by the Adviser, or U.S. Government and Agency securities. The fund is entitled to receive all dividends, interest and distributions on securities loaned, in addition to income earned as a result of the lending transaction. Should a borrower fail to return the securities in a timely manner, The Bank of New York Mellon is required to replace the securities for the benefit of the fund or credit the fund with the market value of the unreturned securities and is subrogated to the fund’s rights against the borrower and the collateral. Additionally, the contractual maturity of security lending transactions are on an overnight and continuous basis. During the period ended November 30, 2019, The Bank of New York Mellon earned $69 from the lending of the fund’s portfolio securities, pursuant to the securities lending agreement.
(d) Affiliated issuers: Investments in other investment companies advised by the Adviser are considered “affiliated” under the Act.
27
NOTES TO FINANCIAL STATEMENTS(continued)
(e) Risk: Investing in foreign markets may involve special risks and considerations not typically associated with investing in the U.S. These risks include revaluation of currencies, high rates of inflation, repatriation restrictions on income and capital, and adverse political and economic developments. Moreover, securities issued in these markets may be less liquid, subject to government ownership controls and delayed settlements, and their prices may be more volatile than those of comparable securities in the U.S.
(f) Dividends and distributions to shareholders: Dividends and distributions are recorded on the ex-dividend date. Dividends from investment income-net and dividends from net realized capital gains, if any, are normally declared and paid annually, but the fund may make distributions on a more frequent basis to comply with the distribution requirements of the Internal Revenue Code of 1986, as amended (the “Code”). To the extent that net realized capital gains can be offset by capital loss carryovers, it is the policy of the fund not to distribute such gains. Income and capital gain distributions are determined in accordance with income tax regulations, which may differ from GAAP.
(g) Federal income taxes: It is the policy of the fund to continue to qualify as a regulated investment company, if such qualification is in the best interests of its shareholders, by complying with the applicable provisions of the Code, and to make distributions of taxable income and net realized capital gain sufficient to relieve it from substantially all federal income and excise taxes.
As of and during the period ended November 30, 2019, the fund did not have any liabilities for any uncertain tax positions. The fund recognizes interest and penalties, if any, related to uncertain tax positions as income tax expense in the Statement of Operations. During the period ended November 30, 2019, the fund did not incur any interest or penalties.
Each tax year in the four-year period ended November 30, 2019 remains subject to examination by the Internal Revenue Service and state taxing authorities.
At November 30, 2019, the components of accumulated earnings on a tax basis were as follows: undistributed ordinary income $9,783,861, undistributed capital gains $60,315,908 and unrealized appreciation $661,535,516.
The tax character of distributions paid to shareholders during the fiscal periods ended November 30, 2019 and November 30, 2018 were as follows: ordinary income $9,841,928 and $17,666,299, and long-term capital gains $66,391,891 and $79,010,102, respectively.
28
(h) New Accounting Pronouncements: Effective June 1, 2019, the fund adopted Accounting Standards Update 2018-13, Fair Value Measurement (Topic 820): Disclosure Framework—Changes to the Disclosure Requirements for Fair Value Measurement (“ASU 2018-13”). The update provides guidance that eliminates, adds and modifies certain disclosure requirements for fair value measurements. The adoption of ASU 2018-13 had no impact on the operations of the fund for the period ended November 30, 2019.
NOTE 2—Bank Lines of Credit:
The fund participates with other long-term open-end funds managed by the Adviser in a $1.030 billion unsecured credit facility led by Citibank, N.A. (the “Citibank Credit Facility”) and a $300 million unsecured credit facility provided by The Bank of New York Mellon (the “BNYM Credit Facility”), each to be utilized primarily for temporary or emergency purposes, including the financing of redemptions (each, a “Facility”). The Citibank Credit Facility is available in two tranches: (i) Tranche A is in an amount equal to $830 million and is available to all long-term open-ended funds, including the fund, and (ii) Tranche B is in amount equal to $200 million and is available only to BNY Mellon Floating Rate Income Fund, a series of BNY Mellon Investment Funds IV, Inc. In connection therewith, the fund has agreed to pay its pro rata portion of commitment fees for Tranche A of the Citibank Credit Facility and the BNYM Credit Facility. Interest is charged to the fund based on rates determined pursuant to the terms of the respective Facility at the time of borrowing.
The average amount of borrowings outstanding under the Facilities during the period ended November 30, 2019 was approximately $326,850 with a related weighted average annualized interest rate of 3.10%.
NOTE 3—Management Fee, Sub-Investment Advisory Fee and Other Transactions with Affiliates:
(a)Pursuant to a management agreement with the Adviser, the management fee is computed at the annual rate of .85% of the value of the fund’s average daily net assets and is payable monthly.
Pursuant to a sub-investment advisory agreement between the Adviser and the Sub-Adviser, the Adviser pays the Sub-Adviser a monthly fee at an annual rate of .41% of the value of the fund’s average daily net assets.
During the period ended November 30, 2019, the Distributor retained $2,795 from commissions earned on sales of the fund’s Class A shares and $231 from CDSC fees on redemptions of the fund’s Class C shares.
29
NOTES TO FINANCIAL STATEMENTS(continued)
(b) Under the Distribution Plan adopted pursuant to Rule 12b-1 under the Act, Class C shares pay the Distributor for distributing its shares at an annual rate of .75% of the value of its average daily net assets. During the period ended November 30, 2019, Class C shares were charged $85,193 pursuant to the Distribution Plan.
(c)Under the Shareholder Services Plan, Class A and Class C shares pay the Distributor at an annual rate of .25% of the value of their average daily net assets for the provision of certain services. The services provided may include personal services relating to shareholder accounts, such as answering shareholder inquiries regarding the fund and providing reports and other information, and services related to the maintenance of shareholder accounts. The Distributor may make payments to Service Agents (securities dealers, financial institutions or other industry professionals) with respect to these services. The Distributor determines the amounts to be paid to Service Agents. During the period ended November 30, 2019, Class A and Class C shares were charged $80,003and $28,398, respectively, pursuant to the Shareholder Services Plan.
The fund has an arrangement with the transfer agent whereby the fund may receive earnings credits when positive cash balances are maintained, which are used to offset transfer agency fees. The fund had an arrangement with the custodian to receive earnings credits when positive cash balances were maintained, which were used to offset custody fees. Effective February 1, 2019, the arrangement with the custodian changed whereby the fund will no longer receive earnings credits to offset its custody fees and will receive interest income or overdraft fees going forward. For financial reporting purposes, the fund includes net earnings credits, if any, as an expense offset in the Statement of Operations.
The fund compensates BNY Mellon Transfer, Inc., a wholly-owned subsidiary of the Adviser, under a transfer agency agreement for providing transfer agency and cash management services for the fund. The majority of transfer agency fees are comprised of amounts paid on a per account basis, while cash management fees are related to fund subscriptions and redemptions. During the period ended November 30, 2019, the fund was charged $11,410 for transfer agency services. These fees are included in Shareholder servicing costs in the Statement of Operations.
The fund compensates The Bank of New York Mellon under a custody agreement for providing custodial services for the fund. These fees are determined based on net assets, geographic region and transaction activity. During the period ended November 30, 2019, the fund was charged $72,177 pursuant to the custody agreement.
30
During the period ended November 30, 2019, the fund was charged $11,659 for services performed by the Chief Compliance Officer and his staff. These fees are included in Miscellaneous in the Statement of Operations.
The components of “Due to BNY Mellon Investment Adviser, Inc. and affiliates” in the Statement of Assets and Liabilities consist of: management fees of $971,731, Distribution Plan fees of $6,934, Shareholder Services Plan fees of $9,630, custodian fees of $26,000, Chief Compliance Officer fees of $2,174 and transfer agency fees of $2,540.
(d) Each Board member also serves as a Board member of other funds in the BNY Mellon Family of Funds complex. Annual retainer fees and attendance fees are allocated to each fund based on net assets.
NOTE 4—Securities Transactions:
The aggregate amount of purchases and sales of investment securities, excluding short-term securities and forward contracts, during the period ended November 30, 2019, amounted to $84,290,244 and $144,375,258, respectively.
Derivatives:A derivative is a financial instrument whose performance is derived from the performance of another asset. Each type of derivative instrument that was held by the fund during the period ended November 30, 2019 is discussed below.
Forward Foreign Currency Exchange Contracts: The fund enters into forward contracts in order to hedge its exposure to changes in foreign currency exchange rates on its foreign portfolio holdings, to settle foreign currency transactions or as a part of its investment strategy. When executing forward contracts, the fund is obligated to buy or sell a foreign currency at a specified rate on a certain date in the future. With respect to sales of forward contracts, the fund incurs a loss if the value of the contract increases between the date the forward contract is opened and the date the forward contract is closed. The fund realizes a gain if the value of the contract decreases between those dates. With respect to purchases of forward contracts, the fund incurs a loss if the value of the contract decreases between the date the forward contract is opened and the date the forward contract is closed. The fund realizes a gain if the value of the contract increases between those dates. Any realized or unrealized gains or losses which occurred during the period are reflected in the Statement of Operations. The fund is exposed to foreign currency risk as a result of changes in value of underlying financial instruments. The fund is also exposed to credit risk associated with counterparty nonperformance on these forward contracts, which is generally limited to the unrealized gain
31
NOTES TO FINANCIAL STATEMENTS(continued)
on each open contract. This risk may be mitigated by Master Agreements, if any, between the fund and the counterparty and the posting of collateral, if any, by the counterparty to the fund to cover the fund’s exposure to the counterparty. Forward contracts open at November 30, 2019 are set forth in the Statement of Forward Foreign Currency Exchange Contracts.
The following summarizes the average market value of derivatives outstanding duringthe period ended November 30, 2019:
|
| Average Market Value ($) |
Forward contracts |
| 1,307,707 |
|
|
|
At November 30, 2019, the cost of investments for federal income tax purposes was $747,771,893; accordingly, accumulated net unrealized appreciation on investments inclusive of derivative contracts was $661,598,968, consisting of $683,273,666 gross unrealized appreciation and $21,674,698 gross unrealized depreciation.
32
REPORT OF INDEPENDENT REGISTERED PUBLIC ACCOUNTING FIRM
To the Shareholders and the Board of Directors of BNY Mellon Global Stock Fund (formerly, Global Stock Fund)
Opinion on the Financial Statements
We have audited the accompanying statement of assets and liabilities of BNY Mellon Global Stock Fund (the “Fund”) (formerly, Global Stock Fund) (one of the funds constituting BNY Mellon Strategic Funds, Inc.), including the statements of investments, investments in affiliated issuers and forward foreign currency exchange contracts, as of November 30, 2019, and the related statement of operations for the year then ended, the statements of changes in net assets for each of the two years in the period then ended, the financial highlights for each of the five years in the period then ended and the related notes (collectively referred to as the “financial statements”). In our opinion, the financial statements present fairly, in all material respects, the financial position of the Fund (one of the funds constituting BNY Mellon Strategic Funds, Inc.) at November 30, 2019, the results of its operations for the year then ended, the changes in its net assets for each of the two years in the period then ended and its financial highlights for each of the five years in the period then ended, in conformity with U.S. generally accepted accounting principles.
Basis for Opinion
These financial statements are the responsibility of the Fund’s management. Our responsibility is to express an opinion on the Fund’s financial statements based on our audits. We are a public accounting firm registered with the Public Company Accounting Oversight Board (United States) (“PCAOB”) and are required to be independent with respect to the Fund in accordance with the U.S. federal securities laws and the applicable rules and regulations of the Securities and Exchange Commission and the PCAOB.
We conducted our audits in accordance with the standards of the PCAOB. Those standards require that we plan and perform the audit to obtain reasonable assurance about whether the financial statements are free of material misstatement, whether due to error or fraud. The Fund is not required to have, nor were we engaged to perform, an audit of the Fund’s internal control over financial reporting. As part of our audits, we are required to obtain an understanding of internal control over financial reporting, but not for the purpose of expressing an opinion on the effectiveness of the Fund’s internal control over financial reporting. Accordingly, we express no such opinion.
Our audits included performing procedures to assess the risks of material misstatement of the financial statements, whether due to error or fraud, and performing procedures that respond to those risks. Such procedures included examining, on a test basis, evidence regarding the amounts and disclosures in the financial statements. Our procedures included confirmation of securities owned as of November 30, 2019, by correspondence with the custodian and others or by other appropriate auditing procedures where replies from others were not received. Our audits also included evaluating the accounting principles used and significant estimates made by management, as well as evaluating the overall presentation of the financial statements. We believe that our audits provide a reasonable basis for our opinion.

We have served as the auditor of one or more investment companies in the BNY Mellon Family of Funds since at least 1957, but we are unable to determine the specific year.
New York, New York
January 28, 2020
33
IMPORTANT TAX INFORMATION(Unaudited)
For federal tax purposes the fund hereby reports 100% of the ordinary dividends paid during the fiscal year ended November 30, 2019 as qualifying for the corporate dividends received deduction. Also certain dividends paid by the fund may be subject to a maximum tax rate of 15%, as provided for by the Jobs and Growth Tax Relief Reconciliation Act of 2003. Of the distributions paid during the fiscal year, $9,841,928 represents the maximum amount that may be considered qualified dividend income. Shareholders will receive notification in early 2020 of the percentage applicable to the preparation of their 2019 income tax returns. Also, the fund hereby reports $1.1577 per share as a long-term capital gain distribution paid on December 31, 2019.
34
INFORMATION ABOUT THE RENEWAL OF THE FUND’S MANAGEMENT AND SUB-INVESTMENT ADVISORY AGREEMENTS (Unaudited)
At a meeting of the fund’s Board of Directors held on November 5, 2019, the Board considered the renewal of the fund’s Management Agreement, pursuant to which the Adviser provides the fund with investment advisory and administrative services (the “Agreement”), and the Sub-Investment Advisory Agreement (together, the “Agreements”), pursuant to which Walter Scott & Partners Limited (the “Subadviser”), an affiliate of the Adviser, provides day-to-day management of the fund’s investments. The Board members, a majority of whom are not “interested persons” (as defined in the Investment Company Act of 1940, as amended) of the fund, were assisted in their review by independent legal counsel and met with counsel in executive session separate from representatives of the Adviser and the Subadviser. In considering the renewal of the Agreements, the Board considered several factors that it believed to be relevant, including those discussed below. The Board did not identify any one factor as dispositive, and each Board member may have attributed different weights to the factors considered.
Analysis of Nature, Extent, and Quality of Services Provided to the Fund. The Board considered information provided to it at the meeting and in previous presentations from representatives of the Adviser regarding the nature, extent, and quality of the services provided to funds in the BNY Mellon fund complex, including the fund. The Adviser provided the number of open accounts in the fund, the fund’s asset size and the allocation of fund assets among distribution channels. The Adviser also had previously provided information regarding the diverse intermediary relationships and distribution channels of funds in the BNY Mellon fund complex (such as retail direct or intermediary, in which intermediaries typically are paid by the fund and/or the Adviser) and the Adviser’s corresponding need for broad, deep, and diverse resources to be able to provide ongoing shareholder services to each intermediary or distribution channel, as applicable to the fund.
The Board also considered research support available to, and portfolio management capabilities of, the fund’s portfolio management personnel and that the Adviser also provides oversight of day-to-day fund operations, including fund accounting and administration and assistance in meeting legal and regulatory requirements. The Board also considered the Adviser’s extensive administrative, accounting and compliance infrastructures, as well as the Adviser’s supervisory activities over the Subadviser. The Board also considered portfolio management’s brokerage policies and practices (including policies and practices regarding soft dollars) and the standards applied in seeking best execution.
Comparative Analysis of the Fund’s Performance and Management Fee and Expense Ratio. The Board reviewed reports prepared by Broadridge Financial Solutions, Inc. (“Broadridge”), an independent provider of investment company data, which included information comparing (1) the fund’s performance with the performance of a group of global large-cap growth funds (the “Performance Group”) and with a broader group of funds consisting of all retail and institutional global large-cap growth funds (the
35
INFORMATION ABOUT THE RENEWAL OF THE FUND’S MANAGEMENT AND SUB-INVESTMENT ADVISORY AGREEMENTS (Unaudited) (continued)
“Performance Universe”), all for various periods ended September 30, 2019, and (2) the fund’s actual and contractual management fees and total expenses with those of the same group of funds in the Performance Group (the “Expense Group”) and with a broader group of funds consisting of all institutional global large-cap growth funds, excluding outliers (the “Expense Universe”), the information for which was derived in part from fund financial statements available to Broadridge as of the date of its analysis. The Adviser previously had furnished the Board with a description of the methodology Broadridge used to select the Performance Group and Performance Universe and the Expense Group and Expense Universe.
Representatives of the Adviser stated that the usefulness of performance comparisons may be affected by a number of factors, including different investment limitations and policies that may be applicable to the fund and comparison funds. The Board discussed with representatives of the Adviser and the Subadviser the results of the comparisons and considered that the fund’s total return performance was above the Performance Group and Performance Universe medians for all periods. The Adviser also provided a comparison of the fund’s calendar year total returns to the returns of the fund’s benchmark index, and it was noted that the fund’s returns were above the returns of the index in six of the ten calendar years shown.
The Board reviewed and considered the contractual management fee rate paid by the fund to the Adviser over the fund’s last fiscal year in light of the nature, extent and quality of the management and sub-advisory services provided by the Adviser and the Subadviser, respectively. The Board noted that the compensation paid to the Subadviser is paid by the Adviser (out of its fee from the fund), not the fund, and, accordingly, that the retention of the Subadviser does not increase the fees or expenses otherwise incurred by the fund and its shareholders.
The Board also reviewed the range of actual and contractual management fees and total expenses of the Expense Group and Expense Universe funds and discussed the results of the comparisons. The Board considered that the fund’s contractual management fee was slightly above the Expense Group contractual management fee median and was above the Expense Group and Expense Universe actual management fee medians, and that the fund’s total expenses were slightly above the Expense Group median and below the Expense Universe median.
Representatives of the Adviser reviewed with the Board the management or investment advisory fees (1) paid by funds advised or administered by the Adviser that are in the same Lipper category as the fund and (2) paid to the Adviser or the Subadviser or its affiliates for advising any separate accounts and/or other types of client portfolios that are considered to have similar investment strategies and policies as the fund (the “Similar Clients”), and explained the nature of the Similar Clients. They discussed differences in fees paid and the relationship of the fees paid in light of any differences in the services provided and other relevant factors. The Board considered the relevance of the fee information provided for the Similar Clients to evaluate the appropriateness of the fund’s management fee.
36
Analysis of Profitability and Economies of Scale. Representatives of the Adviser reviewed the expenses allocated and profit received by the Adviser and its affiliates and the resulting profitability percentage for managing the fund and the aggregate profitability percentage to the Adviser and its affiliates for managing the funds in the BNY Mellon fund complex, and the method used to determine the expenses and profit. The Board concluded that the profitability results were not excessive, given the services rendered and service levels provided by the Adviser and its affiliates. The Board also had been provided with information prepared by an independent consulting firm regarding the Adviser’s approach to allocating costs to, and determining the profitability of, individual funds and the entire BNY Mellon fund complex. The consulting firm also had analyzed where any economies of scale might emerge in connection with the management of a fund.
The Board considered on the advice of its counsel the profitability analysis (1) as part of its evaluation of whether the fees under the Agreements, considered in relation to the mix of services provided by the Adviser and the Subadviser, including the nature, extent and quality of such services, supported the renewal of the Agreements and (2) in light of the relevant circumstances for the fund and the extent to which economies of scale would be realized if the fund grows and whether fee levels reflect these economies of scale for the benefit of fund shareholders. Since the Adviser, and not the fund, pays the Subadviser pursuant to the Sub-Investment Advisory Agreement, the Board did not consider the Subadviser’s profitability to be relevant to its deliberations. Representatives of the Adviser also stated that, as a result of shared and allocated costs among funds in the BNY Mellon fund complex, the extent of economies of scale could depend substantially on the level of assets in the complex as a whole, so that increases and decreases in complex-wide assets can affect potential economies of scale in a manner that is disproportionate to, or even in the opposite direction from, changes in the fund’s asset level. The Board also considered potential benefits to the Adviser and the Subadviser from acting as investment adviser and sub-investment adviser, respectively, and took into consideration the soft dollar arrangements in effect for trading the fund’s investments.
At the conclusion of these discussions, the Board agreed that it had been furnished with sufficient information to make an informed business decision with respect to the renewal of the Agreements. Based on the discussions and considerations as described above, the Board concluded and determined as follows.
· The Board concluded that the nature, extent and quality of the services provided by the Adviser and the Subadviser are adequate and appropriate.
· The Board was satisfied with the fund’s performance.
· The Board concluded that the fees paid to the Adviser and the Subadviser continued to be appropriate under the circumstances and in light of the factors and the totality of the services provided as discussed above.
37
INFORMATION ABOUT THE RENEWAL OF THE FUND’S MANAGEMENT AND SUB-INVESTMENT ADVISORY AGREEMENTS (Unaudited) (continued)
· The Board determined that the economies of scale which may accrue to the Adviser and its affiliates in connection with the management of the fund had been adequately considered by the Adviser in connection with the fee rate charged to the fund pursuant to the Agreement and that, to the extent in the future it were determined that material economies of scale had not been shared with the fund, the Board would seek to have those economies of scale shared with the fund.
In evaluating the Agreements, the Board considered these conclusions and determinations and also relied on its previous knowledge, gained through meetings and other interactions with the Adviser and its affiliates and the Subadviser, of the Adviser and the Subadviser and the services provided to the fund by the Adviser and the Subadviser. The Board also relied on information received on a routine and regular basis throughout the year relating to the operations of the fund and the investment management and other services provided under the Agreements, including information on the investment performance of the fund in comparison to similar mutual funds and benchmark performance indices; general market outlook as applicable to the fund; and compliance reports. In addition, the Board’s consideration of the contractual fee arrangements for this fund had the benefit of a number of years of reviews of the Agreements for the fund, or substantially similar agreements for other BNY Mellon funds that the Board oversees, during which lengthy discussions took place between the Board and representatives of the Adviser. Certain aspects of the arrangements may receive greater scrutiny in some years than in others, and the Board’s conclusions may be based, in part, on their consideration of the fund’s arrangements, or substantially similar arrangements for other BNY Mellon funds that the Board oversees, in prior years. The Board determined to renew the Agreements.
38
BOARD MEMBERS INFORMATION(Unaudited)
INDEPENDENT BOARD MEMBERS
Joseph S. DiMartino (76)
Chairman of the Board (1995)
Principal Occupation During Past 5 Years:
· Corporate Director and Trustee (1995-Present)
Other Public Company Board Memberships During Past 5 Years:
· CBIZ, Inc., a public company providing professional business services, products and solutions,Director (1997-Present)
No. of Portfolios for which Board Member Serves:120
———————
Joni Evans (77)
Board Member (2006)
Principal Occupation During Past 5 Years:
· Chief Executive Officer, www.wowOwow.com, an online community dedicated to women’s conversations and publications (2007-Present)
· Principal, Joni Evans Ltd. (publishing) (2006-Present)
No. of Portfolios for which Board Member Serves:20
———————
Joan Gulley (72)
Board Member (2017)
Principal Occupation During Past 5 Years:
· PNC Financial Services Group, Inc.(1993-2014), Executive Vice President and Chief Human Resources Officer and Executive Committee Member (2008-2014)
· Director, Nantucket Library (2015-Present)
No. of Portfolios for which Board Member Serves:50
———————
Ehud Houminer (79)
Board Member (1994)
Principal Occupation During Past 5 Years:
· Board of Overseers at the Columbia Business School, Columbia
University (1992-Present)
Trustee, Ben Gurion University (2012-2018)
No. of Portfolios for which Board Member Serves: 50
———————
39
BOARD MEMBERS INFORMATION (Unaudited) (continued)
INDEPENDENT BOARD MEMBERS (continued)
Alan H. Howard (60)
Board Member (2018)
Principal Occupation During Past 5 Years:
· Managing Partner of Heathcote Advisors LLC, a financial advisory services firm (2008 – Present)
· President of Dynatech/MPX Holdings LLC (2012 – 2019), a global supplier and service provider of military aircraft parts, including Board Member of two operating subsidiaries, Dynatech International LLC and Military Parts Exchange LLC (2012-2019); Chief Executive Officer of an operating subsidiary, Dynatech International LLC (2013 – 2019)
· Senior Advisor, Rossoff & Co., an independent investment banking firm (2013 – Present)
Other Public Company Board Memberships During Past 5 Years:
· Movado Group, Inc., a public company that designs, sources, markets and distributes watches,Director (1997-Present)
No. of Portfolios for which Board Member Serves:20
———————
Robin A. Melvin (56)
Board Member (1995)
Principal Occupation During Past 5 Years:
· Co-chairman, Mentor Illinois, a non-profit organization dedicated to increasing the quantity and quality of mentoring services in Illinois; (2014-Present; Board member (2013-Present)
No. of Portfolios for which Board Member Serves:97
———————
Burton N. Wallack (69)
Board Member (2006)
Principal Occupation During Past 5 Years:
President and Co-owner of Wallack Management Company, a real estate management company (1987-Present)
Mount Sinai Hospital Urology Board Member (2017-Present)
No. of Portfolios for which Board Member Serves:20
———————
40
Benaree Pratt Wiley (73)
Board Member (2016)
Principal Occupation During Past 5 Years:
· Principal, The Wiley Group, a firm specializing in strategy and business development (2005-Present)
Other Public Company Board Memberships During Past 5 Years:
· CBIZ, Inc., a public company providing professional business services, products and solutions,Director(2008-Present)
· Blue Cross Blue Shield of MassachusettsDirector (2004-Present)
No. of Portfolios for which Board Member Serves: 76
———————
41
BOARD MEMBERS INFORMATION (Unaudited) (continued)
INTERESTED BOARD MEMBER
Gordon J. Davis (78)
Board Member (2006)
Principal Occupation During Past 5 Years:
· Partner in the law firm of Venable LLP (2012-Present)
Other Public Company Board Memberships During Past 5 Years:
· Consolidated Edison, Inc., a utility company,Director (1989-2014)
· The Phoenix Companies, Inc., a life insurance company,Director (2000-2014)
No. of Portfolios for which Board Member Serves:54
Gordon J. Davis is deemed to be an “interested person” (as defined under the Act) of the Company as a result of his affiliation with Venable LLP, which provides legal services to the Company.
———————
Once elected all Board Members serve for an indefinite term, but achieve Emeritus status upon reaching age 80. The address of the Board Members and Officers is c/o BNY Mellon Investment Adviser, Inc. 240 Greenwich Street, New York, New York 10286. Additional information about the Board Members is available in the fund’s Statement of Additional Information which can be obtained from the Adviser free of charge by calling this toll free number: 1-800-373-9387.
William Hodding Carter III, Emeritus Board Member
Hans C. Mautner, Emeritus Board Member
42
OFFICERS OF THE FUND(Unaudited)
RENEE LAROCHE-MORRIS, President since May 2019.
President and a director of BNY Mellon Investment Adviser, Inc. since January 2018. She is an officer of 63 investment companies (comprised of 120 portfolios) managed by the Adviser. She is 48 years old and has been an employee of BNY Mellon since 2003.
JAMES WINDELS, Treasurer since November 2001.
Director- BNY Mellon Fund Administration, and an officer of 64 investment companies (comprised of 143 portfolios) managed by the Adviser. He is 61 years old and has been an employee of the Adviser since April 1985.
BENNETT A. MACDOUGALL, Chief Legal Officer since October 2015.
Chief Legal Officer of the Adviser and Associate General Counsel and Managing Director of BNY Mellon since June 2015; Director and Associate General Counsel of Deutsche Bank – Asset & Wealth Management Division from June 2005 to June 2015, and as Chief Legal Officer of Deutsche Investment Management Americas Inc. from June 2012 to May 2015. He is an officer of 64 investment companies (comprised of 143 portfolios) managed by the Adviser. He is 48 years old and has been an employee of the Adviser since June 2015.
DAVID DIPETRILLO, Vice President since May 2019.
Head of North America Product, BNY Mellon Investment Management since January 2018, Director of Product Strategy, BNY Mellon Investment Management from January 2016 to December 2017; Head of US Retail Product and Channel Marketing, BNY Mellon Investment Management from January 2014 to December 2015. He is an officer of 63 investment companies (comprised of 120 portfolios) managed by the Adviser. He is 41 years old and has been an employee of BNY Mellon since 2005.
JAMES BITETTO, Vice President since August 2005 and Secretary since February 2018.
Senior Managing Counsel of BNY Mellon since December 2019; Managing Counsel of BNY Mellon from April 2014 to December 2019; Secretary of the Adviser, and an officer of 64 investment companies (comprised of 143 portfolios) managed by the Adviser. He is 53 years old and has been an employee of the Adviser since December 1996.
SONALEE CROSS, Vice President and Assistant Secretary since March 2018.
Counsel of BNY Mellon since October 2016; Associate at Proskauer Rose LLP from April 2016 to September 2016; Attorney at EnTrust Capital from August 2015 to February 2016; Associate at Sidley Austin LLP from September 2013 to August 2015. She is an officer of 64 investment companies (comprised of 143 portfolios) managed by the Adviser. She is 32 years old and has been an employee of the Adviser since October 2016.
DEIRDRE CUNNANE, Vice President and Assistant Secretary since March 2019.
Counsel of BNY Mellon since August 2018; Senior Regulatory Specialist at BNY Mellon Investment Management Services from February 2016 to August 2018; Trustee Associate at BNY Mellon Trust Company (Ireland) Limited from August 2013 to February 2016. She is an officer of 64 investment companies (comprised of 143 portfolios) managed by the Adviser. She is 29 years old and has been an employee of the Adviser since August 2018.
SARAH S. KELLEHER, Vice President and Assistant Secretary since April 2014.
Managing Counsel of BNY Mellon since December 2017, Senior Counsel of BNY Mellon from March 2013 to December 2017. She is an officer of 64 investment companies (comprised of 143 portfolios) managed by the Adviser. She is 44 years old and has been an employee of the Adviser since March 2013.
JEFF PRUSNOFSKY, Vice President and Assistant Secretary since August 2005.
Senior Managing Counsel of BNY Mellon, and an officer of 64 investment companies (comprised of 143 portfolios) managed by the Adviser. He is 54 years old and has been an employee of the Adviser since October 1990.
PETER M. SULLIVAN, Vice President and Assistant Secretary since March 2019.
Managing Counsel of BNY Mellon, and an officer of 64 investment companies (comprised of 143 portfolios) managed by the Adviser. He is 51 years old and has been an employee of the Adviser since April 2004.
43
OFFICERS OF THE FUND (Unaudited)(continued)
NATALYA ZELENSKY, Vice President and Assistant Secretary since March 2017.
Managing Counsel of BNY Mellon since December 2019; Counsel of BNY Mellon from May 2016 to December 2019; Attorney at Wildermuth Endowment Strategy Fund/Wildermuth Advisory, LLC from November 2015 to May 2016 and Assistant General Counsel at RCS Advisory Services from July 2014 to November 2015. She is an officer of 64 investment companies (comprised of 143 portfolios) managed by the Adviser. She is 34 years old and has been an employee of the Adviser since May 2016.
GAVIN C. REILLY, Assistant Treasurer since December 2005.
Tax Manager - BNY Mellon Fund Administration, and an officer of 64 investment companies (comprised of 143 portfolios) managed by the Adviser. He is 51 years old and has been an employee of the Adviser since April 1991.
ROBERT S. ROBOL, Assistant Treasurer since December 2002.
Senior Accounting Manager- BNY Mellon Fund Administration, and an officer of 64 investment companies (comprised of 143 portfolios) managed by the Adviser. He is 55 years old and has been an employee of the Adviser since October 1988.
ROBERT SALVIOLO, Assistant Treasurer since July 2007.
Senior Accounting Manager – BNY Mellon Fund Administration, and an officer of 64 investment companies (comprised of 143 portfolios) managed by the Adviser. He is 52 years old and has been an employee of the Adviser since June 1989.
ROBERT SVAGNA, Assistant Treasurer since December 2002.
Senior Accounting Manager – BNY Mellon Fund Administration, and an officer of 64 investment companies (comprised of 143 portfolios) managed by the Adviser. He is 52 years old and has been an employee of the Adviser since November 1990.
JOSEPH W. CONNOLLY, Chief Compliance Officer since October 2004.
Chief Compliance Officer of the Adviser, the BNY Mellon Family of Funds and BNY Mellon Funds Trust (64 investment companies, comprised of 143 portfolios). He is 62 years old and has served in various capacities with the Adviser since 1980, including manager of the firm’s Fund Accounting Department from 1997 through October 2001.
CARIDAD M. CAROSELLA, Anti-Money Laundering Compliance Officer since January 2016.
Anti-Money Laundering Compliance Officer of the BNY Mellon Family of Funds and BNY Mellon Funds Trust since January 2016; from May 2015 to December 2015, Interim Anti-Money Laundering Compliance Officer of the BNY Mellon Family of Funds and BNY Mellon Funds Trust and the Distributor; from January 2012 to May 2015, AML Surveillance Officer of the Distributor. She is an officer of 57 investment companies (comprised of 136 portfolios) managed by the Adviser. She is 51 years old and has been an employee of the Distributor since 1997.
44
NOTES
45
BNY Mellon Global Stock Fund
240 Greenwich Street
New York, NY 10286
Adviser
BNY Mellon Investment Adviser, Inc.
240 Greenwich Street
New York, NY 10286
Sub-Adviser
Walter Scott & Partners Limited
(Walter Scott)
One Charlotte Square
Edinburgh, Scotland, UK
Custodian
The Bank of New York Mellon
240 Greenwich Street
New York, NY 10286
Transfer Agent &
Dividend Disbursing Agent
BNY Mellon Transfer, Inc.
240 Greenwich Street
New York, NY 10286
Distributor
BNY Mellon Securities Corporation
240 Greenwich Street
New York, NY 10286
Ticker Symbols: | Class A: DGLAX Class C: DGLCX Class I: DGLRX Class Y: DGLYX |
Telephone Call your financial representative or 1-800-373-9387
Mail The BNY Mellon Family of Funds, 144 Glenn Curtiss Boulevard, Uniondale, NY 11556-0144
E-mailSend your request toinfo@bnymellon.com
InternetInformation can be viewed online or downloaded atwww.bnymellonim.com/us
The fund files its complete schedule of portfolio holdings with the Securities and Exchange Commission (“SEC”) for the first and third quarters of each fiscal year on Form N-PORT. The fund’s Forms N-PORT are available on the SEC’s website atwww.sec.gov.
A description of the policies and procedures that the fund uses to determine how to vote proxies relating to portfolio securities and information regarding how the fund voted these proxies for the most recent 12-month period ended June 30 is available atwww.bnymellonim.com/us and on the SEC’s website atwww.sec.gov and without charge, upon request, by calling 1-800-373-9387.
© 2020 BNY Mellon Securities Corporation |
|

BNY Mellon International Stock Fund
ANNUAL REPORT November 30, 2019 |
|

Save time. Save paper. View your next shareholder report online as soon as it’s available. Log into www.bnymellonim.com/us and sign up for eCommunications. It’s simple and only takes a few minutes. |
The views expressed in this report reflect those of the portfolio manager(s) only through the end of the period covered and do not necessarily represent the views of BNY Mellon Investment Adviser, Inc. or any other person in the BNY Mellon Investment Adviser, Inc. organization. Any such views are subject to change at any time based upon market or other conditions and BNY Mellon Investment Adviser, Inc. disclaims any responsibility to update such views. These views may not be relied on as investment advice and, because investment decisions for a fund in the BNY Mellon Family of Funds are based on numerous factors, may not be relied on as an indication of trading intent on behalf of any fund in the BNY Mellon Family of Funds. |
Not FDIC-Insured • Not Bank-Guaranteed • May Lose Value |
Contents
THE FUND
BNY Mellon Investment Adviser, Inc. | |
With Those of Other Funds | |
in Affiliated Issuers | |
Currency Exchange Contracts | |
Public Accounting Firm | |
the Fund’s Management and | |
Sub-Investment Advisory Agreements | |
FOR MORE INFORMATION
Back Cover
| The Fund |
A LETTER FROM THE PRESIDENT OF BNY MELLON INVESTMENT ADVISER, INC.
Dear Shareholder:
We are pleased to present this annual report for BNY Mellon International Stock Fund (formerly, International Stock Fund), covering the 12-month period from December 1, 2018 through November 30, 2019. For information about how the fund performed during the reporting period, as well as general market perspectives, we provide a Discussion of Fund Performance on the pages that follow.
In December 2018, stocks experienced a sharp sell-off, as it appeared that the U.S. Federal Reserve (the “Fed”) would maintain its hawkish stance on monetary policy. In January 2019, a pivot in stance from the Fed helped stimulate a rebound across equity markets that continued into the second quarter. Escalating trade tensions disrupted equity markets again in May. The dip was short-lived, as markets rose once again in June and July of 2019, when a trade deal appeared more likely, and the pace of U.S. economic growth remained steady. Nevertheless, concerns over slowing global growth persisted, resulting in bouts of market volatility in August 2019. Stocks rebounded in September and continued an upward path through most of October 2019, supported in part by central bank policy and consistent consumer spending. Near the end of the period, an announcement by President Trump that the first phase of a trade deal with China had been achieved sent U.S. markets to record highs.
In fixed-income markets, a risk-off mentality prevailed to start the period, fueled in part by equity market volatility. A flight to quality supported price increases for U.S. Treasuries, which continued through the end of 2018, leading to a flattening yield curve. After the Fed’s supportive statements in January 2019, other developed-market central banks followed suit and reiterated their abilities to bolster flagging growth by continuing accommodative policies. After taking into account the 25-basis-point increase in December 2018, there was a net decrease of 50 basis points in the federal funds rate during the reporting period. Rates across much of the Treasury curve saw a slight increase during the month of November. However, demand for fixed-income instruments during much of the reporting period was strong, which helped to support positive bond market returns.
We believe that over the near term, the outlook for the U.S. remains positive, but we will monitor relevant data for any signs of a change. As always, we encourage you to discuss the risks and opportunities in today’s investment environment with your financial advisor.
Thank you for your continued confidence and support.
Sincerely,

Renee LaRoche-Morris
President
BNY Mellon Investment Adviser, Inc.
December 16, 2019
2
DISCUSSION OF FUND PERFORMANCE(Unaudited)
For the period from December 1, 2018 through November 30, 2019, as provided by Charlie Macquaker, Roy Leckie and Jane Henderson, the three members of the Investment Executive at Walter Scott & Partners Limited (WS), Sub-Investment Adviser
Market and Fund Performance Overview
For the 12-month period ended November 30, 2019, the BNY Mellon International Stock Fund (formerly, International Stock Fund) Class A shares achieved a total return of 17.81%, Class C shares returned 16.96%, Class I shares returned 18.23% and Class Y shares returned 18.24%.1 In comparison, the fund’s benchmark index, the MSCI EAFE Index (the “Index”), achieved a return of 12.44% for the same period.2
International equities advanced despite pockets of volatility during the reporting period, bolstered by supportive central bank policies. The fund outperformed the Index, largely due to effective stock selection within the information technology and health care sectors.
The Fund’s Investment Approach
The fund seeks long-term total returns. To pursue its goal, the fund normally invests at least 80% of its net assets, plus any borrowings for investment purposes, in stocks. The fund normally invests primarily in foreign companies located in developed markets. The fund ordinarily invests in at least three countries and is not geographically limited in its investment selection but, at times, may invest a substantial portion of its assets in a single country. The fund may invest in the securities of companies of any market capitalization. Walter Scott seeks investment opportunities in companies with fundamental strengths that indicate the potential for sustainable growth. Walter Scott focuses on individual stock selection, building the fund’s portfolio from the bottom up through extensive fundamental research. The investment process begins with the screening of reported company financials. Companies that meet certain broad, absolute and trend criteria are candidates for more detailed financial analysis. The fund’s Investment Team collectively reviews and selects those stocks that meet Walter Scott’s criteria, and where the expected growth rate is combined with a reasonable valuation for the underlying equity. Geographic and sector allocations are results of, not part of, the investment process, because the Investment Team’s sole focus is on the analysis of and investment in individual companies.
Markets Pivot on Central Bank and Trade Activity
During the fourth quarter of 2018, many equity markets felt pressure from slowing global growth, escalating trade issues between U.S. and China, Brexit difficulties and additional geopolitical issues elsewhere in Europe and the emerging markets. In December 2018, equities reached new lows for the year, as economic and political news continued to unnerve investors. Investors also feared the European Central Bank (ECB) would proceed with its plan to conclude stimulus measures in January, despite moderating growth rates.
January 2019 marked a turnaround in the markets. Talk of a potential trade deal between the U.S. and China helped fuel investor optimism, as equity prices recovered. The ECB announced it would provide additional stimulus to support the eurozone economy. China also announced plans to stoke its slowing economic growth rate. At its first meeting of the year, the Federal Reserve (the “Fed”), emphasized its focus on data as a primary driver for
3
DISCUSSION OF FUND PERFORMANCE(Unaudited) (continued)
rate-hike decisions, and its ability to suspend additional rate increases when the data is not supportive. These sentiments reassured investors of central bankers’ commitments to support flagging growth. The rebound continued throughout the month of January, and equity markets maintained an upward trajectory through April 2019. However, renewed trade tensions between the U.S. and China in May caused stocks to pull back once again. The dip was short-lived, as markets rose once again in June. At the end of Julyand again in September and October, the Fed cut the federal funds rate each time by 25 basis points.Supported by supportive central bank policies, optimism regarding United Kingdom election outcomes and a preliminary trade agreement between the U.S. and China, equity markets went on to post solid gains the last several months of the period despite occasional pockets of volatility.
Stock Selection Buoyed Fund Results
The fund’s positive results compared to the Index stemmed from the success of our security selection. Stock picks within the information technology and health care sectors were beneficial, as was an underweight to financials. Companies within Europe ex-U.K. and Japan were particularly additive. In information technology, Netherlands-based ASML Holding and Taiwan-based Taiwan Semiconductor Manufacturing were among the top contributors. These companies have benefited from high demand for their products and an upward turn in the semiconductor market cycle. Luxury goods company LVMH Moet Hennessy Louis Vuitton benefited from strong consumer demand, stemming in part from a growing Chinese middle class. Its stock price rose throughout much of the period, and it was a top contributor to relative results.
Conversely, stock selection within the utilities and real estate sectors detracted from relative returns. The top individual detractors included consumer discretionary companiesWhitbread,Denso and eyewear companyEssilorLuxottica. United Kingdom-basedWhitbread has seen weakened demand for its products and faces a potential uphill battle due to Brexit concerns. We have closed the position. Japan-based automotive companyDenso faces uncertain prospects regarding its ability to compete in the advanced technology auto parts space. We closed the position. France-based eyewear companyEssilorLuxottica weighed on results. The company has struggled after the merger of the large frame and lens manufacturers. We have since exited the stock. Within the energy sector, China-based CNOOC was a top detractor.
Maintaining a Company-by-Company Approach
Although we do not manage the fund’s investments in response to macroeconomic trends, it is worth noting that while central banks are providing support, it appears as though economic growth rates around the globe may be slowing. We also believe the level of corporate leverage may be rising. We think that when slower growth and higher debt levels combine with reduced profit margins due to rising labor costs, it might begin to separate financially and fundamentally strong companies from the weaker organizations.
4
In that context, our focus remains very much unchanged. We must continue to identify and invest in market-leading, financially robust companies with the strategic strengths and vision to generate meaningful returns over the long term. Our distinctly long-term lens allows us to focus on the underlying strengths and opportunities of a business. Not only does that approach mean we waste very little time trying to second-guess short-term market moves, but it ensures we are invested in companies that have the attributes we believe are needed to succeed, regardless of the external environment in which they operate. We will continue to look for opportunities to benefit investors, capturing gains when the market rallies, and adding to fundamentally strong companies when the market pulls back.
December 16, 2019
1 Total return includes reinvestment of dividends and any capital gains paid and does not take into consideration the maximum initial sales charge in the case of Class A shares, or the applicable contingent deferred sales charge imposed on redemptions in the case of Class C shares. Had these charges been reflected, returns would have been lower. Past performance is no guarantee of future results. Share price and investment return fluctuate such that upon redemption, fund shares may be worth more or less than their original cost.
2 Source: Lipper Inc. — The MSCI EAFE Index (Europe, Australasia, Far East) is a free float-adjusted, market capitalization-weighted index that is designed to measure the equity market performance of developed markets, excluding the U.S. and Canada. It reflects reinvestment of net dividends and, where applicable, capital gain distributions. Investors cannot invest directly in any index.
Please note: the position in any security highlighted with italicized typeface was sold during the reporting period.
Equities are subject generally to market, market sector, market liquidity, issuer and investment style risks, among other factors, to varying degrees, all of which are more fully described in the fund’s prospectus.
Investing internationally involves special risks, including changes in currency exchange rates, political, economic, and social instability, a lack of comprehensive company information, differing auditing and legal standards, and less market liquidity.
The fund may, but is not required to, use derivative instruments, such as options, futures, options on futures, forward contracts and other credit derivatives. A small investment in derivatives could have a potentially large impact on the fund’s performance. The use of derivatives involves risks different from, or possibly greater than, the risks associated with investing directly in the underlying assets.
5
FUND PERFORMANCE(Unaudited)
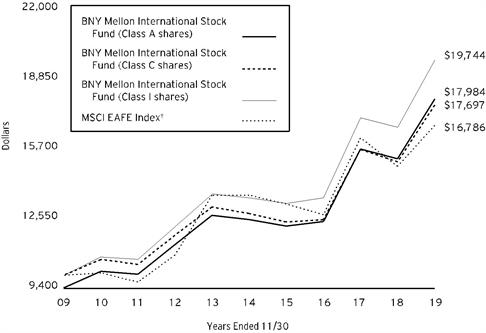
Comparison of change in value of a $10,000 investment in Class A shares, Class C shares and Class I shares of BNY Mellon International Stock Fund with a hypothetical investment of $10,000 in the MSCI EAFE Index (the “Index”)
† Source: Lipper Inc.
Past performance is not predictive of future performance.
The above graph compares a hypothetical investment of $10,000 made in each of the Class A, Class C and Class I shares of BNY Mellon International Stock Fund on 11/30/09 to a hypothetical investment of $10,000 made in the Index on that date. All dividends and capital gain distributions are reinvested.
The fund’s performance shown in the line graph above takes into account the maximum initial sales charge on Class A shares and all other applicable fees and expenses on all classes. The MSCI EAFE Index (Europe, Australasia, Far East) is a free float-adjusted market capitalization-weighted index that is designed to measure the equity market performance of developed markets, excluding the U.S. and Canada. Unlike a mutual fund, the Index is not subject to charges, fees and other expenses. Investors cannot invest directly in any index. Further information relating to fund performance, including expense reimbursements, if applicable, is contained in the Financial Highlights section of the prospectus and elsewhere in this report.
6
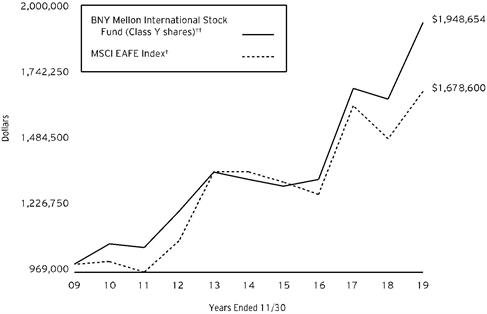
Comparison of change in value of a $1,000,000 investment in Class Y shares of BNY Mellon International Stock Fund with a hypothetical investment of $1,000,000 in the MSCI EAFE Index (the “Index”)
† Source: Lipper Inc.
†† The total return figures presented for Class Y shares of the fund reflect the performance of the fund’s Class A shares for the period prior to 7/1/13 (the inception date for Class Y shares), not reflecting the applicable sales charges for Class A shares.
Past performance is not predictive of future performance.
The above graph compares a hypothetical investment of $1,000,000 made in Class Y shares of BNY Mellon International Stock Fund on 11/30/09 to a hypothetical investment of $1,000,000 made in the Index on that date. All dividends and capital gain distributions are reinvested.
The fund’s performance shown in the line graph above takes into account all other applicable fees and expenses of fund’s Class Y shares. The MSCI EAFE Index (Europe, Australasia, Far East) is a free float-adjusted market capitalization-weighted index that is designed to measure the equity market performance of developed markets, excluding the U.S. and Canada. Unlike a mutual fund, the Index is not subject to charges, fees and other expenses. Investors cannot invest directly in any index. Further information relating to fund performance, including expense reimbursements, if applicable, is contained in the Financial Highlights section of the prospectus and elsewhere in this report.
7
FUND PERFORMANCE(Unaudited) (continued)
Average Annual Total Returns as of 11/30/19 | ||||
Inception | ||||
| Date | 1 Year | 5 Years | 10 Years |
Class A shares | ||||
with maximum sales charge (5.75%) | 12/29/06 | 11.03% | 6.26% | 6.05% |
without sales charge | 12/29/06 | 17.81% | 7.52% | 6.67% |
Class C shares | ||||
with applicable redemption charge† | 12/29/06 | 15.96% | 6.71% | 5.87% |
without redemption | 12/29/06 | 16.96% | 6.71% | 5.87% |
Class I shares | 12/29/06 | 18.23% | 7.88% | 7.04% |
Class Y shares | 7/1/13 | 18.24% | 7.90% | 6.90%†† |
MSCI EAFE Index | 12.44% | 4.26% | 5.32% | |
† The maximum contingent deferred sales charge for Class C shares is 1% for shares redeemed within one year of the date of purchase.
†† The total return performance figures presented for Class Y shares of the fund reflect the performance of the fund’s Class A shares for the period prior to 7/1/13 (the inception date for Class Y shares), not reflecting the applicable sales charges for Class A shares.
The performance data quoted represents past performance, which is no guarantee of future results. Share price and investment return fluctuate and an investor’s shares may be worth more or less than original cost upon redemption. Current performance may be lower or higher than the performance quoted. Go towww.bnymellonim.com/us for the fund’s most recent month-end returns.
The fund’s performance shown in the graphs and table does not reflect the deduction of taxes that a shareholder would pay on fund distributions or the redemption of fund shares. In addition to the performance of Class A shares shown with and without a maximum sales charge, the fund’s performance shown in the table takes into account all other applicable fees and expenses on all classes.
8
UNDERSTANDING YOUR FUND’S EXPENSES(Unaudited)
As a mutual fund investor, you pay ongoing expenses, such as management fees and other expenses. Using the information below, you can estimate how these expenses affect your investment and compare them with the expenses of other funds. You also may pay one-time transaction expenses, including sales charges (loads) and redemption fees, which are not shown in this section and would have resulted in higher total expenses. For more information, see your fund’s prospectus or talk to your financial adviser.
Review your fund’s expenses
The table below shows the expenses you would have paid on a $1,000 investment in BNY Mellon International Stock Fund from June 1, 2019 to November 30, 2019. It also shows how much a $1,000 investment would be worth at the close of the period, assuming actual returns and expenses.
Expenses and Value of a $1,000 Investment |
| |||||
Assume actual returns for the six months ended November 30, 2019 |
| |||||
|
|
|
|
|
|
|
|
| Class A | Class C | Class I | Class Y |
|
Expense paid per $1,000† | $6.55 | $10.44 | $4.81 | $4.65 |
| |
Ending value (after expenses) | $1,107.20 | $1,102.80 | $1,109.40 | $1,109.00 |
| |
COMPARING YOUR FUND’S EXPENSES
WITH THOSE OF OTHER FUNDS(Unaudited)
Using the SEC’s method to compare expenses
The Securities and Exchange Commission (“SEC”) has established guidelines to help investors assess fund expenses. Per these guidelines, the table below shows your fund’s expenses based on a $1,000 investment, assuming a hypothetical 5% annualized return. You can use this information to compare the ongoing expenses (but not transaction expenses or total cost) of investing in the fund with those of other funds. All mutual fund shareholder reports will provide this information to help you make this comparison. Please note that you cannot use this information to estimate your actual ending account balance and expenses paid during the period.
Expenses and Value of a $1,000 Investment |
| |||||
Assuming a hypothetical 5% annualized return for the six months ended November 30, 2019 |
| |||||
|
|
|
|
|
|
|
|
| Class A | Class C | Class I | Class Y |
|
Expense paid per $1,000† | $6.28 | $10.00 | $4.61 | $4.46 |
| |
Ending value (after expenses) | $1,018.85 | $1,015.14 | $1,020.51 | $1,020.66 |
| |
†Expenses are equal to the fund’s annualized expense ratio of 1.24% for Class A, 1.98% for Class C, .91% for Class I and .88% for Class Y, multiplied by the average account value over the period, multiplied by 183/365 (to reflect the one-half year period). | ||||||
9
STATEMENT OF INVESTMENTS
November 30, 2019
Description | Shares | Value ($) | |||||
Common Stocks - 98.1% | |||||||
Australia - 3.8% | |||||||
Cochlear | 431,100 | 68,230,557 | |||||
CSL | 533,400 | 102,277,248 | |||||
170,507,805 | |||||||
Canada - 2.4% | |||||||
Alimentation Couche-Tard, Cl. B | 3,259,400 | 106,642,719 | |||||
China - 1.7% | |||||||
CNOOC | 54,274,000 | 78,761,970 | |||||
Denmark - 6.6% | |||||||
Coloplast, Cl. B | 815,800 | 96,374,126 | |||||
Novo Nordisk, Cl. B | 1,920,600 | 107,950,741 | |||||
Novozymes, Cl. B | 2,005,512 | a | 95,808,951 | ||||
300,133,818 | |||||||
Finland - 2.5% | |||||||
Kone, Cl. B | 1,783,900 | 111,669,632 | |||||
France - 9.5% | |||||||
Air Liquide | 890,120 | 120,668,392 | |||||
Dassault Systemes | 315,677 | 49,732,733 | |||||
L'Oreal | 292,400 | 83,336,862 | |||||
LVMH Moet Hennessy Louis Vuitton | 202,300 | 90,776,544 | |||||
Total | 1,660,000 | 87,125,080 | |||||
431,639,611 | |||||||
Germany - 5.5% | |||||||
Adidas | 408,200 | 127,156,616 | |||||
SAP | 902,200 | 122,733,408 | |||||
249,890,024 | |||||||
Hong Kong - 7.2% | |||||||
AIA Group | 13,613,400 | 136,341,817 | |||||
CLP Holdings | 7,186,500 | 74,086,209 | |||||
Hang Lung Properties | 25,615,000 | 52,486,200 | |||||
Hong Kong & China Gas | 32,140,153 | 61,258,051 | |||||
324,172,277 | |||||||
Ireland - 2.9% | |||||||
Experian | 3,928,700 | 130,230,750 | |||||
Japan - 25.0% | |||||||
Daikin Industries | 669,100 | 96,249,413 | |||||
Daito Trust Construction | 636,500 | 77,836,120 | |||||
FANUC | 482,500 | 92,153,511 | |||||
Kao | 1,221,000 | 96,069,179 | |||||
Keyence | 427,280 | 146,154,705 | |||||
Makita | 2,050,900 | 67,829,318 | |||||
MISUMI Group | 1,837,800 | 45,502,152 | |||||
10
Description | Shares | Value ($) | |||||
Common Stocks - 98.1% (continued) | |||||||
Japan - 25.0% (continued) | |||||||
Murata Manufacturing | 1,667,500 | 96,648,120 | |||||
Shimano | 479,200 | 77,491,572 | |||||
Shin-Etsu Chemical | 1,011,600 | 108,225,627 | |||||
SMC | 314,100 | 142,364,451 | |||||
Sysmex | 1,202,400 | 83,345,748 | |||||
1,129,869,916 | |||||||
Netherlands - 2.7% | |||||||
ASML Holding | 448,700 | 122,100,199 | |||||
Portugal - 1.5% | |||||||
Galp Energia | 4,176,300 | 67,980,214 | |||||
Spain - 2.1% | |||||||
Industria de Diseno Textil | 3,054,100 | 95,086,478 | |||||
Switzerland - 13.1% | |||||||
Alcon | 127,489 | b | 7,038,668 | ||||
Givaudan | 35,300 | 103,746,700 | |||||
Kuehne + Nagel International | 667,600 | 108,551,760 | |||||
Nestle | 879,000 | 91,345,680 | |||||
Novartis | 1,120,000 | 103,107,200 | |||||
Roche Holding | 353,450 | 108,933,290 | |||||
SGS | 26,500 | 68,953,000 | |||||
591,676,298 | |||||||
Taiwan - 2.8% | |||||||
Taiwan Semiconductor Manufacturing, ADR | 2,400,400 | a | 127,437,236 | ||||
United Kingdom - 8.8% | |||||||
Compass Group | 3,574,000 | 87,571,991 | |||||
Diageo | 2,184,700 | 89,429,662 | |||||
Intertek Group | 568,500 | 40,557,464 | |||||
Reckitt Benckiser Group | 1,042,700 | 81,804,623 | |||||
Smith & Nephew | 4,500,000 | 100,745,498 | |||||
400,109,238 | |||||||
Total Common Stocks(cost $2,918,888,440) | 4,437,908,185 | ||||||
1-Day | |||||||
Investment Companies - 1.7% | |||||||
Registered Investment Companies - 1.7% | |||||||
Dreyfus Institutional Preferred Government Plus Money Market Fund | 1.63 | 76,224,829 | c | 76,224,829 | |||
11
STATEMENT OF INVESTMENTS (continued)
Description | 1-Day | Shares | Value (%) | ||||
Investment of Cash Collateral for Securities Loaned - .0% | |||||||
Registered Investment Companies - .0% | |||||||
Dreyfus Institutional Preferred Government Plus Money Market Fund | 1.63 | 649,705 | c | 649,705 | |||
Total Investments(cost $2,995,762,974) | 99.8% | 4,514,782,719 | |||||
Cash and Receivables (Net) | .2% | 10,994,825 | |||||
Net Assets | 100.0% | 4,525,777,544 | |||||
ADR—American Depository Receipt
a Security, or portion thereof, on loan. At November 30, 2019, the value of the fund’s securities on loan was $1,915,446 and the value of the collateral was $1,996,436, consisting of cash collateral of $649,705 and U.S. Government & Agency securities valued at $1,346,731.
b Non-income producing security.
c Investment in affiliated issuer. The investment objective of this investment company is publicly available and can be found within the investment company’s prospectus.
Portfolio Summary (Unaudited)† | Value (%) |
Capital Goods | 12.3 |
Materials | 9.5 |
Pharmaceuticals Biotechnology & Life Sciences | 9.3 |
Health Care Equipment & Services | 7.9 |
Consumer Durables & Apparel | 6.5 |
Household & Personal Products | 5.8 |
Semiconductors & Semiconductor Equipment | 5.5 |
Technology Hardware & Equipment | 5.4 |
Commercial & Professional Services | 5.3 |
Energy | 5.2 |
Food, Beverage & Tobacco | 4.0 |
Software & Services | 3.8 |
Insurance | 3.0 |
Utilities | 3.0 |
Real Estate | 2.9 |
Transportation | 2.4 |
Food & Staples Retailing | 2.3 |
Retailing | 2.1 |
Consumer Services | 1.9 |
Investment Companies | 1.7 |
99.8 |
† Based on net assets.
See notes to financial statements.
12
STATEMENT OF INVESTMENTS IN AFFILIATED ISSUERS
Investment Companies | Value | Purchases ($) | Sales ($) | Value | Net | Dividends/ |
Registered Investment Companies; | ||||||
Dreyfus Institutional Preferred Government Plus Money Market Fund | 41,179,649 | 553,849,232 | 518,804,052 | 76,224,829 | 1.7 | 2,156,927 |
Investment of Cash Collateral for Securities Loaned;† | ||||||
Dreyfus Institutional Preferred Government Plus Money Market Fund | - | 1,825,129 | 1,175,424 | 649,705 | .0 | - |
Total | 41,179,649 | 555,674,361 | 519,979,476 | 76,874,534 | 1.7 | 2,156,927 |
† Effective January 2, 2019, cash collateral for securities lending was transferred from Dreyfus Institutional Preferred Government Money Market Fund, Institutional Shares to Dreyfus Institutional Preferred Government Plus Money Market Fund.
See notes to financial statements.
13
STATEMENT OF FORWARD FOREIGN CURRENCY EXCHANGE CONTRACTSNovember 30, 2019
Counterparty/ Purchased | Purchased Currency | Currency | Sold | Settlement Date | Unrealized Appreciation (Depreciation)($) |
National Australia Bank | |||||
Japanese Yen | 94,843,032 | United States Dollar | 866,701 | 12/2/19 | (71) |
United States Dollar | 143,609 | Japanese Yen | 15,731,100 | 12/2/19 | (134) |
United States Dollar | 1,279,608 | Swiss Franc | 1,277,655 | 12/3/19 | 1,609 |
Japanese Yen | 192,565,498 | United States Dollar | 1,757,786 | 12/3/19 | 1,870 |
United States Dollar | 428,664 | Swiss Franc | 428,777 | 12/2/19 | (199) |
Gross Unrealized Appreciation | 3,479 | ||||
Gross Unrealized Depreciation | (404) | ||||
See notes to financial statements.
14
STATEMENT OF ASSETS AND LIABILITIES
November 30, 2019
|
|
|
|
|
|
|
|
|
| Cost |
| Value |
|
Assets ($): |
|
|
|
| ||
Investments in securities—See Statement of Investments |
|
|
| |||
Unaffiliated issuers | 2,918,888,440 |
| 4,437,908,185 |
| ||
Affiliated issuers |
| 76,874,534 |
| 76,874,534 |
| |
Cash denominated in foreign currency |
|
| 661,819 |
| 661,931 |
|
Tax reclaim receivable |
| 10,786,433 |
| |||
Receivable for shares of Common Stock subscribed |
| 3,243,798 |
| |||
Dividends, interest and securities lending income receivable |
| 2,127,848 |
| |||
Receivable for investment securities sold |
| 1,707,821 |
| |||
Unrealized appreciation on forward foreign |
| 3,479 |
| |||
Prepaid expenses |
|
|
|
| 61,010 |
|
|
|
|
|
| 4,533,375,039 |
|
Liabilities ($): |
|
|
|
| ||
Due to BNY Mellon Investment Adviser, Inc. and affiliates—Note 3(c) |
| 3,353,815 |
| |||
Payable for investment securities purchased |
| 2,624,258 |
| |||
Payable for shares of Common Stock redeemed |
| 714,890 |
| |||
Liability for securities on loan—Note 1(c) |
| 649,705 |
| |||
Directors’ fees and expenses payable |
| 70,693 |
| |||
Unrealized depreciation on forward foreign |
| 404 |
| |||
Other accrued expenses |
|
|
|
| 183,730 |
|
|
|
|
|
| 7,597,495 |
|
Net Assets ($) |
|
| 4,525,777,544 |
| ||
Composition of Net Assets ($): |
|
|
|
| ||
Paid-in capital |
|
|
|
| 2,893,816,464 |
|
Total distributable earnings (loss) |
|
|
|
| 1,631,961,080 |
|
Net Assets ($) |
|
| 4,525,777,544 |
| ||
Net Asset Value Per Share | Class A | Class C | Class I | Class Y |
|
Net Assets ($) | 37,036,287 | 12,000,729 | 2,191,801,102 | 2,284,939,426 |
|
Shares Outstanding | 1,784,050 | 588,792 | 104,892,354 | 110,604,801 |
|
Net Asset Value Per Share ($) | 20.76 | 20.38 | 20.90 | 20.66 |
|
|
|
|
|
|
|
See notes to financial statements. |
|
|
|
|
|
15
STATEMENT OF OPERATIONS
Year Ended November 30, 2019
|
|
|
|
|
|
|
|
|
|
|
|
|
|
Investment Income ($): |
|
|
|
| ||
Income: |
|
|
|
| ||
Cash dividends (net of $10,440,159 foreign taxes withheld at source): |
| |||||
Unaffiliated issuers |
|
| 81,725,424 |
| ||
Affiliated issuers |
|
| 2,156,927 |
| ||
Income from securities lending—Note 1(c) |
|
| 10,266 |
| ||
Total Income |
|
| 83,892,617 |
| ||
Expenses: |
|
|
|
| ||
Management fee—Note 3(a) |
|
| 35,260,646 |
| ||
Shareholder servicing costs—Note 3(c) |
|
| 665,625 |
| ||
Custodian fees—Note 3(c) |
|
| 460,271 |
| ||
Directors’ fees and expenses—Note 3(d) |
|
| 455,259 |
| ||
Professional fees |
|
| 123,071 |
| ||
Loan commitment fees—Note 2 |
|
| 97,610 |
| ||
Distribution fees—Note 3(b) |
|
| 91,653 |
| ||
Registration fees |
|
| 88,150 |
| ||
Prospectus and shareholders’ reports |
|
| 58,891 |
| ||
Interest expense—Note 2 |
|
| 931 |
| ||
Miscellaneous |
|
| 168,442 |
| ||
Total Expenses |
|
| 37,470,549 |
| ||
Investment Income—Net |
|
| 46,422,068 |
| ||
Realized and Unrealized Gain (Loss) on Investments—Note 4 ($): |
|
| ||||
Net realized gain (loss) on investments and foreign currency transactions | 67,328,039 |
| ||||
Net realized gain (loss) on forward foreign currency exchange contracts | 410,619 |
| ||||
Net Realized Gain (Loss) |
|
| 67,738,658 |
| ||
Net change in unrealized appreciation (depreciation) on investments | 586,952,380 |
| ||||
Net change in unrealized appreciation (depreciation) on | 3,075 |
| ||||
Net Change in Unrealized Appreciation (Depreciation) |
|
| 586,955,455 |
| ||
Net Realized and Unrealized Gain (Loss) on Investments |
|
| 654,694,113 |
| ||
Net Increase in Net Assets Resulting from Operations |
| 701,116,181 |
| |||
|
|
|
|
|
|
|
See notes to financial statements. | ||||||
16
STATEMENT OF CHANGES IN NET ASSETS
|
|
|
| Year Ended November 30, | |||||
|
|
|
| 2019 |
| 2018 |
| ||
Operations ($): |
|
|
|
|
|
|
|
| |
Investment income—net |
|
| 46,422,068 |
|
|
| 46,241,692 |
| |
Net realized gain (loss) on investments |
| 67,738,658 |
|
|
| 25,224,498 |
| ||
Net change in unrealized appreciation |
| 586,955,455 |
|
|
| (166,813,403) |
| ||
Net Increase (Decrease) in Net Assets | 701,116,181 |
|
|
| (95,347,213) |
| |||
Distributions ($): |
| ||||||||
Distributions to shareholders: |
|
|
|
|
|
|
|
| |
Class A |
|
| (334,699) |
|
|
| (208,298) |
| |
Class C |
|
| (63,825) |
|
|
| - |
| |
Class I |
|
| (31,525,541) |
|
|
| (20,940,163) |
| |
Class Y |
|
| (29,551,364) |
|
|
| (22,653,914) |
| |
Total Distributions |
|
| (61,475,429) |
|
|
| (43,802,375) |
| |
Capital Stock Transactions ($): |
| ||||||||
Net proceeds from shares sold: |
|
|
|
|
|
|
|
| |
Class A |
|
| 18,146,113 |
|
|
| 7,134,048 |
| |
Class C |
|
| 3,259,426 |
|
|
| 1,318,463 |
| |
Class I |
|
| 410,946,141 |
|
|
| 301,599,131 |
| |
Class Y |
|
| 400,508,522 |
|
|
| 269,698,313 |
| |
Distributions reinvested: |
|
|
|
|
|
|
|
| |
Class A |
|
| 290,947 |
|
|
| 179,438 |
| |
Class C |
|
| 54,300 |
|
|
| - |
| |
Class I |
|
| 28,726,988 |
|
|
| 19,468,039 |
| |
Class Y |
|
| 13,683,020 |
|
|
| 11,153,697 |
| |
Cost of shares redeemed: |
|
|
|
|
|
|
|
| |
Class A |
|
| (12,319,454) |
|
|
| (9,798,689) |
| |
Class C |
|
| (5,313,447) |
|
|
| (3,687,914) |
| |
Class I |
|
| (522,451,493) |
|
|
| (263,591,167) |
| |
Class Y |
|
| (242,070,508) |
|
|
| (497,847,755) |
| |
Increase (Decrease) in Net Assets | 93,460,555 |
|
|
| (164,374,396) |
| |||
Total Increase (Decrease) in Net Assets | 733,101,307 |
|
|
| (303,523,984) |
| |||
Net Assets ($): |
| ||||||||
Beginning of Period |
|
| 3,792,676,237 |
|
|
| 4,096,200,221 |
| |
End of Period |
|
| 4,525,777,544 |
|
|
| 3,792,676,237 |
| |
17
STATEMENT OF CHANGES IN NET ASSETS (continued)
|
|
|
| Year Ended November 30, | |||||
|
|
|
| 2019 |
| 2018 |
| ||
Capital Share Transactions (Shares): |
| ||||||||
Class Aa |
|
|
|
|
|
|
|
| |
Shares sold |
|
| 954,147 |
|
|
| 388,128 |
| |
Shares issued for distributions reinvested |
|
| 17,206 |
|
|
| 9,637 |
| |
Shares redeemed |
|
| (641,743) |
|
|
| (532,501) |
| |
Net Increase (Decrease) in Shares Outstanding | 329,610 |
|
|
| (134,736) |
| |||
Class Ca |
|
|
|
|
|
|
|
| |
Shares sold |
|
| 172,340 |
|
|
| 73,264 |
| |
Shares issued for distributions reinvested |
|
| 3,248 |
|
|
| - |
| |
Shares redeemed |
|
| (274,313) |
|
|
| (203,182) |
| |
Net Increase (Decrease) in Shares Outstanding | (98,725) |
|
|
| (129,918) |
| |||
Class Ia |
|
|
|
|
|
|
|
| |
Shares sold |
|
| 21,586,686 |
|
|
| 16,104,300 |
| |
Shares issued for distributions reinvested |
|
| 1,692,810 |
|
|
| 1,041,629 |
| |
Shares redeemed |
|
| (26,993,396) |
|
|
| (14,133,188) |
| |
Net Increase (Decrease) in Shares Outstanding | (3,713,900) |
|
|
| 3,012,741 |
| |||
Class Ya |
|
|
|
|
|
|
|
| |
Shares sold |
|
| 21,445,913 |
|
|
| 14,555,828 |
| |
Shares issued for distributions reinvested |
|
| 815,436 |
|
|
| 603,555 |
| |
Shares redeemed |
|
| (12,950,473) |
|
|
| (26,890,318) |
| |
Net Increase (Decrease) in Shares Outstanding | 9,310,876 |
|
|
| (11,730,935) |
| |||
|
|
|
|
|
|
|
|
|
|
aDuring the period ended November 30, 2019, 154 Class C shares representing $2,925 were automatically converted to 152 Class A shares, 793 Class Y shares representing $16,443 were exchanged for 789 Class A shares and 700,699 Class I shares representing $13,061,012 were exchanged for 708,650 Class Y shares. During the period ended November 30, 2018, 852,262 Class Y shares representing $15,686,946 were exchanged for 842,649 Class I shares, 2,012 Class C shares and 3,933 Class Y shares representing $108,868 were exchanged for 5,888 Class A shares. | |||||||||
See notes to financial statements. | |||||||||
18
FINANCIAL HIGHLIGHTS
The following tables describe the performance for each share class for the fiscal periods indicated. All information (except portfolio turnover rate) reflects financial results for a single fund share. Total return shows how much your investment in the fund would have increased (or decreased) during each period, assuming you had reinvested all dividends and distributions. These figures have been derived from the fund’s financial statements.
Year Ended November 30, | ||||||
Class A Shares | 2019 | 2018 | 2017 | 2016 | 2015 | |
Per Share Data ($): | ||||||
Net asset value, | 17.86 | 18.51 | 14.77 | 14.66 | 15.15 | |
Investment Operations: | ||||||
Investment income—neta | .15 | .15 | .10 | .13 | .16 | |
Net realized and unrealized | 2.98 | (.67) | 3.77 | .10 | (.50) | |
Total from | 3.13 | (.52) | 3.87 | .23 | (.34) | |
Distributions: | ||||||
Dividends from | (.15) | (.13) | (.13) | (.12) | (.15) | |
Dividends from net realized | (.08) | - | - | - | - | |
Total Distributions | (.23) | (.13) | (.13) | (.12) | (.15) | |
Net asset value, end of period | 20.76 | 17.86 | 18.51 | 14.77 | 14.66 | |
Total Return (%)b | 17.81 | (2.84) | 26.39 | 1.62 | (2.27) | |
Ratios/Supplemental Data (%): | ||||||
Ratio of total expenses | 1.24 | 1.22 | 1.26 | 1.27 | 1.26 | |
Ratio of net expenses | 1.24 | 1.22 | 1.26 | 1.27 | 1.26 | |
Ratio of net investment income | .77 | .81 | .64 | .89 | 1.08 | |
Portfolio Turnover Rate | 7.38 | 7.47 | 12.49 | 10.65 | 16.52 | |
Net Assets, | 37,036 | 25,981 | 29,414 | 59,019 | 85,618 | |
a Based on average shares outstanding.
b Exclusive of sales charge.
See notes to financial statements.
19
FINANCIAL HIGHLIGHTS (continued)
Year Ended November 30, | ||||||
Class C Shares | 2019 | 2018 | 2017 | 2016 | 2015 | |
Per Share Data ($): | ||||||
Net asset value, | 17.53 | 18.17 | 14.49 | 14.37 | 14.84 | |
Investment Operations: | ||||||
Investment income—neta | .02 | .01 | .02 | .02 | .04 | |
Net realized and unrealized | 2.92 | (.65) | 3.66 | .10 | (.48) | |
Total from | 2.94 | (.64) | 3.68 | .12 | (.44) | |
Distributions: | ||||||
Dividends from | (.01) | - | - | - | (.03) | |
Dividends from net realized | (.08) | - | - | - | - | |
Total Distributions | (.09) | - | - | - | (.03) | |
Net asset value, end of period | 20.38 | 17.53 | 18.17 | 14.49 | 14.37 | |
Total Return (%)b | 16.96 | (3.58) | 25.40 | .83 | (2.97) | |
Ratios/Supplemental Data (%): | ||||||
Ratio of total expenses | 1.98 | 1.96 | 2.02 | 2.04 | 2.03 | |
Ratio of net expenses | 1.98 | 1.96 | 2.02 | 2.04 | 2.03 | |
Ratio of net investment income | .12 | .07 | .10 | .12 | .30 | |
Portfolio Turnover Rate | 7.38 | 7.47 | 12.49 | 10.65 | 16.52 | |
Net Assets, | 12,001 | 12,050 | 14,852 | 13,465 | 16,952 | |
a Based on average shares outstanding.
b Exclusive of sales charge.
See notes to financial statements.
20
Year Ended November 30, | ||||||
Class I Shares | 2019 | 2018 | 2017 | 2016 | 2015 | |
Per Share Data ($): | ||||||
Net asset value, | 17.98 | 18.64 | 14.88 | 14.79 | 15.31 | |
Investment Operations: | ||||||
Investment income—neta | .22 | .21 | .20 | .18 | .20 | |
Net realized and unrealized | 2.99 | (.67) | 3.74 | .10 | (.49) | |
Total from | 3.21 | (.46) | 3.94 | .28 | (.29) | |
Distributions: | ||||||
Dividends from | (.21) | (.20) | (.18) | (.19) | (.23) | |
Dividends from net realized | (.08) | - | - | - | - | |
Total Distributions | (.29) | (.20) | (.18) | (.19) | (.23) | |
Net asset value, end of period | 20.90 | 17.98 | 18.64 | 14.88 | 14.79 | |
Total Return (%) | 18.23 | (2.53) | 26.81 | 1.92 | (1.90) | |
Ratios/Supplemental Data (%): | ||||||
Ratio of total expenses | .91 | .91 | .93 | .94 | .94 | |
Ratio of net expenses | .91 | .91 | .93 | .94 | .94 | |
Ratio of net investment income | ||||||
to average net assets | 1.13 | 1.11 | 1.20 | 1.21 | 1.33 | |
Portfolio Turnover Rate | 7.38 | 7.47 | 12.49 | 10.65 | 16.52 | |
Net Assets, | 2,191,801 | 1,953,256 | 1,968,366 | 1,520,360 | 1,560,084 | |
a Based on average shares outstanding.
See notes to financial statements.
21
FINANCIAL HIGHLIGHTS (continued)
Year Ended November 30, | ||||||
Class Y Shares | 2019 | 2018 | 2017 | 2016 | 2015 | |
Per Share Data ($): | ||||||
Net asset value, | 17.78 | 18.43 | 14.72 | 14.63 | 15.15 | |
Investment Operations: | ||||||
Investment income—neta | .21 | .21 | .20 | .19 | .22 | |
Net realized and unrealized | 2.97 | (.66) | 3.70 | .09 | (.51) | |
Total from Investment Operations | 3.18 | (.45) | 3.90 | .28 | (.29) | |
Distributions: | ||||||
Dividends from | (.22) | (.20) | (.19) | (.19) | (.23) | |
Dividends from net realized | (.08) | - | - | - | - | |
Total Distributions | (.30) | (.20) | (.19) | (.19) | (.23) | |
Net asset value, end of period | 20.66 | 17.78 | 18.43 | 14.72 | 14.63 | |
Total Return (%) | 18.24 | (2.48) | 26.80 | 1.97 | (1.89) | |
Ratios/Supplemental Data (%): | ||||||
Ratio of total expenses | .89 | .89 | .91 | .91 | .91 | |
Ratio of net expenses | .89 | .89 | .91 | .91 | .91 | |
Ratio of net investment income | 1.12 | 1.16 | 1.22 | 1.27 | 1.44 | |
Portfolio Turnover Rate | 7.38 | 7.47 | 12.49 | 10.65 | 16.52 | |
Net Assets, | 2,284,939 | 1,801,389 | 2,083,569 | 1,627,586 | 1,625,626 | |
a Based on average shares outstanding.
See notes to financial statements.
22
NOTES TO FINANCIAL STATEMENTS
NOTE 1—Significant Accounting Policies:
BNY Mellon International Stock Fund (the “fund”) is a separate diversified series of BNY Mellon Strategic Funds, Inc. (the “Company”), which is registered under the Investment Company Act of 1940, as amended (the “Act”), as an open-end management investment company and operates as a series company currently offering six series, including the fund. The fund’s investment objective is to seek long-term total return. BNY Mellon Investment Adviser, Inc. (the “Adviser”), a wholly-owned subsidiary of The Bank of New York Mellon Corporation (“BNY Mellon”), serves as the fund’s investment adviser. Walter Scott & Partners Limited (the “Sub-Adviser”), a wholly-owned subsidiary of BNY Mellon and an affiliate of the Adviser, serves as the fund’s sub-investment adviser.
Effective June 3, 2019, the fund changed its name from International Stock Fund to BNY Mellon International Stock Fund and the Company changed its name from Strategic Funds, Inc. to BNY Mellon Strategic Funds, Inc. In addition, The Dreyfus Corporation, the fund’s investment adviser, changed its name to “BNY Mellon Investment Adviser, Inc.”, MBSC Securities Corporation, the fund’s distributor, changed its name to “BNY Mellon Securities Corporation” and Dreyfus Transfer, Inc., the fund’s transfer agent, changed its name to “BNY Mellon Transfer, Inc.”
BNY Mellon Securities Corporation (the “Distributor”), a wholly-owned subsidiary of the Adviser, is the distributor of the fund’s shares. The fund is authorized to issue 700 million shares of $.001 par value Common Stock. The fund currently has authorized five classes of shares: Class A (100 million shares authorized), Class C (100 million shares authorized), Class I (200 million shares authorized), Class T (100 million shares authorized) and Class Y (200 million shares authorized). Class A and Class T shares generally are subject to a sales charge imposed at the time of purchase. Class C shares are subject to a contingent deferred sales charge (“CDSC”) imposed on Class C shares redeemed within one year of purchase. Class C shares automatically convert to Class A shares ten years after the date of purchase, without the imposition of a sales charge. Class I and Class Y shares are sold at net asset value per share generally to institutional investors. As of the date of this report, the fund did not offer Class T shares for purchase. Other differences between the classes include the services offered to and the expenses borne by each class, the allocation of certain transfer agency costs and certain voting rights. Income, expenses (other than expenses attributable to a specific class), and realized and
23
NOTES TO FINANCIAL STATEMENTS(continued)
unrealized gains or losses on investments are allocated to each class of shares based on its relative net assets.
The Company accounts separately for the assets, liabilities and operations of each series. Expenses directly attributable to each series are charged to that series’ operations; expenses which are applicable to all series are allocated among them on a pro rata basis.
The Financial Accounting Standards Board (“FASB”) Accounting Standards Codification (“ASC”) is the exclusive reference of authoritative U.S. generally accepted accounting principles (“GAAP”) recognized by the FASB to be applied by nongovernmental entities. Rules and interpretive releases of the Securities and Exchange Commission (“SEC”) under authority of federal laws are also sources of authoritative GAAP for SEC registrants. The fund is an investment company and applies the accounting and reporting guidance of the FASB ASC Topic 946 Financial Services-Investment Companies. The fund’s financial statements are prepared in accordance with GAAP, which may require the use of management estimates and assumptions. Actual results could differ from those estimates.
The Companyenters into contracts that contain a variety of indemnifications. The fund’s maximum exposure under these arrangements is unknown. The fund does not anticipate recognizing any loss related to these arrangements.
(a) Portfolio valuation: The fair value of a financial instrument is the amount that would be received to sell an asset or paid to transfer a liability in an orderly transaction between market participants at the measurement date (i.e., the exit price). GAAP establishes a fair value hierarchy that prioritizes the inputs of valuation techniques used to measure fair value. This hierarchy gives the highest priority to unadjusted quoted prices in active markets for identical assets or liabilities (Level 1 measurements) and the lowest priority to unobservable inputs (Level 3 measurements).
Additionally, GAAP provides guidance on determining whether the volume and activity in a market has decreased significantly and whether such a decrease in activity results in transactions that are not orderly. GAAP requires enhanced disclosures around valuation inputs and techniques used during annual and interim periods.
Various inputs are used in determining the value of the fund’s investments relating to fair value measurements. These inputs are summarized in the three broad levels listed below:
24
Level 1—unadjusted quoted prices in active markets for identical investments.
Level 2—other significant observable inputs (including quoted prices for similar investments, interest rates, prepayment speeds, credit risk, etc.).
Level 3—significant unobservable inputs (including the fund’s own assumptions in determining the fair value of investments).
The inputs or methodology used for valuing securities are not necessarily an indication of the risk associated with investing in those securities.
Changes in valuation techniques may result in transfers in or out of an assigned level within the disclosure hierarchy. Valuation techniques used to value the fund’s investments are as follows:
Investments in equity securities are valued at the last sales price on the securities exchange or national securities market on which such securities are primarily traded. Securities listed on the National Market System for which market quotations are available are valued at the official closing price or, if there is no official closing price that day, at the last sales price. For open short positions, asked prices are used for valuation purposes. Bid price is used when no asked price is available. Registered investment companies that are not traded on an exchange are valued at their net asset value. All of the preceding securities are generally categorized within Level 1 of the fair value hierarchy.
Securities not listed on an exchange or the national securities market, or securities for which there were no transactions, are valued at the average of the most recent bid and asked prices. These securities are generally categorized within Level 2 of the fair value hierarchy.
Fair valuing of securities may be determined with the assistance of a pricing service using calculations based on indices of domestic securities and other appropriate indicators, such as prices of relevant ADRs and futures. Utilizing these techniques may result in transfers between Level 1 and Level 2 of the fair value hierarchy.
When market quotations or official closing prices are not readily available, or are determined not to accurately reflect fair value, such as when the value of a security has been significantly affected by events after the close of the exchange or market on which the security is principally traded (for example, a foreign exchange or market), but before the fund calculates its net asset value, the fund may value these investments at fair value as determined in accordance with the procedures approved by the Company’s Board of Directors (the “Board”). Certain factors may be considered when
25
NOTES TO FINANCIAL STATEMENTS(continued)
fair valuing investments such as: fundamental analytical data, the nature and duration of restrictions on disposition, an evaluation of the forces that influence the market in which the securities are purchased and sold, and public trading in similar securities of the issuer or comparable issuers. These securities are either categorized within Level 2 or 3 of the fair value hierarchy depending on the relevant inputs used.
For restricted securities where observable inputs are limited, assumptions about market activity and risk are used and such securities are generally categorized within Level 3 of the fair value hierarchy.
Investments denominated in foreign currencies are translated to U.S. dollars at the prevailing rates of exchange.
Forward foreign currency exchange contracts (“forward contracts”) are valued at the forward rate and are generally categorized within Level 2 of the fair value hierarchy.
The following is a summary of the inputs used as of November 30, 2019in valuing the fund’s investments:
Level 1- | Level 2 - | Level 3- | Total | |
Assets ($) | ||||
Investments in Securities:† | ||||
Equity Securities - | 4,437,908,185 | - | - | 4,437,908,185 |
Investment Companies | 76,874,534 | - | - | 76,874,534 |
Other Financial Instruments: | ||||
Forward Foreign Currency Exchange Contracts†† | - | 3,479 | - | 3,479 |
Liabilities ($) | ||||
Other Financial Instruments: | ||||
Forward Foreign Currency Exchange Contracts†† | - | (404) | - | (404) |
† See Statement of Investment for additional detailed categorizations, if any.
†† Amount shown represents unrealized appreciation at period end, but only variation margin on exchanged traded and centrally cleared derivatives, if any are reported in the Statement of Assets and Liabilities.
(b) Foreign currency transactions: The fund does not isolate that portion of the results of operations resulting from changes in foreign exchange rates on investments from the fluctuations arising from changes
26
in the market prices of securities held. Such fluctuations are included with the net realized and unrealized gain or loss on investments.
Net realized foreign exchange gains or losses arise from sales of foreign currencies, currency gains or losses realized on securities transactions between trade and settlement date, and the difference between the amounts of dividends, interest and foreign withholding taxes recorded on the fund’s books and the U.S. dollar equivalent of the amounts actually received or paid. Net unrealized foreign exchange gains and losses arise from changes in the value of assets and liabilities other than investments resulting from changes in exchange rates. Foreign currency gains and losses on foreign currency transactions are also included with net realized and unrealized gain or loss on investments.
(c)Securities transactions and investment income: Securities transactions are recorded on a trade date basis. Realized gains and losses from securities transactions are recorded on the identified cost basis. Dividend income is recognized on the ex-dividend date and interest income, including, where applicable, accretion of discount and amortization of premium on investments, is recognized on the accrual basis.
Pursuant to a securities lending agreement with The Bank of New York Mellon, a subsidiary of BNY Mellon and an affiliate of the Adviser, the fund may lend securities to qualified institutions. It is the fund’s policy that, at origination, all loans are secured by collateral of at least 102% of the value of U.S. securities loaned and 105% of the value of foreign securities loaned. Collateral equivalent to at least 100% of the market value of securities on loan is maintained at all times. Collateral is either in the form of cash, which can be invested in certain money market mutual funds managed by the Adviser, or U.S. Government and Agency securities. The fund is entitled to receive all dividends, interest and distributions on securities loaned, in addition to income earned as a result of the lending transaction. Should a borrower fail to return the securities in a timely manner, The Bank of New York Mellon is required to replace the securities for the benefit of the fund or credit the fund with the market value of the unreturned securities and is subrogated to the fund’s rights against the borrower and the collateral. Additionally, the contractual maturity of security lending transactions are on an overnight and continuous basis. During the period ended November 30, 2019, The Bank of New York Mellon earned $2,012 from the lending of the fund’s portfolio securities, pursuant to the securities lending agreement.
(d) Affiliated issuers: Investments in other investment companies advised by the Adviser are considered “affiliated” under the Act.
27
NOTES TO FINANCIAL STATEMENTS(continued)
(e) Risk: Investing in foreign markets may involve special risks and considerations not typically associated with investing in the U.S. These risks include revaluation of currencies, high rates of inflation, repatriation restrictions on income and capital, and adverse political and economic developments. Moreover, securities issued in these markets may be less liquid, subject to government ownership controls and delayed settlements, and their prices may be more volatile than those of comparable securities in the U.S.
(f) Dividends and distributions to shareholders: Dividends and distributions are recorded on the ex-dividend date. Dividends from investment income-net and dividends from net realized capital gains, if any, are normally declared and paid annually, but the fund may make distributions on a more frequent basis to comply with the distribution requirements of the Internal Revenue Code of 1986, as amended (the “Code”). To the extent that net realized capital gains can be offset by capital loss carryovers, it is the policy of the fund not to distribute such gains. Income and capital gain distributions are determined in accordance with income tax regulations, which may differ from GAAP.
(g) Federal income taxes: It is the policy of the fund to continue to qualify as a regulated investment company, if such qualification is in the best interests of its shareholders, by complying with the applicable provisions of the Code, and to make distributions of taxable income and net realized capital gain sufficient to relieve it from substantially all federal income and excise taxes.
As of and during the period ended November 30, 2019, the fund did not have any liabilities for any uncertain tax positions. The fund recognizes interest and penalties, if any, related to uncertain tax positions as income tax expense in the Statement of Operations. During the period ended November 30, 2019, the fund did not incur any interest or penalties.
Each tax year in the four-year period ended November 30, 2019 remains subject to examination by the Internal Revenue Service and state taxing authorities.
At November 30, 2019, the components of accumulated earnings on a tax basis were as follows: undistributed ordinary income $45,907,586, undistributed capital gains $69,274,896 and unrealized appreciation $1,518,559,229. In addition, the fund had $1,780,631 of capital losses realized after October 31, 2019, which were deferred for tax purposes to the first day of the following fiscal year.
The tax character of distributions paid to shareholders during the fiscal periods ended November 30, 2019 and November 30, 2018 were as
28
follows: ordinary income $45,106,897 and $43,802,375, and long-term capital gains $16,368,532 and $0, respectively.
(h) New Accounting Pronouncements: Effective June 1, 2019, the fund adopted Accounting Standards Update 2018-13, Fair Value Measurement (Topic 820): Disclosure Framework—Changes to the Disclosure Requirements for Fair Value Measurement (“ASU 2018-13”). The update provides guidance that eliminates, adds and modifies certain disclosure requirements for fair value measurements. The adoption of ASU 2018-13 had no impact on the operations of the fund for the period ended November 30, 2019.
NOTE 2—Bank Lines of Credit:
The fund participates with other long-term open-end funds managed by the Adviser in a $1.030 billion unsecured credit facility led by Citibank, N.A. (the “Citibank Credit Facility”) and a $300 million unsecured credit facility provided by The Bank of New York Mellon (the “BNYM Credit Facility”), each to be utilized primarily for temporary or emergency purposes, including the financing of redemptions (each, a “Facility”). The Citibank Credit Facility is available in two tranches: (i) Tranche A is in an amount equal to $830 million and is available to all long-term open-ended funds, including the fund, and (ii) Tranche B is in amount equal to $200 million and is available only to BNY Mellon Floating Rate Income Fund, a series of BNY Mellon Investment Funds IV, Inc. In connection therewith, the fund has agreed to pay its pro rata portion of commitment fees for Tranche A of the Citibank Credit Facility and the BNYM Credit Facility. Interest is charged to the fund based on rates determined pursuant to the terms of the respective Facility at the time of borrowing.
The average amount of borrowings outstanding under the Facilities during the period ended November 30, 2019 was approximately $28,220 with a related weighted average annualized interest rate of 3.30%.
NOTE 3—Management Fee, Sub-Investment Advisory Fee and Other Transactions with Affiliates:
(a)Pursuant to a management agreement with the Adviser, the management fee is computed at the annual rate of .85% of the value of the fund’s average daily net assets and is payable monthly.
Pursuant to a sub-investment advisory agreement between the Adviser and the Sub-Adviser, the Adviser pays the Sub-Adviser a monthly fee at an annual rate of .41% of the value of the fund’s average daily net assets.
29
NOTES TO FINANCIAL STATEMENTS(continued)
During the period ended November 30, 2019, the Distributor retained $7,364 from commissions earned on sales of the fund’s Class A shares and $402 from CDSC fees on redemptions of the fund’s Class C shares.
(b) Under the Distribution Plan adopted pursuant to Rule 12b-1 under the Act, Class C shares pay the Distributor for distributing its shares at an annual rate of .75% of the value of its average daily net assets. During the period ended November 30, 2019, Class C shares were charged $91,653 pursuant to the Distribution Plan.
(c)Under the Shareholder Services Plan, Class A and Class C shares pay the Distributor at an annual rate of .25% of the value of their average daily net assets for the provision of certain services. The services provided may include personal services relating to shareholder accounts, such as answering shareholder inquiries regarding the fund and providing reports and other information, and services related to the maintenance of shareholder accounts. The Distributor may make payments to Service Agents (securities dealers, financial institutions or other industry professionals) with respect to these services. The Distributor determines the amounts to be paid to Service Agents. During the period ended November 30, 2019, Class A and Class C shares were charged $80,487and $30,551, respectively, pursuant to the Shareholder Services Plan.
The fund has an arrangement with the transfer agent whereby the fund may receive earnings credits when positive cash balances are maintained, which are used to offset transfer agency fees. The fund had an arrangement with the custodian to receive earnings credits when positive cash balances were maintained, which were used to offset custody fees. Effective February 1, 2019, the arrangement with the custodian changed whereby the fund will no longer receive earnings credits to offset its custody fees and will receive interest income or overdraft fees going forward. For financial reporting purposes, the fund includes net earnings credits, if any, as an expense offset in the Statement of Operations.
The fund compensates BNY Mellon Transfer, Inc., a wholly-owned subsidiary of the Adviser, under a transfer agency agreement for providing transfer agency and cash management services for the fund. The majority of transfer agency fees are comprised of amounts paid on a per account basis, while cash management fees are related to fund subscriptions and redemptions. During the period ended November 30, 2019, the fund was charged $23,179 for transfer agency services. These fees are included in Shareholder servicing costs in the Statement of Operations.
The fund compensates The Bank of New York Mellon under a custody agreement for providing custodial services for the fund. These fees are
30
determined based on net assets, geographic region and transaction activity. During the period ended November 30, 2019, the fund was charged $460,271 pursuant to the custody agreement.
During the period ended November 30, 2019, the fund was charged $11,659 for services performed by the Chief Compliance Officer and his staff. These fees are included in Miscellaneous in the Statement of Operations.
The components of “Due to BNY Mellon Investment Adviser, Inc. and affiliates” in the Statement of Assets and Liabilities consist of: management fees of $3,169,539, Distribution Plan fees of $7,195, Shareholder Services Plan fees of $9,957, custodian fees of $160,000, Chief Compliance Officer fees of $2,174 and transfer agency fees of $4,950.
(d) Each Board member also serves as a Board member of other funds in the BNY Mellon Family of Funds complex. Annual retainer fees and attendance fees are allocated to each fund based on net assets.
NOTE 4—Securities Transactions:
The aggregate amount of purchases and sales of investment securities, excluding short-term securities and forward contracts, during the period ended November 30, 2019, amounted to $344,237,007 and $298,135,272, respectively.
Derivatives:A derivative is a financial instrument whose performance is derived from the performance of another asset. Each type of derivative instrument that was held by the fund during the period ended November 30, 2019 is discussed below.
Forward Foreign Currency Exchange Contracts: The fund enters into forward contracts in order to hedge its exposure to changes in foreign currency exchange rates on its foreign portfolio holdings, to settle foreign currency transactions or as a part of its investment strategy. When executing forward contracts, the fund is obligated to buy or sell a foreign currency at a specified rate on a certain date in the future. With respect to sales of forward contracts, the fund incurs a loss if the value of the contract increases between the date the forward contract is opened and the date the forward contract is closed. The fund realizes a gain if the value of the contract decreases between those dates. With respect to purchases of forward contracts, the fund incurs a loss if the value of the contract decreases between the date the forward contract is opened and the date the forward contract is closed. The fund realizes a gain if the value of the contract increases between those dates. Any realized or unrealized gains or losses which occurred during the period are reflected in the Statement of
31
NOTES TO FINANCIAL STATEMENTS(continued)
Operations. The fund is exposed to foreign currency risk as a result of changes in value of underlying financial instruments. The fund is also exposed to credit risk associated with counterparty nonperformance on these forward contracts, which is generally limited to the unrealized gain on each open contract. This risk may be mitigated by Master Agreements, if any, between the fund and the counterparty and the posting of collateral, if any, by the counterparty to the fund to cover the fund’s exposure to the counterparty. Forward contracts open at November 30, 2019 are set forth in the Statement of Forward Foreign Currency Exchange Contracts.
The following summarizes the average market value of derivatives outstanding duringthe period ended November 30, 2019:
|
| Average Market Value ($) |
Forward contracts |
| 1,954,890 |
|
|
|
At November 30, 2019, the cost of investments for federal income tax purposes was $2,995,873,227; accordingly, accumulated net unrealized appreciation on investments inclusive of derivative contracts was $1,518,912,567, consisting of $1,580,726,291 gross unrealized appreciation and $61,813,724 gross unrealized depreciation.
32
REPORT OF INDEPENDENT REGISTERED PUBLIC ACCOUNTING FIRM
To the Shareholders and the Board of Directors of BNY Mellon International Stock Fund (formerly, International Stock Fund)
Opinion on the Financial Statements
We have audited the accompanying statement of assets and liabilities of BNY Mellon International Stock Fund (the “Fund”) (formerly, International Stock Fund) (one of the funds constituting BNY Mellon Strategic Funds, Inc.), including the statements of investments, investments in affiliated issuers and forward foreign currency exchange conracts, as of November 30, 2019, and the related statement of operations for the year then ended, the statements of changes in net assets for each of the two years in the period then ended, the financial highlights for each of the five years in the period then ended and the related notes (collectively referred to as the “financial statements”). In our opinion, the financial statements present fairly, in all material respects, the financial position of the Fund (one of the funds constituting BNY Mellon Strategic Funds, Inc.) at November 30, 2019, the results of its operations for the year then ended, the changes in its net assets for each of the two years in the period then ended and its financial highlights for each of the five years in the period then ended, in conformity with U.S. generally accepted accounting principles.
Basis for Opinion
These financial statements are the responsibility of the Fund’s management. Our responsibility is to express an opinion on the Fund’s financial statements based on our audits. We are a public accounting firm registered with the Public Company Accounting Oversight Board (United States) (“PCAOB”) and are required to be independent with respect to the Fund in accordance with the U.S. federal securities laws and the applicable rules and regulations of the Securities and Exchange Commission and the PCAOB.
We conducted our audits in accordance with the standards of the PCAOB. Those standards require that we plan and perform the audit to obtain reasonable assurance about whether the financial statements are free of material misstatement, whether due to error or fraud. The Fund is not required to have, nor were we engaged to perform, an audit of the Fund’s internal control over financial reporting. As part of our audits, we are required to obtain an understanding of internal control over financial reporting, but not for the purpose of expressing an opinion on the effectiveness of the Fund’s internal control over financial reporting. Accordingly, we express no such opinion.
Our audits included performing procedures to assess the risks of material misstatement of the financial statements, whether due to error or fraud, and performing procedures that respond to those risks. Such procedures included examining, on a test basis, evidence regarding the amounts and disclosures in the financial statements. Our procedures included confirmation of securities owned as of November 30, 2019, by correspondence with the custodian and others or by other appropriate auditing procedures where replies from others were not received. Our audits also included evaluating the accounting principles used and significant estimates made by management, as well as evaluating the overall presentation of the financial statements. We believe that our audits provide a reasonable basis for our opinion.

We have served as the auditor of one or more investment companies in the BNY Mellon Family of Funds since at least 1957, but we are unable to determine the specific year.
New York, New York
January 28, 2020
33
IMPORTANT TAX INFORMATION(Unaudited)
In accordance with federal tax law, the fund elects to provide each shareholder with their portion of the fund’s foreign taxes paid and the income sourced from foreign countries. Accordingly, the fund hereby reports the following information regarding its fiscal year ended November 30, 2019:
- the total amount of taxes paid to foreign countries was $10,440,159
- the total amount of income sourced from foreign countries was $92,171,842.
Where required by federal tax law rules, shareholders will receive notification of their proportionate share of foreign taxes paid and foreign sourced income for the 2019 calendar year with Form 1099-DIV which will be mailed in early 2020. For the fiscal year ended November 30, 2019, certain dividends paid by the fund may be subject to a maximum tax rate of 15%, as provided for by the Jobs and Growth Tax Relief Reconciliation Act of 2003. Of the distributions paid during the fiscal year, $45,106,897 represents the maximum amount that may be considered qualified dividend income. Also, the fund hereby reports $.0775 per share as a long-term capital gain distribution paid on December 31, 2018.
34
INFORMATION ABOUT THE RENEWAL OF THE FUND’S MANAGEMENT AND SUB-INVESTMENT ADVISORY AGREEMENTS (Unaudited)
At a meeting of the fund’s Board of Directors held on November 5, 2019, the Board considered the renewalof the fund’s Management Agreement, pursuant to which the Adviser provides the fund with investment advisory and administrative services (the “Agreement”), and the Sub-Investment Advisory Agreement (together, the “Agreements”), pursuant to which Walter Scott & Partners Limited (the “Subadviser”), an affiliate of the Adviser, provides day-to-day management of the fund’s investments. The Board members, a majority of whom are not “interested persons” (as defined in the Investment Company Act of 1940, as amended) of the fund, were assisted in their review by independent legal counsel and met with counsel in executive session separate from representatives of the Adviser and the Subadviser. In considering the renewal of the Agreements, the Board considered several factors that it believed to be relevant, including those discussed below. The Board did not identify any one factor as dispositive, and each Board member may have attributed different weights to the factors considered.
Analysis of Nature, Extent, and Quality of Services Provided to the Fund. The Board considered information provided to it at the meeting and in previous presentations from representatives of the Adviser regarding the nature, extent, and quality of the services provided to funds in the BNY Mellon fund complex, including the fund. The Adviser provided the number of open accounts in the fund, the fund’s asset size and the allocation of fund assets among distribution channels. The Adviser also had previously provided information regarding the diverse intermediary relationships and distribution channels of funds in the BNY Mellon fund complex (such as retail direct or intermediary, in which intermediaries typically are paid by the fund and/or the Adviser) and the Adviser’s corresponding need for broad, deep, and diverse resources to be able to provide ongoing shareholder services to each intermediary or distribution channel, as applicable to the fund.
The Board also considered research support available to, and portfolio management capabilities of, the fund’s portfolio management personnel and that the Adviser also provides oversight of day-to-day fund operations, including fund accounting and administration and assistance in meeting legal and regulatory requirements. The Board also considered the Adviser’s extensive administrative, accounting and compliance infrastructures, as well as the Adviser’s supervisory activities over the Subadviser. The Board also considered portfolio management’s brokerage policies and practices (including policies and practices regarding soft dollars) and the standards applied in seeking best execution.
Comparative Analysis of the Fund’s Performance and Management Fee and Expense Ratio. The Board reviewed reports prepared by Broadridge Financial Solutions, Inc. (“Broadridge”), an independent provider of investment company data, which included information comparing (1) the fund’s performance with the performance of a group of international large-cap growth funds (the “Performance Group”) and with a broader group of funds consisting of all retail and institutional international large-cap growth
35
INFORMATION ABOUT THE RENEWAL OF THE FUND’S MANAGEMENT AND SUB-INVESTMENT ADVISORY AGREEMENTS (Unaudited) (continued)
funds (the “Performance Universe”), all for various periods ended September 30, 2019, and (2) the fund’s actual and contractual management fees and total expenses with those of the same group of funds in the Performance Group (the “Expense Group”) and with a broader group of funds consisting of all institutional international large-cap growth funds, excluding outliers (the “Expense Universe”), the information for which was derived in part from fund financial statements available to Broadridge as of the date of its analysis. The Adviser previously had furnished the Board with a description of the methodology Broadridge used to select the Performance Group and Performance Universe and the Expense Group and Expense Universe.
Representatives of the Adviser stated that the usefulness of performance comparisons may be affected by a number of factors, including different investment limitations and policies that may be applicable to the fund and comparison funds. The Board discussed with representatives of the Adviser and the Subadviser the results of the comparisons and considered that the fund’s total return performance was above the Performance Group and Performance Universe medians for all periods shown, and was ranked in the first quartile of the funds in the Performance Group for the two-, three- and four-year periods and of the funds in the Performance Universe for each period under review. The Adviser also provided a comparison of the fund’s calendar year total returns to the returns of the fund’s benchmark index, and it was noted that the fund’s returns were above the returns of the index in nine of the ten calendar years shown.
The Board reviewed and considered the contractual management fee rate paid by the fund to the Adviser over the fund’s last fiscal year in light of the nature, extent and quality of the management and sub-advisory services provided by the Adviser and the Subadviser, respectively. The Board noted that the compensation paid to the Subadviser is paid by the Adviser (out of its fee from the fund), not the fund, and, accordingly, that the retention of the Subadviser does not increase the fees or expenses otherwise incurred by the fund and its shareholders.
The Board also reviewed the range of actual and contractual management fees and total expenses as a percentage of average net assets of the Expense Group and Expense Universe funds and discussed the results of the comparisons. The Board considered that the fund’s contractual management fee was slightly higher than the Expense Group contractual management fee median and was higher than the Expense Group and Expense Universe actual management fee medians, and that the fund’s total expenses were lower than the Expense Group and Expense Universe medians.
Representatives of the Adviser reviewed with the Board the management or investment advisory fees (1) paid by funds advised or administered by the Adviser that are in the same Lipper category as the fund and (2) paid to the Adviser or the Subadviser or its affiliates for advising any separate accounts and/or other types of client portfolios that are considered to have similar investment strategies and policies as the fund (the “Similar Clients”), and explained the nature of the Similar Clients. They discussed differences in fees paid and the relationship of the fees paid in light of any differences in the services provided and other relevant factors. The Board considered the relevance of
36
the fee information provided for the Similar Clients to evaluate the appropriateness of the fund’s management fee.
Analysis of Profitability and Economies of Scale. Representatives of the Adviser reviewed the expenses allocated and profit received by the Adviser and its affiliates and the resulting profitability percentage for managing the fund and the aggregate profitability percentage to the Adviser and its affiliates for managing the funds in the BNY Mellon fund complex, and the method used to determine the expenses and profit. The Board concluded that the profitability results were not excessive, given the services rendered and service levels provided by the Adviser and its affiliates. The Board also had been provided with information prepared by an independent consulting firm regarding the Adviser’s approach to allocating costs to, and determining the profitability of, individual funds and the entire BNY Mellon fund complex. The consulting firm also had analyzed where any economies of scale might emerge in connection with the management of a fund.
The Board considered on the advice of its counsel the profitability analysis (1) as part of its evaluation of whether the fees under the Agreements, considered in relation to the mix of services provided by the Adviser and the Subadviser, including the nature, extent and quality of such services, supported the renewal of the Agreements and (2) in light of the relevant circumstances for the fund and the extent to which economies of scale would be realized if the fund grows and whether fee levels reflect these economies of scale for the benefit of fund shareholders. Since the Adviser, and not the fund, pays the Subadviser pursuant to the Sub-Investment Advisory Agreement, the Board did not consider the Subadviser’s profitability to be relevant to its deliberations. Representatives of the Adviser also stated that, as a result of shared and allocated costs among funds in the BNY Mellon fund complex, the extent of economies of scale could depend substantially on the level of assets in the complex as a whole, so that increases and decreases in complex-wide assets can affect potential economies of scale in a manner that is disproportionate to, or even in the opposite direction from, changes in the fund’s asset level. The Board also considered potential benefits to the Adviser and the Subadviser from acting as investment adviser and sub-investment adviser, respectively, and took into consideration the soft dollar arrangements in effect for trading the fund’s investments.
At the conclusion of these discussions, the Board agreed that it had been furnished with sufficient information to make an informed business decision with respect to the renewal of the Agreements. Based on the discussions and considerations as described above, the Board concluded and determined as follows.
· The Board concluded that the nature, extent and quality of the services provided by the Adviser and the Subadviser are adequate and appropriate.
· The Board was satisfied with the fund’s performance.
37
INFORMATION ABOUT THE RENEWAL OF THE FUND’S MANAGEMENT AND SUB-INVESTMENT ADVISORY AGREEMENTS (Unaudited) (continued)
· The Board concluded that the fees paid to the Adviser and the Subadviser continued to be appropriate under the circumstances and in light of the factors and the totality of the services provided as discussed above.
· The Board determined that the economies of scale which may accrue to the Adviser and its affiliates in connection with the management of the fund had been adequately considered by the Adviser in connection with the fee rate charged to the fund pursuant to the Agreement and that, to the extent in the future it were determined that material economies of scale had not been shared with the fund, the Board would seek to have those economies of scale shared with the fund.
In evaluating the Agreements, the Board considered these conclusions and determinations and also relied on its previous knowledge, gained through meetings and other interactions with the Adviser and its affiliates and the Subadviser, of the Adviser and the Subadviser and the services provided to the fund by the Adviser and the Subadviser. The Board also relied on information received on a routine and regular basis throughout the year relating to the operations of the fund and the investment management and other services provided under the Agreements, including information on the investment performance of the fund in comparison to similar mutual funds and benchmark performance indices; general market outlook as applicable to the fund; and compliance reports. In addition, the Board’s consideration of the contractual fee arrangements for this fund had the benefit of a number of years of reviews of the Agreements for the fund, or substantially similar agreements for other BNY Mellon funds that the Board oversees, during which lengthy discussions took place between the Board and representatives of the Adviser. Certain aspects of the arrangements may receive greater scrutiny in some years than in others, and the Board’s conclusions may be based, in part, on their consideration of the fund’s arrangements, or substantially similar arrangements for other BNY Mellon funds that the Board oversees, in prior years. The Board determined to renew the Agreements.
38
BOARD MEMBERS INFORMATION(Unaudited)
INDEPENDENT BOARD MEMBERS
Joseph S. DiMartino (76)
Chairman of the Board (1995)
Principal Occupation During Past 5 Years:
· Corporate Director and Trustee (1995-Present)
Other Public Company Board Memberships During Past 5 Years:
· CBIZ, Inc., a public company providing professional business services, products and solutions,Director (1997-Present)
No. of Portfolios for which Board Member Serves:120
———————
Joni Evans (77)
Board Member (2006)
Principal Occupation During Past 5 Years:
· Chief Executive Officer, www.wowOwow.com, an online community dedicated to women’s conversations and publications (2007-Present)
· Principal, Joni Evans Ltd. (publishing) (2006-Present)
No. of Portfolios for which Board Member Serves:20
———————
Joan Gulley (72)
Board Member (2017)
Principal Occupation During Past 5 Years:
· PNC Financial Services Group, Inc.(1993-2014), Executive Vice President and Chief Human Resources Officer and Executive Committee Member (2008-2014)
· Director, Nantucket Library (2015-Present)
No. of Portfolios for which Board Member Serves:50
———————
Ehud Houminer (79)
Board Member (1994)
Principal Occupation During Past 5 Years:
· Board of Overseers at the Columbia Business School, Columbia
University (1992-Present)
Trustee, Ben Gurion University (2012-2018)
No. of Portfolios for which Board Member Serves: 50
———————
39
BOARD MEMBERS INFORMATION (Unaudited) (continued)
INDEPENDENT BOARD MEMBERS (continued)
Alan H. Howard (60)
Board Member (2018)
Principal Occupation During Past 5 Years:
· Managing Partner of Heathcote Advisors LLC, a financial advisory services firm (2008 – Present)
· President of Dynatech/MPX Holdings LLC (2012 – 2019), a global supplier and service provider of military aircraft parts, including Board Member of two operating subsidiaries, Dynatech International LLC and Military Parts Exchange LLC (2012-2019); Chief Executive Officer of an operating subsidiary, Dynatech International LLC (2013 – 2019)
· Senior Advisor, Rossoff & Co., an independent investment banking firm (2013 – Present)
Other Public Company Board Memberships During Past 5 Years:
· Movado Group, Inc., a public company that designs, sources, markets and distributes watches,Director (1997-Present)
No. of Portfolios for which Board Member Serves:20
———————
Robin A. Melvin (56)
Board Member (1995)
Principal Occupation During Past 5 Years:
· Co-chairman, Mentor Illinois, a non-profit organization dedicated to increasing the quantity and quality of mentoring services in Illinois; (2014-Present; Board member (2013-Present)
No. of Portfolios for which Board Member Serves:97
———————
Burton N. Wallack (69)
Board Member (2006)
Principal Occupation During Past 5 Years:
President and Co-owner of Wallack Management Company, a real estate management company (1987-Present)
Mount Sinai Hospital Urology Board Member (2017-Present)
No. of Portfolios for which Board Member Serves:20
———————
40
Benaree Pratt Wiley (73)
Board Member (2016)
Principal Occupation During Past 5 Years:
· Principal, The Wiley Group, a firm specializing in strategy and business development (2005-Present)
Other Public Company Board Memberships During Past 5 Years:
· CBIZ, Inc., a public company providing professional business services, products and solutions,Director(2008-Present)
· Blue Cross Blue Shield of MassachusettsDirector (2004-Present)
No. of Portfolios for which Board Member Serves: 76
———————
41
BOARD MEMBERS INFORMATION (Unaudited) (continued)
INTERESTED BOARD MEMBER
Gordon J. Davis (78)
Board Member (2006)
Principal Occupation During Past 5 Years:
· Partner in the law firm of Venable LLP (2012-Present)
Other Public Company Board Memberships During Past 5 Years:
· Consolidated Edison, Inc., a utility company,Director (1989-2014)
· The Phoenix Companies, Inc., a life insurance company,Director (2000-2014)
No. of Portfolios for which Board Member Serves:54
Gordon J. Davis is deemed to be an “interested person” (as defined under the Act) of the Company as a result of his affiliation with Venable LLP, which provides legal services to the Company.
———————
Once elected all Board Members serve for an indefinite term, but achieve Emeritus status upon reaching age 80. The address of the Board Members and Officers is c/o BNY Mellon Investment Adviser, Inc. 240 Greenwich Street, New York, New York 10286. Additional information about the Board Members is available in the fund’s Statement of Additional Information which can be obtained from the Adviser free of charge by calling this toll free number: 1-800-373-9387.
William Hodding Carter III, Emeritus Board Member
Hans C. Mautner, Emeritus Board Member
42
OFFICERS OF THE FUND(Unaudited)
RENEE LAROCHE-MORRIS, President since May 2019.
President and a director of BNY Mellon Investment Adviser, Inc. since January 2018. She is an officer of 63 investment companies (comprised of 120 portfolios) managed by the Adviser. She is 48 years old and has been an employee of BNY Mellon since 2003.
JAMES WINDELS, Treasurer since November 2001.
Director- BNY Mellon Fund Administration, and an officer of 64 investment companies (comprised of 143 portfolios) managed by the Adviser. He is 61 years old and has been an employee of the Adviser since April 1985.
BENNETT A. MACDOUGALL, Chief Legal Officer since October 2015.
Chief Legal Officer of the Adviser and Associate General Counsel and Managing Director of BNY Mellon since June 2015; Director and Associate General Counsel of Deutsche Bank – Asset & Wealth Management Division from June 2005 to June 2015, and as Chief Legal Officer of Deutsche Investment Management Americas Inc. from June 2012 to May 2015. He is an officer of 64 investment companies (comprised of 143 portfolios) managed by the Adviser. He is 48 years old and has been an employee of the Adviser since June 2015.
DAVID DIPETRILLO, Vice President since May 2019.
Head of North America Product, BNY Mellon Investment Management since January 2018, Director of Product Strategy, BNY Mellon Investment Management from January 2016 to December 2017; Head of US Retail Product and Channel Marketing, BNY Mellon Investment Management from January 2014 to December 2015. He is an officer of 63 investment companies (comprised of 120 portfolios) managed by the Adviser. He is 41 years old and has been an employee of BNY Mellon since 2005.
JAMES BITETTO, Vice President since August 2005 and Secretary since February 2018.
Senior Managing Counsel of BNY Mellon since December 2019; Managing Counsel of BNY Mellon from April 2014 to December 2019; Secretary of the Adviser, and an officer of 64 investment companies (comprised of 143 portfolios) managed by the Adviser. He is 53 years old and has been an employee of the Adviser since December 1996.
SONALEE CROSS, Vice President and Assistant Secretary since March 2018.
Counsel of BNY Mellon since October 2016; Associate at Proskauer Rose LLP from April 2016 to September 2016; Attorney at EnTrust Capital from August 2015 to February 2016; Associate at Sidley Austin LLP from September 2013 to August 2015. She is an officer of 64 investment companies (comprised of 143 portfolios) managed by the Adviser. She is 32 years old and has been an employee of the Adviser since October 2016.
DEIRDRE CUNNANE, Vice President and Assistant Secretary since March 2019.
Counsel of BNY Mellon since August 2018; Senior Regulatory Specialist at BNY Mellon Investment Management Services from February 2016 to August 2018; Trustee Associate at BNY Mellon Trust Company (Ireland) Limited from August 2013 to February 2016. She is an officer of 64 investment companies (comprised of 143 portfolios) managed by the Adviser. She is 29 years old and has been an employee of the Adviser since August 2018.
SARAH S. KELLEHER, Vice President and Assistant Secretary since April 2014.
Managing Counsel of BNY Mellon since December 2017, Senior Counsel of BNY Mellon from March 2013 to December 2017. She is an officer of 64 investment companies (comprised of 143 portfolios) managed by the Adviser. She is 44 years old and has been an employee of the Adviser since March 2013.
JEFF PRUSNOFSKY, Vice President and Assistant Secretary since August 2005.
Senior Managing Counsel of BNY Mellon, and an officer of 64 investment companies (comprised of 143 portfolios) managed by the Adviser. He is 54 years old and has been an employee of the Adviser since October 1990.
PETER M. SULLIVAN, Vice President and Assistant Secretary since March 2019.
Managing Counsel of BNY Mellon, and an officer of 64 investment companies (comprised of 143 portfolios) managed by the Adviser. He is 51 years old and has been an employee of the Adviser since April 2004.
43
OFFICERS OF THE FUND (Unaudited)(continued)
NATALYA ZELENSKY, Vice President and Assistant Secretary since March 2017.
Managing Counsel of BNY Mellon since December 2019; Counsel of BNY Mellon from May 2016 to December 2019; Attorney at Wildermuth Endowment Strategy Fund/Wildermuth Advisory, LLC from November 2015 to May 2016 and Assistant General Counsel at RCS Advisory Services from July 2014 to November 2015. She is an officer of 64 investment companies (comprised of 143 portfolios) managed by the Adviser. She is 34 years old and has been an employee of the Adviser since May 2016.
GAVIN C. REILLY, Assistant Treasurer since December 2005.
Tax Manager - BNY Mellon Fund Administration, and an officer of 64 investment companies (comprised of 143 portfolios) managed by the Adviser. He is 51 years old and has been an employee of the Adviser since April 1991.
ROBERT S. ROBOL, Assistant Treasurer since December 2002.
Senior Accounting Manager- BNY Mellon Fund Administration, and an officer of 64 investment companies (comprised of 143 portfolios) managed by the Adviser. He is 55 years old and has been an employee of the Adviser since October 1988.
ROBERT SALVIOLO, Assistant Treasurer since July 2007.
Senior Accounting Manager – BNY Mellon Fund Administration, and an officer of 64 investment companies (comprised of 143 portfolios) managed by the Adviser. He is 52 years old and has been an employee of the Adviser since June 1989.
ROBERT SVAGNA, Assistant Treasurer since December 2002.
Senior Accounting Manager – BNY Mellon Fund Administration, and an officer of 64 investment companies (comprised of 143 portfolios) managed by the Adviser. He is 52 years old and has been an employee of the Adviser since November 1990.
JOSEPH W. CONNOLLY, Chief Compliance Officer since October 2004.
Chief Compliance Officer of the Adviser, the BNY Mellon Family of Funds and BNY Mellon Funds Trust (64 investment companies, comprised of 143 portfolios). He is 62 years old and has served in various capacities with the Adviser since 1980, including manager of the firm’s Fund Accounting Department from 1997 through October 2001.
CARIDAD M. CAROSELLA, Anti-Money Laundering Compliance Officer since January 2016.
Anti-Money Laundering Compliance Officer of the BNY Mellon Family of Funds and BNY Mellon Funds Trust since January 2016; from May 2015 to December 2015, Interim Anti-Money Laundering Compliance Officer of the BNY Mellon Family of Funds and BNY Mellon Funds Trust and the Distributor; from January 2012 to May 2015, AML Surveillance Officer of the Distributor. She is an officer of 57 investment companies (comprised of 136 portfolios) managed by the Adviser. She is 51 years old and has been an employee of the Distributor since 1997.
44
NOTES
45
BNY Mellon International Stock Fund
240 Greenwich Street
New York, NY 10286
Adviser
BNY Mellon Investment Adviser, Inc.
240 Greenwich Street
New York, NY 10286
Sub-Adviser
Walter Scott & Partners Limited
(Walter Scott)
One Charlotte Square
Edinburgh, Scotland, UK
Custodian
The Bank of New York Mellon
240 Greenwich Street
New York, NY 10286
Transfer Agent &
Dividend Disbursing Agent
BNY Mellon Transfer, Inc.
240 Greenwich Street
New York, NY 10286
Distributor
BNY Mellon Securities Corporation
240 Greenwich Street
New York, NY 10286
Ticker Symbols: | Class A: DISAX Class C: DISCX Class I: DISRX Class Y: DISYX |
Telephone Call your financial representative or 1-800-373-9387
Mail The BNY Mellon Family of Funds, 144 Glenn Curtiss Boulevard, Uniondale, NY 11556-0144
E-mailSend your request toinfo@bnymellon.com
InternetInformation can be viewed online or downloaded atwww.bnymellonim.com/us
The fund files its complete schedule of portfolio holdings with the Securities and Exchange Commission (“SEC”) for the first and third quarters of each fiscal year on Form N-PORT. The fund’s Forms N-PORT are available on the SEC’s website atwww.sec.gov.
A description of the policies and procedures that the fund uses to determine how to vote proxies relating to portfolio securities and information regarding how the fund voted these proxies for the most recent 12-month period ended June 30 is available atwww.bnymellonim.com/us and on the SEC’s website atwww.sec.gov and without charge, upon request, by calling 1-800-373-9387.
© 2020 BNY Mellon Securities Corporation |
|

BNY Mellon Select Managers Small Cap Value Fund
ANNUAL REPORT November 30, 2019 |
|

Save time. Save paper. View your next shareholder report online as soon as it’s available. Log into www.bnymellonim.com/us and sign up for eCommunications. It’s simple and only takes a few minutes. |
The views expressed in this report reflect those of the portfolio manager(s) only through the end of the period covered and do not necessarily represent the views of BNY Mellon Investment Adviser, Inc. or any other person in the BNY Mellon Investment Adviser, Inc. organization. Any such views are subject to change at any time based upon market or other conditions and BNY Mellon Investment Adviser, Inc. disclaims any responsibility to update such views. These views may not be relied on as investment advice and, because investment decisions for a fund in the BNY Mellon Family of Funds are based on numerous factors, may not be relied on as an indication of trading intent on behalf of any fund in the BNY Mellon Family of Funds. |
Not FDIC-Insured • Not Bank-Guaranteed • May Lose Value |
Contents
THE FUND
BNY Mellon Investment Adviser, Inc. | |
With Those of Other Funds | |
in Affiliated Issuers | |
Public Accounting Firm | |
the Fund’s Management and Sub- | |
Investment Advisory Agreements | |
FOR MORE INFORMATION
Back Cover
| The Fund |
A LETTER FROM THE PRESIDENT OF BNY MELLON INVESTMENT ADVISER, INC.
Dear Shareholder:
We are pleased to present this annual report for BNY Mellon Select Managers Small Cap Value Fund (formerly, Dreyfus Select Managers Small Cap Value Fund), covering the 12-month period from December 1, 2018 through November 30, 2019. For information about how the fund performed during the reporting period, as well as general market perspectives, we provide a Discussion of Fund Performance on the pages that follow.
In December 2018, stocks experienced a sharp sell-off, as it appeared that the U.S. Federal Reserve (the “Fed”) would maintain its hawkish stance on monetary policy. In January 2019, a pivot in stance from the Fed helped stimulate a rebound across equity markets that continued into the second quarter. Escalating trade tensions disrupted equity markets again in May. The dip was short-lived, as markets rose once again in June and July of 2019, when a trade deal appeared more likely, and the pace of U.S. economic growth remained steady. Nevertheless, concerns over slowing global growth persisted, resulting in bouts of market volatility in August 2019. Stocks rebounded in September and continued an upward path through most of October 2019, supported in part by central bank policy and consistent consumer spending. Near the end of the period, an announcement by President Trump that the first phase of a trade deal with China had been achieved sent U.S. markets to record highs.
In fixed-income markets, a risk-off mentality prevailed to start the period, fueled in part by equity market volatility. A flight to quality supported price increases for U.S. Treasuries, which continued through the end of 2018, leading to a flattening yield curve. After the Fed’s supportive statements in January 2019, other developed-market central banks followed suit and reiterated their abilities to bolster flagging growth by continuing accommodative policies. After taking into account the 25-basis-point increase in December 2018, there was a net decrease of 50 basis points in the federal funds rate during the reporting period. Rates across much of the Treasury curve saw a slight increase during the month of November. However, demand for fixed-income instruments during much of the reporting period was strong, which helped to support positive bond market returns.
We believe that over the near term, the outlook for the U.S. remains positive, but we will monitor relevant data for any signs of a change. As always, we encourage you to discuss the risks and opportunities in today’s investment environment with your financial advisor.
Thank you for your continued confidence and support.
Sincerely,

Renee LaRoche-Morris
President
BNY Mellon Investment Adviser, Inc.
December 16, 2019
2
DISCUSSION OF FUND PERFORMANCE(Unaudited)
For the period from December 1, 2018 through November 30, 2019, as provided by portfolio allocation managers Stephen Kolano and Elena Goncharova
Market and Fund Performance Overview
For the 12-month period ended November 30, 2019, BNY Mellon Select Managers Small Cap Value Fund’s (formerly Dreyfus Select Managers Small Cap Value Fund) Class A, Class C, Class I and Class Y shares at NAV produced total returns of 6.07%, 5.28%, 6.40% and 6.41%, respectively.1 In comparison, the Russell 2000® Value Index (the “Index”), the fund’s benchmark, returned 3.96% for the same period.2
Small-cap stocks produced gains over the reporting period, amid steady economic growth and supportive central bank policy. The fund outperformed the Index, mainly due to strong sector allocation decisions and to security selection in the industrial sector.
BNY Mellon Investment Adviser, Inc. the fund’s investment adviser, has terminated the sub-investment advisory agreement between BNY Mellon and Thomson, Siegel & Walmsley (TSW), a subadviser to the fund, effective May 15, 2019.The portion of the assets of the fund under TSW’s management will be allocated to certain of the fund’s five other subadvisors, as determined by BNY Mellon Investment Adviser, Inc. the fund’s portfolio allocation manager.
The Fund’s Investment Approach
The fund seeks capital appreciation. To pursue its goal, the fund normally invests at least 80% of its net assets in the stocks of small-cap companies. The fund currently considers small-cap companies to be those companies with market capitalizations that fall within the range of companies in the Index, the fund’s benchmark index. The fund's portfolio is constructed to have a value tilt. The fund uses a “multi-manager” approach by selecting various subadvisors to manage its assets. We may hire, terminate or replace subadvisors and modify material terms and conditions of sub advisory arrangements without shareholder approval.
The fund’s assets are currently allocated to five subadvisors, each acting independently and using its own methodology to select portfolio investments. The new target percentages to be allocated to the subadvisors over time are as follows: approximately 20% of the fund’s assets would be under the management of Walthausen & Co., LLC, which uses a proprietary valuation model to identify companies that are trading at a discount to their intrinsic values; approximately 20% of the fund’s assets would be under the management of Neuberger Berman Investment Advisors LLC, which uses fundamental analysis and a bottom-up stock selection process to identify publicly traded small-cap companies selling at a material discount to their intrinsic value; approximately 15% of the fund’s assets would be under the management of Kayne Anderson Rudnick Investment Management, LLC, which employs a fundamental, bottom-up, research-driven investment process in seeking to identify high-quality companies whose securities are trading at attractive valuations; approximately 30% of the fund’s assets would be under the management of Channing Capital Management, LLC, which employs intensive, fundamental, bottom-up research to identify high-quality companies that represent value opportunities; and approximately 15% of the fund’s assets would be allocated to Eastern Shore Capital Management, which focuses on identifying
3
DISCUSSION OF FUND PERFORMANCE(Unaudited) (continued)
companies with quality fundamentals that are trading at attractive valuations. The percentages of the fund’s assets allocated to the various subadvisors can change over time, within ranges described in the prospectus.
Stocks Rebound on Shift in Federal Reserve Policy
The reporting period began amid concerns about economic growth and corporate earnings. This led the Federal Reserve (the “Fed”) to reduce the fed funds rate three times during the reporting period after a final increase in December 2018. The three rate cuts brought the fed funds target rate to 1.50-1.75%.
But the reporting period started with volatility, which picked up in the fourth quarter of 2018, as stocks declined on a drop in investor sentiment. The weakness in sentiment was driven largely by concerns about the Fed’s plan to continue hiking short-term interest rates in 2019, amid mixed economic data. This shift in sentiment caused higher quality stocks to outperform lower quality stocks.
In December, the Fed moved away from this hawkish stance, saying that rate hikes in 2019 would be “data dependent.” The Fed also indicated that the reduction of its balance sheet would be completed by September 2019, implying the Fed would be satisfied with a larger-than-normal balance sheet, adding to the central bank’s more accommodative stance.
With this move, stocks rallied late in 2018 and continued to rise early in 2019. The Fed declined to cut rates early in 2019, though inflation remained below its target rate of 2.0%. But markets began to anticipate a rate cut later in the year, and at its July 2019 meeting the Fed announced an initial reduction, bringing the fed funds rate to 2.00-2.25%. The Fed followed up with two additional rate cuts in September and October 2019, as trade tensions and other geopolitical concerns appeared to be weighing on economic growth. Other major central banks were also supportive. U.S. markets were steady through the second half of the reporting period, though investors were somewhat concerned about trade tensions and the global economy. But at the end of the period, stocks finished on an uptrend, as investors became optimistic about a U.S.-China trade agreement.
Growth stocks and lower quality stocks outperformed early in 2019, as markets responded to the Fed’s data-dependent approach. But in September 2019, growth stocks began to lag, and value stocks and those of highly leveraged companies outperformed through the end of the reporting period, in anticipation of lower interest rates and continued economic growth.
Allocations and Security Selections Benefited Fund Performance
The fund’s outperformance versus the Index was mainly the result of successful sector allocation decisions and stock selections among the underlying portfolio managers. All underlying managers outperformed the Index. The fund’s overweight to the information technology sector was the largest positive contributor to relative performance, and its underweights to the real estate and energy sectors were beneficial as well. Stock selection contributed most in the industrial sector, where construction-related stocks performed well. More specifically, BMC Stock Holdings, a building products company, gained 74% while SiteOne Landscape Supply rose 44%. In addition, SPX, a heating, ventilation and air conditioning contractor, gained 76%. In the materials sector, Crown Holdings, a maker of packaging, rose 48% on strong demand from the beverage industry. In the health care sector,Array BioPharma, gained 192% on its acquisition by Pfizer.
4
The fund fared less well in other areas due to both sector allocation and stock selection. As for sector allocation, the fund’s underweight to the real estate sector was the largest detractor. As for stock selection, a position in Party City Holdco, which operates party goods stores, declined 84% during the reporting period. In addition, a position in Conduent, a software and services company, fell 47% because it missed its projected earnings target. In the health care sector,Merit Medical Systems, a manufacturer of disposable medical devices, dropped 56% when a lawsuit was filed against it.
A Cautious Outlook
The economy is in the latter stages of the business cycle, and growth is beginning to slow. Geopolitical tensions, including continued uncertainty about Brexit even in the wake of the UK election, as well as the U.S. election in November 2020, may weigh on stocks in the coming months. Given this outlook, the fund will continue to position itself in line with its more defensive nature, seeking earnings growth but only at a reasonable price.
December 16, 2019
1 Total return includes reinvestment of dividends and any capital gains paid and does not take into consideration the maximum initial sales charge in the case of Class A shares, or the applicable contingent deferred sales charge imposed on redemptions in the case of Class C shares. Had these charges been reflected, returns would have been lower. Past performance is no guarantee of future results. Share price and investment return fluctuate such that upon redemption, fund shares may be worth more or less than their original cost. Return figures provided reflect the absorption of certain fund expenses by BNY Mellon Investment Adviser, Inc. pursuant to an undertaking in effect through March 29, 2020, at which time it may be extended, terminated, or modified. Had these expenses not been absorbed, the fund’s returns would have been lower.
2 Source: Lipper Inc. — The Russell 2000® Value Index measures the performance of the small-cap value segment of the U.S. equity universe. It includes those Russell 2000 companies that are considered more value-oriented relative to the overall market as defined by Russell’s leading style methodology. The Russell 2000® Value Index is constructed to provide a comprehensive and unbiased barometer for the small-cap value segment. The index is completely reconstituted annually to ensure larger stocks do not distort the performance and characteristics of the true small-cap opportunity set, and that the represented companies continue to reflect value characteristics. Investors cannot invest directly in any index.
Please note: the position in any security highlighted with italicized typeface was sold during the reporting period.
Equities are subject generally to market, market sector, market liquidity, issuer and investment style risks, among other factors, to varying degrees, all of which are more fully described in the fund’s prospectus.
The prices of small company stocks tend to be more volatile than the prices of large company stocks, mainly because these companies have less established and more volatile earnings histories. They also tend to be less liquid than larger company stocks.
5
FUND PERFORMANCE(Unaudited)
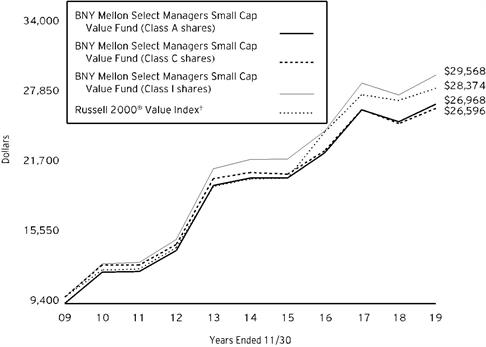
Comparison of change in value of a $10,000 investment in Class A shares, Class C shares and Class I shares of BNY Mellon Select Managers Small Cap Value Fund with a hypothetical investment of $10,000 in the Russell 2000® Value Index (the “Index”)
† Source: Lipper Inc.
Past performance is not predictive of future performance.
The above graph compares a hypothetical $10,000 investment made in Class A, Class C and Class I shares of BNY Mellon Select Managers Small Cap Value Fund on 11/30/09 to a hypothetical investment of $10,000 made in the Index on that date. All dividends and capital gain distributions are reinvested.
The fund’s performance shown in the line graph above takes into account the maximum initial sales charge on Class A shares and all other applicable fees and expenses on all classes. The Index measures the performance of the small-cap value segment of the U.S. equity universe. It includes those Russell 2000 companies that are considered more value-oriented relative to the overall market as defined by Russell’s leading style methodology. The Index is constructed to provide a comprehensive and unbiased barometer for the small-cap value segment. The Index is completely reconstituted annually to ensure larger stocks do not distort the performance and characteristics of the true small-cap opportunity set and that the represented companies continue to reflect value characteristics. Unlike a mutual fund, the Index is not subject to charges, fees and other expenses. Investors cannot invest directly in any index. Further information relating to fund performance, including expense reimbursements, if applicable, is contained in the Financial Highlights section of the prospectus and elsewhere in this report.
6
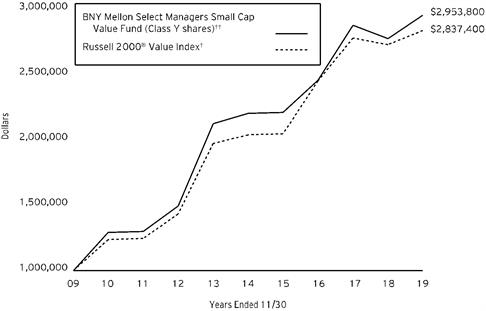
Comparison of change in value of a $1,000,000 investment in Class Y shares of BNY Mellon Select Managers Small Cap Value Fund with a hypothetical investment of $1,000,000 in the Russell 2000® Value Index (the “Index”)
† Source: Lipper Inc.
†† The total return figures presented for Class Y shares of the fund reflect the performance of the fund’s Class A shares for the period prior to 7/1/13 (the inception date for Class Y shares), not reflecting the applicable sales charges for Class A shares.
Past performance is not predictive of future performance.
The above graph compares a hypothetical $1,000,000 investment made in Class Y shares of BNY Mellon Select Managers Small Cap Value Fund on 11/30/09 to a hypothetical investment of $1,000,000 made in the Index on that date. All dividends and capital gain distributions are reinvested.
The fund’s performance shown in the line graph above takes into account all other applicable fees and expenses of fund’s Class Y shares. The Index measures the performance of the small-cap value segment of the U.S. equity universe. It includes those Russell 2000 companies that are considered more value-oriented relative to the overall market as defined by Russell’s leading style methodology. The Index is constructed to provide a comprehensive and unbiased barometer for the small-cap value segment. The Index is completely reconstituted annually to ensure larger stocks do not distort the performance and characteristics of the true small-cap opportunity set and that the represented companies continue to reflect value characteristics. Unlike a mutual fund, the Index is not subject to charges, fees and other expenses. Investors cannot invest directly in any index. Further information relating to fund performance, including expense reimbursements, if applicable, is contained in the Financial Highlights section of the prospectus and elsewhere in this report.
7
FUND PERFORMANCE(Unaudited) (continued)
Average Annual Total Returns as of11/30/19 | ||||
Inception | ||||
| Date | 1 Year | 5 Years | 10 Years |
Class A shares | ||||
with maximum sales charge (5.75%) | 12/17/08 | -0.04% | 4.42% | 10.43% |
without sales charge | 12/17/08 | 6.07% | 5.66% | 11.09% |
Class C shares | ||||
with applicable redemption charge† | 12/17/08 | 4.37% | 4.89% | 10.28% |
without redemption | 12/17/08 | 5.28% | 4.89% | 10.28% |
Class I shares | 12/17/08 | 6.40% | 5.99% | 11.45% |
Class Y shares | 7/1/13 | 6.41% | 6.03% | 11.44%†† |
Russell 2000® Value Index | 12/31/08 | 3.96% | 6.83% | 10.99% |
† The maximum contingent deferred sales charge for Class C shares is 1% for shares redeemed within one year of the date of purchase.
†† The total return performance figures presented for Class Y shares of the fund reflect the performance of the fund’s Class A shares for the period prior to 7/1/13 (the inception date for Class Y shares), not reflecting the applicable sales charges for Class A shares.
The performance data quoted represents past performance, which is no guarantee of future results. Share price and investment return fluctuate and an investor’s shares may be worth more or less than original cost upon redemption. Current performance may be lower or higher than the performance quoted. Go to www.bnymellonim.com/us for the fund’s most recent month-end returns.
The fund’s performance shown in the graphs and table does not reflect the deduction of taxes that a shareholder would pay on fund distributions or the redemption of fund shares. In addition to the performance of Class A shares shown with and without a maximum sales charge, the fund’s performance shown in the table takes into account all other applicable fees and expenses on all classes.
8
UNDERSTANDING YOUR FUND’S EXPENSES(Unaudited)
As a mutual fund investor, you pay ongoing expenses, such as management fees and other expenses. Using the information below, you can estimate how these expenses affect your investment and compare them with the expenses of other funds. You also may pay one-time transaction expenses, including sales charges (loads) and redemption fees, which are not shown in this section and would have resulted in higher total expenses. For more information, see your fund’s prospectus or talk to your financial adviser.
Review your fund’s expenses
The table below shows the expenses you would have paid on a $1,000 investment in BNY Mellon Select Managers Small Cap Value Fund from June 1, 2019 to November 30, 2019. It also shows how much a $1,000 investment would be worth at the close of the period, assuming actual returns and expenses.
Expenses and Value of a $1,000 Investment |
| |||||
Assume actual returns for the six months ended November 30, 2019 |
| |||||
|
|
|
|
|
|
|
|
| Class A | Class C | Class I | Class Y |
|
Expense paid per $1,000† | $6.88 | $10.82 | $5.24 | $5.03 |
| |
Ending value (after expenses) | $1,109.70 | $1,105.80 | $1,111.60 | $1,112.30 |
| |
COMPARING YOUR FUND’S EXPENSES
WITH THOSE OF OTHER FUNDS(Unaudited)
Using the SEC’s method to compare expenses
The Securities and Exchange Commission (“SEC”) has established guidelines to help investors assess fund expenses. Per these guidelines, the table below shows your fund’s expenses based on a $1,000 investment, assuming a hypothetical 5% annualized return. You can use this information to compare the ongoing expenses (but not transaction expenses or total cost) of investing in the fund with those of other funds. All mutual fund shareholder reports will provide this information to help you make this comparison. Please note that you cannot use this information to estimate your actual ending account balance and expenses paid during the period.
Expenses and Value of a $1,000 Investment |
| |||||
Assuming a hypothetical 5% annualized return for the six months ended November 30, 2019 |
| |||||
|
|
|
|
|
|
|
|
| Class A | Class C | Class I | Class Y |
|
Expense paid per $1,000† | $6.58 | $10.35 | $5.01 | $4.81 |
| |
Ending value (after expenses) | $1,018.55 | $1,014.79 | $1,020.10 | $1,020.31 |
| |
†Expenses are equal to the fund’s annualized expense ratio of 1.30% for Class A, 2.05% for Class C, .99% for Class I and .95% for Class Y, multiplied by the average account value over the period, multiplied by 183/365 (to reflect the one-half year period). | ||||||
9
STATEMENT OF INVESTMENTS
November 30, 2019
Description | Shares | Value ($) | |||||
Common Stocks - 97.9% | |||||||
Automobiles & Components - 2.0% | |||||||
Dorman Products | 20,011 | a,b | 1,487,218 | ||||
Fox Factory Holding | 17,055 | b | 1,124,436 | ||||
LCI Industries | 36,837 | a | 3,921,667 | ||||
Thor Industries | 70,140 | a | 4,472,828 | ||||
Visteon | 10,095 | a,b | 944,185 | ||||
11,950,334 | |||||||
Banks - 12.8% | |||||||
Atlantic Union Bankshares | 46,460 | a | 1,756,188 | ||||
Bank of Hawaii | 60,560 | a | 5,457,062 | ||||
BankUnited | 32,770 | 1,148,916 | |||||
Banner | 71,058 | 3,881,899 | |||||
Brookline Bancorp | 103,915 | 1,667,836 | |||||
Bryn Mawr Bank | 16,300 | 640,101 | |||||
Camden National | 26,170 | 1,136,825 | |||||
Centerstate Bank | 257,095 | a | 6,537,926 | ||||
City Holding | 14,700 | a | 1,168,356 | ||||
Columbia Banking System | 99,615 | 3,892,954 | |||||
Community Bank System | 17,165 | a | 1,164,645 | ||||
CVB Financial | 70,360 | 1,502,890 | |||||
Essent Group | 65,485 | 3,578,755 | |||||
First Bancorp | 29,950 | 1,171,045 | |||||
First Financial | 30,930 | 1,367,725 | |||||
First Financial Bancorp | 22,540 | 548,173 | |||||
First Financial Bankshares | 101,860 | a | 3,521,300 | ||||
Great Southern Bancorp | 24,830 | 1,515,375 | |||||
Heartland Financial USA | 25,810 | a | 1,218,748 | ||||
Huntington Bancshares | 74,780 | 1,113,474 | |||||
Independent Bank | 81,205 | 6,837,461 | |||||
Independent Bank Group | 53,556 | 3,086,432 | |||||
Lakeland Financial | 24,670 | a | 1,162,450 | ||||
NBT Bancorp | 33,730 | a | 1,349,200 | ||||
NMI Holdings, Cl. A | 34,640 | b | 1,162,865 | ||||
OceanFirst Financial | 50,460 | 1,210,031 | |||||
PacWest Bancorp | 40,740 | 1,517,158 | |||||
Pinnacle Financial Partners | 19,342 | 1,187,986 | |||||
Provident Financial Services | 48,930 | 1,189,978 | |||||
Renasant | 110,782 | 3,921,683 | |||||
Sterling Bancorp | 60,720 | 1,239,902 | |||||
Stock Yards Bancorp | 27,605 | 1,142,571 | |||||
TCF Financial | 41,494 | 1,763,080 | |||||
Texas Capital Bancshares | 14,870 | b | 859,486 | ||||
10
Description | Shares | Value ($) | |||||
Common Stocks - 97.9% (continued) | |||||||
Banks - 12.8% (continued) | |||||||
TriCo Bancshares | 30,380 | 1,174,187 | |||||
Triumph Bancorp | 60,369 | b | 2,164,832 | ||||
WSFS Financial | 26,260 | 1,170,933 | |||||
76,130,428 | |||||||
Capital Goods - 16.8% | |||||||
AAR | 40,700 | 1,818,883 | |||||
Actuant, Cl. A | 46,785 | 1,149,040 | |||||
Alamo Group | 8,680 | 996,464 | |||||
Albany International, Cl. A | 13,910 | 1,163,989 | |||||
Allied Motion Technologies | 38,298 | 1,715,750 | |||||
Ameresco, Cl. A | 95,800 | b | 1,566,330 | ||||
Atkore International Group | 28,215 | b | 1,177,130 | ||||
Babcock & Wilcox Enterprises | 70,392 | a,b | 243,556 | ||||
Barnes Group | 50,961 | 3,016,382 | |||||
BMC Stock Holdings | 27,800 | b | 823,158 | ||||
Chart Industries | 19,975 | a,b | 1,102,620 | ||||
Columbus McKinnon | 37,360 | 1,534,749 | |||||
Comfort Systems USA | 13,245 | 676,820 | |||||
Crane | 12,340 | 1,025,084 | |||||
Dycom Industries | 25,370 | b | 1,320,508 | ||||
EMCOR Group | 15,450 | 1,373,968 | |||||
EnerSys | 39,735 | 2,788,205 | |||||
ESCO Technologies | 10,545 | 928,698 | |||||
FreightCar America | 90,710 | a,b | 175,977 | ||||
GATX | 15,890 | a | 1,284,389 | ||||
Generac Holdings | 11,670 | b | 1,149,495 | ||||
Graco | 70,650 | 3,413,101 | |||||
Great Lakes Dredge & Dock | 180,774 | b | 1,930,666 | ||||
Harsco | 46,900 | b | 1,043,525 | ||||
Hexcel | 50,521 | 4,022,987 | |||||
Hillenbrand | 89,522 | 2,830,686 | |||||
ITT | 19,490 | 1,360,012 | |||||
John Bean Technologies | 10,325 | a | 1,131,104 | ||||
Kennametal | 101,190 | a | 3,524,447 | ||||
Lincoln Electric Holdings | 22,220 | a | 2,050,017 | ||||
Lydall | 44,600 | b | 830,452 | ||||
Mercury Systems | 35,980 | b | 2,635,535 | ||||
Miller Industries | 38,580 | a | 1,413,957 | ||||
Moog, Cl. A | 17,810 | 1,529,345 | |||||
Mueller Industries | 38,330 | 1,203,179 | |||||
Oshkosh | 15,700 | 1,420,222 | |||||
Parsons | 32,990 | a,b | 1,320,590 | ||||
Patrick Industries | 7,590 | b | 375,857 | ||||
11
STATEMENT OF INVESTMENTS (continued)
Description | Shares | Value ($) | |||||
Common Stocks - 97.9% (continued) | |||||||
Capital Goods - 16.8% (continued) | |||||||
Proto Labs | 5,640 | b | 546,460 | ||||
RBC Bearings | 41,160 | b | 6,827,620 | ||||
Regal Beloit | 13,020 | 1,064,125 | |||||
Resideo Technologies | 84,400 | b | 825,432 | ||||
Rexnord | 151,684 | b | 4,791,698 | ||||
Simpson Manufacturing | 7,880 | 639,856 | |||||
SiteOne Landscape Supply | 70,950 | a,b | 6,297,522 | ||||
Spirit AeroSystems Holdings, Cl. A | 26,310 | 2,288,707 | |||||
SPX | 94,337 | b | 4,507,422 | ||||
SPX FLOW | 59,975 | b | 2,842,815 | ||||
Systemax | 17,310 | 400,900 | |||||
Teledyne Technologies | 3,740 | b | 1,279,043 | ||||
Trex | 12,340 | a,b | 1,061,980 | ||||
Twin Disc | 26,420 | b | 268,956 | ||||
Valmont Industries | 6,200 | 887,468 | |||||
Watsco | 22,790 | 4,055,936 | |||||
Welbilt | 144,150 | a,b | 2,405,863 | ||||
100,058,680 | |||||||
Commercial & Professional Services - 5.0% | |||||||
ABM Industries | 46,890 | a | 1,781,351 | ||||
ASGN | 12,570 | b | 842,316 | ||||
Clean Harbors | 13,600 | b | 1,124,040 | ||||
Covanta Holding | 75,540 | 1,111,193 | |||||
Exponent | 26,710 | 1,697,420 | |||||
Heritage-Crystal Clean | 60,030 | b | 1,856,728 | ||||
IAA | 58,805 | b | 2,665,631 | ||||
ICF International | 13,695 | 1,228,852 | |||||
Kelly Services, Cl. A | 64,420 | a | 1,411,442 | ||||
Kimball International, Cl. B | 36,130 | 772,459 | |||||
McGrath RentCorp | 46,920 | 3,441,113 | |||||
Mobile Mini | 46,960 | 1,782,602 | |||||
MSA Safety | 33,464 | a | 4,147,194 | ||||
Stericycle | 42,300 | a,b | 2,657,286 | ||||
UniFirst | 12,100 | 2,495,625 | |||||
US Ecology | 18,182 | a | 999,828 | ||||
30,015,080 | |||||||
Consumer Durables & Apparel - 2.1% | |||||||
Cavco Industries | 7,830 | b | 1,566,078 | ||||
CSS Industries | 47,360 | 209,331 | |||||
G-III Apparel Group | 17,860 | a,b | 528,656 | ||||
KB Home | 22,895 | 791,709 | |||||
M.D.C. Holdings | 39,320 | 1,555,892 | |||||
M/I Homes | 48,260 | b | 2,136,470 | ||||
12
Description | Shares | Value ($) | |||||
Common Stocks - 97.9% (continued) | |||||||
Consumer Durables & Apparel - 2.1% (continued) | |||||||
Skyline Champion | 38,660 | b | 1,282,739 | ||||
Steven Madden | 19,655 | 834,748 | |||||
Tempur Sealy International | 16,100 | b | 1,366,568 | ||||
Universal Electronics | 23,260 | b | 1,293,256 | ||||
Vista Outdoor | 84,290 | b | 697,921 | ||||
12,263,368 | |||||||
Consumer Services - 3.9% | |||||||
Dave & Buster's Entertainment | 29,600 | a | 1,189,328 | ||||
Frontdoor | 43,315 | b | 1,960,437 | ||||
Hilton Grand Vacations | 49,820 | b | 1,725,267 | ||||
International Game Technology | 38,600 | a | 573,210 | ||||
Marriott Vacations Worldwide | 12,165 | 1,494,349 | |||||
OneSpaWorld Holdings | 228,345 | a | 3,728,874 | ||||
Penn National Gaming | 178,797 | a,b | 4,117,695 | ||||
SeaWorld Entertainment | 87,620 | a,b | 2,565,514 | ||||
The Cheesecake Factory | 91,365 | a | 3,984,428 | ||||
Wyndham Destinations | 38,210 | 1,853,185 | |||||
23,192,287 | |||||||
Diversified Financials - 2.4% | |||||||
Artisan Partners Asset Management, Cl. A | 102,034 | 3,027,349 | |||||
Evercore, Cl. A | 48,129 | 3,724,222 | |||||
Houlihan Lokey | 77,770 | 3,707,296 | |||||
Stifel Financial | 62,641 | 3,916,315 | |||||
14,375,182 | |||||||
Energy - 2.1% | |||||||
Cactus, Cl. A | 32,990 | 995,968 | |||||
Core Laboratories | 34,530 | 1,512,414 | |||||
DMC Global | 13,870 | a | 639,268 | ||||
Dril-Quip | 14,700 | b | 621,222 | ||||
Forum Energy Technologies | 97,200 | b | 127,332 | ||||
ION Geophysical | 23,424 | b | 197,464 | ||||
McDermott International | 75,411 | a,b | 60,359 | ||||
Oil States International | 199,397 | b | 3,178,388 | ||||
Patterson-UTI Energy | 44,900 | a | 401,406 | ||||
Penn Virginia | 8,404 | b | 202,957 | ||||
QEP Resources | 83,250 | 272,228 | |||||
SEACOR Holdings | 8,010 | b | 339,143 | ||||
Select Energy Services, Cl. A | 98,550 | b | 756,864 | ||||
SM Energy | 45,910 | a | 381,512 | ||||
Superior Energy Services | 118,800 | b | 33,858 | ||||
TETRA Technologies | 138,390 | b | 170,220 | ||||
World Fuel Services | 43,050 | 1,825,320 | |||||
13
STATEMENT OF INVESTMENTS (continued)
Description | Shares | Value ($) | |||||
Common Stocks - 97.9% (continued) | |||||||
Energy - 2.1% (continued) | |||||||
WPX Energy | 98,080 | a,b | 965,107 | ||||
12,681,030 | |||||||
Food & Staples Retailing - .2% | |||||||
Casey's General Stores | 7,240 | 1,258,095 | |||||
Food, Beverage & Tobacco - 3.9% | |||||||
Calavo Growers | 19,300 | a | 1,721,367 | ||||
Darling Ingredients | 306,950 | b | 7,305,410 | ||||
Landec | 170,910 | b | 1,958,629 | ||||
National Beverage | 70,648 | a,b | 3,506,967 | ||||
Nomad Foods | 107,730 | b | 2,262,330 | ||||
Sanderson Farms | 8,540 | a | 1,414,053 | ||||
The Hain Celestial Group | 49,000 | a,b | 1,211,280 | ||||
TreeHouse Foods | 73,570 | a,b | 3,596,837 | ||||
22,976,873 | |||||||
Health Care Equipment & Services - 4.2% | |||||||
Acadia Healthcare | 56,100 | a,b | 1,804,176 | ||||
Accuray | 259,290 | b | 798,613 | ||||
Allscripts Healthcare Solutions | 113,290 | a,b | 1,221,266 | ||||
Amedisys | 4,709 | b | 767,379 | ||||
AMN Healthcare Services | 60,744 | b | 3,612,445 | ||||
AtriCure | 37,100 | b | 1,103,725 | ||||
BioTelemetry | 5,040 | b | 233,402 | ||||
CONMED | 6,960 | 788,359 | |||||
Encompass Health | 21,900 | 1,548,549 | |||||
Globus Medical, Cl. A | 18,625 | b | 1,042,069 | ||||
Haemonetics | 6,505 | b | 784,503 | ||||
HealthEquity | 9,335 | b | 587,078 | ||||
Integer Holdings | 48,132 | b | 3,650,812 | ||||
LHC Group | 5,835 | b | 778,389 | ||||
MEDNAX | 36,600 | b | 955,992 | ||||
Molina Healthcare | 11,200 | b | 1,517,600 | ||||
Natus Medical | 24,820 | b | 793,992 | ||||
Novocure | 8,075 | b | 744,354 | ||||
OraSure Technologies | 46,200 | b | 374,220 | ||||
Patterson | 59,900 | a | 1,165,654 | ||||
Teladoc Health | 10,100 | a,b | 845,774 | ||||
25,118,351 | |||||||
Household & Personal Products - .8% | |||||||
Inter Parfums | 27,605 | 1,945,876 | |||||
WD-40 | 15,730 | a | 3,037,620 | ||||
4,983,496 | |||||||
Insurance - 3.8% | |||||||
AMERISAFE | 22,110 | 1,494,636 | |||||
14
Description | Shares | Value ($) | |||||
Common Stocks - 97.9% (continued) | |||||||
Insurance - 3.8% (continued) | |||||||
eHealth | 10,100 | a,b | 931,826 | ||||
First American Financial | 20,850 | 1,326,477 | |||||
Horace Mann Educators | 67,768 | 2,941,809 | |||||
Kemper | 52,134 | 3,853,745 | |||||
Primerica | 55,366 | 7,410,186 | |||||
RLI | 40,000 | 3,654,800 | |||||
Stewart Information Services | 27,580 | 1,179,597 | |||||
22,793,076 | |||||||
Materials - 5.9% | |||||||
Allegheny Technologies | 124,848 | a,b | 2,878,995 | ||||
Avery Dennison | 24,120 | 3,144,524 | |||||
Balchem | 22,440 | 2,235,697 | |||||
Cleveland-Cliffs | 135,930 | a | 1,086,081 | ||||
Crown Holdings | 60,000 | b | 4,554,000 | ||||
H.B. Fuller | 60,286 | 3,007,066 | |||||
Haynes International | 29,730 | 1,091,686 | |||||
Ingevity | 55,243 | b | 4,988,996 | ||||
Louisiana-Pacific | 29,405 | 872,152 | |||||
Materion | 20,370 | 1,198,978 | |||||
Mercer International | 89,027 | 1,115,508 | |||||
PolyOne | 48,935 | 1,542,921 | |||||
Silgan Holdings | 19,360 | 596,482 | |||||
Stepan | 8,377 | 811,731 | |||||
The Scotts Miracle-Gro Company | 62,120 | a | 6,279,090 | ||||
35,403,907 | |||||||
Media & Entertainment - 2.0% | |||||||
Cinemark Holdings | 90,255 | a | 3,056,937 | ||||
Criteo, ADR | 61,700 | b | 1,101,345 | ||||
Gray Television | 129,007 | b | 2,611,102 | ||||
John Wiley & Sons, Cl. A | 27,140 | 1,282,636 | |||||
MSG Networks, Cl. A | 32,500 | b | 527,800 | ||||
TEGNA | 227,768 | a | 3,496,239 | ||||
12,076,059 | |||||||
Pharmaceuticals Biotechnology & Life Sciences - 4.3% | |||||||
ACADIA Pharmaceuticals | 27,830 | a,b | 1,260,421 | ||||
Amneal Pharmaceuticals | 170,600 | b | 641,456 | ||||
Anika Therapeutics | 48,604 | b | 2,809,311 | ||||
Axsome Therapeutics | 21,890 | a,b | 861,809 | ||||
Blueprint Medicines | 5,870 | b | 481,575 | ||||
Charles River Laboratories International | 53,251 | b | 7,734,708 | ||||
Deciphera Pharmaceuticals | 14,815 | b | 700,601 | ||||
Esperion Therapeutics | 35,235 | a,b | 1,809,670 | ||||
Fluidigm | 257,425 | b | 648,711 | ||||
15
STATEMENT OF INVESTMENTS (continued)
Description | Shares | Value ($) | |||||
Common Stocks - 97.9% (continued) | |||||||
Pharmaceuticals Biotechnology & Life Sciences - 4.3% (continued) | |||||||
Intersect ENT | 29,100 | b | 630,888 | ||||
Invitae | 27,825 | a,b | 553,718 | ||||
Iovance Biotherapeutics | 24,380 | b | 556,595 | ||||
Karuna Therapeutics | 7,580 | b | 544,850 | ||||
Luminex | 51,000 | 1,077,630 | |||||
Mallinckrodt | 24,600 | a,b | 92,742 | ||||
NanoString Technologies | 64,100 | b | 1,725,572 | ||||
Natera | 14,900 | b | 543,701 | ||||
Reata Pharmaceuticals, Cl. A | 4,260 | a,b | 831,254 | ||||
Repligen | 13,915 | b | 1,234,956 | ||||
uniQure | 13,915 | a,b | 774,509 | ||||
25,514,677 | |||||||
Real Estate - 4.1% | |||||||
Corporate Office Properties Trust | 74,399 | c | 2,170,963 | ||||
Industrial Logistics Properties Trust | 59,100 | c | 1,278,924 | ||||
Jones Lang LaSalle | 10,008 | 1,664,631 | |||||
MGM Growth Properties, Cl. A | 165,625 | a,c | 5,132,719 | ||||
Physicians Realty Trust | 123,107 | c | 2,362,423 | ||||
QTS Realty Trust, Cl. A | 71,154 | a,c | 3,776,143 | ||||
Rexford Industrial Realty | 49,600 | c | 2,373,856 | ||||
Tanger Factory Outlet Centers | 82,510 | a,c | 1,255,802 | ||||
Terreno Realty | 47,585 | c | 2,746,606 | ||||
UMH Properties | 78,340 | c | 1,222,887 | ||||
Uniti Group | 50,900 | a,c | 342,048 | ||||
24,327,002 | |||||||
Retailing - .8% | |||||||
Chico's FAS | 102,900 | a | 490,833 | ||||
Express | 73,870 | a,b | 290,309 | ||||
Monro | 10,545 | a | 774,003 | ||||
Office Depot | 290,888 | 648,680 | |||||
Ollie's Bargain Outlet Holdings | 21,320 | a,b | 1,394,328 | ||||
Party City Holdco | 159,200 | a,b | 307,256 | ||||
RTW RetailWinds | 53,980 | b | 72,333 | ||||
The Children's Place | 10,800 | a | 780,408 | ||||
4,758,150 | |||||||
Semiconductors & Semiconductor Equipment - 4.4% | |||||||
Brooks Automation | 131,510 | a | 5,887,703 | ||||
Cabot Microelectronics | 13,690 | 1,826,383 | |||||
CEVA | 23,930 | b | 620,266 | ||||
Cirrus Logic | 8,320 | b | 596,544 | ||||
Enphase Energy | 21,890 | a,b | 478,734 | ||||
Entegris | 21,600 | 1,022,112 | |||||
16
Description | Shares | Value ($) | |||||
Common Stocks - 97.9% (continued) | |||||||
Semiconductors & Semiconductor Equipment - 4.4% (continued) | |||||||
Impinj | 10,500 | b | 331,380 | ||||
Inphi | 17,060 | b | 1,187,888 | ||||
Kulicke & Soffa Industries | 68,340 | 1,714,651 | |||||
MACOM Technology Solutions Holdings | 76,355 | a,b | 1,883,678 | ||||
Rambus | 145,180 | b | 1,894,599 | ||||
Semtech | 97,607 | b | 4,730,035 | ||||
Silicon Laboratories | 14,360 | b | 1,521,155 | ||||
SolarEdge Technologies | 6,505 | a,b | 530,873 | ||||
Ultra Clean Holdings | 24,590 | b | 546,882 | ||||
Veeco Instruments | 91,700 | b | 1,255,373 | ||||
26,028,256 | |||||||
Software & Services - 6.4% | |||||||
American Software, Cl. A | 110,100 | 1,740,681 | |||||
Avaya Holdings | 92,020 | a,b | 1,175,095 | ||||
Box, Cl. A | 15,100 | a,b | 275,424 | ||||
Cass Information Systems | 54,792 | 3,094,104 | |||||
Cerence | 19,693 | b | 306,423 | ||||
Cloudera | 198,500 | a,b | 1,961,180 | ||||
Conduent | 116,100 | b | 785,997 | ||||
CoreLogic | 130,040 | b | 5,387,557 | ||||
Everbridge | 14,810 | b | 1,302,391 | ||||
FireEye | 133,700 | a,b | 2,240,812 | ||||
Five9 | 24,685 | b | 1,682,776 | ||||
Jack Henry & Associates | 14,830 | 2,253,270 | |||||
KBR | 92,740 | 2,760,870 | |||||
LivePerson | 29,850 | a,b | 1,184,746 | ||||
ManTech International, Cl. A | 37,044 | 2,873,874 | |||||
Nuance Communications | 157,950 | b | 2,832,043 | ||||
OneSpan | 56,500 | b | 1,053,725 | ||||
Talend, ADR | 8,900 | a,b | 337,844 | ||||
TiVo | 140,290 | 1,095,665 | |||||
Unisys | 60,600 | b | 689,628 | ||||
Verint Systems | 58,669 | b | 2,851,900 | ||||
37,886,005 | |||||||
Technology Hardware & Equipment - 5.5% | |||||||
Badger Meter | 41,500 | a | 2,573,000 | ||||
Ciena | 110,430 | b | 4,191,923 | ||||
Diebold Nixdorf | 114,100 | a,b | 829,507 | ||||
II-VI | 61,058 | a,b | 1,782,283 | ||||
Infinera | 203,820 | a,b | 1,300,372 | ||||
Itron | 35,130 | b | 2,813,210 | ||||
KEMET | 135,074 | a | 3,609,177 | ||||
17
STATEMENT OF INVESTMENTS (continued)
Description | Shares | Value ($) | |||||
Common Stocks - 97.9% (continued) | |||||||
Technology Hardware & Equipment - 5.5% (continued) | |||||||
Kimball Electronics | 42,820 | b | 751,063 | ||||
Littelfuse | 16,194 | 2,937,754 | |||||
Lumentum Holdings | 13,490 | b | 993,673 | ||||
MTS Systems | 21,760 | 988,339 | |||||
NCR | 47,540 | a,b | 1,560,738 | ||||
OSI Systems | 15,110 | b | 1,503,294 | ||||
Quantum | 34,403 | b | 199,537 | ||||
Ribbon Communications | 125,000 | b | 366,250 | ||||
Rogers | 3,820 | b | 496,676 | ||||
Stratasys | 39,900 | a,b | 735,756 | ||||
Viavi Solutions | 128,200 | b | 1,925,564 | ||||
Vishay Intertechnology | 152,537 | 3,033,961 | |||||
32,592,077 | |||||||
Telecommunication Services - .2% | |||||||
Bandwidth, Cl. A | 16,605 | b | 928,718 | ||||
Transportation - 1.9% | |||||||
Avis Budget Group | 40,400 | b | 1,201,900 | ||||
Danaos | 6,871 | b | 47,753 | ||||
Forward Air | 17,950 | 1,257,038 | |||||
Hertz Global Holdings | 106,481 | b | 1,650,455 | ||||
Hub Group, Cl. A | 29,960 | b | 1,530,057 | ||||
Kirby | 15,120 | b | 1,275,674 | ||||
Landstar System | 29,520 | 3,288,823 | |||||
Ryder System | 10,270 | 539,072 | |||||
Saia | 5,870 | b | 557,063 | ||||
11,347,835 | |||||||
Utilities - 2.4% | |||||||
ALLETE | 18,449 | 1,477,949 | |||||
American States Water | 14,490 | a | 1,235,852 | ||||
Atlantic Power | 635,950 | a,b | 1,500,842 | ||||
Chesapeake Utilities | 24,235 | 2,208,778 | |||||
Ormat Technologies | 21,226 | 1,631,218 | |||||
South Jersey Industries | 83,983 | a | 2,623,629 | ||||
Southwest Gas Holdings | 19,305 | 1,462,547 | |||||
Vistra Energy | 90,852 | 2,410,304 | |||||
14,551,119 | |||||||
Total Common Stocks(cost $469,387,850) | 583,210,085 | ||||||
Exchange-Traded Funds - .3% | |||||||
Registered Investment Companies - .3% | |||||||
iShares Russell 2000 ETF | 12,000 | a | 1,941,240 | ||||
18
Description | 1-Day | Shares | Value(%) | ||||
Investment Companies - 2.1% | |||||||
Registered Investment Companies - 2.1% | |||||||
Dreyfus Institutional Preferred Government Plus Money Market Fund | 1.63 | 12,306,693 | d | 12,306,693 | |||
Investment of Cash Collateral for Securities Loaned - 2.3% | |||||||
Registered Investment Companies - 2.3% | |||||||
Dreyfus Institutional Preferred Government Plus Money Market Fund | 1.63 | 13,991,191 | d | 13,991,191 | |||
Total Investments(cost $497,534,631) | 102.6% | 611,449,209 | |||||
Liabilities, Less Cash and Receivables | (2.6%) | (15,672,516) | |||||
Net Assets | 100.0% | 595,776,693 | |||||
ADR—American Depository Receipt
ETF—Exchange-Traded Fund
a Security, or portion thereof, on loan. At November 30, 2019, the value of the fund’s securities on loan was $124,865,738 and the value of the collateral was $128,759,663, consisting of cash collateral of $13,991,191 and U.S. Government & Agency securities valued at $114,768,472.
b Non-income producing security.
c Investment in real estate investment trust within the United States.
d Investment in affiliated issuer. The investment objective of this investment company is publicly available and can be found within the investment company’s prospectus.
Portfolio Summary (Unaudited)† | Value (%) |
Industrials | 23.7 |
Financials | 19.0 |
Information Technology | 16.2 |
Consumer Discretionary | 8.8 |
Health Care | 8.5 |
Materials | 6.0 |
Consumer Staples | 4.9 |
Investment Companies | 4.7 |
Real Estate | 4.1 |
Utilities | 2.4 |
Communication Services | 2.2 |
Energy | 2.1 |
102.6 |
† Based on net assets.
See notes to financial statements.
19
STATEMENT OF INVESTMENTS IN AFFILIATED ISSUERS
Investment Companies | Value | Purchases($) | Sales($) | Value | Net | Dividend/ |
Registered Investment Companies; | ||||||
Dreyfus Institutional Preferred Government Plus Money Market Fund | 12,595,400 | 482,296,352 | 482,585,059 | 12,306,693 | 2.1 | 359,738 |
Investment of Cash Collateral for Securities Loaned:† | ||||||
Dreyfus Institutional Preferred Government Money Market Fund, Institutional Shares | 32,704,474 | 9,573,496 | 42,277,970 | - | - | - |
Dreyfus Institutional Preferred Government Plus Money Market Fund | - | 131,122,571 | 117,131,380 | 13,991,191 | 2.3 | - |
Total | 45,299,874 | 622,992,419 | 641,994,409 | 26,297,884 | 4.4 | 359,738 |
† Effective January 2, 2019, cash collateral for securities lending was transferred from Dreyfus Institutional Preferred Government Money Market Fund, Institutional Shares to Dreyfus Institutional Preferred Government Plus Money Market Fund.
See notes to financial statements.
20
STATEMENT OF ASSETS AND LIABILITIES
November 30, 2019
|
|
|
|
|
|
|
|
|
| Cost |
| Value |
|
Assets ($): |
|
|
|
| ||
Investments in securities—See Statement of Investments |
|
|
| |||
Unaffiliated issuers | 471,236,747 |
| 585,151,325 |
| ||
Affiliated issuers |
| 26,297,884 |
| 26,297,884 |
| |
Dividends, interest and securities lending income receivable |
| 465,809 |
| |||
Receivable for shares of Common Stock subscribed |
| 177,354 |
| |||
Receivable for investment securities sold |
| 48,107 |
| |||
Prepaid expenses |
|
|
|
| 43,117 |
|
|
|
|
|
| 612,183,596 |
|
Liabilities ($): |
|
|
|
| ||
Due to BNY Mellon Investment Adviser, Inc. and affiliates—Note 3(c) |
| 459,432 |
| |||
Liability for securities on loan—Note 1(b) |
| 13,991,191 |
| |||
Payable for investment securities purchased |
| 1,729,869 |
| |||
Payable for shares of Common Stock redeemed |
| 156,796 |
| |||
Directors’ fees and expenses payable |
| 9,917 |
| |||
Other accrued expenses |
|
|
|
| 59,698 |
|
|
|
|
|
| 16,406,903 |
|
Net Assets ($) |
|
| 595,776,693 |
| ||
Composition of Net Assets ($): |
|
|
|
| ||
Paid-in capital |
|
|
|
| 474,782,324 |
|
Total distributable earnings (loss) |
|
|
|
| 120,994,369 |
|
Net Assets ($) |
|
| 595,776,693 |
| ||
Net Asset Value Per Share | Class A | Class C | Class I | Class Y |
|
Net Assets ($) | 1,124,724 | 430,255 | 15,954,700 | 578,267,014 |
|
Shares Outstanding | 50,782 | 21,666 | 705,631 | 25,602,740 |
|
Net Asset Value Per Share ($) | 22.15 | 19.86 | 22.61 | 22.59 |
|
|
|
|
|
|
|
See notes to financial statements. |
|
|
|
|
|
21
STATEMENT OF OPERATIONS
Year Ended November 30, 2019
|
|
|
|
|
|
|
|
|
|
|
|
|
|
Investment Income ($): |
|
|
|
| ||
Income: |
|
|
|
| ||
Cash dividends (net of $14,340 foreign taxes withheld at source): |
| |||||
Unaffiliated issuers |
|
| 8,252,990 |
| ||
Affiliated issuers |
|
| 359,738 |
| ||
Income from securities lending—Note 1(b) |
|
| 178,595 |
| ||
Total Income |
|
| 8,791,323 |
| ||
Expenses: |
|
|
|
| ||
Management fee—Note 3(a) |
|
| 5,521,416 |
| ||
Professional fees |
|
| 87,140 |
| ||
Registration fees |
|
| 66,595 |
| ||
Directors’ fees and expenses—Note 3(d) |
|
| 64,107 |
| ||
Custodian fees—Note 3(c) |
|
| 34,030 |
| ||
Shareholder servicing costs—Note 3(c) |
|
| 13,771 |
| ||
Loan commitment fees—Note 2 |
|
| 13,235 |
| ||
Prospectus and shareholders’ reports |
|
| 10,784 |
| ||
Distribution fees—Note 3(b) |
|
| 3,809 |
| ||
Miscellaneous |
|
| 54,734 |
| ||
Total Expenses |
|
| 5,869,621 |
| ||
Less—reduction in expenses due to undertaking—Note 3(a) |
|
| (1,137) |
| ||
Net Expenses |
|
| 5,868,484 |
| ||
Investment Income—Net |
|
| 2,922,839 |
| ||
Realized and Unrealized Gain (Loss) on Investments—Note 4 ($): |
|
| ||||
Net realized gain (loss) on investments | 10,986,108 |
| ||||
Net change in unrealized appreciation (depreciation) on investments | 5,498,777 |
| ||||
Net Realized and Unrealized Gain (Loss) on Investments |
|
| 16,484,885 |
| ||
Net Increase in Net Assets Resulting from Operations |
| 19,407,724 |
| |||
|
|
|
|
|
|
|
See notes to financial statements. | ||||||
22
STATEMENT OF CHANGES IN NET ASSETS
|
|
|
| Year Ended November 30, | |||||
|
|
|
| 2019 |
| 2018 |
| ||
Operations ($): |
|
|
|
|
|
|
|
| |
Investment income—net |
|
| 2,922,839 |
|
|
| 2,885,212 |
| |
Net realized gain (loss) on investments |
| 10,986,108 |
|
|
| 77,359,132 |
| ||
Net change in unrealized appreciation |
| 5,498,777 |
|
|
| (110,039,814) |
| ||
Net Increase (Decrease) in Net Assets | 19,407,724 |
|
|
| (29,795,470) |
| |||
Distributions ($): |
| ||||||||
Distributions to shareholders: |
|
|
|
|
|
|
|
| |
Class A |
|
| (110,050) |
|
|
| (64,787) |
| |
Class C |
|
| (66,106) |
|
|
| (7,868) |
| |
Class I |
|
| (2,598,752) |
|
|
| (1,228,285) |
| |
Class Y |
|
| (78,332,501) |
|
|
| (54,610,093) |
| |
Total Distributions |
|
| (81,107,409) |
|
|
| (55,911,033) |
| |
Capital Stock Transactions ($): |
| ||||||||
Net proceeds from shares sold: |
|
|
|
|
|
|
|
| |
Class A |
|
| 172,405 |
|
|
| 92,055 |
| |
Class C |
|
| 61,907 |
|
|
| 472,927 |
| |
Class I |
|
| 10,583,723 |
|
|
| 16,731,975 |
| |
Class Y |
|
| 56,189,198 |
|
|
| 75,166,525 |
| |
Distributions reinvested: |
|
|
|
|
|
|
|
| |
Class A |
|
| 108,467 |
|
|
| 63,405 |
| |
Class C |
|
| 65,008 |
|
|
| 7,867 |
| |
Class I |
|
| 2,072,895 |
|
|
| 964,379 |
| |
Class Y |
|
| 33,919,144 |
|
|
| 23,821,651 |
| |
Cost of shares redeemed: |
|
|
|
|
|
|
|
| |
Class A |
|
| (149,257) |
|
|
| (75,592) |
| |
Class C |
|
| (199,960) |
|
|
| (72,895) |
| |
Class I |
|
| (19,225,627) |
|
|
| (11,273,631) |
| |
Class Y |
|
| (229,849,785) |
|
|
| (180,898,249) |
| |
Increase (Decrease) in Net Assets | (146,251,882) |
|
|
| (74,999,583) |
| |||
Total Increase (Decrease) in Net Assets | (207,951,567) |
|
|
| (160,706,086) |
| |||
Net Assets ($): |
| ||||||||
Beginning of Period |
|
| 803,728,260 |
|
|
| 964,434,346 |
| |
End of Period |
|
| 595,776,693 |
|
|
| 803,728,260 |
| |
23
STATEMENT OF CHANGES IN NET ASSETS (continued)
|
|
|
| Year Ended November 30, | |||||
|
|
|
| 2019 |
| 2018 |
| ||
Capital Share Transactions (Shares): |
| ||||||||
Class Aa |
|
|
|
|
|
|
|
| |
Shares sold |
|
| 8,195 |
|
|
| 3,589 |
| |
Shares issued for distributions reinvested |
|
| 5,940 |
|
|
| 2,567 |
| |
Shares redeemed |
|
| (7,120) |
|
|
| (3,096) |
| |
Net Increase (Decrease) in Shares Outstanding | 7,015 |
|
|
| 3,060 |
| |||
Class Ca |
|
|
|
|
|
|
|
| |
Shares sold |
|
| 3,243 |
|
|
| 20,627 |
| |
Shares issued for distributions reinvested |
|
| 3,942 |
|
|
| 345 |
| |
Shares redeemed |
|
| (10,748) |
|
|
| (3,048) |
| |
Net Increase (Decrease) in Shares Outstanding | (3,563) |
|
|
| 17,924 |
| |||
Class Ia |
|
|
|
|
|
|
|
| |
Shares sold |
|
| 495,011 |
|
|
| 656,859 |
| |
Shares issued for distributions reinvested |
|
| 111,506 |
|
|
| 38,402 |
| |
Shares redeemed |
|
| (920,408) |
|
|
| (440,307) |
| |
Net Increase (Decrease) in Shares Outstanding | (313,891) |
|
|
| 254,954 |
| |||
Class Ya |
|
|
|
|
|
|
|
| |
Shares sold |
|
| 2,676,747 |
|
|
| 2,952,382 |
| |
Shares issued for distributions reinvested |
|
| 1,826,449 |
|
|
| 949,722 |
| |
Shares redeemed |
|
| (10,760,520) |
|
|
| (7,107,076) |
| |
Net Increase (Decrease) in Shares Outstanding | (6,257,324) |
|
|
| (3,204,972) |
| |||
|
|
|
|
|
|
|
|
|
|
aDuring the period ended November 30, 2019, 478,261 Class Y shares representing $10,173,491 were exchanged for 477,696 Class I shares, 329 Class Y shares representing $7,445 were exchanged for 335 Class A shares and 215 Class C shares representing $4,177 were automatically converted to 194 Class A shares. During the period ended November 30, 2018, 131 Class C shares representing $3,145 were automatically converted to 121 Class A shares, 622,430 Class Y shares representing $15,845,547 were exchanged for 621,891 Class I shares. | |||||||||
See notes to financial statements. | |||||||||
24
FINANCIAL HIGHLIGHTS
The following tables describe the performance for each share class for the fiscal periods indicated. All information (except portfolio turnover rate) reflects financial results for a single fund share. Total return shows how much your investment in the fund would have increased (or decreased) during each period, assuming you had reinvested all dividends and distributions. These figures have been derived from the fund’s financial statements.
Year Ended November 30, | ||||||
Class A Shares | 2019 | 2018 | 2017 | 2016 | 2015 | |
Per Share Data ($): | ||||||
Net asset value, beginning of period | 23.94 | 26.44 | 22.72 | 22.02 | 24.89 | |
Investment Operations: | ||||||
Investment income (loss)—neta | .02 | (.01) | .00b | .09 | .07 | |
Net realized and unrealized | .86 | (.98) | 3.79 | 2.02 | (.02) | |
Total from Investment Operations | .88 | (.99) | 3.79 | 2.11 | .05 | |
Distributions: | ||||||
Dividends from investment income—net | - | - | (.07) | (.11) | (.00)b | |
Dividends from net realized | (2.67) | (1.51) | - | (1.30) | (2.92) | |
Total Distributions | (2.67) | (1.51) | (.07) | (1.41) | (2.92) | |
Net asset value, end of period | 22.15 | 23.94 | 26.44 | 22.72 | 22.02 | |
Total Return (%)c | 6.07 | (3.93) | 16.74 | 10.72 | .01 | |
Ratios/Supplemental Data (%): | ||||||
Ratio of total expenses | 1.38 | 1.35 | 1.30 | 1.30 | 1.29 | |
Ratio of net expenses | 1.30 | 1.30 | 1.28 | 1.30 | 1.29 | |
Ratio of net investment income (loss) | .12 | (.05) | .01 | .44 | .31 | |
Portfolio Turnover Rate | 57.74 | 58.85 | 67.90 | 66.57 | 65.39 | |
Net Assets, end of period ($ x 1,000) | 1,125 | 1,048 | 1,076 | 2,862 | 2,250 | |
a Based on average shares outstanding.
b Amount represents less than $.01 per share.
c Exclusive of sales charge.
See notes to financial statements.
25
FINANCIAL HIGHLIGHTS (continued)
Year Ended November 30, | ||||||
Class C Shares | 2019 | 2018 | 2017 | 2016 | 2015 | |
Per Share Data ($): | ||||||
Net asset value, beginning of period | 21.92 | 24.51 | 21.15 | 20.68 | 23.70 | |
Investment Operations: | ||||||
Investment (loss)—neta | (.12) | (.19) | (.16) | (.07) | (.09) | |
Net realized and unrealized | .73 | (.89) | 3.52 | 1.90 | (.01) | |
Total from Investment Operations | .61 | (1.08) | 3.36 | 1.83 | (.10) | |
Distributions: | ||||||
Dividends from investment income—net | - | - | - | (.06) | - | |
Dividends from net realized | (2.67) | (1.51) | - | (1.30) | (2.92) | |
Total Distributions | (2.67) | (1.51) | - | (1.36) | (2.92) | |
Net asset value, end of period | 19.86 | 21.92 | 24.51 | 21.15 | 20.68 | |
Total Return (%)b | 5.28 | (4.65) | 15.89 | 9.94 | (.72) | |
Ratios/Supplemental Data (%): | ||||||
Ratio of total expenses | 2.12 | 2.15 | 2.31 | 2.33 | 2.42 | |
Ratio of net expenses | 2.05 | 2.05 | 2.04 | 2.05 | 2.04 | |
Ratio of net investment (loss) | (.61) | (.82) | (.74) | (.39) | (.47) | |
Portfolio Turnover Rate | 57.74 | 58.85 | 67.90 | 66.57 | 65.39 | |
Net Assets, end of period ($ x 1,000) | 430 | 553 | 179 | 146 | 154 | |
a Based on average shares outstanding.
b Exclusive of sales charge.
See notes to financial statements.
26
Year Ended November 30, | ||||||
Class I Shares | 2019 | 2018 | 2017 | 2016 | 2015 | |
Per Share Data ($): | ||||||
Net asset value, beginning of period | 24.41 | 26.90 | 23.09 | 22.36 | 25.22 | |
Investment Operations: | ||||||
Investment income—neta | .10 | .07 | .07 | .15 | .14 | |
Net realized and unrealized | .86 | (1.00) | 3.87 | 2.06 | (.03) | |
Total from Investment Operations | .96 | (.93) | 3.94 | 2.21 | .11 | |
Distributions: | ||||||
Dividends from | (.09) | (.05) | (.13) | (.18) | (.05) | |
Dividends from net realized | (2.67) | (1.51) | - | (1.30) | (2.92) | |
Total Distributions | (2.76) | (1.56) | (.13) | (1.48) | (2.97) | |
Net asset value, end of period | 22.61 | 24.41 | 26.90 | 23.09 | 22.36 | |
Total Return (%) | 6.40 | (3.63) | 17.14 | 11.09 | .26 | |
Ratios/Supplemental Data (%): | ||||||
Ratio of total expenses | .99 | .97 | 1.00 | .99 | .97 | |
Ratio of net expenses | .99 | .97 | .98 | .99 | .97 | |
Ratio of net investment income | .45 | .27 | .29 | .75 | .62 | |
Portfolio Turnover Rate | 57.74 | 58.85 | 67.90 | 66.57 | 65.39 | |
Net Assets, end of period ($ x 1,000) | 15,955 | 24,890 | 20,566 | 16,478 | 20,731 | |
a Based on average shares outstanding.
See notes to financial statements.
27
FINANCIAL HIGHLIGHTS (continued)
Year Ended November 30, | ||||||
Class Y Shares | 2019 | 2018 | 2017 | 2016 | 2015 | |
Per Share Data ($): | ||||||
Net asset value, beginning of period | 24.40 | 26.88 | 23.08 | 22.35 | 25.21 | |
Investment Operations: | ||||||
Investment income—neta | .10 | .08 | .08 | .16 | .15 | |
Net realized and unrealized | .86 | (.99) | 3.86 | 2.06 | (.03) | |
Total from Investment Operations | .96 | (.91) | 3.94 | 2.22 | .12 | |
Distributions: | ||||||
Dividends | (.10) | (.06) | (.14) | (.19) | (.06) | |
Dividends from net realized | (2.67) | (1.51) | - | (1.30) | (2.92) | |
Total Distributions | (2.77) | (1.57) | (.14) | (1.49) | (2.98) | |
Net asset value, end of period | 22.59 | 24.40 | 26.88 | 23.08 | 22.35 | |
Total Return (%) | 6.41 | (3.56) | 17.15 | 11.13 | .31 | |
Ratios/Supplemental Data (%): | ||||||
Ratio of total expenses | .95 | .94 | .94 | .95 | .95 | |
Ratio of net expenses | .95 | .94 | .93 | .95 | .95 | |
Ratio of net investment income | .48 | .31 | .35 | .79 | .65 | |
Portfolio Turnover Rate | 57.74 | 58.85 | 67.90 | 66.57 | 65.39 | |
Net Assets, end of period ($ x 1,000) | 578,267 | 777,237 | 942,613 | 797,087 | 770,763 | |
a Based on average shares outstanding.
See notes to financial statements.
28
NOTES TO FINANCIAL STATEMENTS
NOTE 1—Significant Accounting Policies:
BNY Mellon Select Managers Small Cap Value Fund (the “fund”) is a separate non-diversified series of BNY Mellon Strategic Funds, Inc. (the “Company”), which is registered under the Investment Company Act of 1940, as amended (the “Act”), as an open-end management investment company and operates as a series company currently offering six series, including the fund. The fund’s investment objective is to seek capital appreciation. BNY Mellon Investment Adviser, Inc. (the “Adviser”), a wholly-owned subsidiary of The Bank of New York Mellon Corporation (“BNY Mellon”), serves as the fund’s investment adviser and the fund’s portfolio allocation manager. Walthausen & Co., LLC (“Walthausen”), Neuberger Berman Investment Advisers LLC (“Neuberger Berman”), Kayne Anderson Rudnick Investment Management, LLC (“Kayne”), Channing Capital Management, LLC (“Channing”) and Eastern Shore Capital Management (“Eastern Shore”) serve as the fund’s sub-investment advisers, each managing an allocated portion of the fund’s portfolio.
Effective May 15, 2019, the Company’s Board of Directors (the “Board”) voted to terminate the fund’s sub-investment advisory agreement with Thompson, Siegel and Walmsley, LLC.
Effective June 3, 2019, the fund changed its name from Dreyfus Select Managers Small Cap Value Fund to BNY Mellon Select Managers Small Cap Value Fund and the Company changed its name from Strategic Funds, Inc. to BNY Mellon Strategic Funds, Inc. In addition, The Dreyfus Corporation, the fund’s investment adviser, changed its name to “BNY Mellon Investment Adviser, Inc.”, MBSC Securities Corporation, the fund’s distributor, changed its name to “BNY Mellon Securities Corporation” and Dreyfus Transfer, Inc., the fund’s transfer agent, changed its name to “BNY Mellon Transfer, Inc.”
BNY Mellon Securities Corporation (the “Distributor”), a wholly-owned subsidiary of the Adviser, is the distributor of the fund’s shares. The fund is authorized to issue 100 million shares of $.001 par value Common Stock in each of the following classes of shares: Class A, Class C, Class I, Class T and Class Y. Class A and Class T shares generally are subject to a sales charge imposed at the time of purchase. Class C shares are subject to a contingent deferred sales charge (“CDSC”) imposed on Class C shares redeemed within one year of purchase. Class C shares automatically convert to Class A shares ten years after the date of purchase, without the imposition of a sales charge. Class I and Class Y shares are sold at net asset value per share generally to institutional investors. As of the date of this
29
NOTES TO FINANCIAL STATEMENTS(continued)
report, the fund did not offer Class T shares for purchase. Other differences between the classes include the services offered to and the expenses borne by each class, the allocation of certain transfer agency costs, and certain voting rights. Income, expenses (other than expenses attributable to a specific class), and realized and unrealized gains or losses on investments are allocated to each class of shares based on its relative net assets.
The Company accounts separately for the assets, liabilities and operations of each series. Expenses directly attributable to each series are charged to that series’ operations; expenses which are applicable to all series are allocated among them on a pro rata basis.
The Financial Accounting Standards Board (“FASB”) Accounting Standards Codification (“ASC”) is the exclusive reference of authoritative U.S. generally accepted accounting principles (“GAAP”) recognized by the FASB to be applied by nongovernmental entities. Rules and interpretive releases of the Securities and Exchange Commission (“SEC”) under authority of federal laws are also sources of authoritative GAAP for SEC registrants. The fund is an investment company and applies the accounting and reporting guidance of the FASB ASC Topic 946 Financial Services-Investment Companies. The fund’s financial statements are prepared in accordance with GAAP, which may require the use of management estimates and assumptions. Actual results could differ from those estimates.
The Companyenters into contracts that contain a variety of indemnifications. The fund’s maximum exposure under these arrangements is unknown. The fund does not anticipate recognizing any loss related to these arrangements.
(a) Portfolio valuation: The fair value of a financial instrument is the amount that would be received to sell an asset or paid to transfer a liability in an orderly transaction between market participants at the measurement date (i.e., the exit price). GAAP establishes a fair value hierarchy that prioritizes the inputs of valuation techniques used to measure fair value. This hierarchy gives the highest priority to unadjusted quoted prices in active markets for identical assets or liabilities (Level 1 measurements) and the lowest priority to unobservable inputs (Level 3 measurements).
Additionally, GAAP provides guidance on determining whether the volume and activity in a market has decreased significantly and whether such a decrease in activity results in transactions that are not orderly. GAAP requires enhanced disclosures around valuation inputs and techniques used during annual and interim periods.
30
Various inputs are used in determining the value of the fund’s investments relating to fair value measurements. These inputs are summarized in the three broad levels listed below:
Level 1—unadjusted quoted prices in active markets for identical investments.
Level 2—other significant observable inputs (including quoted prices for similar investments, interest rates, prepayment speeds, credit risk, etc.).
Level 3—significant unobservable inputs (including the fund’s own assumptions in determining the fair value of investments).
The inputs or methodology used for valuing securities are not necessarily an indication of the risk associated with investing in those securities.
Changes in valuation techniques may result in transfers in or out of an assigned level within the disclosure hierarchy. Valuation techniques used to value the fund’s investments are as follows:
Investments in equity securities are valued at the last sales price on the securities exchange or national securities market on which such securities are primarily traded. Securities listed on the National Market System for which market quotations are available are valued at the official closing price or, if there is no official closing price that day, at the last sales price. For open short positions, asked prices are used for valuation purposes. Bid price is used when no asked price is available. Registered investment companies that are not traded on an exchange are valued at their net asset value. All of the preceding securities are generally categorized within Level 1 of the fair value hierarchy.
Securities not listed on an exchange or the national securities market, or securities for which there were no transactions, are valued at the average of the most recent bid and asked prices. These securities are generally categorized within Level 2 of the fair value hierarchy.
Fair valuing of securities may be determined with the assistance of a pricing service using calculations based on indices of domestic securities and other appropriate indicators, such as prices of relevant ADRs and futures. Utilizing these techniques may result in transfers between Level 1 and Level 2 of the fair value hierarchy.
When market quotations or official closing prices are not readily available, or are determined not to accurately reflect fair value, such as when the value of a security has been significantly affected by events after the close of the exchange or market on which the security is principally traded (for
31
NOTES TO FINANCIAL STATEMENTS(continued)
example, a foreign exchange or market), but before the fund calculates its net asset value, the fund may value these investments at fair value as determined in accordance with the procedures approved by the Board. Certain factors may be considered when fair valuing investments such as: fundamental analytical data, the nature and duration of restrictions on disposition, an evaluation of the forces that influence the market in which the securities are purchased and sold, and public trading in similar securities of the issuer or comparable issuers. These securities are either categorized within Level 2 or 3 of the fair value hierarchy depending on the relevant inputs used.
For restricted securities where observable inputs are limited, assumptions about market activity and risk are used and such securities are generally categorized within Level 3 of the fair value hierarchy.
The following is a summary of the inputs used as of November 30, 2019in valuing the fund’s investments:
Level 1 – Unadjusted | Level 2 - Other Significant Observable Inputs | Level 3 -Significant Unobservable Inputs | Total | |
Assets ($) | ||||
Investments in Securities:† | ||||
Equity Securities - Common Stocks | 583,210,085 | - | - | 583,210,085 |
Exchange-Traded Funds | 1,941,240 | - | - | 1,941,240 |
Investment Companies | 26,297,884 | - | - | 26,297,884 |
† See Statement of Investments for additional detailed categorizations, if any.
(b)Securities transactions and investment income: Securities transactions are recorded on a trade date basis. Realized gains and losses from securities transactions are recorded on the identified cost basis. Dividend income is recognized on the ex-dividend date and interest income, including, where applicable, accretion of discount and amortization of premium on investments, is recognized on the accrual basis.
Pursuant to a securities lending agreement with The Bank of New York Mellon, a subsidiary of BNY Mellon and an affiliate of the Adviser, the fund may lend securities to qualified institutions. It is the fund’s policy that, at origination, all loans are secured by collateral of at least 102% of the value of U.S. securities loaned and 105% of the value of foreign securities loaned. Collateral equivalent to at least 100% of the market value
32
of securities on loan is maintained at all times. Collateral is either in the form of cash, which can be invested in certain money market mutual funds managed by the Adviser, or U.S. Government and Agency securities. The fund is entitled to receive all dividends, interest and distributions on securities loaned, in addition to income earned as a result of the lending transaction. Should a borrower fail to return the securities in a timely manner, The Bank of New York Mellon is required to replace the securities for the benefit of the fund or credit the fund with the market value of the unreturned securities and is subrogated to the fund’s rights against the borrower and the collateral. Additionally, the contractual maturity of security lending transactions are on an overnight and continuous basis. During the period ended November 30, 2019, The Bank of New York Mellon earned $34,590 from the lending of the fund’s portfolio securities, pursuant to the securities lending agreement.
(c) Affiliated issuers: Investments in other investment companies advised by the Adviser are considered “affiliated” under the Act.
(d) Dividends and distributions to shareholders: Dividends and distributions are recorded on the ex-dividend date. Dividends from investment income-net and dividends from net realized capital gains, if any, are normally declared and paid annually, but the fund may make distributions on a more frequent basis to comply with the distribution requirements of the Internal Revenue Code of 1986, as amended (the “Code”). To the extent that net realized capital gains can be offset by capital loss carryovers, it is the policy of the fund not to distribute such gains. Income and capital gain distributions are determined in accordance with income tax regulations, which may differ from GAAP.
(e) Federal income taxes: It is the policy of the fund to continue to qualify as a regulated investment company, if such qualification is in the best interests of its shareholders, by complying with the applicable provisions of the Code, and to make distributions of taxable income and net realized capital gain sufficient to relieve it from substantially all federal income and excise taxes.
As of and during the period ended November 30, 2019, the fund did not have any liabilities for any uncertain tax positions. The fund recognizes interest and penalties, if any, related to uncertain tax positions as income tax expense in the Statement of Operations. During the period ended November 30, 2019, the fund did not incur any interest or penalties.
Each tax year in the four-year period ended November 30, 2019 remains subject to examination by the Internal Revenue Service and state taxing authorities.
33
NOTES TO FINANCIAL STATEMENTS(continued)
At November 30, 2019, the components of accumulated earnings on a tax basis were as follows: undistributed ordinary income $2,900,436, undistributed capital gains $11,020,258 and unrealized appreciation $107,073,675.
The tax character of distributions paid to shareholders during the fiscal periods ended November 30, 2019 and November 30, 2018 were as follows: ordinary income $11,977,345 and $12,740,954, and long-term capital gains $69,130,064 and $43,170,079, respectively.
(f) New Accounting Pronouncements: Effective June 1, 2019, the fund adopted Accounting Standards Update 2018-13, Fair Value Measurement (Topic 820): Disclosure Framework—Changes to the Disclosure Requirements for Fair Value Measurement (“ASU 2018-13”). The update provides guidance that eliminates, adds and modifies certain disclosure requirements for fair value measurements. The adoption of ASU 2018-13 had no impact on the operations of the fund for the period ended November 30, 2019.
NOTE 2—Bank Lines of Credit:
The fund participates with other long-term open-end funds managed by the Adviser in a $1.030 billion unsecured credit facility led by Citibank, N.A. (the “Citibank Credit Facility”) and a $300 million unsecured credit facility provided by The Bank of New York Mellon (the “BNYM Credit Facility”), each to be utilized primarily for temporary or emergency purposes, including the financing of redemptions (each, a “Facility”). The Citibank Credit Facility is available in two tranches: (i) Tranche A is in an amount equal to $830 million and is available to all long-term open-ended funds, including the fund, and (ii) Tranche B is in amount equal to $200 million and is available only to BNY Mellon Floating Rate Income Fund, a series of BNY Mellon Investment Funds IV, Inc. In connection therewith, the fund has agreed to pay its pro rata portion of commitment fees for Tranche A of the Citibank Credit Facility and the BNYM Credit Facility. Interest is charged to the fund based on rates determined pursuant to the terms of the respective Facility at the time of borrowing. During the period ended November 30, 2019, the fund did not borrow under the Facilities.
NOTE 3—Management Fee, Sub-Investment Advisory Fee and Other Transactions with Affiliates:
(a)Pursuant to a management agreement with the Adviser, the management fee is computed at the annual rate of .90% of the value of the fund’s average daily net assets and is payable monthly. The Adviser has contractually agreed, from December 1, 2018 through March 29, 2020, to waive receipt of its fees and/or assume the direct expenses of the fund, so
34
that the direct expenses of none of the classes (excluding Rule 12b-1 Distribution Plan fees, Shareholder Services Plan fees, taxes, interest expense, brokerage commissions, commitment fees on borrowings and extraordinary expenses) exceed 1.05% of the value of the fund’s average daily net assets. On or after March 29, 2020, the Adviser may terminate this expense limitation at any time. The reduction in expenses, pursuant to the undertakings, amounted to $1,137 during the period ended November 30, 2019.
Pursuant to separate sub-investment advisory agreements between the Adviser and Walthausen, Neuberger Berman, Kayne, Channing and Eastern Shore, each serves as the fund’s sub-investment adviser responsible for the day-to-day management of a portion of the fund’s portfolio. The Adviser pays each sub-investment adviser a monthly fee at an annual percentage of the value of the fund’s average daily net assets. The Adviser has obtained an exemptive order from the SEC (the “Order”), upon which the fund may rely, to use a manager of managers approach that permits the Adviser, subject to certain conditions and approval by the Board, to enter into and materially amend sub-investment advisory agreements with one or more sub-investment advisers who are either unaffiliated with the Adviser or are wholly-owned subsidiaries (as defined under the Act) of the Adviser’s ultimate parent company, BNY Mellon, without obtaining shareholder approval. The Order also allows the fund to disclose the sub-investment advisory fee paid by the Adviser to any unaffiliated sub-investment adviser in the aggregate with other unaffiliated sub-investment advisers in documents filed with the SEC and provided to shareholders. In addition, pursuant to the Order, it is not necessary to disclose the sub-investment advisory fee payable by the Adviser separately to a sub-investment adviser that is a wholly-owned subsidiary of BNY Mellon in documents filed with the SEC and provided to shareholders; such fees are to be aggregated with fees payable to the Adviser. The Adviser has ultimate responsibility (subject to oversight by the Board) to supervise any sub-investment adviser and recommend the hiring, termination, and replacement of any sub-investment adviser to the Board.
(b) Under the Distribution Plan adopted pursuant to Rule 12b-1 under the Act, Class C shares pay the Distributor for distributing its shares at an annual rate of .75% of the value of its average daily net assets. During the period ended November 30, 2019, Class C shares were charged $3,809 pursuant to the Distribution Plan.
(c)Under the Shareholder Services Plan, Class A and Class C shares pay the Distributor at an annual rate of .25% of the value of their average daily net assets for the provision of certain services. The services provided may
35
NOTES TO FINANCIAL STATEMENTS(continued)
include personal services relating to shareholder accounts, such as answering shareholder inquiries regarding the fund and providing reports and other information, and services related to the maintenance of shareholder accounts. The Distributor may make payments to Service Agents (securities dealers, financial institutions or other industry professionals) with respect to these services. The Distributor determines the amounts to be paid to Service Agents. During the period ended November 30, 2019, Class A and Class C shares were charged $2,571and $1,270, respectively, pursuant to the Shareholder Services Plan.
The fund has an arrangement with the transfer agent whereby the fund may receive earnings credits when positive cash balances are maintained, which are used to offset transfer agency fees. The fund had an arrangement with the custodian to receive earnings credits when positive cash balances were maintained, which were used to offset custody fees. Effective February 1, 2019, the arrangement with the custodian changed whereby the fund will no longer receive earnings credits to offset its custody fees and will receive interest income or overdraft fees going forward. For financial reporting purposes, the fund includes net earnings credits, if any, as an expense offset in the Statement of Operations.
The fund compensates BNY Mellon Transfer, Inc., a wholly-owned subsidiary of the Adviser, under a transfer agency agreement for providing transfer agency and cash management services for the fund. The majority of transfer agency fees are comprised of amounts paid on a per account basis, while cash management fees are related to fund subscriptions and redemptions. During the period ended November 30, 2019, the fund was charged $4,988 for transfer agency services. These fees are included in Shareholder servicing costs in the Statement of Operations.
The fund compensates The Bank of New York Mellon under a custody agreement for providing custodial services for the fund. These fees are determined based on net assets, geographic region and transaction activity. During the period ended November 30, 2019, the fund was charged $34,030 pursuant to the custody agreement.
During the period ended November 30, 2019, the fund was charged $23,318 for services performed by the Chief Compliance Officer and his staff. These fees are included in Miscellaneous in the Statement of Operations.
The components of “Due to BNY Mellon Investment Adviser, Inc. and affiliates” in the Statement of Assets and Liabilities consist of: management fees of $440,898, Distribution Plan fees of $258, Shareholder Services Plan fees of $314, Custodian fees of $12,800, Chief Compliance Officer fees of
36
$4,348 and transfer agency fees of $914, which are offset against an expense reimbursement currently in effect in the amount of $100.
(d) Each Board member also serves as a Board member of other funds in the BNY Mellon Family of Funds complex. Annual retainer fees and attendance fees are allocated to each fund based on net assets.
NOTE 4—Securities Transactions:
The aggregate amount of purchases and sales of investment securities, excluding short-term securities, during the period ended November 30, 2019, amounted to $348,199,646 and $549,478,744, respectively.
At November 30, 2019, the cost of investments for federal income tax purposes was $504,375,534; accordingly, accumulated net unrealized appreciation on investments was $107,073,675, consisting of $143,320,676 gross unrealized appreciation and $36,247,001 gross unrealized depreciation.
37
REPORT OF INDEPENDENT REGISTERED PUBLIC ACCOUNTING FIRM
To the Shareholders and the Board of Directors of BNY Mellon Select Managers Small Cap Value Fund (formerly, Dreyfus Select Managers Small Cap Value Fund)
Opinion on the Financial Statements
We have audited the accompanying statement of assets and liabilities of BNY Mellon Select Managers Small Cap Value Fund (the “Fund”) (formerly, Dreyfus Select Managers Small Cap Value Fund) (one of the funds constituting BNY Mellon Strategic Funds, Inc.), including the statements of investments and investments in affiliated issuers, as of November 30, 2019, and the related statement of operations for the year then ended, the statements of changes in net assets for each of the two years in the period then ended, the financial highlights for each of the five years in the period then ended and the related notes (collectively referred to as the “financial statements”). In our opinion, the financial statements present fairly, in all material respects, the financial position of the Fund (one of the funds constituting BNY Mellon Strategic Funds, Inc.) at November 30, 2019, the results of its operations for the year then ended, the changes in its net assets for each of the two years in the period then ended and its financial highlights for each of the five years in the period then ended, in conformity with U.S. generally accepted accounting principles.
Basis for Opinion
These financial statements are the responsibility of the Fund’s management. Our responsibility is to express an opinion on the Fund’s financial statements based on our audits. We are a public accounting firm registered with the Public Company Accounting Oversight Board (United States) (“PCAOB”) and are required to be independent with respect to the Fund in accordance with the U.S. federal securities laws and the applicable rules and regulations of the Securities and Exchange Commission and the PCAOB.
We conducted our audits in accordance with the standards of the PCAOB. Those standards require that we plan and perform the audit to obtain reasonable assurance about whether the financial statements are free of material misstatement, whether due to error or fraud. The Fund is not required to have, nor were we engaged to perform, an audit of the Fund’s internal control over financial reporting. As part of our audits, we are required to obtain an understanding of internal control over financial reporting, but not for the purpose of expressing an opinion on the effectiveness of the Fund’s internal control over financial reporting. Accordingly, we express no such opinion.
Our audits included performing procedures to assess the risks of material misstatement of the financial statements, whether due to error or fraud, and performing procedures that respond to those risks. Such procedures included examining, on a test basis, evidence regarding the amounts and disclosures in the financial statements. Our procedures included confirmation of securities owned as of November 30, 2019, by correspondence with the custodian and others or by other appropriate auditing procedures where replies from others were not received. Our audits also included evaluating the accounting principles used and significant estimates made by management, as well as evaluating the overall presentation of the financial statements. We believe that our audits provide a reasonable basis for our opinion.

We have served as the auditor of one or more investment companies in the BNY Mellon Family of Funds since at least 1957, but we are unable to determine the specific year.
New York, New York
January 28, 2020
38
IMPORTANT TAX INFORMATION(Unaudited)
For federal tax purposes the fund hereby reports 89.49% of the ordinary dividends paid during the fiscal year ended November 30, 2019 as qualifying for the corporate dividends received deduction. Also certain dividends paid by the fund may be subject to a maximum tax rate of 15%, as provided for by the Jobs and Growth Tax Relief Reconciliation Act of 2003. Of the distributions paid during the fiscal year, $9,574,491 represents the maximum amount that may be considered qualified dividend income. Shareholders will receive notification in early 2020 of the percentage applicable to the preparation of their 2019 income tax returns. Also, the fund hereby reports $.3078 per share as a short-term capital gain distribution and $2.3635 per share as a long-term capital gain distribution paid on December 31, 2018.
39
INFORMATION ABOUT THE RENEWAL OF THE FUND’S MANAGEMENT AND SUB-INVESTMENT ADVISORY AGREEMENTS (Unaudited)
At a meeting of the fund’s Board of Directors held on November 5, 2019, the Board considered the renewalof (a) the fund’s Management Agreement, pursuant to which the Adviser provides the fund with investment management and administrative services and is responsible for evaluating and recommending subadvisers to provide the fund with day-to-day portfolio management services, recommending the percentage of fund assets to be allocated to each subadviser, monitoring and evaluating the performance of the subadvisers, and recommending whether a subadviser should be terminated (the “Agreement”) and (b) the Adviser’s separate Sub-Investment Advisory Agreements with each of Channing Capital Management, LLC, Eastern Shore Capital Management, Kayne Anderson Rudnick Investment Management, LLC, Neuberger Berman Investment Advisers LLC and Walthausen & Co., LLC (each, a “Subadviser” and collectively, the “Subadvisers”), pursuant to which each Subadviser serves as a sub-investment adviser and provides day-to-day management of the fund’s investments with respect to the portion of the fund’s assets allocated to the Subadviser. The Board members, a majority of whom are not “interested persons” (as defined in the Investment Company Act of 1940, as amended) of the fund, were assisted in their review by independent legal counsel and met with counsel in executive session separate from representatives of the Adviser and the Subadvisers. In considering the renewal of the Agreements, the Board considered several factors that it believed to be relevant, including those discussed below. The Board did not identify any one factor as dispositive, and each Board member may have attributed different weights to the factors considered.
Analysis of Nature, Extent, and Quality of Services Provided to the Fund. The Board considered information provided to it at the meeting and in previous presentations from representatives of the Adviser regarding the nature, extent, and quality of the services provided to funds in the BNY Mellon fund complex, including the fund. The Adviser provided the number of open accounts in the fund, the fund’s asset size and the allocation of fund assets among distribution channels. The Adviser also had previously provided information regarding the diverse intermediary relationships and distribution channels of funds in the BNY Mellon fund complex (such as retail direct or intermediary, in which intermediaries typically are paid by the fund and/or the Adviser) and the Adviser’s corresponding need for broad, deep, and diverse resources to be able to provide ongoing shareholder services to each intermediary or distribution channel, as applicable to the fund.
The Board also considered research support available to, and portfolio management capabilities of, the fund’s portfolio management personnel and that the Adviser also provides oversight of day-to-day fund operations, including fund accounting and administration and assistance in meeting legal and regulatory requirements. The Board also considered the Adviser’s extensive administrative, accounting and compliance infrastructures, as well as the Adviser’s supervisory, evaluation and other responsibilities in respect of the Subadvisers. As part of its review, the Board considered information regarding the process by which the Adviser selected and recommended the Subadvisers
40
for Board approval. The Board considered each Subadviser’s specific responsibilities in the day-to-day management of the portion of the fund’s assets allocated to it, as well as the qualifications, experience and responsibilities of the persons serving as the portfolio managers for the segment of the fund’s assets managed by the respective Subadviser, and other key personnel at the Subadviser. The Board specifically took into account each Subadviser’s investment process and capabilities, evaluating how the Subadviser complemented each of the other Subadvisers to the fund, noting theAdviser’s favorable assessment of the nature and quality of the sub-advisory services provided to the fund by the Subadvisers.The Board also considered portfolio management’s brokerage policies and practices (including policies and practices regarding soft dollars) and the standards applied in seeking best execution.
Comparative Analysis of the Fund’s Performance and Management Fee and Expense Ratio. The Board reviewed reports prepared by Broadridge Financial Solutions, Inc. (“Broadridge”), an independent provider of investment company data, which included information comparing (1) the fund’s performance with the performance of a group of small-cap core funds (the “Performance Group”) and with a broader group of funds consisting of all retail and institutional small-cap core funds (the “Performance Universe”), all for various periods ended September 30, 2019, and (2) the fund’s actual and contractual management fees and total expenses with those of the same group of funds in the Performance Group (the “Expense Group”) and with a broader group of funds consisting of all institutional small-cap core funds, excluding outliers (the “Expense Universe”), the information for which was derived in part from fund financial statements available to Broadridge as of the date of its analysis. The Adviser previously had furnished the Board with a description of the methodology Broadridge used to select the Performance Group and Performance Universe and the Expense Group and Expense Universe. The Board also reviewed performance information provided by the Adviser with respect to each Subadviser for various periods ended September 30, 2019.
Representatives of the Adviser stated that the usefulness of performance comparisons may be affected by a number of factors, including different investment limitations and policies that may be applicable to the fund and comparison funds, noting that the funds included in the Performance Group and Performance Universe were not limited to funds that engage multiple subadvisers like the fund, nor did they include only funds that use a value-style of investing. The Board discussed with representatives of the Adviser the results of the comparisons and considered that the fund’s total return performance was below the Performance Group median for all periods, except for the three- and four-year periods when performance was above and at the Performance Group median, respectively, and was below the Performance Universe median for all periods, except for the three-year period when performance was above the Performance Group median. The Board considered the relative proximity of the fund’s performance to the Performance Group and/or Performance Universe median in certain periods when performance was below median. The Adviser also provided a comparison of the fund’s calendar year total returns to the returns of the fund’s benchmark index, and it was noted that the fund’s returns were above the returns of the index in six of the ten calendar years shown. With respect to the performance of each Subadviser, the Board
41
INFORMATION ABOUT THE RENEWAL OF THE FUND’S MANAGEMENT AND SUB-INVESTMENT ADVISORY AGREEMENTS (Unaudited) (continued)
noted that, depending on the period under review, some Subadvisers outperformed, while others underperformed, the fund’s benchmark index and/or the median performance of the funds in the Performance Group and Performance Universe.
The Board reviewed and considered the contractual management fee rate paid by the fund to the Adviser over the fund’s last fiscal year in light of the nature, extent and quality of the management and sub-advisory services provided by the Adviser and the Subadvisers, respectively. The Board noted that the compensation paid to the Subadvisers is paid by the Adviser (out of its fee from the fund), not the fund, and, accordingly, that the retention of the Subadvisers does not increase the fees or expenses otherwise incurred by the fund and its shareholders.
The Board also reviewed the range of actual and contractual management fees and total expenses as a percentage of average net assets of the Expense Group and Expense Universe funds and discussed the results of the comparisons. It was noted that, as in the case of the funds included in the Performance Group and Performance Universe, the funds included in the Expense Group and Expense Universe were not limited to funds that engage multiple subadvisers like the fund. The Board considered that the fund’s contractual management fee was higher than the Expense Group contractual management fee median and higher than the Expense Group and Expense Universe actual management fee medians, and that the fund’s total expenses were higher than the Expense Group median and approximately equal to the Expense Universe median.
Representatives of the Adviser stated that the Adviser has contractually agreed, until March 29, 2020, to waive receipt of its fees and/or assume the direct expenses of the fund so that the direct expenses of none of its classes (excluding Rule 12b-1 fees, shareholder services fees, taxes, interest, brokerage commissions, commitment fees on borrowings and extraordinary expenses) exceed 1.05% of the fund’s average daily net assets.
Representatives of the Adviser reviewed with the Board the management or investment advisory fees (1) paid by funds advised or administered by the Adviser that are in the same Lipper category as the fund and (2) paid to the Adviser or the Subadvisers or their affiliates for advising any separate accounts and/or other types of client portfolios that are considered to have similar investment strategies and policies as the fund (the “Similar Clients”), and explained the nature of the Similar Clients. They discussed differences in fees paid and the relationship of the fees paid in light of any differences in the services provided and other relevant factors. The Board considered the relevance of the fee information provided for the Similar Clients to evaluate the appropriateness of the fund’s management fee.
Analysis of Profitability and Economies of Scale. Representatives of the Adviser reviewed the expenses allocated and profit received by the Adviser and its affiliates and the resulting profitability percentage for managing the fund and the aggregate profitability percentage to the Adviser and its affiliates for managing the funds in the BNY Mellon fund complex, and the method used to determine the expenses and profit. The Board concluded that the profitability results were not excessive, given the services
42
rendered and service levels provided by the Adviser and its affiliates. The Board also had been provided with information prepared by an independent consulting firm regarding the Adviser’s approach to allocating costs to, and determining the profitability of, individual funds and the entire BNY Mellon fund complex. The consulting firm also had analyzed where any economies of scale might emerge in connection with the management of a fund.
The Board considered on the advice of its counsel the profitability analysis (1) as part of its evaluation of whether the fees under the Agreements, considered in relation to the mix of services provided by the Adviser and the Subadvisers, including the nature, extent and quality of such services, supported the renewal of the Agreements and (2) in light of the relevant circumstances for the fund and the extent to which economies of scale would be realized if the fund grows and whether fee levels reflect these economies of scale for the benefit of fund shareholders. Since the Adviser, and not the fund, pays the Subadvisers pursuant to the respective Sub-Investment Advisory Agreements, the Board did not consider any Subadviser’s profitability to be relevant to its deliberations. Representatives of the Adviser also stated that, as a result of shared and allocated costs among funds in the BNY Mellon fund complex, the extent of economies of scale could depend substantially on the level of assets in the complex as a whole, so that increases and decreases in complex-wide assets can affect potential economies of scale in a manner that is disproportionate to, or even in the opposite direction from, changes in the fund’s asset level. The Board also considered potential benefits to the Adviser and each Subadviser from acting as investment adviser and sub-investment adviser, respectively, and took into consideration the soft dollar arrangements in effect for trading the fund’s investments.
At the conclusion of these discussions, the Board agreed that it had been furnished with sufficient information to make an informed business decision with respect to the renewal of the Agreements. Based on the discussions and considerations as described above, the Board concluded and determined as follows.
· The Board concluded that the nature, extent, and quality of the services provided by the Adviser and the Subadvisers are adequate and appropriate.
· The Board was generally satisfied with the manner in which the Advisermonitors and evaluates the performance of each Subadviser and directed the Adviser to closely monitor those Subadvisers that underperformed thefund’s benchmark index for extended periods and report the results of its evaluation to the Board at a future meeting.
· The Board concluded that the fees paid to the Adviser and the Subadvisers continued to be appropriate under the circumstances and in light of the factors and the totality of the services provided as discussed above.
43
INFORMATION ABOUT THE RENEWAL OF THE FUND’S MANAGEMENT AND SUB-INVESTMENT ADVISORY AGREEMENTS (Unaudited) (continued)
· The Board determined that the economies of scale which may accrue to the Adviser and its affiliates in connection with the management of the fund had been adequately considered by the Adviser in connection with the fee rate charged to the fund pursuant to the Agreement and that, to the extent in the future it were determined that material economies of scale had not been shared with the fund, the Board would seek to have those economies of scale shared with the fund.
In evaluating the Agreements, the Board considered these conclusions and determinations and also relied on its previous knowledge, gained through meetings and other interactions with the Adviser and its affiliates, and the Subadvisers, of the Adviser and the Subadvisers and the services provided to the fund by the Adviser and the Subadvisers. The Board also relied on information received on a routine and regular basis throughout the year relating to the operations of the fund and the investment management and other services provided under the Agreements, including information on the investment performance of the fund in comparison to similar mutual funds and benchmark performance indices; general market outlook as applicable to the fund; and compliance reports. In addition, the Board’s consideration of the contractual fee arrangements for this fund had the benefit of a number of years of reviews of the Agreements for the fund, or substantially similar agreements for other BNY Mellon funds that the Board oversees, during which lengthy discussions took place between the Board and representatives of the Adviser. Certain aspects of the arrangements may receive greater scrutiny in some years than in others, and the Board’s conclusions may be based, in part, on their consideration of the fund’s arrangements, or substantially similar arrangements for other BNY Mellon funds that the Board oversees, in prior years. The Board also noted that the Adviser continued to believe that the Subadvisers complemented each other’s specific style of investing and that the Adviser recommended that the Board approve each Sub-Investment Advisory Agreement. The Board determined to renew the Agreements.
44
BOARD MEMBERS INFORMATION(Unaudited)
INDEPENDENT BOARD MEMBERS
Chairman of the Board (1995)
Principal Occupation During Past 5 Years:
· Corporate Director and Trustee (1995-Present)
Other Public Company Board Memberships During Past 5 Years:
· CBIZ, Inc., a public company providing professional business services, products and solutions,Director (1997-Present)
No. of Portfolios for which Board Member Serves:120
———————
Joni Evans (77)
Board Member (2006)
Principal Occupation During Past 5 Years:
· Chief Executive Officer, www.wowOwow.com, an online community dedicated to women’s conversations and publications (2007-Present)
· Principal, Joni Evans Ltd. (publishing) (2006-Present)
No. of Portfolios for which Board Member Serves:20
———————
Joan Gulley (72)
Board Member (2017)
Principal Occupation During Past 5 Years:
· PNC Financial Services Group, Inc.(1993-2014), Executive Vice President and Chief Human Resources Officer and Executive Committee Member (2008-2014)
· Director, Nantucket Library (2015-Present)
No. of Portfolios for which Board Member Serves:50
———————
Ehud Houminer (79)
Board Member (1994)
Principal Occupation During Past 5 Years:
· Board of Overseers at the Columbia Business School, Columbia
University (1992-Present)
Trustee, Ben Gurion University (2012-2018)
No. of Portfolios for which Board Member Serves: 50
———————
45
BOARD MEMBERS INFORMATION (Unaudited) (continued)
INDEPENDENT BOARD MEMBERS (continued)
Alan H. Howard (60)
Board Member (2018)
Principal Occupation During Past 5 Years:
· Managing Partner of Heathcote Advisors LLC, a financial advisory services firm (2008 – Present)
· President of Dynatech/MPX Holdings LLC (2012 – 2019), a global supplier and service provider of military aircraft parts, including Board Member of two operating subsidiaries, Dynatech International LLC and Military Parts Exchange LLC (2012-2019); Chief Executive Officer of an operating subsidiary, Dynatech International LLC (2013 – 2019)
· Senior Advisor, Rossoff & Co., an independent investment banking firm (2013 – Present)
Other Public Company Board Memberships During Past 5 Years:
· Movado Group, Inc., a public company that designs, sources, markets and distributes watches,Director (1997-Present)
No. of Portfolios for which Board Member Serves:20
———————
Robin A. Melvin (56)
Board Member (1995)
Principal Occupation During Past 5 Years:
· Co-chairman, Mentor Illinois, a non-profit organization dedicated to increasing the quantity and quality of mentoring services in Illinois; (2014-Present; Board member (2013-Present)
No. of Portfolios for which Board Member Serves:97
———————
Burton N. Wallack (69)
Board Member (2006)
Principal Occupation During Past 5 Years:
President and Co-owner of Wallack Management Company, a real estate management company (1987-Present)
Mount Sinai Hospital Urology Board Member (2017-Present)
No. of Portfolios for which Board Member Serves:20
———————
46
Benaree Pratt Wiley (73)
Board Member (2016)
Principal Occupation During Past 5 Years:
· Principal, The Wiley Group, a firm specializing in strategy and business development (2005-Present)
Other Public Company Board Memberships During Past 5 Years:
· CBIZ, Inc., a public company providing professional business services, products and solutions,Director(2008-Present)
· Blue Cross Blue Shield of MassachusettsDirector (2004-Present)
No. of Portfolios for which Board Member Serves: 76
———————
47
BOARD MEMBERS INFORMATION (Unaudited) (continued)
INTERESTED BOARD MEMBER
Gordon J. Davis (78)
Board Member (2006)
Principal Occupation During Past 5 Years:
· Partner in the law firm of Venable LLP (2012-Present)
Other Public Company Board Memberships During Past 5 Years:
· Consolidated Edison, Inc., a utility company,Director (1989-2014)
· The Phoenix Companies, Inc., a life insurance company,Director (2000-2014)
No. of Portfolios for which Board Member Serves:54
Gordon J. Davis is deemed to be an “interested person” (as defined under the Act) of the Company as a result of his affiliation with Venable LLP, which provides legal services to the Company.
———————
Once elected all Board Members serve for an indefinite term, but achieve Emeritus status upon reaching age 80. The address of the Board Members and Officers is c/o BNY Mellon Investment Adviser, Inc. 240 Greenwich Street, New York, New York 10286. Additional information about the Board Members is available in the fund’s Statement of Additional Information which can be obtained from the Adviser free of charge by calling this toll free number: 1-800-373-9387.
William Hodding Carter III, Emeritus Board Member
Hans C. Mautner, Emeritus Board Member
48
OFFICERS OF THE FUND(Unaudited)
RENEE LAROCHE-MORRIS, President since May 2019.
President and a director of BNY Mellon Investment Adviser, Inc. since January 2018. She is an officer of 63 investment companies (comprised of 120 portfolios) managed by the Adviser. She is 48 years old and has been an employee of BNY Mellon since 2003.
JAMES WINDELS, Treasurer since November 2001.
Director- BNY Mellon Fund Administration, and an officer of 64 investment companies (comprised of 143 portfolios) managed by the Adviser. He is 61 years old and has been an employee of the Adviser since April 1985.
BENNETT A. MACDOUGALL, Chief Legal Officer since October 2015.
Chief Legal Officer of the Adviser and Associate General Counsel and Managing Director of BNY Mellon since June 2015; Director and Associate General Counsel of Deutsche Bank – Asset & Wealth Management Division from June 2005 to June 2015, and as Chief Legal Officer of Deutsche Investment Management Americas Inc. from June 2012 to May 2015. He is an officer of 64 investment companies (comprised of 143 portfolios) managed by the Adviser. He is 48 years old and has been an employee of the Adviser since June 2015.
DAVID DIPETRILLO, Vice President since May 2019.
Head of North America Product, BNY Mellon Investment Management since January 2018, Director of Product Strategy, BNY Mellon Investment Management from January 2016 to December 2017; Head of US Retail Product and Channel Marketing, BNY Mellon Investment Management from January 2014 to December 2015. He is an officer of 63 investment companies (comprised of 120 portfolios) managed by the Adviser. He is 41 years old and has been an employee of BNY Mellon since 2005.
JAMES BITETTO, Vice President since August 2005 and Secretary since February 2018.
Senior Managing Counsel of BNY Mellon since December 2019; Managing Counsel of BNY Mellon from April 2014 to December 2019; Secretary of the Adviser, and an officer of 64 investment companies (comprised of 143 portfolios) managed by the Adviser. He is 53 years old and has been an employee of the Adviser since December 1996.
SONALEE CROSS, Vice President and Assistant Secretary since March 2018.
Counsel of BNY Mellon since October 2016; Associate at Proskauer Rose LLP from April 2016 to September 2016; Attorney at EnTrust Capital from August 2015 to February 2016; Associate at Sidley Austin LLP from September 2013 to August 2015. She is an officer of 64 investment companies (comprised of 143 portfolios) managed by the Adviser. She is 32 years old and has been an employee of the Adviser since October 2016.
DEIRDRE CUNNANE, Vice President and Assistant Secretary since March 2019.
Counsel of BNY Mellon since August 2018; Senior Regulatory Specialist at BNY Mellon Investment Management Services from February 2016 to August 2018; Trustee Associate at BNY Mellon Trust Company (Ireland) Limited from August 2013 to February 2016. She is an officer of 64 investment companies (comprised of 143 portfolios) managed by the Adviser. She is 29 years old and has been an employee of the Adviser since August 2018.
SARAH S. KELLEHER, Vice President and Assistant Secretary since April 2014.
Managing Counsel of BNY Mellon since December 2017, Senior Counsel of BNY Mellon from March 2013 to December 2017. She is an officer of 64 investment companies (comprised of 143 portfolios) managed by the Adviser. She is 44 years old and has been an employee of the Adviser since March 2013.
JEFF PRUSNOFSKY, Vice President and Assistant Secretary since August 2005.
Senior Managing Counsel of BNY Mellon, and an officer of 64 investment companies (comprised of 143 portfolios) managed by the Adviser. He is 54 years old and has been an employee of the Adviser since October 1990.
PETER M. SULLIVAN, Vice President and Assistant Secretary since March 2019.
Managing Counsel of BNY Mellon, and an officer of 64 investment companies (comprised of 143 portfolios) managed by the Adviser. He is 51 years old and has been an employee of the Adviser since April 2004.
49
OFFICERS OF THE FUND (Unaudited)(continued)
NATALYA ZELENSKY, Vice President and Assistant Secretary since March 2017.
Managing Counsel of BNY Mellon since December 2019; Counsel of BNY Mellon from May 2016 to December 2019; Attorney at Wildermuth Endowment Strategy Fund/Wildermuth Advisory, LLC from November 2015 to May 2016 and Assistant General Counsel at RCS Advisory Services from July 2014 to November 2015. She is an officer of 64 investment companies (comprised of 143 portfolios) managed by the Adviser. She is 34 years old and has been an employee of the Adviser since May 2016.
GAVIN C. REILLY, Assistant Treasurer since December 2005.
Tax Manager - BNY Mellon Fund Administration, and an officer of 64 investment companies (comprised of 143 portfolios) managed by the Adviser. He is 51 years old and has been an employee of the Adviser since April 1991.
ROBERT S. ROBOL, Assistant Treasurer since August 2003.
Senior Accounting Manager- BNY Mellon Fund Administration, and an officer of 64 investment companies (comprised of 143 portfolios) managed by the Adviser. He is 55 years old and has been an employee of the Adviser since October 1988.
ROBERT SALVIOLO, Assistant Treasurer since May 2007.
Senior Accounting Manager – BNY Mellon Fund Administration, and an officer of 64 investment companies (comprised of 143 portfolios) managed by the Adviser. He is 52 years old and has been an employee of the Adviser since June 1989.
ROBERT SVAGNA, Assistant Treasurer since August 2005.
Senior Accounting Manager – BNY Mellon Fund Administration, and an officer of 64 investment companies (comprised of 143 portfolios) managed by the Adviser. He is 52 years old and has been an employee of the Adviser since November 1990.
JOSEPH W. CONNOLLY, Chief Compliance Officer since October 2004.
Chief Compliance Officer of the Adviser, the BNY Mellon Family of Funds and BNY Mellon Funds Trust (64 investment companies, comprised of 143 portfolios). He is 62 years old and has served in various capacities with the Adviser since 1980, including manager of the firm’s Fund Accounting Department from 1997 through October 2001.
CARIDAD M. CAROSELLA, Anti-Money Laundering Compliance Officer since January 2016.
Anti-Money Laundering Compliance Officer of the BNY Mellon Family of Funds and BNY Mellon Funds Trust since January 2016; from May 2015 to December 2015, Interim Anti-Money Laundering Compliance Officer of the BNY Mellon Family of Funds and BNY Mellon Funds Trust and the Distributor; from January 2012 to May 2015, AML Surveillance Officer of the Distributor. She is an officer of 57 investment companies (comprised of 136 portfolios) managed by the Adviser. She is 51 years old and has been an employee of the Distributor since 1997.
50
NOTES
51
NOTES
52
NOTES
53
BNY Mellon Select Managers Small Cap Value Fund
240 Greenwich Street
New York, NY 10286
Adviser
BNY Mellon Investment Adviser, Inc.
240 Greenwich Street
New York, NY 10286
Sub-Advisers
Walthausen & Co., LLC
9 Executive Park Drive, Suite B
Clifton Park, NY 12065
Neuberger Berman Investment Advisers, LLC
605 Third Avenue
New York, NY 10158
Kayne Anderson Rudnick Investment
Management, LLC
1800 Avenue of the Stars, Second Floor
Los Angeles, CA 90067
Channing Capital Management, LLC
10 South LaSalle Street
Suite 2401
Chicago, IL 60633
Eastern Shore Capital Management
18 Sewall Street
Marblehead, MA 01945
Custodian
The Bank of New York Mellon
240 Greenwich Street
New York, NY 10286
Transfer Agent &
Dividend Disbursing Agent
BNY Mellon Transfer, Inc.
240 Greenwich Street
New York, NY 10286
Distributor
BNY Mellon Securities Corporation
240 Greenwich Street
New York, NY 10286
Ticker Symbols: | Class A: DMVAX Class C: DMECX Class I: DMVIX Class Y: DMVYX |
TelephoneCall your financial representative or 1-800-373-9387
MailThe BNY Mellon Family of Funds, 144 Glenn Curtiss Boulevard, Uniondale, NY 11556-0144
E-mailSend your request toinfo@bnymellon.com
InternetInformation can be viewed online or downloaded atwww.bnymellonim.com/us
The fund files its complete schedule of portfolio holdings with the Securities and Exchange Commission (“SEC”) for the first and third quarters of each fiscal year on Form N-PORT. The fund’s Forms N-PORT are available on the SEC’s website atwww.sec.gov.
A description of the policies and procedures that the fund uses to determine how to vote proxies relating to portfolio securities and information regarding how the fund voted these proxies for the most recent 12-month period ended June 30 is available atwww.bnymellonim.com/usand on the SEC’s website atwww.sec.gov and without charge, upon request, by calling 1-800-373-9387.
© 2020 BNY Mellon Securities Corporation |
|

BNY Mellon U.S. Equity Fund
ANNUAL REPORT November 30, 2019 |
|

Save time. Save paper. View your next shareholder report online as soon as it’s available. Log into www.bnymellonim.com/us and sign up for eCommunications. It’s simple and only takes a few minutes. |
The views expressed in this report reflect those of the portfolio manager(s) only through the end of the period covered and do not necessarily represent the views of BNY Mellon Investment Adviser, Inc. or any other person in the BNY Mellon Investment Adviser, Inc. organization. Any such views are subject to change at any time based upon market or other conditions and BNY Mellon Investment Adviser, Inc. disclaims any responsibility to update such views. These views may not be relied on as investment advice and, because investment decisions for a fund in the BNY Mellon Family of Funds are based on numerous factors, may not be relied on as an indication of trading intent on behalf of any fund in the BNY Mellon Family of Funds. |
Not FDIC-Insured • Not Bank-Guaranteed • May Lose Value |
Contents
THE FUND
BNY Mellon Investment Adviser, Inc. | |
With Those of Other Funds | |
in Affiliated Issuers | |
Public Accounting Firm | |
the Fund’s Management and | |
Sub-Investment Advisory | |
Agreements | |
FOR MORE INFORMATION
Back Cover
| The Fund |
A LETTER FROM THE PRESIDENT OF BNY MELLON INVESTMENT ADVISER, INC.
Dear Shareholder:
We are pleased to present this annual report for BNY Mellon U.S. Equity Fund (formerly, Dreyfus U.S. Equity Fund), covering the 12-month period from December 1, 2018 through November 30, 2019. For information about how the fund performed during the reporting period, as well as general market perspectives, we provide a Discussion of Fund Performance on the pages that follow.
In December 2018, stocks experienced a sharp sell-off, as it appeared that the U.S. Federal Reserve (the “Fed”) would maintain its hawkish stance on monetary policy. In January 2019, a pivot in stance from the Fed helped stimulate a rebound across equity markets that continued into the second quarter. Escalating trade tensions disrupted equity markets again in May. The dip was short-lived, as markets rose once again in June and July of 2019, when a trade deal appeared more likely, and the pace of U.S. economic growth remained steady. Nevertheless, concerns over slowing global growth persisted, resulting in bouts of market volatility in August 2019. Stocks rebounded in September and continued an upward path through most of October 2019, supported in part by central bank policy and consistent consumer spending. Near the end of the period, an announcement by President Trump that the first phase of a trade deal with China had been achieved sent U.S. markets to record highs.
In fixed-income markets, a risk-off mentality prevailed to start the period, fueled in part by equity market volatility. A flight to quality supported price increases for U.S. Treasuries, which continued through the end of 2018, leading to a flattening yield curve. After the Fed’s supportive statements in January 2019, other developed-market central banks followed suit and reiterated their abilities to bolster flagging growth by continuing accommodative policies. After taking into account the 25-basis-point increase in December 2018, there was a net decrease of 50 basis points in the federal funds rate during the reporting period. Rates across much of the Treasury curve saw a slight increase during the month of November. However, demand for fixed-income instruments during much of the reporting period was strong, which helped to support positive bond market returns.
We believe that over the near term, the outlook for the U.S. remains positive, but we will monitor relevant data for any signs of a change. As always, we encourage you to discuss the risks and opportunities in today’s investment environment with your financial advisor.
Thank you for your continued confidence and support.
Sincerely,

Renee LaRoche-Morris
President
BNY Mellon Investment Adviser, Inc.
December 16, 2019
2
DISCUSSION OF FUND PERFORMANCE(Unaudited)
DISCUSSION OF FUND PERFORMANCE
For the period from December 1, 2018 through November 30, 2019, as provided by Charlie Macquaker, Roy Leckie and Jane Henderson, the three members of the Investment Executive at Walter Scott & Partners Limited (WS), Sub-Investment Adviser
Market and Fund Performance Overview
For the 12-month period ended November 30, 2019, the BNY Mellon U.S. Equity Fund (formerly Dreyfus U.S. Equity Fund) Class A shares achieved a return of 13.77%, Class C shares returned 12.92%, Class I shares returned 14.17% and Class Y shares returned 14.15%.1 In comparison, the fund’s benchmark, the MSCI USA Index (the “Index”), achieved a return of 15.69% over the same period.2
U.S. equities advanced despite pockets of volatility during the reporting period, bolstered by supportive central bank policies. The fund trailed the Index for the period, due primarily to stock selection within the information technology and industrials sectors.
The Fund’s Investment Approach
The fund seeks long-term total return. To pursue its goal, the fund normally invests at least 80% of its net assets, plus any borrowings for investment purposes, in equity securities of companies located in the United States. The fund may invest in the securities of companies of any market capitalization. Walter Scott seeks investment opportunities in companies with fundamental strengths that indicate the potential for sustainable growth. Walter Scott focuses on individual stock selection, building the fund’s portfolio from the bottom up through extensive fundamental research. The investment process begins with the screening of reported company financials. Companies that meet certain broad, absolute and trend criteria are candidates for more detailed financial analysis. The fund’s Investment Team collectively reviews and selects those stocks that meet Walter Scott’s criteria and where the expected growth rate is combined with a reasonable valuation for the underlying equity. Market capitalization and sector allocations are a residual of, not part of, the investment process, because the Investment Team’s sole focus is on the analysis of and investment in individual companies.
Markets Pivot on Central Bank and Trade Activity
During the fourth quarter of 2018, many equity markets felt pressure from slowing global growth, escalating trade issues between U.S. and China, Brexit difficulties and additional geopolitical issues elsewhere in Europe and the emerging markets. In December 2018, equities reached new lows for the year, as economic and political news continued to unnerve investors. Investors also feared the European Central Bank (ECB) would proceed with its plan to conclude stimulus measures in January, despite moderating growth rates.
January 2019 marked a turnaround in the markets. Talk of a potential trade deal between the U.S. and China helped fuel investor optimism, as equity prices recovered. The ECB announced it would provide additional stimulus to support the eurozone economy. China also announced plans to stoke its slowing economic growth rate. At its first meeting of the year, the Fed emphasized its focus on data as a primary driver for rate-hike decisions, and its ability to suspend additional rate increases when the data is not supportive. These sentiments
3
DISCUSSION OF FUND PERFORMANCE(Unaudited) (continued)
reassured investors of central bankers’ commitments to support flagging growth. The rebound continued throughout the month of January, and equity markets maintained an upward trajectory through April 2019. However, renewed trade tensions between the U.S. and China in May caused stocks to pull back once again. The dip was short-lived, as markets rose once again in June. At the end of Julyand again in September and October, the Fed cut the federal funds rate by 25 basis points.Supported by rate cuts, moderate economic growth and optimism regarding a preliminary trade agreement with China, equity markets went on to post solid gains the last several months of the period despite occasional pockets of volatility.
Stock Selection Drove Fund Results
Stock selection within the information technology, industrials and energy sectors detracted from relative returns. The top individual detractors included energy companiesOccidental Petroleum, Schlumberger and EOG Resources. EOG Resources and Schlumberger were hurt by shifts in oil prices during the period. Concerns regarding future demand for oil also continue to weigh on the industry as a whole.Occidental Petroleum saw its stock price drop after its acquisition of Anadarko Petroleum. This is a substantial acquisition forOccidental and entails a significant amount of integration risk. Furthermore, the high levels of debt required to finance the acquisition adds an additional element of risk. It is for these reasons that we decided to sell the position. We have closed our position inOccidental Petroleum. Pharmaceutical companyBiogenwas also among the top individual detractors. The company suffered a falling stock price during the period due to several factors including patent expirations and termination of trials on its Alzheimer’s medication. We have since exited the position. Industrials companyHealthcare Services Group was also sold during the period. The company experienced a declining stock price amid a class action lawsuit and reduced demand for its services.
Conversely, the fund saw positive results stemming from the success of our security selection within the consumer discretionary and materials sectors. Within the materials sector, chemical company FMC benefited results. Several information technology companies were also among the top individual contributors to portfolio performance, such as Manhattan Associates, Mastercard and Microsoft. Supply chain solutions company Manhattan Associates enjoyed solid earnings growth during the period and raised guidance for the year. Payment processing company Mastercard benefited from solid demand for its products, stemming from trends towards online purchasing and automation. Health care company Edwards Lifesciences was also among the top individual contributors to results. Its new treatment for aortic stenosis has had success in trials leading to a favorable outlook from investors.
Maintaining a Company-by-Company Approach
Although we do not manage the fund’s investments in response to macroeconomic trends, it is worth noting that while central banks are providing support, it appears as though economic growth rates around the globe may be slowing. We also believe the level of corporate leverage may be rising. We think that when slower growth and higher debt levels combine with reduced profit margins due to rising labor costs, it might begin to separate financially and fundamentally strong companies from the weaker organizations.
4
In that context, our focus remains very much unchanged. We shall continue to identify and invest in market-leading, financially robust companies with the strategic strengths and vision to generate meaningful returns over the long term. Our distinctly long-term lens allows us to focus on the underlying strengths and opportunities of a business. Not only does that approach mean we waste very little time trying to second-guess short-term market moves, but it ensures we are invested in companies that have the attributes we believe are needed to succeed regardless of the external environment in which they operate. We will continue to look for opportunities that benefit investors, capturing gains when the market rallies, and adding to fundamentally strong companies when the market pulls back.
December 16, 2019
1 Total return includes reinvestment of dividends and any capital gains paid and does not take into consideration the maximum initial sales charge in the case of Class A shares, or the applicable contingent deferred sales charge imposed on redemptions in the case of Class C shares. Share price and investment return fluctuate such that upon redemption, fund shares may be worth more or less than their original cost. Return figures for the fund reflect the absorption of certain fund expenses by BNY Mellon Investment Adviser, Inc. pursuant to an undertaking in effect through March 29, 2020, at which time it may be extended, terminated or modified. Had these expenses not been absorbed, the fund’s returns would have been lower. Past performance is no guarantee of future results.
2 Source: Lipper Inc. — The MSCI USA Index is designed to measure the performance of the large- and mid-cap segments of the U.S. market. It reflects reinvestment of net dividends and, where applicable, capital gain distributions. Investors cannot invest directly in any index.
Please note: the position in any security highlighted with italicized typeface was sold during the reporting period.
Equities are subject generally to market, market sector, market liquidity, issuer and investment style risks, among other factors, to varying degrees, all of which are more fully described in the fund’s prospectus.
5
FUND PERFORMANCE(Unaudited)
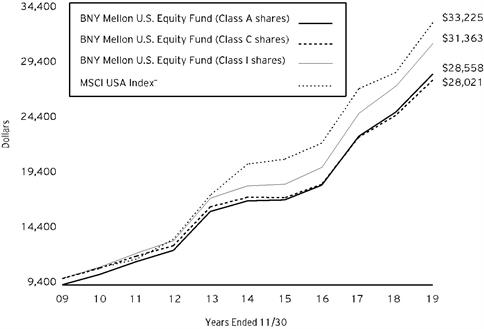
Comparison of change in value of a $10,000 investment in Class A shares, Class C shares and Class I shares of BNY Mellon U.S. Equity Fund with a hypothetical investment of $10,000 in the MSCI USA Index (the “Index”)
† Source: Lipper Inc.
Past performance is not predictive of future performance.
The above graph compares a hypothetical $10,000 investment made in Class A, Class C and Class I shares of BNY Mellon U.S. Equity Fund on 11/30/09 to a hypothetical investment of $10,000 made in the Index on that date. All dividends and capital gain distributions are reinvested.
The fund’s performance shown in the line graph above takes into account the maximum initial sales charge on Class A shares and all other applicable fees and expenses on all classes. The Index is designed to measure the performance of the large- and mid-cap segments of the U.S. market. Unlike a mutual fund, the Index is not subject to charges, fees and other expenses. Investors cannot invest directly in any index. Further information relating to fund performance, including expense reimbursements, if applicable, is contained in the Financial Highlights section of the prospectus and elsewhere in this report.
6
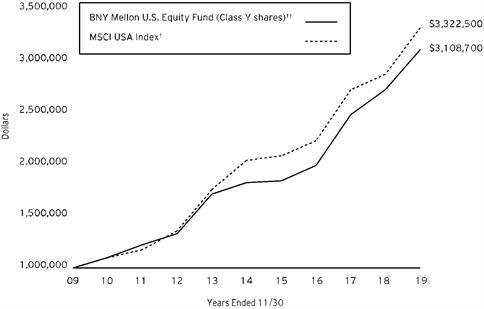
Comparison of change in value of a $1,000,000 investment in Class Y shares of BNY Mellon U.S. Equity Fund with a hypothetical investment of $1,000,000 in the MSCI USA Index (the “Index”)
† Source: Lipper Inc.
†† The total return figures presented for Class Y shares of the fund reflect the performance of the fund’s Class A shares for the period prior to 7/1/13 (the inception date for Class Y shares), not reflecting the applicable sales charges for Class A shares.
Past performance is not predictive of future performance.
The above graph compares a hypothetical $1,000,000 investment made in Class Y shares of BNY Mellon U.S. Equity Fund on 11/30/09 to a hypothetical investment of $1,000,000 made in the Index on that date. All dividends and capital gain distributions are reinvested.
The fund’s performance shown in the line graph above takes into account all other applicable fees and expenses of the fund’s Class Y shares. The Index is designed to measure the performance of the large- and mid-cap segments of the U.S. market. Unlike a mutual fund, the Index is not subject to charges, fees and other expenses. Investors cannot invest directly in any index. Further information relating to fund performance, including expense reimbursements, if applicable, is contained in the Financial Highlights section of the prospectus and elsewhere in this report.
7
FUND PERFORMANCE(Unaudited) (continued)
Average Annual Total Returnsas of 11/30/19 | ||||
| Inception | 1 Year | 5 Years | 10 Years |
Class A shares | ||||
with maximum sales charge (5.75 %) | 5/30/08 | 7.22% | 9.56% | 11.06% |
without sales charge | 5/30/08 | 13.77% | 10.87% | 11.72% |
Class C shares | ||||
with applicable redemption charge† | 5/30/08 | 11.92% | 10.03% | 10.85% |
without redemption | 5/30/08 | 12.92% | 10.03% | 10.85% |
Class I shares | 5/30/08 | 14.17% | 11.24% | 12.11% |
Class Y shares | 7/1/13 | 14.15% | 11.26% | 12.01%†† |
MSCI USA Index | 15.69% | 10.25% | 12.76% | |
† The maximum contingent deferred sales charge for Class C shares is 1% for shares redeemed within one year of the date of purchase.
†† The total return performance figures presented for Class Y shares of the fund reflect the performance of the fund’s Class A shares for the period prior to 7/1/13 (the inception date for Class Y shares), not reflecting the applicable sales charges for Class A shares.
The performance data quoted represents past performance, which is no guarantee of future results. Share price and investment return fluctuate and an investor’s shares may be worth more or less than original cost upon redemption. Current performance may be lower or higher than the performance quoted. Go to www.bnymellonim.com/us for the fund’s most recent month-end returns.
The fund’s performance shown in the graphs and table does not reflect the deduction of taxes that a shareholder would pay on fund distributions or the redemption of fund shares. In addition to the performance of Class A shares shown with and without a maximum sales charge, the fund’s performance shown in the table takes into account all other applicable fees and expenses on all classes.
8
UNDERSTANDING YOUR FUND’S EXPENSES(Unaudited)
As a mutual fund investor, you pay ongoing expenses, such as management fees and other expenses. Using the information below, you can estimate how these expenses affect your investment and compare them with the expenses of other funds. You also may pay one-time transaction expenses, including sales charges (loads) and redemption fees, which are not shown in this section and would have resulted in higher total expenses. For more information, see your fund’s prospectus or talk to your financial adviser.
Review your fund’s expenses
The table below shows the expenses you would have paid on a $1,000 investment in BNY Mellon U.S. Equity Fund from June 1, 2019 to November 30, 2019. It also shows how much a $1,000 investment would be worth at the close of the period, assuming actual returns and expenses.
Expenses and Value of a $1,000 Investment |
| |||||
Assume actual returns for the six months ended November 30, 2019 |
| |||||
|
|
|
|
|
|
|
|
| Class A | Class C | Class I | Class Y |
|
Expense paid per $1,000† | $6.13 | $10.10 | $4.37 | $4.27 |
| |
Ending value (after expenses) | $1,125.80 | $1,121.00 | $1,127.60 | $1,127.70 |
| |
COMPARING YOUR FUND’S EXPENSES
WITH THOSE OF OTHER FUNDS(Unaudited)
Using the SEC’s method to compare expenses
The Securities and Exchange Commission (“SEC”) has established guidelines to help investors assess fund expenses. Per these guidelines, the table below shows your fund’s expenses based on a $1,000 investment, assuming a hypothetical 5% annualized return. You can use this information to compare the ongoing expenses (but not transaction expenses or total cost) of investing in the fund with those of other funds. All mutual fund shareholder reports will provide this information to help you make this comparison. Please note that you cannot use this information to estimate your actual ending account balance and expenses paid during the period.
Expenses and Value of a $1,000 Investment |
| |||||
Assuming a hypothetical 5% annualized return for the six months ended November 30, 2019 |
| |||||
|
|
|
|
|
|
|
|
| Class A | Class C | Class I | Class Y |
|
Expense paid per $1,000† | $5.82 | $9.60 | $4.15 | $4.05 |
| |
Ending value (after expenses) | $1,019.30 | $1,015.54 | $1,020.96 | $1,021.06 |
| |
†Expenses are equal to the fund’s annualized expense ratio of 1.15% for Class A, 1.90% for Class C, .82% for Class I and .80% for Class Y, multiplied by the average account value over the period, multiplied by 183/365 (to reflect the one-half year period). | ||||||
9
STATEMENT OF INVESTMENTS
November 30, 2019
Description | Shares | Value ($) | |||||
Common Stocks - 99.0% | |||||||
Capital Goods - 9.8% | |||||||
Donaldson | 170,900 | a | 9,584,072 | ||||
Fastenal | 403,200 | a | 14,321,664 | ||||
Flowserve | 238,500 | 11,614,950 | |||||
Hexcel | 178,700 | 14,229,881 | |||||
The Toro Company | 174,200 | 13,618,956 | |||||
63,369,523 | |||||||
Consumer Durables & Apparel - 2.2% | |||||||
NIKE, Cl. B | 155,400 | 14,528,346 | |||||
Consumer Services - 3.9% | |||||||
McDonald's | 61,900 | 12,038,312 | |||||
Starbucks | 157,200 | 13,429,596 | |||||
25,467,908 | |||||||
Diversified Financials - 1.5% | |||||||
Intercontinental Exchange | 100,900 | 9,501,753 | |||||
Energy - 3.6% | |||||||
EOG Resources | 136,820 | 9,700,538 | |||||
Pioneer Natural Resources | 27,000 | 3,451,680 | |||||
Schlumberger | 287,850 | 10,420,170 | |||||
23,572,388 | |||||||
Health Care Equipment & Services - 12.9% | |||||||
Cerner | 217,900 | 15,599,461 | |||||
Edwards Lifesciences | 66,200 | b | 16,215,028 | ||||
Henry Schein | 186,200 | a,b | 12,829,180 | ||||
Intuitive Surgical | 22,100 | b | 13,103,090 | ||||
ResMed | 89,300 | 13,359,280 | |||||
Stryker | 59,500 | 12,189,170 | |||||
83,295,209 | |||||||
Household & Personal Products - 3.8% | |||||||
Colgate-Palmolive | 165,600 | 11,230,992 | |||||
The Estee Lauder Companies, Cl. A | 67,000 | 13,096,490 | |||||
24,327,482 | |||||||
Materials - 6.7% | |||||||
Ecolab | 66,200 | 12,357,554 | |||||
FMC | 162,500 | 15,918,500 | |||||
Linde | 74,400 | 15,342,024 | |||||
43,618,078 | |||||||
Media & Entertainment - 4.4% | |||||||
Alphabet, Cl. C | 11,206 | b | 14,623,382 | ||||
The Walt Disney Company | 91,500 | 13,869,570 | |||||
28,492,952 | |||||||
10
Description | Shares | Value ($) | |||||
Common Stocks - 99.0% (continued) | |||||||
Pharmaceuticals Biotechnology & Life Sciences - 8.6% | |||||||
Eli Lilly & Co. | 120,200 | 14,105,470 | |||||
Gilead Sciences | 133,300 | 8,963,092 | |||||
Johnson & Johnson | 84,100 | 11,562,909 | |||||
Mettler-Toledo International | 11,400 | b | 8,201,274 | ||||
Waters | 57,400 | b | 12,746,818 | ||||
55,579,563 | |||||||
Retailing - 9.1% | |||||||
Booking Holdings | 6,800 | b | 12,947,404 | ||||
Dollar General | 93,300 | 14,681,688 | |||||
O'Reilly Automotive | 35,100 | b | 15,524,028 | ||||
The TJX Companies | 259,800 | 15,881,574 | |||||
59,034,694 | |||||||
Software & Services - 20.8% | |||||||
Adobe | 50,600 | b | 15,662,218 | ||||
ANSYS | 31,300 | b | 7,971,797 | ||||
Automatic Data Processing | 73,300 | 12,518,174 | |||||
Cognizant Technology Solutions, Cl. A | 200,162 | 12,832,386 | |||||
Jack Henry & Associates | 67,600 | 10,271,144 | |||||
Manhattan Associates | 183,400 | a,b | 15,315,734 | ||||
Mastercard, Cl. A | 58,400 | 17,066,232 | |||||
Microsoft | 109,200 | 16,530,696 | |||||
Oracle | 241,900 | 13,580,266 | |||||
Paychex | 149,900 | 12,909,388 | |||||
134,658,035 | |||||||
Technology Hardware & Equipment - 9.9% | |||||||
Amphenol, Cl. A | 143,800 | 14,955,200 | |||||
Cisco Systems | 257,500 | 11,667,325 | |||||
Cognex | 239,700 | a | 12,028,146 | ||||
IPG Photonics | 76,900 | a,b | 10,926,721 | ||||
TE Connectivity | 155,200 | 14,388,592 | |||||
63,965,984 | |||||||
Transportation - 1.8% | |||||||
Expeditors International of Washington | 159,700 | 11,939,172 | |||||
Total Common Stocks(cost $361,598,374) | 641,351,087 | ||||||
1-Day | |||||||
Investment Companies - 1.0% | |||||||
Registered Investment Companies - 1.0% | |||||||
Dreyfus Institutional Preferred Government Plus Money Market Fund | 1.63 | 6,554,248 | c | 6,554,248 | |||
11
STATEMENT OF INVESTMENTS (continued)
Description | 1-Day | Shares | Value ($) | ||||
Investment of Cash Collateral for Securities Loaned - .0% | |||||||
Registered Investment Companies - .0% | |||||||
Dreyfus Institutional Preferred Government Plus Money Market Fund | 1.63 | 131,785 | c | 131,785 | |||
Total Investments(cost $368,284,407) | 100.0% | 648,037,120 | |||||
Cash and Receivables (Net) | .0% | 13,881 | |||||
Net Assets | 100.0% | 648,051,001 | |||||
a Security, or portion thereof, on loan. At November 30, 2019, the value of the fund’s securities on loan was $35,406,466 and the value of the collateral was $36,853,743, consisting of cash collateral of $131,785 and U.S. Government & Agency securities valued at $36,721,958.
b Non-income producing security.
c Investment in affiliated issuer. The investment objective of this investment company is publicly available and can be found within the investment company’s prospectus.
Portfolio Summary (Unaudited)† | Value (%) |
Information Technology | 30.7 |
Health Care | 21.4 |
Consumer Discretionary | 15.3 |
Industrials | 11.6 |
Materials | 6.7 |
Communication Services | 4.4 |
Consumer Staples | 3.8 |
Energy | 3.6 |
Financials | 1.5 |
Investment Companies | 1.0 |
100.0 |
† Based on net assets.
See notes to financial statements.
12
STATEMENT OF INVESTMENTS IN AFFILIATED ISSUERS
Investment Companies | Value | Purchases($) | Sales($) | Value | Net | Dividend/ |
Registered Investment Companies: | ||||||
Dreyfus Institutional Preferred Government Plus Money Market Fund | 9,587,340 | 135,337,941 | 138,371,033 | 6,554,248 | 1.0 | 337,451 |
Investment of Cash Collateral for Securities Loaned:† | ||||||
Dreyfus Institutional Preferred Government Money Market Fund, Institutional Shares | 4,646,934 | 2,193,423 | 6,840,357 | - | - | - |
Dreyfus Institutional Preferred Government Plus Money Market Fund | - | 19,311,018 | 19,179,233 | 131,785 | .0 | - |
Total | 14,234,274 | 156,842,382 | 164,390,623 | 6,686,033 | 1.0 | 337,451 |
† Effective January 2, 2019, cash collateral for securities lending was transferred from Dreyfus Institutional Preferred Government Money Market Fund, Institutional Shares to Dreyfus Institutional Preferred Government Plus Money Market Fund.
See notes to financial statements.
13
STATEMENT OF ASSETS AND LIABILITIES
November 30, 2019
|
|
|
|
|
|
|
|
|
| Cost |
| Value |
|
Assets ($): |
|
|
|
| ||
Investments in securities—See Statement of Investments |
|
|
| |||
Unaffiliated issuers | 361,598,374 |
| 641,351,087 |
| ||
Affiliated issuers |
| 6,686,033 |
| 6,686,033 |
| |
Dividends, interest and securities lending income receivable |
| 651,708 |
| |||
Receivable for shares of Common Stock subscribed |
| 10,000 |
| |||
Prepaid expenses |
|
|
|
| 25,125 |
|
|
|
|
|
| 648,723,953 |
|
Liabilities ($): |
|
|
|
| ||
Due to BNY Mellon Investment Adviser, Inc. and affiliates—Note 3(c) |
| 402,642 |
| |||
Liability for securities on loan—Note 1(b) |
| 131,785 |
| |||
Payable for investment securities purchased |
| 43,125 |
| |||
Payable for shares of Common Stock redeemed |
| 23,667 |
| |||
Directors’ fees and expenses payable |
| 10,577 |
| |||
Other accrued expenses |
|
|
|
| 61,156 |
|
|
|
|
|
| 672,952 |
|
Net Assets ($) |
|
| 648,051,001 |
| ||
Composition of Net Assets ($): |
|
|
|
| ||
Paid-in capital |
|
|
|
| 359,646,897 |
|
Total distributable earnings (loss) |
|
|
|
| 288,404,104 |
|
Net Assets ($) |
|
| 648,051,001 |
| ||
Net Asset Value Per Share | Class A | Class C | Class I | Class Y |
|
Net Assets ($) | 1,540,095 | 121,367 | 26,577,262 | 619,812,277 |
|
Shares Outstanding | 73,849 | 6,326.41 | 1,269,153 | 29,610,904 |
|
Net Asset Value Per Share ($) | 20.85 | 19.18 | 20.94 | 20.93 |
|
|
|
|
|
|
|
See notes to financial statements. |
|
|
|
|
|
14
STATEMENT OF OPERATIONS
Year Ended November 30, 2019
|
|
|
|
|
|
|
|
|
|
|
|
|
|
Investment Income ($): |
|
|
|
| ||
Income: |
|
|
|
| ||
Cash dividends: |
| |||||
Unaffiliated issuers |
|
| 7,444,265 |
| ||
Affiliated issuers |
|
| 337,451 |
| ||
Income from securities lending—Note 1(b) |
|
| 73,290 |
| ||
Total Income |
|
| 7,855,006 |
| ||
Expenses: |
|
|
|
| ||
Management fee—Note 3(a) |
|
| 4,378,814 |
| ||
Professional fees |
|
| 79,593 |
| ||
Registration fees |
|
| 67,625 |
| ||
Directors’ fees and expenses—Note 3(d) |
|
| 63,887 |
| ||
Loan commitment fees—Note 2 |
|
| 13,560 |
| ||
Shareholder servicing costs—Note 3(c) |
|
| 11,298 |
| ||
Custodian fees—Note 3(c) |
|
| 9,811 |
| ||
Prospectus and shareholders’ reports |
|
| 9,635 |
| ||
Distribution fees—Note 3(b) |
|
| 768 |
| ||
Interest expense—Note 2 |
|
| 674 |
| ||
Miscellaneous |
|
| 33,977 |
| ||
Total Expenses |
|
| 4,669,642 |
| ||
Less—reduction in expenses due to undertaking—Note 3(a) |
|
| (1,056) |
| ||
Net Expenses |
|
| 4,668,586 |
| ||
Investment Income—Net |
|
| 3,186,420 |
| ||
Realized and Unrealized Gain (Loss) on Investments—Note 4 ($): |
|
| ||||
Net realized gain (loss) on investments | 5,481,647 |
| ||||
Net change in unrealized appreciation (depreciation) on investments | 67,582,703 |
| ||||
Net Realized and Unrealized Gain (Loss) on Investments |
|
| 73,064,350 |
| ||
Net Increase in Net Assets Resulting from Operations |
| 76,250,770 |
| |||
|
|
|
|
|
|
|
See notes to financial statements. | ||||||
15
STATEMENT OF CHANGES IN NET ASSETS
|
|
|
| Year Ended November 30, | |||||
|
|
|
| 2019 |
| 2018 |
| ||
Operations ($): |
|
|
|
|
|
|
|
| |
Investment income—net |
|
| 3,186,420 |
|
|
| 2,891,782 |
| |
Net realized gain (loss) on investments |
| 5,481,647 |
|
|
| 49,619,802 |
| ||
Net change in unrealized appreciation |
| 67,582,703 |
|
|
| (1,641,630) |
| ||
Net Increase (Decrease) in Net Assets | 76,250,770 |
|
|
| 50,869,954 |
| |||
Distributions ($): |
| ||||||||
Distributions to shareholders: |
|
|
|
|
|
|
|
| |
Class A |
|
| (67,642) |
|
|
| (90,769) |
| |
Class C |
|
| (8,507) |
|
|
| (12,898) |
| |
Class I |
|
| (2,181,456) |
|
|
| (2,474,479) |
| |
Class Y |
|
| (50,264,664) |
|
|
| (57,283,211) |
| |
Total Distributions |
|
| (52,522,269) |
|
|
| (59,861,357) |
| |
Capital Stock Transactions ($): |
| ||||||||
Net proceeds from shares sold: |
|
|
|
|
|
|
|
| |
Class A |
|
| 778,691 |
|
|
| 109,475 |
| |
Class C |
|
| 33,836 |
|
|
| 10,387 |
| |
Class I |
|
| 8,273,620 |
|
|
| 12,447,070 |
| |
Class Y |
|
| 144,491,900 |
|
|
| 64,270,703 |
| |
Distributions reinvested: |
|
|
|
|
|
|
|
| |
Class A |
|
| 62,854 |
|
|
| 85,430 |
| |
Class C |
|
| 7,143 |
|
|
| 12,511 |
| |
Class I |
|
| 1,739,482 |
|
|
| 1,975,961 |
| |
Class Y |
|
| 26,580,083 |
|
|
| 29,437,437 |
| |
Cost of shares redeemed: |
|
|
|
|
|
|
|
| |
Class A |
|
| (168,876) |
|
|
| (231,056) |
| |
Class C |
|
| (7,690) |
|
|
| (70,392) |
| |
Class I |
|
| (7,040,861) |
|
|
| (12,202,578) |
| |
Class Y |
|
| (108,285,700) |
|
|
| (78,202,063) |
| |
Increase (Decrease) in Net Assets | 66,464,482 |
|
|
| 17,642,885 |
| |||
Total Increase (Decrease) in Net Assets | 90,192,983 |
|
|
| 8,651,482 |
| |||
Net Assets ($): |
| ||||||||
Beginning of Period |
|
| 557,858,018 |
|
|
| 549,206,536 |
| |
End of Period |
|
| 648,051,001 |
|
|
| 557,858,018 |
| |
16
|
|
|
| Year Ended November 30, | |||||
|
|
|
| 2019 |
| 2018 |
| ||
Capital Share Transactions (Shares): |
| ||||||||
Class Aa |
|
|
|
|
|
|
|
| |
Shares sold |
|
| 40,338 |
|
|
| 5,413 |
| |
Shares issued for distributions reinvested |
|
| 3,764 |
|
|
| 4,525 |
| |
Shares redeemed |
|
| (8,759) |
|
|
| (11,812) |
| |
Net Increase (Decrease) in Shares Outstanding | 35,343 |
|
|
| (1,874) |
| |||
Class Ca |
|
|
|
|
|
|
|
| |
Shares sold |
|
| 1,849 |
|
|
| 541 |
| |
Shares issued for distributions reinvested |
|
| 462 |
|
|
| 705 |
| |
Shares redeemed |
|
| (468) |
|
|
| (3,773) |
| |
Net Increase (Decrease) in Shares Outstanding | 1,843 |
|
|
| (2,527) |
| |||
Class Ib |
|
|
|
|
|
|
|
| |
Shares sold |
|
| 426,039 |
|
|
| 628,934 |
| |
Shares issued for distributions reinvested |
|
| 104,036 |
|
|
| 104,438 |
| |
Shares redeemed |
|
| (368,570) |
|
|
| (625,791) |
| |
Net Increase (Decrease) in Shares Outstanding | 161,505 |
|
|
| 107,581 |
| |||
Class Yb |
|
|
|
|
|
|
|
| |
Shares sold |
|
| 7,652,326 |
|
|
| 3,225,362 |
| |
Shares issued for distributions reinvested |
|
| 1,590,669 |
|
|
| 1,556,712 |
| |
Shares redeemed |
|
| (5,646,122) |
|
|
| (3,927,879) |
| |
Net Increase (Decrease) in Shares Outstanding | 3,596,873 |
|
|
| 854,195 |
| |||
|
|
|
|
|
|
|
|
|
|
aDuring the period ended November 30, 2018, 554 Class C shares representing $10,976 were automatically converted to 523 Class A shares. | |||||||||
bDuring the period ended November 30, 2019, 336,970 Class Y shares representing $6,578,041 were exchanged for 336,789 Class I shares and during the period ended November 30, 2018, 582,018 Class Y shares representing $11,508,672 were exchanged for 581,786 Class I shares. | |||||||||
See notes to financial statements. | |||||||||
17
FINANCIAL HIGHLIGHTS
The following tables describe the performance for each share class for the fiscal periods indicated. All information (except portfolio turnover rate) reflects financial results for a single fund share. Total return shows how much your investment in the fund would have increased (or decreased) during each period, assuming you had reinvested all dividends and distributions. These figures have been derived from the fund’s financial statements.
Year Ended November 30, | ||||||
Class A Shares | 2019 | 2018 | 2017 | 2016 | 2015 | |
Per Share Data ($): | ||||||
Net asset value, beginning of period | 20.44 | 20.85 | 18.29 | 19.77 | 20.70 | |
Investment Operations: | ||||||
Investment income—neta | .04 | .03 | .06 | .08 | .08 | |
Net realized and unrealized | 2.30 | 1.77 | 4.00 | 1.18 | .01b | |
Total from Investment Operations | 2.34 | 1.80 | 4.06 | 1.26 | .09 | |
Distributions: | ||||||
Dividends from | (.03) | (.04) | (.10) | (.11) | (.08) | |
Dividends from net realized | (1.90) | (2.17) | (1.40) | (2.63) | (.94) | |
Total Distributions | (1.93) | (2.21) | (1.50) | (2.74) | (1.02) | |
Net asset value, end of period | 20.85 | 20.44 | 20.85 | 18.29 | 19.77 | |
Total Return (%)c | 13.77 | 9.49 | 24.07 | 7.85 | .50 | |
Ratios/Supplemental Data (%): | ||||||
Ratio of total expenses | 1.20 | 1.25 | 1.20 | 1.17 | 1.16 | |
Ratio of net expenses | 1.15 | 1.15 | 1.15 | 1.15 | 1.14 | |
Ratio of net investment income | .20 | .17 | .31 | .46 | .41 | |
Portfolio Turnover Rate | 14.11 | 17.14 | 13.28 | 5.31 | 13.81 | |
Net Assets, end of period ($ x 1,000) | 1,540 | 787 | 842 | 1,775 | 1,449 | |
a Based on average shares outstanding.
b In addition to net realized and unrealized losses on investments, this amount includes an increase in net asset value per share resulting from the timing of issuances and redemptions of shares in relation to fluctuating market values for the fund’s investments.
c Exclusive of sales charge.
See notes to financial statements.
18
Year Ended November 30, | ||||||
Class C Shares | 2019 | 2018 | 2017 | 2016 | 2015 | |
Per Share Data ($): | ||||||
Net asset value, beginning of period | 19.07 | 19.70 | 17.38 | 18.94 | 19.93 | |
Investment Operations: | ||||||
Investment (loss)—neta | (.10) | (.11) | (.08) | (.05) | (.07) | |
Net realized and unrealized | 2.11 | 1.65 | 3.80 | 1.12 | .02b | |
Total from Investment Operations | 2.01 | 1.54 | 3.72 | 1.07 | (.05) | |
Distributions: | ||||||
Dividends from net realized | (1.90) | (2.17) | (1.40) | (2.63) | (.94) | |
Net asset value, end of period | 19.18 | 19.07 | 19.70 | 17.38 | 18.94 | |
Total Return (%)c | 12.92 | 8.69 | 23.11 | 7.03 | (.29) | |
Ratios/Supplemental Data (%): | ||||||
Ratio of total expenses | 2.40 | 2.35 | 2.16 | 2.11 | 2.04 | |
Ratio of net expenses | 1.90 | 1.90 | 1.90 | 1.90 | 1.90 | |
Ratio of net investment (loss) | (.56) | (.57) | (.43) | (.29) | (.35) | |
Portfolio Turnover Rate | 14.11 | 17.14 | 13.28 | 5.31 | 13.81 | |
Net Assets, end of period ($ x 1,000) | 121 | 86 | 138 | 266 | 348 | |
a Based on average shares outstanding.
b In addition to net realized and unrealized losses on investments, this amount includes an increase in net asset value per share resulting from the timing of issuances and redemptions of shares in relation to fluctuating market values for the fund’s investments.
c Exclusive of sales charge.
See notes to financial statements.
19
FINANCIAL HIGHLIGHTS (continued)
Year Ended November 30, | ||||||
Class I Shares | 2019 | 2018 | 2017 | 2016 | 2015 | |
Per Share Data ($): | ||||||
Net asset value, beginning of period | 20.54 | 20.96 | 18.37 | 19.88 | 20.82 | |
Investment Operations: | ||||||
Investment income—neta | .10 | .10 | .12 | .14 | .15 | |
Net realized and unrealized | 2.31 | 1.77 | 4.02 | 1.17 | .02b | |
Total from Investment Operations | 2.41 | 1.87 | 4.14 | 1.31 | .17 | |
Distributions: | ||||||
Dividends from | (.11) | (.12) | (.15) | (.19) | (.17) | |
Dividends from net realized | (1.90) | (2.17) | (1.40) | (2.63) | (.94) | |
Total Distributions | (2.01) | (2.29) | (1.55) | (2.82) | (1.11) | |
Net asset value, end of period | 20.94 | 20.54 | 20.96 | 18.37 | 19.88 | |
Total Return (%) | 14.17 | 9.85 | 24.46 | 8.15 | .88 | |
Ratios/Supplemental Data (%): | ||||||
Ratio of total expenses | .82 | .82 | .83 | .83 | .80 | |
Ratio of net expenses | .82 | .82 | .83 | .83 | .80 | |
Ratio of net investment income | .53 | .51 | .61 | .80 | .75 | |
Portfolio Turnover Rate | 14.11 | 17.14 | 13.28 | 5.31 | 13.81 | |
Net Assets, end of period ($ x 1,000) | 26,577 | 22,755 | 20,963 | 16,824 | 30,654 | |
a Based on average shares outstanding.
b In addition to net realized and unrealized losses on investments, this amount includes an increase in net asset value per share resulting from the timing of issuances and redemptions of shares in relation to fluctuating market values for the fund’s investments.
See notes to financial statements.
20
Year Ended November 30, | ||||||
Class Y Shares | 2019 | 2018 | 2017 | 2016 | 2015 | |
Per Share Data ($): | ||||||
Net asset value, beginning of period | 20.54 | 20.96 | 18.37 | 19.88 | 20.82 | |
Investment Operations: | ||||||
Investment income—neta | .11 | .11 | .12 | .14 | .15 | |
Net realized and unrealized | 2.29 | 1.77 | 4.02 | 1.17 | .02b | |
Total from Investment Operations | 2.40 | 1.88 | 4.14 | 1.31 | .17 | |
Distributions: | ||||||
Dividends from | (.11) | (.13) | (.15) | (.19) | (.17) | |
Dividends from net realized | (1.90) | (2.17) | (1.40) | (2.63) | (.94) | |
Total Distributions | (2.01) | (2.30) | (1.55) | (2.82) | (1.11) | |
Net asset value, end of period | 20.93 | 20.54 | 20.96 | 18.37 | 19.88 | |
Total Return (%) | 14.15 | 9.88 | 24.51 | 8.18 | .89 | |
Ratios/Supplemental Data (%): | ||||||
Ratio of total expenses | .80 | .80 | .80 | .80 | .79 | |
Ratio of net expenses | .80 | .80 | .80 | .80 | .79 | |
Ratio of net investment income | .55 | .53 | .64 | .81 | .76 | |
Portfolio Turnover Rate | 14.11 | 17.14 | 13.28 | 5.31 | 13.81 | |
Net Assets, end of period ($ x 1,000) | 619,812 | 534,230 | 527,263 | 486,044 | 545,762 | |
a Based on average shares outstanding.
b In addition to net realized and unrealized losses on investments, this amount includes an increase in net asset value per share resulting from the timing of issuances and redemptions of shares in relation to fluctuating market values for the fund’s investments.
See notes to financial statements.
21
NOTES TO FINANCIAL STATEMENTS
NOTE 1—Significant Accounting Policies:
BNY Mellon U.S. Equity Fund (the “fund”) is a separate diversified series of BNY Mellon Strategic Funds, Inc. (the “Company”), which is registered under the Investment Company Act of 1940, as amended (the “Act”), as an open-end management investment company and operates as a series company currently offering six series, including the fund. The fund’s investment objective is to seek long-term total return. BNY Mellon Investment Adviser, Inc. (the “Adviser”), a wholly-owned subsidiary of The Bank of New York Mellon Corporation (“BNY Mellon”), serves as the fund’s investment adviser. Walter Scott & Partners Limited (the “Sub-Adviser”), a wholly-owned subsidiary of BNY Mellon and an affiliate of the Adviser, serves as the fund’s sub-investment adviser.
Effective June 3, 2019, the fund changed its name from Dreyfus U.S. Equity Fund to BNY Mellon U.S. Equity Fund and the Company changed its name from Strategic Funds, Inc. to BNY Mellon Strategic Funds, Inc. In addition, The Dreyfus Corporation, the fund’s investment adviser, changed its name to “BNY Mellon Investment Adviser, Inc.”, MBSC Securities Corporation, the fund’s distributor, changed its name to “BNY Mellon Securities Corporation” and Dreyfus Transfer, Inc., the fund’s transfer agent, changed its name to “BNY Mellon Transfer, Inc.”
BNY Mellon Securities Corporation (the “Distributor”), a wholly-owned subsidiary of the Adviser, is the distributor of the fund’s shares. The fund is authorized to issue 100 million shares of $.001 par value Common Stock in each of the following classes of shares: Class A, Class C, Class I, Class T and Class Y. Class A and Class T shares generally are subject to a sales charge imposed at the time of purchase. Class C shares are subject to a contingent deferred sales charge (“CDSC”) imposed on Class C shares redeemed within one year of purchase. Class C shares automatically convert to Class A shares ten years after the date of purchase, without the imposition of a sales charge. Class I and Class Y shares are sold at net asset value per share generally to institutional investors. As of the date of this report, the fund did not offer Class T shares for purchase. Other differences between the classes include the services offered to and the expenses borne by each class, the allocation of certain transfer agency costs and certain voting rights. Income, expenses (other than expenses attributable to a specific class), and realized and unrealized gains or losses on investments are allocated to each class of shares based on its relative net assets.
22
The Company accounts separately for the assets, liabilities and operations of each series. Expenses directly attributable to each series are charged to that series’ operations; expenses which are applicable to all series are allocated among them on a pro rata basis.
The Financial Accounting Standards Board (“FASB”) Accounting Standards Codification (“ASC”) is the exclusive reference of authoritative U.S. generally accepted accounting principles (“GAAP”) recognized by the FASB to be applied by nongovernmental entities. Rules and interpretive releases of the Securities and Exchange Commission (“SEC”) under authority of federal laws are also sources of authoritative GAAP for SEC registrants. The fund is an investment company and applies the accounting and reporting guidance of the FASB ASC Topic 946 Financial Services-Investment Companies. The fund’s financial statements are prepared in accordance with GAAP, which may require the use of management estimates and assumptions. Actual results could differ from those estimates.
The Companyenters into contracts that contain a variety of indemnifications. The fund’s maximum exposure under these arrangements is unknown. The fund does not anticipate recognizing any loss related to these arrangements.
(a) Portfolio valuation: The fair value of a financial instrument is the amount that would be received to sell an asset or paid to transfer a liability in an orderly transaction between market participants at the measurement date (i.e., the exit price). GAAP establishes a fair value hierarchy that prioritizes the inputs of valuation techniques used to measure fair value. This hierarchy gives the highest priority to unadjusted quoted prices in active markets for identical assets or liabilities (Level 1 measurements) and the lowest priority to unobservable inputs (Level 3 measurements).
Additionally, GAAP provides guidance on determining whether the volume and activity in a market has decreased significantly and whether such a decrease in activity results in transactions that are not orderly. GAAP requires enhanced disclosures around valuation inputs and techniques used during annual and interim periods.
Various inputs are used in determining the value of the fund’s investments relating to fair value measurements. These inputs are summarized in the three broad levels listed below:
Level 1—unadjusted quoted prices in active markets for identical investments.
23
NOTES TO FINANCIAL STATEMENTS(continued)
Level 2—other significant observable inputs (including quoted prices for similar investments, interest rates, prepayment speeds, credit risk, etc.).
Level 3—significant unobservable inputs (including the fund’s own assumptions in determining the fair value of investments).
The inputs or methodology used for valuing securities are not necessarily an indication of the risk associated with investing in those securities.
Changes in valuation techniques may result in transfers in or out of an assigned level within the disclosure hierarchy. Valuation techniques used to value the fund’s investments are as follows:
Investments in equity securities are valued at the last sales price on the securities exchange or national securities market on which such securities are primarily traded. Securities listed on the National Market System for which market quotations are available are valued at the official closing price or, if there is no official closing price that day, at the last sales price. For open short positions, asked prices are used for valuation purposes. Bid price is used when no asked price is available. Registered investment companies that are not traded on an exchange are valued at their net asset value. All of the preceding securities are generally categorized within Level 1 of the fair value hierarchy.
Securities not listed on an exchange or the national securities market, or securities for which there were no transactions, are valued at the average of the most recent bid and asked prices. These securities are generally categorized within Level 2 of the fair value hierarchy.
Fair valuing of securities may be determined with the assistance of a pricing service using calculations based on indices of domestic securities and other appropriate indicators, such as prices of relevant American Depository Receipts and futures. Utilizing these techniques may result in transfers between Level 1 and Level 2 of the fair value hierarchy.
When market quotations or official closing prices are not readily available, or are determined not to accurately reflect fair value, such as when the value of a security has been significantly affected by events after the close of the exchange or market on which the security is principally traded (for example, a foreign exchange or market), but before the fund calculates its net asset value, the fund may value these investments at fair value as determined in accordance with the procedures approved by the Company’s Board of Directors (the “Board”). Certain factors may be considered when fair valuing investments such as: fundamental analytical data, the nature and duration of restrictions on disposition, an evaluation of the forces that
24
influence the market in which the securities are purchased and sold, and public trading in similar securities of the issuer or comparable issuers. These securities are either categorized within Level 2 or 3 of the fair value hierarchy depending on the relevant inputs used.
For restricted securities where observable inputs are limited, assumptions about market activity and risk are used and such securities are generally categorized within Level 3 of the fair value hierarchy.
The following is a summary of the inputs used as of November 30, 2019in valuing the fund’s investments:
Level 1 - Unadjusted Quoted Prices | Level 2 - Other Significant Observable Inputs | Level 3 -Significant Unobservable Inputs | Total | |
Assets ($) | ||||
Investments in Securities: † | ||||
Equity Securities - Domestic Common Stocks | 641,351,087 | - | - | 641,351,087 |
Investment Companies | 6,686,033 | - | - | 6,686,033 |
† See Statement of Investments for additional detailed categorizations, if any.
(b)Securities transactions and investment income: Securities transactions are recorded on a trade date basis. Realized gains and losses from securities transactions are recorded on the identified cost basis. Dividend income is recognized on the ex-dividend date and interest income, including, where applicable, accretion of discount and amortization of premium on investments, is recognized on the accrual basis.
Pursuant to a securities lending agreement with The Bank of New York Mellon, a subsidiary of BNY Mellon and an affiliate of the Adviser, the fund may lend securities to qualified institutions. It is the fund’s policy that, at origination, all loans are secured by collateral of at least 102% of the value of U.S. securities loaned and 105% of the value of foreign securities loaned. Collateral equivalent to at least 100% of the market value of securities on loan is maintained at all times. Collateral is either in the form of cash, which can be invested in certain money market mutual funds managed by the Adviser, or U.S. Government and Agency securities. The fund is entitled to receive all dividends, interest and distributions on securities loaned, in addition to income earned as a result of the lending transaction. Should a borrower fail to return the securities in a timely manner, The Bank of New York Mellon is required to replace the securities for the benefit of the fund or credit the fund with the market value of the unreturned securities and is subrogated to the fund’s rights
25
NOTES TO FINANCIAL STATEMENTS(continued)
against the borrower and the collateral. Additionally, the contractual maturity of security lending transactions are on an overnight and continuous basis. During the period ended November 30, 2019, The Bank of New York Mellon earned $16,345 from the lending of the fund’s portfolio securities, pursuant to the securities lending agreement.
(c) Affiliated issuers: Investments in other investment companies advised by the Adviser are considered “affiliated” under the Act.
(d) Dividends and distributions to shareholders: Dividends and distributions are recorded on the ex-dividend date. Dividends from investment income-net and dividends from net realized capital gains, if any, are normally declared and paid annually, but the fund may make distributions on a more frequent basis to comply with the distribution requirements of the Internal Revenue Code of 1986, as amended (the “Code”). To the extent that net realized capital gains can be offset by capital loss carryovers, it is the policy of the fund not to distribute such gains. Income and capital gain distributions are determined in accordance with income tax regulations, which may differ from GAAP.
(e) Federal income taxes: It is the policy of the fund to continue to qualify as a regulated investment company, if such qualification is in the best interests of its shareholders, by complying with the applicable provisions of the Code, and to make distributions of taxable income and net realized capital gain sufficient to relieve it from substantially all federal income and excise taxes.
As of and during the period ended November 30, 2019, the fund did not have any liabilities for any uncertain tax positions. The fund recognizes interest and penalties, if any, related to uncertain tax positions as income tax expense in the Statement of Operations. During the period ended November 30, 2019, the fund did not incur any interest or penalties.
Each tax year in the four-year period ended November 30, 2019 remains subject to examination by the Internal Revenue Service and state taxing authorities.
At November 30, 2019, the components of accumulated earnings on a tax basis were as follows: undistributed ordinary income $3,174,336, undistributed capital gains $5,701,351 and unrealized appreciation $279,528,417.
The tax character of distributions paid to shareholders during the fiscal periods ended November 30, 2019 and November 30, 2018 were as follows: ordinary income $2,900,072 and $7,375,353, and long-term capital gains $49,622,197 and $52,486,004, respectively.
26
(f) New Accounting Pronouncements: Effective June 1, 2019, the fund adopted Accounting Standards Update 2018-13, Fair Value Measurement (Topic 820): Disclosure Framework—Changes to the Disclosure Requirements for Fair Value Measurement (“ASU 2018-13”). The update provides guidance that eliminates, adds and modifies certain disclosure requirements for fair value measurements. The adoption of ASU 2018-13 had no impact on the operations of the fund for the period ended November 30, 2019.
NOTE 2—Bank Lines of Credit:
The fund participates with other long-term open-end funds managed by the Adviser in a $1.030 billion unsecured credit facility led by Citibank, N.A. (the “Citibank Credit Facility”) and a $300 million unsecured credit facility provided by The Bank of New York Mellon (the “BNYM Credit Facility”), each to be utilized primarily for temporary or emergency purposes, including the financing of redemptions (each, a “Facility”). The Citibank Credit Facility is available in two tranches: (i) Tranche A is in an amount equal to $830 million and is available to all long-term open-ended funds, including the fund, and (ii) Tranche B is in amount equal to $200 million and is available only to BNY Mellon Floating Rate Income Fund, a series of BNY Mellon Investment Funds IV, Inc. In connection therewith, the fund has agreed to pay its pro rata portion of commitment fees for Tranche A of the Citibank Credit Facility and the BNYM Credit Facility. Interest is charged to the fund based on rates determined pursuant to the terms of the respective Facility at the time of borrowing.
The average amount of borrowings outstanding under the Facilities during the period ended November 30, 2019 was approximately $19,730 with a related weighted average annualized interest rate of 3.42%.
NOTE 3—Management Fee, Sub-Investment Advisory Fee and Other Transactions with Affiliates:
(a)Pursuant to a management agreement with the Adviser, the management fee is computed at the annual rate of .75% of the value of the fund’s average daily net assets and is payable monthly. The Adviser has contractually agreed, from December 1, 2018 through March 29, 2020, to waive receipt of its fees and/or assume the direct expenses of the fund, so that the direct expenses of none of the classes (excluding Rule 12b-1 Distribution Plan fees, Shareholder Services Plan fees, taxes, interest expense, brokerage commissions, commitment fees on borrowings and extraordinary expenses) do not exceed .90% of the value of the fund’s average daily net assets. On or after March 29, 2020, the Adviser may terminate this expense limitation at any time. The reduction in expenses,
27
NOTES TO FINANCIAL STATEMENTS(continued)
pursuant to the undertaking, amounted to $1,056 during the period ended November 30, 2019.
Pursuant to a sub-investment advisory agreement between the Adviser and the Sub-Adviser, the Adviser pays the Sub-Adviser a monthly fee at an annual rate of .36% of the value of the fund’s average daily net assets.
During the period ended November 30, 2019, the Distributor retained $898 from commissions earned on sales of the fund’s Class A shares.
(b) Under the Distribution Plan adopted pursuant to Rule 12b-1 under the Act, Class C shares pay the Distributor for distributing its shares at an annual rate of .75% of the value of its average daily net assets. During the period ended November 30, 2019, Class C shares were charged $768 pursuant to the Distribution Plan.
(c)Under the Shareholder Services Plan, Class A and Class C shares pay the Distributor at an annual rate of .25% of the value of their average daily net assets for the provision of certain services. The services provided may include personal services relating to shareholder accounts, such as answering shareholder inquiries regarding the fund and providing reports and other information, and services related to the maintenance of shareholder accounts. The Distributor may make payments to Service Agents (securities dealers, financial institutions or other industry professionals) with respect to these services. The Distributor determines the amounts to be paid to Service Agents. During the period ended November 30, 2019, Class A and Class C shares were charged $2,674and $256, respectively, pursuant to the Shareholder Services Plan.
The fund has an arrangement with the transfer agent whereby the fund may receive earnings credits when positive cash balances are maintained, which are used to offset transfer agency fees. The fund had an arrangement with the custodian to receive earnings credits when positive cash balances were maintained, which were used to offset custody fees. Effective February 1, 2019, the arrangement with the custodian changed whereby the fund will no longer receive earnings credits to offset its custody fees and will receive interest income or overdraft fees going forward. For financial reporting purposes, the fund includes net earnings credits, if any, as an expense offset in the Statement of Operations.
The fund compensates BNY Mellon Transfer, Inc., a wholly-owned subsidiary of the Adviser, under a transfer agency agreement for providing transfer agency and cash management services for the fund. The majority of transfer agency fees are comprised of amounts paid on a per account basis, while cash management fees are related to fund subscriptions and redemptions. During the period ended November 30, 2019, the fund was
28
charged $4,482 for transfer agency services. These fees are included in Shareholder servicing costs in the Statement of Operations.
The fund compensates The Bank of New York Mellon under a custody agreement for providing custodial services for the fund. These fees are determined based on net assets, geographic region and transaction activity. During the period ended November 30, 2019, the fund was charged $9,811 pursuant to the custody agreement.
During the period ended November 30, 2019, the fund was charged $11,659 for services performed by the Chief Compliance Officer and his staff. These fees are included in Miscellaneous in the Statement of Operations.
The components of “Due to BNY Mellon Investment Adviser, Inc. and affiliates” in the Statement of Assets and Liabilities consist of: management fees of $395,941, Distribution Plan fees of $74, Shareholder Services Plan fees of $301, custodian fees of $3,400, Chief Compliance Officer fees of $2,174 and transfer agency fees of $783, which are offset against an expense reimbursement currently in effect in the amount of $31.
(d) Each Board member also serves as a Board member of other funds in the BNY Mellon Family of Funds complex. Annual retainer fees and attendance fees are allocated to each fund based on net assets.
NOTE 4—Securities Transactions:
The aggregate amount of purchases and sales of investment securities, excluding short-term securities, during the period ended November 30, 2019, amounted to $100,764,232 and $80,341,555, respectively.
At November 30, 2019, the cost of investments for federal income tax purposes was $368,508,703; accordingly, accumulated net unrealized appreciation on investments was $279,528,417, consisting of $290,652,993 gross unrealized appreciation and $11,124,576 gross unrealized depreciation.
29
REPORT OF INDEPENDENT REGISTERED PUBLIC ACCOUNTING FIRM
To the Shareholders and the Board of Directors of BNY Mellon U.S. Equity Fund (formerly, Dreyfus U.S. Equity Fund)
Opinion on the Financial Statements
We have audited the accompanying statement of assets and liabilities of BNY Mellon U.S. Equity Fund (the “Fund”) (formerly, Dreyfus U.S. Equity Fund) (one of the funds constituting BNY Mellon Strategic Funds, Inc.), including the statements of investments and investments in affiliated issuers, as of November 30, 2019, and the related statement of operations for the year then ended, the statements of changes in net assets for each of the two years in the period then ended, the financial highlights for each of the five years in the period then ended and the related notes (collectively referred to as the “financial statements”). In our opinion, the financial statements present fairly, in all material respects, the financial position of the Fund (one of the funds constituting BNY Mellon Strategic Funds, Inc.) at November 30, 2019, the results of its operations for the year then ended, the changes in its net assets for each of the two years in the period then ended and its financial highlights for each of the five years in the period then ended, in conformity with U.S. generally accepted accounting principles.
Basis for Opinion
These financial statements are the responsibility of the Fund’s management. Our responsibility is to express an opinion on the Fund’s financial statements based on our audits. We are a public accounting firm registered with the Public Company Accounting Oversight Board (United States) (“PCAOB”) and are required to be independent with respect to the Fund in accordance with the U.S. federal securities laws and the applicable rules and regulations of the Securities and Exchange Commission and the PCAOB.
We conducted our audits in accordance with the standards of the PCAOB. Those standards require that we plan and perform the audit to obtain reasonable assurance about whether the financial statements are free of material misstatement, whether due to error or fraud. The Fund is not required to have, nor were we engaged to perform, an audit of the Fund’s internal control over financial reporting. As part of our audits, we are required to obtain an understanding of internal control over financial reporting, but not for the purpose of expressing an opinion on the effectiveness of the Fund’s internal control over financial reporting. Accordingly, we express no such opinion.
Our audits included performing procedures to assess the risks of material misstatement of the financial statements, whether due to error or fraud, and performing procedures that respond to those risks. Such procedures included examining, on a test basis, evidence regarding the amounts and disclosures in the financial statements. Our procedures included confirmation of securities owned as of November 30, 2019, by correspondence with the custodian and others or by other appropriate auditing procedures where replies from others were not received. Our audits also included evaluating the accounting principles used and significant estimates made by management, as well as evaluating the overall presentation of the financial statements. We believe that our audits provide a reasonable basis for our opinion.

We have served as the auditor of one or more investment companies in the BNY Mellon Family of Funds since at least 1957, but we are unable to determine the specific year.
New York, New York
January 28, 2020
30
IMPORTANT TAX INFORMATION(Unaudited)
For federal tax purposes the fund hereby reports 100% of the ordinary dividends paid during the fiscal year ended November 30, 2019 as qualifying for the corporate dividends received deduction. Also certain dividends paid by the fund may be subject to a maximum tax rate of 15%, as provided for by the Jobs and Growth Tax Relief Reconciliation Act of 2003. Of the distributions paid during the fiscal year, $2,900,072 represents the maximum amount that may be considered qualified dividend income. Shareholders will receive notification in early 2020 of the percentage applicable to the preparation of their 2019 income tax returns. Also, the fund hereby reports $1.8975 per share as a long-term capital gain distribution paid on December 31, 2018.
31
INFORMATION ABOUT THE RENEWAL OF THE FUND’S MANAGEMENT AND SUB-INVESTMENT ADVISORY AGREEMENTS (Unaudited)
At a meeting of the fund’s Board of Directors held on November 5, 2019, the Board considered the renewal of the fund’s Management Agreement, pursuant to which the Adviser provides the fund with investment advisory and administrative services (the “Agreement”), and the Sub-Investment Advisory Agreement (together, the “Agreements”), pursuant to which Walter Scott & Partners Limited (the “Subadviser”), an affiliate of the Adviser, provides day-to-day management of the fund’s investments. The Board members, a majority of whom are not “interested persons” (as defined in the Investment Company Act of 1940, as amended) of the fund, were assisted in their review by independent legal counsel and met with counsel in executive session separate from representatives of the Adviser and the Subadviser. In considering the renewal of the Agreements, the Board considered several factors that it believed to be relevant, including those discussed below. The Board did not identify any one factor as dispositive, and each Board member may have attributed different weights to the factors considered.
Analysis of Nature, Extent, and Quality of Services Provided to the Fund. The Board considered information provided to it at the meeting and in previous presentations from representatives of the Adviser regarding the nature, extent, and quality of the services provided to funds in the BNY Mellon fund complex, including the fund. The Adviser provided the number of open accounts in the fund, the fund’s asset size and the allocation of fund assets among distribution channels. The Adviser also had previously provided information regarding the diverse intermediary relationships and distribution channels of funds in the BNY Mellon fund complex (such as retail direct or intermediary, in which intermediaries typically are paid by the fund and/or the Adviser) and the Adviser’s corresponding need for broad, deep, and diverse resources to be able to provide ongoing shareholder services to each intermediary or distribution channel, as applicable to the fund.
The Board also considered research support available to, and portfolio management capabilities of, the fund’s portfolio management personnel and that the Adviser also provides oversight of day-to-day fund operations, including fund accounting and administration and assistance in meeting legal and regulatory requirements. The Board also considered the Adviser’s extensive administrative, accounting and compliance infrastructures, as well as the Adviser’s supervisory activities over the Subadviser. The Board also considered portfolio management’s brokerage policies and practices (including policies and practices regarding soft dollars) and the standards applied in seeking best execution.
Comparative Analysis of the Fund’s Performance and Management Fee and Expense Ratio. The Board reviewed reports prepared by Broadridge Financial Solutions, Inc. (“Broadridge”), an independent provider of investment company data, which included information comparing (1) the fund’s performance with the performance of a group of multi-cap growth funds (the “Performance Group”) and with a broader group of funds consisting of all retail and institutional multi-cap growth funds (the “Performance
32
Universe”), all for various periods ended September 30, 2019, and (2) the fund’s actual and contractual management fees and total expenses with those of the same group of funds in the Performance Group (the “Expense Group”) and with a broader group of funds consisting of all institutional multi-cap growth funds, excluding outliers (the “Expense Universe”), the information for which was derived in part from fund financial statements available to Broadridge as of the date of its analysis. The Adviser previously had furnished the Board with a description of the methodology Broadridge used to select the Performance Group and Performance Universe and the Expense Group and Expense Universe.
Representatives of the Adviser stated that the usefulness of performance comparisons may be affected by a number of factors, including different investment limitations and policies that may be applicable to the fund and comparison funds. The Board discussed with representatives of the Adviser and the Subadviser the results of the comparisons and considered that the fund’s total return performance was above the Performance Group median for all periods except for the three-, five- and ten-year periods when it was below the median, and was above the Performance Universe median for all periods except the ten-year period when it was below the median. The Board considered the relative proximity of the fund’s performance to the Performance Group and/or Performance Universe median in certain periods when performance was below median. The Adviser also provided a comparison of the fund’s calendar year total returns to the returns of the fund’s benchmark index.
The Board reviewed and considered the contractual management fee rate paid by the fund to the Adviser over the fund’s last fiscal year in light of the nature, extent and quality of the management and sub-advisory services provided by the Adviser and the Subadviser, respectively. The Board noted that the compensation paid to the Subadviser is paid by the Adviser (out of its fee from the fund), not the fund, and, accordingly, that the retention of the Subadviser does not increase the fees or expenses otherwise incurred by the fund and its shareholders.
The Board also reviewed the range of actual and contractual management fees and total expenses of the Expense Group and Expense Universe funds and discussed the results of the comparisons. The Board considered that the fund’s contractual management fee was slightly higher than the Expense Group contractual management fee median and was higher than the Expense Group and Expense Universe actual management fee medians, and that the fund’s total expenses were lower than the Expense Group and Expense Universe medians.
Representatives of the Adviser stated that the Adviser has contractually agreed, until March 29, 2020, to waive receipt of its fees and/or assume the direct expenses of the fund so that the direct expenses of none of its classes (excluding Rule 12b-1 fees, shareholder services fees, taxes, interest, brokerage commissions, commitment fees on borrowings and extraordinary expenses) exceed .90% of the fund’s average daily net assets.
33
INFORMATION ABOUT THE RENEWAL OF THE FUND’S MANAGEMENT AND SUB-INVESTMENT ADVISORY AGREEMENTS (Unaudited) (continued)
Representatives of the Adviser reviewed with the Board the management or investment advisory fees (1) paid by funds advised or administered by the Adviser that are in the same Lipper category as the fund and (2) paid to the Adviser or the Subadviser or its affiliates for advising any separate accounts and/or other types of client portfolios that are considered to have similar investment strategies and policies as the fund (the “Similar Clients”), and explained the nature of the Similar Clients. They discussed differences in fees paid and the relationship of the fees paid in light of any differences in the services provided and other relevant factors. The Board considered the relevance of the fee information provided for the Similar Clients to evaluate the appropriateness of the fund’s management fee.
Analysis of Profitability and Economies of Scale. Representatives of the Adviser reviewed the expenses allocated and profit received by the Adviser and its affiliates and the resulting profitability percentage for managing the fund and the aggregate profitability percentage to the Adviser and its affiliates for managing the funds in the BNY Mellon fund complex, and the method used to determine the expenses and profit. The Board concluded that the profitability results were not excessive, given the services rendered and service levels provided by the Adviser and its affiliates. The Board also had been provided with information prepared by an independent consulting firm regarding the Adviser’s approach to allocating costs to, and determining the profitability of, individual funds and the entire BNY Mellon fund complex. The consulting firm also had analyzed where any economies of scale might emerge in connection with the management of a fund.
The Board considered on the advice of its counsel the profitability analysis (1) as part of its evaluation of whether the fees under the Agreements, considered in relation to the mix of services provided by the Adviser and the Subadviser, including the nature, extent and quality of such services, supported the renewal of the Agreements and (2) in light of the relevant circumstances for the fund and the extent to which economies of scale would be realized if the fund grows and whether fee levels reflect these economies of scale for the benefit of fund shareholders. Since the Adviser, and not the fund, pays the Subadviser pursuant to the Sub-Investment Advisory Agreement, the Board did not consider the Subadviser’s profitability to be relevant to its deliberations. Representatives of the Adviser also stated that, as a result of shared and allocated costs among funds in the BNY Mellon fund complex, the extent of economies of scale could depend substantially on the level of assets in the complex as a whole, so that increases and decreases in complex-wide assets can affect potential economies of scale in a manner that is disproportionate to, or even in the opposite direction from, changes in the fund’s asset level. The Board also considered potential benefits to the Adviser and the Subadviser from acting as investment adviser and sub-investment adviser, respectively, and took into consideration the soft dollar arrangements in effect for trading the fund’s investments.
At the conclusion of these discussions, the Board agreed that it had been furnished with sufficient information to make an informed business decision with respect to the
34
renewal of the Agreements. Based on the discussions and considerations as described above, the Board concluded and determined as follows.
· The Board concluded that the nature, extent and quality of the services provided by the Adviser and the Subadviser are adequate and appropriate.
· The Board generally was satisfied with the fund’s overall performance.
· The Board concluded that the fees paid to the Adviser and the Subadviser continued to be appropriate under the circumstances and in light of the factors and the totality of the services provided as discussed above.
· The Board determined that the economies of scale which may accrue to the Adviser and its affiliates in connection with the management of the fund had been adequately considered by the Adviser in connection with the fee rate charged to the fund pursuant to the Agreement and that, to the extent in the future it were determined that material economies of scale had not been shared with the fund, the Board would seek to have those economies of scale shared with the fund.
In evaluating the Agreements, the Board considered these conclusions and determinations and also relied on its previous knowledge, gained through meetings and other interactions with the Adviser and its affiliates and the Subadviser, of the Adviser and the Subadviser and the services provided to the fund by the Adviser and the Subadviser. The Board also relied on information received on a routine and regular basis throughout the year relating to the operations of the fund and the investment management and other services provided under the Agreements, including information on the investment performance of the fund in comparison to similar mutual funds and benchmark performance indices; general market outlook as applicable to the fund; and compliance reports. In addition, the Board’s consideration of the contractual fee arrangements for this fund had the benefit of a number of years of reviews of the Agreements for the fund, or substantially similar agreements for other BNY Mellon funds that the Board oversees, during which lengthy discussions took place between the Board and representatives of the Adviser. Certain aspects of the arrangements may receive greater scrutiny in some years than in others, and the Board’s conclusions may be based, in part, on their consideration of the fund’s arrangements, or substantially similar arrangements for other BNY Mellon funds that the Board oversees, in prior years. The Board determined to renew the Agreements.
35
BOARD MEMBERS INFORMATION(Unaudited)
INDEPENDENT BOARD MEMBERS
Joseph S. DiMartino (76)
Chairman of the Board (1995)
Principal Occupation During Past 5 Years:
· Corporate Director and Trustee (1995-Present)
Other Public Company Board Memberships During Past 5 Years:
· CBIZ, Inc., a public company providing professional business services, products and solutions,Director (1997-Present)
No. of Portfolios for which Board Member Serves:120
———————
Joni Evans (77)
Board Member (2006)
Principal Occupation During Past 5 Years:
· Chief Executive Officer, www.wowOwow.com, an online community dedicated to women’s conversations and publications (2007-Present)
· Principal, Joni Evans Ltd. (publishing) (2006-Present)
No. of Portfolios for which Board Member Serves:20
———————
Joan Gulley (72)
Board Member (2017)
Principal Occupation During Past 5 Years:
· PNC Financial Services Group, Inc.(1993-2014), Executive Vice President and Chief Human Resources Officer and Executive Committee Member (2008-2014)
· Director, Nantucket Library (2015-Present)
No. of Portfolios for which Board Member Serves:50
———————
Ehud Houminer (79)
Board Member (1994)
Principal Occupation During Past 5 Years:
· Board of Overseers at the Columbia Business School, Columbia
University (1992-Present)
Trustee, Ben Gurion University (2012-2018)
No. of Portfolios for which Board Member Serves: 50
———————
36
Alan H. Howard (60)
Board Member (2018)
Principal Occupation During Past 5 Years:
· Managing Partner of Heathcote Advisors LLC, a financial advisory services firm (2008 – Present)
· President of Dynatech/MPX Holdings LLC (2012 – 2019), a global supplier and service provider of military aircraft parts, including Board Member of two operating subsidiaries, Dynatech International LLC and Military Parts Exchange LLC (2012-2019); Chief Executive Officer of an operating subsidiary, Dynatech International LLC (2013 – 2019)
· Senior Advisor, Rossoff & Co., an independent investment banking firm (2013 – Present)
Other Public Company Board Memberships During Past 5 Years:
· Movado Group, Inc., a public company that designs, sources, markets and distributes watches,Director (1997-Present)
No. of Portfolios for which Board Member Serves:20
———————
Robin A. Melvin (56)
Board Member (1995)
Principal Occupation During Past 5 Years:
· Co-chairman, Mentor Illinois, a non-profit organization dedicated to increasing the quantity and quality of mentoring services in Illinois; (2014-Present; Board member (2013-Present)
No. of Portfolios for which Board Member Serves:97
———————
Burton N. Wallack (69)
Board Member (2006)
Principal Occupation During Past 5 Years:
President and Co-owner of Wallack Management Company, a real estate management company (1987-Present)
Mount Sinai Hospital Urology Board Member (2017-Present)
No. of Portfolios for which Board Member Serves:20
———————
37
BOARD MEMBERS INFORMATION (Unaudited) (continued)
INDEPENDENT BOARD MEMBERS (continued)
Benaree Pratt Wiley (73)
Board Member (2016)
Principal Occupation During Past 5 Years:
· Principal, The Wiley Group, a firm specializing in strategy and business development (2005-Present)
Other Public Company Board Memberships During Past 5 Years:
· CBIZ, Inc., a public company providing professional business services, products and solutions,Director(2008-Present)
· Blue Cross Blue Shield of MassachusettsDirector (2004-Present)
No. of Portfolios for which Board Member Serves: 76
———————
38
INTERESTED BOARD MEMBER
Gordon J. Davis (78)
Board Member (2006)
Principal Occupation During Past 5 Years:
· Partner in the law firm of Venable LLP (2012-Present)
Other Public Company Board Memberships During Past 5 Years:
· Consolidated Edison, Inc., a utility company,Director (1989-2014)
· The Phoenix Companies, Inc., a life insurance company,Director (2000-2014)
No. of Portfolios for which Board Member Serves:54
Gordon J. Davis is deemed to be an “interested person” (as defined under the Act) of the Company as a result of his affiliation with Venable LLP, which provides legal services to the Company.
———————
Once elected all Board Members serve for an indefinite term, but achieve Emeritus status upon reaching age 80. The address of the Board Members and Officers is c/o BNY Mellon Investment Adviser, Inc. 240 Greenwich Street, New York, New York 10286. Additional information about the Board Members is available in the fund’s Statement of Additional Information which can be obtained from the Adviser free of charge by calling this toll free number: 1-800-373-9387.
William Hodding Carter III, Emeritus Board Member
Hans C, Mautner, Emeritus Board Member
39
OFFICERS OF THE FUND(Unaudited)
RENEE LAROCHE-MORRIS, President since May 2019.
President and a director of BNY Mellon Investment Adviser, Inc. since January 2018. She is an officer of 63 investment companies (comprised of 120 portfolios) managed by the Adviser. She is 48 years old and has been an employee of BNY Mellon since 2003.
JAMES WINDELS, Treasurer since November 2001.
Director- BNY Mellon Fund Administration, and an officer of 64 investment companies (comprised of 143 portfolios) managed by the Adviser. He is 61 years old and has been an employee of the Adviser since April 1985.
BENNETT A. MACDOUGALL, Chief Legal Officer since October 2015.
Chief Legal Officer of the Adviser and Associate General Counsel and Managing Director of BNY Mellon since June 2015; Director and Associate General Counsel of Deutsche Bank – Asset & Wealth Management Division from June 2005 to June 2015, and as Chief Legal Officer of Deutsche Investment Management Americas Inc. from June 2012 to May 2015. He is an officer of 64 investment companies (comprised of 143 portfolios) managed by the Adviser. He is 48 years old and has been an employee of the Adviser since June 2015.
DAVID DIPETRILLO, Vice President since May 2019.
Head of North America Product, BNY Mellon Investment Management since January 2018, Director of Product Strategy, BNY Mellon Investment Management from January 2016 to December 2017; Head of US Retail Product and Channel Marketing, BNY Mellon Investment Management from January 2014 to December 2015. He is an officer of 63 investment companies (comprised of 120 portfolios) managed by the Adviser. He is 41 years old and has been an employee of BNY Mellon since 2005.
JAMES BITETTO, Vice President since August 2005 and Secretary since February 2018.
Senior Managing Counsel of BNY Mellon since December 2019; Managing Counsel of BNY Mellon from April 2014 to December 2019; Secretary of the Adviser, and an officer of 64 investment companies (comprised of 143 portfolios) managed by the Adviser. He is 53 years old and has been an employee of the Adviser since December 1996.
SONALEE CROSS, Vice President and Assistant Secretary since March 2018.
Counsel of BNY Mellon since October 2016; Associate at Proskauer Rose LLP from April 2016 to September 2016; Attorney at EnTrust Capital from August 2015 to February 2016; Associate at Sidley Austin LLP from September 2013 to August 2015. She is an officer of 64 investment companies (comprised of 143 portfolios) managed by the Adviser. She is 32 years old and has been an employee of the Adviser since October 2016.
DEIRDRE CUNNANE, Vice President and Assistant Secretary since March 2019.
Counsel of BNY Mellon since August 2018; Senior Regulatory Specialist at BNY Mellon Investment Management Services from February 2016 to August 2018; Trustee Associate at BNY Mellon Trust Company (Ireland) Limited from August 2013 to February 2016. She is an officer of 64 investment companies (comprised of 143 portfolios) managed by the Adviser. She is 29 years old and has been an employee of the Adviser since August 2018.
SARAH S. KELLEHER, Vice President and Assistant Secretary since April 2014.
Managing Counsel of BNY Mellon since December 2017, Senior Counsel of BNY Mellon from March 2013 to December 2017. She is an officer of 64 investment companies (comprised of 143 portfolios) managed by the Adviser. She is 44 years old and has been an employee of the Adviser since March 2013.
JEFF PRUSNOFSKY, Vice President and Assistant Secretary since August 2005.
Senior Managing Counsel of BNY Mellon, and an officer of 64 investment companies (comprised of 143 portfolios) managed by the Adviser. He is 54 years old and has been an employee of the Adviser since October 1990.
PETER M. SULLIVAN, Vice President and Assistant Secretary since March 2019.
Managing Counsel of BNY Mellon, and an officer of 64 investment companies (comprised of 143 portfolios) managed by the Adviser. He is 51 years old and has been an employee of the Adviser since April 2004.
40
NATALYA ZELENSKY, Vice President and Assistant Secretary since March 2017.
Managing Counsel of BNY Mellon since December 2019; Counsel of BNY Mellon from May 2016 to December 2019; Attorney at Wildermuth Endowment Strategy Fund/Wildermuth Advisory, LLC from November 2015 to May 2016 and Assistant General Counsel at RCS Advisory Services from July 2014 to November 2015. She is an officer of 64 investment companies (comprised of 143 portfolios) managed by the Adviser. She is 34 years old and has been an employee of the Adviser since May 2016.
GAVIN C. REILLY, Assistant Treasurer since December 2005.
Tax Manager - BNY Mellon Fund Administration, and an officer of 64 investment companies (comprised of 143 portfolios) managed by the Adviser. He is 51 years old and has been an employee of the Adviser since April 1991.
ROBERT S. ROBOL, Assistant Treasurer since August 2005.
Senior Accounting Manager- BNY Mellon Fund Administration, and an officer of 64 investment companies (comprised of 143 portfolios) managed by the Adviser. He is 55 years old and has been an employee of the Adviser since October 1988.
ROBERT SALVIOLO, Assistant Treasurer since July 2007.
Senior Accounting Manager – BNY Mellon Fund Administration, and an officer of 64 investment companies (comprised of 143 portfolios) managed by the Adviser. He is 52 years old and has been an employee of the Adviser since June 1989.
ROBERT SVAGNA, Assistant Treasurer since September 2002.
Senior Accounting Manager – BNY Mellon Fund Administration, and an officer of 64 investment companies (comprised of 143 portfolios) managed by the Adviser. He is 52 years old and has been an employee of the Adviser since November 1990.
JOSEPH W. CONNOLLY, Chief Compliance Officer since October 2004.
Chief Compliance Officer of the Adviser, the BNY Mellon Family of Funds and BNY Mellon Funds Trust (64 investment companies, comprised of 143 portfolios). He is 62 years old and has served in various capacities with the Adviser since 1980, including manager of the firm’s Fund Accounting Department from 1997 through October 2001.
CARIDAD M. CAROSELLA, Anti-Money Laundering Compliance Officer since January 2016.
Anti-Money Laundering Compliance Officer of the BNY Mellon Family of Funds and BNY Mellon Funds Trust since January 2016; from May 2015 to December 2015, Interim Anti-Money Laundering Compliance Officer of the BNY Mellon Family of Funds and BNY Mellon Funds Trust and the Distributor; from January 2012 to May 2015, AML Surveillance Officer of the Distributor. She is an officer of 57 investment companies (comprised of 136 portfolios) managed by the Adviser. She is 51 years old and has been an employee of the Distributor since 1997.
41
BNY Mellon U.S. Equity Fund
240 Greenwich Street
New York, NY 10286
Adviser
BNY Mellon Investment Adviser, Inc.
240 Greenwich Street
New York, NY 10286
Sub-Adviser
Walter Scott & Partners Limited
(Walter Scott)
One Charlotte Square
Edinburgh, Scotland, UK
Custodian
The Bank of New York Mellon
240 Greenwich Street
New York, NY 10286
Transfer Agent &
Dividend Disbursing Agent
BNY Mellon Transfer, Inc.
240 Greenwich Street
New York, NY 10286
Distributor
BNY Mellon Securities Corporation
240 Greenwich Street
New York, NY 10286
Ticker Symbols: | Class A: DPUAX Class C: DPUCX Class I: DPUIX Class Y: DPUYX |
Telephone Call your financial representative or 1-800-373-9387
Mail The BNY Mellon Family of Funds, 144 Glenn Curtiss Boulevard, Uniondale, NY 11556-0144
E-mailSend your request toinfo@bnymellon.com
InternetInformation can be viewed online or downloaded atwww.bnymellonim.com/us
The fund files its complete schedule of portfolio holdings with the Securities and Exchange Commission (“SEC”) for the first and third quarters of each fiscal year on Form N-PORT. The fund’s Forms N-PORT are available on the SEC’s website atwww.sec.gov.
A description of the policies and procedures that the fund uses to determine how to vote proxies relating to portfolio securities and information regarding how the fund voted these proxies for the most recent 12-month period ended June 30 is available atwww.bnymellonim.com/us and on the SEC’s website atwww.sec.gov and without charge, upon request, by calling 1-800-373-9387.
© 2020 BNY Mellon Securities Corporation |
|

Item 2. Code of Ethics.
The Registrant has adopted a code of ethics that applies to the Registrant's principal executive officer, principal financial officer, principal accounting officer or controller, or persons performing similar functions. There have been no amendments to, or waivers in connection with, the Code of Ethics during the period covered by this Report.
Item 3. Audit Committee Financial Expert.
The Registrant's Board has determined that Ehud Houminer, a member of the Audit Committee of the Board, is an audit committee financial expert as defined by the Securities and Exchange Commission (the "SEC"). Ehud Houminer is "independent" as defined by the SEC for purposes of audit committee financial expert determinations.
Item 4. Principal Accountant Fees and Services.
(a) Audit Fees. The aggregate fees billed for each of the last two fiscal years (the "Reporting Periods") for professional services rendered by the Registrant's principal accountant (the "Auditor") for the audit of the Registrant's annual financial statements or services that are normally provided by the Auditor in connection with the statutory and regulatory filings or engagements for the Reporting Periods, were $165,378 in 2018 and $170,272 in 2019.
(b) Audit-Related Fees. The aggregate fees billed in the Reporting Periods for assurance and related services by the Auditor that are reasonably related to the performance of the audit of the Registrant's financial statements and are not reported under paragraph (a) of this Item 4 were $33,205 in 2018 and $33,764 in 2019. These services consisted of one or more of the following: (i) agreed upon procedures related to compliance with Internal Revenue Code section 817(h), (ii) security counts required by Rule 17f-2 under the Investment Company Act of 1940, as amended, (iii) advisory services as to the accounting or disclosure treatment of Registrant transactions or events and (iv) advisory services to the accounting or disclosure treatment of the actual or potential impact to the Registrant of final or proposed rules, standards or interpretations by the Securities and Exchange Commission, the Financial Accounting Standards Boards or other regulatory or standard-setting bodies.
The aggregate fees billed in the Reporting Periods for non-audit assurance and related services by the Auditor to the Registrant's investment adviser (not including any sub-investment adviser whose role is primarily portfolio management and is subcontracted with or overseen by another investment adviser), and any entity controlling, controlled by or under common control with the investment adviser that provides ongoing services to the Registrant ("Service Affiliates"), that were reasonably related to the performance of the annual audit of the Service Affiliate, which required pre-approval by the Audit Committee were $0 in 2018 and $0 in 2019.
(c) Tax Fees. The aggregate fees billed in the Reporting Periods for professional services rendered by the Auditor for tax compliance, tax advice, and tax planning ("Tax Services") were $17,058 in 2018 and $17,128 in 2019. These services consisted of: (i) review or preparation of U.S. federal, state, local and excise tax returns; (ii) U.S. federal, state and local tax planning, advice and assistance regarding statutory, regulatory or administrative developments; (iii) tax advice regarding tax qualification matters and/or treatment of various financial instruments held or proposed to be acquired or held, and (iv) determination of Passive Foreign Investment Companies. The aggregate fees billed in the Reporting Periods for Tax Services by the Auditor to Service Affiliates, which required pre-approval by the Audit Committee were $0 in 2018 and $0 in 2019.
(d) All Other Fees. The aggregate fees billed in the Reporting Periods for products and services provided by the Auditor, other than the services reported in paragraphs (a) through (c) of this Item, were $396 in 2018 and $541 in 2019. These services consisted of a review of the Registrant's anti-money laundering program.
The aggregate fees billed in the Reporting Periods for Non-Audit Services by the Auditor to Service Affiliates, other than the services reported in paragraphs (b) through (c) of this Item, which required pre-approval by the Audit Committee, were $0 in 2018 and $0 in 2019.
(e)(1)Audit Committee Pre-Approval Policies and Procedures. The Registrant's Audit Committee has established policies and procedures (the "Policy") for pre-approval (within specified fee limits) of the Auditor's engagements for non-audit services to the Registrant and Service Affiliates without specific case-by-case consideration. The pre-approved services in the Policy can include pre-approved audit services, pre-approved audit-related services, pre-approved tax services and pre-approved all other services. Pre-approval considerations include whether the proposed services are compatible with maintaining the Auditor's independence. Pre-approvals pursuant to the Policy are considered annually.
(e)(2)Note. None of the services described in paragraphs (b) through (d) of this Item 4 were approved by the Audit Committee pursuant to paragraph (c)(7)(i)(C) of Rule 2-01 of Regulation S-X.
(f) None of the hours expended on the principal accountant's engagement to audit the registrant's financial statements for the most recent fiscal year were attributed to work performed by persons other than the principal accountant's full-time, permanent employees.
Non-Audit Fees. The aggregate non-audit fees billed by the Auditor for services rendered to the Registrant, and rendered to Service Affiliates, for the Reporting Periods were $673,321 in 2018 and $700,014 in 2019.
Auditor Independence. The Registrant's Audit Committee has considered whether the provision of non-audit services that were rendered to Service Affiliates, which were not pre-approved (not requiring pre-approval), is compatible with maintaining the Auditor's independence.
Item 5. Audit Committee of Listed Registrants.
Not applicable.
Item 6. Investments.
(a) Not applicable.
Item 7. Disclosure of Proxy Voting Policies and Procedures for Closed-End Management Investment Companies.
Not applicable.
Item 8. Portfolio Managers of Closed-End Management Investment Companies.
Not applicable.
Item 9. Purchases of Equity Securities by Closed-End Management Investment Companies and Affiliated Purchasers.
Not applicable.
Item 10. Submission of Matters to a Vote of Security Holders.
There have been no material changes to the procedures applicable to Item 10.
Item 11. Controls and Procedures.
(a) The Registrant's principal executive and principal financial officers have concluded, based on their evaluation of the Registrant's disclosure controls and procedures as of a date within 90 days of the filing date of this report, that the Registrant's disclosure controls and procedures are reasonably designed to ensure that information required to be disclosed by the Registrant on Form N-CSR is recorded, processed, summarized and reported within the required time periods and that information required to be disclosed by the Registrant in the reports that it files or submits on Form N-CSR is accumulated and communicated to the Registrant's management, including its principal executive and principal financial officers, as appropriate to allow timely decisions regarding required disclosure.
(b) There were no changes to the Registrant's internal control over financial reporting that occurred during the second fiscal quarter of the period covered by this report that have materially affected, or are reasonably likely to materially affect, the Registrant's internal control over financial reporting.
Item 12. Disclosure of Securities Lending Activities for Closed-End Management Investment Companies.
Not applicable.
Item 13. Exhibits.
(a)(1) Code of ethics referred to in Item 2.
(a)(2) Certifications of principal executive and principal financial officers as required by Rule 30a-2(a) under the Investment Company Act of 1940.
(a)(3) Not applicable.
(b) Certification of principal executive and principal financial officers as required by Rule 30a-2(b) under the Investment Company Act of 1940.
SIGNATURES
Pursuant to the requirements of the Securities Exchange Act of 1934 and the Investment Company Act of 1940, the Registrant has duly caused this Report to be signed on its behalf by the undersigned, thereunto duly authorized.
BNY Mellon Strategic Funds, Inc.
By: /s/ Renee LaRoche-Morris
Renee LaRoche-Morris
President (Principal Executive Officer)
Date: January 27, 2020
Pursuant to the requirements of the Securities Exchange Act of 1934 and the Investment Company Act of 1940, this Report has been signed below by the following persons on behalf of the Registrant and in the capacities and on the dates indicated.
By: /s/ Renee LaRoche-Morris
Renee LaRoche-Morris
President (Principal Executive Officer)
Date: January 27, 2020
By: /s/ James Windels
James Windels
Treasurer (Principal Financial Officer)
Date: January 24, 2020
EXHIBIT INDEX
(a)(1) Code of ethics referred to in Item 2.
(a)(2) Certifications of principal executive and principal financial officers as required by Rule 30a-2(a) under the Investment Company Act of 1940. (EX-99.CERT)
(b) Certification of principal executive and principal financial officers as required by Rule 30a-2(b) under the Investment Company Act of 1940. (EX-99.906CERT)