UNITED STATES
SECURITIES AND EXCHANGE COMMISSION
Washington, D.C. 20549
FORM N-CSR
CERTIFIED SHAREHOLDER REPORT OF REGISTERED MANAGEMENT
INVESTMENT COMPANIES
| Investment Company Act file number | 811-03940 | |||||
| BNY Mellon Strategic Funds, Inc. | ||||||
| (Exact name of Registrant as specified in charter) | ||||||
c/o BNY Mellon Investment Adviser, Inc. 240 Greenwich Street New York, New York 10286 | ||||||
| (Address of principal executive offices) (Zip code) | ||||||
Deirdre Cunnane, Esq. 240 Greenwich Street New York, New York 10286 | ||||||
| (Name and address of agent for service) | ||||||
| Registrant's telephone number, including area code: | (212) 922-6400 | |||||
Date of fiscal year end:
| 11/30 | |||||
| Date of reporting period: | 11/30/22
| |||||
The following N-CSR relates only to the Registrant's series listed below and does not relate to any series of the Registrant with a different fiscal year end and, therefore, different N-CSR reporting requirements. A separate N-CSR will be filed for any series with a different fiscal year end, as appropriate.
BNY Mellon Global Stock Fund
BNY Mellon International Stock Fund
BNY Mellon Select Managers Small Cap Value Fund
BNY Mellon U.S. Equity Fund
FORM N-CSR
Item 1. Reports to Stockholders.
BNY Mellon Global Stock Fund
ANNUAL REPORT November 30, 2022 |
|

Save time. Save paper. View your next shareholder report online as soon as it’s available. Log into www.im.bnymellon.com and sign up for eCommunications. It’s simple and only takes a few minutes. |
The views expressed in this report reflect those of the portfolio manager(s) only through the end of the period covered and do not necessarily represent the views of BNY Mellon Investment Adviser, Inc. or any other person in the BNY Mellon Investment Adviser, Inc. organization. Any such views are subject to change at any time based upon market or other conditions and BNY Mellon Investment Adviser, Inc. disclaims any responsibility to update such views. These views may not be relied on as investment advice and, because investment decisions for a fund in the BNY Mellon Family of Funds are based on numerous factors, may not be relied on as an indication of trading intent on behalf of any fund in the BNY Mellon Family of Funds. |
Not FDIC-Insured • Not Bank-Guaranteed • May Lose Value |
Contents
THE FUND
Information About the Renewal of | |
FOR MORE INFORMATION
Back Cover
DISCUSSION OF FUND PERFORMANCE (Unaudited)
For the period from December 1, 2021, through November 30, 2022, as provided by Charlie Macquaker, Roy Leckie, Jane Henderson, Fraser Fox and Maxim Skorniakov, members of the Investment Executive group at Walter Scott & Partners Limited (Walter Scott), sub-adviser.
Market and Fund Performance Overview
For the 12-month period ended November 30, 2022, the BNY Mellon Global Stock Fund’s (the “fund”) Class A shares achieved a total return of −11.84%, Class C shares returned −12.59%, Class I shares returned −11.59% and Class Y shares returned −11.58%.1 For the same period, the fund’s benchmark, the MSCI World Index (the “Index”), achieved a total return of −10.86%.2
Global stocks lost ground during the reporting period under pressure from increasing inflation, slowing economic growth and uncertainties related to Russia’s invasion of Ukraine. The fund underperformed the Index largely due to the fund’s tilt in favor of growth at a time when markets favored value-oriented stocks over their growth-oriented counterparts.
The Fund’s Investment Approach
The fund seeks long-term total return. To pursue its goal, the fund normally invests at least 80% of its net assets, plus any borrowings for investment purposes, in stocks. The fund’s investments will be focused on companies located in developed markets. The fund ordinarily invests in at least three countries and is not geographically limited in its investment selection but, at times, may invest a substantial portion of its assets in a single country. The fund may invest in the securities of companies of any market capitalization. Walter Scott seeks investment opportunities in companies with fundamental strengths that indicate the potential for sustainable growth. Walter Scott focuses on individual stock selection, building the fund’s portfolio from the bottom up through extensive fundamental research. The investment process begins with the screening of reported company financials. Companies that meet certain broad, absolute and trend criteria are candidates for more detailed financial analysis. The fund’s Investment Team collectively reviews and selects those stocks that meet Walter Scott’s criteria, and where the expected growth rate is combined with a reasonable valuation for the underlying equity. Geographic and sector allocations are the result of, not part of, the investment process, because the Investment Team’s sole focus is on the analysis of, and investment in, individual companies.
Inflation-Driven Rate Increases Pressure Markets
Shifting global monetary policy weighed on international equities from the start of the reporting period, with stretched valuations a cause for concern in the face of a December 2021 interest-rate increase from the Bank of England and increasingly hawkish rhetoric from the U.S. Federal Reserve (the “Fed”). Inflationary forces were exacerbated by the Russian invasion of Ukraine in early 2022. As the largest land war in Europe since World War II continued with no sign of an early resolution, European markets began contemplating the possibility of reduced or curtailed oil and natural gas exports from Russia, a leading source of energy commodities to the continent. Energy costs, already at elevated levels, spiked higher, along with prices of crucial agricultural chemicals and industrial metals. COVID-19-related lockdowns in China snarled global supply lines, creating product shortages and leading to still higher prices. The Fed responded to mounting inflationary pressures with its most
2
aggressive series of interest-rate increases in decades. Most other central banks followed suit with rate increases of their own, raising the specter of a possible recession, which put further downward pressure on equity markets, particularly richly valued, growth-oriented shares in the information technology and consumer discretionary sectors.
International equities moved higher in October and November 2022, as international economies showed signs of slowing in response to monetary policies and other macroeconomic pressures, reducing the likelihood of further, sharp rate increases. However, the risk of recession remained a real concern, with Europe and the UK seen as especially vulnerable.
The Fund’s Bias Toward Growth Detracts
The market’s shift from favoring growth-oriented shares with high p/e (price/earnings) multiples to favoring value-oriented shares with lower p/e multiples raised significant headwinds for the fund, which held a large proportion of positions in richly valued companies with growth characteristics. Some holdings also encountered problems related to the fallout from adverse macroeconomic conditions, including inflation, supply-chain constraints and slowing growth in China. The three most significant detractors from relative returns included Taiwan-based semiconductor manufacturer Taiwan Semiconductor Manufacturing (TSMC), Japan-based automation equipment maker Keyence and U.S.-based digital document company Adobe. Shares in TSMC were undermined by increased risks related to geopolitical tensions between China and Taiwan, and by the market’s preconception of the cyclical nature of the semiconductor industry. We believe, however, that TSMC’s focus on specialized semiconductors make it less vulnerable to cyclical fluctuations than many other companies in its industry. Keyence entered the reporting period with a relatively high valuation in the wake of a strong 2021 performance and was punished by the market despite reasonably strong financial performance, solid fundamentals and, in our opinion, favorable growth prospects. Adobe, which had seen robust growth during the height of the pandemic as users depended on its products while working from home, faced a more challenging environment as more employees began moving back to the office. Shares also traded off on the market’s reaction to the company’s acquisition of competitor Figma.
On a more positive note, several holdings contributed positively to the fund’s returns relative to the Index. Among the most notable, shares in U.S.-based staffing and employment services provider Automatic Data Processing were bolstered by the company’s strong execution amid favorable macro trends in employment, with additional benefits from the company’s leverage to rising interest rates. Shares in Denmark-based biotechnology company Novo Nordisk rose as the company resolved production problems with its successful, recently approved weight-loss drug Wegovy, along with raised guidance from management and an increased share buyback program. Finally, shares in U.S.-based off-price clothing retailer The TJX Companies performed well as increasingly price-conscious consumers turned to discounters in the face of rising expenses.
Remaining Focused on High-Quality Companies with Strong Fundamentals
Over the shorter term, we believe asset prices are likely to remain volatile as the Fed struggles to constrain inflationary pressures, with the possibility of a recession still on the horizon. While many companies have effectively controlled costs and continued to report
3
DISCUSSION OF FUND PERFORMANCE (Unaudited) (continued)
reasonably strong earnings despite those pressures, we expect businesses to face increasing difficulties in meeting financial expectations if interest rates continue to rise while economic growth falters. We believe the fund’s holdings are relatively well positioned to outperform in the face of prevailing market uncertainties due to their high-quality, defensive characteristics and solid fundamentals, which enable them to operate effectively in varying economic environments.
December 15, 2022
1 Total return includes reinvestment of dividends and any capital gains paid and does not take into consideration the maximum initial sales charge in the case of Class A shares, or the applicable contingent deferred sales charge imposed on redemptions in the case of Class C shares. Had these charges been reflected, returns would have been lower. Past performance is no guarantee of future results. Share price, yield and investment return fluctuate such that upon redemption, fund shares may be worth more or less than their original cost.
2 Source: Lipper Inc. — The MSCI World Index is a free float-adjusted, market capitalization-weighted index that is designed to
measure the equity market performance of developed markets. It reflects reinvestment of net dividends and, where applicable, capital gain distributions. Investors cannot invest directly in any index.
Equities are subject generally to market, market sector, market liquidity, issuer and investment style risks, among other factors, to varying degrees, all of which are more fully described in the fund’s prospectus.
Investing internationally involves special risks, including changes in currency exchange rates, political, economic, and social instability, a lack of comprehensive company information, differing auditing and legal standards, and less market liquidity. These risks generally are greater with emerging-market countries than with more economically and politically established foreign countries.
Small and midsized company stocks tend to be more volatile and less liquid than larger company stocks as these companies are less established and have more volatile earnings histories.
The fund may, but is not required to, use derivative instruments. A small investment in derivatives could have a potentially large impact on the fund’s performance. The use of derivatives involves risks different from, or possibly greater than, the risks associated with investing directly in the underlying assets.
Recent market risks include pandemic risks related to COVID-19. The effects of COVID-19 have contributed to increased volatility in global markets and will likely affect certain countries, companies, industries and market sectors more dramatically than others. To the extent the fund may overweight its investments in certain countries, companies, industries or market sectors, such positions will increase the fund’s exposure to risk of loss from adverse developments affecting those countries, companies, industries or sectors.
4
FUND PERFORMANCE (Unaudited)
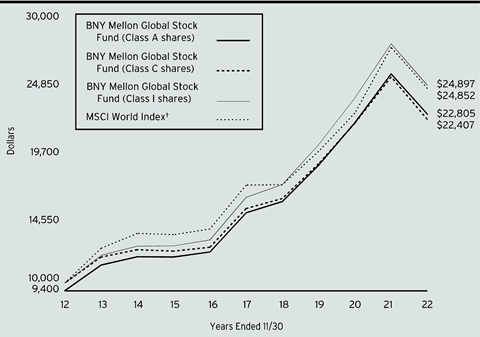
Comparison of change in value of a $10,000 investment in Class A shares, Class C shares, and Class I shares of BNY Mellon Global Stock Fund with a hypothetical investment of $10,000 in the MSCI World Index (the “Index”).
† Source: Lipper Inc.
Past performance is not predictive of future performance.
The above graph compares a hypothetical investment of $10,000 made in each of the Class A shares, Class C shares, and Class I shares of BNY Mellon Global Stock Fund on 11/30/12 to a hypothetical investment of $10,000 made in the Index on that date. All dividends and capital gain distributions are reinvested.
The fund’s performance shown in the line graph above takes into account the maximum initial sales charge on Class A shares and all other applicable fees and expenses on Class A shares, Class C shares, and Class I shares. The Index is a free float-adjusted market capitalization-weighted index that is designed to measure the equity market performance of developed markets. Unlike a mutual fund, the Index is not subject to charges, fees and other expenses. Investors cannot invest directly in any index. Further information relating to fund performance, including expense reimbursements, if applicable, is contained in the Financial Highlights section of the prospectus and elsewhere in this report.
5
FUND PERFORMANCE (Unaudited) (continued)
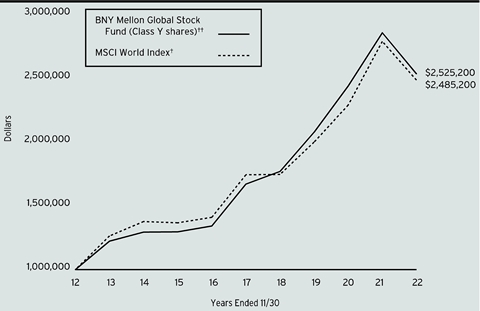
Comparison of change in value of a $1,000,000 investment in Class Y shares of BNY Mellon Global Stock Fund with a hypothetical investment of $1,000,000 in the MSCI World Index (the “Index”).
† Source: Lipper Inc.
†† The total return figures presented for Class Y shares of the fund reflect the performance of the fund’s Class A shares for the period prior to 7/1/13 (the inception date for Class Y shares), not reflecting the applicable sales charges for Class A shares.
Past performance is not predictive of future performance.
The above graph compares a hypothetical investment of $1,000,000 made in Class Y shares of BNY Mellon Global Stock Fund on 11/30/12 to a hypothetical investment of $1,000,000 made in the Index on that date. All dividends and capital gain distributions are reinvested.
The fund’s performance shown in the line graph above takes into account all applicable fees and expenses on the fund’s Class Y shares. The Index is a free float-adjusted market capitalization-weighted index that is designed to measure the equity market performance of developed markets. Unlike a mutual fund, the Index is not subject to charges, fees and other expenses. Investors cannot invest directly in any index. Further information relating to fund performance, including expense reimbursements, if applicable, is contained in the Financial Highlights section of the prospectus and elsewhere in this report.
6
Average Annual Total Returns as of 11/30/2022 | ||||
| Inception | 1 Year | 5 Years | 10 Years |
Class A shares | ||||
with maximum sales charge (5.75%) | 12/29/06 | -16.90% | 7.00% | 8.59% |
without sales charge | 12/29/06 | -11.84% | 8.28% | 9.24% |
Class C shares | ||||
with applicable redemption charge † | 12/29/06 | -13.38% | 7.44% | 8.40% |
without redemption | 12/29/06 | -12.59% | 7.44% | 8.40% |
Class I shares | 12/29/06 | -11.59% | 8.57% | 9.55% |
Class Y shares | 7/1/13 | -11.58% | 8.63% | 9.71%†† |
MSCI World Index | -10.86% | 7.35% | 9.53% | |
† The maximum contingent deferred sales charge for Class C shares is 1% for shares redeemed within one year of the date of purchase.
†† The total return performance figures presented for Class Y shares of the fund reflect the performance of the fund’s Class A shares for the period prior to 7/1/13 (the inception date for Class Y shares), not reflecting the applicable sales charges for Class A shares.
The performance data quoted represents past performance, which is no guarantee of future results. Share price and investment return fluctuate and an investor’s shares may be worth more or less than original cost upon redemption. Current performance may be lower or higher than the performance quoted. Go to www.im.bnymellon.com for the fund’s most recent month-end returns.
The fund's performance shown in the graphs and table does not reflect the deduction of taxes that a shareholder would pay on fund distributions or the redemption of fund shares. In addition to the performance of Class A shares shown with and without a maximum sales charge, the fund's performance shown in the table takes into account all other applicable fees and expenses on all classes.
7
UNDERSTANDING YOUR FUND’S EXPENSES (Unaudited)
As a mutual fund investor, you pay ongoing expenses, such as management fees and other expenses. Using the information below, you can estimate how these expenses affect your investment and compare them with the expenses of other funds. You also may pay one-time transaction expenses, including sales charges (loads) and redemption fees, which are not shown in this section and would have resulted in higher total expenses. For more information, see your fund’s prospectus or talk to your financial adviser.
Review your fund’s expenses
The table below shows the expenses you would have paid on a $1,000 investment in BNY Mellon Global Stock Fund from June 1, 2022 to November 30, 2022. It also shows how much a $1,000 investment would be worth at the close of the period, assuming actual returns and expenses.
Expenses and Value of a $1,000 Investment |
| |||||
Assume actual returns for the six months ended November 30, 2022 |
| |||||
|
|
|
|
|
|
|
|
| Class A | Class C | Class I | Class Y |
|
Expenses paid per $1,000† | $6.17 | $10.21 | $4.57 | $4.52 |
| |
Ending value (after expenses) | $1,000.90 | $996.70 | $1,002.60 | $1,002.60 |
| |
COMPARING YOUR FUND’S EXPENSES WITH THOSE OF OTHER FUNDS (Unaudited)
Using the SEC’s method to compare expenses
The Securities and Exchange Commission (“SEC”) has established guidelines to help investors assess fund expenses. Per these guidelines, the table below shows your fund’s expenses based on a $1,000 investment, assuming a hypothetical 5% annualized return. You can use this information to compare the ongoing expenses (but not transaction expenses or total cost) of investing in the fund with those of other funds. All mutual fund shareholder reports will provide this information to help you make this comparison. Please note that you cannot use this information to estimate your actual ending account balance and expenses paid during the period.
Expenses and Value of a $1,000 Investment |
| |||||
Assuming a hypothetical 5% annualized return for the six months ended November 30, 2022 |
| |||||
|
|
|
|
|
|
|
|
| Class A | Class C | Class I | Class Y |
|
Expenses paid per $1,000† | $6.23 | $10.30 | $4.61 | $4.56 |
| |
Ending value (after expenses) | $1,018.90 | $1,014.84 | $1,020.51 | $1,020.56 |
| |
† | Expenses are equal to the fund’s annualized expense ratio of 1.23% for Class A, 2.04% for Class C, .91% for Class I and .90% for Class Y, multiplied by the average account value over the period, multiplied by 183/365 (to reflect the one-half year period). | |||||
8
STATEMENT OF INVESTMENTS
November 30, 2022
Description | Shares | Value ($) | |||||
Common Stocks - 98.8% | |||||||
Australia - 2.5% | |||||||
CSL Ltd. | 130,000 | 26,706,627 | |||||
Canada - 5.3% | |||||||
Alimentation Couche-Tard Inc. | 575,400 | 26,213,071 | |||||
Canadian National Railway Co. | 229,100 | 29,411,797 | |||||
55,624,868 | |||||||
Denmark - 3.9% | |||||||
Novo Nordisk A/S, Cl. B | 326,200 | 40,836,875 | |||||
Finland - 1.3% | |||||||
Kone OYJ, Cl. B | 273,000 | 13,723,811 | |||||
France - 5.5% | |||||||
L'Oreal SA | 70,700 | 26,739,145 | |||||
LVMH SE | 40,800 | 31,589,837 | |||||
58,328,982 | |||||||
Hong Kong - 3.2% | |||||||
AIA Group Ltd. | 2,828,600 | 28,848,849 | |||||
Jardine Matheson Holdings Ltd. | 107,300 | 5,192,466 | |||||
34,041,315 | |||||||
Ireland - 2.2% | |||||||
Experian PLC | 662,200 | 23,544,310 | |||||
Japan - 6.2% | |||||||
Keyence Corp. | 69,028 | 29,354,874 | |||||
Shin-Etsu Chemical Co. | 177,700 | 23,020,158 | |||||
SMC Corp. | 29,600 | 13,539,944 | |||||
65,914,976 | |||||||
Spain - 1.2% | |||||||
Industria de Diseno Textil SA | 481,600 | a | 12,486,395 | ||||
Switzerland - 5.5% | |||||||
Nestle SA | 172,800 | 20,563,061 | |||||
Roche Holding AG | 71,600 | 23,272,658 | |||||
SGS SA | 6,300 | 14,731,045 | |||||
58,566,764 | |||||||
Taiwan - 2.7% | |||||||
Taiwan Semiconductor Manufacturing Co., ADR | 341,700 | 28,354,266 | |||||
United Kingdom - 6.6% | |||||||
Compass Group PLC | 1,169,000 | 26,503,753 | |||||
Linde PLC | 102,800 | 34,590,144 | |||||
Prudential PLC | 759,900 | 9,066,337 | |||||
70,160,234 | |||||||
United States - 52.7% | |||||||
Adobe Inc. | 71,600 | b | 24,696,988 | ||||
9
STATEMENT OF INVESTMENTS (continued)
Description | Shares | Value ($) | |||||
Common Stocks - 98.8% (continued) | |||||||
United States - 52.7% (continued) | |||||||
Alphabet Inc., Cl. C | 285,940 | b | 29,008,613 | ||||
Amphenol Corp., Cl. A | 441,300 | 35,493,759 | |||||
Automatic Data Processing Inc. | 124,500 | 32,885,430 | |||||
Booking Holdings Inc. | 10,360 | b | 21,543,102 | ||||
Cisco Systems Inc. | 434,400 | 21,598,368 | |||||
Cognex Corp. | 173,200 | 8,621,896 | |||||
Cognizant Technology Solutions Corp., Cl. A | 319,600 | 19,882,316 | |||||
Colgate-Palmolive Co. | 55,893 | 4,330,590 | |||||
Edwards Lifesciences Corp. | 284,100 | b | 21,946,725 | ||||
Fastenal Co. | 508,500 | 26,192,835 | |||||
Fortinet Inc. | 320,400 | b | 17,032,464 | ||||
Illumina Inc. | 50,500 | b | 11,013,040 | ||||
Intuitive Surgical Inc. | 106,100 | b | 28,688,379 | ||||
IPG Photonics Corp. | 78,700 | b | 7,164,061 | ||||
Johnson & Johnson | 121,100 | 21,555,800 | |||||
Mastercard Inc., Cl. A | 92,600 | 33,002,640 | |||||
Microsoft Corp. | 152,700 | 38,959,878 | |||||
NIKE Inc., Cl. B | 211,200 | 23,166,528 | |||||
Paychex Inc. | 148,100 | 18,368,843 | |||||
Stryker Corp. | 72,700 | 17,003,803 | |||||
Texas Instruments Inc. | 163,600 | 29,523,256 | |||||
The TJX Companies | 331,500 | 26,536,575 | |||||
The Walt Disney Company | 171,600 | b | 16,794,492 | ||||
Waters Corp. | 68,700 | b | 23,811,420 | ||||
558,821,801 | |||||||
Total Common Stocks (cost $451,281,563) | 1,047,111,224 | ||||||
1-Day | |||||||
Investment Companies - .8% | |||||||
Registered Investment Companies - .8% | |||||||
Dreyfus Institutional Preferred Government Plus Money Market Fund, Institutional Shares | 3.94 | 8,741,138 | c | 8,741,138 | |||
10
Description | 1-Day | Shares | Value ($) | ||||
Investment of Cash Collateral for Securities Loaned - .4% | |||||||
Registered Investment Companies - .4% | |||||||
Dreyfus Institutional Preferred Government Plus Money Market Fund, SL Shares | 3.94 | 3,484,166 | c | 3,484,166 | |||
Total Investments (cost $463,506,867) | 100.0% | 1,059,336,528 | |||||
Cash and Receivables (Net) | .0% | 456,265 | |||||
Net Assets | 100.0% | 1,059,792,793 | |||||
ADR—American Depository Receipt
a Security, or portion thereof, on loan. At November 30, 2022, the value of the fund’s securities on loan was $3,333,344 and the value of the collateral was $3,484,166. In addition, the value of collateral may include pending sales that are also on loan.
b Non-income producing security.
c Investment in affiliated issuer. The investment objective of this investment company is publicly available and can be found within the investment company’s prospectus.
Portfolio Summary (Unaudited) † | Value (%) |
Software & Services | 17.4 |
Pharmaceuticals Biotechnology & Life Sciences | 13.9 |
Technology Hardware & Equipment | 9.7 |
Health Care Equipment & Services | 6.4 |
Capital Goods | 5.5 |
Semiconductors & Semiconductor Equipment | 5.5 |
Materials | 5.4 |
Consumer Durables & Apparel | 5.2 |
Consumer Services | 4.5 |
Media & Entertainment | 4.3 |
Retailing | 3.7 |
Commercial & Professional Services | 3.6 |
Insurance | 3.6 |
Household & Personal Products | 2.9 |
Transportation | 2.8 |
Food & Staples Retailing | 2.5 |
Food, Beverage & Tobacco | 1.9 |
Investment Companies | 1.2 |
100.0 |
† Based on net assets.
See notes to financial statements.
11
STATEMENT OF INVESTMENTS (continued)
Affiliated Issuers | ||||||
Description | Value ($) 11/30/2021 | Purchases ($)† | Sales ($) | Value ($) 11/30/2022 | Dividends/ | |
Registered Investment Companies - .8% | ||||||
Dreyfus Institutional Preferred Government Plus Money Market Fund, Institutional Shares - .8% | 19,642,602 | 189,031,180 | (199,932,644) | 8,741,138 | 160,326 | |
Investment of Cash Collateral for Securities Loaned - .4% | ||||||
Dreyfus Institutional Preferred Government Plus Money Market Fund, SL Shares - .4% | - | 13,071,342 | (9,587,176) | 3,484,166 | 39 | †† |
Total - 1.2% | 19,642,602 | 202,102,522 | (209,519,820) | 12,225,304 | 160,365 | |
† Includes reinvested dividends/distributions.
†† Represents securities lending income earned from the reinvestment of cash collateral from loaned securities, net of fees and collateral investment expenses, and other payments to and from borrowers of securities.
See notes to financial statements.
12
STATEMENT OF ASSETS AND LIABILITIES
November 30, 2022
|
|
|
|
|
|
|
|
|
| Cost |
| Value |
|
Assets ($): |
|
|
|
| ||
Investments in securities—See Statement of Investments |
|
|
| |||
Unaffiliated issuers | 451,281,563 |
| 1,047,111,224 |
| ||
Affiliated issuers |
| 12,225,304 |
| 12,225,304 |
| |
Tax reclaim receivable—Note 1(b) |
| 3,483,552 |
| |||
Receivable for investment securities sold |
| 1,876,880 |
| |||
Receivable for shares of Common Stock subscribed |
| 584,740 |
| |||
Dividends receivable |
| 534,129 |
| |||
Prepaid expenses |
|
|
|
| 56,010 |
|
|
|
|
|
| 1,065,871,839 |
|
Liabilities ($): |
|
|
|
| ||
Due to BNY Mellon Investment Adviser, Inc. and affiliates—Note 3(c) |
| 770,184 |
| |||
Cash overdraft due to Custodian |
|
| 7 |
| 8 |
|
Liability for securities on loan—Note 1(c) |
| 3,484,166 |
| |||
Payable for shares of Common Stock redeemed |
| 1,677,300 |
| |||
Directors’ fees and expenses payable |
| 24,481 |
| |||
Other accrued expenses |
|
|
|
| 122,907 |
|
|
|
|
|
| 6,079,046 |
|
Net Assets ($) |
|
| 1,059,792,793 |
| ||
Composition of Net Assets ($): |
|
|
|
| ||
Paid-in capital |
|
|
|
| 359,983,382 |
|
Total distributable earnings (loss) |
|
|
|
| 699,809,411 |
|
Net Assets ($) |
|
| 1,059,792,793 |
| ||
Net Asset Value Per Share | Class A | Class C | Class I | Class Y |
|
Net Assets ($) | 34,703,842 | 2,280,587 | 616,996,392 | 405,811,972 |
|
Shares Outstanding | 1,518,276 | 105,904 | 26,433,924 | 17,424,817 |
|
Net Asset Value Per Share ($) | 22.86 | 21.53 | 23.34 | 23.29 |
|
|
|
|
|
|
|
See notes to financial statements. |
|
|
|
|
|
13
STATEMENT OF OPERATIONS
Year Ended November 30, 2022
|
|
|
|
|
|
|
|
|
|
|
|
|
|
Investment Income ($): |
|
|
|
| ||
Income: |
|
|
|
| ||
Cash dividends (net of $1,255,804 foreign taxes withheld at source): |
| |||||
Unaffiliated issuers |
|
| 15,692,717 |
| ||
Affiliated issuers |
|
| 160,326 |
| ||
Income from securities lending—Note 1(c) |
|
| 39 |
| ||
Total Income |
|
| 15,853,082 |
| ||
Expenses: |
|
|
|
| ||
Management fee—Note 3(a) |
|
| 10,254,558 |
| ||
Shareholder servicing costs—Note 3(c) |
|
| 159,467 |
| ||
Directors’ fees and expenses—Note 3(d) |
|
| 112,293 |
| ||
Professional fees |
|
| 104,115 |
| ||
Custodian fees—Note 3(c) |
|
| 79,197 |
| ||
Registration fees |
|
| 69,326 |
| ||
Distribution fees—Note 3(b) |
|
| 22,826 |
| ||
Loan commitment fees—Note 2 |
|
| 21,358 |
| ||
Prospectus and shareholders’ reports |
|
| 19,597 |
| ||
Chief Compliance Officer fees—Note 3(c) |
|
| 17,027 |
| ||
Interest expense—Note 2 |
|
| 1,491 |
| ||
Miscellaneous |
|
| 44,867 |
| ||
Total Expenses |
|
| 10,906,122 |
| ||
Less—reduction in fees due to earnings credits—Note 3(c) |
|
| (804) |
| ||
Net Expenses |
|
| 10,905,318 |
| ||
Net Investment Income |
|
| 4,947,764 |
| ||
Realized and Unrealized Gain (Loss) on Investments—Note 4 ($): |
|
| ||||
Net realized gain (loss) on investments and foreign currency transactions | 114,538,018 |
| ||||
Net change in unrealized appreciation (depreciation) on investments | (291,210,715) |
| ||||
Net Realized and Unrealized Gain (Loss) on Investments |
|
| (176,672,697) |
| ||
Net (Decrease) in Net Assets Resulting from Operations |
| (171,724,933) |
| |||
|
|
|
|
|
|
|
See notes to financial statements. | ||||||
14
STATEMENT OF CHANGES IN NET ASSETS
|
|
|
| Year Ended November 30, | |||||
|
|
|
| 2022 |
| 2021 |
| ||
Operations ($): |
|
|
|
|
|
|
|
| |
Net investment income |
|
| 4,947,764 |
|
|
| 4,328,273 |
| |
Net realized gain (loss) on investments |
| 114,538,018 |
|
|
| 129,620,725 |
| ||
Net change in unrealized appreciation |
| (291,210,715) |
|
|
| 95,827,464 |
| ||
Net Increase (Decrease) in Net Assets | (171,724,933) |
|
|
| 229,776,462 |
| |||
Distributions ($): |
| ||||||||
Distributions to shareholders: |
|
|
|
|
|
|
|
| |
Class A |
|
| (4,038,293) |
|
|
| (2,168,361) |
| |
Class C |
|
| (402,809) |
|
|
| (430,557) |
| |
Class I |
|
| (77,813,997) |
|
|
| (58,199,516) |
| |
Class Y |
|
| (51,099,609) |
|
|
| (19,314,782) |
| |
Total Distributions |
|
| (133,354,708) |
|
|
| (80,113,216) |
| |
Capital Stock Transactions ($): |
| ||||||||
Net proceeds from shares sold: |
|
|
|
|
|
|
|
| |
Class A |
|
| 2,566,854 |
|
|
| 8,851,272 |
| |
Class C |
|
| 188,515 |
|
|
| 352,897 |
| |
Class I |
|
| 72,130,511 |
|
|
| 121,824,623 |
| |
Class Y |
|
| 26,529,561 |
|
|
| 267,649,784 |
| |
Distributions reinvested: |
|
|
|
|
|
|
|
| |
Class A |
|
| 3,707,708 |
|
|
| 1,974,862 |
| |
Class C |
|
| 356,095 |
|
|
| 403,712 |
| |
Class I |
|
| 72,709,117 |
|
|
| 54,658,318 |
| |
Class Y |
|
| 36,669,026 |
|
|
| 9,350,319 |
| |
Cost of shares redeemed: |
|
|
|
|
|
|
|
| |
Class A |
|
| (7,704,105) |
|
|
| (8,911,012) |
| |
Class C |
|
| (1,759,602) |
|
|
| (4,918,843) |
| |
Class I |
|
| (211,156,002) |
|
|
| (453,235,891) |
| |
Class Y |
|
| (104,730,636) |
|
|
| (84,245,826) |
| |
Increase (Decrease) in Net Assets | (110,492,958) |
|
|
| (86,245,785) |
| |||
Total Increase (Decrease) in Net Assets | (415,572,599) |
|
|
| 63,417,461 |
| |||
Net Assets ($): |
| ||||||||
Beginning of Period |
|
| 1,475,365,392 |
|
|
| 1,411,947,931 |
| |
End of Period |
|
| 1,059,792,793 |
|
|
| 1,475,365,392 |
| |
15
STATEMENT OF CHANGES IN NET ASSETS (continued)
|
|
|
| Year Ended November 30, | |||||
|
|
|
| 2022 |
| 2021 |
| ||
Capital Share Transactions (Shares): |
| ||||||||
Class Aa,b |
|
|
|
|
|
|
|
| |
Shares sold |
|
| 106,001 |
|
|
| 336,361 |
| |
Shares issued for distributions reinvested |
|
| 139,035 |
|
|
| 79,793 |
| |
Shares redeemed |
|
| (324,647) |
|
|
| (326,563) |
| |
Net Increase (Decrease) in Shares Outstanding | (79,611) |
|
|
| 89,591 |
| |||
Class Cb |
|
|
|
|
|
|
|
| |
Shares sold |
|
| 7,963 |
|
|
| 13,892 |
| |
Shares issued for distributions reinvested |
|
| 14,064 |
|
|
| 16,970 |
| |
Shares redeemed |
|
| (78,475) |
|
|
| (196,604) |
| |
Net Increase (Decrease) in Shares Outstanding | (56,448) |
|
|
| (165,742) |
| |||
Class Ia |
|
|
|
|
|
|
|
| |
Shares sold |
|
| 3,051,443 |
|
|
| 4,478,588 |
| |
Shares issued for distributions reinvested |
|
| 2,679,150 |
|
|
| 2,173,293 |
| |
Shares redeemed |
|
| (9,102,664) |
|
|
| (16,052,071) |
| |
Net Increase (Decrease) in Shares Outstanding | (3,372,071) |
|
|
| (9,400,190) |
| |||
Class Ya |
|
|
|
|
|
|
|
| |
Shares sold |
|
| 1,061,652 |
|
|
| 9,222,646 |
| |
Shares issued for distributions reinvested |
|
| 1,354,201 |
|
|
| 372,523 |
| |
Shares redeemed |
|
| (4,458,923) |
|
|
| (3,048,463) |
| |
Net Increase (Decrease) in Shares Outstanding | (2,043,070) |
|
|
| 6,546,706 |
| |||
|
|
|
|
|
|
|
|
|
|
a | During the period ended November 30, 2022, 1,971 Class Y shares representing $55,393 were exchanged for 2,001 Class A shares, and 274,616 Class Y shares representing $6,265,506 were exchanged for 273,993 Class I shares. During the period ended November 30, 2021, 235,093 Class Y shares representing $6,509,609 were exchanged for 234,700 Class I shares. | ||||||||
b | During the period ended November 30, 2021, 5,638 Class C shares representing $138,532 were automatically converted to 5,413 Class A shares. | ||||||||
See notes to financial statements. | |||||||||
16
FINANCIAL HIGHLIGHTS
The following tables describe the performance for each share class for the fiscal periods indicated. All information (except portfolio turnover rate) reflects financial results for a single fund share. Net asset value total return is calculated assuming an initial investment made at the net asset value at the beginning of the period, reinvestment of all dividends and distributions at net asset value during the period, and redemption at net asset value on the last day of the period. Net asset value total return includes adjustments in accordance with accounting principles generally accepted in the United States of America and as such, the net asset value for financial reporting purposes and the returns based upon those net asset values may differ from the net asset value and returns for shareholder transactions. These figures have been derived from the fund’s financial statements.
Year Ended November 30, | ||||||
Class A Shares | 2022 | 2021 | 2020 | 2019 | 2018 | |
Per Share Data ($): | ||||||
Net asset value, beginning of period | 28.41 | 25.74 | 23.07 | 21.08 | 21.53 | |
Investment Operations: | ||||||
Net investment incomea | .02 | .01 | .06 | .10 | .11 | |
Net realized and unrealized | (3.04) | 4.09 | 3.71 | 3.17 | 1.02 | |
Total from Investment Operations | (3.02) | 4.10 | 3.77 | 3.27 | 1.13 | |
Distributions: | ||||||
Dividends from | (.00)b | (.08) | (.10) | (.12) | (.15) | |
Dividends from net realized | (2.53) | (1.35) | (1.00) | (1.16) | (1.43) | |
Total Distributions | (2.53) | (1.43) | (1.10) | (1.28) | (1.58) | |
Net asset value, end of period | 22.86 | 28.41 | 25.74 | 23.07 | 21.08 | |
Total Return (%)c | (11.84) | 16.72 | 17.00 | 17.04 | 5.61 | |
Ratios/Supplemental Data (%): | ||||||
Ratio of total expenses | 1.22 | 1.20 | 1.23 | 1.21 | 1.20 | |
Ratio of net expenses | 1.22 | 1.20 | 1.23 | 1.21 | 1.20 | |
Ratio of net investment income | .09 | .03 | .27 | .46 | .52 | |
Portfolio Turnover Rate | 1.10 | 9.79 | 4.13 | 6.62 | 8.15 | |
Net Assets, end of period ($ x 1,000) | 34,704 | 45,402 | 38,828 | 35,891 | 29,369 | |
a Based on average shares outstanding.
b Amount represents less than $.001 per share.
c Exclusive of sales charge.
See notes to financial statements.
17
FINANCIAL HIGHLIGHTS (continued)
Year Ended November 30, | ||||||
Class C Shares | 2022 | 2021 | 2020 | 2019 | 2018 | |
Per Share Data ($): | ||||||
Net asset value, beginning of period | 27.11 | 24.73 | 22.26 | 20.41 | 20.89 | |
Investment Operations: | ||||||
Net investment (loss)a | (.15) | (.19) | (.10) | (.05) | (.05) | |
Net realized and unrealized | (2.90) | 3.92 | 3.57 | 3.06 | 1.00 | |
Total from Investment Operations | (3.05) | 3.73 | 3.47 | 3.01 | .95 | |
Distributions: | ||||||
Dividends from net realized | (2.53) | (1.35) | (1.00) | (1.16) | (1.43) | |
Net asset value, end of period | 21.53 | 27.11 | 24.73 | 22.26 | 20.41 | |
Total Return (%)b | (12.59) | 15.83 | 16.15 | 16.12 | 4.85 | |
Ratios/Supplemental Data (%): | ||||||
Ratio of total expenses | 2.01 | 1.97 | 1.98 | 1.96 | 1.97 | |
Ratio of net expenses | 2.01 | 1.97 | 1.98 | 1.96 | 1.97 | |
Ratio of net investment | (.69) | (.77) | (.45) | (.25) | (.22) | |
Portfolio Turnover Rate | 1.10 | 9.79 | 4.13 | 6.62 | 8.15 | |
Net Assets, end of period ($ x 1,000) | 2,281 | 4,401 | 8,114 | 11,260 | 11,008 | |
a Based on average shares outstanding.
b Exclusive of sales charge.
See notes to financial statements.
18
Year Ended November 30, | ||||||
Class I Shares | 2022 | 2021 | 2020 | 2019 | 2018 | |
Per Share Data ($): | ||||||
Net asset value, beginning of period | 28.95 | 26.19 | 23.44 | 21.41 | 21.83 | |
Investment Operations: | ||||||
Net investment incomea | .10 | .09 | .12 | .15 | .17 | |
Net realized and unrealized | (3.10) | 4.16 | 3.78 | 3.21 | 1.04 | |
Total from Investment Operations | (3.00) | 4.25 | 3.90 | 3.36 | 1.21 | |
Distributions: | ||||||
Dividends from | (.08) | (.14) | (.15) | (.17) | (.20) | |
Dividends from net realized | (2.53) | (1.35) | (1.00) | (1.16) | (1.43) | |
Total Distributions | (2.61) | (1.49) | (1.15) | (1.33) | (1.63) | |
Net asset value, end of period | 23.34 | 28.95 | 26.19 | 23.44 | 21.41 | |
Total Return (%) | (11.59) | 17.07 | 17.32 | 17.32 | 5.89 | |
Ratios/Supplemental Data (%): | ||||||
Ratio of total expenses | .89 | .93 | .96 | .97 | .94 | |
Ratio of net expenses | .89 | .93 | .96 | .97 | .94 | |
Ratio of net investment income | .42 | .31 | .53 | .71 | .78 | |
Portfolio Turnover Rate | 1.10 | 9.79 | 4.13 | 6.62 | 8.15 | |
Net Assets, end of period ($ x 1,000) | 616,996 | 862,835 | 1,026,985 | 965,481 | 858,817 | |
a Based on average shares outstanding.
See notes to financial statements.
19
FINANCIAL HIGHLIGHTS (continued)
Year Ended November 30, | ||||||
Class Y Shares | 2022 | 2021 | 2020 | 2019 | 2018 | |
Per Share Data ($): | ||||||
Net asset value, beginning of period | 28.91 | 26.16 | 23.41 | 21.38 | 21.81 | |
Investment Operations: | ||||||
Net investment incomea | .10 | .08 | .14 | .17 | .18 | |
Net realized and unrealized | (3.10) | 4.17 | 3.78 | 3.20 | 1.04 | |
Total from Investment Operations | (3.00) | 4.25 | 3.92 | 3.37 | 1.22 | |
Distributions: | ||||||
Dividends from | (.09) | (.15) | (.17) | (.18) | (.22) | |
Dividends from net realized | (2.53) | (1.35) | (1.00) | (1.16) | (1.43) | |
Total Distributions | (2.62) | (1.50) | (1.17) | (1.34) | (1.65) | |
Net asset value, end of period | 23.29 | 28.91 | 26.16 | 23.41 | 21.38 | |
Total Return (%) | (11.58) | 17.11 | 17.43 | 17.36 | 5.98 | |
Ratios/Supplemental Data (%): | ||||||
Ratio of total expenses | .89 | .89 | .89 | .89 | .89 | |
Ratio of net expenses | .89 | .89 | .89 | .89 | .89 | |
Ratio of net investment income | .43 | .29 | .62 | .80 | .85 | |
Portfolio Turnover Rate | 1.10 | 9.79 | 4.13 | 6.62 | 8.15 | |
Net Assets, end of period ($ x 1,000) | 405,812 | 562,727 | 338,021 | 398,977 | 358,526 | |
a Based on average shares outstanding.
See notes to financial statements.
20
NOTES TO FINANCIAL STATEMENTS
NOTE 1—Significant Accounting Policies:
BNY Mellon Global Stock Fund (the “fund”) is a separate diversified series of BNY Mellon Strategic Funds, Inc. (the “Company”), which is registered under the Investment Company Act of 1940, as amended (the “Act”), as an open-end management investment company and operates as a series company currently offering six series, including the fund. The fund’s investment objective is to seek long-term total return. BNY Mellon Investment Adviser, Inc. (the “Adviser”), a wholly-owned subsidiary of The Bank of New York Mellon Corporation (“BNY Mellon”), serves as the fund’s investment adviser. Walter Scott & Partners Limited (the “Sub-Adviser”), a wholly-owned subsidiary of BNY Mellon and an affiliate of the Adviser, serves as the fund’s sub-adviser.
BNY Mellon Securities Corporation (the “Distributor”), a wholly-owned subsidiary of the Adviser, is the distributor of the fund’s shares. The fund is authorized to issue 600 million shares of $.001 par value Common Stock. The fund currently has authorized four classes of shares: Class A (100 million shares authorized), Class C (100 million shares authorized), Class I (250 million shares authorized) and Class Y (150 million shares authorized). Class A and Class C shares are sold primarily to retail investors through financial intermediaries and bear Distribution and/or Shareholder Services Plan fees. Class A shares generally are subject to a sales charge imposed at the time of purchase. Class A shares bought without an initial sales charge as part of an investment of $1 million or more may be charged a contingent deferred sales charge (“CDSC”) of 1.00% if redeemed within one year. Class C shares are subject to a CDSC imposed on Class C shares redeemed within one year of purchase. Class C shares automatically convert to Class A shares eight years after the date of purchase, without the imposition of a sales charge. Class I shares are sold primarily to bank trust departments and other financial service providers (including BNY Mellon and its affiliates), acting on behalf of customers having a qualified trust or an investment account or relationship at such institution, and bear no Distribution or Shareholder Services Plan fees. Class Y shares are sold at net asset value per share generally to institutional investors, and bear no Distribution or Shareholder Services Plan fees. Class I and Class Y shares are offered without a front-end sales charge or CDSC. Other differences between the classes include the services offered to and the expenses borne by each class, the allocation of certain transfer agency costs and certain voting rights. Income, expenses (other than expenses attributable to a specific class), and realized and unrealized gains or losses
21
NOTES TO FINANCIAL STATEMENTS (continued)
on investments are allocated to each class of shares based on its relative net assets.
The Company accounts separately for the assets, liabilities and operations of each series. Expenses directly attributable to each series are charged to that series’ operations; expenses which are applicable to all series are allocated among them on a pro rata basis.
The Financial Accounting Standards Board (“FASB”) Accounting Standards Codification (“ASC”) is the exclusive reference of authoritative U.S. generally accepted accounting principles (“GAAP”) recognized by the FASB to be applied by nongovernmental entities. Rules and interpretive releases of the SEC under authority of federal laws are also sources of authoritative GAAP for SEC registrants. The fund is an investment company and applies the accounting and reporting guidance of the FASB ASC Topic 946 Financial Services-Investment Companies. The fund’s financial statements are prepared in accordance with GAAP, which may require the use of management estimates and assumptions. Actual results could differ from those estimates.
The Company enters into contracts that contain a variety of indemnifications. The fund’s maximum exposure under these arrangements is unknown. The fund does not anticipate recognizing any loss related to these arrangements.
(a) Portfolio valuation: The fair value of a financial instrument is the amount that would be received to sell an asset or paid to transfer a liability in an orderly transaction between market participants at the measurement date (i.e., the exit price). GAAP establishes a fair value hierarchy that prioritizes the inputs of valuation techniques used to measure fair value. This hierarchy gives the highest priority to unadjusted quoted prices in active markets for identical assets or liabilities (Level 1 measurements) and the lowest priority to unobservable inputs (Level 3 measurements).
Additionally, GAAP provides guidance on determining whether the volume and activity in a market has decreased significantly and whether such a decrease in activity results in transactions that are not orderly. GAAP requires enhanced disclosures around valuation inputs and techniques used during annual and interim periods.
Various inputs are used in determining the value of the fund’s investments relating to fair value measurements. These inputs are summarized in the three broad levels listed below:
Level 1—unadjusted quoted prices in active markets for identical investments.
22
Level 2—other significant observable inputs (including quoted prices for similar investments, interest rates, prepayment speeds, credit risk, etc.).
Level 3—significant unobservable inputs (including the fund’s own assumptions in determining the fair value of investments).
The inputs or methodology used for valuing securities are not necessarily an indication of the risk associated with investing in those securities.
Changes in valuation techniques may result in transfers in or out of an assigned level within the disclosure hierarchy. Valuation techniques used to value the fund’s investments are as follows:
The Company’s Board of Directors (the “Board”) has designated the Adviser as the fund’s valuation designee, effective September 8, 2022, to make all fair value determinations with respect to the fund’s portfolio investments, subject to the Board’s oversight and pursuant to Rule 2a-5 under the Act.
Investments in equity securities are valued at the last sales price on the securities exchange or national securities market on which such securities are primarily traded. Securities listed on the National Market System for which market quotations are available are valued at the official closing price or, if there is no official closing price that day, at the last sales price. For open short positions, asked prices are used for valuation purposes. Bid price is used when no asked price is available. Registered investment companies that are not traded on an exchange are valued at their net asset value. All of the preceding securities are generally categorized within Level 1 of the fair value hierarchy.
Securities not listed on an exchange or the national securities market, or securities for which there were no transactions, are valued at the average of the most recent bid and asked prices. These securities are generally categorized within Level 2 of the fair value hierarchy.
Fair valuing of securities may be determined with the assistance of a pricing service using calculations based on indices of domestic securities and other appropriate indicators, such as prices of relevant American Depository Receipts and futures. Utilizing these techniques may result in transfers between Level 1 and Level 2 of the fair value hierarchy.
When market quotations or official closing prices are not readily available, or are determined not to accurately reflect fair value, such as when the value of a security has been significantly affected by events after the close of the exchange or market on which the security is principally traded (for example, a foreign exchange or market), but before the fund calculates its
23
NOTES TO FINANCIAL STATEMENTS (continued)
net asset value, the fund may value these investments at fair value as determined in accordance with the procedures approved by the Board. Certain factors may be considered when fair valuing investments such as: fundamental analytical data, the nature and duration of restrictions on disposition, an evaluation of the forces that influence the market in which the securities are purchased and sold, and public trading in similar securities of the issuer or comparable issuers. These securities are either categorized within Level 2 or 3 of the fair value hierarchy depending on the relevant inputs used.
For securities where observable inputs are limited, assumptions about market activity and risk are used and such securities are generally categorized within Level 3 of the fair value hierarchy.
Investments denominated in foreign currencies are translated to U.S. dollars at the prevailing rates of exchange.
The following is a summary of the inputs used as of November 30, 2022 in valuing the fund’s investments:
Level 1-Unadjusted Quoted Prices | Level 2- Other Significant Observable Inputs | Level 3-Significant Unobservable Inputs | Total | |||
Assets ($) | ||||||
Investments in Securities:† | ||||||
Equity Securities - Common Stocks | 677,391,079 | 369,720,145 | †† | - | 1,047,111,224 | |
Investment Companies | 12,225,304 | - | - | 12,225,304 | ||
† See Statement of Investments for additional detailed categorizations, if any.
†† Securities classified within Level 2 at period end as the values were determined pursuant to the fund’s fair valuation procedures.
(b) Foreign currency transactions: The fund does not isolate that portion of the results of operations resulting from changes in foreign exchange rates on investments from the fluctuations arising from changes in the market prices of securities held. Such fluctuations are included with the net realized and unrealized gain or loss on investments.
Net realized foreign exchange gains or losses arise from sales of foreign currencies, currency gains or losses realized on securities transactions between trade and settlement date, and the difference between the amounts of dividends, interest and foreign withholding taxes recorded on the fund’s books and the U.S. dollar equivalent of the amounts actually received or paid. Net unrealized foreign exchange gains and losses arise from changes in the value of assets and liabilities other than investments resulting from changes in exchange rates. Foreign currency gains and losses
24
on foreign currency transactions are also included with net realized and unrealized gain or loss on investments.
Foreign taxes: The fund may be subject to foreign taxes (a portion of which may be reclaimable) on income, stock dividends, realized and unrealized capital gains on investments or certain foreign currency transactions. Foreign taxes are recorded in accordance with the applicable foreign tax regulations and rates that exist in the foreign jurisdictions in which the fund invests. These foreign taxes, if any, are paid by the fund and are reflected in the Statement of Operations, if applicable. Foreign taxes payable or deferred or those subject to reclaims as of November 30, 2022, if any, are disclosed in the fund’s Statement of Assets and Liabilities.
(c) Securities transactions and investment income: Securities transactions are recorded on a trade date basis. Realized gains and losses from securities transactions are recorded on the identified cost basis. Dividend income is recognized on the ex-dividend date and interest income, including, where applicable, accretion of discount and amortization of premium on investments, is recognized on the accrual basis.
Pursuant to a securities lending agreement with BNY Mellon, the fund may lend securities to qualified institutions. It is the fund’s policy that, at origination, all loans are secured by collateral of at least 102% of the value of U.S. securities loaned and 105% of the value of foreign securities loaned. Collateral equivalent to at least 100% of the market value of securities on loan is maintained at all times. Collateral is either in the form of cash, which can be invested in certain money market mutual funds managed by the Adviser, or U.S. Government and Agency securities. The fund is entitled to receive all dividends, interest and distributions on securities loaned, in addition to income earned as a result of the lending transaction. Should a borrower fail to return the securities in a timely manner, BNY Mellon is required to replace the securities for the benefit of the fund or credit the fund with the market value of the unreturned securities and is subrogated to the fund’s rights against the borrower and the collateral. Additionally, the contractual maturity of security lending transactions are on an overnight and continuous basis. During the period ended November 30, 2022, BNY Mellon earned $5 from the lending of the fund’s portfolio securities, pursuant to the securities lending agreement.
(d) Affiliated issuers: Investments in other investment companies advised by the Adviser are considered “affiliated” under the Act.
(e) Market Risk: The value of the securities in which the fund invests may be affected by political, regulatory, economic and social developments,
25
NOTES TO FINANCIAL STATEMENTS (continued)
and developments that impact specific economic sectors, industries or segments of the market. The value of a security may also decline due to general market conditions that are not specifically related to a particular company or industry, such as real or perceived adverse economic conditions, changes in the general outlook for corporate earnings, changes in interest or currency rates, changes to inflation, adverse changes to credit markets or adverse investor sentiment generally. In addition, turbulence in financial markets and reduced liquidity in equity, credit and/or fixed income markets may negatively affect many issuers, which could adversely affect the fund. Global economies and financial markets are becoming increasingly interconnected, and conditions and events in one country, region or financial market may adversely impact issuers in a different country, region or financial market. These risks may be magnified if certain events or developments adversely interrupt the global supply chain; in these and other circumstances, such risks might affect companies world-wide. Recent examples include pandemic risks related to COVID-19 and aggressive measures taken world-wide in response by governments, including closing borders, restricting international and domestic travel, and the imposition of prolonged quarantines of large populations, and by businesses, including changes to operations and reducing staff.
Foreign Investment Risk: To the extent the fund invests in foreign securities, the fund’s performance will be influenced by political, social and economic factors affecting investments in foreign issuers. Special risk associated with investments in foreign issuers include exposure to currency fluctuations, less liquidity, less developed or less efficient trading markets, lack of comprehensive company information, political and economic instability and differing auditing and legal standards.
(f) Dividends and distributions to shareholders: Dividends and distributions are recorded on the ex-dividend date. Dividends from net investment income and dividends from net realized capital gains, if any, are normally declared and paid annually, but the fund may make distributions on a more frequent basis to comply with the distribution requirements of the Internal Revenue Code of 1986, as amended (the “Code”). To the extent that net realized capital gains can be offset by capital loss carryovers, it is the policy of the fund not to distribute such gains. Income and capital gain distributions are determined in accordance with income tax regulations, which may differ from GAAP.
(g) Federal income taxes: It is the policy of the fund to continue to qualify as a regulated investment company, if such qualification is in the best interests of its shareholders, by complying with the applicable provisions of the Code, and to make distributions of taxable income and
26
net realized capital gain sufficient to relieve it from substantially all federal income and excise taxes.
As of and during the period ended November 30, 2022, the fund did not have any liabilities for any uncertain tax positions. The fund recognizes interest and penalties, if any, related to uncertain tax positions as income tax expense in the Statement of Operations. During the period ended November 30, 2022, the fund did not incur any interest or penalties.
Each tax year in the four-year period ended November 30, 2022 remains subject to examination by the Internal Revenue Service and state taxing authorities.
At November 30, 2022, the components of accumulated earnings on a tax basis were as follows: undistributed ordinary income $4,929,701, undistributed capital gains $99,342,815 and unrealized appreciation $595,536,895.
The tax character of distributions paid to shareholders during the fiscal years ended November 30, 2022 and November 30, 2021 were as follows: ordinary income $5,403,849 and $11,198,204, and long-term capital gains $127,950,859 and $68,915,012, respectively.
During the period ended November 30, 2022, as a result of permanent book to tax differences, primarily due to the tax treatment for treating a portion of the proceeds from redemptions as a distribution for tax purposes, the fund decreased total distributable earnings (loss) by $15,196,471 and increased paid-in capital by the same amount. Net assets and net asset value per share were not affected by this reclassification.
NOTE 2—Bank Lines of Credit:
The fund participates with other long-term open-end funds managed by the Adviser in a $823.5 million unsecured credit facility led by Citibank, N.A. (the “Citibank Credit Facility”) and a $300 million unsecured credit facility provided by BNY Mellon (the “BNYM Credit Facility”), each to be utilized primarily for temporary or emergency purposes, including the financing of redemptions (each, a “Facility”). The Citibank Credit Facility is available in two tranches: (i) Tranche A is in an amount equal to $688.5 million and is available to all long-term open-ended funds, including the fund, and (ii) Tranche B is an amount equal to $135 million and is available only to BNY Mellon Floating Rate Income Fund, a series of BNY Mellon Investment Funds IV, Inc. In connection therewith, the fund has agreed to pay its pro rata portion of commitment fees for Tranche A of the Citibank Credit Facility and the BNYM Credit Facility. Interest is charged to the
27
NOTES TO FINANCIAL STATEMENTS (continued)
fund based on rates determined pursuant to the terms of the respective Facility at the time of borrowing.
The average amount of borrowings outstanding under the Facilities during the period ended November 30, 2022 was approximately $40,274 with a related weighted average annualized interest rate of 3.70%.
NOTE 3—Management Fee, Sub-Advisory Fee and Other Transactions with Affiliates:
(a) Pursuant to a management agreement with the Adviser, the management fee is computed at the annual rate of .85% of the value of the fund’s average daily net assets and is payable monthly.
Pursuant to a sub-investment advisory agreement between the Adviser and the Sub-Adviser, the Adviser pays the Sub-Adviser a monthly fee at an annual rate of .41% of the value of the fund’s average daily net assets.
During the period ended November 30, 2022, the Distributor retained $1,196 from commissions earned on sales of the fund’s Class A shares and $337 from CDSC fees on redemptions of the fund’s Class C shares.
(b) Under the Distribution Plan adopted pursuant to Rule 12b-1 under the Act, Class C shares pay the Distributor for distributing its shares at an annual rate of .75% of the value of its average daily net assets. The Distributor may pay one or more Service Agents in respect of advertising, marketing and other distribution services, and determines the amounts, if any, to be paid to Service Agents and the basis on which such payments are made. During the period ended November 30, 2022, Class C shares were charged $22,826 pursuant to the Distribution Plan.
(c) Under the Shareholder Services Plan, Class A and Class C shares pay the Distributor at an annual rate of .25% of the value of their average daily net assets for the provision of certain services. The services provided may include personal services relating to shareholder accounts, such as answering shareholder inquiries regarding the fund, and services related to the maintenance of shareholder accounts. The Distributor may make payments to Service Agents (securities dealers, financial institutions or other industry professionals) with respect to these services. The Distributor determines the amounts to be paid to Service Agents. During the period ended November 30, 2022, Class A and Class C shares were charged $93,819 and $7,609, respectively, pursuant to the Shareholder Services Plan.
The fund has an arrangement with BNY Mellon Transfer, Inc., (the “Transfer Agent”), a subsidiary of BNY Mellon and an affiliate of the Adviser, whereby the fund may receive earnings credits when positive cash
28
balances are maintained, which are used to offset Transfer Agent fees. For financial reporting purposes, the fund includes transfer agent net earnings credits, if any, as an expense offset in the Statement of Operations.
The fund has an arrangement with The Bank of New York Mellon (the “Custodian”), a subsidiary of BNY Mellon and an affiliate of the Adviser, whereby the fund will receive interest income or be charged overdraft fees when cash balances are maintained. For financial reporting purposes, the fund includes this interest income and overdraft fees, if any, as interest income in the Statement of Operations.
The fund compensates the Transfer Agent, under a transfer agency agreement, for providing transfer agency and cash management services for the fund. The majority of Transfer Agent fees are comprised of amounts paid on a per account basis, while cash management fees are related to fund subscriptions and redemptions. During the period ended November 30, 2022, the fund was charged $23,215 for transfer agency services. These fees are included in Shareholder servicing costs in the Statement of Operations. These fees were partially offset by earnings credits of $804.
The fund compensates the Custodian, under a custody agreement, for providing custodial services for the fund. These fees are determined based on net assets, geographic region and transaction activity. During the period ended November 30, 2022, the fund was charged $79,197 pursuant to the custody agreement.
During the period ended November 30, 2022, the fund was charged $17,027 for services performed by the fund’s Chief Compliance Officer and his staff. These fees are included in Chief Compliance Officer fees in the Statement of Operations.
The components of “Due to BNY Mellon Investment Adviser, Inc. and affiliates” in the Statement of Assets and Liabilities consist of: management fee of $714,378, Distribution Plan fees of $1,368, Shareholder Services Plan fees of $7,287, Custodian fees of $39,000, Chief Compliance Officer fees of $2,721 and Transfer Agent fees of $5,430.
(d) Each Board Member also serves as a Board Member of other funds in the BNY Mellon Family of Funds complex. Annual retainer fees and attendance fees are allocated to each fund based on net assets.
NOTE 4—Securities Transactions:
The aggregate amount of purchases and sales of investment securities, excluding short-term securities, during the period ended November 30, 2022, amounted to $13,204,119 and $242,559,375, respectively.
29
NOTES TO FINANCIAL STATEMENTS (continued)
At November 30, 2022, the cost of investments for federal income tax purposes was $463,723,821; accordingly, accumulated net unrealized appreciation on investments was $595,612,707, consisting of $615,866,857 gross unrealized appreciation and $20,254,150 gross unrealized depreciation.
30
REPORT OF INDEPENDENT REGISTERED PUBLIC ACCOUNTING FIRM
To the Shareholders and the Board of Directors of BNY Mellon Global Stock Fund
Opinion on the Financial Statements
We have audited the accompanying statement of assets and liabilities of BNY Mellon Global Stock Fund (the “Fund”) (one of the funds constituting BNY Mellon Strategic Funds, Inc.), including the statement of investments, as of November 30, 2022, and the related statement of operations for the year then ended, the statements of changes in net assets for each of the two years in the period then ended, the financial highlights for each of the five years in the period then ended and the related notes (collectively referred to as the “financial statements”). In our opinion, the financial statements present fairly, in all material respects, the financial position of the Fund (one of the funds constituting BNY Mellon Strategic Funds, Inc.) at November 30, 2022, the results of its operations for the year then ended, the changes in its net assets for each of the two years in the period then ended and its financial highlights for each of the five years in the period then ended, in conformity with U.S. generally accepted accounting principles.
Basis for Opinion
These financial statements are the responsibility of the Fund’s management. Our responsibility is to express an opinion on the Fund’s financial statements based on our audits. We are a public accounting firm registered with the Public Company Accounting Oversight Board (United States) (“PCAOB”) and are required to be independent with respect to the Fund in accordance with the U.S. federal securities laws and the applicable rules and regulations of the Securities and Exchange Commission and the PCAOB.
We conducted our audits in accordance with the standards of the PCAOB. Those standards require that we plan and perform the audit to obtain reasonable assurance about whether the financial statements are free of material misstatement, whether due to error or fraud. The Fund is not required to have, nor were we engaged to perform, an audit of the Fund’s internal control over financial reporting. As part of our audits, we are required to obtain an understanding of internal control over financial reporting, but not for the purpose of expressing an opinion on the effectiveness of the Fund’s internal control over financial reporting. Accordingly, we express no such opinion.
Our audits included performing procedures to assess the risks of material misstatement of the financial statements, whether due to error or fraud, and performing procedures that respond to those risks. Such procedures included examining, on a test basis, evidence regarding the amounts and disclosures in the financial statements. Our procedures included confirmation of securities owned as of November 30, 2022, by correspondence with the custodian, brokers and others; when replies were not received from brokers and others, we performed other auditing procedures. Our audits also included evaluating the accounting principles used and significant estimates made by management, as well as evaluating the overall presentation of the financial statements. We believe that our audits provide a reasonable basis for our opinion.

We have served as the auditor of one or more investment companies in the BNY Mellon Family of Funds since at least 1957, but we are unable to determine the specific year.
New York, New York
January 23, 2023
31
IMPORTANT TAX INFORMATION (Unaudited)
For federal tax purposes the fund hereby reports 100% of the ordinary dividends paid during the fiscal year ended November 30, 2022 as qualifying for the corporate dividends received deduction. Also certain dividends paid by the fund may be subject to a maximum tax rate of 15%, as provided for by the Jobs and Growth Tax Relief Reconciliation Act of 2003. Of the distributions paid during the fiscal year, $5,403,849 represents the maximum amount that may be considered qualified dividend income. Shareholders will receive notification in early 2023 of the percentage applicable to the preparation of their 2022 income tax returns. Also, the fund hereby reports $.0246 per share as a short-term capital gain distribution paid on December 14, 2021, $2.3315 and $.1749 per share as a long-term capital gain distribution paid on December 14, 2021 and March 29, 2022, respectively.
32
INFORMATION ABOUT THE RENEWAL OF THE FUND’S MANAGEMENT AND SUB-INVESTMENT ADVISORY AGREEMENTS (Unaudited)
At a meeting of the fund’s Board of Directors held on October 31-November 1, 2022, the Board considered the renewal of the fund’s Management Agreement, pursuant to which the Adviser provides the fund with investment advisory and administrative services, and the Sub-Investment Advisory Agreement (together with the Management Agreement, the “Agreements”), pursuant to which Walter Scott & Partners Limited (the “Sub-Adviser”) provides day-to-day management of the fund’s investments. The Board members, none of whom are “interested persons” (as defined in the Investment Company Act of 1940, as amended) of the fund, were assisted in their review by independent legal counsel and met with counsel in executive session separate from representatives of the Adviser and the Sub-Adviser. In considering the renewal of the Agreements, the Board considered several factors that it believed to be relevant, including those discussed below. The Board did not identify any one factor as dispositive, and each Board member may have attributed different weights to the factors considered.
Analysis of Nature, Extent, and Quality of Services Provided to the Fund. The Board considered information provided to it at the meeting and in previous presentations from representatives of the Adviser regarding the nature, extent, and quality of the services provided to funds in the BNY Mellon fund complex, including the fund. The Adviser provided the number of open accounts in the fund, the fund’s asset size and the allocation of fund assets among distribution channels. The Adviser also had previously provided information regarding the diverse intermediary relationships and distribution channels of funds in the BNY Mellon fund complex (such as retail direct or intermediary, in which intermediaries typically are paid by the fund and/or the Adviser) and the Adviser’s corresponding need for broad, deep, and diverse resources to be able to provide ongoing shareholder services to each intermediary or distribution channel, as applicable to the fund.
The Board also considered research support available to, and portfolio management capabilities of, the fund’s portfolio management personnel and that the Adviser also provides oversight of day-to-day fund operations, including fund accounting and administration and assistance in meeting legal and regulatory requirements. The Board also considered the Adviser’s extensive administrative, accounting and compliance infrastructures, as well as the Adviser’s supervisory activities over the Sub-Adviser. The Board also considered portfolio management’s brokerage policies and practices (including that there are no soft dollar arrangements in place for the fund) and the standards applied in seeking best execution.
Comparative Analysis of the Fund’s Performance and Management Fee and Expense Ratio. The Board reviewed reports prepared by Broadridge Financial Solutions, Inc. (“Broadridge”), an independent provider of investment company data based on classifications provided by Thomson Reuters Lipper (“Lipper”), which included information comparing (1) the performance of the fund’s Class I shares with the performance of a group of institutional global large-cap growth funds selected by
33
INFORMATION ABOUT THE RENEWAL OF THE FUND’S MANAGEMENT AND SUB-INVESTMENT ADVISORY AGREEMENTS (Unaudited) (continued)
Broadridge as comparable to the fund (the “Performance Group”) and with a broader group of funds consisting of all retail and institutional global large-cap growth funds (the “Performance Universe”), all for various periods ended September 30, 2022, and (2) the fund’s actual and contractual management fees and total expenses with those of the same group of funds in the Performance Group (the “Expense Group”) and with a broader group of all institutional global large-cap growth funds, excluding outliers (the “Expense Universe”), the information for which was derived in part from fund financial statements available to Broadridge as of the date of its analysis. The Adviser previously had furnished the Board with a description of the methodology Broadridge used to select the Performance Group and Performance Universe and the Expense Group and Expense Universe.
Performance Comparisons. Representatives of the Adviser stated that the usefulness of performance comparisons may be affected by a number of factors, including different investment limitations and policies that may be applicable to the fund and comparison funds and the end date selected. The Board also considered the fund’s performance in light of overall financial market conditions. The Board discussed with representatives of the Adviser and the Sub-Adviser the results of the comparisons and considered that the fund’s total return performance was at or above the Performance Group median for the one-, two- and five-year periods and below the Performance Group median for the three-, four- and ten-year periods, and was above the Performance Universe median for all periods, except for the three-year period when the fund’s total return performance was below the Performance Universe median. The Adviser also provided a comparison of the fund’s calendar year total returns to the returns of the fund’s benchmark index, and it was noted that the fund’s returns were above the returns of the index in six of the ten calendar years shown. The Board also noted that the fund had a four-star overall rating and a four-star rating for the five- and ten-year periods from Morningstar based on Morningstar’s risk-adjusted return measure.
Management Fee and Expense Ratio Comparisons. The Board reviewed and considered the contractual management fee rate payable by the fund to the Adviser in light of the nature, extent and quality of the management services and the sub-advisory services provided by the Adviser and the Sub-Adviser, respectively. In addition, the Board reviewed and considered the actual management fee rate paid by the fund over the fund’s last fiscal year. The Board also reviewed the range of actual and contractual management fees and total expenses as a percentage of average net assets of the Expense Group and Expense Universe funds and discussed the results of the comparisons.
The Board considered that the fund’s contractual management fee was higher than the Expense Group median contractual management fee, the fund’s actual management fee was higher than the Expense Group median and the Expense Universe median actual management fee and the fund’s total expenses were slightly higher than the Expense Group median total expenses and slightly lower than the Expense Universe median total expenses.
34
Representatives of the Adviser reviewed with the Board the management or investment advisory fees (1) paid by the one fund advised by the Adviser that is in the same Lipper category as the fund and (2) paid to the Adviser or the Sub-Adviser or its affiliates for advising any separate accounts and/or other types of client portfolios that are considered to have similar investment strategies and policies as the fund (the “Similar Clients”), and explained the nature of the Similar Clients. They discussed differences in fees paid in light of any differences in the services provided and other relevant factors. The Board considered the relevance of the fee information provided for the Similar Clients to evaluate the appropriateness of the fund’s management fee.
The Board considered the fee payable to the Sub-Adviser in relation to the fee payable to the Adviser by the fund and the respective services provided by the Sub-Adviser and the Adviser. The Board also took into consideration that the Sub-Adviser’s fee is paid by the Adviser, out of its fee from the fund, and not the fund.
Analysis of Profitability and Economies of Scale. Representatives of the Adviser reviewed the expenses allocated and profit received by the Adviser and its affiliates and the resulting profitability percentage for managing the fund and the aggregate profitability percentage to the Adviser and its affiliates for managing the funds in the BNY Mellon fund complex, and the method used to determine the expenses and profit. The Board concluded that the profitability results were not excessive, given the services rendered and service levels provided by the Adviser and its affiliates. The Board also had been provided with information prepared by an independent consulting firm regarding the Adviser’s approach to allocating costs to, and determining the profitability of, individual funds and the entire BNY Mellon fund complex. The consulting firm also had analyzed where any economies of scale might emerge in connection with the management of a fund.
The Board considered, on the advice of its counsel, the profitability analysis (1) as part of its evaluation of whether the fees under the Agreements, considered in relation to the mix of services provided by the Adviser and the Sub-Adviser, including the nature, extent and quality of such services, supported the renewal of the Agreements and (2) in light of the relevant circumstances for the fund and the extent to which economies of scale would be realized if the fund grows and whether fee levels reflect these economies of scale for the benefit of fund shareholders. Representatives of the Adviser stated that a discussion of economies of scale is predicated on a fund having achieved a substantial size with increasing assets and that, if a fund’s assets had been stable or decreasing, the possibility that the Adviser may have realized any economies of scale would be less. Representatives of the Adviser also stated that, as a result of shared and allocated costs among funds in the BNY Mellon fund complex, the extent of economies of scale could depend substantially on the level of assets in the complex as a whole, so that increases and decreases in complex-wide assets can affect potential economies of scale in a manner that is disproportionate to, or even in the opposite direction from, changes in the fund’s asset level. The Board also considered potential benefits to the Adviser and the Sub-Adviser from acting as investment adviser and sub-investment adviser,
35
INFORMATION ABOUT THE RENEWAL OF THE FUND’S MANAGEMENT AND SUB-INVESTMENT ADVISORY AGREEMENTS (Unaudited) (continued)
respectively, and took into consideration that there were no soft dollar arrangements in effect for trading the fund’s investments.
At the conclusion of these discussions, the Board agreed that it had been furnished with sufficient information to make an informed business decision with respect to the renewal of the Agreements. Based on the discussions and considerations as described above, the Board concluded and determined as follows.
· The Board concluded that the nature, extent and quality of the services provided by the Adviser and the Sub-Adviser are adequate and appropriate.
· The Board generally was satisfied with the fund’s performance.
· The Board concluded that the fees paid to the Adviser and the Sub-Adviser continued to be appropriate under the circumstances and in light of the factors and the totality of the services provided as discussed above.
· The Board determined that the economies of scale which may accrue to the Adviser and its affiliates in connection with the management of the fund had been adequately considered by the Adviser in connection with the fee rate charged to the fund pursuant to its Management Agreement and that, to the extent in the future it were determined that material economies of scale had not been shared with the fund, the Board would seek to have those economies of scale shared with the fund.
In evaluating the Agreements, the Board considered these conclusions and determinations and also relied on its previous knowledge, gained through meetings and other interactions with the Adviser and its affiliates and the Sub-Adviser, of the Adviser and the Sub-Adviser and the services provided to the fund by the Adviser and the Sub-Adviser. The Board also relied on information received on a routine and regular basis throughout the year relating to the operations of the fund and the investment management and other services provided under the Agreements, including information on the investment performance of the fund in comparison to similar mutual funds and benchmark performance indices; general market outlook as applicable to the fund; and compliance reports. In addition, the Board’s consideration of the contractual fee arrangements for the fund had the benefit of a number of years of reviews of the Agreements for the fund, or substantially similar agreements for other BNY Mellon funds that the Board oversees, during which lengthy discussions took place between the Board and representatives of the Adviser. Certain aspects of the arrangements may receive greater scrutiny in some years than in others, and the Board’s conclusions may be based, in part, on its consideration of the fund’s arrangements, or substantially similar arrangements for other BNY Mellon funds that the Board oversees, in prior years. The Board determined to renew the Agreements.
36
BOARD MEMBERS INFORMATION (Unaudited)
Independent Board Members
Joseph S. DiMartino (79)
Chairman of the Board (1995)
Principal Occupation During Past 5 Years:
· Director or Trustee of funds in the BNY Mellon Family of Funds and certain other entities (as described in the fund’s Statement of Additional Information) (1995-Present)
Other Public Company Board Memberships During Past 5 Years:
· CBIZ, Inc., a public company providing professional business services, products and solutions, Director (1997-Present)
No. of Portfolios for which Board Member Serves: 92
———————
Joni Evans (80)
Board Member (2006)
Principal Occupation During Past 5 Years:
· www.wowOwow.com, an online community dedicated to women’s conversations and publications, Chief Executive Officer (2007-2019)
· Joni Evans Ltd. publishing, Principal (2006-2019)
No. of Portfolios for which Board Member Serves: 17
———————
Joan Gulley (75)
Board Member (2017)
Principal Occupation During Past 5 Years:
· Nantucket Atheneum, public library, Chair (2018-June 2021) and Director (2015-June 2021)
· Orchard Island Club, golf and beach club, Governor (2016-Present)
No. of Portfolios for which Board Member Serves: 39
———————
37
BOARD MEMBERS INFORMATION (Unaudited) (continued)
Alan H. Howard (63)
Board Member (2018)
Principal Occupation During Past 5 Years:
· Heathcote Advisors LLC, a financial advisory services firm, Managing Partner (2008-Present)
· Dynatech/MPX Holdings LLC, a global supplier and service provider of military aircraft parts, President (2012-2019); and Board Member of its two operating subsidiaries, Dynatech International LLC and Military Parts Exchange LLC (2012-2019), including Chief Executive Officer of an operating subsidiary, Dynatech International LLC (2013-2019)
· Rossoff & Co., an independent investment banking firm, Senior Advisor (2013-June 2021)
Other Public Company Board Memberships During Past 5 Years:
· Movado Group, Inc., a public company that designs, sources, markets and distributes watches, Director (1997-Present)
· Diamond Offshore Drilling, Inc., a public company that provides contract drilling services, Director (March 2020-April 2021)
No. of Portfolios for which Board Member Serves: 17
———————
Robin A. Melvin (59)
Board Member (1995)
Principal Occupation During Past 5 Years:
· Westover School, a private girls’ boarding school in Middlebury, Connecticut, Trustee (2019-Present)
· Mentor Illinois, a non-profit organization dedicated to increasing the quantity and quality of mentoring services in Illinois. Co-Chair (2014–2020); Board Member, Mentor Illinois (2013-2020)
· JDRF, a non-profit juvenile diabetes research foundation, Board Member (June 2021-June 2022)
Other Public Company Board Memberships During Past 5 Years:
· HPS Corporate Lending Fund, a closed-end management investment company regulated as a business development company, Trustee (August 2021-Present)
No. of Portfolios for which Board Member Serves: 71
———————
Burton N. Wallack (72)
Board Member (2006)
Principal Occupation During Past 5 Years:
Wallack Management Company, a real estate management company, President and Co-owner (1987-Present)
Other Public Company Board Memberships During Past 5 Years:
Mount Sinai Hospital Urology, Board Member (2017-Present)
No. of Portfolios for which Board Member Serves: 17
———————
38
Benaree Pratt Wiley (76)
Board Member (2016)
Principal Occupation During Past 5 Years:
· The Wiley Group, a firm specializing in strategy and business development. Principal (2005-Present)
Other Public Company Board Memberships During Past 5 Years:
· CBIZ, Inc., a public company providing professional business services, products and solutions, Director (2008-Present)
· Blue Cross-Blue Shield of Massachusetts, Director (2004-2020)
No. of Portfolios for which Board Member Serves: 60
———————
Gordon J. Davis (81)
Advisory Board Member (2021)
Principal Occupation During Past 5 Years:
· Venable LLP, a law firm, Partner (2012-Present)
Other Public Company Board Memberships During Past 5 Years:
· BNY Mellon Family of Funds (53 funds), Board Member (1995-August 2021)
No. of Portfolios for which Advisory Board Member Serves: 39
———————
The address of the Board Members and Officers is c/o BNY Mellon Investment Adviser, Inc., 240 Greenwich Street, New York, New York 10286. Additional information about each Board Member is available in the fund’s Statement of Additional Information which can be obtained from the Adviser free of charge by calling this toll free number: 1-800-373-9387.
39
OFFICERS OF THE FUND (Unaudited)
DAVID DIPETRILLO, President since January 2021.
Vice President and Director of the Adviser since February 2021; Head of North America Product, BNY Mellon Investment Management since January 2018; and Director of Product Strategy, BNY Mellon Investment Management from January 2016 to December 2017. He is an officer of 54 investment companies (comprised of 107 portfolios) managed by the Adviser or an affiliate of the Adviser. He is 44 years old and has been an employee of BNY Mellon since 2005.
JAMES WINDELS, Treasurer since November 2001.
Vice President of the Adviser since September 2020; and Director–BNY Mellon Fund Administration. He is an officer of 55 investment companies (comprised of 127 portfolios) managed by the Adviser or an affiliate of the Adviser. He is 64 years old and has been an employee of the Adviser since April 1985.
PETER M. SULLIVAN, Chief Legal Officer since July 2021 and Vice President and Assistant Secretary since March 2019.
Chief Legal Officer of the Adviser and Associate General Counsel of BNY Mellon since July 2021; Senior Managing Counsel of BNY Mellon from December 2020 to July 2021; and Managing Counsel of BNY Mellon from March 2009 to December 2020. He is an officer of 55 investment companies (comprised of 127 portfolios) managed by the Adviser or an affiliate of the Adviser. He is 54 years old and has been an employee of BNY Mellon since April 2004.
JAMES BITETTO, Vice President since August 2005 and Secretary since February 2018.
Senior Managing Counsel of BNY Mellon since December 2019; Managing Counsel of BNY Mellon from April 2014 to December 2019; and Secretary of the Adviser. He is an officer of 55 investment companies (comprised of 127 portfolios) managed by the Adviser or an affiliate of the Adviser. He is 56 years old and has been an employee of the Adviser since December 1996.
DEIRDRE CUNNANE, Vice President and Assistant Secretary since March 2019.
Managing Counsel of BNY Mellon since December 2021, Counsel of BNY Mellon from August 2018 to December 2021; and Senior Regulatory Specialist at BNY Mellon Investment Management Services from February 2016 to August 2018. She is an officer of 55 investment companies (comprised of 127 portfolios) managed by the Adviser or an affiliate of the Adviser. She is 32 years old and has been an employee of the Adviser since August 2018.
SARAH S. KELLEHER, Vice President and Assistant Secretary since April 2014.
Vice President of BNY Mellon ETF Investment Adviser; LLC since February 2020; Senior Managing Counsel of BNY Mellon since September 2021; Managing Counsel of BNY Mellon from December 2017 to September 2021; and Senior Counsel of BNY Mellon from March 2013 to December 2017. She is an officer of 55 investment companies (comprised of 127 portfolios) managed by the Adviser or an affiliate of the Adviser. She is 47 years old and has been an employee of the Adviser since March 2013.
JEFF PRUSNOFSKY, Vice President and Assistant Secretary since August 2005.
Senior Managing Counsel of BNY Mellon. He is an officer of 55 investment companies (comprised of 127 portfolios) managed by the Adviser or an affiliate of the Adviser. He is 57 years old and has been an employee of the Adviser since October 1990.
AMANDA QUINN, Vice President and Assistant Secretary since March 2020.
Counsel of BNY Mellon since June 2019; Regulatory Administration Manager at BNY Mellon Investment Management Services from September 2018 to May 2019; and Senior Regulatory Specialist at BNY Mellon Investment Management Services from April 2015 to August 2018. She is an officer of 55 investment companies (comprised of 127 portfolios) managed by the Adviser or an affiliate of the Adviser. She is 37 years old and has been an employee of the Adviser since June 2019.
40
NATALYA ZELENSKY, Vice President and Assistant Secretary since March 2017.
Chief Compliance Officer since August 2021 and Vice President since February 2020 of BNY Mellon ETF Investment Adviser, LLC; Chief Compliance Officer since August 2021 and Vice President and Assistant Secretary since February 2020 of BNY Mellon ETF Trust; Managing Counsel of BNY Mellon from December 2019 to August 2021; Counsel of BNY Mellon from May 2016 to December 2019; and Assistant Secretary of the Adviser from April 2018 to August 2021. She is an officer of 55 investment companies (comprised of 127 portfolios) managed by the Adviser or an affiliate of the Adviser. She is 37 years old and has been an employee of BNY Mellon since May 2016.
DANIEL GOLDSTEIN, Vice President since March 2022.
Vice President and Head of Product Development of North America Product, BNY Mellon Investment Management since January 2018; Co-Head of Product Management, Development & Oversight of North America Product, BNY Mellon Investment Management from January 2010 to January 2018; and Senior Vice President, Development & Oversight of North America Product, BNY Mellon Investment Management since 2010. He is an officer of 54 investment companies (comprised of 107 portfolios) managed by the Adviser or an affiliate of the Adviser. He is 53 years old and has been an employee of the Distributor since 1991.
JOSEPH MARTELLA, Vice President since March 2022.
Vice President and Head of Product Management of North America Product, BNY Mellon Investment Management since January 2018; Director of Product Research and Analytics of North America Product, BNY Mellon Investment Management from January 2010 to January 2018; and Senior Vice President of North America Product, BNY Mellon Investment Management since 2010. He is an officer of 54 investment companies (comprised of 107 portfolios) managed by the Adviser or an affiliate of the Adviser. He is 46 years old and has been an employee of the Distributor since 1999.
GAVIN C. REILLY, Assistant Treasurer since December 2005.
Tax Manager–BNY Mellon Fund Administration. He is an officer of 55 investment companies (comprised of 127 portfolios) managed by the Adviser or an affiliate of the Adviser. He is 54 years old and has been an employee of the Adviser since April 1991.
ROBERT SALVIOLO, Assistant Treasurer since July 2007.
Senior Accounting Manager–BNY Mellon Fund Administration. He is an officer of 55 investment companies (comprised of 127 portfolios) managed by the Adviser or an affiliate of the Adviser. He is 55 years old and has been an employee of the Adviser since June 1989.
ROBERT SVAGNA, Assistant Treasurer since December 2002.
Senior Accounting Manager–BNY Mellon Fund Administration. He is an officer of 55 investment companies (comprised of 127 portfolios) managed by the Adviser or an affiliate of the Adviser. He is 55 years old and has been an employee of the Adviser since November 1990.
JOSEPH W. CONNOLLY, Chief Compliance Officer since October 2004.
Chief Compliance Officer of the BNY Mellon Family of Funds and BNY Mellon Funds Trust since 2004; and Chief Compliance Officer of the Adviser from 2004 until June 2021. He is the Chief Compliance Officer of 54 investment companies (comprised of 112 portfolios) managed by the Adviser. He is 65 years old.
CARIDAD M. CAROSELLA, Anti-Money Laundering Compliance Officer since January 2016.
Anti-Money Laundering Compliance Officer of the BNY Mellon Family of Funds and BNY Mellon Funds Trust. She is an officer of 48 investment companies (comprised of 120 portfolios) managed by the Adviser or an affiliate of the Adviser. She is 54 years old and has been an employee of the Distributor since 1997.
41
BNY Mellon Global Stock Fund
240 Greenwich Street
New York, NY 10286
Adviser
BNY Mellon Investment Adviser, Inc.
240 Greenwich Street
New York, NY 10286
Sub-Adviser
Walter Scott & Partners Limited
One Charlotte Square
Edinburgh, Scotland, UK
Custodian
The Bank of New York Mellon
240 Greenwich Street
New York, NY 10286
Transfer Agent &
Dividend Disbursing Agent
BNY Mellon Transfer, Inc.
240 Greenwich Street
New York, NY 10286
Distributor
BNY Mellon Securities Corporation
240 Greenwich Street
New York, NY 10286
Ticker Symbols: | Class A: DGLAX Class C: DGLCX Class I: DGLRX Class Y: DGLYX |
Telephone Call your financial representative or 1-800-373-9387
Mail The BNY Mellon Family of Funds, 144 Glenn Curtiss Boulevard, Uniondale, NY 11556-0144
E-mail Send your request to info@bnymellon.com
Internet Information can be viewed online or downloaded at www.im.bnymellon.com
The fund files its complete schedule of portfolio holdings with the Securities and Exchange Commission (“SEC”) for the first and third quarters of each fiscal year on Form N-PORT. The fund’s Forms N-PORT are available on the SEC’s website at www.sec.gov.
A description of the policies and procedures that the fund uses to determine how to vote proxies relating to portfolio securities and information regarding how the fund voted these proxies for the most recent 12-month period ended June 30 is available at www.im.bnymellon.com and on the SEC’s website at www.sec.gov and without charge, upon request, by calling 1-800-373-9387.
© 2023 BNY Mellon Securities Corporation |
|

BNY Mellon International Stock Fund
ANNUAL REPORT November 30, 2022 |
|

Save time. Save paper. View your next shareholder report online as soon as it’s available. Log into www.im.bnymellon.com and sign up for eCommunications. It’s simple and only takes a few minutes. |
The views expressed in this report reflect those of the portfolio manager(s) only through the end of the period covered and do not necessarily represent the views of BNY Mellon Investment Adviser, Inc. or any other person in the BNY Mellon Investment Adviser, Inc. organization. Any such views are subject to change at any time based upon market or other conditions and BNY Mellon Investment Adviser, Inc. disclaims any responsibility to update such views. These views may not be relied on as investment advice and, because investment decisions for a fund in the BNY Mellon Family of Funds are based on numerous factors, may not be relied on as an indication of trading intent on behalf of any fund in the BNY Mellon Family of Funds. |
Not FDIC-Insured • Not Bank-Guaranteed • May Lose Value |
Contents
THE FUND
Information About the Renewal of | |
FOR MORE INFORMATION
Back Cover
DISCUSSION OF FUND PERFORMANCE (Unaudited)
For the period from December 1, 2021, through November 30, 2022, as provided by Charlie Macquaker, Roy Leckie, Jane Henderson, Fraser Fox and Maxim Skorniakov, members of the Investment Executive group at Walter Scott & Partners Limited (Walter Scott), sub-adviser
Market and Fund Performance Overview
For the 12-month period ended November 30, 2022, the BNY Mellon International Stock Fund’s (the “fund”) Class A shares produced a total return of −16.50%, Class C shares returned −17.10%, Class I shares returned −16.20% and Class Y shares returned −16.17%.1 In comparison, the fund’s benchmark index, the MSCI EAFE® Index (the “Index”), produced a return of −10.14% for the same period.2
International equities lost ground during the reporting period under pressure from increasing inflation, slowing economic growth and uncertainties related to Russia’s invasion of Ukraine. The fund underperformed the Index largely due to the fund’s tilt in favor of growth at a time when markets favored value-oriented stocks over their growth-oriented counterparts.
The Fund’s Investment Approach
The fund seeks long-term total returns. To pursue its goal, the fund normally invests at least 80% of its net assets, plus any borrowings for investment purposes, in stocks. The fund normally invests primarily in foreign companies located in developed markets. The fund ordinarily invests in at least three countries and is not geographically limited in its investment selection but, at times, may invest a substantial portion of its assets in a single country. The fund may invest in the securities of companies of any market capitalization. Walter Scott seeks investment opportunities in companies with fundamental strengths that indicate the potential for sustainable growth. Walter Scott focuses on individual stock selection, building the fund’s portfolio from the bottom up through extensive fundamental research. The investment process begins with the screening of reported company financials. Companies that meet certain broad, absolute and trend criteria are candidates for more detailed financial analysis. The fund’s Investment Team collectively reviews and selects those stocks that meet Walter Scott’s criteria, and where the expected growth rate is combined with a reasonable valuation for the underlying equity. Geographic and sector allocations are results of, not part of, the investment process, because the Investment Team’s sole focus is on the analysis of, and investment in, individual companies.
Inflation-Driven Rate Increases Pressure Markets
Shifting global monetary policy weighed on international equities from the start of the reporting period, with stretched valuations a cause for concern in the face of a December 2021 interest-rate increase from the Bank of England and increasingly hawkish rhetoric from the U.S. Federal Reserve (the “Fed”). Inflationary forces were exacerbated by the Russian invasion of Ukraine in early 2022. As the largest land war in Europe since World War II continued with no sign of an early resolution, European markets began contemplating the possibility of reduced or curtailed oil and natural gas exports from Russia, a leading source of energy commodities to the continent. Energy costs, already at elevated levels, spiked higher, along with prices of crucial agricultural chemicals and industrial metals. COVID-19-related lockdowns in China snarled global supply lines, creating product shortages and leading to still higher prices. The Fed responded to mounting inflationary pressures with its most
2
aggressive series of interest-rate increases in decades. Most other central banks followed suit with rate increases of their own, raising the specter of a possible recession, which put further downward pressure on equity markets, particularly richly valued, growth-oriented shares in the information technology and consumer discretionary sectors.
International equities moved higher in October and November 2022, as international economies showed signs of slowing in response to monetary policies and other macroeconomic pressures, reducing the likelihood of further, sharp rate increases. However, the risk of recession remained a real concern, with Europe and the UK seen as especially vulnerable.
The Fund’s Bias Toward Growth Detracts
The market’s shift from favoring growth-oriented shares with high p/e (price/earnings) multiples to favoring value-oriented shares with lower p/e multiples raised significant headwinds for the fund, which held a large proportion of positions in richly valued companies with growth characteristics. Some holdings also encountered problems related to the fallout from adverse macroeconomic conditions, including inflation, supply-chain constraints and slowing growth in China. The three most significant detractors from relative returns, included German sports apparel company adidas, Taiwanese semiconductor manufacturer Taiwan Semiconductor Manufacturing (TSMC) and medical testing equipment producer Sysmex. Adidas suffered from slowing sales in China, where pandemic-related lockdowns deterred shoppers, as well as slowing global economic growth. Shares in TSMC were undermined by increased risks related to geopolitical tensions between China and Taiwan, and by the market’s preconception of the cyclical nature of the semiconductor industry. We believe, however, that TSMC’s focus on specialized semiconductors make it less vulnerable to cyclical fluctuations than many other companies in its industry. Sysmex was hurt by concerns regarding a slowdown in post-pandemic testing and declining sales in China due to that country’s slowing growth, lockdowns and a move toward domestic suppliers.
On a more positive note, several holdings contributed positively to the fund’s returns relative to the Index. Among the most notable, France-based integrated oil and gas company TotalEnergies, the fund’s sole energy sector holding, benefited from soaring oil and gas prices, major new oil discoveries in Africa, and improved profitability in its refining and chemical operations. Shares in Denmark-based biotechnology company Novo Nordisk rose as the company resolved production problems with its successful, recently approved weight-loss drug Wegovy, along with raised guidance from management and an increased share buyback program. Canada-based international convenience store chain Alimentation Couche-Tard entered 2022 with positive business fundamentals and a relatively low valuation that the market rewarded.
Remaining Focused on High-Quality Companies with Strong Fundamentals
Over the shorter term, we believe asset prices are likely to remain volatile as the Fed struggles to constrain inflationary pressures, with the possibility of a recession still on the horizon. While many companies have effectively controlled costs and continued to report reasonably strong earnings despite those pressures, we expect businesses to face increasing difficulties in meeting financial expectations if interest rates continue to rise while economic growth falters. We believe the fund’s holdings are relatively well positioned to outperform in
3
DISCUSSION OF FUND PERFORMANCE (Unaudited) (continued)
the face of prevailing market uncertainties due to their high-quality, defensive characteristics and solid fundamentals, which enable them to operate effectively in varying economic environments.
December 15, 2022
1 Total return includes reinvestment of dividends and any capital gains paid and does not take into consideration the maximum initial sales charge in the case of Class A shares, or the applicable contingent deferred sales charge imposed on redemptions in the case of Class C shares. Had these charges been reflected, returns would have been lower. Past performance is no guarantee of future results. Share price and investment return fluctuate such that upon redemption, fund shares may be worth more or less than their original cost.
2 Source: Lipper Inc. — The MSCI EAFE® Index (Europe, Australasia, Far East) is a free float-adjusted, market capitalization-weighted index that is designed to measure the equity market performance of developed markets, excluding the U.S. and Canada. It reflects reinvestment of net dividends and, where applicable, capital gain distributions. Investors cannot invest directly in any index.
Equities are subject generally to market, market sector, market liquidity, issuer and investment style risks, among other factors, to varying degrees, all of which are more fully described in the fund’s prospectus.
Investing internationally involves special risks, including changes in currency exchange rates, political, economic, and social instability, a lack of comprehensive company information, differing auditing and legal standards, and less market liquidity.
Small and midsized company stocks tend to be more volatile and less liquid than larger company stocks as these companies are less established and have more volatile earnings histories.
Recent market risks include pandemic risks related to COVID-19. The effects of COVID-19 have contributed to increased volatility in global markets and will likely affect certain countries, companies, industries and market sectors more dramatically than others. To the extent the fund may overweight its investments in certain countries, companies, industries or market sectors, such positions will increase the fund’s exposure to risk of loss from adverse developments affecting those countries, companies, industries or sectors.
4
FUND PERFORMANCE (Unaudited)
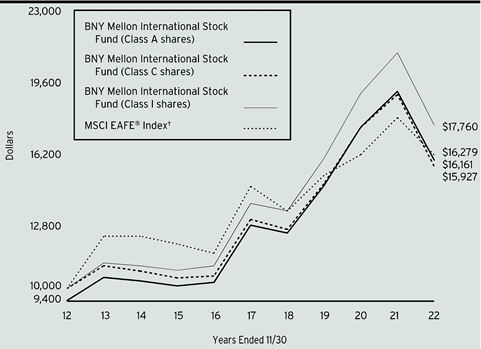
Comparison of change in value of a $10,000 investment in Class A shares, Class C shares, and Class I shares of BNY Mellon International Stock Fund with a hypothetical investment of $10,000 in the MSCI EAFE® Index (the “Index”)
† Source: Lipper Inc.
Past performance is not predictive of future performance.
The above graph compares a hypothetical investment of $10,000 made in each of the Class A shares, Class C shares, and Class I shares of BNY Mellon International Stock Fund on 11/30/12 to a hypothetical investment of $10,000 made in the Index on that date. All dividends and capital gain distributions are reinvested.
The fund’s performance shown in the line graph above takes into account the maximum initial sales charge on Class A shares and all other applicable fees and expenses on all classes. The Index (Europe, Australasia, Far East) is a free float-adjusted market capitalization-weighted index that is designed to measure the equity market performance of developed markets, excluding the U.S. and Canada. Unlike a mutual fund, the Index is not subject to charges, fees and other expenses. Investors cannot invest directly in any index. Further information relating to fund performance, including expense reimbursements, if applicable, is contained in the Financial Highlights section of the prospectus and elsewhere in this report.
5
FUND PERFORMANCE (Unaudited) (continued)

Comparison of change in value of a $1,000,000 investment in Class Y shares of BNY Mellon International Stock Fund with a hypothetical investment of $1,000,000 in the MSCI EAFE® Index (the “Index”)
† Source: Lipper Inc.
†† The total return figures presented for Class Y shares of the fund reflect the performance of the fund’s Class A shares for the period prior to 7/1/13 (the inception date for Class Y shares), not reflecting the applicable sales charges for Class A shares.
Past performance is not predictive of future performance.
The above graph compares a hypothetical investment of $1,000,000 made in Class Y shares of BNY Mellon International Stock Fund on 11/30/12 to a hypothetical investment of $1,000,000 made in the Index on that date. All dividends and capital gain distributions are reinvested.
The fund’s performance shown in the line graph above takes into account all other applicable fees and expenses of fund’s Class Y shares. The Index (Europe, Australasia, Far East) is a free float-adjusted market capitalization-weighted index that is designed to measure the equity market performance of developed markets, excluding the U.S. and Canada. Unlike a mutual fund, the Index is not subject to charges, fees and other expenses. Investors cannot invest directly in any index. Further information relating to fund performance, including expense reimbursements, if applicable, is contained in the Financial Highlights section of the prospectus and elsewhere in this report.
6
Average Annual Total Returns as of 11/30/2022 | ||||
Inception | ||||
| Date | 1 Year | 5 Years | 10 Years |
Class A shares | ||||
with maximum sales charge (5.75%) | 12/29/06 | -21.32% | 3.21% | 4.92% |
without sales charge | 12/29/06 | -16.50% | 4.44% | 5.54% |
Class C shares | ||||
with applicable redemption charge† | 12/29/06 | -17.93% | 3.70% | 4.76% |
without redemption | 12/29/06 | -17.10% | 3.70% | 4.76% |
Class I shares | 12/29/06 | -16.20% | 4.81% | 5.91% |
Class Y shares | 7/1/13 | -16.17% | 4.84% | 5.89%†† |
MSCI EAFE® Index | -10.14% | 1.85% | 4.99% | |
† The maximum contingent deferred sales charge for Class C shares is 1% for shares redeemed within one year of the date of purchase.
†† The total return performance figures presented for Class Y shares of the fund reflect the performance of the fund’s Class A shares for the period prior to 7/1/13 (the inception date for Class Y shares), not reflecting the applicable sales charges for Class A shares.
The performance data quoted represents past performance, which is no guarantee of future results. Share price and investment return fluctuate and an investor’s shares may be worth more or less than original cost upon redemption. Current performance may be lower or higher than the performance quoted. Go to www.im.bnymellon.com for the fund’s most recent month-end returns.
The fund’s performance shown in the graphs and table does not reflect the deduction of taxes that a shareholder would pay on fund distributions or the redemption of fund shares. In addition to the performance of Class A shares shown with and without a maximum sales charge, the fund’s performance shown in the table takes into account all other applicable fees and expenses on all classes.
7
UNDERSTANDING YOUR FUND’S EXPENSES (Unaudited)
As a mutual fund investor, you pay ongoing expenses, such as management fees and other expenses. Using the information below, you can estimate how these expenses affect your investment and compare them with the expenses of other funds. You also may pay one-time transaction expenses, including sales charges (loads) and redemption fees, which are not shown in this section and would have resulted in higher total expenses. For more information, see your fund’s prospectus or talk to your financial adviser.
Review your fund’s expenses
The table below shows the expenses you would have paid on a $1,000 investment in BNY Mellon International Stock Fund from June 1, 2022 to November 30, 2022. It also shows how much a $1,000 investment would be worth at the close of the period, assuming actual returns and expenses.
Expenses and Value of a $1,000 Investment |
| |||||
Assume actual returns for the six months ended November 30, 2022 |
| |||||
|
|
|
|
|
|
|
|
| Class A | Class C | Class I | Class Y |
|
Expenses paid per $1,000† | $6.44 | $9.84 | $4.61 | $4.41 |
| |
Ending value (after expenses) | $977.10 | $973.20 | $979.00 | $978.80 |
| |
COMPARING YOUR FUND’S EXPENSES WITH THOSE OF OTHER FUNDS (Unaudited)
Using the SEC’s method to compare expenses
The Securities and Exchange Commission (“SEC”) has established guidelines to help investors assess fund expenses. Per these guidelines, the table below shows your fund’s expenses based on a $1,000 investment, assuming a hypothetical 5% annualized return. You can use this information to compare the ongoing expenses (but not transaction expenses or total cost) of investing in the fund with those of other funds. All mutual fund shareholder reports will provide this information to help you make this comparison. Please note that you cannot use this information to estimate your actual ending account balance and expenses paid during the period.
Expenses and Value of a $1,000 Investment |
| |||||
Assuming a hypothetical 5% annualized return for the six months ended November 30, 2022 |
| |||||
|
|
|
|
|
|
|
|
| Class A | Class C | Class I | Class Y |
|
Expenses paid per $1,000† | $6.58 | $10.05 | $4.71 | $4.51 |
| |
Ending value (after expenses) | $1,018.55 | $1,015.09 | $1,020.41 | $1,020.61 |
| |
† | Expenses are equal to the fund’s annualized expense ratio of 1.30% for Class A, 1.99% for Class C, .93% for Class I and .89% for Class Y, multiplied by the average account value over the period, multiplied by 183/365 (to reflect the one-half year period). | |||||
8
STATEMENT OF INVESTMENTS
November 30, 2022
Description | Shares | Value ($) | |||||
Common Stocks - 99.7% | |||||||
Australia - 3.9% | |||||||
Cochlear Ltd. | 431,100 | 63,586,794 | |||||
CSL Ltd. | 686,800 | 141,093,164 | |||||
204,679,958 | |||||||
Canada - 5.7% | |||||||
Alimentation Couche-Tard Inc. | 3,420,400 | 155,820,624 | |||||
Canadian National Railway Co. | 1,132,300 | 145,364,373 | |||||
301,184,997 | |||||||
Denmark - 9.6% | |||||||
Chr. Hansen Holding A/S | 1,592,000 | 99,109,037 | |||||
Coloplast A/S, Cl. B | 786,000 | 93,133,060 | |||||
Novo Nordisk A/S, Cl. B | 1,684,000 | 210,819,425 | |||||
Novozymes A/S, Cl. B | 1,871,000 | 109,264,913 | |||||
512,326,435 | |||||||
Finland - 2.5% | |||||||
Kone OYJ, Cl. B | 2,607,200 | 131,064,907 | |||||
France - 14.0% | |||||||
Air Liquide SA | 908,240 | 132,975,473 | |||||
Dassault Systemes SE | 2,371,400 | 88,971,282 | |||||
Hermes International | 42,000 | 69,035,058 | |||||
L'Oreal SA | 372,000 | 140,692,530 | |||||
LVMH SE | 217,000 | 168,014,575 | |||||
TotalEnergies SE | 2,265,404 | 141,512,018 | |||||
741,200,936 | |||||||
Germany - 6.1% | |||||||
adidas AG | 663,300 | 84,582,115 | |||||
Merck KGaA | 700,000 | 126,830,060 | |||||
SAP SE | 1,060,100 | 114,735,047 | |||||
326,147,222 | |||||||
Hong Kong - 6.4% | |||||||
AIA Group Ltd. | 14,486,000 | 147,742,498 | |||||
CLP Holdings Ltd. | 9,862,500 | a | 71,793,905 | ||||
Hang Lung Properties Ltd. | 40,583,000 | 74,958,651 | |||||
Jardine Matheson Holdings Ltd. | 983,100 | 47,574,220 | |||||
342,069,274 | |||||||
Ireland - 2.5% | |||||||
Experian PLC | 3,750,400 | 133,344,277 | |||||
Japan - 18.3% | |||||||
Daikin Industries Ltd. | 734,200 | 121,503,252 | |||||
FANUC Corp. | 515,200 | 77,169,169 | |||||
Hoya Corp. | 979,800 | 101,434,728 | |||||
Keyence Corp. | 427,280 | 181,705,257 | |||||
9
STATEMENT OF INVESTMENTS (continued)
Description | Shares | Value ($) | |||||
Common Stocks - 99.7% (continued) | |||||||
Japan - 18.3% (continued) | |||||||
MISUMI Group Inc. | 1,837,800 | 45,603,602 | |||||
Murata Manufacturing Co. | 1,900,000 | 104,521,545 | |||||
Shin-Etsu Chemical Co. | 1,011,600 | 131,047,787 | |||||
SMC Corp. | 271,400 | 124,146,650 | |||||
Sysmex Corp. | 1,382,900 | 84,748,984 | |||||
971,880,974 | |||||||
Netherlands - 4.8% | |||||||
ASM International NV | 194,000 | 54,455,176 | |||||
ASML Holding NV | 331,990 | 201,939,925 | |||||
256,395,101 | |||||||
Spain - 2.2% | |||||||
Industria de Diseno Textil SA | 4,400,000 | a | 114,078,365 | ||||
Switzerland - 13.3% | |||||||
Kuehne + Nagel International AG | 454,400 | 110,477,897 | |||||
Lonza Group AG | 198,600 | 104,966,909 | |||||
Nestle SA | 1,000,000 | 118,999,195 | |||||
Novartis AG | 1,453,100 | 129,552,590 | |||||
Roche Holding AG | 409,500 | 133,102,703 | |||||
SGS SA | 47,400 | 110,833,578 | |||||
707,932,872 | |||||||
Taiwan - 2.9% | |||||||
Taiwan Semiconductor Manufacturing Co., ADR | 1,866,000 | 154,840,680 | |||||
United Kingdom - 7.5% | |||||||
Compass Group PLC | 5,881,800 | 133,353,101 | |||||
Diageo PLC | 3,318,000 | 154,172,338 | |||||
Prudential PLC | 9,429,600 | 112,504,184 | |||||
400,029,623 | |||||||
Total Common Stocks (cost $3,750,139,095) | 5,297,175,621 | ||||||
1-Day | |||||||
Investment Companies - 1.1% | |||||||
Registered Investment Companies - 1.1% | |||||||
Dreyfus Institutional Preferred Government Plus Money Market Fund, Institutional Shares | 3.94 | 56,786,189 | b | 56,786,189 | |||
10
Description | 1-Day | Shares | Value ($) | ||||
Investment of Cash Collateral for Securities Loaned - .0% | |||||||
Registered Investment Companies - .0% | |||||||
Dreyfus Institutional Preferred Government Plus Money Market Fund, SL Shares | 3.94 | 2,950,693 | b | 2,950,693 | |||
Total Investments (cost $3,809,875,977) | 100.8% | 5,356,912,503 | |||||
Liabilities, Less Cash and Receivables | (.8%) | (45,014,929) | |||||
Net Assets | 100.0% | 5,311,897,574 | |||||
ADR—American Depository Receipt
a Security, or portion thereof, on loan. At November 30, 2022, the value of the fund’s securities on loan was $2,822,939 and the value of the collateral was $2,950,693. In addition, the value of collateral may include pending sales that are also on loan.
b Investment in affiliated issuer. The investment objective of this investment company is publicly available and can be found within the investment company’s prospectus.
Portfolio Summary (Unaudited) † | Value (%) |
Pharmaceuticals Biotechnology & Life Sciences | 15.9 |
Capital Goods | 10.3 |
Materials | 8.9 |
Semiconductors & Semiconductor Equipment | 7.7 |
Health Care Equipment & Services | 6.5 |
Consumer Durables & Apparel | 6.1 |
Technology Hardware & Equipment | 5.4 |
Food, Beverage & Tobacco | 5.1 |
Insurance | 4.9 |
Transportation | 4.8 |
Commercial & Professional Services | 4.6 |
Software & Services | 3.8 |
Food & Staples Retailing | 2.9 |
Energy | 2.7 |
Household & Personal Products | 2.7 |
Consumer Services | 2.5 |
Retailing | 2.1 |
Real Estate | 1.4 |
Utilities | 1.4 |
Investment Companies | 1.1 |
100.8 |
† Based on net assets.
See notes to financial statements.
11
STATEMENT OF INVESTMENTS (continued)
Affiliated Issuers | ||||||
Description | Value ($) 11/30/2021 | Purchases ($)† | Sales ($) | Value ($) 11/30/2022 | Dividends/ | |
Registered Investment Companies - 1.1% | ||||||
Dreyfus Institutional Preferred Government Plus Money Market Fund, Institutional Shares - 1.1% | 155,670,618 | 929,695,722 | (1,028,580,151) | 56,786,189 | 958,471 | |
Investment of Cash Collateral for Securities Loaned - .0% | ||||||
Dreyfus Institutional Preferred Government Plus Money Market Fund, SL Shares - ..0% | 244,138 | 50,631,405 | (47,924,850) | 2,950,693 | 24,099 | †† |
Total - 1.1% | 155,914,756 | 980,327,127 | (1,076,505,001) | 59,736,882 | 982,570 | |
† Includes reinvested dividends/distributions.
†† Represents securities lending income earned from the reinvestment of cash collateral from loaned securities, net of fees and collateral investment expenses, and other payments to and from borrowers of securities.
See notes to financial statements.
12
STATEMENT OF ASSETS AND LIABILITIES
November 30, 2022
|
|
|
|
|
|
|
|
|
| Cost |
| Value |
|
Assets ($): |
|
|
|
| ||
Investments in securities—See Statement of Investments |
|
|
| |||
Unaffiliated issuers | 3,750,139,095 |
| 5,297,175,621 |
| ||
Affiliated issuers |
| 59,736,882 |
| 59,736,882 |
| |
Tax reclaim receivable—Note 1(b) |
| 22,622,199 |
| |||
Receivable for shares of Common Stock subscribed |
| 2,758,483 |
| |||
Dividends and securities lending income receivable |
| 2,393,437 |
| |||
Prepaid expenses |
|
|
|
| 197,328 |
|
|
|
|
|
| 5,384,883,950 |
|
Liabilities ($): |
|
|
|
| ||
Due to BNY Mellon Investment Adviser, Inc. and affiliates—Note 3(c) |
| 4,046,604 |
| |||
Cash overdraft due to Custodian |
|
| 295,436 |
| 295,436 |
|
Payable for shares of Common Stock redeemed |
| 65,202,270 |
| |||
Liability for securities on loan—Note 1(c) |
| 2,950,693 |
| |||
Directors’ fees and expenses payable |
| 92,420 |
| |||
Other accrued expenses |
|
|
|
| 398,953 |
|
|
|
|
|
| 72,986,376 |
|
Net Assets ($) |
|
| 5,311,897,574 |
| ||
Composition of Net Assets ($): |
|
|
|
| ||
Paid-in capital |
|
|
|
| 3,646,898,510 |
|
Total distributable earnings (loss) |
|
|
|
| 1,664,999,064 |
|
Net Assets ($) |
|
| 5,311,897,574 |
| ||
Net Asset Value Per Share | Class A | Class C | Class I | Class Y |
|
Net Assets ($) | 55,109,879 | 5,902,667 | 2,925,622,342 | 2,325,262,686 |
|
Shares Outstanding | 2,586,277 | 284,978 | 136,089,836 | 109,468,420 |
|
Net Asset Value Per Share ($) | 21.31 | 20.71 | 21.50 | 21.24 |
|
|
|
|
|
|
|
See notes to financial statements. |
|
|
|
|
|
13
STATEMENT OF OPERATIONS
Year Ended November 30, 2022
|
|
|
|
|
|
|
|
|
|
|
|
|
|
Investment Income ($): |
|
|
|
| ||
Income: |
|
|
|
| ||
Cash dividends (net of $12,782,171 foreign taxes withheld at source): |
| |||||
Unaffiliated issuers |
|
| 101,514,108 |
| ||
Affiliated issuers |
|
| 958,471 |
| ||
Income from securities lending—Note 1(c) |
|
| 24,099 |
| ||
Total Income |
|
| 102,496,678 |
| ||
Expenses: |
|
|
|
| ||
Management fee—Note 3(a) |
|
| 50,200,352 |
| ||
Shareholder servicing costs—Note 3(c) |
|
| 1,478,576 |
| ||
Custodian fees—Note 3(c) |
|
| 803,628 |
| ||
Directors’ fees and expenses—Note 3(d) |
|
| 558,929 |
| ||
Registration fees |
|
| 143,663 |
| ||
Prospectus and shareholders’ reports |
|
| 119,799 |
| ||
Professional fees |
|
| 108,585 |
| ||
Loan commitment fees—Note 2 |
|
| 102,450 |
| ||
Distribution fees—Note 3(b) |
|
| 68,975 |
| ||
Chief Compliance Officer fees—Note 3(c) |
|
| 17,027 |
| ||
Interest expense—Note 2 |
|
| 13,317 |
| ||
Miscellaneous |
|
| 211,891 |
| ||
Total Expenses |
|
| 53,827,192 |
| ||
Less—reduction in fees due to earnings credits—Note 3(c) |
|
| (1,323) |
| ||
Net Expenses |
|
| 53,825,869 |
| ||
Net Investment Income |
|
| 48,670,809 |
| ||
Realized and Unrealized Gain (Loss) on Investments—Note 4 ($): |
|
| ||||
Net realized gain (loss) on investments and foreign currency transactions | 70,582,127 |
| ||||
Net change in unrealized appreciation (depreciation) on investments | (1,294,177,138) |
| ||||
Net Realized and Unrealized Gain (Loss) on Investments |
|
| (1,223,595,011) |
| ||
Net (Decrease) in Net Assets Resulting from Operations |
| (1,174,924,202) |
| |||
|
|
|
|
|
|
|
See notes to financial statements. | ||||||
14
STATEMENT OF CHANGES IN NET ASSETS
|
|
|
| Year Ended November 30, | |||||
|
|
|
| 2022 |
| 2021 |
| ||
Operations ($): |
|
|
|
|
|
|
|
| |
Net investment income |
|
| 48,670,809 |
|
|
| 38,878,822 |
| |
Net realized gain (loss) on investments |
| 70,582,127 |
|
|
| 24,281,507 |
| ||
Net change in unrealized appreciation |
| (1,294,177,138) |
|
|
| 558,399,994 |
| ||
Net Increase (Decrease) in Net Assets | (1,174,924,202) |
|
|
| 621,560,323 |
| |||
Distributions ($): |
| ||||||||
Distributions to shareholders: |
|
|
|
|
|
|
|
| |
Class A |
|
| (413,959) |
|
|
| (1,696,616) |
| |
Class C |
|
| (39,893) |
|
|
| (375,053) |
| |
Class I |
|
| (34,258,850) |
|
|
| (97,424,371) |
| |
Class Y |
|
| (28,298,432) |
|
|
| (89,046,864) |
| |
Total Distributions |
|
| (63,011,134) |
|
|
| (188,542,904) |
| |
Capital Stock Transactions ($): |
| ||||||||
Net proceeds from shares sold: |
|
|
|
|
|
|
|
| |
Class A |
|
| 18,118,520 |
|
|
| 35,480,358 |
| |
Class C |
|
| 1,118,761 |
|
|
| 3,064,589 |
| |
Class I |
|
| 1,082,898,560 |
|
|
| 1,040,617,933 |
| |
Class Y |
|
| 424,941,188 |
|
|
| 430,889,367 |
| |
Distributions reinvested: |
|
|
|
|
|
|
|
| |
Class A |
|
| 385,478 |
|
|
| 1,518,997 |
| |
Class C |
|
| 39,848 |
|
|
| 374,478 |
| |
Class I |
|
| 32,404,933 |
|
|
| 89,308,231 |
| |
Class Y |
|
| 13,658,420 |
|
|
| 50,927,635 |
| |
Cost of shares redeemed: |
|
|
|
|
|
|
|
| |
Class A |
|
| (25,399,495) |
|
|
| (26,337,872) |
| |
Class C |
|
| (4,312,164) |
|
|
| (7,735,220) |
| |
Class I |
|
| (1,339,576,090) |
|
|
| (653,938,900) |
| |
Class Y |
|
| (657,385,624) |
|
|
| (429,445,723) |
| |
Increase (Decrease) in Net Assets | (453,107,665) |
|
|
| 534,723,873 |
| |||
Total Increase (Decrease) in Net Assets | (1,691,043,001) |
|
|
| 967,741,292 |
| |||
Net Assets ($): |
| ||||||||
Beginning of Period |
|
| 7,002,940,575 |
|
|
| 6,035,199,283 |
| |
End of Period |
|
| 5,311,897,574 |
|
|
| 7,002,940,575 |
| |
15
STATEMENT OF CHANGES IN NET ASSETS (continued)
|
|
|
| Year Ended November 30, | |||||
|
|
|
| 2022 |
| 2021 |
| ||
Capital Share Transactions (Shares): |
| ||||||||
Class Aa,b |
|
|
|
|
|
|
|
| |
Shares sold |
|
| 826,044 |
|
|
| 1,385,645 |
| |
Shares issued for distributions reinvested |
|
| 14,809 |
|
|
| 63,985 |
| |
Shares redeemed |
|
| (1,166,148) |
|
|
| (1,018,315) |
| |
Net Increase (Decrease) in Shares Outstanding | (325,295) |
|
|
| 431,315 |
| |||
Class Ca,b |
|
|
|
|
|
|
|
| |
Shares sold |
|
| 47,039 |
|
|
| 124,220 |
| |
Shares issued for distributions reinvested |
|
| 1,565 |
|
|
| 16,045 |
| |
Shares redeemed |
|
| (210,035) |
|
|
| (307,896) |
| |
Net Increase (Decrease) in Shares Outstanding | (161,431) |
|
|
| (167,631) |
| |||
Class Ib |
|
|
|
|
|
|
|
| |
Shares sold |
|
| 49,149,580 |
|
|
| 41,047,907 |
| |
Shares issued for distributions reinvested |
|
| 1,238,247 |
|
|
| 3,744,580 |
| |
Shares redeemed |
|
| (62,997,157) |
|
|
| (25,557,823) |
| |
Net Increase (Decrease) in Shares Outstanding | (12,609,330) |
|
|
| 19,234,664 |
| |||
Class Yb |
|
|
|
|
|
|
|
| |
Shares sold |
|
| 19,556,870 |
|
|
| 17,225,498 |
| |
Shares issued for distributions reinvested |
|
| 528,372 |
|
|
| 2,161,614 |
| |
Shares redeemed |
|
| (30,663,296) |
|
|
| (16,845,441) |
| |
Net Increase (Decrease) in Shares Outstanding | (10,578,054) |
|
|
| 2,541,671 |
| |||
|
|
|
|
|
|
|
|
|
|
a | During the period ended November 30, 2022, 8 Class C shares representing $175 were automatically converted to 8 Class A shares during the period ended November 30, 2021, 3,040 Class C shares representing $72,467 were automatically converted to 2,986 Class A shares. | ||||||||
b | During the period ended November 30, 2022, 3,779,535 Class Y shares representing $90,873,549 were exchanged for 3,733,659 Class I shares, 94,931 Class C shares representing $1,919,508 were exchanged for 91,492 Class I shares and 652 Class I shares representing $10,867 were exchanged for 657 Class A shares. During the period ended November 30, 2021, 829,473 Class I shares representing $24,242,105 were exchanged for 840,306 Class Y shares. | ||||||||
See notes to financial statements. | |||||||||
16
FINANCIAL HIGHLIGHTS
The following tables describe the performance for each share class for the fiscal periods indicated. All information (except portfolio turnover rate) reflects financial results for a single fund share. Net asset value total return is calculated assuming an initial investment made at the net asset value at the beginning of the period, reinvestment of all dividends and distributions at net asset value during the period, and redemption at net asset value on the last day of the period. Net asset value total return includes adjustments in accordance with accounting principles generally accepted in the United States of America and as such, the net asset value for financial reporting purposes and the returns based upon those net asset values may differ from the net asset value and returns for shareholder transactions. These figures have been derived from the fund’s financial statements.
| ||||||
Year Ended November 30, | ||||||
Class A Shares | 2022 | 2021 | 2020 | 2019 | 2018 | |
Per Share Data ($): | ||||||
Net asset value, | 25.66 | 24.09 | 20.76 | 17.86 | 18.51 | |
Investment Operations: | ||||||
Net investment incomea | .10 | .05 | .08 | .15 | .15 | |
Net realized and unrealized | (4.31) | 2.21 | 3.72 | 2.98 | (.67) | |
Total from | (4.21) | 2.26 | 3.80 | 3.13 | (.52) | |
Distributions: | ||||||
Dividends from | (.05) | (.08) | (.15) | (.15) | (.13) | |
Dividends from net realized | (.09) | (.61) | (.32) | (.08) | - | |
Total Distributions | (.14) | (.69) | (.47) | (.23) | (.13) | |
Net asset value, end of period | 21.31 | 25.66 | 24.09 | 20.76 | 17.86 | |
Total Return (%)b | (16.50) | 9.58 | 18.67 | 17.81 | (2.84) | |
Ratios/Supplemental Data (%): | ||||||
Ratio of total expenses | 1.29 | 1.27 | 1.30 | 1.24 | 1.22 | |
Ratio of net expenses | 1.29 | 1.27 | 1.30 | 1.24 | 1.22 | |
Ratio of net investment income | .45 | .20 | .35 | .77 | .81 | |
Portfolio Turnover Rate | 6.98 | 8.72 | 7.20 | 7.38 | 7.47 | |
Net Assets, | 55,110 | 74,707 | 59,740 | 37,036 | 25,981 | |
a Based on average shares outstanding.
b Exclusive of sales charge.
See notes to financial statements.
17
FINANCIAL HIGHLIGHTS (continued)
Year Ended November 30, | ||||||
Class C Shares | 2022 | 2021 | 2020 | 2019 | 2018 | |
Per Share Data ($): | ||||||
Net asset value, | 25.07 | 23.63 | 20.38 | 17.53 | 18.17 | |
Investment Operations: | ||||||
Net investment income (loss)a | (.05) | (.12) | (.06) | .02 | .01 | |
Net realized and unrealized | (4.22) | 2.17 | 3.65 | 2.92 | (.65) | |
Total from | (4.27) | 2.05 | 3.59 | 2.94 | (.64) | |
Distributions: | ||||||
Dividends from | - | - | (.02) | (.01) | - | |
Dividends from net realized | (.09) | (.61) | (.32) | (.08) | - | |
Total Distributions | (.09) | (.61) | (.34) | (.09) | - | |
Net asset value, end of period | 20.71 | 25.07 | 23.63 | 20.38 | 17.53 | |
Total Return (%)b | (17.10) | 8.85 | 17.84 | 16.96 | (3.58) | |
Ratios/Supplemental Data (%): | ||||||
Ratio of total expenses | 1.98 | 1.97 | 1.98 | 1.98 | 1.96 | |
Ratio of net expenses | 1.98 | 1.97 | 1.98 | 1.98 | 1.96 | |
Ratio of net investment income | (.24) | (.47) | (.30) | .12 | .07 | |
Portfolio Turnover Rate | 6.98 | 8.72 | 7.20 | 7.38 | 7.47 | |
Net Assets, | 5,903 | 11,190 | 14,510 | 12,001 | 12,050 | |
a Based on average shares outstanding.
b Exclusive of sales charge.
See notes to financial statements.
18
Year Ended November 30, | ||||||
Class I Shares | 2022 | 2021 | 2020 | 2019 | 2018 | |
Per Share Data ($): | ||||||
Net asset value, | 25.88 | 24.27 | 20.90 | 17.98 | 18.64 | |
Investment Operations: | ||||||
Net investment incomea | .18 | .14 | .15 | .22 | .21 | |
Net realized and unrealized | (4.33) | 2.23 | 3.75 | 2.99 | (.67) | |
Total from | (4.15) | 2.37 | 3.90 | 3.21 | (.46) | |
Distributions: | ||||||
Dividends from | (.14) | (.15) | (.21) | (.21) | (.20) | |
Dividends from net realized | (.09) | (.61) | (.32) | (.08) | - | |
Total Distributions | (.23) | (.76) | (.53) | (.29) | (.20) | |
Net asset value, end of period | 21.50 | 25.88 | 24.27 | 20.90 | 17.98 | |
Total Return (%) | (16.20) | 10.01 | 19.07 | 18.23 | (2.53) | |
Ratios/Supplemental Data (%): | ||||||
Ratio of total expenses | .92 | .91 | .91 | .91 | .91 | |
Ratio of net expenses | .92 | .91 | .91 | .91 | .91 | |
Ratio of net investment income | ||||||
to average net assets | .81 | .56 | .72 | 1.13 | 1.11 | |
Portfolio Turnover Rate | 6.98 | 8.72 | 7.20 | 7.38 | 7.47 | |
Net Assets, | 2,925,622 | 3,847,708 | 3,142,203 | 2,191,801 | 1,953,256 | |
a Based on average shares outstanding.
See notes to financial statements.
19
FINANCIAL HIGHLIGHTS (continued)
Year Ended November 30, | ||||||
Class Y Shares | 2022 | 2021 | 2020 | 2019 | 2018 | |
Per Share Data ($): | ||||||
Net asset value, | 25.57 | 23.99 | 20.66 | 17.78 | 18.43 | |
Investment Operations: | ||||||
Net investment incomea | .19 | .15 | .16 | .21 | .21 | |
Net realized and unrealized | (4.28) | 2.19 | 3.71 | 2.97 | (.66) | |
Total from Investment Operations | (4.09) | 2.34 | 3.87 | 3.18 | (.45) | |
Distributions: | ||||||
Dividends from | (.15) | (.15) | (.22) | (.22) | (.20) | |
Dividends from net realized | (.09) | (.61) | (.32) | (.08) | - | |
Total Distributions | (.24) | (.76) | (.54) | (.30) | (.20) | |
Net asset value, end of period | 21.24 | 25.57 | 23.99 | 20.66 | 17.78 | |
Total Return (%) | (16.17) | 10.02 | 19.12 | 18.24 | (2.48) | |
Ratios/Supplemental Data (%): | ||||||
Ratio of total expenses | .89 | .88 | .89 | .89 | .89 | |
Ratio of net expenses | .89 | .88 | .89 | .89 | .89 | |
Ratio of net investment income | .85 | .59 | .77 | 1.12 | 1.16 | |
Portfolio Turnover Rate | 6.98 | 8.72 | 7.20 | 7.38 | 7.47 | |
Net Assets, | 2,325,263 | 3,069,335 | 2,818,746 | 2,284,939 | 1,801,389 | |
a Based on average shares outstanding.
See notes to financial statements.
20
NOTES TO FINANCIAL STATEMENTS
NOTE 1—Significant Accounting Policies:
BNY Mellon International Stock Fund (the “fund”) is a separate diversified series of BNY Mellon Strategic Funds, Inc. (the “Company”), which is registered under the Investment Company Act of 1940, as amended (the “Act”), as an open-end management investment company and operates as a series company currently offering six series, including the fund. The fund’s investment objective is to seek long-term total return. BNY Mellon Investment Adviser, Inc. (the “Adviser”), a wholly-owned subsidiary of The Bank of New York Mellon Corporation (“BNY Mellon”), serves as the fund’s investment adviser. Walter Scott & Partners Limited (the “Sub-Adviser”), a wholly-owned subsidiary of BNY Mellon and an affiliate of the Adviser, serves as the fund’s sub-adviser.
BNY Mellon Securities Corporation (the “Distributor”), a wholly-owned subsidiary of the Adviser, is the distributor of the fund’s shares. The fund is authorized to issue 700 million shares of $.001 par value Common Stock. The fund currently has authorized four classes of shares: Class A (100 million shares authorized), Class C (100 million shares authorized), Class I (250 million shares authorized) and Class Y (250 million shares authorized). Class A and Class C shares are sold primarily to retail investors through financial intermediaries and bear Distribution and/or Shareholder Services Plan fees. Class A shares generally are subject to a sales charge imposed at the time of purchase. Class A shares bought without an initial sales charge as part of an investment of $1 million or more may be charged a contingent deferred sales charge (“CDSC”) of 1.00% if redeemed within one year. Class C shares are subject to a CDSC imposed on Class C shares redeemed within one year of purchase. Class C shares automatically convert to Class A shares eight years after the date of purchase, without the imposition of a sales charge. Class I shares are sold primarily to bank trust departments and other financial service providers (including BNY Mellon and its affiliates), acting on behalf of customers having a qualified trust or an investment account or relationship at such institution, and bear no Distribution or Shareholder Services Plan fees. Class Y shares are sold at net asset value per share generally to institutional investors, and bear no Distribution or Shareholder Services Plan fees. Class I and Class Y shares are offered without a front-end sales charge or CDSC. Other differences between the classes include the services offered to and the expenses borne by each class, the allocation of certain transfer agency costs and certain voting rights. Income, expenses (other than expenses attributable to a specific class), and realized and unrealized gains or losses
21
NOTES TO FINANCIAL STATEMENTS (continued)
on investments are allocated to each class of shares based on its relative net assets.
The Company accounts separately for the assets, liabilities and operations of each series. Expenses directly attributable to each series are charged to that series’ operations; expenses which are applicable to all series are allocated among them on a pro rata basis.
The Financial Accounting Standards Board (“FASB”) Accounting Standards Codification (“ASC”) is the exclusive reference of authoritative U.S. generally accepted accounting principles (“GAAP”) recognized by the FASB to be applied by nongovernmental entities. Rules and interpretive releases of the SEC under authority of federal laws are also sources of authoritative GAAP for SEC registrants. The fund is an investment company and applies the accounting and reporting guidance of the FASB ASC Topic 946 Financial Services-Investment Companies. The fund’s financial statements are prepared in accordance with GAAP, which may require the use of management estimates and assumptions. Actual results could differ from those estimates.
The Company enters into contracts that contain a variety of indemnifications. The fund’s maximum exposure under these arrangements is unknown. The fund does not anticipate recognizing any loss related to these arrangements.
(a) Portfolio valuation: The fair value of a financial instrument is the amount that would be received to sell an asset or paid to transfer a liability in an orderly transaction between market participants at the measurement date (i.e., the exit price). GAAP establishes a fair value hierarchy that prioritizes the inputs of valuation techniques used to measure fair value. This hierarchy gives the highest priority to unadjusted quoted prices in active markets for identical assets or liabilities (Level 1 measurements) and the lowest priority to unobservable inputs (Level 3 measurements).
Additionally, GAAP provides guidance on determining whether the volume and activity in a market has decreased significantly and whether such a decrease in activity results in transactions that are not orderly. GAAP requires enhanced disclosures around valuation inputs and techniques used during annual and interim periods.
Various inputs are used in determining the value of the fund’s investments relating to fair value measurements. These inputs are summarized in the three broad levels listed below:
Level 1—unadjusted quoted prices in active markets for identical investments.
22
Level 2—other significant observable inputs (including quoted prices for similar investments, interest rates, prepayment speeds, credit risk, etc.).
Level 3—significant unobservable inputs (including the fund’s own assumptions in determining the fair value of investments).
The inputs or methodology used for valuing securities are not necessarily an indication of the risk associated with investing in those securities.
Changes in valuation techniques may result in transfers in or out of an assigned level within the disclosure hierarchy. Valuation techniques used to value the fund’s investments are as follows:
The Company’s Board of Directors (the “Board”) has designated the Adviser as the fund’s valuation designee, effective September 8, 2022, to make all fair value determinations with respect to the fund’s portfolio investments, subject to the Board’s oversight and pursuant to Rule 2a-5 under the Act.
Investments in equity securities are valued at the last sales price on the securities exchange or national securities market on which such securities are primarily traded. Securities listed on the National Market System for which market quotations are available are valued at the official closing price or, if there is no official closing price that day, at the last sales price. For open short positions, asked prices are used for valuation purposes. Bid price is used when no asked price is available. Registered investment companies that are not traded on an exchange are valued at their net asset value. All of the preceding securities are generally categorized within Level 1 of the fair value hierarchy.
Securities not listed on an exchange or the national securities market, or securities for which there were no transactions, are valued at the average of the most recent bid and asked prices. These securities are generally categorized within Level 2 of the fair value hierarchy.
Fair valuing of securities may be determined with the assistance of a pricing service using calculations based on indices of domestic securities and other appropriate indicators, such as prices of relevant ADRs and futures. Utilizing these techniques may result in transfers between Level 1 and Level 2 of the fair value hierarchy.
When market quotations or official closing prices are not readily available, or are determined not to accurately reflect fair value, such as when the value of a security has been significantly affected by events after the close of the exchange or market on which the security is principally traded (for example, a foreign exchange or market), but before the fund calculates its
23
NOTES TO FINANCIAL STATEMENTS (continued)
net asset value, the fund may value these investments at fair value as determined in accordance with the procedures approved by the Board. Certain factors may be considered when fair valuing investments such as: fundamental analytical data, the nature and duration of restrictions on disposition, an evaluation of the forces that influence the market in which the securities are purchased and sold, and public trading in similar securities of the issuer or comparable issuers. These securities are either categorized within Level 2 or 3 of the fair value hierarchy depending on the relevant inputs used.
For securities where observable inputs are limited, assumptions about market activity and risk are used and such securities are generally categorized within Level 3 of the fair value hierarchy.
Investments denominated in foreign currencies are translated to U.S. dollars at the prevailing rates of exchange.
The following is a summary of the inputs used as of November 30, 2022 in valuing the fund’s investments:
Level 1-Unadjusted Quoted Prices | Level 2- Other Significant Observable Inputs | Level 3-Significant Unobservable Inputs | Total | |||
Assets ($) | ||||||
Investments in Securities:† | ||||||
Equity Securities - Common Stocks | 456,025,677 | 4,841,149,944 | †† | - | 5,297,175,621 | |
Investment Companies | 59,736,882 | - | - | 59,736,882 | ||
† See Statement of Investments for additional detailed categorizations, if any.
†† Securities classified within Level 2 at period end as the values were determined pursuant to the fund’s fair valuation procedures.
(b) Foreign currency transactions: The fund does not isolate that portion of the results of operations resulting from changes in foreign exchange rates on investments from the fluctuations arising from changes in the market prices of securities held. Such fluctuations are included with the net realized and unrealized gain or loss on investments.
Net realized foreign exchange gains or losses arise from sales of foreign currencies, currency gains or losses realized on securities transactions between trade and settlement date, and the difference between the amounts of dividends, interest and foreign withholding taxes recorded on the fund’s books and the U.S. dollar equivalent of the amounts actually received or paid. Net unrealized foreign exchange gains and losses arise from changes in the value of assets and liabilities other than investments resulting from changes in exchange rates. Foreign currency gains and losses
24
on foreign currency transactions are also included with net realized and unrealized gain or loss on investments.
Foreign taxes: The fund may be subject to foreign taxes (a portion of which may be reclaimable) on income, stock dividends, realized and unrealized capital gains on investments or certain foreign currency transactions. Foreign taxes are recorded in accordance with the applicable foreign tax regulations and rates that exist in the foreign jurisdictions in which the fund invests. These foreign taxes, if any, are paid by the fund and are reflected in the Statement of Operations, if applicable. Foreign taxes payable or deferred or those subject to reclaims as of November 30, 2022, if any, are disclosed in the fund’s Statement of Assets and Liabilities.
(c) Securities transactions and investment income: Securities transactions are recorded on a trade date basis. Realized gains and losses from securities transactions are recorded on the identified cost basis. Dividend income is recognized on the ex-dividend date and interest income, including, where applicable, accretion of discount and amortization of premium on investments, is recognized on the accrual basis.
Pursuant to a securities lending agreement with BNY Mellon, the fund may lend securities to qualified institutions. It is the fund’s policy that, at origination, all loans are secured by collateral of at least 102% of the value of U.S. securities loaned and 105% of the value of foreign securities loaned. Collateral equivalent to at least 100% of the market value of securities on loan is maintained at all times. Collateral is either in the form of cash, which can be invested in certain money market mutual funds managed by the Adviser, or U.S. Government and Agency securities. The fund is entitled to receive all dividends, interest and distributions on securities loaned, in addition to income earned as a result of the lending transaction. Should a borrower fail to return the securities in a timely manner, BNY Mellon is required to replace the securities for the benefit of the fund or credit the fund with the market value of the unreturned securities and is subrogated to the fund’s rights against the borrower and the collateral. Additionally, the contractual maturity of security lending transactions are on an overnight and continuous basis. During the period ended November 30, 2022, BNY Mellon earned $3,286 from the lending of the fund’s portfolio securities, pursuant to the securities lending agreement.
(d) Affiliated issuers: Investments in other investment companies advised by the Adviser are considered “affiliated” under the Act.
25
NOTES TO FINANCIAL STATEMENTS (continued)
(e) Market Risk: The value of the securities in which the fund invests may be affected by political, regulatory, economic and social developments, and developments that impact specific economic sectors, industries or segments of the market. The value of a security may also decline due to general market conditions that are not specifically related to a particular company or industry, such as real or perceived adverse economic conditions, changes in the general outlook for corporate earnings, changes in interest or currency rates, changes to inflation, adverse changes to credit markets or adverse investor sentiment generally. In addition, turbulence in financial markets and reduced liquidity in equity, credit and/or fixed income markets may negatively affect many issuers, which could adversely affect the fund. Global economies and financial markets are becoming increasingly interconnected, and conditions and events in one country, region or financial market may adversely impact issuers in a different country, region or financial market. These risks may be magnified if certain events or developments adversely interrupt the global supply chain; in these and other circumstances, such risks might affect companies world-wide. Recent examples include pandemic risks related to COVID-19 and aggressive measures taken world-wide in response by governments, including closing borders, restricting international and domestic travel, and the imposition of prolonged quarantines of large populations, and by businesses, including changes to operations and reducing staff.
Foreign Investment Risk: To the extent the fund invests in foreign securities, the fund’s performance will be influenced by political, social and economic factors affecting investments in foreign issuers. Special risk associated with investments in foreign issuers include exposure to currency fluctuations, less liquidity, less developed or less efficient trading markets, lack of comprehensive company information, political and economic instability and differing auditing and legal standards.
(f) Dividends and distributions to shareholders: Dividends and distributions are recorded on the ex-dividend date. Dividends from net investment income and dividends from net realized capital gains, if any, are normally declared and paid annually, but the fund may make distributions on a more frequent basis to comply with the distribution requirements of the Internal Revenue Code of 1986, as amended (the “Code”). To the extent that net realized capital gains can be offset by capital loss carryovers, it is the policy of the fund not to distribute such gains. Income and capital gain distributions are determined in accordance with income tax regulations, which may differ from GAAP.
(g) Federal income taxes: It is the policy of the fund to continue to qualify as a regulated investment company, if such qualification is in the
26
best interests of its shareholders, by complying with the applicable provisions of the Code, and to make distributions of taxable income and net realized capital gain sufficient to relieve it from substantially all federal income and excise taxes.
As of and during the period ended November 30, 2022, the fund did not have any liabilities for any uncertain tax positions. The fund recognizes interest and penalties, if any, related to uncertain tax positions as income tax expense in the Statement of Operations. During the period ended November 30, 2022, the fund did not incur any interest or penalties.
Each tax year in the four-year period ended November 30, 2022 remains subject to examination by the Internal Revenue Service and state taxing authorities.
At November 30, 2022, the components of accumulated earnings on a tax basis were as follows: undistributed ordinary income $48,344,966, undistributed capital gains $79,168,201 and unrealized appreciation $1,545,778,983. In addition, the fund had $8,293,086 of capital losses realized after October 31, 2022, which were deferred for tax purposes to the first day of the following fiscal year.
The tax character of distributions paid to shareholders during the fiscal years ended November 30, 2022 and November 30, 2021 were as follows: ordinary income $38,686,760 and $42,376,927, and long-term capital gains $24,324,374 and $146,165,977, respectively.
NOTE 2—Bank Lines of Credit:
The fund participates with other long-term open-end funds managed by the Adviser in a $823.5 million unsecured credit facility led by Citibank, N.A. (the “Citibank Credit Facility”) and a $300 million unsecured credit facility provided by BNY Mellon (the “BNYM Credit Facility”), each to be utilized primarily for temporary or emergency purposes, including the financing of redemptions (each, a “Facility”). The Citibank Credit Facility is available in two tranches: (i) Tranche A is in an amount equal to $688.5 million and is available to all long-term open-ended funds, including the fund, and (ii) Tranche B is an amount equal to $135 million and is available only to BNY Mellon Floating Rate Income Fund, a series of BNY Mellon Investment Funds IV, Inc. In connection therewith, the fund has agreed to pay its pro rata portion of commitment fees for Tranche A of the Citibank Credit Facility and the BNYM Credit Facility. Interest is charged to the fund based on rates determined pursuant to the terms of the respective Facility at the time of borrowing.
27
NOTES TO FINANCIAL STATEMENTS (continued)
The average amount of borrowings outstanding under the Facilities during the period ended November 30, 2022 was approximately $369,041 with a related weighted average annualized interest rate of 3.61%.
NOTE 3—Management Fee, Sub-Advisory Fee and Other Transactions with Affiliates:
(a) Pursuant to a management agreement with the Adviser, the management fee is computed at the annual rate of .85% of the value of the fund’s average daily net assets and is payable monthly.
Pursuant to a sub-investment advisory agreement between the Adviser and the Sub-Adviser, the Adviser pays the Sub-Adviser a monthly fee at an annual rate of .41% of the value of the fund’s average daily net assets.
During the period ended November 30, 2022, the Distributor retained $1,337 from commissions earned on sales of the fund’s Class A shares and $1,463 from CDSC fees on redemptions of the fund’s Class C shares.
(b) Under the Distribution Plan adopted pursuant to Rule 12b-1 under the Act, Class C shares pay the Distributor for distributing its shares at an annual rate of .75% of the value of its average daily net assets. The Distributor may pay one or more Service Agents in respect of advertising, marketing and other distribution services, and determines the amounts, if any, to be paid to Service Agents and the basis on which such payments are made. During the period ended November 30, 2022, Class C shares were charged $68,975 pursuant to the Distribution Plan.
(c) Under the Shareholder Services Plan, Class A and Class C shares pay the Distributor at an annual rate of .25% of the value of their average daily net assets for the provision of certain services. The services provided may include personal services relating to shareholder accounts, such as answering shareholder inquiries regarding the fund, and services related to the maintenance of shareholder accounts. The Distributor may make payments to Service Agents (securities dealers, financial institutions or other industry professionals) with respect to these services. The Distributor determines the amounts to be paid to Service Agents. During the period ended November 30, 2022, Class A and Class C shares were charged $151,819 and $22,992, respectively, pursuant to the Shareholder Services Plan.
The fund has an arrangement with BNY Mellon Transfer, Inc., (the “Transfer Agent”), a subsidiary of BNY Mellon and an affiliate of the Adviser, whereby the fund may receive earnings credits when positive cash balances are maintained, which are used to offset Transfer Agent fees. For
28
financial reporting purposes, the fund includes transfer agent net earnings credits, if any, as an expense offset in the Statement of Operations.
The fund has an arrangement with The Bank of New York Mellon (the “Custodian”), a subsidiary of BNY Mellon and an affiliate of the Adviser, whereby the fund will receive interest income or be charged overdraft fees when cash balances are maintained. For financial reporting purposes, the fund includes this interest income and overdraft fees, if any, as interest income in the Statement of Operations.
The fund compensates the Transfer Agent, under a transfer agency agreement, for providing transfer agency and cash management services for the fund. The majority of Transfer Agent fees are comprised of amounts paid on a per account basis, while cash management fees are related to fund subscriptions and redemptions. During the period ended November 30, 2022, the fund was charged $91,018 for transfer agency services. These fees are included in Shareholder servicing costs in the Statement of Operations. These fees were partially offset by earnings credits of $1,323.
The fund compensates the Custodian, under a custody agreement, for providing custodial services for the fund. These fees are determined based on net assets, geographic region and transaction activity. During the period ended November 30, 2022, the fund was charged $803,628 pursuant to the custody agreement.
During the period ended November 30, 2022, the fund was charged $17,027 for services performed by the fund’s Chief Compliance Officer and his staff. These fees are included in Chief Compliance Officer fees in the Statement of Operations.
The components of “Due to BNY Mellon Investment Adviser, Inc. and affiliates” in the Statement of Assets and Liabilities consist of: management fee of $3,592,570, Distribution Plan fees of $4,614, Shareholder Services Plan fees of $12,374, Custodian fees of $420,000, Chief Compliance Officer fees of $2,721 and Transfer Agent fees of $14,325.
(d) Each Board Member also serves as a Board Member of other funds in the BNY Mellon Family of Funds complex. Annual retainer fees and attendance fees are allocated to each fund based on net assets.
NOTE 4—Securities Transactions:
The aggregate amount of purchases and sales of investment securities, excluding short-term securities during the period ended November 30, 2022, amounted to $405,553,800 and $708,672,683, respectively.
29
NOTES TO FINANCIAL STATEMENTS (continued)
At November 30, 2022, the cost of investments for federal income tax purposes was $3,809,986,230; accordingly, accumulated net unrealized appreciation on investments was $1,546,926,273, consisting of $1,799,174,859 gross unrealized appreciation and $252,248,586 gross unrealized depreciation.
30
REPORT OF INDEPENDENT REGISTERED PUBLIC ACCOUNTING FIRM
To the Shareholders and the Board of Directors of BNY Mellon International Stock Fund
Opinion on the Financial Statements
We have audited the accompanying statement of assets and liabilities of BNY Mellon International Stock Fund (the “Fund”) (one of the funds constituting BNY Mellon Strategic Funds, Inc.), including the statement of investments, as of November 30, 2022, and the related statement of operations for the year then ended, the statements of changes in net assets for each of the two years in the period then ended, the financial highlights for each of the five years in the period then ended and the related notes (collectively referred to as the “financial statements”). In our opinion, the financial statements present fairly, in all material respects, the financial position of the Fund (one of the funds constituting BNY Mellon Strategic Funds, Inc.) at November 30, 2022, the results of its operations for the year then ended, the changes in its net assets for each of the two years in the period then ended and its financial highlights for each of the five years in the period then ended, in conformity with U.S. generally accepted accounting principles.
Basis for Opinion
These financial statements are the responsibility of the Fund’s management. Our responsibility is to express an opinion on the Fund’s financial statements based on our audits. We are a public accounting firm registered with the Public Company Accounting Oversight Board (United States) (“PCAOB”) and are required to be independent with respect to the Fund in accordance with the U.S. federal securities laws and the applicable rules and regulations of the Securities and Exchange Commission and the PCAOB.
We conducted our audits in accordance with the standards of the PCAOB. Those standards require that we plan and perform the audit to obtain reasonable assurance about whether the financial statements are free of material misstatement, whether due to error or fraud. The Fund is not required to have, nor were we engaged to perform, an audit of the Fund’s internal control over financial reporting. As part of our audits, we are required to obtain an understanding of internal control over financial reporting, but not for the purpose of expressing an opinion on the effectiveness of the Fund’s internal control over financial reporting. Accordingly, we express no such opinion.
Our audits included performing procedures to assess the risks of material misstatement of the financial statements, whether due to error or fraud, and performing procedures that respond to those risks. Such procedures included examining, on a test basis, evidence regarding the amounts and disclosures in the financial statements. Our procedures included confirmation of securities owned as of November 30, 2022, by correspondence with the custodian, brokers and others; when replies were not received from brokers and others, we performed other auditing procedures. Our audits also included evaluating the accounting principles used and significant estimates made by management, as well as evaluating the overall presentation of the financial statements. We believe that our audits provide a reasonable basis for our opinion.

We have served as the auditor of one or more investment companies in the BNY Mellon Family of Funds since at least 1957, but we are unable to determine the specific year.
New York, New York
January 23, 2023
31
IMPORTANT TAX INFORMATION (Unaudited)
In accordance with federal tax law, the fund elects to provide each shareholder with their portion of the fund’s foreign taxes paid and the income sourced from foreign countries. Accordingly, the fund hereby reports the following information regarding its fiscal year ended November 30, 2022:
- the total amount of taxes paid to foreign countries was $12,782,171
- the total amount of income sourced from foreign countries was $114,302,855.
Where required by federal tax law rules, shareholders will receive notification of their proportionate share of foreign taxes paid and foreign sourced income for the 2022 calendar year with Form 1099-DIV which will be mailed in early 2023. For the fiscal year ended November 30, 2022, certain dividends paid by the fund may be subject to a maximum tax rate of 15%, as provided for by the Jobs and Growth Tax Relief Reconciliation Act of 2003. Of the distributions paid during the fiscal year, $51,468,931 represents the maximum amount that may be considered qualified dividend income. Also, the fund hereby reports $.0893 per share as a long-term capital gain distribution paid on December 14, 2021.
32
INFORMATION ABOUT THE RENEWAL OF THE FUND’S MANAGEMENT AND SUB-INVESTMENT ADVISORY AGREEMENTS (Unaudited)
At a meeting of the fund’s Board of Directors held on October 31-November 1, 2022, the Board considered the renewal of the fund’s Management Agreement, pursuant to which the Adviser provides the fund with investment advisory and administrative services, and the Sub-Investment Advisory Agreement (together with the Management Agreement, the “Agreements”), pursuant to which Walter Scott & Partners Limited (the “Sub-Adviser”) provides day-to-day management of the fund’s investments. The Board members, none of whom are “interested persons” (as defined in the Investment Company Act of 1940, as amended) of the fund, were assisted in their review by independent legal counsel and met with counsel in executive session separate from representatives of the Adviser and the Sub-Adviser. In considering the renewal of the Agreements, the Board considered several factors that it believed to be relevant, including those discussed below. The Board did not identify any one factor as dispositive, and each Board member may have attributed different weights to the factors considered.
Analysis of Nature, Extent, and Quality of Services Provided to the Fund. The Board considered information provided to it at the meeting and in previous presentations from representatives of the Adviser regarding the nature, extent, and quality of the services provided to funds in the BNY Mellon fund complex, including the fund. The Adviser provided the number of open accounts in the fund, the fund’s asset size and the allocation of fund assets among distribution channels. The Adviser also had previously provided information regarding the diverse intermediary relationships and distribution channels of funds in the BNY Mellon fund complex (such as retail direct or intermediary, in which intermediaries typically are paid by the fund and/or the Adviser) and the Adviser’s corresponding need for broad, deep, and diverse resources to be able to provide ongoing shareholder services to each intermediary or distribution channel, as applicable to the fund.
The Board also considered research support available to, and portfolio management capabilities of, the fund’s portfolio management personnel and that the Adviser also provides oversight of day-to-day fund operations, including fund accounting and administration and assistance in meeting legal and regulatory requirements. The Board also considered the Adviser’s extensive administrative, accounting and compliance infrastructures, as well as the Adviser’s supervisory activities over the Sub-Adviser. The Board also considered portfolio management’s brokerage policies and practices (including that there are no soft dollar arrangements in place for the fund) and the standards applied in seeking best execution.
Comparative Analysis of the Fund’s Performance and Management Fee and Expense Ratio. The Board reviewed reports prepared by Broadridge Financial Solutions, Inc. (“Broadridge”), an independent provider of investment company data based on classifications provided by Thomson Reuters Lipper (“Lipper”), which included information comparing (1) the performance of the fund’s Class I shares with the performance of a group of institutional international large-cap growth funds selected by
33
INFORMATION ABOUT THE RENEWAL OF THE FUND’S MANAGEMENT AND SUB-INVESTMENT ADVISORY AGREEMENTS (Unaudited) (continued)
Broadridge as comparable to the fund (the “Performance Group”) and with a broader group of funds consisting of all retail and institutional international large-cap growth funds (the “Performance Universe”), all for various periods ended September 30, 2022, and (2) the fund’s actual and contractual management fees and total expenses with those of the same group of funds in the Performance Group (the “Expense Group”) and with a broader group of all institutional international large-cap growth funds, excluding outliers (the “Expense Universe”), the information for which was derived in part from fund financial statements available to Broadridge as of the date of its analysis. The Adviser previously had furnished the Board with a description of the methodology Broadridge used to select the Performance Group and Performance Universe and the Expense Group and Expense Universe.
Performance Comparisons. Representatives of the Adviser stated that the usefulness of performance comparisons may be affected by a number of factors, including different investment limitations and policies that may be applicable to the fund and comparison funds and the end date selected. The Board also considered the fund’s performance in light of overall financial market conditions. The Board discussed with representatives of the Adviser and the Sub-Adviser the results of the comparisons and considered that the fund’s total return performance was at or above the Performance Group median for all periods, and above the Performance Universe median for the four-, five- and ten-year periods and below the Performance Universe median for the one-, two- and three-year periods. The Board considered the relative proximity of the fund’s performance to the Performance Universe medians in certain periods when performance was below median. The Adviser also provided a comparison of the fund’s calendar year total returns to the returns of the fund’s benchmark index, and it was noted that the fund’s returns were above the returns of the index in eight of the ten calendar years shown. The Board also noted that the fund had a four-star overall rating and a four-star rating for the three-, five- and ten-year periods from Morningstar based on Morningstar’s risk adjusted return measure.
Management Fee and Expense Ratio Comparisons. The Board reviewed and considered the contractual management fee rate payable by the fund to the Adviser in light of the nature, extent and quality of the management services and the sub-advisory services provided by the Adviser and the Sub-Adviser, respectively. In addition, the Board reviewed and considered the actual management fee rate paid by the fund over the fund’s last fiscal year. The Board also reviewed the range of actual and contractual management fees and total expenses as a percentage of average net assets of the Expense Group and Expense Universe funds and discussed the results of the comparisons.
The Board considered that the fund’s contractual management fee was higher than the Expense Group median contractual management fee, the fund’s actual management fee was higher than the Expense Group median and the Expense Universe median actual management fee and the fund’s total expenses were higher than the Expense Group median and the Expense Universe median total expenses.
34
Representatives of the Adviser reviewed with the Board the management or investment advisory fees paid to the Adviser or the Sub-Adviser or its affiliates for advising any separate accounts and/or other types of client portfolios that are considered to have similar investment strategies and policies as the fund (the “Similar Clients”), and explained the nature of the Similar Clients. They discussed differences in fees paid in light of any differences in the services provided and other relevant factors. The Board considered the relevance of the fee information provided for the Similar Clients to evaluate the appropriateness of the fund’s management fee. Representatives of the Adviser noted that there were no other funds advised by the Adviser that are in the same Lipper category as the fund.
The Board considered the fee payable to the Sub-Adviser in relation to the fee payable to the Adviser by the fund and the respective services provided by the Sub-Adviser and the Adviser. The Board also took into consideration that the Sub-Adviser’s fee is paid by the Adviser, out of its fee from the fund, and not the fund.
Analysis of Profitability and Economies of Scale. Representatives of the Adviser reviewed the expenses allocated and profit received by the Adviser and its affiliates and the resulting profitability percentage for managing the fund and the aggregate profitability percentage to the Adviser and its affiliates for managing the funds in the BNY Mellon fund complex, and the method used to determine the expenses and profit. The Board concluded that the profitability results were not excessive, given the services rendered and service levels provided by the Adviser and its affiliates. The Board also had been provided with information prepared by an independent consulting firm regarding the Adviser’s approach to allocating costs to, and determining the profitability of, individual funds and the entire BNY Mellon fund complex. The consulting firm also had analyzed where any economies of scale might emerge in connection with the management of a fund.
The Board considered, on the advice of its counsel, the profitability analysis (1) as part of its evaluation of whether the fees under the Agreements, considered in relation to the mix of services provided by the Adviser and the Sub-Adviser, including the nature, extent and quality of such services, supported the renewal of the Agreements and (2) in light of the relevant circumstances for the fund and the extent to which economies of scale would be realized if the fund grows and whether fee levels reflect these economies of scale for the benefit of fund shareholders. Representatives of the Adviser stated that a discussion of economies of scale is predicated on a fund having achieved a substantial size with increasing assets and that, if a fund’s assets had been stable or decreasing, the possibility that the Adviser may have realized any economies of scale would be less. Representatives of the Adviser also stated that, as a result of shared and allocated costs among funds in the BNY Mellon fund complex, the extent of economies of scale could depend substantially on the level of assets in the complex as a whole, so that increases and decreases in complex-wide assets can affect potential economies of scale in a manner that is disproportionate to, or even in the opposite direction from, changes in the fund’s asset level. The Board also considered potential benefits to the Adviser and the Sub-Adviser from acting as investment adviser and sub-investment adviser,
35
INFORMATION ABOUT THE RENEWAL OF THE FUND’S MANAGEMENT AND SUB-INVESTMENT ADVISORY AGREEMENTS (Unaudited) (continued)
respectively, and took into consideration that there were no soft dollar arrangements in effect for trading the fund’s investments.
At the conclusion of these discussions, the Board agreed that it had been furnished with sufficient information to make an informed business decision with respect to the renewal of the Agreements. Based on the discussions and considerations as described above, the Board concluded and determined as follows.
· The Board concluded that the nature, extent and quality of the services provided by the Adviser and the Sub-Adviser are adequate and appropriate.
· The Board generally was satisfied with the fund’s overall performance.
· The Board concluded that the fees paid to the Adviser and the Sub-Adviser continued to be appropriate under the circumstances and in light of the factors and the totality of the services provided as discussed above.
· The Board determined that the economies of scale which may accrue to the Adviser and its affiliates in connection with the management of the fund had been adequately considered by the Adviser in connection with the fee rate charged to the fund pursuant to its Management Agreement and that, to the extent in the future it were determined that material economies of scale had not been shared with the fund, the Board would seek to have those economies of scale shared with the fund.
In evaluating the Agreements, the Board considered these conclusions and determinations and also relied on its previous knowledge, gained through meetings and other interactions with the Adviser and its affiliates and the Sub-Adviser, of the Adviser and the Sub-Adviser and the services provided to the fund by the Adviser and the Sub-Adviser. The Board also relied on information received on a routine and regular basis throughout the year relating to the operations of the fund and the investment management and other services provided under the Agreements, including information on the investment performance of the fund in comparison to similar mutual funds and benchmark performance indices; general market outlook as applicable to the fund; and compliance reports. In addition, the Board’s consideration of the contractual fee arrangements for the fund had the benefit of a number of years of reviews of the Agreements for the fund, or substantially similar agreements for other BNY Mellon funds that the Board oversees, during which lengthy discussions took place between the Board and representatives of the Adviser. Certain aspects of the arrangements may receive greater scrutiny in some years than in others, and the Board’s conclusions may be based, in part, on its consideration of the fund’s arrangements, or substantially similar arrangements for other BNY Mellon funds that the Board oversees, in prior years. The Board determined to renew the Agreements.
36
BOARD MEMBERS INFORMATION (Unaudited)
Independent Board Members
Joseph S. DiMartino (79)
Chairman of the Board (1995)
Principal Occupation During Past 5 Years:
· Director or Trustee of funds in the BNY Mellon Family of Funds and certain other entities (as described in the fund’s Statement of Additional Information) (1995-Present)
Other Public Company Board Memberships During Past 5 Years:
· CBIZ, Inc., a public company providing professional business services, products and solutions, Director (1997-Present)
No. of Portfolios for which Board Member Serves: 92
———————
Joni Evans (80)
Board Member (2006)
Principal Occupation During Past 5 Years:
· www.wowOwow.com, an online community dedicated to women’s conversations and publications, Chief Executive Officer (2007-2019)
· Joni Evans Ltd. publishing, Principal (2006-2019)
No. of Portfolios for which Board Member Serves: 17
———————
Joan Gulley (75)
Board Member (2017)
Principal Occupation During Past 5 Years:
· Nantucket Atheneum, public library, Chair (2018-June 2021) and Director (2015-June 2021)
· Orchard Island Club, golf and beach club, Governor (2016-Present)
No. of Portfolios for which Board Member Serves: 39
———————
37
BOARD MEMBERS INFORMATION (Unaudited) (continued)
Alan H. Howard (63)
Board Member (2018)
Principal Occupation During Past 5 Years:
· Heathcote Advisors LLC, a financial advisory services firm, Managing Partner (2008-Present)
· Dynatech/MPX Holdings LLC, a global supplier and service provider of military aircraft parts, President (2012-2019); and Board Member of its two operating subsidiaries, Dynatech International LLC and Military Parts Exchange LLC (2012-2019), including Chief Executive Officer of an operating subsidiary, Dynatech International LLC (2013-2019)
· Rossoff & Co., an independent investment banking firm, Senior Advisor (2013-June 2021)
Other Public Company Board Memberships During Past 5 Years:
· Movado Group, Inc., a public company that designs, sources, markets and distributes watches, Director (1997-Present)
· Diamond Offshore Drilling, Inc., a public company that provides contract drilling services, Director (March 2020-April 2021)
No. of Portfolios for which Board Member Serves: 17
———————
Robin A. Melvin (59)
Board Member (1995)
Principal Occupation During Past 5 Years:
· Westover School, a private girls’ boarding school in Middlebury, Connecticut, Trustee (2019-Present)
· Mentor Illinois, a non-profit organization dedicated to increasing the quantity and quality of mentoring services in Illinois. Co-Chair (2014–2020); Board Member, Mentor Illinois (2013-2020)
· JDRF, a non-profit juvenile diabetes research foundation, Board Member (June 2021-June 2022)
Other Public Company Board Memberships During Past 5 Years:
· HPS Corporate Lending Fund, a closed-end management investment company regulated as a business development company, Trustee (August 2021-Present)
No. of Portfolios for which Board Member Serves: 71
———————
Burton N. Wallack (72)
Board Member (2006)
Principal Occupation During Past 5 Years:
Wallack Management Company, a real estate management company, President and Co-owner (1987-Present)
Other Public Company Board Memberships During Past 5 Years:
Mount Sinai Hospital Urology, Board Member (2017-Present)
No. of Portfolios for which Board Member Serves: 17
———————
38
Benaree Pratt Wiley (76)
Board Member (2016)
Principal Occupation During Past 5 Years:
· The Wiley Group, a firm specializing in strategy and business development. Principal (2005-Present)
Other Public Company Board Memberships During Past 5 Years:
· CBIZ, Inc., a public company providing professional business services, products and solutions, Director (2008-Present)
· Blue Cross-Blue Shield of Massachusetts, Director (2004-2020)
No. of Portfolios for which Board Member Serves: 60
———————
Gordon J. Davis (81)
Advisory Board Member (2021)
Principal Occupation During Past 5 Years:
· Venable LLP, a law firm, Partner (2012-Present)
Other Public Company Board Memberships During Past 5 Years:
· BNY Mellon Family of Funds (53 funds), Board Member (1995-August 2021)
No. of Portfolios for which Advisory Board Member Serves: 39
———————
The address of the Board Members and Officers is c/o BNY Mellon Investment Adviser, Inc., 240 Greenwich Street, New York, New York 10286. Additional information about each Board Member is available in the fund’s Statement of Additional Information which can be obtained from the Adviser free of charge by calling this toll free number: 1-800-373-9387.
39
OFFICERS OF THE FUND (Unaudited)
DAVID DIPETRILLO, President since January 2021.
Vice President and Director of the Adviser since February 2021; Head of North America Product, BNY Mellon Investment Management since January 2018; and Director of Product Strategy, BNY Mellon Investment Management from January 2016 to December 2017. He is an officer of 54 investment companies (comprised of 107 portfolios) managed by the Adviser or an affiliate of the Adviser. He is 44 years old and has been an employee of BNY Mellon since 2005.
JAMES WINDELS, Treasurer since November 2001.
Vice President of the Adviser since September 2020; and Director–BNY Mellon Fund Administration. He is an officer of 55 investment companies (comprised of 127 portfolios) managed by the Adviser or an affiliate of the Adviser. He is 64 years old and has been an employee of the Adviser since April 1985.
PETER M. SULLIVAN, Chief Legal Officer since July 2021 and Vice President and Assistant Secretary since March 2019.
Chief Legal Officer of the Adviser and Associate General Counsel of BNY Mellon since July 2021; Senior Managing Counsel of BNY Mellon from December 2020 to July 2021; and Managing Counsel of BNY Mellon from March 2009 to December 2020. He is an officer of 55 investment companies (comprised of 127 portfolios) managed by the Adviser or an affiliate of the Adviser. He is 54 years old and has been an employee of BNY Mellon since April 2004.
JAMES BITETTO, Vice President since August 2005 and Secretary since February 2018.
Senior Managing Counsel of BNY Mellon since December 2019; Managing Counsel of BNY Mellon from April 2014 to December 2019; and Secretary of the Adviser. He is an officer of 55 investment companies (comprised of 127 portfolios) managed by the Adviser or an affiliate of the Adviser. He is 56 years old and has been an employee of the Adviser since December 1996.
DEIRDRE CUNNANE, Vice President and Assistant Secretary since March 2019.
Managing Counsel of BNY Mellon since December 2021, Counsel of BNY Mellon from August 2018 to December 2021; and Senior Regulatory Specialist at BNY Mellon Investment Management Services from February 2016 to August 2018. She is an officer of 55 investment companies (comprised of 127 portfolios) managed by the Adviser or an affiliate of the Adviser. She is 32 years old and has been an employee of the Adviser since August 2018.
SARAH S. KELLEHER, Vice President and Assistant Secretary since April 2014.
Vice President of BNY Mellon ETF Investment Adviser; LLC since February 2020; Senior Managing Counsel of BNY Mellon since September 2021; Managing Counsel of BNY Mellon from December 2017 to September 2021; and Senior Counsel of BNY Mellon from March 2013 to December 2017. She is an officer of 55 investment companies (comprised of 127 portfolios) managed by the Adviser or an affiliate of the Adviser. She is 47 years old and has been an employee of the Adviser since March 2013.
JEFF PRUSNOFSKY, Vice President and Assistant Secretary since August 2005.
Senior Managing Counsel of BNY Mellon. He is an officer of 55 investment companies (comprised of 127 portfolios) managed by the Adviser or an affiliate of the Adviser. He is 57 years old and has been an employee of the Adviser since October 1990.
AMANDA QUINN, Vice President and Assistant Secretary since March 2020.
Counsel of BNY Mellon since June 2019; Regulatory Administration Manager at BNY Mellon Investment Management Services from September 2018 to May 2019; and Senior Regulatory Specialist at BNY Mellon Investment Management Services from April 2015 to August 2018. She is an officer of 55 investment companies (comprised of 127 portfolios) managed by the Adviser or an affiliate of the Adviser. She is 37 years old and has been an employee of the Adviser since June 2019.
40
NATALYA ZELENSKY, Vice President and Assistant Secretary since March 2017.
Chief Compliance Officer since August 2021 and Vice President since February 2020 of BNY Mellon ETF Investment Adviser, LLC; Chief Compliance Officer since August 2021 and Vice President and Assistant Secretary since February 2020 of BNY Mellon ETF Trust; Managing Counsel of BNY Mellon from December 2019 to August 2021; Counsel of BNY Mellon from May 2016 to December 2019; and Assistant Secretary of the Adviser from April 2018 to August 2021. She is an officer of 55 investment companies (comprised of 127 portfolios) managed by the Adviser or an affiliate of the Adviser. She is 37 years old and has been an employee of BNY Mellon since May 2016.
DANIEL GOLDSTEIN, Vice President since March 2022.
Vice President and Head of Product Development of North America Product, BNY Mellon Investment Management since January 2018; Co-Head of Product Management, Development & Oversight of North America Product, BNY Mellon Investment Management from January 2010 to January 2018; and Senior Vice President, Development & Oversight of North America Product, BNY Mellon Investment Management since 2010. He is an officer of 54 investment companies (comprised of 107 portfolios) managed by the Adviser or an affiliate of the Adviser. He is 53 years old and has been an employee of the Distributor since 1991.
JOSEPH MARTELLA, Vice President since March 2022.
Vice President and Head of Product Management of North America Product, BNY Mellon Investment Management since January 2018; Director of Product Research and Analytics of North America Product, BNY Mellon Investment Management from January 2010 to January 2018; and Senior Vice President of North America Product, BNY Mellon Investment Management since 2010. He is an officer of 54 investment companies (comprised of 107 portfolios) managed by the Adviser or an affiliate of the Adviser. He is 46 years old and has been an employee of the Distributor since 1999.
GAVIN C. REILLY, Assistant Treasurer since December 2005.
Tax Manager–BNY Mellon Fund Administration. He is an officer of 55 investment companies (comprised of 127 portfolios) managed by the Adviser or an affiliate of the Adviser. He is 54 years old and has been an employee of the Adviser since April 1991.
ROBERT SALVIOLO, Assistant Treasurer since July 2007.
Senior Accounting Manager–BNY Mellon Fund Administration. He is an officer of 55 investment companies (comprised of 127 portfolios) managed by the Adviser or an affiliate of the Adviser. He is 55 years old and has been an employee of the Adviser since June 1989.
ROBERT SVAGNA, Assistant Treasurer since December 2002.
Senior Accounting Manager–BNY Mellon Fund Administration. He is an officer of 55 investment companies (comprised of 127 portfolios) managed by the Adviser or an affiliate of the Adviser. He is 55 years old and has been an employee of the Adviser since November 1990.
JOSEPH W. CONNOLLY, Chief Compliance Officer since October 2004.
Chief Compliance Officer of the BNY Mellon Family of Funds and BNY Mellon Funds Trust since 2004; and Chief Compliance Officer of the Adviser from 2004 until June 2021. He is the Chief Compliance Officer of 54 investment companies (comprised of 112 portfolios) managed by the Adviser. He is 65 years old.
CARIDAD M. CAROSELLA, Anti-Money Laundering Compliance Officer since January 2016.
Anti-Money Laundering Compliance Officer of the BNY Mellon Family of Funds and BNY Mellon Funds Trust. She is an officer of 48 investment companies (comprised of 120 portfolios) managed by the Adviser or an affiliate of the Adviser. She is 54 years old and has been an employee of the Distributor since 1997.
41
BNY Mellon International Stock Fund
240 Greenwich Street
New York, NY 10286
Adviser
BNY Mellon Investment Adviser, Inc.
240 Greenwich Street
New York, NY 10286
Sub-Adviser
Walter Scott & Partners Limited
One Charlotte Square
Edinburgh, Scotland, UK
Custodian
The Bank of New York Mellon
240 Greenwich Street
New York, NY 10286
Transfer Agent &
Dividend Disbursing Agent
BNY Mellon Transfer, Inc.
240 Greenwich Street
New York, NY 10286
Distributor
BNY Mellon Securities Corporation
240 Greenwich Street
New York, NY 10286
Ticker Symbols: | Class A: DISAX Class C: DISCX Class I: DISRX Class Y: DISYX |
Telephone Call your financial representative or 1-800-373-9387
Mail The BNY Mellon Family of Funds, 144 Glenn Curtiss Boulevard, Uniondale, NY 11556-0144
E-mail Send your request to info@bnymellon.com
Internet Information can be viewed online or downloaded at www.im.bnymellon.com
The fund files its complete schedule of portfolio holdings with the Securities and Exchange Commission (“SEC”) for the first and third quarters of each fiscal year on Form N-PORT. The fund’s Forms N-PORT are available on the SEC’s website at www.sec.gov.
A description of the policies and procedures that the fund uses to determine how to vote proxies relating to portfolio securities and information regarding how the fund voted these proxies for the most recent 12-month period ended June 30 is available at www.im.bnymellon.com and on the SEC’s website at www.sec.gov and without charge, upon request, by calling 1-800-373-9387.
© 2023 BNY Mellon Securities Corporation |
|

BNY Mellon Select Managers Small Cap Value Fund
ANNUAL REPORT November 30, 2022 |
|

Save time. Save paper. View your next shareholder report online as soon as it’s available. Log into www.im.bnymellon.com and sign up for eCommunications. It’s simple and only takes a few minutes. |
The views expressed in this report reflect those of the portfolio manager(s) only through the end of the period covered and do not necessarily represent the views of BNY Mellon Investment Adviser, Inc. or any other person in the BNY Mellon Investment Adviser, Inc. organization. Any such views are subject to change at any time based upon market or other conditions and BNY Mellon Investment Adviser, Inc. disclaims any responsibility to update such views. These views may not be relied on as investment advice and, because investment decisions for a fund in the BNY Mellon Family of Funds are based on numerous factors, may not be relied on as an indication of trading intent on behalf of any fund in the BNY Mellon Family of Funds. |
Not FDIC-Insured • Not Bank-Guaranteed • May Lose Value |
Contents
THE FUND
FOR MORE INFORMATION
Back Cover
DISCUSSION OF FUND PERFORMANCE (Unaudited)
For the period from December 1, 2021, through November 30, 2022, as provided by portfolio allocation manager, Elena Goncharova.
Market and Fund Performance Overview
For the 12-month period ended November 30, 2022, BNY Mellon Select Managers Small Cap Value Fund’s (the “fund”) Class A, Class C, Class I and Class Y shares at NAV produced total returns of −7.76%, −8.44%, −7.55% and −7.48%, respectively.1 In comparison, the Russell 2000® Value Index (the “Index”), the fund’s benchmark, returned −4.75% for the same period.2
Small-cap value stocks lost ground over the reporting period as markets felt the effects of rising inflation and interest rates. The fund lagged the Index, mainly due to unfavorable asset allocation decisions.
The fund’s board has approved Denali Advisors, LLC (Denali) as an additional sub-adviser to the fund, effective on or about November 15, 2022 (the Effective Date). In addition, with the fund board’s approval, BNY Mellon Investment Adviser, Inc. (BNYM Investment Adviser), the fund’s investment adviser and portfolio allocation manager, has terminated the Sub-Investment Advisory Agreement between BNYM Investment Adviser and Walthausen & Co., LLC (Walthausen), effective November 15, 2022.
The Fund’s Investment Approach
The fund seeks capital appreciation. To pursue its goal, the fund normally invests at least 80% of its net assets in the stocks of small-cap companies. The fund currently considers small-cap companies to be those companies with market capitalizations that fall within the range of companies in the Index, the fund’s benchmark index. The fund’s portfolio is constructed to have a value tilt.
The fund uses a “multi-manager” approach by selecting various subadvisers to manage its assets. We may hire, terminate or replace subadvisers and modify material terms and conditions of sub-advisory arrangements without shareholder approval.
The fund’s assets will be allocated among five subadvisers— Channing Capital Management, LLC, Eastern Shore Capital Management, Neuberger Berman Investment Advisers LLC, Heartland Advisors, Inc., and Denali. The target percentage of the fund’s assets to be allocated over time to the subadvisers is approximately 27% to Channing; 14% to Eastern Shore; 19% to Neuberger Berman; 21% to Heartland and 20% to Denali. In addition, BNYM Investment Adviser, Inc., the fund’s investment adviser & portfolio allocation manager, is permitted to adjust those allocations by up to 20% of the fund’s assets without board approval. Subject to board approval, the fund may hire, terminate or replace subadvisers and modify material terms and conditions of subadvisory arrangements without shareholder approval.
2
Inflation, Monetary Tightening and Concerns about Growth Weigh on Markets
The reporting period was defined by a significant shift from positive to negative investor sentiment. This was driven by high inflation, dramatically tightening monetary policy from the Federal Reserve (the “Fed”) and the Russia-Ukraine War.
Inflation continued to rise around the world, worrying consumers and investors alike. In response to persistently high inflation, the Fed shifted its policy from helping economic recovery to taming rising inflation by raising interest rates and reducing its balance sheet. Higher rates are intended to help tame inflation as consumers and businesses cut back on consumption and investments due to higher borrowing costs.
As 2022 progressed, inflation data and central bank monetary tightening policies dominated the market narrative. Slower growth prospects, supply-chain concerns and expectations that interest rates would be higher for a longer period negatively impacted stock valuations. Across Europe, a broad monetary tightening effort by the Bank of England and the European Central Bank was implemented. In the EU, high inflation readings dampened the growth outlook, while soaring energy prices became a focus for European policymakers.
In contrast to monetary normalization and reopening trends worldwide, China continued to implement more accommodative monetary policies to address lackluster economic growth stemming from a weak macroeconomic environment and strict COVID-19 lockdown policies.
Political leadership in the world’s leading economies also dominated headlines and drove market sentiment. In the UK, Rishi Sunak calmed capital markets after taking over as the new prime minister after a short stint by Liz Truss, who took over for Boris Johnson. In Italy, Giorgia Meloni took the helm of prime minister, while the country continued to struggle economically. In China, Xi Jinping secured an unprecedented third term as president, rattling markets as his Zero-COVID-19 policies and technology sector crackdowns could go unchecked, given his consolidation of power.
As the reporting period progressed, markets responded in rollercoaster fashion to tightening monetary policy, mixed economic data and geopolitical uncertainties. Midway through the year, the market appeared to reach a bottom and began to rebound before descending again late in the period.
Asset Allocation Hampered Fund Performance
The fund’s underperformance versus the Index stemmed mainly from unfavorable asset allocation. The fund’s relative results were hampered primarily by an underweight to the energy sector, which was the Index’s best-performing sector. An underweight to the utilities sector, which also performed well, also detracted from returns, as did an overweight to the information technology sector, which lagged the Index. The fund also tends to be underweight on value stocks relative to the Index, and that was a drag on relative returns as well.
On a more positive note, the fund was correctly positioned on key risk factors, being underweight small caps, overweight on quality and underweight on volatility. In addition, the fund benefited from stock selection decisions, primarily in the health care sector. The fund’s
3
DISCUSSION OF FUND PERFORMANCE (Unaudited) (continued)
positions spread across a range of industries, and these were largely advantageous. Holdings in the health care facilities business in particular were beneficial.
Volatility Likely to Ease, but Recession Odds Are High
Volatility is likely to remain over the near term, given a number of uncertainties on the horizon. These include the prospect of a recession, or at least a slowdown, as well as ongoing geopolitical factors. The uncertain trajectory of the war in Ukraine continues to affect the outlook for oil supplies and prices, and, as of this date, the direction of China’s Zero-COVID policy and its effect on the global economy are also unclear.
Nevertheless, we believe the Fed is nearing the end of its tightening phase, and this is likely to reduce the volatility seen in the market in 2022. In the coming months, volatility is more likely to stem from weakening economic growth than from central bank policy. Worldwide, a broad consensus among central banks in developed markets on the need to raise policy rates may dissolve if an economic slowdown materializes.
Factors supporting the market in the near term include an easing of inflation and a buoyant job market. Any additional good news that occurs is likely to further support market performance in the near term.
December 15, 2022
1 Total return includes reinvestment of dividends and any capital gains paid and does not take into consideration the maximum initial sales charge in the case of Class A shares, or the applicable contingent deferred sales charge imposed on redemptions in the case of Class C shares. Had these charges been reflected, returns would have been lower. Past performance is no guarantee of future results. Share price and investment return fluctuate such that upon redemption, fund shares may be worth more or less than their original cost. Return figures provided reflect the absorption of certain fund expenses by BNY Mellon Investment Adviser, Inc. pursuant to an undertaking in effect through March 31, 2023, at which time it may be extended, terminated or modified. Had these expenses not been absorbed, the fund’s returns would have been lower.
2 Source: Lipper Inc. — The Russell 2000® Value Index measures the performance of the small-cap value segment of the U.S. equity universe. It includes those Russell 2000 companies that are considered more value-oriented relative to the overall market as defined by Russell’s leading style methodology. The Russell 2000® Value Index is constructed to provide a comprehensive and unbiased barometer for the small-cap value segment. The Index is completely reconstituted annually to ensure larger stocks do not distort the performance and characteristics of the true small-cap opportunity set, and that the represented companies continue to reflect value characteristics. Investors cannot invest directly in any index.
Equities are subject generally to market, market sector, market liquidity, issuer and investment style risks, among other factors, to varying degrees, all of which are more fully described in the fund’s prospectus.
Multi-manager risk means each sub-adviser makes investment decisions independently, and it is possible that the investment styles of the sub advisers may not complement one another. Consequently, the fund’s exposure to given stock, industry or investment style could be greater or smaller than if the fund had a single adviser.
Investing in foreign denominated and/or domiciled securities involves special risks, including changes in currency exchange rates, political, economic and social instability, limited company information, differing auditing and legal standards, and less market liquidity. These risks are generally greater with emerging market countries.
The prices of small company stocks tend to be more volatile than the prices of large company stocks, mainly because these companies have less established and more volatile earnings histories. They also tend to be less liquid than larger company stocks.
References to specific securities, asset classes and financial markets are for illustrative purposes only and are not intended to be and should not be interpreted as recommendations.
Recent market risks include pandemic risks related to COVID-19. The effects of COVID-19 have contributed to increased volatility in global markets and will likely affect certain countries, companies, industries and market sectors more dramatically than others. To the extent the fund may overweight its investments in certain countries, companies, industries or market sectors, such positions will increase the fund’s exposure to risk of loss from adverse developments affecting those countries, companies, industries or sectors.
4
FUND PERFORMANCE (Unaudited)
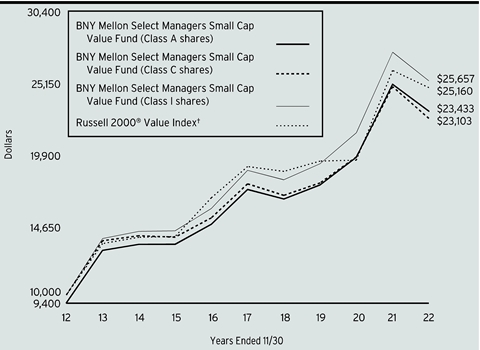
Comparison of change in value of a $10,000 investment in Class A shares, Class C shares and Class I shares of BNY Mellon Select Managers Small Cap Value Fund with a hypothetical investment of $10,000 in the Russell 2000® Value Index (the “Index”).
† Source: Lipper Inc.
Past performance is not predictive of future performance. The above graph compares a hypothetical $10,000 investment made in each of the Class A shares, Class C shares and Class I shares of BNY Mellon Select Managers Small Cap Value Fund on 11/30/12 to a hypothetical investment of $10,000 made in the Index on that date. All dividends and capital gain distributions are reinvested.
The fund’s performance shown in the line graph above takes into account the maximum initial sales charge on Class A shares and all other applicable fees and expenses on Class A shares, Class C shares and Class I shares. The Index measures the performance of the small-cap value segment of the U.S. equity universe. It includes those Russell 2000 companies that are considered more value-oriented relative to the overall market as defined by Russell’s leading style methodology. The Index is constructed to provide a comprehensive and unbiased barometer for the small-cap value segment. The Index is completely reconstituted annually to ensure larger stocks do not distort the performance and characteristics of the true small-cap opportunity set and that the represented companies continue to reflect value characteristics. Unlike a mutual fund, the Index is not subject to charges, fees and other expenses. Investors cannot invest directly in any index. Further information relating to fund performance, including expense reimbursements, if applicable, is contained in the Financial Highlights section of the prospectus and elsewhere in this report.
5
FUND PERFORMANCE (Unaudited) (continued)

Comparison of change in value of a $1,000,000 investment in Class Y shares of BNY Mellon Select Managers Small Cap Value Fund with a hypothetical investment of $1,000,000 in the Russell 2000® Value Index (the “Index”).
† Source: Lipper Inc.
†† The total return figures presented for Class Y shares of the fund reflect the performance of the fund’s Class A shares for the period prior to 7/1/13 (the inception date for Class Y shares), not reflecting the applicable sales charges for Class A shares.
Past performance is not predictive of future performance. The above graph compares a hypothetical $1,000,000 investment made in Class Y shares of BNY Mellon Select Managers Small Cap Value Fund on 11/30/12 to a hypothetical investment of $1,000,000 made in the Index on that date. All dividends and capital gain distributions are reinvested.
The fund’s performance shown in the line graph above takes into account all other applicable fees and expenses of fund’s Class Y shares. The Index measures the performance of the small-cap value segment of the U.S. equity universe. It includes those Russell 2000 companies that are considered more value-oriented relative to the overall market as defined by Russell’s leading style methodology. The Index is constructed to provide a comprehensive and unbiased barometer for the small-cap value segment. The Index is completely reconstituted annually to ensure larger stocks do not distort the performance and characteristics of the true small-cap opportunity set and that the represented companies continue to reflect value characteristics. Unlike a mutual fund, the Index is not subject to charges, fees and other expenses. Investors cannot invest directly in any index. Further information relating to fund performance, including expense reimbursements, if applicable, is contained in the Financial Highlights section of the prospectus and elsewhere in this report.
6
Average Annual Total Returns as of 11/30/2022 | ||||
Inception | ||||
| Date | 1 Year | 5 Years | 10 Years |
Class A shares | ||||
with maximum sales charge (5.75%) | 12/17/08 | -13.08% | 4.51% | 8.89% |
without sales charge | 12/17/08 | -7.76% | 5.75% | 9.54% |
Class C shares | ||||
with applicable redemption charge† | 12/17/08 | -9.20% | 4.97% | 8.73% |
without redemption | 12/17/08 | -8.44% | 4.97% | 8.73% |
Class I shares | 12/17/08 | -7.55% | 6.06% | 9.88% |
Class Y shares | 7/1/13 | -7.48% | 6.11% | 9.99%†† |
Russell 2000® Value Index | -4.75% | 5.35% | 9.67% | |
† The maximum contingent deferred sales charge for Class C shares is 1% for shares redeemed within one year of the date of purchase.
†† The total return performance figures presented for Class Y shares of the fund reflect the performance of the fund’s Class A shares for the period prior to 7/1/13 (the inception date for Class Y shares), not reflecting the applicable sales charges for Class A shares.
The performance data quoted represents past performance, which is no guarantee of future results. Share price and investment return fluctuate and an investor’s shares may be worth more or less than original cost upon redemption. Current performance may be lower or higher than the performance quoted. Go to www.im.bnymellon.com for the fund’s most recent month-end returns.
The fund’s performance shown in the graphs and table does not reflect the deduction of taxes that a shareholder would pay on fund distributions or the redemption of fund shares. In addition to the performance of Class A shares shown with and without a maximum sales charge, the fund's performance shown in the table takes into account all other applicable fees and expenses on all classes.
7
UNDERSTANDING YOUR FUND’S EXPENSES (Unaudited)
As a mutual fund investor, you pay ongoing expenses, such as management fees and other expenses. Using the information below, you can estimate how these expenses affect your investment and compare them with the expenses of other funds. You also may pay one-time transaction expenses, including sales charges (loads) and redemption fees, which are not shown in this section and would have resulted in higher total expenses. For more information, see your fund’s prospectus or talk to your financial adviser.
Review your fund’s expenses
The table below shows the expenses you would have paid on a $1,000 investment in BNY Mellon Select Managers Small Cap Value Fund from June 1, 2022 to November 30, 2022. It also shows how much a $1,000 investment would be worth at the close of the period, assuming actual returns and expenses.
Expenses and Value of a $1,000 Investment |
| |||||
Assume actual returns for the six months ended November 30, 2022 |
| |||||
|
|
|
|
|
|
|
|
| Class A | Class C | Class I | Class Y |
|
Expenses paid per $1,000† | $6.48 | $10.20 | $5.19 | $4.99 |
| |
Ending value (after expenses) | $988.70 | $985.20 | $989.40 | $989.80 |
| |
COMPARING YOUR FUND’S EXPENSES WITH THOSE OF OTHER FUNDS (Unaudited)
Using the SEC’s method to compare expenses
The Securities and Exchange Commission (“SEC”) has established guidelines to help investors assess fund expenses. Per these guidelines, the table below shows your fund’s expenses based on a $1,000 investment, assuming a hypothetical 5% annualized return. You can use this information to compare the ongoing expenses (but not transaction expenses or total cost) of investing in the fund with those of other funds. All mutual fund shareholder reports will provide this information to help you make this comparison. Please note that you cannot use this information to estimate your actual ending account balance and expenses paid during the period.
Expenses and Value of a $1,000 Investment |
| |||||
Assuming a hypothetical 5% annualized return for the six months ended November 30, 2022 |
| |||||
|
|
|
|
|
|
|
|
| Class A | Class C | Class I | Class Y |
|
Expenses paid per $1,000† | $6.58 | $10.35 | $5.27 | $5.06 |
| |
Ending value (after expenses) | $1,018.55 | $1,014.79 | $1,019.85 | $1,020.05 |
| |
† | Expenses are equal to the fund’s annualized expense ratio of 1.30% for Class A, 2.05% for Class C, 1.04% for Class I and 1.00% for Class Y, multiplied by the average account value over the period, multiplied by 183/365 (to reflect the one-half year period). | |||||
8
STATEMENT OF INVESTMENTS
November 30, 2022
Description | Shares | Value ($) | |||||
Common Stocks - 96.0% | |||||||
Automobiles & Components - 1.0% | |||||||
Fox Factory Holding Corp. | 4,165 | a | 441,907 | ||||
Harley-Davidson Inc. | 31,880 | 1,502,504 | |||||
LCI Industries | 6,900 | b | 682,134 | ||||
Patrick Industries Inc. | 5,300 | 296,429 | |||||
Visteon Corp. | 5,140 | a | 754,552 | ||||
3,677,526 | |||||||
Banks - 13.1% | |||||||
1st Source Corp. | 12,900 | 736,590 | |||||
Atlantic Union Bankshares Corp. | 24,200 | 863,214 | |||||
BankUnited Inc. | 29,231 | 1,073,362 | |||||
Banner Corp. | 32,813 | 2,317,254 | |||||
Brookline Bancorp Inc. | 53,020 | 753,944 | |||||
Cadence Bank | 77,993 | 2,249,318 | |||||
Columbia Banking System Inc. | 35,340 | 1,203,680 | |||||
Columbia Financial Inc. | 4,900 | a | 108,192 | ||||
ConnectOne Bancorp Inc. | 3,200 | 83,968 | |||||
Eastern Bankshares Inc. | 30,745 | 602,909 | |||||
Federal Agricultural | 3,750 | 471,938 | |||||
First Busey Corp. | 4,600 | 119,922 | |||||
Glacier Bancorp Inc. | 31,640 | 1,831,956 | |||||
Heartland Financial USA Inc. | 26,160 | 1,276,346 | |||||
Hilltop Holdings Inc. | 22,400 | 667,520 | |||||
Hope Bancorp Inc. | 99,800 | 1,359,276 | |||||
Huntington Bancshares Inc. | 70,057 | 1,084,482 | |||||
Independent Bank Corp. | 65,583 | 5,936,573 | |||||
Merchants Bancorp | 20,900 | 534,831 | |||||
NBT Bancorp Inc. | 29,670 | 1,369,567 | |||||
NMI Holdings Inc., Cl. A | 16,890 | a | 363,642 | ||||
OceanFirst Financial Corp. | 37,030 | 865,021 | |||||
Old National Bancorp | 78,286 | 1,496,045 | |||||
Pacific Premier Bancorp Inc. | 63,535 | 2,347,618 | |||||
Park National Corp. | 2,700 | 408,591 | |||||
Pennymac Financial Services Inc. | 12,100 | 721,886 | |||||
Preferred Bank | 2,600 | 196,534 | |||||
Premier Financial Corp. | 5,800 | 169,244 | |||||
Provident Financial Services Inc. | 44,300 | 998,079 | |||||
Republic Bancorp Inc. | 4,200 | 185,094 | |||||
Sandy Spring Bancorp Inc. | 9,700 | 337,754 | |||||
Seacoast Banking Corp. of Florida | 66,651 | 2,291,461 | |||||
SouthState Corp. | 24,364 | 2,140,377 | |||||
9
STATEMENT OF INVESTMENTS (continued)
Description | Shares | Value ($) | |||||
Common Stocks - 96.0% (continued) | |||||||
Banks - 13.1% (continued) | |||||||
Synovus Financial Corp. | 45,915 | 1,934,399 | |||||
Texas Capital Bancshares Inc. | 56,069 | a | 3,363,580 | ||||
The Bank of NT Butterfield & Son Ltd. | 39,900 | 1,388,520 | |||||
Towne Bank | 42,900 | 1,385,670 | |||||
Walker & Dunlop Inc. | 2,750 | 245,603 | |||||
Wintrust Financial Corp. | 8,325 | 761,155 | |||||
46,245,115 | |||||||
Capital Goods - 11.0% | |||||||
AAON Inc. | 4,855 | 384,807 | |||||
AerCap Holdings NV | 21,291 | a | 1,307,267 | ||||
AerSale Corp. | 4,200 | a | 66,570 | ||||
Albany International Corp., Cl. A | 7,290 | 738,987 | |||||
Arcosa Inc. | 1,683 | 102,831 | |||||
Astec Industries Inc. | 39,401 | 1,743,100 | |||||
Babcock & Wilcox Enterprises Inc. | 121,493 | a,b | 554,008 | ||||
Bloom Energy Corp., Cl. A | 24,506 | a | 521,733 | ||||
BlueLinx Holdings Inc. | 19,600 | a | 1,360,240 | ||||
Boise Cascade Co. | 7,600 | 562,704 | |||||
BWX Technologies Inc. | 27,730 | 1,688,480 | |||||
Chart Industries Inc. | 4,080 | a,b | 583,399 | ||||
Comfort Systems USA Inc. | 5,940 | 752,954 | |||||
Douglas Dynamics Inc. | 39,807 | 1,549,288 | |||||
Enerpac Tool Group Corp. | 78,714 | 1,970,999 | |||||
Franklin Electric Co. | 5,225 | 435,243 | |||||
Global Industrial Co. | 9,600 | 236,256 | |||||
Granite Construction Inc. | 50,118 | 1,805,250 | |||||
Griffon Corp. | 12,315 | 434,843 | |||||
H&E Equipment Services Inc. | 11,925 | 500,015 | |||||
Hexcel Corp. | 37,635 | 2,256,218 | |||||
Hillenbrand Inc. | 35,058 | 1,752,900 | |||||
Kratos Defense & Security Solutions Inc. | 38,246 | a | 364,102 | ||||
Markforged Holding Corp. | 52,368 | a | 59,700 | ||||
McGrath RentCorp | 6,115 | 600,004 | |||||
Mercury Systems Inc. | 7,187 | a,b | 365,243 | ||||
Mueller Industries Inc. | 19,400 | 1,334,138 | |||||
NOW Inc. | 36,389 | a | 454,135 | ||||
Park Aerospace Corp. | 130,126 | 1,721,567 | |||||
Powell Industries Inc. | 72,131 | 1,898,488 | |||||
Resideo Technologies Inc. | 69,176 | a | 1,120,651 | ||||
Rush Enterprises Inc., Cl. A | 27,000 | 1,391,310 | |||||
Spirit AeroSystems Holdings Inc., Cl. A | 9,473 | 248,287 | |||||
SPX Technologies Inc. | 36,342 | a | 2,431,280 | ||||
Terex Corp. | 11,000 | 505,010 | |||||
10
Description | Shares | Value ($) | |||||
Common Stocks - 96.0% (continued) | |||||||
Capital Goods - 11.0% (continued) | |||||||
The AZEK Company | 13,380 | a | 258,769 | ||||
Twin Disc Inc. | 10,999 | a | 117,359 | ||||
Valmont Industries Inc. | 2,479 | 839,538 | |||||
WillScot Mobile Mini Holdings Corp. | 20,115 | a | 969,744 | ||||
Zurn Elkay Water Solutions Corp. | 107,886 | 2,611,920 | |||||
38,599,337 | |||||||
Commercial & Professional Services - 4.0% | |||||||
ASGN Inc. | 5,940 | a | 538,164 | ||||
CACI International Inc., Cl. A | 3,455 | a | 1,078,996 | ||||
Clean Harbors Inc. | 6,273 | a | 752,760 | ||||
CoreCivic Inc. | 86,384 | a | 1,147,180 | ||||
Harsco Corp. | 54,047 | a | 404,272 | ||||
Healthcare Services Group Inc. | 60,846 | 848,802 | |||||
Heritage-Crystal Clean Inc. | 5,010 | a | 158,316 | ||||
ICF International Inc. | 5,225 | 566,233 | |||||
KAR Auction Services Inc. | 52,741 | a | 724,661 | ||||
KBR Inc. | 35,974 | 1,858,777 | |||||
MSA Safety Inc. | 18,575 | 2,619,261 | |||||
Stericycle Inc. | 16,991 | a | 885,741 | ||||
The Brink's Company | 36,620 | 2,188,045 | |||||
The GEO Group Inc. | 39,200 | a,b | 463,344 | ||||
14,234,552 | |||||||
Consumer Durables & Apparel - 3.2% | |||||||
Acushnet Holdings Corp. | 28,000 | 1,272,600 | |||||
Beazer Homes USA Inc. | 11,000 | a | 150,150 | ||||
Carter's Inc. | 31,234 | b | 2,281,331 | ||||
Century Communities Inc. | 20,100 | 968,016 | |||||
Crocs Inc. | 3,805 | a | 384,305 | ||||
G-III Apparel Group Ltd. | 23,290 | a | 503,763 | ||||
Helen of Troy Ltd. | 7,265 | a | 715,893 | ||||
M.D.C. Holdings Inc. | 73,528 | b | 2,384,513 | ||||
M/I Homes Inc. | 30,300 | a | 1,368,954 | ||||
Meritage Homes Corp. | 4,500 | a | 388,845 | ||||
Sturm Ruger & Co. | 1,400 | 76,902 | |||||
Tempur Sealy International Inc. | 27,312 | b | 867,702 | ||||
11,362,974 | |||||||
Consumer Services - 3.5% | |||||||
Boyd Gaming Corp. | 35,101 | 2,152,744 | |||||
Graham Holdings Co., Cl. B | 2,100 | 1,351,728 | |||||
Hilton Grand Vacations Inc. | 26,315 | a | 1,158,386 | ||||
International Game Technology PLC | 64,187 | 1,575,149 | |||||
Marriott Vacations Worldwide Corp. | 13,827 | 2,059,946 | |||||
OneSpaWorld Holdings Ltd. | 210,199 | a | 2,095,684 | ||||
11
STATEMENT OF INVESTMENTS (continued)
Description | Shares | Value ($) | |||||
Common Stocks - 96.0% (continued) | |||||||
Consumer Services - 3.5% (continued) | |||||||
Perdoceo Education Corp. | 79,500 | a | 1,140,825 | ||||
SeaWorld Entertainment Inc. | 9,626 | a | 549,260 | ||||
Stride Inc. | 10,190 | a | 360,828 | ||||
12,444,550 | |||||||
Diversified Financials - 3.8% | |||||||
Artisan Partners Asset Management Inc., Cl. A | 77,794 | 2,698,674 | |||||
Atlanticus Holdings Corp. | 2,500 | a | 72,000 | ||||
B. Riley Financial Inc. | 10,046 | 441,220 | |||||
Bread Financial Holdings Inc. | 32,484 | 1,332,819 | |||||
Cohen & Steers Inc. | 10,100 | 669,125 | |||||
Dynex Capital Inc. | 15,300 | c | 200,430 | ||||
Enova International Inc. | 29,100 | a | 1,173,894 | ||||
Evercore Inc., Cl. A | 3,100 | 357,058 | |||||
Focus Financial Partners Inc., Cl. A | 14,700 | a | 560,952 | ||||
KKR Real Estate Finance Trust Inc. | 30,300 | c | 501,465 | ||||
Nelnet Inc., Cl. A | 14,400 | 1,418,976 | |||||
Oppenheimer Holdings Inc. | 4,000 | 166,640 | |||||
Stifel Financial Corp. | 37,693 | 2,421,775 | |||||
StoneX Group Inc. | 13,500 | a | 1,369,845 | ||||
13,384,873 | |||||||
Energy - 6.7% | |||||||
Arch Resources Inc. | 1,400 | b | 216,650 | ||||
Cactus Inc., Cl. A | 59,057 | 3,212,110 | |||||
Callon Petroleum Co. | 40,396 | a,b | 1,693,400 | ||||
ChampionX Corp. | 93,978 | 2,898,282 | |||||
Chord Energy Corp. | 6,295 | 960,176 | |||||
CNX Resources Corp. | 30,349 | a | 527,162 | ||||
Comstock Resources Inc. | 59,401 | 1,090,009 | |||||
CVR Energy Inc. | 8,500 | 313,225 | |||||
Devon Energy Corp. | 23,783 | 1,629,611 | |||||
Dril-Quip Inc. | 75,558 | a | 1,778,635 | ||||
Earthstone Energy Inc., Cl. A | 65,715 | a,b | 1,040,926 | ||||
Green Plains Inc. | 20,285 | a,b | 701,050 | ||||
Helmerich & Payne Inc. | 46,112 | 2,355,401 | |||||
HighPeak Energy Inc. | 5,000 | b | 119,900 | ||||
ION Geophysical Corp. | 12,608 | a,d | 0 | ||||
National Energy Services Reunited Corp. | 49,000 | a | 313,110 | ||||
Oil States International Inc. | 45,932 | a | 310,041 | ||||
Patterson-UTI Energy Inc. | 18,836 | 338,106 | |||||
PDC Energy Inc. | 27,990 | 2,080,217 | |||||
REX American Resources Corp. | 4,000 | a | 118,040 | ||||
Sitio Royalties Corp. | 7,300 | b | 230,242 | ||||
12
Description | Shares | Value ($) | |||||
Common Stocks - 96.0% (continued) | |||||||
Energy - 6.7% (continued) | |||||||
TechnipFMC PLC | 57,038 | a | 707,271 | ||||
TETRA Technologies Inc. | 71,356 | a | 271,866 | ||||
World Fuel Services Corp. | 29,900 | 850,655 | |||||
23,756,085 | |||||||
Food & Staples Retailing - .8% | |||||||
BJ's Wholesale Club Holdings Inc. | 13,205 | a | 993,544 | ||||
Ingles Markets Inc. | 13,700 | 1,385,070 | |||||
Weis Markets Inc. | 6,100 | 531,981 | |||||
2,910,595 | |||||||
Food, Beverage & Tobacco - 2.4% | |||||||
Darling Ingredients Inc. | 36,538 | a | 2,624,525 | ||||
National Beverage Corp. | 16,800 | a | 865,704 | ||||
Seneca Foods Corp., Cl. A | 2,400 | a | 154,272 | ||||
The Hain Celestial Group Inc. | 20,719 | a | 388,274 | ||||
Tootsie Roll Industries Inc. | 21,137 | b | 950,108 | ||||
TreeHouse Foods Inc. | 68,239 | a | 3,373,054 | ||||
8,355,937 | |||||||
Health Care Equipment & Services - 7.7% | |||||||
Acadia Healthcare Co. | 23,704 | a | 2,111,078 | ||||
Accuray Inc. | 109,214 | a | 223,889 | ||||
AngioDynamics Inc. | 94,093 | a | 1,218,504 | ||||
AtriCure Inc. | 9,938 | a | 452,775 | ||||
Avanos Medical Inc. | 82,315 | a | 2,214,273 | ||||
Axonics Inc. | 7,620 | a | 521,818 | ||||
Cardiovascular Systems Inc. | 13,260 | a | 185,773 | ||||
CONMED Corp. | 7,355 | b | 609,362 | ||||
Cytosorbents Corp. | 26,229 | a | 36,721 | ||||
Enovis Corp. | 37,542 | a | 2,032,148 | ||||
Haemonetics Corp. | 47,713 | a | 4,070,396 | ||||
HealthEquity Inc. | 7,170 | a | 455,152 | ||||
HealthStream Inc. | 54,372 | a | 1,381,049 | ||||
Integer Holdings Corp. | 30,740 | a,b | 2,284,597 | ||||
Lantheus Holdings Inc. | 4,345 | a | 269,738 | ||||
Merit Medical Systems Inc. | 28,420 | a | 2,046,240 | ||||
Mesa Laboratories Inc. | 1,240 | b | 209,771 | ||||
Molina Healthcare Inc. | 3,834 | a | 1,291,176 | ||||
National HealthCare Corp. | 11,700 | 721,188 | |||||
NuVasive Inc. | 40,349 | a | 1,567,155 | ||||
Omnicell Inc. | 7,000 | a | 361,270 | ||||
Option Care Health Inc. | 12,580 | a | 378,784 | ||||
OraSure Technologies Inc. | 52,879 | a | 266,510 | ||||
Patterson Companies Inc. | 14,049 | 399,554 | |||||
Select Medical Holdings Corp. | 26,600 | 653,828 | |||||
13
STATEMENT OF INVESTMENTS (continued)
Description | Shares | Value ($) | |||||
Common Stocks - 96.0% (continued) | |||||||
Health Care Equipment & Services - 7.7% (continued) | |||||||
Shockwave Medical Inc. | 2,035 | a | 516,076 | ||||
STAAR Surgical Co. | 2,565 | a | 146,487 | ||||
Varex Imaging Corp. | 18,333 | a | 389,393 | ||||
27,014,705 | |||||||
Household & Personal Products - 1.0% | |||||||
BellRing Brands Inc. | 25,780 | a,b | 642,180 | ||||
Central Garden & Pet Co., Cl. A | 9,300 | a | 363,351 | ||||
Oil-Dri Corp. of America | 33,337 | 1,090,120 | |||||
Spectrum Brands Holdings Inc. | 11,009 | 586,449 | |||||
USANA Health Sciences Inc. | 18,400 | a | 1,012,736 | ||||
3,694,836 | |||||||
Insurance - 3.8% | |||||||
American Equity Investment Life Holding Co. | 28,700 | 1,162,637 | |||||
Employers Holdings Inc. | 3,600 | 167,292 | |||||
Horace Mann Educators Corp. | 51,136 | 1,973,338 | |||||
Kinsale Capital Group Inc. | 3,720 | 1,146,541 | |||||
National Western Life Group Inc. | 900 | 189,720 | |||||
Old Republic International Corp. | 31,478 | 771,211 | |||||
RenaissanceRe Holdings Ltd. | 4,090 | b | 772,642 | ||||
Safety Insurance Group Inc. | 1,700 | 155,958 | |||||
Selective Insurance Group Inc. | 19,138 | 1,839,545 | |||||
Stewart Information Services Corp. | 27,790 | 1,229,985 | |||||
The Hanover Insurance Group Inc. | 26,250 | 3,866,624 | |||||
13,275,493 | |||||||
Materials - 6.8% | |||||||
American Vanguard Corp. | 109,526 | 2,519,098 | |||||
ATI Inc. | 85,647 | a | 2,613,090 | ||||
Avery Dennison Corp. | 8,454 | 1,634,412 | |||||
Avient Corp. | 65,657 | 2,272,389 | |||||
Balchem Corp. | 6,110 | 860,288 | |||||
Cleveland-Cliffs Inc. | 71,710 | a,b | 1,110,071 | ||||
Crown Holdings Inc. | 17,477 | 1,436,784 | |||||
Element Solutions Inc. | 25,960 | 507,778 | |||||
Greif Inc., Cl. A | 19,600 | 1,378,076 | |||||
Koppers Holdings Inc. | 6,800 | 202,572 | |||||
Kronos Worldwide Inc. | 79,600 | 733,116 | |||||
Livent Corp. | 15,500 | a,b | 433,845 | ||||
Materion Corp. | 11,972 | 964,464 | |||||
MP Materials Corp. | 14,510 | a | 482,458 | ||||
O-I Glass Inc. | 35,000 | a | 574,350 | ||||
Orion Engineered Carbons SA | 8,000 | 150,240 | |||||
Royal Gold Inc. | 17,251 | 1,937,805 | |||||
14
Description | Shares | Value ($) | |||||
Common Stocks - 96.0% (continued) | |||||||
Materials - 6.8% (continued) | |||||||
Ryerson Holding Corp. | 26,200 | 772,638 | |||||
Schnitzer Steel Industries Inc., Cl. A | 38,401 | 1,318,306 | |||||
Summit Materials Inc., Cl. A | 21,795 | a | 660,171 | ||||
Sylvamo Corp. | 8,800 | 475,992 | |||||
TriMas Corp. | 12,581 | 344,090 | |||||
Worthington Industries Inc. | 12,500 | 709,250 | |||||
24,091,283 | |||||||
Media & Entertainment - 2.5% | |||||||
AMC Networks Inc., Cl. A | 33,800 | a | 674,648 | ||||
Criteo SA, ADR | 59,415 | a | 1,607,770 | ||||
Gray Television Inc. | 233,081 | 2,727,048 | |||||
Lions Gate Entertainment Corp., Cl. B | 112,680 | a | 802,282 | ||||
Madison Square Garden | 38,140 | a,b | 1,835,297 | ||||
The E.W. Scripps Company, Cl. A | 7,800 | a | 116,844 | ||||
Thryv Holdings Inc. | 48,700 | a | 934,066 | ||||
8,697,955 | |||||||
Pharmaceuticals Biotechnology & Life Sciences - 2.6% | |||||||
Amneal Pharmaceuticals Inc. | 71,983 | a | 184,276 | ||||
Amylyx Pharmaceuticals Inc. | 3,990 | a | 153,096 | ||||
Arrowhead Pharmaceuticals Inc. | 4,160 | a | 133,952 | ||||
Axsome Therapeutics Inc. | 5,150 | a | 372,294 | ||||
Blueprint Medicines Corp. | 1,775 | a | 84,827 | ||||
Charles River Laboratories | 3,712 | a | 848,452 | ||||
CRISPR Therapeutics AG | 2,745 | a | 150,399 | ||||
CryoPort Inc. | 42,539 | a | 840,145 | ||||
Cytokinetics Inc. | 9,130 | a | 388,025 | ||||
Fate Therapeutics Inc. | 7,085 | a | 147,510 | ||||
Innoviva Inc. | 99,000 | a | 1,299,870 | ||||
Intellia Therapeutics Inc. | 1,950 | a | 100,347 | ||||
Karuna Therapeutics Inc. | 1,775 | a | 417,675 | ||||
Maravai LifeSciences Holdings Inc., Cl. A | 7,265 | a | 108,103 | ||||
Medpace Holdings Inc. | 8,358 | a | 1,754,261 | ||||
Phibro Animal Health Corp., Cl. A | 109,794 | 1,351,564 | |||||
Revance Therapeutics Inc. | 12,220 | a | 265,296 | ||||
Standard Biotools Inc. | 97,896 | a,b | 136,075 | ||||
Verona Pharma PLC, ADR | 23,200 | a,b | 299,280 | ||||
Verve Therapeutics Inc. | 3,275 | a | 76,078 | ||||
9,111,525 | |||||||
Real Estate - 3.9% | |||||||
Alexander's Inc. | 1,600 | c | 390,784 | ||||
Chatham Lodging Trust | 19,972 | a,c | 267,026 | ||||
15
STATEMENT OF INVESTMENTS (continued)
Description | Shares | Value ($) | |||||
Common Stocks - 96.0% (continued) | |||||||
Real Estate - 3.9% (continued) | |||||||
Corporate Office Properties Trust | 94,253 | c | 2,617,406 | ||||
Farmland Partners Inc. | 72,406 | c | 961,552 | ||||
Forestar Group Inc. | 22,000 | a | 326,260 | ||||
Kennedy-Wilson Holdings Inc. | 40,700 | 692,714 | |||||
Lamar Advertising Co., Cl. A | 11,703 | c | 1,171,938 | ||||
Marcus & Millichap Inc. | 14,100 | 525,084 | |||||
Newmark Group Inc., Cl. A | 107,300 | 909,904 | |||||
Physicians Realty Trust | 130,376 | c | 1,946,514 | ||||
Potlatchdeltic Corp. | 35,837 | b,c | 1,712,650 | ||||
RLJ Lodging Trust | 19,799 | c | 239,964 | ||||
Sunstone Hotel Investors Inc. | 69,850 | c | 767,652 | ||||
Terreno Realty Corp. | 16,475 | c | 966,094 | ||||
The Howard Hughes Corp. | 3,720 | a | 277,289 | ||||
13,772,831 | |||||||
Retailing - 1.7% | |||||||
Asbury Automotive Group Inc. | 15,114 | a | 2,835,689 | ||||
Caleres Inc. | 15,429 | 372,765 | |||||
Chico's FAS Inc. | 47,311 | a | 277,716 | ||||
Dillard's Inc., Cl. A | 500 | b | 179,850 | ||||
Foot Locker Inc. | 3,900 | 155,220 | |||||
Haverty Furniture Cos. | 2,300 | 72,519 | |||||
Leslie's Inc. | 22,230 | a,b | 324,558 | ||||
The Buckle Inc. | 17,900 | 786,705 | |||||
The Children's Place Inc. | 7,207 | a | 255,849 | ||||
The ODP Corp. | 11,569 | a | 556,816 | ||||
5,817,687 | |||||||
Semiconductors & Semiconductor Equipment - 4.0% | |||||||
Ambarella Inc. | 2,750 | a | 204,050 | ||||
Amkor Technology Inc. | 49,600 | 1,389,792 | |||||
CEVA Inc. | 10,161 | a | 276,074 | ||||
Diodes Inc. | 24,164 | a | 2,228,646 | ||||
MACOM Technology Solutions | 28,799 | a | 1,978,203 | ||||
MaxLinear Inc. | 50,551 | a | 1,850,167 | ||||
MKS Instruments Inc. | 19,521 | 1,637,031 | |||||
Power Integrations Inc. | 3,185 | 256,329 | |||||
Rambus Inc. | 55,546 | a | 2,131,855 | ||||
Silicon Laboratories Inc. | 3,985 | a | 579,578 | ||||
SiTime Corp. | 1,590 | a,b | 167,681 | ||||
Synaptics Inc. | 1,945 | a | 206,112 | ||||
Veeco Instruments Inc. | 57,632 | a | 1,145,724 | ||||
14,051,242 | |||||||
16
Description | Shares | Value ($) | |||||
Common Stocks - 96.0% (continued) | |||||||
Software & Services - 2.6% | |||||||
Adeia Inc. | 55,160 | 609,518 | |||||
Asana Inc., Cl. A | 5,940 | a,b | 107,870 | ||||
BlackLine Inc. | 3,895 | a | 263,653 | ||||
Box Inc., Cl. A | 24,340 | a | 668,133 | ||||
Cerence Inc. | 10,677 | a | 218,985 | ||||
Cognyte Software Ltd. | 76,118 | a | 224,548 | ||||
Conduent Inc. | 227,797 | a | 920,300 | ||||
Consensus Cloud Solutions Inc. | 6,300 | a | 357,777 | ||||
Ebix Inc. | 10,200 | 193,698 | |||||
Kyndryl Holdings Inc. | 58,081 | a | 680,129 | ||||
New Relic Inc. | 9,824 | a | 552,796 | ||||
OneSpan Inc. | 28,092 | a | 353,116 | ||||
Qualys Inc. | 1,775 | a | 218,893 | ||||
TTEC Holdings Inc. | 10,600 | 508,270 | |||||
Unisys Corp. | 91,896 | a | 395,153 | ||||
Varonis Systems Inc. | 28,299 | a | 601,070 | ||||
Verint Systems Inc. | 22,949 | a | 902,584 | ||||
Wix.com Ltd. | 5,039 | a | 455,979 | ||||
Workiva Inc. | 4,425 | a | 356,478 | ||||
Xperi Inc. | 44,415 | a | 475,685 | ||||
9,064,635 | |||||||
Technology Hardware & Equipment - 5.0% | |||||||
Belden Inc. | 31,498 | 2,533,699 | |||||
Calix Inc. | 3,190 | a | 227,447 | ||||
Ciena Corp. | 31,067 | a | 1,396,772 | ||||
Coherent Corp. | 45,331 | a,b | 1,662,288 | ||||
Diebold Nixdorf Inc. | 48,230 | a | 103,695 | ||||
EMCORE Corp. | 41,209 | a | 58,517 | ||||
Infinera Corp. | 47,525 | a,b | 320,794 | ||||
Innoviz Technologies Ltd. | 50,337 | a | 270,310 | ||||
Itron Inc. | 14,055 | a | 747,445 | ||||
Knowles Corp. | 70,613 | a,b | 1,101,563 | ||||
Methode Electronics Inc. | 44,275 | 2,022,482 | |||||
nLight Inc. | 15,018 | a | 163,095 | ||||
Novanta Inc. | 4,785 | a | 754,834 | ||||
OSI Systems Inc. | 6,287 | a | 556,274 | ||||
PC Connection Inc. | 13,600 | a | 755,480 | ||||
Quantum Corp. | 473,869 | a | 601,814 | ||||
Radware Ltd. | 18,444 | a | 380,500 | ||||
Ribbon Communications Inc. | 297,865 | a | 753,598 | ||||
Stratasys Ltd. | 49,143 | a | 689,476 | ||||
Teledyne Technologies Inc. | 1,383 | a | 580,998 | ||||
Viasat Inc. | 29,832 | a,b | 1,016,973 | ||||
17
STATEMENT OF INVESTMENTS (continued)
Description | Shares | Value ($) | |||||
Common Stocks - 96.0% (continued) | |||||||
Technology Hardware & Equipment - 5.0% (continued) | |||||||
Viavi Solutions Inc. | 54,199 | a | 614,075 | ||||
Vishay Intertechnology Inc. | 5,300 | 122,112 | |||||
17,434,241 | |||||||
Telecommunication Services - .7% | |||||||
ATN International Inc. | 36,609 | 1,772,242 | |||||
U.S. Cellular Corp. | 31,000 | a,b | 659,060 | ||||
2,431,302 | |||||||
Transportation - 1.7% | |||||||
Costamare Inc. | 121,500 | 1,171,260 | |||||
Covenant Logistics Group Inc. | 5,100 | 195,789 | |||||
Heartland Express Inc. | 90,474 | b | 1,514,535 | ||||
Matson Inc. | 4,700 | 299,672 | |||||
Universal Logistics Holdings Inc. | 9,300 | 353,121 | |||||
Werner Enterprises Inc. | 11,430 | 502,691 | |||||
XPO Logistics Inc. | 54,470 | a,b | 2,103,631 | ||||
6,140,699 | |||||||
Utilities - 2.5% | |||||||
American States Water Co. | 3,725 | b | 365,013 | ||||
Chesapeake Utilities Corp. | 6,380 | 763,877 | |||||
New Jersey Resources Corp. | 16,125 | b | 802,219 | ||||
Ormat Technologies Inc. | 18,778 | 1,698,095 | |||||
Otter Tail Corp. | 10,200 | 608,226 | |||||
Portland General Electric Co. | 60,406 | b | 2,973,787 | ||||
Southwest Gas Holdings Inc. | 6,105 | 417,948 | |||||
Vistra Energy Corp. | 42,005 | 1,021,982 | |||||
8,651,147 | |||||||
Total Common Stocks (cost $287,134,457) | 338,221,125 | ||||||
Exchange-Traded Funds - 1.1% | |||||||
Registered Investment Companies - 1.1% | |||||||
iShares Russell 2000 ETF | 20,500 | b | 3,841,085 | ||||
Coupon | Maturity | Principal Amount ($) | |||||
Escrow Bonds - .0% | |||||||
Energy - .0% | |||||||
Ion Geophysical Escrow Bond | 8.00 | 12/15/2025 | 48,000 | d | 0 | ||
18
Description | 1-Day | Shares | Value ($) | ||||
Investment Companies - 2.6% | |||||||
Registered Investment Companies - 2.6% | |||||||
Dreyfus Institutional Preferred Government Plus Money Market Fund, Institutional Shares | 3.94 | 8,925,142 | e | 8,925,142 | |||
Investment of Cash Collateral for Securities Loaned - 1.7% | |||||||
Registered Investment Companies - 1.7% | |||||||
Dreyfus Institutional Preferred Government Plus Money Market Fund, SL Shares | 3.94 | 6,056,465 | e | 6,056,465 | |||
Total Investments (cost $305,798,750) | 101.4% | 357,043,817 | |||||
Liabilities, Less Cash and Receivables | (1.4%) | (4,850,845) | |||||
Net Assets | 100.0% | 352,192,972 | |||||
ADR—American Depository Receipt
ETF—Exchange-Traded Fund
a Non-income producing security.
b Security, or portion thereof, on loan. At November 30, 2022, the value of the fund’s securities on loan was $28,936,183 and the value of the collateral was $28,864,285, consisting of cash collateral of $6,056,465 and U.S. Government & Agency securities valued at $22,807,820. In addition, the value of collateral may include pending sales that are also on loan.
c Investment in real estate investment trust within the United States.
d The fund held Level 3 securities at November 30, 2022. These securities were valued at $0 or .0% of net assets.
e Investment in affiliated issuer. The investment objective of this investment company is publicly available and can be found within the investment company’s prospectus.
Portfolio Summary (Unaudited) † | Value (%) |
Financials | 20.6 |
Industrials | 16.7 |
Information Technology | 11.5 |
Health Care | 10.3 |
Consumer Discretionary | 9.5 |
Materials | 6.8 |
Energy | 6.7 |
Investment Companies | 5.4 |
Consumer Staples | 4.3 |
Real Estate | 3.9 |
Communication Services | 3.2 |
Utilities | 2.5 |
101.4 |
† Based on net assets.
See notes to financial statements.
19
STATEMENT OF INVESTMENTS (continued)
Affiliated Issuers | ||||||
Description | Value ($) 11/30/2021 | Purchases ($)† | Sales ($) | Value ($) 11/30/2022 | Dividends/ | |
Registered Investment Companies - 2.6% | ||||||
Dreyfus Institutional Preferred Government Plus Money Market Fund, Institutional Shares - 2.6% | 10,825,043 | 385,175,968 | (387,075,869) | 8,925,142 | 148,525 | |
Investment of Cash Collateral for Securities Loaned - 1.7% | ||||||
Dreyfus Institutional Preferred Government Plus Money Market Fund, SL Shares - 1.7% | 7,971,454 | 125,381,790 | (127,296,779) | 6,056,465 | 85,474 | †† |
Total - 4.3% | 18,796,497 | 510,557,758 | (514,372,648) | 14,981,607 | 233,999 | |
† Includes reinvested dividends/distributions.
†† Represents securities lending income earned from the reinvestment of cash collateral from loaned securities, net of fees and collateral investment expenses, and other payments to and from borrowers of securities.
See notes to financial statements.
20
STATEMENT OF ASSETS AND LIABILITIES
November 30, 2022
|
|
|
|
|
|
|
|
|
| Cost |
| Value |
|
Assets ($): |
|
|
|
| ||
Investments in securities—See Statement of Investments |
|
|
| |||
Unaffiliated issuers | 290,817,143 |
| 342,062,210 |
| ||
Affiliated issuers |
| 14,981,607 |
| 14,981,607 |
| |
Cash |
|
|
|
| 1,611,497 |
|
Receivable for investment securities sold |
| 1,163,338 |
| |||
Dividends, interest and securities lending income receivable |
| 395,996 |
| |||
Receivable for shares of Common Stock subscribed |
| 51,205 |
| |||
Prepaid expenses |
|
|
|
| 54,916 |
|
|
|
|
|
| 360,320,769 |
|
Liabilities ($): |
|
|
|
| ||
Due to BNY Mellon Investment Adviser, Inc. and affiliates—Note 3(c) |
| 287,269 |
| |||
Liability for securities on loan—Note 1(c) |
| 6,056,465 |
| |||
Payable for investment securities purchased |
| 854,490 |
| |||
Payable for shares of Common Stock redeemed |
| 840,699 |
| |||
Directors’ fees and expenses payable |
| 6,602 |
| |||
Interest payable—Note 2 |
| 892 |
| |||
Other accrued expenses |
|
|
|
| 81,380 |
|
|
|
|
|
| 8,127,797 |
|
Net Assets ($) |
|
| 352,192,972 |
| ||
Composition of Net Assets ($): |
|
|
|
| ||
Paid-in capital |
|
|
|
| 270,583,307 |
|
Total distributable earnings (loss) |
|
|
|
| 81,609,665 |
|
Net Assets ($) |
|
| 352,192,972 |
| ||
Net Asset Value Per Share | Class A | Class C | Class I | Class Y |
|
Net Assets ($) | 1,234,172 | 94,918 | 16,831,988 | 334,031,894 |
|
Shares Outstanding | 54,399 | 4,929 | 722,593 | 14,372,421 |
|
Net Asset Value Per Share ($) | 22.69 | 19.26 | 23.29 | 23.24 |
|
|
|
|
|
|
|
See notes to financial statements. |
|
|
|
|
|
21
STATEMENT OF OPERATIONS
Year Ended November 30, 2022
|
|
|
|
|
|
|
|
|
|
|
|
|
|
Investment Income ($): |
|
|
|
| ||
Income: |
|
|
|
| ||
Cash dividends (net of $1,864 foreign taxes withheld at source): |
| |||||
Unaffiliated issuers |
|
| 6,296,431 |
| ||
Affiliated issuers |
|
| 148,525 |
| ||
Income from securities lending—Note 1(c) |
|
| 85,474 |
| ||
Interest |
|
| 2,367 |
| ||
Total Income |
|
| 6,532,797 |
| ||
Expenses: |
|
|
|
| ||
Management fee—Note 3(a) |
|
| 4,203,931 |
| ||
Professional fees |
|
| 125,111 |
| ||
Registration fees |
|
| 67,033 |
| ||
Custodian fees—Note 3(c) |
|
| 46,205 |
| ||
Directors’ fees and expenses—Note 3(d) |
|
| 42,907 |
| ||
Chief Compliance Officer fees—Note 3(c) |
|
| 34,054 |
| ||
Shareholder servicing costs—Note 3(c) |
|
| 18,022 |
| ||
Prospectus and shareholders’ reports |
|
| 14,902 |
| ||
Loan commitment fees—Note 2 |
|
| 8,136 |
| ||
Interest expense—Note 2 |
|
| 892 |
| ||
Distribution fees—Note 3(b) |
|
| 787 |
| ||
Miscellaneous |
|
| 46,407 |
| ||
Total Expenses |
|
| 4,608,387 |
| ||
Less—reduction in expenses due to undertaking—Note 3(a) |
|
| (1,753) |
| ||
Less—reduction in fees due to earnings credits—Note 3(c) |
|
| (119) |
| ||
Net Expenses |
|
| 4,606,515 |
| ||
Net Investment Income |
|
| 1,926,282 |
| ||
Realized and Unrealized Gain (Loss) on Investments—Note 4 ($): |
|
| ||||
Net realized gain (loss) on investments | 36,801,877 |
| ||||
Net change in unrealized appreciation (depreciation) on investments | (83,493,340) |
| ||||
Net Realized and Unrealized Gain (Loss) on Investments |
|
| (46,691,463) |
| ||
Net (Decrease) in Net Assets Resulting from Operations |
| (44,765,181) |
| |||
|
|
|
|
|
|
|
See notes to financial statements. | ||||||
22
STATEMENT OF CHANGES IN NET ASSETS
|
|
|
| Year Ended November 30, | |||||
|
|
|
| 2022 |
| 2021 |
| ||
Operations ($): |
|
|
|
|
|
|
|
| |
Net investment income |
|
| 1,926,282 |
|
|
| 819,773 |
| |
Net realized gain (loss) on investments |
| 36,801,877 |
|
|
| 103,670,400 |
| ||
Net change in unrealized appreciation |
| (83,493,340) |
|
|
| 24,184,807 |
| ||
Net Increase (Decrease) in Net Assets | (44,765,181) |
|
|
| 128,674,980 |
| |||
Distributions ($): |
| ||||||||
Distributions to shareholders: |
|
|
|
|
|
|
|
| |
Class A |
|
| (272,534) |
|
|
| (62,778) |
| |
Class C |
|
| (23,235) |
|
|
| (7,152) |
| |
Class I |
|
| (3,636,404) |
|
|
| (788,385) |
| |
Class Y |
|
| (92,159,940) |
|
|
| (27,376,311) |
| |
Total Distributions |
|
| (96,092,113) |
|
|
| (28,234,626) |
| |
Capital Stock Transactions ($): |
| ||||||||
Net proceeds from shares sold: |
|
|
|
|
|
|
|
| |
Class A |
|
| 112,352 |
|
|
| 730,978 |
| |
Class C |
|
| 2,994 |
|
|
| 104,994 |
| |
Class I |
|
| 14,093,526 |
|
|
| 15,957,249 |
| |
Class Y |
|
| 47,378,147 |
|
|
| 93,421,278 |
| |
Distributions reinvested: |
|
|
|
|
|
|
|
| |
Class A |
|
| 270,878 |
|
|
| 62,687 |
| |
Class C |
|
| 21,390 |
|
|
| 6,605 |
| |
Class I |
|
| 2,956,040 |
|
|
| 608,542 |
| |
Class Y |
|
| 45,640,636 |
|
|
| 12,863,987 |
| |
Cost of shares redeemed: |
|
|
|
|
|
|
|
| |
Class A |
|
| (518,349) |
|
|
| (266,381) |
| |
Class C |
|
| (27,851) |
|
|
| (120,675) |
| |
Class I |
|
| (17,525,858) |
|
|
| (10,091,327) |
| |
Class Y |
|
| (221,930,787) |
|
|
| (73,933,219) |
| |
Increase (Decrease) in Net Assets | (129,526,882) |
|
|
| 39,344,718 |
| |||
Total Increase (Decrease) in Net Assets | (270,384,176) |
|
|
| 139,785,072 |
| |||
Net Assets ($): |
| ||||||||
Beginning of Period |
|
| 622,577,148 |
|
|
| 482,792,076 |
| |
End of Period |
|
| 352,192,972 |
|
|
| 622,577,148 |
| |
23
STATEMENT OF CHANGES IN NET ASSETS (continued)
|
|
|
| Year Ended November 30, | |||||
|
|
|
| 2022 |
| 2021 |
| ||
Capital Share Transactions (Shares): |
| ||||||||
Class Aa,b |
|
|
|
|
|
|
|
| |
Shares sold |
|
| 4,968 |
|
|
| 25,427 |
| |
Shares issued for distributions reinvested |
|
| 10,540 |
|
|
| 2,448 |
| |
Shares redeemed |
|
| (22,016) |
|
|
| (9,458) |
| |
Net Increase (Decrease) in Shares Outstanding | (6,508) |
|
|
| 18,417 |
| |||
Class Ca |
|
|
|
|
|
|
|
| |
Shares sold |
|
| 142 |
|
|
| 4,009 |
| |
Shares issued for distributions reinvested |
|
| 971 |
|
|
| 293 |
| |
Shares redeemed |
|
| (1,334) |
|
|
| (4,625) |
| |
Net Increase (Decrease) in Shares Outstanding | (221) |
|
|
| (323) |
| |||
Class Ib |
|
|
|
|
|
|
|
| |
Shares sold |
|
| 582,730 |
|
|
| 537,477 |
| |
Shares issued for distributions reinvested |
|
| 112,390 |
|
|
| 23,392 |
| |
Shares redeemed |
|
| (750,473) |
|
|
| (345,897) |
| |
Net Increase (Decrease) in Shares Outstanding | (55,353) |
|
|
| 214,972 |
| |||
Class Yb |
|
|
|
|
|
|
|
| |
Shares sold |
|
| 1,831,114 |
|
|
| 3,230,714 |
| |
Shares issued for distributions reinvested |
|
| 1,738,870 |
|
|
| 495,982 |
| |
Shares redeemed |
|
| (9,434,825) |
|
|
| (2,536,103) |
| |
Net Increase (Decrease) in Shares Outstanding | (5,864,841) |
|
|
| 1,190,593 |
| |||
|
|
|
|
|
|
|
|
|
|
a | During the period ended November 30, 2021, 3,811 Class C shares representing $100,000 were automatically converted to 3,357 Class A shares. | ||||||||
b | During the period ended November 30, 2022, 481,494 Class Y shares representing $11,733,984 were exchanged for 480,331 Class I shares and 837 Class Y shares representing $22,518 were exchanged for 855 Class A shares. During the period ended November 30, 2021, 447,362 Class Y shares representing $13,260,930 were exchanged for 446,442 Class I shares. | ||||||||
See notes to financial statements. | |||||||||
24
FINANCIAL HIGHLIGHTS
The following tables describe the performance for each share class for the fiscal periods indicated. All information (except portfolio turnover rate) reflects financial results for a single fund share. Net asset value total return is calculated assuming an initial investment made at the net asset value at the beginning of the period, reinvestment of all dividends and distributions at net asset value during the period, and redemption at net asset value on the last day of the period. Net asset value total return includes adjustments in accordance with accounting principles generally accepted in the United States of America and as such, the net asset value for financial reporting purposes and the returns based upon those net asset values may differ from the net asset value and returns for shareholder transactions. These figures have been derived from the fund’s financial statements.
Year Ended November 30, | ||||||
Class A Shares | 2022 | 2021 | 2020 | 2019 | 2018 | |
Per Share Data ($): | ||||||
Net asset value, beginning of period | 28.97 | 24.13 | 22.15 | 23.94 | 26.44 | |
Investment Operations: | ||||||
Net investment income (loss)a | .02 | (.07) | .03 | .02 | (.01) | |
Net realized and unrealized | (1.81) | 6.28 | 2.39 | .86 | (.98) | |
Total from Investment Operations | (1.79) | 6.21 | 2.42 | .88 | (.99) | |
Distributions: | ||||||
Dividends from net investment income | - | (.04) | (.01) | - | - | |
Dividends from net realized | (4.49) | (1.33) | (.43) | (2.67) | (1.51) | |
Total Distributions | (4.49) | (1.37) | (.44) | (2.67) | (1.51) | |
Net asset value, end of period | 22.69 | 28.97 | 24.13 | 22.15 | 23.94 | |
Total Return (%)b | (7.76) | 26.55 | 11.21 | 6.07 | (3.93) | |
Ratios/Supplemental Data (%): | ||||||
Ratio of total expenses | 1.38 | 1.33 | 1.44 | 1.38 | 1.35 | |
Ratio of net expenses | 1.30 | 1.30 | 1.30 | 1.30 | 1.30 | |
Ratio of net investment income (loss) | .09 | (.23) | .14 | .12 | (.05) | |
Portfolio Turnover Rate | 70.59 | 70.67 | 86.50 | 57.74 | 58.85 | |
Net Assets, end of period ($ x 1,000) | 1,234 | 1,765 | 1,025 | 1,125 | 1,048 | |
a Based on average shares outstanding.
b Exclusive of sales charge.
See notes to financial statements.
25
FINANCIAL HIGHLIGHTS (continued)
Year Ended November 30, | ||||||
Class C Shares | 2022 | 2021 | 2020 | 2019 | 2018 | |
Per Share Data ($): | ||||||
Net asset value, beginning of period | 25.41 | 21.44 | 19.86 | 21.92 | 24.51 | |
Investment Operations: | ||||||
Net investment (loss)a | (.13) | (.24) | (.10) | (.12) | (.19) | |
Net realized and unrealized | (1.53) | 5.54 | 2.11 | .73 | (.89) | |
Total from Investment Operations | (1.66) | 5.30 | 2.01 | .61 | (1.08) | |
Distributions: | ||||||
Dividends from net realized | (4.49) | (1.33) | (.43) | (2.67) | (1.51) | |
Net asset value, end of period | 19.26 | 25.41 | 21.44 | 19.86 | 21.92 | |
Total Return (%)b | (8.44) | 25.58 | 10.42 | 5.28 | (4.65) | |
Ratios/Supplemental Data (%): | ||||||
Ratio of total expenses | 2.62 | 2.43 | 2.39 | 2.12 | 2.15 | |
Ratio of net expenses | 2.05 | 2.05 | 2.05 | 2.05 | 2.05 | |
Ratio of net investment (loss) | (.66) | (.95) | (.55) | (.61) | (.82) | |
Portfolio Turnover Rate | 70.59 | 70.67 | 86.50 | 57.74 | 58.85 | |
Net Assets, end of period ($ x 1,000) | 95 | 131 | 117 | 430 | 553 | |
a Based on average shares outstanding.
b Exclusive of sales charge.
See notes to financial statements.
26
Year Ended November 30, | ||||||
Class I Shares | 2022 | 2021 | 2020 | 2019 | 2018 | |
Per Share Data ($): | ||||||
Net asset value, beginning of period | 29.59 | 24.60 | 22.61 | 24.41 | 26.90 | |
Investment Operations: | ||||||
Net investment incomea | .09 | .03 | .08 | .10 | .07 | |
Net realized and unrealized | (1.87) | 6.39 | 2.44 | .86 | (1.00) | |
Total from Investment Operations | (1.78) | 6.42 | 2.52 | .96 | (.93) | |
Distributions: | ||||||
Dividends from | (.03) | (.10) | (.10) | (.09) | (.05) | |
Dividends from net realized | (4.49) | (1.33) | (.43) | (2.67) | (1.51) | |
Total Distributions | (4.52) | (1.43) | (.53) | (2.76) | (1.56) | |
Net asset value, end of period | 23.29 | 29.59 | 24.60 | 22.61 | 24.41 | |
Total Return (%) | (7.55) | 26.95 | 11.53 | 6.40 | (3.63) | |
Ratios/Supplemental Data (%): | ||||||
Ratio of total expenses | 1.03 | 1.00 | 1.03 | .99 | .97 | |
Ratio of net expenses | 1.03 | 1.00 | 1.03 | .99 | .97 | |
Ratio of net investment income | .37 | .09 | .41 | .45 | .27 | |
Portfolio Turnover Rate | 70.59 | 70.67 | 86.50 | 57.74 | 58.85 | |
Net Assets, end of period ($ x 1,000) | 16,832 | 23,019 | 13,851 | 15,955 | 24,890 | |
a Based on average shares outstanding.
See notes to financial statements.
27
FINANCIAL HIGHLIGHTS (continued)
Year Ended November 30, | ||||||
Class Y Shares | 2022 | 2021 | 2020 | 2019 | 2018 | |
Per Share Data ($): | ||||||
Net asset value, beginning of period | 29.53 | 24.56 | 22.59 | 24.40 | 26.88 | |
Investment Operations: | ||||||
Net Investment incomea | .10 | .04 | .10 | .10 | .08 | |
Net realized and unrealized | (1.86) | 6.37 | 2.42 | .86 | (.99) | |
Total from Investment Operations | (1.76) | 6.41 | 2.52 | .96 | (.91) | |
Distributions: | ||||||
Dividends | (.04) | (.11) | (.12) | (.10) | (.06) | |
Dividends from net realized | (4.49) | (1.33) | (.43) | (2.67) | (1.51) | |
Total Distributions | (4.53) | (1.44) | (.55) | (2.77) | (1.57) | |
Net asset value, end of period | 23.24 | 29.53 | 24.56 | 22.59 | 24.40 | |
Total Return (%) | (7.48) | 26.97 | 11.58 | 6.41 | (3.56) | |
Ratios/Supplemental Data (%): | ||||||
Ratio of total expenses | .98 | .96 | .98 | .95 | .94 | |
Ratio of net expenses | .98 | .96 | .98 | .95 | .94 | |
Ratio of net investment income | .42 | .14 | .46 | .48 | .31 | |
Portfolio Turnover Rate | 70.59 | 70.67 | 86.50 | 57.74 | 58.85 | |
Net Assets, end of period ($ x 1,000) | 334,032 | 597,663 | 467,798 | 578,267 | 777,237 | |
a Based on average shares outstanding.
See notes to financial statements.
28
NOTES TO FINANCIAL STATEMENTS
NOTE 1—Significant Accounting Policies:
BNY Mellon Select Managers Small Cap Value Fund (the “fund”) is a separate diversified series of BNY Mellon Strategic Funds, Inc. (the “Company”), which is registered under the Investment Company Act of 1940, as amended (the “Act”), as an open-end management investment company and operates as a series company currently offering six series, including the fund. The fund’s investment objective is to seek capital appreciation. BNY Mellon Investment Adviser, Inc. (the “Adviser”), a wholly-owned subsidiary of The Bank of New York Mellon Corporation (“BNY Mellon”), serves as the fund’s investment adviser and the fund’s portfolio allocation manager. Denali Advisors, LLC (“Denali”), Neuberger Berman Investment Advisers LLC (“Neuberger Berman”), Channing Capital Management, LLC (“Channing”), Eastern Shore Capital Management (“Eastern Shore”) and Heartland Advisors, Inc. (“Heartland”), serve as the fund’s sub-advisers (collectively, the “Sub-Advisers”), each managing an allocated portion of the fund’s portfolio.
Effective July 31, 2022, Rice Hall James & Associates, LLC (“RHJ”) is no longer a sub-adviser of the fund. Prior to July 31, 2022, the portion of the fund’s assets allocated to RHJ was allocated to certain of the fund’s five other sub-advisers.
Effective November 15, 2022 (the “Effective Date”), the fund’s sub-investment advisory agreement with Walthausen & Co., LLC (“Walthausen”) was terminated. Additionally, as of the Effective Date, a new sub-investment advisory agreement between Denali and the Adviser, on behalf of the fund, became operational. The portion of the fund’s assets previously allocated to Walthausen were re-allocated primarily to Denali.
BNY Mellon Securities Corporation (the “Distributor”), a wholly-owned subsidiary of the Adviser, is the distributor of the fund’s shares. The fund is authorized to issue 500 million shares of $.001 par value Common Stock. The fund currently has authorized four classes of shares: Class A (100 million shares authorized), Class C (100 million shares authorized), Class I (100 million shares authorized) and Class Y (200 million shares authorized). Class A and Class C shares are sold primarily to retail investors through financial intermediaries and bear Distribution and/or Shareholder Services Plan fees. Class A shares generally are subject to a sales charge imposed at the time of purchase. Class A shares bought without an initial sales charge as part of an investment of $1 million or more may be charged a contingent deferred sales charge (“CDSC”) of
29
NOTES TO FINANCIAL STATEMENTS (continued)
1.00% if redeemed within one year. Class C shares are subject to a CDSC imposed on Class C shares redeemed within one year of purchase. Class C shares automatically convert to Class A shares eight years after the date of purchase, without the imposition of a sales charge. Class I shares are sold primarily to bank trust departments and other financial service providers (including BNY Mellon and its affiliates), acting on behalf of customers having a qualified trust or an investment account or relationship at such institution, and bear no Distribution or Shareholder Services Plan fees. Class Y shares are sold at net asset value per share generally to institutional investors, and bear no Distribution or Shareholder Services Plan fees. Class I and Class Y shares are offered without a front-end sales charge or CDSC. Other differences between the classes include the services offered to and the expenses borne by each class, the allocation of certain transfer agency costs, and certain voting rights. Income, expenses (other than expenses attributable to a specific class), and realized and unrealized gains or losses on investments are allocated to each class of shares based on its relative net assets.
As of November 30, 2022, MBC Investments Corporation, an indirect subsidiary of BNY Mellon, held 411 Class C shares of the fund.
The Company accounts separately for the assets, liabilities and operations of each series. Expenses directly attributable to each series are charged to that series’ operations; expenses which are applicable to all series are allocated among them on a pro rata basis.
The Financial Accounting Standards Board (“FASB”) Accounting Standards Codification (“ASC”) is the exclusive reference of authoritative U.S. generally accepted accounting principles (“GAAP”) recognized by the FASB to be applied by nongovernmental entities. Rules and interpretive releases of the SEC under authority of federal laws are also sources of authoritative GAAP for SEC registrants. The fund is an investment company and applies the accounting and reporting guidance of the FASB ASC Topic 946 Financial Services-Investment Companies. The fund’s financial statements are prepared in accordance with GAAP, which may require the use of management estimates and assumptions. Actual results could differ from those estimates.
The Company enters into contracts that contain a variety of indemnifications. The fund’s maximum exposure under these arrangements is unknown. The fund does not anticipate recognizing any loss related to these arrangements.
(a) Portfolio valuation: The fair value of a financial instrument is the amount that would be received to sell an asset or paid to transfer a liability
30
in an orderly transaction between market participants at the measurement date (i.e., the exit price). GAAP establishes a fair value hierarchy that prioritizes the inputs of valuation techniques used to measure fair value. This hierarchy gives the highest priority to unadjusted quoted prices in active markets for identical assets or liabilities (Level 1 measurements) and the lowest priority to unobservable inputs (Level 3 measurements).
Additionally, GAAP provides guidance on determining whether the volume and activity in a market has decreased significantly and whether such a decrease in activity results in transactions that are not orderly. GAAP requires enhanced disclosures around valuation inputs and techniques used during annual and interim periods.
Various inputs are used in determining the value of the fund’s investments relating to fair value measurements. These inputs are summarized in the three broad levels listed below:
Level 1—unadjusted quoted prices in active markets for identical investments.
Level 2—other significant observable inputs (including quoted prices for similar investments, interest rates, prepayment speeds, credit risk, etc.).
Level 3—significant unobservable inputs (including the fund’s own assumptions in determining the fair value of investments).
The inputs or methodology used for valuing securities are not necessarily an indication of the risk associated with investing in those securities.
Changes in valuation techniques may result in transfers in or out of an assigned level within the disclosure hierarchy. Valuation techniques used to value the fund’s investments are as follows:
The Company’s Board of Directors (the “Board”) has designated the Adviser as the fund’s valuation designee, effective September 8, 2022, to make all fair value determinations with respect to the fund’s portfolio investments, subject to the Board’s oversight and pursuant to Rule 2a-5 under the Act.
Investments in debt securities excluding short-term investments (other than U.S. Treasury Bills), are valued each business day by one or more independent pricing services (each, a “Service”) approved by the Board. Investments for which quoted bid prices are readily available and are representative of the bid side of the market in the judgment of a Service are valued at the mean between the quoted bid prices (as obtained by a Service from dealers in such securities) and asked prices (as calculated by a
31
NOTES TO FINANCIAL STATEMENTS (continued)
Service based upon its evaluation of the market for such securities). Securities are valued as determined by a Service, based on methods which include consideration of the following: yields or prices of securities of comparable quality, coupon, maturity and type; indications as to values from dealers; and general market conditions. The Services are engaged under the general supervision of the Board. These securities are generally categorized within Level 2 of the fair value hierarchy.
Investments in equity securities are valued at the last sales price on the securities exchange or national securities market on which such securities are primarily traded. Securities listed on the National Market System for which market quotations are available are valued at the official closing price or, if there is no official closing price that day, at the last sales price. For open short positions, asked prices are used for valuation purposes. Bid price is used when no asked price is available. Registered investment companies that are not traded on an exchange are valued at their net asset value. All of the preceding securities are generally categorized within Level 1 of the fair value hierarchy.
Securities not listed on an exchange or the national securities market, or securities for which there were no transactions, are valued at the average of the most recent bid and asked prices. These securities are generally categorized within Level 2 of the fair value hierarchy.
Fair valuing of securities may be determined with the assistance of a Service using calculations based on indices of domestic securities and other appropriate indicators, such as prices of relevant ADRs and futures. Utilizing these techniques may result in transfers between Level 1 and Level 2 of the fair value hierarchy.
When market quotations or official closing prices are not readily available, or are determined not to accurately reflect fair value, such as when the value of a security has been significantly affected by events after the close of the exchange or market on which the security is principally traded, but before the fund calculates its net asset value, the fund may value these investments at fair value as determined in accordance with the procedures approved by the Board. Certain factors may be considered when fair valuing investments such as: fundamental analytical data, the nature and duration of restrictions on disposition, an evaluation of the forces that influence the market in which the securities are purchased and sold, and public trading in similar securities of the issuer or comparable issuers. These securities are either categorized within Level 2 or 3 of the fair value hierarchy depending on the relevant inputs used.
32
For securities where observable inputs are limited, assumptions about market activity and risk are used and such securities are generally categorized within Level 3 of the fair value hierarchy.
The following is a summary of the inputs used as of November 30, 2022 in valuing the fund’s investments:
Level 1-Unadjusted Quoted Prices | Level 2- Other Significant Observable Inputs | Level 3-Significant Unobservable Inputs | Total | |||
Assets ($) | ||||||
Investments in Securities:† | ||||||
Escrow Bond | - | - | 0 | 0 | ||
Equity Securities - Common Stocks | 338,221,125 | - | - | 338,221,125 | ||
Exchange-Traded Funds | 3,841,085 | - | - | 3,841,085 | ||
Investment Companies | 14,981,607 | - | - | 14,981,607 | ||
† See Statement of Investments for additional detailed categorizations, if any.
The following is a reconciliation of Level 3 assets for which significant unobservable inputs were used to determine fair value:
Escrow Bond ($) | |
Balance as of 11/30/2021 | - |
Net realized gain (loss) | - |
Change in unrealized appreciation (depreciation) | (15,840) |
Purchases/Issuances | 15,840 |
Sales/Dispositions | - |
Transfers into Level 3 | - |
Transfers out of Level 3 | - |
Balances as of 11/30/2022† | 0 |
The amount of net realized gains (loss) for the period included in earnings attributable to the change in unrealized appreciation (depreciation) relating to investments still held at 11/30/2022 | (15,840) |
† Securities deemed as Level 3 due to the lack of observable inputs by management assessment.
(b) Foreign taxes: The fund may be subject to foreign taxes (a portion of which may be reclaimable) on income, stock dividends, realized and unrealized capital gains on investments or certain foreign currency transactions. Foreign taxes are recorded in accordance with the applicable foreign tax regulations and rates that exist in the foreign jurisdictions in
33
NOTES TO FINANCIAL STATEMENTS (continued)
which the fund invests. These foreign taxes, if any, are paid by the fund and are reflected in the Statement of Operations, if applicable. Foreign taxes payable or deferred or those subject to reclaims as of November 30, 2022, if any, are disclosed in the fund’s Statement of Assets and Liabilities.
(c) Securities transactions and investment income: Securities transactions are recorded on a trade date basis. Realized gains and losses from securities transactions are recorded on the identified cost basis. Dividend income is recognized on the ex-dividend date and interest income, including, where applicable, accretion of discount and amortization of premium on investments, is recognized on the accrual basis.
Pursuant to a securities lending agreement with BNY Mellon, the fund may lend securities to qualified institutions. It is the fund’s policy that, at origination, all loans are secured by collateral of at least 102% of the value of U.S. securities loaned and 105% of the value of foreign securities loaned. Collateral equivalent to at least 100% of the market value of securities on loan is maintained at all times. At November 30, 2022, the market value of the collateral was 99.8% of the market value of the securities on loan. The fund received additional collateral subsequent to year end which resulted in the market value of the collateral to be at least 100% of the market value of the securities on loan. Collateral is either in the form of cash, which can be invested in certain money market mutual funds managed by the Adviser, or U.S. Government and Agency securities. The fund is entitled to receive all dividends, interest and distributions on securities loaned, in addition to income earned as a result of the lending transaction. Should a borrower fail to return the securities in a timely manner, BNY Mellon is required to replace the securities for the benefit of the fund or credit the fund with the market value of the unreturned securities and is subrogated to the fund’s rights against the borrower and the collateral. Additionally, the contractual maturity of security lending transactions are on an overnight and continuous basis. During the period ended November 30, 2022, BNY Mellon earned $11,646 from the lending of the fund’s portfolio securities, pursuant to the securities lending agreement.
(d) Affiliated issuers: Investments in other investment companies advised by the Adviser are considered “affiliated” under the Act.
(e) Market Risk: The value of the securities in which the fund invests may be affected by political, regulatory, economic and social developments, and developments that impact specific economic sectors, industries or segments of the market. The value of a security may also decline due to general market conditions that are not specifically related to a particular
34
company or industry, such as real or perceived adverse economic conditions, changes in the general outlook for corporate earnings, changes in interest or currency rates, changes to inflation, adverse changes to credit markets or adverse investor sentiment generally. In addition, turbulence in financial markets and reduced liquidity in equity, credit and/or fixed income markets may negatively affect many issuers, which could adversely affect the fund. Global economies and financial markets are becoming increasingly interconnected, and conditions and events in one country, region or financial market may adversely impact issuers in a different country, region or financial market. These risks may be magnified if certain events or developments adversely interrupt the global supply chain; in these and other circumstances, such risks might affect companies world-wide. Recent examples include pandemic risks related to COVID-19 and aggressive measures taken world-wide in response by governments, including closing borders, restricting international and domestic travel, and the imposition of prolonged quarantines of large populations, and by businesses, including changes to operations and reducing staff.
(f) Dividends and distributions to shareholders: Dividends and distributions are recorded on the ex-dividend date. Dividends from net investment income and dividends from net realized capital gains, if any, are normally declared and paid annually, but the fund may make distributions on a more frequent basis to comply with the distribution requirements of the Internal Revenue Code of 1986, as amended (the “Code”). To the extent that net realized capital gains can be offset by capital loss carryovers, it is the policy of the fund not to distribute such gains. Income and capital gain distributions are determined in accordance with income tax regulations, which may differ from GAAP.
(g) Federal income taxes: It is the policy of the fund to continue to qualify as a regulated investment company, if such qualification is in the best interests of its shareholders, by complying with the applicable provisions of the Code, and to make distributions of taxable income and net realized capital gain sufficient to relieve it from substantially all federal income and excise taxes.
As of and during the period ended November 30, 2022, the fund did not have any liabilities for any uncertain tax positions. The fund recognizes interest and penalties, if any, related to uncertain tax positions as income tax expense in the Statement of Operations. During the period ended November 30, 2022, the fund did not incur any interest or penalties.
Each tax year in the four-year period ended November 30, 2022 remains subject to examination by the Internal Revenue Service and state taxing authorities.
35
NOTES TO FINANCIAL STATEMENTS (continued)
At November 30, 2022, the components of accumulated earnings on a tax basis were as follows: undistributed ordinary income $1,975,523, undistributed capital gains $38,157,998 and unrealized appreciation $41,476,144.
The tax character of distributions paid to shareholders during the fiscal years ended November 30, 2022 and November 30, 2021 were as follows: ordinary income $34,033,285 and $2,066,443, and long-term capital gains $62,058,828 and $26,168,183, respectively.
NOTE 2—Bank Lines of Credit:
The fund participates with other long-term open-end funds managed by the Adviser in a $823.5 million unsecured credit facility led by Citibank, N.A. (the “Citibank Credit Facility”) and a $300 million unsecured credit facility provided by BNY Mellon (the “BNYM Credit Facility”), each to be utilized primarily for temporary or emergency purposes, including the financing of redemptions (each, a “Facility”). The Citibank Credit Facility is available in two tranches: (i) Tranche A is in an amount equal to $688.5 million and is available to all long-term open-ended funds, including the fund, and (ii) Tranche B is an amount equal to $135 million and is available only to BNY Mellon Floating Rate Income Fund, a series of BNY Mellon Investment Funds IV, Inc. In connection therewith, the fund has agreed to pay its pro rata portion of commitment fees for Tranche A of the Citibank Credit Facility and the BNYM Credit Facility. Interest is charged to the fund based on rates determined pursuant to the terms of the respective Facility at the time of borrowing.
The average amount of borrowings outstanding under the Facilities during the period ended November 30, 2022 was approximately $40,822 with a related weighted average annualized interest rate of 2.19%.
NOTE 3—Management Fee, Sub-Advisory Fee and Other Transactions with Affiliates:
(a) Pursuant to a management agreement with the Adviser, the management fee is computed at the annual rate of .90% of the value of the fund’s average daily net assets and is payable monthly. The Adviser has contractually agreed, from December 1, 2021 through March 31, 2023, to waive receipt of its fees and/or assume the direct expenses of the fund, so that the direct expenses of none of the fund’s classes (excluding Rule 12b-1 Distribution Plan fees, Shareholder Services Plan fees, taxes, interest expense, brokerage commissions, commitment fees on borrowings and extraordinary expenses) exceed 1.05% of the value of the fund’s average daily net assets. On or after March 31, 2023, the Adviser may terminate this expense limitation at any time. The reduction in expenses, pursuant to
36
the undertakings, amounted to $1,753 during the period ended November 30, 2022.
Pursuant to separate sub-investment advisory agreements between the Adviser and the Sub-Advisers, each serves as the fund’s sub-adviser responsible for the day-to-day management of a portion of the fund’s portfolio. The Adviser pays each sub-adviser a monthly fee at an annual percentage of the value of the fund’s average daily net assets. The Adviser has obtained an exemptive order from the SEC (the “Order”), upon which the fund may rely, to use a manager of managers approach that permits the Adviser, subject to certain conditions and approval by the Board, to enter into and materially amend sub-investment advisory agreements with one or more sub-advisers who are either unaffiliated with the Adviser or are wholly-owned subsidiaries (as defined under the Act) of the Adviser’s ultimate parent company, BNY Mellon, without obtaining shareholder approval. The Order also allows the fund to disclose the sub-advisory fee paid by the Adviser to any unaffiliated sub-adviser in the aggregate with other unaffiliated sub-advisers in documents filed with the SEC and provided to shareholders. In addition, pursuant to the Order, it is not necessary to disclose the sub-advisory fee payable by the Adviser separately to a sub-adviser that is a wholly-owned subsidiary of BNY Mellon in documents filed with the SEC and provided to shareholders; such fees are to be aggregated with fees payable to the Adviser. The Adviser has ultimate responsibility (subject to oversight by the Board) to supervise any sub-adviser and recommend the hiring, termination, and replacement of any sub-adviser to the Board.
(b) Under the Distribution Plan adopted pursuant to Rule 12b-1 under the Act, Class C shares pay the Distributor for distributing its shares at an annual rate of .75% of the value of its average daily net assets. The Distributor may pay one or more Service Agents in respect of advertising, marketing and other distribution services, and determines the amounts, if any, to be paid to Service Agents and the basis on which such payments are made. During the period ended November 30, 2022, Class C shares were charged $787 pursuant to the Distribution Plan.
(c) Under the Shareholder Services Plan, Class A and Class C shares pay the Distributor at an annual rate of .25% of the value of their average daily net assets for the provision of certain services. The services provided may include personal services relating to shareholder accounts, such as answering shareholder inquiries regarding the fund, and services related to the maintenance of shareholder accounts. The Distributor may make payments to Service Agents (securities dealers, financial institutions or other industry professionals) with respect to these services. The
37
NOTES TO FINANCIAL STATEMENTS (continued)
Distributor determines the amounts to be paid to Service Agents. During the period ended November 30, 2022, Class A and Class C shares were charged $3,567 and $262, respectively, pursuant to the Shareholder Services Plan.
The fund has an arrangement with BNY Mellon Transfer, Inc., (the “Transfer Agent”), a subsidiary of BNY Mellon and an affiliate of the Adviser, whereby the fund may receive earnings credits when positive cash balances are maintained, which are used to offset Transfer Agent fees. For financial reporting purposes, the fund includes transfer agent net earnings credits, if any, as an expense offset in the Statement of Operations.
The fund has an arrangement with The Bank of New York Mellon (the “Custodian”), a subsidiary of BNY Mellon and an affiliate of the Adviser, whereby the fund will receive interest income or be charged overdraft fees when cash balances are maintained. For financial reporting purposes, the fund includes this interest income and overdraft fees, if any, as interest income in the Statement of Operations.
The fund compensates the Transfer Agent, under a transfer agency agreement, for providing transfer agency and cash management services for the fund. The majority of Transfer Agent fees are comprised of amounts paid on a per account basis, while cash management fees are related to fund subscriptions and redemptions. During the period ended November 30, 2022, the fund was charged $6,399 for transfer agency services. These fees are included in Shareholder servicing costs in the Statement of Operations. These fees were partially offset by earnings credits of $119.
The fund compensates the Custodian, under a custody agreement, for providing custodial services for the fund. These fees are determined based on net assets, geographic region and transaction activity. During the period ended November 30, 2022, the fund was charged $46,205 pursuant to the custody agreement.
During the period ended November 30, 2022, the fund was charged $34,054 for services performed by the fund’s Chief Compliance Officer and his staff. These fees are included in Chief Compliance Officer fees in the Statement of Operations.
The components of “Due to BNY Mellon Investment Adviser, Inc. and affiliates” in the Statement of Assets and Liabilities consist of: management fee of $262,165, Distribution Plan fees of $57, Shareholder Services Plan fees of $267, Custodian fees of $18,000, Chief Compliance Officer fees of $5,443 and Transfer Agent fees of $1,575, which are offset against an expense reimbursement currently in effect in the amount of $238.
38
(d) Each Board Member also serves as a Board Member of other funds in the BNY Mellon Family of Funds complex. Annual retainer fees and attendance fees are allocated to each fund based on net assets.
NOTE 4—Securities Transactions:
The aggregate amount of purchases and sales of investment securities, excluding short-term securities, during the period ended November 30, 2022, amounted to $320,739,275 and $544,597,066, respectively.
At November 30, 2022, the cost of investments for federal income tax purposes was $315,567,673; accordingly, accumulated net unrealized appreciation on investments was $41,476,144, consisting of $71,818,788 gross unrealized appreciation and $30,342,644 gross unrealized depreciation.
39
REPORT OF INDEPENDENT REGISTERED PUBLIC ACCOUNTING FIRM
To the Shareholders and the Board of Directors of BNY Mellon Select Managers Small Cap Value Fund
Opinion on the Financial Statements
We have audited the accompanying statement of assets and liabilities of BNY Mellon Select Managers Small Cap Value Fund (the “Fund”) (one of the funds constituting BNY Mellon Strategic Funds, Inc.), including the statement of investments, as of November 30, 2022, and the related statement of operations for the year then ended, the statements of changes in net assets for each of the two years in the period then ended, the financial highlights for each of the five years in the period then ended and the related notes (collectively referred to as the “financial statements”). In our opinion, the financial statements present fairly, in all material respects, the financial position of the Fund (one of the funds constituting BNY Mellon Strategic Funds, Inc.) at November 30, 2022, the results of its operations for the year then ended, the changes in its net assets for each of the two years in the period then ended and its financial highlights for each of the five years in the period then ended, in conformity with U.S. generally accepted accounting principles.
Basis for Opinion
These financial statements are the responsibility of the Fund’s management. Our responsibility is to express an opinion on the Fund’s financial statements based on our audits. We are a public accounting firm registered with the Public Company Accounting Oversight Board (United States) (“PCAOB”) and are required to be independent with respect to the Fund in accordance with the U.S. federal securities laws and the applicable rules and regulations of the Securities and Exchange Commission and the PCAOB.
We conducted our audits in accordance with the standards of the PCAOB. Those standards require that we plan and perform the audit to obtain reasonable assurance about whether the financial statements are free of material misstatement, whether due to error or fraud. The Fund is not required to have, nor were we engaged to perform, an audit of the Fund’s internal control over financial reporting. As part of our audits, we are required to obtain an understanding of internal control over financial reporting, but not for the purpose of expressing an opinion on the effectiveness of the Fund’s internal control over financial reporting. Accordingly, we express no such opinion.
Our audits included performing procedures to assess the risks of material misstatement of the financial statements, whether due to error or fraud, and performing procedures that respond to those risks. Such procedures included examining, on a test basis, evidence regarding the amounts and disclosures in the financial statements. Our procedures included confirmation of securities owned as of November 30, 2022, by correspondence with the custodian, brokers and others; when replies were not received from brokers and others, we performed other auditing procedures. Our audits also included evaluating the accounting principles used and significant estimates made by management, as well as evaluating the overall presentation of the financial statements. We believe that our audits provide a reasonable basis for our opinion.

We have served as the auditor of one or more investment companies in the BNY Mellon Family of Funds since at least 1957, but we are unable to determine the specific year.
New York, New York
January 23, 2023
40
IMPORTANT TAX INFORMATION (Unaudited)
For federal tax purposes the fund hereby reports 16.03% of the ordinary dividends paid during the fiscal year ended November 30, 2022 as qualifying for the corporate dividends received deduction. Also certain dividends paid by the fund may be subject to a maximum tax rate of 15%, as provided for by the Jobs and Growth Tax Relief Reconciliation Act of 2003. Of the distributions paid during the fiscal year, $5,501,506 represents the maximum amount that may be considered qualified dividend income. Shareholders will receive notification in early 2023 of the percentage applicable to the preparation of their 2022 income tax returns. Also, the fund hereby reports $2.4587 per share as a long-term capital gain distribution and $1.5297 per share as a short-term capital gain distribution paid on December 22, 2021 and $.4678 per share as a long-term capital gain distribution and $.0307 per share as a short-term capital gain distribution paid on March 29, 2022.
41
INFORMATION ABOUT THE RENEWAL AND APPROVAL OF THE FUND’S MANAGEMENT AND SUB-INVESTMENT ADVISORY AGREEMENTS (Unaudited)
At a meeting of the fund’s Board of Directors held on October 31-November 1, 2022, the Board considered the renewal of (a) the fund’s Management Agreement, pursuant to which the Adviser provides the fund with investment management and administrative services and is responsible for evaluating and recommending sub-advisers to provide the fund with day-to-day portfolio management services, recommending the percentage of fund assets to be allocated to each sub-adviser, monitoring and evaluating the performance of the sub-advisers, and recommending whether a sub-adviser should be terminated and (b) the separate Sub-Investment Advisory Agreements (together with the Management Agreement, the “Agreements”), between the Adviser and each of Channing Capital Management, LLC (“Channing”), Eastern Shore Capital Management (“Eastern Shore”), Heartland Advisors, Inc. (“Heartland”) and Neuberger Berman Investment Advisers LLC (“Neuberger Berman”) (each, a “Sub-Adviser” and collectively, the “Sub-Advisers”), pursuant to which each Sub-Adviser serves as a sub-investment adviser and provides day-to-day management of the fund’s investments with respect to the portion of the fund’s assets allocated to the Sub-Adviser. The Board members, none of whom are “interested persons” (as defined in the Investment Company Act of 1940, as amended (the “1940 Act”)) of the fund, were assisted in their review by independent legal counsel and met with counsel in executive session separate from representatives of the Adviser and the Sub-Advisers. In considering the renewal of the Agreements, the Board considered several factors that it believed to be relevant, including those discussed below. The Board did not identify any one factor as dispositive, and each Board member may have attributed different weights to the factors considered.
In addition, at the meeting, the Board considered and approved (x) a new Sub-Investment Advisory Agreement (the “New Sub-Advisory Agreement”), on behalf of the fund, between the Adviser and Denali Advisers, LLC (“Denali”), pursuant to which Denali would serve as a new sub-adviser for the fund, and (y) the termination of the Sub-Investment Advisory Agreement between the Adviser and Walthausen & Co., LLC (“Walthausen”), a sub-investment adviser to the fund. The Adviser’s recommendation of Denali was based on, among other information, the Adviser’s review and due diligence reports relating to Denali and its investment advisory services. In the opinion of the Adviser, the proposed allocation to Denali of a portion of the fund’s assets would allow Denali to effectively complement the fund’s other Sub-Advisers and add capacity and provide greater diversification for the fund, particularly in light of the termination of Walthausen. The portion of the fund’s assets allocated to Walthausen would be re-allocated primarily to Denali.
Analysis of Nature, Extent, and Quality of Services Provided to the Fund. The Board considered information provided to it at the meeting and in previous presentations from representatives of the Adviser regarding the nature, extent, and quality of the services provided to funds in the BNY Mellon fund complex, including the fund. The Adviser provided the number of open accounts in the fund, the fund’s asset size and the allocation of fund assets among distribution channels. The Adviser also had previously
42
provided information regarding the diverse intermediary relationships and distribution channels of funds in the BNY Mellon fund complex (such as retail direct or intermediary, in which intermediaries typically are paid by the fund and/or the Adviser) and the Adviser’s corresponding need for broad, deep, and diverse resources to be able to provide ongoing shareholder services to each intermediary or distribution channel, as applicable to the fund.
The Board also considered research support available to, and portfolio management capabilities of, the fund’s portfolio management personnel and that the Adviser also provides oversight of day-to-day fund operations, including fund accounting and administration and assistance in meeting legal and regulatory requirements. The Board also considered the Adviser’s extensive administrative, accounting and compliance infrastructures, as well as the Adviser’s supervisory, evaluation and other responsibilities in respect of the Sub-Advisers. As part of its review, the Board considered information regarding the process by which the Adviser selected and recommended the Sub-Advisers for Board approval. The Board considered each Sub-Adviser’s specific responsibilities in the day-to-day management of the portion of the fund’s assets allocated to it, as well as the qualifications, experience and responsibilities of the persons serving as the portfolio managers for the segment of the fund’s assets managed by the respective Sub-Adviser, and other key personnel at the Sub-Adviser. The Board specifically took into account each Sub-Adviser’s investment process and capabilities, evaluating how the Sub-Adviser complemented each of the other Sub-Advisers to the fund, noting the Adviser’s favorable assessment of the nature and quality of the sub-advisory services provided to the fund by the Sub-Advisers. The Board also considered portfolio management’s brokerage policies and practices (including policies and practices regarding soft dollars) and the standards applied in seeking best execution.
Comparative Analysis of the Fund’s Performance and Management Fee and Expense Ratio. The Board reviewed reports prepared by Broadridge Financial Solutions, Inc. (“Broadridge”), an independent provider of investment company data based on classifications provided by Thomson Reuters Lipper (“Lipper”), which included information comparing (1) the performance of the fund’s Class I shares with the performance of a group of institutional small-cap core funds selected by Broadridge as comparable to the fund (the “Performance Group”) and with a broader group of funds consisting of all retail and institutional small-cap core funds (the “Performance Universe”), all for various periods ended September 30, 2022, and (2) the fund’s actual and contractual management fees and total expenses with those of the same group of funds in the Performance Group (the “Expense Group”) and with a broader group of all institutional small-cap core funds, excluding outliers (the “Expense Universe”), the information for which was derived in part from fund financial statements available to Broadridge as of the date of its analysis. The Adviser previously had furnished the Board with a description of the methodology Broadridge used to select the Performance Group and Performance Universe and the Expense Group and Expense Universe. The Board also reviewed performance information provided by the Adviser with respect to each Sub-Adviser for various periods ended September 30, 2022.
43
INFORMATION ABOUT THE RENEWAL AND APPROVAL OF THE FUND’S MANAGEMENT AND SUB-INVESTMENT ADVISORY AGREEMENTS (Unaudited) (continued)
Performance Comparisons. Representatives of the Adviser stated that the usefulness of performance comparisons may be affected by a number of factors, including different investment limitations and policies that may be applicable to the fund and comparison funds and the end date selected, noting that the funds included in the Performance Group and the Performance Universe were not limited to funds that engage multiple sub-advisers like the fund, nor did they include only funds that use a value-style of investing. The Board also considered the fund’s performance in light of overall market conditions. The Board discussed with representatives of the Adviser the results of the comparisons and considered that the fund’s total return performance was at or above the Performance Group and the Performance Universe medians for all periods, except the one- and two-years periods when the fund’s total return performance was below the Performance Group and Performance Universe medians. The Adviser also provided a comparison of the fund’s calendar year total returns to the returns of the fund’s benchmark index, and it was noted that the fund’s returns were above the returns of the index in five of the ten calendar years shown. The Board also noted that the fund had a four-star rating for the three-year period from Morningstar based on Morningstar’s risk-adjusted return measure. With respect to the performance of each Sub-Adviser, the Board noted that, depending on the period under review, some Sub-Advisers outperformed, while others underperformed, the fund’s benchmark index and/or the median performance of the funds in the Performance Group and Performance Universe. The Board discussed with representatives of the Adviser the portfolio management strategies of the fund’s Sub-Advisers, and noted that the Sub-Advisers’ strategies continued to complement each other and were applied consistently.
Management Fee and Expense Ratio Comparisons. The Board reviewed and considered the contractual management fee rate payable by the fund to the Adviser in light of the nature, extent and quality of the management services and the sub-advisory services provided by the Adviser and the Sub-Advisers, respectively. In addition, the Board reviewed and considered the actual management fee rate paid by the fund over the fund’s last fiscal year. The Board also reviewed the range of actual and contractual management fees and total expenses as a percentage of average net assets of the Expense Group and Expense Universe funds and discussed the results of the comparisons. It was noted that, as in the case of the funds included in the Performance Group and the Performance Universe, the funds included in the Expense Group and the Expense Universe were not limited to funds that engage multiple sub-advisers like the fund.
The Board considered that the fund’s contractual management fee was higher than the Expense Group median contractual management fee, the fund’s actual management fee was higher than the Expense Group median and the Expense Universe median actual management fee and the fund’s total expenses were higher than the Expense Group median and the Expense Universe median total expenses.
Representatives of the Adviser stated that the Adviser has contractually agreed, until March 31, 2023, to waive receipt of its fees and/or assume the direct expenses of the fund so that the direct expenses of none of the fund’s classes of shares (excluding Rule
44
12b-1 fees, shareholder services fees, taxes, interest, brokerage commissions, commitment fees on borrowings and extraordinary expenses) exceed 1.05% of the fund’s average daily net assets.
Representatives of the Adviser reviewed with the Board the management or investment advisory fees paid by funds advised by the Adviser that are in the same Lipper category as the fund (the “Similar Funds”), and explained the nature of the Similar Funds. They discussed differences in fees paid in light of any differences in the services provided and other relevant factors. The Board considered the relevance of the fee information provided for the Similar Funds to evaluate the appropriateness of the fund’s management fee. Representatives of the Adviser noted there were no separate accounts and/or other types of client portfolios advised by the Adviser that are considered to have similar investment strategies and policies as the fund.
The Board considered the fees payable to the Sub-Advisers in relation to the fee payable to the Adviser by the fund and the respective services provided by the Sub-Advisers and the Adviser. The Board also took into consideration that the Sub-Advisers’ fees are paid by the Adviser, out of its fee from the fund, and not the fund.
Analysis of Profitability and Economies of Scale. Representatives of the Adviser reviewed the expenses allocated and profit received by the Adviser and its affiliates and the resulting profitability percentage for managing the fund and the aggregate profitability percentage to the Adviser and its affiliates for managing the funds in the BNY Mellon fund complex, and the method used to determine the expenses and profit. The Board concluded that the profitability results were not excessive, given the services rendered and service levels provided by the Adviser and its affiliates. The Board also had been provided with information prepared by an independent consulting firm regarding the Adviser’s approach to allocating costs to, and determining the profitability of, individual funds and the entire BNY Mellon fund complex. The consulting firm also had analyzed where any economies of scale might emerge in connection with the management of a fund.
The Board considered, on the advice of its counsel, the profitability analysis (1) as part of its evaluation of whether the fees under the Agreements, considered in relation to the mix of services provided by the Adviser and the Sub-Advisers, including the nature, extent and quality of such services, supported the renewal of the Agreements and (2) in light of the relevant circumstances for the fund and the extent to which economies of scale would be realized if the fund grows and whether fee levels reflect these economies of scale for the benefit of fund shareholders. Since the Adviser, and not the fund, pays the Sub-Advisers pursuant to the respective Sub-Investment Advisory Agreements the Board did not consider any Sub-Adviser’s profitability to be relevant to its deliberations. Representatives of the Adviser stated that a discussion of economies of scale is predicated on a fund having achieved a substantial size with increasing assets and that, if a fund’s assets had been stable or decreasing, the possibility that the Adviser may have realized any economies of scale would be less. Representatives of the Adviser also stated that, as a result of shared and allocated costs among funds in the BNY Mellon fund complex, the extent of economies of scale could depend substantially on the level
45
INFORMATION ABOUT THE RENEWAL AND APPROVAL OF THE FUND’S MANAGEMENT AND SUB-INVESTMENT ADVISORY AGREEMENTS (Unaudited) (continued)
of assets in the complex as a whole, so that increases and decreases in complex-wide assets can affect potential economies of scale in a manner that is disproportionate to, or even in the opposite direction from, changes in the fund’s asset level. The Board also considered potential benefits to the Adviser and each Sub-Adviser from acting as investment adviser and sub-investment adviser, respectively, and took into consideration the soft dollar arrangements in effect for trading the fund’s investments.
At the conclusion of these discussions, the Board agreed that it had been furnished with sufficient information to make an informed business decision with respect to the renewal of the Agreements. Based on the discussions and considerations as described above, the Board concluded and determined as follows.
· The Board concluded that the nature, extent and quality of the services provided by the Adviser and the Sub-Advisers are adequate and appropriate.
· The Board generally was satisfied with the fund’s overall performance and with the manner in which the Adviser monitors and evaluates the performance of each Sub-Adviser.
· The Board concluded that the fees paid to the Adviser and the Sub-Advisers continued to be appropriate under the circumstances and in light of the factors and the totality of the services provided as discussed above.
· The Board determined that the economies of scale which may accrue to the Adviser and its affiliates in connection with the management of the fund had been adequately considered by the Adviser in connection with the fee rate charged to the fund pursuant to the Management Agreement and that, to the extent in the future it were determined that material economies of scale had not been shared with the fund, the Board would seek to have those economies of scale shared with the fund.
In evaluating the Agreements, the Board considered these conclusions and determinations and also relied on its previous knowledge, gained through meetings and other interactions with the Adviser and its affiliates and the Sub-Advisers, of the Adviser and the Sub-Advisers and the services provided to the fund by the Adviser and the Sub-Advisers. The Board also relied on information received on a routine and regular basis throughout the year relating to the operations of the fund and the investment management and other services provided under the Agreements, including information on the investment performance of the fund in comparison to similar mutual funds and benchmark performance indices; general market outlook as applicable to the fund; and compliance reports. In addition, the Board’s consideration of the contractual fee arrangements for the fund had the benefit of a number of years of reviews of the Agreements for the fund, or substantially similar agreements for other BNY Mellon funds that the Board oversees, during which lengthy discussions took place between the Board and representatives of the Adviser. Certain aspects of the arrangements may receive greater scrutiny in some years than in others, and the Board’s conclusions may be based, in part, on its consideration of the fund’s arrangements, or
46
substantially similar arrangements for other BNY Mellon funds that the Board oversees, in prior years. The Board also noted that the Adviser continued to believe that the Sub-Advisers complemented each other’s specific style of investing and that the Adviser recommended that the Board approve each Sub-Investment Advisory Agreement. The Board determined to renew the Agreements.
***********************
Approval of New Sub-Advisory Agreement
In determining whether to approve the New Sub-Advisory Agreement, the Board considered the due diligence materials prepared by the Adviser and other information, which included: (i) copies of the New Sub-Advisory Agreement; (ii) information regarding the process by which the Adviser selected and recommended Denali for Board approval; (iii) information regarding the nature, extent and quality of the services Denali would provide to the fund; (iv) information regarding Denali’s reputation, investment management businesses, personnel and operations; (v) information regarding Denali’s brokerage and trading policies and practices; (vi) information regarding the level of the sub-investment advisory fee to be charged by Denali; (vii) information regarding Denali’s compliance program; and (viii) information regarding Denali’s historical performance returns managing investment mandates similar to the fund’s investment mandate, with such performance compared to relevant unmanaged indices. The Board also considered the substance of discussions with representatives of the Adviser at the meeting. Additionally, the Board reviewed materials supplied by counsel that were prepared for use by the Board in fulfilling its duties under the 1940 Act.
Nature, Extent and Quality of Services to be Provided by Denali. In examining the nature, extent and quality of the services to be provided by Denali to the fund, the Board considered with respect to Denali: (i) organization, history, reputation and qualifications, as well as the qualifications of Denali’s investment personnel; (ii) expertise in providing portfolio management services to other similar investment portfolios and the performance history of those portfolios; (iii) proposed investment strategies for the portion of the fund’s assets to be allocated to Denali; (iv) long- and short-term performance relative to unmanaged indices; and (v) Denali’s compliance program. The Board specifically took into account Denali’s investment process and research resources and capabilities, evaluating how Denali would complement the fund’s existing Sub-Advisers. The Board also discussed the acceptability of the New Sub-Advisory Agreement, noting the substantial similarity in material respects to the terms of the fund’s other Sub-Investment Advisory Agreements. The Board also considered the review process undertaken by the Adviser and the Adviser’s favorable assessment of the nature and quality of the sub-investment advisory services expected to be provided to the fund by Denali. The Board concluded that the fund will benefit from the quality and experience of Denali’s investment professionals. Based on their considerations and review of the foregoing information, the Board concluded that the nature, extent and quality of the sub-investment advisory services expected to be provided by Denali were adequate and appropriate in light of Denali’s experience in managing small cap value
47
INFORMATION ABOUT THE RENEWAL AND APPROVAL OF THE FUND’S MANAGEMENT AND SUB-INVESTMENT ADVISORY AGREEMENTS (Unaudited) (continued)
equity assets, Denali’s portfolio management and research resources to be applied in managing a portion of the fund’s portfolio, and the Adviser’s recommendation to engage Denali, and supported a decision to approve the New Sub-Advisory Agreement.
Investment Performance of Denali. Because Denali is a newly appointed sub-adviser for the fund, the Board could not consider its investment performance in managing portions of the fund’s portfolio as a factor in evaluating the New Sub-Advisory Agreement during the meeting. However, the Board did review Denali’s historical performance records in managing other portfolios that were comparable to the fund with respect to its investment mandate. The Board also discussed with representatives of the Adviser the investment strategies to be employed by Denali in the management of its allocated portion of the fund’s assets. The Board noted the Adviser’s reputation and experience in selecting, evaluating and overseeing investment managers. Based on their consideration and review of the foregoing information, the Board concluded that these factors supported a decision to approve the New Sub-Advisory Agreement.
Cost of Services to be Provided and Profitability. The Board considered the proposed fee payable under the New Sub-Advisory Agreement, noting that the proposed fee would be paid by the Adviser and thus, would not impact the fees paid by the fund. The Board recognized that, because Denali’s fees would be paid by the Adviser, and not the fund, an analysis of profitability was more appropriate in the context of the Board’s consideration of the Management Agreement pursuant to which the Adviser provides investment management services to the fund, and therefore, the Board received and considered a profitability analysis of the Adviser and its affiliates with respect to the proposed addition of Denali as an additional sub-adviser for the fund. The Board concluded that the proposed fees payable to Denali by the Adviser with respect to the assets to be allocated to Denali in its capacity as sub-adviser was appropriate and the Adviser’s profitability was not excessive in light of the nature, extent and quality of the services to be provided to the fund by the Adviser and Denali.
Economies of Scale to be Realized. The Board recognized that, because Denali’s fees would be paid by the Adviser, and not the fund, the analyses of economies of scale were more appropriate in the context of the Board’s consideration of the Management Agreement. Accordingly, considerations of economies of scale with respect to Denali were not relevant to the Board’s determination to approve the New Sub-Advisory Agreement.
The Board also considered whether there were any ancillary benefits that may accrue to Denali as a result of its relationship with the fund. The Board concluded that Denali may in the future direct fund brokerage transactions to certain brokers to obtain research and other services. However, the Board noted that Denali was required to select brokers who met the fund’s requirements for seeking best execution, and that the Adviser would monitor and evaluate Denali’s trade execution with respect to fund brokerage transactions on a quarterly basis and would provide reports to the Board on these matters.
In considering the materials and information described above, the Board members received assistance from, and met separately with, their legal counsel, and were provided
48
with a written description of their statutory responsibilities and the legal standards that are applicable to the approval of investment advisory and sub-investment advisory agreements.
After full consideration of the factors discussed above, with no single factor identified as being of paramount importance, the Board, with the assistance of independent legal counsel, approved the New Sub-Advisory Agreement between the Adviser and Denali, for the fund.
49
BOARD MEMBERS INFORMATION (Unaudited)
Independent Board Members
Chairman of the Board (1995)
Principal Occupation During Past 5 Years:
· Director or Trustee of funds in the BNY Mellon Family of Funds and certain other entities (as described in the fund’s Statement of Additional Information) (1995-Present)
Other Public Company Board Memberships During Past 5 Years:
· CBIZ, Inc., a public company providing professional business services, products and solutions, Director (1997-Present)
No. of Portfolios for which Board Member Serves: 92
———————
Joni Evans (80)
Board Member (2006)
Principal Occupation During Past 5 Years:
· www.wowOwow.com, an online community dedicated to women’s conversations and publications, Chief Executive Officer (2007-2019)
· Joni Evans Ltd. publishing, Principal (2006-2019)
No. of Portfolios for which Board Member Serves: 17
———————
Joan Gulley (75)
Board Member (2017)
Principal Occupation During Past 5 Years:
· Nantucket Atheneum, public library, Chair (2018-June 2021) and Director (2015-June 2021)
· Orchard Island Club, golf and beach club, Governor (2016-Present)
No. of Portfolios for which Board Member Serves: 39
———————
50
Alan H. Howard (63)
Board Member (2018)
Principal Occupation During Past 5 Years:
· Heathcote Advisors LLC, a financial advisory services firm, Managing Partner (2008-Present)
· Dynatech/MPX Holdings LLC, a global supplier and service provider of military aircraft parts, President (2012-2019); and Board Member of its two operating subsidiaries, Dynatech International LLC and Military Parts Exchange LLC (2012-2019), including Chief Executive Officer of an operating subsidiary, Dynatech International LLC (2013-2019)
· Rossoff & Co., an independent investment banking firm, Senior Advisor (2013-June 2021)
Other Public Company Board Memberships During Past 5 Years:
· Movado Group, Inc., a public company that designs, sources, markets and distributes watches, Director (1997-Present)
· Diamond Offshore Drilling, Inc., a public company that provides contract drilling services, Director (March 2020-April 2021)
No. of Portfolios for which Board Member Serves: 17
———————
Robin A. Melvin (59)
Board Member (1995)
Principal Occupation During Past 5 Years:
· Westover School, a private girls’ boarding school in Middlebury, Connecticut, Trustee (2019-Present)
· Mentor Illinois, a non-profit organization dedicated to increasing the quantity and quality of mentoring services in Illinois. Co-Chair (2014–2020); Board Member, Mentor Illinois (2013-2020)
· JDRF, a non-profit juvenile diabetes research foundation, Board Member (June 2021-June 2022)
Other Public Company Board Memberships During Past 5 Years:
· HPS Corporate Lending Fund, a closed-end management investment company regulated as a business development company, Trustee (August 2021-Present)
No. of Portfolios for which Board Member Serves: 71
———————
Burton N. Wallack (72)
Board Member (2006)
Principal Occupation During Past 5 Years:
Wallack Management Company, a real estate management company, President and Co-owner (1987-Present)
Other Public Company Board Memberships During Past 5 Years:
Mount Sinai Hospital Urology, Board Member (2017-Present)
No. of Portfolios for which Board Member Serves: 17
———————
51
BOARD MEMBERS INFORMATION (Unaudited) (continued)
Benaree Pratt Wiley (76)
Board Member (2016)
Principal Occupation During Past 5 Years:
· The Wiley Group, a firm specializing in strategy and business development. Principal (2005-Present)
Other Public Company Board Memberships During Past 5 Years:
· CBIZ, Inc., a public company providing professional business services, products and solutions, Director (2008-Present)
· Blue Cross-Blue Shield of Massachusetts, Director (2004-2020)
No. of Portfolios for which Board Member Serves: 60
———————
Gordon J. Davis (81)
Advisory Board Member (2021)
Principal Occupation During Past 5 Years:
· Venable LLP, a law firm, Partner (2012-Present)
Other Public Company Board Memberships During Past 5 Years:
· BNY Mellon Family of Funds (53 funds), Board Member (1995-August 2021)
No. of Portfolios for which Advisory Board Member Serves: 39
———————
The address of the Board Members and Officers is c/o BNY Mellon Investment Adviser, Inc., 240 Greenwich Street, New York, New York 10286. Additional information about each Board Member is available in the fund’s Statement of Additional Information which can be obtained from the Adviser free of charge by calling this toll free number: 1-800-373-9387.
52
OFFICERS OF THE FUND (Unaudited)
DAVID DIPETRILLO, President since January 2021.
Vice President and Director of the Adviser since February 2021; Head of North America Product, BNY Mellon Investment Management since January 2018; and Director of Product Strategy, BNY Mellon Investment Management from January 2016 to December 2017. He is an officer of 54 investment companies (comprised of 107 portfolios) managed by the Adviser or an affiliate of the Adviser. He is 44 years old and has been an employee of BNY Mellon since 2005.
JAMES WINDELS, Treasurer since November 2001.
Vice President of the Adviser since September 2020; and Director–BNY Mellon Fund Administration. He is an officer of 55 investment companies (comprised of 127 portfolios) managed by the Adviser or an affiliate of the Adviser. He is 64 years old and has been an employee of the Adviser since April 1985.
PETER M. SULLIVAN, Chief Legal Officer since July 2021 and Vice President and Assistant Secretary since March 2019.
Chief Legal Officer of the Adviser and Associate General Counsel of BNY Mellon since July 2021; Senior Managing Counsel of BNY Mellon from December 2020 to July 2021; and Managing Counsel of BNY Mellon from March 2009 to December 2020. He is an officer of 55 investment companies (comprised of 127 portfolios) managed by the Adviser or an affiliate of the Adviser. He is 54 years old and has been an employee of BNY Mellon since April 2004.
JAMES BITETTO, Vice President since August 2005 and Secretary since February 2018.
Senior Managing Counsel of BNY Mellon since December 2019; Managing Counsel of BNY Mellon from April 2014 to December 2019; and Secretary of the Adviser. He is an officer of 55 investment companies (comprised of 127 portfolios) managed by the Adviser or an affiliate of the Adviser. He is 56 years old and has been an employee of the Adviser since December 1996.
DEIRDRE CUNNANE, Vice President and Assistant Secretary since March 2019.
Managing Counsel of BNY Mellon since December 2021, Counsel of BNY Mellon from August 2018 to December 2021; and Senior Regulatory Specialist at BNY Mellon Investment Management Services from February 2016 to August 2018. She is an officer of 55 investment companies (comprised of 127 portfolios) managed by the Adviser or an affiliate of the Adviser. She is 32 years old and has been an employee of the Adviser since August 2018.
SARAH S. KELLEHER, Vice President and Assistant Secretary since April 2014.
Vice President of BNY Mellon ETF Investment Adviser; LLC since February 2020; Senior Managing Counsel of BNY Mellon since September 2021; Managing Counsel of BNY Mellon from December 2017 to September 2021; and Senior Counsel of BNY Mellon from March 2013 to December 2017. She is an officer of 55 investment companies (comprised of 127 portfolios) managed by the Adviser or an affiliate of the Adviser. She is 47 years old and has been an employee of the Adviser since March 2013.
JEFF PRUSNOFSKY, Vice President and Assistant Secretary since August 2005.
Senior Managing Counsel of BNY Mellon. He is an officer of 55 investment companies (comprised of 127 portfolios) managed by the Adviser or an affiliate of the Adviser. He is 57 years old and has been an employee of the Adviser since October 1990.
AMANDA QUINN, Vice President and Assistant Secretary since March 2020.
Counsel of BNY Mellon since June 2019; Regulatory Administration Manager at BNY Mellon Investment Management Services from September 2018 to May 2019; and Senior Regulatory Specialist at BNY Mellon Investment Management Services from April 2015 to August 2018. She is an officer of 55 investment companies (comprised of 127 portfolios) managed by the Adviser or an affiliate of the Adviser. She is 37 years old and has been an employee of the Adviser since June 2019.
53
OFFICERS OF THE FUND (Unaudited) (continued)
NATALYA ZELENSKY, Vice President and Assistant Secretary since March 2017.
Chief Compliance Officer since August 2021 and Vice President since February 2020 of BNY Mellon ETF Investment Adviser, LLC; Chief Compliance Officer since August 2021 and Vice President and Assistant Secretary since February 2020 of BNY Mellon ETF Trust; Managing Counsel of BNY Mellon from December 2019 to August 2021; Counsel of BNY Mellon from May 2016 to December 2019; and Assistant Secretary of the Adviser from April 2018 to August 2021. She is an officer of 55 investment companies (comprised of 127 portfolios) managed by the Adviser or an affiliate of the Adviser. She is 37 years old and has been an employee of BNY Mellon since May 2016.
DANIEL GOLDSTEIN, Vice President since March 2022.
Vice President and Head of Product Development of North America Product, BNY Mellon Investment Management since January 2018; Co-Head of Product Management, Development & Oversight of North America Product, BNY Mellon Investment Management from January 2010 to January 2018; and Senior Vice President, Development & Oversight of North America Product, BNY Mellon Investment Management since 2010. He is an officer of 54 investment companies (comprised of 107 portfolios) managed by the Adviser or an affiliate of the Adviser. He is 53 years old and has been an employee of the Distributor since 1991.
JOSEPH MARTELLA, Vice President since March 2022.
Vice President and Head of Product Management of North America Product, BNY Mellon Investment Management since January 2018; Director of Product Research and Analytics of North America Product, BNY Mellon Investment Management from January 2010 to January 2018; and Senior Vice President of North America Product, BNY Mellon Investment Management since 2010. He is an officer of 54 investment companies (comprised of 107 portfolios) managed by the Adviser or an affiliate of the Adviser. He is 46 years old and has been an employee of the Distributor since 1999.
GAVIN C. REILLY, Assistant Treasurer since December 2005.
Tax Manager–BNY Mellon Fund Administration. He is an officer of 55 investment companies (comprised of 127 portfolios) managed by the Adviser or an affiliate of the Adviser. He is 54 years old and has been an employee of the Adviser since April 1991.
ROBERT SALVIOLO, Assistant Treasurer since May 2007.
Senior Accounting Manager–BNY Mellon Fund Administration. He is an officer of 55 investment companies (comprised of 127 portfolios) managed by the Adviser or an affiliate of the Adviser. He is 55 years old and has been an employee of the Adviser since June 1989.
ROBERT SVAGNA, Assistant Treasurer since August 2005.
Senior Accounting Manager–BNY Mellon Fund Administration. He is an officer of 55 investment companies (comprised of 127 portfolios) managed by the Adviser or an affiliate of the Adviser. He is 55 years old and has been an employee of the Adviser since November 1990.
JOSEPH W. CONNOLLY, Chief Compliance Officer since October 2004.
Chief Compliance Officer of the BNY Mellon Family of Funds and BNY Mellon Funds Trust since 2004; and Chief Compliance Officer of the Adviser from 2004 until June 2021. He is the Chief Compliance Officer of 54 investment companies (comprised of 112 portfolios) managed by the Adviser. He is 65 years old.
CARIDAD M. CAROSELLA, Anti-Money Laundering Compliance Officer since January 2016.
Anti-Money Laundering Compliance Officer of the BNY Mellon Family of Funds and BNY Mellon Funds Trust. She is an officer of 48 investment companies (comprised of 120 portfolios) managed by the Adviser or an affiliate of the Adviser. She is 54 years old and has been an employee of the Distributor since 1997.
54
This page intentionally left blank.
55
This page intentionally left blank.
56
This page intentionally left blank.
57
BNY Mellon Select Managers Small Cap Value Fund
240 Greenwich Street
New York, NY 10286
Adviser
BNY Mellon Investment Adviser, Inc.
240 Greenwich Street
New York, NY 10286
Sub-Advisers
Denali Advisors, LLC5075 Shoreham Place, Suite #120San Diego, CA 92122
Neuberger Berman Investment Advisers, LLC
605 Third Avenue
New York, NY 10158
Channing Capital Management, LLC
10 South LaSalle Street
Suite 2401
Chicago, IL 60633
Eastern Shore Capital Management
18 Sewall Street
Marblehead, MA 01945
Heartland Advisors, Inc.
790 North Water Street, Suite 1200
Milwaukee, WI 53202
Custodian
The Bank of New York Mellon
240 Greenwich Street
New York, NY 10286
Transfer Agent &
Dividend Disbursing Agent
BNY Mellon Transfer, Inc.
240 Greenwich Street
New York, NY 10286
Distributor
BNY Mellon Securities Corporation
240 Greenwich Street
New York, NY 10286
Ticker Symbols: | Class A: DMVAX Class C: DMECX Class I: DMVIX Class Y: DMVYX |
Telephone Call your financial representative or 1-800-373-9387
Mail The BNY Mellon Family of Funds, 144 Glenn Curtiss Boulevard, Uniondale, NY 11556-0144
E-mail Send your request to info@bnymellon.com
Internet Information can be viewed online or downloaded at www.im.bnymellon.com
The fund files its complete schedule of portfolio holdings with the Securities and Exchange Commission (“SEC”) for the first and third quarters of each fiscal year on Form N-PORT. The fund’s Forms N-PORT are available on the SEC’s website at www.sec.gov.
A description of the policies and procedures that the fund uses to determine how to vote proxies relating to portfolio securities and information regarding how the fund voted these proxies for the most recent 12-month period ended June 30 is available at www.im.bnymellon.com and on the SEC’s website at www.sec.gov and without charge, upon request, by calling 1-800-373-9387.
© 2023 BNY Mellon Securities Corporation |
|

BNY Mellon U.S. Equity Fund
ANNUAL REPORT November 30, 2022 |
|

Save time. Save paper. View your next shareholder report online as soon as it’s available. Log into www.im.bnymellon.com and sign up for eCommunications. It’s simple and only takes a few minutes. |
The views expressed in this report reflect those of the portfolio manager(s) only through the end of the period covered and do not necessarily represent the views of BNY Mellon Investment Adviser, Inc. or any other person in the BNY Mellon Investment Adviser, Inc. organization. Any such views are subject to change at any time based upon market or other conditions and BNY Mellon Investment Adviser, Inc. disclaims any responsibility to update such views. These views may not be relied on as investment advice and, because investment decisions for a fund in the BNY Mellon Family of Funds are based on numerous factors, may not be relied on as an indication of trading intent on behalf of any fund in the BNY Mellon Family of Funds. |
Not FDIC-Insured • Not Bank-Guaranteed • May Lose Value |
Contents
THE FUND
Information About the Renewal of | |
FOR MORE INFORMATION
Back Cover
DISCUSSION OF FUND PERFORMANCE (Unaudited)
For the period from December 1, 2021, through November 30, 2022, as provided by Charlie Macquaker, Roy Leckie, Jane Henderson, Fraser Fox and Maxim Skorniakov, members of the Investment Executive group at Walter Scott & Partners Limited (Walter Scott), sub-adviser.
Market and Fund Performance Overview
For the 12-month period ended November 30, 2022, the BNY Mellon U.S. Equity Fund (the “fund”) Class A shares achieved a return of −12.50%, Class C shares returned −13.12%, Class I shares returned −12.19% and Class Y shares returned −12.18%.1 In comparison, the fund’s benchmark, the MSCI USA Index (the “Index”), achieved a return of −11.47% over the same period.2
U.S. stocks lost ground during the reporting period under pressure from increasing inflation, slowing economic growth and uncertainties related to Russia’s invasion of Ukraine. The fund underperformed the Index largely due to the fund’s tilt in favor of growth at a time when markets favored value-oriented stocks over their growth-oriented counterparts.
The Fund’s Investment Approach
The fund seeks long-term total return. To pursue its goal, the fund normally invests at least 80% of its net assets, plus any borrowings for investment purposes, in equity securities of companies located in the United States. The fund may invest in the securities of companies of any market capitalization. Walter Scott seeks investment opportunities in companies with fundamental strengths that indicate the potential for sustainable growth. Walter Scott focuses on individual stock selection, building the fund’s portfolio from the bottom up through extensive fundamental research. The investment process begins with the screening of reported company financials. Companies that meet certain broad, absolute and trend criteria are candidates for more detailed financial analysis. The fund’s Investment Team collectively reviews and selects those stocks that meet Walter Scott’s criteria, and where the expected growth rate is combined with a reasonable valuation for the underlying equity. Market capitalization and sector allocations are a residual of, not part of, the investment process, because the Investment Team’s sole focus is on the analysis of, and investment in, individual companies.
Inflation-Driven Rate Increases Pressure Markets
Shifting global monetary policy weighed on U.S. equities from the start of the reporting period, with stretched valuations a cause for concern in the face of hawkish rhetoric from the U.S. Federal Reserve (the “Fed”). Inflationary forces were exacerbated by the Russian invasion of Ukraine in early 2022. As the largest land war in Europe since World War II continued with no sign of an early resolution, European markets began contemplating the possibility of reduced or curtailed oil and natural gas exports from Russia, a leading source of energy commodities to the continent. Energy costs, already at elevated levels, spiked higher, along with prices of crucial agricultural chemicals and industrial metals. COVID-19-related lockdowns in China snarled global supply lines,
2
creating product shortages and leading to still higher prices. The Fed responded to mounting inflationary pressures with its most aggressive series of interest-rate increases in decades, raising the specter of a possible recession, which put further downward pressure on equity markets, particularly richly valued, growth-oriented shares in the information technology and consumer discretionary sectors.
U.S. equities moved higher in October and November 2022, as investors considered signs that the Fed’s monetary policies were slowing parts of the economy. While less hawkish headlines regarding further planned interest-rate increases bolstered markets, the risk of recession remained a real concern. For the period as a whole, stocks in energy producers gained the most ground, while consumer staples, utilities and health care performed relatively well compared to other, non-energy-related sectors. Growth-oriented shares suffered the sharpest declines as investors questioned the pace of future growth and the relative value of future earnings. Consumer discretionary, information technology and real estate stocks experienced the most significant declines.
The Fund’s Bias Toward Growth Detracts
The market’s shift from favoring growth-oriented shares with high p/e (price/earnings) multiples to favoring value-oriented shares with lower p/e multiples raised significant headwinds for the fund, which held a large proportion of positions in richly valued companies with growth characteristics. The three most significant detractors from relative returns included digital document company Adobe, sports apparel maker NIKE and internet advertising company Alphabet, all of which were hurt by the market’s rotation from growth toward value. Adobe, which had seen robust growth during the height of the pandemic as users depended on its products while working from home, faced a more challenging environment as more employees began moving back to the office. NIKE suffered from slowing sales in China, where pandemic-related lockdowns deterred shoppers, as well as slowing global economic growth. Shares in Alphabet, the parent company of internet advertising giant Google, traded lower despite strong underlying company fundamentals as the market broadly discounted growth-oriented stocks and grew wary of the possible impact of slowing economic growth on the company’s advertising revenue.
On a more positive note, several holdings contributed positively to the fund’s returns relative to the Index. Among the most notable, shares in pharmaceutical firm Eli Lilly & Co. gained ground on the company’s solid earnings, as well as progress in its development of diabetes and obesity treatment Mounjaro, which performed well in clinical trials and was approved in May by the U.S. Food and Drug Administration. Shares in automobile parts maker O’Reilly Auto Parts benefited from attractive valuations, effective cost controls and positive sales trends on both the direct-to-consumer and professional sides of the company’s business. Finally, shares in off-price clothing retailer The TJX Companies performed well as increasingly price-conscious consumers turned to discounters in the face of rising expenses.
3
DISCUSSION OF FUND PERFORMANCE (Unaudited) (continued)
Remaining Focused on High-Quality Companies with Strong Fundamentals
Over the shorter term, we believe asset prices are likely to remain volatile as the Fed struggles to constrain inflationary pressures, with the possibility of a recession still on the horizon. While many companies have effectively controlled costs and continued to report reasonably strong earnings despite those pressures, we expect businesses to face increasing difficulties in meeting financial expectations if interest rates continue to rise while economic growth falters. We believe the fund’s holdings are relatively well positioned to outperform in the face of prevailing market uncertainties due to their high-quality, defensive characteristics and solid fundamentals, which enable them to operate effectively in varying economic environments.
December 15, 2022
1 Total return includes reinvestment of dividends and any capital gains paid and does not take into consideration the maximum initial sales charge in the case of Class A shares, or the applicable contingent deferred sales charge imposed on redemptions in the case of Class C shares. Share price and investment return fluctuate such that upon redemption, fund shares may be worth more or less than their original cost. The fund’s return reflects the absorption of certain fund expenses by BNY Mellon Investment Adviser, Inc. pursuant to an agreement in effect through March 31, 2023, at which time it may be extended, modified or terminated. Had these expenses not been absorbed, returns would have been lower. Past performance is no guarantee of future results.
2 Source: Lipper Inc. — The MSCI USA Index is designed to measure the performance of the large- and mid-cap segments of the U.S. market. It reflects reinvestment of net dividends and, where applicable, capital gain distributions. Investors cannot invest directly in any index.
Equities are subject generally to market, market sector, market liquidity, issuer and investment style risks, among other factors, to varying degrees, all of which are more fully described in the fund’s prospectus.
Small and midsized company stocks tend to be more volatile and less liquid than larger company stocks as these companies are less established and have more volatile earnings histories.
Recent market risks include pandemic risks related to COVID-19. The effects of COVID-19 have contributed to increased volatility in global markets and will likely affect certain countries, companies, industries and market sectors more dramatically than others. To the extent the fund may overweight its investments in certain countries, companies, industries or market sectors, such positions will increase the fund’s exposure to risk of loss from adverse developments affecting those countries, companies, industries or sectors.
4
FUND PERFORMANCE (Unaudited)

Comparison of change in value of a $10,000 investment in Class A shares, Class C shares and Class I shares of BNY Mellon U.S. Equity Fund with a hypothetical investment of $10,000 in the MSCI USA Index (the “Index”).
† Source: Lipper Inc.
Past performance is not predictive of future performance.
The above graph compares a hypothetical $10,000 investment made in each of the Class A shares, Class C shares and Class I shares of BNY Mellon U.S. Equity Fund on 11/30/12 to a hypothetical investment of $10,000 made in the Index on that date. All dividends and capital gain distributions are reinvested.
The fund’s performance shown in the line graph above takes into account the maximum initial sales charge on Class A shares and all other applicable fees and expenses on all classes. The Index is designed to measure the performance of the large- and mid-cap segments of the U.S. market. Unlike a mutual fund, the Index is not subject to charges, fees and other expenses. Investors cannot invest directly in any index. Further information relating to fund performance, including expense reimbursements, if applicable, is contained in the Financial Highlights section of the prospectus and elsewhere in this report.
5
FUND PERFORMANCE (Unaudited) (continued)

Comparison of change in value of a $1,000,000 investment in Class Y shares of BNY Mellon U.S. Equity Fund with a hypothetical investment of $1,000,000 in the MSCI USA Index (the “Index”).
† Source: Lipper Inc.
†† The total return figures presented for Class Y shares of the fund reflect the performance of the fund’s Class A shares for the period prior to 7/1/13 (the inception date for Class Y shares), not reflecting the applicable sales charges for Class A shares.
Past performance is not predictive of future performance.
The above graph compares a hypothetical $1,000,000 investment made in Class Y shares of BNY Mellon U.S. Equity Fund on 11/30/12 to a hypothetical investment of $1,000,000 made in the Index on that date. All dividends and capital gain distributions are reinvested.
The fund’s performance shown in the line graph above takes into account all other applicable fees and expenses of the fund’s Class Y shares. The Index is designed to measure the performance of the large- and mid-cap segments of the U.S. market. Unlike a mutual fund, the Index is not subject to charges, fees and other expenses. Investors cannot invest directly in any index. Further information relating to fund performance, including expense reimbursements, if applicable, is contained in the Financial Highlights section of the prospectus and elsewhere in this report.
6
Average Annual Total Returns as of 11/30/2022 | ||||
| Inception Date | 1 Year | 5 Years | 10 Years |
Class A shares | ||||
with maximum sales charge (5.75 %) | 5/30/08 | -17.52% | 7.71% | 10.24% |
without sales charge | 5/30/08 | -12.50% | 8.99% | 10.89% |
Class C shares | ||||
with applicable redemption charge† | 5/30/08 | -13.87% | 8.18% | 10.05% |
without redemption | 5/30/08 | -13.12% | 8.18% | 10.05% |
Class I shares | 5/30/08 | -12.19% | 9.36% | 11.27% |
Class Y shares | 7/1/13 | -12.18% | 9.37% | 11.29%†† |
MSCI USA Index | -11.47% | 10.31% | 12.60% | |
† The maximum contingent deferred sales charge for Class C shares is 1% for shares redeemed within one year of the date of purchase.
†† The total return performance figures presented for Class Y shares of the fund reflect the performance of the fund’s Class A shares for the period prior to 7/1/13 (the inception date for Class Y shares), not reflecting the applicable sales charges for Class A shares.
The performance data quoted represents past performance, which is no guarantee of future results. Share price and investment return fluctuate and an investor’s shares may be worth more or less than original cost upon redemption. Current performance may be lower or higher than the performance quoted. Go to www.im.bnymellon.com for the fund’s most recent month-end returns.
The fund’s performance shown in the graphs and table does not reflect the deduction of taxes that a shareholder would pay on fund distributions or the redemption of fund shares. In addition to the performance of Class A shares shown with and without a maximum sales charge, the fund’s performance shown in the table takes into account all other applicable fees and expenses on all classes.
7
UNDERSTANDING YOUR FUND’S EXPENSES (Unaudited)
As a mutual fund investor, you pay ongoing expenses, such as management fees and other expenses. Using the information below, you can estimate how these expenses affect your investment and compare them with the expenses of other funds. You also may pay one-time transaction expenses, including sales charges (loads) and redemption fees, which are not shown in this section and would have resulted in higher total expenses. For more information, see your fund’s prospectus or talk to your financial adviser.
Review your fund’s expenses
The table below shows the expenses you would have paid on a $1,000 investment in BNY Mellon U.S. Equity Fund from June 1, 2022 to November 30, 2022. It also shows how much a $1,000 investment would be worth at the close of the period, assuming actual returns and expenses.
Expenses and Value of a $1,000 Investment |
| |||||
Assume actual returns for the six months ended November 30, 2022 |
| |||||
|
|
|
|
|
|
|
|
| Class A | Class C | Class I | Class Y |
|
Expenses paid per $1,000† | $5.82 | $9.60 | $4.20 | $4.10 |
| |
Ending value (after expenses) | $1,018.40 | $1,015.00 | $1,020.10 | $1,020.10 |
| |
COMPARING YOUR FUND’S EXPENSES WITH THOSE OF OTHER FUNDS (Unaudited)
Using the SEC’s method to compare expenses
The Securities and Exchange Commission (“SEC”) has established guidelines to help investors assess fund expenses. Per these guidelines, the table below shows your fund’s expenses based on a $1,000 investment, assuming a hypothetical 5% annualized return. You can use this information to compare the ongoing expenses (but not transaction expenses or total cost) of investing in the fund with those of other funds. All mutual fund shareholder reports will provide this information to help you make this comparison. Please note that you cannot use this information to estimate your actual ending account balance and expenses paid during the period.
Expenses and Value of a $1,000 Investment |
| |||||
Assuming a hypothetical 5% annualized return for the six months ended November 30, 2022 |
| |||||
|
|
|
|
|
|
|
|
| Class A | Class C | Class I | Class Y |
|
Expenses paid per $1,000† | $5.82 | $9.60 | $4.20 | $4.10 |
| |
Ending value (after expenses) | $1,019.30 | $1,015.54 | $1,020.91 | $1,021.01 |
| |
† | Expenses are equal to the fund’s annualized expense ratio of 1.15% for Class A, 1.90% for Class C, .83% for Class I and .81% for Class Y, multiplied by the average account value over the period, multiplied by 183/365 (to reflect the one-half year period). | |||||
8
STATEMENT OF INVESTMENTS
November 30, 2022
Description | Shares | Value ($) | |||||
Common Stocks - 99.9% | |||||||
Capital Goods - 6.1% | |||||||
Fastenal Co. | 190,700 | 9,822,957 | |||||
Hexcel Corp. | 158,800 | 9,520,060 | |||||
The Toro Company | 82,700 | 9,178,873 | |||||
28,521,890 | |||||||
Commercial & Professional Services - 2.4% | |||||||
Copart Inc. | 171,800 | a | 11,435,008 | ||||
Consumer Durables & Apparel - 2.5% | |||||||
NIKE Inc., Cl. B | 105,700 | 11,594,233 | |||||
Consumer Services - 4.1% | |||||||
Booking Holdings Inc. | 4,900 | a | 10,189,305 | ||||
McDonald's Corp. | 34,100 | 9,302,139 | |||||
19,491,444 | |||||||
Diversified Financials - 2.0% | |||||||
Moody's Corp. | 31,900 | 9,514,813 | |||||
Food & Staples Retailing - 2.2% | |||||||
Costco Wholesale Corp. | 19,500 | 10,515,375 | |||||
Health Care Equipment & Services - 9.6% | |||||||
Align Technology Inc. | 13,000 | a | 2,556,581 | ||||
Edwards Lifesciences Corp. | 118,600 | a | 9,161,850 | ||||
Intuitive Surgical Inc. | 49,600 | a | 13,411,344 | ||||
ResMed Inc. | 47,500 | 10,934,500 | |||||
Stryker Corp. | 38,900 | 9,098,321 | |||||
45,162,596 | |||||||
Household & Personal Products - 2.5% | |||||||
Colgate-Palmolive Co. | 23,840 | 1,847,123 | |||||
The Estee Lauder Companies, Cl. A | 42,900 | 10,115,391 | |||||
11,962,514 | |||||||
Materials - 6.0% | |||||||
Ecolab Inc. | 62,100 | 9,304,443 | |||||
FMC Corp. | 73,400 | 9,588,976 | |||||
Linde PLC | 27,600 | 9,286,848 | |||||
28,180,267 | |||||||
Media & Entertainment - 6.5% | |||||||
Alphabet Inc., Cl. C | 187,820 | a | 19,054,339 | ||||
Netflix Inc. | 12,100 | a | 3,696,913 | ||||
The Walt Disney Company | 80,300 | a | 7,858,961 | ||||
30,610,213 | |||||||
Pharmaceuticals Biotechnology & Life Sciences - 11.8% | |||||||
Eli Lilly & Co. | 29,300 | 10,872,644 | |||||
Illumina Inc. | 22,600 | a | 4,928,608 | ||||
Johnson & Johnson | 58,300 | 10,377,400 | |||||
9
STATEMENT OF INVESTMENTS (continued)
Description | Shares | Value ($) | |||||
Common Stocks - 99.9% (continued) | |||||||
Pharmaceuticals Biotechnology & Life Sciences - 11.8% (continued) | |||||||
Mettler-Toledo International Inc. | 6,400 | a | 9,405,184 | ||||
Waters Corp. | 30,900 | a | 10,709,940 | ||||
West Pharmaceutical Services Inc. | 39,700 | 9,316,002 | |||||
55,609,778 | |||||||
Retailing - 6.1% | |||||||
Dollar General Corp. | 36,700 | 9,383,456 | |||||
O'Reilly Automotive Inc. | 10,900 | a | 9,423,486 | ||||
The TJX Companies | 120,300 | 9,630,015 | |||||
28,436,957 | |||||||
Semiconductors & Semiconductor Equipment - 2.7% | |||||||
Texas Instruments Inc. | 70,700 | 12,758,522 | |||||
Software & Services - 24.1% | |||||||
Adobe Inc. | 35,200 | a | 12,141,536 | ||||
Ansys Inc. | 43,400 | a | 11,036,620 | ||||
Automatic Data Processing Inc. | 31,000 | 8,188,340 | |||||
Cognizant Technology Solutions Corp., Cl. A | 150,800 | 9,381,268 | |||||
Fortinet Inc. | 111,500 | a | 5,927,340 | ||||
Jack Henry & Associates Inc. | 49,800 | 9,429,630 | |||||
Manhattan Associates Inc. | 61,900 | a | 7,795,686 | ||||
Mastercard Inc., Cl. A | 44,600 | 15,895,440 | |||||
Microsoft Corp. | 81,000 | 20,666,340 | |||||
Paychex Inc. | 63,200 | 7,838,696 | |||||
PayPal Holdings Inc. | 62,000 | a | 4,861,420 | ||||
113,162,316 | |||||||
Technology Hardware & Equipment - 9.0% | |||||||
Amphenol Corp., Cl. A | 137,700 | 11,075,211 | |||||
Cisco Systems Inc. | 193,800 | 9,635,736 | |||||
Cognex Corp. | 207,900 | 10,349,262 | |||||
IPG Photonics Corp. | 56,800 | a | 5,170,504 | ||||
TE Connectivity Ltd. | 47,900 | 6,041,148 | |||||
42,271,861 | |||||||
Transportation - 2.3% | |||||||
Old Dominion Freight Line Inc. | 35,500 | 10,742,655 | |||||
Total Common Stocks (cost $236,946,429) | 469,970,442 | ||||||
10
Description | 1-Day | Shares | Value ($) | ||||
Investment Companies - .0% | |||||||
Registered Investment Companies - .0% | |||||||
Dreyfus Institutional Preferred Government Plus Money Market Fund, Institutional Shares | 3.94 | 12,802 | b | 12,802 | |||
Total Investments (cost $236,959,231) | 99.9% | 469,983,244 | |||||
Cash and Receivables (Net) | .1% | 408,149 | |||||
Net Assets | 100.0% | 470,391,393 | |||||
a Non-income producing security.
b Investment in affiliated issuer. The investment objective of this investment company is publicly available and can be found within the investment company’s prospectus.
Portfolio Summary (Unaudited) † | Value (%) |
Information Technology | 35.8 |
Health Care | 21.4 |
Consumer Discretionary | 12.6 |
Industrials | 10.8 |
Communication Services | 6.5 |
Materials | 6.0 |
Consumer Staples | 4.8 |
Financials | 2.0 |
Investment Companies | .0 |
99.9 |
† Based on net assets.
See notes to financial statements.
Affiliated Issuers | ||||||
Description | Value ($) 11/30/2021 | Purchases ($)† | Sales ($) | Value ($) 11/30/2022 | Dividends/ | |
Registered Investment Companies - .0% | ||||||
Dreyfus Institutional Preferred Government Plus Money Market Fund, Institutional Shares - .0% | 19,343,291 | 147,008,475 | (166,338,964) | 12,802 | 86,973 | |
† Includes reinvested dividends/distributions.
See notes to financial statements.
11
STATEMENT OF ASSETS AND LIABILITIES
November 30, 2022
|
|
|
|
|
|
|
|
|
| Cost |
| Value |
|
Assets ($): |
|
|
|
| ||
Investments in securities—See Statement of Investments |
|
|
| |||
Unaffiliated issuers | 236,946,429 |
| 469,970,442 |
| ||
Affiliated issuers |
| 12,802 |
| 12,802 |
| |
Receivable for investment securities sold |
| 13,274,452 |
| |||
Dividends receivable |
| 415,205 |
| |||
Receivable for shares of Common Stock subscribed |
| 85,799 |
| |||
Prepaid expenses |
|
|
|
| 60,714 |
|
|
|
|
|
| 483,819,414 |
|
Liabilities ($): |
|
|
|
| ||
Due to BNY Mellon Investment Adviser, Inc. and affiliates—Note 3(c) |
| 316,769 |
| |||
Note payable—Note 2 |
| 6,800,000 |
| |||
Payable for shares of Common Stock redeemed |
| 6,215,996 |
| |||
Directors’ fees and expenses payable |
| 8,909 |
| |||
Interest payable—Note 2 |
| 6,363 |
| |||
Other accrued expenses |
|
|
|
| 79,984 |
|
|
|
|
|
| 13,428,021 |
|
Net Assets ($) |
|
| 470,391,393 |
| ||
Composition of Net Assets ($): |
|
|
|
| ||
Paid-in capital |
|
|
|
| 137,234,069 |
|
Total distributable earnings (loss) |
|
|
|
| 333,157,324 |
|
Net Assets ($) |
|
| 470,391,393 |
| ||
Net Asset Value Per Share | Class A | Class C | Class I | Class Y |
|
Net Assets ($) | 1,638,906 | 10,195 | 24,226,557 | 444,515,735 |
|
Shares Outstanding | 74,137 | 518.67 | 1,084,621 | 19,916,585 |
|
Net Asset Value Per Share ($) | 22.11 | 19.66 | 22.34 | 22.32 |
|
|
|
|
|
|
|
See notes to financial statements. |
|
|
|
|
|
12
STATEMENT OF OPERATIONS
Year Ended November 30, 2022
|
|
|
|
|
|
|
|
|
|
|
|
|
|
Investment Income ($): |
|
|
|
| ||
Income: |
|
|
|
| ||
Cash dividends: |
| |||||
Unaffiliated issuers |
|
| 5,184,426 |
| ||
Affiliated issuers |
|
| 86,973 |
| ||
Income from securities lending—Note 1(b) |
|
| 310 |
| ||
Total Income |
|
| 5,271,709 |
| ||
Expenses: |
|
|
|
| ||
Management fee—Note 3(a) |
|
| 4,288,640 |
| ||
Professional fees |
|
| 89,933 |
| ||
Registration fees |
|
| 65,079 |
| ||
Directors’ fees and expenses—Note 3(d) |
|
| 52,599 |
| ||
Chief Compliance Officer fees—Note 3(c) |
|
| 17,027 |
| ||
Shareholder servicing costs—Note 3(c) |
|
| 15,567 |
| ||
Prospectus and shareholders’ reports |
|
| 13,396 |
| ||
Custodian fees—Note 3(c) |
|
| 11,431 |
| ||
Loan commitment fees—Note 2 |
|
| 9,490 |
| ||
Interest expense—Note 2 |
|
| 6,703 |
| ||
Distribution fees—Note 3(b) |
|
| 161 |
| ||
Miscellaneous |
|
| 29,003 |
| ||
Total Expenses |
|
| 4,599,029 |
| ||
Less—reduction in expenses due to undertaking—Note 3(a) |
|
| (777) |
| ||
Less—reduction in fees due to earnings credits—Note 3(c) |
|
| (111) |
| ||
Net Expenses |
|
| 4,598,141 |
| ||
Net Investment Income |
|
| 673,568 |
| ||
Realized and Unrealized Gain (Loss) on Investments—Note 4 ($): |
|
| ||||
Net realized gain (loss) on investments | 124,845,371 |
| ||||
Net change in unrealized appreciation (depreciation) on investments | (206,244,903) |
| ||||
Net Realized and Unrealized Gain (Loss) on Investments |
|
| (81,399,532) |
| ||
Net (Decrease) in Net Assets Resulting from Operations |
| (80,725,964) |
| |||
|
|
|
|
|
|
|
See notes to financial statements. | ||||||
13
STATEMENT OF CHANGES IN NET ASSETS
|
|
|
| Year Ended November 30, | |||||
|
|
|
| 2022 |
| 2021 |
| ||
Operations ($): |
|
|
|
|
|
|
|
| |
Net investment income |
|
| 673,568 |
|
|
| 1,163,910 |
| |
Net realized gain (loss) on investments |
| 124,845,371 |
|
|
| 98,997,094 |
| ||
Net change in unrealized appreciation |
| (206,244,903) |
|
|
| 53,493,541 |
| ||
Net Increase (Decrease) in Net Assets | (80,725,964) |
|
|
| 153,654,545 |
| |||
Distributions ($): |
| ||||||||
Distributions to shareholders: |
|
|
|
|
|
|
|
| |
Class A |
|
| (257,595) |
|
|
| (23,045) |
| |
Class C |
|
| (4,667) |
|
|
| (1,102) |
| |
Class I |
|
| (4,396,588) |
|
|
| (342,545) |
| |
Class Y |
|
| (86,574,572) |
|
|
| (10,227,644) |
| |
Total Distributions |
|
| (91,233,422) |
|
|
| (10,594,336) |
| |
Capital Stock Transactions ($): |
| ||||||||
Net proceeds from shares sold: |
|
|
|
|
|
|
|
| |
Class A |
|
| 272,114 |
|
|
| 546,801 |
| |
Class C |
|
| - |
|
|
| 4,230 |
| |
Class I |
|
| 14,958,564 |
|
|
| 12,235,825 |
| |
Class Y |
|
| 65,687,656 |
|
|
| 43,529,935 |
| |
Distributions reinvested: |
|
|
|
|
|
|
|
| |
Class A |
|
| 232,055 |
|
|
| 17,543 |
| |
Class C |
|
| 2,840 |
|
|
| 973 |
| |
Class I |
|
| 3,476,970 |
|
|
| 294,756 |
| |
Class Y |
|
| 38,736,237 |
|
|
| 4,006,640 |
| |
Cost of shares redeemed: |
|
|
|
|
|
|
|
| |
Class A |
|
| (434,621) |
|
|
| (568,630) |
| |
Class C |
|
| (16,464) |
|
|
| (85,765) |
| |
Class I |
|
| (19,666,201) |
|
|
| (7,923,388) |
| |
Class Y |
|
| (213,592,453) |
|
|
| (194,178,207) |
| |
Increase (Decrease) in Net Assets | (110,343,303) |
|
|
| (142,119,287) |
| |||
Total Increase (Decrease) in Net Assets | (282,302,689) |
|
|
| 940,922 |
| |||
Net Assets ($): |
| ||||||||
Beginning of Period |
|
| 752,694,082 |
|
|
| 751,753,160 |
| |
End of Period |
|
| 470,391,393 |
|
|
| 752,694,082 |
| |
14
|
|
|
| Year Ended November 30, | |||||
|
|
|
| 2022 |
| 2021 |
| ||
Capital Share Transactions (Shares): |
| ||||||||
Class Aa |
|
|
|
|
|
|
|
| |
Shares sold |
|
| 11,441 |
|
|
| 21,659 |
| |
Shares issued for distributions reinvested |
|
| 8,864 |
|
|
| 730 |
| |
Shares redeemed |
|
| (18,629) |
|
|
| (22,345) |
| |
Net Increase (Decrease) in Shares Outstanding | 1,676 |
|
|
| 44 |
| |||
Class C |
|
|
|
|
|
|
|
| |
Shares sold |
|
| - |
|
|
| 191 |
| |
Shares issued for distributions reinvested |
|
| 121 |
|
|
| 45 |
| |
Shares redeemed |
|
| (910) |
|
|
| (3,870) |
| |
Net Increase (Decrease) in Shares Outstanding | (789) |
|
|
| (3,634) |
| |||
Class Ia |
|
|
|
|
|
|
|
| |
Shares sold |
|
| 622,732 |
|
|
| 451,615 |
| |
Shares issued for distributions reinvested |
|
| 132,097 |
|
|
| 12,254 |
| |
Shares redeemed |
|
| (861,065) |
|
|
| (299,075) |
| |
Net Increase (Decrease) in Shares Outstanding | (106,236) |
|
|
| 164,794 |
| |||
Class Ya |
|
|
|
|
|
|
|
| |
Shares sold |
|
| 3,051,454 |
|
|
| 1,652,859 |
| |
Shares issued for distributions reinvested |
|
| 1,470,926 |
|
|
| 166,721 |
| |
Shares redeemed |
|
| (9,381,933) |
|
|
| (7,434,078) |
| |
Net Increase (Decrease) in Shares Outstanding | (4,859,553) |
|
|
| (5,614,498) |
| |||
|
|
|
|
|
|
|
|
|
|
a | During the period ended November 30, 2022, 585,474 Class Y shares representing $14,126,479 were exchanged for 584,953 Class I shares and 6,365 Class Y shares representing $159,598 were exchanged for 6,409 Class A shares. During the period ended November 30, 2021, 404,317 Class Y shares representing $10,902,873 were exchanged for 404,000 Class I shares. | ||||||||
See notes to financial statements. | |||||||||
15
FINANCIAL HIGHLIGHTS
The following tables describe the performance for each share class for the fiscal periods indicated. All information (except portfolio turnover rate) reflects financial results for a single fund share. Net asset value total return is calculated assuming an initial investment made at the net asset value at the beginning of the period, reinvestment of all dividends and distributions at net asset value during the period, and redemption at net asset value on the last day of the period. Net asset value total return includes adjustments in accordance with accounting principles generally accepted in the United States of America and as such, the net asset value for financial reporting purposes and the returns based upon those net asset values may differ from the net asset value and returns for shareholder transactions. These figures have been derived from the fund’s financial statements.
Year Ended November 30, | ||||||
Class A Shares | 2022 | 2021 | 2020 | 2019 | 2018 | |
Per Share Data ($): | ||||||
Net asset value, beginning of period | 28.74 | 23.75 | 20.85 | 20.44 | 20.85 | |
Investment Operations: | ||||||
Net investment income (loss)a | (.05) | (.05) | .00b | .04 | .03 | |
Net realized and unrealized | (3.06) | 5.32 | 3.16 | 2.30 | 1.77 | |
Total from Investment Operations | (3.11) | 5.27 | 3.16 | 2.34 | 1.80 | |
Distributions: | ||||||
Dividends from net | - | (.03) | (.07) | (.03) | (.04) | |
Dividends from net realized | (3.52) | (.25) | (.19) | (1.90) | (2.17) | |
Total Distributions | (3.52) | (.28) | (.26) | (1.93) | (2.21) | |
Net asset value, end of period | 22.11 | 28.74 | 23.75 | 20.85 | 20.44 | |
Total Return (%)c | (12.50) | 22.41 | 15.28 | 13.77 | 9.49 | |
Ratios/Supplemental Data (%): | ||||||
Ratio of total expenses | 1.19 | 1.15 | 1.17 | 1.20 | 1.25 | |
Ratio of net expenses | 1.15 | 1.15 | 1.15 | 1.15 | 1.15 | |
Ratio of net investment income (loss) | (.23) | (.20) | .02 | .20 | .17 | |
Portfolio Turnover Rate | 10.61 | 10.70 | 11.94 | 14.11 | 17.14 | |
Net Assets, end of period ($ x 1,000) | 1,639 | 2,082 | 1,720 | 1,540 | 787 | |
a Based on average shares outstanding.
b Amount represents less than $.01 per share.
c Exclusive of sales charge.
See notes to financial statements.
16
Year Ended November 30, | ||||||
Class C Shares | 2022 | 2021 | 2020 | 2019 | 2018 | |
Per Share Data ($): | ||||||
Net asset value, beginning of period | 26.10 | 21.74 | 19.18 | 19.07 | 19.70 | |
Investment Operations: | ||||||
Net investment (loss)a | (.22) | (.19) | (.14) | (.10) | (.11) | |
Net realized and unrealized | (2.70) | 4.80 | 2.89 | 2.11 | 1.65 | |
Total from Investment Operations | (2.92) | 4.61 | 2.75 | 2.01 | 1.54 | |
Distributions: | ||||||
Dividends from net realized | (3.52) | (.25) | (.19) | (1.90) | (2.17) | |
Net asset value, end of period | 19.66 | 26.10 | 21.74 | 19.18 | 19.07 | |
Total Return (%)b | (13.12) | 21.42 | 14.44 | 12.92 | 8.69 | |
Ratios/Supplemental Data (%): | ||||||
Ratio of total expenses | 2.40 | 2.34 | 2.35 | 2.40 | 2.35 | |
Ratio of net expenses | 1.90 | 1.90 | 1.90 | 1.90 | 1.90 | |
Ratio of net investment (loss) | (1.01) | (.81) | (.72) | (.56) | (.57) | |
Portfolio Turnover Rate | 10.61 | 10.70 | 11.94 | 14.11 | 17.14 | |
Net Assets, end of period ($ x 1,000) | 10 | 34 | 107 | 121 | 86 | |
a Based on average shares outstanding.
b Exclusive of sales charge.
See notes to financial statements.
17
FINANCIAL HIGHLIGHTS (continued)
Year Ended November 30, | ||||||
Class I Shares | 2022 | 2021 | 2020 | 2019 | 2018 | |
Per Share Data ($): | ||||||
Net asset value, beginning of period | 28.92 | 23.89 | 20.94 | 20.54 | 20.96 | |
Investment Operations: | ||||||
Net investment incomea | .02 | .03 | .08 | .10 | .10 | |
Net realized and unrealized | (3.07) | 5.34 | 3.17 | 2.31 | 1.77 | |
Total from Investment Operations | (3.05) | 5.37 | 3.25 | 2.41 | 1.87 | |
Distributions: | ||||||
Dividends from net | (.01) | (.09) | (.11) | (.11) | (.12) | |
Dividends from net realized | (3.52) | (.25) | (.19) | (1.90) | (2.17) | |
Total Distributions | (3.53) | (.34) | (.30) | (2.01) | (2.29) | |
Net asset value, end of period | 22.34 | 28.92 | 23.89 | 20.94 | 20.54 | |
Total Return (%) | (12.19) | 22.75 | 15.71 | 14.17 | 9.85 | |
Ratios/Supplemental Data (%): | ||||||
Ratio of total expenses | .83 | .81 | .82 | .82 | .82 | |
Ratio of net expenses | .83 | .81 | .82 | .82 | .82 | |
Ratio of net investment income | .09 | .12 | .36 | .53 | .51 | |
Portfolio Turnover Rate | 10.61 | 10.70 | 11.94 | 14.11 | 17.14 | |
Net Assets, end of period ($ x 1,000) | 24,227 | 34,445 | 24,508 | 26,577 | 22,755 | |
a Based on average shares outstanding.
See notes to financial statements.
18
Year Ended November 30, | ||||||
Class Y Shares | 2022 | 2021 | 2020 | 2019 | 2018 | |
Per Share Data ($): | ||||||
Net asset value, beginning of period | 28.90 | 23.87 | 20.93 | 20.54 | 20.96 | |
Investment Operations: | ||||||
Net investment incomea | .03 | .04 | .08 | .11 | .11 | |
Net realized and unrealized | (3.07) | 5.33 | 3.17 | 2.29 | 1.77 | |
Total from Investment Operations | (3.04) | 5.37 | 3.25 | 2.40 | 1.88 | |
Distributions: | ||||||
Dividends from net | (.02) | (.09) | (.12) | (.11) | (.13) | |
Dividends from net realized | (3.52) | (.25) | (.19) | (1.90) | (2.17) | |
Total Distributions | (3.54) | (.34) | (.31) | (2.01) | (2.30) | |
Net asset value, end of period | 22.32 | 28.90 | 23.87 | 20.93 | 20.54 | |
Total Return (%) | (12.18) | 22.80 | 15.69 | 14.15 | 9.88 | |
Ratios/Supplemental Data (%): | ||||||
Ratio of total expenses | .80 | .79 | .80 | .80 | .80 | |
Ratio of net expenses | .80 | .79 | .80 | .80 | .80 | |
Ratio of net investment income | .12 | .16 | .37 | .55 | .53 | |
Portfolio Turnover Rate | 10.61 | 10.70 | 11.94 | 14.11 | 17.14 | |
Net Assets, end of period ($ x 1,000) | 444,516 | 716,133 | 725,418 | 619,812 | 534,230 | |
a Based on average shares outstanding.
See notes to financial statements.
19
NOTES TO FINANCIAL STATEMENTS
NOTE 1—Significant Accounting Policies:
BNY Mellon U.S. Equity Fund (the “fund”) is a separate diversified series of BNY Mellon Strategic Funds, Inc. (the “Company”), which is registered under the Investment Company Act of 1940, as amended (the “Act”), as an open-end management investment company and operates as a series company currently offering six series, including the fund. The fund’s investment objective is to seek long-term total return. BNY Mellon Investment Adviser, Inc. (the “Adviser”), a wholly-owned subsidiary of The Bank of New York Mellon Corporation (“BNY Mellon”), serves as the fund’s investment adviser. Walter Scott & Partners Limited (the “Sub-Adviser”), a wholly-owned subsidiary of BNY Mellon and an affiliate of the Adviser, serves as the fund’s sub-adviser.
BNY Mellon Securities Corporation (the “Distributor”), a wholly-owned subsidiary of the Adviser, is the distributor of the fund’s shares. The fund is authorized to issue 500 million shares of $.001 par value Common Stock. The fund currently has authorized four classes of shares: Class A (100 million shares authorized), Class C (100 million shares authorized), Class I (100 million shares authorized) and Class Y (200 million shares authorized). Class A and Class C shares are sold primarily to retail investors through financial intermediaries and bear Distribution and/or Shareholder Services Plan fees. Class A shares generally are subject to a sales charge imposed at the time of purchase. Class A shares bought without an initial sales charge as part of an investment of $1 million or more may be charged a contingent deferred sales charge (“CDSC”) of 1.00% if redeemed within one year. Class C shares are subject to a CDSC imposed on Class C shares redeemed within one year of purchase. Class C shares automatically convert to Class A shares eight years after the date of purchase, without the imposition of a sales charge. Class I shares are sold primarily to bank trust departments and other financial service providers (including BNY Mellon and its affiliates), acting on behalf of customers having a qualified trust or an investment account or relationship at such institution, and bear no Distribution or Shareholder Services Plan fees. Class Y shares are sold at net asset value per share generally to institutional investors, and bear no Distribution or Shareholder Services Plan fees. Class I and Class Y shares are offered without a front-end sales charge or CDSC. Other differences between the classes include the services offered to and the expenses borne by each class, the allocation of certain transfer agency costs and certain voting rights. Income, expenses (other than expenses attributable to a specific class), and realized and unrealized gains or losses
20
on investments are allocated to each class of shares based on its relative net assets.
The Company accounts separately for the assets, liabilities and operations of each series. Expenses directly attributable to each series are charged to that series’ operations; expenses which are applicable to all series are allocated among them on a pro rata basis.
The Financial Accounting Standards Board (“FASB”) Accounting Standards Codification (“ASC”) is the exclusive reference of authoritative U.S. generally accepted accounting principles (“GAAP”) recognized by the FASB to be applied by nongovernmental entities. Rules and interpretive releases of the SEC under authority of federal laws are also sources of authoritative GAAP for SEC registrants. The fund is an investment company and applies the accounting and reporting guidance of the FASB ASC Topic 946 Financial Services-Investment Companies. The fund’s financial statements are prepared in accordance with GAAP, which may require the use of management estimates and assumptions. Actual results could differ from those estimates.
The Company enters into contracts that contain a variety of indemnifications. The fund’s maximum exposure under these arrangements is unknown. The fund does not anticipate recognizing any loss related to these arrangements.
(a) Portfolio valuation: The fair value of a financial instrument is the amount that would be received to sell an asset or paid to transfer a liability in an orderly transaction between market participants at the measurement date (i.e., the exit price). GAAP establishes a fair value hierarchy that prioritizes the inputs of valuation techniques used to measure fair value. This hierarchy gives the highest priority to unadjusted quoted prices in active markets for identical assets or liabilities (Level 1 measurements) and the lowest priority to unobservable inputs (Level 3 measurements).
Additionally, GAAP provides guidance on determining whether the volume and activity in a market has decreased significantly and whether such a decrease in activity results in transactions that are not orderly. GAAP requires enhanced disclosures around valuation inputs and techniques used during annual and interim periods.
Various inputs are used in determining the value of the fund’s investments relating to fair value measurements. These inputs are summarized in the three broad levels listed below:
Level 1—unadjusted quoted prices in active markets for identical investments.
21
NOTES TO FINANCIAL STATEMENTS (continued)
Level 2—other significant observable inputs (including quoted prices for similar investments, interest rates, prepayment speeds, credit risk, etc.).
Level 3—significant unobservable inputs (including the fund’s own assumptions in determining the fair value of investments).
The inputs or methodology used for valuing securities are not necessarily an indication of the risk associated with investing in those securities.
Changes in valuation techniques may result in transfers in or out of an assigned level within the disclosure hierarchy. Valuation techniques used to value the fund’s investments are as follows:
The Company’s Board of Directors (the “Board”) has designated the Adviser as the fund’s valuation designee, effective September 8, 2022, to make all fair value determinations with respect to the fund’s portfolio investments, subject to the Board’s oversight and pursuant to Rule 2a-5 under the Act.
Investments in equity securities are valued at the last sales price on the securities exchange or national securities market on which such securities are primarily traded. Securities listed on the National Market System for which market quotations are available are valued at the official closing price or, if there is no official closing price that day, at the last sales price. For open short positions, asked prices are used for valuation purposes. Bid price is used when no asked price is available. Registered investment companies that are not traded on an exchange are valued at their net asset value. All of the preceding securities are generally categorized within Level 1 of the fair value hierarchy.
Securities not listed on an exchange or the national securities market, or securities for which there were no transactions, are valued at the average of the most recent bid and asked prices. These securities are generally categorized within Level 2 of the fair value hierarchy.
Fair valuing of securities may be determined with the assistance of a pricing service using calculations based on indices of domestic securities and other appropriate indicators, such as prices of relevant American Depository Receipts and futures. Utilizing these techniques may result in transfers between Level 1 and Level 2 of the fair value hierarchy.
When market quotations or official closing prices are not readily available, or are determined not to accurately reflect fair value, such as when the value of a security has been significantly affected by events after the close of the exchange or market on which the security is principally traded (for example, a foreign exchange or market), but before the fund calculates its
22
net asset value, the fund may value these investments at fair value as determined in accordance with the procedures approved by the Board. Certain factors may be considered when fair valuing investments such as: fundamental analytical data, the nature and duration of restrictions on disposition, an evaluation of the forces that influence the market in which the securities are purchased and sold, and public trading in similar securities of the issuer or comparable issuers. These securities are either categorized within Level 2 or 3 of the fair value hierarchy depending on the relevant inputs used.
For securities where observable inputs are limited, assumptions about market activity and risk are used and such securities are generally categorized within Level 3 of the fair value hierarchy.
The following is a summary of the inputs used as of November 30, 2022 in valuing the fund’s investments:
Level 1-Unadjusted Quoted Prices | Level 2- Other Significant Observable Inputs | Level 3-Significant Unobservable Inputs | Total | |||
Assets ($) | ||||||
Investments in Securities:† | ||||||
Equity Securities - Common Stocks | 469,970,442 | - | - | 469,970,442 | ||
Investment Companies | 12,802 | - | - | 12,802 | ||
† See Statement of Investments for additional detailed categorizations, if any.
(b) Securities transactions and investment income: Securities transactions are recorded on a trade date basis. Realized gains and losses from securities transactions are recorded on the identified cost basis. Dividend income is recognized on the ex-dividend date and interest income, including, where applicable, accretion of discount and amortization of premium on investments, is recognized on the accrual basis.
Pursuant to a securities lending agreement with BNY Mellon, the fund may lend securities to qualified institutions. It is the fund’s policy that, at origination, all loans are secured by collateral of at least 102% of the value of U.S. securities loaned and 105% of the value of foreign securities loaned. Collateral equivalent to at least 100% of the market value of securities on loan is maintained at all times. Collateral is either in the form of cash, which can be invested in certain money market mutual funds managed by the Adviser, or U.S. Government and Agency securities. The fund is entitled to receive all dividends, interest and distributions on securities loaned, in addition to income earned as a result of the lending
23
NOTES TO FINANCIAL STATEMENTS (continued)
transaction. Should a borrower fail to return the securities in a timely manner, BNY Mellon is required to replace the securities for the benefit of the fund or credit the fund with the market value of the unreturned securities and is subrogated to the fund’s rights against the borrower and the collateral. Additionally, the contractual maturity of security lending transactions are on an overnight and continuous basis. During the period ended November 30, 2022, BNY Mellon earned $42 from the lending of the fund’s portfolio securities, pursuant to the securities lending agreement.
(c) Affiliated issuers: Investments in other investment companies advised by the Adviser are considered “affiliated” under the Act.
(d) Market Risk: The value of the securities in which the fund invests may be affected by political, regulatory, economic and social developments, and developments that impact specific economic sectors, industries or segments of the market. The value of a security may also decline due to general market conditions that are not specifically related to a particular company or industry, such as real or perceived adverse economic conditions, changes in the general outlook for corporate earnings, changes in interest or currency rates, changes to inflation, adverse changes to credit markets or adverse investor sentiment generally. In addition, turbulence in financial markets and reduced liquidity in equity, credit and/or fixed income markets may negatively affect many issuers, which could adversely affect the fund. Global economies and financial markets are becoming increasingly interconnected, and conditions and events in one country, region or financial market may adversely impact issuers in a different country, region or financial market. These risks may be magnified if certain events or developments adversely interrupt the global supply chain; in these and other circumstances, such risks might affect companies world-wide. Recent examples include pandemic risks related to COVID-19 and aggressive measures taken world-wide in response by governments, including closing borders, restricting international and domestic travel, and the imposition of prolonged quarantines of large populations, and by businesses, including changes to operations and reducing staff.
(e) Dividends and distributions to shareholders: Dividends and distributions are recorded on the ex-dividend date. Dividends from net investment income and dividends from net realized capital gains, if any, are normally declared and paid annually, but the fund may make distributions on a more frequent basis to comply with the distribution requirements of the Internal Revenue Code of 1986, as amended (the “Code”). To the extent that net realized capital gains can be offset by capital loss carryovers, it is the policy of the fund not to distribute such gains. Income and capital
24
gain distributions are determined in accordance with income tax regulations, which may differ from GAAP.
(f) Federal income taxes: It is the policy of the fund to continue to qualify as a regulated investment company, if such qualification is in the best interests of its shareholders, by complying with the applicable provisions of the Code, and to make distributions of taxable income and net realized capital gain sufficient to relieve it from substantially all federal income and excise taxes.
As of and during the period ended November 30, 2022, the fund did not have any liabilities for any uncertain tax positions. The fund recognizes interest and penalties, if any, related to uncertain tax positions as income tax expense in the Statement of Operations. During the period ended November 30, 2022, the fund did not incur any interest or penalties.
Each tax year in the four-year period ended November 30, 2022 remains subject to examination by the Internal Revenue Service and state taxing authorities.
At November 30, 2022, the components of accumulated earnings on a tax basis were as follows: undistributed ordinary income $667,621, undistributed capital gains $100,013,521 and unrealized appreciation $232,476,182.
The tax character of distributions paid to shareholders during the fiscal years ended November 30, 2022 and November 30, 2021 were as follows: ordinary income $11,710,883 and $3,177,413, and long-term capital gains $79,522,539 and $7,416,923, respectively.
During the period ended November 30, 2022, as a result of permanent book to tax differences, primarily due to the tax treatment for treating a portion of the proceeds from redemptions as a distribution for tax purposes, the fund decreased total distributable earnings (loss) by $25,149,913 and increased paid-in-capital by the same amount. Net assets and net asset value per share were not affected by this reclassification.
NOTE 2—Bank Lines of Credit:
The fund participates with other long-term open-end funds managed by the Adviser in a $823.5 million unsecured credit facility led by Citibank, N.A. (the “Citibank Credit Facility”) and a $300 million unsecured credit facility provided by BNY Mellon (the “BNYM Credit Facility”), each to be utilized primarily for temporary or emergency purposes, including the financing of redemptions (each, a “Facility”). The Citibank Credit Facility is available in two tranches: (i) Tranche A is in an amount equal to $688.5 million and is available to all long-term open-ended funds, including the
25
NOTES TO FINANCIAL STATEMENTS (continued)
fund, and (ii) Tranche B is an amount equal to $135 million and is available only to BNY Mellon Floating Rate Income Fund, a series of BNY Mellon Investment Funds IV, Inc. In connection therewith, the fund has agreed to pay its pro rata portion of commitment fees for Tranche A of the Citibank Credit Facility and the BNYM Credit Facility. Interest is charged to the fund based on rates determined pursuant to the terms of the respective Facility at the time of borrowing.
The average amount of borrowings outstanding under the Facilities during the period ended November 30, 2022 was approximately $157,534 with a related weighted average annualized interest rate of 4.25%.
NOTE 3—Management Fee, Sub-Advisory Fee and Other Transactions with Affiliates:
(a) Pursuant to a management agreement with the Adviser, the management fee is computed at the annual rate of .75% of the value of the fund’s average daily net assets and is payable monthly. The Adviser has contractually agreed, from December 1, 2021 through March 31, 2023, to waive receipt of its fees and/or assume the direct expenses of the fund, so that the direct expenses of none of the fund’s classes (excluding Rule 12b-1 Distribution Plan fees, Shareholder Services Plan fees, taxes, interest expense, brokerage commissions, commitment fees on borrowings and extraordinary expenses) exceed .90% of the value of the fund’s average daily net assets. On or after March 31, 2023, the Adviser may terminate this expense limitation at any time. The reduction in expenses, pursuant to the undertaking, amounted to $777 during the period ended November 30, 2022.
Pursuant to a sub-investment advisory agreement between the Adviser and the Sub-Adviser, the Adviser pays the Sub-Adviser a monthly fee at an annual rate of .36% of the value of the fund’s average daily net assets.
During the period ended November 30, 2022, the Distributor retained $14 from commissions earned on sales of the fund’s Class A shares.
(b) Under the Distribution Plan adopted pursuant to Rule 12b-1 under the Act, Class C shares pay the Distributor for distributing its shares at an annual rate of .75% of the value of its average daily net assets. The Distributor may pay one or more Service Agents in respect of advertising, marketing and other distribution services, and determines the amounts, if any, to be paid to Service Agents and the basis on which such payments are made. During the period ended November 30, 2022, Class C shares were charged $161 pursuant to the Distribution Plan.
26
(c) Under the Shareholder Services Plan, Class A and Class C shares pay the Distributor at an annual rate of .25% of the value of their average daily net assets for the provision of certain services. The services provided may include personal services relating to shareholder accounts, such as answering shareholder inquiries regarding the fund, and services related to the maintenance of shareholder accounts. The Distributor may make payments to Service Agents (securities dealers, financial institutions or other industry professionals) with respect to these services. The Distributor determines the amounts to be paid to Service Agents. During the period ended November 30, 2022, Class A and Class C shares were charged $4,377 and $54, respectively, pursuant to the Shareholder Services Plan.
The fund has an arrangement with BNY Mellon Transfer, Inc., (the “Transfer Agent”), a subsidiary of BNY Mellon and an affiliate of the Adviser, whereby the fund may receive earnings credits when positive cash balances are maintained, which are used to offset Transfer Agent fees. For financial reporting purposes, the fund includes transfer agent net earnings credits, if any, as an expense offset in the Statement of Operations.
The fund has an arrangement with The Bank of New York Mellon (the “Custodian”), a subsidiary of BNY Mellon and an affiliate of the Adviser, whereby the fund will receive interest income or be charged overdraft fees when cash balances are maintained. For financial reporting purposes, the fund includes this interest income and overdraft fees, if any, as interest income in the Statement of Operations.
The fund compensates the Transfer Agent, under a transfer agency agreement, for providing transfer agency and cash management services for the fund. The majority of Transfer Agent fees are comprised of amounts paid on a per account basis, while cash management fees are related to fund subscriptions and redemptions. During the period ended November 30, 2022, the fund was charged $5,348 for transfer agency services. These fees are included in Shareholder servicing costs in the Statement of Operations. These fees were partially offset by earnings credits of $111.
The fund compensates the Custodian, under a custody agreement, for providing custodial services for the fund. These fees are determined based on net assets, geographic region and transaction activity. During the period ended November 30, 2022, the fund was charged $11,431 pursuant to the custody agreement.
During the period ended November 30, 2022, the fund was charged $17,027 for services performed by the fund’s Chief Compliance Officer
27
NOTES TO FINANCIAL STATEMENTS (continued)
and his staff. These fees are included in Chief Compliance Officer fees in the Statement of Operations.
The components of “Due to BNY Mellon Investment Adviser, Inc. and affiliates” in the Statement of Assets and Liabilities consist of: management fee of $306,448, Distribution Plan fees of $6, Shareholder Services Plan fees of $330, Custodian fees of $6,000, Chief Compliance Officer fees of $2,721 and Transfer Agent fees of $1,338, which are offset against an expense reimbursement currently in effect in the amount of $74.
(d) Each Board Member also serves as a Board Member of other funds in the BNY Mellon Family of Funds complex. Annual retainer fees and attendance fees are allocated to each fund based on net assets.
NOTE 4—Securities Transactions:
The aggregate amount of purchases and sales of investment securities, excluding short-term securities, during the period ended November 30, 2022, amounted to $60,255,633 and $242,548,306, respectively.
At November 30, 2022, the cost of investments for federal income tax purposes was $237,507,062; accordingly, accumulated net unrealized appreciation on investments was $232,476,182, consisting of $256,377,858 gross unrealized appreciation and $23,901,676 gross unrealized depreciation.
28
REPORT OF INDEPENDENT REGISTERED PUBLIC ACCOUNTING FIRM
To the Shareholders and the Board of Directors of BNY Mellon U.S. Equity Fund
Opinion on the Financial Statements
We have audited the accompanying statement of assets and liabilities of BNY Mellon U.S. Equity Fund (the “Fund”) (one of the funds constituting BNY Mellon Strategic Funds, Inc.), including the statement of investments, as of November 30, 2022, and the related statement of operations for the year then ended, the statements of changes in net assets for each of the two years in the period then ended, the financial highlights for each of the five years in the period then ended and the related notes (collectively referred to as the “financial statements”). In our opinion, the financial statements present fairly, in all material respects, the financial position of the Fund (one of the funds constituting BNY Mellon Strategic Funds, Inc.) at November 30, 2022, the results of its operations for the year then ended, the changes in its net assets for each of the two years in the period then ended and its financial highlights for each of the five years in the period then ended, in conformity with U.S. generally accepted accounting principles.
Basis for Opinion
These financial statements are the responsibility of the Fund’s management. Our responsibility is to express an opinion on the Fund’s financial statements based on our audits. We are a public accounting firm registered with the Public Company Accounting Oversight Board (United States) (“PCAOB”) and are required to be independent with respect to the Fund in accordance with the U.S. federal securities laws and the applicable rules and regulations of the Securities and Exchange Commission and the PCAOB.
We conducted our audits in accordance with the standards of the PCAOB. Those standards require that we plan and perform the audit to obtain reasonable assurance about whether the financial statements are free of material misstatement, whether due to error or fraud. The Fund is not required to have, nor were we engaged to perform, an audit of the Fund’s internal control over financial reporting. As part of our audits, we are required to obtain an understanding of internal control over financial reporting, but not for the purpose of expressing an opinion on the effectiveness of the Fund’s internal control over financial reporting. Accordingly, we express no such opinion.
Our audits included performing procedures to assess the risks of material misstatement of the financial statements, whether due to error or fraud, and performing procedures that respond to those risks. Such procedures included examining, on a test basis, evidence regarding the amounts and disclosures in the financial statements. Our procedures included confirmation of securities owned as of November 30, 2022, by correspondence with the custodian, brokers and others; when replies were not received from brokers and others, we performed other auditing procedures. Our audits also included evaluating the accounting principles used and significant estimates made by management, as well as evaluating the overall presentation of the financial statements. We believe that our audits provide a reasonable basis for our opinion.

We have served as the auditor of one or more investment companies in the BNY Mellon Family of Funds since at least 1957, but we are unable to determine the specific year.
New York, New York
January 23, 2023
29
IMPORTANT TAX INFORMATION (Unaudited)
For federal tax purposes the fund hereby reports 53.27% of the ordinary dividends paid during the fiscal year ended November 30, 2022 as qualifying for the corporate dividends received deduction. Also certain dividends paid by the fund may be subject to a maximum tax rate of 15%, as provided for by the Jobs and Growth Tax Relief Reconciliation Act of 2003. Of the distributions paid during the fiscal year, $6,668,519 represents the maximum amount that may be considered qualified dividend income. Shareholders will receive notification in early 2023 of the percentage applicable to the preparation of their 2022 income tax returns. Also, the fund hereby reports $.2748 per share as a short-term capital gain distribution and $2.6234 as a long-term capital gain distribution paid on December 14, 2021 and $.1658 per share as a short-term capital gain distribution and $.4590 as a long-term capital gain distribution paid on March 29, 2022.
30
INFORMATION ABOUT THE RENEWAL OF THE FUND’S MANAGEMENT AND SUB-INVESTMENT ADVISORY AGREEMENTS (Unaudited)
At a meeting of the fund’s Board of Directors held on October 31-November 1, 2022, the Board considered the renewal of the fund’s Management Agreement, pursuant to which the Adviser provides the fund with investment advisory and administrative services, and the Sub-Investment Advisory Agreement (together with the Management Agreement, the “Agreements”), pursuant to which Walter Scott & Partners Limited (the “Sub-Adviser”) provides day-to-day management of the fund’s investments. The Board members, none of whom are “interested persons” (as defined in the Investment Company Act of 1940, as amended) of the fund, were assisted in their review by independent legal counsel and met with counsel in executive session separate from representatives of the Adviser and the Sub-Adviser. In considering the renewal of the Agreements, the Board considered several factors that it believed to be relevant, including those discussed below. The Board did not identify any one factor as dispositive, and each Board member may have attributed different weights to the factors considered.
Analysis of Nature, Extent, and Quality of Services Provided to the Fund. The Board considered information provided to it at the meeting and in previous presentations from representatives of the Adviser regarding the nature, extent, and quality of the services provided to funds in the BNY Mellon fund complex, including the fund. The Adviser provided the number of open accounts in the fund, the fund’s asset size and the allocation of fund assets among distribution channels. The Adviser also had previously provided information regarding the diverse intermediary relationships and distribution channels of funds in the BNY Mellon fund complex (such as retail direct or intermediary, in which intermediaries typically are paid by the fund and/or the Adviser) and the Adviser’s corresponding need for broad, deep, and diverse resources to be able to provide ongoing shareholder services to each intermediary or distribution channel, as applicable to the fund.
The Board also considered research support available to, and portfolio management capabilities of, the fund’s portfolio management personnel and that the Adviser also provides oversight of day-to-day fund operations, including fund accounting and administration and assistance in meeting legal and regulatory requirements. The Board also considered the Adviser’s extensive administrative, accounting and compliance infrastructures, as well as the Adviser’s supervisory activities over the Sub-Adviser. The Board also considered portfolio management’s brokerage policies and practices (including that there are no soft dollar arrangements in place for the fund) and the standards applied in seeking best execution.
Comparative Analysis of the Fund’s Performance and Management Fee and Expense Ratio. The Board reviewed reports prepared by Broadridge Financial Solutions, Inc. (“Broadridge”), an independent provider of investment company data based on classifications provided by Thomson Reuters Lipper (“Lipper”), which included information comparing (1) the performance of the fund’s Class I shares with the performance of a group of institutional multi-cap growth funds selected by Broadridge
31
INFORMATION ABOUT THE RENEWAL OF THE FUND’S MANAGEMENT AND SUB-INVESTMENT ADVISORY AGREEMENTS (Unaudited) (continued)
as comparable to the fund (the “Performance Group”) and with a broader group of funds consisting of all retail and institutional multi-cap growth funds (the “Performance Universe”), all for various periods ended September 30, 2022, and (2) the fund’s actual and contractual management fees and total expenses with those of the same group of funds in the Performance Group (the “Expense Group”) and with a broader group of all institutional multi-cap growth funds, excluding outliers (the “Expense Universe”), the information for which was derived in part from fund financial statements available to Broadridge as of the date of its analysis. The Adviser previously had furnished the Board with a description of the methodology Broadridge used to select the Performance Group and Performance Universe and the Expense Group and Expense Universe.
Performance Comparisons. Representatives of the Adviser stated that the usefulness of performance comparisons may be affected by a number of factors, including different investment limitations and policies that may be applicable to the fund and comparison funds and the end date selected. The Board also considered the fund’s performance in light of overall financial market conditions. The Board discussed with representatives of the Adviser and the Sub-Adviser the results of the comparisons and considered that the fund’s total return performance was at or above the Performance Group median for all periods, except for the ten-year period when the fund’s total return performance was below the Performance Group median, and was below the Performance Universe median for all periods, except the one- and two-year periods when the fund’s total return performance was above the Performance Universe median. The Adviser also noted that the fund’s total return performance ranked in the first quartile of the Performance Group and the Performance Universe for the one- and two-year periods. The Adviser also provided a comparison of the fund’s calendar year total returns to the returns of the fund’s benchmark index and it was noted that the fund’s returns were above the returns of the index in three of the ten calendar years shown.
Management Fee and Expense Ratio Comparisons. The Board reviewed and considered the contractual management fee rate payable by the fund to the Adviser in light of the nature, extent and quality of the management services and the sub-advisory services provided by the Adviser and the Sub-Adviser, respectively. In addition, the Board reviewed and considered the actual management fee rate paid by the fund over the fund’s last fiscal year. The Board also reviewed the range of actual and contractual management fees and total expenses as a percentage of average net assets of the Expense Group and Expense Universe funds and discussed the results of the comparisons.
The Board considered that the fund’s contractual management fee was equal to the Expense Group median contractual management fee, the fund’s actual management fee was equal to the Expense Group median and higher than the Expense Universe median actual management fee and the fund’s total expenses were slightly lower than the Expense Group median and the Expense Universe median total expenses.
Representatives of the Adviser stated that the Adviser has contractually agreed, until March 31, 2023, to waive receipt of its fees and/or assume the direct expenses of the fund so that the direct expenses of none of the fund’s share classes (excluding Rule 12b-
32
1 fees, shareholder services fees, taxes, interest, brokerage commissions, commitment fees on borrowings and extraordinary expenses) exceed .90% of the fund’s average daily net assets.
Representatives of the Adviser reviewed with the Board the management or investment advisory fees paid to the Adviser or the Sub-Adviser or its affiliates for advising any separate accounts and/or other types of client portfolios that are considered to have similar investment strategies and policies as the fund (the “Similar Clients”), and explained the nature of the Similar Clients. They discussed differences in fees paid in light of any differences in the services provided and other relevant factors. The Board considered the relevance of the fee information provided for the Similar Clients to evaluate the appropriateness of the fund’s management fee. Representatives of the Adviser noted that there were no other funds advised by the Adviser that are in the same Lipper category as the fund.
The Board considered the fee payable to the Sub-Adviser in relation to the fee payable to the Adviser by the fund and the respective services provided by the Sub-Adviser and the Adviser. The Board also took into consideration that the Sub-Adviser’s fee is paid by the Adviser, out of its fee from the fund, and not the fund.
Analysis of Profitability and Economies of Scale. Representatives of the Adviser reviewed the expenses allocated and profit received by the Adviser and its affiliates and the resulting profitability percentage for managing the fund and the aggregate profitability percentage to the Adviser and its affiliates for managing the funds in the BNY Mellon fund complex, and the method used to determine the expenses and profit. The Board concluded that the profitability results were not excessive, given the services rendered and service levels provided by the Adviser and its affiliates. The Board also had been provided with information prepared by an independent consulting firm regarding the Adviser’s approach to allocating costs to, and determining the profitability of, individual funds and the entire BNY Mellon fund complex. The consulting firm also had analyzed where any economies of scale might emerge in connection with the management of a fund.
The Board considered, on the advice of its counsel, the profitability analysis (1) as part of its evaluation of whether the fees under the Agreements, considered in relation to the mix of services provided by the Adviser and the Sub-Adviser, including the nature, extent and quality of such services, supported the renewal of the Agreements and (2) in light of the relevant circumstances for the fund and the extent to which economies of scale would be realized if the fund grows and whether fee levels reflect these economies of scale for the benefit of fund shareholders. Representatives of the Adviser stated that a discussion of economies of scale is predicated on a fund having achieved a substantial size with increasing assets and that, if a fund’s assets had been stable or decreasing, the possibility that the Adviser may have realized any economies of scale would be less. Representatives of the Adviser also stated that, as a result of shared and allocated costs among funds in the BNY Mellon fund complex, the extent of economies of scale could depend substantially on the level of assets in the complex as a whole, so that increases and decreases in complex-wide assets can affect potential economies of scale in a
33
INFORMATION ABOUT THE RENEWAL OF THE FUND’S MANAGEMENT AND SUB-INVESTMENT ADVISORY AGREEMENTS (Unaudited) (continued)
manner that is disproportionate to, or even in the opposite direction from, changes in the fund’s asset level. The Board also considered potential benefits to the Adviser and the Sub-Adviser from acting as investment adviser and sub-investment adviser, respectively, and took into consideration that there were no soft dollar arrangements in effect for trading the fund’s investments.
At the conclusion of these discussions, the Board agreed that it had been furnished with sufficient information to make an informed business decision with respect to the renewal of the Agreements. Based on the discussions and considerations as described above, the Board concluded and determined as follows.
· The Board concluded that the nature, extent and quality of the services provided by the Adviser and the Sub-Adviser are adequate and appropriate.
· The Board was satisfied with the fund’s performance.
· The Board concluded that the fees paid to the Adviser and the Sub-Adviser continued to be appropriate under the circumstances and in light of the factors and the totality of the services provided as discussed above.
· The Board determined that the economies of scale which may accrue to the Adviser and its affiliates in connection with the management of the fund had been adequately considered by the Adviser in connection with the fee rate charged to the fund pursuant to its Management Agreement and that, to the extent in the future it were determined that material economies of scale had not been shared with the fund, the Board would seek to have those economies of scale shared with the fund.
In evaluating the Agreements, the Board considered these conclusions and determinations and also relied on its previous knowledge, gained through meetings and other interactions with the Adviser and its affiliates and the Sub-Adviser, of the Adviser and the Sub-Adviser and the services provided to the fund by the Adviser and the Sub-Adviser. The Board also relied on information received on a routine and regular basis throughout the year relating to the operations of the fund and the investment management and other services provided under the Agreements, including information on the investment performance of the fund in comparison to similar mutual funds and benchmark performance indices; general market outlook as applicable to the fund; and compliance reports. In addition, the Board’s consideration of the contractual fee arrangements for the fund had the benefit of a number of years of reviews of the Agreements for the fund, or substantially similar agreements for other BNY Mellon funds that the Board oversees, during which lengthy discussions took place between the Board and representatives of the Adviser. Certain aspects of the arrangements may receive greater scrutiny in some years than in others, and the Board’s conclusions may be based, in part, on its consideration of the fund’s arrangements, or substantially similar arrangements for other BNY Mellon funds that the Board oversees, in prior years. The Board determined to renew the Agreements.
34
BOARD MEMBERS INFORMATION (Unaudited)
Independent Board Members
Joseph S. DiMartino (79)
Chairman of the Board (1995)
Principal Occupation During Past 5 Years:
· Director or Trustee of funds in the BNY Mellon Family of Funds and certain other entities (as described in the fund’s Statement of Additional Information) (1995-Present)
Other Public Company Board Memberships During Past 5 Years:
· CBIZ, Inc., a public company providing professional business services, products and solutions, Director (1997-Present)
No. of Portfolios for which Board Member Serves: 92
———————
Joni Evans (80)
Board Member (2006)
Principal Occupation During Past 5 Years:
· www.wowOwow.com, an online community dedicated to women’s conversations and publications, Chief Executive Officer (2007-2019)
· Joni Evans Ltd. publishing, Principal (2006-2019)
No. of Portfolios for which Board Member Serves: 17
———————
Joan Gulley (75)
Board Member (2017)
Principal Occupation During Past 5 Years:
· Nantucket Atheneum, public library, Chair (2018-June 2021) and Director (2015-June 2021)
· Orchard Island Club, golf and beach club, Governor (2016-Present)
No. of Portfolios for which Board Member Serves: 39
———————
35
BOARD MEMBERS INFORMATION (Unaudited) (continued)
Alan H. Howard (63)
Board Member (2018)
Principal Occupation During Past 5 Years:
· Heathcote Advisors LLC, a financial advisory services firm, Managing Partner (2008-Present)
· Dynatech/MPX Holdings LLC, a global supplier and service provider of military aircraft parts, President (2012-2019); and Board Member of its two operating subsidiaries, Dynatech International LLC and Military Parts Exchange LLC (2012-2019), including Chief Executive Officer of an operating subsidiary, Dynatech International LLC (2013-2019)
· Rossoff & Co., an independent investment banking firm, Senior Advisor (2013-June 2021)
Other Public Company Board Memberships During Past 5 Years:
· Movado Group, Inc., a public company that designs, sources, markets and distributes watches, Director (1997-Present)
· Diamond Offshore Drilling, Inc., a public company that provides contract drilling services, Director (March 2020-April 2021)
No. of Portfolios for which Board Member Serves: 17
———————
Robin A. Melvin (59)
Board Member (1995)
Principal Occupation During Past 5 Years:
· Westover School, a private girls’ boarding school in Middlebury, Connecticut, Trustee (2019-Present)
· Mentor Illinois, a non-profit organization dedicated to increasing the quantity and quality of mentoring services in Illinois. Co-Chair (2014–2020); Board Member, Mentor Illinois (2013-2020)
· JDRF, a non-profit juvenile diabetes research foundation, Board Member (June 2021-June 2022)
Other Public Company Board Memberships During Past 5 Years:
· HPS Corporate Lending Fund, a closed-end management investment company regulated as a business development company, Trustee (August 2021-Present)
No. of Portfolios for which Board Member Serves: 71
———————
Burton N. Wallack (72)
Board Member (2006)
Principal Occupation During Past 5 Years:
Wallack Management Company, a real estate management company, President and Co-owner (1987-Present)
Other Public Company Board Memberships During Past 5 Years:
Mount Sinai Hospital Urology, Board Member (2017-Present)
No. of Portfolios for which Board Member Serves: 17
———————
36
Benaree Pratt Wiley (76)
Board Member (2016)
Principal Occupation During Past 5 Years:
· The Wiley Group, a firm specializing in strategy and business development. Principal (2005-Present)
Other Public Company Board Memberships During Past 5 Years:
· CBIZ, Inc., a public company providing professional business services, products and solutions, Director (2008-Present)
· Blue Cross-Blue Shield of Massachusetts, Director (2004-2020)
No. of Portfolios for which Board Member Serves: 60
———————
Gordon J. Davis (81)
Advisory Board Member (2021)
Principal Occupation During Past 5 Years:
· Venable LLP, a law firm, Partner (2012-Present)
Other Public Company Board Memberships During Past 5 Years:
· BNY Mellon Family of Funds (53 funds), Board Member (1995-August 2021)
No. of Portfolios for which Advisory Board Member Serves: 39
———————
The address of the Board Members and Officers is c/o BNY Mellon Investment Adviser, Inc., 240 Greenwich Street, New York, New York 10286. Additional information about each Board Member is available in the fund’s Statement of Additional Information which can be obtained from the Adviser free of charge by calling this toll free number: 1-800-373-9387.
37
OFFICERS OF THE FUND (Unaudited)
DAVID DIPETRILLO, President since January 2021.
Vice President and Director of the Adviser since February 2021; Head of North America Product, BNY Mellon Investment Management since January 2018; and Director of Product Strategy, BNY Mellon Investment Management from January 2016 to December 2017. He is an officer of 54 investment companies (comprised of 107 portfolios) managed by the Adviser or an affiliate of the Adviser. He is 44 years old and has been an employee of BNY Mellon since 2005.
JAMES WINDELS, Treasurer since November 2001.
Vice President of the Adviser since September 2020; and Director–BNY Mellon Fund Administration. He is an officer of 55 investment companies (comprised of 127 portfolios) managed by the Adviser or an affiliate of the Adviser. He is 64 years old and has been an employee of the Adviser since April 1985.
PETER M. SULLIVAN, Chief Legal Officer since July 2021 and Vice President and Assistant Secretary since March 2019.
Chief Legal Officer of the Adviser and Associate General Counsel of BNY Mellon since July 2021; Senior Managing Counsel of BNY Mellon from December 2020 to July 2021; and Managing Counsel of BNY Mellon from March 2009 to December 2020. He is an officer of 55 investment companies (comprised of 127 portfolios) managed by the Adviser or an affiliate of the Adviser. He is 54 years old and has been an employee of BNY Mellon since April 2004.
JAMES BITETTO, Vice President since August 2005 and Secretary since February 2018.
Senior Managing Counsel of BNY Mellon since December 2019; Managing Counsel of BNY Mellon from April 2014 to December 2019; and Secretary of the Adviser. He is an officer of 55 investment companies (comprised of 127 portfolios) managed by the Adviser or an affiliate of the Adviser. He is 56 years old and has been an employee of the Adviser since December 1996.
DEIRDRE CUNNANE, Vice President and Assistant Secretary since March 2019.
Managing Counsel of BNY Mellon since December 2021, Counsel of BNY Mellon from August 2018 to December 2021; and Senior Regulatory Specialist at BNY Mellon Investment Management Services from February 2016 to August 2018. She is an officer of 55 investment companies (comprised of 127 portfolios) managed by the Adviser or an affiliate of the Adviser. She is 32 years old and has been an employee of the Adviser since August 2018.
SARAH S. KELLEHER, Vice President and Assistant Secretary since April 2014.
Vice President of BNY Mellon ETF Investment Adviser; LLC since February 2020; Senior Managing Counsel of BNY Mellon since September 2021; Managing Counsel of BNY Mellon from December 2017 to September 2021; and Senior Counsel of BNY Mellon from March 2013 to December 2017. She is an officer of 55 investment companies (comprised of 127 portfolios) managed by the Adviser or an affiliate of the Adviser. She is 47 years old and has been an employee of the Adviser since March 2013.
JEFF PRUSNOFSKY, Vice President and Assistant Secretary since August 2005.
Senior Managing Counsel of BNY Mellon. He is an officer of 55 investment companies (comprised of 127 portfolios) managed by the Adviser or an affiliate of the Adviser. He is 57 years old and has been an employee of the Adviser since October 1990.
AMANDA QUINN, Vice President and Assistant Secretary since March 2020.
Counsel of BNY Mellon since June 2019; Regulatory Administration Manager at BNY Mellon Investment Management Services from September 2018 to May 2019; and Senior Regulatory Specialist at BNY Mellon Investment Management Services from April 2015 to August 2018. She is an officer of 55 investment companies (comprised of 127 portfolios) managed by the Adviser or an affiliate of the Adviser. She is 37 years old and has been an employee of the Adviser since June 2019.
38
NATALYA ZELENSKY, Vice President and Assistant Secretary since March 2017.
Chief Compliance Officer since August 2021 and Vice President since February 2020 of BNY Mellon ETF Investment Adviser, LLC; Chief Compliance Officer since August 2021 and Vice President and Assistant Secretary since February 2020 of BNY Mellon ETF Trust; Managing Counsel of BNY Mellon from December 2019 to August 2021; Counsel of BNY Mellon from May 2016 to December 2019; and Assistant Secretary of the Adviser from April 2018 to August 2021. She is an officer of 55 investment companies (comprised of 127 portfolios) managed by the Adviser or an affiliate of the Adviser. She is 37 years old and has been an employee of BNY Mellon since May 2016.
DANIEL GOLDSTEIN, Vice President since March 2022.
Vice President and Head of Product Development of North America Product, BNY Mellon Investment Management since January 2018; Co-Head of Product Management, Development & Oversight of North America Product, BNY Mellon Investment Management from January 2010 to January 2018; and Senior Vice President, Development & Oversight of North America Product, BNY Mellon Investment Management since 2010. He is an officer of 54 investment companies (comprised of 107 portfolios) managed by the Adviser or an affiliate of the Adviser. He is 53 years old and has been an employee of the Distributor since 1991.
JOSEPH MARTELLA, Vice President since March 2022.
Vice President and Head of Product Management of North America Product, BNY Mellon Investment Management since January 2018; Director of Product Research and Analytics of North America Product, BNY Mellon Investment Management from January 2010 to January 2018; and Senior Vice President of North America Product, BNY Mellon Investment Management since 2010. He is an officer of 54 investment companies (comprised of 107 portfolios) managed by the Adviser or an affiliate of the Adviser. He is 46 years old and has been an employee of the Distributor since 1999.
GAVIN C. REILLY, Assistant Treasurer since December 2005.
Tax Manager–BNY Mellon Fund Administration. He is an officer of 55 investment companies (comprised of 127 portfolios) managed by the Adviser or an affiliate of the Adviser. He is 54 years old and has been an employee of the Adviser since April 1991.
ROBERT SALVIOLO, Assistant Treasurer since July 2007.
Senior Accounting Manager–BNY Mellon Fund Administration. He is an officer of 55 investment companies (comprised of 127 portfolios) managed by the Adviser or an affiliate of the Adviser. He is 55 years old and has been an employee of the Adviser since June 1989.
ROBERT SVAGNA, Assistant Treasurer since September 2002.
Senior Accounting Manager–BNY Mellon Fund Administration. He is an officer of 55 investment companies (comprised of 127 portfolios) managed by the Adviser or an affiliate of the Adviser. He is 55 years old and has been an employee of the Adviser since November 1990.
JOSEPH W. CONNOLLY, Chief Compliance Officer since October 2004.
Chief Compliance Officer of the BNY Mellon Family of Funds and BNY Mellon Funds Trust since 2004; and Chief Compliance Officer of the Adviser from 2004 until June 2021. He is the Chief Compliance Officer of 54 investment companies (comprised of 112 portfolios) managed by the Adviser. He is 65 years old.
CARIDAD M. CAROSELLA, Anti-Money Laundering Compliance Officer since January 2016.
Anti-Money Laundering Compliance Officer of the BNY Mellon Family of Funds and BNY Mellon Funds Trust. She is an officer of 48 investment companies (comprised of 120 portfolios) managed by the Adviser or an affiliate of the Adviser. She is 54 years old and has been an employee of the Distributor since 1997.
39
This page intentionally left blank.
40
This page intentionally left blank.
41
BNY Mellon U.S. Equity Fund
240 Greenwich Street
New York, NY 10286
Adviser
BNY Mellon Investment Adviser, Inc.
240 Greenwich Street
New York, NY 10286
Sub-Adviser
Walter Scott & Partners Limited
One Charlotte Square
Edinburgh, Scotland, UK
Custodian
The Bank of New York Mellon
240 Greenwich Street
New York, NY 10286
Transfer Agent &
Dividend Disbursing Agent
BNY Mellon Transfer, Inc.
240 Greenwich Street
New York, NY 10286
Distributor
BNY Mellon Securities Corporation
240 Greenwich Street
New York, NY 10286
Ticker Symbols: | Class A: DPUAX Class C: DPUCX Class I: DPUIX Class Y: DPUYX |
Telephone Call your financial representative or 1-800-373-9387
Mail The BNY Mellon Family of Funds, 144 Glenn Curtiss Boulevard, Uniondale, NY 11556-0144
E-mail Send your request to info@bnymellon.com
Internet Information can be viewed online or downloaded at www.im.bnymellon.com
The fund files its complete schedule of portfolio holdings with the Securities and Exchange Commission (“SEC”) for the first and third quarters of each fiscal year on Form N-PORT. The fund’s Forms N-PORT are available on the SEC’s website at www.sec.gov.
A description of the policies and procedures that the fund uses to determine how to vote proxies relating to portfolio securities and information regarding how the fund voted these proxies for the most recent 12-month period ended June 30 is available at www.im.bnymellon.com and on the SEC’s website at www.sec.gov and without charge, upon request, by calling 1-800-373-9387.
© 2023 BNY Mellon Securities Corporation |
|

Item 2. Code of Ethics.
The Registrant has adopted a code of ethics that applies to the Registrant's principal executive officer, principal financial officer, principal accounting officer or controller, or persons performing similar functions. There have been no amendments to, or waivers in connection with, the Code of Ethics during the period covered by this Report.
Item 3. Audit Committee Financial Expert.
The Registrant's Board has determined that Alan H. Howard, a member of the Audit Committee of the Board, is an audit committee financial expert as defined by the Securities and Exchange Commission (the "SEC"). Mr. Howard is "independent" as defined by the SEC for purposes of audit committee financial expert determinations.
Item 4. Principal Accountant Fees and Services.
(a) Audit Fees. The aggregate fees billed for each of the last two fiscal years (the "Reporting Periods") for professional services rendered by the Registrant's principal accountant (the "Auditor") for the audit of the Registrant's annual financial statements or services that are normally provided by the Auditor in connection with the statutory and regulatory filings or engagements for the Reporting Periods, were $164,706 in 2021 and $168,000 in 2022.
(b) Audit-Related Fees. The aggregate fees billed in the Reporting Periods for assurance and related services by the Auditor that are reasonably related to the performance of the audit of the Registrant's financial statements and are not reported under paragraph (a) of this Item 4 were $33,724 in 2021 and $36,088 in 2022. These services consisted of one or more of the following: (i) agreed upon procedures related to compliance with Internal Revenue Code section 817(h), (ii) security counts required by Rule 17f-2 under the Investment Company Act of 1940, as amended, (iii) advisory services as to the accounting or disclosure treatment of Registrant transactions or events and (iv) advisory services to the accounting or disclosure treatment of the actual or potential impact to the Registrant of final or proposed rules, standards or interpretations by the Securities and Exchange Commission, the Financial Accounting Standards Boards or other regulatory or standard-setting bodies.
The aggregate fees billed in the Reporting Periods for non-audit assurance and related services by the Auditor to the Registrant's investment adviser (not including any sub-investment adviser whose role is primarily portfolio management and is subcontracted with or overseen by another investment adviser), and any entity controlling, controlled by or under common control with the investment adviser that provides ongoing services to the Registrant ("Service Affiliates"), that were reasonably related to the performance of the annual audit of the Service Affiliate, which required pre-approval by the Audit Committee were $0 in 2021 and $0 in 2022.
(c) Tax Fees. The aggregate fees billed in the Reporting Periods for professional services rendered by the Auditor for tax compliance, tax advice, and tax planning ("Tax Services") were $20,888 in 2021 and $19,051 in 2022. These services consisted of: (i) review or preparation of U.S. federal, state, local and excise tax returns; (ii) U.S. federal, state and local tax planning, advice and assistance regarding statutory, regulatory or administrative developments; (iii) tax advice regarding tax qualification matters and/or treatment of various financial instruments held or proposed to be acquired or held, and (iv) determination of Passive Foreign Investment Companies. The aggregate fees billed in the Reporting Periods for Tax Services by the Auditor to Service Affiliates, which required pre-approval by the Audit Committee were $26,949 in 2021 and $26,949 in 2022.
(d) All Other Fees. The aggregate fees billed in the Reporting Periods for products and services provided by the Auditor, other than the services reported in paragraphs (a) through (c) of this Item, were $2,734 in 2021 and $1,913 in 2022. These services consisted of a review of the Registrant's anti-money laundering program.
The aggregate fees billed in the Reporting Periods for Non-Audit Services by the Auditor to Service Affiliates, other than the services reported in paragraphs (b) through (c) of this Item, which required pre-approval by the Audit Committee, were $0 in 2021 and $0 in 2022.
(e)(1) Audit Committee Pre-Approval Policies and Procedures. The Registrant's Audit Committee has established policies and procedures (the "Policy") for pre-approval (within specified fee limits) of the Auditor's engagements for non-audit services to the Registrant and Service Affiliates without specific case-by-case consideration. The pre-approved services in the Policy can include pre-approved audit services, pre-approved audit-related services, pre-approved tax services and pre-approved all other services. Pre-approval considerations include whether the proposed services are compatible with maintaining the Auditor's independence. Pre-approvals pursuant to the Policy are considered annually.
(e)(2) Note. None of the services described in paragraphs (b) through (d) of this Item 4 were approved by the Audit Committee pursuant to paragraph (c)(7)(i)(C) of Rule 2-01 of Regulation S-X.
(f) None of the hours expended on the principal accountant's engagement to audit the registrant's financial statements for the most recent fiscal year were attributed to work performed by persons other than the principal accountant's full-time, permanent employees.
Non-Audit Fees. The aggregate non-audit fees billed by the Auditor for services rendered to the Registrant, and rendered to Service Affiliates, for the Reporting Periods were $2,747,329 in 2021 and $2,144,335 in 2022.
Auditor Independence. The Registrant's Audit Committee has considered whether the provision of non-audit services that were rendered to Service Affiliates, which were not pre-approved (not requiring pre-approval), is compatible with maintaining the Auditor's independence.
| (i) | Not applicable. |
(j) Not applicable.
Item 5. Audit Committee of Listed Registrants.
Not applicable.
Item 6. Investments.
(a) Not applicable.
| Item 7. | Disclosure of Proxy Voting Policies and Procedures for Closed-End Management Investment Companies. |
Not applicable.
Item 8. Portfolio Managers of Closed-End Management Investment Companies.
Not applicable.
| Item 9. | Purchases of Equity Securities by Closed-End Management Investment Companies and Affiliated Purchasers. |
Not applicable.
| Item 10. | Submission of Matters to a Vote of Security Holders. |
There have been no material changes to the procedures applicable to Item 10.
| Item 11. | Controls and Procedures. |
(a) The Registrant's principal executive and principal financial officers have concluded, based on their evaluation of the Registrant's disclosure controls and procedures as of a date within 90 days of the filing date of this report, that the Registrant's disclosure controls and procedures are reasonably designed to ensure that information required to be disclosed by the Registrant on Form N-CSR is recorded, processed, summarized and reported within the required time periods and that information required to be disclosed by the Registrant in the reports that it files or submits on Form N-CSR is accumulated and communicated to the Registrant's management, including its principal executive and principal financial officers, as appropriate to allow timely decisions regarding required disclosure.
(b) There were no changes to the Registrant's internal control over financial reporting that occurred during the period covered by this report that have materially affected, or are reasonably likely to materially affect, the Registrant's internal control over financial reporting.
| Item 12. | Disclosure of Securities Lending Activities for Closed-End Management Investment Companies. |
Not applicable.
| Item 13. | Exhibits. |
(a)(1) Code of ethics referred to in Item 2.
(a)(3) Not applicable.
SIGNATURES
Pursuant to the requirements of the Securities Exchange Act of 1934 and the Investment Company Act of 1940, the Registrant has duly caused this Report to be signed on its behalf by the undersigned, thereunto duly authorized.
BNY Mellon Strategic Funds, Inc.
By: /s/ David J. DiPetrillo
David J. DiPetrillo
President (Principal Executive Officer)
Date: January 21, 2023
Pursuant to the requirements of the Securities Exchange Act of 1934 and the Investment Company Act of 1940, this Report has been signed below by the following persons on behalf of the Registrant and in the capacities and on the dates indicated.
By: /s/ David J. DiPetrillo
David J. DiPetrillo
President (Principal Executive Officer)
Date: January 21, 2023
By: /s/ James Windels
James Windels
Treasurer (Principal Financial Officer)
Date: January 20, 2023
EXHIBIT INDEX
(a)(1) Code of ethics referred to in Item 2.
(a)(2) Certifications of principal executive and principal financial officers as required by Rule 30a-2(a) under the Investment Company Act of 1940. (EX-99.CERT)
(b) Certification of principal executive and principal financial officers as required by Rule 30a-2(b) under the Investment Company Act of 1940. (EX-99.906CERT)