Exhibit 99
Targeting Profitable Growth
Ohio Casualty Corporation Investor Presentation
September 17, 2004
Forward Looking Statements
Certain of the statements contained in these materials, including all financial forecasts and projections, are forward-looking statements within the meaning of the Private Securities Litigation Reform Act. Forward-looking statements are typically identified herein by words or phrases such as "expect," "project," "forecast," "plan," "goal," and similar expressions of future or conditional verbs such as "will," "should," and "would." Future premium levels, loss experience, operating expenses and profits are all influenced by a number of factors, including those identified below, all of which are inherently difficult to forecast. Consequently, actual results may differ materially from those included in the forward-looking statements. Among the factors that could cause actual results to differ materially from the forward-looking statements are the following:
General Industry Factors
Pricing environment for the Corporation’s insurance products and general competition Changes in governmental regulation
Acts of war and terrorist activities
Fluctuations in interest rates and performance of the financial markets
General economic and market conditions
Corporation-Specific Factors
Ability of the Corporation to successfully execute its Corporate Strategic Plan
Ability of the Corporation to maintain appropriate lines of credit
Ability of the Corporation to achieve and maintain planned price increases for its insurance products Ability of the Corporation to achieve and maintain planned expense savings
Ability of the Corporation to retain key employees and agents having the experience and skills necessary to execute the Corporation’s Strategic Plan Ability of the Corporation to attain planned benefits from technology initiatives Ability of the Corporation to maintain sufficient financial strength ratings Adequacy of the Corporation’s property and casualty reserves Catastrophe losses and other adverse claims experience Availability and pricing of reinsurance Litigation and administrative proceedings
Other factors that could cause actual results to differ include those matters set forth in the Corporation’s Annual Report on Form 10-K for the fiscal year ended December 31, 2003. The Corporation disclaims any obligation or intention to publicly update or revise any of the forward-looking statements contained in these materials, whether as a result of new information, future events or otherwise.
Targeting Profitable Growth
2
Objectives of This Meeting
Update of the 2004-2006 Strategic Plan Discuss execution of the Strategic Plan
Provide an agent’s perspective on the Ease of Doing Business (EODB) initiatives Q & A with Executive Management Team
Targeting Profitable Growth
3
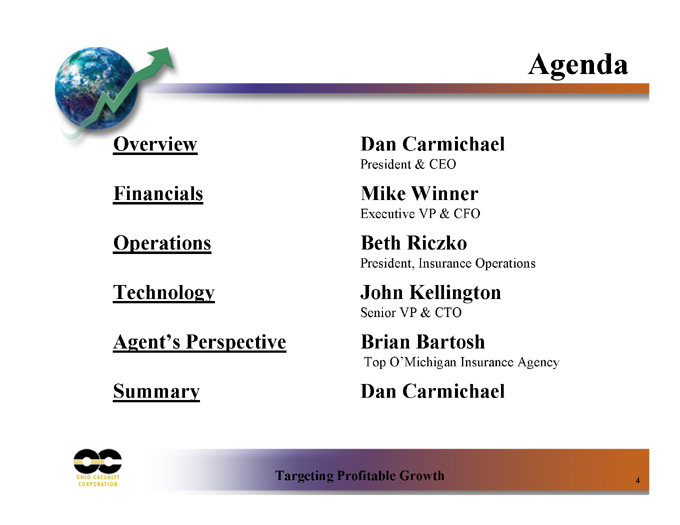
Agenda
Overview Dan Carmichael
President & CEO
Financials Mike Winner
Executive VP & CFO
Operations Beth Riczko
President, Insurance Operations
Technology John Kellington
Senior VP & CTO
Agent’s Perspective Brian Bartosh
Top O’Michigan Insurance Agency
Summary Dan Carmichael
Targeting Profitable Growth
4
Corporate Overview
Dan Carmichael President & CEO
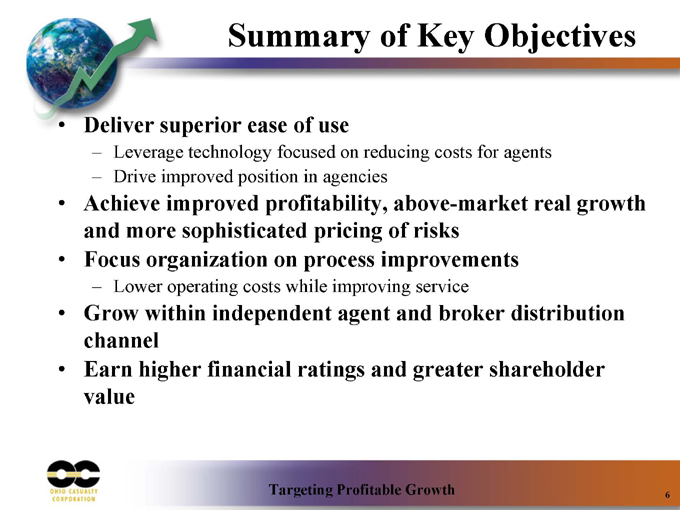
Summary of Key Objectives
Deliver superior ease of use
Leverage technology focused on reducing costs for agents Drive improved position in agencies
Achieve improved profitability, above-market real growth and more sophisticated pricing of risks Focus organization on process improvements
Lower operating costs while improving service
Grow within independent agent and broker distribution channel Earn higher financial ratings and greater shareholder value
Targeting Profitable Growth
6
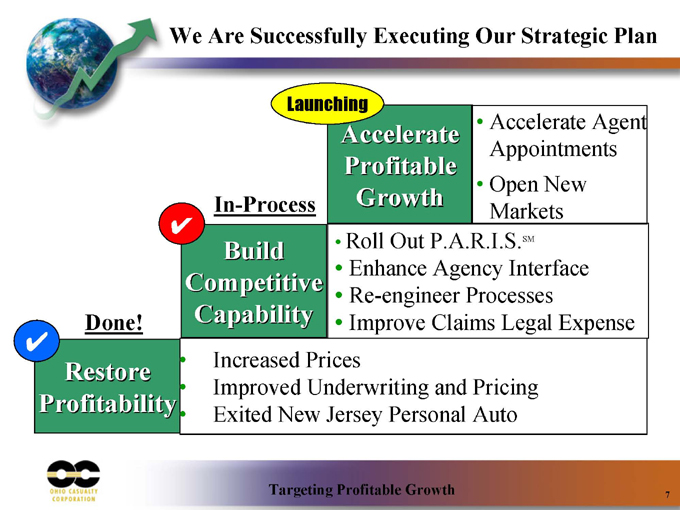
We Are Successfully Executing Our Strategic Plan
Launching
Accelerate Profitable Growth
Accelerate Agent Appointments Open New Markets
In-Process
Build Competitive Capability
Roll Out P.A.R.I.S.SM Enhance Agency Interface Re-engineer Processes Improve Claims Legal Expense
Done!
Restore Profitability
Increased Prices
Improved Underwriting and Pricing Exited New Jersey Personal Auto
Targeting Profitable Growth
7
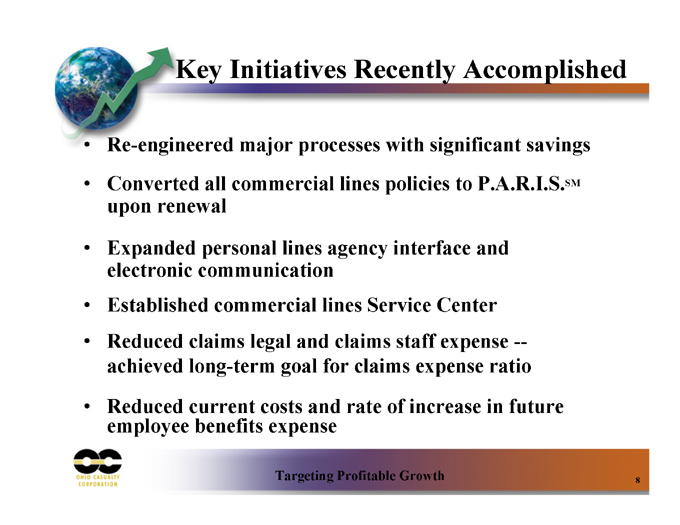
Key Initiatives Recently Accomplished
Re-engineered major processes with significant savings Converted all commercial lines policies to P.A.R.I.S.SM upon renewal
Expanded personal lines agency interface and electronic communication Established commercial lines Service Center Reduced claims legal and claims staff expense — achieved long-term goal for claims expense ratio Reduced current costs and rate of increase in future employee benefits expense
Targeting Profitable Growth
8
Key Initiatives in Progress
Install commercial lines policy issuance by agents Achieve additional expense savings from further workflow re-engineering Use predictive modeling to enhance pricing analysis Continue agency value analysis, segmentation and improved agent communication Strengthen marketing capabilities Continue upgrading skills of underwriting and claims professionals
Targeting Profitable Growth
9
Financial Update
Mike Winner Executive VP & CFO
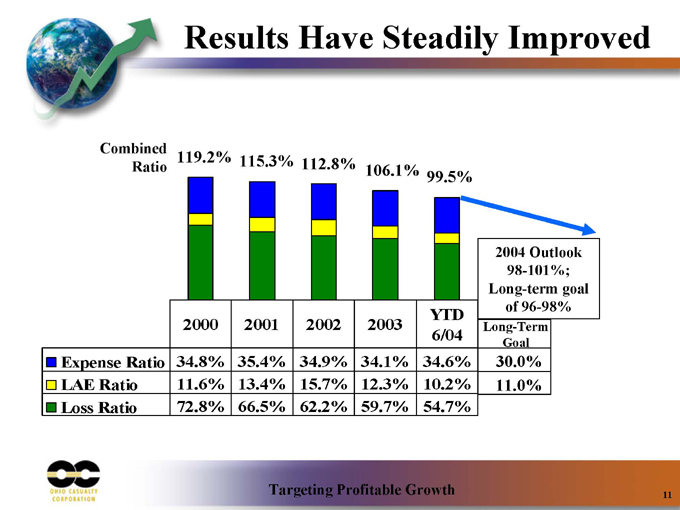
Results Have Steadily Improved
Combined Ratio
119.2% 115.3% 112.8%
106.1% 99.5%
2004 Outlook 98-101%; Long-term goal of 96-98%
2000 2001 2002 2003 YTD 6/04
Expense Ratio 34.8% 35.4% 34.9% 34.1% 34.6%
LAE Ratio 11.6% 13.4% 15.7% 12.3% 10.2%
Loss Ratio 72.8% 66.5% 62.2% 59.7% 54.7%
Long-Term Goal
30.0%
11.0%
Targeting Profitable Growth
11
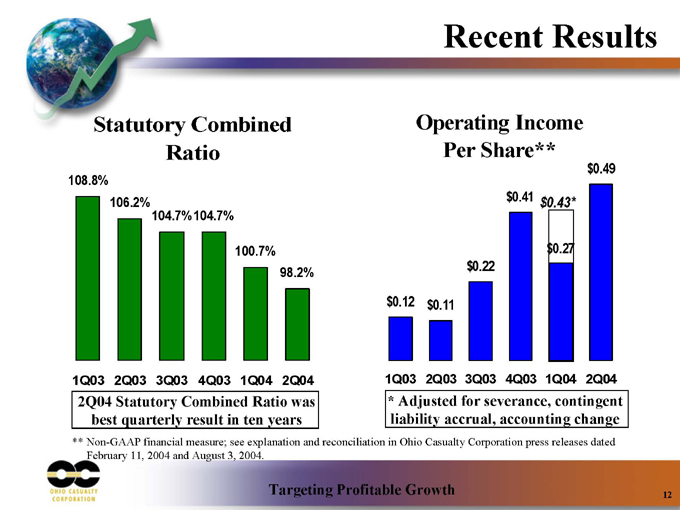
Recent Results
Statutory Combined Ratio
108.8%
106.2%
104.7%
104.7%
100.7%
98.2%
1Q03 2Q03 3Q03 4Q03 1Q04 2Q04
2Q04 Statutory Combined Ratio was best quarterly result in ten years
Operating Income Per Share** $0.12 $0.11 $0.22 $0.41 $0.43* $0.27 $0.49
1Q03 2Q03 3Q03 4Q03 1Q04 2Q04
* Adjusted for severance, contingent liability accrual, accounting change
** Non-GAAP financial measure; see explanation and reconciliation in Ohio Casualty Corporation press releases dated February 11, 2004 and August 3, 2004.
Targeting Profitable Growth
12
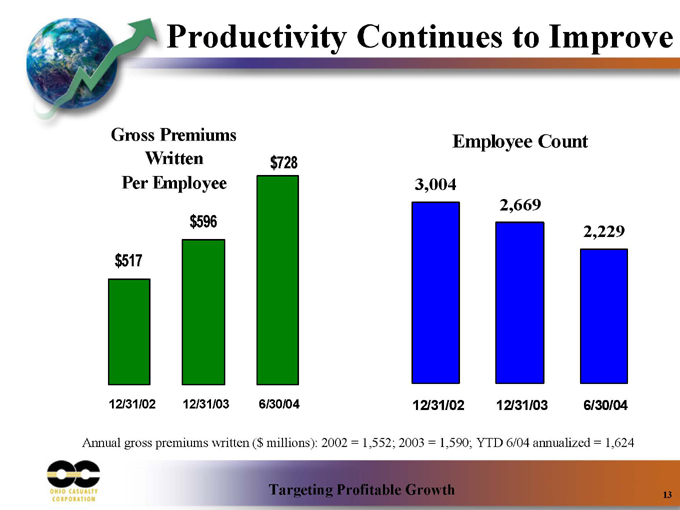
Productivity Continues to Improve
Gross Premiums Written Per Employee
$517
$596
$728
12/31/02 12/31/03 6/30/04
Employee Count
3,004
2,669
2,229
12/31/02 12/31/03 6/30/04
Annual gross premiums written ($ millions): 2002 = 1,552; 2003 = 1,590; YTD 6/04 annualized = 1,624
Targeting Profitable Growth
13
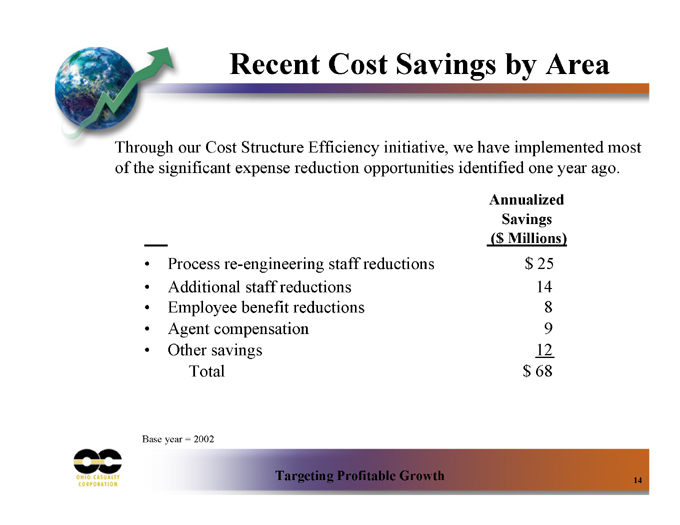
Recent Cost Savings by Area
Through our Cost Structure Efficiency initiative, we have implemented most of the significant expense reduction opportunities identified one year ago.
Annualized Savings ($ Millions)
Process re-engineering staff reductions $ 25
Additional staff reductions 14
Employee benefit reductions 8
Agent compensation 9
Other savings 12
Total $ 68
Base year = 2002
Targeting Profitable Growth
14
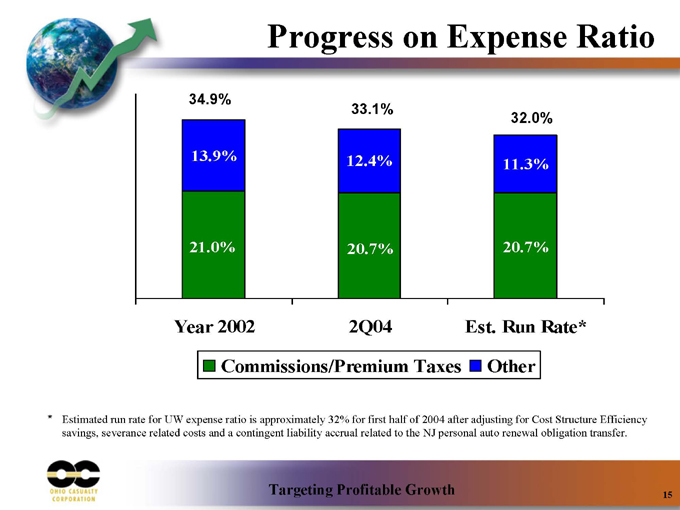
Progress on Expense Ratio
34.9%
13.9%
21.0%
33.1%
12.4%
20.7%
32.0%
11.3%
20.7%
Year 2002 2Q04 Est. Run Rate*
Commissions/Premium Taxes Other
* Estimated run rate for UW expense ratio is approximately 32% for first half of 2004 after adjusting for Cost Structure Efficiency savings, severance related costs and a contingent liability accrual related to the NJ personal auto renewal obligation transfer.
Targeting Profitable Growth
15
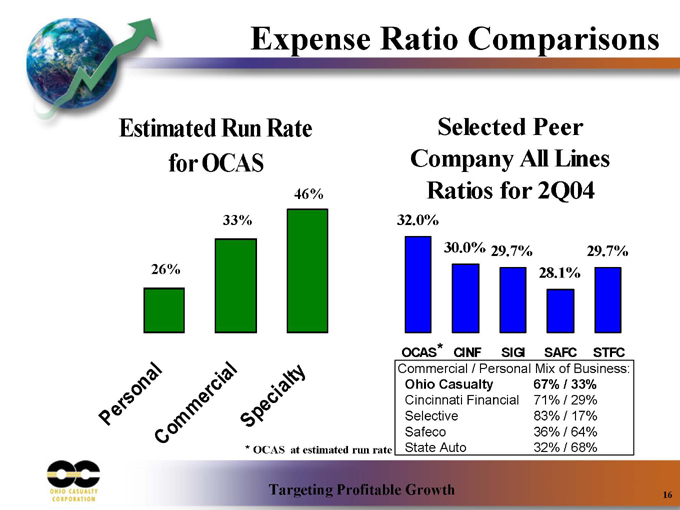
Expense Ratio Comparisons
Estimated Run Rate for OCAS
26%
33%
46%
Personal Commercial
Specialty
Selected Peer Company All Lines Ratios for 2Q04
32.0%
30.0%
29.7%
28.1%
29.7%
OCAS* CINF SIGI SAFC STFC
Commercial / Personal Mix of Business:
Ohio Casualty 67% / 33%
Cincinnati Financial 71% / 29%
Selective 83% / 17%
Safeco 36% / 64%
State Auto 32% / 68%
* OCAS at estimated run rate
Targeting Profitable Growth
16
Investment Strategy
Overall Strategy
Remain fully invested (maintain $20-40 million in operating cash) Optimize after-tax income while maintaining disciplined portfolio risk profile Balance internal and external investment management
Fixed Income Portfolio
Grow tax-exempt portfolio commensurate with corporate profitability Targeting 12-31-04 tax-exempt portfolio of $700 million to $1 billion Maintain “A” or better average rating Maintain intermediate bond duration (4.8 years @ 6/30/04) Maintain laddered maturity structure Reduce the allocation to mortgage-backed securities
Equity Portfolio
Maintain allocation to equities at 35-45% of surplus
Targeting Profitable Growth
17

Operations Review
Beth Riczko President, Insurance Operations
Competitive Advantages
Versus National Companies
Stronger agency relationships Superior local knowledge of markets
Versus Regional Companies
Greater scale to support technology advantage More data to increase pricing sophistication
Targeting Profitable Growth
19
Relationships & Market Knowledge
Structured to build strong agency relationships
Service Center maintains agency name recognition in customer communication Personal lines underwriters are dedicated to specific agents Segregation of commercial lines underwriters for new business versus retained business renewals
Focus on core geography provides opportunities for local market knowledge
Concentration of premium volume in top 5 personal lines states is approximately 65% Concentration of premium volume in top 10 commercial lines states is approximately 60%
Targeting Profitable Growth
20
Scale For Technology Advantages
State-of-the-art technology
P.A.R.I.S.SM software platform supports all commercial lines products for all states Personal lines and specialty lines under development
Agency Interface applications with SEMCI options
Agents can lower their cost of doing business and improve their access to OCAS data Widespread adoption of existing interface solutions with 80% of all personal lines new business input by agents
Claims department utilizing “best of breed” tools & methods
SEMCI stands for Single Entry, Multiple Company Interface
Targeting Profitable Growth
21

Data for Pricing Sophistication
Workers Compensation Loss Experience by Territorial Relativity
0.80 0.75 0.70 0.65 0.60 0.55
0.50 0.45
0.40 0.35 0.30 0.25 0.20 0.15
200%
180%
160%
140%
120% 100% 80%
60%
40%
20%
0%
>= 0.7, < 0.8 >= 0.8, < 0.9 >= 0.9, < 1 >= 1, < 1.1 >= 1.1, < 1.2 >= 1.2, < 1.3 >= 1.3, < 1.4 >= 1.4
Territory Relativity
Targeting Profitable Growth
22
Technology Update
John Kellington Senior VP & CTO
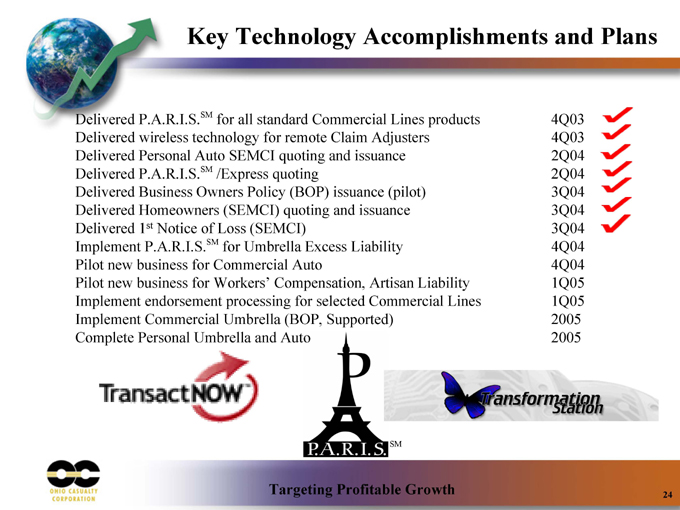
Key Technology Accomplishments and Plans
Delivered P.A.R.I.S.SM for all standard Commercial Lines products 4Q03
Delivered wireless technology for remote Claim Adjusters 4Q03
Delivered Personal Auto SEMCI quoting and issuance 2Q04
Delivered P.A.R.I.S.SM /Express quoting 2Q04
Delivered Business Owners Policy (BOP) issuance (pilot) 3Q04
Delivered Homeowners (SEMCI) quoting and issuance 3Q04
Delivered 1st Notice of Loss (SEMCI) 3Q04
Implement P.A.R.I.S.SM for Umbrella Excess Liability 4Q04
Pilot new business for Commercial Auto 4Q04
Pilot new business for Workers’ Compensation, Artisan Liability 1Q05
Implement endorsement processing for selected Commercial Lines 1Q05
Implement Commercial Umbrella (BOP, Supported) 2005
Complete Personal Umbrella and Auto 2005
Targeting Profitable Growth
24
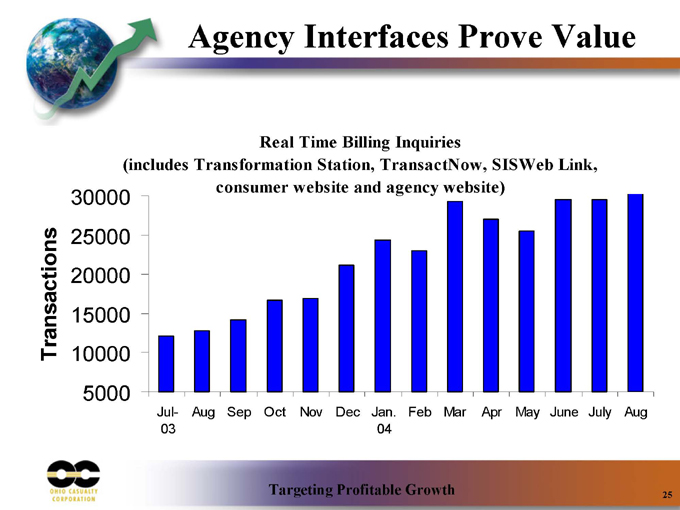
Agency Interfaces Prove Value
Real Time Billing Inquiries
(includes Transformation Station, TransactNow, SISWeb Link, consumer website and agency website)
Transactions
30000
25000
20000
15000
10000
5000
Jul- Aug Sep Oct Nov Dec Jan. Feb Mar Apr May June July Aug
03 04
Targeting Profitable Growth
25
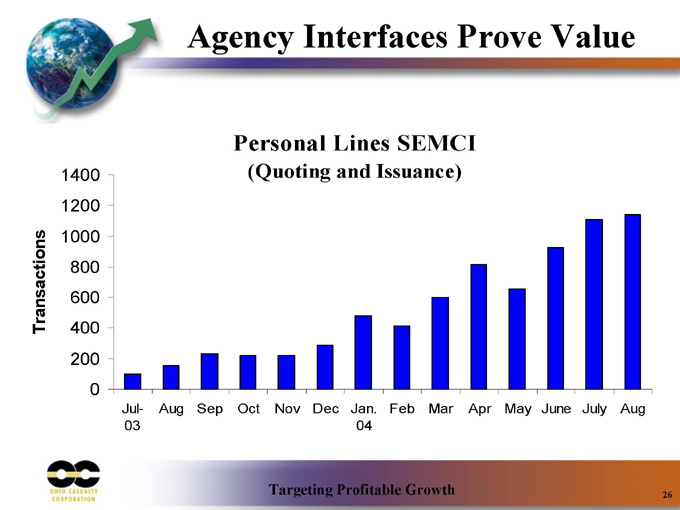
Agency Interfaces Prove Value
Personal Lines SEMCI
(Quoting and Issuance)
Transactions
1400 1200 1000 800 600 400 200 0
Jul- Aug Sep Oct Nov Dec Jan. Feb Mar Apr May June July Aug
03 04
Targeting Profitable Growth
26
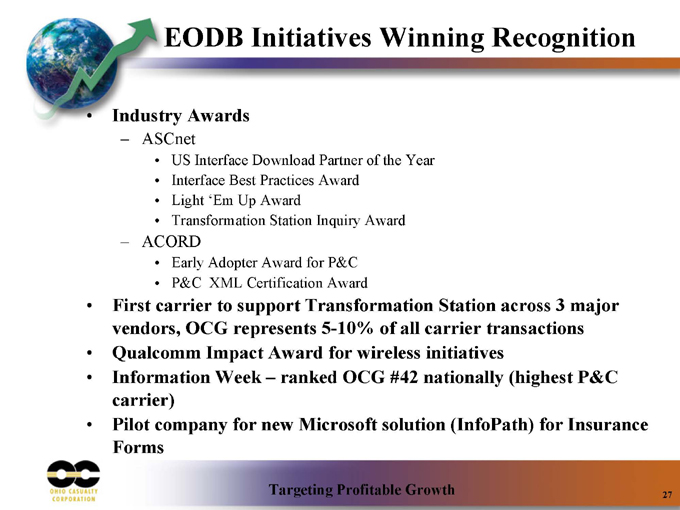
EODB Initiatives Winning Recognition
Industry Awards
ASCnet
US Interface Download Partner of the Year Interface Best Practices Award Light ‘Em Up Award Transformation Station Inquiry Award
ACORD
Early Adopter Award for P&C P&C XML Certification Award
First carrier to support Transformation Station across 3 major vendors, OCG represents 5-10% of all carrier transactions Qualcomm Impact Award for wireless initiatives Information Week – ranked OCG #42 nationally (highest P&C carrier) Pilot company for new Microsoft solution (InfoPath) for Insurance Forms
Targeting Profitable Growth
27
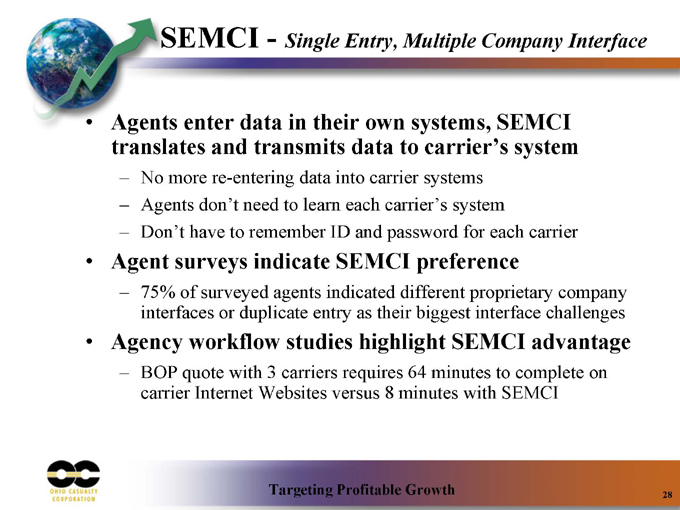
SEMCI - Single Entry, Multiple Company Interface
Agents enter data in their own systems, SEMCI translates and transmits data to carrier’s system
No more re-entering data into carrier systems Agents don’t need to learn each carrier’s system
Don’t have to remember ID and password for each carrier
Agent surveys indicate SEMCI preference
75% of surveyed agents indicated different proprietary company interfaces or duplicate entry as their biggest interface challenges
Agency workflow studies highlight SEMCI advantage
BOP quote with 3 carriers requires 64 minutes to complete on carrier Internet Websites versus 8 minutes with SEMCI
Targeting Profitable Growth
28
Why A Carrier’s Technology Is Important
Brian Bartosh Top O’Michigan Insurance Agency

Top O’ Michigan Insurance
Multi-Line Insurance Agency in Michigan Began in 1974 First automation in 1982 29 Employees Main Office Financial Services Office 7 Branch Sales Offices
Targeting Profitable Growth
30
We have our own priorities
Majority of service to our clients begins at the agency We’d like a consistent approach to carrier interaction Inefficient work-flows cost us real money Training has always been an issue Quick response from carrier allows us to provide quick response to our clients
Targeting Profitable Growth
31
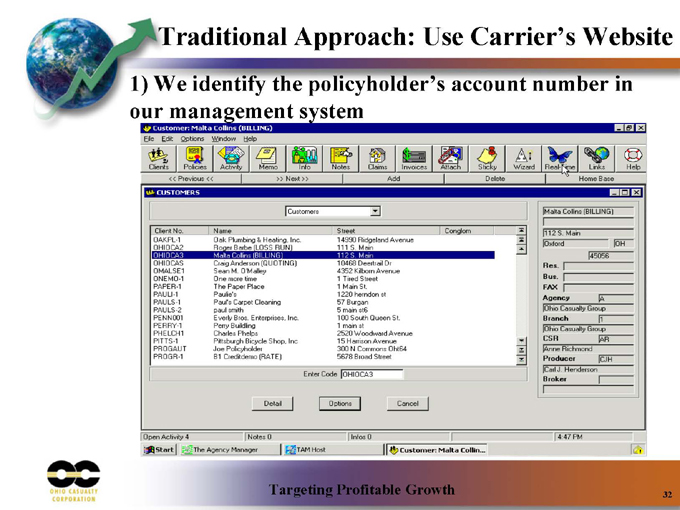
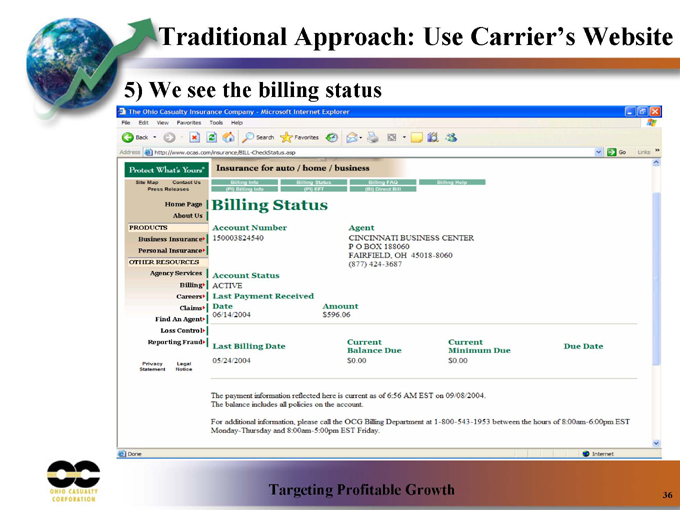
Traditional Approach: Use Carrier’s Website
1) We identify the policyholder’s account number in our management system
Targeting Profitable Growth
32
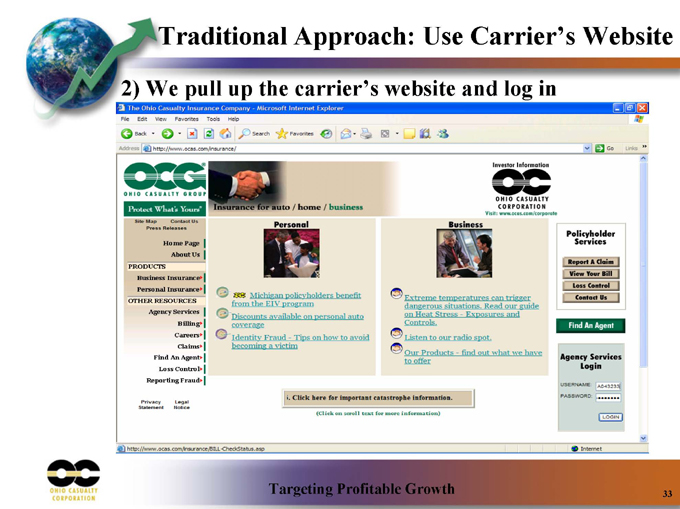
Traditional Approach: Use Carrier’s Website
2) We pull up the carrier’s website and log in
Targeting Profitable Growth
33
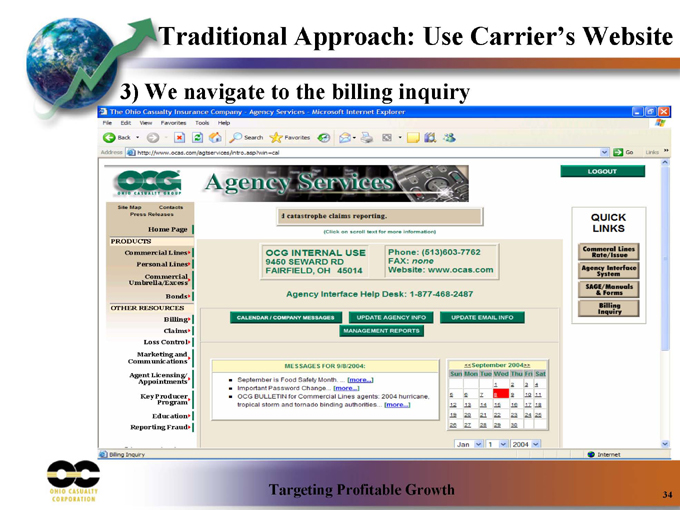
Traditional Approach: Use Carrier’s Website
3) We navigate to the billing inquiry
Targeting Profitable Growth
34
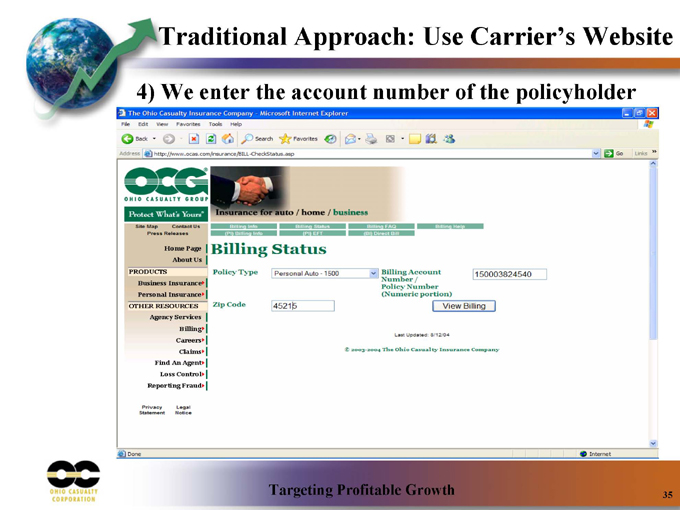
Traditional Approach: Use Carrier’s Website
4) We enter the account number of the policyholder
Targeting Profitable Growth
35
Traditional Approach: Use Carrier’s Website
5) We see the billing status
Targeting Profitable Growth
36
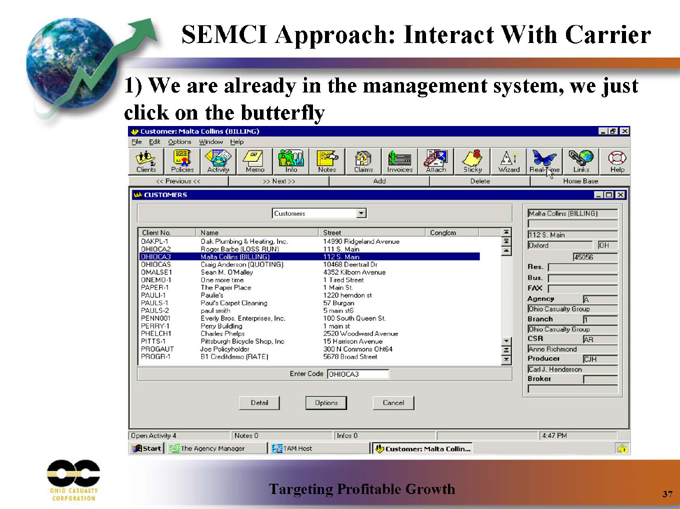
SEMCI Approach: Interact With Carrier
1) We are already in the management system, we just click on the butterfly
Targeting Profitable Growth
37
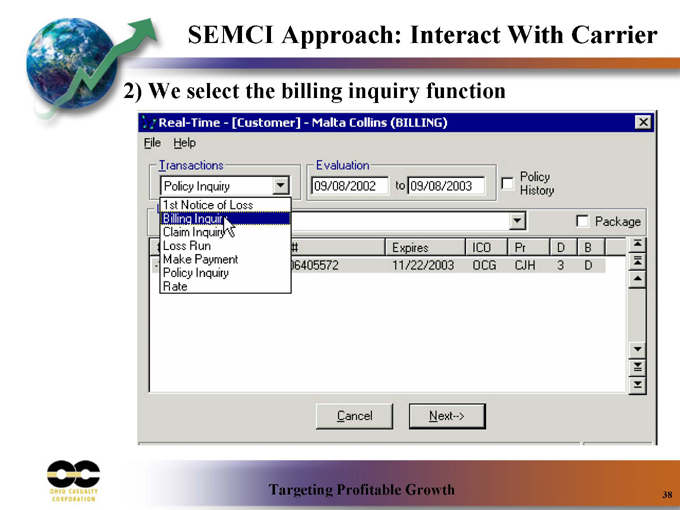
SEMCI Approach: Interact With Carrier
2) We select the billing inquiry function
Targeting Profitable Growth
38
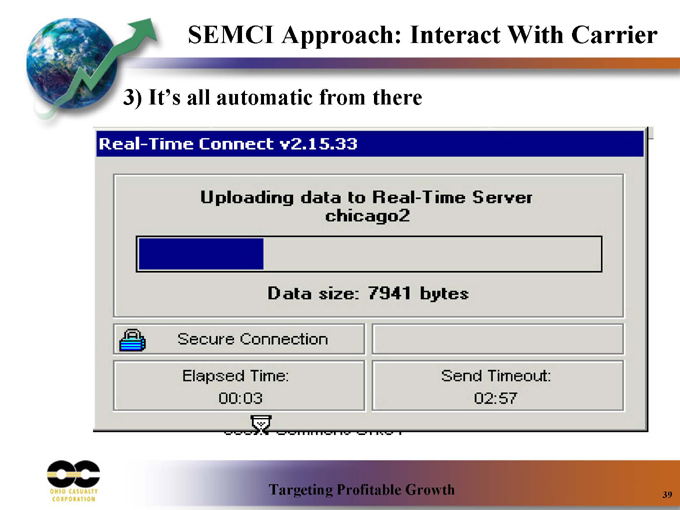
SEMCI Approach: Interact With Carrier
3) It’s all automatic from there
Targeting Profitable Growth
39
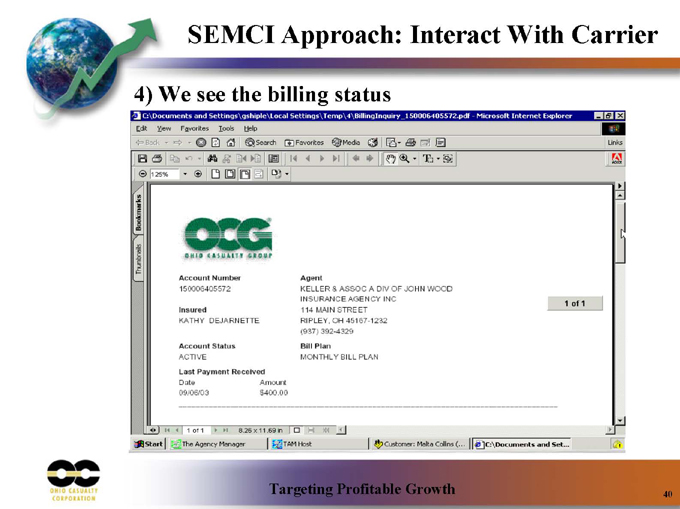
SEMCI Approach: Interact With Carrier
4) We see the billing status
Targeting Profitable Growth
40
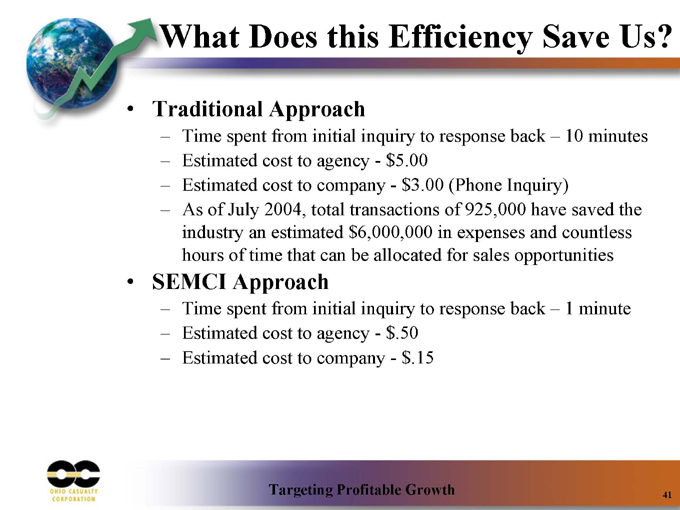
What Does this Efficiency Save Us?
Traditional Approach
Time spent from initial inquiry to response back – 10 minutes Estimated cost to agency—$5.00 Estimated cost to company—$3.00 (Phone Inquiry) As of July 2004, total transactions of 925,000 have saved the industry an estimated $6,000,000 in expenses and countless hours of time that can be allocated for sales opportunities
SEMCI Approach
Time spent from initial inquiry to response back – 1 minute Estimated cost to agency—$.50 Estimated cost to company—$.15
Targeting Profitable Growth
41
We Ask these Questions of Our Carriers:
Do you believe SEMCI is a positive industry direction?
What is your commitment to the SEMCI solutions available today?
What are your timelines for implementing the most common SEMCI transactions?
Targeting Profitable Growth
42
The industry’s perspective of Ohio Casualty
Leader in support of agency workflows using SEMCI Not just an innovator, but an implementer!
Technology compliments business operations
Targeting Profitable Growth
43

Summary
Dan Carmichael
Turnaround Is Complete
Actions in 2001-2003 have restored profitability Process is in place to continue reducing expenses Award-winning P.A.R.I.S.SM technology offers unique advantages EODB gains will accelerate top-line growth
Targeting Profitable Growth
45
Why Invest in Ohio Casualty
This year’s cost reduction and EODB initiatives will pay off in 2005 Structural changes, targeted marketing and sophisticated pricing will accelerate profitable growth Technology improvements, service center, and other Ease Of Doing Business efforts will tighten our link to top quality agents, gaining more of their business Emphasis on improving financial strength, increasing book value Refinancing notes will enhance EPS in 2005
Targeting Profitable Growth
46