Exhibit 99.1

Investor PresentationSeptember 2017
Forward Looking Statements This document contains forward-looking statements as defined in the Private Securities Litigation Reform Act of 1995. There are several factors that could cause actual results to differ significantly from expectations described in the forward-looking statements. For a discussion of such factors, please see the Company’s most recent reports on Forms 10-K and 10-Q filed with the Securities and Exchange Commission and available on the SEC’s website at www.sec.gov. The Company does not undertake any obligation to update forward-looking statements. 2 Non-GAAP Financial Statements This document contains certain non-GAAP financial measures in addition to results presented in accordance with Generally Accepted Accounting Principles (“GAAP”). These non-GAAP measures provide supplemental perspectives on operating results, performance trends, and financial condition. They are not a substitute for GAAP measures; they should be read and used in conjunction with the Company’s GAAP financial information. A reconciliation of non-GAAP financial measures to GAAP measures is included in the second quarter earnings release and Form 10-Q which can be found at www.bhbt.com. In all cases, it should be understood that non-GAAP per share measures do not depict amounts that accrue directly to the benefit of shareholders. The Company utilizes the non-GAAP measure of core earnings in evaluating operating trends, including components for core revenue and expense. These measures exclude items which the Company does not view as related to its normalized operations. These items include securities gains/losses, merger costs, restructuring costs, and systems conversion costs. Non-core adjustments are presented net of an adjustment for income tax expense. This adjustment is determined as the difference between the GAAP tax rate and the effective tax rate applicable to core income. The efficiency ratio is adjusted for non-core revenue and expense items and for tax preference items. The Company also calculates measures related to tangible equity, which adjust equity (and assets where applicable) to exclude intangible assets due to the importance of these measures to the investment community. Charges related to the acquisition of Lake Sunapee Bank Group consist primarily of severance and retention cost, systems conversion and integration costs, and professional fees.
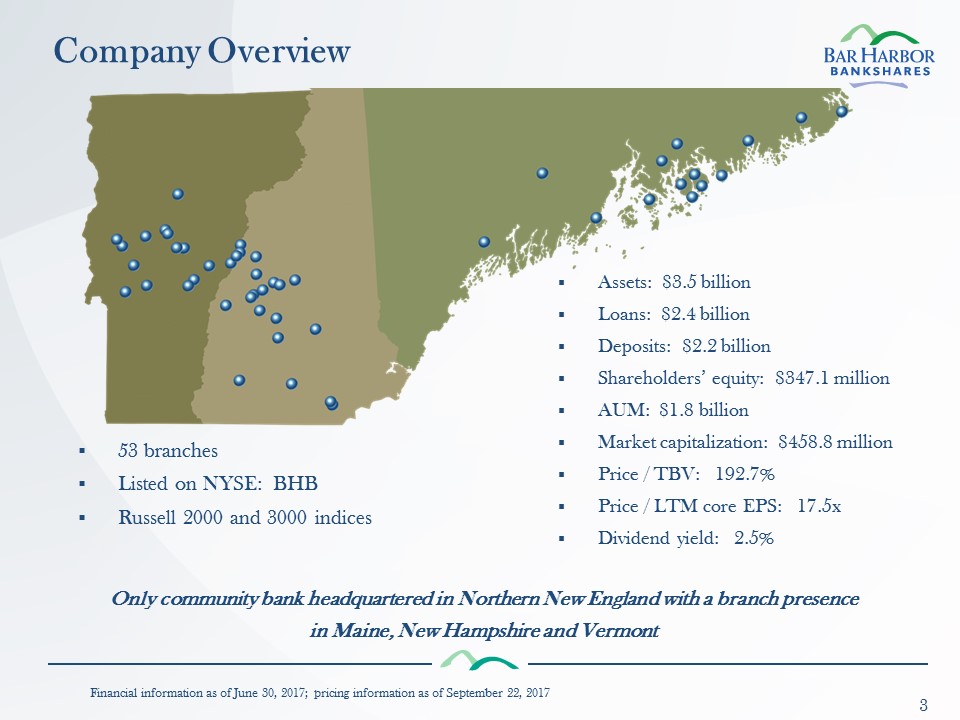
Company Overview 3 Only community bank headquartered in Northern New England with a branch presence in Maine, New Hampshire and Vermont Assets: $3.5 billionLoans: $2.4 billionDeposits: $2.2 billionShareholders’ equity: $347.1 millionAUM: $1.8 billionMarket capitalization: $458.8 millionPrice / TBV: 192.7%Price / LTM core EPS: 17.5xDividend yield: 2.5% 53 branchesListed on NYSE: BHBRussell 2000 and 3000 indices Financial information as of June 30, 2017; pricing information as of September 22, 2017
Deep and Talented Management Team 4 Curtis C. SimardPresident and CEO Josephine IannelliExecutive Vice President, Chief Financial Officer and Treasurer Richard B. Maltz Executive Vice President, Chief Operating Officer and Chief Risk Officer John MercierExecutive Vice President – Commercial Banking Gregory W. Dalton Executive Vice President – Commercial Banking William J. McIverExecutive Vice President – Regional President, New Hampshire and Vermont Markets Marsha C. SawyerExecutive Vice President – Human Resources Joseph M. PrattPresident Bar Harbor Trust Services
Employee and customer experience is the foundation of superior performance, which leads to significant financial benefit to our shareholdersWe value geography, heritage and performance while balancing growth and earningsRisk management and earnings sustainability while remaining true to our cultureCreated a service and sales driven culture with focus on core business growthSignificant investment in recent years in processes, products, technology, training, leadership and infrastructureLook to expand our brand and business model and deepen our market presenceCreate opportunity and growth for existing employees, while adding catalyst recruits across all levels of the company with broad experience and depth that value our cultureMaintain our strong commitment to compliance and to risk management given the evolving environment within the industry Our Business Model 5
Corporate Goals 6 Our corporate goal is to be among the most profitable banks in New England Targeting a return on average assets in the top quartile amongst our peers and a strong double-digit return on average equityGrowing fee income as a percentage of total revenueFocusing on core commercial banking cross sell activitiesLess reliance on wholesale fundingExpanding cash management product offerings;Recently added senior leadership in this area Financial information as of June 30, 2017
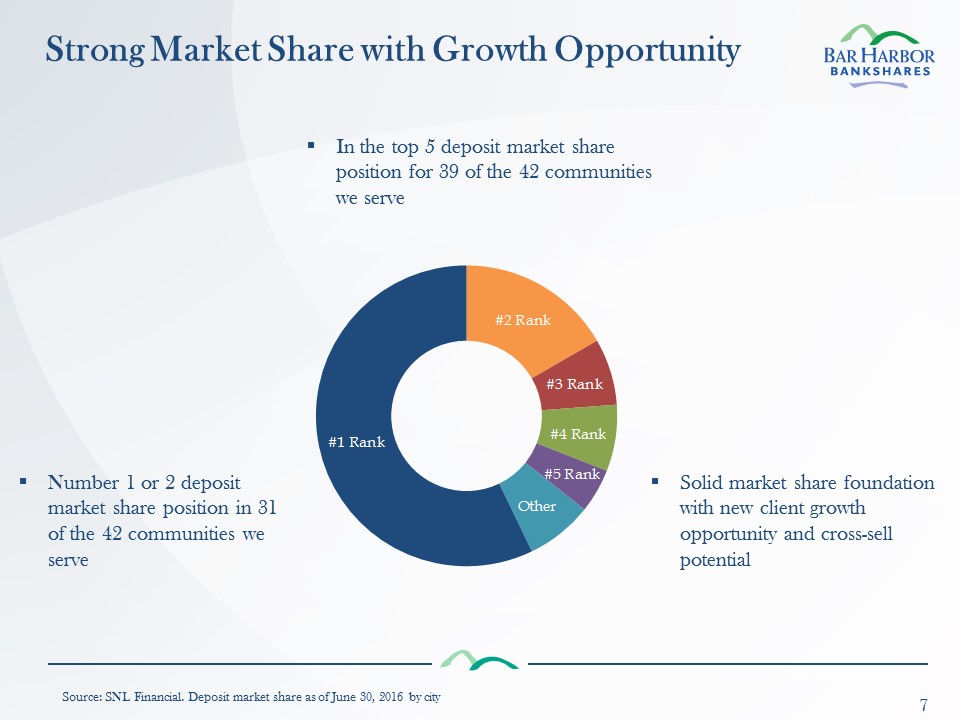
Strong Market Share with Growth Opportunity 7 Source: SNL Financial. Deposit market share as of June 30, 2016 by city In the top 5 deposit market share position for 39 of the 42 communities we serve Number 1 or 2 deposit market share position in 31 of the 42 communities we serve Solid market share foundation with new client growth opportunity and cross-sell potential
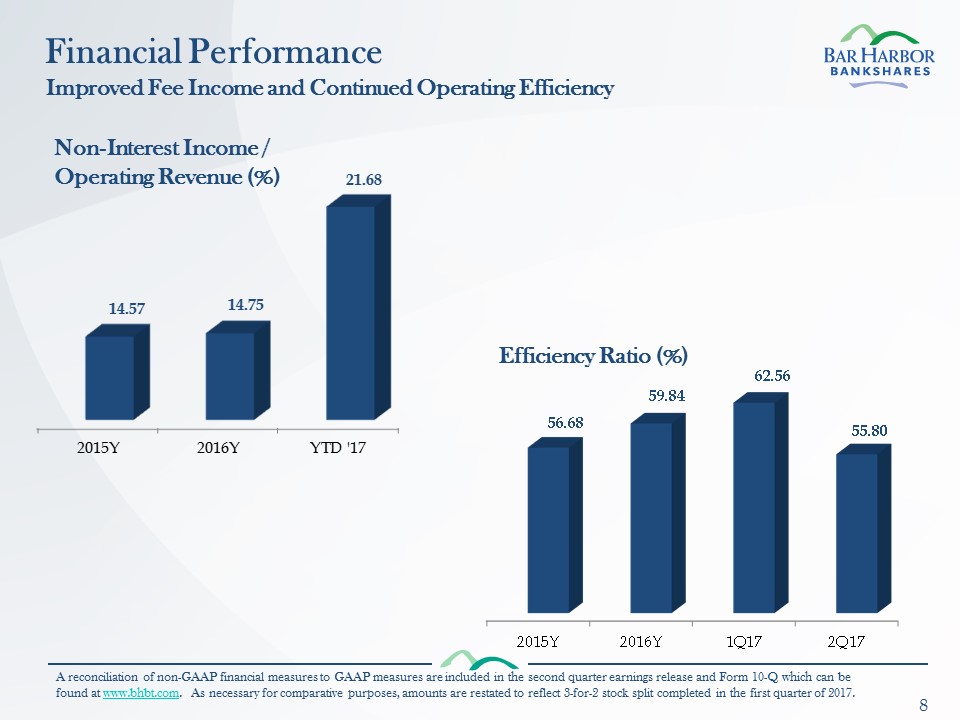
8 Non-Interest Income / Operating Revenue (%) Financial PerformanceImproved Fee Income and Continued Operating Efficiency Efficiency Ratio (%) A reconciliation of non-GAAP financial measures to GAAP measures are included in the second quarter earnings release and Form 10-Q which can be found at www.bhbt.com. As necessary for comparative purposes, amounts are restated to reflect 3-for-2 stock split completed in the first quarter of 2017.
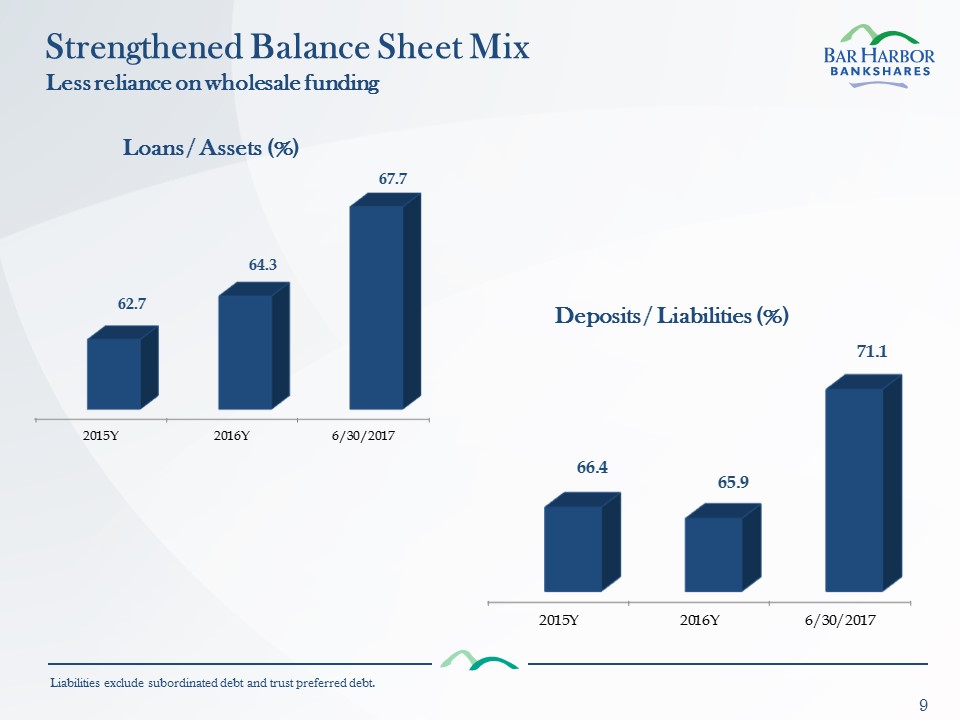
Strengthened Balance Sheet Mix 9 Less reliance on wholesale funding Deposits / Liabilities (%) Liabilities exclude subordinated debt and trust preferred debt. Loans / Assets (%)
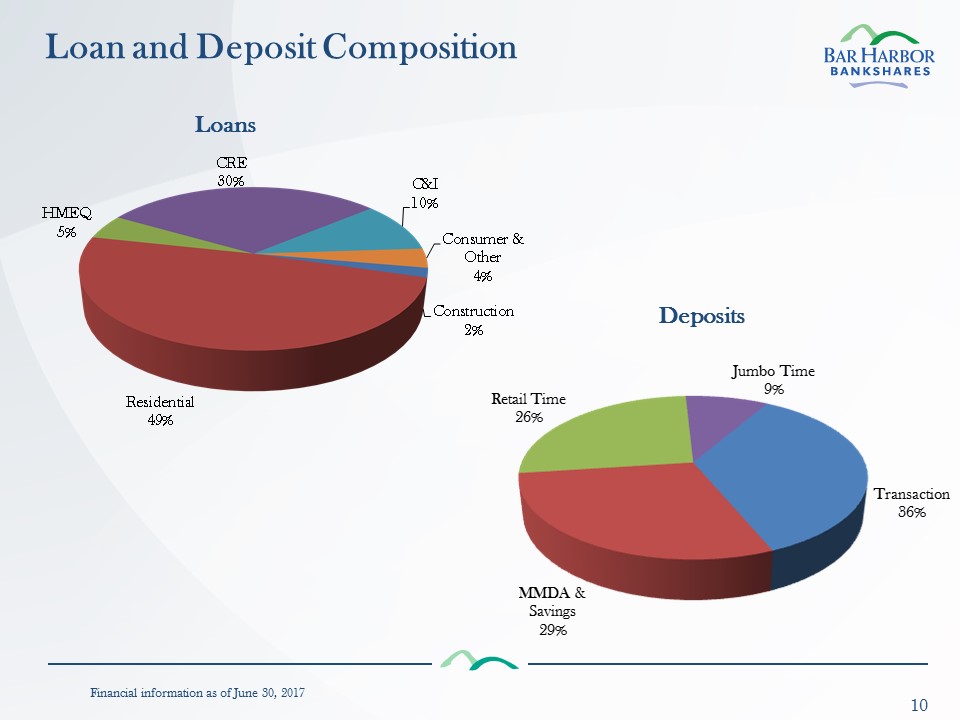
Loan and Deposit Composition 10 Deposits Loans Financial information as of June 30, 2017
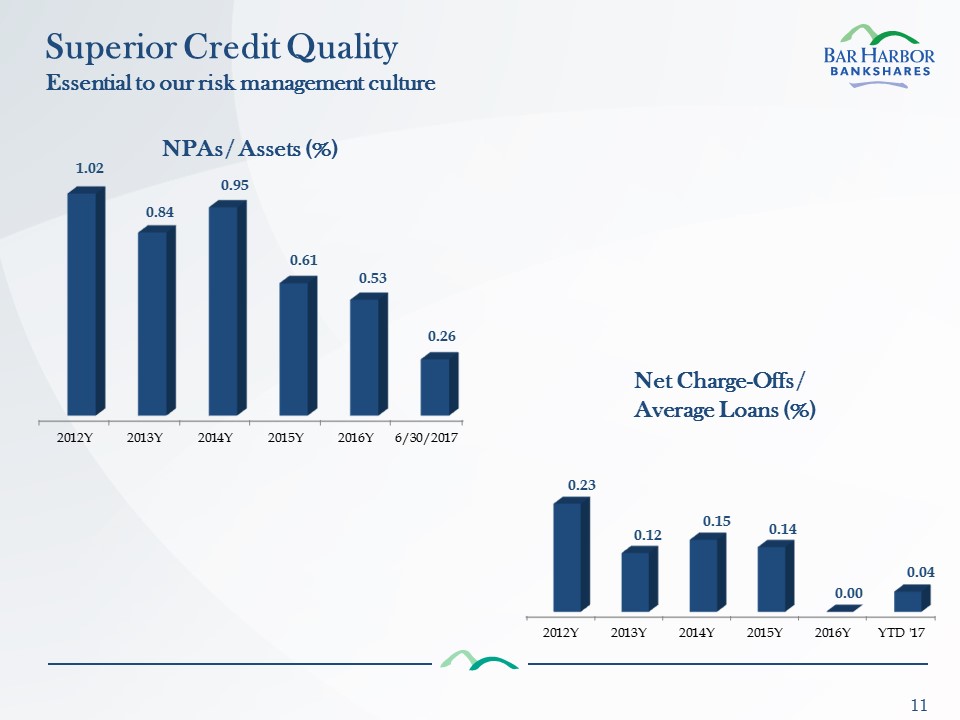
Superior Credit Quality 11 NPAs / Assets (%) Net Charge-Offs / Average Loans (%) Essential to our risk management culture
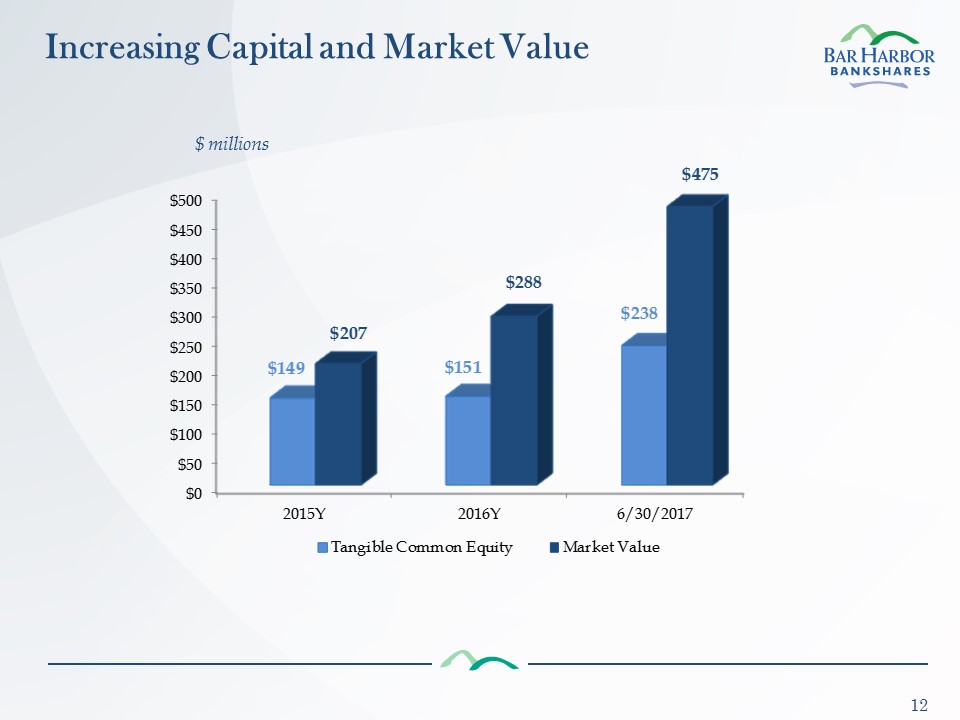
Increasing Capital and Market Value 12 $ millions
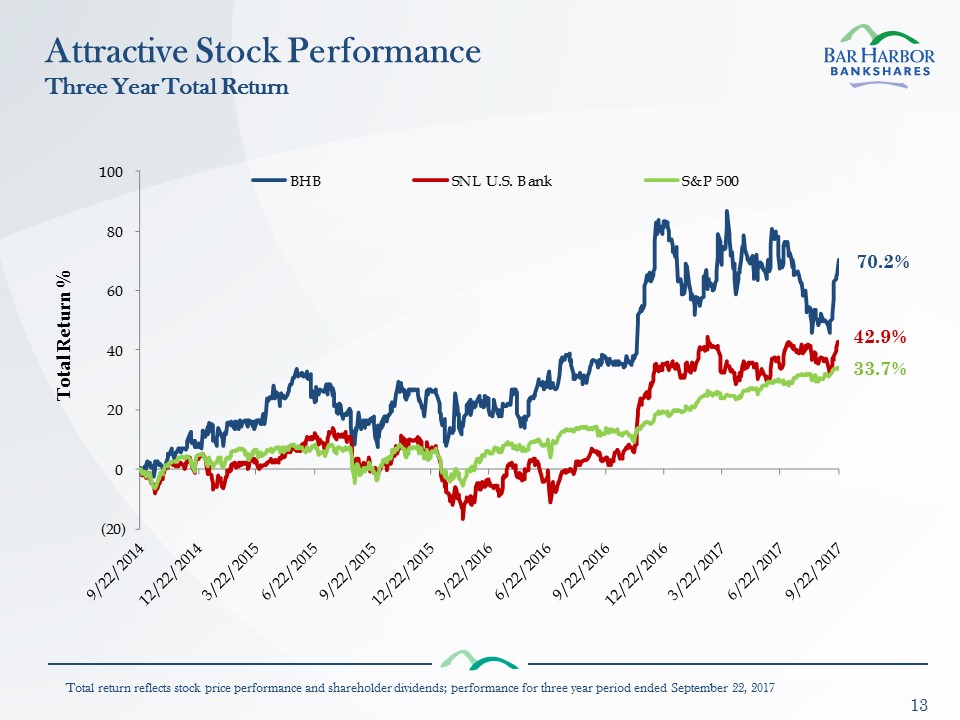
Attractive Stock PerformanceThree Year Total Return 13 70.2% 42.9% 33.7% Total Return % Total return reflects stock price performance and shareholder dividends; performance for three year period ended September 22, 2017
The Path Forward Leverage our size and expanded footprint while maintaining our community, customer, and employee focus as our most important asset. This is what we mean by A True Community BankMaintain our traditionally strong performance metricsContinually becoming more core and less wholesale with an improving product suiteExecute our traditional credit discipline in the face of heightening competitionNavigate a rising rate environment for the first time in almost ten years and its impact on deposit growth and pricingKeep pace with evolving risk in the sector, including cyber security and other enterprise wide risksFocus on operating leverage – top line revenue, disciplined expense management and balance sheet growth 14