Exhibit 99.1

Magna International Inc.
Second Quarter Report
2020
MAGNA INTERNATIONAL INC.
Management’s Discussion and Analysis of Results of Operations and Financial Position
Unless otherwise noted, all amounts in this Management’s Discussion and Analysis of Results of Operations and Financial Position [“MD&A”] are in U.S. dollars and all tabular amounts are in millions of U.S. dollars, except per share figures, which are in U.S. dollars. When we use the terms “we”, “us”, “our” or “Magna”, we are referring to Magna International Inc. and its subsidiaries and jointly controlled entities, unless the context otherwise requires.
This MD&A should be read in conjunction with the unaudited interim consolidated financial statements for the three and six months ended June 30, 2020 included in this Quarterly Report, and the audited consolidated financial statements and MD&A for the year ended December 31, 2019 included in our 2019 Annual Report to Shareholders.
This MD&A may contain statements that are forward looking. Refer to the “Forward-Looking Statements” section in this MD&A for a more detailed discussion of our use of forward-looking statements.
This MD&A has been prepared as at August 6, 2020.
USE OF NON-GAAP FINANCIAL MEASURES
In addition to results presented in accordance with accounting principles generally accepted in the United States of America [“U.S. GAAP”], this report includes the use of Adjusted (loss) earnings before interest and taxes [“Adjusted EBIT”], Adjusted EBIT as a percentage of sales, Adjusted diluted (loss) earnings per share, Return on Invested Capital, Adjusted Return on Invested Capital and Return on Equity [collectively, the “Non-GAAP Measures”]. We believe these non-GAAP financial measures provide additional information that is useful to investors in understanding our underlying performance and trends through the same financial measures employed by our management for this purpose. Readers should be aware that Non-GAAP Measures have no standardized meaning under U.S. GAAP and accordingly may not be comparable to the calculation of similar measures by other companies. We believe that Return on Invested Capital and Return on Equity are useful to both management and investors in their analysis of our results of operations and reflect our ability to generate returns. Similarly, we believe that Adjusted EBIT, Adjusted EBIT as a percentage of sales, Adjusted diluted (loss) earnings per share and Adjusted Return on Invested Capital provide useful information to our investors for measuring our operational performance as they exclude certain items that are not reflective of ongoing operating profit or loss and facilitate a comparison with prior periods. The presentation of any Non-GAAP Measures should not be considered in isolation or as a substitute for our related financial results prepared in accordance with U.S. GAAP. Non-GAAP financial measures are presented together with the most directly comparable U.S. GAAP financial measure, and a reconciliation to the most directly comparable U.S. GAAP financial measure, can be found in the “Non-GAAP Financial Measures Reconciliation” section of this MD&A.
FINANCIAL HIGHLIGHTS
| · | Global light vehicle production decreased 42%, including decreases of 70% and 59% in our two largest markets North America and Europe, respectively. The lower vehicle production was largely due to our customers’ production suspensions and volume reductions attributable to the COVID-19 pandemic. |
| · | Total sales decreased 58% to $4.3 billion in the second quarter of 2020, compared to $10.1 billion in the second quarter of 2019. |
| · | We estimate the impact of the COVID-19 pandemic reduced our sales in the second quarter of 2020 by approximately $5.5 billion and reduced Adjusted EBIT by approximately $1.2 billion. |
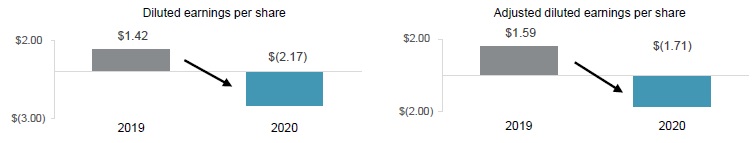
| · | Diluted loss per share was $2.17 for the second quarter of 2020. This is compared to diluted earnings per share of $1.42 for the second quarter of 2019. The significant decrease in earnings was primarily due to: |
| · | lost contribution on lower sales; |
| · | higher other expense (income), net, largely as a result of restructuring and impairment costs incurred in the second quarter of 2020; |
| · | in our ADAS business, higher engineering costs, including retroactive social tax costs, substantially associated with three programs that will be utilizing new technologies; |
| · | net provisions for customer claims during the second quarter of 2020; and |
| · | the impact of a lower effective income tax rate |
| · | Adjusted diluted loss per share was $1.71 in the second quarter of 2020 compared to adjusted diluted earnings per share of $1.59 in the second quarter of 2019. |
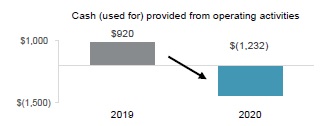
| · | Cash used for operating activities was $1.2 billion in the second quarter of 2020, compared to cash provided from operating activities of $920 million in the second quarter of 2019. The decrease was largely due to reduced earnings on lower sales and a significant investment in operating assets and liabilities as we restarted operations. |
| · | We paid a quarterly dividend of $0.40 per share in the second quarter of 2020. |
| · | We issued $750 million of 2.45% fixed rate Senior notes which mature in June 2030, to provide us with further financial flexibility at a relatively attractive interest rate. |
| Magna International Inc. Second Quarter Report 2020 1 |
OVERVIEW
OUR BUSINESS(1)
We are a mobility technology company. We have more than 152,000 entrepreneurial-minded employees and 346 manufacturing operations and 93 product development, engineering and sales centres in 27 countries. We have complete vehicle engineering and contract manufacturing expertise, as well as product capabilities which include body, chassis, exterior, seating, powertrain, active driver assistance, electronics, mechatronics, mirrors, lighting and roof systems. Magna also has electronic and software capabilities across many of these areas. Our common shares trade on the Toronto Stock Exchange (MG) and the New York Stock Exchange (MGA).
IMPACT OF COVID-19 ON OUR BUSINESS
CONSUMER CONFIDENCE; LIGHT VEHICLE SALES AND PRODUCTION
Consumer confidence, which is a significant driver of new vehicle sales, deteriorated significantly in the second quarter of 2020 as a result of the COVID-19 pandemic. Global consumer confidence levels experienced a record drop in the second quarter compared to the first quarter, due to factors such as deteriorating job prospects and rising anxieties about personal finances. On a regional basis, consumer confidence deteriorated in each of our primary geographic regions – North America, Europe and China. Looking forward, key factors which may further impact the recovery of consumer confidence include COVID-19 infection and death rates, as well as the continuing economic impact of the pandemic on household finances, particularly as government support programs wind-down.
New light vehicle sales in our two largest markets, North America and Europe, deteriorated in the second quarter of 2020 compared to the first quarter as mandatory stay at home orders and other measures intended to reduce the spread of COVID-19 inhibited consumers’ ability to purchase vehicles. However, during the second quarter, new light vehicle sales in both North America and Europe showed signs of recovery, which continued into July. Second quarter new light vehicle sales in China rebounded from the sharp drop in the first quarter.
During the second quarter of 2020, our most significant production markets of North America and Europe experienced vehicle production declines compared to the second quarter of 2019 that, both in percentage and absolute volume terms, far exceeded the worst comparable quarterly declines experienced during the 2008/2009 financial crisis/recession. Vehicle production fell 70% and 59% in North America and Europe, respectively. On a global basis, light vehicle production dropped 42% in the second quarter of 2020 compared to the second quarter of 2019, partially reflecting a 3% increase in China.
MANUFACTURING OPERATIONS
While many of our manufacturing facilities in China, Europe and North America had temporarily suspended operations beginning in the first quarter of 2020, the primary impact of such suspensions in North America and Europe was felt in the second quarter. Production has since resumed at all of our facilities in these regions, although not necessarily at pre-shutdown production levels. To date, we have not experienced further shut-downs at these manufacturing facilities, but production disruption risks remain, particularly in COVID-19 “hotspot” areas in which we operate such as parts of the U.S., Mexico, Brazil and India. Work from home arrangements implemented for our professional staff continue, in whole or in part, in a number of regions.
We continue to actively monitor the situation and adjust our plans in-line with our customers’ production plans, and in accordance with governmental orders and legal requirements in each of the markets in which we operate. We may take further actions with respect to production, where required by law or determined by us to be in the best interests of the company taking into account applicable stakeholders such as our employees, customers, suppliers or the communities in which we operate.
As we noted in our first quarter MD&A, it is difficult to determine with a high degree of accuracy the value of sales lost specifically as a result of the temporary suspension of production at OEM plants and reduced demand attributable to COVID-19. However, based on our expectations at the beginning of the year compared to final production levels for the second quarter, we estimate such lost sales to have been approximately $5.5 billion. It is similarly difficult to accurately determine the Adjusted EBIT impact specifically attributable to such lost sales. However, we estimate that Adjusted EBIT was negatively impacted by approximately $1.2 billion in the second quarter. For the Segment Analysis discussions below, the Adjusted EBIT impact includes the benefit of reduced fees paid to Corporate.
1 Manufacturing operations, product development, engineering and sales centres and employee figures include certain operations accounted for under the equity method.
| 2 Magna International Inc. Second Quarter Report 2020 |
EMPLOYEE HEALTH & SAFETY
The health and safety of our employees remains our number one priority. As the COVID-19 virus spread, we developed protocols, assessment tools and guidance documents to assist all of our manufacturing facilities, as well as engineering, R&D, sales and other offices. We also disseminated health screening tools and isolation guides for our employees, instituted contact tracing for any known cases of the virus within our employee population, instituted decontamination procedures, disseminated personal protective gear to employees and installed personal protective equipment where needed in our production and office facilities.
In order to minimize the COVID-19 health and safety risks to our employees, our medical and health and safety staff have complied with applicable legal requirements and have worked in coordination with public health authorities, as well as the medical directors of our OEM customers to share best practices, as well as to promote employee safety and confidence for return to work. Return to work protocols have been consolidated into our “Smart Start Playbook”, a return to work guide for managers throughout the company, which includes a streamlined set of checklists and practical recommendations based on guidelines from the Centers for Disease Control and Prevention and the World Health Organization. We have shared the playbook with our customers and suppliers in order to promote the health and safety of employees throughout the automotive value chain. Moreover, we continue to build on the knowledge gained in managing employee health and safety risks in the first half of 2020 to plan and prepare for potential second or subsequent waves of COVID-19.
Approximately 700 of our approximately 152,000 employees have been confirmed as having contracted COVID-19, of which approximately 440 have recovered and over 250 are current active cases. Regrettably, ten of our employees are confirmed to have passed away as a result of COVID-19 as at June 30, 2020. Based on contact tracing, we have had no confirmed cases to date of employee-to-employee transmission in our facilities.
EMPLOYEE INCOME AND BENEFITS PROTECTIONS
In light of the suspensions of production earlier in the year, temporary layoffs of employees were inevitable. However, we took a number of steps during such suspensions to minimize the impact felt by our employees, including:
| · | maintaining employee benefits coverages through the layoff period; |
| · | maximizing the number of days at full compensation during the layoff period through utilization of vacation days, where possible; |
| · | engaging emergency government wage protection programs and providing top-ups to maintain full compensation levels for a certain period, where applicable; and |
| · | providing regular communication to employees, including with respect to company programs to support their physical and mental health needs. |
RESTRUCTURING AND RIGHT-SIZING ACTIONS
In response to the impact that COVID-19 is expected to have on vehicle production volumes over the short to medium term, in the second quarter of 2020 we initiated and/or accelerated the timing of restructuring plans to right-size our business. These restructuring actions include plant closures and workforce reductions.
LIQUIDITY ACTIONS
During the second quarter, we took three prudent steps to provide us with additional financing flexibility:
| · | amendment of our 364-day syndicated revolving credit facility to increase the size of the facility from $300 million to $1.0 billion and extend the maturity to April 2021; |
| · | filing of a base shelf prospectus (the “Shelf Prospectus”) with the Ontario Securities Commission and an F-10 registration statement (the “Registration Statement”) with the U.S. Securities and Exchange Commission, to qualify up to $2.0 billion of debt securities from time to time over a 25-month period; and |
| · | completion on June 15, 2020, of an offering of $750 million senior unsecured notes bearing interest at 2.45% per annum and maturing June 15, 2030, under the Shelf Prospectus and Registration Statement. |
As at June 30, 2020, our total liquidity was $4.1 billion, consisting of $648 million in cash, as well as unused and available credit lines of $3.5 billion.
We suspended repurchases of common shares for cancellation under our normal course issuer bid (“NCIB”) in the first quarter of 2020 and have not resumed repurchases during the second quarter. At this time, we do not expect to resume repurchases under our NCIB prior to its expiry in November 2020.
| Magna International Inc. Second Quarter Report 2020 3 |
CAPITAL AND OTHER EXPENDITURES
We continue to assess the impact of changes to our customers’ production plans and the related adjustments to our capital expenditures. Where our customers’ production programs are being downsized, deferred or cancelled, we are taking equivalent capital expenditure actions. We have also reduced discretionary capital spending and certain productivity capital expenditures where the returns on the investment are no longer likely to be achieved within an appropriate timeframe. However, we remain focused on ensuring that capital actions being taken today do not adversely impact the implementation of our long-term strategy.
CUSTOMERS AND SUPPLY CHAIN
We regularly monitor metrics related to the financial health of our customers and have not identified any cause for concern regarding the financial health of our primary customers. Although no material supplier to us has become bankrupt or insolvent as a result of the COVID-19 suspension of production, we have heightened our focus on the financial health of our supply base.
OTHER IMPACTS AND RISKS
We recorded fixed asset impairment charges of $19 million in the second quarter and could experience further material impacts in 2020 as a result of reduced sales attributable to COVID-19, including charges related to: potential expected credit losses; restructuring costs; asset impairments; deferred tax valuation allowances; and changes in the effectiveness of our hedging instruments.
Although we currently believe that the most severe short-term impacts of the COVID-19 pandemic occurred in the first and second quarters of 2020, its full effect and longer-term impacts may not be reflected in our results of operations and overall financial performance until future periods. It is difficult to accurately assess the continuing magnitude, outcome and duration of the pandemic. However, a prolonged pandemic, including as a result of second or subsequent waves, could further:
| · | deteriorate economic conditions, resulting in lower consumer confidence which typically translates into lower vehicle sales and production levels; |
| · | reduce our customers’ production volumes, including as a result of continued or intermittent facility shutdowns; |
| · | elevate the financial pressure on our customers, which could lead to an OEM insolvency, and would likely increase pricing pressure on us and the entire automotive supply chain; |
| · | reduce our production levels, including as a result of continued or intermittent shutdowns of our manufacturing facilities. |
| · | cause potential shortages of employees to staff our facilities, or the facilities of our customers or suppliers; |
| · | lead to prolonged disruptions of critical components, including as a result of the bankruptcy/insolvency of one or more suppliers due to worsening economic conditions; or |
| · | result in governmental regulation adversely impacting our business. |
Any or all of the above impacts of a prolonged pandemic could have a rapid, unexpected and material adverse effect on our business, financial condition and results of operations. Irrespective of whether the pandemic is prolonged, the significant global economic impact and job losses to date are likely to affect household income and wealth beyond 2020, which would directly affect vehicle sales and thus production as well.
RESULTS OF OPERATIONS
AVERAGE FOREIGN EXCHANGE
| For the three months | For the six months | |||||||||||||||||||||||
| ended June 30, | ended June 30, | |||||||||||||||||||||||
| 2020 | 2019 | Change | 2020 | 2019 | Change | |||||||||||||||||||
| 1 Canadian dollar equals U.S. dollars | 0.722 | 0.748 | - | 3 | % | 0.733 | 0.750 | - | 2 | % | ||||||||||||||
| 1 euro equals U.S. dollars | 1.101 | 1.124 | - | 2 | % | 1.102 | 1.130 | - | 2 | % | ||||||||||||||
| 1 Chinese renminbi equals U.S. dollars | 0.141 | 0.147 | - | 4 | % | 0.142 | 0.147 | - | 3 | % | ||||||||||||||
The preceding table reflects the average foreign exchange rates between the most common currencies in which we conduct business and our U.S. dollar reporting currency. The changes in these foreign exchange rates for the three and six months ended June 30, 2020 impacted the reported U.S. dollar amounts of our sales, expenses and income.
The results of operations for which the functional currency is not the U.S. dollar are translated into U.S. dollars using the average exchange rates for the relevant period. Throughout this MD&A, reference is made to the impact of translation of foreign operations on reported U.S. dollar amounts where relevant.
| 4 Magna International Inc. Second Quarter Report 2020 |
LIGHT VEHICLE PRODUCTION VOLUMES
Our operating results are mostly dependent on light vehicle production in the regions reflected in the table below:
Light Vehicle Production Volumes (thousands of units)
| For the three months | For the six months | |||||||||||||||||||||||
| ended June 30, | ended June 30, | |||||||||||||||||||||||
| 2020 | 2019 | Change | 2020 | 2019 | Change | |||||||||||||||||||
| North America | 1,286 | 4,268 | - | 70 | % | 5,081 | 8,518 | - | 40 | % | ||||||||||||||
| Europe | 2,324 | 5,683 | - | 59 | % | 6,974 | 11,418 | - | 39 | % | ||||||||||||||
| China | 5,639 | 5,484 | + | 3 | % | 8,899 | 11,515 | - | 23 | % | ||||||||||||||
RESULTS OF OPERATIONS – FOR THE THREE MONTHS ENDED JUNE 30, 2020
SALES

Sales decreased 58% or $5.83 billion to $4.29 billion for the second quarter of 2020 compared to $10.13 billion for the second quarter of 2019 substantially due to the approximately $5.5 billion negative impact of the COVID-19 pandemic. In addition, sales decreased due to the end of production of certain programs, the net weakening of foreign currencies against the U.S. dollar, which decreased sales by $76 million, and net customer price concessions subsequent to the second quarter of 2019.
The changes in sales are discussed further in the “Segment Analysis” section of this MD&A.
COST OF GOODS SOLD
| For the three months | ||||||||||||
| ended June 30, | ||||||||||||
| 2020 | 2019 | Change | ||||||||||
| Material | $ | 2,645 | $ | 6,360 | $ | (3,715 | ) | |||||
| Direct labour | 404 | 730 | (326 | ) | ||||||||
| Overhead | 1,157 | 1,620 | (463 | ) | ||||||||
| Cost of goods sold | $ | 4,206 | $ | 8,710 | $ | (4,504 | ) | |||||
Cost of goods sold decreased $4.50 billion to $4.21 billion for the second quarter of 2020 compared to $8.71 billion for the second quarter of 2019 substantially as a result of lower material, direct labour and overhead costs associated with lower sales. In addition, cost of goods sold decreased by $74 million due to the net weakening of foreign currencies against the U.S. dollar, and ongoing productivity initiatives.
DEPRECIATION AND AMORTIZATION
Depreciation and amortization costs was $334 million for the second quarter of 2020 and 2019. Higher amortization at our facilities was offset by a $7 million net decrease in reported U.S. dollar depreciation and amortization due to the net weakening of foreign currencies against the U.S. dollar, and lower amortization in our ADAS business as a result of amortizing 100% of capital spending during the second quarter of 2019 associated with two programs that will be utilizing new technologies.
| Magna International Inc. Second Quarter Report 2020 5 |
SELLING, GENERAL AND ADMINISTRATIVE [“SG&A”]
SG&A expense decreased $75 million to $378 million for the second quarter of 2020 compared to $453 million for the second quarter of 2019, primarily as a result of:
| · | lower short-term and long-term incentive compensation; |
| · | lower labour and benefit costs; |
| · | a general decrease in SG&A costs associated with reduced business activities; |
| · | a $10 million decrease in reported U.S. dollar SG&A expense due to the net weakening of foreign currencies against the U.S. dollar; and |
| · | lower spending associated with corporate research & development. |
These factors were partially offset by net losses on the sale of assets in the second quarter of 2020 compared to net gains in the second quarter of 2019 and higher net foreign exchange losses.
INTEREST EXPENSE, NET
During the second quarter of 2020, we recorded net interest expense of $21 million compared to $14 million for the second quarter of 2019. The $7 million increase is primarily as a result of lower interest income earned on favourable tax settlements during the second quarter of 2020 compared to the second quarter of 2019, lower cash balances, and an increase in long-term borrowings.
EQUITY INCOME
Equity income decreased $23 million to $25 million for the second quarter of 2020 compared to $48 million for the second quarter of 2019, substantially as a result of reduced earnings due to lower sales at our non-wholly owned operations related to the impact of the COVID-19 pandemic.
OTHER EXPENSE (INCOME), NET
| For the three months | ||||||||
| ended June 30, | ||||||||
| 2020 | 2019 | |||||||
| Restructuring and impairments (1) | $ | 168 | $ | 7 | ||||
| Net losses on investments (2) | — | 67 | ||||||
| Gain on sale of Business (3) | — | (6 | ) | |||||
| $ | 168 | $ | 68 | |||||
| (1) | Restructuring and impairments |
In response to the impact that COVID-19 is expected to have on vehicle production volumes over the short to medium term, in the second quarter of 2020 we initiated and/or accelerated the timing of restructuring plans to right-size our business. These restructuring actions include plant closures and workforce reductions.
The following table summarizes the restructuring and fixed asset impairment charges recorded by segment:
| Net of | ||||||||||||||||
| Restructuring | Impairments | Total | Tax | |||||||||||||
| Power & Vision | $ | 104 | $ | 11 | $ | 115 | $ | 90 | ||||||||
| Body Exteriors & Structures | 29 | 8 | 37 | 32 | ||||||||||||
| Seating Systems | 16 | — | 16 | 14 | ||||||||||||
| $ | 149 | $ | 19 | $ | 168 | $ | 136 | |||||||||
The restructuring charges recorded during the second quarter of 2019 related to certain European Body Exteriors & Structures operations. There were no income taxes recorded on the restructuring charges.
| 6 Magna International Inc. Second Quarter Report 2020 |
| (2) | Net losses on investments |
The net loss on investments in the second quarter of 2019 was substantially related to the revaluation of our investment in Lyft, Inc. [$57 million after tax].
| (3) | Gain on sale of Business |
During the second quarter of 2019, we adjusted the gain on the sale of our Fluid Pressure & Controls [“FP&C”] business by $6 million [$7 million after tax] as a result of finalizing the proceeds relating to working capital.
(LOSS) INCOME FROM OPERATIONS BEFORE INCOME TAXES
(Loss) income from operations before income taxes was a loss of $789 million for the second quarter of 2020 compared to income of $595 million for the second quarter of 2019. This $1.38 billion decrease is a result of the following changes, each as discussed above:
| For the three months | ||||||||||||
| ended June 30, | ||||||||||||
| 2020 | 2019 | Change | ||||||||||
| Sales | $ | 4,293 | $ | 10,126 | $ | (5,833 | ) | |||||
| Costs and expenses | ||||||||||||
| Cost of goods sold | 4,206 | 8,710 | (4,504 | ) | ||||||||
| Depreciation and amortization | 334 | 334 | — | |||||||||
| Selling, general & administrative | 378 | 453 | (75 | ) | ||||||||
| Interest expense, net | 21 | 14 | 7 | |||||||||
| Equity income | (25 | ) | (48 | ) | 23 | |||||||
| Other expense (income), net | 168 | 68 | 100 | |||||||||
| (Loss) Income from operations before income taxes | $ | (789 | ) | $ | 595 | $ | (1,384 | ) | ||||
INCOME TAXES
| For the three months ended June 30, | ||||||||||||||
| 2020 | 2019 | |||||||||||||
| Income Taxes as reported | $ | (137 | ) | 17.4 | % | $ | 145 | 24.4 | % | |||||
| Tax effect on Other expense (income), net | 32 | (0.5 | ) | 11 | (0.9 | ) | ||||||||
| $ | (105 | ) | 16.9 | % | $ | 156 | 23.5 | % | ||||||
Excluding the tax effect on Other expense (income), net, our effective income tax rate represented a benefit of 16.9% for the second quarter of 2020 compared to an expense of 23.5% for the second quarter of 2019. The effective income tax rate of 16.9% was lower primarily due to an increase in losses not benefited in Europe and a change in the mix of earnings.
LOSS ATTRIBUTABLE TO NON-CONTROLLING INTERESTS
Loss attributable to non-controlling interests increased $3 million to $5 million for the second quarter of 2020 compared to $2 million for the second quarter of 2020 due to decreased profits at our non-wholly owned operations in China.
NET (LOSS) INCOME ATTRIBUTABLE TO MAGNA INTERNATIONAL INC.
Net (loss) income attributable to Magna International Inc. was a loss of $647 million for the second quarter of 2020 compared to income of $452 million for the second quarter of 2019. This $1.1 billion decrease was as a result of: a decrease in income from operations before income taxes of $1.38 billion; partially offset by a decrease in income taxes of $282 million; and an increase in loss attributable to non-controlling interests of $3 million.
| Magna International Inc. Second Quarter Report 2020 7 |
(LOSS) EARNINGS PER SHARE
| For the three months | ||||||||||||
| ended June 30, | ||||||||||||
| 2020 | 2019 | Change | ||||||||||
| (Loss) earnings per Common Share | ||||||||||||
| Basic | $ | (2.17 | ) | $ | 1.42 | — | ||||||
| Diluted | $ | (2.17 | ) | $ | 1.42 | — | ||||||
| Weighted average number of Common Shares outstanding (millions) | ||||||||||||
| Basic | 298.4 | 318.4 | - | 6 | % | |||||||
| Diluted | 298.4 | 319.5 | - | 7 | % | |||||||
| Adjusted diluted (loss) earnings per share | $ | (1.71 | ) | $ | 1.59 | — | ||||||
Diluted loss per share was $2.17 for the second quarter of 2020 compared to diluted earnings per share of $1.42 for the second quarter of 2019. The $3.59 decrease was substantially as a result of the decrease in net income attributable to Magna International Inc., as discussed above. In addition, the decrease in the weighted average number of diluted shares outstanding contributed to higher diluted loss per share. The decrease in the weighted average number of diluted shares outstanding was primarily due to the purchase and cancellation of Common Shares, during or subsequent to the second quarter of 2019, pursuant to our normal course issuer bids.
Other expense (income), net, after tax, negatively impacted diluted (loss) earnings per share by $0.46 in the second quarter of 2020 and $0.17 in the second quarter of 2019, respectively, as discussed in the “Other expense (income), net” and “Income Taxes” sections.
Adjusted diluted (loss) earnings per share, as reconciled in the “Non-GAAP Financial Measures Reconciliation” section, was a loss of $1.71 for the second quarter of 2020 compared to earnings of $1.59 in the second quarter of 2019, a decrease of $3.30.
| 8 Magna International Inc. Second Quarter Report 2020 |
NON-GAAP PERFORMANCE MEASURES - FOR THE THREE MONTHS ENDED JUNE 30, 2020
ADJUSTED EBIT AS A PERCENTAGE OF SALES

The table below shows the change in Magna's Sales and Adjusted EBIT by segment and the impact each segment's change had on Magna's Adjusted EBIT as a percentage of sales for the second quarter of 2020 compared to the second quarter of 2019:
| Sales | Adjusted EBIT | Adjusted EBIT as a percentage of sales | ||||||||||
| Second quarter of 2019 | $ | 10,126 | $ | 677 | 6.7 | % | ||||||
| (Decrease) Increase related to: | ||||||||||||
| Body Exteriors & Structures | (2,620 | ) | (656 | ) | - | 11.2 | % | |||||
| Power & Vision | (1,510 | ) | (427 | ) | - | 7.6 | % | |||||
| Seating Systems | (928 | ) | (167 | ) | - | 2.5 | % | |||||
| Complete Vehicles | (869 | ) | 1 | + | 1.4 | % | ||||||
| Corporate and Other | 94 | (28 | ) | - | 0.8 | % | ||||||
| Second quarter of 2020 | $ | 4,293 | $ | (600) | - | 14.0 | % | |||||
Adjusted EBIT as a percentage of sales decreased to -14.0% for the second quarter of 2020 compared to 6.7% for the second quarter of 2019 substantially due to the negative impact of the COVID-19 pandemic. Excluding the impact of the COVID-19 pandemic, other factors negatively impacting Adjusted EBIT as a percentage of sales include:
| · | lower tooling contribution in the second quarter of 2020 compared to the second quarter of 2019; |
| · | in our ADAS business, higher engineering costs, including retroactive social tax costs, substantially associated with three programs that will be utilizing new technologies; |
| · | lower equity income; |
| · | net provisions for customer claims during the second quarter of 2020; and |
| · | higher net warranty costs. |
These factors were partially offset by:
| · | lower spending associated with electrification, autonomy and research & development; |
| · | favourable mix within certain complete vehicle assembly programs; and |
| · | the benefit of a cost cutting initiative in our Complete Vehicle segment. |
| Magna International Inc. Second Quarter Report 2020 9 |
RETURN ON INVESTED CAPITAL
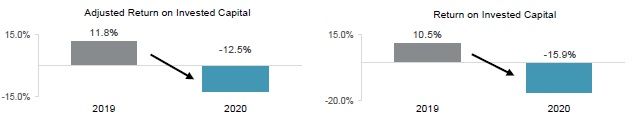
Adjusted Return on Invested Capital decreased to -12.5% for the second quarter of 2020 compared to 11.8% for the second quarter of 2019 as a result of a decrease in Adjusted After-tax operating profits partially offset by lower Average Invested Capital. The change in Other expense (income), net, after tax also negatively impacted Return on Invested Capital by 2.1%.
Average Invested Capital decreased $1.65 billion to $15.94 billion for the second quarter of 2020 compared to $17.59 billion for the second quarter of 2019, primarily due to:
| · | the impairment of assets recorded in the third quarter of 2019; |
| · | the net weakening of foreign currencies against the U.S. dollar; |
| · | the sale of our investment in Lyft equity in the third and fourth quarters of 2019; and |
| · | a decrease in average non-cash working capital. |
RETURN ON EQUITY
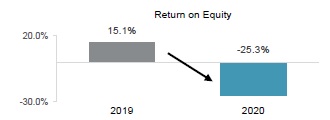
Return on Equity was -25.3% for the second quarter of 2020 compared to 15.1% for the second quarter of 2019. This decrease was due to lower net (loss) income attributable to Magna, partially offset by lower average shareholders' equity. The change in Other expense (income), net, after tax, negatively impacted Return on Equity by 3.5%.
| 10 Magna International Inc. Second Quarter Report 2020 |
SEGMENT ANALYSIS
We are a global automotive supplier that has complete vehicle engineering and contract manufacturing expertise, as well as product capabilities which include body, chassis, exterior, seating, powertrain, active driver assistance, electronics, mechatronics, mirrors, lighting and roof systems. Magna also has electronic and software capabilities across many of these areas.
Our business is managed under operating segments which have been determined on the basis of technological opportunities, product similarities, as well as market and operating factors. Our internal financial reporting is aligned with the way our business is managed. Accordingly, we report key internal operating performance measures for Body Exteriors & Structures, Power & Vision, Seating Systems, and Complete Vehicles for presentation to our chief operating decision maker to use in the assessment of operating performance, allocation of resources, and to help plan our long-term strategic direction and future global growth.
Our chief operating decision maker uses Adjusted EBIT as the measure of segment profit or loss, since we believe Adjusted EBIT is the most appropriate measure of operational profitability or loss for our reportable segments. Adjusted EBIT has been reconciled in the "Non-GAAP Financial Measures Reconciliation" section included in this MD&A.
| For the three months ended June 30, | ||||||||||||||||||||||||
| Sales | Adjusted EBIT | |||||||||||||||||||||||
| 2020 | 2019 | Change | 2020 | 2019 | Change | |||||||||||||||||||
| Body Exteriors & Structures | $ | 1,623 | $ | 4,243 | $ | (2,620 | ) | $ | (315 | ) | $ | 341 | $ | (656 | ) | |||||||||
| Power & Vision | 1,298 | 2,808 | (1,510 | ) | (226 | ) | 201 | (427 | ) | |||||||||||||||
| Seating Systems | 524 | 1,452 | (928 | ) | (84 | ) | 83 | (167 | ) | |||||||||||||||
| Complete Vehicles | 933 | 1,802 | (869 | ) | 44 | 43 | 1 | |||||||||||||||||
| Corporate and Other | (85 | ) | (179 | ) | 94 | (19 | ) | 9 | (28 | ) | ||||||||||||||
| Total reportable segments | $ | 4,293 | $ | 10,126 | $ | (5,833) | $ | (600) | $ | 677 | $ | (1,277) | ||||||||||||
BODY EXTERIORS & STRUCTURES
| For the three months ended June 30, | ||||||||||||||||
| 2020 | 2019 | Change | ||||||||||||||
| Sales | $ | 1,623 | $ | 4,243 | $ | (2,620 | ) | -62 | % | |||||||
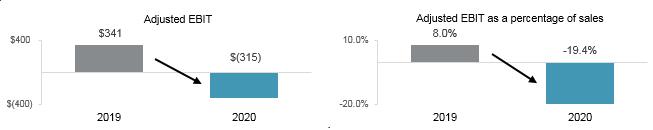
| Adjusted EBIT | $ | (315 | ) | $ | 341 | $ | (656 | ) | — | |||||||
| Adjusted EBIT as a percentage of sales | (19.4 | )% | 8.0 | % | -27.4 | % | ||||||||||

Sales – Body Exteriors & Structures
Sales for Body Exteriors & Structures decreased 62% or $2.62 billion to $1.62 billion for the second quarter of 2020 compared to $4.24 billion for the second quarter of 2019, substantially due to an approximate $2.65 billion negative impact of the COVID-19 pandemic. Other factors negatively impacting sales include the end of production of certain programs, the net weakening of foreign currencies against the U.S. dollar, which decreased sales by $29 million, and net customer price concessions subsequent to the second quarter of 2019.
| Magna International Inc. Second Quarter Report 2020 11 |
Adjusted EBIT and Adjusted EBIT as a percentage of sales – Body Exteriors & Structures
Adjusted EBIT for Body Exteriors & Structures was a loss of $315 million for the second quarter of 2020 compared to earnings of $341 million for the second quarter of 2019 and Adjusted EBIT as a percentage of sales was -19.4% for the second quarter of 2020 compared to 8.0% for the second quarter of 2019. These decreases were substantially as a result of reduced earnings due to lower sales during the second quarter of 2020. Other factors negatively impacting Adjusted EBIT and Adjusted EBIT as a percentage of sales include:
| · | lower tooling contribution in the second quarter of 2020 compared to the second quarter of 2019; |
| · | net provisions for customer claims during the second quarter of 2020; and |
| · | higher foreign exchange losses. |
These factors were partially offset by losses during the second quarter of 2019 at plants that were closed in 2019.
In addition, the net weakening of foreign currencies against the U.S. dollar favourably impacted reported U.S. dollar Adjusted EBIT by $8 million; and net customer price concessions subsequent to the second quarter of 2019 had an unfavourable impact on Adjusted EBIT.
POWER & VISION
| For the three months ended June 30, | ||||||||||||||||
| 2020 | 2019 | Change | ||||||||||||||
| Sales | $ | 1,298 | $ | 2,808 | $ | (1,510 | ) | - | 54 | % | ||||||
| Adjusted EBIT | $ | (226 | ) | $ | 201 | $ | (427 | ) | — | |||||||
| Adjusted EBIT as a percentage of sales | (17.4 | )% | 7.2 | % | - | 24.6 | % | |||||||||

Sales – Power & Vision
Sales for Power & Vision decreased 54% or $1.51 billion to $1.30 billion for the second quarter of 2020 compared to $2.81 billion for the second quarter of 2019, substantially due to an approximate $1.45 billion negative impact of the COVID-19 pandemic. In addition, sales decreased due to the end of production of certain programs, the net weakening of foreign currencies against the U.S. dollar, which decreased sales by $22 million, and net customer price concessions subsequent to the second quarter of 2019.
| 12 Magna International Inc. Second Quarter Report 2020 |
Adjusted EBIT and Adjusted EBIT as a percentage of sales – Power & Vision
Adjusted EBIT for Power & Vision was a loss of $226 million for the second quarter of 2020 compared to earnings of $201 million for the second quarter of 2019 and Adjusted EBIT as a percentage of sales was -17.4% for the second quarter of 2020 compared to 7.2% for the second quarter of 2019. These decreases were primarily as a result of reduced earnings due to lower sales during the second quarter of 2020. Other factors negatively impacting Adjusted EBIT and Adjusted EBIT as a percentage of sales include:
| · | in our ADAS business, higher engineering costs, including retroactive social tax costs, substantially associated with three programs that will be utilizing new technologies; |
| · | lower equity income of $20 million primarily as a result of reduced earnings due to lower sales at our non-wholly owned operations; |
| · | earnings during the second quarter of 2019 at a plant we closed subsequent to the second quarter of 2019; and |
| · | higher net warranty costs of $9 million. |
In addition, net customer price concessions subsequent to the second quarter of 2019 had an unfavourable impact on Adjusted EBIT.
SEATING SYSTEMS
| For the three months ended June 30, | ||||||||||||||||
| 2020 | 2019 | Change | ||||||||||||||
| Sales | $ | 524 | $ | 1,452 | $ | (928 | ) | - | 64 | % | ||||||
| Adjusted EBIT | $ | (84 | ) | $ | 83 | $ | (167 | ) | — | |||||||
| Adjusted EBIT as a percentage of sales | (16.0 | )% | 5.7 | % | - | 21.7 | % | |||||||||

Sales – Seating Systems
Sales for Seating Systems decreased 64% or $928 million to $524 million for the second quarter of 2020 compared to $1.45 billion for the second quarter of 2019, substantially due to an approximate $1.0 billion negative impact of the COVID-19 pandemic. Other factors negatively impacting sales include the end of production of certain programs, the net weakening of foreign currencies against the U.S. dollar, which decreased sales by $10 million, and net customer price concessions subsequent to the second quarter of 2019.
| Magna International Inc. Second Quarter Report 2020 13 |
Adjusted EBIT and Adjusted EBIT as a percentage of sales – Seating Systems
Adjusted EBIT for Seating Systems was a loss of $84 million for the second quarter of 2020 compared to earnings of $83 million for the second quarter of 2019 and Adjusted EBIT as a percentage of sales was -16.0% for the second quarter of 2020 compared to 5.7% for the second quarter of 2019. These decreases were substantially as a result of reduced earnings due to lower sales during the second quarter of 2020.
In addition, net customer price concessions subsequent to the second quarter of 2019 had an unfavourable impact on Adjusted EBIT.
COMPLETE VEHICLES
| For the three months ended June 30, | ||||||||||||||||
| 2020 | 2019 | Change | ||||||||||||||
| Complete Vehicle Assembly Volumes (thousands of units)(i) | 16.8 | 43.0 | (26.2 | ) | - | 61 | % | |||||||||
| Sales | $ | 933 | $ | 1,802 | $ | (869 | ) | - | 48 | % | ||||||
| Adjusted EBIT | $ | 44 | $ | 43 | $ | 1 | + | 2 | % | |||||||
| Adjusted EBIT as a percentage of sales | 4.7 | % | 2.4 | % | + | 2.3 | % | |||||||||
(i) Vehicles produced at our Complete Vehicle operations are included in Europe Light Vehicle Production volumes.
Sales – Complete Vehicles
Sales for Complete Vehicles decreased 48% or $869 million to $933 million for the second quarter of 2020 compared to $1.80 billion for the second quarter of 2019 and assembly volumes decreased 61% or twenty-six thousand units. The decrease in sales is substantially as a result of the impact of lower assembly volumes during the second quarter of 2020, which includes an approximate $400 million negative impact of the COVID-19 pandemic. In addition, sales were negatively impacted by a $16 million decrease in reported U.S. dollar sales as a result of the weakening of the euro against the U.S. dollar. These factors were partially offset by higher engineering sales.
| 14 Magna International Inc. Second Quarter Report 2020 |
Adjusted EBIT and Adjusted EBIT as a percentage of sales – Complete Vehicles
Adjusted EBIT for Complete Vehicles increased $1 million to $44 million for the second quarter of 2020 compared to $43 million for the second quarter of 2019. The increase in Adjusted EBIT and Adjusted EBIT as percentage of sales are due to favourable mix within certain complete vehicle assembly programs and the benefit of a cost cutting initiative.
These factors were partially offset by reduced earnings due to lower assembly volumes during the second quarter of 2020, net of contractual fixed costs recoveries on certain programs.
CORPORATE AND OTHER
Adjusted EBIT in Corporate and Other was a loss of $19 million for the second quarter of 2020 compared to income of $9 million in the second quarter of 2019. The decrease was substantially as a result of a decrease in fees recorded from our divisions and a loss on the sale of assets during the second quarter of 2020. These factors were partially offset by lower short-term and long-term incentive compensation, a $10 million favourable impact of higher net foreign exchange gains in the second quarter of 2020 compared to the second quarter of 2019 and lower corporate research & development spending.
| Magna International Inc. Second Quarter Report 2020 15 |
FINANCIAL CONDITION, LIQUIDITY AND CAPITAL RESOURCES
OPERATING ACTIVITIES
| For the three months ended June 30, | ||||||||||||
| 2020 | 2019 | Change | ||||||||||
| Net (loss) income | $ | (652 | ) | $ | 450 | |||||||
| Items not involving current cash flows | 354 | 470 | ||||||||||
| (298 | ) | 920 | $ | (1,218 | ) | |||||||
| Changes in operating assets and liabilities | (934 | ) | — | (934 | ) | |||||||
| Cash (used for) provided from operating activities | $ | (1,232 | ) | $ | 920 | $ | (2,152 | ) | ||||
Cash used for operating activities
During the second quarter of 2020, we had a use of cash from operations of $1.2 billion, compared to cash generation of $920 million during the second quarter of 2019. Cash receipts from customers and cash payments to suppliers and for labour were reduced during the second quarter of 2020 primarily as a result of the production volume reductions as discussed previously.
The substantial use of cash was driven by a $5.7 billion reduction in cash received from customers which was only partially offset by a $2.9 billion decrease in cash paid for material and overhead and a $0.6 billion decrease in cash paid for labour.
Changes in operating assets and liabilities
Specifically as it relates to the change in operating assets and liabilities, the $934 million used during the second quarter of 2020 is primarily a result of a $1.4 billion reduction in accounts payable related to lower production levels combined with the restart of production. In addition, we also had:
| · | a $154 million reduction in our accrual for the Employee Equity and Profit Participation Plan as the 2019 payout occurred in April 2020; |
| · | a $114 million increase in amounts receivable from governments for various employee wage protection programs; and |
| · | a $105 million increase in income taxes receivable. |
These uses of cash in operating assets and liabilities were partially offset by:
| · | a $591 million decrease in accounts receivable related to lower production levels partially offset by the delayed timing of certain cash receipts to the first week of the third quarter; |
| · | a $105 million increase in restructuring accruals; and |
| · | a $96 million decrease in production and other inventories related to the lower production levels. |
| 16 Magna International Inc. Second Quarter Report 2020 |
INVESTING ACTIVITIES

| For the three months ended June 30, | ||||||||||||
| 2020 | 2019 | Change | ||||||||||
| Fixed asset additions | $ | (169 | ) | $ | (328 | ) | ||||||
| Increase in private equity investments | (2 | ) | (5 | ) | ||||||||
| Increase in investments, other assets and intangible assets | (72 | ) | (102 | ) | ||||||||
| Fixed assets, investments, other assets and intangible assets additions | (243 | ) | (435 | ) | ||||||||
| Proceeds from dispositions | 11 | 26 | ||||||||||
| Acquisitions | — | (152 | ) | |||||||||
| Cash used for investing activities | $ | (232 | ) | $ | (561 | ) | $ | 329 | ||||
We used cash for investing activities in the second quarter of 2020 and 2019. The change was primarily due to a lower investment in fixed assets during the second quarter of 2020 compared to the second quarter of 2019 and the acquisition of 100% equity interest in VIZA GECA S.L. ["VIZA"] during second the quarter of 2019.
Fixed assets, investments, other assets and intangible assets additions
In the second quarter of 2020, we invested $169 million in fixed assets. Where our customers' production programs are being downsized, deferred or cancelled, we have taken equivalent capital expenditure actions. We also reduced discretionary capital spending and certain productivity capital expenditures where the returns on the investment are no longer likely to be achieved within an appropriate timeframe. However, we remain focused on ensuring that capital actions being taken today do not adversely impact the implementation of our long-term strategy.
In addition, we invested: $44 million in other assets related primarily to reimbursable tooling, planning, and engineering costs for programs that launched during the second quarter of 2020 or will be launching subsequent to the second quarter of 2020; $18 million in equity method investments; and $10 million in intangible assets, primarily related to software.
Proceeds from dispositions
In the second quarter of 2020, $11 million of proceeds related to normal course fixed and other asset disposals.
FINANCING ACTIVITIES
| For the three months ended June 30, | ||||||||||||
| 2020 | 2019 | Change | ||||||||||
| Issues of debt | $ | 817 | $ | 10 | ||||||||
| Increase (decrease) in short-term borrowings | 177 | (154 | ) | |||||||||
| Repayments of debt | (32 | ) | (43 | ) | ||||||||
| Issue of Common Shares on exercise of stock options | 1 | 6 | ||||||||||
| Shares repurchased for tax withholdings on vesting of equity awards | — | (2 | ) | |||||||||
| Repurchase of Common Shares | — | (409 | ) | |||||||||
| Dividend paid to non-controlling interest | (3 | ) | (13 | ) | ||||||||
| Dividends paid | (116 | ) | (110 | ) | ||||||||
| Cash provided from (used for) financing activities | $ | 844 | $ | (715 | ) | $ | 1,559 | |||||
During the second quarter of 2020, we issued $750 million of 2.45% fixed-rate Senior Notes which mature on June 15, 2030.
The increase in short-term borrowings relates primarily to a $168 million increase in euro-commercial paper ["the Euro Program"] during the second quarter of 2020.
| Magna International Inc. Second Quarter Report 2020 17 |
Cash dividends paid per Common Share were $0.40 for the second quarter of 2020, for a total of $116 million compared to cash dividends paid per Common Share of $0.365 for the second quarter of 2019, for a total of $110 million.
FINANCING RESOURCES
| As at June 30, 2020 | As at December 31, 2019 | Change | ||||||||||
| Liabilities | ||||||||||||
| Short-term borrowings | $ | 188 | $ | — | ||||||||
| Long-term debt due within one year | 150 | 106 | ||||||||||
| Current portion of operating lease liabilities | 221 | 225 | ||||||||||
| Long-term debt | 3,771 | 3,062 | ||||||||||
| Operating lease liabilities | 1,577 | 1,601 | ||||||||||
| 5,907 | 4,994 | $ | 913 | |||||||||
| Non-controlling interests | 273 | 300 | (27 | ) | ||||||||
| Shareholders' equity | 9,680 | 10,831 | (1,151 | ) | ||||||||
| Total capitalization | $ | 15,860 | $ | 16,125 | $ | (265 | ) | |||||
Total capitalization decreased by $265 million to $15.86 billion as at June 30, 2020 compared to $16.13 billion at December 31, 2019, primarily as a result of a $1.2 billion decrease in shareholder’s equity and a $27 million decrease in non-controlling interest partially offset by a $913 million increase in liabilities.
The decrease in shareholder's equity in the first six months of 2020 was primarily as a result of:
| · | $400 million of net loss; |
| · | $237 million of dividends paid; |
| · | $233 million net unrealized loss on translation of our net investment in foreign operations whose functional currency is not U.S. dollars; |
| · | $201 million related to the repurchase of 5.0 million Common Shares; and |
| · | $124 million of net unrealized loss on cash flow hedges. |
The decrease in non-controlling interest during the first six months of 2020 was primarily as a result of the loss attributable to non-controlling interests and dividends paid.
The increase in financial liabilities during the first six months of 2020 was primarily as a result of the issuance of $750 million of 2.45% fixed-rate Senior Notes which mature on June 15, 2030 and a $168 million increase in the Euro Program.
CASH RESOURCES
During the second quarter of 2020 our cash resources, including restricted cash equivalents, decreased by $611 million to $648 million, primarily as a result of cash used for operating and investing activities partially offset by cash provided from financing activities, as discussed above. In addition to our cash resources at June 30, 2020, we had term and operating lines of credit totaling $4.0 billion, of which $3.5 billion was unused and available.
MAXIMUM NUMBER OF SHARES ISSUABLE
The following table presents the maximum number of shares that would be outstanding if all of the outstanding options at August 6, 2020 were exercised:
| Common Shares | 298,624,436 | ||
| Stock options (i) | 9,683,301 | ||
| 308,307,737 |
| (i) | Options to purchase Common Shares are exercisable by the holder in accordance with the vesting provisions and upon payment of the exercise price as may be determined from time to time pursuant to our stock option plans. |
CONTRACTUAL OBLIGATIONS
There have been no material changes with respect to the contractual obligations requiring annual payments during the second quarter of 2020 that are outside the ordinary course of our business. Refer to our MD&A included in our 2019 Annual Report.
| 18 Magna International Inc. Second Quarter Report 2020 |
RESULTS OF OPERATIONS – FOR THE SIX MONTHS ENDED JUNE 30, 2020
For the six months ended June 30, | ||||||||||||||||||||||||
| Sales | Adjusted EBIT | |||||||||||||||||||||||
| 2020 | 2019 | Change | 2020 | 2019 | Change | |||||||||||||||||||
| Body Exteriors & Structures | $ | 5,299 | $ | 8,551 | $ | (3,252 | ) | $ | (116 | ) | $ | 704 | $ | (820 | ) | |||||||||
| Power & Vision | 3,821 | 5,891 | (2,070 | ) | (91 | ) | 417 | (508 | ) | |||||||||||||||
| Seating Systems | 1,785 | 2,885 | (1,100 | ) | (44 | ) | 177 | (221 | ) | |||||||||||||||
| Complete Vehicles | 2,254 | 3,730 | (1,476 | ) | 94 | 71 | 23 | |||||||||||||||||
| Corporate and Other | (209 | ) | (340 | ) | 131 | (40 | ) | 28 | (68 | ) | ||||||||||||||
| Total reportable segments | $ | 12,950 | $ | 20,717 | $ | (7,767 | ) | $ | (197 | ) | $ | 1,397 | $ | (1,594 | ) | |||||||||
BODY EXTERIORS & STRUCTURES
For the six months ended June 30, | ||||||||||||||||
| 2020 | 2019 | Change | ||||||||||||||
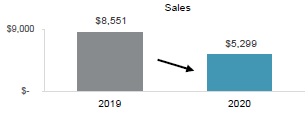
| Sales | $ | 5,299 | $ | 8,551 | $ | (3,252 | ) | -38 | % | |||||||
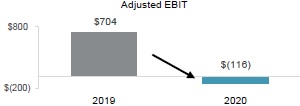
| Adjusted EBIT | $ | (116 | ) | $ | 704 | $ | (820 | ) | — | |||||||
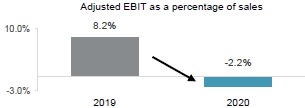
| Adjusted EBIT as a percentage of sales | (2.2 | )% | 8.2 | % | -10.4 | % | ||||||||||
Sales – Body Exteriors & Structures
Sales for Body Exteriors & Structures decreased 38% or $3.25 billion to $5.30 billion for the six months ended June 30, 2020 compared to $8.55 billion for the six months ended June 30, 2019, substantially due to an approximate $3.08 billion negative impact of the COVID-19 pandemic. Other factors negatively impacting sales include the end of production of certain programs, the net weakening of foreign currencies against the U.S. dollar, which decreased sales by $74 million, and net customer price concessions subsequent to the first six months of 2019.
| Magna International Inc. Second Quarter Report 2020 19 |
 |  |
Adjusted EBIT and Adjusted EBIT as a percentage of sales – Body Exteriors & Structures
Adjusted EBIT for Body Exteriors & Structures was a loss of $116 million for the six months ended June 30, 2020 compared to earnings of $704 million for the six months ended June 30, 2019 and Adjusted EBIT as a percentage of sales was -2.2% for the six months ended June 30, 2020 compared to 8.2% for the six months ended June 30, 2019. These decreases were substantially as a result of reduced earnings due to lower sales during the six months ended June 30, 2020. Other factors negatively impacting Adjusted EBIT and Adjusted EBIT as a percentage of sales include:
| · | lower tooling contribution in the first six months of 2020 compared to the first six months of 2019; |
| · | operational underperformance at a facility; |
| · | net provisions for customer claims during the second quarter of 2020; and |
| · | lower scrap steel and aluminum recoveries partially offset by lower commodity costs. |
These factors were partially offset by lower launch costs, and losses during the first six months of 2019 at plants that were closed in 2019.
In addition, the net weakening of foreign currencies against the U.S. dollar favourably impacted reported U.S. dollar Adjusted EBIT by $8 million; and net customer price concessions subsequent to the first six months of 2019 had an unfavourable impact on Adjusted EBIT.
POWER & VISION
For the six months ended June 30, | ||||||||||||||||
| 2020 | 2019 | Change | ||||||||||||||
| Sales | $ | 3,821 | $ | 5,891 | $ | (2,070 | ) | -35 | % | |||||||
| Adjusted EBIT | $ | (91 | ) | $ | 417 | $ | (508 | ) | — | |||||||
| Adjusted EBIT as a percentage of sales | (2.4 | )% | 7.1 | % | -9.5 | % | ||||||||||
Sales – Power & Vision
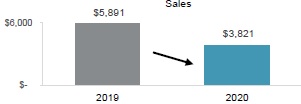
Sales for Power & Vision decreased 35% or $2.07 billion to $3.82 billion for the six months ended June 30, 2020 compared to $5.89 billion for the six months ended June 30, 2019, primarily due to an approximate $1.75 billion negative impact of the COVID-19 pandemic. Other factors negatively impacting sales include the divestiture of FP&C during the first quarter of 2019, which decreased sales by $361 million, the end of production of certain programs, the net weakening of foreign currencies against the U.S. dollar, which decreased sales by $71 million, and net customer price concessions subsequent to the second quarter of 2019.
| 20 Magna International Inc. Second Quarter Report 2020 |
 |  |
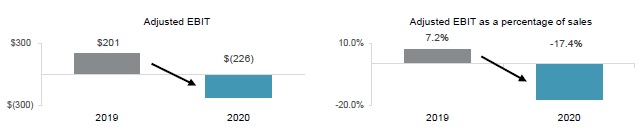
Adjusted EBIT and Adjusted EBIT as a percentage of sales – Power & Vision
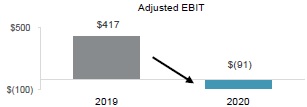
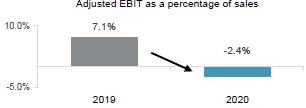
Adjusted EBIT for Power & Vision was a loss of $91 million for the six months ended June 30, 2020 compared to earnings of $417 million for the six months ended June 30, 2019 and Adjusted EBIT as a percentage of sales was -2.4% for the six months ended June 30, 2020 compared to 7.1% for the six months ended June 30, 2019. These decreases were substantially as a result of reduced earnings due to lower sales during the six months ended June 30, 2020. Other factors negatively impacting Adjusted EBIT and Adjusted EBIT as a percentage of sales include:
| · | in our ADAS business, higher engineering and other costs, including retroactive social tax costs, substantially associated with three programs that will be utilizing new technologies; |
| · | lower equity income of $20 million primarily as a result of reduced earnings due to lower sales at our non-wholly owned operations; |
| · | earnings during the first six months of 2019 at a plant we closed subsequent to the first six months of 2019; and |
| · | higher net warranty costs of $9 million. |
In addition, net customer price concessions subsequent to the first six months of 2019 had an unfavourable impact on Adjusted EBIT.
SEATING SYSTEMS
| For the six months ended June 30, | ||||||||||||||||
| 2020 | 2019 | Change | ||||||||||||||
| Sales | $ | 1,785 | $ | 2,885 | $ | (1,100 | ) | -38 | % | |||||||
| Adjusted EBIT | $ | (44 | ) | $ | 177 | $ | (221 | ) | — | |||||||
| Adjusted EBIT as a percentage of sales | (2.5 | %) | 6.1 | % | -8.6 | % | ||||||||||
Sales – Seating Systems
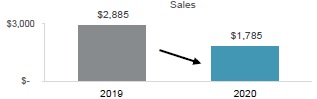
Sales for Seating Systems decreased 38% or $1.10 billion to $1.79 billion for the six months ended June 30, 2020 compared to $2.89 billion for the six months ended June 30, 2019, substantially due to an approximate $1.15 billion negative impact of the COVID-19 pandemic. Other factors negatively impacting sales include the end of production of certain programs, the net weakening of foreign currencies against the U.S. dollar, which decreased sales by $31 million, and net customer price concessions subsequent to the second quarter of 2019.
These factors were partially offset by an acquisition subsequent to the six months ended June 30, 2019 which increased sales by $36 million.
| Magna International Inc. Second Quarter Report 2020 21 |
 |  |
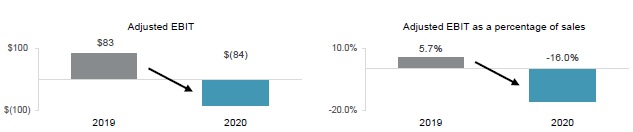
Adjusted EBIT and Adjusted EBIT as a percentage of sales – Seating Systems
Adjusted EBIT for Seating Systems was a loss of $44 million for the six months ended June 30, 2020 compared to earnings of $177 million for the six months ended June 30, 2019 and Adjusted EBIT as a percentage of sales was -2.5% for the six months ended June 30, 2020 compared to 6.1% for the six months ended June 30, 2019. These decreases were substantially as a result of reduced earnings due to lower sales during the six months ended June 30, 2020. In addition, a gain on the sale of assets during the first quarter of 2019, negatively impacted Adjusted EBIT and Adjusted EBIT as a percentage of sales.
These factors were partially offset by productivity and efficiency improvements at an underperforming facility.
COMPLETE VEHICLES
| For the six months ended June 30, | ||||||||||||||||
| 2020 | 2019 | Change | ||||||||||||||
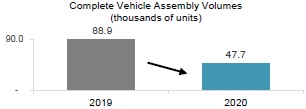
| Complete Vehicle Assembly Volumes (thousands of units)(i) | 47.7 | 88.9 | (41.2 | ) | -46 | % | ||||||||||
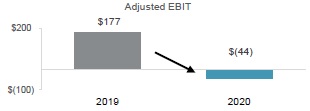
| Sales | $ | 2,254 | $ | 3,730 | $ | (1,476 | ) | -40 | % | |||||||
| Adjusted EBIT | $ | 94 | $ | 71 | $ | 23 | +32 | % | ||||||||
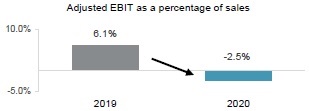
| Adjusted EBIT as a percentage of sales | 4.2 | % | 1.9 | % | +2.3 | % | ||||||||||
(i) Vehicles produced at our Complete Vehicle operations are included in Europe Light Vehicle Production volumes.
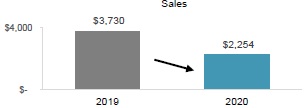 |  |
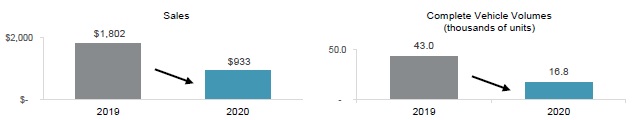
Sales – Complete Vehicles
Sales for Complete Vehicles decreased 40% or $1.48 billion to $2.25 billion for the six months ended June 30, 2020 compared to $3.73 billion for the six months ended June 30, 2019 and assembly volumes decreased 46% or forty-one thousand units. The decrease in sales is substantially as a result of the impact of lower assembly volumes during the first six months of 2020, which includes an approximate $625 million negative impact of the COVID-19 pandemic. In addition, sales was negatively impacted by a $56 million decrease in reported U.S. dollar sales as a result of the weakening of the euro against the U.S. dollar.
These factors were partially offset by higher engineering sales.
| 22 Magna International Inc. Second Quarter Report 2020 |
 | 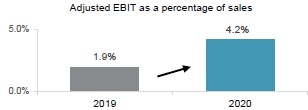 |
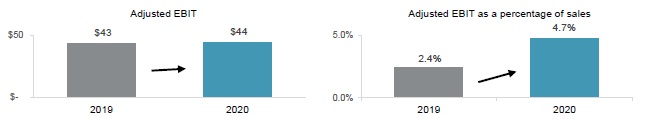
Adjusted EBIT and Adjusted EBIT as a percentage of sales – Complete Vehicles
Adjusted EBIT for Complete Vehicles increased $23 million to $94 million for the six months ended June 30, 2020 compared to $71 million for the six months ended June 30, 2019 and Adjusted EBIT as a percentage of sales increased to 4.2% for the six months ended June 30, 2020 compared to 1.9% for the six months ended June 30, 2019. These increases were primarily as a result of:
| · | favourable mix within certain complete vehicle assembly programs; |
| · | a favourable engineering program resolution in the first quarter of 2020; and | |
| · | the benefit of a cost cutting initiative. |
These factors were partially offset by reduced earnings due to lower assembly volumes during the first six months of 2020, net of contractual fixed cost recoveries on certain programs.
CORPORATE AND OTHER
Adjusted EBIT in Corporate and Other was a loss of $40 million for the six months ended June 30, 2020 compared to income of $28 million in the six months ended June 30, 2019. The $68 million decrease was primarily as a result of:
| · | a decrease in fees received from our divisions; |
| · | a $29 million unfavourable impact of higher net foreign exchange losses primarily as a result of foreign exchange losses in the six months ended June 30, 2020 compared to foreign exchange gains in the six months ended June 30, 2019; and |
| · | a loss on the sale of assets during the first six months of 2020 compared to a gain on the sale of assets during the first six months of 2019. |
These factors were partially offset by lower short-term and long-term incentive compensation and lower corporate research & development spending.
| Magna International Inc. Second Quarter Report 2020 23 |
NON-GAAP PERFORMANCE MEASURES - FOR THE SIX MONTHS ENDED JUNE 30, 2020
ADJUSTED EBIT AS A PERCENTAGE OF SALES

The table below shows the change in Magna's Sales and Adjusted EBIT by segment and the impact each segment's changes have on Magna's Adjusted EBIT as a percentage of sales for the six months ended June 30, 2020 compared to the six months ended June 20, 2019:
| Sales | Adjusted EBIT | Adjusted EBIT as a percentage of sales | ||||||||||
| Six months ended June 30, 2019 | $ | 20,717 | $ | 1,397 | 6.7 | % | ||||||
| (Decrease) Increase related to: | ||||||||||||
| Body Exteriors & Structures | (3,252 | ) | (820 | ) | -4.6 | % | ||||||
| Power & Vision | (2,070 | ) | (508 | ) | -2.8 | % | ||||||
| Seating Systems | (1,100 | ) | (221 | ) | -1.1 | % | ||||||
| Complete Vehicles | (1,476 | ) | 23 | +0.9 | % | |||||||
| Corporate and Other | 131 | (68 | ) | -0.6 | % | |||||||
| Six months ended June 30, 2020 | $ | 12,950 | $ | (197 | ) | -1.5 | % | |||||
Adjusted EBIT as a percentage of sales decreased to -1.5% for the six months ended June 30, 2020 compared to 6.7% for the six months ended June 30, 2019 substantially due to the negative impact of the COVID-19 pandemic. Excluding the impact of the COVID-19 pandemic, other factors negatively impacting Adjusted EBIT as a percentage of sales include:
| · | lower tooling contribution in the six months ended June 30, 2020 compared to the six months ended June 30, 2019; |
| · | in our ADAS business, higher engineering and other costs, including retroactive social tax costs, substantially associated with three programs that will be utilizing new technologies; |
| · | lower equity income; |
| · | net losses on the sale of assets in the first six months of 2020 compared to net gains in the first six months of 2019; |
| · | operational underperformance at a Body Exterior & Structures facility; |
| · | net provisions for customer claims during the second quarter of 2020; and |
| · | divestitures, net of acquisitions, during or subsequent to the six months ended June 30, 2019. |
These factors were partially offset by:
| · | the benefit of a cost cutting initiative in our Complete Vehicle segment; |
| · | favourable mix within certain complete vehicle assembly programs; |
| · | a favourable engineering program resolution in the first quarter of 2020 in our Complete Vehicle segment; and |
| · | lower spending associated with electrification, autonomy and research & development. |
| 24 Magna International Inc. Second Quarter Report 2020 |
RETURN ON INVESTED CAPITAL
 | 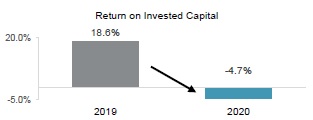 |
Adjusted Return on Invested Capital decreased to -3.0% for the six months ended June 30, 2020 compared to 12.5% for the six months ended June 30, 2019 as a result of a decrease in Adjusted After-tax operating profits partially offset by lower Average Invested Capital. The change in Other expense (income), net, after tax also negatively impacted Return on Invested Capital by 7.8%.
Average Invested Capital decreased $1.08 billion to $15.96 billion for the six months ended June 30, 2020 compared to $17.05 billion for the six months ended June 30, 2019 primarily due to:
| · | the impairment of assets recorded in the third quarter of 2019; |
| · | the sale of our investment in Lyft equity in the third and fourth quarters of 2019; |
| · | the sale of our FP&C business during the first quarter of 2019; |
| · | the net weakening of foreign currencies against the U.S. dollar; and |
| · | a decrease in average non-cash working capital. |
These factors were partially offset by the recognition of operating lease right-of-use assets during the first quarter of 2019 in accordance with the adoption of the accounting standard Accounting Standards Codification 842 – Leases.
RETURN ON EQUITY
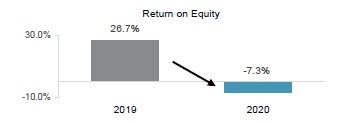
Return on Equity was -7.3% for the six months ended June 30, 2020 compared to 26.7% for the six months ended June 30, 2019. This decrease was due to lower net (loss) income attributable to Magna, partially offset by lower average shareholders' equity. The change in Other expense (income), net, after tax, negatively impacted Return on Equity by 11.5%.
| Magna International Inc. Second Quarter Report 2020 25 |
NON-GAAP FINANCIAL MEASURES RECONCILIATION
ADJUSTED EBIT
Adjusted EBIT is discussed in the "Segment Analysis" section. The following table reconciles net (loss) income to Adjusted EBIT:
For the three months ended June 30, | For the six months ended June 30, | |||||||||||||||
| 2020 | 2019 | 2020 | 2019 | |||||||||||||
| Net (Loss) Income | $ | (652 | ) | $ | 450 | $ | (400 | ) | $ | 1,551 | ||||||
| Add: | ||||||||||||||||
| Interest Expense, net | 21 | 14 | 38 | 45 | ||||||||||||
| Other Expense (Income), net | 168 | 68 | 168 | (611 | ) | |||||||||||
| Income Taxes | (137 | ) | 145 | (3 | ) | 412 | ||||||||||
| Adjusted EBIT | $ | (600 | ) | $ | 677 | $ | (197 | ) | $ | 1,397 | ||||||
ADJUSTED EBIT AS A PERCENTAGE OF SALES
Adjusted EBIT as a percentage of sales is discussed in the "Non-GAAP Performance Measures" section and is calculated in the table below:
For the three months ended June 30, | For the six months ended June 30, | |||||||||||||||
| 2020 | 2019 | 2020 | 2019 | |||||||||||||
| Sales | $ | 4,293 | $ | 10,126 | $ | 12,950 | $ | 20,717 | ||||||||
| Adjusted EBIT | $ | (600 | ) | $ | 677 | $ | (197 | ) | $ | 1,397 | ||||||
| Adjusted EBIT as a percentage of sales | (14.0 | )% | 6.7 | % | (1.5 | )% | 6.7 | % | ||||||||
ADJUSTED DILUTED (LOSS) EARNINGS PER SHARE
Adjusted diluted (loss) earnings per share is discussed in the "(Loss) Earnings per Share" section. The following table reconciles net (loss) income attributable to Magna International Inc. to Adjusted diluted (loss) earnings per share:
| For the three months ended June 30, | For the six months ended June 30, | |||||||||||||||
| 2020 | 2019 | 2020 | 2019 | |||||||||||||
| Net (loss) income attributable to Magna International Inc. | $ | (647 | ) | $ | 452 | $ | (386 | ) | $ | 1,558 | ||||||
| Add: | ||||||||||||||||
| Other Expense (Income), net | 168 | 68 | 168 | (611 | ) | |||||||||||
| Tax effect on Other Expense (Income), net | (32 | ) | (11 | ) | (32 | ) | 93 | |||||||||
| Adjusted net (loss) income attributable to Magna International Inc. | (511 | ) | 509 | (250 | ) | 1,040 | ||||||||||
| Diluted weighted average number of Common Shares outstanding during the period (millions) | 298.4 | 319.5 | 300.3 | 322.9 | ||||||||||||
| Adjusted diluted (loss) earnings per share | $ | (1.71 | ) | $ | 1.59 | $ | (0.83 | ) | $ | 3.23 | ||||||
| 26 Magna International Inc. Second Quarter Report 2020 |
RETURN ON INVESTED CAPITAL AND ADJUSTED RETURN ON INVESTED CAPITAL
Return on Invested Capital and Adjusted Return on Invested Capital are discussed in the "Non-GAAP Performance Measures" section. Return on Invested Capital is calculated as After-tax operating profits divided by Average Invested Capital (Invested Capital is averaged on a five-fiscal quarter basis) for the period. Adjusted Return on Invested Capital is calculated as Adjusted After-tax operating profits divided by Average Invested Capital (Invested Capital is averaged on a five-fiscal quarter basis) for the period.
After-tax operating profits and Adjusted After-tax operating profits are calculated in the table below:
| For the three months ended June 30, | For the six months ended June 30, | |||||||||||||||
| 2020 | 2019 | 2020 | 2019 | |||||||||||||
| Net (Loss) Income | $ | (652 | ) | $ | 450 | $ | (400 | ) | $ | 1,551 | ||||||
| Add: | ||||||||||||||||
| Interest Expense, net | 21 | 14 | 38 | 45 | ||||||||||||
| Income taxes on Interest Expense, net at Magna's effective income tax rate: | (4 | ) | (3 | ) | (10 | ) | (10 | ) | ||||||||
| After-tax operating profits | (635 | ) | 461 | (372 | ) | 1,586 | ||||||||||
| Other Expense (Income), net | 168 | 68 | 168 | (611 | ) | |||||||||||
| Tax effect on Other Expense (Income), net | (32 | ) | (11 | ) | (32 | ) | 93 | |||||||||
| Adjusted After-tax operating profits | $ | (499 | ) | $ | 518 | $ | (236 | ) | $ | 1,068 | ||||||
Invested Capital is calculated in the table below:
| As at June 30, | ||||||||
| 2020 | 2019 | |||||||
| Total Assets | $ | 24,280 | $ | 27,630 | ||||
| Excluding: | ||||||||
| Cash and cash equivalents | (533 | ) | (563 | ) | ||||
| Deferred tax assets | (353 | ) | (284 | ) | ||||
| Less Current Liabilities | (7,551 | ) | (9,573 | ) | ||||
| Excluding: | ||||||||
| Short-term borrowings | 188 | 199 | ||||||
| Long-term debt due within one year | 150 | 112 | ||||||
| Current portion of operating lease liabilities | 221 | 214 | ||||||
| Invested Capital | $ | 16,402 | $ | 17,735 | ||||
Return on Invested Capital is calculated in the table below:
| For the three months ended June 30, | For the six months ended June 30, | |||||||||||||||
| 2020 | 2019 | 2020 | 2019 | |||||||||||||
| After-tax operating profits | $ | (635 | ) | $ | 461 | $ | (372 | ) | $ | 1,587 | ||||||
| Average Invested Capital | $ | 15,941 | $ | 17,590 | $ | 15,963 | $ | 17,045 | ||||||||
| Return on Invested Capital | (15.9 | )% | 10.5 | % | (4.7 | )% | 18.6 | % | ||||||||
Adjusted Return on Invested Capital is calculated in the table below:
| For the three months ended June 30, | For the six months ended June 30, | |||||||||||||||
| 2020 | 2019 | 2020 | 2019 | |||||||||||||
| Adjusted After-tax operating profits | $ | (499 | ) | $ | 518 | $ | (236 | ) | $ | 1,068 | ||||||
| Average Invested Capital | $ | 15,941 | $ | 17,590 | $ | 15,963 | $ | 17,045 | ||||||||
| Adjusted Return on Invested Capital | (12.5 | )% | 11.8 | % | (3.0 | )% | 12.5 | % | ||||||||
| Magna International Inc. Second Quarter Report 2020 27 |
RETURN ON EQUITY
Return on Equity is discussed in the "Non-GAAP Performance Measures" section and is calculated in the table below:
| For the three months ended June 30, | For the six months ended June 30, | |||||||||||||||
| 2020 | 2019 | 2020 | 2019 | |||||||||||||
| Net (loss) income attributable to Magna International Inc. | $ | (647 | ) | $ | 452 | $ | (386 | ) | $ | 1,558 | ||||||
| Average Shareholders' Equity | $ | 10,248 | $ | 11,950 | $ | 10,542 | $ | 11,686 | ||||||||
| Return on Equity | (25.3 | )% | 15.1 | % | (7.3 | )% | 26.7 | % | ||||||||
SIGNIFICANT ACCOUNTING POLICIES
Refer to Note 1 - Significant Accounting Policies included in our unaudited interim consolidated financial statements for the three and six months ended June 30, 2020 included in this Quarterly Report for additional information related to our significant accounting policies.
COMMITMENTS AND CONTINGENCIES
From time to time, we may be contingently liable for litigation, legal and/or regulatory actions and proceedings and other claims. Refer to note 24 of our audited consolidated financial statements for the year ended December 31, 2019, which describes these claims.
For a discussion of risk factors relating to legal and other claims/actions against us, refer to "Item 5. Risk Factors" in our Annual Information Form and Annual Report on Form 40-F, each in respect of the year ended December 31, 2019.
CONTROLS AND PROCEDURES
There have been no changes in our internal controls over financial reporting that occurred during the three months ended June 30, 2020 that have materially affected, or are reasonably likely to materially affect, our internal control over financial reporting.
| 28 Magna International Inc. Second Quarter Report 2020 |
INDUSTRY TRENDS AND RISKS
Our operating results are primarily dependent on the levels of North American, European and Chinese car and light truck production by our customers. While we supply systems and components to every major original equipment manufacturer ["OEM"], we do not supply systems and components for every vehicle, nor is the value of our content consistent from one vehicle to the next. As a result, customer and program mix relative to market trends, as well as the value of our content on specific vehicle production programs, are also important drivers of our results.
OEM production volumes are generally aligned with vehicle sales levels and thus affected by changes in such levels. Aside from vehicle sales levels, production volumes are typically impacted by a range of factors, including: general economic and political conditions; labour disruptions; free trade arrangements; tariffs; relative currency values; commodities prices; supply chains and infrastructure; availability and relative cost of skilled labour; regulatory considerations, including those related to environmental emissions and safety standards; and other factors.
Overall vehicle sales levels are significantly affected by changes in consumer confidence levels, which may in turn be impacted by consumer perceptions and general trends related to the job, housing and stock markets, as well as other macroeconomic factors. Other factors which typically impact vehicle sales levels and thus production volumes include: interest rates and/or availability of credit; fuel and energy prices; relative currency values; regulatory restrictions on use of vehicles in certain megacities; and other factors.
While the foregoing economic, political and other factors are part of the general context in which the global automotive industry operates, there have been a number of significant industry trends that are shaping the future of the industry and creating opportunities and risks for automotive suppliers. We continue to implement a business strategy which is rooted in our best assessment as to the rate and direction of change in the automotive industry, including with respect to trends related to vehicle electrification and autonomy, as well as "mobility-as-a-service" ["MaaS"]. Our short- and medium-term operational success, as well as our ability to create long-term value through our business strategy, are subject to a number of risks and uncertainties. Significant industry trends, our business strategy and the major risks we face are discussed in our Annual Information Form ["AIF"] and Annual Report on Form 40-F ["Form 40-F"] in respect of the year ended December 31, 2019, together with subsequent filings, including our First Quarter Report 2020. Those industry trends and risk factors remain substantially unchanged in respect of the second quarter ended June 30, 2020, except as discussed under "Impact of COVID-19 on Our Business" elsewhere in this MD&A.
| Magna International Inc. Second Quarter Report 2020 29 |
FORWARD-LOOKING STATEMENTS
Certain statements in this MD&A may constitute "forward-looking information" or "forward-looking statements" (collectively, "forward-looking statements"). Any such forward-looking statements are intended to provide information about management's current expectations and plans and may not be appropriate for other purposes. Forward-looking statements may include financial and other projections, as well as statements regarding our future plans, strategic objectives or economic performance, or the assumptions underlying any of the foregoing, and other statements that are not recitations of historical fact. We use words such as "may", "would", "could", "should", "will", "likely", "expect", "anticipate", "believe", "intend", "plan", "aim", "forecast", "outlook", "project", "estimate", "target" and similar expressions suggesting future outcomes or events to identify forward-looking statements.
Forward-looking statements in this document include, but are not limited to, statements relating to: our actions in response to the COVID-19 (Coronavirus) pandemic, including with respect to: actions in our manufacturing operations; employee health and safety; employee income and benefits protections; restructuring and right-sizing actions; actions to maintain liquidity, including potential debt offerings; reductions or freezing of capital and other expenditures; and actions with respect to our customers and supply chain.
Forward-looking statements are based on information currently available to us, and are based on assumptions and analyses made by us in light of our experience and our perception of historical trends, current conditions and expected future developments, as well as other factors we believe are appropriate in the circumstances. While we believe we have a reasonable basis for making any such forward-looking statements, they are not a guarantee of future performance or outcomes. Whether actual results and developments conform to our expectations and predictions is subject to a number of risks, assumptions and uncertainties, many of which are beyond our control, and the effects of which can be difficult to predict, including, without limitation:
Risks Related to the Automotive Industry
| · | economic cyclicality; |
| · | regional production volume declines, including as a result of the COVID-19 (Coronavirus) pandemic; |
| · | intense competition; |
| · | potential restrictions on free trade; |
| · | trade disputes/tariffs; |
Customer and Supplier Related Risks
| · | concentration of sales with six customers; |
| · | OEM consolidation and cooperation; |
| · | shifts in market shares among vehicles or vehicle segments; |
| · | shifts in consumer "take rates" for products we sell; |
| · | dependence on outsourcing; |
| · | quarterly sales fluctuations; |
| · | potential loss of any material purchase orders; |
| · | a deterioration in the financial condition of our supply base, including as a result of the COVID-19 (Coronavirus) pandemic; |
Manufacturing Operational Risks
| · | product and new facility launch risks; |
| · | operational underperformance; |
| · | restructuring costs; |
| · | impairment charges; |
| · | labour disruptions; |
| · | COVID-19 (Coronavirus) shutdowns; |
| · | supply disruptions and applicable costs related to supply disruption mitigation initiatives, including as a result of the COVID-19 (Coronavirus) pandemic; |
| · | climate change risks; |
| · | attraction/retention of skilled labour; |
IT Security Risk
| · | IT/Cybersecurity breach; |
| · | Product cybersecurity breach; |
Pricing Risks
| · | pricing risks between time of quote and start of production; |
| · | price concessions; |
| · | commodity costs; |
| · | declines in scrap steel/aluminum prices; |
Warranty / Recall Risks
| · | costs related to repair or replace defective products, including due to a recall; |
| · | warranty or recall costs that exceed warranty provision or insurance coverage limits; |
| · | product liability claims |
Acquisition Risks
| · | inherent merger and acquisition risks; |
| · | acquisition integration risk; |
Other Business Risks
| · | risks related to conducting business through joint ventures; |
| · | our ability to consistently develop and commercialize innovative products or processes; |
| · | our changing business risk profile as a result of increased investment in electrification and autonomous/assisted driving, including: higher R&D and engineering costs, and challenges in quoting for profitable returns on products for which we may not have significant quoting experience; |
| · | risks of conducting business in foreign markets; |
| · | fluctuations in relative currency values; |
| · | tax risks; |
| · | reduced financial flexibility as a result of an economic shock; |
| · | changes in credit ratings assigned to us; |
Legal, Regulatory and Other Risks
| · | antitrust risk; |
| · | legal claims and/or regulatory actions against us; and |
| · | changes in laws and regulations, including those related to vehicle emissions. |
In evaluating forward-looking statements or forward-looking information, we caution readers not to place undue reliance on any forward-looking statement, and readers should specifically consider the various factors which could cause actual events or results to differ materially from those indicated by such forward-looking statements, including the risks, assumptions and uncertainties above which are discussed in greater detail in this document under the section titled "Industry Trends and Risks" and set out in our Annual Information Form filed with securities commissions in Canada and our annual report on Form 40-F filed with the United States Securities and Exchange Commission, and subsequent filings.
| 30 Magna International Inc. Second Quarter Report 2020 |
MAGNA INTERNATIONAL INC.
CONSOLIDATED STATEMENTS OF (LOSS) INCOME
[Unaudited]
[U.S. dollars in millions, except per share figures]
| Three months ended | Six months ended | |||||||||||||||||||
| June 30, | June 30, | |||||||||||||||||||
| Note | 2020 | 2019 | 2020 | 2019 | ||||||||||||||||
| Sales | 16 | $ | 4,293 | $ | 10,126 | $ | 12,950 | $ | 20,717 | |||||||||||
| Costs and expenses | ||||||||||||||||||||
| Cost of goods sold | 4,206 | 8,710 | 11,773 | 17,874 | ||||||||||||||||
| Depreciation and amortization | 334 | 334 | 670 | 655 | ||||||||||||||||
| Selling, general and administrative | 378 | 453 | 759 | 874 | ||||||||||||||||
| Interest expense, net | 21 | 14 | 38 | 45 | ||||||||||||||||
| Equity income | (25 | ) | (48 | ) | (55 | ) | (83 | ) | ||||||||||||
| Other expense (income), net | 2 | 168 | 68 | 168 | (611 | ) | ||||||||||||||
| (Loss) income from operations before income taxes | (789 | ) | 595 | (403 | ) | 1,963 | ||||||||||||||
| Income taxes | 10 | (137 | ) | 145 | (3 | ) | 412 | |||||||||||||
| Net (loss) income | (652 | ) | 450 | (400 | ) | 1,551 | ||||||||||||||
| Loss attributable to non-controlling interests | 5 | 2 | 14 | 7 | ||||||||||||||||
| Net (loss) income attributable to Magna International Inc. | $ | (647 | ) | $ | 452 | $ | (386 | ) | $ | 1,558 | ||||||||||
| (Loss) earnings per Common Share: | 3 | |||||||||||||||||||
| Basic | $ | (2.17 | ) | $ | 1.42 | $ | (1.29 | ) | $ | 4.84 | ||||||||||
| Diluted | $ | (2.17 | ) | $ | 1.42 | $ | (1.29 | ) | $ | 4.83 | ||||||||||
| Cash dividends paid per Common Share | $ | 0.400 | $ | 0.365 | $ | 0.800 | $ | 0.730 | ||||||||||||
| Weighted average number of Common Shares outstanding during | ||||||||||||||||||||
| the period [in millions]: | 3 | |||||||||||||||||||
| Basic | 298.4 | 318.4 | 300.3 | 321.7 | ||||||||||||||||
| Diluted | 298.4 | 319.5 | 300.3 | 322.9 | ||||||||||||||||
See accompanying notes
| Magna International Inc. Second Quarter Report 2020 31 |
MAGNA INTERNATIONAL INC.
CONSOLIDATED STATEMENTS OF COMPREHENSIVE (LOSS) INCOME
[Unaudited]
[U.S. dollars in millions]
| Three months ended | Six months ended | |||||||||||||||||
| June 30, | June 30, | |||||||||||||||||
| Note | 2020 | 2019 | 2020 | 2019 | ||||||||||||||
| Net (loss) income | $ | (652 | ) | $ | 450 | $ | (400 | ) | $ | 1,551 | ||||||||
| Other comprehensive income (loss), net of tax: | 13 | |||||||||||||||||
| Net unrealized gain (loss) on translation of net investment | ||||||||||||||||||
| in foreign operations | 87 | 19 | (233 | ) | 46 | |||||||||||||
| Net unrealized gain (loss) on cash flow hedges | 60 | 49 | (124 | ) | 86 | |||||||||||||
| Reclassification of net loss on cash flow hedges to | ||||||||||||||||||
| net income | 25 | 2 | 17 | 20 | ||||||||||||||
| Reclassification of net loss on pensions to net income | 1 | 2 | 3 | 3 | ||||||||||||||
| Other comprehensive income (loss) | 173 | 72 | (337 | ) | 155 | |||||||||||||
| Comprehensive (loss) income | (479 | ) | 522 | (737 | ) | 1,706 | ||||||||||||
| Comprehensive loss attributable to non-controlling interests | 6 | 13 | 21 | 6 | ||||||||||||||
| Comprehensive (loss) income attributable to | ||||||||||||||||||
| Magna International Inc. | $ | (473 | ) | $ | 535 | $ | (716 | ) | $ | 1,712 | ||||||||
See accompanying notes
| 32 Magna International Inc. Second Quarter Report 2020 |
MAGNA INTERNATIONAL INC.
CONSOLIDATED BALANCE SHEETS
[Unaudited]
[U.S. dollars in millions]
| As at | As at | |||||||||||
| June 30, | December 31, | |||||||||||
| Note | 2020 | 2019 | ||||||||||
| ASSETS | ||||||||||||
| Current assets | ||||||||||||
| Cash and cash equivalents | 4 | $ | 533 | $ | 1,276 | |||||||
| Accounts receivable | 5,253 | 5,927 | ||||||||||
| Inventories | 5 | 3,503 | 3,304 | |||||||||
| Prepaid expenses and other | 216 | 238 | ||||||||||
| Income taxes receivable | 10 | 87 | — | |||||||||
| 9,592 | 10,745 | |||||||||||
| Investments | 6 | 1,336 | 1,210 | |||||||||
| Fixed assets, net | 7,860 | 8,260 | ||||||||||
| Operating lease right-of-use assets | 1,777 | 1,811 | ||||||||||
| Intangible assets, net | 456 | 484 | ||||||||||
| Goodwill | 1,965 | 1,976 | ||||||||||
| Deferred tax assets | 353 | 308 | ||||||||||
| Other assets | 7 | 941 | 996 | |||||||||
| $ | 24,280 | $ | 25,790 | |||||||||
| LIABILITIES AND SHAREHOLDERS' EQUITY | ||||||||||||
| Current liabilities | ||||||||||||
| Short-term borrowings | 8 | $ | 188 | $ | — | |||||||
| Accounts payable | 4,243 | 5,628 | ||||||||||
| Accrued salaries and wages | 691 | 753 | ||||||||||
| Other accrued liabilities | 9 | 2,058 | 1,800 | |||||||||
| Income taxes payable | 10 | — | 17 | |||||||||
| Long-term debt due within one year | 150 | 106 | ||||||||||
| Current portion of operating lease liabilities | 221 | 225 | ||||||||||
| 7,551 | 8,529 | |||||||||||
| Long-term debt | 11 | 3,771 | 3,062 | |||||||||
| Operating lease liabilities | 1,577 | 1,601 | ||||||||||
| Long-term employee benefit liabilities | 675 | 677 | ||||||||||
| Other long-term liabilities | 390 | 371 | ||||||||||
| Deferred tax liabilities | 363 | 419 | ||||||||||
| 14,327 | 14,659 | |||||||||||
| Shareholders' equity | ||||||||||||
| Capital stock | ||||||||||||
| Common Shares | ||||||||||||
| [issued:298,624,236; December 31, 2019 – 303,250,415] | 12 | 3,164 | 3,198 | |||||||||
| Contributed surplus | 125 | 127 | ||||||||||
| Retained earnings | 7,804 | 8,596 | ||||||||||
| Accumulated other comprehensive loss | 13 | (1,413 | ) | (1,090 | ) | |||||||
| 9,680 | 10,831 | |||||||||||
| Non-controlling interests | 273 | 300 | ||||||||||
| 9,953 | 11,131 | |||||||||||
| $ | 24,280 | $ | 25,790 | |||||||||
See accompanying notes
| Magna International Inc. Second Quarter Report 2020 33 |
MAGNA INTERNATIONAL INC.
CONSOLIDATED STATEMENTS OF CASH FLOWS
[Unaudited]
[U.S. dollars in millions]
| Three months ended | Six months ended | |||||||||||||||||||
| June 30, | June 30, | |||||||||||||||||||
| Note | 2020 | 2019 | 2020 | 2019 | ||||||||||||||||
| Cash provided from (used for): | ||||||||||||||||||||
| OPERATING ACTIVITIES | ||||||||||||||||||||
| Net (loss) income | $ | (652 | ) | $ | 450 | $ | (400 | ) | $ | 1,551 | ||||||||||
| Items not involving current cash flows | 4 | 354 | 470 | 717 | 257 | |||||||||||||||
| (298 | ) | 920 | 317 | 1,808 | ||||||||||||||||
| Changes in operating assets and liabilities | 1, 4 | (934 | ) | — | (910 | ) | (294 | ) | ||||||||||||
| Cash (used for) provided from operating activities | (1,232 | ) | 920 | (593 | ) | 1,514 | ||||||||||||||
| INVESTMENT ACTIVITIES | ||||||||||||||||||||
| Fixed asset additions | (169 | ) | (328 | ) | (372 | ) | (579 | ) | ||||||||||||
| Increase in private equity investments | (2 | ) | (5 | ) | (102 | ) | (10 | ) | ||||||||||||
| Increase in investments, other assets and intangible assets | (72 | ) | (102 | ) | (165 | ) | (179 | ) | ||||||||||||
| Proceeds from disposition | 11 | 26 | 34 | 112 | ||||||||||||||||
| Acquisitions | — | (152 | ) | (7 | ) | (152 | ) | |||||||||||||
| Proceeds on sale of business | — | — | — | 1,129 | ||||||||||||||||
| Cash (used for) provided from investing activities | (232 | ) | (561 | ) | (612 | ) | 321 | |||||||||||||
| FINANCING ACTIVITIES | ||||||||||||||||||||
| Issues of debt | 11 | 817 | 10 | 825 | 15 | |||||||||||||||
| Increase (decrease) in short-term borrowings | 177 | (154 | ) | 176 | (928 | ) | ||||||||||||||
| Repayments of debt | (32 | ) | (43 | ) | (45 | ) | (129 | ) | ||||||||||||
| Issue of Common Shares on exercise of stock options | 1 | 6 | 2 | 14 | ||||||||||||||||
| Shares repurchased for tax withholdings on vesting of equity awards | — | (2 | ) | (10 | ) | (5 | ) | |||||||||||||
| Repurchase of Common Shares | 12 | — | (409 | ) | (201 | ) | (693 | ) | ||||||||||||
| Contributions to subsidiaries by non-controlling interests | — | — | — | 2 | ||||||||||||||||
| Dividends paid to non-controlling interests | (3 | ) | (13 | ) | (6 | ) | (13 | ) | ||||||||||||
| Dividends paid | (116 | ) | (110 | ) | (237 | ) | (229 | ) | ||||||||||||
| Cash provided from (used for) financing activities | 844 | (715 | ) | 504 | (1,966 | ) | ||||||||||||||
| Effect of exchange rate changes on cash, cash equivalents and restricted cash equivalents | 9 | (4 | ) | (43 | ) | 10 | ||||||||||||||
| Net decrease in cash, cash equivalents and Restricted cash equivalents during the period | (611 | ) | (360 | ) | (744 | ) | (121 | ) | ||||||||||||
| Cash, cash equivalents and restricted cash equivalents, beginning of period | 1,259 | 1,041 | 1,392 | 802 | ||||||||||||||||
| Cash, cash equivalents and restricted cash equivalents, end of period | 4 | $ | 648 | $ | 681 | $ | 648 | $ | 681 | |||||||||||
See accompanying notes
| 34 Magna International Inc. Second Quarter Report 2020 |
MAGNA INTERNATIONAL INC.
CONSOLIDATED STATEMENTS OF CHANGES IN EQUITY
[Unaudited]
[U.S. dollars in millions]
| Six months ended June 30, 2020 | |||||||||||||||||||||||||||
| Common Shares | Non- | ||||||||||||||||||||||||||
| Stated | Contributed | Retained | controlling | Total | |||||||||||||||||||||||
| Note | Number | Value | Surplus | Earnings | AOCL (i) | Interest | Equity | ||||||||||||||||||||
| [in millions] | |||||||||||||||||||||||||||
| Balance, December 31, 2019 | 303.2 | $ | 3,198 | $ | 127 | $ | 8,596 | $ | (1,090 | ) | $ | 300 | $ | 11,131 | |||||||||||||
| Net loss | (386 | ) | (14 | ) | (400 | ) | |||||||||||||||||||||
| Other comprehensive loss | (330 | ) | (7 | ) | (337 | ) | |||||||||||||||||||||
| Shares issued on exercise of stock options | 0.1 | 2 | 2 | ||||||||||||||||||||||||
| Release of stock and stock units | 0.4 | 13 | (13 | ) | — | ||||||||||||||||||||||
| Shares repurchased for tax withholdings on vesting of equity rewards | (0.2 | ) | (2 | ) | (8 | ) | (10 | ) | |||||||||||||||||||
| Repurchase and cancellation under normal course issuer bid | 12 | (5.0) | (53 | ) | (155 | ) | 7 | (201 | ) | ||||||||||||||||||
| Stock-based compensation expense | 11 | 11 | |||||||||||||||||||||||||
| Dividends paid to non-controlling interests | (6 | ) | (6 | ) | |||||||||||||||||||||||
| Dividends paid | 0.1 | 6 | (243 | ) | (237 | ) | |||||||||||||||||||||
| Balance, June 30, 2020 | 298.6 | $ | 3,164 | $ | 125 | $ | 7,804 | $ | (1,413 | ) | $ | 273 | $ | 9,953 | |||||||||||||
| Three months ended June 30, 2020 | |||||||||||||||||||||||||||
| Common Shares | Non- | ||||||||||||||||||||||||||
| Stated | Contributed | Retained | controlling | Total | |||||||||||||||||||||||
| Note | Number | Value | Surplus | Earnings | AOCL (i) | Interest | Equity | ||||||||||||||||||||
| [in millions] | |||||||||||||||||||||||||||
| Balance, March 31, 2020 | 298.5 | $ | 3,159 | $ | 117 | $ | 8,571 | $ | (1,587 | ) | $ | 282 | $ | 10,542 | |||||||||||||
| Net loss | (647 | ) | (5 | ) | (652 | ) | |||||||||||||||||||||
| Other comprehensive income | 174 | (1 | ) | 173 | |||||||||||||||||||||||
| Shares issued on exercise of stock options | 0.1 | 1 | 1 | ||||||||||||||||||||||||
| Stock-based compensation expense | 8 | 8 | |||||||||||||||||||||||||
| Dividends paid to non-controlling interests | (3 | ) | (3 | ) | |||||||||||||||||||||||
| Dividends paid | 4 | (120 | ) | (116 | ) | ||||||||||||||||||||||
| Balance, June 30, 2020 | 298.6 | $ | 3,164 | $ | 125 | $ | 7,804 | $ | (1,413 | ) | $ | 273 | $ | 9,953 | |||||||||||||
(i) AOCL is Accumulated Other Comprehensive Loss.
See accompanying notes
| Magna International Inc. Second Quarter Report 2020 35 |
MAGNA INTERNATIONAL INC.
CONSOLIDATED STATEMENTS OF CHANGES IN EQUITY
[Unaudited]
[U.S. dollars in millions]
| Six months ended June 30, 2019 | |||||||||||||||||||||||||||
| Common Shares | Non- | ||||||||||||||||||||||||||
| Stated | Contributed | Retained | controlling | Total | |||||||||||||||||||||||
| Note | Number | Value | Surplus | Earnings | AOCL (i) | Interest | Equity | ||||||||||||||||||||
| [in millions] | |||||||||||||||||||||||||||
| Balance, December 31, 2018, as adjusted | 327.3 | $ | 3,380 | $ | 120 | $ | 8,351 | $ | (1,175 | ) | $ | 458 | $ | 11,134 | |||||||||||||
| Net income | 1,558 | (7 | ) | 1,551 | |||||||||||||||||||||||
| Other comprehensive income | 154 | 1 | 155 | ||||||||||||||||||||||||
| Contributions by non-controlling interests | 2 | 2 | |||||||||||||||||||||||||
| Sale of business | 8 | 8 | |||||||||||||||||||||||||
| Shares issued on exercise of stock options | 0.4 | 17 | (3 | ) | 14 | ||||||||||||||||||||||
| Release of stock and stock units | 0.2 | 9 | (9 | ) | — | ||||||||||||||||||||||
| Shares repurchased for tax withholdings on vesting of equity rewards | (0.1 | ) | (1 | ) | (4 | ) | (5 | ) | |||||||||||||||||||
| Repurchase and cancellation under normal course issuer bid | 12 | (14.2 | ) | (147 | ) | (562 | ) | 16 | (693 | ) | |||||||||||||||||
| Stock-based compensation expense | 28 | 28 | |||||||||||||||||||||||||
| Dividends paid to non-controlling Interests | (13 | ) | (13) | ||||||||||||||||||||||||
| Dividends paid | 0.2 | 8 | (237 | ) | (229 | ) | |||||||||||||||||||||
| Balance, June 30, 2019 | 313.8 | $ | 3,266 | $ | 136 | $ | 9,106 | $ | (997 | ) | $ | 441 | $ | 11,952 | |||||||||||||
| Three months ended June 30, 2019 | |||||||||||||||||||||||||||
| Common Shares | Non- | ||||||||||||||||||||||||||
| Stated | Contributed | Retained | controlling | Total | |||||||||||||||||||||||
| Note | Number | Value | Surplus | Earnings | AOCL (i) | Interest | Equity | ||||||||||||||||||||
| [in millions] | |||||||||||||||||||||||||||
| Balance, March 31, 2019 | 322.1 | $ | 3,340 | $ | 129 | $ | 9,101 | $ | (1,090 | ) | $ | 467 | $ | 11,947 | |||||||||||||
| Net income | 452 | (2 | ) | 450 | |||||||||||||||||||||||
| Other comprehensive income | 83 | (11 | ) | 72 | |||||||||||||||||||||||
| Shares issued on exercise of stock options | 0.2 | 7 | (1 | ) | 6 | ||||||||||||||||||||||
| Release of stock and stock units | 0.1 | 3 | (3 | ) | — | ||||||||||||||||||||||
| Shares repurchased for tax withholdings on vesting of equity rewards | (1 | ) | (1 | ) | (2 | ) | |||||||||||||||||||||
| Repurchase and cancellation under normal course issuer bid | 12 | (8.6 | ) | (88 | ) | (331 | ) | 10 | (409 | ) | |||||||||||||||||
| Stock-based compensation expense | 11 | 11 | |||||||||||||||||||||||||
| Dividends paid to non-controlling Interests | (13 | ) | (13 | ) | |||||||||||||||||||||||
| Dividends paid | 5 | (115 | ) | (110 | ) | ||||||||||||||||||||||
| Balance, June 30, 2019 | 313.8 | $ | 3,266 | $ | 136 | $ | 9,106 | $ | (997 | ) | $ | 441 | $ | 11,952 | |||||||||||||
(ii) AOCL is Accumulated Other Comprehensive Loss.
See accompanying notes
| 36 Magna International Inc. Second Quarter Report 2020 |
MAGNA INTERNATIONAL INC.
NOTES TO INTERIM CONSOLIDATED FINANCIAL STATEMENTS
[Unaudited]
[All amounts in U.S. dollars and all tabular amounts in millions unless otherwise noted]
| 1. | significant accounting policies |
| [a] | Basis of presentation |
The unaudited interim consolidated financial statements of Magna International Inc. and its subsidiaries [collectively "Magna" or the "Company"] have been prepared in U.S. dollars following accounting principles generally accepted in the United States of America ["GAAP"]. The unaudited interim consolidated financial statements do not conform in all respects to the requirements of GAAP for annual financial statements. Accordingly, these unaudited interim consolidated financial statements should be read in conjunction with the December 31, 2019 audited consolidated financial statements and notes thereto included in the Company's 2019 Annual Report.
The unaudited interim consolidated financial statements reflect all adjustments, which consist only of normal and recurring adjustments, necessary to present fairly the financial position at June 30, 2020 and the results of operations, changes in equity and cash flows for the three and six-month periods ended June 30, 2020 and 2019.
| [b] | Use of estimates |
The preparation of the unaudited interim consolidated financial statements in conformity with GAAP requires management to make estimates and assumptions that affect the amounts reported and disclosed in the consolidated financial statements and accompanying notes. As of June 30, 2020, the impact of the outbreak of COVID-19 continues to develop and as a result, many of the Company's estimates and assumptions required increased judgment. As events continue to evolve and additional information becomes available, actual results may differ from these estimates.
| [c] | Government grants |
Government grants are recognized at their fair value where there is a reasonable assurance that the grant will be received and the Company will comply with all required conditions. Government grants relating to costs are deferred and recognized in income over the period necessary to match them with the costs that they are intended to compensate and are presented as a reduction of the related expense.
| [d] | Restructuring |
Restructuring costs may include employee termination benefits, as well as other incremental costs resulting from restructuring actions. These actions may result in employees receiving voluntary or involuntary employee termination benefits, which are mainly pursuant to union or other contractual agreements or statutory requirements. Voluntary termination benefits are accrued when an employee accepts the related offer. Involuntary termination benefits are accrued upon the commitment to a termination plan and when the benefit arrangement is communicated to affected employees, or when liabilities are determined to be probable and estimable, depending on the existence of a substantive plan for termination. Additional elements of severance and termination benefits associated with non-recurring benefits may be recognized rateably over each employee's required future service period. All other restructuring costs are expensed as incurred.
| Magna International Inc. Second Quarter Report 2020 37 |
MAGNA INTERNATIONAL INC.
NOTES TO INTERIM CONSOLIDATED FINANCIAL STATEMENTS
[Unaudited]
[All amounts in U.S. dollars and all tabular amounts in millions unless otherwise noted]
| 2. | OTHER EXPENSE (INCOME), NET |
| Three months ended | Six months ended | |||||||||||||||||||
| June 30, | June 30, | |||||||||||||||||||
| 2020 | 2019 | 2020 | 2019 | |||||||||||||||||
| Restructuring and impairments | [a] | $ | 168 | $ | 7 | $ | 168 | $ | 21 | |||||||||||
| Net losses (gains) on investments | [b] | — | 67 | — | (110 | ) | ||||||||||||||
| Gain on the sale of Business | [c] | — | (6 | ) | — | (522 | ) | |||||||||||||
| Other expense (income), net | $ | 168 | $ | 68 | $ | 168 | $ | (611 | ) | |||||||||||
| [a] | Restructuring and impairments |
In response to the impact that COVID-19 is expected to have on vehicle production volumes over the short to medium term, in the second quarter of 2020 the Company initiated and/or accelerated the timing of restructuring plans to right-size its business. These restructuring actions include plant closures and workforce reductions.
The following table summarizes the restructuring and fixed asset impairment charges recorded by segment:
| Net of | ||||||||||||||||
| Restructuring | Impairment | Total | Tax | |||||||||||||
| Power & Vision | $ | 104 | $ | 11 | $ | 115 | $ | 90 | ||||||||
| Body Exteriors & Structures | 29 | 8 | 37 | 32 | ||||||||||||
| Seating Systems | 16 | — | 16 | 14 | ||||||||||||
| $ | 149 | $ | 19 | $ | 168 | $ | 136 | |||||||||
For the three and six months ended June 30, 2019, the Company recorded restructuring charges of $7 million and $21 million [$7 million and $21 million after tax], respectively, for its Body Exteriors & Structures operations.
| [b] | Net losses (gains) on investments |
For the three and six months ended June 30, 2019, the Company recorded net losses of $67 million and net gains of $110 million [$57 million after tax and $94 million after tax], respectively, substantially related to its investment in Lyft, Inc.
| [c] | Gain on the sale of Business |
For the three and six months ended June 30, 2019, the Company recorded a gain on the sale of its Fluid Pressure & Controls business of $6 million and $522 million [$7 million after tax affect and $445 million after tax], respectively, in the Power & Vision segment.
| 38 Magna International Inc. Second Quarter Report 2020 |
MAGNA INTERNATIONAL INC.
NOTES TO INTERIM CONSOLIDATED FINANCIAL STATEMENTS
[Unaudited]
[All amounts in U.S. dollars and all tabular amounts in millions unless otherwise noted]
| 3. | (Loss) EARNINGS PER SHARE |
| Three months ended | Six months ended | |||||||||||||||
| June 30, | June 30, | |||||||||||||||
| 2020 | 2019 | 2020 | 2019 | |||||||||||||
| Basic (loss) earnings per Common Share: | ||||||||||||||||
| Net (loss) income attributable to Magna International Inc. | $ | (647 | ) | $ | 452 | $ | (386 | ) | $ | 1,558 | ||||||
| Weighted average number of Common Shares outstanding | 298.4 | 318.4 | 300.3 | 321.7 | ||||||||||||
| Basic (loss) earnings per Common Share | $ | (2.17 | ) | $ | 1.42 | $ | (1.29 | ) | $ | 4.84 | ||||||
| Diluted (loss) earnings per Common Share [a]: | ||||||||||||||||
| Net (loss) income attributable to Magna International Inc. | $ | (647 | ) | $ | 452 | $ | (386 | ) | $ | 1,558 | ||||||
| Weighted average number of Common Shares outstanding Adjustments | 298.4 | 318.4 | 300.3 | 321.7 | ||||||||||||
| Stock options and restricted stock | — | 1.1 | — | 1.2 | ||||||||||||
| 298.4 | 319.5 | 300.3 | 322.9 | |||||||||||||
| Diluted (loss) earnings per Common Share | $ | (2.17 | ) | $ | 1.42 | $ | (1.29 | ) | $ | 4.83 | ||||||
| [a] | For the three and six months ended months ended June 30, 2020, diluted earnings per Common Share excluded 9.7 million and 9.3 million, respectively, Common Shares issuable under the Company's Incentive Stock Option Plan because the effect of including them would have been anti-dilutive. |
For the three and six months ended June 30, 2019, diluted earnings per Common Share excluded 4.5 million and 4.0 million Common Shares issuable under the Company's Incentive Stock Option Plan because these options were not “in-the-money”. The dilutive effect of participating securities using the two-class method was excluded from the calculation of earnings per share because the effect would be immaterial.
| Magna International Inc. Second Quarter Report 2020 39 |
MAGNA INTERNATIONAL INC.
NOTES TO INTERIM CONSOLIDATED FINANCIAL STATEMENTS
[Unaudited]
[All amounts in U.S. dollars and all tabular amounts in millions unless otherwise noted]
| 4. | DETAILS OF CASH FROM OPERATING ACTIVITIES |
| [a] | Cash, cash equivalents and restricted cash equivalents: |
| June 30, | December 31, | |||||||
| 2020 | 2019 | |||||||
| Bank term deposits and bankers' acceptances | $ | 274 | $ | 724 | ||||
| Cash | 259 | 552 | ||||||
| Cash and cash equivalents | 533 | 1,276 | ||||||
| Restricted cash equivalents included in prepaid expenses [note 8] | 115 | 116 | ||||||
| $ | 648 | $ | 1,392 | |||||
| [b] | Items not involving current cash flows: |
| Three months ended | Six months ended | |||||||||||||||
| June 30, | June 30, | |||||||||||||||
| 2020 | 2019 | 2020 | 2019 | |||||||||||||
| Depreciation and amortization | $ | 334 | $ | 334 | $ | 670 | $ | 655 | ||||||||
| Amortization of other assets included in cost of goods sold | 37 | 54 | 90 | 113 | ||||||||||||
| Other non-cash charges | 40 | 5 | 36 | 34 | ||||||||||||
| Deferred income taxes | (98 | ) | 6 | (102 | ) | 66 | ||||||||||
| Equity income in excess of dividends received | 22 | 10 | 4 | 21 | ||||||||||||
| Gain on sale of business | — | (6 | ) | — | (522 | ) | ||||||||||
| Non-cash portion of Other expense (income), net [note 2] | 19 | 67 | 19 | (110 | ) | |||||||||||
| $ | 354 | $ | 470 | $ | 717 | $ | 257 | |||||||||
| [c] | Changes in operating assets and liabilities: |
| Three months ended | Six months ended | |||||||||||||||
| June 30, | June 30, | |||||||||||||||
| 2020 | 2019 | 2020 | 2019 | |||||||||||||
| Accounts receivable | $ | 442 | $ | 329 | $ | 535 | $ | (617 | ) | |||||||
| Inventories | 63 | 11 | (214 | ) | (96 | ) | ||||||||||
| Prepaid expenses and other | 15 | 28 | (13 | ) | (4 | ) | ||||||||||
| Accounts payable | (1,405 | ) | (296 | ) | (1,296 | ) | 104 | |||||||||
| Accrued salaries and wages | (120 | ) | (114 | ) | (48 | ) | (27 | ) | ||||||||
| Other accrued liabilities | 176 | 14 | 197 | 285 | ||||||||||||
| Income taxes payable | (105 | ) | 28 | (71 | ) | 61 | ||||||||||
| $ | (934 | ) | $ | — | $ | (910 | ) | $ | (294 | ) | ||||||
| 5. | INVENTORIES |
Inventories consist of:
| June 30, | December 31, | |||||||
| 2020 | 2019 | |||||||
| Raw materials and supplies | $ | 1,264 | $ | 1,201 | ||||
| Work-in-process | 344 | 339 | ||||||
| Finished goods | 418 | 425 | ||||||
| Tooling and engineering | 1,477 | 1,339 | ||||||
| $ | 3,503 | $ | 3,304 | |||||
Tooling and engineering inventory represents costs incurred on tooling and engineering services contracts in excess of billed and unbilled amounts included in accounts receivable.
| 40 Magna International Inc. Second Quarter Report 2020 |
MAGNA INTERNATIONAL INC.
NOTES TO INTERIM CONSOLIDATED FINANCIAL STATEMENTS
[Unaudited]
[All amounts in U.S. dollars and all tabular amounts in millions unless otherwise noted]
| 6. | Investments |
| June 30, | December 31, | |||||||
| 2020 | 2019 | |||||||
| Equity method investments | $ | 1,138 | $ | 1,107 | ||||
| Private equity investments | 194 | 95 | ||||||
| Other | 4 | 8 | ||||||
| $ | 1,336 | $ | 1,210 | |||||
| 7. | Other assets |
Other assets consist of:
| June 30, | December 31, | |||||||
| 2020 | 2019 | |||||||
| Preproduction costs related to long-term supply agreements | $ | 670 | $ | 683 | ||||
| Long-term receivables | 197 | 217 | ||||||
| Pension overfunded status | 22 | 22 | ||||||
| Unrealized gain on cash flow hedges | 12 | 24 | ||||||
| Other, net | 40 | 50 | ||||||
| $ | 941 | $ | 996 | |||||
| 8. | short-term borrowings |
The Company's short-term borrowings consist of the following:
| June 30, | December 31, | |||||||
| 2020 | 2019 | |||||||
| Bank indebtedness | $ | 20 | $ | — | ||||
| Commercial paper [i] | 168 | — | ||||||
| $ | 188 | $ | — | |||||
| [i] | As at June 30, 2020, $168 million or €150 million of euro notes were outstanding under the euro-commercial paper program, with a weighted-average interest rate of 0.19%, and maturities less than three months. |
Credit Facilities
The Company has an agreement for a credit facility that is drawn in euros that is secured with a USD cash deposit of 105% of the outstanding balance. As at June 30, 2020, the amount drawn was $110 million and the related restricted cash equivalent deposit was $115 million. Given that the credit agreement includes a netting arrangement that provides for the legal right of setoff, the remaining net deposit of $5 million is included in the prepaid expenses and other balance [note 4]. As at December 31, 2019, the outstanding balance under the credit facility was $110 million, and the net deposit included in the prepaid expenses and other balance was $6 million.
On April 13, 2020, the Company amended its 364-day syndicated revolving credit facility, which included an increase to the size of the facility from U.S. $300 million to U.S. $1.0 billion and an extension of the maturity date from June 22, 2020 to April 12, 2021. The facility can be drawn in U.S. dollars or Canadian dollars. As of June 30, 2020, the Company has not borrowed any funds under this credit facility.
| Magna International Inc. Second Quarter Report 2020 41 |
MAGNA INTERNATIONAL INC.
NOTES TO INTERIM CONSOLIDATED FINANCIAL STATEMENTS
[Unaudited]
[All amounts in U.S. dollars and all tabular amounts in millions unless otherwise noted]
| 9. | Warranty |
The following is a continuity of the Company's warranty accruals, included in Other accrued liabilities:
| 2020 | 2019 | |||||||
| Balance, beginning of period | $ | 252 | $ | 208 | ||||
| Expense, net | 22 | 21 | ||||||
| Settlements | (73 | ) | (24 | ) | ||||
| Foreign exchange and other | (2 | ) | 4 | |||||
| Balance, March 31 | 199 | 209 | ||||||
| Expense, net | 37 | 25 | ||||||
| Settlements | (32 | ) | (14 | ) | ||||
| Foreign exchange and other | 1 | 3 | ||||||
| Balance, June 30 | $ | 205 | $ | 223 | ||||
| 10. | INCOME TAXES |
For the three months ended June 30, 2020, the Company's income tax benefit does not reflect the customary tax rate mainly as a result of losses in Europe that could not be recognized.
For the six months ended June 30, 2020, the Company's income tax benefit does not reflect the customary tax rate mainly as a result of losses in Europe that could not be recognized, and the tax on foreign exchange gains reported on U.S. dollar denominated assets for Mexican tax purposes that are not recognized for U.S. GAAP purposes.
| 11. | Long-term debt |
On June 8, 2020, the Company issued $750 million of 2.45% fixed-rate Senior Notes which mature on June 15, 2030. The Senior Notes are senior unsecured obligations, interest is payable on June 15 and December 15 of each year, and do not include any financial covenants. The Company may redeem the Senior Notes in whole or in part at any time, and from time to time, at specified redemption prices determined in accordance with the terms of the indenture governing the Senior Notes. All of the Senior Notes were issued for general corporate purposes.
| 12. | CAPITAL STOCK |
| [a] | The Company repurchased shares under normal course issuer bids as follows: |
| 2020 | 2019 | |||||||||||||||
| Number | Cash | Number | Cash | |||||||||||||
| of shares | consideration | of shares | consideration | |||||||||||||
| First Quarter | 5,032,621 | $ | 201 | 5,661,112 | $ | 284 | ||||||||||
| Second Quarter | — | — | 8,535,533 | 409 | ||||||||||||
| 5,032,621 | $ | 201 | 14,196,645 | $ | 693 | |||||||||||
| [b] | The following table presents the maximum number of shares that would be outstanding if all the dilutive instruments outstanding at August 6, 2020 were exercised or converted: |
| Common Shares | 298,624,436 | ||
| Stock options (i) | 9,683,301 | ||
| 308,307,737 |
| (i) | Options to purchase Common Shares are exercisable by the holder in accordance with the vesting provisions and upon payment of the exercise price as may be determined from time to time pursuant to the Company's stock option plans. |
| 42 Magna International Inc. Second Quarter Report 2020 |
MAGNA INTERNATIONAL INC.
NOTES TO INTERIM CONSOLIDATED FINANCIAL STATEMENTS
[Unaudited]
[All amounts in U.S. dollars and all tabular amounts in millions unless otherwise noted]
| 13. | ACCUMULATED other comprehensive loss |
The following is a continuity schedule of accumulated other comprehensive loss:
| 2020 | 2019 | |||||||
| Accumulated net unrealized loss on translation of net investment in foreign Operations | ||||||||
| Balance, beginning of period | $ | (907 | ) | $ | (917 | ) | ||
| Net unrealized (loss) gain | (314 | ) | 15 | |||||
| Repurchase of shares under normal course issuer bid | 7 | 6 | ||||||
| Balance, March 31 | (1,214 | ) | (896 | ) | ||||
| Net unrealized gain | 88 | 30 | ||||||
| Repurchase of shares under normal course issuer bid | — | 10 | ||||||
| Balance, June 30 | (1,126 | ) | (856 | ) | ||||
| Accumulated net unrealized gain (loss) on cash flow hedges (i) | ||||||||
| Balance, beginning of period | 38 | (68 | ) | |||||
| Net unrealized (loss) gain | (184 | ) | 37 | |||||
| Reclassification of net (gain) loss to net income | (8 | ) | 18 | |||||
| Balance, March 31 | (154 | ) | (13 | ) | ||||
| Net unrealized gain | 60 | 49 | ||||||
| Reclassification of net loss to net income | 25 | 2 | ||||||
| Balance, June 30 | (69 | ) | 38 | |||||
| Accumulated net unrealized loss on pensions | ||||||||
| Balance, beginning of period | (221 | ) | (190 | ) | ||||
| Reclassification of net loss to net income | 2 | 1 | ||||||
| Sale of business | — | 8 | ||||||
| Balance, March 31 | (219 | ) | (181 | ) | ||||
| Reclassification of net loss to net income | 1 | 2 | ||||||
| Balance, June 30 | (218 | ) | (179 | ) | ||||
| Total accumulated other comprehensive loss | $ | (1,413 | ) | $ | (997 | ) | ||
| (i) | The amount of income tax benefit (expense) that has been netted in the accumulated net unrealized gain on cash flow hedges is as follows: |
| 2020 | 2019 | |||||||
| Balance, beginning of period | $ | (14 | ) | $ | 23 | |||
| Net unrealized loss (gain) | 66 | (13 | ) | |||||
| Reclassification of net gain (loss) to net income | 3 | (6 | ) | |||||
| Balance, March 31 | 55 | 4 | ||||||
| Net unrealized gain | (21 | ) | (18 | ) | ||||
| Reclassifications of net loss to net income | (9 | ) | (1 | ) | ||||
| Balance, June 30 | $ | 25 | $ | (15 | ) | |||
The amount of other comprehensive loss that is expected to be reclassified to net income over the next 12 months is $54 million.
| Magna International Inc. Second Quarter Report 2020 43 |
MAGNA INTERNATIONAL INC.
NOTES TO INTERIM CONSOLIDATED FINANCIAL STATEMENTS
[Unaudited]
[All amounts in U.S. dollars and all tabular amounts in millions unless otherwise noted]
| 14. | Financial instruments |
| [a] | Financial assets and liabilities |
The Company’s financial assets and financial liabilities consist of the following:
| June 30, | December 31, | |||||||
| 2020 | 2019 | |||||||
| Financial assets | ||||||||
| Cash and cash equivalents | $ | 533 | $ | 1,276 | ||||
| Restricted cash equivalents | 115 | 116 | ||||||
| Accounts receivable | 5,253 | 5,927 | ||||||
| Private equity investments | 194 | 95 | ||||||
| Severance investments | 1 | 1 | ||||||
| Long-term receivables included in other assets | 197 | 217 | ||||||
| $ | 6,293 | $ | 7,632 | |||||
| Financial liabilities | ||||||||
| Bank indebtedness | $ | 20 | $ | — | ||||
| Commercial Paper | 168 | — | ||||||
| Long-term debt (including portion due within one year) | 3,921 | 3,168 | ||||||
| Accounts payable | 4,243 | 5,628 | ||||||
| $ | 8,352 | $ | 8,796 | |||||
| Derivatives designated as effective hedges, measured at fair value | ||||||||
| Foreign currency contracts | ||||||||
| Prepaid expenses | $ | 14 | $ | 46 | ||||
| Other assets | 12 | 24 | ||||||
| Other accrued liabilities | (63 | ) | (10 | ) | ||||
| Other long-term liabilities | (45 | ) | (8 | ) | ||||
| $ | (82 | ) | $ | 52 | ||||
| [b] | Derivatives designated as effective hedges, measured at fair value |
The Company presents derivatives that are designated as effective hedges at gross fair values in the consolidated balance sheets. However, master netting and other similar arrangements allow net settlements under certain conditions. The following table shows the Company’s derivative foreign currency contracts at gross fair value as reflected in the consolidated balance sheets and the unrecognized impacts of master netting arrangements:
| Gross | Gross | |||||||||||
| amounts | amounts | |||||||||||
| presented | not offset | |||||||||||
| in consolidated | in consolidated | |||||||||||
| balance sheets | balance sheets | Net amounts | ||||||||||
| June 30, 2020 | ||||||||||||
| Assets | $ | 26 | $ | 21 | $ | 5 | ||||||
| Liabilities | $ | (108 | ) | $ | (21 | ) | $ | (87 | ) | |||
| December 31, 2019 | ||||||||||||
| Assets | $ | 70 | $ | 15 | $ | 55 | ||||||
| Liabilities | $ | (18 | ) | $ | (15 | ) | $ | (3 | ) | |||
| 44 Magna International Inc. Second Quarter Report 2020 |
MAGNA INTERNATIONAL INC.
NOTES TO INTERIM CONSOLIDATED FINANCIAL STATEMENTS
[Unaudited]
[All amounts in U.S. dollars and all tabular amounts in millions unless otherwise noted]
| 14. | Financial instruments (CONTINUED) |
| [c] | Fair value |
The Company determined the estimated fair values of its financial instruments based on valuation methodologies it believes are appropriate; however, considerable judgment is required to develop these estimates. Accordingly, these estimated fair values are not necessarily indicative of the amounts the Company could realize in a current market exchange. The estimated fair value amounts can be materially affected by the use of different assumptions or methodologies. The methods and assumptions used to estimate the fair value of financial instruments are described below:
Cash and cash equivalents, restricted cash equivalents, accounts receivable, short-term borrowings and accounts payable.
Due to the short period to maturity of the instruments, the carrying values as presented in the consolidated balance sheets are reasonable estimates of fair values.
Private equity securities
The Company estimates the value of its private equity securities based on valuation methods using the observable transaction price at the transaction date and other observable inputs including rights and obligations of the securities held by the Company. [Level 3 input based on the GAAP fair value hierarchy.]
Term debt
The Company’s term debt includes $150 million due within one year. Due to the short period to maturity of this debt, the carrying value as presented in the consolidated balance sheets is a reasonable estimate of its fair value.
Senior Notes
The fair value of our Senior Notes are classified as Level 1 when we use quoted prices in active markets and Level 2 when the quoted prices are from less active markets or when other observable inputs are used to determine fair value. At June 30, 2020, the net book value of the Company’s Senior Notes was $3.75 billion and the estimated fair value was $3.97 billion.
| [d] | Credit risk |
The Company’s financial assets that are exposed to credit risk consist primarily of cash and cash equivalents, restricted cash equivalents [net of the euro drawn amount], accounts receivable, and foreign exchange forward contracts with positive fair values.
Cash and cash equivalents and restricted cash equivalents which consists of short-term investments, are only invested in bank term deposits and bank commercial paper with primarily an investment grade credit rating. Credit risk is further reduced by limiting the amount which is invested in certain major financial institutions.
The Company is also exposed to credit risk from the potential default by any of its counterparties on its foreign exchange forward contracts. The Company mitigates this credit risk by dealing with counterparties who are major financial institutions that the Company anticipates will satisfy their obligations under the contracts.
| Magna International Inc. Second Quarter Report 2020 45 |
MAGNA INTERNATIONAL INC.
NOTES TO INTERIM CONSOLIDATED FINANCIAL STATEMENTS
[Unaudited]
[All amounts in U.S. dollars and all tabular amounts in millions unless otherwise noted]
| 14. | Financial instruments (CONTINUED) |
| [d] | Credit risk (Continued) |
In the normal course of business, the Company is exposed to credit risk from its customers, substantially all of which are in the automotive industry and are subject to credit risks associated with the automotive industry. For the three and six month periods ended June 30, 2020, sales to the Company’s six largest customers represented 78% and 79% of the Company’s sales, respectively, and substantially all of the Company’s sales are to customers with which it has ongoing contractual relationships. The Company continues to closely monitor its customers during the current economic crises. In determining the allowance for expected credit losses, the Company considers changes in customer’s credit ratings, liquidity, customer’s historical payments and loss experience, current economic conditions and the Company’s expectations of future economic conditions.
| [e] | Interest rate risk |
The Company is not exposed to interest rate risk on its term debt, commercial paper and Senior Notes as the interest rates on these instruments are fixed.
| [f] | Currency risk and foreign exchange contracts |
The Company is exposed to fluctuations in foreign exchange rates when manufacturing facilities have committed to the delivery of products for which the selling price has been quoted in currencies other than the facilities’ functional currency, and when materials and equipment are purchased in currencies other than the facilities’ functional currency. In an effort to manage this net foreign exchange exposure, the Company employs hedging programs, primarily through the use of foreign exchange forward contracts.
At June 30, 2020, the Company had outstanding foreign exchange forward contracts representing commitments to buy and sell various foreign currencies. Significant commitments are as follows:
| Buys | Sells | |||||||
| For Canadian dollars | ||||||||
| U.S. amount | 137 | (1,522 | ) | |||||
| euro amount | 11 | (2 | ) | |||||
| For U.S. dollars | ||||||||
| Peso amount | 8,738 | — | ||||||
| Euro amount | 136 | (232 | ) | |||||
| For euros | ||||||||
| U.S. amount | 275 | (156 | ) | |||||
| GBP amount | 10 | (21 | ) | |||||
| Czech Koruna amount | 7,815 | (9 | ) | |||||
| Polish Zlotys amount | 486 | (1 | ) | |||||
Forward contracts mature at various dates through 2024. Foreign currency exposures are reviewed quarterly.
| 46 Magna International Inc. Second Quarter Report 2020 |
MAGNA INTERNATIONAL INC.
NOTES TO INTERIM CONSOLIDATED FINANCIAL STATEMENTS
[Unaudited]
[All amounts in U.S. dollars and all tabular amounts in millions unless otherwise noted]
| 15. | CONTINGENCIES |
From time to time, the Company may become involved in regulatory proceedings, or become liable for legal, contractual and other claims by various parties, including customers, suppliers, former employees, class action plaintiffs and others. On an ongoing basis, the Company attempts to assess the likelihood of any adverse judgments or outcomes to these proceedings or claims, together with potential ranges of probable costs and losses. A determination of the provision required, if any, for these contingencies is made after analysis of each individual issue. The required provision may change in the future due to new developments in each matter or changes in approach such as a change in settlement strategy in dealing with these matters.
| [a] | In September 2014, the Conselho Administrativo de Defesa Economica [“CADE”], Brazil’s Federal competition authority, attended at one of the Company's operating divisions in Brazil to obtain information in connection with an ongoing antitrust investigation relating to suppliers of automotive door latches and related products [“access mechanisms”]. |
In May 2019, CADE informed the Company that it completed its preliminary investigation and, based on a review of the evidence, has commenced a formal administrative proceeding into alleged anticompetitive behaviour relating to access mechanisms involving the Company.
Administrative proceedings of this nature can often continue for several years. At this time, management is unable to predict the duration or outcome of the Brazilian administrative proceeding, including whether any operating divisions of the Company will be found liable for any violation of law or the extent or magnitude of any liability, if any.
In the event that wrongful conduct is found, CADE may impose administrative penalties or fines taking into account several mitigating and aggravating factors. Administrative fines are tied to the sales in Brazil of the applicable Magna companies in the fiscal year prior to the commencement of the formal administrative proceeding. Magna could also be subject to restitution settlements, civil proceedings and other consequences, including reputational damage.
The Company’s policy is to comply with all applicable laws, including antitrust and competition laws. The Company has completed its previously announced global review focused on antitrust risk and does not currently anticipate any material liabilities in connection with the review.
| [b] | The Company is at risk for product warranty costs, which include product liability and recall costs, and is currently experiencing increased customer pressure to assume greater warranty responsibility. For most types of products, the Company only accounts for existing or probable product warranty claims. However, for certain complete vehicle assembly, powertrain systems and electronics contracts, the Company records an estimate of future warranty-related costs based on the terms of the specific customer agreements and/or the Company’s warranty experience. Product liability and recall provisions are established based on the Company’s best estimate of the amounts necessary to settle existing claims, which typically take into account: the number of units that may be returned; the cost of the product being replaced; labour to remove and replace the defective part; and the customer’s administrative costs relating to the recall. Where applicable, such provisions are booked net of recoveries from sub-suppliers and along with related insurance recoveries. Due to the uncertain nature of the net costs, actual product liability costs could be materially different from the Company’s best estimates of future costs [note 9]. |
| Magna International Inc. Second Quarter Report 2020 47 |
MAGNA INTERNATIONAL INC.
NOTES TO INTERIM CONSOLIDATED FINANCIAL STATEMENTS
[Unaudited]
[All amounts in U.S. dollars and all tabular amounts in millions unless otherwise noted]
| 16. | Segmented Information |
Magna is a global automotive supplier which has complete vehicle engineering and contract manufacturing expertise, as well as product capabilities which include body, chassis, exterior, seating, powertrain, active driver assistance, electronics, mirrors & lighting, mechatronics and roof systems. Magna also has electronic and software capabilities across many of these areas.
The Company is organized under four operating segments: Body Exteriors & Structures, Power & Vision, Seating Systems and Complete Vehicles. These segments have been determined on the basis of technological opportunities, product similarities, and market and operating factors, and are also the Company's reportable segments.
The Company’s chief operating decision maker uses Adjusted Earnings before Interest and Income Taxes [“Adjusted EBIT”] as the measure of segment profit or loss, since management believes Adjusted EBIT is the most appropriate measure of operational profitability or loss for its reporting segments. Adjusted EBIT is calculated by taking net (loss) income from operations and adding back income tax expense (benefit), interest expense, net, and other (expense) income, net.
| 48 Magna International Inc. Second Quarter Report 2020 |
| MAGNA INTERNATIONAL INC. | |
| NOTES TO INTERIM CONSOLIDATED FINANCIAL STATEMENTS | |
| [Unaudited] | |
| [All amounts in U.S. dollars and all tabular amounts in millions unless otherwise noted] |
| 16. | Segmented Information (CONTINUED) |
| [a] | The following tables show segment information for the Company's reporting segments and a reconciliation of Adjusted EBIT to the Company's consolidated net (loss) income: |
| Three months ended June 30, 2020 | ||||||||||||||||||||||||
| Total sales | External sales | Adjusted EBIT [ii] | Depreciation and amortization | Equity (income) loss | Fixed asset additions | |||||||||||||||||||
| Body Exteriors & Structures | $ | 1,623 | $ | 1,578 | $ | (315 | ) | $ | 177 | $ | 2 | $ | 85 | |||||||||||
| Power & Vision | 1,298 | 1,271 | (226 | ) | 115 | (28 | ) | 70 | ||||||||||||||||
| Seating Systems | 524 | 521 | (84 | ) | 19 | (1 | ) | 6 | ||||||||||||||||
| Complete Vehicles | 933 | 921 | 44 | 20 | — | 6 | ||||||||||||||||||
| Corporate & Other [i] | (85 | ) | 2 | (19 | ) | 3 | 2 | 2 | ||||||||||||||||
| Total Reportable Segments | $ | 4,293 | $ | 4,293 | $ | (600 | ) | $ | 334 | $ | (25 | ) | $ | 169 | ||||||||||
| Three months ended June 30, 2019 | ||||||||||||||||||||||||
| Total sales | External sales | Adjusted EBIT [ii] | Depreciation and amortization | Equity (income) loss | Fixed asset additions | |||||||||||||||||||
| Body Exteriors & Structures | $ | 4,243 | $ | 4,145 | $ | 341 | $ | 177 | $ | (1 | ) | $ | 165 | |||||||||||
| Power & Vision | 2,808 | 2,745 | 201 | 116 | (48 | ) | 123 | |||||||||||||||||
| Seating Systems | 1,452 | 1,442 | 83 | 15 | 3 | 14 | ||||||||||||||||||
| Complete Vehicles | 1,802 | 1,793 | 43 | 21 | — | 23 | ||||||||||||||||||
| Corporate & Other [i] | (179 | ) | 1 | 9 | 5 | (2 | ) | 3 | ||||||||||||||||
| Total Reportable Segments | $ | 10,126 | $ | 10,126 | $ | 677 | $ | 334 | $ | (48 | ) | $ | 328 | |||||||||||
| Six months ended June 30, 2020 | ||||||||||||||||||||||||
| Total sales | External sales | Adjusted EBIT [ii] | Depreciation and amortization | Equity (income) loss | Fixed asset additions | |||||||||||||||||||
| Body Exteriors & Structures | $ | 5,299 | $ | 5,188 | $ | (116 | ) | $ | 356 | $ | 2 | $ | 187 | |||||||||||
| Power & Vision | 3,821 | 3,751 | (91 | ) | 230 | (62 | ) | 150 | ||||||||||||||||
| Seating Systems | 1,785 | 1,777 | (44 | ) | 36 | 2 | 21 | |||||||||||||||||
| Complete Vehicles | 2,254 | 2,232 | 94 | 40 | — | 10 | ||||||||||||||||||
| Corporate & Other [i] | (209 | ) | 2 | (40 | ) | 8 | 3 | 4 | ||||||||||||||||
| Total Reportable Segments | $ | 12,950 | $ | 12,950 | $ | (197 | ) | $ | 670 | $ | (55 | ) | $ | 372 | ||||||||||
| Six months ended June 30, 2019 | ||||||||||||||||||||||||
| Total sales | External sales | Adjusted EBIT [ii] | Depreciation and amortization | Equity (income) loss | Fixed asset additions | |||||||||||||||||||
| Body Exteriors & Structures | $ | 8,551 | $ | 8,355 | $ | 704 | $ | 352 | $ | (2 | ) | $ | 276 | |||||||||||
| Power & Vision | 5,891 | 5,780 | 417 | 223 | (82 | ) | 238 | |||||||||||||||||
| Seating Systems | 2,885 | 2,869 | 177 | 30 | 2 | 23 | ||||||||||||||||||
| Complete Vehicles | 3,730 | 3,711 | 71 | 40 | — | 41 | ||||||||||||||||||
| Corporate & Other [i] | (340 | ) | 2 | 28 | 10 | (1 | ) | 1 | ||||||||||||||||
| Total Reportable Segments | $ | 20,717 | $ | 20,717 | $ | 1,397 | $ | 655 | $ | (83 | ) | $ | 579 | |||||||||||
| [i] | Included in Corporate and Other Adjusted EBIT are intercompany fees charged to the automotive segments. |
| Magna International Inc. Second Quarter Report 2020 49 |
| MAGNA INTERNATIONAL INC. | |
| NOTES TO INTERIM CONSOLIDATED FINANCIAL STATEMENTS | |
| [Unaudited] | |
| [All amounts in U.S. dollars and all tabular amounts in millions unless otherwise noted] |
| 16. | Segmented Information (CONTINUED) |
| [ii] | The following table reconciles Net income to Adjusted EBIT: |
| Three months ended | Six months ended | |||||||||||||||
| June 30, | June 30, | |||||||||||||||
| 2020 | 2019 | 2020 | 2019 | |||||||||||||
| Net (loss) income | $ | (652 | ) | $ | 450 | $ | (400 | ) | $ | 1,551 | ||||||
| Add: | ||||||||||||||||
| Interest expense, net | 21 | 14 | 38 | 45 | ||||||||||||
| Other expense (income), net | 168 | 68 | 168 | (611 | ) | |||||||||||
| Income taxes | (137 | ) | 145 | (3 | ) | 412 | ||||||||||
| Adjusted EBIT | $ | (600 | ) | $ | 677 | $ | (197 | ) | $ | 1,397 | ||||||
[b] The following table shows Goodwill for the Company's reporting segments:
| June 30, | December 31, | |||||||
| 2020 | 2019 | |||||||
| Body Exteriors & Structures | $ | 457 | $ | 458 | ||||
| Power & Vision | 1,230 | 1,238 | ||||||
| Seating Systems | 167 | 169 | ||||||
| Complete Vehicles | 111 | 111 | ||||||
| Total Reportable Segments | $ | 1,965 | $ | 1,976 | ||||
| [c] | The following table shows Net Assets for the Company's reporting segments: |
| June 30, | December 31, | |||||||
| 2020 | 2019 | |||||||
| Body Exteriors & Structures | $ | 7,899 | $ | 7,906 | ||||
| Power & Vision | 5,871 | 5,626 | ||||||
| Seating Systems | 1,235 | 1,219 | ||||||
| Complete Vehicles | 845 | 735 | ||||||
| Corporate & Other | 395 | 468 | ||||||
| Total Reportable Segments | $ | 16,245 | $ | 15,954 | ||||
The following table reconciles Total Assets to Net Assets:
| June 30, | December 31, | |||||||
| 2020 | 2019 | |||||||
| Total Assets | $ | 24,280 | $ | 25,790 | ||||
| Deduct assets not included in segment net assets: | ||||||||
| Cash and cash equivalents | (533 | ) | (1,276 | ) | ||||
| Deferred tax assets | (353 | ) | (308 | ) | ||||
| Long-term receivables from joint venture partners | (70 | ) | (71 | ) | ||||
| Income taxes receivable | (87 | ) | — | |||||
| Deduct liabilities included in segment net assets: | ||||||||
| Accounts payable | (4,243 | ) | (5,628 | ) | ||||
| Accrued salaries and wages | (691 | ) | (753 | ) | ||||
| Other accrued liabilities | (2,058 | ) | (1,800 | ) | ||||
| Segment Net Assets | $ | 16,245 | $ | 15,954 | ||||
| 50 Magna International Inc. Second Quarter Report 2020 |
CORPORATE OFFICE
| Magna International Inc. | ||
| 337 Magna Drive | ||
| Aurora, Ontario | ||
| Canada L4G 7K1 | ||
| Telephone: | (905) 726-2462 | |
| www.magna.com | ||
TRANSFER AGENT AND REGISTRAR
| Canada – Common Shares | ||
| Computershare Trust Company of Canada | ||
| 100 University Avenue, 8th Floor | ||
| Toronto, Ontario, Canada M5J 2Y1 | ||
| Telephone: | 1 (800) 564-6253 | |
| United States – Common Shares | ||
| Computershare Trust Company N.A. | ||
| 462 S. 4th Street | ||
| Louisville, Kentucky, USA 40202 | ||
| Telephone: | 1 (800) 962-4284 | |
| From all other countries | ||
| Telephone: | 1 (514) 982-7555 | |
| www.computershare.com | ||
EXCHANGE LISTINGS
| Common Shares | |
| Toronto Stock Exchange | MG |
| The New York Stock Exchange | MGA |
Shareholders wishing to communicate with the non-management members of the Magna Board of Directors may do so by contacting the Chairman of Board through the office of Magna’s Corporate Secretary at 337 Magna Drive, Aurora, Ontario, Canada L4G 7K1 (905) 726-7070.
Annual Report
Copies of the Annual Report may be obtained from: The Corporate Secretary, Magna International Inc., 337 Magna Drive, Aurora, Ontario, Canada L4G 7K1 or www.magna.com. Copies of financial data and other publicly filed documents are available through the internet on the Canadian Securities Administrators’ System for Electronic Document Analysis and Retrieval (SEDAR) which can be accessed at www.sedar.com, and on the United States Securities and Exchange Commission's Electronic Data Gathering, Analysis and Retrieval System (EDGAR) which can be accessed at www.sec.gov.