Exhibit 99

1 Q3 2020 Results Call November 6, 2020
Forward Looking Statements 2 Certain statements in this document constitute "forward - looking information" or "forward - looking statements" (collectively, "for ward - looking statements"). Any such forward - looking statements are intended to provide information about management's current expectations and plans and may not be appropriate for other purposes. Forward - looking statements may include financial and other projections, as well as statements regarding our future plans, strategic objectives or economic performance, or the assumptions underlying any of the foregoing, and other statements that are not recitations of historical fact. We use words s uch as "may", "would", "could", "should", "will", "likely", "expect", "anticipate", "believe", "intend", "plan", "aim", "forecast ", "outlook", "project", "estimate", "target" and similar expressions suggesting future outcomes or events to identify forward - looking stateme nts. Forward - looking statements in this document include, but are not limited to, statements relating to: the expected impact o f our cost structure reductions and discretionary spending adjustments on our financial results; the benefits of our Honglizhixin acquisition and our cooperation with Fisker ; actions to optimize our joint venture transmission business; the timing and success of product and/or program launches; expected Adjusted Debt/Adjusted EBITDA range; free cash flow expectations; forecasts of light vehicl e p roduction in North America ,Europe and globally;; expected Total sales, based on such light vehicle production, including spl it by reporting segment; Adjusted EBIT margin; Equity Income; Net interest expense; Tax rate; Net Income; and Capital spending. Forward - looking statements are based on information currently available to us and are based on assumptions and analyses made by us in light of our experience and our perception of historical trends, current conditions and expected future developments, a s well as other factors we believe are appropriate in the circumstances. While we believe we have a reasonable basis for making an y such forward - looking statements, they are not a guarantee of future performance or outcomes. Whether actual results and developments conform to our expectations and predictions is subject to a number of risks, assumptions and uncertainties, many of which are beyond our control, and the effects of which can be difficult to predict, including, without limitation: Risks Related to the Automotive Industry • economic cyclicality; • regional production volume declines, including as a result of the COVID - 19 (Coronavirus) pandemic; • intense competition; • potential restrictions on free trade; • trade disputes/tariffs; Customer and Supplier Related Risks • concentration of sales with six customers; • OEM consolidation and cooperation; • shifts in market shares among vehicles or vehicle segments; • shifts in consumer "take rates" for products we sell; • quarterly sales fluctuations; • potential loss of any material purchase orders; • a deterioration in the financial condition of our supply base, including as a result of the COVID - 19 (Coronavirus) pandemic; • increased financial pressure, including as a result of COVID - 19 caused OEM bankruptcies; Manufacturing Operational Risks • product and new facility launch risks; • operational underperformance; • restructuring costs; • impairment charges; • labour disruptions; • labour shortage in our facilities, or those of our customers and suppliers, as a result of the COVID - 19 (Coronavirus) pandemic; • COVID - 19 (Coronavirus) shutdowns; • supply disruptions and applicable costs related to supply disruption mitigation initiatives, including as a result of the COVID - 19 (Coronavirus) pandemic; • climate change risks; • attraction/retention of skilled labour ; IT Security/Cybersecurity Risks • IT/Cybersecurity breach; • Product Cybersecurity breach; Pricing Risks • pricing risks between time of quote and start of production; • price concessions, including as a result of the COVID - 19 (Coronavirus) pandemic; • commodity costs; • declines in scrap steel prices; Warranty / Recall Risks • costs related to repair or replacement of defective products, including due to a recall; • warranty or recall costs that exceed warranty provision or insurance coverage limits; • product liability claims; Acquisition Risks • inherent merger and acquisition risks; • acquisition integration risk; Other Business Risks • risks related to conducting business through joint ventures; • our ability to consistently develop and commercialize innovative products or processes; • our changing business risk profile as a result of increased investment in electrification and autonomous driving, including: higher R&D and engineering costs, and challenges in quoting for profitable returns on products for which we may not have significant quoting experience; • risks of conducting business in foreign markets; • fluctuations in relative currency values; • tax risks; • reduced financial flexibility as a result of an economic shock; • changes in credit ratings assigned to us; Legal, Regulatory and Other Risks • antitrust risk; • legal claims and/or regulatory actions against us; and • changes in laws and regulations, including those related to vehicle emissions or made as a result of the COVID - 19 (Coronavirus) pandemic. In evaluating forward - looking statements or forward - looking information, we caution readers not to place undue reliance on any forward - looking statement, and readers should specifically consider the various factors which could cause actual events or results to differ materially from those indicated by such forward - looking statements, including the risks, assumptions and uncertainties above which are discussed in greater detail in this document under the section titled "Industry Trends and Risks" and set out in our Annual Information Form filed with securities commissions in Canada and our annual report on Form 40 - F filed with the United States Securities and Exchange Commission, and subsequent filings .
Reminders • All amounts are in U.S. Dollars (unless otherwise noted) • Today’s discussion excludes the impact of other expense, net (Unusual Items) • “Organic”, in the context of sales movements, means “excluding the impact of foreign exchange, acquisitions and divestitures” • Magna will provide 2021 Outlook with Q4, 2020 results in February 2021 3
Q3 2020 Highlights • Appointment of Swamy Kotagiri as CEO effective January 1, 2021 • Strong Q3 performance • Non - cash impairment charge • Agreement to acquire Honglizhixin (“ Hongli ”) • Start of production in China in our vehicle manufacturing JV • Cooperation with Fisker • Program award for camera monitoring system 4

Strong Q3 2020 Performance 5 Reflects Actions to Reduce Discretionary and Structural Costs SALES - 2 % Global Vehicle Production - 4% ADJUSTED EPS $ 1.95 +38% FREE CASH FLOW $ 1.3B vs $385M

Getrag Update Joint Ventures • Past few years we have highlighted challenges • Business planning activity has led to lower volume and free cash flow projections for Getrag Jiangling Transmission (GJT) joint - venture – Result: recorded $200 million impairment charge after taxes and minority interest 6
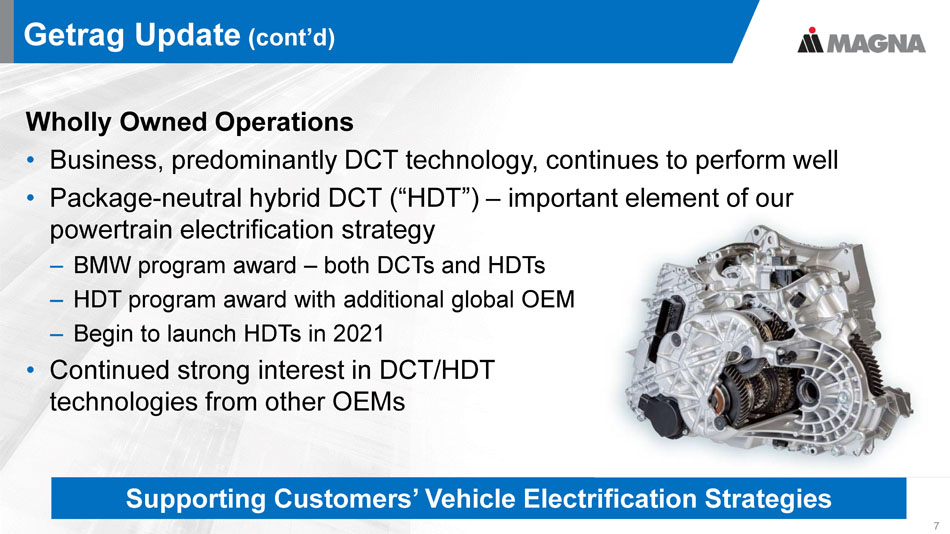
Getrag Update (cont’d) Wholly Owned Operations • Business, predominantly DCT technology, continues to perform well • Package - neutral hybrid DCT (“HDT”) – important element of our powertrain electrification strategy – BMW program award – both DCTs and HDTs – HDT program award with additional global OEM – Begin to launch HDTs in 2021 • Continued strong interest in DCT/HDT technologies from other OEMs 7 Supporting Customers’ Vehicle Electrification Strategies
Honglizhixin (“ Hongli ”) Seating 8 • Agreement signed to acquire 65% and control of Hongli , a leading seat supplier to Chinese automakers • Expands Magna’s capabilities in China • Strengthens competitiveness through additional manufacturing sites, full engineering and testing, increased vertical integration • Transaction expected to close in early 2021
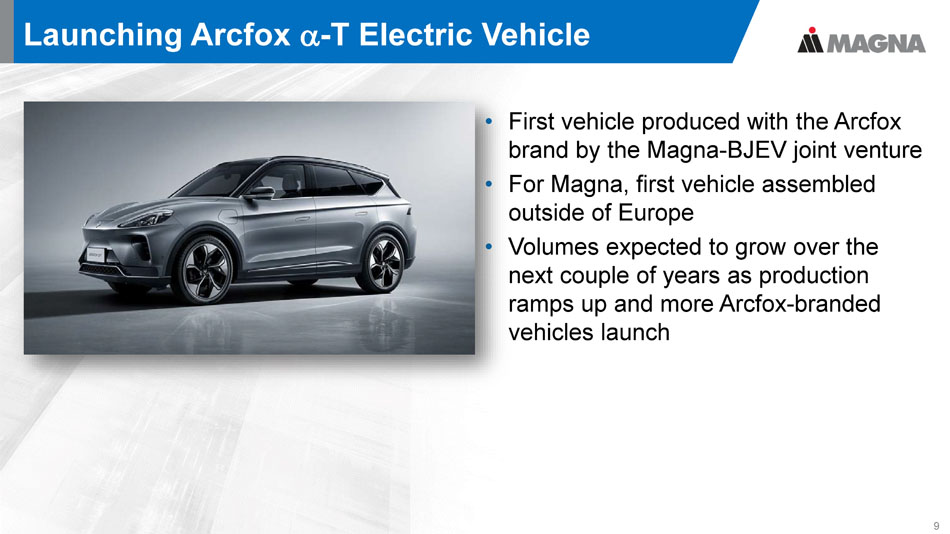
Launching Arcfox - T Electric Vehicle 9 • First vehicle produced with the Arcfox brand by the Magna - BJEV joint venture • For Magna, first vehicle assembled outside of Europe • Volumes expected to grow over the next couple of years as production ramps up and more Arcfox - branded vehicles launch
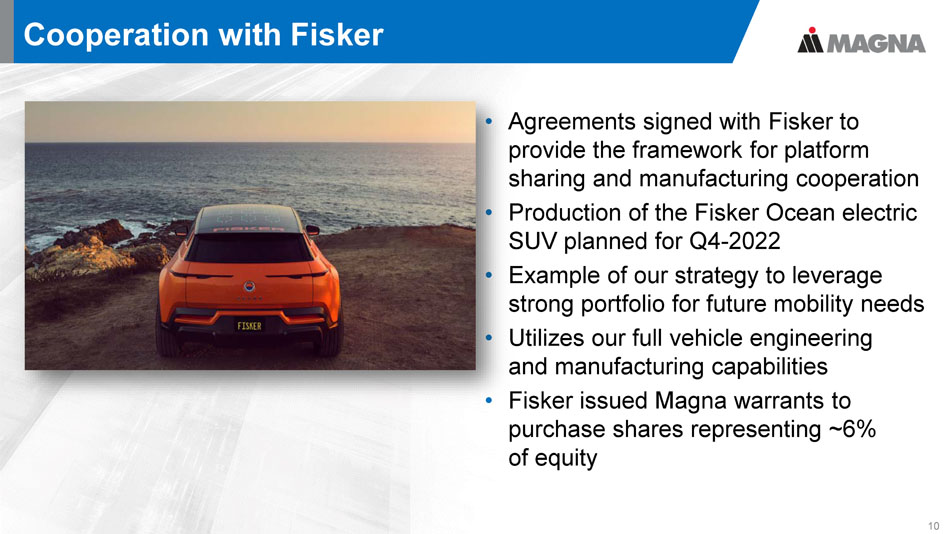
Cooperation with Fisker 10 • Agreements signed with Fisker to provide the framework for platform sharing and manufacturing cooperation • Production of the Fisker Ocean electric SUV planned for Q4 - 2022 • Example of our strategy to leverage strong portfolio for future mobility needs • Utilizes our full vehicle engineering and manufacturing capabilities • Fisker issued Magna warrants to purchase shares representing ~6% of equity
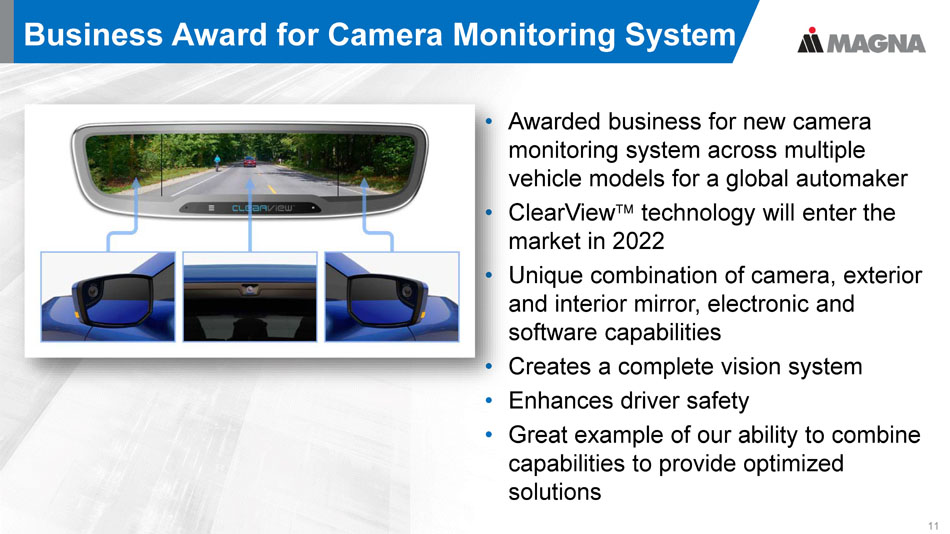
Business Award for Camera Monitoring System 11 • Awarded business for new camera monitoring system across multiple vehicle models for a global automaker • ClearView technology will enter the market in 2022 • Unique combination of camera, exterior and interior mirror, electronic and software capabilities • Creates a complete vision system • Enhances driver safety • Great example of our ability to combine capabilities to provide optimized solutions
Magna CEO Transition 12 • Don Walker announced his retirement effective end of 2020 after 33 years of impeccable service, growing Magna to be the third largest global automotive supplier, one of Fortune’s Worlds Most Admired Companies, and a perennial winner of customer, industry and technology awards • Swamy Kotagiri appointed by the Board as Magna’s new CEO effective January 2021 • With 21 years of Magna service, sound judgement and strategic thinking, Swamy is the right leader to take Magna forward
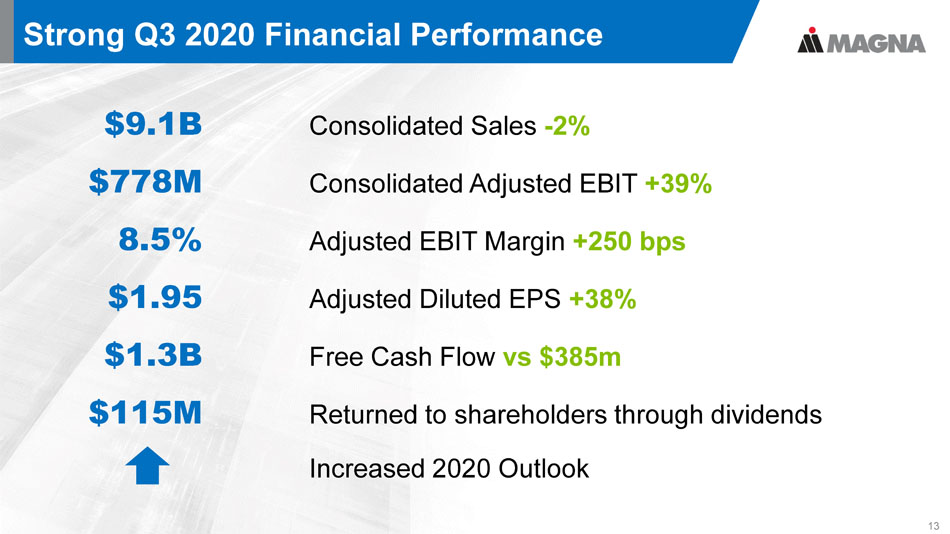
Strong Q3 2020 Financial Performance $9.1B Consolidated Sales - 2% $778M Consolidated Adjusted EBIT +39% 8.5% Adjusted EBIT Margin +250 bps $1.95 Adjusted Diluted EPS +38% $1.3B Free Cash Flow vs $385m $115M Returned to shareholders through dividends Increased 2020 Outlook 13

Q3 2020 Consolidated Sales 14 Key Factors: • Assembly volumes ( - ) • European light vehicle production ( - ) • End of production of certain programs ( - ) • Launch of new programs (+) • Labour strike at GM in Q3 2019 (+) • Foreign currency translation (+) Q3 2019 Q3 2020 $9.3B $9.1B - 2 %
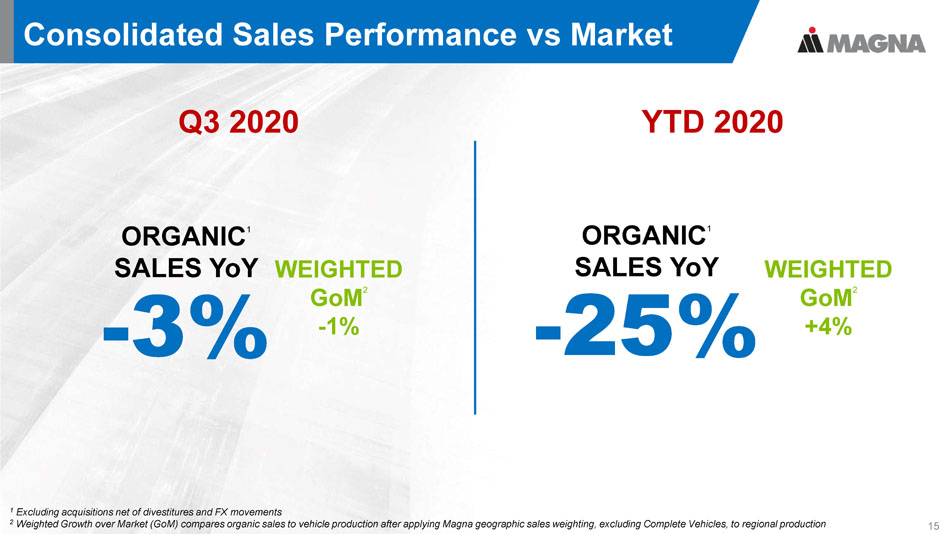
Consolidated Sales Performance vs Market 15 ORGANIC 1 SALES YoY - 25% WEIGHTED GoM 2 +4% WEIGHTED GoM 2 - 1% ORGANIC 1 SALES YoY - 3% Q3 2020 YTD 2020 1 Excluding acquisitions net of divestitures and FX movements 2 Weighted Growth over Market ( GoM ) compares organic sales to vehicle production after applying Magna geographic sales weighting, excluding Complete Vehicles, to regional production
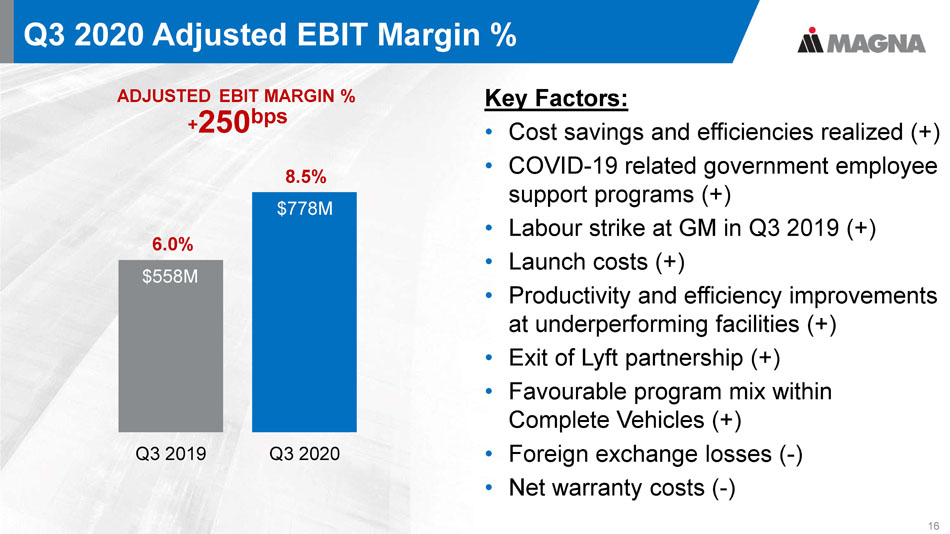
Q3 2020 Adjusted EBIT Margin % 16 Q3 2019 Q3 2020 $558M $778M + 250 bps ADJUSTED EBIT MARGIN % Key Factors: • Cost savings and efficiencies realized (+) • COVID - 19 related government employee support programs (+) • Labour strike at GM in Q3 2019 (+) • Launch costs (+) • Productivity and efficiency improvements at underperforming facilities (+) • Exit of Lyft partnership (+) • Favourable program mix within Complete Vehicles (+) • Foreign exchange losses ( - ) • Net warranty costs ( - ) 6.0% 8.5%
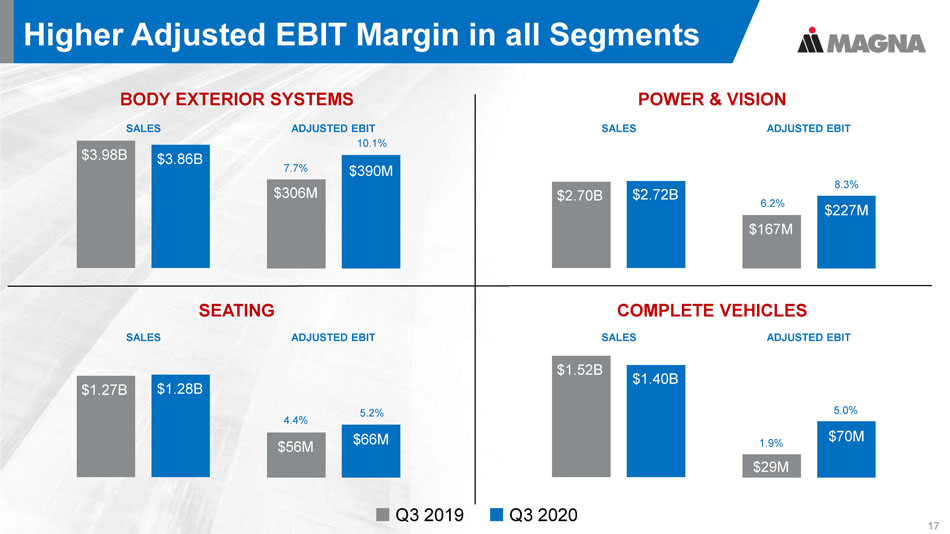
Higher Adjusted EBIT Margin in all Segments 17 Q3 2019 Q3 2020 BODY EXTERIOR SYSTEMS $3.98B $3.86B SALES ADJUSTED EBIT $306M $390M 7.7% 10.1% SEATING $1.27B $1.28B SALES ADJUSTED EBIT $56M $66M 4.4% 5.2% POWER & VISION $2.70B $2.72B SALES ADJUSTED EBIT $167M $227M 6.2% 8.3% COMPLETE VEHICLES $1.52B $1.40B SALES ADJUSTED EBIT $29M $70M 1.9% 5.0%
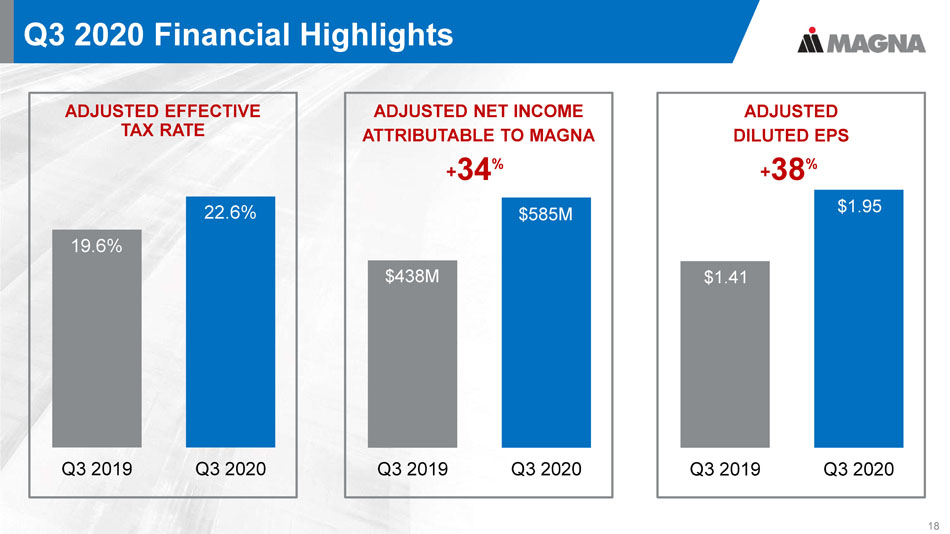
Q3 2020 Financial Highlights 18 Q3 2019 Q3 2020 ADJUSTED DILUTED EPS $1.41 $1.95 Q3 2019 Q3 2020 ADJUSTED EFFECTIVE TAX RATE 19.6% 22.6% Q3 2019 Q3 2020 ADJUSTED NET INCOME ATTRIBUTABLE TO MAGNA $438M $585M + 34 % + 38 %
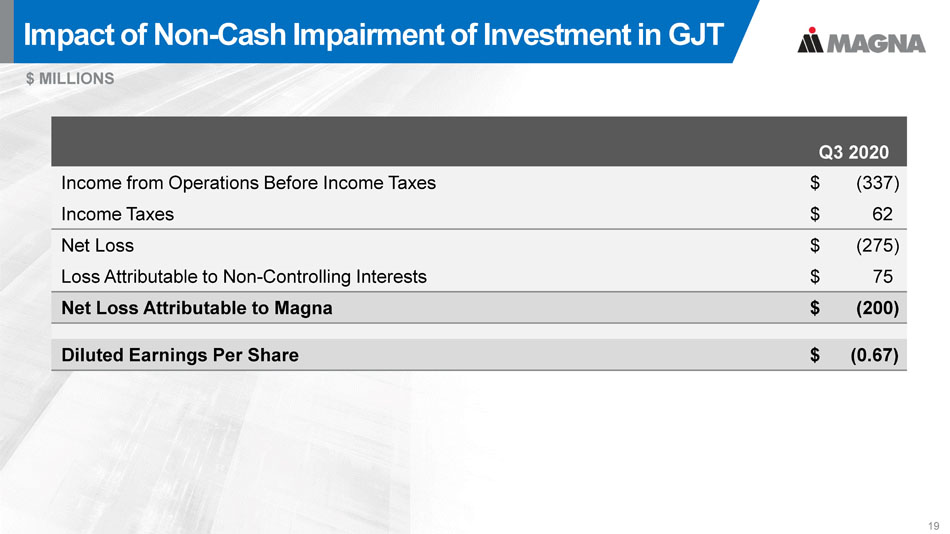
Impact of Non - Cash Impairment of Investment in GJT 19 $ MILLIONS Q3 2020 Income from Operations Before Income Taxes $ (337) Income Taxes $ 62 Net Loss $ (275) Loss Attributable to Non - Controlling Interests $ 75 Net Loss Attributable to Magna $ (200) Diluted Earnings Per Share $ (0.67)

Q3 2020 Cash Flow 20 $ MILLIONS Cash from Operations Net Income + Non - Cash Items $ 1,094 Changes in Non - Cash Operating Assets & Liabilities $ 518 $ 1,612 Investment Activities Fixed Assets $ (213) Investments, Other Assets & Intangibles $ (68) $ (281) Proceeds from Disposition and Other $ 14 Free Cash Flow $ 1,345 Private Equity Investments $ (12) Dividends Paid $ (115)
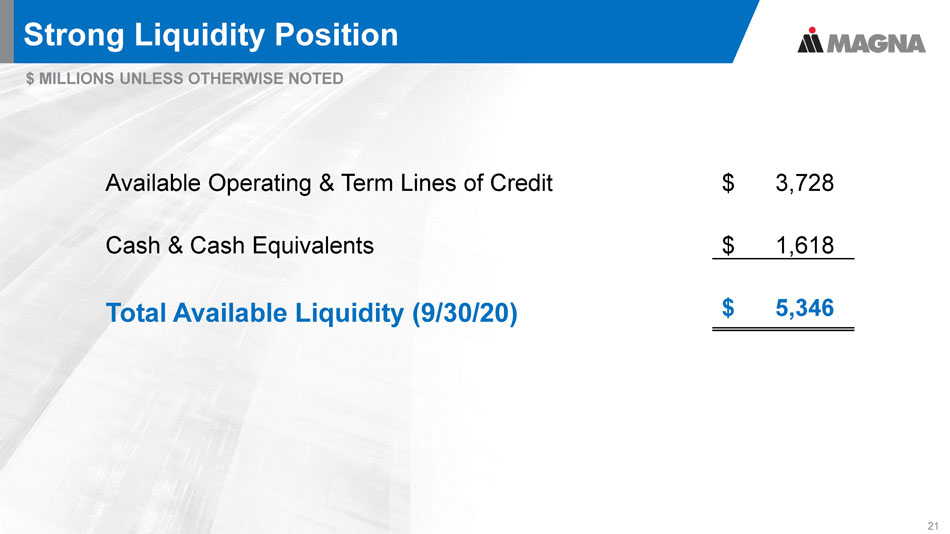
Strong Liquidity Position 21 $ MILLIONS UNLESS OTHERWISE NOTED Available Operating & Term Lines of Credit $ 3,728 Cash & Cash Equivalents $ 1,618 Total Available Liquidity (9/30/20) $ 5,346
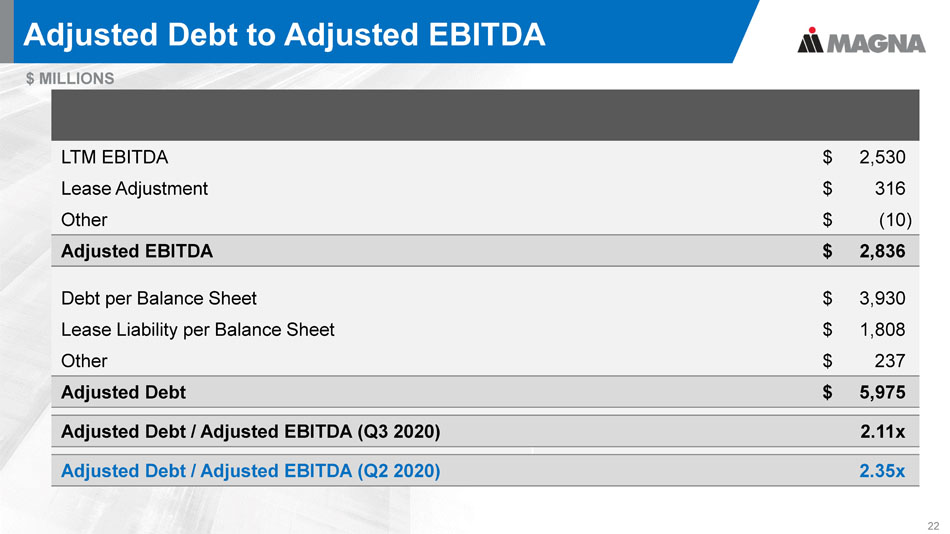
Adjusted Debt to Adjusted EBITDA 22 $ MILLIONS LTM EBITDA $ 2,530 Lease Adjustment $ 316 Other $ (10) Adjusted EBITDA $ 2,836 Debt per Balance Sheet $ 3,930 Lease Liability per Balance Sheet $ 1,808 Other $ 237 Adjusted Debt $ 5,975 Adjusted Debt / Adjusted EBITDA (Q3 2020) 2.11x Adjusted Debt / Adjusted EBITDA (Q2 2020) 2.35x
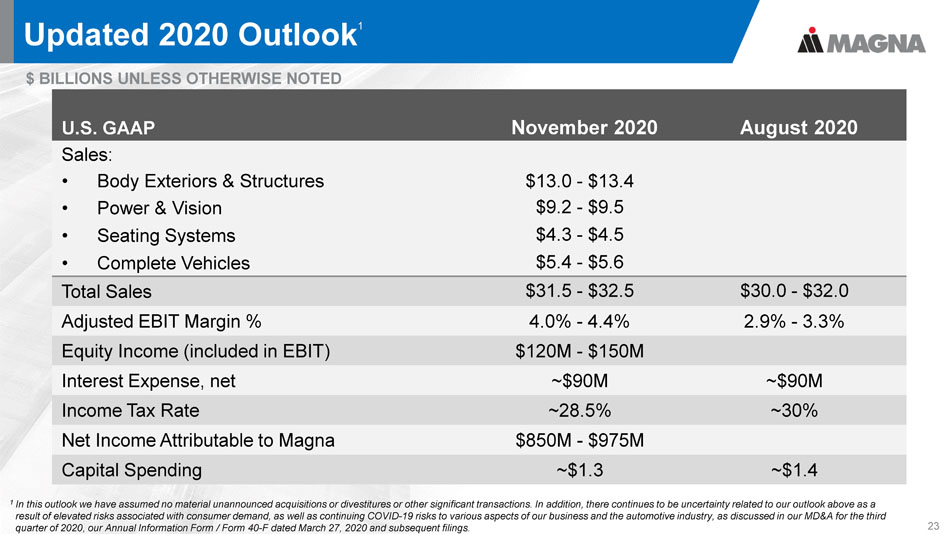
Updated 2020 Outlook 1 23 $ BILLIONS UNLESS OTHERWISE NOTED U.S. GAAP November 2020 August 2020 Sales: • Body Exteriors & Structures $13.0 - $13.4 • Power & Vision $9.2 - $9.5 • Seating Systems $4.3 - $4.5 • Complete Vehicles $5.4 - $5.6 Total Sales $31.5 - $32.5 $30.0 - $32.0 Adjusted EBIT Margin % 4.0% - 4.4% 2.9% - 3.3% Equity Income (included in EBIT) $120M - $150M Interest Expense, net ~$90M ~$90M Income Tax Rate ~28.5% ~30% Net Income Attributable to Magna $850M - $975M Capital Spending ~$1.3 ~$1.4 1 In this outlook we have assumed no material unannounced acquisitions or divestitures or other significant transactions. In ad dit ion, there continues to be uncertainty related to our outlook above as a result of elevated risks associated with consumer demand, as well as continuing COVID - 19 risks to various aspects of our busines s and the automotive industry, as discussed in our MD&A for the third quarter of 2020, our Annual Information Form / Form 40 - F dated March 27, 2020 and subsequent filings.
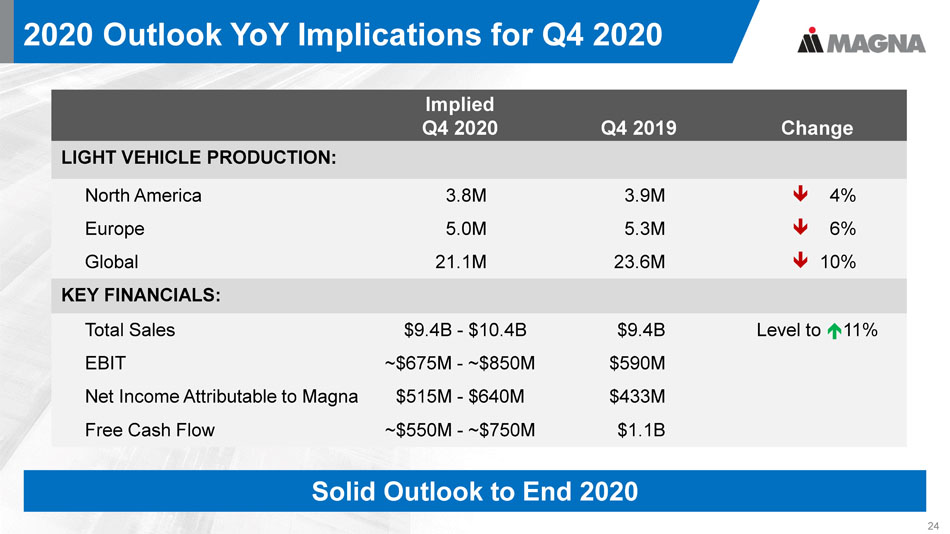
2020 Outlook YoY Implications for Q4 2020 24 Implied Q4 2020 Q4 2019 Change LIGHT VEHICLE PRODUCTION: North America 3.8M 3.9M 4 % Europe 5.0M 5.3M 6 % Global 21.1M 23.6M 10 % KEY FINANCIALS: Total Sales $9.4B - $10.4B $9.4B Level to 11% EBIT ~$675M - ~$850M $590M Net Income Attributable to Magna $515M - $640M $433M Free Cash Flow ~$550M - ~$750M $1.1B Solid Outlook to End 2020
Q3 2020 RESULTS APPENDIX 25
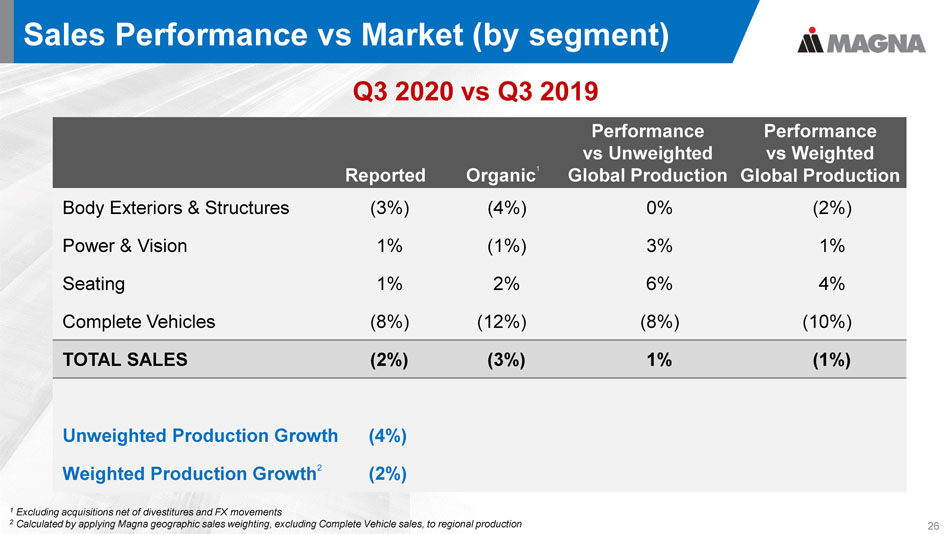
Sales Performance vs Market (by segment) 26 Reported Organic 1 Performance vs Unweighted Global Production Performance vs Weighted Global Production Body Exteriors & Structures (3%) (4%) 0% (2%) Power & Vision 1% (1%) 3% 1% Seating 1% 2% 6% 4% Complete Vehicles (8%) (12%) (8%) (10%) TOTAL SALES (2%) (3%) 1% (1%) Unweighted Production Growth (4%) Weighted Production Growth 2 (2%) 1 Excluding acquisitions net of divestitures and FX movements 2 Calculated by applying Magna geographic sales weighting, excluding Complete Vehicle sales, to regional production Q3 2020 vs Q3 2019

Sales Performance vs Market (by segment) 27 Reported Organic 1 Performance vs Unweighted Global Production Performance vs Weighted Global Production Body Exteriors & Structures (27%) (26%) (1%) 3% Power & Vision (24%) (19%) 6% 10% Seating (26%) (26%) (1%) 3% Complete Vehicles (30%) (30%) (5%) (1%) TOTAL SALES (26%) (25%) 0% 4% Unweighted Production Growth (25%) Weighted Production Growth 2 (29%) 1 Excluding acquisitions net of divestitures and FX movements 2 Calculated by applying Magna geographic sales weighting, excluding Complete Vehicle sales, to regional production YTD 2020 vs YTD 2019
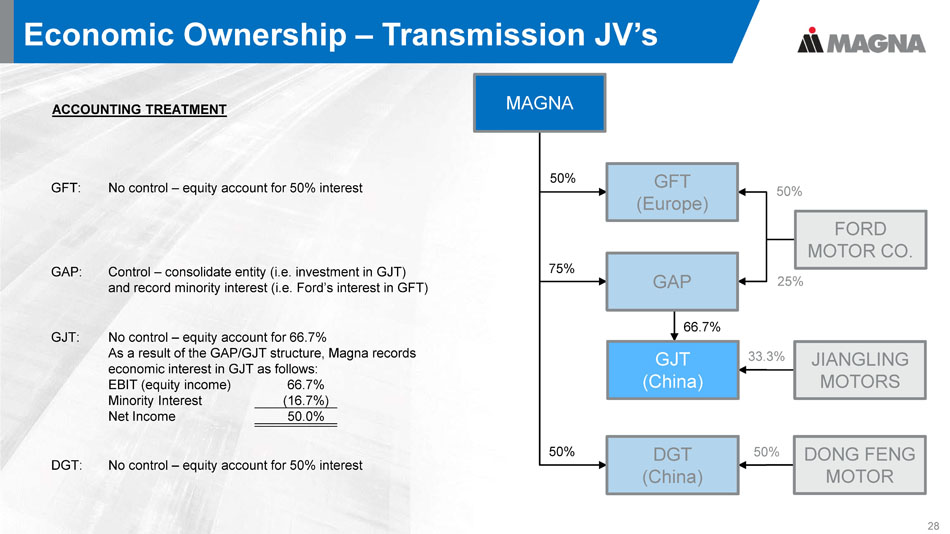
Economic Ownership – Transmission JV’s 28 GFT: No control – equity account for 50% interest DGT: No control – equity account for 50% interest GAP: Control – consolidate entity (i.e. investment in GJT) and record minority interest (i.e. Ford’s interest in GFT) GJT: No control – equity account for 66.7% As a result of the GAP/GJT structure, Magna records economic interest in GJT as follows: EBIT (equity income) 66.7% Minority Interest (16.7%) Net Income 50.0% ACCOUNTING TREATMENT MAGNA DGT (China) JIANGLING MOTORS 50% 75% 50% 25% 50% 66.7% 33.3% 50% GAP GFT (Europe) FORD MOTOR CO. DONG FENG MOTOR GJT (China)
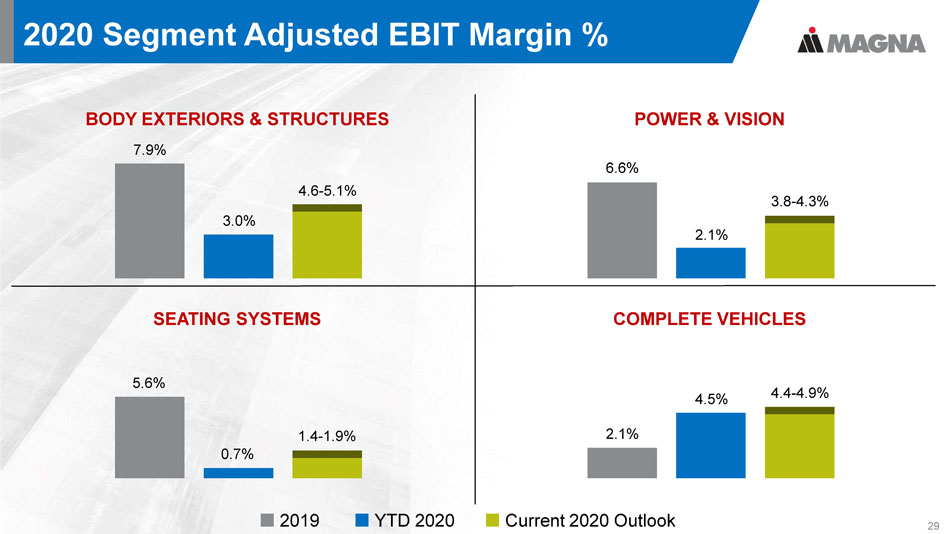
2020 Segment Adjusted EBIT Margin % 29 2019 YTD 2020 Current 2020 Outlook BODY EXTERIORS & STRUCTURES 7.9% 3.0% 4.6 - 5.1% SEATING SYSTEMS 5.6% 0.7% 1.4 - 1.9% POWER & VISION 6.6% 2.1% 3.8 - 4.3% COMPLETE VEHICLES 2.1% 4.5% 4.4 - 4.9%
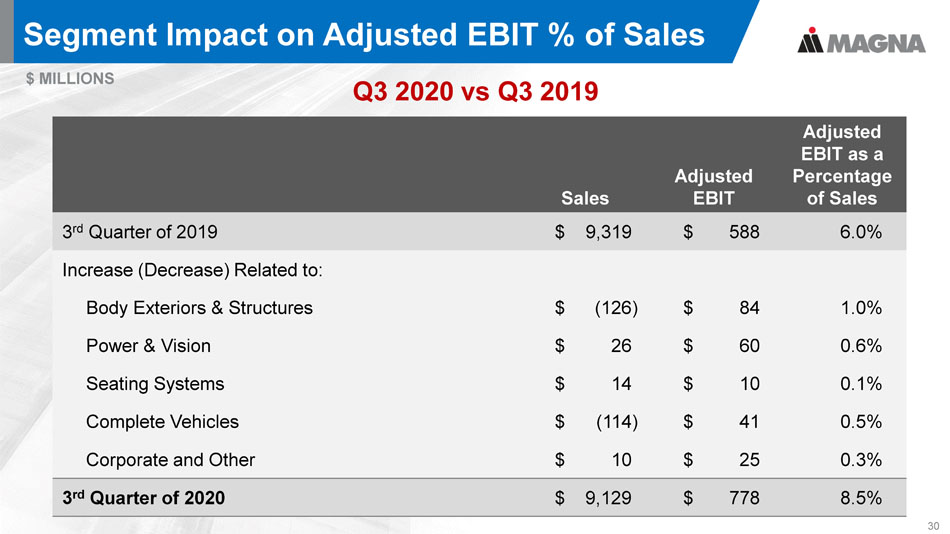
Segment Impact on Adjusted EBIT % of Sales 30 $ MILLIONS Sales Adjusted EBIT Adjusted EBIT as a Percentage of Sales 3 rd Quarter of 2019 $ 9,319 $ 588 6.0% Increase (Decrease) Related to: Body Exteriors & Structures $ (126) $ 84 1.0% Power & Vision $ 26 $ 60 0.6% Seating Systems $ 14 $ 10 0.1% Complete Vehicles $ (114) $ 41 0.5% Corporate and Other $ 10 $ 25 0.3% 3 rd Quarter of 2020 $ 9,129 $ 778 8.5% Q3 2020 vs Q3 2019
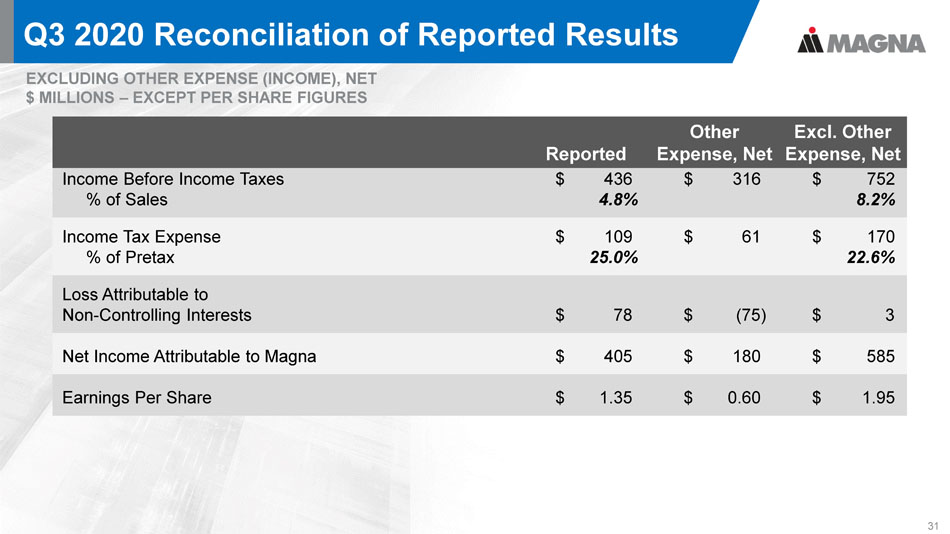
Q3 2020 Reconciliation of Reported Results 31 EXCLUDING OTHER EXPENSE (INCOME), NET $ MILLIONS – EXCEPT PER SHARE FIGURES Reported Other Expense, Net Excl. Other Expense, Net Income Before Income Taxes $ 436 $ 316 $ 752 % of Sales 4.8% 8.2% Income Tax Expense $ 109 $ 61 $ 170 % of Pretax 25.0% 22.6% Loss Attributable to Non - Controlling Interests $ 78 $ (75) $ 3 Net Income Attributable to Magna $ 405 $ 180 $ 585 Earnings Per Share $ 1.35 $ 0.60 $ 1.95

Q3 2019 Reconciliation of Reported Results 32 EXCLUDING OTHER EXPENSE (INCOME), NET $ MILLIONS – EXCEPT PER SHARE FIGURES Reported Other Expense, Net Excl. Other Expense, Net (Loss) Income Before Income Taxes $ (319) $ 859 $ 540 % of Sales (3.4%) 5.8% Income Tax Expense $ 45 $ 61 $ 106 % of Pretax (14.1%) 19.6% Loss Attributable to Non - Controlling Interests $ 131 $ (127) $ 4 (Loss) Net Income Attributable to Magna $ (233) $ 671 $ 438 (Loss) Earnings Per Share $ (0.75) $ 2.16 $ 1.41
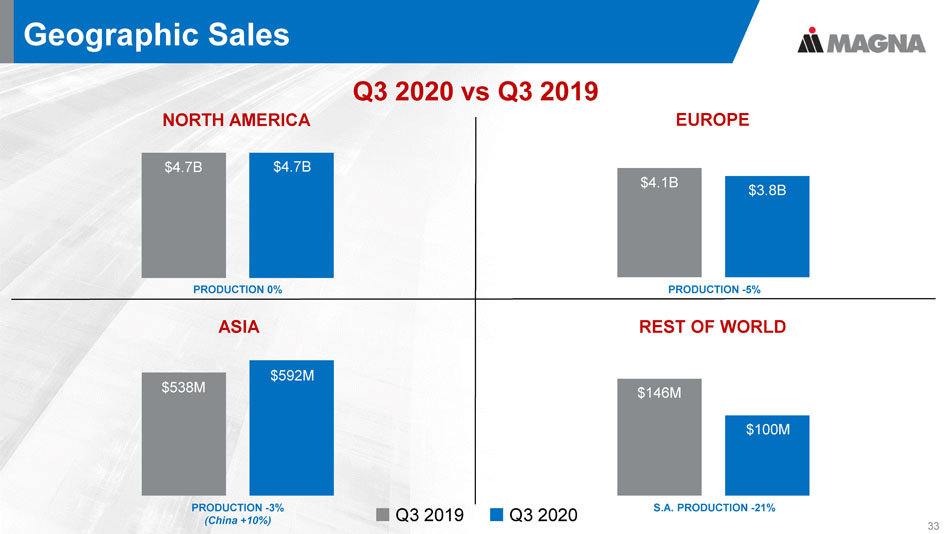
Geographic Sales 33 Q3 2019 Q3 2020 NORTH AMERICA $4.7B $4.7B PRODUCTION 0% EUROPE $4.1B $3.8B PRODUCTION - 5% ASIA $538M $592M PRODUCTION - 3% (China +10%) REST OF WORLD $146M $100M S.A. PRODUCTION - 21% Q3 2020 vs Q3 2019

34