Exhibit 99.2
Q1 2022 Results April 29, 2022
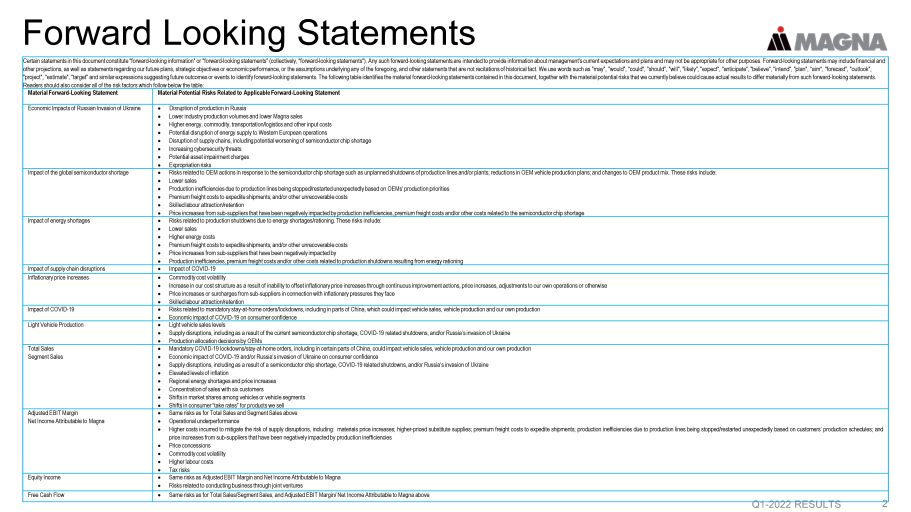
Forward Looking Statements Q1 - 2022 RESULTS 2 Certain statements in this document constitute "forward - looking information" or "forward - looking statements" (collectively, "for ward - looking statements"). Any such forward - looking statements are intended to provide information about management's current ex pectations and plans and may not be appropriate for other purposes. Forward - looking statements may include financial and other projections, as well as statements regarding our future plans, strategic objectives or economic performance, or the ass ump tions underlying any of the foregoing, and other statements that are not recitations of historical fact. We use words such as "m ay", "would", "could", "should", "will", "likely", "expect", "anticipate", "believe", "intend", "plan", "aim", "forecast", "o utl ook", "project", "estimate", "target" and similar expressions suggesting future outcomes or events to identify forward - looking stateme nts. The following table identifies the material forward - looking statements contained in this document, together with the materi al potential risks that we currently believe could cause actual results to differ materially from such forward - looking statement s. Readers should also consider all of the risk factors which follow below the table: Material Forward - Looking Statement Material Potential Risks Related to Applicable Forward - Looking Statement Economic Impacts of Russian Invasion of Ukraine Disruption of production in Russia Lower industry production volumes and lower Magna sales Higher energy, commodity, transportation/logistics and other input costs Potential disruption of energy supply to Western European operations Disruption of supply chains, including potential worsening of semiconductor chip shortage Increasing cybersecurity threats Potential asset impairment charges Expropriation risks Impact of the global semiconductor shortage Risks related to OEM actions in response to the semiconductor chip shortage such as unplanned shutdowns of production lines and/or plants ; reductions in OEM vehicle production plans ; and changes to OEM product mix . These risks include : Lower sales Production inefficiencies due to production lines being stopped/restarted unexpectedly based on OEMs' production priorities Premium freight costs to expedite shipments ; and/or other unrecoverable costs Skilled labour attraction/retention Price increases from sub - suppliers that have been negatively impacted by production inefficiencies, premium freight costs and/or other costs related to the semiconductor chip shortage Impact of energy shortages Risks related to production shutdowns due to energy shortages/rationing . These risks include : Lower sales Higher energy costs Premium freight costs to expedite shipments ; and/or other unrecoverable costs Price increases from sub - suppliers that have been negatively impacted by Production inefficiencies, premium freight costs and/or other costs related to production shutdowns resulting from energy rationing Impact of supply chain disruptions Impact of COVID - 19 Inflationary price increases Commodity cost volatility Increase in our cost structure as a result of inability to offset inflationary price increases through continuous improvement actions, price increases, adjustments to our own operations or otherwise Price increases or surcharges from sub - suppliers in connection with inflationary pressures they face Skilled labour attraction/retention Impact of COVID - 19 Risks related to mandatory stay - at - home orders/lockdowns, including in parts of China, which could impact vehicle sales, vehicle production and our own production Economic impact of COVID - 19 on consumer confidence Light Vehicle Production Light vehicle sales levels Supply disruptions, including as a result of the current semiconductor chip shortage, COVID - 19 related shutdowns, and/or Russia’s invasion of Ukraine Production allocation decisions by OEMs Total Sales Segment Sales Mandatory COVID - 19 lockdowns/stay - at - home orders, including in certain parts of China, could impact vehicle sales, vehicle production and our own production Economic impact of COVID - 19 and/or Russia’s invasion of Ukraine on consumer confidence Supply disruptions, including as a result of a semiconductor chip shortage, COVID - 19 related shutdowns, and/or Russia’s invasion of Ukraine Elevated levels of inflation Regional energy shortages and price increases Concentration of sales with six customers Shifts in market shares among vehicles or vehicle segments Shifts in consumer “take rates” for products we sell Adjusted EBIT Margin Net Income Attributable to Magna Same risks as for Total Sales and Segment Sales above Operational underperformance Higher costs incurred to mitigate the risk of supply disruptions, including : materials price increases ; higher - priced substitute supplies ; premium freight costs to expedite shipments ; production inefficiencies due to production lines being stopped/restarted unexpectedly based on customers’ production schedules ; and price increases from sub - suppliers that have been negatively impacted by production inefficiencies Price concessions Commodity cost volatility Higher labour costs Tax risks Equity Income Same risks as Adjusted EBIT Margin and Net Income Attributable to Magna Risks related to conducting business through joint ventures Free Cash Flow Same risks as for Total Sales/Segment Sales, and Adjusted EBIT Margin/ Net Income Attributable to Magna above

Forward Looking Statements (cont.) Q1 - 2022 RESULTS 3 Forward - looking statements are based on information currently available to us and are based on assumptions and analyses made by us in light of our experience and our perception of historical trends, current conditions and expected future developments, a s w ell as other factors we believe are appropriate in the circumstances. While we believe we have a reasonable basis for making any such forward - looking statements, they are not a guaran tee of future performance or outcomes. In addition to the factors in the table above, whether actual results and developments co nform to our expectations and predictions is subject to a number of risks, assumptions and uncertainties, many of which are beyond our control, and the effects of which can be di ffi cult to predict, including, without limitation: Risks Related to the Automotive Industry economic cyclicality; regional production volume declines; intense competition; potential restrictions on free trade; trade disputes/tariffs; Customer and Supplier Related Risks concentration of sales with six customers; emergence of potentially disruptive Electric Vehicle OEMs, including risks related to limited revenues/operating history of new OEM entrants; OEM consolidation and cooperation; shifts in market shares among vehicles or vehicle segments; shifts in consumer "take rates" for products we sell; dependence on outsourcing; quarterly sales fluctuations; potential loss of any material purchase orders; a deterioration in the financial condition of our supply base; Manufacturing/Operational Risks risks arising from Russia’s invasion of Ukraine and compliance with the sanctions the regime imposed in response; impact of the semiconductor chip shortages on OEM production volumes and on the efficiency of our operations; risks related to COVID - 19; supply disruptions and higher costs to mitigate such disruptions; regional energy shortages and price increases; skilled labour attraction/retention; product and new facility launch risks; operational underperformance; restructuring costs; impairment charges; labour disruptions; climate change risks; leadership succession; IT Security/Cybersecurity Risk IT/Cybersecurity breach; Product Cybersecurity breach; Pricing Risks Inflationary pressures; pricing risks between time of quote and award of new business; price concessions; commodity cost volatility; declines in scrap steel/aluminum prices; Warranty/Recall Risks costs related to repair or replacement of defective products, including due to a recall; warranty or recall costs that exceed warranty provision or insurance coverage limits; product liability claims; Acquisition Risks competition for strategic acquisition targets; inherent merger and acquisition risks; acquisition integration risk; Other Business Risks risks related to conducting business through joint ventures; our ability to consistently develop and commercialize innovative products or processes; intellectual property risks; our changing business risk profile as a result of increased investment in electrification and autonomous/assisted driving, including: higher R&D and engineering costs, and challenges in quoting for profitable returns on products for which we may not have significant quoting experience; risks of conducting business in foreign markets; fluctuations in relative currency values; tax risks; reduced financial flexibility as a result of an economic shock; changes in credit ratings assigned to us; Legal, Regulatory and Other Risks antitrust risk; legal claims and/or regulatory actions against us; and changes in laws and regulations, including those related to vehicle emissions or made as a result of the COVID - 19 pandemic. In evaluating forward - looking statements or forward - looking information, we caution readers not to place undue reliance on any f orward - looking statement. Additionally, readers should specifically consider the various factors which could cause actual events or results to differ materially from those indicated by such forward - looking statements, including the risks, assumptions and uncertainties above which are: discussed under the “Industry Trends and Risks” heading of our Management’s Discussion and Analysis; and set out in our Annual Information Form filed with securities commissions in Canada, our annual report on Form 40 - F filed with th e United States Securities and Exchange Commission, and subsequent filings. Readers should also consider discussion of our risk mitigation activities with respect to certain risk factors, which can be als o found in our Annual Information Form.

4 Reminders All amounts are in U.S. Dollars Today's discussion excludes the impact of other expense (income), net ("Unusual Items") "Organic", in the context of sales movements, means "excluding the impact of foreign exchange, acquisitions and divestitures" Q1 - 2022 RESULTS
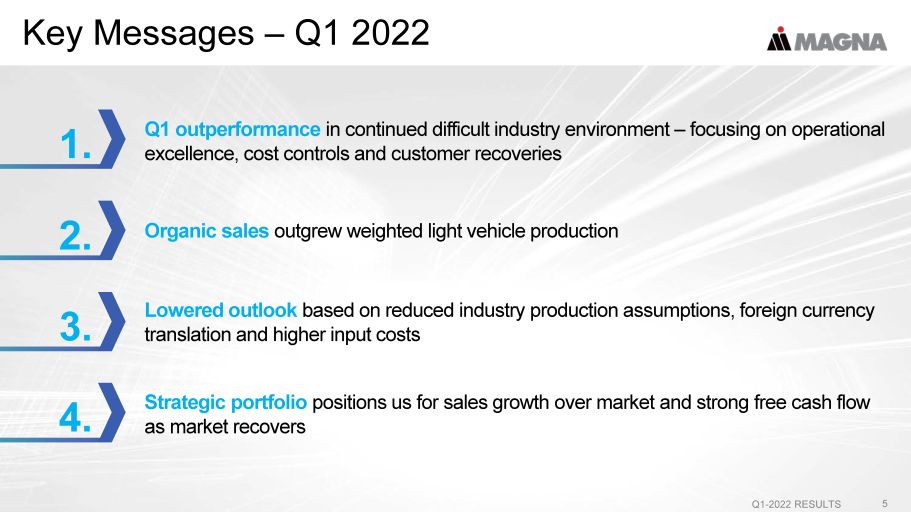
Key Messages – Q1 2022 Q1 - 2022 RESULTS 5 Q1 outperformance in continued difficult industry environment – focusing on operational excellence, cost controls and customer recoveries 1. Organic sales outgrew weighted light vehicle production 2. Lowered outlook based on reduced industry production assumptions, foreign currency translation and higher input costs 3. Strategic portfolio positions us for sales growth over market and strong free cash flow as market recovers 4.
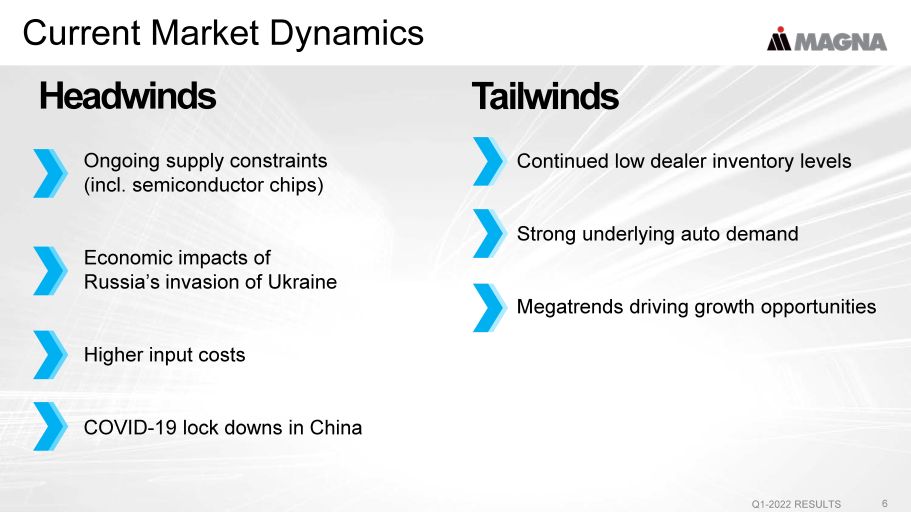
Current Market Dynamics Q1 - 2022 RESULTS 6 Headwinds Ongoing supply constraints (incl. semiconductor chips) Economic impacts of Russia’s invasion of Ukraine Higher input costs COVID - 19 lock downs in China Tailwinds Continued low dealer inventory levels Strong underlying auto demand Megatrends driving growth opportunities
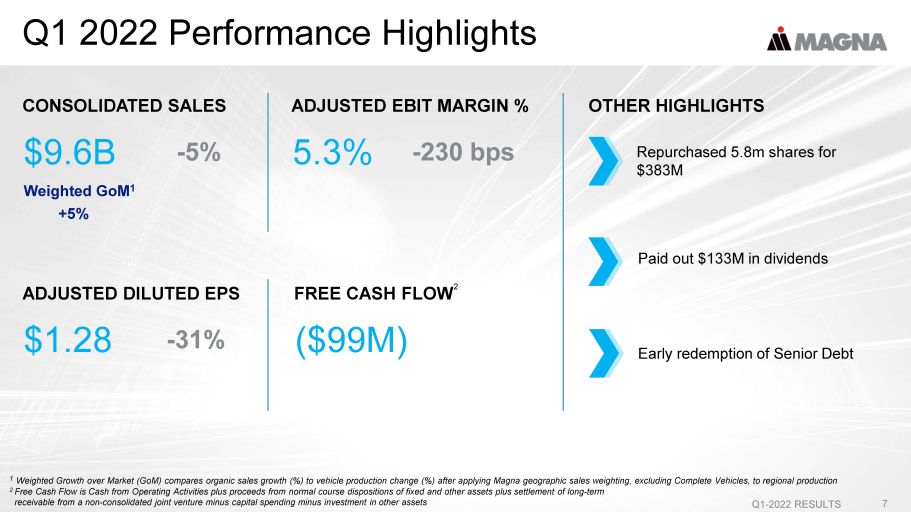
CONSOLIDATED SALES $9.6B Weighted GoM 1 - 5% Q1 2022 Performance Highlights Q1 - 2022 RESULTS 7 ADJUSTED EBIT MARGIN % 5.3% - 230 bps OTHER HIGHLIGHTS Paid out $133M in dividends ADJUSTED DILUTED EPS $1.28 - 31% FREE CASH FLOW 2 ($99M) Repurchased 5.8m shares for $383M 1 Weighted Growth over Market ( GoM ) compares organic sales growth (%) to vehicle production change (%) after applying Magna geographic sales weighting, excludi ng Complete Vehicles, to regional production 2 Free Cash Flow is Cash from Operating Activities plus proceeds from normal course dispositions of fixed and other assets plus se ttlement of long - term receivable from a non - consolidated joint venture minus capital spending minus investment in other assets +5% Early redemption of Senior Debt

Updated 2022 Outlook – Key Factors Q1 - 2022 RESULTS 8 • Lowered global light vehicle production (“GLVP”) assumptions ̶ +3% year over year versus +6% in February outlook ̶ Europe production down 2.1M units ▪ 0.9M Russia – assumes no production for global OEMs ▪ 1.2M in Rest of Europe ̶ North America production down 500K units ̶ China production up 200K units, down 400K Q2 - Q4 • Lower sales expectations due to lower GLVP assumptions and lower euro - US$ • Assumed higher net input costs impacting margin by ~$290M

Customer and Industry Recognition Q1 - 2022 RESULTS 9 Magna wins multiple GM supplier of the year awards for 2021 Multiple Magna innovations identified as finalists for the 2022 Automotive News PACE Awards
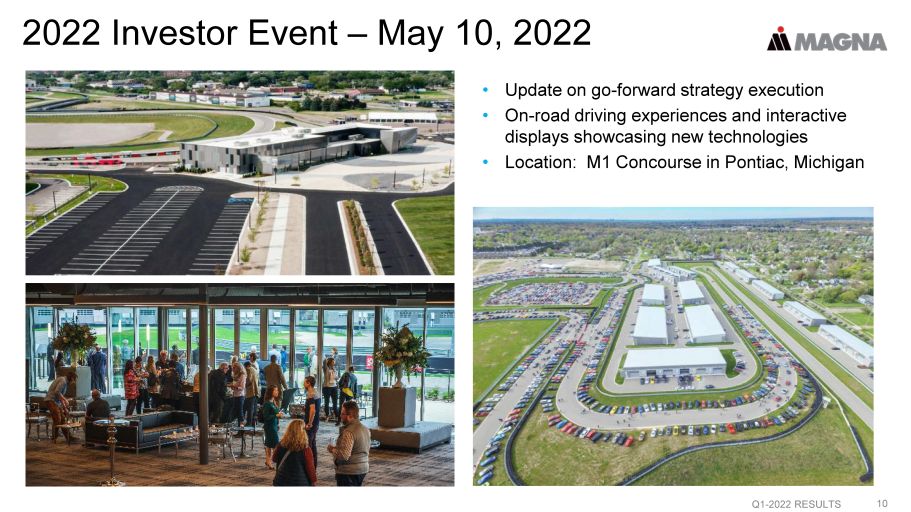
2022 Investor Event – May 10, 2022 • Update on go - forward strategy execution • On - road driving experiences and interactive displays showcasing new technologies • Location: M1 Concourse in Pontiac, Michigan Q1 - 2022 RESULTS 10
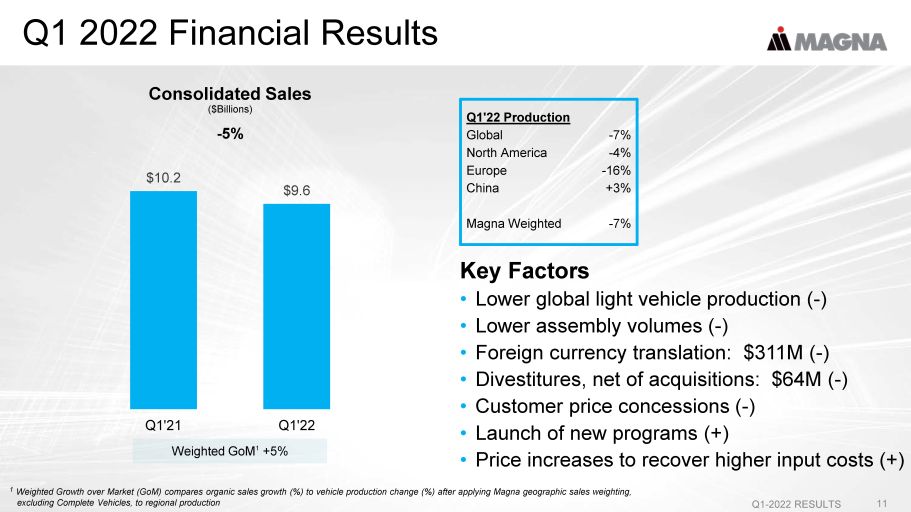
Q1 2022 Financial Results Q1 - 2022 RESULTS 11 Key Factors • Lower global light vehicle production ( - ) • Lower assembly volumes ( - ) • Foreign currency translation: $311M ( - ) • Divestitures, net of acquisitions: $64M ( - ) • Customer price concessions ( - ) • Launch of new programs (+) • Price increases to recover higher input costs (+) Q1'22 Production Global - 7% North America - 4% Europe - 16% China +3% Magna Weighted - 7% Consolidated Sales ($Billions) - 5% $10.2 $9.6 0.0 0.1 0.1 0.1 0.1 0.1 0.1 0.1 $0.0 $2.0 $4.0 $6.0 $8.0 $10.0 $12.0 Q1'21 Q1'22 Weighted GoM 1 +5% 1 Weighted Growth over Market ( GoM ) compares organic sales growth (%) to vehicle production change (%) after applying Magna geographic sales weighting, excluding Complete Vehicles, to regional production
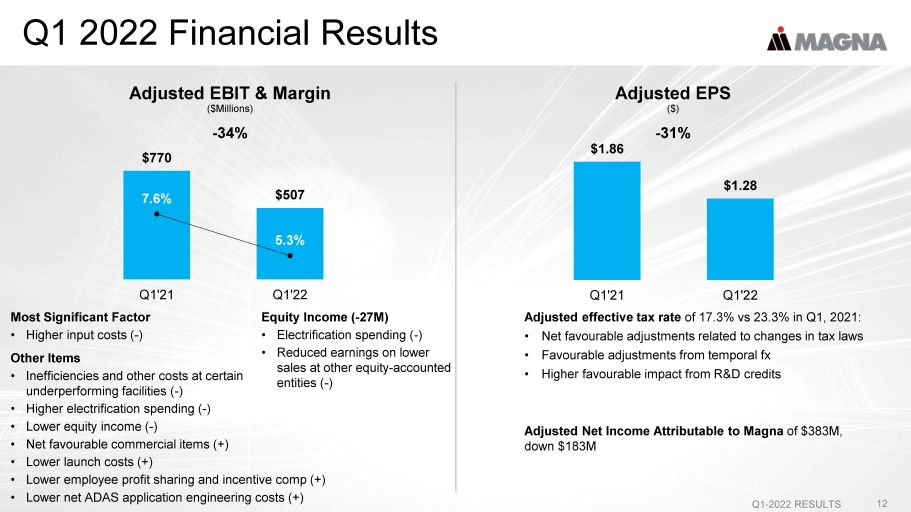
Q1 2022 Financial Results Q1 - 2022 RESULTS 12 Adjusted effective tax rate of 17.3% vs 23.3% in Q1, 2021: • Net favourable adjustments related to changes in tax laws • Favourable adjustments from temporal fx • Higher favourable impact from R&D credits Adjusted Net Income Attributable to Magna of $383M, down $183M Equity Income ( - 27M) • Electrification spending ( - ) • Reduced earnings on lower sales at other equity - accounted entities ( - ) Adjusted EBIT & Margin ($Millions) - 34% Adjusted EPS ($) - 31% $1.86 $1.28 0.0 0.1 0.1 0.1 0.1 0.1 0.1 0.1 0 0.2 0.4 0.6 0.8 1 1.2 1.4 1.6 1.8 2 Q1'21 Q1'22 $770 $507 7.6% 5.3% 0.0 0.1 0.1 0.1 0.1 0.1 0.1 0.1 0 100 200 300 400 500 600 700 800 900 Q1'21 Q1'22 Most Significant Factor • Higher input costs ( - ) Other Items • Inefficiencies and other costs at certain underperforming facilities ( - ) • Higher electrification spending ( - ) • Lower equity income ( - ) • Net favourable commercial items (+) • Lower launch costs (+) • Lower employee profit sharing and incentive comp (+) • Lower net ADAS application engineering costs (+)
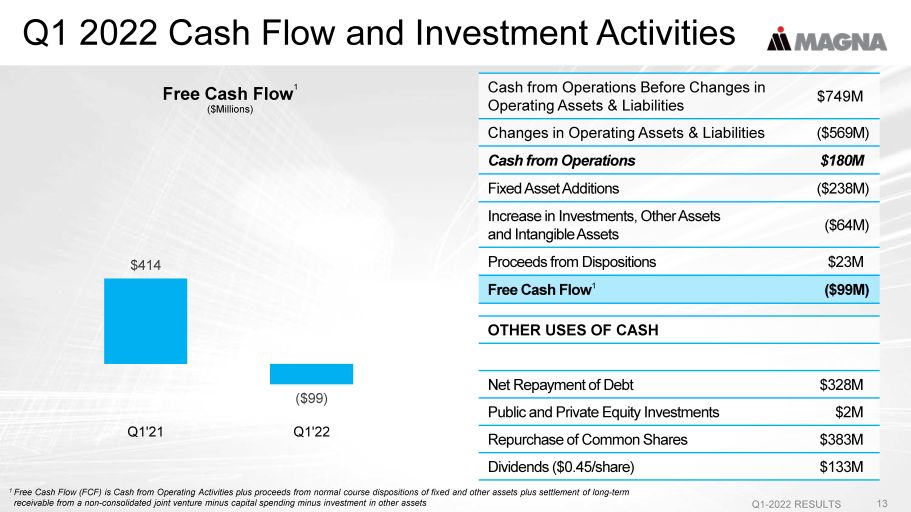
Q1 2022 Cash Flow and Investment Activities Q1 - 2022 RESULTS 13 Free Cash Flow 1 ($Millions) $414 ($99) 0.0 0.1 0.1 0.1 0.1 0.1 0.1 0.1 -$250 -$50 $150 $350 $550 $750 $950 Q1'21 Q1'22 OTHER USES OF CASH Net Repayment of Debt $328M Public and Private Equity Investments $2M Repurchase of Common Shares $383M Dividends ($0.45/share) $133M Cash from Operations Before Changes in Operating Assets & Liabilities $749M Changes in Operating Assets & Liabilities ($569M) Cash from Operations $180M Fixed Asset Additions ($238M) Increase in Investments, Other Assets and Intangible Assets ($64M) Proceeds from Dispositions $23M Free Cash Flow 1 ($99M) 1 Free Cash Flow (FCF) is Cash from Operating Activities plus proceeds from normal course dispositions of fixed and other asset s p lus settlement of long - term receivable from a non - consolidated joint venture minus capital spending minus investment in other assets

Continued Financial Flexibility Q1 - 2022 RESULTS 14 ($M) Estimated Future LTD Principal Repayments (12/31/21) ($M) $455 $692 $771 $651 $3 $1,437 2022 2023 2024 2025 2026 Thereafter LEVERAGE RATIO (LTM, 03/31/22) Adjusted Debt $5,471 Adjusted EBITDA $3,529 Adjusted Debt / Adjusted EBITDA 1.55 TOTAL LIQUIDITY (03/31/22) Cash $1,996 Available Term & Operating Lines of Credit $3,539 Total Liquidity $5,535 Investment - grade ratings from Moody’s, S&P, DBRS
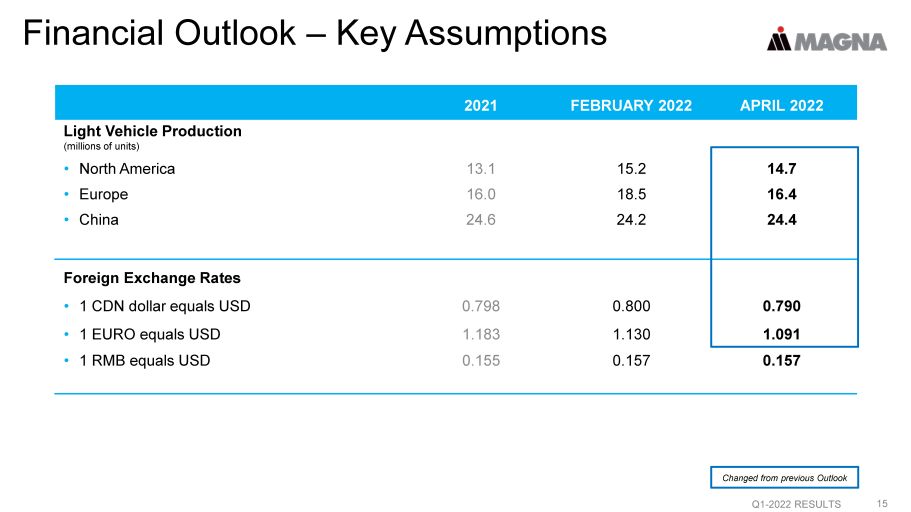
Financial Outlook – Key Assumptions Q1 - 2022 RESULTS 15 2021 FEBRUARY 2022 APRIL 2022 Light Vehicle Production (millions of units) • North America 13.1 15.2 14.7 • Europe 16.0 18.5 16.4 • China 24.6 24.2 24.4 Foreign Exchange Rates • 1 CDN dollar equals USD 0.798 0.800 0.790 • 1 EURO equals USD 1.183 1.130 1.091 • 1 RMB equals USD 0.155 0.157 0.157 Changed from previous Outlook

2022 Outlook Q1 - 2022 RESULTS 16 2021 FEBRUARY 2022 APRIL 2022 Sales: • Body Exteriors & Structures 14.5 16.2 – 16.8 15.8 – 16.4 • Power & Vision 11.3 11.9 – 12.3 11.6 – 12.0 • Seating Systems 4.9 5.4 – 5.7 5.2 – 5.5 • Complete Vehicles 6.1 5.8 – 6.1 5.2 – 5.5 Total Sales 36.2 38.8 – 40.4 37.3 – 38.9 Adjusted EBIT Margin % 1 5.7% 6.0% – 6.4% 5.0% - 5.4% Equity Income 148M 70M – 100M 70M – 100M Interest Expense 78M ~80M ~90M Income Tax Rate 2 19.8% ~21% ~21% Net Income Attributable to Magna 3 1.553 1.7 – 1.9 1.3 – 1.5 Capital Spending 1.4 ~1.8 ~1.8 1 Adjusted EBIT Margin is the ratio of Adjusted EBIT to Total Sales 2 The Income Tax Rate has been calculated using Adjusted EBIT and is based on current tax legislation 3 Net Income Attributable to Magna represents Net Income excluding Other expense (income), net ($Billions, unless otherwise noted) Changed from previous Outlook
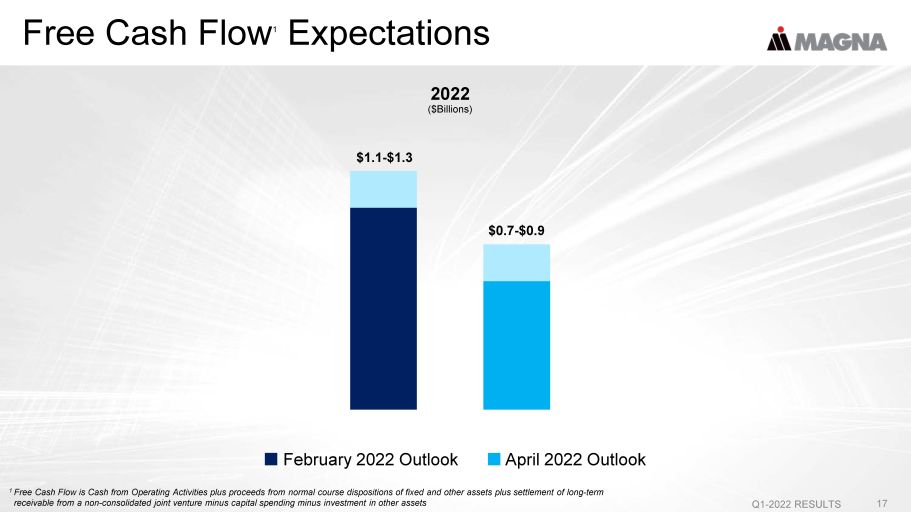
Free Cash Flow 1 Expectations Q1 - 2022 RESULTS 17 2022 ($Billions) 0.0 0.2 0.4 0.6 0.8 1.0 1.2 1.4 $1.1 - $1.3 $0.7 - $0.9 February 2022 Outlook April 2022 Outlook 1 Free Cash Flow is Cash from Operating Activities plus proceeds from normal course dispositions of fixed and other assets plus se ttlement of long - term receivable from a non - consolidated joint venture minus capital spending minus investment in other assets
In Summary Q1 - 2022 RESULTS 18 • Focusing on Operational Excellence, Cost Controls and Customer Recoveries • Ongoing Investments to Drive Future Growth • Positioned for Growth and Free Cash Flow Generation as Markets Recover Q1 Outperformance Despite Industry Headwinds
Appendix – Q1 2022 Results Q1 - 2022 RESULTS 19

Magna in Russia Q1 - 2022 RESULTS 20 • 2021 sales of $371 million (~1% of total sales) ̶ Substantively to Hyundai and Volkswagen • ~2,000 employees in 6 facilities • $440 million on balance sheet as at March 31, 2022 ̶ $160 million in net assets ̶ $280 million in deferred cumulative translation losses • Operations remain substantially idled
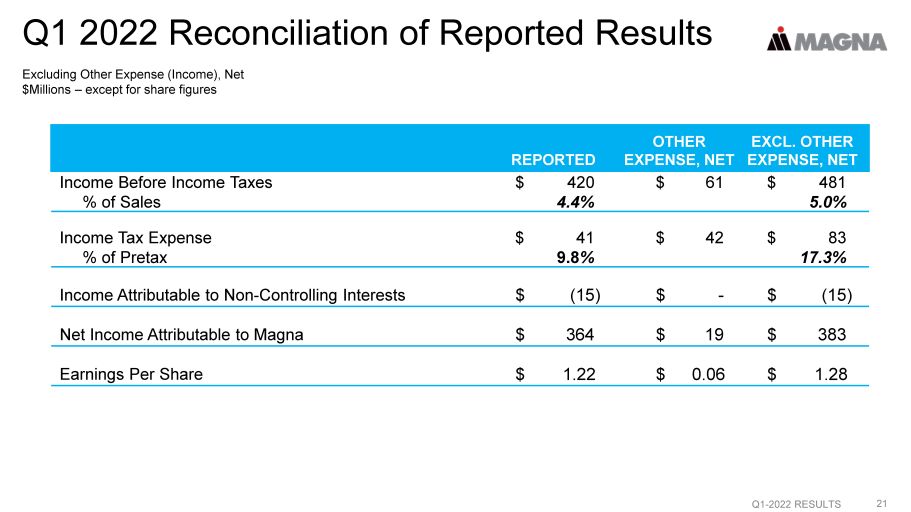
Q1 2022 Reconciliation of Reported Results 21 REPORTED OTHER EXPENSE, NET EXCL. OTHER EXPENSE, NET Income Before Income Taxes $ 420 $ 61 $ 481 % of Sales 4.4% 5.0% Income Tax Expense $ 41 $ 42 $ 83 % of Pretax 9.8 % 17.3% Income Attributable to Non - Controlling Interests $ (15) $ - $ (15) Net Income Attributable to Magna $ 364 $ 19 $ 383 Earnings Per Share $ 1.22 $ 0.06 $ 1.28 Excluding Other Expense (Income), Net $Millions – except for share figures Q1 - 2022 RESULTS
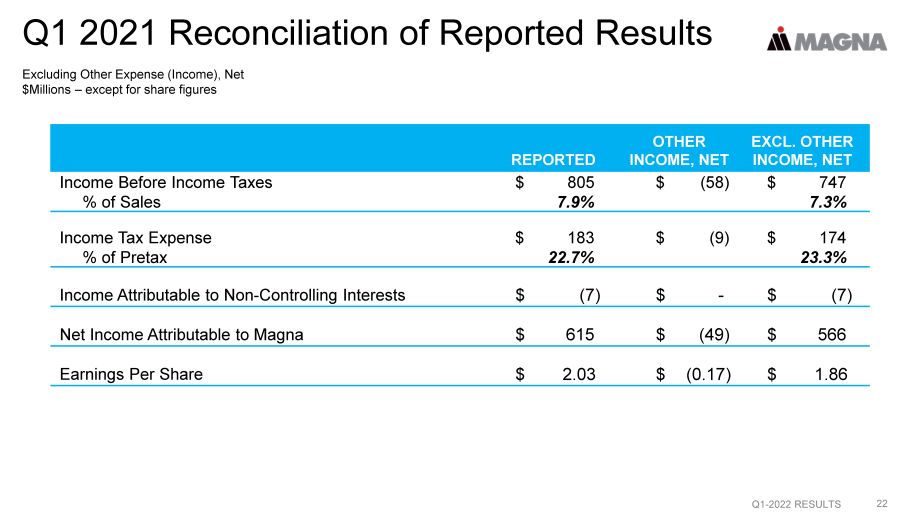
Q1 2021 Reconciliation of Reported Results 22 REPORTED OTHER INCOME, NET EXCL. OTHER INCOME, NET Income Before Income Taxes $ 805 $ (58) $ 747 % of Sales 7.9% 7.3% Income Tax Expense $ 183 $ (9) $ 174 % of Pretax 22.7% 23.3% Income Attributable to Non - Controlling Interests $ (7) $ - $ (7) Net Income Attributable to Magna $ 615 $ (49) $ 566 Earnings Per Share $ 2.03 $ (0.17) $ 1.86 Excluding Other Expense (Income), Net $Millions – except for share figures Q1 - 2022 RESULTS
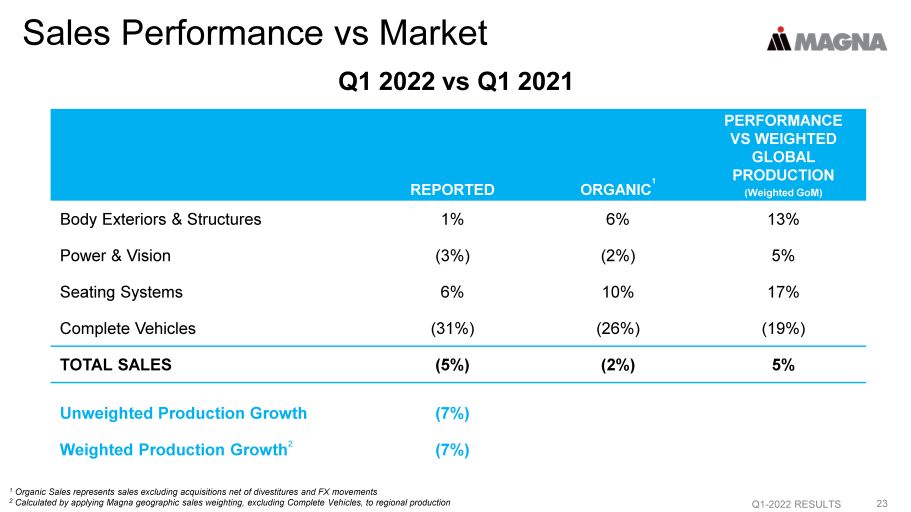
Sales Performance vs Market 23 REPORTED ORGANIC 1 PERFORMANCE VS WEIGHTED GLOBAL PRODUCTION (Weighted GoM) Body Exteriors & Structures 1% 6% 13% Power & Vision (3%) (2%) 5% Seating Systems 6% 10% 17% Complete Vehicles (31%) (26%) (19%) TOTAL SALES (5%) (2%) 5% Unweighted Production Growth (7%) Weighted Production Growth 2 (7%) 1 Organic Sales represents sales excluding acquisitions net of divestitures and FX movements 2 Calculated by applying Magna geographic sales weighting, excluding Complete Vehicles, to regional production Q1 - 2022 RESULTS Q1 2022 vs Q1 2021
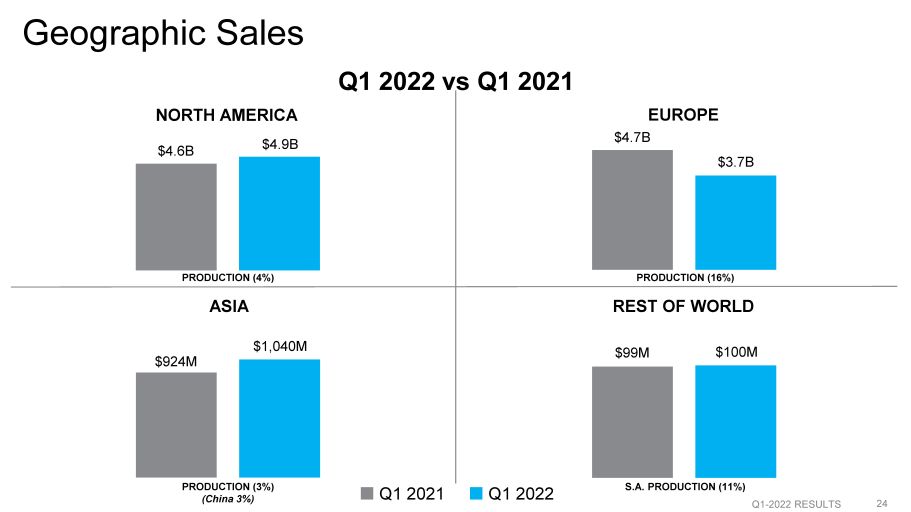
Q1 - 2022 RESULTS 24 Geographic Sales Q1 2021 Q1 2022 NORTH AMERICA $4.6B $4.9B PRODUCTION (4%) EUROPE $4.7B $3.7B PRODUCTION (16%) ASIA $924M $1,040M PRODUCTION (3%) (China 3%) REST OF WORLD $99M $100M S.A. PRODUCTION (11%) Q1 2022 vs Q1 2021

2022 Segment Adjusted EBIT Margin Q1 - 2022 RESULTS 25 2021 February 2022 Outlook April 2022 Outlook BODY EXTERIORS & STRUCTURES 5.7% 8.1 - 8.6% 6.0 - 6.5% SEATING SYSTEMS 3.1% 3.9 - 4.4% 3.4 - 3.9% POWER & VISION 6.5% 5.0 - 5.5% 4.5 - 5.0% COMPLETE VEHICLES 4.7% 3.4 - 3.9% 3.4 - 3.9%
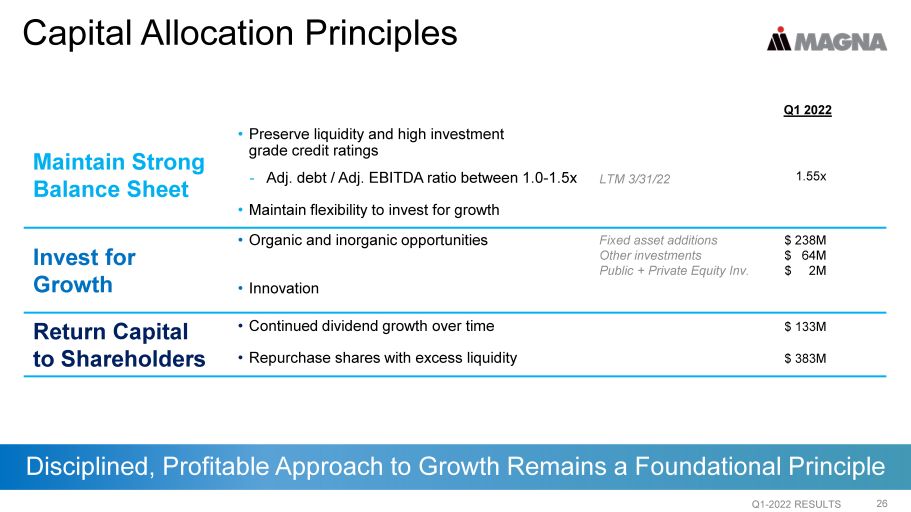
Capital Allocation Principles Q1 - 2022 RESULTS 26 Disciplined, Profitable Approach to Growth Remains a Foundational Principle Q1 2022 Maintain Strong Balance Sheet • Preserve liquidity and high investment grade credit ratings - Adj. debt / Adj. EBITDA ratio between 1.0 - 1.5x LTM 3/31/22 1.55x • Maintain flexibility to invest for growth Invest for Growth • Organic and inorganic opportunities Fixed asset additions Other investments Public + Private Equity Inv. $ 238M $ 64M $ 2M • Innovation Return Capital to Shareholders • Continued dividend growth over time $ 133M • Repurchase shares with excess liquidity $ 383M
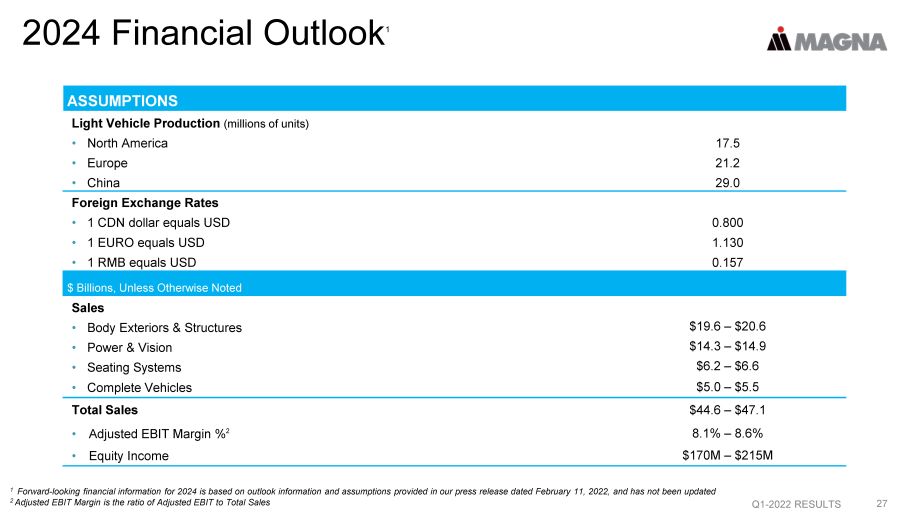
2024 Financial Outlook 1 Q1 - 2022 RESULTS 27 1 Forward - looking financial information for 2024 is based on outlook information and assumptions provided in our press release da ted February 11, 2022, and has not been updated 2 Adjusted EBIT Margin is the ratio of Adjusted EBIT to Total Sales ASSUMPTIONS Light Vehicle Production (millions of units) • North America 17.5 • Europe 21.2 • China 29.0 Foreign Exchange Rates • 1 CDN dollar equals USD 0.800 • 1 EURO equals USD 1.130 • 1 RMB equals USD 0.157 $ Billions, Unless Otherwise Noted Sales • Body Exteriors & Structures $19.6 – $20.6 • Power & Vision $14.3 – $14.9 • Seating Systems $6.2 – $6.6 • Complete Vehicles $5.0 – $5.5 Total Sales $44.6 – $47.1 • Adjusted EBIT Margin % 2 8.1% – 8.6% • Equity Income $170M – $215M

Segment Financial Performance Q1 - 2022 RESULTS 28 • Higher input costs ( - ) • Inefficiencies & other costs at certain underperforming facilities ( - ) • Commercial settlements (+) • Divestitures, net of acquisitions (+) • Launch of new programs (+) • Price increases to recover higher input costs (+) • Lower global light vehicle production ( - ) • Divestitures, net of acquisitions: $97M ( - ) • Foreign currency translation: $80M (+) • Customer price concessions ( - ) $4.0 $4.1 Q1'21 Q1'22 Sales ($Billions) +1% Adjusted EBIT & Margin ($Millions) - 30% $327 $229 8.1% 5.6% 0.0 0.1 0.1 0.1 0.1 0.1 0.1 0.1 0 50 100 150 200 250 300 350 Q1'21 Q1'22 BODY EXTERIORS & STRUCTURES
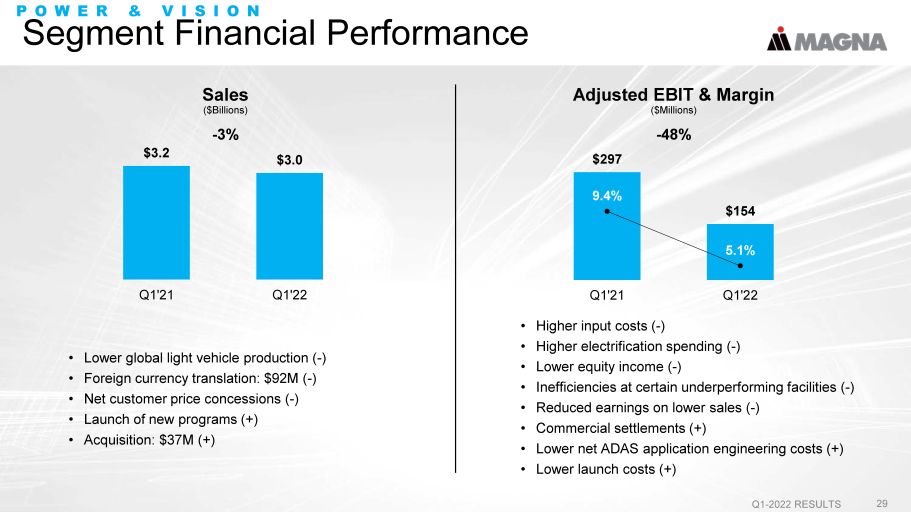
• Lower global light vehicle production ( - ) • Foreign currency translation: $92M ( - ) • Net customer price concessions ( - ) • Launch of new programs (+) • Acquisition: $37M (+) Segment Financial Performance Q1 - 2022 RESULTS 29 • Higher input costs ( - ) • Higher electrification spending ( - ) • Lower equity income ( - ) • Inefficiencies at certain underperforming facilities ( - ) • Reduced earnings on lower sales ( - ) • Commercial settlements (+) • Lower net ADAS application engineering costs (+) • Lower launch costs (+) POWER & VISION $3.2 $3.0 Q1'21 Q1'22 $297 $154 9.4% 5.1% 0.0 0.1 0.1 0.1 0.1 0.1 0.1 0.1 0.1 0.1 0.1 0 50 100 150 200 250 300 350 Q1'21 Q1'22 Sales ($Billions) - 3% Adjusted EBIT & Margin ($Millions) - 48%

• Launch of new programs (+) • Lower global light vehicle production ( - ) • Foreign currency translation: $54M ( - ) • Net customer price concessions ( - ) Segment Financial Performance Q1 - 2022 RESULTS 30 • Higher input costs ( - ) • Earnings on higher sales (+) • Lower launch costs (+) • Commercial settlements (+) SEATING $1.3 $1.4 Q1'21 Q1'22 $55 $49 4.2% 3.6% 0.0 0.0 0.0 0.0 0.0 0.1 0.1 0.1 Q1'21 Q1'22 Sales ($Billions) +6% Adjusted EBIT & Margin ($Millions) - 11%
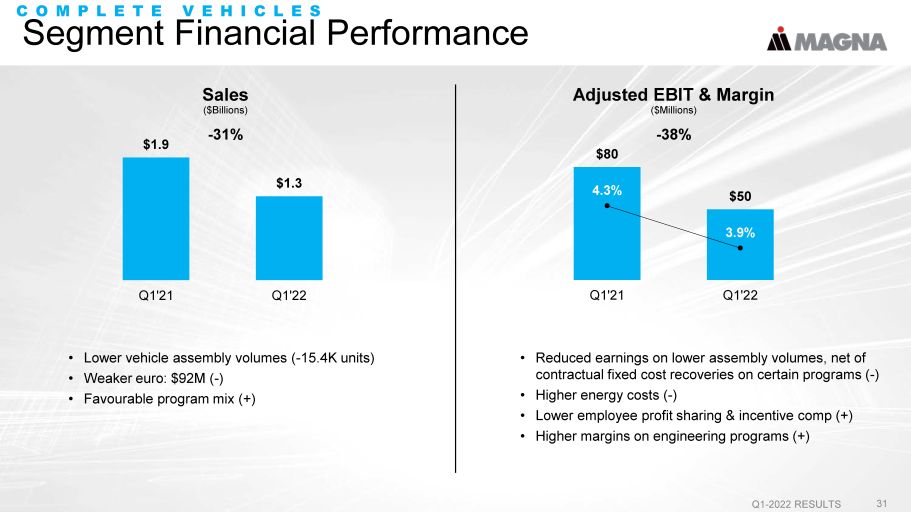
• Lower vehicle assembly volumes ( - 15.4K units) • Weaker euro: $92M ( - ) • Favourable program mix (+) Segment Financial Performance Q1 - 2022 RESULTS 31 • Reduced earnings on lower assembly volumes, net of contractual fixed cost recoveries on certain programs ( - ) • Higher energy costs ( - ) • Lower employee profit sharing & incentive comp (+) • Higher margins on engineering programs (+) COMPLETE VEHICLES $1.9 $1.3 Q1'21 Q1'22 $80 $50 4.3% 3.9% 0.0 0.0 0.0 0.0 0.0 0.0 0.0 0 10 20 30 40 50 60 70 80 90 Q1'21 Q1'22 Sales ($Billions) - 31% Adjusted EBIT & Margin ($Millions) - 38%

END