UNITED STATES
SECURITIES AND EXCHANGE COMMISSION
Washington, D.C. 20549
FORM N-CSR
CERTIFIED SHAREHOLDER REPORT
OF
REGISTERED MANAGEMENT INVESTMENT COMPANIES
Investment Company Act file number: 811-04098
Name of Registrant: Vanguard Chester Funds
Address of Registrant:
P.O. Box 2600
Valley Forge, PA 19482
Name and address of agent for service:
Anne E. Robinson, Esquire
P.O. Box 876
Valley Forge, PA 19482
Registrant’s telephone number, including area code: (610) 669-1000
Date of fiscal year end: September 30
Date of reporting period: October 1, 2017 – September 30, 2018
Item 1: Reports to Shareholders
| Annual Report | September 30, 2018 |
| Vanguard PRIMECAP Fund |
Vanguard’s Principles for Investing Success
We want to give you the best chance of investment success. These
principles, grounded in Vanguard’s research and experience, can put you on
the right path.
Goals. Create clear, appropriate investment goals.
Balance. Develop a suitable asset allocation using broadly diversified funds.
Cost. Minimize cost.
Discipline. Maintain perspective and long-term discipline.
A single theme unites these principles: Focus on the things you can control.
We believe there is no wiser course for any investor.
| Contents | |
| Your Fund’s Performance at a Glance. | 1 |
| CEO’s Perspective. | 3 |
| Advisor’s Report. | 5 |
| Fund Profile. | 9 |
| Performance Summary. | 11 |
| Financial Statements. | 13 |
| Your Fund’s After-Tax Returns. | 28 |
| About Your Fund’s Expenses. | 29 |
| Trustees Approve Advisory Arrangement. | 31 |
| Glossary. | 33 |
Please note: The opinions expressed in this report are just that—informed opinions. They should not be considered promises or advice. Also, please keep in mind that the information and opinions cover the period through the date on the front of this report. Of course, the risks of investing in your fund are spelled out in the prospectus.
See the Glossary for definitions of investment terms used in this report.
Your Fund’s Performance at a Glance
• Vanguard PRIMECAP Fund returned nearly 23% for the 12 months ended September 30, 2018, ahead of the return of its benchmark, the Standard & Poor’s 500 Index, and a bit behind the average return of its peers.
• The broad U.S. stock market advanced nearly 18% as corporate earnings remained strong and the U.S. economy continued to grow. However, stocks endured a stretch of volatility earlier in 2018 before rebounding.
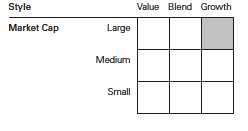
• Growth stocks outperformed their value brethren over the period, and large- and small-capitalization stocks generally surpassed mid-caps.
• PRIMECAP Management Company, the fund’s advisor, traditionally invests most heavily in the information technology and health care sectors. The fund’s information technology stocks advanced nearly 40%, ahead of those in the benchmark, and contributed about 13 percentage points to return. Its health care stocks returned about 18% and added about 4 percentage points to return. The fund also benefited from its industrial stocks.
| Total Returns: Fiscal Year Ended September 30, 2018 | |
| Total | |
| Returns | |
| Vanguard PRIMECAP Fund | |
| Investor Shares | 22.86% |
| Admiral™ Shares | 22.95 |
| S&P 500 Index | 17.91 |
| Multi-Cap Growth Funds Average | 23.04 |
| Multi-Cap Growth Funds Average: Derived from data provided by Lipper, a Thomson Reuters Company. | |
| Admiral Shares carry lower expenses and are available to investors who meet certain account-balance requirements. | |
| Total Returns: Ten Years Ended September 30, 2018 | |
| Average | |
| Annual Return | |
| PRIMECAP Fund Investor Shares | 14.04% |
| S&P 500 Index | 11.97 |
| Multi-Cap Growth Funds Average | 11.84 |
| Multi-Cap Growth Funds Average: Derived from data provided by Lipper, a Thomson Reuters Company. | |
The figures shown represent past performance, which is not a guarantee of future results. (Current performance may be lower or higher than the performance data cited. For performance data current to the most recent month-end, visit our website at vanguard.com/performance.) Note, too, that both investment returns and principal value can fluctuate widely, so an investor’s shares, when sold, could be worth more or less than their original cost.
1
| Expense Ratios | |||
| Your Fund Compared With Its Peer Group | |||
| Investor | Admiral | Peer Group | |
| Shares | Shares | Average | |
| PRIMECAP Fund | 0.39% | 0.32% | 1.17% |
The fund expense ratios shown are from the prospectus dated January 25, 2018, and represent estimated costs for the current fiscal year. For the fiscal year ended September 30, 2018, the fund’s expense ratios were 0.38% for Investor Shares and 0.31% for Admiral Shares. The peer-group expense ratio is derived from data provided by Lipper, a Thomson Reuters Company, and captures information through year-end 2017.
Peer group: Multi-Cap Growth Funds.
2
CEO’s Perspective

Tim Buckley
President and Chief Executive Officer
Dear Shareholder,
Over the years, I’ve found that prudent investors exhibit a common trait: discipline. No matter how the markets move or what new investing fad hits the headlines, those who stay focused on their goals and tune out the noise are set up for long-term success.
The prime gateway to investing is saving, and you don’t usually become a saver without a healthy dose of discipline. Savers make the decision to sock away part of their income, which means spending less and delaying gratification, no matter how difficult that may be.
Of course, disciplined investing extends beyond diligent saving. The financial markets, in the short term especially, are unpredictable; I have yet to meet the investor who can time them perfectly. It takes discipline to resist the urge to go all-in when markets are frothy or to retreat when things look bleak.
Staying put with your investments is one strategy for handling volatility. Another, rebalancing, requires even more discipline because it means steering your money away from strong performers and toward poorer performers.
Patience—a form of discipline—is also the friend of long-term investors. Higher returns are the potential reward for weathering the market’s turbulence and uncertainty.
3
We have been enjoying one of the longest bull markets in history, but it won’t continue forever. Prepare yourself now for how you will react when volatility comes back. Don’t panic. Don’t chase returns or look for answers outside the asset classes you trust. And be sure to rebalance periodically, even when there’s turmoil.
Whether you’re a master of self-control, get a boost from technology, or work with a professional advisor, know that discipline is necessary to get the most out of your investment portfolio. And know that Vanguard is with you for the entire ride.
Thank you for your continued loyalty.
Sincerely,

Mortimer J. Buckley
President and Chief Executive Officer
October 18, 2018
| Market Barometer | |||
| Average Annual Total Returns | |||
| Periods Ended September 30, 2018 | |||
| One Year | Three Years | Five Years | |
| Stocks | |||
| Russell 1000 Index (Large-caps) | 17.76% | 17.07% | 13.67% |
| Russell 2000 Index (Small-caps) | 15.24 | 17.12 | 11.07 |
| Russell 3000 Index (Broad U.S. market) | 17.58 | 17.07 | 13.46 |
| FTSE All-World ex US Index (International) | 2.13 | 10.18 | 4.51 |
| Bonds | |||
| Bloomberg Barclays U.S. Aggregate Bond Index | |||
| (Broad taxable market) | -1.22% | 1.31% | 2.16% |
| Bloomberg Barclays Municipal Bond Index | |||
| (Broad tax-exempt market) | 0.35 | 2.24 | 3.54 |
| FTSE Three-Month U. S. Treasury Bill Index | 1.57 | 0.80 | 0.48 |
| CPI | |||
| Consumer Price Index | 2.28% | 1.99% | 1.52% |
4
Advisor’s Report
For the fiscal year ended September 30, 2018, Vanguard PRIMECAP Fund returned 22.86% for Investor Shares and 22.95% for Admiral Shares, exceeding the 17.91% return of the fund’s benchmark, the Standard & Poor’s 500 Index, and slightly trailing the 23.04% average return of the fund’s multi-capitalization growth fund competitors.
Relative to the S&P 500, sector allocation and stock selection each added to relative results. The fund’s information technology holdings were the primary driver of outperformance, as the fund’s overweight allocation and strong stock selection both benefited results.
The investment environment
The fiscal year ended September 30, 2018, featured a strengthening U.S. economy and robust U.S. equity market returns. The American consumer remained upbeat given healthy gains in employment, real disposable personal income, and household net worth. Consumer confidence measures, in turn, climbed to historically elevated levels, including a notable recent uptick in sentiment from lower-income households.
On the corporate side, federal tax legislation in late 2017 catalyzed the best earnings growth since the immediate aftermath of the global financial crisis, and a broad deregulatory agenda helped usher business sentiment to decade-high levels. Various gauges of business activity
registered consistent expansion throughout the year, and forward-looking indicators remained encouraging.
While the growth momentum in the U.S. economy ultimately translated into equity strength, the path was not linear. The equity market rose rapidly through late January on tax-law enthusiasm and consequent upgrades to forward earnings. Market volatility resurfaced in early 2018 as combative trade rhetoric and the regulatory scrutiny of key technology companies escalated. The market corrected lower by more than 10% and largely hovered at these subdued levels for several months.
The undeniable fitness of the underlying economy, coupled with key trade resolutions, lifted the equity markets back into record-setting territory by late August. Cyclical sectors led the way during the fiscal year, with information technology returning 38% and consumer discretionary returning 35%, while defensive sectors generally underperformed the market averages.
Outlook for U.S. equities
As we look beyond the reporting period, we remain cautiously optimistic. This calendar year’s above-trend gross domestic product (GDP) growth and exceptional corporate earnings growth will likely decelerate next year, but solid growth on both fronts should endure. The S&P 500’s forward price-earnings
5
(P/E) valuation (16.8 times) sits slightly above its 25-year historical average (16.1 times), while financial conditions remain fairly accommodative despite rising U.S. Treasury yields and a strengthening U.S. dollar.
The market’s valuation is thus reasonable overall, in our view. Our largest sector positions continue to be in information technology, health care, and industrials, where we believe our holdings enjoy a combination of strong secular growth, improved industry dynamics, and sensible valuations.
As the fiscal year closed, domestic strength increasingly contrasted with signs of emerging weakness abroad. While U.S. outperformance in this scenario is neither unprecedented nor alarming given superior fundamentals, synchronous global growth is a better environment for U.S. equities. And yet the markets are sounding early warnings, particularly in China, where deteriorating U.S.-China relations have contributed to a slumping equity market and a beleaguered yuan.
The risk of broader trade-induced tumult has diminished somewhat with each preliminary trade agreement announced by the Trump administration, but these developments focus the attention on China, the original and largest target of trade ire. As we have indicated previously, we are still hopeful that trade-inspired
economic and geopolitical risks will continue to subside, even as we acknowledge few signs of progress in this specific dispute. We invest in many companies and industries––such as semiconductors and airlines––that maintain a cyclical bent. These companies rely heavily on international commerce and on global growth more broadly, and some are especially dependent on constructive U.S.-China relations.
Portfolio update
The portfolio maintained large overweight positions in information technology, health care, and industrial stocks. These sectors made up 71% of average assets compared with their 44% combined weighting in the S&P 500. The portfolio was equal-weighted consumer discretionary at 10% of average assets. The fund maintained an underweight position in all other sectors, particularly consumer staples, energy, financials, and telecommunication services. The fund had limited or no exposure to several smaller sectors, including materials, real estate, and utilities.
Information technology was the primary driver of relative outperformance during the fiscal year. The fund maintained a large overweight position (30% of average assets versus 20% for the S&P 500), and stock selection was effective overall. Key
6
stocks included NetApp (+99%), Adobe Systems (+81%), NVIDIA (+58%), and Microsoft (+56%).
Health care was also a large overweight position, but it did not influence relative performance given the sector’s in-line return of 18% and mixed stock selection. Bioverativ (+84%) and Eli Lilly (+29%) largely offset the drag from Roche (–1%) and Novartis (+3%).
Stock selection in the fund’s industrials portfolio boosted relative results, though this largely stemmed from avoiding General Electric’s 52% decline. Performance in the fund’s large airline holdings was mixed and detracted slightly overall.
Stock selection elsewhere was unfavorable in aggregate, primarily because of our limited exposure to Amazon (+108%) and Netflix (+106%).
As of September 30, 2018, the fund’s top ten holdings made up 39% of assets.
Advisor perspectives
Information technology has been a consistent source of outperformance for the fund. In recent years, our significant ownership in technology companies, particularly semiconductor stocks, has been an extraordinarily reliable driver of annual upside.
Such trends tend not to persist indefinitely. That said, we continue to expect demand for semiconductors and software products––and technology and innovation in general––to outpace demand for goods and services more broadly. We also view the sector’s modest valuation premium (18.3 times forward P/E) as largely justified and, of note, not remotely similar to the valuation distortions of technology euphoria in previous eras.
As our assessment of company-level risk/reward has evolved after years of outperformance, we have reduced several positions. And if fundamentals or sentiment were to shift after a strong multiyear run, we acknowledge the potential for performance reversion. But, importantly, our ownership is in companies, not sectors, and our conviction is in these companies’ immense opportunities in an increasingly technology-centric world. Our holdings thus continue to constitute a meaningful portfolio overweight.
In contrast to our information technology holdings, our health care holdings have generally performed below our expectations in recent years, implying that the projected upside we envisioned from favorable demographics and company-level innovation remains intact. The airlines have also underperformed of late, and now trade at a roughly ten times forward
7
P/E valuation despite continued growth in travel demand. Even as oil prices increase, the airlines’ substantial earnings power corroborates our contrarian view that this time can indeed be different.
Conclusion
As bottom-up stock pickers, we search for opportunities to invest in stocks with long-term prospects that we find to be materially better than market prices imply. This approach to stock selection, which drives portfolio composition and therefore sector allocation, often results in portfolios that bear little resemblance to market indexes, creating the possibility for lengthy periods of relative outperformance or underperformance. We nonetheless believe that this approach can generate superior results for shareholders over the long term.
PRIMECAP Management Company
October 18, 2018
8
PRIMECAP Fund
Fund Profile
As of September 30, 2018
| Share-Class Characteristics | ||
| Investor | Admiral | |
| Shares | Shares | |
| Ticker Symbol | VPMCX | VPMAX |
| Expense Ratio1 | 0.39% | 0.32% |
| 30-Day SEC Yield | 1.17% | 1.24% |
| Portfolio Characteristics | |||
| DJ | |||
| U.S. Total | |||
| S&P 500 | Market | ||
| Fund | Index | FA Index | |
| Number of Stocks | 135 | 506 | 3,825 |
| Median Market Cap | $100.3B | $113.8B | $73.9B |
| Price/Earnings Ratio | 20.3x | 21.5x | 21.0x |
| Price/Book Ratio | 4.2x | 3.3x | 3.1x |
| Return on Equity | 15.6% | 16.2% | 14.9% |
| Earnings Growth Rate | 11.0% | 8.2% | 8.5% |
| Dividend Yield | 1.4% | 1.8% | 1.7% |
| Foreign Holdings | 13.4% | 0.0% | 0.0% |
| Turnover Rate | 8% | — | — |
| Short-Term Reserves | 2.8% | — | — |
| Volatility Measures | ||
| DJ | ||
| U.S. Total | ||
| S&P 500 | Market | |
| Index | FA Index | |
| R-Squared | 0.87 | 0.87 |
| Beta | 1.11 | 1.09 |
These measures show the degree and timing of the fund’s fluctuations compared with the indexes over 36 months.
| Sector Diversification (% of equity exposure) | |||
| DJ | |||
| U.S. Total | |||
| S&P 500 | Market | ||
| Fund | Index | FA Index | |
| Consumer | |||
| Discretionary | 8.3% | 10.3% | 10.8% |
| Consumer Staples | 0.0 | 6.7 | 6.0 |
| Energy | 0.9 | 6.0 | 5.8 |
| Financials | 7.5 | 13.3 | 13.8 |
| Health Care | 24.2 | 15.1 | 14.6 |
| Industrials | 20.4 | 9.7 | 10.4 |
| Information | |||
| Technology | 38.2 | 21.0 | 20.8 |
| Materials | 0.4 | 2.4 | 2.9 |
| Real Estate | 0.0 | 2.7 | 3.6 |
| Telecommunication | |||
| Services | 0.1 | 10.0 | 8.5 |
| Utilities | 0.0 | 2.8 | 2.8 |
Sector categories are based on the Global Industry Classification Standard (“GICS”), except for the “Other” category (if applicable), which includes securities that have not been provided a GICS classification as of the effective reporting period.
| Ten Largest Holdings (% of total net assets) | ||
| Adobe Systems Inc. | Application Software | 5.6% |
| Biogen Inc. | Biotechnology | 4.7 |
| Alphabet Inc. | Internet Software & | |
| Services | 4.6 | |
| Eli Lilly & Co. | Pharmaceuticals | 4.5 |
| Microsoft Corp. | Systems Software | 4.2 |
| Amgen Inc. | Biotechnology | 3.4 |
| FedEx Corp. | Air Freight & | |
| Logistics | 3.3 | |
| Texas Instruments Inc. | Semiconductors | 3.2 |
| Southwest Airlines Co. | Airlines | 3.2 |
| Airbus SE | Aerospace & | |
| Defense | 2.1 | |
| Top Ten | 38.8% | |
The holdings listed exclude any temporary cash investments and equity index products.
1 The expense ratios shown are from the prospectus dated January 25, 2018, and represent estimated costs for the current fiscal year. For the fiscal year ended September 30, 2018, the expense ratios were 0.38% for Investor Shares and 0.31% for Admiral Shares.
9
PRIMECAP Fund
Investment Focus
10
PRIMECAP Fund
Performance Summary
All of the returns in this report represent past performance, which is not a guarantee of future results that may be achieved by the fund. (Current performance may be lower or higher than the performance data cited. For performance data current to the most recent month-end, visit our website at vanguard.com/performance.) Note, too, that both investment returns and principal value can fluctuate widely, so an investor’s shares, when sold, could be worth more or less than their original cost. The returns shown do not reflect taxes that a shareholder would pay on fund distributions or on the sale of fund shares.
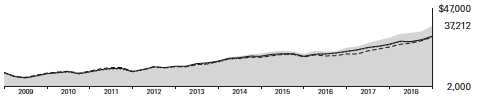
Cumulative Performance: September 30, 2008, Through September 30, 2018
Initial Investment of $10,000
| Average Annual Total Returns | ||||
| Periods Ended September 30, 2018 | ||||
| One | Five | Ten | of a $10,000 | |
| Year | Years | Years | Investment | |
| PRIMECAP Fund*Investor Shares | 22.86% | 17.18% | 14.04% | $37,212 |
| • S&P 500 Index | 17.91 | 13.95 | 11.97 | 30,962 |
| Multi-Cap Growth Funds Average | 23.04 | 13.23 | 11.84 | 30,628 |
| Dow Jones U.S. Total Stock Market | ||||
| Float Adjusted Index | 17.58 | 13.42 | 12.05 | 31,191 |
Multi-Cap Growth Funds Average: Derived from data provided by Lipper, a Thomson Reuters Company.
| Final Value | ||||
| One | Five | Ten | of a $50,000 | |
| Year | Years | Years | Investment | |
| PRIMECAP Fund Admiral Shares | 22.95% | 17.27% | 14.14% | $187,620 |
| S&P 500 Index | 17.91 | 13.95 | 11.97 | 154,811 |
| Dow Jones U.S. Total Stock Market Float | ||||
| Adjusted Index | 17.58 | 13.42 | 12.05 | 155,955 |
See Financial Highlights for dividend and capital gains information.
11
PRIMECAP Fund
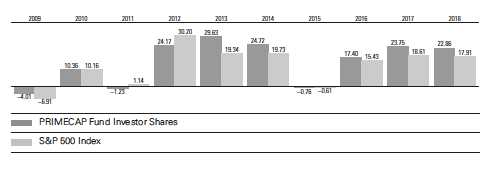
Fiscal-Year Total Returns (%): September 30, 2008, Through September 30, 2018
12
PRIMECAP Fund
Financial Statements
Statement of Net Assets
As of September 30, 2018
The fund reports a complete list of its holdings in regulatory filings four times in each fiscal year, at the quarter-ends. For the second and fourth fiscal quarters, the lists appear in the fund’s semiannual and annual reports to shareholders. For the first and third fiscal quarters, the fund files the lists with the Securities and Exchange Commission on Form N-Q. Shareholders can look up the fund’s Forms N-Q on the SEC’s website at sec.gov. Forms N-Q may also be reviewed and copied at the SEC’s Public Reference Room (see the back cover of this report for further information).
| Market | |||
| Value• | |||
| Shares | ($000) | ||
| Common Stocks (97.2%) | |||
| Consumer Discretionary (8.0%) | |||
| Sony Corp. ADR | 17,572,750 | 1,065,787 | |
| Ross Stores Inc. | 8,354,972 | 827,978 | |
| TJX Cos. Inc. | 4,768,992 | 534,222 | |
| 1 | Whirlpool Corp. | 4,097,472 | 486,575 |
| Carnival Corp. | 7,249,595 | 462,307 | |
| *,^,1 Mattel Inc. | 26,146,638 | 410,502 | |
| * | Amazon.com Inc. | 194,765 | 390,114 |
| Royal Caribbean | |||
| Cruises Ltd. | 2,875,433 | 373,634 | |
| L Brands Inc. | 10,674,073 | 323,424 | |
| Walt Disney Co. | 2,600,000 | 304,044 | |
| Comcast Corp. Class A | 1,947,900 | 68,975 | |
| Marriott International | |||
| Inc.Class A | 490,300 | 64,734 | |
| * | Charter Communications | ||
| Inc. Class A | 136,000 | 44,320 | |
| MGM Resorts | |||
| International | 1,494,600 | 41,714 | |
| Restaurant Brands | |||
| International Inc. | 522,900 | 30,998 | |
| CBS Corp. Class B | 537,767 | 30,895 | |
| * | Ulta Beauty Inc. | 103,500 | 29,199 |
| Hilton Worldwide | |||
| Holdings Inc. | 295,366 | 23,860 | |
| Las Vegas Sands Corp. | 361,500 | 21,448 | |
| McDonald’s Corp. | 101,800 | 17,030 | |
| * | Netflix Inc. | 34,950 | 13,076 |
| Newell Brands Inc. | 564,000 | 11,449 | |
| Entercom | |||
| Communications Corp. | |||
| Class A | 353,458 | 2,792 | |
| Adient plc | 69,700 | 2,740 | |
| 5,581,817 | |||
| Market | |||
| Value• | |||
| Shares | ($000) | ||
| Consumer Staples (0.0%) | |||
| Constellation Brands Inc. | |||
| Class A | 5,600 | 1,208 | |
| Philip Morris International | |||
| Inc. | 6,600 | 538 | |
| Altria Group Inc. | 7,100 | 428 | |
| 2,174 | |||
| Energy (0.8%) | |||
| EOG Resources Inc. | 1,898,500 | 242,192 | |
| Schlumberger Ltd. | 2,467,700 | 150,332 | |
| *,^ | Transocean Ltd. | 7,928,573 | 110,603 |
| Noble Energy Inc. | 2,185,600 | 68,169 | |
| National Oilwell Varco | |||
| Inc. | 375,700 | 16,185 | |
| Hess Corp. | 100,000 | 7,158 | |
| Pioneer Natural | |||
| Resources Co. | 2,800 | 488 | |
| 595,127 | |||
| Financials (7.3%) | |||
| JPMorgan Chase & Co. | 11,318,808 | 1,277,214 | |
| Wells Fargo & Co. | 21,973,047 | 1,154,903 | |
| Charles Schwab Corp. | 17,269,645 | 848,803 | |
| Marsh & McLennan | |||
| Cos. Inc. | 6,496,476 | 537,389 | |
| Bank of America Corp. | 8,092,432 | 238,403 | |
| Discover Financial | |||
| Services | 2,855,424 | 218,297 | |
| Progressive Corp. | 2,815,700 | 200,027 | |
| US Bancorp | 3,707,325 | 195,784 | |
| CME Group Inc. | 896,318 | 152,562 | |
| Citigroup Inc. | 2,008,900 | 144,119 | |
| American Express Co. | 372,100 | 39,625 | |
| Travelers Cos. Inc. | 287,601 | 37,305 | |
| Chubb Ltd. | 41,133 | 5,497 | |
| 5,049,928 | |||
| Health Care (23.6%) | |||
| * | Biogen Inc. | 9,221,680 | 3,258,112 |
| Eli Lilly & Co. | 28,869,415 | 3,097,977 | |
13
| PRIMECAP Fund | |||
| Market | |||
| Value• | |||
| Shares | ($000) | ||
| Amgen Inc. | 11,536,934 | 2,391,491 | |
| Roche Holding AG | 4,863,894 | 1,176,165 | |
| * | Boston Scientific Corp | . 29,533,304 | 1,137,032 |
| Novartis AG ADR | 12,934,406 | 1,114,429 | |
| AstraZeneca plc ADR | 27,137,088 | 1,073,815 | |
| Thermo Fisher | |||
| Scientific Inc. | 2,600,020 | 634,613 | |
| Medtronic plc | 4,824,770 | 474,613 | |
| Bristol-Myers Squibb | |||
| Co. | 7,088,052 | 440,026 | |
| Abbott Laboratories | 5,958,088 | 437,085 | |
| * | BioMarin | ||
| Pharmaceutical Inc. | 4,111,763 | 398,718 | |
| *,2 | Siemens Healthineers | ||
| AG | 3,977,700 | 174,769 | |
| CVS Health Corp. | 2,111,815 | 166,242 | |
| Merck & Co. Inc. | 1,500,000 | 106,410 | |
| Agilent Technologies | |||
| Inc. | 1,179,760 | 83,220 | |
| Zimmer Biomet | |||
| Holdings Inc. | 603,380 | 79,326 | |
| Sanofi ADR | 1,008,000 | 45,027 | |
| Johnson & Johnson | 265,000 | 36,615 | |
| Stryker Corp. | 180,000 | 31,982 | |
| GlaxoSmithKline plc | |||
| ADR | 560,000 | 22,495 | |
| 16,380,162 | |||
| Industrials (19.8%) | |||
| FedEx Corp. | 9,572,126 | 2,304,872 | |
| 1 | Southwest Airlines Co. | 35,149,162 | 2,195,065 |
| Airbus SE | 11,581,190 | 1,453,950 | |
| *,1 | United Continental | ||
| Holdings Inc. | 15,835,494 | 1,410,309 | |
| 1 | American Airlines | ||
| Group Inc. | 30,326,913 | 1,253,411 | |
| Siemens AG | 7,241,026 | 925,874 | |
| Caterpillar Inc. | 5,497,345 | 838,290 | |
| Delta Air Lines Inc. | 11,743,466 | 679,125 | |
| Deere & Co. | 3,168,101 | 476,261 | |
| Honeywell | |||
| International Inc. | 2,333,098 | 388,227 | |
| Union Pacific Corp. | 2,313,325 | 376,679 | |
| Alaska Air Group Inc. | 4,996,700 | 344,073 | |
| Boeing Co. | 893,700 | 332,367 | |
| United Parcel Service | |||
| Inc. Class B | 2,125,170 | 248,114 | |
| Textron Inc. | 2,800,000 | 200,116 | |
| CSX Corp. | 1,410,000 | 104,410 | |
| United Technologies | |||
| Corp. | 495,000 | 69,206 | |
| * | TransDigm Group Inc. | 128,600 | 47,878 |
| Pentair plc | 1,030,000 | 44,650 | |
| Rockwell Automation | |||
| Inc. | 180,680 | 33,881 | |
| Market | |||
| Value• | |||
| Shares | ($000) | ||
| nVent Electric plc | 1,030,000 | 27,975 | |
| * | Ryanair Holdings plc | ||
| ADR | 250,000 | 24,010 | |
| * | Herc Holdings Inc. | 142,000 | 7,270 |
| 13,786,013 | |||
| Information Technology (37.2%) | |||
| * | Adobe Systems Inc. | 14,317,657 | 3,865,051 |
| Microsoft Corp. | 25,349,468 | 2,899,219 | |
| Texas Instruments Inc. | 20,519,555 | 2,201,543 | |
| * | Alphabet Inc. Class C | 1,345,943 | 1,606,343 |
| * | Alphabet Inc. Class A | 1,327,689 | 1,602,627 |
| * | Micron Technology Inc. | 31,080,100 | 1,405,753 |
| * | Alibaba Group Holding | ||
| Ltd. ADR | 8,330,680 | 1,372,563 | |
| 1 | NetApp Inc. | 14,540,200 | 1,248,858 |
| NVIDIA Corp. | 3,805,000 | 1,069,281 | |
| HP Inc. | 31,606,290 | 814,494 | |
| QUALCOMM Inc. | 10,568,214 | 761,228 | |
| Intuit Inc. | 3,308,615 | 752,379 | |
| Hewlett Packard | |||
| Enterprise Co. | 44,542,514 | 726,488 | |
| Cisco Systems Inc. | 14,502,650 | 705,554 | |
| Intel Corp. | 14,280,800 | 675,339 | |
| KLA-Tencor Corp. | 6,322,700 | 643,082 | |
| Telefonaktiebolaget | |||
| LM Ericsson ADR | 72,702,590 | 639,783 | |
| Activision Blizzard Inc. | 5,609,000 | 466,613 | |
| Oracle Corp. | 6,300,429 | 324,850 | |
| Analog Devices Inc. | 2,912,960 | 269,332 | |
| 1 | Plantronics Inc. | 3,672,300 | 221,440 |
| Corning Inc. | 5,642,950 | 199,196 | |
| Visa Inc. Class A | 1,296,000 | 194,517 | |
| DXC Technology Co. | 1,970,168 | 184,250 | |
| * | Dell Technologies Inc. | ||
| Class V | 1,460,000 | 141,795 | |
| Apple Inc. | 547,500 | 123,593 | |
| * | BlackBerry Ltd. | 10,854,800 | 123,528 |
| * | PayPal Holdings Inc. | 1,097,600 | 96,413 |
| * | Altaba Inc. | 1,307,300 | 89,053 |
| * | salesforce.com Inc. | 538,400 | 85,622 |
| ^ | Micro Focus | ||
| International plc ADR | 4,427,540 | 81,821 | |
| Entegris Inc. | 2,650,322 | 76,727 | |
| * | eBay Inc. | 2,263,900 | 74,754 |
| Perspecta Inc. | 1,264,905 | 32,533 | |
| * | Keysight Technologies | ||
| Inc. | 383,290 | 25,404 | |
| Mastercard Inc. Class A | 50,350 | 11,208 | |
| Applied Materials Inc. | 244,400 | 9,446 | |
| * | Rambus Inc. | 554,197 | 6,046 |
| * | Arista Networks Inc. | 1,300 | 346 |
| 25,828,072 | |||
14
| PRIMECAP Fund | ||
| Market | ||
| Value• | ||
| Shares | ($000) | |
| Materials (0.4%) | ||
| Praxair Inc. | 905,200 | 145,493 |
| DowDuPont Inc. | 1,647,555 | 105,954 |
| Albemarle Corp. | 465,500 | 46,448 |
| 297,895 | ||
| Real Estate (0.0%) | ||
| Equinix Inc. | 12,000 | 5,195 |
| Telecommunication Services (0.1%) | ||
| * T-Mobile US Inc. | 581,900 | 40,838 |
| Total Common Stocks | ||
| (Cost $27,083,349) | 67,567,221 | |
| Temporary Cash Investment (3.0%) | ||
| Money Market Fund (3.0%) | ||
| 3,4 Vanguard Market | ||
| Liquidity Fund, | ||
| 2.209% | ||
| (Cost $2,087,817) | 20,879,627 | 2,087,963 |
| Total Investments (100.2%) | ||
| (Cost $29,171,166) | 69,655,184 | |
| Other Assets and Liabilities (-0.2%) | ||
| Other Assets | 96,299 | |
| Liabilities 3 | (264,361) | |
| Net Assets (100%) | 69,487,122 | |
| Amount | |
| ($000) | |
| Statement of Assets and Liabilities | |
| Assets | |
| Investments in Securities, at Value | |
| Unaffiliated Issuers | 60,341,061 |
| Affiliated Vanguard Funds | 2,087,963 |
| Other Affiliated Issuers | 7,226,160 |
| Total Investments in Securities | 69,655,184 |
| Investment in Vanguard | 3,517 |
| Receivables for Investment Securities | |
| Sold | 117 |
| Receivables for Accrued Income | 55,617 |
| Receivables for Capital Shares Issued | 29,940 |
| Other Assets | 7,108 |
| Total Assets | 69,751,483 |
| Liabilities | |
| Payables for Investment Securities | |
| Purchased | (13,692) |
| Collateral for Securities on Loan | (149,367) |
| Payables to Investment Advisor | (30,658) |
| Payables for Capital Shares Redeemed | (21,061) |
| Payables to Vanguard | (47,373) |
| Other Liabilities | (2,210) |
| Total Liabilities | (264,361) |
| Net Assets | 69,487,122 |
15
| PRIMECAP Fund | |
| At September 30, 2018, net assets consisted of: | |
| Amount | |
| ($000) | |
| Paid-in Capital | 24,774,080 |
| Undistributed Net Investment Income | 512,557 |
| Accumulated Net Realized Gains | 3,716,860 |
| Unrealized Appreciation (Depreciation) | |
| Investment Securities | 40,484,018 |
| Foreign Currencies | (393) |
| Net Assets | 69,487,122 |
| Investor Shares—Net Assets | |
| Applicable to 48,275,927 outstanding | |
| $.001 par value shares of beneficial | |
| interest (unlimited authorization) | 7,126,127 |
| Net Asset Value Per Share— | |
| Investor Shares | $147.61 |
| Admiral Shares—Net Assets | |
| Applicable to 407,349,436 outstanding | |
| $.001 par value shares of beneficial | |
| interest (unlimited authorization) | 62,360,995 |
| Net Asset Value Per Share— | |
| Admiral Shares | $153.09 |
• See Note A in Notes to Financial Statements.
* Non-income-producing security.
^ Includes partial security positions on loan to broker-dealers.
The total value of securities on loan is $138,532,000.
1 Considered an affiliated company of the fund as the fund
owns more than 5% of the outstanding voting securities
of such company.
2 Security exempt from registration under Rule 144A of the
Securities Act of 1933. Such securities may be sold in
transactions exempt from registration, normally to qualified
institutional buyers. At September 30, 2018, the value of this
security represented 0.3% of net assets.
3 Includes $149,367,000 of collateral received for securities
on loan.
4 Affiliated money market fund available only to Vanguard funds
and certain trusts and accounts managed by Vanguard. Rate
shown is the 7-day yield.
ADR—American Depositary Receipt.
See accompanying Notes, which are an integral part of the Financial Statements.
16
| PRIMECAP Fund | |
| Statement of Operations | |
| Year Ended | |
| September 30, 2018 | |
| ($000) | |
| Investment Income | |
| Income | |
| Dividends Received from Unaffiliated Issuers1 | 841,402 |
| Dividends Received from Affiliated Issuers | 56,488 |
| Interest Received from Affiliated Vanguard Fund | 43,872 |
| Securities Lending—Net | 967 |
| Total Income | 942,729 |
| Expenses | |
| Investment Advisory Fees—Note B | 117,460 |
| The Vanguard Group—Note C | |
| Management and Administrative—Investor Shares | 13,556 |
| Management and Administrative—Admiral Shares | 69,504 |
| Marketing and Distribution—Investor Shares | 1,012 |
| Marketing and Distribution—Admiral Shares | 2,389 |
| Custodian Fees | 2,044 |
| Auditing Fees | 34 |
| Shareholders’ Reports and Proxy—Investor Shares | 124 |
| Shareholders’ Reports and Proxy—Admiral Shares | 189 |
| Trustees’ Fees and Expenses | 87 |
| Total Expenses | 206,399 |
| Net Investment Income | 736,330 |
| Realized Net Gain (Loss) | |
| Investment Securities Sold—Unaffiliated Issuers | 3,916,934 |
| Investment Securities Sold—Affiliated Issuers | (315) |
| Foreign Currencies | 16 |
| Realized Net Gain (Loss) | 3,916,635 |
| Change in Unrealized Appreciation (Depreciation) | |
| Investment Securities—Unaffiliated Issuers | 7,502,990 |
| Investment Securities—Affiliated Issuers | 1,040,706 |
| Foreign Currencies | (1,857) |
| Change in Unrealized Appreciation (Depreciation) | 8,541,839 |
| Net Increase (Decrease) in Net Assets Resulting from Operations | 13,194,804 |
| 1 Dividends are net of foreign withholding taxes of $19,737,000. | |
See accompanying Notes, which are an integral part of the Financial Statements.
17
| PRIMECAP Fund | ||
| Statement of Changes in Net Assets | ||
| Year Ended September 30, | ||
| 2018 | 2017 | |
| ($000) | ($000) | |
| Increase (Decrease) in Net Assets | ||
| Operations | ||
| Net Investment Income | 736,330 | 661,415 |
| Realized Net Gain (Loss) | 3,916,635 | 2,951,017 |
| Change in Unrealized Appreciation (Depreciation) | 8,541,839 | 7,556,344 |
| Net Increase (Decrease) in Net Assets Resulting from Operations | 13,194,804 | 11,168,776 |
| Distributions | ||
| Net Investment Income | ||
| Investor Shares | (78,554) | (92,535) |
| Admiral Shares | (559,059) | (531,693) |
| Realized Capital Gain1 | ||
| Investor Shares | (327,320) | (269,344) |
| Admiral Shares | (2,340,855) | (1,457,828) |
| Total Distributions | (3,305,788) | (2,351,400) |
| Capital Share Transactions | ||
| Investor Shares | (1,710,759) | (1,160,090) |
| Admiral Shares | 2,994,615 | 3,216,264 |
| Net Increase (Decrease) from Capital Share Transactions | 1,283,856 | 2,056,174 |
| Total Increase (Decrease) | 11,172,872 | 10,873,550 |
| Net Assets | ||
| Beginning of Period | 58,314,250 | 47,440,700 |
| End of Period2 | 69,487,122 | 58,314,250 |
1 Includes fiscal 2018 and 2017 short-term gain distributions totaling $104,276,000 and $54,261,000, respectively. Short-term gain
distributions are treated as ordinary income dividends for tax purposes.
2 Net Assets—End of Period includes undistributed (overdistributed) net investment income of $512,557,000 and $440,228,000.
See accompanying Notes, which are an integral part of the Financial Statements.
18
| PRIMECAP Fund | |||||
| Financial Highlights | |||||
| Investor Shares | |||||
| For a Share Outstanding | Year Ended September 30, | ||||
| Throughout Each Period | 2018 | 2017 | 2016 | 2015 | 2014 |
| Net Asset Value, Beginning of Period | $126.84 | $107.60 | $96.99 | $104.16 | $87.83 |
| Investment Operations | |||||
| Net Investment Income | 1.4741 | 1.3981 | 1.401 | 1.329 | 1.124 |
| Net Realized and Unrealized Gain (Loss) | |||||
| on Investments | 26.529 | 23.145 | 15.103 | (1.631) | 19.812 |
| Total from Investment Operations | 28.003 | 24.543 | 16.504 | (. 302) | 20.936 |
| Distributions | |||||
| Dividends from Net Investment Income | (1.400) | (1.356) | (1.114) | (1.160) | (.836) |
| Distributions from Realized Capital Gains | (5.833) | (3.947) | (4.780) | (5.708) | (3.770) |
| Total Distributions | (7.233) | (5.303) | (5.894) | (6.868) | (4.606) |
| Net Asset Value, End of Period | $147.61 | $126.84 | $107.60 | $96.99 | $104.16 |
| Total Return2 | 22.86% | 23.75% | 17.40% | -0.76% | 24.72% |
| Ratios/Supplemental Data | |||||
| Net Assets, End of Period (Millions) | $7,126 | $7,699 | $7,588 | $7,741 | $13,273 |
| Ratio of Total Expenses to Average Net Assets | 0.38% | 0.39% | 0.39% | 0.40% | 0.44% |
| Ratio of Net Investment Income to | |||||
| Average Net Assets | 1.08% | 1.22% | 1.37% | 1.33% | 1.17% |
| Portfolio Turnover Rate | 8% | 8% | 6% | 9% | 11% |
1 Calculated based on average shares outstanding.
2 Total returns do not include account service fees that may have applied in the periods shown. Fund prospectuses provide information
about any applicable account service fees.
See accompanying Notes, which are an integral part of the Financial Statements.
19
| PRIMECAP Fund | |||||
| Financial Highlights | |||||
| Admiral Shares | |||||
| For a Share Outstanding | Year Ended September 30, | ||||
| Throughout Each Period | 2018 | 2017 | 2016 | 2015 | 2014 |
| Net Asset Value, Beginning of Period | $131.45 | $111.52 | $100.53 | $108.08 | $91.15 |
| Investment Operations | |||||
| Net Investment Income | 1.6221 | 1.5281 | 1.532 | 1.550 | 1.286 |
| Net Realized and Unrealized Gain (Loss) | |||||
| on Investments | 27.508 | 23.981 | 15.645 | (1.784) | 20.536 |
| Total from Investment Operations | 29.130 | 25.509 | 17.177 | (.234) | 21.822 |
| Distributions | |||||
| Dividends from Net Investment Income | (1.444) | (1.491) | (1.236) | (1.403) | (.983) |
| Distributions from Realized Capital Gains | (6.046) | (4.088) | (4.951) | (5.913) | (3.909) |
| Total Distributions | (7.490) | (5.579) | (6.187) | (7.316) | (4.892) |
| Net Asset Value, End of Period | $153.09 | $131.45 | $111.52 | $100.53 | $108.08 |
| Total Return2 | 22.95% | 23.83% | 17.48% | -0.69% | 24.85% |
| Ratios/Supplemental Data | |||||
| Net Assets, End of Period (Millions) | $62,361 | $50,615 | $39,852 | $34,773 | $30,982 |
| Ratio of Total Expenses to Average Net Assets | 0.31% | 0.32% | 0.33% | 0.34% | 0.35% |
| Ratio of Net Investment Income to | |||||
| Average Net Assets | 1.15% | 1.29% | 1.43% | 1.39% | 1.26% |
| Portfolio Turnover Rate | 8% | 8% | 6% | 9% | 11% |
1 Calculated based on average shares outstanding.
2 Total returns do not include transaction fees that may have applied in the periods shown. Fund prospectuses provide information about
any applicable transaction fees.
See accompanying Notes, which are an integral part of the Financial Statements.
20
PRIMECAP Fund
Notes to Financial Statements
Vanguard PRIMECAP Fund is registered under the Investment Company Act of 1940 as an open-end investment company, or mutual fund. The fund offers two classes of shares: Investor Shares and Admiral Shares. Investor Shares are available to any investor who meets the fund’s minimum purchase requirements. Admiral Shares are designed for investors who meet certain administrative, service, and account-size criteria.
A. The following significant accounting policies conform to generally accepted accounting principles for U.S. investment companies. The fund consistently follows such policies in preparing its financial statements.
1. Security Valuation: Securities are valued as of the close of trading on the New York Stock Exchange (generally 4 p.m., Eastern time) on the valuation date. Equity securities are valued at the latest quoted sales prices or official closing prices taken from the primary market in which each security trades; such securities not traded on the valuation date are valued at the mean of the latest quoted bid and asked prices. Securities for which market quotations are not readily available, or whose values have been affected by events occurring before the fund’s pricing time but after the close of the securities’ primary markets, are valued at their fair values calculated according to procedures adopted by the board of trustees. These procedures include obtaining quotations from an independent pricing service, monitoring news to identify significant market- or security-specific events, and evaluating changes in the values of foreign market proxies (for example, ADRs, futures contracts, or exchange-traded funds), between the time the foreign markets close and the fund’s pricing time. When fair-value pricing is employed, the prices of securities used by a fund to calculate its net asset value may differ from quoted or published prices for the same securities. Investments in Vanguard Market Liquidity Fund are valued at that fund’s net asset value.
2. Foreign Currency: Securities and other assets and liabilities denominated in foreign currencies are translated into U.S. dollars using exchange rates obtained from an independent third party as of the fund’s pricing time on the valuation date. Realized gains (losses) and unrealized appreciation (depreciation) on investment securities include the effects of changes in exchange rates since the securities were purchased, combined with the effects of changes in security prices. Fluctuations in the value of other assets and liabilities resulting from changes in exchange rates are recorded as unrealized foreign currency gains (losses) until the assets or liabilities are settled in cash, at which time they are recorded as realized foreign currency gains (losses).
3. Federal Income Taxes: The fund intends to continue to qualify as a regulated investment company and distribute all of its taxable income. Management has analyzed the fund’s tax positions taken for all open federal income tax years (September 30, 2015–2018), and has concluded that no provision for federal income tax is required in the fund’s financial statements.
4. Distributions: Distributions to shareholders are recorded on the ex-dividend date. Distributions are determined on a tax basis and may differ from net investment income and realized capital gains for financial reporting purposes.
5. Securities Lending: To earn additional income, the fund lends its securities to qualified institutional borrowers. Security loans are subject to termination by the fund at any time, and are required to be secured at all times by collateral in an amount at least equal to the market value of securities loaned. Daily market fluctuations could cause the value of loaned securities to be more
21
PRIMECAP Fund
or less than the value of the collateral received. When this occurs, the collateral is adjusted and settled before the opening of the market on the next business day. The fund further mitigates its counterparty risk by entering into securities lending transactions only with a diverse group of prequalified counterparties, monitoring their financial strength, and entering into master securities lending agreements with its counterparties. The master securities lending agreements provide that, in the event of a counterparty’s default (including bankruptcy), the fund may terminate any loans with that borrower, determine the net amount owed, and sell or retain the collateral up to the net amount owed to the fund; however, such actions may be subject to legal proceedings. While collateral mitigates counterparty risk, in the event of a default, the fund may experience delays and costs in recovering the securities loaned. The fund invests cash collateral received in Vanguard Market Liquidity Fund, and records a liability in the Statement of Assets and Liabilities for the return of the collateral, during the period the securities are on loan. Securities lending income represents fees charged to borrowers plus income earned on invested cash collateral, less expenses associated with the loan. During the term of the loan, the fund is entitled to all distributions made on or in respect of the loaned securities.
6. Credit Facility: The fund and certain other funds managed by The Vanguard Group (“Vanguard”) participate in a $3.1 billion committed credit facility provided by a syndicate of lenders pursuant to a credit agreement that may be renewed annually; each fund is individually liable for its borrowings, if any, under the credit facility. Borrowings may be utilized for temporary and emergency purposes, and are subject to the fund’s regulatory and contractual borrowing restrictions. The participating funds are charged administrative fees and an annual commitment fee of 0.10% of the undrawn amount of the facility; these fees are allocated to the funds based on a method approved by the fund’s board of trustees and included in Management and Administrative expenses on the fund’s Statement of Operations. Any borrowings under this facility bear interest at a rate based upon the higher of the one-month London Interbank Offered Rate, federal funds effective rate, or overnight bank funding rate plus an agreed-upon spread.
The fund had no borrowings outstanding at September 30, 2018, or at any time during the period then ended.
7. Other: Dividend income is recorded on the ex-dividend date. Interest income includes income distributions received from Vanguard Market Liquidity Fund and is accrued daily. Security transactions are accounted for on the date securities are bought or sold. Costs used to determine realized gains (losses) on the sale of investment securities are those of the specific securities sold.
Each class of shares has equal rights as to assets and earnings, except that each class separately bears certain class-specific expenses related to maintenance of shareholder accounts (included in Management and Administrative expenses), shareholder reporting, and the proxy. Marketing and distribution expenses are allocated to each class of shares based on a method approved by the board of trustees. Income, other non-class-specific expenses, and gains and losses on investments are allocated to each class of shares based on its relative net assets.
B. PRIMECAP Management Company provides investment advisory services to the fund for a fee calculated at an annual percentage rate of average net assets. For the year ended September 30, 2018, the investment advisory fee represented an effective annual rate of 0.18% of the fund’s average net assets.
22
PRIMECAP Fund
C. In accordance with the terms of a Funds’ Service Agreement (the “FSA”) between Vanguard and the fund, Vanguard furnishes to the fund corporate management, administrative, marketing, and distribution services at Vanguard’s cost of operations (as defined by the FSA). These costs of operations are allocated to the fund based on methods and guidelines approved by the board of trustees. Vanguard does not require reimbursement in the current period for certain costs of operations (such as deferred compensation/benefits and risk/insurance costs); the fund’s liability for these costs of operations is included in Payables to Vanguard on the Statement of Assets and Liabilities. All other costs of operations payable to Vanguard are generally settled twice a month.
Upon the request of Vanguard, the fund may invest up to 0.40% of its net assets as capital in Vanguard. At September 30, 2018, the fund had contributed to Vanguard capital in the amount of $3,517,000, representing 0.01% of the fund’s net assets and 1.41% of Vanguard’s capitalization. The fund’s trustees and officers are also directors and employees, respectively, of Vanguard.
D. Various inputs may be used to determine the value of the fund’s investments. These inputs are summarized in three broad levels for financial statement purposes. The inputs or methodologies used to value securities are not necessarily an indication of the risk associated with investing in those securities.
Level 1—Quoted prices in active markets for identical securities.
Level 2—Other significant observable inputs (including quoted prices for similar securities, interest rates, prepayment speeds, credit risk, etc.).
Level 3—Significant unobservable inputs (including the fund’s own assumptions used to determine the fair value of investments). Any investments valued with significant unobservable inputs are noted on the Statement of Net Assets.
The following table summarizes the market value of the fund’s investments as of September 30, 2018, based on the inputs used to value them:
| Level 1 | Level 2 | Level 3 | |
| Investments | ($000) | ($000) | ($000) |
| Common Stocks | 63,836,464 | 3,730,757 | — |
| Temporary Cash Investments | 2,087,963 | — | — |
| Total | 65,924,427 | 3,730,757 | — |
E. Permanent differences between book-basis and tax-basis components of net assets are reclassified among capital accounts in the financial statements to reflect their tax character. These reclassifications have no effect on net assets or net asset value per share. As of period end, the following permanent differences primarily attributable to the accounting for foreign currency transactions and distributions in connection with fund share redemptions were reclassified to the following accounts:
| Amount | |
| ($000) | |
| Paid-in Capital | 169,212 |
| Undistributed (Overdistributed) Net Investment Income | (26,388) |
| Accumulated Net Realized Gains (Losses) | (142,824) |
23
PRIMECAP Fund
Temporary differences between book-basis and tax-basis components of accumulated net earnings (losses) arise when certain items of income, gain, or loss are recognized in different periods for financial statement and tax purposes; these differences will reverse at some time in the future. The differences are primarily related to the tax deferral of losses on wash sales. As of period end, the tax components of accumulated net earnings (losses) are detailed in the table as follows:
| Amount | |
| ($000) | |
| Undistributed Ordinary Income | 593,870 |
| Undistributed Long-Term Gains | 3,678,495 |
| Capital Loss Carryforwards (Non-expiring) | — |
| Net Unrealized Gains (Losses) | 40,483,625 |
As of September 30, 2018, gross unrealized appreciation and depreciation for investments and derivatives based on cost for U.S. federal income tax purposes were as follows:
| Amount | |
| ($000) | |
| Tax Cost | 29,171,166 |
| Gross Unrealized Appreciation | 41,538,228 |
| Gross Unrealized Depreciation | (1,054,210) |
| Net Unrealized Appreciation (Depreciation) | 40,484,018 |
F. During the year ended September 30, 2018, the fund purchased $5,228,031,000 of investment securities and sold $5,165,876,000 of investment securities, other than temporary cash investments.
| Purchases and sales include $114,642,000 and $0, respectively, in connection with in-kind | ||||
| purchases and redemptions of the fund’s capital shares. | ||||
| G. Capital share transactions for each class of shares were: | ||||
| Year Ended September 30, | ||||
| 2018 | 2017 | |||
| Amount | Shares | Amount | Shares | |
| ($000) | (000) | ($000) | (000) | |
| Investor Shares | ||||
| Issued | 748,854 | 5,524 | 573,721 | 5,070 |
| Issued in Lieu of Cash Distributions | 396,358 | 3,055 | 353,911 | 3,324 |
| Redeemed | (2,855,971) | (21,003) | (2,087,722) | (18,215) |
| Net Increase (Decrease)—Investor Shares | (1,710,759) | (12,424) | (1,160,090) | (9,821) |
| Admiral Shares | ||||
| Issued | 4,800,588 | 34,215 | 4,401,870 | 36,653 |
| Issued in Lieu of Cash Distributions | 2,746,449 | 20,423 | 1,880,344 | 17,051 |
| Redeemed | (4,552,422) | (32,354) | (3,065,950) | (26,006) |
| Net Increase (Decrease)—Admiral Shares | 2,994,615 | 22,284 | 3,216,264 | 27,698 |
24
PRIMECAP Fund
H. Certain of the fund’s investments are in companies that are considered to be affiliated companies of the fund because the fund owns more than 5% of the outstanding voting securities of the company or the issuer is another member of The Vanguard Group. Transactions during the period in securities of these companies were as follows:
| Current Period Transactions | ||||||||
| Sept. 30, | Proceeds | Net | Change in | Sept. 30, | ||||
| 2017 | from | Realized | Net | Capital Gain | 2018 | |||
| Market | Purchases | Securities | Gain | Unrealized | Distributions | Market | ||
| Value | at Cost | Sold | (Loss) | App. (Dep.) | Income | Received | Value | |
| ($000) | ($000) | ($000) | ($000) | ($000) | ($000) | ($000) | ($000) | |
| Vanguard Market | ||||||||
| Liquidity Fund | 3,318,618 | NA1 | NA1 | (315) | 161 | 43,872 | — | 2,087,963 |
| American Airlines | ||||||||
| Group Inc. | NA2 | 394,278 | — | — | (124,798) | 9,486 | — | 1,253,411 |
| Mattel Inc. | 304,459 | 91,125 | — | — | 14,918 | — | — | 410,502 |
| NetApp Inc. | 634,279 | 3,551 | — | — | 611,028 | 14,513 | — | 1,248,858 |
| Plantronics Inc. | 162,389 | — | — | — | 59,051 | 2,203 | — | 221,440 |
| Southwest | ||||||||
| Airlines Co. | 1,903,936 | 60,336 | — | — | 230,793 | 19,568 | — | 2,195,065 |
| United Continental | ||||||||
| Holdings Inc. | NA 2 | 511,191 | — | — | 400,018 | — | — | 1,410,309 |
| Whirlpool Corp. | NA2 | 470,978 | — | — | (150,465) | 10,718 | — | 486,575 |
| Total | 6,323,681 | (315) | 1,040,706 | 100,360 | — | 9,314,123 | ||
1 Not applicable—purchases and sales are for temporary cash investment purposes.
2 Not applicable—at September 30, 2017, the issuer was not an affiliated company of the fund.
I. Management has determined that no events or transactions occurred subsequent to September 30, 2018, that would require recognition or disclosure in these financial statements.
25
Report of Independent Registered Public Accounting Firm
To the Board of Trustees of Vanguard Chester Funds and Shareholders of Vanguard PRIMECAP Fund
Opinion on the Financial Statements
We have audited the accompanying statement of net assets and statement of assets and liabilities of Vanguard PRIMECAP Fund (one of the funds constituting Vanguard Chester Funds, referred to hereafter as the “Fund”) as of September 30, 2018, the related statement of operations for the year ended September 30, 2018, the statement of changes in net assets for each of the two years in the period ended September 30, 2018, including the related notes, and the financial highlights for each of the five years in the period ended September 30, 2018 (collectively referred to as the “financial statements”). In our opinion, the financial statements present fairly, in all material respects, the financial position of the Fund as of September 30, 2018, the results of its operations for the year then ended, the changes in its net assets for each of the two years in the period ended September 30, 2018 and the financial highlights for each of the five years in the period ended September 30, 2018 in conformity with accounting principles generally accepted in the United States of America.
Basis for Opinion
These financial statements are the responsibility of the Fund’s management. Our responsibility is to express an opinion on the Fund’s financial statements based on our audits. We are a public accounting firm registered with the Public Company Accounting Oversight Board (United States) (“PCAOB”) and are required to be independent with respect to the Fund in accordance with the U.S. federal securities laws and the applicable rules and regulations of the Securities and Exchange Commission and the PCAOB.
We conducted our audits of these financial statements in accordance with the standards of the PCAOB. Those standards require that we plan and perform the audit to obtain reasonable assurance about whether the financial statements are free of material misstatement, whether due to error or fraud.
Our audits included performing procedures to assess the risks of material misstatement of the financial statements, whether due to error or fraud, and performing procedures that respond to those risks. Such procedures included examining, on a test basis, evidence regarding the amounts and disclosures in the financial statements. Our audits also included evaluating the accounting principles used and significant estimates made by management, as well as evaluating the overall presentation of the financial statements. Our procedures included confirmation of securities owned as of September 30, 2018 by correspondence with the custodian and brokers and by agreement to the underlying ownership records of the transfer agent; when replies were not received from brokers, we performed other auditing procedures. We believe that our audits provide a reasonable basis for our opinion.
/s/PricewaterhouseCoopers LLP
Philadelphia, Pennsylvania
November 15, 2018
We have served as the auditor of one or more investment companies in The Vanguard Group of Funds since 1975.
26
Special 2018 tax information (unaudited) for Vanguard PRIMECAP Fund
This information for the fiscal year ended September 30, 2018, is included pursuant to provisions of the Internal Revenue Code.
The fund distributed $2,705,121,000 as capital gain dividends (20% rate gain distributions) to shareholders during the fiscal year.
For nonresident alien shareholders, 100% of short-term capital gain dividends distributed by the fund are qualified short-term capital gains.
The fund distributed $637,613,000 of qualified dividend income to shareholders during the fiscal year.
For corporate shareholders, 97.0% of investment income (dividend income plus short-term gains, if any) qualifies for the dividends-received deduction.
27
Your Fund’s After-Tax Returns
This table presents returns for your fund both before and after taxes. The after-tax returns are shown in two ways: (1) assuming that an investor owned the fund during the entire period and paid taxes on the fund’s distributions, and (2) assuming that an investor paid taxes on the fund’s distributions and sold all shares at the end of each period.
Calculations are based on the highest individual federal income tax and capital gains tax rates in effect at the times of the distributions and the hypothetical sales. State and local taxes were not considered. After-tax returns reflect any qualified dividend income, using actual prior-year figures and estimates for 2018. (In the example, returns after the sale of fund shares may be higher than those assuming no sale. This occurs when the sale would have produced a capital loss. The calculation assumes that the investor received a tax deduction for the loss.)
The table shows returns for Investor Shares only; returns for other share classes will differ. Please note that your actual after-tax returns will depend on your tax situation and may differ from those shown. Also note that if you own the fund in a tax-deferred account, such as an individual retirement account or a 401(k) plan, this information does not apply to you. Such accounts are not subject to current taxes.
Finally, keep in mind that a fund’s performance—whether before or after taxes—does not guarantee future results.
| Average Annual Total Returns: PRIMECAP Fund Investor Shares | |||
| Periods Ended September 30, 2018 | |||
| One | Five | Ten | |
| Year | Years | Years | |
| Returns Before Taxes | 22.86% | 17.18% | 14.04% |
| Returns After Taxes on Distributions | 21.32 | 15.70 | 13.01 |
| Returns After Taxes on Distributions and Sale of Fund Shares | 14.39 | 13.50 | 11.50 |
28
About Your Fund’s Expenses
As a shareholder of the fund, you incur ongoing costs, which include costs for portfolio management, administrative services, and shareholder reports (like this one), among others. Operating expenses, which are deducted from a fund’s gross income, directly reduce the investment return of the fund.
A fund’s expenses are expressed as a percentage of its average net assets. This figure is known as the expense ratio. The following examples are intended to help you understand the ongoing costs (in dollars) of investing in your fund and to compare these costs with those of other mutual funds. The examples are based on an investment of $1,000 made at the beginning of the period shown and held for the entire period.
The accompanying table illustrates your fund’s costs in two ways:
• Based on actual fund return. This section helps you to estimate the actual expenses that you paid over the period. The ”Ending Account Value“ shown is derived from the fund‘s actual return, and the third column shows the dollar amount that would have been paid by an investor who started with $1,000 in the fund. You may use the information here, together with the amount you invested, to estimate the expenses that you paid over the period.
To do so, simply divide your account value by $1,000 (for example, an $8,600 account value divided by $1,000 = 8.6), then multiply the result by the number given for your fund under the heading ”Expenses Paid During Period.“
• Based on hypothetical 5% yearly return. This section is intended to help you compare your fund‘s costs with those of other mutual funds. It assumes that the fund had a yearly return of 5% before expenses, but that the expense ratio is unchanged. In this case—because the return used is not the fund’s actual return—the results do not apply to your investment. The example is useful in making comparisons because the Securities and Exchange Commission requires all mutual funds to calculate expenses based on a 5% return. You can assess your fund’s costs by comparing this hypothetical example with the hypothetical examples that appear in shareholder reports of other funds.
Note that the expenses shown in the table are meant to highlight and help you compare ongoing costs only and do not reflect transaction costs incurred by the fund for buying and selling securities. Further, the expenses do not include any purchase, redemption, or account service fees described in the fund prospectus. If such fees were applied to your account, your costs would be higher. Your fund does not carry a “sales load.”
The calculations assume no shares were bought or sold during the period. Your actual costs may have been higher or lower, depending on the amount of your investment and the timing of any purchases or redemptions.
You can find more information about the fund’s expenses, including annual expense ratios, in the Financial Statements section of this report. For additional information on operating expenses and other shareholder costs, please refer to your fund’s current prospectus.
29
| Six Months Ended September 30, 2018 | |||
| Beginning | Ending | Expenses | |
| Account Value | Account Value | Paid During | |
| PRIMECAP Fund | 3/31/2018 | 9/30/2018 | Period |
| Based on Actual Fund Return | |||
| Investor Shares | $1,000.00 | $1,127.14 | $2.03 |
| Admiral Shares | 1,000.00 | 1,127.57 | 1.65 |
| Based on Hypothetical 5% Yearly Return | |||
| Investor Shares | $1,000.00 | $1,023.16 | $1.93 |
| Admiral Shares | 1,000.00 | 1,023.51 | 1.57 |
The calculations are based on expenses incurred in the most recent six-month period. The fund’s annualized six-month expense ratios for that period are 0.38% for Investor Shares and 0.31% for Admiral Shares. The dollar amounts shown as “Expenses Paid” are equal to the annualized expense ratio multiplied by the average account value over the period, multiplied by the number of days in the most recent six-month period, then divided by the number of days in the most recent 12-month period (183/365).
30
Trustees Approve Advisory Arrangement
The board of trustees of Vanguard PRIMECAP Fund has renewed the fund’s investment advisory arrangement with PRIMECAP Management Company (PRIMECAP Management). The board determined that renewing the fund’s advisory arrangement was in the best interests of the fund and its shareholders.
The board based its decision upon an evaluation of the advisor’s investment staff, portfolio management process, and performance. This evaluation included information provided to the board by Vanguard’s Portfolio Review Department, which is responsible for fund and advisory oversight and product management. The Portfolio Review Department met regularly with the advisor and made monthly presentations to the board during the fiscal year that directed the board’s focus to relevant information and topics.
The board, or an investment committee made up of board members, also received information throughout the year during advisor presentations. For each advisor presentation, the board was provided with letters and reports that included information about, among other things, the advisory firm and the advisor’s assessment of the investment environment, portfolio performance, and portfolio characteristics.
In addition, the board received monthly reports, which included a Market and Economic Report, a Fund Dashboard Monthly Summary, and a Fund Performance Report.
Prior to their meeting, the trustees were provided with a memo and material that summarized the information they received over the course of the year. They also considered the factors discussed below, among others. However, no single factor determined whether the board approved the arrangement. Rather, it was the totality of the circumstances that drove the board’s decision.
Nature, extent, and quality of services
The board reviewed the quality of the fund’s investment management services over both the short and long term, and took into account the organizational depth and stability of the advisor. The board considered that PRIMECAP Management, founded in 1983, is recognized for its long-term approach to growth equity investing. Five experienced portfolio managers are responsible for separate subportfolios, and each portfolio manager employs a fundamental, research-driven approach in seeking to identify companies with long-term growth potential that the market has yet to appreciate. The multi-counselor approach employed by PRIMECAP is designed to emphasize individual decision-making and enable the portfolio managers to invest in their highest-conviction ideas. The advisor’s fundamental research focuses on developing opinions independent from Wall Street’s consensus and maintaining a long-term horizon. PRIMECAP Management has managed the fund since its inception in 1984.
The board concluded that the advisor’s experience, stability, depth, and performance, among other factors, warranted continuation of the advisory arrangement.
Investment performance
The board considered the short- and long-term performance of the fund, including any periods of outperformance or underperformance compared with a relevant benchmark index and peer group. The board concluded that the performance was such that the advisory arrangement should continue. Information about the fund’s most recent performance can be found in the Performance Summary section of this report.
31
Cost
The board concluded that the fund’s expense ratio was well below the average expense ratio charged by funds in its peer group and that the fund’s advisory fee rate was also well below its peer-group average. Information about the fund’s expense ratio appears in the About Your Fund’s Expenses section of this report as well as in the Financial Statements section, which also includes information about the fund’s advisory fee rate.
The board did not consider the profitability of PRIMECAP Management in determining whether to approve the advisory fee, because PRIMECAP Management is independent of Vanguard and the advisory fee is the result of arm’s-length negotiations.
The benefit of economies of scale
The board concluded that the fund’s shareholders benefit from economies of scale because of breakpoints in the fund’s advisory fee schedule. The breakpoints reduce the effective rate of the fee as the fund’s assets increase.
The board will consider whether to renew the advisory arrangement again after a one-year period.
32
Glossary
30-Day SEC Yield. A fund’s 30-day SEC yield is derived using a formula specified by the U.S. Securities and Exchange Commission. Under the formula, data related to the fund’s security holdings in the previous 30 days are used to calculate the fund’s hypothetical net income for that period, which is then annualized and divided by the fund’s estimated average net assets over the calculation period. For the purposes of this calculation, a security’s income is based on its current market yield to maturity (for bonds), its actual income (for asset-backed securities), or its projected dividend yield (for stocks). Because the SEC yield represents hypothetical annualized income, it will differ—at times significantly—from the fund’s actual experience. As a result, the fund’s income distributions may be higher or lower than implied by the SEC yield.
Beta. A measure of the magnitude of a fund’s past share-price fluctuations in relation to the ups and downs of a given market index. The index is assigned a beta of 1.00. Compared with a given index, a fund with a beta of 1.20 typically would have seen its share price rise or fall by 12% when the index rose or fell by 10%. For this report, beta is based on returns over the past 36 months for both the fund and the index. Note that a fund’s beta should be reviewed in conjunction with its R-squared (see definition). The lower the R-squared, the less correlation there is between the fund and the index, and the less reliable beta is as an indicator of volatility.
Dividend Yield. Dividend income earned by stocks, expressed as a percentage of the aggregate market value (or of net asset value, for a fund). The yield is determined by dividing the amount of the annual dividends by the aggregate value (or net asset value) at the end of the period. For a fund, the dividend yield is based solely on stock holdings and does not include any income produced by other investments.
Earnings Growth Rate. The average annual rate of growth in earnings over the past five years for the stocks now in a fund.
Equity Exposure. A measure that reflects a fund’s investments in stocks and stock futures. Any holdings in short-term reserves are excluded.
Expense Ratio. A fund’s total annual operating expenses expressed as a percentage of the fund’s average net assets. The expense ratio includes management and administrative expenses, but does not include the transaction costs of buying and selling portfolio securities.
Foreign Holdings. The percentage of a fund represented by securities or depositary receipts of companies based outside the United States.
Inception Date. The date on which the assets of a fund (or one of its share classes) are first invested in accordance with the fund’s investment objective. For funds with a subscription period, the inception date is the day after that period ends. Investment performance is measured from the inception date.
Median Market Cap. An indicator of the size of companies in which a fund invests; the midpoint of market capitalization (market price x shares outstanding) of a fund’s stocks, weighted by the proportion of the fund’s assets invested in each stock. Stocks representing half of the fund’s assets have market capitalizations above the median, and the rest are below it.
Price/Book Ratio. The share price of a stock divided by its net worth, or book value, per share.
For a fund, the weighted average price/book ratio of the stocks it holds.
33
Price/Earnings Ratio. The ratio of a stock’s current price to its per-share earnings over the past year. For a fund, the weighted average P/E of the stocks it holds. P/E is an indicator of market expectations about corporate prospects; the higher the P/E, the greater the expectations for a company’s future growth.
R-Squared. A measure of how much of a fund’s past returns can be explained by the returns from the market in general, as measured by a given index. If a fund’s total returns were precisely synchronized with an index’s returns, its R-squared would be 1.00. If the fund’s returns bore no relationship to the index’s returns, its R-squared would be 0. For this report, R-squared is based on returns over the past 36 months for both the fund and the index.
Return on Equity. The annual average rate of return generated by a company during the past five years for each dollar of shareholder’s equity (net income divided by shareholder’s equity). For a fund, the weighted average return on equity for the companies whose stocks it holds.
Short-Term Reserves. The percentage of a fund invested in highly liquid, short-term securities that can be readily converted to cash.
Turnover Rate. An indication of the fund’s trading activity. Funds with high turnover rates incur higher transaction costs and may be more likely to distribute capital gains (which may be taxable to investors). The turnover rate excludes in-kind transactions, which have minimal impact on costs.
34
The Global Industry Classification Standard (“GICS”) was developed by and is the exclusive property and a service mark of MSCI Inc. (“MSCI”) and Standard and Poor’s, a division of McGraw-Hill Companies, Inc. (“S&P”), and is licensed for use by Vanguard. Neither MSCI, S&P nor any third party involved in making or compiling the GICS or any GICS classification makes any express or implied warranties or representations with respect to such standard or classification (or the results to be obtained by the use thereof), and all such parties hereby expressly disclaim all warranties of originality, accuracy, completeness, merchantability or fitness for a particular purpose with respect to any such standard or classification. Without limiting any of the foregoing, in no event shall MSCI, S&P, any of its affiliates or any third party involved in making or compiling the GICS or any GICS classification have any liability for any direct, indirect, special, punitive, consequential or any other damages (including lost profits) even if notified of the possibility of such damages.
35
This page intentionally left blank.
This page intentionally left blank.
This page intentionally left blank.
The People Who Govern Your Fund
The trustees of your mutual fund are there to see that the fund is operated and managed in your best interests since, as a shareholder, you are a part owner of the fund. Your fund’s trustees also serve on the board of directors of The Vanguard Group, Inc., which is owned by the Vanguard funds and provides services to them on an at-cost basis.
A majority of Vanguard’s board members are independent, meaning that they have no affiliation with Vanguard or the funds they oversee, apart from the sizable personal investments they have made as private individuals. The independent board members have distinguished backgrounds in business, academia, and public service. Each of the trustees and executive officers oversees 211 Vanguard funds.
Information for each trustee and executive officer of the fund appears below. The mailing address of the trustees and officers is P.O. Box 876, Valley Forge, PA 19482. More information about the trustees is in the Statement of Additional Information, which can be obtained, without charge, by contacting Vanguard at 800-662-7447, or online at vanguard.com.
Interested Trustees1
F. William McNabb III
Born in 1957. Trustee since July 2009. Principal occupation(s) during the past five years and other experience: chairman of the board (January 2010–present) of Vanguard and of each of the investment companies served by Vanguard, trustee (2009–present) of each of the investment companies served by Vanguard, and director (2008–present) of Vanguard. Chief executive officer and president (2008–2017) of Vanguard and each of the investment companies served by Vanguard, managing director (1995–2008) of Vanguard, and director (1997–2018) of Vanguard Marketing Corporation. Director (2018–present) of UnitedHealth Group.
Mortimer J. Buckley
Born in 1969. Trustee since January 2018. Principal occupation(s) during the past five years and other experience: chief executive officer (January 2018–present) of Vanguard; chief executive officer, president, and trustee (January 2018–present) of each of the investment companies served by Vanguard; president and director (2017–present) of Vanguard; and president (February 2018–present) of Vanguard Marketing Corporation. Chief investment officer (2013–2017), managing director (2002–2017), head of the Retail Investor Group (2006–2012), and chief information officer (2001–2006) of Vanguard. Chairman of the board (2011–2017) of the Children’s Hospital of Philadelphia.
Independent Trustees
Emerson U. Fullwood
Born in 1948. Trustee since January 2008. Principal occupation(s) during the past five years and other experience: executive chief staff and marketing officer for North America and corporate vice president (retired 2008) of Xerox Corporation (document management products and services). Former president of the Worldwide Channels Group, Latin America, and Worldwide Customer Service and executive chief staff officer of Developing Markets of Xerox. Executive in residence and 2009–2010 Distinguished Minett Professor at the Rochester Institute of Technology. Lead director of SPX FLOW, Inc. (multi-industry manufacturing). Director of the University of Rochester Medical Center, the Monroe Community College Foundation, the United Way of Rochester, North Carolina A&T University, and Roberts Wesleyan College. Trustee of the University of Rochester.
Amy Gutmann
Born in 1949. Trustee since June 2006. Principal occupation(s) during the past five years and other experience: president (2004–present) of the University of Pennsylvania. Christopher H. Browne Distinguished Professor of Political Science, School of Arts and Sciences, and professor of communication, Annenberg School for Communication, with secondary faculty appointments in the Department of Philosophy, School of Arts and Sciences, and at the Graduate School of Education, University of Pennsylvania. Trustee of the National Constitution Center.
1 Mr. McNabb and Mr. Buckley are considered “interested persons,” as defined in the Investment Company Act of 1940, because they are officers of the Vanguard funds.
JoAnn Heffernan Heisen
Born in 1950. Trustee since July 1998. Principal occupation(s) during the past five years and other experience: corporate vice president of Johnson & Johnson (pharmaceuticals/medical devices/consumer products) and member of its executive committee (1997–2008). Chief global diversity officer (retired 2008), vice president and chief information officer (1997–2006), controller (1995–1997), treasurer (1991–1995), and assistant treasurer (1989–1991) of Johnson & Johnson. Director of Skytop Lodge Corporation (hotels) and the Robert Wood Johnson Foundation. Member of the advisory board of the Institute for Women’s Leadership at Rutgers University.
F. Joseph Loughrey
Born in 1949. Trustee since October 2009. Principal occupation(s) during the past five years and other experience: president and chief operating officer (retired 2009) and vice chairman of the board (2008–2009) of Cummins Inc. (industrial machinery). Chairman of the board of Hillenbrand, Inc. (specialized consumer services), Oxfam America, and the Lumina Foundation for Education. Director of the V Foundation for Cancer Research. Member of the advisory council for the College of Arts and Letters and chair of the advisory board to the Kellogg Institute for International Studies, both at the University of Notre Dame.
Mark Loughridge
Born in 1953. Trustee since March 2012. Principal occupation(s) during the past five years and other experience: senior vice president and chief financial officer (retired 2013) of IBM (information technology services). Fiduciary member of IBM’s Retirement Plan Committee (2004–2013), senior vice president and general manager (2002–2004) of IBM Global Financing, vice president and controller (1998–2002) of IBM, and a variety of other prior management roles at IBM. Member of the Council on Chicago Booth.
Scott C. Malpass
Born in 1962. Trustee since March 2012. Principal occupation(s) during the past five years and other experience: chief investment officer (1989–present) and vice president (1996–present) of the University of Notre Dame. Assistant professor of finance at the Mendoza College of Business, University of Notre Dame, and member of the Notre Dame 403(b) Investment Committee. Chairman of the board of TIFF Advisory Services, Inc. Member of the board of Catholic Investment Services, Inc. (investment advisors), the board of advisors for Spruceview Capital Partners, and the board of superintendence of the Institute for the Works of Religion.
Deanna Mulligan
Born in 1963. Trustee since January 2018. Principal occupation(s) during the past five years and other experience: president (2010–present) and chief executive officer (2011–present) of The Guardian Life Insurance Company of America. Chief operating officer (2010–2011) and executive vice president (2008–2010) of Individual Life and Disability of The Guardian Life Insurance Company of America. Member of the board of The Guardian Life Insurance Company of America, the American Council of Life Insurers, the Partnership for New York City (business leadership), and the Committee Encouraging Corporate Philanthropy. Trustee of the Economic Club of New York and the Bruce Museum (arts and science). Member of the Advisory Council for the Stanford Graduate School of Business.
André F. Perold
Born in 1952. Trustee since December 2004. Principal occupation(s) during the past five years and other experience: George Gund Professor of Finance and Banking, Emeritus at the Harvard Business School (retired 2011). Chief investment officer and co-managing partner of HighVista Strategies LLC (private investment firm). Overseer of the Museum of Fine Arts Boston.
Sarah Bloom Raskin
Born in 1961. Trustee since January 2018. Principal occupation(s) during the past five years and other experience: deputy secretary (2014–2017) of the United States Department of the Treasury. Governor (2010–2014) of the Federal Reserve Board. Commissioner (2007–2010) of financial regulation for the State of Maryland. Member of the board of directors (2012–2014) of Neighborhood Reinvestment Corporation. Director of i(x) Investments, LLC.
Peter F. Volanakis
Born in 1955. Trustee since July 2009. Principal occupation(s) during the past five years and other experience: president and chief operating officer (retired 2010) of Corning Incorporated (communications equipment) and director of Corning Incorporated (2000–2010) and Dow Corning (2001–2010). Director (2012) of SPX Corporation (multi-industry manufacturing). Overseer of the Amos Tuck School of Business Administration, Dartmouth College (2001–2013). Chairman of the board of trustees of Colby-Sawyer College. Member of the Board of Hypertherm Inc. (industrial cutting systems, software, and consumables).
Executive Officers
Glenn Booraem
Born in 1967. Principal occupation(s) during the past five years and other experience: principal of Vanguard. Investment stewardship officer (2017–present), treasurer (2015–2017), controller (2010–2015), and assistant controller (2001–2010) of each of the investment companies served by Vanguard.
Christine M. Buchanan
Born in 1970. Principal occupation(s) during the past five years and other experience: principal of Vanguard and global head of Fund Administration at Vanguard. Treasurer (2017–present) of each of the investment companies served by Vanguard. Partner (2005–2017) at KPMG LLP (audit, tax, and advisory services).
Brian Dvorak
Born in 1973. Principal occupation(s) during the past five years and other experience: principal of Vanguard. Chief compliance officer (2017–present) of Vanguard and each of the investment companies served by Vanguard. Assistant vice president (2017–present) of Vanguard Marketing Corporation. Vice president and director of Enterprise Risk Management (2011–2013) at Oppenheimer Funds, Inc.
Thomas J. Higgins
Born in 1957. Principal occupation(s) during the past five years and other experience: principal of Vanguard. Chief financial officer (2008–present) and treasurer (1998–2008) of each of the investment companies served by Vanguard.
Peter Mahoney
Born in 1974. Principal occupation(s) during the past five years and other experience: principal of Vanguard. Controller (2015–present) of each of the investment companies served by Vanguard. Head of International Fund Services (2008–2014) at Vanguard.
Anne E. Robinson
Born in 1970. Principal occupation(s) during the past five years and other experience: general counsel (2016–present) of Vanguard. Secretary (2016–present) of Vanguard and of each of the investment companies served by Vanguard. Managing director (2016–present) of Vanguard. Director and senior vice president (2016–2018) of Vanguard Marketing Corporation. Managing director and general counsel of Global Cards and Consumer Services (2014–2016) at Citigroup. Counsel (2003–2014) at American Express.
Michael Rollings
Born in 1963. Principal occupation(s) during the past five years and other experience: finance director (2017–present) and treasurer (2017) of each of the investment companies served by Vanguard. Managing director (2016–present) of Vanguard. Chief financial officer (2016–present) of Vanguard. Director (2016–present) of Vanguard Marketing Corporation. Executive vice president and chief financial officer (2006–2016) of MassMutual Financial Group.
| Vanguard Senior Management Team | |
| Joseph Brennan | Chris D. McIsaac |
| Mortimer J. Buckley | James M. Norris |
| Gregory Davis | Thomas M. Rampulla |
| John James | Karin A. Risi |
| Martha G. King | Anne E. Robinson |
| John T. Marcante | Michael Rollings |
| Chairman Emeritus and Senior Advisor | |
| John J. Brennan | |
| Chairman, 1996–2009 | |
| Chief Executive Officer and President, 1996–2008 | |
| Founder | |
| John C. Bogle | |
| Chairman and Chief Executive Officer, 1974–1996 | |
 | |
P.O. Box 2600 | |
Connect with Vanguard® > vanguard.com | |
| Fund Information > 800-662-7447 | Source for Bloomberg Barclays indexes: Bloomberg |
| Direct Investor Account Services > 800-662-2739 | Index Services Limited. Copyright 2018, Bloomberg. All |
| rights reserved. | |
| Institutional Investor Services > 800-523-1036 | |
| Text Telephone for People | |
| Who Are Deaf or Hard of Hearing > 800-749-7273 | |
| This material may be used in conjunction | |
| with the offering of shares of any Vanguard | |
| fund only if preceded or accompanied by | |
| the fund’s current prospectus. | |
| All comparative mutual fund data are from Lipper, a | |
| Thomson Reuters Company, or Morningstar, Inc., unless | |
| otherwise noted. | |
| You can obtain a free copy of Vanguard’s proxy voting | |
| guidelines by visiting vanguard.com/proxyreporting or by | |
| calling Vanguard at 800-662-2739. The guidelines are | |
| also available from the SEC’s website, sec.gov. In | |
| addition, you may obtain a free report on how your fund | |
| voted the proxies for securities it owned during the 12 | |
| months ended June 30. To get the report, visit either | |
| vanguard.com/proxyreporting or sec.gov. | |
| You can review and copy information about your fund at | |
| the SEC’s Public Reference Room in Washington, D.C. To | |
| find out more about this public service, call the SEC at | |
| 202-551-8090. Information about your fund is also | |
| available on the SEC’s website, and you can receive | |
| copies of this information, for a fee, by sending a | |
| request in either of two ways: via email addressed to | |
| publicinfo@sec.gov or via regular mail addressed to the | |
| Public Reference Section, Securities and Exchange | |
| Commission, Washington, DC 20549-1520. | |
| © 2018 The Vanguard Group, Inc. | |
| All rights reserved. | |
| Vanguard Marketing Corporation, Distributor. | |
| Q590 112018 | |
| Annual Report | September 30, 2018 |
| Vanguard Target Retirement Funds |
| Vanguard Target Retirement Income Fund |
| Vanguard Target Retirement 2015 Fund |
| Vanguard Target Retirement 2020 Fund |
| Vanguard Target Retirement 2025 Fund |
| Vanguard Target Retirement 2030 Fund |
| Vanguard Target Retirement 2035 Fund |
Vanguard’s Principles for Investing Success
We want to give you the best chance of investment success. These
principles, grounded in Vanguard’s research and experience, can put you on
the right path.
Goals. Create clear, appropriate investment goals.
Balance. Develop a suitable asset allocation using broadly diversified funds.
Cost. Minimize cost.
Discipline. Maintain perspective and long-term discipline.
A single theme unites these principles: Focus on the things you can control.
We believe there is no wiser course for any investor.
| Contents | |
| Your Fund’s Performance at a Glance. | 1 |
| CEO’s Perspective. | 4 |
| Target Retirement Income Fund. | 6 |
| Target Retirement 2015 Fund. | 18 |
| Target Retirement 2020 Fund. | 30 |
| Target Retirement 2025 Fund. | 42 |
| Target Retirement 2030 Fund. | 54 |
| Target Retirement 2035 Fund. | 66 |
| Your Fund’s After-Tax Returns. | 81 |
| About Your Fund’s Expenses. | 83 |
| Glossary. | 85 |
Please note: The opinions expressed in this report are just that—informed opinions. They should not be considered promises or advice. Also, please keep in mind that the information and opinions cover the period through the date on the front of this report. Of course, the risks of investing in your fund are spelled out in the prospectus.
See the Glossary for definitions of investment terms used in this report.
Your Fund’s Performance at a Glance
• For the 12 months ended September 30, 2018, the six Vanguard Target Retirement Funds covered in this report recorded returns ranging from 3.31% for the Target Retirement Income Fund to 8.51% for the Target Retirement 2035 Fund. (The funds with target dates of 2040 through 2065 are covered in a separate report.) The funds with a greater allocation to stocks performed best.
• Each fund posted returns that were in line with those of its composite benchmark after expenses. Each fund surpassed the average returns of its peers.
• Vanguard Target Retirement Funds are designed to reach an allocation of 70% bonds and 30% stocks within seven years after their target dates.
• For the ten years ended September 30, the funds’ average annual returns ranged from 5.67% for the Target Retirement Income Fund to 8.78% for the Target Retirement 2035 Fund.
| Total Returns: Fiscal Year Ended September 30, 2018 | |
| Total | |
| Returns | |
| Vanguard Target Retirement Income Fund | 3.31% |
| Target Income Composite Index | 3.47 |
| Mixed-Asset Target Today Funds Average | 2.82 |
| Mixed-Asset Target Today Funds Average: Derived from data provided by Lipper, a Thomson Reuters Company. | |
| Vanguard Target Retirement 2015 Fund | 4.54% |
| Target 2015 Composite Index | 4.77 |
| Mixed-Asset Target 2015 Funds Average | 4.10 |
| Mixed-Asset Target 2015 Funds Average: Derived from data provided by Lipper, a Thomson Reuters Company. | |
| Vanguard Target Retirement 2020 Fund | 5.87% |
| Target 2020 Composite Index | 6.11 |
| Mixed-Asset Target 2020 Funds Average | 4.36 |
| Mixed-Asset Target 2020 Funds Average: Derived from data provided by Lipper, a Thomson Reuters Company. | |
| Vanguard Target Retirement 2025 Fund | 6.79% |
| Target 2025 Composite Index | 7.08 |
| Mixed-Asset Target 2025 Funds Average | 5.46 |
| Mixed-Asset Target 2025 Funds Average: Derived from data provided by Lipper, a Thomson Reuters Company. | |
1
| Total | |
| Returns | |
| Vanguard Target Retirement 2030 Fund | 7.65% |
| Target 2030 Composite Index | 7.94 |
| Mixed-Asset Target 2030 Funds Average | 6.64 |
| Mixed-Asset Target 2030 Funds Average: Derived from data provided by Lipper, a Thomson Reuters Company. | |
| Vanguard Target Retirement 2035 Fund | 8.51% |
| Target 2035 Composite Index | 8.80 |
| Mixed-Asset Target 2035 Funds Average | 7.90 |
Mixed-Asset Target 2035 Funds Average: Derived from data provided by Lipper, a Thomson Reuters Company. For a benchmark description, see the Glossary.
Investments in Target Retirement Funds are subject to the risks of their underlying funds. The year in the fund name refers to the approximate year (the target date) when an investor in the fund would retire and leave the work force. The fund will gradually shift its emphasis from more aggressive investments to more conservative ones based on its target date. An investment in a Target Retirement Fund is not guaranteed at any time, including on or after the target date.
| Total Returns: Ten Years Ended September 30, 2018 | |
| Average | |
| Annual Return | |
| Target Retirement Income Fund | 5.67% |
| Target Income Composite Index | 5.78 |
| Spliced Mixed-Asset Target Today Funds Average | 5.00 |
| Spliced Mixed-Asset Target Today Funds Average: Derived from data provided by Lipper, a Thomson Reuters Company. | |
| Target Retirement 2015 Fund | 6.91% |
| Target 2015 Composite Index | 7.00 |
| Mixed-Asset Target 2015 Funds Average | 5.63 |
| Mixed-Asset Target 2015 Funds Average: Derived from data provided by Lipper, a Thomson Reuters Company. | |
| Target Retirement 2020 Fund | 7.56% |
| Target 2020 Composite Index | 7.75 |
| Mixed-Asset Target 2020 Funds Average | 6.07 |
| Mixed-Asset Target 2020 Funds Average: Derived from data provided by Lipper, a Thomson Reuters Company. | |
| Target Retirement 2025 Fund | 7.98% |
| Target 2025 Composite Index | 8.18 |
| Mixed-Asset Target 2025 Funds Average | 6.85 |
| Mixed-Asset Target 2025 Funds Average: Derived from data provided by Lipper, a Thomson Reuters Company. | |
| Target Retirement 2030 Fund | 8.36% |
| Target 2030 Composite Index | 8.57 |
| Mixed-Asset Target 2030 Funds Average | 7.18 |
| Mixed-Asset Target 2030 Funds Average: Derived from data provided by Lipper, a Thomson Reuters Company. |
2
| Average | |
| Annual Return | |
| Target Retirement 2035 Fund | 8.78% |
| Target 2035 Composite Index | 8.99 |
| Mixed-Asset Target 2035 Funds Average | 7.92 |
| Mixed-Asset Target 2035 Funds Average: Derived from data provided by Lipper, a Thomson Reuters Company. |
For a benchmark description, see the Glossary.
The figures shown represent past performance, which is not a guarantee of future results. (Current performance may be lower or higher than the performance data cited. For performance data current to the most recent month-end, visit our website at vanguard.com/performance.) Note, too, that both investment returns and principal value can fluctuate widely, so an investor’s shares, when sold, could be worth more or less than their original cost.
| Expense Ratios | ||
| Your Fund Compared With Its Peer Group | ||
| Acquired Fund Fees | Peer Group | |
| and Expenses | Average | |
| Target Retirement Income Fund | 0.13% | 0.42% |
| Target Retirement 2015 Fund | 0.13 | 0.36 |
| Target Retirement 2020 Fund | 0.13 | 0.42 |
| Target Retirement 2025 Fund | 0.14 | 0.40 |
| Target Retirement 2030 Fund | 0.14 | 0.43 |
| Target Retirement 2035 Fund | 0.14 | 0.40 |
The fund expense figures shown—drawn from the prospectus dated January 25, 2018—represent an estimate of the weighted average of the expense ratios and any transaction fees charged by the underlying mutual funds (the ”acquired” funds) in which the Target Retirement Funds invest. The Target Retirement Funds do not charge any expenses or fees of their own. For the fiscal year ended September 30, 2018, the acquired fund fees and expenses were 0.12% for the Income Fund, 0.13% for the 2015 Fund, 0.13% for the 2020 Fund, 0.13% for the 2025 Fund, 0.14% for the 2030 Fund, and 0.14% for the 2035 Fund. Peer-group expense ratios are derived from data provided by Lipper, a Thomson Reuters Company, and capture information through year-end 2017.
Peer groups: For the Income Fund, Mixed-Asset Target Today Funds; for the 2015 Fund, Mixed-Asset Target 2015 Funds; for the 2020 Fund, Mixed-Asset Target 2020 Funds; for the 2025 Fund, Mixed-Asset Target 2025 Funds; for the 2030 Fund, Mixed-Asset Target 2030 Funds; and for the 2035 Fund, Mixed-Asset Target 2035 Funds.
3
CEO’s Perspective

Tim Buckley
President and Chief Executive Officer
Dear Shareholder,
Over the years, I’ve found that prudent investors exhibit a common trait: discipline. No matter how the markets move or what new investing fad hits the headlines, those who stay focused on their goals and tune out the noise are set up for long-term success.
The prime gateway to investing is saving, and you don’t usually become a saver without a healthy dose of discipline. Savers make the decision to sock away part of their income, which means spending less and delaying gratification, no matter how difficult that may be.
Of course, disciplined investing extends beyond diligent saving. The financial markets, in the short term especially, are unpredictable; I have yet to meet the investor who can time them perfectly. It takes discipline to resist the urge to go all-in when markets are frothy or to retreat when things look bleak.
Staying put with your investments is one strategy for handling volatility. Another, rebalancing, requires even more discipline because it means steering your money away from strong performers and toward poorer performers.
Patience—a form of discipline—is also the friend of long-term investors. Higher returns are the potential reward for weathering the market’s turbulence and uncertainty.
4
We have been enjoying one of the longest bull markets in history, but it won’t continue forever. Prepare yourself now for how you will react when volatility comes back. Don’t panic. Don’t chase returns or look for answers outside the asset classes you trust. And be sure to rebalance periodically, even when there’s turmoil.
Whether you’re a master of self-control, get a boost from technology, or work with a professional advisor, know that discipline is necessary to get the most out of your investment portfolio. And know that Vanguard is with you for the entire ride.
Thank you for your continued loyalty.
Sincerely,

Mortimer J. Buckley
President and Chief Executive Officer
October 18, 2018
| Market Barometer | |||
| Average Annual Total Returns | |||
| Periods Ended September 30, 2018 | |||
| One Year | Three Years | Five Years | |
| Stocks | |||
| Russell 1000 Index (Large-caps) | 17.76% | 17.07% | 13.67% |
| Russell 2000 Index (Small-caps) | 15.24 | 17.12 | 11.07 |
| Russell 3000 Index (Broad U.S. market) | 17.58 | 17.07 | 13.46 |
| FTSE All-World ex US Index (International) | 2.13 | 10.18 | 4.51 |
| Bonds | |||
| Bloomberg Barclays U. S. Aggregate Bond Index | |||
| (Broad taxable market) | -1.22% | 1.31% | 2.16% |
| Bloomberg Barclays Municipal Bond Index | |||
| (Broad tax-exempt market) | 0.35 | 2.24 | 3.54 |
| FTSE Three-Month U.S. Treasury Bill Index | 1.57 | 0.80 | 0.48 |
| CPI | |||
| Consumer Price Index | 2.28% | 1.99% | 1.52% |
5
Target Retirement Income Fund
Fund Profile
As of September 30, 2018
| Total Fund Characteristics | |
| Ticker Symbol | VTINX |
| 30-Day SEC Yield | 2.34% |
| Acquired Fund Fees and Expenses1 | 0.13% |
| Allocation to Underlying Vanguard Funds | |
| Vanguard Total Bond Market II Index Fund | |
| Investor Shares | 37.3% |
| Vanguard Total Stock Market Index Fund | |
| Investor Shares | 18.1 |
| Vanguard Short-Term Inflation-Protected | |
| Securities Index Fund Investor Shares | 16.8 |
| Vanguard Total International Bond Index | |
| Fund Investor Shares | 15.9 |
| Vanguard Total International Stock Index | |
| Fund Investor Shares | 11.9 |
| Total Fund Volatility Measures | ||
| Bloomberg | ||
| Target | Barclays US | |
| Income | Aggregate | |
| Composite | Bond | |
| Index | Index | |
| R-Squared | 0.99 | 0.22 |
| Beta | 0.99 | 0.53 |
These measures show the degree and timing of the fund’s fluctuations compared with the indexes over 36 months.
Fund Asset Allocation
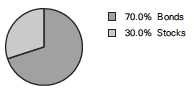
1 This figure—drawn from the prospectus dated January 25, 2018—represents an estimate of the weighted average of the expense ratios and any transaction fees charged by the underlying mutual funds (the ”acquired” funds) in which the Target Retirement Income Fund invests. The fund does not charge any expenses or fees of its own. For the fiscal year ended September 30, 2018, the acquired fund fees and expenses were 0.12%.
6
Target Retirement Income Fund
Performance Summary
All of the returns in this report represent past performance, which is not a guarantee of future results that may be achieved by the fund. (Current performance may be lower or higher than the performance data cited. For performance data current to the most recent month-end, visit our website at vanguard.com/performance.) Note, too, that both investment returns and principal value can fluctuate widely, so an investor’s shares, when sold, could be worth more or less than their original cost. The returns shown do not reflect taxes that a shareholder would pay on fund distributions or on the sale of fund shares.
Cumulative Performance: September 30, 2008, Through September 30, 2018
Initial Investment of $10,000
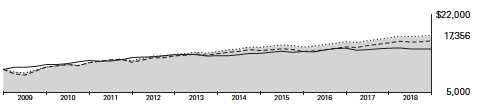
| Average Annual Total Returns | ||||
| Periods Ended September 30, 2018 | ||||
| Final Value | ||||
| One | Five | Ten | of a $10,000 | |
| Year | Years | Years | Investment | |
| Target Retirement Income Fund* | 3.31% | 4.52% | 5.67% | $17,356 |
| Target Income Composite Index | 3.47 | 4.72 | 5.78 | 17,534 |
| Spliced Mixed-Asset Target Today | ||||
| Funds Average | 2.82 | 3.89 | 5.00 | 16,289 |
| Bloomberg Barclays U.S. Aggregate | ||||
| Bond Index | -1.22 | 2.16 | 3.77 | 14,482 |
For a benchmark description, see the Glossary.
Spliced Mixed-Asset Target Today Funds Average: Derived from data provided by Lipper, a Thomson Reuters Company.
See Financial Highlights for dividend and capital gains information.
7
Target Retirement Income Fund
Fiscal-Year Total Returns (%): September 30, 2008, Through September 30, 2018
8
Target Retirement Income Fund
Financial Statements
Statement of Net Assets
As of September 30, 2018
The fund reports a complete list of its holdings in regulatory filings four times in each fiscal year, at the quarter-ends. For the second and fourth fiscal quarters, the lists appear in the fund’s semiannual and annual reports to shareholders. For the first and third fiscal quarters, the fund files the lists with the Securities and Exchange Commission on Form N-Q. Shareholders can look up the fund’s Forms N-Q on the SEC’s website at sec.gov. Forms N-Q may also be reviewed and copied at the SEC’s Public Reference Room (see the back cover of this report for further information).
| Market | ||
| Value• | ||
| Shares | ($000) | |
| Investment Companies (100.0%) | ||
| U.S. Stock Fund (18.1%) | ||
| Vanguard Total Stock Market Index Fund Investor Shares | 41,363,957 | 3,012,123 |
| International Stock Fund (11.9%) | ||
| Vanguard Total International Stock Index Fund Investor Shares | 113,619,304 | 1,972,431 |
| U.S. Bond Funds (54.1%) | ||
| 1 Vanguard Total Bond Market II Index Fund Investor Shares | 599,174,369 | 6,189,471 |
| Vanguard Short-Term Inflation-Protected Securities Index Fund | ||
| Investor Shares | 115,175,784 | 2,790,710 |
| 8,980,181 | ||
| International Bond Fund (15.9%) | ||
| Vanguard Total International Bond Index Fund Investor Shares | 243,256,366 | 2,646,629 |
| Total Investment Companies (Cost $14,163,862) | 16,611,364 | |
| Temporary Cash Investment (0.0%) | ||
| Money Market Fund (0.0%) | ||
| 1 Vanguard Market Liquidity Fund, 2.209% (Cost $2) | 17 | 2 |
| Total Investments (100.0%) (Cost $14,163,864) | 16,611,366 | |
| Other Assets and Liabilities (0.0%) | ||
| Other Assets | 42,619 | |
| Liabilities | (40,893) | |
| 1,726 | ||
| Net Assets (100%) | ||
| Applicable to 1,229,101,098 outstanding $.001 par value shares of | ||
| beneficial interest (unlimited authorization) | 16,613,092 | |
| Net Asset Value Per Share | $13.52 | |
9
| Target Retirement Income Fund | |
| Amount | |
| ($000) | |
| Statement of Assets and Liabilities | |
| Assets | |
| Investments in Securities, at Value—Affiliated Funds | 16,611,366 |
| Receivables for Investment Securities Sold | 15,379 |
| Receivables for Accrued Income | 16,592 |
| Receivables for Capital Shares Issued | 10,648 |
| Total Assets | 16,653,985 |
| Liabilities | |
| Payables for Investment Securities Purchased | 16,590 |
| Payables for Capital Shares Redeemed | 22,696 |
| Other Liabilities | 1,607 |
| Total Liabilities | 40,893 |
| Net Assets | 16,613,092 |
| At September 30, 2018, net assets consisted of: | |
| Amount | |
| ($000) | |
| Paid-in Capital | 13,918,275 |
| Undistributed Net Investment Income | 16,978 |
| Accumulated Net Realized Gains | 230,337 |
| Unrealized Appreciation (Depreciation) | 2,447,502 |
| Net Assets | 16,613,092 |
• See Note A in Notes to Financial Statements.
1 Affiliated fund available only to Vanguard funds and certain trusts and accounts managed by Vanguard. Rate shown for Vanguard
Market Liquidity Fund is the 7-day yield.
See accompanying Notes, which are an integral part of the Financial Statements.
10
| Target Retirement Income Fund | |
| Statement of Operations | |
| Year Ended | |
| September 30, 2018 | |
| ($000) | |
| Investment Income | |
| Income | |
| Income Distributions Received from Affiliated Funds | 413,947 |
| Net Investment Income—Note B | 413,947 |
| Realized Net Gain (Loss) | |
| Capital Gain Distributions Received from Affiliated Funds | 1,393 |
| Affiliated Funds Sold | 259,903 |
| Realized Net Gain (Loss) | 261,296 |
| Change in Unrealized Appreciation (Depreciation) from Affiliated Funds | (139,267) |
| Net Increase (Decrease) in Net Assets Resulting from Operations | 535,976 |
See accompanying Notes, which are an integral part of the Financial Statements.
11
| Target Retirement Income Fund | ||
| Statement of Changes in Net Assets | ||
| Year Ended September 30, | ||
| 2018 | 2017 | |
| ($000) | ($000) | |
| Increase (Decrease) in Net Assets | ||
| Operations | ||
| Net Investment Income | 413,947 | 227,170 |
| Realized Net Gain (Loss) | 261,296 | 87,493 |
| Change in Unrealized Appreciation (Depreciation) | (139,267) | 303,251 |
| Net Increase (Decrease) in Net Assets Resulting from Operations | 535,976 | 617,914 |
| Distributions | ||
| Net Investment Income | (403,170) | (230,482) |
| Realized Capital Gain1 | (68,416) | (34,498) |
| Total Distributions | (471,586) | (264,980) |
| Capital Share Transactions | ||
| Issued | 2,962,286 | 3,494,664 |
| Issued in Connection with Acquisition of Vanguard Target | ||
| Retirement 2010 Fund—Note F | — | 4,889,025 |
| Issued in Lieu of Cash Distributions | 451,985 | 252,814 |
| Redeemed | (3,510,565) | (3,134,272) |
| Net Increase (Decrease) from Capital Share Transactions | (96,294) | 5,502,231 |
| Total Increase (Decrease) | (31,904) | 5,855,165 |
| Net Assets | ||
| Beginning of Period | 16,644,996 | 10,789,831 |
| End of Period2 | 16,613,092 | 16,644,996 |
1 Includes fiscal 2018 and 2017 short-term gain distributions totaling $7,271,000 and $3,515,000, respectively. Short-term gain
distributions are treated as ordinary income dividends for tax purposes.
2 Net Assets—End of Period includes undistributed (overdistributed) net investment income of $16,978,000 and $6,201,000.
See accompanying Notes, which are an integral part of the Financial Statements.
12
| Target Retirement Income Fund | |||||
| Financial Highlights | |||||
| For a Share Outstanding | Year Ended September 30, | ||||
| Throughout Each Period | 2018 | 2017 | 2016 | 2015 | 2014 |
| Net Asset Value, Beginning of Period | $13.46 | $13.08 | $12.59 | $12.84 | $12.46 |
| Investment Operations | |||||
| Net Investment Income | . 3341 | .2501 | .229 | .238 | .220 |
| Capital Gain Distributions Received | .0011 | .0041 | .007 | .015 | .002 |
| Net Realized and Unrealized Gain (Loss) | |||||
| on Investments | .107 | .422 | .692 | (.225) | .572 |
| Total from Investment Operations | .442 | .676 | .928 | .028 | .794 |
| Distributions | |||||
| Dividends from Net Investment Income | (.327) | (.254) | (.227) | (.236) | (.218) |
| Distributions from Realized Capital Gains | (.055) | (.042) | (.211) | (.042) | (.196) |
| Total Distributions | (.382) | (.296) | (.438) | (.278) | (.414) |
| Net Asset Value, End of Period | $13.52 | $13.46 | $13.08 | $12.59 | $12.84 |
| Total Return2 | 3.31% | 5.26% | 7.54% | 0.18% | 6.47% |
| Ratios/Supplemental Data | |||||
| Net Assets, End of Period (Millions) | $16,613 | $16,645 | $10,790 | $10,633 | $11,215 |
| Ratio of Total Expenses to Average Net Assets | — | — | — | — | — |
| Acquired Fund Fees and Expenses | 0.12% | 0.13% | 0.13% | 0.14% | 0.16% |
| Ratio of Net Investment Income to | |||||
| Average Net Assets | 2.47% | 1.90% | 1.78% | 1.83% | 1.74% |
| Portfolio Turnover Rate | 6% | 8% | 11% | 14% | 6% |
1 Calculated based on average shares outstanding.
2 Total returns do not include account service fees that may have applied in the periods shown. Fund prospectuses provide information
about any applicable account service fees.
See accompanying Notes, which are an integral part of the Financial Statements.
13
Target Retirement Income Fund
Notes to Financial Statements
Vanguard Target Retirement Income Fund is registered under the Investment Company Act of 1940 as an open-end investment company, or mutual fund. The fund follows a balanced investment strategy by investing in selected Vanguard funds to achieve its targeted allocation of assets to U.S. and international stocks, and U.S. and international bonds. Financial statements and other information about each underlying fund are available on vanguard.com.
A. The following significant accounting policies conform to generally accepted accounting principles for U.S. investment companies. The fund consistently follows such policies in preparing its financial statements.
1. Security Valuation: Investments are valued at the net asset value of each underlying Vanguard fund determined as of the close of the New York Stock Exchange (generally 4 p.m., Eastern time) on the valuation date.
2. Federal Income Taxes: The fund intends to continue to qualify as a regulated investment company and distribute all of its taxable income. Management has analyzed the fund’s tax positions taken for all open federal income tax years (September 30, 2015–2018), and has concluded that no provision for federal income tax is required in the fund’s financial statements.
3. Distributions: Distributions to shareholders are recorded on the ex-dividend date. Distributions are determined on a tax basis and may differ from net investment income and realized capital gains for financial reporting purposes.
4. Credit Facility: The fund and certain other funds managed by The Vanguard Group (“Vanguard”) participate in a $3.1 billion committed credit facility provided by a syndicate of lenders pursuant to a credit agreement that may be renewed annually; each fund is individually liable for its borrowings, if any, under the credit facility. Borrowings may be utilized for temporary and emergency purposes, and are subject to the fund’s regulatory and contractual borrowing restrictions. The participating funds are charged administrative fees and an annual commitment fee of 0.10% of the undrawn amount of the facility; these fees are allocated to the funds based on a method approved by the fund’s board of trustees and borne by the funds in which the fund invests (see Note B). Any borrowings under this facility bear interest at a rate based upon the higher of the one-month London Interbank Offered Rate, federal funds effective rate, or overnight bank funding rate plus an agreed-upon spread.
The fund had no borrowings outstanding at September 30, 2018, or at any time during the period then ended.
5. Other: Income and capital gain distributions received are recorded on the ex-dividend date. Security transactions are accounted for on the date securities are bought or sold. Costs used to determine realized gains (losses) on the sale of investment securities are those of the specific securities sold.
B. In accordance with the terms of a Funds’ Service Agreement (the “FSA”) between Vanguard and the fund, Vanguard furnishes to the fund investment advisory, corporate management, administrative, marketing, and distribution services at Vanguard’s cost of operations (as defined by the FSA). These costs of operations are allocated to the fund based on methods and guidelines approved by the board of trustees. The FSA provides that expenses otherwise allocable to Vanguard funds-of-funds may be reduced or eliminated to the extent of savings realized by the
14
Target Retirement Income Fund
underlying Vanguard funds by virtue of being part of a fund-of-funds. Accordingly, all expenses for services provided by Vanguard to the fund and all other expenses incurred by the fund during the period ended September 30, 2018, were borne by the underlying Vanguard funds in which the fund invests. The fund’s trustees and officers are also trustees and officers, respectively, of the underlying Vanguard funds, as well as directors and employees, respectively, of Vanguard.
C. Various inputs may be used to determine the value of the fund’s investments. These inputs are summarized in three broad levels for financial statement purposes. The inputs or methodologies used to value securities are not necessarily an indication of the risk associated with investing in those securities.
Level 1—Quoted prices in active markets for identical securities.
Level 2—Other significant observable inputs (including quoted prices for similar securities, interest rates, prepayment speeds, credit risk, etc.).
Level 3—Significant unobservable inputs (including the fund’s own assumptions used to determine the fair value of investments). Any investments valued with significant unobservable inputs are noted on the Statement of Net Assets.
At September 30, 2018, 100% of the market value of the fund’s investments was determined based on Level 1 inputs.
D. Permanent differences between book-basis and tax-basis components of net assets are reclassified among capital accounts in the financial statements to reflect their tax character. These reclassifications have no effect on net assets or net asset value per share. As of period end, the following permanent differences primarily attributable to the accounting for distributions in connection with fund share redemptions were reclassified to the following accounts:
| Amount | |
| ($000) | |
| Paid-in Capital | 25,746 |
| Undistributed (Overdistributed) Net Investment Income | — |
| Accumulated Net Realized Gains (Losses) | (25,746) |
Temporary differences between book-basis and tax-basis components of accumulated net earnings (losses) arise when certain items of income, gain, or loss are recognized in different periods for financial statement and tax purposes; these differences will reverse at some time in the future. The differences are primarily related to the tax deferral of losses on wash sales. As of period end, the tax-basis components of accumulated net earnings (losses) are detailed in the table as follows:
| Amount | |
| ($000) | |
| Undistributed Ordinary Income | 22,249 |
| Undistributed Long-Term Gains | 225,066 |
| Capital Loss Carryforwards (Non-expiring) | — |
| Net Unrealized Gains (Losses) | 2,447,502 |
15
Target Retirement Income Fund
As of September 30, 2018, gross unrealized appreciation and depreciation for investments and derivatives based on cost for U.S. federal income tax purposes were as follows:
| Amount | ||
| ($000) | ||
| Tax Cost | 14,163,864 | |
| Gross Unrealized Appreciation | 2,587,813 | |
| Gross Unrealized Depreciation | (140,311) | |
| Net Unrealized Appreciation (Depreciation) | 2,447,502 | |
| E. Capital shares issued and redeemed were: | ||
| Year Ended September 30, | ||
| 2018 | 2017 | |
| Shares | Shares | |
| (000) | (000) | |
| Issued | 218,663 | 264,346 |
| Issued in Connection with Acquisition of Vanguard Target | ||
| Retirement 2010 Fund | — | 366,108 |
| Issued in Lieu of Cash Distributions | 33,394 | 19,353 |
| Redeemed | (259,138) | (238,265) |
| Net Increase (Decrease) in Shares Outstanding | (7,081) | 411,542 |
F. On July 21, 2017, the fund acquired all the net assets of Vanguard Target Retirement 2010 Fund pursuant to a plan of reorganization approved by the funds’ board of trustees. The purpose of the transaction was to combine two funds with comparable investment objectives. The acquisition was accomplished by a tax-free exchange of 366,108,000 shares of the fund for 191,723,000 shares of the Vanguard Target Retirement 2010 Fund outstanding as of the close of business on July 21, 2017. The Vanguard Target Retirement 2010 Fund’s net assets as of the close of business on July 21, 2017, of $4,899,025,000, including $810,947,000 of unrealized appreciation, were combined with the fund’s net assets. The net assets of the fund immediately before the acquisition were $11,585,554,000. The net assets of the fund immediately following the acquisition were $16,484,579,000.
Assuming that the acquisition had been completed on October 1, 2016, the beginning of the fund’s reporting period, the fund’s pro forma results of operations for the year ended September 30, 2017, would be:
| ($000) | |
| Net Investment Income | 309,270 |
| Realized Net Gain (Loss) | 305,963 |
| Change in Unrealized Appreciation (Depreciation) | 225,401 |
| Net Increase (Decrease) in Net Assets Resulting from Operations | 840,634 |
16
Target Retirement Income Fund
Because the combined funds have been managed as a single integrated fund since the acquisition was completed, it is not practical to separate the results of operations of Vanguard Target Retirement 2010 Fund that have been included in the fund’s statement of operations since July 21, 2017.
G. Transactions during the period in affiliated underlying Vanguard funds were as follows:
| Current Period Transactions | ||||||||
| Sept. 30, | Proceeds | Realized | Sept. 30, | |||||
| 2017 | from | Net | Change in | Capital Gain | 2018 | |||
| Market | Purchases | Securities | Gain | Unrealized | Distributions | Market | ||
| Value | at Cost | Sold | (Loss) | App. (Dep.) | Income | Received | Value | |
| ($000) | ($000) | ($000) | ($000) | ($000) | ($000) | ($000) | ($000) | |
| Vanguard Market | ||||||||
| Liquidity Fund | 2,961 | NA1 | NA1 | (4) | — | 52 | — | 2 |
| Vanguard Short-Term | ||||||||
| Inflation-Protected | ||||||||
| Securities Index | ||||||||
| Fund | 2,775,481 | 164,239 | 87,426 | (937) | (60,647) | 86,854 | — | 2,790,710 |
| Vanguard Total | ||||||||
| Bond Market II | ||||||||
| Index Fund | 6,197,174 | 477,832 | 236,392 | 63 | (249,206) | 162,773 | 1,393 | 6,189,471 |
| Vanguard Total | ||||||||
| International Bond | ||||||||
| Index Fund | 2,623,007 | 101,328 | 75,441 | (449) | (1,816) | 58,849 | — | 2,646,629 |
| Vanguard Total | ||||||||
| International Stock | ||||||||
| Index Fund | 2,014,327 | 137,633 | 164,510 | 17,419 | (32,438) | 53,899 | — | 1,972,431 |
| Vanguard Total | ||||||||
| Stock Market | ||||||||
| Index Fund | 3,024,180 | 189,042 | 649,750 | 243,811 | 204,840 | 51,520 | — | 3,012,123 |
| Total | 16,637,130 | 1,070,074 | 1,213,519 | 259,903 | (139,267) | 413,947 | 1,393 | 16,611,366 |
| 1 Not applicable—purchases and sales are for temporary cash investment purposes. | ||||||||
H. Management has determined that no events or transactions occurred subsequent to September 30, 2018, that would require recognition or disclosure in these financial statements.
17
Target Retirement 2015 Fund
Fund Profile
As of September 30, 2018
| Total Fund Characteristics | |
| Ticker Symbol | VTXVX |
| 30-Day SEC Yield | 2.26% |
| Acquired Fund Fees and Expenses1 | 0.13% |
| Allocation to Underlying Vanguard Funds | |
| Vanguard Total Bond Market II Index Fund | |
| Investor Shares | 33.1% |
| Vanguard Total Stock Market Index Fund | |
| Investor Shares | 24.4 |
| Vanguard Total International Stock Index | |
| Fund Investor Shares | 16.2 |
| Vanguard Total International Bond Index | |
| Fund Investor Shares | 14.1 |
| Vanguard Short-Term Inflation-Protected | |
| Securities Index Fund Investor Shares | 12.2 |
| Total Fund Volatility Measures | ||
| MSCI US | ||
| Target 2015 | Broad | |
| Composite | Market | |
| Index | Index | |
| R-Squared | 0.99 | 0.78 |
| Beta | 0.97 | 0.40 |
These measures show the degree and timing of the fund’s fluctuations compared with the indexes over 36 months.
Fund Asset Allocation
1 This figure—drawn from the prospectus dated January 25, 2018—represents an estimate of the weighted average of the expense ratios and any transaction fees charged by the underlying mutual funds (the ”acquired” funds) in which the Target Retirement 2015 Fund invests. The fund does not charge any expenses or fees of its own. For the fiscal year ended September 30, 2018, the acquired fund fees and expenses were 0.13%.
18
Target Retirement 2015 Fund
Performance Summary
All of the returns in this report represent past performance, which is not a guarantee of future results that may be achieved by the fund. (Current performance may be lower or higher than the performance data cited. For performance data current to the most recent month-end, visit our website at vanguard.com/performance.) Note, too, that both investment returns and principal value can fluctuate widely, so an investor’s shares, when sold, could be worth more or less than their original cost. The returns shown do not reflect taxes that a shareholder would pay on fund distributions or on the sale of fund shares.
Cumulative Performance: September 30, 2008, Through September 30, 2018
Initial Investment of $10,000
| Average Annual Total Returns | |||||
| Periods Ended September 30, 2018 | |||||
| Final Value | |||||
| One | Five | Ten | of a $10,000 | ||
| Year | Years | Years | Investment | ||
| Target Retirement 2015 Fund* | 4.54% | 5.92% | 6.91% | $19,514 | |
| •• | Target 2015 Composite Index | 4.77 | 6.13 | 7.00 | 19,674 |
| – | Mixed-Asset Target 2015 Funds | ||||
| Average | 4.10 | 4.99 | 5.63 | 17,297 | |
| MSCI US Broad Market Index | 17.62 | 13.52 | 12.12 | 31,391 | |
For a benchmark description, see the Glossary.
Mixed-Asset Target 2015 Funds Average: Derived from data provided by Lipper, a Thomson Reuters Company.
See Financial Highlights for dividend and capital gains information.
19
Target Retirement 2015 Fund
Fiscal-Year Total Returns (%): September 30, 2008, Through September 30, 2018
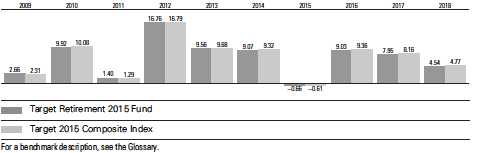
20
Target Retirement 2015 Fund
Financial Statements
Statement of Net Assets
As of September 30, 2018
The fund reports a complete list of its holdings in regulatory filings four times in each fiscal year, at the quarter-ends. For the second and fourth fiscal quarters, the lists appear in the fund’s semiannual and annual reports to shareholders. For the first and third fiscal quarters, the fund files the lists with the Securities and Exchange Commission on Form N-Q. Shareholders can look up the fund’s Forms N-Q on the SEC’s website at sec.gov. Forms N-Q may also be reviewed and copied at the SEC’s Public Reference Room (see the back cover of this report for further information).
| Market | ||
| Value• | ||
| Shares | ($000) | |
| Investment Companies (100.0%) | ||
| U.S. Stock Fund (24.4%) | ||
| Vanguard Total Stock Market Index Fund Investor Shares | 54,910,780 | 3,998,603 |
| International Stock Fund (16.2%) | ||
| Vanguard Total International Stock Index Fund Investor Shares | 152,776,698 | 2,652,203 |
| U.S. Bond Funds (45.3%) | ||
| 1 Vanguard Total Bond Market II Index Fund Investor Shares | 526,791,808 | 5,441,759 |
| Vanguard Short-Term Inflation-Protected Securities Index Fund | ||
| Investor Shares | 82,559,496 | 2,000,417 |
| 7,442,176 | ||
| International Bond Fund (14.1%) | ||
| Vanguard Total International Bond Index Fund Investor Shares | 213,065,254 | 2,318,150 |
| Total Investment Companies (Cost $12,995,194) | 16,411,132 | |
| Temporary Cash Investment (0.0%) | ||
| Money Market Fund (0.0%) | ||
| 1 Vanguard Market Liquidity Fund, 2.209% (Cost $3) | 25 | 3 |
| Total Investments (100.0%) (Cost $12,995,197) | 16,411,135 | |
| Other Assets and Liabilities (0.0%) | ||
| Other Assets | 92,654 | |
| Liabilities | (93,828) | |
| (1,174) | ||
| Net Assets (100%) | ||
| Applicable to 1,051,769,027 outstanding $.001 par value shares of | ||
| beneficial interest (unlimited authorization) | 16,409,961 | |
| Net Asset Value Per Share | $15.60 | |
21
| Target Retirement 2015 Fund | |
| Amount | |
| ($000) | |
| Statement of Assets and Liabilities | |
| Assets | |
| Investments in Securities, at Value—Affiliated Funds | 16,411,135 |
| Receivables for Investment Securities Sold | 70,000 |
| Receivables for Accrued Income | 14,559 |
| Receivables for Capital Shares Issued | 8,095 |
| Total Assets | 16,503,789 |
| Liabilities | |
| Payables for Investment Securities Purchased | 59,858 |
| Payables for Capital Shares Redeemed | 32,784 |
| Other Liabilities | 1,186 |
| Total Liabilities | 93,828 |
| Net Assets | 16,409,961 |
| At September 30, 2018, net assets consisted of: | |
| Amount | |
| ($000) | |
| Paid-in Capital | 12,141,286 |
| Undistributed Net Investment Income | 228,826 |
| Accumulated Net Realized Gains | 623,911 |
| Unrealized Appreciation (Depreciation) | 3,415,938 |
| Net Assets | 16,409,961 |
• See Note A in Notes to Financial Statements.
1 Affiliated fund available only to Vanguard funds and certain trusts and accounts managed by Vanguard. Rate shown for Vanguard
Market Liquidity Fund is the 7-day yield.
See accompanying Notes, which are an integral part of the Financial Statements.
22
| Target Retirement 2015 Fund | |
| Statement of Operations | |
| Year Ended | |
| September 30, 2018 | |
| ($000) | |
| Investment Income | |
| Income | |
| Income Distributions Received from Affiliated Funds | 404,958 |
| Net Investment Income—Note B | 404,958 |
| Realized Net Gain (Loss) | |
| Capital Gain Distributions Received from Affiliated Funds | 1,244 |
| Affiliated Funds Sold | 750,928 |
| Futures Contracts | 9 |
| Realized Net Gain (Loss) | 752,181 |
| Change in Unrealized Appreciation (Depreciation) from Affiliated Funds | (394,093) |
| Net Increase (Decrease) in Net Assets Resulting from Operations | 763,046 |
See accompanying Notes, which are an integral part of the Financial Statements.
23
| Target Retirement 2015 Fund | ||
| Statement of Changes in Net Assets | ||
| Year Ended September 30, | ||
| 2018 | 2017 | |
| ($000) | ($000) | |
| Increase (Decrease) in Net Assets | ||
| Operations | ||
| Net Investment Income | 404,958 | 345,920 |
| Realized Net Gain (Loss) | 752,181 | 595,516 |
| Change in Unrealized Appreciation (Depreciation) | (394,093) | 374,464 |
| Net Increase (Decrease) in Net Assets Resulting from Operations | 763,046 | 1,315,900 |
| Distributions | ||
| Net Investment Income | (344,563) | (327,196) |
| Realized Capital Gain1 | (575,173) | (347,122) |
| Total Distributions | (919,736) | (674,318) |
| Capital Share Transactions | ||
| Issued | 2,644,360 | 3,275,914 |
| Issued in Lieu of Cash Distributions | 898,348 | 660,094 |
| Redeemed | (4,226,220) | (4,806,030) |
| Net Increase (Decrease) from Capital Share Transactions | (683,512) | (870,022) |
| Total Increase (Decrease) | (840,202) | (228,440) |
| Net Assets | ||
| Beginning of Period | 17,250,163 | 17,478,603 |
| End of Period2 | 16,409,961 | 17,250,163 |
1 Includes fiscal 2018 and 2017 short-term gain distributions totaling $0 and $3,623,000, respectively. Short-term gain distributions
are treated as ordinary income dividends for tax purposes.
2 Net Assets—End of Period includes undistributed (overdistributed) net investment income of $228,826,000 and $198,557,000.
See accompanying Notes, which are an integral part of the Financial Statements.
24
| Target Retirement 2015 Fund | |||||
| Financial Highlights | |||||
| For a Share Outstanding | Year Ended September 30, | ||||
| Throughout Each Period | 2018 | 2017 | 2016 | 2015 | 2014 |
| Net Asset Value, Beginning of Period | $15.75 | $15.19 | $14.90 | $15.44 | $14.49 |
| Investment Operations | |||||
| Net Investment Income | . 3711 | .3051 | .311 | .327 | .300 |
| Capital Gain Distributions Received | .0011 | .0051 | .007 | .018 | .002 |
| Net Realized and Unrealized Gain (Loss) | |||||
| on Investments | .328 | .846 | .968 | (.433) | .996 |
| Total from Investment Operations | .700 | 1.156 | 1.286 | (.088) | 1.298 |
| Distributions | |||||
| Dividends from Net Investment Income | (.318) | (.289) | (.299) | (.284) | (.261) |
| Distributions from Realized Capital Gains | (.532) | (.307) | (.697) | (.168) | (.087) |
| Total Distributions | (.850) | (.596) | (.996) | (.452) | (.348) |
| Net Asset Value, End of Period | $15.60 | $15.75 | $15.19 | $14.90 | $15.44 |
| Total Return2 | 4.54% | 7.95% | 9.03% | -0.66% | 9.07% |
| Ratios/Supplemental Data | |||||
| Net Assets, End of Period (Millions) | $16,410 | $17,250 | $17,479 | $18,858 | $21,741 |
| Ratio of Total Expenses to Average Net Assets | — | — | — | — | — |
| Acquired Fund Fees and Expenses | 0.13% | 0.13% | 0.14% | 0.14% | 0.16% |
| Ratio of Net Investment Income to | |||||
| Average Net Assets | 2.39% | 2.02% | 1.96% | 1.95% | 1.99% |
| Portfolio Turnover Rate | 7% | 7% | 9% | 16% | 10% |
1 Calculated based on average shares outstanding.
2 Total returns do not include account service fees that may have applied in the periods shown. Fund prospectuses provide information
about any applicable account service fees.
See accompanying Notes, which are an integral part of the Financial Statements.
25
Target Retirement 2015 Fund
Notes to Financial Statements
Vanguard Target Retirement 2015 Fund is registered under the Investment Company Act of 1940 as an open-end investment company, or mutual fund. The fund follows a balanced investment strategy by investing in selected Vanguard funds to achieve its targeted allocation of assets to U.S. and international stocks, and U.S. and international bonds. Financial statements and other information about each underlying fund are available on vanguard.com.
A. The following significant accounting policies conform to generally accepted accounting principles for U.S. investment companies. The fund consistently follows such policies in preparing its financial statements.
1. Security Valuation: Investments are valued at the net asset value of each underlying Vanguard fund determined as of the close of the New York Stock Exchange (generally 4 p.m., Eastern time) on the valuation date.
2. Futures Contracts: The fund uses stock and bond futures contracts to a limited extent, with the objectives of maintaining full exposure to the market and maintaining its target asset allocation. The primary risks associated with the use of futures contracts are imperfect correlation between changes in market values of investments held by the fund and the prices of futures contracts, and the possibility of an illiquid market. Counterparty risk involving futures is mitigated because a regulated clearinghouse is the counterparty instead of the clearing broker. To further mitigate counterparty risk, the fund trades futures contracts on an exchange, monitors the financial strength of its clearing brokers and clearinghouse, and has entered into clearing agreements with its clearing brokers. The clearinghouse imposes initial margin requirements to secure the fund’s performance and requires daily settlement of variation margin representing changes in the market value of each contract. Any assets pledged as initial margin for open contracts are noted in the Statement of Net Assets.
Futures contracts are valued at their quoted daily settlement prices. The notional amounts of the contracts are not recorded in the Statement of Net Assets. Fluctuations in the value of the contracts are recorded in the Statement of Assets and Liabilities as an asset (liability) and in the Statement of Operations as unrealized appreciation (depreciation) until the contracts are closed, when they are recorded as realized futures gains (losses).
During the year ended September 30, 2018, the fund’s average investments in long and short futures contracts represented less than 1% and 0% of net assets, respectively, based on the average of the notional amounts at each quarter-end during the period. The fund had no open futures contracts at September 30, 2018.
3. Federal Income Taxes: The fund intends to continue to qualify as a regulated investment company and distribute all of its taxable income. Management has analyzed the fund’s tax positions taken for all open federal income tax years (September 30, 2015–2018), and has concluded that no provision for federal income tax is required in the fund’s financial statements.
4. Distributions: Distributions to shareholders are recorded on the ex-dividend date. Distributions are determined on a tax basis and may differ from net investment income and realized capital gains for financial reporting purposes.
26
Target Retirement 2015 Fund
5. Credit Facility: The fund and certain other funds managed by The Vanguard Group (“Vanguard”) participate in a $3.1 billion committed credit facility provided by a syndicate of lenders pursuant to a credit agreement that may be renewed annually; each fund is individually liable for its borrowings, if any, under the credit facility. Borrowings may be utilized for temporary and emergency purposes, and are subject to the fund’s regulatory and contractual borrowing restrictions. The participating funds are charged administrative fees and an annual commitment fee of 0.10% of the undrawn amount of the facility; these fees are allocated to the funds based on a method approved by the fund’s board of trustees and borne by the funds in which the fund invests (see Note B). Any borrowings under this facility bear interest at a rate based upon the higher of the one-month London Interbank Offered Rate, federal funds effective rate, or overnight bank funding rate plus an agreed-upon spread.
The fund had no borrowings outstanding at September 30, 2018, or at any time during the period then ended.
6. Other: Income and capital gain distributions received are recorded on the ex-dividend date. Security transactions are accounted for on the date securities are bought or sold. Costs used to determine realized gains (losses) on the sale of investment securities are those of the specific securities sold.
B. In accordance with the terms of a Funds’ Service Agreement (the “FSA”) between Vanguard and the fund, Vanguard furnishes to the fund investment advisory, corporate management, administrative, marketing, and distribution services at Vanguard’s cost of operations (as defined by the FSA). These costs of operations are allocated to the fund based on methods and guidelines approved by the board of trustees. The FSA provides that expenses otherwise allocable to Vanguard funds-of-funds may be reduced or eliminated to the extent of savings realized by the underlying Vanguard funds by virtue of being part of a fund-of-funds. Accordingly, all expenses for services provided by Vanguard to the fund and all other expenses incurred by the fund during the period ended September 30, 2018, were borne by the underlying Vanguard funds in which the fund invests. The fund’s trustees and officers are also trustees and officers, respectively, of the underlying Vanguard funds, as well as directors and employees, respectively, of Vanguard.
C. Various inputs may be used to determine the value of the fund’s investments. These inputs are summarized in three broad levels for financial statement purposes. The inputs or methodologies used to value securities are not necessarily an indication of the risk associated with investing in those securities.
Level 1—Quoted prices in active markets for identical securities.
Level 2—Other significant observable inputs (including quoted prices for similar securities, interest rates, prepayment speeds, credit risk, etc.).
Level 3—Significant unobservable inputs (including the fund’s own assumptions used to determine the fair value of investments). Any investments valued with significant unobservable inputs are noted on the Statement of Net Assets.
At September 30, 2018, 100% of the market value of the fund’s investments was determined based on Level 1 inputs.
27
Target Retirement 2015 Fund
D. Permanent differences between book-basis and tax-basis components of net assets are reclassified among capital accounts in the financial statements to reflect their tax character. These reclassifications have no effect on net assets or net asset value per share. As of period end, the following permanent differences primarily attributable to the accounting for distributions in connection with fund share redemptions were reclassified to the following accounts:
| Amount | |
| ($000) | |
| Paid-in Capital | 85,382 |
| Undistributed (Overdistributed) Net Investment Income | (30,126) |
| Accumulated Net Realized Gains (Losses) | (55,256) |
Temporary differences between book-basis and tax-basis components of accumulated net earnings (losses) arise when certain items of income, gain, or loss are recognized in different periods for financial statement and tax purposes; these differences will reverse at some time in the future. The differences are primarily related to the tax deferral of losses on wash sales. As of period end, the tax-basis components of accumulated net earnings (losses) are detailed in the table as follows:
| Amount | |
| ($000) | |
| Undistributed Ordinary Income | 233,762 |
| Undistributed Long-Term Gains | 618,975 |
| Capital Loss Carryforwards (Non-expiring) | — |
| Net Unrealized Gains (Losses) | 3,415,938 |
As of September 30, 2018, gross unrealized appreciation and depreciation for investments and derivatives based on cost for U.S. federal income tax purposes were as follows:
| Amount | |
| ($000) | |
| Tax Cost | 12,995,197 |
| Gross Unrealized Appreciation | 3,476,852 |
| Gross Unrealized Depreciation | (60,914) |
| Net Unrealized Appreciation (Depreciation) | 3,415,938 |
28
| Target Retirement 2015 Fund | ||
| E. Capital shares issued and redeemed were: | ||
| Year Ended September 30, | ||
| 2018 | 2017 | |
| Shares | Shares | |
| (000) | (000) | |
| Issued | 169,901 | 216,944 |
| Issued in Lieu of Cash Distributions | 58,562 | 45,555 |
| Redeemed | (271,935) | (318,180) |
| Net Increase (Decrease) in Shares Outstanding | (43,472) | (55,681) |
F. Transactions during the period in affiliated underlying Vanguard funds were as follows:
| Current Period Transactions | ||||||||
| Sept. 30, | Proceeds | Realized | Sept. 30, | |||||
| 2017 | from | Net | Change in | Capital Gain | 2018 | |||
| Market | Purchases | Securities | Gain | Unrealized | Distributions | Market | ||
| Value | at Cost | Sold | (Loss) | App. (Dep.) | Income | Received | Value | |
| ($000) | ($000) | ($000) | ($000) | ($000) | ($000) | ($000) | ($000) | |
| Vanguard Market | ||||||||
| Liquidity Fund | 1 | NA1 | NA1 | (4) | — | 27 | — | 3 |
| Vanguard Short-Term | ||||||||
| Inflation-Protected | ||||||||
| Securities Index | ||||||||
| Fund | 1,857,697 | 241,378 | 55,769 | (682) | (42,207) | 60,354 | — | 2,000,417 |
| Vanguard Total | ||||||||
| Bond Market II | ||||||||
| Index Fund | 5,539,438 | 476,208 | 352,950 | (2,891) | (218,046) 143,974 | 1,244 | 5,441,759 | |
| Vanguard Total | ||||||||
| International Bond | ||||||||
| Index Fund | 2,334,226 | 132,312 | 146,316 | 103 | (2,175) | 52,268 | — | 2,318,150 |
| Vanguard Total | ||||||||
| International Stock | ||||||||
| Index Fund | 3,034,415 | 123,274 | 493,722 | 61,461 | (73,225) | 76,111 | — | 2,652,203 |
| Vanguard Total | ||||||||
| Stock Market | ||||||||
| Index Fund | 4,483,170 | 277,697 | 1,396,765 | 692,941 | (58,440) | 72,224 | — | 3,998,603 |
| Total | 17,248,947 | 1,250,869 2,445,522 | 750,928 | (394,093) 404,958 | 1,244 | 16,411,135 | ||
| 1 Not applicable—purchases and sales are for temporary cash investment purposes. | ||||||||
G. Management has determined that no events or transactions occurred subsequent to September 30, 2018, that would require recognition or disclosure in these financial statements.
29
Target Retirement 2020 Fund
Fund Profile
As of September 30, 2018
| Total Fund Characteristics | |
| Ticker Symbol | VTWNX |
| 30-Day SEC Yield | 2.22% |
| Acquired Fund Fees and Expenses1 | 0.13% |
| Allocation to Underlying Vanguard Funds | |
| Vanguard Total Stock Market Index Fund | |
| Investor Shares | 32.2% |
| Vanguard Total Bond Market II Index Fund | |
| Investor Shares | 28.9 |
| Vanguard Total International Stock Index | |
| Fund Investor Shares | 21.3 |
| Vanguard Total International Bond Index | |
| Fund Investor Shares | 12.2 |
| Vanguard Short-Term Inflation-Protected | |
| Securities Index Fund Investor Shares | 5.4 |
| Total Fund Volatility Measures | ||
| MSCI US | ||
| Target 2020 | Broad | |
| Composite | Market | |
| Index | Index | |
| R-Squared | 0.99 | 0.84 |
| Beta | 0.97 | 0.51 |
These measures show the degree and timing of the fund’s fluctuations compared with the indexes over 36 months.
Fund Asset Allocation
1 This figure—drawn from the prospectus dated January 25, 2018—represents an estimate of the weighted average of the expense ratios and any transaction fees charged by the underlying mutual funds (the ”acquired” funds) in which the Target Retirement 2020 Fund invests. The fund does not charge any expenses or fees of its own. For the fiscal year ended September 30, 2018, the acquired fund fees and expenses were 0.13%.
30
Target Retirement 2020 Fund
Performance Summary
All of the returns in this report represent past performance, which is not a guarantee of future results that may be achieved by the fund. (Current performance may be lower or higher than the performance data cited. For performance data current to the most recent month-end, visit our website at vanguard.com/performance.) Note, too, that both investment returns and principal value can fluctuate widely, so an investor’s shares, when sold, could be worth more or less than their original cost. The returns shown do not reflect taxes that a shareholder would pay on fund distributions or on the sale of fund shares.
Cumulative Performance: September 30, 2008, Through September 30, 2018
Initial Investment of $10,000
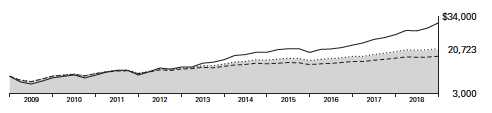
| Average Annual Total Returns | ||||
| Periods Ended September 30, 2018 | ||||
| Final Value | ||||
| One | Five | Ten | of a $10,000 | |
| Year | Years | Years | Investment | |
| Target Retirement 2020 Fund* | 5.87% | 6.92% | 7.56% | $20,723 |
| • Target 2020 Composite Index | 6.11 | 7.15 | 7.75 | 21,091 |
| Mixed-Asset Target 2020 Funds | ||||
| Average | 4.36 | 5.22 | 6.07 | 18,024 |
| MSCI US Broad Market Index | 17.62 | 13.52 | 12.12 | 31,391 |
For a benchmark description, see the Glossary.
Mixed-Asset Target 2020 Funds Average: Derived from data provided by Lipper, a Thomson Reuters Company.
See Financial Highlights for dividend and capital gains information.
31
Target Retirement 2020 Fund
Fiscal-Year Total Returns (%): September 30, 2008, Through September 30, 2018
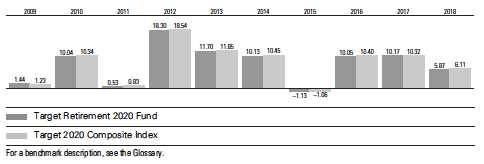
32
Target Retirement 2020 Fund
Financial Statements
Statement of Net Assets
As of September 30, 2018
The fund reports a complete list of its holdings in regulatory filings four times in each fiscal year, at the quarter-ends. For the second and fourth fiscal quarters, the lists appear in the fund’s semiannual and annual reports to shareholders. For the first and third fiscal quarters, the fund files the lists with the Securities and Exchange Commission on Form N-Q. Shareholders can look up the fund’s Forms N-Q on the SEC’s website at sec.gov. Forms N-Q may also be reviewed and copied at the SEC’s Public Reference Room (see the back cover of this report for further information).
| Market | ||
| Value• | ||
| Shares | ($000) | |
| Investment Companies (100.0%) | ||
| U.S. Stock Fund (32.2%) | ||
| Vanguard Total Stock Market Index Fund Investor Shares | 146,416,360 | 10,662,039 |
| International Stock Fund (21.3%) | ||
| Vanguard Total International Stock Index Fund Investor Shares | 406,784,332 | 7,061,776 |
| U.S. Bond Funds (34.3%) | ||
| 1 Vanguard Total Bond Market II Index Fund Investor Shares | 926,227,770 | 9,567,933 |
| Vanguard Short-Term Inflation-Protected Securities Index Fund | ||
| Investor Shares | 73,213,553 | 1,773,964 |
| 11,341,897 | ||
| International Bond Fund (12.2%) | ||
| Vanguard Total International Bond Index Fund Investor Shares | 371,726,479 | 4,044,384 |
| Total Investment Companies (Cost $25,527,063) | 33,110,096 | |
| Temporary Cash Investment (0.0%) | ||
| Money Market Fund (0.0%) | ||
| 1 Vanguard Market Liquidity Fund, 2.209% (Cost $1) | 7 | 1 |
| Total Investments (100.0%) (Cost $25,527,064) | 33,110,097 | |
| Other Assets and Liabilities (0.0%) | ||
| Other Assets | 168,992 | |
| Liabilities | (165,471) | |
| 3,521 | ||
| Net Assets (100%) | ||
| Applicable to 1,030,390,771 outstanding $.001 par value shares of | ||
| beneficial interest (unlimited authorization) | 33,113,618 | |
| Net Asset Value Per Share | $32.14 | |
33
| Target Retirement 2020 Fund | |
| Amount | |
| ($000) | |
| Statement of Assets and Liabilities | |
| Assets | |
| Investments in Securities, at Value—Affiliated Funds | 33,110,097 |
| Receivables for Investment Securities Sold | 110,000 |
| Receivables for Accrued Income | 25,845 |
| Receivables for Capital Shares Issued | 33,147 |
| Total Assets | 33,279,089 |
| Liabilities | |
| Payables for Investment Securities Purchased | 92,325 |
| Payables for Capital Shares Redeemed | 68,550 |
| Other Liabilities | 4,596 |
| Total Liabilities | 165,471 |
| Net Assets | 33,113,618 |
| At September 30, 2018, net assets consisted of: | |
| Amount | |
| ($000) | |
| Paid-in Capital | 24,424,731 |
| Undistributed Net Investment Income | 458,043 |
| Accumulated Net Realized Gains | 647,811 |
| Unrealized Appreciation (Depreciation) | 7,583,033 |
| Net Assets | 33,113,618 |
• See Note A in Notes to Financial Statements.
1 Affiliated fund available only to Vanguard funds and certain trusts and accounts managed by Vanguard. Rate shown for Vanguard
Market Liquidity Fund is the 7-day yield.
See accompanying Notes, which are an integral part of the Financial Statements.
34
| Target Retirement 2020 Fund | |
| Statement of Operations | |
| Year Ended | |
| September 30, 2018 | |
| ($000) | |
| Investment Income | |
| Income | |
| Income Distributions Received from Affiliated Funds | 751,094 |
| Other Income | 270 |
| Net Investment Income—Note B | 751,364 |
| Realized Net Gain (Loss) | |
| Capital Gain Distributions Received from Affiliated Funds | 2,079 |
| Affiliated Funds Sold | 740,473 |
| Futures Contracts | 47 |
| Realized Net Gain (Loss) | 742,599 |
| Change in Unrealized Appreciation (Depreciation) from Affiliated Funds | 351,099 |
| Net Increase (Decrease) in Net Assets Resulting from Operations | 1,845,062 |
See accompanying Notes, which are an integral part of the Financial Statements.
35
| Target Retirement 2020 Fund | ||
| Statement of Changes in Net Assets | ||
| Year Ended September 30, | ||
| 2018 | 2017 | |
| ($000) | ($000) | |
| Increase (Decrease) in Net Assets | ||
| Operations | ||
| Net Investment Income | 751,364 | 627,133 |
| Realized Net Gain (Loss) | 742,599 | 205,406 |
| Change in Unrealized Appreciation (Depreciation) | 351,099 | 2,040,744 |
| Net Increase (Decrease) in Net Assets Resulting from Operations | 1,845,062 | 2,873,283 |
| Distributions | ||
| Net Investment Income | (641,685) | (540,313) |
| Realized Capital Gain1 | (232,702) | (205,071) |
| Total Distributions | (874,387) | (745,384) |
| Capital Share Transactions | ||
| Issued | 7,270,038 | 8,233,193 |
| Issued in Lieu of Cash Distributions | 859,230 | 733,928 |
| Redeemed | (7,248,867) | (7,374,696) |
| Net Increase (Decrease) from Capital Share Transactions | 880,401 | 1,592,425 |
| Total Increase (Decrease) | 1,851,076 | 3,720,324 |
| Net Assets | ||
| Beginning of Period | 31,262,542 | 27,542,218 |
| End of Period2 | 33,113,618 | 31,262,542 |
1 Includes fiscal 2018 and 2017 short-term gain distributions totaling $12,707,000 and $6,153,000, respectively. Short-term gain
distributions are treated as ordinary income dividends for tax purposes.
2 Net Assets—End of Period includes undistributed (overdistributed) net investment income of $458,043,000 and $392,927,000.
See accompanying Notes, which are an integral part of the Financial Statements.
36
| Target Retirement 2020 Fund | |||||
| Financial Highlights | |||||
| For a Share Outstanding | Year Ended September 30, | ||||
| Throughout Each Period | 2018 | 2017 | 2016 | 2015 | 2014 |
| Net Asset Value, Beginning of Period | $31.19 | $29.09 | $27.52 | $28.40 | $26.26 |
| Investment Operations | |||||
| Net Investment Income | .7291 | .6361 | .619 | .622 | .577 |
| Capital Gain Distributions Received | .0021 | .0081 | .012 | .026 | .004 |
| Net Realized and Unrealized Gain (Loss) | |||||
| on Investments | 1.079 | 2.231 | 2.065 | (.946) | 2.054 |
| Total from Investment Operations | 1.810 | 2.875 | 2.696 | (.298) | 2.635 |
| Distributions | |||||
| Dividends from Net Investment Income | (.631) | (.562) | (.591) | (.541) | (.484) |
| Distributions from Realized Capital Gains | (.229) | (.213) | (.535) | (.041) | (.011) |
| Total Distributions | (.860) | (.775) | (1.126) | (.582) | (.495) |
| Net Asset Value, End of Period | $32.14 | $31.19 | $29.09 | $27.52 | $28.40 |
| Total Return2 | 5.87% | 10.17% | 10.05% | -1.13% | 10.13% |
| Ratios/Supplemental Data | |||||
| Net Assets, End of Period (Millions) | $33,114 | $31,263 | $27,542 | $26,693 | $27,488 |
| Ratio of Total Expenses to Average Net Assets | — | — | — | — | — |
| Acquired Fund Fees and Expenses | 0.13% | 0.13% | 0.14% | 0.14% | 0.16% |
| Ratio of Net Investment Income to | |||||
| Average Net Assets | 2.30% | 2.15% | 2.14% | 2.07% | 2.14% |
| Portfolio Turnover Rate | 10% | 9% | 15% | 25% | 7% |
1 Calculated based on average shares outstanding.
2 Total returns do not include account service fees that may have applied in the periods shown. Fund prospectuses provide information
about any applicable account service fees.
See accompanying Notes, which are an integral part of the Financial Statements.
37
Target Retirement 2020 Fund
Notes to Financial Statements
Vanguard Target Retirement 2020 Fund is registered under the Investment Company Act of 1940 as an open-end investment company, or mutual fund. The fund follows a balanced investment strategy by investing in selected Vanguard funds to achieve its targeted allocation of assets to U.S. and international stocks, and U.S. and international bonds. Financial statements and other information about each underlying fund are available on vanguard.com.
A. The following significant accounting policies conform to generally accepted accounting principles for U.S. investment companies. The fund consistently follows such policies in preparing its financial statements.
1. Security Valuation: Investments are valued at the net asset value of each underlying Vanguard fund determined as of the close of the New York Stock Exchange (generally 4 p.m., Eastern time) on the valuation date.
2. Futures Contracts: The fund uses stock and bond futures contracts to a limited extent, with the objectives of maintaining full exposure to the market and maintaining its target asset allocation. The primary risks associated with the use of futures contracts are imperfect correlation between changes in market values of investments held by the fund and the prices of futures contracts, and the possibility of an illiquid market. Counterparty risk involving futures is mitigated because a regulated clearinghouse is the counterparty instead of the clearing broker. To further mitigate counterparty risk, the fund trades futures contracts on an exchange, monitors the financial strength of its clearing brokers and clearinghouse, and has entered into clearing agreements with its clearing brokers. The clearinghouse imposes initial margin requirements to secure the fund’s performance and requires daily settlement of variation margin representing changes in the market value of each contract. Any assets pledged as initial margin for open contracts are noted in the Statement of Net Assets.
Futures contracts are valued at their quoted daily settlement prices. The notional amounts of the contracts are not recorded in the Statement of Net Assets. Fluctuations in the value of the contracts are recorded in the Statement of Assets and Liabilities as an asset (liability) and in the Statement of Operations as unrealized appreciation (depreciation) until the contracts are closed, when they are recorded as realized futures gains (losses).
During the year ended September 30, 2018, the fund’s average investments in long and short futures contracts represented less than 1% and 0% of net assets, respectively, based on the average of the notional amounts at each quarter-end during the period. The fund had no open futures contracts at September 30, 2018.
3. Federal Income Taxes: The fund intends to continue to qualify as a regulated investment company and distribute all of its taxable income. Management has analyzed the fund’s tax positions taken for all open federal income tax years (September 30, 2015–2018), and has concluded that no provision for federal income tax is required in the fund’s financial statements.
4. Distributions: Distributions to shareholders are recorded on the ex-dividend date. Distributions are determined on a tax basis and may differ from net investment income and realized capital gains for financial reporting purposes.
38
Target Retirement 2020 Fund
5. Credit Facility: The fund and certain other funds managed by The Vanguard Group (“Vanguard”) participate in a $3.1 billion committed credit facility provided by a syndicate of lenders pursuant to a credit agreement that may be renewed annually; each fund is individually liable for its borrowings, if any, under the credit facility. Borrowings may be utilized for temporary and emergency purposes, and are subject to the fund’s regulatory and contractual borrowing restrictions. The participating funds are charged administrative fees and an annual commitment fee of 0.10% of the undrawn amount of the facility; these fees are allocated to the funds based on a method approved by the fund’s board of trustees and borne by the funds in which the fund invests (see Note B). Any borrowings under this facility bear interest at a rate based upon the higher of the one-month London Interbank Offered Rate, federal funds effective rate, or overnight bank funding rate plus an agreed-upon spread.
The fund had no borrowings outstanding at September 30, 2018, or at any time during the period then ended.
6. Other: Income and capital gain distributions received are recorded on the ex-dividend date. Security transactions are accounted for on the date securities are bought or sold. Costs used to determine realized gains (losses) on the sale of investment securities are those of the specific securities sold.
B. In accordance with the terms of a Funds’ Service Agreement (the “FSA”) between Vanguard and the fund, Vanguard furnishes to the fund investment advisory, corporate management, administrative, marketing, and distribution services at Vanguard’s cost of operations (as defined by the FSA). These costs of operations are allocated to the fund based on methods and guidelines approved by the board of trustees. The FSA provides that expenses otherwise allocable to Vanguard funds-of-funds may be reduced or eliminated to the extent of savings realized by the underlying Vanguard funds by virtue of being part of a fund-of-funds. Accordingly, all expenses for services provided by Vanguard to the fund and all other expenses incurred by the fund during the period ended September 30, 2018, were borne by the underlying Vanguard funds in which the fund invests. The fund’s trustees and officers are also trustees and officers, respectively, of the underlying Vanguard funds, as well as directors and employees, respectively, of Vanguard.
C. Various inputs may be used to determine the value of the fund’s investments. These inputs are summarized in three broad levels for financial statement purposes. The inputs or methodologies used to value securities are not necessarily an indication of the risk associated with investing in those securities.
Level 1—Quoted prices in active markets for identical securities.
Level 2—Other significant observable inputs (including quoted prices for similar securities, interest rates, prepayment speeds, credit risk, etc.).
Level 3—Significant unobservable inputs (including the fund’s own assumptions used to determine the fair value of investments). Any investments valued with significant unobservable inputs are noted on the Statement of Net Assets.
At September 30, 2018, 100% of the market value of the fund’s investments was determined based on Level 1 inputs.
39
Target Retirement 2020 Fund
D. Permanent differences between book-basis and tax-basis components of net assets are reclassified among capital accounts in the financial statements to reflect their tax character. These reclassifications have no effect on net assets or net asset value per share. As of period end, the following permanent differences primarily attributable to the accounting for distributions in connection with fund share redemptions were reclassified to the following accounts:
| Amount | |
| ($000) | |
| Paid-in Capital | 87,873 |
| Undistributed (Overdistributed) Net Investment Income | (44,563) |
| Accumulated Net Realized Gains (Losses) | (43,310) |
Temporary differences between book-basis and tax-basis components of accumulated net earnings (losses) arise when certain items of income, gain, or loss are recognized in different periods for financial statement and tax purposes; these differences will reverse at some time in the future. The differences are primarily related to the tax deferral of losses on wash sales. As of period end, the tax-basis components of accumulated net earnings (losses) are detailed in the table as follows:
| Amount | |
| ($000) | |
| Undistributed Ordinary Income | 472,941 |
| Undistributed Long-Term Gains | 632,913 |
| Capital Loss Carryforwards (Non-expiring) | — |
| Net Unrealized Gains (Losses) | 7,583,033 |
As of September 30, 2018, gross unrealized appreciation and depreciation for investments and derivatives based on cost for U.S. federal income tax purposes were as follows:
| Amount | |
| ($000) | |
| Tax Cost | 25,527,064 |
| Gross Unrealized Appreciation | 7,844,468 |
| Gross Unrealized Depreciation | (261,435) |
| Net Unrealized Appreciation (Depreciation) | 7,583,033 |
40
| Target Retirement 2020 Fund | ||
| E. Capital shares issued and redeemed were: | ||
| Year Ended September 30, | ||
| 2018 | 2017 | |
| Shares | Shares | |
| (000) | (000) | |
| Issued | 229,558 | 278,945 |
| Issued in Lieu of Cash Distributions | 27,347 | 26,017 |
| Redeemed | (228,859) | (249,268) |
| Net Increase (Decrease) in Shares Outstanding | 28,046 | 55,694 |
F. Transactions during the period in affiliated underlying Vanguard funds were as follows:
| Current Period Transactions | ||||||||
| Sept. 30, | Proceeds | Realized | Sept. 30, | |||||
| 2017 | from | Net | Change in | Capital Gain | 2018 | |||
| Market | Purchases | Securities | Gain | Unrealized | Distributions | Market | ||
| Value | at Cost | Sold | (Loss) | Income | App. (Dep.) | Received | Value | |
| ($000) | ($000) | ($000) | ($000) | ($000) | ($000) | ($000) | ($000) | |
| Vanguard Market | ||||||||
| Liquidity Fund | 3,904 | NA1 | NA1 | (4) | — 50 | — | 1 | |
| Vanguard Short-Term | ||||||||
| Inflation-Protected | ||||||||
| Securities Index | ||||||||
| Fund | 1,163,653 | 661,074 | 18,767 | — | (31,996) | 45,929 | — | 1,773,964 |
| Vanguard Total | ||||||||
| Bond Market II | ||||||||
| Index Fund | 8,935,698 | 1,711,760 | 704,165 | — | (375,360) | 245,617 | 2,079 | 9,567,933 |
| Vanguard Total | ||||||||
| International Bond | ||||||||
| Index Fund | 3,748,016 | 412,176 | 112,483 | (713) | (2,612) | 86,795 | — | 4,044,384 |
| Vanguard Total | ||||||||
| International Stock | ||||||||
| Index Fund | 6,960,556 | 676,158 | 511,007 | 43,473 | (107,404) | 190,909 | — | 7,061,776 |
| Vanguard Total | ||||||||
| Stock Market | ||||||||
| Index Fund | 10,450,278 | 610,066 | 1,964,493 | 697,717 | 868,471 | 181,794 | — | 10,662,039 |
| Total | 31,262,105 | 4,071,234 | 3,310,915 | 740,473 | 351,099 | 751,094 | 2,079 | 33,110,097 |
| 1 Not applicable—purchases and sales are for temporary cash investment purposes. | ||||||||
G. Management has determined that no events or transactions occurred subsequent to September 30, 2018, that would require recognition or disclosure in these financial statements.
41
Target Retirement 2025 Fund
Fund Profile
As of September 30, 2018
| Total Fund Characteristics | |
| Ticker Symbol | VTTVX |
| 30-Day SEC Yield | 2.17% |
| Acquired Fund Fees and Expenses1 | 0.14% |
| Allocation to Underlying Vanguard Funds | |
| Vanguard Total Stock Market Index Fund | |
| Investor Shares | 38.0% |
| Vanguard Total Bond Market II Index Fund | |
| Investor Shares | 26.2 |
| Vanguard Total International Stock Index | |
| Fund Investor Shares | 24.9 |
| Vanguard Total International Bond Index | |
| Fund Investor Shares | 10.9 |
| Total Fund Volatility Measures | ||
| MSCI US | ||
| Target 2025 | Broad | |
| Composite | Market | |
| Index | Index | |
| R-Squared | 0.99 | 0.86 |
| Beta | 0.97 | 0.58 |
These measures show the degree and timing of the fund’s fluctuations compared with the indexes over 36 months.
Fund Asset Allocation
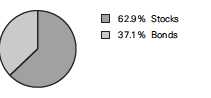
1 This figure—drawn from the prospectus dated January 25, 2018—represents an estimate of the weighted average of the expense ratios and any transaction fees charged by the underlying mutual funds (the ”acquired” funds) in which the Target Retirement 2025 Fund invests. The fund does not charge any expenses or fees of its own. For the fiscal year ended September 30, 2018, the acquired fund fees and expenses were 0.13%.
42
Target Retirement 2025 Fund
Performance Summary
All of the returns in this report represent past performance, which is not a guarantee of future results that may be achieved by the fund. (Current performance may be lower or higher than the performance data cited. For performance data current to the most recent month-end, visit our website at vanguard.com/performance.) Note, too, that both investment returns and principal value can fluctuate widely, so an investor’s shares, when sold, could be worth more or less than their original cost. The returns shown do not reflect taxes that a shareholder would pay on fund distributions or on the sale of fund shares.
Cumulative Performance: September 30, 2008, Through September 30, 2018
Initial Investment of $10,000
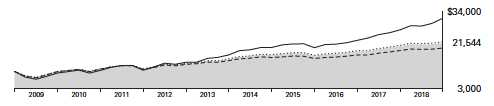
| Average Annual Total Returns | ||||
| Periods Ended September 30, 2018 | ||||
| Final Value | ||||
| One | Five | Ten | of a $10,000 | |
| Year | Years | Years | Investment | |
| Target Retirement 2025 Fund* | 6.79% | 7.56% | 7.98% | $21,544 |
| • Target 2025 Composite Index | 7.08 | 7.80 | 8.18 | 21,962 |
| Mixed-Asset Target 2025 Funds | ||||
| Average | 5.46 | 6.21 | 6.85 | 19,395 |
| MSCI US Broad Market Index | 17.62 | 13.52 | 12.12 | 31,391 |
For a benchmark description, see the Glossary.
Mixed-Asset Target 2025 Funds Average: Derived from data provided by Lipper, a Thomson Reuters Company.
See Financial Highlights for dividend and capital gains information.
43
Target Retirement 2025 Fund
Fiscal-Year Total Returns (%): September 30, 2008, Through September 30, 2018
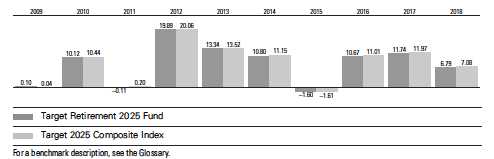
44
Target Retirement 2025 Fund
Financial Statements
Statement of Net Assets
As of September 30, 2018
The fund reports a complete list of its holdings in regulatory filings four times in each fiscal year, at the quarter-ends. For the second and fourth fiscal quarters, the lists appear in the fund’s semiannual and annual reports to shareholders. For the first and third fiscal quarters, the fund files the lists with the Securities and Exchange Commission on Form N-Q. Shareholders can look up the fund’s Forms N-Q on the SEC’s website at sec.gov. Forms N-Q may also be reviewed and copied at the SEC’s Public Reference Room (see the back cover of this report for further information).
| Market | ||
| Value• | ||
| Shares | ($000) | |
| Investment Companies (100.0%) | ||
| U.S. Stock Fund (38.0%) | ||
| Vanguard Total Stock Market Index Fund Investor Shares | 218,113,538 | 15,883,028 |
| International Stock Fund (24.9%) | ||
| Vanguard Total International Stock Index Fund Investor Shares | 600,462,648 | 10,424,031 |
| U.S. Bond Fund (26.2%) | ||
| 1 Vanguard Total Bond Market II Index Fund Investor Shares | 1,062,878,431 | 10,979,534 |
| International Bond Fund (10.9%) | ||
| Vanguard Total International Bond Index Fund Investor Shares | 420,853,639 | 4,578,888 |
| Total Investment Companies (Cost $30,645,883) | 41,865,481 | |
| Temporary Cash Investment (0.0%) | ||
| Money Market Fund (0.0%) | ||
| 1 Vanguard Market Liquidity Fund, 2.209% (Cost $3) | 33 | 3 |
| Total Investments (100.0%) (Cost $30,645,886) | 41,865,484 | |
| Other Assets and Liabilities (0.0%) | ||
| Other Assets | 101,868 | |
| Liabilities | (107,611) | |
| (5,743) | ||
| Net Assets (100%) | ||
| Applicable to 2,200,278,070 outstanding $.001 par value shares of | ||
| beneficial interest (unlimited authorization) | 41,859,741 | |
| Net Asset Value Per Share | $19.02 | |
45
| Target Retirement 2025 Fund | |
| Amount | |
| ($000) | |
| Statement of Assets and Liabilities | |
| Assets | |
| Investments in Securities, at Value—Affiliated Funds | 41,865,484 |
| Receivables for Investment Securities Sold | 41,881 |
| Receivables for Accrued Income | 29,361 |
| Receivables for Capital Shares Issued | 30,626 |
| Total Assets | 41,967,352 |
| Liabilities | |
| Payables for Investment Securities Purchased | 29,251 |
| Payables for Capital Shares Redeemed | 74,377 |
| Other Liabilities | 3,983 |
| Total Liabilities | 107,611 |
| Net Assets | 41,859,741 |
| At September 30, 2018, net assets consisted of: | |
| Amount | |
| ($000) | |
| Paid-in Capital | 29,835,639 |
| Undistributed Net Investment Income | 585,819 |
| Accumulated Net Realized Gains | 218,685 |
| Unrealized Appreciation (Depreciation) | 11,219,598 |
| Net Assets | 41,859,741 |
• See Note A in Notes to Financial Statements.
1 Affiliated fund available only to Vanguard funds and certain trusts and accounts managed by Vanguard. Rate shown for Vanguard
Market Liquidity Fund is the 7-day yield.
See accompanying Notes, which are an integral part of the Financial Statements.
46
| Target Retirement 2025 Fund | |
| Statement of Operations | |
| Year Ended | |
| September 30, 2018 | |
| ($000) | |
| Investment Income | |
| Income | |
| Income Distributions Received from Affiliated Funds | 898,335 |
| Other Income | 106 |
| Net Investment Income—Note B | 898,441 |
| Realized Net Gain (Loss) | |
| Capital Gain Distributions Received from Affiliated Funds | 2,213 |
| Affiliated Funds Sold | 226,830 |
| Futures Contracts | 137 |
| Realized Net Gain (Loss) | 229,180 |
| Change in Unrealized Appreciation (Depreciation) from Affiliated Funds | 1,462,402 |
| Net Increase (Decrease) in Net Assets Resulting from Operations | 2,590,023 |
See accompanying Notes, which are an integral part of the Financial Statements.
47
| Target Retirement 2025 Fund | ||
| Statement of Changes in Net Assets | ||
| Year Ended September 30, | ||
| 2018 | 2017 | |
| ($000) | ($000) | |
| Increase (Decrease) in Net Assets | ||
| Operations | ||
| Net Investment Income | 898,441 | 752,393 |
| Realized Net Gain (Loss) | 229,180 | 205,795 |
| Change in Unrealized Appreciation (Depreciation) | 1,462,402 | 2,911,271 |
| Net Increase (Decrease) in Net Assets Resulting from Operations | 2,590,023 | 3,869,459 |
| Distributions | ||
| Net Investment Income | (768,518) | (632,365) |
| Realized Capital Gain1 | (182,505) | (214,269) |
| Total Distributions | (951,023) | (846,634) |
| Capital Share Transactions | ||
| Issued | 9,267,239 | 9,126,407 |
| Issued in Lieu of Cash Distributions | 935,571 | 834,520 |
| Redeemed | (7,093,003) | (7,579,252) |
| Net Increase (Decrease) from Capital Share Transactions | 3,109,807 | 2,381,675 |
| Total Increase (Decrease) | 4,748,807 | 5,404,500 |
| Net Assets | ||
| Beginning of Period | 37,110,934 | 31,706,434 |
| End of Period2 | 41,859,741 | 37,110,934 |
1 Includes fiscal 2018 and 2017 short-term gain distributions totaling $21,642,000 and $5,608,000, respectively. Short-term gain
distributions are treated as ordinary income dividends for tax purposes.
2 Net Assets—End of Period includes undistributed (overdistributed) net investment income of $585,819,000 and $486,322,000.
See accompanying Notes, which are an integral part of the Financial Statements.
48
| Target Retirement 2025 Fund | |||||
| Financial Highlights | |||||
| For a Share Outstanding | Year Ended September 30, | ||||
| Throughout Each Period | 2018 | 2017 | 2016 | 2015 | 2014 |
| Net Asset Value, Beginning of Period | $18.25 | $16.77 | $15.90 | $16.50 | $15.18 |
| Investment Operations | |||||
| Net Investment Income | . 4191 | .3801 | . 362 | . 364 | . 350 |
| Capital Gain Distributions Received | .0011 | .0041 | .006 | .012 | .002 |
| Net Realized and Unrealized Gain (Loss) | |||||
| on Investments | .807 | 1.534 | 1.280 | (.624) | 1.272 |
| Total from Investment Operations | 1.227 | 1.918 | 1.648 | (.248) | 1.624 |
| Distributions | |||||
| Dividends from Net Investment Income | (.369) | (.327) | (.342) | (.322) | (.287) |
| Distributions from Realized Capital Gains | (.088) | (.111) | (.436) | (.030) | (.017) |
| Total Distributions | (.457) | (.438) | (.778) | (.352) | (.304) |
| Net Asset Value, End of Period | $19.02 | $18.25 | $16.77 | $15.90 | $16.50 |
| Total Return2 | 6.79% | 11.74% | 10.67% | -1.60% | 10.80% |
| Ratios/Supplemental Data | |||||
| Net Assets, End of Period (Millions) | $41,860 | $37,111 | $31,706 | $30,048 | $31,428 |
| Ratio of Total Expenses to Average Net Assets | — | — | — | — | — |
| Acquired Fund Fees and Expenses | 0.13% | 0.14% | 0.14% | 0.15% | 0.17% |
| Ratio of Net Investment Income to | |||||
| Average Net Assets | 2.24% | 2.21% | 2.18% | 2.07% | 2.15% |
| Portfolio Turnover Rate | 8% | 10% | 15% | 24% | 7% |
1 Calculated based on average shares outstanding.
2 Total returns do not include account service fees that may have applied in the periods shown. Fund prospectuses provide information
about any applicable account service fees.
See accompanying Notes, which are an integral part of the Financial Statements.
49
Target Retirement 2025 Fund
Notes to Financial Statements
Vanguard Target Retirement 2025 Fund is registered under the Investment Company Act of 1940 as an open-end investment company, or mutual fund. The fund follows a balanced investment strategy by investing in selected Vanguard funds to achieve its targeted allocation of assets to U.S. and international stocks, and U.S. and international bonds. Financial statements and other information about each underlying fund are available on vanguard.com.
A. The following significant accounting policies conform to generally accepted accounting principles for U.S. investment companies. The fund consistently follows such policies in preparing its financial statements.
1. Security Valuation: Investments are valued at the net asset value of each underlying Vanguard fund determined as of the close of the New York Stock Exchange (generally 4 p.m., Eastern time) on the valuation date.
2. Futures Contracts: The fund uses stock and bond futures contracts to a limited extent, with the objectives of maintaining full exposure to the market and maintaining its target asset allocation. The primary risks associated with the use of futures contracts are imperfect correlation between changes in market values of investments held by the fund and the prices of futures contracts, and the possibility of an illiquid market. Counterparty risk involving futures is mitigated because a regulated clearinghouse is the counterparty instead of the clearing broker. To further mitigate counterparty risk, the fund trades futures contracts on an exchange, monitors the financial strength of its clearing brokers and clearinghouse, and has entered into clearing agreements with its clearing brokers. The clearinghouse imposes initial margin requirements to secure the fund’s performance and requires daily settlement of variation margin representing changes in the market value of each contract. Any assets pledged as initial margin for open contracts are noted in the Statement of Net Assets.
Futures contracts are valued at their quoted daily settlement prices. The notional amounts of the contracts are not recorded in the Statement of Net Assets. Fluctuations in the value of the contracts are recorded in the Statement of Assets and Liabilities as an asset (liability) and in the Statement of Operations as unrealized appreciation (depreciation) until the contracts are closed, when they are recorded as realized futures gains (losses).
During the year ended September 30, 2018, the fund’s average investments in long and short futures contracts represented less than 1% and 0% of net assets, respectively, based on the average of the notional amounts at each quarter-end during the period. The fund had no open futures contracts at September 30, 2018.
3. Federal Income Taxes: The fund intends to continue to qualify as a regulated investment company and distribute all of its taxable income. Management has analyzed the fund’s tax positions taken for all open federal income tax years (September 30, 2015–2018), and has concluded that no provision for federal income tax is required in the fund’s financial statements.
4. Distributions: Distributions to shareholders are recorded on the ex-dividend date. Distributions are determined on a tax basis and may differ from net investment income and realized capital gains for financial reporting purposes.
50
Target Retirement 2025 Fund
5. Credit Facility: The fund and certain other funds managed by The Vanguard Group (“Vanguard”) participate in a $3.1 billion committed credit facility provided by a syndicate of lenders pursuant to a credit agreement that may be renewed annually; each fund is individually liable for its borrowings, if any, under the credit facility. Borrowings may be utilized for temporary and emergency purposes, and are subject to the fund’s regulatory and contractual borrowing restrictions. The participating funds are charged administrative fees and an annual commitment fee of 0.10% of the undrawn amount of the facility; these fees are allocated to the funds based on a method approved by the fund’s board of trustees and borne by the funds in which the fund invests (see Note B). Any borrowings under this facility bear interest at a rate based upon the higher of the one-month London Interbank Offered Rate, federal funds effective rate, or overnight bank funding rate plus an agreed-upon spread.
The fund had no borrowings outstanding at September 30, 2018, or at any time during the period then ended.
6. Other: Income and capital gain distributions received are recorded on the ex-dividend date. Security transactions are accounted for on the date securities are bought or sold. Costs used to determine realized gains (losses) on the sale of investment securities are those of the specific securities sold.
B. In accordance with the terms of a Funds’ Service Agreement (the “FSA”) between Vanguard and the fund, Vanguard furnishes to the fund investment advisory, corporate management, administrative, marketing, and distribution services at Vanguard’s cost of operations (as defined by the FSA). These costs of operations are allocated to the fund based on methods and guidelines approved by the board of trustees. The FSA provides that expenses otherwise allocable to Vanguard funds-of-funds may be reduced or eliminated to the extent of savings realized by the underlying Vanguard funds by virtue of being part of a fund-of-funds. Accordingly, all expenses for services provided by Vanguard to the fund and all other expenses incurred by the fund during the period ended September 30, 2018, were borne by the underlying Vanguard funds in which the fund invests. The fund’s trustees and officers are also trustees and officers, respectively, of the underlying Vanguard funds, as well as directors and employees, respectively, of Vanguard.
C. Various inputs may be used to determine the value of the fund’s investments. These inputs are summarized in three broad levels for financial statement purposes. The inputs or methodologies used to value securities are not necessarily an indication of the risk associated with investing in those securities.
Level 1—Quoted prices in active markets for identical securities.
Level 2—Other significant observable inputs (including quoted prices for similar securities, interest rates, prepayment speeds, credit risk, etc.).
Level 3—Significant unobservable inputs (including the fund’s own assumptions used to determine the fair value of investments). Any investments valued with significant unobservable inputs are noted on the Statement of Net Assets.
At September 30, 2018, 100% of the market value of the fund’s investments was determined based on Level 1 inputs.
51
Target Retirement 2025 Fund
D. Permanent differences between book-basis and tax-basis components of net assets are reclassified among capital accounts in the financial statements to reflect their tax character. These reclassifications have no effect on net assets or net asset value per share. As of period end, the following permanent differences primarily attributable to the accounting for distributions in connection with fund share redemptions were reclassified to the following accounts:
| Amount | |
| ($000) | |
| Paid-in Capital | 38,034 |
| Undistributed (Overdistributed) Net Investment Income | (30,426) |
| Accumulated Net Realized Gains (Losses) | (7,608) |
Temporary differences between book-basis and tax-basis components of accumulated net earnings (losses) arise when certain items of income, gain, or loss are recognized in different periods for financial statement and tax purposes; these differences will reverse at some time in the future. The differences are primarily related to the tax deferral of losses on wash sales. As of period end, the tax components of accumulated net earnings (losses) are detailed in the table as follows:
| Amount | |
| ($000) | |
| Undistributed Ordinary Income | 668,287 |
| Undistributed Long-Term Gains | 136,217 |
| Capital Loss Carryforwards (Non-expiring) | — |
| Net Unrealized Gains (Losses) | 11,219,598 |
As of September 30, 2018, gross unrealized appreciation and depreciation for investments and derivatives based on cost for U.S. federal income tax purposes were as follows:
| Amount | ||
| ($000) | ||
| Tax Cost | 30,645,886 | |
| Gross Unrealized Appreciation | 11,498,122 | |
| Gross Unrealized Depreciation | (278,524) | |
| Net Unrealized Appreciation (Depreciation) | 11,219,598 | |
| E. Capital shares issued and redeemed were: | ||
| Year Ended September 30, | ||
| 2018 | 2017 | |
| Shares | Shares | |
| (000) | (000) | |
| Issued | 496,292 | 532,501 |
| Issued in Lieu of Cash Distributions | 50,490 | 51,135 |
| Redeemed | (379,667) | (441,562) |
| Net Increase (Decrease) in Shares Outstanding | 167,115 | 142,074 |
52
Target Retirement 2025 Fund
F. Transactions during the period in affiliated underlying Vanguard funds were as follows:
| Current Period Transactions | ||||||||
| Sept. 30, | Proceeds | Realized | Sept. 30, | |||||
| 2017 | from | Net | Change in | Capital Gain | 2018 | |||
| Market | Purchases | Securities | Gain | Unrealized | Distributions | Market | ||
| Value | at Cost | Sold | (Loss) | App. (Dep.) | Income | Received | Value | |
| ($000) | ($000) | ($000) | ($000) | ($000) | ($000) | ($000) | ($000) | |
| Vanguard Market | ||||||||
| Liquidity Fund | 8,931 | NA1 | NA1 | (12) | — | 113 | — | 3 |
| Vanguard Total | ||||||||
| Bond Market II | ||||||||
| Index Fund | 9,339,193 | 3,106,810 | 1,057,191 | — | 270,606 | (409,278) | 2,213 | 10,979,534 |
| Vanguard Total | ||||||||
| International Bond | ||||||||
| Index Fund | 3,889,558 | 703,492 | 9,719 | — | (4,443) | 93,165 | — | 4,578,888 |
| Vanguard Total | ||||||||
| International Stock | ||||||||
| Index Fund | 9,504,320 | 1,467,180 | 429,764 | 14,905 | (132,610) | 273,404 | — | 10,424,031 |
| Vanguard Total | ||||||||
| Stock Market | ||||||||
| Index Fund | 14,384,000 | 962,363 | 1,684,005 | 211,937 | 2,008,733 | 261,047 | — | 15,883,028 |
| Total | 37,126,002 | 6,239,845 | 3,180,679 | 226,830 | 1,462,402 | 898,335 | 2,213 | 41,865,484 |
| 1 Not applicable—purchases and sales are for temporary cash investment purposes. | ||||||||
G. Management has determined that no events or transactions occurred subsequent to September 30, 2018, that would require recognition or disclosure in these financial statements.
53
Target Retirement 2030 Fund
Fund Profile
As of September 30, 2018
| Total Fund Characteristics | |
| Ticker Symbol | VTHRX |
| 30-Day SEC Yield | 2.17% |
| Acquired Fund Fees and Expenses1 | 0.14% |
| Allocation to Underlying Vanguard Funds | |
| Vanguard Total Stock Market Index Fund | |
| Investor Shares | 42.2% |
| Vanguard Total International Stock Index | |
| Fund Investor Shares | 28.0 |
| Vanguard Total Bond Market II Index Fund | |
| Investor Shares | 21.1 |
| Vanguard Total International Bond Index | |
| Fund Investor Shares | 8.7 |
| Total Fund Volatility Measures | ||
| MSCI US | ||
| Target 2030 | Broad | |
| Composite | Market | |
| Index | Index | |
| R-Squared | 0.99 | 0.88 |
| Beta | 0.97 | 0.66 |
These measures show the degree and timing of the fund’s fluctuations compared with the indexes over 36 months.
Fund Asset Allocation
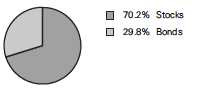
1 This figure—drawn from the prospectus dated January 25, 2018—represents an estimate of the weighted average of the expense ratios and any transaction fees charged by the underlying mutual funds (the ”acquired” funds) in which the Target Retirement 2030 Fund invests. The fund does not charge any expenses or fees of its own. For the fiscal year ended September 30, 2018, the acquired fund fees and expenses were 0.14%.
54
Target Retirement 2030 Fund
Performance Summary
All of the returns in this report represent past performance, which is not a guarantee of future results that may be achieved by the fund. (Current performance may be lower or higher than the performance data cited. For performance data current to the most recent month-end, visit our website at vanguard.com/performance.) Note, too, that both investment returns and principal value can fluctuate widely, so an investor’s shares, when sold, could be worth more or less than their original cost. The returns shown do not reflect taxes that a shareholder would pay on fund distributions or on the sale of fund shares.
Cumulative Performance: September 30, 2008, Through September 30, 2018
Initial Investment of $10,000
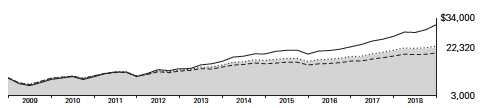
| Average Annual Total Returns | ||||
| Periods Ended September 30, 2018 | ||||
| Final Value | ||||
| One | Five | Ten | of a $10,000 | |
| Year | Years | Years | Investment | |
| Target Retirement 2030 Fund* | 7.65% | 8.13% | 8.36% | $22,320 |
| Target 2030 Composite Index | 7.94 | 8.37 | 8.57 | 22,755 |
| Mixed-Asset Target 2030 Funds | ||||
| Average | 6.64 | 6.87 | 7.18 | 20,014 |
| MSCI US Broad Market Index | 17.62 | 13.52 | 12.12 | 31,391 |
For a benchmark description, see the Glossary.
Mixed-Asset Target 2030 Funds Average: Derived from data provided by Lipper, a Thomson Reuters Company.
See Financial Highlights for dividend and capital gains information.
55
Target Retirement 2030 Fund
Fiscal-Year Total Returns (%): September 30, 2008, Through September 30, 2018
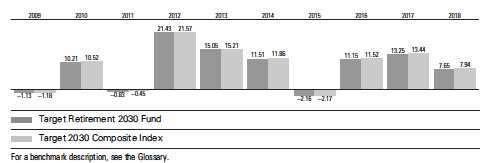
56
Target Retirement 2030 Fund
Financial Statements
Statement of Net Assets
As of September 30, 2018
The fund reports a complete list of its holdings in regulatory filings four times in each fiscal year, at the quarter-ends. For the second and fourth fiscal quarters, the lists appear in the fund’s semiannual and annual reports to shareholders. For the first and third fiscal quarters, the fund files the lists with the Securities and Exchange Commission on Form N-Q. Shareholders can look up the fund’s Forms N-Q on the SEC’s website at sec.gov. Forms N-Q may also be reviewed and copied at the SEC’s Public Reference Room (see the back cover of this report for further information).
| Market | ||
| Value• | ||
| Shares | ($000) | |
| Investment Companies (100.0%) | ||
| U.S. Stock Fund (42.2%) | ||
| Vanguard Total Stock Market Index Fund Investor Shares | 208,133,424 | 15,156,276 |
| International Stock Fund (28.0%) | ||
| Vanguard Total International Stock Index Fund Investor Shares | 578,795,853 | 10,047,896 |
| U.S. Bond Fund (21.1%) | ||
| 1 Vanguard Total Bond Market II Index Fund Investor Shares | 735,246,995 | 7,595,101 |
| International Bond Fund (8.7%) | ||
| Vanguard Total International Bond Index Fund Investor Shares | 286,270,044 | 3,114,618 |
| Total Investment Companies (Cost $26,186,619) | 35,913,891 | |
| Temporary Cash Investment (0.0%) | ||
| Money Market Fund (0.0%) | ||
| 1 Vanguard Market Liquidity Fund, 2.209% (Cost $1,900) | 18,996 | 1,900 |
| Total Investments (100.0%) (Cost $26,188,519) | 35,915,791 | |
| Other Assets and Liabilities (0.0%) | ||
| Other Assets | 88,329 | |
| Liabilities | (90,628) | |
| (2,299) | ||
| Net Assets (100%) | ||
| Applicable to 1,033,737,250 outstanding $.001 par value shares of | ||
| beneficial interest (unlimited authorization) | 35,913,492 | |
| Net Asset Value Per Share | $34.74 | |
57
| Target Retirement 2030 Fund | |
| Amount | |
| ($000) | |
| Statement of Assets and Liabilities | |
| Assets | |
| Investments in Securities, at Value—Affiliated Funds | 35,915,791 |
| Receivables for Investment Securities Sold | 19,409 |
| Receivables for Accrued Income | 20,447 |
| Receivables for Capital Shares Issued | 48,473 |
| Total Assets | 36,004,120 |
| Liabilities | |
| Payables for Investment Securities Purchased | 20,068 |
| Payables for Capital Shares Redeemed | 70,560 |
| Total Liabilities | 90,628 |
| Net Assets | 35,913,492 |
| At September 30, 2018, net assets consisted of: | |
| Amount | |
| ($000) | |
| Paid-in Capital | 25,619,959 |
| Undistributed Net Investment Income | 495,664 |
| Accumulated Net Realized Gains | 70,597 |
| Unrealized Appreciation (Depreciation) | 9,727,272 |
| Net Assets | 35,913,492 |
• See Note A in Notes to Financial Statements.
1 Affiliated fund available only to Vanguard funds and certain trusts and accounts managed by Vanguard. Rate shown for Vanguard
Market Liquidity Fund is the 7-day yield.
See accompanying Notes, which are an integral part of the Financial Statements.
58
| Target Retirement 2030 Fund | |
| Statement of Operations | |
| Year Ended | |
| September 30, 2018 | |
| ($000) | |
| Investment Income | |
| Income | |
| Income Distributions Received from Affiliated Funds | 750,650 |
| Other Income | 377 |
| Net Investment Income—Note B | 751,027 |
| Realized Net Gain (Loss) | |
| Capital Gain Distributions Received from Affiliated Funds | 1,462 |
| Affiliated Funds Sold | 71,401 |
| Futures Contracts | 110 |
| Realized Net Gain (Loss) | 72,973 |
| Change in Unrealized Appreciation (Depreciation) from Affiliated Funds | 1,620,004 |
| Net Increase (Decrease) in Net Assets Resulting from Operations | 2,444,004 |
See accompanying Notes, which are an integral part of the Financial Statements.
59
| Target Retirement 2030 Fund | ||
| Statement of Changes in Net Assets | ||
| Year Ended September 30, | ||
| 2018 | 2017 | |
| ($000) | ($000) | |
| Increase (Decrease) in Net Assets | ||
| Operations | ||
| Net Investment Income | 751,027 | 614,498 |
| Realized Net Gain (Loss) | 72,973 | 33,094 |
| Change in Unrealized Appreciation (Depreciation) | 1,620,004 | 2,880,568 |
| Net Increase (Decrease) in Net Assets Resulting from Operations | 2,444,004 | 3,528,160 |
| Distributions | ||
| Net Investment Income | (643,271) | (497,511) |
| Realized Capital Gain1 | (18,256) | (103,476) |
| Total Distributions | (661,527) | (600,987) |
| Capital Share Transactions | ||
| Issued | 8,378,602 | 8,474,068 |
| Issued in Lieu of Cash Distributions | 651,753 | 591,348 |
| Redeemed | (5,776,550) | (6,081,063) |
| Net Increase (Decrease) from Capital Share Transactions | 3,253,805 | 2,984,353 |
| Total Increase (Decrease) | 5,036,282 | 5,911,526 |
| Net Assets | ||
| Beginning of Period | 30,877,210 | 24,965,684 |
| End of Period2 | 35,913,492 | 30,877,210 |
1 Includes fiscal 2018 and 2017 short-term gain distributions totaling $15,085,000 and $33,427,000, respectively. Short-term gain
distributions are treated as ordinary income dividends for tax purposes.
2 Net Assets—End of Period includes undistributed (overdistributed) net investment income of $495,664,000 and $411,884,000.
See accompanying Notes, which are an integral part of the Financial Statements.
60
| Target Retirement 2030 Fund | |||||
| Financial Highlights | |||||
| For a Share Outstanding | Year Ended September 30, | ||||
| Throughout Each Period | 2018 | 2017 | 2016 | 2015 | 2014 |
| Net Asset Value, Beginning of Period | $32.93 | $29.77 | $27.77 | $28.95 | $26.46 |
| Investment Operations | |||||
| Net Investment Income | .7541 | .6831 | .634 | .633 | .613 |
| Capital Gain Distributions Received | .0011 | .0061 | .008 | .016 | .002 |
| Net Realized and Unrealized Gain (Loss) | |||||
| on Investments | 1.744 | 3.167 | 2.390 | (1.242) | 2.402 |
| Total from Investment Operations | 2.499 | 3.856 | 3.032 | (.593) | 3.017 |
| Distributions | |||||
| Dividends from Net Investment Income | (.670) | (.576) | (.597) | (.558) | (.491) |
| Distributions from Realized Capital Gains | (.019) | (.120) | (.435) | (.029) | (.036) |
| Total Distributions | (.689) | (.696) | (1.032) | (.587) | (.527) |
| Net Asset Value, End of Period | $34.74 | $32.93 | $29.77 | $27.77 | $28.95 |
| Total Return2 | 7.65% | 13.25% | 11.15% | -2.16% | 11.51% |
| Ratios/Supplemental Data | |||||
| Net Assets, End of Period (Millions) | $35,913 | $30,877 | $24,966 | $22,684 | $23,085 |
| Ratio of Total Expenses to Average Net Assets | — | — | — | — | — |
| Acquired Fund Fees and Expenses | 0.14% | 0.14% | 0.15% | 0.15% | 0.17% |
| Ratio of Net Investment Income to | |||||
| Average Net Assets | 2.22% | 2.21% | 2.20% | 2.08% | 2.16% |
| Portfolio Turnover Rate | 9% | 9% | 16% | 24% | 7% |
1 Calculated based on average shares outstanding.
2 Total returns do not include account service fees that may have applied in the periods shown. Fund prospectuses provide information
about any applicable account service fees.
See accompanying Notes, which are an integral part of the Financial Statements.
61
Target Retirement 2030 Fund
Notes to Financial Statements
Vanguard Target Retirement 2030 Fund is registered under the Investment Company Act of 1940 as an open-end investment company, or mutual fund. The fund follows a balanced investment strategy by investing in selected Vanguard funds to achieve its targeted allocation of assets to U.S. and international stocks, and U.S. and international bonds. Financial statements and other information about each underlying fund are available on vanguard.com.
A. The following significant accounting policies conform to generally accepted accounting principles for U.S. investment companies. The fund consistently follows such policies in preparing its financial statements.
1. Security Valuation: Investments are valued at the net asset value of each underlying Vanguard fund determined as of the close of the New York Stock Exchange (generally 4 p.m., Eastern time) on the valuation date.
2. Futures Contracts: The fund uses stock and bond futures contracts to a limited extent, with the objectives of maintaining full exposure to the market and maintaining its target asset allocation. The primary risks associated with the use of futures contracts are imperfect correlation between changes in market values of investments held by the fund and the prices of futures contracts, and the possibility of an illiquid market. Counterparty risk involving futures is mitigated because a regulated clearinghouse is the counterparty instead of the clearing broker. To further mitigate counterparty risk, the fund trades futures contracts on an exchange, monitors the financial strength of its clearing brokers and clearinghouse, and has entered into clearing agreements with its clearing brokers. The clearinghouse imposes initial margin requirements to secure the fund’s performance and requires daily settlement of variation margin representing changes in the market value of each contract. Any assets pledged as initial margin for open contracts are noted in the Statement of Net Assets.
Futures contracts are valued at their quoted daily settlement prices. The notional amounts of the contracts are not recorded in the Statement of Net Assets. Fluctuations in the value of the contracts are recorded in the Statement of Assets and Liabilities as an asset (liability) and in the Statement of Operations as unrealized appreciation (depreciation) until the contracts are closed, when they are recorded as realized futures gains (losses).
During the year ended September 30, 2018, the fund’s average investments in long and short futures contracts represented less than 1% and 0% of net assets, respectively, based on the average of the notional amounts at each quarter-end during the period. The fund had no open futures contracts at September 30, 2018.
3. Federal Income Taxes: The fund intends to continue to qualify as a regulated investment company and distribute all of its taxable income. Management has analyzed the fund’s tax positions taken for all open federal income tax years (September 30, 2015–2018), and has concluded that no provision for federal income tax is required in the fund’s financial statements.
4. Distributions: Distributions to shareholders are recorded on the ex-dividend date. Distributions are determined on a tax basis and may differ from net investment income and realized capital gains for financial reporting purposes.
62
Target Retirement 2030 Fund
5. Credit Facility: The fund and certain other funds managed by The Vanguard Group (“Vanguard”) participate in a $3.1 billion committed credit facility provided by a syndicate of lenders pursuant to a credit agreement that may be renewed annually; each fund is individually liable for its borrowings, if any, under the credit facility. Borrowings may be utilized for temporary and emergency purposes, and are subject to the fund’s regulatory and contractual borrowing restrictions. The participating funds are charged administrative fees and an annual commitment fee of 0.10% of the undrawn amount of the facility; these fees are allocated to the funds based on a method approved by the fund’s board of trustees and borne by the funds in which the fund invests (see Note B). Any borrowings under this facility bear interest at a rate based upon the higher of the one-month London Interbank Offered Rate, federal funds effective rate, or overnight bank funding rate plus an agreed-upon spread.
The fund had no borrowings outstanding at September 30, 2018, or at any time during the period then ended.
6. Other: Income and capital gain distributions received are recorded on the ex-dividend date. Security transactions are accounted for on the date securities are bought or sold. Costs used to determine realized gains (losses) on the sale of investment securities are those of the specific securities sold.
B. In accordance with the terms of a Funds’ Service Agreement (the “FSA”) between Vanguard and the fund, Vanguard furnishes to the fund investment advisory, corporate management, administrative, marketing, and distribution services at Vanguard’s cost of operations (as defined by the FSA). These costs of operations are allocated to the fund based on methods and guidelines approved by the board of trustees. The FSA provides that expenses otherwise allocable to Vanguard funds-of-funds may be reduced or eliminated to the extent of savings realized by the underlying Vanguard funds by virtue of being part of a fund-of-funds. Accordingly, all expenses for services provided by Vanguard to the fund and all other expenses incurred by the fund during the period ended September 30, 2018, were borne by the underlying Vanguard funds in which the fund invests. The fund’s trustees and officers are also trustees and officers, respectively, of the underlying Vanguard funds, as well as directors and employees, respectively, of Vanguard.
C. Various inputs may be used to determine the value of the fund’s investments. These inputs are summarized in three broad levels for financial statement purposes. The inputs or methodologies used to value securities are not necessarily an indication of the risk associated with investing in those securities.
Level 1—Quoted prices in active markets for identical securities.
Level 2—Other significant observable inputs (including quoted prices for similar securities, interest rates, prepayment speeds, credit risk, etc.).
Level 3—Significant unobservable inputs (including the fund’s own assumptions used to determine the fair value of investments). Any investments valued with significant unobservable inputs are noted on the Statement of Net Assets.
At September 30, 2018, 100% of the market value of the fund’s investments was determined based on Level 1 inputs.
63
Target Retirement 2030 Fund
D. Permanent differences between book-basis and tax-basis components of net assets are reclassified among capital accounts in the financial statements to reflect their tax character. These reclassifications have no effect on net assets or net asset value per share. As of period end, the following permanent differences primarily attributable to the accounting for distributions in connection with fund share redemptions were reclassified to the following accounts:
| Amount | |
| ($000) | |
| Paid-in Capital | 26,244 |
| Undistributed (Overdistributed) Net Investment Income | (23,976) |
| Accumulated Net Realized Gains (Losses) | (2,268) |
Temporary differences between book-basis and tax-basis components of accumulated net earnings (losses) arise when certain items of income, gain, or loss are recognized in different periods for financial statement and tax purposes; these differences will reverse at some time in the future. The differences are primarily related to the tax deferral of losses on wash sales. As of period end, the tax-basis components of accumulated net earnings (losses) are detailed in the table as follows:
| Amount | |
| ($000) | |
| Undistributed Ordinary Income | 559,708 |
| Undistributed Long-Term Gains | 6,553 |
| Capital Loss Carryforwards (Non-expiring) | — |
| Net Unrealized Gains (Losses) | 9,727,272 |
As of September 30, 2018, gross unrealized appreciation and depreciation for investments and derivatives based on cost for U.S. federal income tax purposes were as follows:
| Amount | |
| ($000) | |
| Tax Cost | 26,188,519 |
| Gross Unrealized Appreciation | 9,973,456 |
| Gross Unrealized Depreciation | (246,184) |
| Net Unrealized Appreciation (Depreciation) | 9,727,272 |
64
| Target Retirement 2030 Fund | ||
| E. Capital shares issued and redeemed were: | ||
| Year Ended September 30, | ||
| 2018 | 2017 | |
| Shares | Shares | |
| (000) | (000) | |
| Issued | 246,657 | 275,820 |
| Issued in Lieu of Cash Distributions | 19,346 | 20,272 |
| Redeemed | (169,972) | (197,141) |
| Net Increase (Decrease) in Shares Outstanding | 96,031 | 98,951 |
F. Transactions during the period in affiliated underlying Vanguard funds were as follows:
| Current Period Transactions | ||||||||
| Sept. 30, | Proceeds | Realized | Sept. 30, | |||||
| 2017 | from | Net | Change in | Capital Gain | 2018 | |||
| Market | Purchases | Securities | Gain | Unrealized | Distributions | Market | ||
| Value | at Cost | Sold | (Loss) | App. (Dep.) | Income | Received | Value | |
| ($000) | ($000) | ($000) | ($000) | ($000) | ($000) | ($000) | ($000) | |
| Vanguard Market | ||||||||
| Liquidity Fund | 16,347 | NA1 | NA1 | (7) | — | 120 | — | 1,900 |
| Vanguard Total | ||||||||
| Bond Market II | ||||||||
| Index Fund | 6,203,572 | 2,820,825 | 1,154,266 | 310 | (275,340) | 182,470 | 1,462 | 7,595,101 |
| Vanguard Total | ||||||||
| International Bond | ||||||||
| Index Fund | 2,547,466 | 615,313 | 45,441 | (157) | (2,563) | 62,297 | — | 3,114,618 |
| Vanguard Total | ||||||||
| International | ||||||||
| Stock Index Fund | 8,796,361 | 1,727,565 | 360,839 | 8,926 | (124,117) | 259,346 | — | 10,047,896 |
| Vanguard Total | ||||||||
| Stock Market | ||||||||
| Index Fund | 13,333,026 | 1,086,810 | 1,347,913 | 62,329 | 2,022,024 | 246,417 | — | 15,156,276 |
| Total | 30,896,772 | 6,250,513 | 2,908,459 | 71,401 | 1,620,004 | 750,650 | 1,462 | 35,915,791 |
| 1 Not applicable—purchases and sales are for temporary cash investment purposes. | ||||||||
G. Management has determined that no events or transactions occurred subsequent to September 30, 2018, that would require recognition or disclosure in these financial statements.
65
Target Retirement 2035 Fund
Fund Profile
As of September 30, 2018
| Total Fund Characteristics | |
| Ticker Symbol | VTTHX |
| 30-Day SEC Yield | 2.15% |
| Acquired Fund Fees and Expenses1 | 0.14% |
| Allocation to Underlying Vanguard Funds | |
| Vanguard Total Stock Market Index Fund | |
| Investor Shares | 46.8% |
| Vanguard Total International Stock Index | |
| Fund Investor Shares | 30.9 |
| Vanguard Total Bond Market II Index Fund | |
| Investor Shares | 15.8 |
| Vanguard Total International Bond Index | |
| Fund Investor Shares | 6.5 |
| Total Fund Volatility Measures | ||
| MSCI US | ||
| Target 2035 | Broad | |
| Composite | Market | |
| Index | Index | |
| R-Squared | 0.99 | 0.89 |
| Beta | 0.97 | 0.73 |
These measures show the degree and timing of the fund’s fluctuations compared with the indexes over 36 months.
Fund Asset Allocation
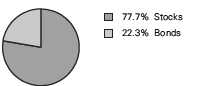
1 This figure—drawn from the prospectus dated January 25, 2018—represents an estimate of the weighted average of the expense ratios and any transaction fees charged by the underlying mutual funds (the ”acquired” funds) in which the Target Retirement 2035 Fund invests. The fund does not charge any expenses or fees of its own. For the fiscal year ended September 30, 2018, the acquired fund fees and expenses were 0.14%.
66
Target Retirement 2035 Fund
Performance Summary
All of the returns in this report represent past performance, which is not a guarantee of future results that may be achieved by the fund. (Current performance may be lower or higher than the performance data cited. For performance data current to the most recent month-end, visit our website at vanguard.com/performance.) Note, too, that both investment returns and principal value can fluctuate widely, so an investor’s shares, when sold, could be worth more or less than their original cost. The returns shown do not reflect taxes that a shareholder would pay on fund distributions or on the sale of fund shares.
Cumulative Performance: September 30, 2008, Through September 30, 2018
Initial Investment of $10,000
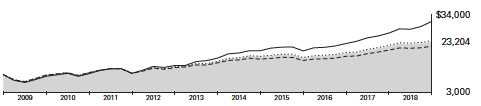
| Average Annual Total Returns | |||||
| Periods Ended September 30, 2018 | |||||
| Final Value | |||||
| One | Five | Ten | of a $10,000 | ||
| Year | Years | Years | Investment | ||
| Target Retirement 2035 Fund* | 8.51% | 8.69% | 8.78% | $23,204 | |
| • | Target 2035 Composite Index | 8.80 | 8.93 | 8.99 | 23,663 |
| – | Mixed-Asset Target 2035 Funds | ||||
| Average | 7.90 | 7.73 | 7.92 | 21,430 | |
| MSCI US Broad Market Index | 17.62 | 13.52 | 12.12 | 31,391 | |
For a benchmark description, see the Glossary.
Mixed-Asset Target 2035 Funds Average: Derived from data provided by Lipper, a Thomson Reuters Company.
See Financial Highlights for dividend and capital gains information.
67
Target Retirement 2035 Fund
Fiscal-Year Total Returns (%): September 30, 2008, Through September 30, 2018
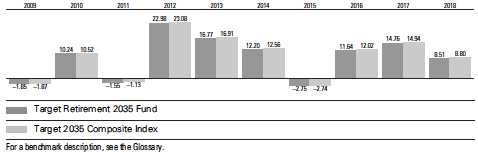
68
Target Retirement 2035 Fund
Financial Statements
Statement of Net Assets
As of September 30, 2018
The fund reports a complete list of its holdings in regulatory filings four times in each fiscal year, at the quarter-ends. For the second and fourth fiscal quarters, the lists appear in the fund’s semiannual and annual reports to shareholders. For the first and third fiscal quarters, the fund files the lists with the Securities and Exchange Commission on Form N-Q. Shareholders can look up the fund’s Forms N-Q on the SEC’s website at sec.gov. Forms N-Q may also be reviewed and copied at the SEC’s Public Reference Room (see the back cover of this report for further information).
| Market | ||
| Value• | ||
| Shares | ($000) | |
| Investment Companies (100.0%) | ||
| U.S. Stock Fund (46.8%) | ||
| Vanguard Total Stock Market Index Fund Investor Shares | 221,946,262 | 16,162,127 |
| International Stock Fund (30.9%) | ||
| Vanguard Total International Stock Index Fund Investor Shares | 613,645,357 | 10,652,883 |
| U.S. Bond Fund (15.8%) | ||
| 1 Vanguard Total Bond Market II Index Fund Investor Shares | 529,842,404 | 5,473,272 |
| International Bond Fund (6.5%) | ||
| Vanguard Total International Bond Index Fund Investor Shares | 205,620,458 | 2,237,151 |
| Total Investment Companies (Cost $23,753,689) | 34,525,433 | |
| Temporary Cash Investment (0.0%) | ||
| Money Market Fund (0.0%) | ||
| 1 Vanguard Market Liquidity Fund, 2.209% (Cost $1,202) | 12,020 | 1,202 |
| Total Investments (100.0%) (Cost $23,754,891) | 34,526,635 | |
| Other Assets and Liabilities (0.0%) | ||
| Other Assets | 79,669 | |
| Liabilities | (84,564) | |
| (4,895) | ||
| Net Assets (100%) | ||
| Applicable to 1,608,756,943 outstanding $.001 par value shares of | ||
| beneficial interest (unlimited authorization) | 34,521,740 | |
| Net Asset Value Per Share | $21.46 | |
69
| Target Retirement 2035 Fund | |
| Amount | |
| ($000) | |
| Statement of Assets and Liabilities | |
| Assets | |
| Investments in Securities, at Value—Affiliated Funds | 34,526,635 |
| Receivables for Investment Securities Sold | 37,699 |
| Receivables for Accrued Income | 14,760 |
| Receivables for Capital Shares Issued | 27,210 |
| Total Assets | 34,606,304 |
| Liabilities | |
| Payables for Investment Securities Purchased | 14,475 |
| Payables for Capital Shares Redeemed | 70,089 |
| Total Liabilities | 84,564 |
| Net Assets | 34,521,740 |
| At September 30, 2018, net assets consisted of: | |
| Amount | |
| ($000) | |
| Paid-in Capital | 23,206,962 |
| Undistributed Net Investment Income | 474,506 |
| Accumulated Net Realized Gains | 68,528 |
| Unrealized Appreciation (Depreciation) | 10,771,744 |
| Net Assets | 34,521,740 |
• See Note A in Notes to Financial Statements.
1 Affiliated fund available only to Vanguard funds and certain trusts and accounts managed by Vanguard. Rate shown for Vanguard Market Liquidity Fund is the 7-day yield.
See accompanying Notes, which are an integral part of the Financial Statements.
70
| Target Retirement 2035 Fund | |
| Statement of Operations | |
| Year Ended | |
| September 30, 2018 | |
| ($000) | |
| Investment Income | |
| Income | |
| Income Distributions Received from Affiliated Funds | 714,540 |
| Other Income | 283 |
| Net Investment Income—Note B | 714,823 |
| Realized Net Gain (Loss) | |
| Capital Gain Distributions Received from Affiliated Funds | 1,043 |
| Affiliated Funds Sold | 69,980 |
| Futures Contracts | 194 |
| Realized Net Gain (Loss) | 71,217 |
| Change in Unrealized Appreciation (Depreciation) from Affiliated Funds | 1,827,238 |
| Net Increase (Decrease) in Net Assets Resulting from Operations | 2,613,278 |
See accompanying Notes, which are an integral part of the Financial Statements.
71
| Target Retirement 2035 Fund | ||
| Statement of Changes in Net Assets | ||
| Year Ended September 30, | ||
| 2018 | 2017 | |
| ($000) | ($000) | |
| Increase (Decrease) in Net Assets | ||
| Operations | ||
| Net Investment Income | 714,823 | 597,296 |
| Realized Net Gain (Loss) | 71,217 | 63,546 |
| Change in Unrealized Appreciation (Depreciation) | 1,827,238 | 3,103,907 |
| Net Increase (Decrease) in Net Assets Resulting from Operations | 2,613,278 | 3,764,749 |
| Distributions | ||
| Net Investment Income | (618,358) | (494,222) |
| Realized Capital Gain1 | (49,432) | (187,693) |
| Total Distributions | (667,790) | (681,915) |
| Capital Share Transactions | ||
| Issued | 7,351,952 | 7,084,082 |
| Issued in Lieu of Cash Distributions | 658,556 | 673,009 |
| Redeemed | (5,232,422) | (5,572,365) |
| Net Increase (Decrease) from Capital Share Transactions | 2,778,086 | 2,184,726 |
| Total Increase (Decrease) | 4,723,574 | 5,267,560 |
| Net Assets | ||
| Beginning of Period | 29,798,166 | 24,530,606 |
| End of Period2 | 34,521,740 | 29,798,166 |
1 Includes fiscal 2018 and 2017 short-term gain distributions totaling $21,099,000 and $5,137,000, respectively. Short-term gain
distributions are treated as ordinary income dividends for tax purposes.
2 Net Assets—End of Period includes undistributed (overdistributed) net investment income of $474,506,000 and $398,999,000.
See accompanying Notes, which are an integral part of the Financial Statements.
72
| Target Retirement 2035 Fund | |||||
| Financial Highlights | |||||
| For a Share Outstanding | Year Ended September 30, | ||||
| Throughout Each Period | 2018 | 2017 | 2016 | 2015 | 2014 |
| Net Asset Value, Beginning of Period | $20.20 | $18.09 | $16.95 | $17.79 | $16.16 |
| Investment Operations | |||||
| Net Investment Income | . 4591 | .4181 | .393 | .391 | .359 |
| Capital Gain Distributions Received | .0011 | .0031 | .003 | .007 | .001 |
| Net Realized and Unrealized Gain (Loss) | |||||
| on Investments | 1.243 | 2.180 | 1.530 | (.865) | 1.594 |
| Total from Investment Operations | 1.703 | 2.601 | 1.926 | (.467) | 1.954 |
| Distributions | |||||
| Dividends from Net Investment Income | (.410) | (.356) | (.371) | (.368) | (.324) |
| Distributions from Realized Capital Gains | (.033) | (.135) | (.415) | (.005) | — |
| Total Distributions | (.443) | (.491) | (.786) | (.373) | (.324) |
| Net Asset Value, End of Period | $21.46 | $20.20 | $18.09 | $16.95 | $17.79 |
| Total Return2 | 8.51% | 14.76% | 11.64% | -2.75% | 12.20% |
| Ratios/Supplemental Data | |||||
| Net Assets, End of Period (Millions) | $34,522 | $29,798 | $24,531 | $22,800 | $23,826 |
| Ratio of Total Expenses to Average Net Assets | — | — | — | — | — |
| Acquired Fund Fees and Expenses | 0.14% | 0.14% | 0.15% | 0.15% | 0.18% |
| Ratio of Net Investment Income to | |||||
| Average Net Assets | 2.19% | 2.22% | 2.21% | 2.07% | 2.17% |
| Portfolio Turnover Rate | 8% | 9% | 14% | 23% | 6% |
1 Calculated based on average shares outstanding.
2 Total returns do not include account service fees that may have applied in the periods shown. Fund prospectuses provide information
about any applicable account service fees.
See accompanying Notes, which are an integral part of the Financial Statements.
73
Target Retirement 2035 Fund
Notes to Financial Statements
Vanguard Target Retirement 2035 Fund is registered under the Investment Company Act of 1940 as an open-end investment company, or mutual fund. The fund follows a balanced investment strategy by investing in selected Vanguard funds to achieve its targeted allocation of assets to U.S. and international stocks, and U.S. and international bonds. Financial statements and other information about each underlying fund are available on vanguard.com.
A. The following significant accounting policies conform to generally accepted accounting principles for U.S. investment companies. The fund consistently follows such policies in preparing its financial statements.
1. Security Valuation: Investments are valued at the net asset value of each underlying Vanguard fund determined as of the close of the New York Stock Exchange (generally 4 p.m., Eastern time) on the valuation date.
2. Futures Contracts: The fund uses stock and bond futures contracts to a limited extent, with the objectives of maintaining full exposure to the market and maintaining its target asset allocation. The primary risks associated with the use of futures contracts are imperfect correlation between changes in market values of investments held by the fund and the prices of futures contracts, and the possibility of an illiquid market. Counterparty risk involving futures is mitigated because a regulated clearinghouse is the counterparty instead of the clearing broker. To further mitigate counterparty risk, the fund trades futures contracts on an exchange, monitors the financial strength of its clearing brokers and clearinghouse, and has entered into clearing agreements with its clearing brokers. The clearinghouse imposes initial margin requirements to secure the fund’s performance and requires daily settlement of variation margin representing changes in the market value of each contract. Any assets pledged as initial margin for open contracts are noted in the Statement of Net Assets.
Futures contracts are valued at their quoted daily settlement prices. The notional amounts of the contracts are not recorded in the Statement of Net Assets. Fluctuations in the value of the contracts are recorded in the Statement of Assets and Liabilities as an asset (liability) and in the Statement of Operations as unrealized appreciation (depreciation) until the contracts are closed, when they are recorded as realized futures gains (losses).
During the year ended September 30, 2018, the fund’s average investments in long and short futures contracts represented less than 1% and 0% of net assets, respectively, based on the average of the notional amounts at each quarter-end during the period. The fund had no open futures contracts at September 30, 2018.
3. Federal Income Taxes: The fund intends to continue to qualify as a regulated investment company and distribute all of its taxable income. Management has analyzed the fund’s tax positions taken for all open federal income tax years (September 30, 2015–2018), and has concluded that no provision for federal income tax is required in the fund’s financial statements.
4. Distributions: Distributions to shareholders are recorded on the ex-dividend date. Distributions are determined on a tax basis and may differ from net investment income and realized capital gains for financial reporting purposes.
74
Target Retirement 2035 Fund
5. Credit Facility: The fund and certain other funds managed by The Vanguard Group (“Vanguard”) participate in a $3.1 billion committed credit facility provided by a syndicate of lenders pursuant to a credit agreement that may be renewed annually; each fund is individually liable for its borrowings, if any, under the credit facility. Borrowings may be utilized for temporary and emergency purposes, and are subject to the fund’s regulatory and contractual borrowing restrictions. The participating funds are charged administrative fees and an annual commitment fee of 0.10% of the undrawn amount of the facility; these fees are allocated to the funds based on a method approved by the fund’s board of trustees and borne by the funds in which the fund invests (see Note B). Any borrowings under this facility bear interest at a rate based upon the higher of the one-month London Interbank Offered Rate, federal funds effective rate, or overnight bank funding rate plus an agreed-upon spread.
The fund had no borrowings outstanding at September 30, 2018, or at any time during the period then ended.
6. Other: Income and capital gain distributions received are recorded on the ex-dividend date. Security transactions are accounted for on the date securities are bought or sold. Costs used to determine realized gains (losses) on the sale of investment securities are those of the specific securities sold.
B. In accordance with the terms of a Funds’ Service Agreement (the “FSA”) between Vanguard and the fund, Vanguard furnishes to the fund investment advisory, corporate management, administrative, marketing, and distribution services at Vanguard’s cost of operations (as defined by the FSA). These costs of operations are allocated to the fund based on methods and guidelines approved by the board of trustees. The FSA provides that expenses otherwise allocable to Vanguard funds-of-funds may be reduced or eliminated to the extent of savings realized by the underlying Vanguard funds by virtue of being part of a fund-of-funds. Accordingly, all expenses for services provided by Vanguard to the fund and all other expenses incurred by the fund during the period ended September 30, 2018, were borne by the underlying Vanguard funds in which the fund invests. The fund’s trustees and officers are also trustees and officers, respectively, of the underlying Vanguard funds, as well as directors and employees, respectively, of Vanguard.
C. Various inputs may be used to determine the value of the fund’s investments. These inputs are summarized in three broad levels for financial statement purposes. The inputs or methodologies used to value securities are not necessarily an indication of the risk associated with investing in those securities.
Level 1—Quoted prices in active markets for identical securities.
Level 2—Other significant observable inputs (including quoted prices for similar securities, interest rates, prepayment speeds, credit risk, etc.).
Level 3—Significant unobservable inputs (including the fund’s own assumptions used to determine the fair value of investments). Any investments valued with significant unobservable inputs are noted on the Statement of Net Assets.
At September 30, 2018, 100% of the market value of the fund’s investments was determined based on Level 1 inputs.
75
Target Retirement 2035 Fund
D. Permanent differences between book-basis and tax-basis components of net assets are reclassified among capital accounts in the financial statements to reflect their tax character. These reclassifications have no effect on net assets or net asset value per share. As of period end, the following permanent differences primarily attributable to the accounting for distributions in connection with fund share redemptions were reclassified to the following accounts:
| Amount | |
| ($000) | |
| Paid-in Capital | 22,994 |
| Undistributed (Overdistributed) Net Investment Income | (20,958) |
| Accumulated Net Realized Gains (Losses) | (2,036) |
Temporary differences between book-basis and tax-basis components of accumulated net earnings (losses) arise when certain items of income, gain, or loss are recognized in different periods for financial statement and tax purposes; these differences will reverse at some time in the future. The differences are primarily related to the tax deferral of losses on wash sales. As of period end, the tax-basis components of accumulated net earnings (losses) are detailed in the table as follows:
| Amount | |
| ($000) | |
| Undistributed Ordinary Income | 538,896 |
| Undistributed Long-Term Gains | 4,138 |
| Capital Loss Carryforwards (Non-expiring) | — |
| Net Unrealized Gains (Losses) | 10,771,744 |
As of September 30, 2018, gross unrealized appreciation and depreciation for investments and derivatives based on cost for U.S. federal income tax purposes were as follows:
| Amount | |
| ($000) | |
| Tax Cost | 23,754,891 |
| Gross Unrealized Appreciation | 10,953,357 |
| Gross Unrealized Depreciation | (181,613) |
| Net Unrealized Appreciation (Depreciation) | 10,771,744 |
76
| Target Retirement 2035 Fund | ||
| E. Capital shares issued and redeemed were: | ||
| Year Ended September 30, | ||
| 2018 | 2017 | |
| Shares | Shares | |
| (000) | (000) | |
| Issued | 351,488 | 378,037 |
| Issued in Lieu of Cash Distributions | 31,768 | 37,980 |
| Redeemed | (249,802) | (296,871) |
| Net Increase (Decrease) in Shares Outstanding | 133,454 | 119,146 |
F. Transactions during the period in affiliated underlying Vanguard funds were as follows:
| Current Period Transactions | ||||||||
| Sept. 30, | Proceeds | Realized | Sept. 30, | |||||
| 2017 | from | Net | Change in | Capital Gain | 2018 | |||
| Market | Purchases | Securities | Gain | Unrealized | Distributions | Market | ||
| Value | at Cost | Sold | (Loss) | App. (Dep.) | Income | Received | Value | |
| ($000) | ($000) | ($000) | ($000) | ($000) | ($000) | ($000) | ($000) | |
| Vanguard Market | ||||||||
| Liquidity Fund | 15,625 | NA1 | NA1 | (16) | — | 107 | — | 1,202 |
| Vanguard Total | ||||||||
| Bond Market II | ||||||||
| Index Fund | 4,405,128 | 2,086,657 | 821,147 | — | (197,366) | 131,039 | 1,043 | 5,473,272 |
| Vanguard Total | ||||||||
| International Bond | ||||||||
| Index Fund | 1,835,053 | 460,913 | 56,735 | (226) | (1,854) | 44,828 | — | 2,237,151 |
| Vanguard Total | ||||||||
| International | ||||||||
| Stock Index Fund | 9,355,903 | 1,825,618 | 402,470 | 10,545 | (136,713) | 276,062 | — | 10,652,883 |
| Vanguard Total | ||||||||
| Stock Market | ||||||||
| Index Fund | 14,200,704 | 1,140,051 | 1,401,476 | 59,677 | 2,163,171 | 262,504 | — | 16,162,127 |
| Total | 29,812,413 | 5,513,239 | 2,681,828 | 69,980 | 1,827,238 | 714,540 | 1,043 34,526,635 | |
| 1 Not applicable—purchases and sales are for temporary cash investment purposes. | ||||||||
G. Management has determined that no events or transactions occurred subsequent to September 30, 2018, that would require recognition or disclosure in these financial statements.
77
Report of Independent Registered Public Accounting Firm
To the Board of Trustees of Vanguard Chester Funds and Shareholders of Vanguard Target Retirement Income Fund, Vanguard Target Retirement 2015 Fund, Vanguard Target Retirement 2020 Fund, Vanguard Target Retirement 2025 Fund, Vanguard Target Retirement 2030 Fund and Vanguard Target Retirement 2035 Fund
Opinions on the Financial Statements
We have audited the accompanying statements of net assets and statements of assets and liabilities of Vanguard Target Retirement Income Fund, Vanguard Target Retirement 2015 Fund, Vanguard Target Retirement 2020 Fund, Vanguard Target Retirement 2025 Fund, Vanguard Target Retirement 2030 Fund and Vanguard Target Retirement 2035 Fund (six of the funds constituting Vanguard Chester Funds, hereafter collectively referred to as the “Funds”) as of September 30, 2018, the related statements of operations for the year ended September 30, 2018, the statements of changes in net assets for each of the two years in the period ended September 30, 2018, including the related notes, and the financial highlights for each of the five years in the period ended September 30, 2018 (collectively referred to as the “financial statements”). In our opinion, the financial statements present fairly, in all material respects, the financial position of each of the Funds as of September 30, 2018, the results of each of their operations for the year then ended, the changes in each of their net assets for each of the two years in the period ended September 30, 2018 and each of the financial highlights for each of the five years in the period ended September 30, 2018 in conformity with accounting principles generally accepted in the United States of America.
Basis for Opinions
These financial statements are the responsibility of the Funds’ management. Our responsibility is to express an opinion on the Funds’ financial statements based on our audits. We are a public accounting firm registered with the Public Company Accounting Oversight Board (United States) (“PCAOB”) and are required to be independent with respect to the Funds in accordance with the U.S. federal securities laws and the applicable rules and regulations of the Securities and Exchange Commission and the PCAOB.
We conducted our audits of these financial statements in accordance with the standards of the PCAOB. Those standards require that we plan and perform the audit to obtain reasonable assurance about whether the financial statements are free of material misstatement, whether due to error or fraud.
Our audits included performing procedures to assess the risks of material misstatement of the financial statements, whether due to error or fraud, and performing procedures that respond to those risks. Such procedures included examining, on a test basis, evidence regarding the amounts and disclosures in the financial statements. Our audits also included evaluating the accounting principles used and significant estimates made by management, as well as evaluating the overall presentation of the financial statements. Our procedures included confirmation of securities owned as of September 30, 2018 by agreement to the underlying ownership records of the transfer agent. We believe that our audits provide a reasonable basis for our opinions.
/s/PricewaterhouseCoopers LLP
Philadelphia, Pennsylvania
November 13, 2018
We have served as the auditor of one or more investment companies in The Vanguard Group of Funds since 1975.
78
Special 2018 tax information (unaudited) for Vanguard Target Retirement Funds
This information for the fiscal year ended September 30, 2018, is included pursuant to provisions of the Internal Revenue Code.
The funds distributed capital gain dividends (from net long-term capital gains) to shareholders during the fiscal year as follows:
| Fund | ($000) |
| Target Retirement Income Fund | 85,930 |
| Target Retirement 2015 Fund | 630,033 |
| Target Retirement 2020 Fund | 262,331 |
| Target Retirement 2025 Fund | 165,541 |
| Target Retirement 2030 Fund | 3,401 |
| Target Retirement 2035 Fund | 28,456 |
For nonresident alien shareholders, 100% of short-term capital gain dividends distributed by the funds are qualified short-term capital gains.
The funds distributed qualified dividend income to shareholders during the fiscal year as follows:
| Fund | ($000) |
| Target Retirement Income Fund | 95,893 |
| Target Retirement 2015 Fund | 121,892 |
| Target Retirement 2020 Fund | 280,998 |
| Target Retirement 2025 Fund | 386,253 |
| Target Retirement 2030 Fund | 362,210 |
| Target Retirement 2035 Fund | 385,207 |
For corporate shareholders, the percentage of investment income (dividend income plus short-term gains, if any) that qualifies for the dividends-received deduction is as follows:
| Fund | Percentage |
| Target Retirement Income Fund | 10.9% |
| Target Retirement 2015 Fund | 15.7 |
| Target Retirement 2020 Fund | 21.0 |
| Target Retirement 2025 Fund | 23.5 |
| Target Retirement 2030 Fund | 26.7 |
| Target Retirement 2035 Fund | 29.6 |
79
The funds designate to shareholders foreign source income and foreign taxes paid as follows:
| Foreign Source Income | Foreign Taxes Paid | |
| Fund | ($000) | ($000) |
| Target Retirement Income Fund | 111,155 | 3,709 |
| Target Retirement 2015 Fund | 127,431 | 5,134 |
| Target Retirement 2020 Fund | 276,852 | 12,725 |
| Target Retirement 2025 Fund | 366,392 | 18,118 |
| Target Retirement 2030 Fund | 322,613 | 17,098 |
| Target Retirement 2035 Fund | 322,944 | 18,128 |
Shareholders will receive more detailed information with their Form 1099-DIV in January 2019 to determine the calendar-year amounts to be included on their 2018 tax returns.
80
Your Fund’s After-Tax Returns
This table presents returns for your fund both before and after taxes. The after-tax returns are shown in two ways: (1) assuming that an investor owned the fund during the entire period and paid taxes on the fund’s distributions, and (2) assuming that an investor paid taxes on the fund’s distributions and sold all shares at the end of each period.
Calculations are based on the highest individual federal income tax and capital gains tax rates in effect at the times of the distributions and the hypothetical sales. State and local taxes were not considered. After-tax returns reflect any qualified dividend income, using actual prior-year figures and estimates for 2018. (In the example, returns after the sale of fund shares may be higher than those assuming no sale. This occurs when the sale would have produced a capital loss. The calculation assumes that the investor received a tax deduction for the loss.) Please note that your actual after-tax returns will depend on your tax situation and may differ from those shown. Also note that if you own the fund in a tax-deferred account, such as an individual retirement account or a 401(k) plan, this information does not apply to you. Such accounts are not subject to current taxes.
Finally, keep in mind that a fund’s performance—whether before or after taxes—does not guarantee future results.
| Average Annual Total Returns: Target Retirement Funds | |||
| Periods Ended September 30, 2018 | |||
| One | Five | Ten | |
| Year | Years | Years | |
| Target Retirement Income Fund | |||
| Returns Before Taxes | 3.31% | 4.52% | 5.67% |
| Returns After Taxes on Distributions | 2.28 | 3.55 | 4.76 |
| Returns After Taxes on Distributions and Sale of Fund Shares | 2.10 | 3.18 | 4.19 |
| One | Five | Ten | |
| Year | Years | Years | |
| Target Retirement 2015 Fund | |||
| Returns Before Taxes | 4.54% | 5.92% | 6.91% |
| Returns After Taxes on Distributions | 2.99 | 4.66 | 5.90 |
| Returns After Taxes on Distributions and Sale of Fund Shares | 3.35 | 4.31 | 5.28 |
| One | Five | Ten | |
| Year | Years | Years | |
| Target Retirement 2020 Fund | |||
| Returns Before Taxes | 5.87% | 6.92% | 7.56% |
| Returns After Taxes on Distributions | 4.98 | 6.07 | 6.81 |
| Returns After Taxes on Distributions and Sale of Fund Shares | 3.72 | 5.16 | 5.88 |
81
| Average Annual Total Returns: Target Retirement Funds | |||
| Periods Ended September 30, 2018 | |||
| One | Five | Ten | |
| Year | Years | Years | |
| Target Retirement 2025 Fund | |||
| Returns Before Taxes | 6.79% | 7.56% | 7.98% |
| Returns After Taxes on Distributions | 5.99 | 6.69 | 7.24 |
| Returns After Taxes on Distributions and Sale of Fund Shares | 4.25 | 5.68 | 6.25 |
| One | Five | Ten | |
| Year | Years | Years | |
| Target Retirement 2030 Fund | |||
| Returns Before Taxes | 7.65% | 8.13% | 8.36% |
| Returns After Taxes on Distributions | 6.98 | 7.38 | 7.73 |
| Returns After Taxes on Distributions and Sale of Fund Shares | 4.72 | 6.17 | 6.62 |
| One | Five | Ten | |
| Year | Years | Years | |
| Target Retirement 2035 Fund | |||
| Returns Before Taxes | 8.51% | 8. % | 8.78% |
| Returns After Taxes on Distributions | 7.83 | 7.90 | 8.14 |
| Returns After Taxes on Distributions and Sale of Fund Shares | 5.26 | 6.64 | 7.00 |
82
About Your Fund’s Expenses
As a shareholder of the fund, you incur ongoing costs, which include costs for portfolio management, administrative services, and shareholder reports (like this one), among others. Operating expenses, which are deducted from a fund’s gross income, directly reduce the investment return of the fund.
A typical fund’s expenses are expressed as a percentage of its average net assets. The Target Retirement Funds have no direct expenses, but each fund bears its proportionate share of the costs for the underlying funds in which it invests. These indirect expenses make up the acquired fund fees and expenses, also expressed as a percentage of average net assets.
The following examples are intended to help you understand the ongoing cost (in dollars) of investing in your fund and to compare these costs with those of other mutual funds. The examples are based on an investment of $1,000 made at the beginning of the period shown and held for the entire period. The costs were calculated using the acquired fund fees and expenses for each Target Retirement Fund.
The accompanying table illustrates your fund’s costs in two ways:
• Based on actual fund return. This section helps you to estimate the actual expenses that you paid over the period. The ”Ending Account Value“ shown is derived from the fund‘s actual return, and the third column shows the dollar amount that would have been paid by an investor who started with $1,000 in the fund. You may use the information here, together with the amount you invested, to estimate the expenses that you paid over the period.
To do so, simply divide your account value by $1,000 (for example, an $8,600 account value divided by $1,000 = 8.6), then multiply the result by the number given for your fund under the heading ”Expenses Paid During Period.“
• Based on hypothetical 5% yearly return. This section is intended to help you compare your fund‘s costs with those of other mutual funds. It assumes that the fund had a yearly return of 5% before expenses, but that the expense ratio is unchanged. In this case—because the return used is not the fund’s actual return—the results do not apply to your investment. The example is useful in making comparisons because the Securities and Exchange Commission requires all mutual funds to calculate expenses based on a 5% return. You can assess your fund’s costs by comparing this hypothetical example with the hypothetical examples that appear in shareholder reports of other funds.
Note that the expenses shown in the table are meant to highlight and help you compare ongoing costs only and do not reflect transaction costs incurred by the fund for buying and selling securities. Further, the expenses do not include any purchase, redemption, or account service fees described in the fund prospectus. If such fees were applied to your account, your costs would be higher. Your fund does not carry a “sales load.”
The calculations assume no shares were bought or sold during the period. Your actual costs may have been higher or lower, depending on the amount of your investment and the timing of any purchases or redemptions.
You can find more information about the fund’s expenses, including annual expense ratios, in the Financial Statements section of this report. For additional information on operating expenses and other shareholder costs, please refer to your fund’s current prospectus.
83
| Six Months Ended September 30, 2018 | |||
| Beginning | Ending | Expenses | |
| Account Value | Account Value | Paid During | |
| 3/31/2018 | 9/30/2018 | Period | |
| Based on Actual Fund Return | |||
| Target Retirement Income Fund | $1,000.00 | $1,017.60 | $0.61 |
| Target Retirement 2015 Fund | $1,000.00 | $1,022.95 | $0.66 |
| Target Retirement 2020 Fund | $1,000.00 | $1,029.80 | $0.66 |
| Target Retirement 2025 Fund | $1,000.00 | $1,034.26 | $0.66 |
| Target Retirement 2030 Fund | $1,000.00 | $1,038.88 | $0.72 |
| Target Retirement 2035 Fund | $1,000.00 | $1,043.27 | $0.72 |
| Based on Hypothetical 5% Yearly Return | |||
| Target Retirement Income Fund | $1,000.00 | $1,024.47 | $0.61 |
| Target Retirement 2015 Fund | $1,000.00 | $1,024.42 | $0.66 |
| Target Retirement 2020 Fund | $1,000.00 | $1,024.42 | $0.66 |
| Target Retirement 2025 Fund | $1,000.00 | $1,024.42 | $0.66 |
| Target Retirement 2030 Fund | $1,000.00 | $1,024.37 | $0.71 |
| Target Retirement 2035 Fund | $1,000.00 | $1,024.37 | $0.71 |
The calculations are based on the acquired fund fees and expenses for the most recent six-month period. The funds’ annualized expense figures for that period are (in order as listed from top to bottom above) 0.12%, 0.13%, 0.13%, 0.13%, 0.14%, and 0.14%. The dollar amounts shown as ”Expenses Paid” are equal to the annualized expense figures for the underlying funds multiplied by the average account value over the period, multiplied by the number of days in the most recent six-month period, then divided by the number of days in the most recent 12-month period (183/365).
84
Glossary
30-Day SEC Yield. A fund’s 30-day SEC yield is derived using a formula specified by the U.S. Securities and Exchange Commission. Under the formula, data related to the fund’s security holdings in the previous 30 days are used to calculate the fund’s hypothetical net income for that period, which is then annualized and divided by the fund’s estimated average net assets over the calculation period. For the purposes of this calculation, a security’s income is based on its current market yield to maturity (for bonds), its actual income (for asset-backed securities), or its projected dividend yield (for stocks). Because the SEC yield represents hypothetical annualized income, it will differ—at times significantly—from the fund’s actual experience. As a result, the fund’s income distributions may be higher or lower than implied by the SEC yield.
Acquired Fund Fees and Expenses. Funds that invest in other Vanguard funds incur no direct expenses, but they do bear proportionate shares of the operating, administrative, and advisory expenses of the underlying funds, and they must pay any fees charged by those funds. The figure for acquired fund fees and expenses represents a weighted average of these underlying costs. Acquired is a term that the Securities and Exchange Commission applies to any mutual fund whose shares are owned by another fund.
Beta. A measure of the magnitude of a fund’s past share-price fluctuations in relation to the ups and downs of a given market index. The index is assigned a beta of 1.00. Compared with a given index, a fund with a beta of 1.20 typically would have seen its share price rise or fall by 12% when the index rose or fell by 10%. For this report, beta is based on returns over the past 36 months for both the fund and the index. Note that a fund’s beta should be reviewed in conjunction with its R-squared (see definition). The lower the R-squared, the less correlation there is between the fund and the index, and the less reliable beta is as an indicator of volatility.
Expense Ratio. A fund’s total annual operating expenses expressed as a percentage of the fund’s average net assets. The expense ratio includes management and administrative expenses, but does not include the transaction costs of buying and selling portfolio securities.
Inception Date. The date on which the assets of a fund (or one of its share classes) are first invested in accordance with the fund’s investment objective. For funds with a subscription period, the inception date is the day after that period ends. Investment performance is measured from the inception date.
R-Squared. A measure of how much of a fund’s past returns can be explained by the returns from the market in general, as measured by a given index. If a fund’s total returns were precisely synchronized with an index’s returns, its R-squared would be 1.00. If the fund’s returns bore no relationship to the index’s returns, its R-squared would be 0. For this report, R-squared is based on returns over the past 36 months for both the fund and the index.
Benchmark Information
Spliced Mixed-Asset Target Today Funds Average: Mixed-Asset Target Conservative Funds Average through June 30, 2012; Mixed-Asset Target Today Funds Average thereafter.
85
Target 2015 Composite Index: Derived by applying the fund’s target asset allocation to the results of the following benchmarks: for international stocks of developed markets, the MSCI EAFE Index through December 15, 2010, the MSCI ACWI ex USA IMI Index through June 2, 2013, and the FTSE Global All Cap ex US Index thereafter; for emerging-market stocks, the Select Emerging Markets Index through August 23, 2006, the MSCI Emerging Markets Index through December 15, 2010, the MSCI ACWI ex USA IMI Index through June 2, 2013, and the FTSE Global All Cap ex US Index thereafter; for U.S. bonds, the Bloomberg Barclays U.S. Aggregate Bond Index through December 31, 2009, and the Bloomberg Barclays U.S. Aggregate Float Adjusted Index thereafter, as well as the Bloomberg Barclays U.S. Treasury Inflation-Protected Securities Index through June 2, 2013, and the Bloomberg Barclays U.S. Treasury Inflation-Protected Securities (TIPS) 0–5 Year Index thereafter; for international bonds, the Bloomberg Barclays Global Aggregate ex-USD Float Adjusted RIC Capped Index beginning June 3, 2013; and for U.S. stocks, the Dow Jones U.S. Total Stock Market Index (formerly known as the Dow Jones Wilshire 5000 Index) through April 22, 2005, the MSCI US Broad Market Index through June 2, 2013, and the CRSP US Total Market Index thereafter. International stock benchmark returns are adjusted for withholding taxes.
Target 2020 Composite Index: Derived by applying the fund’s target asset allocation to the results of the following benchmarks: for international stocks of developed markets, the MSCI EAFE Index through December 15, 2010, the MSCI ACWI ex USA IMI Index through June 2, 2013, and the FTSE Global All Cap ex US Index thereafter; for emerging-market stocks, the Select Emerging Markets Index through August 23, 2006, the MSCI Emerging Markets Index through December 15, 2010, the MSCI ACWI ex USA IMI Index through June 2, 2013, and the FTSE Global All Cap ex US Index thereafter; for U.S. bonds, the Bloomberg Barclays U.S. Aggregate Bond Index through December 31, 2009, and the Bloomberg Barclays U.S. Aggregate Float Adjusted Index thereafter; for international bonds, the Bloomberg Barclays Global Aggregate ex-USD Float Adjusted RIC Capped Index beginning June 3, 2013; and for U.S. stocks, the MSCI US Broad Market Index through June 2, 2013, and the CRSP US Total Market Index thereafter. International stock benchmark returns are adjusted for withholding taxes.
Target 2025 Composite Index: Derived by applying the fund’s target asset allocation to the results of the following benchmarks: for international stocks of developed markets, the MSCI EAFE Index through December 15, 2010, the MSCI ACWI ex USA IMI Index through June 2, 2013, and the FTSE Global All Cap ex US Index thereafter; for emerging-market stocks, the Select Emerging Markets Index through August 23, 2006, the MSCI Emerging Markets Index through December 15, 2010, the MSCI ACWI ex USA IMI Index through June 2, 2013, and the FTSE Global All Cap ex US Index thereafter; for U.S. bonds, the Bloomberg Barclays U.S. Aggregate Bond Index through December 31, 2009, and the Bloomberg Barclays U.S. Aggregate Float Adjusted Index thereafter; for international bonds, the Bloomberg Barclays Global Aggregate ex-USD Float Adjusted RIC Capped Index beginning June 3, 2013; and for U.S. stocks, the Dow Jones U.S. Total Stock Market Index (formerly known as the Dow Jones Wilshire 5000 Index) through April 22, 2005, the MSCI US Broad Market Index through June 2, 2013, and the CRSP US Total Market Index thereafter. International stock benchmark returns are adjusted for withholding taxes.
86
Target 2030 Composite Index: Derived by applying the fund’s target asset allocation to the results of the following benchmarks: for international stocks of developed markets, the MSCI EAFE Index through December 15, 2010, the MSCI ACWI ex USA IMI Index through June 2, 2013, and the FTSE Global All Cap ex US Index thereafter; for emerging-market stocks, the Select Emerging Markets Index through August 23, 2006, the MSCI Emerging Markets Index through December 15, 2010, the MSCI ACWI ex USA IMI Index through June 2, 2013, and the FTSE Global All Cap ex US Index thereafter; for U.S. bonds, the Bloomberg Barclays U.S. Aggregate Bond Index through December 31, 2009, and the Bloomberg Barclays U.S. Aggregate Float Adjusted Index thereafter; for international bonds, the Bloomberg Barclays Global Aggregate ex-USD Float Adjusted RIC Capped Index beginning June 3, 2013; and for U.S. stocks, the MSCI US Broad Market Index through June 2, 2013, and the CRSP US Total Market Index thereafter. International stock benchmark returns are adjusted for withholding taxes.
Target 2035 Composite Index: Derived by applying the fund’s target asset allocation to the results of the following benchmarks: for international stocks of developed markets, the MSCI EAFE Index through December 15, 2010, the MSCI ACWI ex USA IMI Index through June 2, 2013, and the FTSE Global All Cap ex US Index thereafter; for emerging-market stocks, the Select Emerging Markets Index through August 23, 2006, the MSCI Emerging Markets Index through December 15, 2010, the MSCI ACWI ex USA IMI Index through June 2, 2013, and the FTSE Global All Cap ex US Index thereafter; for U.S. bonds, the Bloomberg Barclays U.S. Aggregate Bond Index through December 31, 2009, and the Bloomberg Barclays U.S. Aggregate Float Adjusted Index thereafter; for international bonds, the Bloomberg Barclays Global Aggregate ex-USD Float Adjusted RIC Capped Index beginning June 3, 2013; and for U.S. stocks, the Dow Jones U.S. Total Stock Market Index (formerly known as the Dow Jones Wilshire 5000 Index) through April 22, 2005, the MSCI US Broad Market Index through June 2, 2013, and the CRSP US Total Market Index thereafter. International stock benchmark returns are adjusted for withholding taxes.
87
Target Income Composite Index: Derived by applying the fund’s target asset allocation to the results of the following benchmarks: for international stocks of developed markets, the MSCI EAFE Index through December 15, 2010, the MSCI ACWI ex USA IMI Index through June 2, 2013, and the FTSE Global All Cap ex US Index thereafter; for emerging-market stocks, the Select Emerging Markets Index through August 23, 2006, the MSCI Emerging Markets Index through December 15, 2010, the MSCI ACWI ex USA IMI Index through June 2, 2013, and the FTSE Global All Cap ex US Index thereafter; for U.S. bonds, the Bloomberg Barclays U.S. Aggregate Bond Index through December 31, 2009, and the Bloomberg Barclays U.S. Aggregate Float Adjusted Index thereafter, as well as the Bloomberg Barclays U.S. Treasury Inflation-Protected Securities Index through June 2, 2013, and the Bloomberg Barclays U.S. Treasury Inflation-Protected Securities (TIPS) 0–5 Year Index thereafter; for short-term reserves, the Citigroup Three-Month Treasury Bill Index through June 2, 2013; for international bonds, the Bloomberg Barclays Global Aggregate ex-USD Float Adjusted RIC Capped Index beginning June 3, 2013; and for U.S. stocks, the Dow Jones U.S. Total Stock Market Index (formerly known as the Dow Jones Wilshire 5000 Index) through April 22, 2005, the MSCI US Broad Market Index through June 2, 2013, and the CRSP US Total Market Index thereafter. International stock benchmark returns are adjusted for withholding taxes.
88
BLOOMBERG is a trademark and service mark of Bloomberg Finance L.P. BARCLAYS is a trademark and service mark of Barclays Bank Plc, used under license. Bloomberg Finance L.P. and its affiliates, including Bloomberg Index Services Limited (BISL) (collectively, Bloomberg), or Bloomberg’s licensors, own all proprietary rights in the Bloomberg Barclays U.S. Aggregate Bond Index, Bloomberg Barclays U.S. Aggregate Float Adjusted Index, Bloomberg Barclays U.S. Treasury Inflation Protected Securities Index, Bloomberg Barclays U.S. Treasury Inflation-Protected Securities (TIPS) 0–5 Year Index, and the Bloomberg Barclays Global Aggregate ex-USD Float Adjusted RIC Capped Index (USD Hedged) (the Indices or Bloomberg Barclays Indices).
Neither Barclays Bank Plc, Barclays Capital Inc., or any affiliate (collectively Barclays) or Bloomberg is the issuer or producer of the Target Retirement Funds (including the Total Bond Market II Index Fund, the Total International Bond Index Fund, and the Short-Term Inflation-Protected Securities Index Fund) and neither Bloomberg nor Barclays has any responsibilities, obligations or duties to investors in the Target Retirement Funds. The Indices are licensed for use by The Vanguard Group, Inc. (Vanguard) as the sponsor of the Target Retirement Funds. Bloomberg and Barclays’ only relationship with Vanguard in respect to the Indices is the licensing of the Indices, which is determined, composed and calculated by BISL, or any successor thereto, without regard to the Issuer or the Target Retirement Funds or the owners of the Target Retirement Funds.
Additionally, Vanguard may for itself execute transaction(s) with Barclays in or relating to the Indices in connection with the Target Retirement Funds. Investors acquire the Target Retirement Funds from Vanguard and investors neither acquire any interest in the Indices nor enter into any relationship of any kind whatsoever with Bloomberg or Barclays upon making an investment in the Target Retirement Funds. The Target Retirement Funds are not sponsored, endorsed, sold or promoted by Bloomberg or Barclays. Neither Bloomberg nor Barclays makes any representation or warranty, express or implied regarding the advisability of investing in the Target Retirement Funds or the advisability of investing in securities generally or the ability of the Indices to track corresponding or relative market performance. Neither Bloomberg nor Barclays has passed on the legality or suitability of the Target Retirement Funds with respect to any person or entity. Neither Bloomberg nor Barclays is responsible for and has not participated in the determination of the timing of, prices at, or quantities of the Target Retirement Funds to be issued. Neither Bloomberg nor Barclays has any obligation to take the needs of the Issuer or the owners of the Target Retirement Funds or any other third party into consideration in determining, composing or calculating the Indices. Neither Bloomberg nor Barclays has any obligation or liability in connection with administration, marketing or trading of the Target Retirement Funds.
89
The licensing agreement between Bloomberg and Barclays is solely for the benefit of Bloomberg and Barclays and not for the benefit of the owners of the Target Retirement Funds, investors or other third parties. In addition, the licensing agreement between Vanguard and Bloomberg is solely for the benefit of Vanguard and Bloomberg and not for the benefit of the owners of the Target Retirement Funds, investors or other third parties.
NEITHER BLOOMBERG NOR BARCLAYS SHALL HAVE ANY LIABILITY TO THE ISSUER, INVESTORS OR TO OTHER THIRD PARTIES FOR THE QUALITY, ACCURACY AND/OR COMPLETENESS OF THE BLOOMBERG BARCLAYS INDICES OR ANY DATA INCLUDED THEREIN OR FOR INTERRUPTIONS IN THE DELIVERY OF THE BLOOMBERG BARCLAYS INDICES. NEITHER BLOOMBERG NOR BARCLAYS MAKES ANY WARRANTY, EXPRESS OR IMPLIED, AS TO RESULTS TO BE OBTAINED BY THE ISSUER, THE INVESTORS OR ANY OTHER PERSON OR ENTITY FROM THE USE OF THE BLOOMBERG BARCLAYS INDICES OR ANY DATA INCLUDED THEREIN. NEITHER BLOOMBERG NOR BARCLAYS MAKES ANY EXPRESS OR IMPLIED WARRANTIES, AND EACH HEREBY EXPRESSLY DISCLAIMS ALL WARRANTIES OF MERCHANTABILITY OR FITNESS FOR A PARTICULAR PURPOSE OR USE WITH RESPECT TO BLOOMBERG BARCLAYS INDICES OR ANY DATA INCLUDED THEREIN. BLOOMBERG RESERVES THE RIGHT TO CHANGE THE METHODS OF CALCULATION OR PUBLICATION, OR TO CEASE THE CALCULATION OR PUBLICATION OF THE BLOOMBERG BARCLAYS INDICES, AND NEITHER BLOOMBERG NOR BARCLAYS SHALL BE LIABLE FOR ANY MISCALCULATION OF OR ANY INCORRECT, DELAYED OR INTERRUPTED PUBLICATION WITH RESPECT TO ANY OF THE BLOOMBERG BARCLAYS INDICES. NEITHER BLOOMBERG NOR BARCLAYS SHALL BE LIABLE FOR ANY DAMAGES, INCLUDING, WITHOUT LIMITATION, ANY SPECIAL, INDIRECT OR CONSEQUENTIAL DAMAGES, OR ANY LOST PROFITS AND EVEN IF ADVISED OF THE POSSIBILITY OF SUCH, RESULTING FROM THE USE OF BLOOMBERG BARCLAYS INDICES OR ANY DATA INCLUDED THEREIN OR WITH RESPECT TO THE TARGET RETIREMENT FUNDS.
None of the information supplied by Bloomberg or Barclays and used in this publication may be reproduced in any manner without the prior written permission of both Bloomberg and Barclays Capital, the investment banking division of Barclays Bank Plc. Barclays Bank Plc is registered in England No. 1026167. Registered office 1 Churchill Place London E14 5HP.
© 2018 Bloomberg. Used with Permission.
Source: Bloomberg Index Services Limited. Copyright 2018, Bloomberg. All rights reserved.
90
The People Who Govern Your Fund
The trustees of your mutual fund are there to see that the fund is operated and managed in your best interests since, as a shareholder, you are a part owner of the fund. Your fund’s trustees also serve on the board of directors of The Vanguard Group, Inc., which is owned by the Vanguard funds and provides services to them on an at-cost basis.
A majority of Vanguard’s board members are independent, meaning that they have no affiliation with Vanguard or the funds they oversee, apart from the sizable personal investments they have made as private individuals. The independent board members have distinguished backgrounds in business, academia, and public service. Each of the trustees and executive officers oversees 211 Vanguard funds.
Information for each trustee and executive officer of the fund appears below. The mailing address of the trustees and officers is P.O. Box 876, Valley Forge, PA 19482. More information about the trustees is in the Statement of Additional Information, which can be obtained, without charge, by contacting Vanguard at 800-662-7447, or online at vanguard.com.
Interested Trustees1
F. William McNabb III
Born in 1957. Trustee since July 2009. Principal occupation(s) during the past five years and other experience: chairman of the board (January 2010–present) of Vanguard and of each of the investment companies served by Vanguard, trustee (2009–present) of each of the investment companies served by Vanguard, and director (2008–present) of Vanguard. Chief executive officer and president (2008–2017) of Vanguard and each of the investment companies served by Vanguard, managing director (1995–2008) of Vanguard, and director (1997–2018) of Vanguard Marketing Corporation. Director (2018–present) of UnitedHealth Group.
Mortimer J. Buckley
Born in 1969. Trustee since January 2018. Principal occupation(s) during the past five years and other experience: chief executive officer (January 2018–present) of Vanguard; chief executive officer, president, and trustee (January 2018–present) of each of the investment companies served by Vanguard; president and director (2017–present) of Vanguard; and president (February 2018–present) of Vanguard Marketing Corporation. Chief investment officer (2013–2017), managing director (2002–2017), head of the Retail Investor Group (2006–2012), and chief information officer (2001–2006) of Vanguard. Chairman of the board (2011–2017) of the Children’s Hospital of Philadelphia.
Independent Trustees
Emerson U. Fullwood
Born in 1948. Trustee since January 2008. Principal occupation(s) during the past five years and other experience: executive chief staff and marketing officer for North America and corporate vice president (retired 2008) of Xerox Corporation (document management products and services). Former president of the Worldwide Channels Group, Latin America, and Worldwide Customer Service and executive chief staff officer of Developing Markets of Xerox. Executive in residence and 2009–2010 Distinguished Minett Professor at the Rochester Institute of Technology. Lead director of SPX FLOW, Inc. (multi-industry manufacturing). Director of the University of Rochester Medical Center, the Monroe Community College Foundation, the United Way of Rochester, North Carolina A&T University, and Roberts Wesleyan College. Trustee of the University of Rochester.
Amy Gutmann
Born in 1949. Trustee since June 2006. Principal occupation(s) during the past five years and other experience: president (2004–present) of the University of Pennsylvania. Christopher H. Browne Distinguished Professor of Political Science, School of Arts and Sciences, and professor of communication, Annenberg School for Communication, with secondary faculty appointments in the Department of Philosophy, School of Arts and Sciences, and at the Graduate School of Education, University of Pennsylvania. Trustee of the National Constitution Center.
1 Mr. McNabb and Mr. Buckley are considered “interested persons,” as defined in the Investment Company Act of 1940, because they are officers of the Vanguard funds.
JoAnn Heffernan Heisen
Born in 1950. Trustee since July 1998. Principal occupation(s) during the past five years and other experience: corporate vice president of Johnson & Johnson (pharmaceuticals/medical devices/consumer products) and member of its executive committee (1997–2008). Chief global diversity officer (retired 2008), vice president and chief information officer (1997–2006), controller (1995–1997), treasurer (1991–1995), and assistant treasurer (1989–1991) of Johnson & Johnson. Director of Skytop Lodge Corporation (hotels) and the Robert Wood Johnson Foundation. Member of the advisory board of the Institute for Women’s Leadership at Rutgers University.
F. Joseph Loughrey
Born in 1949. Trustee since October 2009. Principal occupation(s) during the past five years and other experience: president and chief operating officer (retired 2009) and vice chairman of the board (2008–2009) of Cummins Inc. (industrial machinery). Chairman of the board of Hillenbrand, Inc. (specialized consumer services), Oxfam America, and the Lumina Foundation for Education. Director of the V Foundation for Cancer Research. Member of the advisory council for the College of Arts and Letters and chair of the advisory board to the Kellogg Institute for International Studies, both at the University of Notre Dame.
Mark Loughridge
Born in 1953. Trustee since March 2012. Principal occupation(s) during the past five years and other experience: senior vice president and chief financial officer (retired 2013) of IBM (information technology services). Fiduciary member of IBM’s Retirement Plan Committee (2004–2013), senior vice president and general manager (2002–2004) of IBM Global Financing, vice president and controller (1998–2002) of IBM, and a variety of other prior management roles at IBM. Member of the Council on Chicago Booth.
Scott C. Malpass
Born in 1962. Trustee since March 2012. Principal occupation(s) during the past five years and other experience: chief investment officer (1989–present) and vice president (1996–present) of the University of Notre Dame. Assistant professor of finance at the Mendoza College of Business, University of Notre Dame, and member of the Notre Dame 403(b) Investment Committee. Chairman of the board of TIFF Advisory Services, Inc. Member of the board of Catholic Investment Services, Inc. (investment advisors), the board of advisors for Spruceview Capital Partners, and the board of superintendence of the Institute for the Works of Religion.
Deanna Mulligan
Born in 1963. Trustee since January 2018. Principal occupation(s) during the past five years and other experience: president (2010–present) and chief executive officer (2011–present) of The Guardian Life Insurance Company of America. Chief operating officer (2010–2011) and executive vice president (2008–2010) of Individual Life and Disability of The Guardian Life Insurance Company of America. Member of the board of The Guardian Life Insurance Company of America, the American Council of Life Insurers, the Partnership for New York City (business leadership), and the Committee Encouraging Corporate Philanthropy. Trustee of the Economic Club of New York and the Bruce Museum (arts and science). Member of the Advisory Council for the Stanford Graduate School of Business.
André F. Perold
Born in 1952. Trustee since December 2004. Principal occupation(s) during the past five years and other experience: George Gund Professor of Finance and Banking, Emeritus at the Harvard Business School (retired 2011). Chief investment officer and co-managing partner of HighVista Strategies LLC (private investment firm). Overseer of the Museum of Fine Arts Boston.
Sarah Bloom Raskin
Born in 1961. Trustee since January 2018. Principal occupation(s) during the past five years and other experience: deputy secretary (2014–2017) of the United States Department of the Treasury. Governor (2010–2014) of the Federal Reserve Board. Commissioner (2007–2010) of financial regulation for the State of Maryland. Member of the board of directors (2012–2014) of Neighborhood Reinvestment Corporation. Director of i(x) Investments, LLC.
Peter F. Volanakis
Born in 1955. Trustee since July 2009. Principal occupation(s) during the past five years and other experience: president and chief operating officer (retired 2010) of Corning Incorporated (communications equipment) and director of Corning Incorporated (2000–2010) and Dow Corning (2001–2010). Director (2012) of SPX Corporation (multi-industry manufacturing). Overseer of the Amos Tuck School of Business Administration, Dartmouth College (2001–2013). Chairman of the board of trustees of Colby-Sawyer College. Member of the Board of Hypertherm Inc. (industrial cutting systems, software, and consumables).
Executive Officers
Glenn Booraem
Born in 1967. Principal occupation(s) during the past five years and other experience: principal of Vanguard. Investment stewardship officer (2017–present), treasurer (2015–2017), controller (2010–2015), and assistant controller (2001–2010) of each of the investment companies served by Vanguard.
Christine M. Buchanan
Born in 1970. Principal occupation(s) during the past five years and other experience: principal of Vanguard and global head of Fund Administration at Vanguard. Treasurer (2017–present) of each of the investment companies served by Vanguard. Partner (2005–2017) at KPMG LLP (audit, tax, and advisory services).
Brian Dvorak
Born in 1973. Principal occupation(s) during the past five years and other experience: principal of Vanguard. Chief compliance officer (2017–present) of Vanguard and each of the investment companies served by Vanguard. Assistant vice president (2017–present) of Vanguard Marketing Corporation. Vice president and director of Enterprise Risk Management (2011–2013) at Oppenheimer Funds, Inc.
Thomas J. Higgins
Born in 1957. Principal occupation(s) during the past five years and other experience: principal of Vanguard. Chief financial officer (2008–present) and treasurer (1998–2008) of each of the investment companies served by Vanguard.
Peter Mahoney
Born in 1974. Principal occupation(s) during the past five years and other experience: principal of Vanguard. Controller (2015–present) of each of the investment companies served by Vanguard. Head of International Fund Services (2008–2014) at Vanguard.
Anne E. Robinson
Born in 1970. Principal occupation(s) during the past five years and other experience: general counsel (2016–present) of Vanguard. Secretary (2016–present) of Vanguard and of each of the investment companies served by Vanguard. Managing director (2016–present) of Vanguard. Director and senior vice president (2016–2018) of Vanguard Marketing Corporation. Managing director and general counsel of Global Cards and Consumer Services (2014–2016) at Citigroup. Counsel (2003–2014) at American Express.
Michael Rollings
Born in 1963. Principal occupation(s) during the past five years and other experience: finance director (2017–present) and treasurer (2017) of each of the investment companies served by Vanguard. Managing director (2016–present) of Vanguard. Chief financial officer (2016–present) of Vanguard. Director (2016–present) of Vanguard Marketing Corporation. Executive vice president and chief financial officer (2006–2016) of MassMutual Financial Group.
| Vanguard Senior Management Team | |
| Joseph Brennan | Chris D. McIsaac |
| Mortimer J. Buckley | James M. Norris |
| Gregory Davis | Thomas M. Rampulla |
| John James | Karin A. Risi |
| Martha G. King | Anne E. Robinson |
| John T. Marcante | Michael Rollings |
| Chairman Emeritus and Senior Advisor | |
| John J. Brennan | |
| Chairman, 1996–2009 | |
| Chief Executive Officer and President, 1996–2008 | |
| Founder | |
| John C. Bogle | |
| Chairman and Chief Executive Officer, 1974–1996 | |
 | |
P.O. Box 2600 | |
Connect with Vanguard® > vanguard.com | |
| Fund Information > 800-662-7447 | |
| Direct Investor Account Services > 800-662-2739 | |
| Institutional Investor Services > 800-523-1036 | |
| Text Telephone for People | |
| Who Are Deaf or Hard of Hearing > 800-749-7273 | |
| This material may be used in conjunction | |
| with the offering of shares of any Vanguard | |
| fund only if preceded or accompanied by | |
| the fund’s current prospectus. | |
| All comparative mutual fund data are from Lipper, a | |
| Thomson Reuters Company, or Morningstar, Inc., unless | |
| otherwise noted. | |
| You can obtain a free copy of Vanguard’s proxy voting | |
| guidelines by visiting vanguard.com/proxyreporting or by | |
| calling Vanguard at 800-662-2739. The guidelines are | |
| also available from the SEC’s website, sec.gov. In | |
| addition, you may obtain a free report on how your fund | |
| voted the proxies for securities it owned during the 12 | |
| months ended June 30. To get the report, visit either | |
| vanguard.com/proxyreporting or sec.gov. | |
| You can review and copy information about your fund at | |
| the SEC’s Public Reference Room in Washington, D.C. To | |
| find out more about this public service, call the SEC at | |
| 202-551-8090. Information about your fund is also | |
| available on the SEC’s website, and you can receive | |
| copies of this information, for a fee, by sending a | |
| request in either of two ways: via email addressed to | |
| publicinfo@sec.gov or via regular mail addressed to the | |
| Public Reference Section, Securities and Exchange | |
| Commission, Washington, DC 20549-1520. | |
| © 2018 The Vanguard Group, Inc. | |
| All rights reserved. | |
| Vanguard Marketing Corporation, Distributor. | |
| Q3080 112018 | |
| Annual Report | September 30, 2018 |
| Vanguard Target Retirement Funds |
| Vanguard Target Retirement 2040 Fund |
| Vanguard Target Retirement 2045 Fund |
| Vanguard Target Retirement 2050 Fund |
| Vanguard Target Retirement 2055 Fund |
| Vanguard Target Retirement 2060 Fund |
| Vanguard Target Retirement 2065 Fund |
Vanguard’s Principles for Investing Success
We want to give you the best chance of investment success. These
principles, grounded in Vanguard’s research and experience, can put you on
the right path.
Goals. Create clear, appropriate investment goals.
Balance. Develop a suitable asset allocation using broadly diversified funds.
Cost. Minimize cost.
Discipline. Maintain perspective and long-term discipline.
A single theme unites these principles: Focus on the things you can control.
We believe there is no wiser course for any investor.
| Contents | |
| Your Fund’s Performance at a Glance. | 1 |
| CEO’s Perspective. | 4 |
| Target Retirement 2040 Fund. | 6 |
| Target Retirement 2045 Fund. | 18 |
| Target Retirement 2050 Fund. | 30 |
| Target Retirement 2055 Fund. | 42 |
| Target Retirement 2060 Fund. | 54 |
| Target Retirement 2065 Fund. | 66 |
| Your Fund’s After-Tax Returns. | 81 |
| About Your Fund’s Expenses. | 83 |
| Glossary. | 85 |
Please note: The opinions expressed in this report are just that—informed opinions. They should not be considered promises or advice. Also, please keep in mind that the information and opinions cover the period through the date on the front of this report. Of course, the risks of investing in your fund are spelled out in the prospectus.
See the Glossary for definitions of investment terms used in this report.
Your Fund’s Performance at a Glance
• For the 12 months ended September 30, 2018, the six Vanguard Target Retirement Funds covered in this report recorded returns ranging from 9.37% for the Target Retirement 2040 Fund to 9.85% for the Target Retirement 2045 Fund. (The funds with target dates of 2015 through 2035, as well as the Target Retirement Income Fund, are covered in a separate report.)
• Each fund posted returns that were in line with those of its composite benchmark after expenses. Each fund surpassed the average returns of its peers.
• Vanguard Target Retirement Funds are designed to reach an allocation of 70% bonds and 30% stocks within seven years after their target dates.
• For the ten years ended September 30—or since inception for the three newest funds—the average annual returns ranged from 9.14% for the Target Retirement 2040 Fund to 11.41% for the Target Retirement 2065 Fund.
| Total Returns: Fiscal Year Ended September 30, 2018 | |
| Total | |
| Returns | |
| Vanguard Target Retirement 2040 Fund | 9.37% |
| Target 2040 Composite Index | 9.66 |
| Mixed-Asset Target 2040 Funds Average | 8.36 |
| Mixed-Asset Target 2040 Funds Average: Derived from data provided by Lipper, a Thomson Reuters Company. | |
| Vanguard Target Retirement 2045 Fund | 9.85% |
| Target 2045 Composite Index | 10.15 |
| Mixed-Asset Target 2045 Funds Average | 9.11 |
| Mixed-Asset Target 2045 Funds Average: Derived from data provided by Lipper, a Thomson Reuters Company. | |
| Vanguard Target Retirement 2050 Fund | 9.84% |
| Target 2050 Composite Index | 10.15 |
| Mixed-Asset Target 2050 Funds Average | 9.09 |
| Mixed-Asset Target 2050 Funds Average: Derived from data provided by Lipper, a Thomson Reuters Company. | |
| Vanguard Target Retirement 2055 Fund | 9.79% |
| Target 2055 Composite Index | 10.15 |
| Mixed-Asset Target 2055+ Funds Average | 9.53 |
| Mixed-Asset Target 2055+ Funds Average: Derived from data provided by Lipper, a Thomson Reuters Company. | |
1
| Total | |
| Returns | |
| Vanguard Target Retirement 2060 Fund | 9.81% |
| Target 2060 Composite Index | 10.15 |
| Mixed-Asset Target 2055+ Funds Average | 9.53 |
| Mixed-Asset Target 2055+ Funds Average: Derived from data provided by Lipper, a Thomson Reuters Company. | |
| Vanguard Target Retirement 2065 Fund | 9.75% |
| Target 2065 Composite Index | 10.15 |
| Mixed-Asset Target 2055+ Funds Average | 9.53 |
Mixed-Asset Target 2055+ Funds Average: Derived from data provided by Lipper, a Thomson Reuters Company. For a benchmark description, see the Glossary.
Investments in Target Retirement Funds are subject to the risks of their underlying funds. The year in the fund name refers to the approximate year (the target date) when an investor in the fund would retire and leave the work force. The fund will gradually shift its emphasis from more aggressive investments to more conservative ones based on its target date. An investment in a Target Retirement Fund is not guaranteed at any time, including on or after the target date.
| Total Returns: Ten Years Ended September 30, 2018 | |
| Average | |
| Annual Return | |
| Target Retirement 2040 Fund | 9.14% |
| Target 2040 Composite Index | 9.36 |
| Mixed-Asset Target 2040 Funds Average | 7.89 |
| Mixed-Asset Target 2040 Funds Average: Derived from data provided by Lipper, a Thomson Reuters Company. | |
| Target Retirement 2045 Fund | 9.24% |
| Target 2045 Composite Index | 9.46 |
| Mixed-Asset Target 2045 Funds Average | 8.39 |
| Mixed-Asset Target 2045 Funds Average: Derived from data provided by Lipper, a Thomson Reuters Company. | |
| Target Retirement 2050 Fund | 9.24% |
| Target 2050 Composite Index | 9.46 |
| Mixed-Asset Target 2050 Funds Average | 8.31 |
| Mixed-Asset Target 2050 Funds Average: Derived from data provided by Lipper, a Thomson Reuters Company. | |
| Target Retirement 2055 Fund (Returns since inception: 8/18/2010) | 11.08% |
| Target 2055 Composite Index | 11.34 |
| Spliced Mixed-Asset Target 2055+ Funds Average | 10.19 |
| Spliced Mixed-Asset Target 2055+ Funds Average: Derived from data provided by Lipper, a Thomson Reuters Company. | |
| Target Retirement 2060 Fund (Returns since inception: 1/19/2012) | 10.91% |
| Target 2060 Composite Index | 11.18 |
| Spliced Mixed-Asset Target 2055+ Funds Average | 10.18 |
| Spliced Mixed-Asset Target 2055+ Funds Average: Derived from data provided by Lipper, a Thomson Reuters Company. |
2
| Average | |
| Annual Return | |
| Target Retirement 2065 Fund (Returns since inception: 7/12/2017) | 11.41% |
| Target 2065 Composite Index | 11.65 |
| Spliced Mixed-Asset Target 2055+ Funds Average | 11.14 |
| Spliced Mixed-Asset Target 2055+ Funds Average: Derived from data provided by Lipper, a Thomson Reuters Company. |
For a benchmark description, see the Glossary.
The figures shown represent past performance, which is not a guarantee of future results. (Current performance may be lower or higher than the performance data cited. For performance data current to the most recent month-end, visit our website at vanguard.com/performance.) Note, too, that both investment returns and principal value can fluctuate widely, so an investor’s shares, when sold, could be worth more or less than their original cost.
| Expense Ratios | ||
| Your Fund Compared With Its Peer Group | ||
| Acquired Fund Fees | Peer Group | |
| and Expenses | Average | |
| Target Retirement 2040 Fund | 0.15% | 0.42% |
| Target Retirement 2045 Fund | 0.15 | 0.40 |
| Target Retirement 2050 Fund | 0.15 | 0.41 |
| Target Retirement 2055 Fund | 0.15 | 0.38 |
| Target Retirement 2060 Fund | 0.15 | 0.38 |
| Target Retirement 2065 Fund | 0.15 | 0.38 |
The fund expense figures shown—drawn from the prospectus dated January 25, 2018—represent an estimate of the weighted average of the expense ratios and any transaction fees charged by the underlying mutual funds (the ”acquired” funds) in which the Target Retirement Funds invest. The Target Retirement Funds do not charge any expenses or fees of their own. For the fiscal year ended September 30, 2018, the acquired fund fees and expenses were 0.14% for the 2040 Fund, 0.15% for the 2045 Fund, 0.15% for the 2050 Fund, 0.15% for the 2055 Fund, 0.15% for the 2060 Fund, and 0.15% for the 2065 Fund. Peer-group expense ratios are derived from data provided by Lipper, a Thomson Reuters Company, and capture information through year-end 2017.
Peer groups: For the 2040 Fund, Mixed-Asset Target 2040 Funds; for the 2045 Fund, Mixed-Asset Target 2045 Funds; for the 2050 Fund, Mixed-Asset Target 2050 Funds; for the 2055, 2060, and 2065 Funds, Mixed-Asset Target 2055+ Funds.
3
CEO’s Perspective

Tim Buckley
President and Chief Executive Officer
Dear Shareholder,
Over the years, I’ve found that prudent investors exhibit a common trait: discipline. No matter how the markets move or what new investing fad hits the headlines, those who stay focused on their goals and tune out the noise are set up for long-term success.
The prime gateway to investing is saving, and you don’t usually become a saver without a healthy dose of discipline. Savers make the decision to sock away part of their income, which means spending less and delaying gratification, no matter how difficult that may be.
Of course, disciplined investing extends beyond diligent saving. The financial markets, in the short term especially, are unpredictable; I have yet to meet the investor who can time them perfectly. It takes discipline to resist the urge to go all-in when markets are frothy or to retreat when things look bleak.
Staying put with your investments is one strategy for handling volatility. Another, rebalancing, requires even more discipline because it means steering your money away from strong performers and toward poorer performers.
Patience—a form of discipline—is also the friend of long-term investors. Higher returns are the potential reward for weathering the market’s turbulence and uncertainty.
4
We have been enjoying one of the longest bull markets in history, but it won’t continue forever. Prepare yourself now for how you will react when volatility comes back. Don’t panic. Don’t chase returns or look for answers outside the asset classes you trust. And be sure to rebalance periodically, even when there’s turmoil.
Whether you’re a master of self-control, get a boost from technology, or work with a professional advisor, know that discipline is necessary to get the most out of your investment portfolio. And know that Vanguard is with you for the entire ride.
Thank you for your continued loyalty.
Sincerely,

Mortimer J. Buckley
President and Chief Executive Officer
October 18, 2018
| Market Barometer | |||
| Average Annual Total Returns | |||
| Periods Ended September 30, 2018 | |||
| One Year | Three Years | Five Years | |
| Stocks | |||
| Russell 1000 Index (Large-caps) | 17.76% | 17.07% | 13.67% |
| Russell 2000 Index (Small-caps) | 15.24 | 17.12 | 11.07 |
| Russell 3000 Index (Broad U.S. market) | 17.58 | 17.07 | 13.46 |
| FTSE All-World ex US Index (International) | 2.13 | 10.18 | 4.51 |
| Bonds | |||
| Bloomberg Barclays U. S. Aggregate Bond Index | |||
| (Broad taxable market) | -1.22% | 1.31% | 2.16% |
| Bloomberg Barclays Municipal Bond Index | |||
| (Broad tax-exempt market) | 0.35 | 2.24 | 3.54 |
| FTSE Three-Month U.S. Treasury Bill Index | 1.57 | 0.80 | 0.48 |
| CPI | |||
| Consumer Price Index | 2.28% | 1.99% | 1.52% |
5
Target Retirement 2040 Fund
Fund Profile
As of September 30, 2018
| Total Fund Characteristics | |
| Ticker Symbol | VFORX |
| 30-Day SEC Yield | 2.15% |
| Acquired Fund Fees and Expenses1 | 0.15% |
| Allocation to Underlying Vanguard Funds | |
| Vanguard Total Stock Market Index Fund | |
| Investor Shares | 51.1% |
| Vanguard Total International Stock Index | |
| Fund Investor Shares | 33.9 |
| Vanguard Total Bond Market II Index Fund | |
| Investor Shares | 10.7 |
| Vanguard Total International Bond Index | |
| Fund Investor Shares | 4.3 |
| Total Fund Volatility Measures | ||
| MSCI US | ||
| Target 2040 | Broad | |
| Composite | Market | |
| Index | Index | |
| R-Squared | 0.99 | 0.89 |
| Beta | 0.97 | 0.80 |
These measures show the degree and timing of the fund’s fluctuations compared with the indexes over 36 months.
Fund Asset Allocation
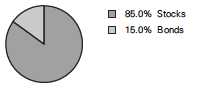
1 This figure—drawn from the prospectus dated January 25, 2018—represents an estimate of the weighted average of the expense ratios and any transaction fees charged by the underlying mutual funds (the ”acquired” funds) in which the Target Retirement 2040 Fund invests. The fund does not charge any expenses or fees of its own. For the fiscal year ended September 30, 2018, the acquired fund fees and expenses were 0.14%.
6
Target Retirement 2040 Fund
Performance Summary
All of the returns in this report represent past performance, which is not a guarantee of future results that may be achieved by the fund. (Current performance may be lower or higher than the performance data cited. For performance data current to the most recent month-end, visit our website at vanguard.com/performance.) Note, too, that both investment returns and principal value can fluctuate widely, so an investor’s shares, when sold, could be worth more or less than their original cost. The returns shown do not reflect taxes that a shareholder would pay on fund distributions or on the sale of fund shares.
Cumulative Performance: September 30, 2008, Through September 30, 2018
Initial Investment of $10,000
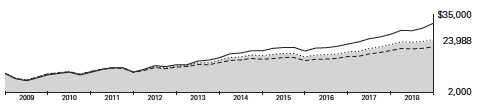
| Average Annual Total Returns | ||||
| Periods Ended September 30, 2018 | ||||
| Final Value | ||||
| One | Five | Ten | of a $10,000 | |
| Year | Years | Years | Investment | |
| Target Retirement 2040 Fund* | 9.37% | 9.17% | 9.14% | $23,988 |
| Target 2040 Composite Index | 9.66 | 9.44 | 9.36 | 24,463 |
| Mixed-Asset Target 2040 Funds | ||||
| Average | 8.36 | 7.94 | 7.89 | 21,368 |
| MSCI US Broad Market Index | 17.62 | 13.52 | 12.12 | 31,391 |
For a benchmark description, see the Glossary.
Mixed-Asset Target 2040 Funds Average: Derived from data provided by Lipper, a Thomson Reuters Company.
See Financial Highlights for dividend and capital gains information.
7
Target Retirement 2040 Fund
Fiscal-Year Total Returns (%): September 30, 2008, Through September 30, 2018
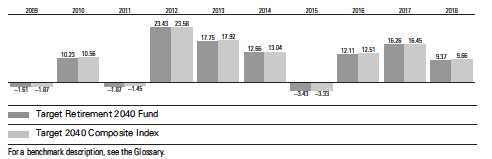
8
Target Retirement 2040 Fund
Financial Statements
Statement of Net Assets
As of September 30, 2018
The fund reports a complete list of its holdings in regulatory filings four times in each fiscal year, at the quarter-ends. For the second and fourth fiscal quarters, the lists appear in the fund’s semiannual and annual reports to shareholders. For the first and third fiscal quarters, the fund files the lists with the Securities and Exchange Commission on Form N-Q. Shareholders can look up the fund’s Forms N-Q on the SEC’s website at sec.gov. Forms N-Q may also be reviewed and copied at the SEC’s Public Reference Room (see the back cover of this report for further information).
| Market | ||
| Value• | ||
| Shares | ($000) | |
| Investment Companies (100.0%) | ||
| U.S. Stock Fund (51.1%) | ||
| Vanguard Total Stock Market Index Fund Investor Shares | 185,464,644 | 13,505,535 |
| International Stock Fund (33.9%) | ||
| Vanguard Total International Stock Index Fund Investor Shares | 516,288,845 | 8,962,774 |
| U.S. Bond Fund (10.7%) | ||
| 1 Vanguard Total Bond Market II Index Fund Investor Shares | 273,782,231 | 2,828,171 |
| International Bond Fund (4.3%) | ||
| Vanguard Total International Bond Index Fund Investor Shares | 104,664,842 | 1,138,754 |
| Total Investment Companies (Cost $18,340,936) | 26,435,234 | |
| Temporary Cash Investment (0.0%) | ||
| Money Market Fund (0.0%) | ||
| 1 Vanguard Market Liquidity Fund, 2.209% (Cost $11) | 110 | 11 |
| Total Investments (100.0%) (Cost $18,340,947) | 26,435,245 | |
| Other Assets and Liabilities (0.0%) | ||
| Other Assets | 80,292 | |
| Liabilities | (70,213) | |
| 10,079 | ||
| Net Assets (100%) | ||
| Applicable to 709,779,760 outstanding $.001 par value shares of | ||
| beneficial interest (unlimited authorization) | 26,445,324 | |
| Net Asset Value Per Share | $37.26 | |
9
| Target Retirement 2040 Fund | |
| Amount | |
| ($000) | |
| Statement of Assets and Liabilities | |
| Assets | |
| Investments in Securities, at Value—Affiliated Funds | 26,435,245 |
| Receivables for Investment Securities Sold | 19,442 |
| Receivables for Capital Shares Issued | 53,356 |
| Receivables for Accrued Income | 7,494 |
| Total Assets | 26,515,537 |
| Liabilities | |
| Payables for Investment Securities Purchased | 7,385 |
| Payables for Capital Shares Redeemed | 60,887 |
| Other Liabilities | 1,941 |
| Total Liabilities | 70,213 |
| Net Assets | 26,445,324 |
| At September 30, 2018, net assets consisted of: | |
| Amount | |
| ($000) | |
| Paid-in Capital | 17,954,039 |
| Undistributed Net Investment Income | 358,075 |
| Accumulated Net Realized Gains | 38,912 |
| Unrealized Appreciation (Depreciation) | 8,094,298 |
| Net Assets | 26,445,324 |
• See Note A in Notes to Financial Statements.
1 Affiliated fund available only to Vanguard funds and certain trusts and accounts managed by Vanguard. Rate shown for Vanguard
Market Liquidity Fund is the 7-day yield.
See accompanying Notes, which are an integral part of the Financial Statements.
10
| Target Retirement 2040 Fund | |
| Statement of Operations | |
| Year Ended | |
| September 30, 2018 | |
| ($000) | |
| Investment Income | |
| Income | |
| Income Distributions Received from Affiliated Funds | 535,697 |
| Other Income | 108 |
| Net Investment Income—Note B | 535,805 |
| Realized Net Gain (Loss) | |
| Capital Gain Distributions Received from Affiliated Funds | 510 |
| Affiliated Funds Sold | 39,552 |
| Futures Contracts | 178 |
| Realized Net Gain (Loss) | 40,240 |
| Change in Unrealized Appreciation (Depreciation) from Affiliated Funds | 1,586,712 |
| Net Increase (Decrease) in Net Assets Resulting from Operations | 2,162,757 |
See accompanying Notes, which are an integral part of the Financial Statements.
11
| Target Retirement 2040 Fund | ||
| Statement of Changes in Net Assets | ||
| Year Ended September 30, | ||
| 2018 | 2017 | |
| ($000) | ($000) | |
| Increase (Decrease) in Net Assets | ||
| Operations | ||
| Net Investment Income | 535,805 | 439,534 |
| Realized Net Gain (Loss) | 40,240 | 19,902 |
| Change in Unrealized Appreciation (Depreciation) | 1,586,712 | 2,566,980 |
| Net Increase (Decrease) in Net Assets Resulting from Operations | 2,162,757 | 3,026,416 |
| Distributions | ||
| Net Investment Income | (450,227) | (349,773) |
| Realized Capital Gain1 | (9,411) | (72,933) |
| Total Distributions | (459,638) | (422,706) |
| Capital Share Transactions | ||
| Issued | 6,304,784 | 6,021,161 |
| Issued in Lieu of Cash Distributions | 453,171 | 415,992 |
| Redeemed | (4,340,003) | (4,087,681) |
| Net Increase (Decrease) from Capital Share Transactions | 2,417,952 | 2,349,472 |
| Total Increase (Decrease) | 4,121,071 | 4,953,182 |
| Net Assets | ||
| Beginning of Period | 22,324,253 | 17,371,071 |
| End of Period2 | 26,445,324 | 22,324,253 |
1 Includes fiscal 2018 and 2017 short-term gain distributions totaling $8,951,000 and $10,861,000, respectively. Short-term gain
distributions are treated as ordinary income dividends for tax purposes.
2 Net Assets—End of Period includes undistributed (overdistributed) net investment income of $358,075,000 and $288,641,000.
See accompanying Notes, which are an integral part of the Financial Statements.
12
| Target Retirement 2040 Fund | |||||
| Financial Highlights | |||||
| For a Share Outstanding | Year Ended September 30, | ||||
| Throughout Each Period | 2018 | 2017 | 2016 | 2015 | 2014 |
| Net Asset Value, Beginning of Period | $34.73 | $30.59 | $28.09 | $29.66 | $26.80 |
| Investment Operations | |||||
| Net Investment Income | .7861 | .7181 | .660 | .648 | .593 |
| Capital Gain Distributions Received | .0011 | .0031 | .003 | .007 | .001 |
| Net Realized and Unrealized Gain (Loss) | |||||
| on Investments | 2.441 | 4.143 | 2.687 | (1.634) | 2.773 |
| Total from Investment Operations | 3.228 | 4.864 | 3.350 | (.979) | 3.367 |
| Distributions | |||||
| Dividends from Net Investment Income | (.684) | (.599) | (.615) | (.574) | (.500) |
| Distributions from Realized Capital Gains | (.014) | (.125) | (.235) | (.017) | (.007) |
| Total Distributions | (.698) | (.724) | (.850) | (.591) | (.507) |
| Net Asset Value, End of Period | $37.26 | $34.73 | $30.59 | $28.09 | $29.66 |
| Total Return2 | 9.37% | 16.26% | 12.11% | -3.43% | 12.66% |
| Ratios/Supplemental Data | |||||
| Net Assets, End of Period (Millions) | $26,445 | $22,324 | $17,371 | $15,724 | $15,912 |
| Ratio of Total Expenses to Average Net Assets | — | — | — | — | — |
| Acquired Fund Fees and Expenses | 0.14% | 0.15% | 0.16% | 0.16% | 0.18% |
| Ratio of Net Investment Income to | |||||
| Average Net Assets | 2.17% | 2.23% | 2.23% | 2.09% | 2.18% |
| Portfolio Turnover Rate | 8% | 8% | 16% | 21% | 6% |
1 Calculated based on average shares outstanding.
2 Total returns do not include account service fees that may have applied in the periods shown. Fund prospectuses provide information
about any applicable account service fees.
See accompanying Notes, which are an integral part of the Financial Statements.
13
Target Retirement 2040 Fund
Notes to Financial Statements
Vanguard Target Retirement 2040 Fund is registered under the Investment Company Act of 1940 as an open-end investment company, or mutual fund. The fund follows a balanced investment strategy by investing in selected Vanguard funds to achieve its targeted allocation of assets to U.S. and international stocks, and U.S. and international bonds. Financial statements and other information about each underlying fund are available on vanguard.com.
A. The following significant accounting policies conform to generally accepted accounting principles for U.S. investment companies. The fund consistently follows such policies in preparing its financial statements.
1. Security Valuation: Investments are valued at the net asset value of each underlying Vanguard fund determined as of the close of the New York Stock Exchange (generally 4 p.m., Eastern time) on the valuation date.
2. Futures Contracts: The fund uses stock and bond futures contracts to a limited extent, with the objectives of maintaining full exposure to the market and maintaining its target asset allocation. The primary risks associated with the use of futures contracts are imperfect correlation between changes in market values of investments held by the fund and the prices of futures contracts, and the possibility of an illiquid market. Counterparty risk involving futures is mitigated because a regulated clearinghouse is the counterparty instead of the clearing broker. To further mitigate counterparty risk, the fund trades futures contracts on an exchange, monitors the financial strength of its clearing brokers and clearinghouse, and has entered into clearing agreements with its clearing brokers. The clearinghouse imposes initial margin requirements to secure the fund’s performance and requires daily settlement of variation margin representing changes in the market value of each contract. Any assets pledged as initial margin for open contracts are noted in the Statement of Net Assets.
Futures contracts are valued at their quoted daily settlement prices. The notional amounts of the contracts are not recorded in the Statement of Net Assets. Fluctuations in the value of the contracts are recorded in the Statement of Assets and Liabilities as an asset (liability) and in the Statement of Operations as unrealized appreciation (depreciation) until the contracts are closed, when they are recorded as realized futures gains (losses).
During the year ended September 30, 2018, the fund’s average investments in long and short futures contracts represented less than 1% and 0% of net assets, respectively, based on the average of the notional amounts at each quarter-end during the period. The fund had no open futures contracts at September 30, 2018.
3. Federal Income Taxes: The fund intends to continue to qualify as a regulated investment company and distribute all of its taxable income. Management has analyzed the fund’s tax positions taken for all open federal income tax years (September 30, 2015–2018), and has concluded that no provision for federal income tax is required in the fund’s financial statements.
4. Distributions: Distributions to shareholders are recorded on the ex-dividend date. Distributions are determined on a tax basis and may differ from net investment income and realized capital gains for financial reporting purposes.
14
Target Retirement 2040 Fund
5. Credit Facility: The fund and certain other funds managed by The Vanguard Group (“Vanguard”) participate in a $3.1 billion committed credit facility provided by a syndicate of lenders pursuant to a credit agreement that may be renewed annually; each fund is individually liable for its borrowings, if any, under the credit facility. Borrowings may be utilized for temporary and emergency purposes, and are subject to the fund’s regulatory and contractual borrowing restrictions. The participating funds are charged administrative fees and an annual commitment fee of 0.10% of the undrawn amount of the facility; these fees are allocated to the funds based on a method approved by the fund’s board of trustees and borne by the funds in which the fund invests (see Note B).
Any borrowings under this facility bear interest at a rate based upon the higher of the one-month London Interbank Offered Rate, federal funds effective rate, or overnight bank funding rate plus an agreed-upon spread.
The fund had no borrowings outstanding at September 30, 2018, or at any time during the period then ended.
6. Other: Income and capital gain distributions received are recorded on the ex-dividend date. Security transactions are accounted for on the date securities are bought or sold. Costs used to determine realized gains (losses) on the sale of investment securities are those of the specific securities sold.
B. In accordance with the terms of a Funds’ Service Agreement (the “FSA”) between Vanguard and the fund, Vanguard furnishes to the fund investment advisory, corporate management, administrative, marketing, and distribution services at Vanguard’s cost of operations (as defined by the FSA). These costs of operations are allocated to the fund based on methods and guidelines approved by the board of trustees. The FSA provides that expenses otherwise allocable to Vanguard funds-of-funds may be reduced or eliminated to the extent of savings realized by the underlying Vanguard funds by virtue of being part of a fund-of-funds. Accordingly, all expenses for services provided by Vanguard to the fund and all other expenses incurred by the fund during the period ended September 30, 2018, were borne by the underlying Vanguard funds in which the fund invests. The fund’s trustees and officers are also trustees and officers, respectively, of the underlying Vanguard funds, as well as directors and employees, respectively, of Vanguard.
C. Various inputs may be used to determine the value of the fund’s investments. These inputs are summarized in three broad levels for financial statement purposes. The inputs or methodologies used to value securities are not necessarily an indication of the risk associated with investing in those securities.
Level 1—Quoted prices in active markets for identical securities.
Level 2—Other significant observable inputs (including quoted prices for similar securities, interest rates, prepayment speeds, credit risk, etc.).
Level 3—Significant unobservable inputs (including the fund’s own assumptions used to determine the fair value of investments). Any investments valued with significant unobservable inputs are noted on the Statement of Net Assets.
At September 30, 2018, 100% of the market value of the fund’s investments was determined based on Level 1 inputs.
15
Target Retirement 2040 Fund
D. Permanent differences between book-basis and tax-basis components of net assets are reclassified among capital accounts in the financial statements to reflect their tax character. These reclassifications have no effect on net assets or net asset value per share. As of period end, the following permanent differences primarily attributable to the accounting for distributions in connection with fund share redemptions were reclassified to the following accounts:
| Amount | |
| ($000) | |
| Paid-in Capital | 17,323 |
| Undistributed (Overdistributed) Net Investment Income | (16,144) |
| Accumulated Net Realized Gains (Losses) | (1,179) |
Temporary differences between book-basis and tax-basis components of accumulated net earnings (losses) arise when certain items of income, gain, or loss are recognized in different periods for financial statement and tax purposes; these differences will reverse at some time in the future. The differences are primarily related to the tax deferral of losses on wash sales. As of period end, the tax-basis components of accumulated net earnings (losses) are detailed in the table as follows:
| Amount | |
| ($000) | |
| Undistributed Ordinary Income | 396,401 |
| Undistributed Long-Term Gains | 586 |
| Capital Loss Carryforwards (Non-expiring) | — |
| Net Unrealized Gains (Losses) | 8,094,298 |
As of September 30, 2018, gross unrealized appreciation and depreciation for investments and derivatives based on cost for U.S. federal income tax purposes were as follows:
| Amount | ||
| ($000) | ||
| Tax Cost | 18,340,947 | |
| Gross Unrealized Appreciation | 8,209,497 | |
| Gross Unrealized Depreciation | (115,199) | |
| Net Unrealized Appreciation (Depreciation) | 8,094,298 | |
| E. Capital shares issued and redeemed were: | ||
| Year Ended September 30, | ||
| 2018 | 2017 | |
| Shares | Shares | |
| (000) | (000) | |
| Issued | 174,069 | 187,954 |
| Issued in Lieu of Cash Distributions | 12,637 | 13,784 |
| Redeemed | (119,638) | (126,965) |
| Net Increase (Decrease) in Shares Outstanding | 67,068 | 74,773 |
16
Target Retirement 2040 Fund
F. Transactions during the period in affiliated underlying Vanguard funds were as follows:
| Current Period Transactions | ||||||||
| Sept. 30, | Proceeds | Realized | Sept. 30, | |||||
| 2017 | from | Net | Change in | Capital Gain | 2018 | |||
| Market | Purchases | Securities | Gain | Unrealized | Distributions | Market | ||
| Value | at Cost | Sold | (Loss) | App. (Dep.) | Income | Received | Value | |
| ($000) | ($000) | ($000) | ($000) | ($000) | ($000) | ($000) | ($000) | |
| Vanguard Market | ||||||||
| Liquidity Fund | 10,689 | NA1 | NA1 | (10) | — | 83 | — | 11 |
| Vanguard Total | ||||||||
| Bond Market II | ||||||||
| Index Fund | 2,138,153 | 1,435,471 | 646,345 | — | (99,108) | 65,661 | 510 | 2,828,171 |
| Vanguard Total | ||||||||
| International Bond | ||||||||
| Index Fund | 860,907 | 290,374 | 11,438 | — | (1,089) | 21,889 | — | 1,138,754 |
| Vanguard Total | ||||||||
| International Stock | ||||||||
| Index Fund | 7,692,108 | 1,693,623 | 312,150 | 7,146 | (117,953) | 229,929 | — | 8,962,774 |
| Vanguard Total | ||||||||
| Stock Market | ||||||||
| Index Fund | 11,636,768 | 1,065,642 | 1,034,153 | 32,416 | 1,804,862 | 218,135 | — 13,505,535 | |
| Total | 22,338,625 | 4,485,110 | 2,004,086 | 39,552 | 1,586,712 | 535,697 | 510 | 26,435,245 |
| 1 Not applicable—purchases and sales are for temporary cash investment purposes. | ||||||||
G. Management has determined that no events or transactions occurred subsequent to September 30, 2018, that would require recognition or disclosure in these financial statements.
17
Target Retirement 2045 Fund
Fund Profile
As of September 30, 2018
| Total Fund Characteristics | |
| Ticker Symbol | VTIVX |
| 30-Day SEC Yield | 2.14% |
| Acquired Fund Fees and Expenses1 | 0.15% |
| Allocation to Underlying Vanguard Funds | |
| Vanguard Total Stock Market Index Fund | |
| Investor Shares | 54.1% |
| Vanguard Total International Stock Index | |
| Fund Investor Shares | 35.9 |
| Vanguard Total Bond Market II Index Fund | |
| Investor Shares | 7.1 |
| Vanguard Total International Bond Index | |
| Fund Investor Shares | 2.9 |
| Total Fund Volatility Measures | ||
| MSCI US | ||
| Target 2045 | Broad | |
| Composite | Market | |
| Index | Index | |
| R-Squared | 0.99 | 0.90 |
| Beta | 0.97 | 0.82 |
These measures show the degree and timing of the fund’s fluctuations compared with the indexes over 36 months.
Fund Asset Allocation
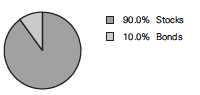
1 This figure—drawn from the prospectus dated January 25, 2018—represents an estimate of the weighted average of the expense ratios and any transaction fees charged by the underlying mutual funds (the ”acquired” funds) in which the Target Retirement 2045 Fund invests. The fund does not charge any expenses or fees of its own. For the fiscal year ended September 30, 2018, the acquired fund fees and expenses were 0.15%.
18
Target Retirement 2045 Fund
Performance Summary
All of the returns in this report represent past performance, which is not a guarantee of future results that may be achieved by the fund. (Current performance may be lower or higher than the performance data cited. For performance data current to the most recent month-end, visit our website at vanguard.com/performance.) Note, too, that both investment returns and principal value can fluctuate widely, so an investor’s shares, when sold, could be worth more or less than their original cost. The returns shown do not reflect taxes that a shareholder would pay on fund distributions or on the sale of fund shares.
Cumulative Performance: September 30, 2008, Through September 30, 2018
Initial Investment of $10,000
| Average Annual Total Returns | ||||
| Periods Ended September 30, 2018 | ||||
| Final Value | ||||
| One | Five | Ten | of a $10,000 | |
| Year | Years | Years | Investment | |
| Target Retirement 2045 Fund* | 9.85% | 9.39% | 9.24% | $24,195 |
| Target 2045 Composite Index | 10.15 | 9.65 | 9.46 | 24,700 |
| Mixed-Asset Target 2045 Funds | ||||
| Average | 9.11 | 8.42 | 8.39 | 22,379 |
| MSCI US Broad Market Index | 17.62 | 13.52 | 12.12 | 31,391 |
For a benchmark description, see the Glossary.
Mixed-Asset Target 2045 Funds Average: Derived from data provided by Lipper, a Thomson Reuters Company.
See Financial Highlights for dividend and capital gains information.
19
Target Retirement 2045 Fund
Fiscal-Year Total Returns (%): September 30, 2008, Through September 30, 2018
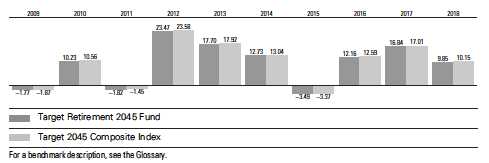
20
Target Retirement 2045 Fund
Financial Statements
Statement of Net Assets
As of September 30, 2018
The fund reports a complete list of its holdings in regulatory filings four times in each fiscal year, at the quarter-ends. For the second and fourth fiscal quarters, the lists appear in the fund’s semiannual and annual reports to shareholders. For the first and third fiscal quarters, the fund files the lists with the Securities and Exchange Commission on Form N-Q. Shareholders can look up the fund’s Forms N-Q on the SEC’s website at sec.gov. Forms N-Q may also be reviewed and copied at the SEC’s Public Reference Room (see the back cover of this report for further information).
| Market | ||
| Value• | ||
| Shares | ($000) | |
| Investment Companies (100.0%) | ||
| U.S. Stock Fund (54.1%) | ||
| Vanguard Total Stock Market Index Fund Investor Shares | 180,722,257 | 13,160,195 |
| International Stock Fund (35.9%) | ||
| Vanguard Total International Stock Index Fund Investor Shares | 503,208,660 | 8,735,702 |
| U.S. Bond Fund (7.1%) | ||
| 1 Vanguard Total Bond Market II Index Fund Investor Shares | 166,830,765 | 1,723,362 |
| International Bond Fund (2.9%) | ||
| Vanguard Total International Bond Index Fund Investor Shares | 65,371,513 | 711,242 |
| Total Investment Companies (Cost $16,530,472) | 24,330,501 | |
| Temporary Cash Investment (0.0%) | ||
| Money Market Fund (0.0%) | ||
| 1 Vanguard Market Liquidity Fund, 2.209% (Cost $6) | 57 | 6 |
| Total Investments (100.0%) (Cost $16,530,478) | 24,330,507 | |
| Other Assets and Liabilities (0.0%) | ||
| Other Assets | 56,294 | |
| Liabilities | (57,234) | |
| (940) | ||
| Net Assets (100%) | ||
| Applicable to 1,035,863,971 outstanding $.001 par value shares of | ||
| beneficial interest (unlimited authorization) | 24,329,567 | |
| Net Asset Value Per Share | $23.49 | |
21
| Target Retirement 2045 Fund | |
| Amount | |
| ($000) | |
| Statement of Assets and Liabilities | |
| Assets | |
| Investments in Securities, at Value—Affiliated Funds | 24,330,507 |
| Receivables for Investment Securities Sold | 26,715 |
| Receivables for Capital Shares Issued | 24,882 |
| Receivables for Accrued Income | 4,697 |
| Total Assets | 24,386,801 |
| Liabilities | |
| Payables for Investment Securities Purchased | 4,571 |
| Payables for Capital Shares Redeemed | 50,649 |
| Other Liabilities | 2,014 |
| Total Liabilities | 57,234 |
| Net Assets | 24,329,567 |
| At September 30, 2018, net assets consisted of: | |
| Amount | |
| ($000) | |
| Paid-in Capital | 16,175,931 |
| Undistributed Net Investment Income | 328,935 |
| Accumulated Net Realized Gains | 24,672 |
| Unrealized Appreciation (Depreciation) | 7,800,029 |
| Net Assets | 24,329,567 |
• See Note A in Notes to Financial Statements.
1 Affiliated fund available only to Vanguard funds and certain trusts and accounts managed by Vanguard. Rate shown for Vanguard
Market Liquidity Fund is the 7-day yield.
See accompanying Notes, which are an integral part of the Financial Statements.
22
| Target Retirement 2045 Fund | |
| Statement of Operations | |
| Year Ended | |
| September 30, 2018 | |
| ($000) | |
| Investment Income | |
| Income | |
| Income Distributions Received from Affiliated Funds | 490,342 |
| Other Income | 129 |
| Net Investment Income—Note B | 490,471 |
| Realized Net Gain (Loss) | |
| Capital Gain Distributions Received from Affiliated Funds | 339 |
| Affiliated Funds Sold | 25,768 |
| Futures Contracts | 218 |
| Realized Net Gain (Loss) | 26,325 |
| Change in Unrealized Appreciation (Depreciation) from Affiliated Funds | 1,567,532 |
| Net Increase (Decrease) in Net Assets Resulting from Operations | 2,084,328 |
See accompanying Notes, which are an integral part of the Financial Statements.
23
| Target Retirement 2045 Fund | ||
| Statement of Changes in Net Assets | ||
| Year Ended September 30, | ||
| 2018 | 2017 | |
| ($000) | ($000) | |
| Increase (Decrease) in Net Assets | ||
| Operations | ||
| Net Investment Income | 490,471 | 402,343 |
| Realized Net Gain (Loss) | 26,325 | 16,761 |
| Change in Unrealized Appreciation (Depreciation) | 1,567,532 | 2,430,140 |
| Net Increase (Decrease) in Net Assets Resulting from Operations | 2,084,328 | 2,849,244 |
| Distributions | ||
| Net Investment Income | (412,734) | (323,102) |
| Realized Capital Gain1 | (9,737) | (79,182) |
| Total Distributions | (422,471) | (402,284) |
| Capital Share Transactions | ||
| Issued | 5,662,342 | 5,084,279 |
| Issued in Lieu of Cash Distributions | 416,672 | 397,131 |
| Redeemed | (3,824,416) | (3,501,855) |
| Net Increase (Decrease) from Capital Share Transactions | 2,254,598 | 1,979,555 |
| Total Increase (Decrease) | 3,916,455 | 4,426,515 |
| Net Assets | ||
| Beginning of Period | 20,413,112 | 15,986,597 |
| End of Period2 | 24,329,567 | 20,413,112 |
1 Includes fiscal 2018 and 2017 short-term gain distributions totaling $9,737,000 and $6,807,000, respectively. Short-term gain
distributions are treated as ordinary income dividends for tax purposes.
2 Net Assets—End of Period includes undistributed (overdistributed) net investment income of $328,935,000 and $265,300,000.
See accompanying Notes, which are an integral part of the Financial Statements.
24
| Target Retirement 2045 Fund | |||||
| Financial Highlights | |||||
| For a Share Outstanding | Year Ended September 30, | ||||
| Throughout Each Period | 2018 | 2017 | 2016 | 2015 | 2014 |
| Net Asset Value, Beginning of Period | $21.80 | $19.12 | $17.60 | $18.61 | $16.82 |
| Investment Operations | |||||
| Net Investment Income | . 4921 | .4501 | .411 | .406 | .376 |
| Capital Gain Distributions Received | — | . 0011 | .002 | .004 | .001 |
| Net Realized and Unrealized Gain (Loss) | |||||
| on Investments | 1.636 | 2.696 | 1.692 | (1.034) | 1.747 |
| Total from Investment Operations | 2.128 | 3.147 | 2.105 | (.624) | 2.124 |
| Distributions | |||||
| Dividends from Net Investment Income | (.428) | (.375) | (.386) | (.383) | (.334) |
| Distributions from Realized Capital Gains | (.010) | (.092) | (.199) | (.003) | — |
| Total Distributions | (.438) | (.467) | (.585) | (.386) | (.334) |
| Net Asset Value, End of Period | $23.49 | $21.80 | $19.12 | $17.60 | $18.61 |
| Total Return2 | 9.85% | 16.84% | 12.16% | -3.49% | 12.73% |
| Ratios/Supplemental Data | |||||
| Net Assets, End of Period (Millions) | $24,330 | $20,413 | $15,987 | $14,283 | $14,491 |
| Ratio of Total Expenses to Average Net Assets | — | — | — | — | — |
| Acquired Fund Fees and Expenses | 0.15% | 0.15% | 0.16% | 0.16% | 0.18% |
| Ratio of Net Investment Income to | |||||
| Average Net Assets | 2.16% | 2.23% | 2.43% | 2.10% | 2.17% |
| Portfolio Turnover Rate | 7% | 8% | 13% | 20% | 7% |
1 Calculated based on average shares outstanding.
2 Total returns do not include account service fees that may have applied in the periods shown. Fund prospectuses provide information
about any applicable account service fees.
See accompanying Notes, which are an integral part of the Financial Statements.
25
Target Retirement 2045 Fund
Notes to Financial Statements
Vanguard Target Retirement 2045 Fund is registered under the Investment Company Act of 1940 as an open-end investment company, or mutual fund. The fund follows a balanced investment strategy by investing in selected Vanguard funds to achieve its targeted allocation of assets to U.S. and international stocks, and U.S. and international bonds. Financial statements and other information about each underlying fund are available on vanguard.com.
A. The following significant accounting policies conform to generally accepted accounting principles for U.S. investment companies. The fund consistently follows such policies in preparing its financial statements.
1. Security Valuation: Investments are valued at the net asset value of each underlying Vanguard fund determined as of the close of the New York Stock Exchange (generally 4 p.m., Eastern time) on the valuation date.
2. Futures Contracts: The fund uses stock and bond futures contracts to a limited extent, with the objectives of maintaining full exposure to the market and maintaining its target asset allocation. The primary risks associated with the use of futures contracts are imperfect correlation between changes in market values of investments held by the fund and the prices of futures contracts, and the possibility of an illiquid market. Counterparty risk involving futures is mitigated because a regulated clearinghouse is the counterparty instead of the clearing broker. To further mitigate counterparty risk, the fund trades futures contracts on an exchange, monitors the financial strength of its clearing brokers and clearinghouse, and has entered into clearing agreements with its clearing brokers. The clearinghouse imposes initial margin requirements to secure the fund’s performance and requires daily settlement of variation margin representing changes in the market value of each contract. Any assets pledged as initial margin for open contracts are noted in the Statement of Net Assets.
Futures contracts are valued at their quoted daily settlement prices. The notional amounts of the contracts are not recorded in the Statement of Net Assets. Fluctuations in the value of the contracts are recorded in the Statement of Assets and Liabilities as an asset (liability) and in the Statement of Operations as unrealized appreciation (depreciation) until the contracts are closed, when they are recorded as realized futures gains (losses).
During the year ended September 30, 2018, the fund’s average investments in long and short futures contracts represented less than 1% and 0% of net assets, respectively, based on the average of the notional amounts at each quarter-end during the period. The fund had no open futures contracts at September 30, 2018.
3. Federal Income Taxes: The fund intends to continue to qualify as a regulated investment company and distribute all of its taxable income. Management has analyzed the fund’s tax positions taken for all open federal income tax years (September 30, 2015–2018), and has concluded that no provision for federal income tax is required in the fund’s financial statements.
4. Distributions: Distributions to shareholders are recorded on the ex-dividend date. Distributions are determined on a tax basis and may differ from net investment income and realized capital gains for financial reporting purposes.
26
Target Retirement 2045 Fund
5. Credit Facility: The fund and certain other funds managed by The Vanguard Group (“Vanguard”) participate in a $3.1 billion committed credit facility provided by a syndicate of lenders pursuant to a credit agreement that may be renewed annually; each fund is individually liable for its borrowings, if any, under the credit facility. Borrowings may be utilized for temporary and emergency purposes, and are subject to the fund’s regulatory and contractual borrowing restrictions. The participating funds are charged administrative fees and an annual commitment fee of 0.10% of the undrawn amount of the facility; these fees are allocated to the funds based on a method approved by the fund’s board of trustees and borne by the funds in which the fund invests (see Note B). Any borrowings under this facility bear interest at a rate based upon the higher of the one-month London Interbank Offered Rate, federal funds effective rate, or overnight bank funding rate plus an agreed-upon spread.
The fund had no borrowings outstanding at September 30, 2018, or at any time during the period then ended.
6. Other: Income and capital gain distributions received are recorded on the ex-dividend date. Security transactions are accounted for on the date securities are bought or sold. Costs used to determine realized gains (losses) on the sale of investment securities are those of the specific securities sold.
B. In accordance with the terms of a Funds’ Service Agreement (the “FSA”) between Vanguard and the fund, Vanguard furnishes to the fund investment advisory, corporate management, administrative, marketing, and distribution services at Vanguard’s cost of operations (as defined by the FSA). These costs of operations are allocated to the fund based on methods and guidelines approved by the board of trustees. The FSA provides that expenses otherwise allocable to Vanguard funds-of-funds may be reduced or eliminated to the extent of savings realized by the underlying Vanguard funds by virtue of being part of a fund-of-funds. Accordingly, all expenses for services provided by Vanguard to the fund and all other expenses incurred by the fund during the period ended September 30, 2018, were borne by the underlying Vanguard funds in which the fund invests. The fund’s trustees and officers are also trustees and officers, respectively, of the underlying Vanguard funds, as well as directors and employees, respectively, of Vanguard.
C. Various inputs may be used to determine the value of the fund’s investments. These inputs are summarized in three broad levels for financial statement purposes. The inputs or methodologies used to value securities are not necessarily an indication of the risk associated with investing in those securities.
Level 1—Quoted prices in active markets for identical securities.
Level 2—Other significant observable inputs (including quoted prices for similar securities, interest rates, prepayment speeds, credit risk, etc.).
Level 3—Significant unobservable inputs (including the fund’s own assumptions used to determine the fair value of investments). Any investments valued with significant unobservable inputs are noted on the Statement of Net Assets.
At September 30, 2018, 100% of the market value of the fund’s investments was determined based on Level 1 inputs.
27
Target Retirement 2045 Fund
D. Permanent differences between book-basis and tax-basis components of net assets are reclassified among capital accounts in the financial statements to reflect their tax character. These reclassifications have no effect on net assets or net asset value per share. As of period end, the following permanent differences primarily attributable to the accounting for distributions in connection with fund share redemptions were reclassified to the following accounts:
| Amount | |
| ($000) | |
| Paid-in Capital | 14,816 |
| Undistributed (Overdistributed) Net Investment Income | (14,102) |
| Accumulated Net Realized Gains (Losses) | (714) |
Temporary differences between book-basis and tax-basis components of accumulated net earnings (losses) arise when certain items of income, gain, or loss are recognized in different periods for financial statement and tax purposes; these differences will reverse at some time in the future. The differences are primarily related to the tax deferral of losses on wash sales. As of period end, the tax-basis components of accumulated net earnings (losses) are detailed in the table as follows:
| Amount | |
| ($000) | |
| Undistributed Ordinary Income | 353,607 |
| Undistributed Long-Term Gains | — |
| Capital Loss Carryforwards (Non-expiring) | — |
| Net Unrealized Gains (Losses) | 7,800,029 |
As of September 30, 2018, gross unrealized appreciation and depreciation for investments and derivatives based on cost for U.S. federal income tax purposes were as follows:
| Amount | ||
| ($000) | ||
| Tax Cost | 16,530,478 | |
| Gross Unrealized Appreciation | 7,878,884 | |
| Gross Unrealized Depreciation | (78,855) | |
| Net Unrealized Appreciation (Depreciation) | 7,800,029 | |
| E. Capital shares issued and redeemed were: | ||
| Year Ended September 30, | ||
| 2018 | 2017 | |
| Shares | Shares | |
| (000) | (000) | |
| Issued | 248,564 | 253,488 |
| Issued in Lieu of Cash Distributions | 18,469 | 21,034 |
| Redeemed | (167,394) | (174,328) |
| Net Increase (Decrease) in Shares Outstanding | 99,639 | 100,194 |
28
Target Retirement 2045 Fund
F. Transactions during the period in affiliated underlying Vanguard funds were as follows:
| Current Period Transactions | ||||||||
| Sept. 30, | Proceeds | Realized | Sept. 30, | |||||
| 2017 | from | Net | Change in | Capital Gain | 2018 | |||
| Market | Purchases | Securities | Gain | Unrealized | Distributions | Market | ||
| Value | at Cost | Sold | (Loss) | App. (Dep.) | Income | Received | Value | |
| ($000) | ($000) | ($000) | ($000) | ($000) | ($000) | ($000) | ($000) | |
| Vanguard Market | ||||||||
| Liquidity Fund | 6,235 | NA1 | NA1 | (5) | — | 69 | — | 6 |
| Vanguard Total | ||||||||
| Bond Market II | ||||||||
| Index Fund | 1,432,028 | 753,046 | 397,731 | (1,604) | (62,377) | 42,176 | 339 | 1,723,362 |
| Vanguard Total | ||||||||
| International Bond | ||||||||
| Index Fund | 603,691 | 129,205 | 20,983 | (88) | (583) | 14,481 | — | 711,242 |
| Vanguard Total | ||||||||
| International Stock | ||||||||
| Index Fund | 7,317,231 | 1,806,730 | 273,773 | 6,011 | (120,497) 222,560 | — | 8,735,702 | |
| Vanguard Total | ||||||||
| Stock Market | ||||||||
| Index Fund | 11,055,891 | 1,269,911 | 938,050 | 21,454 | 1,750,989 | 211,056 | — | 13,160,195 |
| Total | 20,415,076 | 3,958,892 | 1,630,537 | 25,768 | 1,567,532 | 490,342 | 339 | 24,330,507 |
| 1 Not applicable—purchases and sales are for temporary cash investment purposes. | ||||||||
G. Management has determined that no events or transactions occurred subsequent to September 30, 2018, that would require recognition or disclosure in these financial statements.
29
Target Retirement 2050 Fund
Fund Profile
As of September 30, 2018
| Total Fund Characteristics | |
| Ticker Symbol | VFIFX |
| 30-Day SEC Yield | 2.16% |
| Acquired Fund Fees and Expenses1 | 0.15% |
| Allocation to Underlying Vanguard Funds | |
| Vanguard Total Stock Market Index Fund | |
| Investor Shares | 54.0% |
| Vanguard Total International Stock Index | |
| Fund Investor Shares | 36.0 |
| Vanguard Total Bond Market II Index Fund | |
| Investor Shares | 7.1 |
| Vanguard Total International Bond Index | |
| Fund Investor Shares | 2.9 |
| Total Fund Volatility Measures | ||
| MSCI US | ||
| Target 2050 | Broad | |
| Composite | Market | |
| Index | Index | |
| R-Squared | 0.99 | 0.89 |
| Beta | 0.97 | 0.82 |
These measures show the degree and timing of the fund’s fluctuations compared with the indexes over 36 months.
Fund Asset Allocation
1 This figure—drawn from the prospectus dated January 25, 2018—represents an estimate of the weighted average of the expense ratios and any transaction fees charged by the underlying mutual funds (the ”acquired” funds) in which the Target Retirement 2050 Fund invests. The fund does not charge any expenses or fees of its own. For the fiscal year ended September 30, 2018, the acquired fund fees and expenses were 0.15%.
30
Target Retirement 2050 Fund
Performance Summary
All of the returns in this report represent past performance, which is not a guarantee of future results that may be achieved by the fund. (Current performance may be lower or higher than the performance data cited. For performance data current to the most recent month-end, visit our website at vanguard.com/performance.) Note, too, that both investment returns and principal value can fluctuate widely, so an investor’s shares, when sold, could be worth more or less than their original cost. The returns shown do not reflect taxes that a shareholder would pay on fund distributions or on the sale of fund shares.
Cumulative Performance: September 30, 2008, Through September 30, 2018
Initial Investment of $10,000
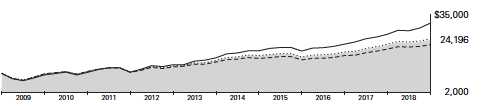
| Average Annual Total Returns | ||||
| Periods Ended September 30, 2018 | ||||
| Final Value | ||||
| One | Five | Ten | of a $10,000 | |
| Year | Years | Years | Investment | |
| Target Retirement 2050 Fund* | 9.84% | 9.38% | 9.24% | $24,196 |
| Target 2050 Composite Index | 10.15 | 9.65 | 9.46 | 24,700 |
| Mixed-Asset Target 2050 Funds | ||||
| Average | 9.09 | 8.39 | 8.31 | 22,225 |
| MSCI US Broad Market Index | 17.62 | 13.52 | 12.12 | 31,391 |
For a benchmark description, see the Glossary.
Mixed-Asset Target 2050 Funds Average: Derived from data provided by Lipper, a Thomson Reuters Company.
See Financial Highlights for dividend and capital gains information.
31
Target Retirement 2050 Fund
Fiscal-Year Total Returns (%): September 30, 2008, Through September 30, 2018
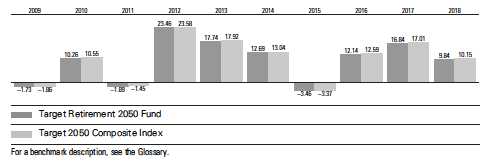
32
Target Retirement 2050 Fund
Financial Statements
Statement of Net Assets
As of September 30, 2018
The fund reports a complete list of its holdings in regulatory filings four times in each fiscal year, at the quarter-ends. For the second and fourth fiscal quarters, the lists appear in the fund’s semiannual and annual reports to shareholders. For the first and third fiscal quarters, the fund files the lists with the Securities and Exchange Commission on Form N-Q. Shareholders can look up the fund’s Forms N-Q on the SEC’s website at sec.gov. Forms N-Q may also be reviewed and copied at the SEC’s Public Reference Room (see the back cover of this report for further information).
| Market | ||
| Value• | ||
| Shares | ($000) | |
| Investment Companies (100.0%) | ||
| U.S. Stock Fund (54.0%) | ||
| Vanguard Total Stock Market Index Fund Investor Shares | 124,567,368 | 9,070,996 |
| International Stock Fund (36.0%) | ||
| Vanguard Total International Stock Index Fund Investor Shares | 348,000,054 | 6,041,281 |
| U.S. Bond Fund (7.1%) | ||
| 1 Vanguard Total Bond Market II Index Fund Investor Shares | 115,671,538 | 1,194,887 |
| International Bond Fund (2.9%) | ||
| Vanguard Total International Bond Index Fund Investor Shares | 44,971,569 | 489,291 |
| Total Investment Companies (Cost $12,309,402) | 16,796,455 | |
| Temporary Cash Investment (0.0%) | ||
| Money Market Fund (0.0%) | ||
| 1 Vanguard Market Liquidity Fund, 2.209% (Cost $1,188) | 11,886 | 1,188 |
| Total Investments (100.0%) (Cost $12,310,590) | 16,797,643 | |
| Other Assets and Liabilities (0.0%) | ||
| Other Assets | 52,892 | |
| Liabilities | (46,527) | |
| 6,365 | ||
| Net Assets (100%) | ||
| Applicable to 444,585,784 outstanding $.001 par value shares of | ||
| beneficial interest (unlimited authorization) | 16,804,008 | |
| Net Asset Value Per Share | $37.80 | |
33
| Target Retirement 2050 Fund | |
| Amount | |
| ($000) | |
| Statement of Assets and Liabilities | |
| Assets | |
| Investments in Securities, at Value—Affiliated Funds | 16,797,643 |
| Receivables for Investment Securities Sold | 6,285 |
| Receivables for Accrued Income | 3,212 |
| Receivables for Capital Shares Issued | 43,342 |
| Other Assets | 53 |
| Total Assets | 16,850,535 |
| Liabilities | |
| Payables for Investment Securities Purchased | 3,161 |
| Payables for Capital Shares Redeemed | 43,366 |
| Total Liabilities | 46,527 |
| Net Assets | 16,804,008 |
| At September 30, 2018, net assets consisted of: | |
| Amount | |
| ($000) | |
| Paid-in Capital | 12,071,282 |
| Undistributed Net Investment Income | 233,962 |
| Accumulated Net Realized Gains | 11,711 |
| Unrealized Appreciation (Depreciation) | 4,487,053 |
| Net Assets | 16,804,008 |
| • See Note A in Notes to Financial Statements. |
| 1 Affiliated fund available only to Vanguard funds and certain trusts and accounts managed by Vanguard. Rate shown for Vanguard |
| Market Liquidity Fund is the 7-day yield. |
See accompanying Notes, which are an integral part of the Financial Statements.
34
| Target Retirement 2050 Fund | |
| Statement of Operations | |
| Year Ended | |
| September 30, 2018 | |
| ($000) | |
| Investment Income | |
| Income | |
| Income Distributions Received from Affiliated Funds | 331,534 |
| Other Income | 52 |
| Net Investment Income—Note B | 331,586 |
| Realized Net Gain (Loss) | |
| Capital Gain Distributions Received from Affiliated Funds | 225 |
| Affiliated Funds Sold | 12,318 |
| Futures Contracts | 132 |
| Realized Net Gain (Loss) | 12,675 |
| Change in Unrealized Appreciation (Depreciation) from Affiliated Funds | 1,053,045 |
| Net Increase (Decrease) in Net Assets Resulting from Operations | 1,397,306 |
See accompanying Notes, which are an integral part of the Financial Statements.
35
| Target Retirement 2050 Fund | ||
| Statement of Changes in Net Assets | ||
| Year Ended September 30, | ||
| 2018 | 2017 | |
| ($000) | ($000) | |
| Increase (Decrease) in Net Assets | ||
| Operations | ||
| Net Investment Income | 331,586 | 255,731 |
| Realized Net Gain (Loss) | 12,675 | 8,597 |
| Change in Unrealized Appreciation (Depreciation) | 1,053,045 | 1,550,560 |
| Net Increase (Decrease) in Net Assets Resulting from Operations | 1,397,306 | 1,814,888 |
| Distributions | ||
| Net Investment Income | (271,760) | (193,369) |
| Realized Capital Gain1 | (3,856) | (11,266) |
| Total Distributions | (275,616) | (204,635) |
| Capital Share Transactions | ||
| Issued | 4,834,564 | 4,182,146 |
| Issued in Lieu of Cash Distributions | 271,105 | 201,506 |
| Redeemed | (2,830,456) | (2,220,595) |
| Net Increase (Decrease) from Capital Share Transactions | 2,275,213 | 2,163,057 |
| Total Increase (Decrease) | 3,396,903 | 3,773,310 |
| Net Assets | ||
| Beginning of Period | 13,407,105 | 9,633,795 |
| End of Period2 | 16,804,008 | 13,407,105 |
1 Includes fiscal 2018 and 2017 short-term gain distributions totaling $3,657,000 and $2,504,000, respectively. Short-term gain
distributions are treated as ordinary income dividends for tax purposes.
2 Net Assets—End of Period includes undistributed (overdistributed) net investment income of $233,962,000 and $174,136,000.
See accompanying Notes, which are an integral part of the Financial Statements.
36
| Target Retirement 2050 Fund | |||||
| Financial Highlights | |||||
| For a Share Outstanding | Year Ended September 30, | ||||
| Throughout Each Period | 2018 | 2017 | 2016 | 2015 | 2014 |
| Net Asset Value, Beginning of Period | $35.07 | $30.63 | $27.95 | $29.53 | $26.69 |
| Investment Operations | |||||
| Net Investment Income | .7941 | .7271 | .636 | .623 | .586 |
| Capital Gain Distributions Received | .0011 | .0021 | .003 | .006 | .001 |
| Net Realized and Unrealized Gain (Loss) | |||||
| on Investments | 2.629 | 4.332 | 2.714 | (1.609) | 2.771 |
| Total from Investment Operations | 3.424 | 5.061 | 3.353 | (.980) | 3.358 |
| Distributions | |||||
| Dividends from Net Investment Income | (.684) | (.587) | (.585) | (.596) | (.518) |
| Distributions from Realized Capital Gains | (.010) | (.034) | (.088) | (.004) | — |
| Total Distributions | (.694) | (.621) | (.673) | (.600) | (.518) |
| Net Asset Value, End of Period | $37.80 | $35.07 | $30.63 | $27.95 | $29.53 |
| Total Return2 | 9.84% | 16.84% | 12.14% | -3.46% | 12.69% |
| Ratios/Supplemental Data | |||||
| Net Assets, End of Period (Millions) | $16,804 | $13,407 | $9,634 | $7,893 | $7,389 |
| Ratio of Total Expenses to Average Net Assets | — | — | — | — | — |
| Acquired Fund Fees and Expenses | 0.15% | 0.15% | 0.16% | 0.16% | 0.18% |
| Ratio of Net Investment Income to | |||||
| Average Net Assets | 2.16% | 2.24% | 2.24% | 2.11% | 2.19% |
| Portfolio Turnover Rate | 7% | 6% | 12% | 18% | 7% |
1 Calculated based on average shares outstanding.
2 Total returns do not include account service fees that may have applied in the periods shown. Fund prospectuses provide information
about any applicable account service fees.
See accompanying Notes, which are an integral part of the Financial Statements.
37
Target Retirement 2050 Fund
Notes to Financial Statements
Vanguard Target Retirement 2050 Fund is registered under the Investment Company Act of 1940 as an open-end investment company, or mutual fund. The fund follows a balanced investment strategy by investing in selected Vanguard funds to achieve its targeted allocation of assets to U.S. and international stocks, and U.S. and international bonds. Financial statements and other information about each underlying fund are available on vanguard.com.
A. The following significant accounting policies conform to generally accepted accounting principles for U.S. investment companies. The fund consistently follows such policies in preparing its financial statements.
1. Security Valuation: Investments are valued at the net asset value of each underlying Vanguard fund determined as of the close of the New York Stock Exchange (generally 4 p.m., Eastern time) on the valuation date.
2. Futures Contracts: The fund uses stock and bond futures contracts to a limited extent, with the objectives of maintaining full exposure to the market and maintaining its target asset allocation. The primary risks associated with the use of futures contracts are imperfect correlation between changes in market values of investments held by the fund and the prices of futures contracts, and the possibility of an illiquid market. Counterparty risk involving futures is mitigated because a regulated clearinghouse is the counterparty instead of the clearing broker. To further mitigate counterparty risk, the fund trades futures contracts on an exchange, monitors the financial strength of its clearing brokers and clearinghouse, and has entered into clearing agreements with its clearing brokers. The clearinghouse imposes initial margin requirements to secure the fund’s performance and requires daily settlement of variation margin representing changes in the market value of each contract. Any assets pledged as initial margin for open contracts are noted in the Statement of Net Assets.
Futures contracts are valued at their quoted daily settlement prices. The notional amounts of the contracts are not recorded in the Statement of Net Assets. Fluctuations in the value of the contracts are recorded in the Statement of Assets and Liabilities as an asset (liability) and in the Statement of Operations as unrealized appreciation (depreciation) until the contracts are closed, when they are recorded as realized futures gains (losses).
During the year ended September 30, 2018, the fund’s average investments in long and short futures contracts represented less than 1% and 0% of net assets, respectively, based on the average of the notional amounts at each quarter-end during the period. The fund had no open futures contracts at September 30, 2018.
3. Federal Income Taxes: The fund intends to continue to qualify as a regulated investment company and distribute all of its taxable income. Management has analyzed the fund’s tax positions taken for all open federal income tax years (September 30, 2015–2018), and has concluded that no provision for federal income tax is required in the fund’s financial statements.
4. Distributions: Distributions to shareholders are recorded on the ex-dividend date. Distributions are determined on a tax basis and may differ from net investment income and realized capital gains for financial reporting purposes.
38
Target Retirement 2050 Fund
5. Credit Facility: The fund and certain other funds managed by The Vanguard Group (“Vanguard”) participate in a $3.1 billion committed credit facility provided by a syndicate of lenders pursuant to a credit agreement that may be renewed annually; each fund is individually liable for its borrowings, if any, under the credit facility. Borrowings may be utilized for temporary and emergency purposes, and are subject to the fund’s regulatory and contractual borrowing restrictions. The participating funds are charged administrative fees and an annual commitment fee of 0.10% of the undrawn amount of the facility; these fees are allocated to the funds based on a method approved by the fund’s board of trustees and borne by the funds in which the fund invests (see Note B). Any borrowings under this facility bear interest at a rate based upon the higher of the one-month London Interbank Offered Rate, federal funds effective rate, or overnight bank funding rate plus an agreed-upon spread.
The fund had no borrowings outstanding at September 30, 2018, or at any time during the period then ended.
6. Other: Income and capital gain distributions received are recorded on the ex-dividend date. Security transactions are accounted for on the date securities are bought or sold. Costs used to determine realized gains (losses) on the sale of investment securities are those of the specific securities sold.
B. In accordance with the terms of a Funds’ Service Agreement (the “FSA”) between Vanguard and the fund, Vanguard furnishes to the fund investment advisory, corporate management, administrative, marketing, and distribution services at Vanguard’s cost of operations (as defined by the FSA). These costs of operations are allocated to the fund based on methods and guidelines approved by the board of trustees. The FSA provides that expenses otherwise allocable to Vanguard funds-of-funds may be reduced or eliminated to the extent of savings realized by the underlying Vanguard funds by virtue of being part of a fund-of-funds. Accordingly, all expenses for services provided by Vanguard to the fund and all other expenses incurred by the fund during the period ended September 30, 2018, were borne by the underlying Vanguard funds in which the fund invests. The fund’s trustees and officers are also trustees and officers, respectively, of the underlying Vanguard funds, as well as directors and employees, respectively, of Vanguard.
C. Various inputs may be used to determine the value of the fund’s investments. These inputs are summarized in three broad levels for financial statement purposes. The inputs or methodologies used to value securities are not necessarily an indication of the risk associated with investing in those securities.
Level 1—Quoted prices in active markets for identical securities.
Level 2—Other significant observable inputs (including quoted prices for similar securities, interest rates, prepayment speeds, credit risk, etc.).
Level 3—Significant unobservable inputs (including the fund’s own assumptions used to determine the fair value of investments). Any investments valued with significant unobservable inputs are noted on the Statement of Net Assets.
At September 30, 2018, 100% of the market value of the fund’s investments was determined based on Level 1 inputs.
39
Target Retirement 2050 Fund
D. Permanent differences between book-basis and tax-basis components of net asset, if any, are reclassified among capital accounts in the financial statements to reflect their tax character. These reclassifications have no effect on net assets or net asset value per share.
Temporary differences between book-basis and tax-basis components of accumulated net earnings (losses) arise when certain items of income, gain, or loss are recognized in different periods for financial statement and tax purposes; these differences will reverse at some time in the future. The differences are primarily related to the tax deferral of losses on wash sales. As of period end, the tax-basis components of accumulated net earnings (losses) are detailed in the table as follows:
| Amount | |
| ($000) | |
| Undistributed Ordinary Income | 245,673 |
| Undistributed Long-Term Gains | — |
| Capital Loss Carryforwards (Non-expiring) | — |
| Net Unrealized Gains (Losses) | 4,487,053 |
As of September 30, 2018, gross unrealized appreciation and depreciation for investments and derivatives based on cost for U.S. federal income tax purposes were as follows:
| Amount | ||
| ($000) | ||
| Tax Cost | 12,310,590 | |
| Gross Unrealized Appreciation | 4,558,077 | |
| Gross Unrealized Depreciation | (71,024) | |
| Net Unrealized Appreciation (Depreciation) | 4,487,053 | |
| E. Capital shares issued and redeemed were: | ||
| Year Ended September 30, | ||
| 2018 | 2017 | |
| Shares | Shares | |
| (000) | (000) | |
| Issued | 131,840 | 129,546 |
| Issued in Lieu of Cash Distributions | 7,468 | 6,635 |
| Redeemed | (76,965) | (68,419) |
| Net Increase (Decrease) in Shares Outstanding | 62,343 | 67,762 |
40
Target Retirement 2050 Fund
F. Transactions during the period in affiliated underlying Vanguard funds were as follows:
| Current Period Transactions | ||||||||
| Sept. 30, | Proceeds | Realized | Sept. 30, | |||||
| 2017 | from | Net | Change in | Capital Gain | 2018 | |||
| Market | Purchases | Securities | Gain | Unrealized | Distributions | Market | ||
| Value | at Cost | Sold | (Loss) | App. (Dep.) | Income | Received | Value | |
| ($000) | ($000) | ($000) | ($000) | ($000) | ($000) | ($000) | ($000) | |
| Vanguard Market | ||||||||
| Liquidity Fund | 6,411 | NA1 | NA1 | (4) | — | 69 | — | 1,188 |
| Vanguard Total | ||||||||
| Bond Market II | ||||||||
| Index Fund | 941,432 | 593,181 | 296,723 | (219) | (42,784) | 28,467 | 225 | 1,194,887 |
| Vanguard Total | ||||||||
| International Bond | ||||||||
| Index Fund | 395,258 | 100,820 | 6,288 | — | (499) | 9,643 | — | 489,291 |
| Vanguard Total | ||||||||
| International Stock | ||||||||
| Index Fund | 4,811,996 | 1,476,559 | 163,240 | 3,081 | (87,115) | 150,508 | — | 6,041,281 |
| Vanguard Total | ||||||||
| Stock Market | ||||||||
| Index Fund | 7,256,355 | 1,186,251 | 564,513 | 9,460 | 1,183,443 | 142,847 | — | 9,070,996 |
| Total | 13,411,452 | 3,356,811 | 1,030,764 | 12,318 | 1,053,045 | 331,534 | 225 | 16,797,643 |
| 1 Not applicable—purchases and sales are for temporary cash investment purposes. | ||||||||
G. Management has determined that no events or transactions occurred subsequent to September 30, 2018, that would require recognition or disclosure in these financial statements.
41
Target Retirement 2055 Fund
Fund Profile
As of September 30, 2018
| Total Fund Characteristics | |
| Ticker Symbol | VFFVX |
| 30-Day SEC Yield | 2.04% |
| Acquired Fund Fees and Expenses1 | 0.15% |
| Allocation to Underlying Vanguard Funds | |
| Vanguard Total Stock Market Index Fund | |
| Investor Shares | 54.0% |
| Vanguard Total International Stock Index | |
| Fund Investor Shares | 36.0 |
| Vanguard Total Bond Market II Index Fund | |
| Investor Shares | 7.1 |
| Vanguard Total International Bond Index | |
| Fund Investor Shares | 2.9 |
| Total Fund Volatility Measures | ||
| MSCI US | ||
| Target 2055 | Broad | |
| Composite | Market | |
| Index | Index | |
| R-Squared | 0.99 | 0.90 |
| Beta | 0.97 | 0.82 |
These measures show the degree and timing of the fund’s fluctuations compared with the indexes over 36 months.
Fund Asset Allocation
1 This figure—drawn from the prospectus dated January 25, 2018—represents an estimate of the weighted average of the expense ratios and any transaction fees charged by the underlying mutual funds (the ”acquired” funds) in which the Target Retirement 2055 Fund invests. The fund does not charge any expenses or fees of its own. For the fiscal year ended September 30, 2018, the acquired fund fees and expenses were 0.15%.
42
Target Retirement 2055 Fund
Performance Summary
All of the returns in this report represent past performance, which is not a guarantee of future results that may be achieved by the fund. (Current performance may be lower or higher than the performance data cited. For performance data current to the most recent month-end, visit our website at vanguard.com/performance.) Note, too, that both investment returns and principal value can fluctuate widely, so an investor’s shares, when sold, could be worth more or less than their original cost. The returns shown do not reflect taxes that a shareholder would pay on fund distributions or on the sale of fund shares.
Cumulative Performance: August 18, 2010, Through September 30, 2018
Initial Investment of $10,000
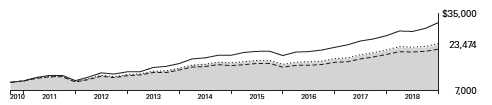
| Average Annual Total Returns | ||||
| Periods Ended September 30, 2018 | ||||
| Since | Final Value | |||
| One | Five | Inception | of a $10,000 | |
| Year | Years | (8/18/2010) | Investment | |
| Target Retirement 2055 Fund* | 9.79% | 9.34% | 11.08% | $23,474 |
| Target 2055 Composite Index | 10.15 | 9.65 | 11.34 | 23,912 |
| Spliced Mixed-Asset Target 2055+ | ||||
| Funds Average | 9.53 | 8.78 | 10.19 | 21,978 |
| MSCI US Broad Market Index | 17.62 | 13.52 | 15.22 | 31,593 |
For a benchmark description, see the Glossary.
"Since Inception" performance is calculated from the inception date for both the fund and its comparative standards.
See Financial Highlights for dividend and capital gains information.
43
Target Retirement 2055 Fund
Fiscal-Year Total Returns (%): August 18, 2010, Through September 30, 2018

44
Target Retirement 2055 Fund
Financial Statements
Statement of Net Assets
As of September 30, 2018
The fund reports a complete list of its holdings in regulatory filings four times in each fiscal year, at the quarter-ends. For the second and fourth fiscal quarters, the lists appear in the fund’s semiannual and annual reports to shareholders. For the first and third fiscal quarters, the fund files the lists with the Securities and Exchange Commission on Form N-Q. Shareholders can look up the fund’s Forms N-Q on the SEC’s website at sec.gov. Forms N-Q may also be reviewed and copied at the SEC’s Public Reference Room (see the back cover of this report for further information).
| Market | ||
| Value• | ||
| Shares | ($000) | |
| Investment Companies (99.9%) | ||
| U.S. Stock Fund (54.0%) | ||
| Vanguard Total Stock Market Index Fund Investor Shares | 59,410,075 | 4,326,242 |
| International Stock Fund (35.9%) | ||
| Vanguard Total International Stock Index Fund Investor Shares | 165,793,080 | 2,878,168 |
| U.S. Bond Fund (7.1%) | ||
| 1 Vanguard Total Bond Market II Index Fund Investor Shares | 55,127,986 | 569,472 |
| International Bond Fund (2.9%) | ||
| Vanguard Total International Bond Index Fund Investor Shares | 21,286,736 | 231,600 |
| Total Investment Companies (Cost $6,608,199) | 8,005,482 | |
| Temporary Cash Investment (0.1%) | ||
| Money Market Fund (0.1%) | ||
| 1 Vanguard Market Liquidity Fund, 2.209% (Cost $3,066) | 30,662 | 3,066 |
| Total Investments (100%) (Cost $6,611,265) | 8,008,548 | |
| Other Assets and Liabilities (0.0%) | ||
| Other Assets | 33,528 | |
| Liabilities | (31,420) | |
| 2,108 | ||
| Net Assets (100%) | ||
| Applicable to 195,596,987 outstanding $.001 par value shares of | ||
| beneficial interest (unlimited authorization) | 8,010,656 | |
| Net Asset Value Per Share | $40.95 | |
45
| Target Retirement 2055 Fund | |
| Amount | |
| ($000) | |
| Statement of Assets and Liabilities | |
| Assets | |
| Investments in Securities, at Value—Affiliated Funds | 8,008,548 |
| Receivables for Investment Securities Sold | 15,391 |
| Receivables for Capital Shares Issued | 16,611 |
| Receivables for Accrued Income | 1,512 |
| Other Assets | 14 |
| Total Assets | 8,042,076 |
| Liabilities | |
| Payables for Investment Securities Purchased | 1,513 |
| Payables for Capital Shares Redeemed | 29,907 |
| Total Liabilities | 31,420 |
| Net Assets | 8,010,656 |
| At September 30, 2018, net assets consisted of: | |
| Amount | |
| ($000) | |
| Paid-in Capital | 6,506,046 |
| Undistributed Net Investment Income | 109,142 |
| Accumulated Net Realized Losses | (1,815) |
| Unrealized Appreciation (Depreciation) | 1,397,283 |
| Net Assets | 8,010,656 |
• See Note A in Notes to Financial Statements.
1 Affiliated fund available only to Vanguard funds and certain trusts and accounts managed by Vanguard. Rate shown for Vanguard
Market Liquidity Fund is the 7-day yield.
See accompanying Notes, which are an integral part of the Financial Statements.
46
| Target Retirement 2055 Fund | |
| Statement of Operations | |
| Year Ended | |
| September 30, 2018 | |
| ($000) | |
| Investment Income | |
| Income | |
| Income Distributions Received from Affiliated Funds | 151,249 |
| Net Investment Income—Note B | 151,249 |
| Realized Net Gain (Loss) | |
| Capital Gain Distributions Received from Affiliated Funds | 97 |
| Affiliated Funds Sold | (834) |
| Futures Contracts | 65 |
| Realized Net Gain (Loss) | (672) |
| Change in Unrealized Appreciation (Depreciation) from Affiliated Funds | 464,109 |
| Net Increase (Decrease) in Net Assets Resulting from Operations | 614,686 |
See accompanying Notes, which are an integral part of the Financial Statements.
47
| Target Retirement 2055 Fund | ||
| Statement of Changes in Net Assets | ||
| Year Ended September 30, | ||
| 2018 | 2017 | |
| ($000) | ($000) | |
| Increase (Decrease) in Net Assets | ||
| Operations | ||
| Net Investment Income | 151,249 | 100,282 |
| Realized Net Gain (Loss) | (672) | 1,087 |
| Change in Unrealized Appreciation (Depreciation) | 464,109 | 610,032 |
| Net Increase (Decrease) in Net Assets Resulting from Operations | 614,686 | 711,401 |
| Distributions | ||
| Net Investment Income | (113,882) | (73,319) |
| Realized Capital Gain1 | — | (224) |
| Total Distributions | (113,882) | (73,543) |
| Capital Share Transactions | ||
| Issued | 3,016,467 | 2,324,300 |
| Issued in Lieu of Cash Distributions | 111,895 | 72,303 |
| Redeemed | (1,218,478) | (833,493) |
| Net Increase (Decrease) from Capital Share Transactions | 1,909,884 | 1,563,110 |
| Total Increase (Decrease) | 2,410,688 | 2,200,968 |
| Net Assets | ||
| Beginning of Period | 5,599,968 | 3,399,000 |
| End of Period2 | 8,010,656 | 5,599,968 |
1 Includes fiscal 2018 and 2017 short-term gain distributions totaling $0 and $224,000, respectively. Short-term gain distributions
are treated as ordinary income dividends for tax purposes.
2 Net Assets—End of Period includes undistributed (overdistributed) net investment income of $109,142,000 and $71,775,000.
See accompanying Notes, which are an integral part of the Financial Statements.
48
| Target Retirement 2055 Fund | |||||
| Financial Highlights | |||||
| For a Share Outstanding | Year Ended September 30, | ||||
| Throughout Each Period | 2018 | 2017 | 2016 | 2015 | 2014 |
| Net Asset Value, Beginning of Period | $37.98 | $33.15 | $30.14 | $31.80 | $28.67 |
| Investment Operations | |||||
| Net Investment Income | . 8681 | .7961 | .642 | .631 | .577 |
| Capital Gain Distributions Received | .0011 | .0021 | .003 | .005 | .001 |
| Net Realized and Unrealized Gain (Loss) | |||||
| on Investments | 2.819 | 4.688 | 2.974 | (1.736) | 3.033 |
| Total from Investment Operations | 3.688 | 5.486 | 3.619 | (1.100) | 3.611 |
| Distributions | |||||
| Dividends from Net Investment Income | (.718) | (.654) | (.593) | (.554) | (.477) |
| Distributions from Realized Capital Gains | — | (.002) | (.016) | (.006) | (.004) |
| Total Distributions | (.718) | (.656) | (.609) | (.560) | (.481) |
| Net Asset Value, End of Period | $40.95 | $37.98 | $33.15 | $30.14 | $31.80 |
| Total Return2 | 9.79% | 16.86% | 12.13% | -3.58% | 12.69% |
| Ratios/Supplemental Data | |||||
| Net Assets, End of Period (Millions) | $8,011 | $5,600 | $3,399 | $2,279 | $1,670 |
| Ratio of Total Expenses to Average Net Assets | — | — | — | — | — |
| Acquired Fund Fees and Expenses | 0.15% | 0.15% | 0.16% | 0.16% | 0.18% |
| Ratio of Net Investment Income to | |||||
| Average Net Assets | 2.18% | 2.26% | 2.27% | 2.17% | 2.22% |
| Portfolio Turnover Rate | 5% | 5% | 8% | 18% | 7% |
1 Calculated based on average shares outstanding.
2 Total returns do not include account service fees that may have applied in the periods shown. Fund prospectuses provide information
about any applicable account service fees.
See accompanying Notes, which are an integral part of the Financial Statements.
49
Target Retirement 2055 Fund
Notes to Financial Statements
Vanguard Target Retirement 2055 Fund is registered under the Investment Company Act of 1940 as an open-end investment company, or mutual fund. The fund follows a balanced investment strategy by investing in selected Vanguard funds to achieve its targeted allocation of assets to U.S. and international stocks, and U.S. and international bonds. Financial statements and other information about each underlying fund are available on vanguard.com.
A. The following significant accounting policies conform to generally accepted accounting principles for U.S. investment companies. The fund consistently follows such policies in preparing its financial statements.
1. Security Valuation: Investments are valued at the net asset value of each underlying Vanguard fund determined as of the close of the New York Stock Exchange (generally 4 p.m., Eastern time) on the valuation date.
2. Futures Contracts: The fund uses stock and bond futures contracts to a limited extent, with the objectives of maintaining full exposure to the market and maintaining its target asset allocation. The primary risks associated with the use of futures contracts are imperfect correlation between changes in market values of investments held by the fund and the prices of futures contracts, and the possibility of an illiquid market. Counterparty risk involving futures is mitigated because a regulated clearinghouse is the counterparty instead of the clearing broker. To further mitigate counterparty risk, the fund trades futures contracts on an exchange, monitors the financial strength of its clearing brokers and clearinghouse, and has entered into clearing agreements with its clearing brokers. The clearinghouse imposes initial margin requirements to secure the fund’s performance and requires daily settlement of variation margin representing changes in the market value of each contract. Any assets pledged as initial margin for open contracts are noted in the Statement of Net Assets.
Futures contracts are valued at their quoted daily settlement prices. The notional amounts of the contracts are not recorded in the Statement of Net Assets. Fluctuations in the value of the contracts are recorded in the Statement of Assets and Liabilities and in the Statement of Operations as unrealized appreciation (depreciation) until the contracts are closed, when they are recorded as realized futures gains (losses).
During the year ended September 30, 2018, the fund’s average investments in long and short futures contracts represented less than 1% and 0% of net assets, respectively, based on the average of the notional amounts at each quarter-end during the period. The fund had no open futures contracts at September 30, 2018.
3. Federal Income Taxes: The fund intends to continue to qualify as a regulated investment company and distribute all of its taxable income. Management has analyzed the fund’s tax positions taken for all open federal income tax years (September 30, 2015–2018), and has concluded that no provision for federal income tax is required in the fund’s financial statements.
4. Distributions: Distributions to shareholders are recorded on the ex-dividend date. Distributions are determined on a tax basis and may differ from net investment income and realized capital gains for financial reporting purposes.
50
Target Retirement 2055 Fund
5. Credit Facility: The fund and certain other funds managed by The Vanguard Group (“Vanguard”) participate in a $3.1 billion committed credit facility provided by a syndicate of lenders pursuant to a credit agreement that may be renewed annually; each fund is individually liable for its borrowings, if any, under the credit facility. Borrowings may be utilized for temporary and emergency purposes, and are subject to the fund’s regulatory and contractual borrowing restrictions. The participating funds are charged administrative fees and an annual commitment fee of 0.10% of the undrawn amount of the facility; these fees are allocated to the funds based on a method approved by the fund’s board of trustees and borne by the funds in which the fund invests (see Note B). Any borrowings under this facility bear interest at a rate based upon the higher of the one-month London Interbank Offered Rate, federal funds effective rate, or overnight bank funding rate plus an agreed-upon spread.
The fund had no borrowings outstanding at September 30, 2018, or at any time during the period then ended.
6. Other: Income and capital gain distributions received are recorded on the ex-dividend date. Security transactions are accounted for on the date securities are bought or sold. Costs used to determine realized gains (losses) on the sale of investment securities are those of the specific securities sold.
B. In accordance with the terms of a Funds’ Service Agreement (the “FSA”) between Vanguard and the fund, Vanguard furnishes to the fund investment advisory, corporate management, administrative, marketing, and distribution services at Vanguard’s cost of operations (as defined by the FSA). These costs of operations are allocated to the fund based on methods and guidelines approved by the board of trustees. The FSA provides that expenses otherwise allocable to Vanguard funds-of-funds may be reduced or eliminated to the extent of savings realized by the underlying Vanguard funds by virtue of being part of a fund-of-funds. Accordingly, all expenses for services provided by Vanguard to the fund and all other expenses incurred by the fund during the period ended September 30, 2018, were borne by the underlying Vanguard funds in which the fund invests. The fund’s trustees and officers are also trustees and officers, respectively, of the underlying Vanguard funds, as well as directors and employees, respectively, of Vanguard.
C. Various inputs may be used to determine the value of the fund’s investments. These inputs are summarized in three broad levels for financial statement purposes. The inputs or methodologies used to value securities are not necessarily an indication of the risk associated with investing in those securities.
Level 1—Quoted prices in active markets for identical securities.
Level 2—Other significant observable inputs (including quoted prices for similar securities, interest rates, prepayment speeds, credit risk, etc.).
Level 3—Significant unobservable inputs (including the fund’s own assumptions used to determine the fair value of investments). Any investments valued with significant unobservable inputs are noted on the Statement of Net Assets.
At September 30, 2018, 100% of the market value of the fund’s investments was determined based on Level 1 inputs.
51
Target Retirement 2055 Fund
D. Permanent differences between book-basis and tax-basis components of net assets, if any, are reclassified among capital accounts in the financial statements to reflect their tax character. These reclassifications have no effect on net assets or net asset value per share.
Temporary differences between book-basis and tax-basis components of accumulated net earnings (losses) arise when certain items of income, gain, or loss are recognized in different periods for financial statement and tax purposes; these differences will reverse at some time in the future. The differences are primarily related to the tax deferral of losses on wash sales. As of period end, the tax-basis components of accumulated net earnings (losses) are detailed in the table as follows:
| Amount | |
| ($000) | |
| Undistributed Ordinary Income | 109,143 |
| Undistributed Long-Term Gains | — |
| Capital Loss Carryforwards (Non-expiring) | (1,816) |
| Net Unrealized Gains (Losses) | 1,397,283 |
As of September 30, 2018, gross unrealized appreciation and depreciation for investments and derivatives based on cost for U.S. federal income tax purposes were as follows:
| Amount | ||
| ($000) | ||
| Tax Cost | 6,611,265 | |
| Gross Unrealized Appreciation | 1,446,694 | |
| Gross Unrealized Depreciation | (49,411) | |
| Net Unrealized Appreciation (Depreciation) | 1,397,283 | |
| E. Capital shares issued and redeemed were: | ||
| Year Ended September 30, | ||
| 2018 | 2017 | |
| Shares | Shares | |
| (000) | (000) | |
| Issued | 75,923 | 66,428 |
| Issued in Lieu of Cash Distributions | 2,845 | 2,199 |
| Redeemed | (30,634) | (23,689) |
| Net Increase (Decrease) in Shares Outstanding | 48,134 | 44,938 |
52
Target Retirement 2055 Fund
F. Transactions during the period in affiliated underlying Vanguard funds were as follows:
| Current Period Transactions | ||||||||
| Sept. 30, | Proceeds | Realized | Sept. 30, | |||||
| 2017 | from | Net | Change in | Capital Gain | 2018 | |||
| Market | Purchases | Securities | Gain | Unrealized | Distributions | Market | ||
| Value | at Cost | Sold | (Loss) | App. (Dep.) | Income | Received | Value | |
| ($000) | ($000) | ($000) | ($000) | ($000) | ($000) | ($000) | ($000) | |
| Vanguard Market | ||||||||
| Liquidity Fund | 2,448 | NA1 | NA1 | (2) | — | 65 | — | 3,066 |
| Vanguard Total | ||||||||
| Bond Market II | ||||||||
| Index Fund | 393,769 | 302,096 | 107,108 | (392) | (18,893) | 12,930 | 97 | 569,472 |
| Vanguard Total | ||||||||
| International Bond | ||||||||
| Index Fund | 164,044 | 70,662 | 2,878 | — | (228) | 4,238 | — | 231,600 |
| Vanguard Total | ||||||||
| International Stock | ||||||||
| Index Fund | 2,010,617 | 962,615 | 44,424 | (620) | (50,020) | 68,669 | — | 2,878,168 |
| Vanguard Total | ||||||||
| Stock Market | ||||||||
| Index Fund | 3,024,478 | 928,986 | 160,652 | 180 | 533,250 | 65,347 | — | 4,326,242 |
| Total | 5,595,356 | 2,264,359 | 315,062 | (834) | 464,109 | 151,249 | 97 | 8,008,548 |
| 1 Not applicable—purchases and sales are for temporary cash investment purposes. | ||||||||
G. Management has determined that no events or transactions occurred subsequent to September 30, 2018, that would require recognition or disclosure in these financial statements.
53
Target Retirement 2060 Fund
Fund Profile
As of September 30, 2018
| Total Fund Characteristics | |
| Ticker Symbol | VTTSX |
| 30-Day SEC Yield | 2.21% |
| Acquired Fund Fees and Expenses1 | 0.15% |
| Allocation to Underlying Vanguard Funds | |
| Vanguard Total Stock Market Index Fund | |
| Investor Shares | 54.1% |
| Vanguard Total International Stock Index | |
| Fund Investor Shares | 35.9 |
| Vanguard Total Bond Market II Index Fund | |
| Investor Shares | 7.1 |
| Vanguard Total International Bond Index | |
| Fund Investor Shares | 2.9 |
| Total Fund Volatility Measures | ||
| MSCI US | ||
| Target 2060 | Broad | |
| Composite | Market | |
| Index | Index | |
| R-Squared | 0.99 | 0.90 |
| Beta | 0.97 | 0.82 |
These measures show the degree and timing of the fund’s fluctuations compared with the indexes over 36 months.
Fund Asset Allocation
1 This figure—drawn from the prospectus dated January 25, 2018—represents an estimate of the weighted average of the expense ratios and any transaction fees charged by the underlying mutual funds (the ”acquired” funds) in which the Target Retirement 2060 Fund invests. The fund does not charge any expenses or fees of its own. For the fiscal year ended September 30, 2018, the acquired fund fees and expenses were 0.15%.
54
Target Retirement 2060 Fund
Performance Summary
All of the returns in this report represent past performance, which is not a guarantee of future results that may be achieved by the fund. (Current performance may be lower or higher than the performance data cited. For performance data current to the most recent month-end, visit our website at vanguard.com/performance.) Note, too, that both investment returns and principal value can fluctuate widely, so an investor’s shares, when sold, could be worth more or less than their original cost. The returns shown do not reflect taxes that a shareholder would pay on fund distributions or on the sale of fund shares.
Cumulative Performance: January 19, 2012, Through September 30, 2018
Initial Investment of $10,000
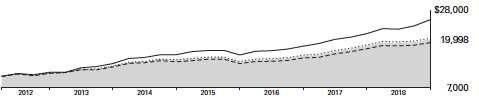
| Average Annual Total Returns | ||||
| Periods Ended September 30, 2018 | ||||
| Since | Final Value | |||
| One | Five | Inception | of a $10,000 | |
| Year | Years | (1/19/2012) | Investment | |
| Target Retirement 2060 Fund* | 9.81% | 9.35% | 10.91% | $19,998 |
| Target 2060 Composite Index | 10.15 | 9.65 | 11.18 | 20,333 |
| Spliced Mixed-Asset Target 2055+ | ||||
| Funds Average | 9.53 | 8.78 | 10.18 | 19,135 |
| MSCI US Broad Market Index | 17.62 | 13.52 | 14.92 | 25,369 |
For a benchmark description, see the Glossary.
"Since Inception" performance is calculated from the inception date for both the fund and its comparative standards.
See Financial Highlights for dividend and capital gains information.
55
Target Retirement 2060 Fund
Fiscal-Year Total Returns (%): January 19, 2012, Through September 30, 2018
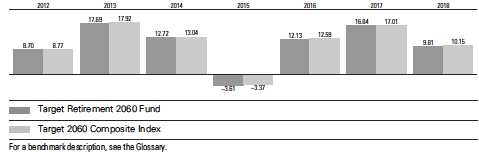
56
Target Retirement 2060 Fund
Financial Statements
Statement of Net Assets
As of September 30, 2018
The fund reports a complete list of its holdings in regulatory filings four times in each fiscal year, at the quarter-ends. For the second and fourth fiscal quarters, the lists appear in the fund’s semiannual and annual reports to shareholders. For the first and third fiscal quarters, the fund files the lists with the Securities and Exchange Commission on Form N-Q. Shareholders can look up the fund’s Forms N-Q on the SEC’s website at sec.gov. Forms N-Q may also be reviewed and copied at the SEC’s Public Reference Room (see the back cover of this report for further information).
| Market | ||
| Value• | ||
| Shares | ($000) | |
| Investment Companies (99.9%) | ||
| U.S. Stock Fund (54.0%) | ||
| Vanguard Total Stock Market Index Fund Investor Shares | 24,035,669 | 1,750,277 |
| International Stock Fund (35.9%) | ||
| Vanguard Total International Stock Index Fund Investor Shares | 66,926,126 | 1,161,838 |
| U.S. Bond Fund (7.1%) | ||
| 1 Vanguard Total Bond Market II Index Fund Investor Shares | 22,298,866 | 230,347 |
| International Bond Fund (2.9%) | ||
| Vanguard Total International Bond Index Fund Investor Shares | 8,687,249 | 94,517 |
| Total Investment Companies (Cost $2,762,813) | 3,236,979 | |
| Temporary Cash Investment (0.0%) | ||
| Money Market Fund (0.0%) | ||
| 1 Vanguard Market Liquidity Fund, 2.209% (Cost $578) | 5,779 | 578 |
| Total Investments (99.9%) (Cost $2,763,391) | 3,237,557 | |
| Other Assets and Liabilities (0.1%) | ||
| Other Assets | 12,079 | |
| Liabilities | (9,997) | |
| 2,082 | ||
| Net Assets (100%) | ||
| Applicable to 89,587,816 outstanding $.001 par value shares of | ||
| beneficial interest (unlimited authorization) | 3,239,639 | |
| Net Asset Value Per Share | $36.16 | |
57
| Target Retirement 2060 Fund | |
| Amount | |
| ($000) | |
| Statement of Assets and Liabilities | |
| Assets | |
| Investments in Securities, at Value—Affiliated Funds | 3,237,557 |
| Receivables for Capital Shares Issued | 11,460 |
| Receivables for Accrued Income | 613 |
| Other Assets | 6 |
| Total Assets | 3,249,636 |
| Liabilities | |
| Payables for Investment Securities Purchased | 3,009 |
| Payables for Capital Shares Redeemed | 6,988 |
| Total Liabilities | 9,997 |
| Net Assets | 3,239,639 |
| At September 30, 2018, net assets consisted of: | |
| Amount | |
| ($000) | |
| Paid-in Capital | 2,721,908 |
| Undistributed Net Investment Income | 43,246 |
| Accumulated Net Realized Gains | 319 |
| Unrealized Appreciation (Depreciation) | 474,166 |
| Net Assets | 3,239,639 |
• See Note A in Notes to Financial Statements.
1 Affiliated fund available only to Vanguard funds and certain trusts and accounts managed by Vanguard. Rate shown for Vanguard
Market Liquidity Fund is the 7-day yield.
See accompanying Notes, which are an integral part of the Financial Statements.
58
| Target Retirement 2060 Fund | |
| Statement of Operations | |
| Year Ended | |
| September 30, 2018 | |
| ($000) | |
| Investment Income | |
| Income | |
| Income Distributions Received from Affiliated Funds | 59,145 |
| Other Income | 5 |
| Net Investment Income—Note B | 59,150 |
| Realized Net Gain (Loss) | |
| Capital Gain Distributions Received from Affiliated Funds | 37 |
| Affiliated Funds Sold | 403 |
| Futures Contracts | 17 |
| Realized Net Gain (Loss) | 457 |
| Change in Unrealized Appreciation (Depreciation) from Affiliated Funds | 177,389 |
| Net Increase (Decrease) in Net Assets Resulting from Operations | 236,996 |
See accompanying Notes, which are an integral part of the Financial Statements.
59
| Target Retirement 2060 Fund | ||
| Statement of Changes in Net Assets | ||
| Year Ended September 30, | ||
| 2018 | 2017 | |
| ($000) | ($000) | |
| Increase (Decrease) in Net Assets | ||
| Operations | ||
| Net Investment Income | 59,150 | 35,708 |
| Realized Net Gain (Loss) | 457 | 176 |
| Change in Unrealized Appreciation (Depreciation) | 177,389 | 216,221 |
| Net Increase (Decrease) in Net Assets Resulting from Operations | 236,996 | 252,105 |
| Distributions | ||
| Net Investment Income | (41,761) | (24,622) |
| Realized Capital Gain1 | — | (77) |
| Total Distributions | (41,761) | (24,699) |
| Capital Share Transactions | ||
| Issued | 1,437,252 | 1,001,387 |
| Issued in Lieu of Cash Distributions | 40,758 | 24,164 |
| Redeemed | (514,124) | (315,380) |
| Net Increase (Decrease) from Capital Share Transactions | 963,886 | 710,171 |
| Total Increase (Decrease) | 1,159,121 | 937,577 |
| Net Assets | ||
| Beginning of Period | 2,080,518 | 1,142,941 |
| End of Period2 | 3,239,639 | 2,080,518 |
1 Includes fiscal 2018 and 2017 short-term gain distributions totaling $0 and $77,000, respectively. Short-term gain distributions are
treated as ordinary income dividends for tax purposes.
2 Net Assets—End of Period includes undistributed (overdistributed) net investment income of $43,246,000 and $25,857,000.
See accompanying Notes, which are an integral part of the Financial Statements.
60
| Target Retirement 2060 Fund | |||||
| Financial Highlights | |||||
| For a Share Outstanding | Year Ended September 30, | ||||
| Throughout Each Period | 2018 | 2017 | 2016 | 2015 | 2014 |
| Net Asset Value, Beginning of Period | $33.51 | $29.25 | $26.58 | $28.03 | $25.21 |
| Investment Operations | |||||
| Net Investment Income | .7681 | .7081 | . 555 | .540 | .6151 |
| Capital Gain Distributions Received | — | .0021 | .003 | .004 | .0011 |
| Net Realized and Unrealized Gain (Loss) | |||||
| on Investments | 2.495 | 4.126 | 2.635 | (1.523) | 2.572 |
| Total from Investment Operations | 3.263 | 4.836 | 3.193 | (. 979) | 3.188 |
| Distributions | |||||
| Dividends from Net Investment Income | (.613) | (.574) | (. 503) | (. 464) | (. 367) |
| Distributions from Realized Capital Gains | — | (. 002) | (.020) | (. 007) | (.001) |
| Total Distributions | (.613) | (. 576) | (. 523) | (.471) | (. 368) |
| Net Asset Value, End of Period | $36.16 | $33.51 | $29.25 | $26.58 | $28.03 |
| Total Return2 | 9.81% | 16.84% | 12.13% | -3.61% | 12.72% |
| Ratios/Supplemental Data | |||||
| Net Assets, End of Period (Millions) | $3,240 | $2,081 | $1,143 | $733 | $485 |
| Ratio of Total Expenses to Average Net Assets | — | — | — | — | — |
| Acquired Fund Fees and Expenses | 0.15% | 0.15% | 0.16% | 0.16% | 0.18% |
| Ratio of Net Investment Income to | |||||
| Average Net Assets | 2.19% | 2.28% | 2.28% | 2.19% | 2.25% |
| Portfolio Turnover Rate | 3% | 4% | 6% | 21% | 11% |
1 Calculated based on average shares outstanding.
2 Total returns do not include account service fees that may have applied in the periods shown. Fund prospectuses provide information
about any applicable account service fees.
See accompanying Notes, which are an integral part of the Financial Statements.
61
Target Retirement 2060 Fund
Notes to Financial Statements
Vanguard Target Retirement 2060 Fund is registered under the Investment Company Act of 1940 as an open-end investment company, or mutual fund. The fund follows a balanced investment strategy by investing in selected Vanguard funds to achieve its targeted allocation of assets to U.S. and international stocks, and U.S. and international bonds. Financial statements and other information about each underlying fund are available on vanguard.com.
A. The following significant accounting policies conform to generally accepted accounting principles for U.S. investment companies. The fund consistently follows such policies in preparing its financial statements.
1. Security Valuation: Investments are valued at the net asset value of each underlying Vanguard fund determined as of the close of the New York Stock Exchange (generally 4 p.m., Eastern time) on the valuation date.
2. Futures Contracts: The fund uses stock and bond futures contracts to a limited extent, with the objectives of maintaining full exposure to the market and maintaining its target asset allocation. The primary risks associated with the use of futures contracts are imperfect correlation between changes in market values of investments held by the fund and the prices of futures contracts, and the possibility of an illiquid market. Counterparty risk involving futures is mitigated because a regulated clearinghouse is the counterparty instead of the clearing broker. To further mitigate counterparty risk, the fund trades futures contracts on an exchange, monitors the financial strength of its clearing brokers and clearinghouse, and has entered into clearing agreements with its clearing brokers. The clearinghouse imposes initial margin requirements to secure the fund’s performance and requires daily settlement of variation margin representing changes in the market value of each contract. Any assets pledged as initial margin for open contracts are noted in the Statement of Net Assets.
Futures contracts are valued at their quoted daily settlement prices. The notional amounts of the contracts are not recorded in the Statement of Net Assets. Fluctuations in the value of the contracts are recorded in the Statement of Assets and Liabilities and in the Statement of Operations as unrealized appreciation (depreciation) until the contracts are closed, when they are recorded as realized futures gains (losses).
During the year ended September 30, 2018, the fund’s average investments in long and short futures contracts represented less than 1% and 0% of net assets, respectively, based on the average of the notional amounts at each quarter-end during the period. The fund had no open futures contracts at September 30, 2018.
3. Federal Income Taxes: The fund intends to continue to qualify as a regulated investment company and distribute all of its taxable income. Management has analyzed the fund’s tax positions taken for all open federal income tax years (September 30, 2015–2018), and has concluded that no provision for federal income tax is required in the fund’s financial statements.
4. Distributions: Distributions to shareholders are recorded on the ex-dividend date. Distributions are determined on a tax basis and may differ from net investment income and realized capital gains for financial reporting purposes.
62
Target Retirement 2060 Fund
5. Credit Facility: The fund and certain other funds managed by The Vanguard Group (“Vanguard”) participate in a $3.1 billion committed credit facility provided by a syndicate of lenders pursuant to a credit agreement that may be renewed annually; each fund is individually liable for its borrowings, if any, under the credit facility. Borrowings may be utilized for temporary and emergency purposes, and are subject to the fund’s regulatory and contractual borrowing restrictions. The participating funds are charged administrative fees and an annual commitment fee of 0.10% of the undrawn amount of the facility; these fees are allocated to the funds based on a method approved by the fund’s board of trustees and borne by the funds in which the fund invests (see Note B). Any borrowings under this facility bear interest at a rate based upon the higher of the one-month London Interbank Offered Rate, federal funds effective rate, or overnight bank funding rate plus an agreed-upon spread.
The fund had no borrowings outstanding at September 30, 2018, or at any time during the period then ended.
6. Other: Income and capital gain distributions received are recorded on the ex-dividend date. Security transactions are accounted for on the date securities are bought or sold. Costs used to determine realized gains (losses) on the sale of investment securities are those of the specific securities sold.
B. In accordance with the terms of a Funds’ Service Agreement (the “FSA”) between Vanguard and the fund, Vanguard furnishes to the fund investment advisory, corporate management, administrative, marketing, and distribution services at Vanguard’s cost of operations (as defined by the FSA). These costs of operations are allocated to the fund based on methods and guidelines approved by the board of trustees. The FSA provides that expenses otherwise allocable to Vanguard funds-of-funds may be reduced or eliminated to the extent of savings realized by the underlying Vanguard funds by virtue of being part of a fund-of-funds. Accordingly, all expenses for services provided by Vanguard to the fund and all other expenses incurred by the fund during the period ended September 30, 2018, were borne by the underlying Vanguard funds in which the fund invests. The fund’s trustees and officers are also trustees and officers, respectively, of the underlying Vanguard funds, as well as directors and employees, respectively, of Vanguard.
C. Various inputs may be used to determine the value of the fund’s investments. These inputs are summarized in three broad levels for financial statement purposes. The inputs or methodologies used to value securities are not necessarily an indication of the risk associated with investing in those securities.
Level 1—Quoted prices in active markets for identical securities.
Level 2—Other significant observable inputs (including quoted prices for similar securities, interest rates, prepayment speeds, credit risk, etc.).
Level 3—Significant unobservable inputs (including the fund’s own assumptions used to determine the fair value of investments). Any investments valued with significant unobservable inputs are noted on the Statement of Net Assets.
At September 30, 2018, 100% of the market value of the fund’s investments was determined based on Level 1 inputs.
63
Target Retirement 2060 Fund
D. Permanent differences between book-basis and tax-basis components of net assets, if any, are reclassified among capital accounts in the financial statements to reflect their tax character. These reclassifications have no effect on net assets or net asset value per share.
Temporary differences between book-basis and tax-basis components of accumulated net earnings (losses) arise when certain items of income, gain, or loss are recognized in different periods for financial statement and tax purposes; these differences will reverse at some time in the future. The differences are primarily related to the tax deferral of losses on wash sales. As of period end, the tax-basis components of accumulated net earnings (losses) are detailed in the table as follows:
| Amount | |
| ($000) | |
| Undistributed Ordinary Income | 43,543 |
| Undistributed Long-Term Gains | 22 |
| Capital Loss Carryforwards (Non-expiring) | — |
| Net Unrealized Gains (Losses) | 474,166 |
As of September 30, 2018, gross unrealized appreciation and depreciation for investments and derivatives based on cost for U.S. federal income tax purposes were as follows:
| Amount | ||
| ($000) | ||
| Tax Cost | 2,763,391 | |
| Gross Unrealized Appreciation | 496,832 | |
| Gross Unrealized Depreciation | (22,666) | |
| Net Unrealized Appreciation (Depreciation) | 474,166 | |
| E. Capital shares issued and redeemed were: | ||
| Year Ended September 30, | ||
| 2018 | 2017 | |
| Shares | Shares | |
| (000) | (000) | |
| Issued | 40,975 | 32,339 |
| Issued in Lieu of Cash Distributions | 1,174 | 833 |
| Redeemed | (14,643) | (10,161) |
| Net Increase (Decrease) in Shares Outstanding | 27,506 | 23,011 |
64
Target Retirement 2060 Fund
| F. Transactions during the period in affiliated underlying Vanguard funds were as follows: | ||||||||
| Current Period Transactions | ||||||||
| Sept. 30, | Proceeds | Realized | Sept. 30, | |||||
| 2017 | from | Net | Change in | Capital Gain | 2018 | |||
| Market | Purchases | Securities | Gain | Unrealized | Distributions | Market | ||
| Value | at Cost | Sold | (Loss) | App. (Dep.) | Income | Received | Value | |
| ($000) | ($000) | ($000) | ($000) | ($000) | ($000) | ($000) | ($000) | |
| Vanguard Market | ||||||||
| Liquidity Fund | 1,174 | NA1 | NA1 | (1) | — | 26 | — | 578 |
| Vanguard Total | ||||||||
| Bond Market II | ||||||||
| Index Fund | 146,423 | 125,208 | 33,821 | 112 | (7,575) | 5,052 | 37 | 230,347 |
| Vanguard Total | ||||||||
| International Bond | ||||||||
| Index Fund | 60,960 | 35,037 | 1,369 | — | (111) | 1,634 | — | 94,517 |
| Vanguard Total | ||||||||
| International Stock | ||||||||
| Index Fund | 747,045 | 445,053 | 7,872 | 2 | (22,390) | 26,828 | — | 1,161,838 |
| Vanguard Total | ||||||||
| Stock Market | ||||||||
| Index Fund | 1,125,657 | 462,541 | 45,676 | 290 | 207,465 | 25,605 | — | 1,750,277 |
| Total | 2,081,259 | 1,067,839 | 88,738 | 403 | 177,389 | 59,145 | 37 | 3,237,557 |
| 1 Not applicable—purchases and sales are for temporary cash investment purposes. | ||||||||
G. Management has determined that no events or transactions occurred subsequent to September 30, 2018, that would require recognition or disclosure in these financial statements.
65
Target Retirement 2065 Fund
Fund Profile
As of September 30, 2018
| Total Fund Characteristics | |
| Ticker Symbol | VLXVX |
| 30-Day SEC Yield | 2.52% |
| Acquired Fund Fees and Expenses1 | 0.15% |
| Allocation to Underlying Vanguard Funds | |
| Vanguard Total Stock Market Index Fund | |
| Investor Shares | 54.2% |
| Vanguard Total International Stock Index | |
| Fund Investor Shares | 35.8 |
| Vanguard Total Bond Market II Index Fund | |
| Investor Shares | 7.0 |
| Vanguard Total International Bond Index | |
| Fund Investor Shares | 3.0 |
Fund Asset Allocation
1 This figure—drawn from the prospectus dated January 25, 2018—represents an estimate of the weighted average of the expense ratios and any transaction fees charged by the underlying mutual funds (the ”acquired” funds) in which the Target Retirement 2065 Fund invests. The fund does not charge any expenses or fees of its own. For the fiscal year ended September 30, 2018, the acquired fund fees and expenses were 0.15%.
66
Target Retirement 2065 Fund
Performance Summary
All of the returns in this report represent past performance, which is not a guarantee of future results that may be achieved by the fund. (Current performance may be lower or higher than the performance data cited. For performance data current to the most recent month-end, visit our website at vanguard.com/performance.) Note, too, that both investment returns and principal value can fluctuate widely, so an investor’s shares, when sold, could be worth more or less than their original cost. The returns shown do not reflect taxes that a shareholder would pay on fund distributions or on the sale of fund shares.
Cumulative Performance: July 12, 2017, Through September 30, 2018
Initial Investment of $10,000
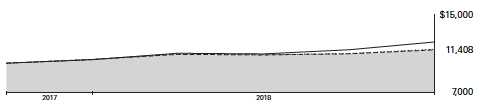
| Average Annual Total Returns | |||
| Periods Ended September 30, 2018 | |||
| Since | Final Value | ||
| One | Inception | of a $10,000 | |
| Year | (7/12/2017) | Investment | |
| Target Retirement 2065 Fund* | 9.75% | 11.41% | $11,408 |
| Target 2065 Composite Index | 10.15 | 11.65 | 11,439 |
| Spliced Mixed-Asset Target 2055+ | |||
| Funds Average | 9.53 | 11.14 | 11,375 |
| MSCI US Broad Market Index | 17.62 | 17.66 | 12,193 |
For a benchmark description, see the Glossary.
"Since Inception" performance is calculated from the inception date for both the fund and its comparative standards.
See Financial Highlights for dividend and capital gains information.
67
Target Retirement 2065 Fund
Fiscal-Year Total Returns (%): July 12, 2017, Through September 30, 2018
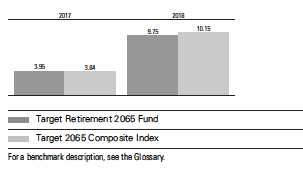 68
68
Target Retirement 2065 Fund
Financial Statements
Statement of Net Assets
As of September 30, 2018
The fund reports a complete list of its holdings in regulatory filings four times in each fiscal year, at the quarter-ends. For the second and fourth fiscal quarters, the lists appear in the fund’s semiannual and annual reports to shareholders. For the first and third fiscal quarters, the fund files the lists with the Securities and Exchange Commission on Form N-Q. Shareholders can look up the fund’s Forms N-Q on the SEC’s website at sec.gov. Forms N-Q may also be reviewed and copied at the SEC’s Public Reference Room (see the back cover of this report for further information).
| Market | ||
| Value• | ||
| Shares | ($000) | |
| Investment Companies (99.9%) | ||
| U.S. Stock Fund (54.1%) | ||
| Vanguard Total Stock Market Index Fund Investor Shares | 1,496,993 | 109,011 |
| International Stock Fund (35.8%) | ||
| Vanguard Total International Stock Index Fund Investor Shares | 4,148,372 | 72,016 |
| U.S. Bond Fund (7.0%) | ||
| 1 Vanguard Total Bond Market II Index Fund Investor Shares | 1,365,419 | 14,105 |
| International Bond Fund (3.0%) | ||
| Vanguard Total International Bond Index Fund Investor Shares | 553,866 | 6,026 |
| Total Investment Companies (Cost $196,062) | 201,158 | |
| Temporary Cash Investment (0.1%) | ||
| Money Market Fund (0.1%) | ||
| 1 Vanguard Market Liquidity Fund, 2.209% (Cost $276) | 2,763 | 276 |
| Total Investments (100.0%) (Cost $196,338) | 201,434 | |
| Other Assets and Liabilities (0.0%) | ||
| Other Assets | 863 | |
| Liabilities | (786) | |
| 77 | ||
| Net Assets (100%) | ||
| Applicable to 8,900,925 outstanding $.001 par value shares of | ||
| beneficial interest (unlimited authorization) | 201,511 | |
| Net Asset Value Per Share | $22.64 | |
69
| Target Retirement 2065 Fund | |
| Amount | |
| ($000) | |
| Statement of Assets and Liabilities | |
| Assets | |
| Investments in Securities, at Value—Affiliated Funds | 201,434 |
| Receivables for Accrued Income | 38 |
| Receivables for Capital Shares Issued | 824 |
| Other Assets | 1 |
| Total Assets | 202,297 |
| Liabilities | |
| Payables for Investment Securities Purchased | 335 |
| Payables for Capital Shares Redeemed | 451 |
| Total Liabilities | 786 |
| Net Assets | 201,511 |
| At September 30, 2018, net assets consisted of: | |
| Amount | |
| ($000) | |
| Paid-in Capital | 194,191 |
| Undistributed Net Investment Income | 2,220 |
| Accumulated Net Realized Gains | 4 |
| Unrealized Appreciation (Depreciation) | 5,096 |
| Net Assets | 201,511 |
• See Note A in Notes to Financial Statements.
1 Affiliated fund available only to Vanguard funds and certain trusts and accounts managed by Vanguard. Rate shown for Vanguard
Market Liquidity Fund is the 7-day yield.
See accompanying Notes, which are an integral part of the Financial Statements.
70
| Target Retirement 2065 Fund | |
| Statement of Operations | |
| �� | Year Ended |
| September 30, 2018 | |
| ($000) | |
| Investment Income | |
| Income | |
| Income Distributions Received from Affiliated Funds | 2,512 |
| Other Income | 1 |
| Net Investment Income—Note B | 2,513 |
| Realized Net Gain (Loss) | |
| Capital Gain Distributions Received from Affiliated Funds | 1 |
| Affiliated Funds Sold | 7 |
| Futures Contracts | 6 |
| Realized Net Gain (Loss) | 14 |
| Change in Unrealized Appreciation (Depreciation) from Affiliated Funds | 4,758 |
| Net Increase (Decrease) in Net Assets Resulting from Operations | 7,285 |
See accompanying Notes, which are an integral part of the Financial Statements.
71
| Target Retirement 2065 Fund | ||
| Statement of Changes in Net Assets | ||
| July 12, | ||
| Year Ended | 20171 to | |
| September 30, | September 30, | |
| 2018 | 2017 | |
| ($000) | ($000) | |
| Increase (Decrease) in Net Assets | ||
| Operations | ||
| Net Investment Income | 2,513 | 73 |
| Realized Net Gain (Loss) | 14 | (10) |
| Change in Unrealized Appreciation (Depreciation) | 4,758 | 338 |
| Net Increase (Decrease) in Net Assets Resulting from Operations | 7,285 | 401 |
| Distributions | ||
| Net Investment Income | (366) | — |
| Realized Capital Gain | — | — |
| Total Distributions | (366) | — |
| Capital Share Transactions | ||
| Issued | 214,128 | 19,735 |
| Issued in Lieu of Cash Distributions | 346 | — |
| Redeemed | (38,875) | (1,143) |
| Net Increase (Decrease) from Capital Share Transactions | 175,599 | 18,592 |
| Total Increase (Decrease) | 182,518 | 18,993 |
| Net Assets | ||
| Beginning of Period | 18,993 | — |
| End of Period2 | 201,511 | 18,993 |
1 Inception.
2 Net Assets—End of Period includes undistributed (overdistributed) net investment income of $2,220,000 and $73,000.
See accompanying Notes, which are an integral part of the Financial Statements.
72
| Target Retirement 2065 Fund | ||
| Financial Highlights | ||
| Year | July 12, | |
| Ended | 20171 to | |
| Sept. 30, | Sept. 30, | |
| For a Share Outstanding Throughout Each Period | 2018 | 2017 |
| Net Asset Value, Beginning of Period | $20.79 | $20.00 |
| Investment Operations | ||
| Net Investment Income2 | .524 | .150 |
| Capital Gain Distributions Received 2 | — | — |
| Net Realized and Unrealized Gain (Loss) on Investments | 1.496 | .640 |
| Total from Investment Operations | 2.020 | .790 |
| Distributions | ||
| Dividends from Net Investment Income | (.170) | — |
| Distributions from Realized Capital Gains | — | — |
| Total Distributions | (.170) | — |
| Net Asset Value, End of Period | $22.64 | $20.79 |
| Total Return 3 | 9.75% | 3.95% |
| Ratios/Supplemental Data | ||
| Net Assets, End of Period (Millions) | $202 | $19 |
| Ratio of Total Expenses to Average Net Assets | — | — |
| Acquired Fund Fees and Expenses | 0.15% | 0.15%4 |
| Ratio of Net Investment Income to Average Net Assets | 2.37% | 3.30%4 |
| Portfolio Turnover Rate | 1% | 29% |
1 Inception.
2 Calculated based on average shares outstanding.
3 Total returns do not include account service fees that may have applied in the periods shown. Fund prospectuses provide information
about any applicable account service fees.
4 Annualized.
See accompanying Notes, which are an integral part of the Financial Statements.
73
Target Retirement 2065 Fund
Notes to Financial Statements
Vanguard Target Retirement 2065 Fund is registered under the Investment Company Act of 1940 as an open-end investment company, or mutual fund. The fund follows a balanced investment strategy by investing in selected Vanguard funds to achieve its targeted allocation of assets to U.S. and international stocks, and U.S. and international bonds. Financial statements and other information about each underlying fund are available on vanguard.com.
A. The following significant accounting policies conform to generally accepted accounting principles for U.S. investment companies. The fund consistently follows such policies in preparing its financial statements.
1. Security Valuation: Investments are valued at the net asset value of each underlying Vanguard fund determined as of the close of the New York Stock Exchange (generally 4 p.m., Eastern time) on the valuation date.
2. Futures Contracts: The fund uses stock and bond futures contracts to a limited extent, with the objectives of maintaining full exposure to the market and maintaining its target asset allocation. The primary risks associated with the use of futures contracts are imperfect correlation between changes in market values of investments held by the fund and the prices of futures contracts, and the possibility of an illiquid market. Counterparty risk involving futures is mitigated because a regulated clearinghouse is the counterparty instead of the clearing broker. To further mitigate counterparty risk, the fund trades futures contracts on an exchange, monitors the financial strength of its clearing brokers and clearinghouse, and has entered into clearing agreements with its clearing brokers. The clearinghouse imposes initial margin requirements to secure the fund’s performance and requires daily settlement of variation margin representing changes in the market value of each contract. Any assets pledged as initial margin for open contracts are noted in the Statement of Net Assets.
Futures contracts are valued at their quoted daily settlement prices. The notional amounts of the contracts are not recorded in the Statement of Net Assets. Fluctuations in the value of the contracts are recorded in the Statement of Assets and Liabilities as an asset (liability) and in the Statement of Operations as unrealized appreciation (depreciation) until the contracts are closed, when they are recorded as realized futures gains (losses).
During the year ended September 30, 2018, the fund’s average investments in long and short futures contracts represented less than 1% and 0% of net assets, respectively, based on the average of the notional amounts at each quarter-end during the period. The fund had no open futures contracts at September 30, 2018.
3. Federal Income Taxes: The fund intends to continue to qualify as a regulated investment company and distribute all of its taxable income. Management has analyzed the fund’s tax positions taken for all open federal income tax years (September 30, 2017–2018), and has concluded that no provision for federal income tax is required in the fund’s financial statements.
4. Distributions: Distributions to shareholders are recorded on the ex-dividend date. Distributions are determined on a tax basis and may differ from net investment income and realized capital gains for financial reporting purposes.
74
Target Retirement 2065 Fund
5. Credit Facility: The fund and certain other funds managed by The Vanguard Group (“Vanguard”) participate in a $3.1 billion committed credit facility provided by a syndicate of lenders pursuant to a credit agreement that may be renewed annually; each fund is individually liable for its borrowings, if any, under the credit facility. Borrowings may be utilized for temporary and emergency purposes, and are subject to the fund’s regulatory and contractual borrowing restrictions. The participating funds are charged administrative fees and an annual commitment fee of 0.10% of the undrawn amount of the facility; these fees are allocated to the funds based on a method approved by the fund’s board of trustees and borne by the funds in which the fund invests (see Note B). Any borrowings under this facility bear interest at a rate based upon the higher of the one-month London Interbank Offered Rate, federal funds effective rate, or overnight bank funding rate plus an agreed-upon spread.
The fund had no borrowings outstanding at September 30, 2018, or at any time during the period then ended.
6. Other: Income and capital gain distributions received are recorded on the ex-dividend date. Security transactions are accounted for on the date securities are bought or sold. Costs used to determine realized gains (losses) on the sale of investment securities are those of the specific securities sold.
B. In accordance with the terms of a Funds’ Service Agreement (the “FSA”) between Vanguard and the fund, Vanguard furnishes to the fund investment advisory, corporate management, administrative, marketing, and distribution services at Vanguard’s cost of operations (as defined by the FSA). These costs of operations are allocated to the fund based on methods and guidelines approved by the board of trustees. The FSA provides that expenses otherwise allocable to Vanguard funds-of-funds may be reduced or eliminated to the extent of savings realized by the underlying Vanguard funds by virtue of being part of a fund-of-funds. Accordingly, all expenses for services provided by Vanguard to the fund and all other expenses incurred by the fund during the period ended September 30, 2018, were borne by the underlying Vanguard funds in which the fund invests. The fund’s trustees and officers are also trustees and officers, respectively, of the underlying Vanguard funds, as well as directors and employees, respectively, of Vanguard.
C. Various inputs may be used to determine the value of the fund’s investments. These inputs are summarized in three broad levels for financial statement purposes. The inputs or methodologies used to value securities are not necessarily an indication of the risk associated with investing in those securities.
Level 1—Quoted prices in active markets for identical securities.
Level 2—Other significant observable inputs (including quoted prices for similar securities, interest rates, prepayment speeds, credit risk, etc.).
Level 3—Significant unobservable inputs (including the fund’s own assumptions used to determine the fair value of investments). Any investments valued with significant unobservable inputs are noted on the Statement of Net Assets.
At September 30, 2018, 100% of the market value of the fund’s investments was determined based on Level 1 inputs.
75
Target Retirement 2065 Fund
D. Permanent differences between book-basis and tax-basis components of net assets, if any, are reclassified among capital accounts in the financial statements to reflect their tax character. These reclassifications have no effect on net assets or net asset value per share.
Temporary differences between book-basis and tax-basis components of accumulated net earnings (losses) arise when certain items of income, gain, or loss are recognized in different periods for financial statement and tax purposes; these differences will reverse at some time in the future. The differences are primarily related to the tax deferral of losses on wash sales. As of period end, the tax-basis components of accumulated net earnings (losses) are detailed in the table as follows:
| Amount | |
| ($000) | |
| Undistributed Ordinary Income | 2,220 |
| Undistributed Long-Term Gains | 4 |
| Capital Loss Carryforwards (Non-expiring) | — |
| Net Unrealized Gains (Losses) | 5,096 |
As of September 30, 2018, gross unrealized appreciation and depreciation for investments and derivatives based on cost for U.S. federal income tax purposes were as follows:
| Amount | ||
| ($000) | ||
| Tax Cost | 196,338 | |
| Gross Unrealized Appreciation | 8,068 | |
| Gross Unrealized Depreciation | (2,972) | |
| Net Unrealized Appreciation (Depreciation) | 5,096 | |
| E. Capital shares issued and redeemed were: | ||
| Year Ended | July 12, 20171 to | |
| September 30, 2018 | September 30, 2017 | |
| Shares | Shares | |
| (000) | (000) | |
| Issued | 9,733 | 969 |
| Issued in Lieu of Cash Distributions | 16 | — |
| Redeemed | (1,762) | (56) |
| Net Increase (Decrease) in Shares Outstanding | 7,987 | 913 |
| 1 Inception. | ||
76
Target Retirement 2065 Fund
| F. Transactions during the period in affiliated underlying Vanguard funds were as follows: | ||||||||
| Current Period Transactions | ||||||||
| Sept. 30, | Proceeds | Realized | Sept. 30, | |||||
| 2017 | from | Net | Change in | Capital Gain | 2018 | |||
| Market | Purchases | Securities | Gain | Unrealized | Distributions | Market | ||
| Value | at Cost | Sold | (Loss) | App. (Dep.) | Income | Received | Value | |
| ($000) | ($000) | ($000) | ($000) | ($000) | ($000) | ($000) | ($000) | |
| Vanguard Market | ||||||||
| Liquidity Fund | 101 | NA1 | NA1 | — | — | 4 | — | 276 |
| Vanguard Total | ||||||||
| Bond Market II | ||||||||
| Index Fund | 1,315 | 13,250 | 210 | (1) | (249) | 198 | 1 | 14,105 |
| Vanguard Total | ||||||||
| International Bond | ||||||||
| Index Fund | 564 | 5,556 | 86 | (1) | (7) | 51 | — | 6,026 |
| Vanguard Total | ||||||||
| International Stock | ||||||||
| Index Fund | ||||||||
| Investor Shares | 6,797 | 67,985 | 145 | 2 | (2,623) | 1,144 | — | 72,016 |
| Vanguard Total | ||||||||
| International Stock | ||||||||
| Index Fund ETF Shares2 — | 122 | 122 | — | — | — | — | — | |
| Vanguard Total | ||||||||
| Stock Market | ||||||||
| Index Fund | ||||||||
| Investor Shares | 10,166 | 91,660 | 459 | 7 | 7,637 | 1,115 | — | 109,011 |
| Vanguard Total | ||||||||
| Stock Market Index | ||||||||
| Fund ETF Shares2 | — | 526 | 526 | — | — | — | — | — |
| Total | 18,943 | 179,099 | 1,548 | 7 | 4,758 | 2,512 | 1 | 201,434 |
| 1 Not applicable—purchases and sales are for temporary cash investment purposes. | ||||||||
| 2 The fund invested in ETF shares during the period, but sold their positions before the period end. | ||||||||
G. Management has determined that no events or transactions occurred subsequent to September 30, 2018, that would require recognition or disclosure in these financial statements.
77
Report of Independent Registered Public Accounting Firm
To the Board of Trustees of Vanguard Chester Funds and Shareholders of Vanguard Target Retirement 2040 Fund, Vanguard Target Retirement 2045 Fund, Vanguard Target Retirement 2050 Fund, Vanguard Target Retirement 2055 Fund, Vanguard Target Retirement 2060 Fund and Vanguard Target Retirement 2065 Fund
Opinions on the Financial Statements
We have audited the accompanying statements of net assets and statements of assets and liabilities of each of the funds indicated in the table below (six of the funds constituting Vanguard Chester Funds, hereafter collectively referred to as the “Funds”) as of September 30, 2018, the related statements of operations and of changes in net assets for each of the periods indicated in the table below, including the related notes, and the financial highlights for each of the periods indicated therein (collectively referred to as the “financial statements”). In our opinion, the financial statements present fairly, in all material respects, the financial position of each of the Funds as of September 30, 2018, the results of each of their operations and the changes in each of their net assets for each of the periods indicated in the table below, and each of the financial highlights for each of the periods indicated therein in conformity with accounting principles generally accepted in the United States of America.
| Vanguard Target Retirement 2040 Fund | Statements of operations for the year ended September 30, |
| Vanguard Target Retirement 2045 Fund | 2018 and statements of changes in net assets for each of the |
| Vanguard Target Retirement 2050 Fund | two years in the period ended September 30, 2018 |
| Vanguard Target Retirement 2055 Fund | |
| Vanguard Target Retirement 2060 Fund | |
| Vanguard Target Retirement 2065 Fund | Statements of operations for the year ended September 30, |
| 2018 and statements of changes in net assets for the year | |
| ended September 30, 2018 and for the period July 12, 2017 | |
| (inception) through September 30, 2017 |
Basis for Opinions
These financial statements are the responsibility of the Funds’ management. Our responsibility is to express an opinion on the Funds’ financial statements based on our audits. We are a public accounting firm registered with the Public Company Accounting Oversight Board (United States) (“PCAOB”) and are required to be independent with respect to the Funds in accordance with the U.S. federal securities laws and the applicable rules and regulations of the Securities and Exchange Commission and the PCAOB.
We conducted our audits of these financial statements in accordance with the standards of the PCAOB. Those standards require that we plan and perform the audit to obtain reasonable assurance about whether the financial statements are free of material misstatement, whether due to error or fraud.
Our audits included performing procedures to assess the risks of material misstatement of the financial statements, whether due to error or fraud, and performing procedures that respond to those risks. Such procedures included examining, on a test basis, evidence regarding the amounts and disclosures in the financial statements. Our audits also included evaluating the accounting
78
principles used and significant estimates made by management, as well as evaluating the overall presentation of the financial statements. Our procedures included confirmation of securities owned as of September 30, 2018 by agreement to the underlying ownership records of the transfer agent. We believe that our audits provide a reasonable basis for our opinions.
/s/ PricewaterhouseCoopers LLP
Philadelphia, Pennsylvania
November 13, 2018
We have served as the auditor of one or more investment companies in The Vanguard Group of Funds since 1975.
Special 2018 tax information (unaudited) for Vanguard Target Retirement Funds
This information for the fiscal year ended September 30, 2018, is included pursuant to provisions of the Internal Revenue Code.
The funds distributed capital gain dividends (from net long-term capital gains) to shareholders during the fiscal year as follows:
| Fund | ($000) |
| Target Retirement 2040 Fund | 479 |
| Target Retirement 2045 Fund | — |
| Target Retirement 2050 Fund | 205 |
| Target Retirement 2055 Fund | — |
| Target Retirement 2060 Fund | — |
| Target Retirement 2065 Fund | — |
79
For nonresident alien shareholders, 100% of short-term capital gain dividends distributed by the funds are qualified short-term capital gains.
The funds distributed qualified dividend income to shareholders during the fiscal year as follows:
| Fund | ($000) |
| Target Retirement 2040 Fund | 308,243 |
| Target Retirement 2045 Fund | 293,686 |
| Target Retirement 2050 Fund | 193,555 |
| Target Retirement 2055 Fund | 81,201 |
| Target Retirement 2060 Fund | 29,728 |
| Target Retirement 2065 Fund | 260 |
For corporate shareholders, the percentage of investment income (dividend income plus short-term gains, if any) that qualifies for the dividends-received deduction is as follows:
| Fund | Percentage |
| Target Retirement 2040 Fund | 33.3% |
| Target Retirement 2045 Fund | 35.9 |
| Target Retirement 2050 Fund | 36.5 |
| Target Retirement 2055 Fund | 38.1 |
| Target Retirement 2060 Fund | 37.6 |
| Target Retirement 2065 Fund | 37.4 |
The funds designate to shareholders foreign source income and foreign taxes paid as follows:
| Foreign Source Income | Foreign Taxes Paid | |
| Fund | ($000) | ($000) |
| Target Retirement 2040 Fund | 254,228 | 15,046 |
| Target Retirement 2045 Fund | 239,770 | 14,542 |
| Target Retirement 2050 Fund | 161,983 | 9,834 |
| Target Retirement 2055 Fund | 73,728 | 4,486 |
| Target Retirement 2060 Fund | 28,777 | 1,752 |
| Target Retirement 2065 Fund | 1,207 | 75 |
Shareholders will receive more detailed information with their Form 1099-DIV in January 2019 to determine the calendar-year amounts to be included on their 2018 tax returns.
80
Your Fund’s After-Tax Returns
This table presents returns for your fund both before and after taxes. The after-tax returns are shown in two ways: (1) assuming that an investor owned the fund during the entire period and paid taxes on the fund’s distributions, and (2) assuming that an investor paid taxes on the fund’s distributions and sold all shares at the end of each period.
Calculations are based on the highest individual federal income tax and capital gains tax rates in effect at the times of the distributions and the hypothetical sales. State and local taxes were not considered. After-tax returns reflect any qualified dividend income, using actual prior-year figures and estimates for 2018. (In the example, returns after the sale of fund shares may be higher than those assuming no sale. This occurs when the sale would have produced a capital loss. The calculation assumes that the investor received a tax deduction for the loss.) Please note that your actual after-tax returns will depend on your tax situation and may differ from those shown. Also note that if you own the fund in a tax-deferred account, such as an individual retirement account or a 401(k) plan, this information does not apply to you. Such accounts are not subject to current taxes.
Finally, keep in mind that a fund’s performance—whether before or after taxes—does not guarantee future results.
| Average Annual Total Returns: Target Retirement Funds | |||
| Periods Ended September 30, 2018 | |||
| One | Five | Ten | |
| Year | Years | Years | |
| Target Retirement 2040 Fund | |||
| Returns Before Taxes | 9.37% | 9.17% | 9.14% |
| Returns After Taxes on Distributions | 8.78 | 8.53 | 8.59 |
| Returns After Taxes on Distributions and Sale of Fund Shares | 5.78 | 7.08 | 7.34 |
| One | Five | Ten | |
| Year | Years | Years | |
| Target Retirement 2045 Fund | |||
| Returns Before Taxes | 9.85% | 9.39% | 9.24% |
| Returns After Taxes on Distributions | 9.26 | 8.72 | 8.65 |
| Returns After Taxes on Distributions and Sale of Fund Shares | 6.07 | 7.25 | 7.41 |
| One | Five | Ten | |
| Year | Years | Years | |
| Target Retirement 2050 Fund | |||
| Returns Before Taxes | 9.84% | 9.38% | 9.24% |
| Returns After Taxes on Distributions | 9.27 | 8.79 | 8.69 |
| Returns After Taxes on Distributions and Sale of Fund Shares | 6.07 | 7.26 | 7.42 |
81
| Average Annual Total Returns: Target Retirement Funds | |||
| Periods Ended September 30, 2018 | |||
| Since | |||
| One | Five | Inception | |
| Year | Years | (8/18/2010) | |
| Target Retirement 2055 Fund | |||
| Returns Before Taxes | 9.79% | 9.34% | 11.08% |
| Returns After Taxes on Distributions | 9.24 | 8.82 | 10.63 |
| Returns After Taxes on Distributions and Sale of Fund Shares | 6.03 | 7.25 | 8.96 |
| Since | |||
| One | Five | Inception | |
| Year | Years | (1/19/2012) | |
| Target Retirement 2060 Fund | |||
| Returns Before Taxes | 9.81% | 9.35% | 10.91% |
| Returns After Taxes on Distributions | 9.29 | 8.84 | 10.48 |
| Returns After Taxes on Distributions and Sale of Fund Shares | 6.04 | 7.26 | 8.71 |
| Since | |||
| One | Five | Inception | |
| Year | Years | (7/12/2017) | |
| Target Retirement 2065 Fund | |||
| Returns Before Taxes | 9.75% | — | 11.41% |
| Returns After Taxes on Distributions | 9.50 | — | 11.20 |
| Returns After Taxes on Distributions and Sale of Fund Shares | 5.86 | — | 8.67 |
82
About Your Fund’s Expenses
As a shareholder of the fund, you incur ongoing costs, which include costs for portfolio management, administrative services, and shareholder reports (like this one), among others. Operating expenses, which are deducted from a fund’s gross income, directly reduce the investment return of the fund.
A typical fund’s expenses are expressed as a percentage of its average net assets. The Target Retirement Funds have no direct expenses, but each fund bears its proportionate share of the costs for the underlying funds in which it invests. These indirect expenses make up the acquired fund fees and expenses, also expressed as a percentage of average net assets.
The following examples are intended to help you understand the ongoing cost (in dollars) of investing in your fund and to compare these costs with those of other mutual funds. The examples are based on an investment of $1,000 made at the beginning of the period shown and held for the entire period. The costs were calculated using the acquired fund fees and expenses for each Target Retirement Fund.
The accompanying table illustrates your fund’s costs in two ways:
• Based on actual fund return. This section helps you to estimate the actual expenses that you paid over the period. The ”Ending Account Value“ shown is derived from the fund‘s actual return, and the third column shows the dollar amount that would have been paid by an investor who started with $1,000 in the fund. You may use the information here, together with the amount you invested, to estimate the expenses that you paid over the period.
To do so, simply divide your account value by $1,000 (for example, an $8,600 account value divided by $1,000 = 8.6), then multiply the result by the number given for your fund under the heading ”Expenses Paid During Period.“
• Based on hypothetical 5% yearly return. This section is intended to help you compare your fund‘s costs with those of other mutual funds. It assumes that the fund had a yearly return of 5% before expenses, but that the expense ratio is unchanged. In this case—because the return used is not the fund’s actual return—the results do not apply to your investment. The example is useful in making comparisons because the Securities and Exchange Commission requires all mutual funds to calculate expenses based on a 5% return. You can assess your fund’s costs by comparing this hypothetical example with the hypothetical examples that appear in shareholder reports of other funds.
Note that the expenses shown in the table are meant to highlight and help you compare ongoing costs only and do not reflect transaction costs incurred by the fund for buying and selling securities. Further, the expenses do not include any purchase, redemption, or account service fees described in the fund prospectus. If such fees were applied to your account, your costs would be higher. Your fund does not carry a “sales load.”
The calculations assume no shares were bought or sold during the period. Your actual costs may have been higher or lower, depending on the amount of your investment and the timing of any purchases or redemptions.
You can find more information about the fund’s expenses, including annual expense ratios, in the Financial Statements section of this report. For additional information on operating expenses and other shareholder costs, please refer to your fund’s current prospectus.
83
| Six Months Ended September 30, 2018 | |||
| Beginning | Ending | Expenses | |
| Account Value | Account Value | Paid During | |
| 3/31/2018 | 9/30/2018 | Period | |
| Based on Actual Fund Return | |||
| Target Retirement 2040 Fund | $1,000.00 | $1,047.22 | $0.72 |
| Target Retirement 2045 Fund | $1,000.00 | $1,050.07 | $0.77 |
| Target Retirement 2050 Fund | $1,000.00 | $1,050.00 | $0.77 |
| Target Retirement 2055 Fund | $1,000.00 | $1,049.73 | $0.77 |
| Target Retirement 2060 Fund | $1,000.00 | $1,049.64 | $0.77 |
| Target Retirement 2065 Fund | $1,000.00 | $1,049.61 | $0.77 |
| Based on Hypothetical 5% Yearly Return | |||
| Target Retirement 2040 Fund | $1,000.00 | $1,024.37 | $0.71 |
| Target Retirement 2045 Fund | $1,000.00 | $1,024.32 | $0.76 |
| Target Retirement 2050 Fund | $1,000.00 | $1,024.32 | $0.76 |
| Target Retirement 2055 Fund | $1,000.00 | $1,024.32 | $0.76 |
| Target Retirement 2060 Fund | $1,000.00 | $1,024.32 | $0.76 |
| Target Retirement 2065 Fund | $1,000.00 | $1,024.32 | $0.76 |
The calculations are based on the acquired fund fees and expenses for the most recent six-month period. The funds’ annualized expense figures for the period are (in order as listed from top to bottom above) 0.14%, 0.15%, 0.15%, 0.15%, 0.15%, and 0.15%. The dollar amounts shown as ”Expenses Paid” are equal to the annualized average weighted expense ratio for the underlying funds multiplied by the average account value over the period, multiplied by the number of days in the most recent six-month period, then divided by the number of days in the most recent 12-month period (183/365).
84
Glossary
30-Day SEC Yield. A fund’s 30-day SEC yield is derived using a formula specified by the U.S. Securities and Exchange Commission. Under the formula, data related to the fund’s security holdings in the previous 30 days are used to calculate the fund’s hypothetical net income for that period, which is then annualized and divided by the fund’s estimated average net assets over the calculation period. For the purposes of this calculation, a security’s income is based on its current market yield to maturity (for bonds), its actual income (for asset-backed securities), or its projected dividend yield (for stocks). Because the SEC yield represents hypothetical annualized income, it will differ—at times significantly—from the fund’s actual experience. As a result, the fund’s income distributions may be higher or lower than implied by the SEC yield.
Acquired Fund Fees and Expenses. Funds that invest in other Vanguard funds incur no direct expenses, but they do bear proportionate shares of the operating, administrative, and advisory expenses of the underlying funds, and they must pay any fees charged by those funds. The figure for acquired fund fees and expenses represents a weighted average of these underlying costs. Acquired is a term that the Securities and Exchange Commission applies to any mutual fund whose shares are owned by another fund.
Beta. A measure of the magnitude of a fund’s past share-price fluctuations in relation to the ups and downs of a given market index. The index is assigned a beta of 1.00. Compared with a given index, a fund with a beta of 1.20 typically would have seen its share price rise or fall by 12% when the index rose or fell by 10%. For this report, beta is based on returns over the past 36 months for both the fund and the index. Note that a fund’s beta should be reviewed in conjunction with its R-squared (see definition). The lower the R-squared, the less correlation there is between the fund and the index, and the less reliable beta is as an indicator of volatility.
Expense Ratio. A fund’s total annual operating expenses expressed as a percentage of the fund’s average net assets. The expense ratio includes management and administrative expenses, but does not include the transaction costs of buying and selling portfolio securities.
Inception Date. The date on which the assets of a fund (or one of its share classes) are first invested in accordance with the fund’s investment objective. For funds with a subscription period, the inception date is the day after that period ends. Investment performance is measured from the inception date.
R-Squared. A measure of how much of a fund’s past returns can be explained by the returns from the market in general, as measured by a given index. If a fund’s total returns were precisely synchronized with an index’s returns, its R-squared would be 1.00. If the fund’s returns bore no relationship to the index’s returns, its R-squared would be 0. For this report, R-squared is based on returns over the past 36 months for both the fund and the index.
Benchmark Information
Spliced Mixed-Asset Target 2055+ Funds Average: Mixed-Asset Target 2050 Funds Average through August 31, 2013; Mixed-Asset Target 2055+ Funds Average thereafter.
85
Target 2040 Composite Index: Derived by applying the fund’s target asset allocation to the results of the following benchmarks: for international stocks of developed markets, the MSCI EAFE Index through December 15, 2010, the MSCI ACWI ex USA IMI Index through June 2, 2013, and the FTSE Global All Cap ex US Index thereafter; for emerging-market stocks, the Select Emerging Markets Index through August 23, 2006, the MSCI Emerging Markets Index through December 15, 2010, the MSCI ACWI ex USA IMI Index through June 2, 2013, and the FTSE Global All Cap ex US Index thereafter; for U.S. bonds, the Bloomberg Barclays U.S. Aggregate Bond Index through December 31, 2009, and the Bloomberg Barclays U.S. Aggregate Float Adjusted Index thereafter; for international bonds, the Bloomberg Barclays Global Aggregate ex-USD Float Adjusted RIC Capped Index beginning June 3, 2013; and for U.S. stocks, the MSCI US Broad Market Index through June 2, 2013, and the CRSP US Total Market Index thereafter. International stock benchmark returns are adjusted for withholding taxes.
Target 2045 Composite Index: Derived by applying the fund’s target asset allocation to the results of the following benchmarks: for international stocks of developed markets, the MSCI EAFE Index through December 15, 2010, the MSCI ACWI ex USA IMI Index through June 2, 2013, and the FTSE Global All Cap ex US Index thereafter; for emerging-market stocks, the Select Emerging Markets Index through August 23, 2006, the MSCI Emerging Markets Index through December 15, 2010, the MSCI ACWI ex USA IMI Index through June 2, 2013, and the FTSE Global All Cap ex US Index thereafter; for U.S. bonds, the Bloomberg Barclays U.S. Aggregate Bond Index through December 31, 2009, and the Bloomberg Barclays U.S. Aggregate Float Adjusted Index thereafter; for international bonds, the Bloomberg Barclays Global Aggregate ex-USD Float Adjusted RIC Capped Index beginning June 3, 2013; and for U.S. stocks, the Dow Jones U.S. Total Stock Market Index (formerly known as the Dow Jones Wilshire 5000 Index) through April 22, 2005, the MSCI US Broad Market Index through June 2, 2013, and the CRSP US Total Market Index thereafter. International stock benchmark returns are adjusted for withholding taxes.
Target 2050 Composite Index: Derived by applying the fund’s target asset allocation to the results of the following benchmarks: for international stocks of developed markets, the MSCI EAFE Index through December 15, 2010, the MSCI ACWI ex USA IMI Index through June 2, 2013, and the FTSE Global All Cap ex US Index thereafter; for emerging-market stocks, the Select Emerging Markets Index through August 23, 2006, the MSCI Emerging Markets Index through December 15, 2010, the MSCI ACWI ex USA IMI Index through June 2, 2013, and the FTSE Global All Cap ex US Index thereafter; for U.S. bonds, the Bloomberg Barclays U.S. Aggregate Bond Index through December 31, 2009, and the Bloomberg Barclays U.S. Aggregate Float Adjusted Index thereafter; for international bonds, the Bloomberg Barclays Global Aggregate ex-USD Float Adjusted RIC Capped Index beginning June 3, 2013; and for U.S. stocks, the MSCI US Broad Market Index through June 2, 2013, and the CRSP US Total Market Index thereafter. International stock benchmark returns are adjusted for withholding taxes.
86
Target 2055 Composite Index: Derived by applying the fund’s target asset allocation to the results of the following benchmarks: for international stocks of developed markets, the MSCI EAFE Index through December 15, 2010, the MSCI ACWI ex USA IMI Index through June 2, 2013, and the FTSE Global All Cap ex US Index thereafter; for emerging-market stocks, the MSCI Emerging Markets Index through December 15, 2010, the MSCI ACWI ex USA IMI Index through June 2, 2013, and the FTSE Global All Cap ex US Index thereafter; for U.S. bonds, the Bloomberg Barclays U.S. Aggregate Float Adjusted Index; for international bonds, the Bloomberg Barclays Global Aggregate ex-USD Float Adjusted RIC Capped Index beginning June 3, 2013; and for U.S. stocks, the MSCI US Broad Market Index through June 2, 2013, and the CRSP US Total Market Index thereafter. International stock benchmark returns are adjusted for withholding taxes.
Target 2060 Composite Index: Derived by applying the fund’s target asset allocation to the results of the following benchmarks: for international stocks of developed markets, the MSCI ACWI ex USA IMI Index through June 2, 2013, and the FTSE Global All Cap ex US Index thereafter; for emerging-market stocks, the MSCI ACWI ex USA IMI Index through June 2, 2013, and the FTSE Global All Cap ex US Index thereafter; for U.S. bonds, the Bloomberg Barclays U.S. Aggregate Float Adjusted Index; for international bonds, the Bloomberg Barclays Global Aggregate ex-USD Float Adjusted RIC Capped Index beginning June 3, 2013; and for U.S. stocks, the MSCI US Broad Market Index through June 2, 2013, and the CRSP US Total Market Index thereafter. International stock benchmark returns are adjusted for withholding taxes.
Target 2065 Composite Index: Derived by applying the fund’s target asset allocation to the results of the following benchmarks: the FTSE Global All Cap ex US Index for international stocks, the Bloomberg Barclays U.S. Aggregate Float Adjusted Index for U.S. bonds, the Bloomberg Barclays Global Aggregate ex-USD Float Adjusted RIC Capped Index for international bonds, and the CRSP US Total Market Index for U.S. stocks. International stock benchmark returns are adjusted for withholding taxes.
87
BLOOMBERG is a trademark and service mark of Bloomberg Finance L.P. BARCLAYS is a trademark and service mark of Barclays Bank Plc, used under license. Bloomberg Finance L.P. and its affiliates, including Bloomberg Index Services Limited (BISL) (collectively, Bloomberg), or Bloomberg’s licensors, own all proprietary rights in the Bloomberg Barclays U.S. Aggregate Bond Index, Bloomberg Barclays U.S. Aggregate Float Adjusted Index, and the Bloomberg Barclays Global Aggregate ex-USD Float Adjusted RIC Capped Index (USD Hedged) (the Indices or Bloomberg Barclays Indices).
Neither Barclays Bank Plc, Barclays Capital Inc., or any affiliate (collectively Barclays) or Bloomberg is the issuer or producer of the Target Retirement Funds (including the Total Bond Market II Index Fund and the Total International Bond Index Fund) and neither Bloomberg nor Barclays has any responsibilities, obligations or duties to investors in the Target Retirement Funds. The Indices are licensed for use by The Vanguard Group, Inc. (Vanguard) as the sponsor of the Target Retirement Funds. Bloomberg and Barclays’ only relationship with Vanguard in respect to the Indices is the licensing of the Indices, which is determined, composed and calculated by BISL, or any successor thereto, without regard to the Issuer or the Target Retirement Funds or the owners of the Target Retirement Funds.
Additionally, Vanguard may for itself execute transaction(s) with Barclays in or relating to the Indices in connection with the Target Retirement Funds. Investors acquire the Target Retirement Funds from Vanguard and investors neither acquire any interest in the Indices nor enter into any relationship of any kind whatsoever with Bloomberg or Barclays upon making an investment in the Target Retirement Funds. The Target Retirement Funds are not sponsored, endorsed, sold or promoted by Bloomberg or Barclays. Neither Bloomberg nor Barclays makes any representation or warranty, express or implied regarding the advisability of investing in the Target Retirement Funds or the advisability of investing in securities generally or the ability of the Indices to track corresponding or relative market performance. Neither Bloomberg nor Barclays has passed on the legality or suitability of the Target Retirement Funds with respect to any person or entity. Neither Bloomberg nor Barclays is responsible for and has not participated in the determination of the timing of, prices at, or quantities of the Target Retirement Funds to be issued. Neither Bloomberg nor Barclays has any obligation to take the needs of the Issuer or the owners of the Target Retirement Funds or any other third party into consideration in determining, composing or calculating the Indices. Neither Bloomberg nor Barclays has any obligation or liability in connection with administration, marketing or trading of the Target Retirement Funds.
The licensing agreement between Bloomberg and Barclays is solely for the benefit of Bloomberg and Barclays and not for the benefit of the owners of the Target Retirement Funds, investors or other third parties. In addition, the licensing agreement between Vanguard and Bloomberg is solely for the benefit of Vanguard and Bloomberg and not for the benefit of the owners of the Target Retirement Funds, investors or other third parties.
88
NEITHER BLOOMBERG NOR BARCLAYS SHALL HAVE ANY LIABILITY TO THE ISSUER, INVESTORS OR TO OTHER THIRD PARTIES FOR THE QUALITY, ACCURACY AND/OR COMPLETENESS OF THE BLOOMBERG BARCLAYS INDICES OR ANY DATA INCLUDED THEREIN OR FOR INTERRUPTIONS IN THE DELIVERY OF THE BLOOMBERG BARCLAYS INDICES. NEITHER BLOOMBERG NOR BARCLAYS MAKES ANY WARRANTY, EXPRESS OR IMPLIED, AS TO RESULTS TO BE OBTAINED BY THE ISSUER, THE INVESTORS OR ANY OTHER PERSON OR ENTITY FROM THE USE OF THE BLOOMBERG BARCLAYS INDICES OR ANY DATA INCLUDED THEREIN. NEITHER BLOOMBERG NOR BARCLAYS MAKES ANY EXPRESS OR IMPLIED WARRANTIES, AND EACH HEREBY EXPRESSLY DISCLAIMS ALL WARRANTIES OF MERCHANTABILITY
OR FITNESS FOR A PARTICULAR PURPOSE OR USE WITH RESPECT TO BLOOMBERG BARCLAYS INDICES OR ANY DATA INCLUDED THEREIN. BLOOMBERG RESERVES THE RIGHT TO CHANGE THE METHODS OF CALCULATION OR PUBLICATION, OR TO CEASE THE CALCULATION OR PUBLICATION OF THE BLOOMBERG BARCLAYS INDICES, AND NEITHER BLOOMBERG NOR BARCLAYS SHALL BE LIABLE FOR ANY MISCALCULATION OF OR ANY INCORRECT, DELAYED OR INTERRUPTED PUBLICATION WITH RESPECT TO ANY OF THE BLOOMBERG BARCLAYS INDICES. NEITHER BLOOMBERG NOR BARCLAYS SHALL BE LIABLE FOR ANY DAMAGES, INCLUDING, WITHOUT LIMITATION, ANY SPECIAL, INDIRECT OR CONSEQUENTIAL DAMAGES, OR ANY LOST PROFITS AND EVEN IF ADVISED OF THE POSSIBILITY OF SUCH, RESULTING FROM THE USE OF BLOOMBERG BARCLAYS INDICES OR ANY DATA INCLUDED THEREIN OR WITH RESPECT TO THE TARGET RETIREMENT FUNDS.
None of the information supplied by Bloomberg or Barclays and used in this publication may be reproduced in any manner without the prior written permission of both Bloomberg and Barclays Capital, the investment banking division of Barclays Bank Plc. Barclays Bank Plc is registered in England No. 1026167. Registered office 1 Churchill Place London E14 5HP.
© 2018 Bloomberg. Used with Permission.
Source: Bloomberg Index Services Limited. Copyright 2018, Bloomberg. All rights reserved.
89
This page intentionally left blank.
The People Who Govern Your Fund
The trustees of your mutual fund are there to see that the fund is operated and managed in your best interests since, as a shareholder, you are a part owner of the fund. Your fund’s trustees also serve on the board of directors of The Vanguard Group, Inc., which is owned by the Vanguard funds and provides services to them on an at-cost basis.
A majority of Vanguard’s board members are independent, meaning that they have no affiliation with Vanguard or the funds they oversee, apart from the sizable personal investments they have made as private individuals. The independent board members have distinguished backgrounds in business, academia, and public service. Each of the trustees and executive officers oversees 211 Vanguard funds.
Information for each trustee and executive officer of the fund appears below. The mailing address of the trustees and officers is P.O. Box 876, Valley Forge, PA 19482. More information about the trustees is in the Statement of Additional Information, which can be obtained, without charge, by contacting Vanguard at 800-662-7447, or online at vanguard.com.
Interested Trustees1
F. William McNabb III
Born in 1957. Trustee since July 2009. Principal occupation(s) during the past five years and other experience: chairman of the board (January 2010–present) of Vanguard and of each of the investment companies served by Vanguard, trustee (2009–present) of each of the investment companies served by Vanguard, and director (2008–present) of Vanguard. Chief executive officer and president (2008–2017) of Vanguard and each of the investment companies served by Vanguard, managing director (1995–2008) of Vanguard, and director (1997–2018) of Vanguard Marketing Corporation. Director (2018–present) of UnitedHealth Group.
Mortimer J. Buckley
Born in 1969. Trustee since January 2018. Principal occupation(s) during the past five years and other experience: chief executive officer (January 2018–present) of Vanguard; chief executive officer, president, and trustee (January 2018–present) of each of the investment companies served by Vanguard; president and director (2017–present) of Vanguard; and president (February 2018–present) of Vanguard Marketing Corporation. Chief investment officer (2013–2017), managing director (2002–2017), head of the Retail Investor Group (2006–2012), and chief information officer (2001–2006) of Vanguard. Chairman of the board (2011–2017) of the Children’s Hospital of Philadelphia.
Independent Trustees
Emerson U. Fullwood
Born in 1948. Trustee since January 2008. Principal occupation(s) during the past five years and other experience: executive chief staff and marketing officer for North America and corporate vice president (retired 2008) of Xerox Corporation (document management products and services). Former president of the Worldwide Channels Group, Latin America, and Worldwide Customer Service and executive chief staff officer of Developing Markets of Xerox. Executive in residence and 2009–2010 Distinguished Minett Professor at the Rochester Institute of Technology. Lead director of SPX FLOW, Inc. (multi-industry manufacturing). Director of the University of Rochester Medical Center, the Monroe Community College Foundation, the United Way of Rochester, North Carolina A&T University, and Roberts Wesleyan College. Trustee of the University of Rochester.
Amy Gutmann
Born in 1949. Trustee since June 2006. Principal occupation(s) during the past five years and other experience: president (2004–present) of the University of Pennsylvania. Christopher H. Browne Distinguished Professor of Political Science, School of Arts and Sciences, and professor of communication, Annenberg School for Communication, with secondary faculty appointments in the Department of Philosophy, School of Arts and Sciences, and at the Graduate School of Education, University of Pennsylvania. Trustee of the National Constitution Center.
1 Mr. McNabb and Mr. Buckley are considered “interested persons,” as defined in the Investment Company Act of 1940, because they are officers of the Vanguard funds.
JoAnn Heffernan Heisen
Born in 1950. Trustee since July 1998. Principal occupation(s) during the past five years and other experience: corporate vice president of Johnson & Johnson (pharmaceuticals/medical devices/consumer products) and member of its executive committee (1997–2008). Chief global diversity officer (retired 2008), vice president and chief information officer (1997–2006), controller (1995–1997), treasurer (1991–1995), and assistant treasurer (1989–1991) of Johnson & Johnson. Director of Skytop Lodge Corporation (hotels) and the Robert Wood Johnson Foundation. Member of the advisory board of the Institute for Women’s Leadership at Rutgers University.
F. Joseph Loughrey
Born in 1949. Trustee since October 2009. Principal occupation(s) during the past five years and other experience: president and chief operating officer (retired 2009) and vice chairman of the board (2008–2009) of Cummins Inc. (industrial machinery). Chairman of the board of Hillenbrand, Inc. (specialized consumer services), Oxfam America, and the Lumina Foundation for Education. Director of the V Foundation for Cancer Research. Member of the advisory council for the College of Arts and Letters and chair of the advisory board to the Kellogg Institute for International Studies, both at the University of Notre Dame.
Mark Loughridge
Born in 1953. Trustee since March 2012. Principal occupation(s) during the past five years and other experience: senior vice president and chief financial officer (retired 2013) of IBM (information technology services). Fiduciary member of IBM’s Retirement Plan Committee (2004–2013), senior vice president and general manager (2002–2004) of IBM Global Financing, vice president and controller (1998–2002) of IBM, and a variety of other prior management roles at IBM. Member of the Council on Chicago Booth.
Scott C. Malpass
Born in 1962. Trustee since March 2012. Principal occupation(s) during the past five years and other experience: chief investment officer (1989–present) and vice president (1996–present) of the University of Notre Dame. Assistant professor of finance at the Mendoza College of Business, University of Notre Dame, and member of the Notre Dame 403(b) Investment Committee. Chairman of the board of TIFF Advisory Services, Inc. Member of the board of Catholic Investment Services, Inc. (investment advisors), the board of advisors for Spruceview Capital Partners, and the board of superintendence of the Institute for the Works of Religion.
Deanna Mulligan
Born in 1963. Trustee since January 2018. Principal occupation(s) during the past five years and other experience: president (2010–present) and chief executive officer (2011–present) of The Guardian Life Insurance Company of America. Chief operating officer (2010–2011) and executive vice president (2008–2010) of Individual Life and Disability of The Guardian Life Insurance Company of America. Member of the board of The Guardian Life Insurance Company of America, the American Council of Life Insurers, the Partnership for New York City (business leadership), and the Committee Encouraging Corporate Philanthropy. Trustee of the Economic Club of New York and the Bruce Museum (arts and science). Member of the Advisory Council for the Stanford Graduate School of Business.
André F. Perold
Born in 1952. Trustee since December 2004. Principal occupation(s) during the past five years and other experience: George Gund Professor of Finance and Banking, Emeritus at the Harvard Business School (retired 2011). Chief investment officer and co-managing partner of HighVista Strategies LLC (private investment firm). Overseer of the Museum of Fine Arts Boston.
Sarah Bloom Raskin
Born in 1961. Trustee since January 2018. Principal occupation(s) during the past five years and other experience: deputy secretary (2014–2017) of the United States Department of the Treasury. Governor (2010–2014) of the Federal Reserve Board. Commissioner (2007–2010) of financial regulation for the State of Maryland. Member of the board of directors (2012–2014) of Neighborhood Reinvestment Corporation. Director of i(x) Investments, LLC.
Peter F. Volanakis
Born in 1955. Trustee since July 2009. Principal occupation(s) during the past five years and other experience: president and chief operating officer (retired 2010) of Corning Incorporated (communications equipment) and director of Corning Incorporated (2000–2010) and Dow Corning (2001–2010). Director (2012) of SPX Corporation (multi-industry manufacturing). Overseer of the Amos Tuck School of Business Administration, Dartmouth College (2001–2013). Chairman of the board of trustees of Colby-Sawyer College. Member of the Board of Hypertherm Inc. (industrial cutting systems, software, and consumables).
Executive Officers
Glenn Booraem
Born in 1967. Principal occupation(s) during the past five years and other experience: principal of Vanguard. Investment stewardship officer (2017–present), treasurer (2015–2017), controller (2010–2015), and assistant controller (2001–2010) of each of the investment companies served by Vanguard.
Christine M. Buchanan
Born in 1970. Principal occupation(s) during the past five years and other experience: principal of Vanguard and global head of Fund Administration at Vanguard. Treasurer (2017–present) of each of the investment companies served by Vanguard. Partner (2005–2017) at KPMG LLP (audit, tax, and advisory services).
Brian Dvorak
Born in 1973. Principal occupation(s) during the past five years and other experience: principal of Vanguard. Chief compliance officer (2017–present) of Vanguard and each of the investment companies served by Vanguard. Assistant vice president (2017–present) of Vanguard Marketing Corporation. Vice president and director of Enterprise Risk Management (2011–2013) at Oppenheimer Funds, Inc.
Thomas J. Higgins
Born in 1957. Principal occupation(s) during the past five years and other experience: principal of Vanguard. Chief financial officer (2008–present) and treasurer (1998–2008) of each of the investment companies served by Vanguard.
Peter Mahoney
Born in 1974. Principal occupation(s) during the past five years and other experience: principal of Vanguard. Controller (2015–present) of each of the investment companies served by Vanguard. Head of International Fund Services (2008–2014) at Vanguard.
Anne E. Robinson
Born in 1970. Principal occupation(s) during the past five years and other experience: general counsel (2016–present) of Vanguard. Secretary (2016–present) of Vanguard and of each of the investment companies served by Vanguard. Managing director (2016–present) of Vanguard. Director and senior vice president (2016–2018) of Vanguard Marketing Corporation. Managing director and general counsel of Global Cards and Consumer Services (2014–2016) at Citigroup. Counsel (2003–2014) at American Express.
Michael Rollings
Born in 1963. Principal occupation(s) during the past five years and other experience: finance director (2017–present) and treasurer (2017) of each of the investment companies served by Vanguard. Managing director (2016–present) of Vanguard. Chief financial officer (2016–present) of Vanguard. Director (2016–present) of Vanguard Marketing Corporation. Executive vice president and chief financial officer (2006–2016) of MassMutual Financial Group.
| Vanguard Senior Management Team | |
| Joseph Brennan | Chris D. McIsaac |
| Mortimer J. Buckley | James M. Norris |
| Gregory Davis | Thomas M. Rampulla |
| John James | Karin A. Risi |
| Martha G. King | Anne E. Robinson |
| John T. Marcante | Michael Rollings |
| Chairman Emeritus and Senior Advisor | |
| John J. Brennan | |
| Chairman, 1996–2009 | |
| Chief Executive Officer and President, 1996–2008 | |
| Founder | |
| John C. Bogle | |
| Chairman and Chief Executive Officer, 1974–1996 | |
 | |
P.O. Box 2600 | |
Connect with Vanguard® > vanguard.com | |
| Fund Information > 800-662-7447 | |
| Direct Investor Account Services > 800-662-2739 | |
| Institutional Investor Services > 800-523-1036 | |
| Text Telephone for People | |
| Who Are Deaf or Hard of Hearing > 800-749-7273 | |
| This material may be used in conjunction | |
| with the offering of shares of any Vanguard | |
| fund only if preceded or accompanied by | |
| the fund’s current prospectus. | |
| All comparative mutual fund data are from Lipper, a | |
| Thomson Reuters Company, or Morningstar, Inc., unless | |
| otherwise noted. | |
| You can obtain a free copy of Vanguard’s proxy voting | |
| guidelines by visiting vanguard.com/proxyreporting or by | |
| calling Vanguard at 800-662-2739. The guidelines are | |
| also available from the SEC’s website, sec.gov. In | |
| addition, you may obtain a free report on how your fund | |
| voted the proxies for securities it owned during the 12 | |
| months ended June 30. To get the report, visit either | |
| vanguard.com/proxyreporting or sec.gov. | |
| You can review and copy information about your fund at | |
| the SEC’s Public Reference Room in Washington, D.C. To | |
| find out more about this public service, call the SEC at | |
| 202-551-8090. Information about your fund is also | |
| available on the SEC’s website, and you can receive | |
| copies of this information, for a fee, by sending a | |
| request in either of two ways: via email addressed to | |
| publicinfo@sec.gov or via regular mail addressed to the | |
| Public Reference Section, Securities and Exchange | |
| Commission, Washington, DC 20549-1520. | |
| © 2018 The Vanguard Group, Inc. | |
| All rights reserved. | |
| Vanguard Marketing Corporation, Distributor. | |
| Q3080B 112018 | |
| Annual Report | September 30, 2018 |
| Vanguard Institutional Target |
| Retirement Funds |
| Vanguard Institutional Target Retirement Income Fund |
| Vanguard Institutional Target Retirement 2015 Fund |
| Vanguard Institutional Target Retirement 2020 Fund |
| Vanguard Institutional Target Retirement 2025 Fund |
| Vanguard Institutional Target Retirement 2030 Fund |
| Vanguard Institutional Target Retirement 2035 Fund |
Vanguard’s Principles for Investing Success
We want to give you the best chance of investment success. These
principles, grounded in Vanguard’s research and experience, can put you on
the right path.
Goals. Create clear, appropriate investment goals.
Balance. Develop a suitable asset allocation using broadly diversified funds.
Cost. Minimize cost.
Discipline. Maintain perspective and long-term discipline.
A single theme unites these principles: Focus on the things you can control.
We believe there is no wiser course for any investor.
| Contents | |
| Your Fund’s Performance at a Glance. | 1 |
| CEO’s Perspective. | 4 |
| Institutional Target Retirement Income Fund. | 6 |
| Institutional Target Retirement 2015 Fund. | 19 |
| Institutional Target Retirement 2020 Fund. | 31 |
| Institutional Target Retirement 2025 Fund. | 43 |
| Institutional Target Retirement 2030 Fund. | 55 |
| Institutional Target Retirement 2035 Fund. | 67 |
| About Your Fund’s Expenses. | 82 |
| Glossary. | 84 |
Please note: The opinions expressed in this report are just that—informed opinions. They should not be considered promises or advice. Also, please keep in mind that the information and opinions cover the period through the date on the front of this report. Of course, the risks of investing in your fund are spelled out in the prospectus.
See the Glossary for definitions of investment terms used in this report.
Your Fund’s Performance at a Glance
• For the 12 months ended September 30, 2018, the six Vanguard Institutional Target Retirement Funds covered in this report recorded returns ranging from 3.34% for the Institutional Target Retirement Income Fund to 8.54% for the Institutional Target Retirement 2035 Fund. (The funds with target dates of 2040 through 2065 are covered in a separate report.) The funds with a greater allocation to stocks performed best.
• Each fund posted returns that were in line with those of its composite benchmark after expenses. Each fund surpassed the average returns of its peers.
• Vanguard Institutional Target Retirement Funds are designed to reach an allocation of 70% bonds and 30% stocks within seven years after their target dates.
• From their inception dates through September 30, the funds’ average annual returns ranged from 4.18% for the Institutional Target Retirement Income Fund to 7.64% for the Institutional Target Retirement 2035 Fund.
| Total Returns: Fiscal Year Ended September 30, 2018 | |
| Total | |
| Returns | |
| Vanguard Institutional Target Retirement Income Fund | 3.34% |
| Target Income Composite Index | 3.47 |
| Mixed-Asset Target Today Funds Average | 2.82 |
| Mixed-Asset Target Today Funds Average: Derived from data provided by Lipper, a Thomson Reuters Company. | |
| Vanguard Institutional Target Retirement 2015 Fund | 4.60% |
| Target 2015 Composite Index | 4.77 |
| Mixed-Asset Target 2015 Funds Average | 4.10 |
| Mixed-Asset Target 2015 Funds Average: Derived from data provided by Lipper, a Thomson Reuters Company. | |
| Vanguard Institutional Target Retirement 2020 Fund | 5.92% |
| Target 2020 Composite Index | 6.11 |
| Mixed-Asset Target 2020 Funds Average | 4.36 |
| Mixed-Asset Target 2020 Funds Average: Derived from data provided by Lipper, a Thomson Reuters Company. | |
| Vanguard Institutional Target Retirement 2025 Fund | 6.85% |
| Target 2025 Composite Index | 7.08 |
| Mixed-Asset Target 2025 Funds Average | 5.46 |
| Mixed-Asset Target 2025 Funds Average: Derived from data provided by Lipper, a Thomson Reuters Company. | |
1
| Total | |
| Returns | |
| Vanguard Institutional Target Retirement 2030 Fund | 7.73% |
| Target 2030 Composite Index | 7.94 |
| Mixed-Asset Target 2030 Funds Average | 6.64 |
| Mixed-Asset Target 2030 Funds Average: Derived from data provided by Lipper, a Thomson Reuters Company. | |
| Vanguard Institutional Target Retirement 2035 Fund | 8.54% |
| Target 2035 Composite Index | 8.80 |
| Mixed-Asset Target 2035 Funds Average | 7.90 |
Mixed-Asset Target 2035 Funds Average: Derived from data provided by Lipper, a Thomson Reuters Company. For a benchmark description, see the Glossary.
Investments in Target Retirement Funds are subject to the risks of their underlying funds. The year in the fund name refers to the approximate year (the target date) when an investor in the fund would retire and leave the work force. The fund will gradually shift its emphasis from more aggressive investments to more conservative ones based on its target date. An investment in a Target Retirement Fund is not guaranteed at any time, including on or after the target date.
| Total Returns: Inception Through September 30, 2018 | |
| Average | |
| Annual Return | |
| Institutional Target Retirement Income Fund (Returns since inception: 6/26/2015) | 4.18% |
| Target Income Composite Index | 4.31 |
| Mixed-Asset Target Today Funds Average | 3.80 |
| Mixed-Asset Target Today Funds Average: Derived from data provided by Lipper, a Thomson Reuters Company. | |
| Institutional Target Retirement 2015 Fund (Returns since inception: 6/26/2015) | 5.07% |
| Target 2015 Composite Index | 5.23 |
| Mixed-Asset Target 2015 Funds Average | 4.63 |
| Mixed-Asset Target 2015 Funds Average: Derived from data provided by Lipper, a Thomson Reuters Company. | |
| Institutional Target Retirement 2020 Fund (Returns since inception: 6/26/2015) | 6.04% |
| Target 2020 Composite Index | 6.22 |
| Mixed-Asset Target 2020 Funds Average | 4.58 |
| Mixed-Asset Target 2020 Funds Average: Derived from data provided by Lipper, a Thomson Reuters Company. | |
| Institutional Target Retirement 2025 Fund (Returns since inception: 6/26/2015) | 6.67% |
| Target 2025 Composite Index | 6.84 |
| Mixed-Asset Target 2025 Funds Average | 5.47 |
| Mixed-Asset Target 2025 Funds Average: Derived from data provided by Lipper, a Thomson Reuters Company. | |
| Institutional Target Retirement 2030 Fund (Returns since inception: 6/26/2015) | 7.15% |
| Target 2030 Composite Index | 7.36 |
| Mixed-Asset Target 2030 Funds Average | 6.16 |
| Mixed-Asset Target 2030 Funds Average: Derived from data provided by Lipper, a Thomson Reuters Company. | |
2
| Average | |
| Annual Return | |
| Institutional Target Retirement 2035 Fund (Returns since inception: 6/26/2015) | 7.64% |
| Target 2035 Composite Index | 7.86 |
| Mixed-Asset Target 2035 Funds Average | 6.96 |
Mixed-Asset Target 2035 Funds Average: Derived from data provided by Lipper, a Thomson Reuters Company.
The figures shown represent past performance, which is not a guarantee of future results. (Current performance may be lower or higher than the performance data cited. For performance data current to the most recent month-end, visit our website at vanguard.com/performance.) Note, too, that both investment returns and principal value can fluctuate widely, so an investor’s shares, when sold, could be worth more or less than their original cost.
3
CEO’s Perspective

Tim Buckley
President and Chief Executive Officer
Dear Shareholder,
Over the years, I’ve found that prudent investors exhibit a common trait: discipline. No matter how the markets move or what new investing fad hits the headlines, those who stay focused on their goals and tune out the noise are set up for long-term success.
The prime gateway to investing is saving, and you don’t usually become a saver without a healthy dose of discipline. Savers make the decision to sock away part of their income, which means spending less and delaying gratification, no matter how difficult that may be.
Of course, disciplined investing extends beyond diligent saving. The financial markets, in the short term especially, are unpredictable; I have yet to meet the investor who can time them perfectly. It takes discipline to resist the urge to go all-in when markets are frothy or to retreat when things look bleak.
Staying put with your investments is one strategy for handling volatility. Another, rebalancing, requires even more discipline because it means steering your money away from strong performers and toward poorer performers.
Patience—a form of discipline—is also the friend of long-term investors. Higher returns are the potential reward for weathering the market’s turbulence and uncertainty.
4
We have been enjoying one of the longest bull markets in history, but it won’t continue forever. Prepare yourself now for how you will react when volatility comes back. Don’t panic. Don’t chase returns or look for answers outside the asset classes you trust. And be sure to rebalance periodically, even when there’s turmoil.
Whether you’re a master of self-control, get a boost from technology, or work with a professional advisor, know that discipline is necessary to get the most out of your investment portfolio. And know that Vanguard is with you for the entire ride.
Thank you for your continued loyalty.
Sincerely,

Mortimer J. Buckley
President and Chief Executive Officer
October 18, 2018
| Market Barometer | |||
| Average Annual Total Returns | |||
| Periods Ended September 30, 2018 | |||
| One Year | Three Years | Five Years | |
| Stocks | |||
| Russell 1000 Index (Large-caps) | 17.76% | 17.07% | 13.67% |
| Russell 2000 Index (Small-caps) | 15.24 | 17.12 | 11.07 |
| Russell 3000 Index (Broad U.S. market) | 17.58 | 17.07 | 13.46 |
| FTSE All-World ex US Index (International) | 2.13 | 10.18 | 4.51 |
| Bonds | |||
| Bloomberg Barclays U.S. Aggregate Bond Index | |||
| (Broad taxable market) | -1.22% | 1.31% | 2.16% |
| Bloomberg Barclays Municipal Bond Index | |||
| (Broad tax-exempt market) | 0.35 | 2.24 | 3.54 |
| FTSE Three-Month U. S. Treasury Bill Index | 1.57 | 0.80 | 0.48 |
| CPI | |||
| Consumer Price Index | 2.28% | 1.99% | 1.52% |
5
Institutional Target Retirement Income Fund
Fund Profile
As of September 30, 2018
| Total Fund Characteristics | |
| Ticker Symbol | VITRX |
| 30-Day SEC Yield | 2.44% |
| Acquired Fund Fees and Expenses1 | 0.09% |
| Allocation to Underlying Vanguard Funds | |
| Vanguard Total Bond Market II Index Fund | |
| Investor Shares | 37.3% |
| Vanguard Total Stock Market Index Fund | |
| Institutional Shares | 18.0 |
| Vanguard Short-Term Inflation-Protected | |
| Securities Index Fund Admiral Shares | 16.8 |
| Vanguard Total International Bond Index | |
| Fund Admiral Shares | 15.9 |
| Vanguard Total International Stock Index | |
| Fund Investor Shares | 12.0 |
Fund Asset Allocation
1 This figure—drawn from the prospectus dated January 25, 2018—represents an estimate of the weighted average of the expense ratios and any transaction fees charged by the underlying mutual funds (the ”acquired” funds) in which the Institutional Target Retirement Income Fund invests. The fund does not charge any expenses or fees of its own. For the fiscal year ended September 30, 2018, the acquired fund fees and expenses were 0.09%.
6
Institutional Target Retirement Income Fund
Performance Summary
All of the returns in this report represent past performance, which is not a guarantee of future results that may be achieved by the fund. (Current performance may be lower or higher than the performance data cited. For performance data current to the most recent month-end, visit our website at vanguard.com/performance.) Note, too, that both investment returns and principal value can fluctuate widely, so an investor’s shares, when sold, could be worth more or less than their original cost. The returns shown do not reflect taxes that a shareholder would pay on fund distributions or on the sale of fund shares.
Cumulative Performance: June 26, 2015, Through September 30, 2018
Initial Investment of $100,000,000
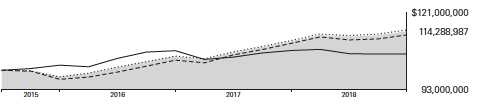
| Average Annual Total Returns | |||
| Periods Ended September 30, 2018 | |||
| Since | Final Value | ||
| One | Inception | of a $100,000,000 | |
| Year | (6/26/2015) | Investment | |
| Institutional Target Retirement Income | |||
| Fund* | 3.34% | 4.18% | $114,288,987 |
| Target Income Composite Index | 3.47 | 4.31 | 114,765,107 |
| Mixed-Asset Target Today Funds | |||
| Average | 2.82 | 3.80 | 112,949,056 |
| Bloomberg Barclays U.S. Aggregate | |||
| Bond Index | -1.22 | 1.78 | 105,928,554 |
For a benchmark description, see the Glossary.
Mixed-Asset Target Today Funds Average: Derived from data provided by Lipper, a Thomson Reuters Company.
"Since Inception" performance is calculated from the fund's inception date for both the fund and its comparative standards.
See Financial Highlights for dividend and capital gains information.
7
Institutional Target Retirement Income Fund
Fiscal-Year Total Returns (%): June 26, 2015, Through September 30, 2018
8
Institutional Target Retirement Income Fund
Financial Statements
Statement of Net Assets
As of September 30, 2018
The fund reports a complete list of its holdings in regulatory filings four times in each fiscal year, at the quarter-ends. For the second and fourth fiscal quarters, the lists appear in the fund’s semiannual and annual reports to shareholders. For the first and third fiscal quarters, the fund files the lists with the Securities and Exchange Commission on Form N-Q. Shareholders can look up the fund’s Forms N-Q on the SEC’s website at sec.gov. Forms N-Q may also be reviewed and copied at the SEC’s Public Reference Room (see the back cover of this report for further information).
| Market | ||
| Value• | ||
| Shares | ($000) | |
| Investment Companies (100.0%) | ||
| U.S. Stock Fund (18.0%) | ||
| Vanguard Total Stock Market Index Fund Institutional Shares | 13,989,179 | 1,019,112 |
| International Stock Fund (12.0%) | ||
| Vanguard Total International Stock Index Fund Investor Shares | 39,201,789 | 680,543 |
| U.S. Bond Funds (54.1%) | ||
| 1 Vanguard Total Bond Market II Index Fund Investor Shares | 204,187,436 | 2,109,256 |
| Vanguard Short-Term Inflation-Protected Securities Index Fund | ||
| Admiral Shares | 39,214,262 | 950,946 |
| 3,060,202 | ||
| International Bond Fund (15.9%) | ||
| Vanguard Total International Bond Index Fund Admiral Shares | 41,327,320 | 899,283 |
| Total Investment Companies (Cost $5,351,100) | 5,659,140 | |
| Temporary Cash Investment (0.0%) | ||
| Money Market Fund (0.0%) | ||
| 1 Vanguard Market Liquidity Fund, 2.209% (Cost $1) | 14 | 1 |
| Total Investments (100.0%) (Cost $5,351,101) | 5,659,141 | |
| Other Assets and Liabilities (0.0%) | ||
| Other Assets | 23,344 | |
| Liabilities | (21,912) | |
| 1,432 | ||
| Net Assets (100%) | ||
| Applicable to 263,919,912 outstanding $.001 par value shares of | ||
| beneficial interest (unlimited authorization) | 5,660,573 | |
| Net Asset Value Per Share | $21.45 |
9
| Institutional Target Retirement Income Fund | |
| Amount | |
| ($000) | |
| Statement of Assets and Liabilities | |
| Assets | |
| Investments in Securities, at Value—Affiliated Funds | 5,659,141 |
| Receivables for Investment Securities Sold | 14,968 |
| Receivables for Accrued Income | 5,669 |
| Receivables for Capital Shares Issued | 2,707 |
| Total Assets | 5,682,485 |
| Liabilities | |
| Payables for Investment Securities Purchased | 5,669 |
| Payables for Capital Shares Redeemed | 10,775 |
| Other Liabilities | 5,468 |
| Total Liabilities | 21,912 |
| Net Assets | 5,660,573 |
| At September 30, 2018, net assets consisted of: | |
| Amount | |
| ($000) | |
| Paid-in Capital | 5,340,656 |
| Undistributed Net Investment Income | 6,041 |
| Accumulated Net Realized Gains | 5,836 |
| Unrealized Appreciation (Depreciation) | 308,040 |
| Net Assets | 5,660,573 |
• See Note A in Notes to Financial Statements.
1 Affiliated fund available only to Vanguard funds and certain trusts and accounts managed by Vanguard. Rate shown for Vanguard
Market Liquidity Fund is the 7-day yield.
See accompanying Notes, which are an integral part of the Financial Statements.
10
| Institutional Target Retirement Income Fund | |
| Statement of Operations | |
| Year Ended | |
| September 30, 2018 | |
| ($000) | |
| Investment Income | |
| Income | |
| Income Distributions Received from Affiliated Funds | 136,244 |
| Net Investment Income—Note B | 136,244 |
| Realized Net Gain (Loss) | |
| Capital Gain Distributions Received from Affiliated Funds | 431 |
| Affiliated Funds Sold | 7,739 |
| Futures Contracts | (56) |
| Realized Net Gain (Loss) | 8,114 |
| Change in Unrealized Appreciation (Depreciation) from Affiliated Funds | 27,989 |
| Net Increase (Decrease) in Net Assets Resulting from Operations | 172,347 |
See accompanying Notes, which are an integral part of the Financial Statements.
11
| Institutional Target Retirement Income Fund | ||
| Statement of Changes in Net Assets | ||
| Year Ended September 30, | ||
| 2018 | 2017 | |
| ($000) | ($000) | |
| Increase (Decrease) in Net Assets | ||
| Operations | ||
| Net Investment Income | 136,244 | 55,255 |
| Realized Net Gain (Loss) | 8,114 | 2,499 |
| Change in Unrealized Appreciation (Depreciation) | 27,989 | 99,003 |
| Net Increase (Decrease) in Net Assets Resulting from Operations | 172,347 | 156,757 |
| Distributions | ||
| Net Investment Income | (132,299) | (54,657) |
| Realized Capital Gain1 | (931) | (952) |
| Total Distributions | (133,230) | (55,609) |
| Capital Share Transactions | ||
| Issued | 1,660,589 | 1,997,355 |
| Issued in Connection with Acquisition of Vanguard Institutional | ||
| Target Retirement 2010 Fund—Note F | — | 1,874,542 |
| Issued in Lieu of Cash Distributions | 132,093 | 55,149 |
| Redeemed | (1,210,217) | (1,019,703) |
| Net Increase (Decrease) from Capital Share Transactions | 582,465 | 2,907,343 |
| Total Increase (Decrease) | 621,582 | 3,008,491 |
| Net Assets | ||
| Beginning of Period | 5,038,991 | 2,030,500 |
| End of Period2 | 5,660,573 | 5,038,991 |
1 Includes fiscal 2018 and 2017 short-term gain distributions totaling $539,000 and $688,000, respectively. Short-term gain
distributions are treated as ordinary income dividends for tax purposes.
2 Net Assets—End of Period includes undistributed (overdistributed) net investment income of $6,041,000 and $2,096,000.
See accompanying Notes, which are an integral part of the Financial Statements.
12
| Institutional Target Retirement Income Fund | ||||
| Financial Highlights | ||||
| June 26, | ||||
| 20151 to | ||||
| Year Ended September 30, | Sept. 30, | |||
| For a Share Outstanding Throughout Each Period | 2018 | 2017 | 2016 | 2015 |
| Net Asset Value, Beginning of Period | $21.27 | $20.60 | $19.46 | $20.00 |
| Investment Operations | ||||
| Net Investment Income | . 537 2 | .4042 | .341 | .1112 |
| Capital Gain Distributions Received | .002 2 | .006 2 | .010 | — |
| Net Realized and Unrealized Gain (Loss) on Investments | .167 | .667 | 1.127 | (.599) |
| Total from Investment Operations | .706 | 1.077 | 1.478 | (.488) |
| Distributions | ||||
| Dividends from Net Investment Income | (. 522) | (. 398) | (. 337) | (. 052) |
| Distributions from Realized Capital Gains | (. 004) | (. 009) | (. 001) | — |
| Total Distributions | (. 526) | (. 407) | (. 338) | (. 052) |
| Net Asset Value, End of Period | $21.45 | $21.27 | $20.60 | $19.46 |
| Total Return | 3.34% | 5.30% | 7.66% | -2.44% |
| Ratios/Supplemental Data | ||||
| Net Assets, End of Period (Millions) | $5,661 | $5,039 | $2,031 | $843 |
| Ratio of Total Expenses to Average Net Assets | — | — | — | — |
| Acquired Fund Fees and Expenses | 0.09% | 0.09% | 0.09% | 0.10%3 |
| Ratio of Net Investment Income to Average Net Assets | 2.50% | 1.94% | 1.83% | 1.99%3 |
| Portfolio Turnover Rate | 13% | 7% | 7% | 1% |
1 Inception.
2 Calculated based on average shares outstanding.
3 Annualized.
See accompanying Notes, which are an integral part of the Financial Statements.
13
Institutional Target Retirement Income Fund
Notes to Financial Statements
Vanguard Institutional Target Retirement Income Fund is registered under the Investment Company Act of 1940 as an open-end investment company, or mutual fund. The fund follows a balanced investment strategy by investing in selected Vanguard funds to achieve its targeted allocation of assets to U.S. and international stocks, and U.S. and international bonds. Financial statements and other information about each underlying fund are available on vanguard.com.
A. The following significant accounting policies conform to generally accepted accounting principles for U.S. investment companies. The fund consistently follows such policies in preparing its financial statements.
1. Security Valuation: Investments are valued at the net asset value of each underlying Vanguard fund determined as of the close of the New York Stock Exchange (generally 4 p.m., Eastern time) on the valuation date.
2. Futures Contracts: The fund uses stock and bond futures contracts to a limited extent, with the objectives of maintaining full exposure to the market and maintaining its target asset allocation. The primary risks associated with the use of futures contracts are imperfect correlation between changes in market values of investments held by the fund and the prices of futures contracts, and the possibility of an illiquid market. Counterparty risk involving futures is mitigated because a regulated clearinghouse is the counterparty instead of the clearing broker. To further mitigate counterparty risk, the fund trades futures contracts on an exchange, monitors the financial strength of its clearing brokers and clearinghouse, and has entered into clearing agreements with its clearing brokers. The clearinghouse imposes initial margin requirements to secure the fund’s performance and requires daily settlement of variation margin representing changes in the market value of each contract. Any assets pledged as initial margin for open contracts are noted in the Statement of Net Assets.
Futures contracts are valued at their quoted daily settlement prices. The notional amounts of the contracts are not recorded in the Statement of Net Assets. Fluctuations in the value of the contracts are recorded in the Statement of Assets and Liabilities as an asset (liability) and in the Statement of Operations as unrealized appreciation (depreciation) until the contracts are closed, when they are recorded as realized futures gains (losses).
During the year ended September 30, 2018, the fund’s average investments in long and short futures contracts represented less than 1% and 0% of net assets, respectively, based on the average of the notional amounts at each quarter-end during the period. The fund had no open futures contracts at September 30, 2018.
3. Federal Income Taxes: The fund intends to continue to qualify as a regulated investment company and distribute all of its taxable income. Management has analyzed the fund’s tax positions taken for all open federal income tax years (September 30, 2015–2018), and has concluded that no provision for federal income tax is required in the fund’s financial statements.
4. Distributions: Distributions to shareholders are recorded on the ex-dividend date. Distributions are determined on a tax basis and may differ from net investment income and realized capital gains for financial reporting purposes.
14
Institutional Target Retirement Income Fund
5. Credit Facility: The fund and certain other funds managed by The Vanguard Group (“Vanguard”) participate in a $3.1 billion committed credit facility provided by a syndicate of lenders pursuant to a credit agreement that may be renewed annually; each fund is individually liable for its borrowings, if any, under the credit facility. Borrowings may be utilized for temporary and emergency purposes, and are subject to the fund’s regulatory and contractual borrowing restrictions. The participating funds are charged administrative fees and an annual commitment fee of 0.10% of the undrawn amount of the facility; these fees are allocated to the funds based on a method approved by the fund’s board of trustees and borne by the funds in which the fund invests (see Note B). Any borrowings under this facility bear interest at a rate based upon the higher of the one-month London Interbank Offered Rate, federal funds effective rate, or overnight bank funding rate plus an agreed-upon spread.
The fund had no borrowings outstanding at September 30, 2018, or at any time during the period then ended.
6. Other: Income and capital gain distributions received are recorded on the ex-dividend date. Security transactions are accounted for on the date securities are bought or sold. Costs used to determine realized gains (losses) on the sale of investment securities are those of the specific securities sold.
B. In accordance with the terms of a Funds’ Service Agreement (the “FSA”) between Vanguard and the fund, Vanguard furnishes to the fund investment advisory, corporate management, administrative, marketing, and distribution services at Vanguard’s cost of operations (as defined by the FSA). These costs of operations are allocated to the fund based on methods and guidelines approved by the board of trustees. The FSA provides that expenses otherwise allocable to Vanguard funds-of-funds may be reduced or eliminated to the extent of savings realized by the underlying Vanguard funds by virtue of being part of a fund-of-funds. Accordingly, all expenses for services provided by Vanguard to the fund and all other expenses incurred by the fund during the period ended September 30, 2018, were borne by the underlying Vanguard funds in which the fund invests. The fund’s trustees and officers are also trustees and officers, respectively, of the underlying Vanguard funds, as well as directors and employees, respectively, of Vanguard.
C. Various inputs may be used to determine the value of the fund’s investments. These inputs are summarized in three broad levels for financial statement purposes. The inputs or methodologies used to value securities are not necessarily an indication of the risk associated with investing in those securities.
Level 1—Quoted prices in active markets for identical securities.
Level 2—Other significant observable inputs (including quoted prices for similar securities, interest rates, prepayment speeds, credit risk, etc.).
Level 3—Significant unobservable inputs (including the fund’s own assumptions used to determine the fair value of investments). Any investments valued with significant unobservable inputs are noted on the Statement of Net Assets.
At September 30, 2018, 100% of the market value of the fund’s investments was determined based on Level 1 inputs.
15
Institutional Target Retirement Income Fund
D. Permanent differences between book-basis and tax-basis components of net assets are reclassified among capital accounts in the financial statements to reflect their tax character. These reclassifications have no effect on net assets or net asset value per share. As of period end, the following permanent differences primarily attributable to the accounting for distributions in connection with fund share redemptions were reclassified to the following accounts:
| Amount | |
| ($000) | |
| Paid-in Capital | 2,028 |
| Undistributed (Overdistributed) Net Investment Income | — |
| Accumulated Net Realized Gains (Losses) | (2,028) |
Temporary differences between book-basis and tax-basis components of accumulated net earnings (losses) arise when certain items of income, gain, or loss are recognized in different periods for financial statement and tax purposes; these differences will reverse at some time in the future. The differences are primarily related to the tax deferral of losses on wash sales. As of period end, the tax-basis components of accumulated net earnings (losses) are detailed in the table as follows:
| Amount | |
| ($000) | |
| Undistributed Ordinary Income | 10,249 |
| Undistributed Long-Term Gains | 1,628 |
| Capital Loss Carryforwards (Non-expiring) | — |
| Net Unrealized Gains (Losses) | 308,040 |
As of September 30, 2018, gross unrealized appreciation and depreciation for investments and derivatives based on cost for U.S. federal income tax purposes were as follows:
| Amount | |
| ($000) | |
| Tax Cost | 5,351,101 |
| Gross Unrealized Appreciation | 397,335 |
| Gross Unrealized Depreciation | (89,295) |
| Net Unrealized Appreciation (Depreciation) | 308,040 |
16
Institutional Target Retirement Income Fund
| E. Capital shares issued and redeemed were: | ||
| Year Ended September 30, | ||
| 2018 | 2017 | |
| Shares | Shares | |
| (000) | (000) | |
| Issued | 77,323 | 95,617 |
| Issued in Connection with Acquisition of Vanguard Institutional | ||
| Target Retirement 2010 Fund | — | 88,677 |
| Issued in Lieu of Cash Distributions | 6,154 | 2,657 |
| Redeemed | (56,429) | (48,625) |
| Net Increase (Decrease) in Shares Outstanding | 27,048 | 138,326 |
At September 30, 2018, one shareholder was the record or beneficial owner of 31% of the fund’s net assets. If the shareholder were to redeem its investment in the fund, the redemption might lead to the realization of taxable capital gains.
F. On July 21, 2017, the fund acquired all the net assets of Vanguard Institutional Target Retirement 2010 Fund pursuant to a plan of reorganization approved by the funds’ board of trustees. The purpose of the transaction was to combine two funds with comparable investment objectives. The acquisition was accomplished by a tax-free exchange of 88,677,000 shares of the fund for 89,056,000 shares of the Vanguard Institutional Target Retirement 2010 Fund outstanding as of the close of business on July 21, 2017. The Vanguard Institutional Target Retirement 2010 Fund’s net assets as of the close of business on July 21, 2017, of $1,874,542,000, including $111,122,000 of unrealized appreciation, were combined with the fund’s net assets. The net assets of the fund immediately before the acquisition were $2,936,988,000. The net assets of the fund immediately following the acquisition were $4,811,530,000.
Assuming that the acquisition had been completed on October 1, 2016, the beginning of the fund’s reporting period, the fund’s pro forma results of operations for the year ended September 30, 2017, would be:
| ($000) | |
| Net Investment Income | 86,895 |
| Realized Net Gain (Loss) | 10,268 |
| Change in Unrealized Appreciation (Depreciation) | 146,955 |
| Net Increase (Decrease) in Net Assets Resulting from Operations | 244,118 |
Because the combined funds have been managed as a single integrated fund since the acquisition was completed, it is not practical to separate the results of operations of Vanguard Institutional Target Retirement 2010 Fund that have been included in the fund’s statement of operations since July 21, 2017.
17
Institutional Target Retirement Income Fund
| G. Transactions during the period in affiliated underlying Vanguard funds were as follows: | ||||||||
| Current Period Transactions | ||||||||
| Sept. 30, | Proceeds | Realized | Sept. 30, | |||||
| 2017 | from | Net | Change in | Capital Gain | 2018 | |||
| Market | Purchases | Securities | Gain | Unrealized | Distributions | Market | ||
| Value | at Cost | Sold | (Loss) | App. (Dep.) | Income | Received | Value | |
| ($000) | ($000) | ($000) | ($000) | ($000) | ($000) | ($000) | ($000) | |
| Vanguard Market | ||||||||
| Liquidity Fund | 1,358 | NA1 | NA1 | (1) | — | 11 | — | 1 |
| Vanguard Short-Term | ||||||||
| Inflation-Protected | ||||||||
| Securities Index | ||||||||
| Fund | 841,637 | 197,347 | 68,251 | (112) | (19,675) | 28,930 | — | 950,946 |
| Vanguard Total | ||||||||
| Bond Market II | ||||||||
| Index Fund | 1,895,549 | 586,674 | 291,997 | — | (80,970) | 53,117 | 431 | 2,109,256 |
| Vanguard Total | ||||||||
| International Bond | ||||||||
| Index Fund | 779,202 | 145,273 | 24,912 | (198) | (82) | 18,858 | — | 899,283 |
| Vanguard Total | ||||||||
| International Stock | ||||||||
| Index Fund | 600,976 | 162,715 | 75,856 | 420 | (7,712) | 17,525 | — | 680,543 |
| Vanguard Total | ||||||||
| Stock Market | ||||||||
| Index Fund | 911,460 | 207,393 | 243,799 | 7,630 | 136,428 | 17,803 | — | 1,019,112 |
| Total | 5,030,182 | 1,299,402 | 704,815 | 7,739 | 27,989 | 136,244 | 431 | 5,659,141 |
| 1 Not applicable—purchases and sales are for temporary cash investment purposes. | ||||||||
H. Management has determined that no events or transactions occurred subsequent to September 30, 2018, that would require recognition or disclosure in these financial statements.
18
Institutional Target Retirement 2015 Fund
Fund Profile
As of September 30, 2018
| Total Fund Characteristics | |
| Ticker Symbol | VITVX |
| 30-Day SEC Yield | 2.38% |
| Acquired Fund Fees and Expenses1 | 0.09% |
| Allocation to Underlying Vanguard Funds | |
| Vanguard Total Bond Market II Index Fund | |
| Investor Shares | 33.1% |
| Vanguard Total Stock Market Index Fund | |
| Institutional Shares | 24.2 |
| Vanguard Total International Stock Index | |
| Fund Investor Shares | 16.3 |
| Vanguard Total International Bond Index | |
| Fund Admiral Shares | 14.2 |
| Vanguard Short-Term Inflation-Protected | |
| Securities Index Fund Admiral Shares | 12.2 |
Fund Asset Allocation
1 This figure—drawn from the prospectus dated January 25, 2018—represents an estimate of the weighted average of the expense ratios and any transaction fees charged by the underlying mutual funds (the ”acquired” funds) in which the Institutional Target Retirement 2015 Fund invests. The fund does not charge any expenses or fees of its own. For the fiscal year ended September 30, 2018, the acquired fund fees and expenses were 0.09%.
19
Institutional Target Retirement 2015 Fund
Performance Summary
All of the returns in this report represent past performance, which is not a guarantee of future results that may be achieved by the fund. (Current performance may be lower or higher than the performance data cited. For performance data current to the most recent month-end, visit our website at vanguard.com/performance.) Note, too, that both investment returns and principal value can fluctuate widely, so an investor’s shares, when sold, could be worth more or less than their original cost. The returns shown do not reflect taxes that a shareholder would pay on fund distributions or on the sale of fund shares.
Cumulative Performance: June 26, 2015, Through September 30, 2018
Initial Investment of $100,000,000
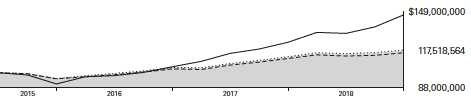
| Average Annual Total Returns | |||
| Periods Ended September 30, 2018 | |||
| Since | Final Value | ||
| One | Inception | of a $100,000,000 | |
| Year | (6/26/2015) | Investment | |
| Institutional Target Retirement 2015 | |||
| Fund* | 4.60% | 5.07% | $117,518,564 |
| • Target 2015 Composite Index | 4.77 | 5.23 | 118,096,791 |
| Mixed-Asset Target 2015 Funds | |||
| Average | 4.10 | 4.63 | 115,914,804 |
| MSCI US Broad Market Index | 17.62 | 12.34 | 146,201,479 |
For a benchmark description, see the Glossary.
Mixed-Asset Target 2015 Funds Average: Derived from data provided by Lipper, a Thomson Reuters Company.
"Since Inception" performance is calculated from the fund's inception date for both the fund and its comparative standards.
See Financial Highlights for dividend and capital gains information.
20
Institutional Target Retirement 2015 Fund
Fiscal-Year Total Returns (%): June 26, 2015, Through September 30, 2018
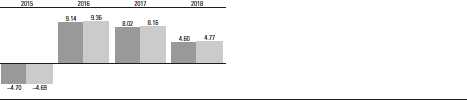
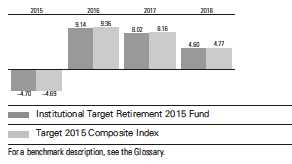
21
Institutional Target Retirement 2015 Fund
Financial Statements
Statement of Net Assets
As of September 30, 2018
The fund reports a complete list of its holdings in regulatory filings four times in each fiscal year, at the quarter-ends. For the second and fourth fiscal quarters, the lists appear in the fund’s semiannual and annual reports to shareholders. For the first and third fiscal quarters, the fund files the lists with the Securities and Exchange Commission on Form N-Q. Shareholders can look up the fund’s Forms N-Q on the SEC’s website at sec.gov. Forms N-Q may also be reviewed and copied at the SEC’s Public Reference Room (see the back cover of this report for further information).
| Market | ||
| Value• | ||
| Shares | ($000) | |
| Investment Companies (100.0%) | ||
| U.S. Stock Fund (24.2%) | ||
| Vanguard Total Stock Market Index Fund Institutional Shares | 27,381,615 | 1,994,751 |
| International Stock Fund (16.3%) | ||
| Vanguard Total International Stock Index Fund Investor Shares | 77,502,647 | 1,345,446 |
| U.S. Bond Funds (45.3%) | ||
| 1 Vanguard Total Bond Market II Index Fund Investor Shares | 264,331,653 | 2,730,546 |
| Vanguard Short-Term Inflation-Protected Securities Index Fund | ||
| Admiral Shares | 41,372,067 | 1,003,272 |
| 3,733,818 | ||
| International Bond Fund (14.2%) | ||
| Vanguard Total International Bond Index Fund Admiral Shares | 53,620,139 | 1,166,774 |
| Total Investment Companies (Cost $7,537,621) | 8,240,789 | |
| Temporary Cash Investment (0.0%) | ||
| Money Market Fund (0.0%) | ||
| 1 Vanguard Market Liquidity Fund, 2.209% (Cost $1,881) | 18,807 | 1,881 |
| Total Investments (100.0%) (Cost $7,539,502) | 8,242,670 | |
| Other Assets and Liabilities (0.0%) | ||
| Other Assets | 47,515 | |
| Liabilities | (44,013) | |
| 3,502 | ||
| Net Assets (100%) | ||
| Applicable to 368,260,384 outstanding $.001 par value shares of | ||
| beneficial interest (unlimited authorization) | 8,246,172 | |
| Net Asset Value Per Share | $22.39 |
22
| Institutional Target Retirement 2015 Fund | |
| Amount | |
| ($000) | |
| Statement of Assets and Liabilities | |
| Assets | |
| Investments in Securities, at Value—Affiliated Funds | 8,242,670 |
| Receivables for Investment Securities Sold | 35,800 |
| Receivables for Accrued Income | 7,342 |
| Receivables for Capital Shares Issued | 4,373 |
| Total Assets | 8,290,185 |
| Liabilities | |
| Payables for Investment Securities Purchased | 27,016 |
| Payables for Capital Shares Redeemed | 16,988 |
| Other Liabilities | 9 |
| Total Liabilities | 44,013 |
| Net Assets | 8,246,172 |
| At September 30, 2018, net assets consisted of: | |
| Amount | |
| ($000) | |
| Paid-in Capital | 7,361,850 |
| Undistributed Net Investment Income | 118,854 |
| Accumulated Net Realized Gains | 62,300 |
| Unrealized Appreciation (Depreciation) | 703,168 |
| Net Assets | 8,246,172 |
• See Note A in Notes to Financial Statements.
1 Affiliated fund available only to Vanguard funds and certain trusts and accounts managed by Vanguard. Rate shown for Vanguard
Market Liquidity Fund is the 7-day yield.
See accompanying Notes, which are an integral part of the Financial Statements.
23
| Institutional Target Retirement 2015 Fund | |
| Statement of Operations | |
| Year Ended | |
| September 30, 2018 | |
| ($000) | |
| Investment Income | |
| Income | |
| Income Distributions Received from Affiliated Funds | 195,779 |
| Net Investment Income—Note B | 195,779 |
| Realized Net Gain (Loss) | |
| Capital Gain Distributions Received from Affiliated Funds | 561 |
| Affiliated Funds Sold | 69,312 |
| Futures Contracts | (146) |
| Realized Net Gain (Loss) | 69,727 |
| Change in Unrealized Appreciation (Depreciation) from Affiliated Funds | 91,261 |
| Net Increase (Decrease) in Net Assets Resulting from Operations | 356,767 |
See accompanying Notes, which are an integral part of the Financial Statements.
24
Institutional Target Retirement 2015 Fund
| Statement of Changes in Net Assets | ||
| Year Ended September 30, | ||
| 2018 | 2017 | |
| ($000) | ($000) | |
| Increase (Decrease) in Net Assets | ||
| Operations | ||
| Net Investment Income | 195,779 | 141,091 |
| Realized Net Gain (Loss) | 69,727 | 8,554 |
| Change in Unrealized Appreciation (Depreciation) | 91,261 | 393,230 |
| Net Increase (Decrease) in Net Assets Resulting from Operations | 356,767 | 542,875 |
| Distributions | ||
| Net Investment Income | (158,721) | (115,625) |
| Realized Capital Gain1 | (9,936) | (3,156) |
| Total Distributions | (168,657) | (118,781) |
| Capital Share Transactions | ||
| Issued | 2,030,600 | 2,199,372 |
| Issued in Lieu of Cash Distributions | 167,397 | 118,060 |
| Redeemed | (1,754,155) | (1,150,053) |
| Net Increase (Decrease) from Capital Share Transactions | 443,842 | 1,167,379 |
| Total Increase (Decrease) | 631,952 | 1,591,473 |
| Net Assets | ||
| Beginning of Period | 7,614,220 | 6,022,747 |
| End of Period2 | 8,246,172 | 7,614,220 |
1 Includes fiscal 2018 and 2017 short-term gain distributions totaling $5,056,000 and $1,791,000, respectively. Short-term gain distributions are treated as ordinary income dividends for tax purposes.
2 Net Assets—End of Period includes undistributed (overdistributed) net investment income of $118,854,000 and $92,190,000.
See accompanying Notes, which are an integral part of the Financial Statements.
25
| Institutional Target Retirement 2015 Fund | ||||
| Financial Highlights | ||||
| June 26, | ||||
| 20151 to | ||||
| Year Ended September 30, | Sept. 30, | |||
| For a Share Outstanding Throughout Each Period | 2018 | 2017 | 2016 | 2015 |
| Net Asset Value, Beginning of Period | $21.87 | $20.64 | $19.06 | $20.00 |
| Investment Operations | ||||
| Net Investment Income | . 536 2 | .433 2 | .345 | .1242 |
| Capital Gain Distributions Received | .002 2 | .006 2 | .008 | — |
| Net Realized and Unrealized Gain (Loss) on Investments | .459 | 1.182 | 1.380 | (1.064) |
| Total from Investment Operations | .997 | 1.621 | 1.733 | (.940) |
| Distributions | ||||
| Dividends from Net Investment Income | (. 449) | (. 381) | (.152) | — |
| Distributions from Realized Capital Gains | (. 028) | (. 010) | (. 001) | — |
| Total Distributions | (. 477) | (. 391) | (.153) | — |
| Net Asset Value, End of Period | $22.39 | $21.87 | $20.64 | $19.06 |
| Total Return | 4.60% | 8.02% | 9.14% | -4.70% |
| Ratios/Supplemental Data | ||||
| Net Assets, End of Period (Millions) | $8,246 | $7,614 | $6,023 | $2,790 |
| Ratio of Total Expenses to Average Net Assets | — | — | — | — |
| Acquired Fund Fees and Expenses | 0.09% | 0.09% | 0.09% | 0.10%3 |
| Ratio of Net Investment Income to Average Net Assets | 2.42% | 2.07% | 2.04% | 2.21%3 |
| Portfolio Turnover Rate | 15% | 10% | 10% | 1% |
1 Inception.
2 Calculated based on average shares outstanding.
3 Annualized.
See accompanying Notes, which are an integral part of the Financial Statements.
26
Institutional Target Retirement 2015 Fund
Notes to Financial Statements
Vanguard Institutional Target Retirement 2015 Fund is registered under the Investment Company Act of 1940 as an open-end investment company, or mutual fund. The fund follows a balanced investment strategy by investing in selected Vanguard funds to achieve its targeted allocation of assets to U.S. and international stocks, and U.S. and international bonds. Financial statements and other information about each underlying fund are available on vanguard.com.
A. The following significant accounting policies conform to generally accepted accounting principles for U.S. investment companies. The fund consistently follows such policies in preparing its financial statements.
1. Security Valuation: Investments are valued at the net asset value of each underlying Vanguard fund determined as of the close of the New York Stock Exchange (generally 4 p.m., Eastern time) on the valuation date.
2. Futures Contracts: The fund uses stock and bond futures contracts to a limited extent, with the objectives of maintaining full exposure to the market and maintaining its target asset allocation. The primary risks associated with the use of futures contracts are imperfect correlation between changes in market values of investments held by the fund and the prices of futures contracts, and the possibility of an illiquid market. Counterparty risk involving futures is mitigated because a regulated clearinghouse is the counterparty instead of the clearing broker. To further mitigate counterparty risk, the fund trades futures contracts on an exchange, monitors the financial strength of its clearing brokers and clearinghouse, and has entered into clearing agreements with its clearing brokers. The clearinghouse imposes initial margin requirements to secure the fund’s performance and requires daily settlement of variation margin representing changes in the market value of each contract. Any assets pledged as initial margin for open contracts are noted in the Statement of Net Assets.
Futures contracts are valued at their quoted daily settlement prices. The notional amounts of the contracts are not recorded in the Statement of Net Assets. Fluctuations in the value of the contracts are recorded in the Statement of Assets and Liabilities as an asset (liability) and in the Statement of Operations as unrealized appreciation (depreciation) until the contracts are closed, when they are recorded as realized futures gains (losses).
During the year ended September 30, 2018, the fund’s average investments in long and short futures contracts represented less than 1% and 0% of net assets, respectively, based on the average of the notional amounts at each quarter-end during the period. The fund had no open futures contracts at September 30, 2018.
3. Federal Income Taxes: The fund intends to continue to qualify as a regulated investment company and distribute all of its taxable income. Management has analyzed the fund’s tax positions taken for all open federal income tax years (September 30, 2015–2018), and has concluded that no provision for federal income tax is required in the fund’s financial statements.
4. Distributions: Distributions to shareholders are recorded on the ex-dividend date. Distributions are determined on a tax basis and may differ from net investment income and realized capital gains for financial reporting purposes.
27
Institutional Target Retirement 2015 Fund
5. Credit Facility: The fund and certain other funds managed by The Vanguard Group (“Vanguard”) participate in a $3.1 billion committed credit facility provided by a syndicate of lenders pursuant to a credit agreement that may be renewed annually; each fund is individually liable for its borrowings, if any, under the credit facility. Borrowings may be utilized for temporary and emergency purposes, and are subject to the fund’s regulatory and contractual borrowing restrictions. The participating funds are charged administrative fees and an annual commitment fee of 0.10% of the undrawn amount of the facility; these fees are allocated to the funds based on a method approved by the fund’s board of trustees and borne by the funds in which the fund invests (see Note B). Any borrowings under this facility bear interest at a rate based upon the higher of the one-month London Interbank Offered Rate, federal funds effective rate, or overnight bank funding rate plus an agreed-upon spread.
The fund had no borrowings outstanding at September 30, 2018, or at any time during the period then ended.
6. Other: Income and capital gain distributions received are recorded on the ex-dividend date. Security transactions are accounted for on the date securities are bought or sold. Costs used to determine realized gains (losses) on the sale of investment securities are those of the specific securities sold.
B. In accordance with the terms of a Funds’ Service Agreement (the “FSA”) between Vanguard and the fund, Vanguard furnishes to the fund investment advisory, corporate management, administrative, marketing, and distribution services at Vanguard’s cost of operations (as defined by the FSA). These costs of operations are allocated to the fund based on methods and guidelines approved by the board of trustees. The FSA provides that expenses otherwise allocable to Vanguard funds-of-funds may be reduced or eliminated to the extent of savings realized by the underlying Vanguard funds by virtue of being part of a fund-of-funds. Accordingly, all expenses for services provided by Vanguard to the fund and all other expenses incurred by the fund during the period ended September 30, 2018, were borne by the underlying Vanguard funds in which the fund invests. The fund’s trustees and officers are also trustees and officers, respectively, of the underlying Vanguard funds, as well as directors and employees, respectively, of Vanguard.
C. Various inputs may be used to determine the value of the fund’s investments. These inputs are summarized in three broad levels for financial statement purposes. The inputs or methodologies used to value securities are not necessarily an indication of the risk associated with investing in those securities.
Level 1—Quoted prices in active markets for identical securities.
Level 2—Other significant observable inputs (including quoted prices for similar securities, interest rates, prepayment speeds, credit risk, etc.).
Level 3—Significant unobservable inputs (including the fund’s own assumptions used to determine the fair value of investments). Any investments valued with significant unobservable inputs are noted on the Statement of Net Assets.
At September 30, 2018, 100% of the market value of the fund’s investments was determined based on Level 1 inputs.
28
Institutional Target Retirement 2015 Fund
D. Permanent differences between book-basis and tax-basis components of net assets are reclassified among capital accounts in the financial statements to reflect their tax character. These reclassifications have no effect on net assets or net asset value per share. As of period end, the following permanent differences primarily attributable to the accounting for distributions in connection with fund share redemptions were reclassified to the following accounts:
| Amount | |
| ($000) | |
| Paid-in Capital | 14,052 |
| Undistributed (Overdistributed) Net Investment Income | (10,394) |
| Accumulated Net Realized Gains (Losses) | (3,658) |
Temporary differences between book-basis and tax-basis components of accumulated net earnings (losses) arise when certain items of income, gain, or loss are recognized in different periods for financial statement and tax purposes; these differences will reverse at some time in the future. The differences are primarily related to the tax deferral of losses on wash sales. As of period end, the tax-basis components of accumulated net earnings (losses) are detailed in the table as follows:
| Amount | |
| ($000) | |
| Undistributed Ordinary Income | 132,174 |
| Undistributed Long-Term Gains | 48,980 |
| Capital Loss Carryforwards (Non-expiring) | — |
| Net Unrealized Gains (Losses) | 703,168 |
As of September 30, 2018, gross unrealized appreciation and depreciation for investments and derivatives based on cost for U.S. federal income tax purposes were as follows:
| Amount | |
| ($000) | |
| Tax Cost | 7,539,502 |
| Gross Unrealized Appreciation | 819,185 |
| Gross Unrealized Depreciation | (116,017) |
| Net Unrealized Appreciation (Depreciation) | 703,168 |
E. Capital shares issued and redeemed were:
| Year Ended September 30, | ||
| 2018 | 2017 | |
| Shares | Shares | |
| (000) | (000) | |
| Issued | 91,749 | 105,356 |
| Issued in Lieu of Cash Distributions | 7,606 | 5,871 |
| Redeemed | (79,251) | (54,838) |
| Net Increase (Decrease) in Shares Outstanding | 20,104 | 56,389 |
29
Institutional Target Retirement 2015 Fund
At September 30, 2018, one shareholder was the record or beneficial owner of 33% of the fund’s net assets. If the shareholder were to redeem its investment in the fund, the redemption might lead to the realization of taxable capital gains.
| F. Transactions during the period in affiliated underlying Vanguard funds were as follows: | ||||||||
| Current Period Transactions | ||||||||
| Sept. 30, | Proceeds | Realized | Sept. 30, | |||||
| 2017 | from | Net | Change in | Capital Gain | 2018 | |||
| Market | Purchases | Securities | Gain | Unrealized | Distributions | Market | ||
| Value | at Cost | Sold | (Loss) | App. (Dep.) | Income | Received | Value | |
| ($000) | ($000) | ($000) | ($000) | ($000) | ($000) | ($000) | ($000) | |
| Vanguard Market | ||||||||
| Liquidity Fund | 1 | NA1 | NA1 | (3) | — | 19 | — | 1,881 |
| Vanguard Short-Term | ||||||||
| Inflation-Protected | ||||||||
| Securities | 835,433 | 274,525 | 86,429 | (38) | (20,219) | 29,581 | — | 1,003,272 |
| Vanguard Total | ||||||||
| Bond Market II | ||||||||
| Index Fund | 2,442,045 | 692,267 | 299,286 | — | (104,480) | 68,868 | 561 | 2,730,546 |
| Vanguard Total | ||||||||
| International Bond | ||||||||
| Index Fund | 1,018,525 | 205,213 | 56,484 | (671) | 191 | 24,518 | — | 1,166,774 |
| Vanguard Total | ||||||||
| International Stock | ||||||||
| Index Fund | 1,323,606 | 185,008 | 151,146 | 7,607 | (19,629) | 36,189 | — | 1,345,446 |
| Vanguard Total | ||||||||
| Stock Market | ||||||||
| Index Fund | 1,986,626 | 317,425 | 607,115 | 62,417 | 235,398 | 36,604 | — | 1,994,751 |
| Total | 7,606,236 | 1,674,438 | 1,200,460 | 69,312 | 91,261 | 195,779 | 561 | 8,242,670 |
1 Not applicable—purchases and sales are for temporary cash investment purposes.
G. Management has determined that no events or transactions occurred subsequent to September 30, 2018, that would require recognition or disclosure in these financial statements.
30
Institutional Target Retirement 2020 Fund
Fund Profile
As of September 30, 2018
| Total Fund Characteristics | |
| Ticker Symbol | VITWX |
| 30-Day SEC Yield | 2.34% |
| Acquired Fund Fees and Expenses1 | 0.09% |
| Allocation to Underlying Vanguard Funds | |
| Vanguard Total Stock Market Index Fund | |
| Institutional Shares | 32.4% |
| Vanguard Total Bond Market II Index Fund | |
| Investor Shares | 28.9 |
| Vanguard Total International Stock Index | |
| Fund Investor Shares | 21.2 |
| Vanguard Total International Bond Index | |
| Fund Admiral Shares | 12.3 |
| Vanguard Short-Term Inflation-Protected | |
| Securities Index Fund Admiral Shares | 5.2 |
Fund Asset Allocation
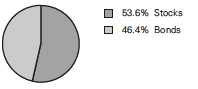
1 This figure—drawn from the prospectus dated January 25, 2018—represents an estimate of the weighted average of the expense ratios and any transaction fees charged by the underlying mutual funds (the ”acquired” funds) in which the Institutional Target Retirement 2020 Fund invests. The fund does not charge any expenses or fees of its own. For the fiscal year ended September 30, 2018, the acquired fund fees and expenses were 0.09%.
31
Institutional Target Retirement 2020 Fund
Performance Summary
All of the returns in this report represent past performance, which is not a guarantee of future results that may be achieved by the fund. (Current performance may be lower or higher than the performance data cited. For performance data current to the most recent month-end, visit our website at vanguard.com/performance.) Note, too, that both investment returns and principal value can fluctuate widely, so an investor’s shares, when sold, could be worth more or less than their original cost. The returns shown do not reflect taxes that a shareholder would pay on fund distributions or on the sale of fund shares.
Cumulative Performance: June 26, 2015, Through September 30, 2018
Initial Investment of $100,000,000
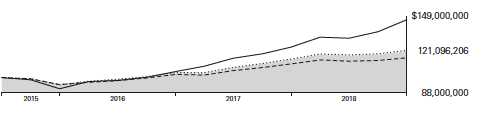
| Average Annual Total Returns | |||
| Periods Ended September 30, 2018 | |||
| Since | Final Value | ||
| One | Inception | of a $100,000,000 | |
| Year | (6/26/2015) | Investment | |
| Institutional Target Retirement 2020 | |||
| Fund* | 5.92% | 6.04% | $121,096,206 |
| Target 2020 Composite Index | 6.11 | 6.22 | 121,747,062 |
| Mixed-Asset Target 2020 Funds | |||
| Average | 4.36 | 4.58 | 115,720,559 |
| MSCI US Broad Market Index | 17.62 | 12.34 | 146,201,479 |
For a benchmark description, see the Glossary.
Mixed-Asset Target 2020 Funds Average: Derived from data provided by Lipper, a Thomson Reuters Company.
"Since Inception" performance is calculated from the fund's inception date for both the fund and its comparative standards.
See Financial Highlights for dividend and capital gains information.
32
Institutional Target Retirement 2020 Fund
Fiscal-Year Total Returns (%): June 26, 2015, Through September 30, 2018
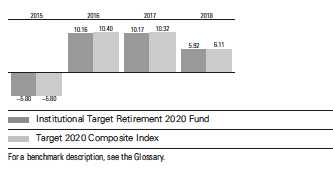
33
Institutional Target Retirement 2020 Fund
Financial Statements
Statement of Net Assets
As of September 30, 2018
The fund reports a complete list of its holdings in regulatory filings four times in each fiscal year, at the quarter-ends. For the second and fourth fiscal quarters, the lists appear in the fund’s semiannual and annual reports to shareholders. For the first and third fiscal quarters, the fund files the lists with the Securities and Exchange Commission on Form N-Q. Shareholders can look up the fund’s Forms N-Q on the SEC’s website at sec.gov. Forms N-Q may also be reviewed and copied at the SEC’s Public Reference Room (see the back cover of this report for further information).
| Market | ||
| Value• | ||
| Shares | ($000) | |
| Investment Companies (100.0%) | ||
| U.S. Stock Fund (32.4%) | ||
| Vanguard Total Stock Market Index Fund Institutional Shares | 97,119,815 | 7,075,179 |
| International Stock Fund (21.2%) | ||
| Vanguard Total International Stock Index Fund Investor Shares | 266,962,040 | 4,634,461 |
| U.S. Bond Funds (34.1%) | ||
| 1 Vanguard Total Bond Market II Index Fund Investor Shares | 610,984,041 | 6,311,465 |
| Vanguard Short-Term Inflation-Protected Securities Index Fund | ||
| Admiral Shares | 46,690,012 | 1,132,233 |
| 7,443,698 | ||
| International Bond Fund (12.3%) | ||
| Vanguard Total International Bond Index Fund Admiral Shares | 123,006,750 | 2,676,627 |
| Total Investment Companies (Cost $19,609,702) | 21,829,965 | |
| Temporary Cash Investment (0.0%) | ||
| Money Market Fund (0.0%) | ||
| 1 Vanguard Market Liquidity Fund, 2.209% (Cost $0) | 4 | — |
| Total Investments (100.0%) (Cost $19,609,702) | 21,829,965 | |
| Other Assets and Liabilities (0.0%) | ||
| Other Assets | 70,343 | |
| Liabilities | (61,338) | |
| 9,005 | ||
| Net Assets (100%) | ||
| Applicable to 946,290,045 outstanding $.001 par value shares of | ||
| beneficial interest (unlimited authorization) | 21,838,970 | |
| Net Asset Value Per Share | $23.08 |
34
| Institutional Target Retirement 2020 Fund | |
| Amount | |
| ($000) | |
| Statement of Assets and Liabilities | |
| Assets | |
| Investments in Securities, at Value—Affiliated Funds | 21,829,965 |
| Receivables for Investment Securities Sold | 33,443 |
| Receivables for Accrued Income | 16,974 |
| Receivables for Capital Shares Issued | 19,926 |
| Total Assets | 21,900,308 |
| Liabilities | |
| Payables for Investment Securities Purchased | 16,972 |
| Payables for Capital Shares Redeemed | 43,519 |
| Other Liabilities | 847 |
| Total Liabilities | 61,338 |
| Net Assets | 21,838,970 |
| At September 30, 2018, net assets consisted of: | |
| Amount | |
| ($000) | |
| Paid-in Capital | 19,291,096 |
| Undistributed Net Investment Income | 309,676 |
| Accumulated Net Realized Gains | 17,935 |
| Unrealized Appreciation (Depreciation) | 2,220,263 |
| Net Assets | 21,838,970 |
• See Note A in Notes to Financial Statements.
1 Affiliated fund available only to Vanguard funds and certain trusts and accounts managed by Vanguard. Rate shown for Vanguard
Market Liquidity Fund is the 7-day yield.
See accompanying Notes, which are an integral part of the Financial Statements.
35
| Institutional Target Retirement 2020 Fund | |
| Statement of Operations | |
| Year Ended | |
| September 30, 2018 | |
| ($000) | |
| Investment Income | |
| Income | |
| Income Distributions Received from Affiliated Funds | 469,905 |
| Net Investment Income—Note B | 469,905 |
| Realized Net Gain (Loss) | |
| Capital Gain Distributions Received from Affiliated Funds | 1,195 |
| Affiliated Funds Sold | 18,155 |
| Futures Contracts | (209) |
| Realized Net Gain (Loss) | 19,141 |
| Change in Unrealized Appreciation (Depreciation) from Affiliated Funds | 616,999 |
| Net Increase (Decrease) in Net Assets Resulting from Operations | 1,106,045 |
See accompanying Notes, which are an integral part of the Financial Statements.
36
Institutional Target Retirement 2020 Fund
Statement of Changes in Net Assets
| Year Ended September 30, | ||
| 2018 | 2017 | |
| ($000) | ($000) | |
| Increase (Decrease) in Net Assets | ||
| Operations | ||
| Net Investment Income | 469,905 | 319,507 |
| Realized Net Gain (Loss) | 19,141 | 8,581 |
| Change in Unrealized Appreciation (Depreciation) | 616,999 | 1,148,562 |
| Net Increase (Decrease) in Net Assets Resulting from Operations | 1,106,045 | 1,476,650 |
| Distributions | ||
| Net Investment Income | (371,348) | (237,390) |
| Realized Capital Gain1 | (6,294) | (5,950) |
| Total Distributions | (377,642) | (243,340) |
| Capital Share Transactions | ||
| Issued | 5,918,823 | 5,982,661 |
| Issued in Lieu of Cash Distributions | 373,108 | 241,218 |
| Redeemed | (2,768,170) | (1,483,882) |
| Net Increase (Decrease) from Capital Share Transactions | 3,523,761 | 4,739,997 |
| Total Increase (Decrease) | 4,252,164 | 5,973,307 |
| Net Assets | ||
| Beginning of Period | 17,586,806 | 11,613,499 |
| End of Period2 | 21,838,970 | 17,586,806 |
1 Includes fiscal 2018 and 2017 short-term gain distributions totaling $4,472,000 and $3,279,000, respectively. Short-term gain
distributions are treated as ordinary income dividends for tax purposes.
2 Net Assets—End of Period includes undistributed (overdistributed) net investment income of $309,676,000 and $225,478,000.
See accompanying Notes, which are an integral part of the Financial Statements.
37
| Institutional Target Retirement 2020 Fund | ||||
| Financial Highlights | ||||
| June 26, | ||||
| 20151 to | ||||
| Year Ended September 30, | Sept. 30, | |||
| For a Share Outstanding Throughout Each Period | 2018 | 2017 | 2016 | 2015 |
| Net Asset Value, Beginning of Period | $22.23 | $20.58 | $18.84 | $20.00 |
| Investment Operations | ||||
| Net Investment Income2 | .532 | .464 | .444 | .138 |
| Capital Gain Distributions Received 2 | .001 | .005 | .007 | — |
| Net Realized and Unrealized Gain (Loss) on Investments | .773 | 1.582 | 1.453 | (1.298) |
| Total from Investment Operations | 1.306 | 2.051 | 1.904 | (1.160) |
| Distributions | ||||
| Dividends from Net Investment Income | (. 448) | (. 391) | (.162) | — |
| Distributions from Realized Capital Gains | (. 008) | (. 010) | (. 002) | — |
| Total Distributions | (.456) | (.401) | (.164) | — |
| Net Asset Value, End of Period | $23.08 | $22.23 | $20.58 | $18.84 |
| Total Return | 5.92% | 10.17% | 10.16% | -5.80% |
| Ratios/Supplemental Data | ||||
| Net Assets, End of Period (Millions) | $21,839 | $17,587 | $11,613 | $4,835 |
| Ratio of Total Expenses to Average Net Assets | — | — | — | — |
| Acquired Fund Fees and Expenses | 0.09% | 0.09% | 0.10% | 0.10%3 |
| Ratio of Net Investment Income to Average Net Assets | 2.35% | 2.20% | 2.25% | 2.48%3 |
| Portfolio Turnover Rate | 8% | 6% | 5% | 2% |
1 Inception.
2 Calculated based on average shares outstanding.
3 Annualized.
See accompanying Notes, which are an integral part of the Financial Statements.
38
Institutional Target Retirement 2020 Fund
Notes to Financial Statements
Vanguard Institutional Target Retirement 2020 Fund is registered under the Investment Company Act of 1940 as an open-end investment company, or mutual fund. The fund follows a balanced investment strategy by investing in selected Vanguard funds to achieve its targeted allocation of assets to U.S. and international stocks, and U.S. and international bonds. Financial statements and other information about each underlying fund are available on vanguard.com.
A. The following significant accounting policies conform to generally accepted accounting principles for U.S. investment companies. The fund consistently follows such policies in preparing its financial statements.
1. Security Valuation: Investments are valued at the net asset value of each underlying Vanguard fund determined as of the close of the New York Stock Exchange (generally 4 p.m., Eastern time) on the valuation date.
2. Futures Contracts: The fund uses stock and bond futures contracts to a limited extent, with the objectives of maintaining full exposure to the market and maintaining its target asset allocation. The primary risks associated with the use of futures contracts are imperfect correlation between changes in market values of investments held by the fund and the prices of futures contracts, and the possibility of an illiquid market. Counterparty risk involving futures is mitigated because a regulated clearinghouse is the counterparty instead of the clearing broker. To further mitigate counterparty risk, the fund trades futures contracts on an exchange, monitors the financial strength of its clearing brokers and clearinghouse, and has entered into clearing agreements with its clearing brokers. The clearinghouse imposes initial margin requirements to secure the fund’s performance and requires daily settlement of variation margin representing changes in the market value of each contract. Any assets pledged as initial margin for open contracts are noted in the Statement of Net Assets.
Futures contracts are valued at their quoted daily settlement prices. The notional amounts of the contracts are not recorded in the Statement of Net Assets. Fluctuations in the value of the contracts are recorded in the Statement of Assets and Liabilities as an asset (liability) and in the Statement of Operations as unrealized appreciation (depreciation) until the contracts are closed, when they are recorded as realized futures gains (losses).
During the year ended September 30, 2018, the fund’s average investments in long and short futures contracts represented less than 1% and 0% of net assets, respectively, based on the average of the notional amounts at each quarter-end during the period. The fund had no open futures contracts at September 30, 2018.
3. Federal Income Taxes: The fund intends to continue to qualify as a regulated investment company and distribute all of its taxable income. Management has analyzed the fund’s tax positions taken for all open federal income tax years (September 30, 2015–2018), and has concluded that no provision for federal income tax is required in the fund’s financial statements.
4. Distributions: Distributions to shareholders are recorded on the ex-dividend date. Distributions are determined on a tax basis and may differ from net investment income and realized capital gains for financial reporting purposes.
39
Institutional Target Retirement 2020 Fund
5. Credit Facility: The fund and certain other funds managed by The Vanguard Group (“Vanguard”) participate in a $3.1 billion committed credit facility provided by a syndicate of lenders pursuant to a credit agreement that may be renewed annually; each fund is individually liable for its borrowings, if any, under the credit facility. Borrowings may be utilized for temporary and emergency purposes, and are subject to the fund’s regulatory and contractual borrowing restrictions. The participating funds are charged administrative fees and an annual commitment fee of 0.10% of the undrawn amount of the facility; these fees are allocated to the funds based on a method approved by the fund’s board of trustees and borne by the funds in which the fund invests (see Note B). Any borrowings under this facility bear interest at a rate based upon the higher of the one-month London Interbank Offered Rate, federal funds effective rate, or overnight bank funding rate plus an agreed-upon spread.
The fund had no borrowings outstanding at September 30, 2018, or at any time during the period then ended.
6. Other: Income and capital gain distributions received are recorded on the ex-dividend date. Security transactions are accounted for on the date securities are bought or sold. Costs used to determine realized gains (losses) on the sale of investment securities are those of the specific securities sold.
B. In accordance with the terms of a Funds’ Service Agreement (the “FSA”) between Vanguard and the fund, Vanguard furnishes to the fund investment advisory, corporate management, administrative, marketing, and distribution services at Vanguard’s cost of operations (as defined by the FSA). These costs of operations are allocated to the fund based on methods and guidelines approved by the board of trustees. The FSA provides that expenses otherwise allocable to Vanguard funds-of-funds may be reduced or eliminated to the extent of savings realized by the underlying Vanguard funds by virtue of being part of a fund-of-funds. Accordingly, all expenses for services provided by Vanguard to the fund and all other expenses incurred by the fund during the period ended September 30, 2018, were borne by the underlying Vanguard funds in which the fund invests. The fund’s trustees and officers are also trustees and officers, respectively, of the underlying Vanguard funds, as well as directors and employees, respectively, of Vanguard.
C. Various inputs may be used to determine the value of the fund’s investments. These inputs are summarized in three broad levels for financial statement purposes. The inputs or methodologies used to value securities are not necessarily an indication of the risk associated with investing in those securities.
Level 1—Quoted prices in active markets for identical securities.
Level 2—Other significant observable inputs (including quoted prices for similar securities, interest rates, prepayment speeds, credit risk, etc.).
Level 3—Significant unobservable inputs (including the fund’s own assumptions used to determine the fair value of investments). Any investments valued with significant unobservable inputs are noted on the Statement of Net Assets.
At September 30, 2018, 100% of the market value of the fund’s investments was determined based on Level 1 inputs.
40
Institutional Target Retirement 2020 Fund
D. Permanent differences between book-basis and tax-basis components of net assets are reclassified among capital accounts in the financial statements to reflect their tax character. These reclassifications have no effect on net assets or net asset value per share. As of period end, the following permanent differences primarily attributable to the accounting for distributions in connection with fund share redemptions were reclassified to the following accounts:
| Amount | |
| ($000) | |
| Paid-in Capital | 14,913 |
| Undistributed (Overdistributed) Net Investment Income | (14,359) |
| Accumulated Net Realized Gains (Losses) | (554) |
Temporary differences between book-basis and tax-basis components of accumulated net earnings (losses) arise when certain items of income, gain, or loss are recognized in different periods for financial statement and tax purposes; these differences will reverse at some time in the future. The differences are primarily related to the tax deferral of losses on wash sales. As of period end, the tax-basis components of accumulated net earnings (losses) are detailed in the table as follows:
| Amount | |
| ($000) | |
| Undistributed Ordinary Income | 326,584 |
| Undistributed Long-Term Gains | 1,027 |
| Capital Loss Carryforwards (Non-expiring) | — |
| Net Unrealized Gains (Losses) | 2,220,263 |
As of September 30, 2018, gross unrealized appreciation and depreciation for investments and derivatives based on cost for U.S. federal income tax purposes were as follows:
| Amount | |
| ($000) | |
| Tax Cost | 19,609,702 |
| Gross Unrealized Appreciation | 2,488,208 |
| Gross Unrealized Depreciation | (267,945) |
| Net Unrealized Appreciation (Depreciation) | 2,220,263 |
E. Capital shares issued and redeemed were:
| Year Ended September 30, | ||
| 2018 | 2017 | |
| Shares | Shares | |
| (000) | (000) | |
| Issued | 260,732 | 284,709 |
| Issued in Lieu of Cash Distributions | 16,538 | 11,995 |
| Redeemed | (122,044) | (69,990) |
| Net Increase (Decrease) in Shares Outstanding | 155,226 | 226,714 |
41
Institutional Target Retirement 2020 Fund
At September 30, 2018, one shareholder was the record or beneficial owner of 38% of the fund’s net assets. If the shareholder were to redeem its investment in the fund, the redemption might lead to the realization of taxable capital gains.
| F. Transactions during the period in affiliated underlying Vanguard funds were as follows: | ||||||||
| Current Period Transactions | ||||||||
| Sept. 30, | Proceeds | Realized | Sept. 30, | |||||
| 2017 | from | Net | Change in | Capital Gain | 2018 | |||
| Market | Purchases | Securities | Gain | Unrealized | Distributions | Market | ||
| Value | at Cost | Sold | (Loss) | App. (Dep.) | Income | Received | Value | |
| ($000) | ($000) | ($000) | ($000) | ($000) | ($000) | ($000) | ($000) | |
| Vanguard Market | ||||||||
| Liquidity Fund | 973 | NA1 | NA1 | 1 | — | 18 | — | — |
| Vanguard Short-Term | ||||||||
| Inflation-Protected | ||||||||
| Securities Index | ||||||||
| Fund | 669,958 | 526,585 | 44,241 | — | (20,069) | 29,276 | — | 1,132,233 |
| Vanguard Total | ||||||||
| Bond Market II | ||||||||
| Index Fund | 5,065,910 | 2,082,607 | 606,535 | 715 | (231,232) | 151,348 | 1,195 | 6,311,465 |
| Vanguard Total | ||||||||
| International Bond | ||||||||
| Index Fund | 2,129,764 | 588,883 | 40,557 | — | (1,463) | 52,907 | — | 2,676,627 |
| Vanguard Total | ||||||||
| International Stock | ||||||||
| Index Fund | 3,862,091 | 946,554 | 113,008 | 906 | (62,082) | 116,622 | — | 4,634,461 |
| Vanguard Total | ||||||||
| Stock Market | ||||||||
| Index Fund | 5,851,427 | 1,109,743 | 834,369 | 16,533 | 931,845 | 119,734 | — | 7,075,179 |
| Total | 17,580,123 | 5,254,372 | 1,638,710 | 18,155 | 616,999 | 469,905 | 1,195 | 21,829,965 |
| 1 Not applicable—purchases and sales are for temporary cash investment purposes. | ||||||||
G. Management has determined that no events or transactions occurred subsequent to September 30, 2018, that would require recognition or disclosure in these financial statements.
42
Institutional Target Retirement 2025 Fund
Fund Profile
As of September 30, 2018
| Total Fund Characteristics | |
| Ticker Symbol | VRIVX |
| 30-Day SEC Yield | 2.28% |
| Acquired Fund Fees and Expenses1 | 0.09% |
| Allocation to Underlying Vanguard Funds | |
| Vanguard Total Stock Market Index Fund | |
| Institutional Shares | 37.8% |
| Vanguard Total Bond Market II Index Fund | |
| Investor Shares | 26.2 |
| Vanguard Total International Stock Index | |
| Fund Investor Shares | 25.0 |
| Vanguard Total International Bond Index | |
| Fund Admiral Shares | 11.0 |
Fund Asset Allocation
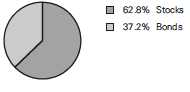
1 This figure—drawn from the prospectus dated January 25, 2018—represents an estimate of the weighted average of the expense ratios and any transaction fees charged by the underlying mutual funds (the ”acquired” funds) in which the Institutional Target Retirement 2025 Fund invests. The fund does not charge any expenses or fees of its own. For the fiscal year ended September 30, 2018, the acquired fund fees and expenses were 0.09%.
43
Institutional Target Retirement 2025 Fund
Performance Summary
All of the returns in this report represent past performance, which is not a guarantee of future results that may be achieved by the fund. (Current performance may be lower or higher than the performance data cited. For performance data current to the most recent month-end, visit our website at vanguard.com/performance.) Note, too, that both investment returns and principal value can fluctuate widely, so an investor’s shares, when sold, could be worth more or less than their original cost. The returns shown do not reflect taxes that a shareholder would pay on fund distributions or on the sale of fund shares.
Cumulative Performance: June 26, 2015, Through September 30, 2018
Initial Investment of $100,000,000
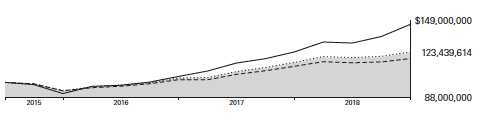
| Average Annual Total Returns | |||
| Periods Ended September 30, 2018 | |||
| Since | Final Value | ||
| One | Inception | of a $100,000,000 | |
| Year | (6/26/2015) | Investment | |
| Institutional Target Retirement 2025 | |||
| Fund* | 6.85% | 6.67% | $123,439,614 |
| Target 2025 Composite Index | 7.08 | 6.84 | 124,111,276 |
| Mixed-Asset Target 2025 Funds | |||
| Average | 5.46 | 5.47 | 118,976,213 |
| MSCI US Broad Market Index | 17.62 | 12.34 | 146,201,479 |
Mixed-Asset Target 2025 Funds Average: Derived from data provided by Lipper, a Thomson Reuters Company.
"Since Inception" performance is calculated from the fund's inception date for both the fund and its comparative standards.
See Financial Highlights for dividend and capital gains information.
44
Institutional Target Retirement 2025 Fund
Fiscal-Year Total Returns (%): June 26, 2015, Through September 30, 2018
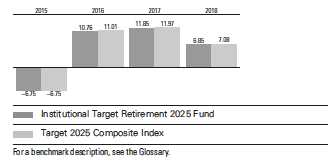

Institutional Target Retirement 2025 Fund
Financial Statements
Statement of Net Assets
As of September 30, 2018
The fund reports a complete list of its holdings in regulatory filings four times in each fiscal year, at the quarter-ends. For the second and fourth fiscal quarters, the lists appear in the fund’s semiannual and annual reports to shareholders. For the first and third fiscal quarters, the fund files the lists with the Securities and Exchange Commission on Form N-Q. Shareholders can look up the fund’s Forms N-Q on the SEC’s website at sec.gov. Forms N-Q may also be reviewed and copied at the SEC’s Public Reference Room (see the back cover of this report for further information).
| Market | ||
| Value• | ||
| Shares | ($000) | |
| Investment Companies (99.9%) | ||
| U.S. Stock Fund (37.7%) | ||
| Vanguard Total Stock Market Index Fund Institutional Shares | 145,406,360 | 10,592,853 |
| International Stock Fund (25.0%) | ||
| Vanguard Total International Stock Index Fund Investor Shares | 403,450,148 | 7,003,894 |
| U.S. Bond Fund (26.2%) | ||
| 1 Vanguard Total Bond Market II Index Fund Investor Shares | 712,500,269 | 7,360,128 |
| International Bond Fund (11.0%) | ||
| Vanguard Total International Bond Index Fund Admiral Shares | 141,738,273 | 3,084,225 |
| Total Investment Companies (Cost $24,856,313) | 28,041,100 | |
| Temporary Cash Investment (0.0%) | ||
| Money Market Fund (0.0%) | ||
| 1 Vanguard Market Liquidity Fund, 2.209% (Cost $5) | 47 | 5 |
| Total Investments (99.9%) (Cost $24,856,318) | 28,041,105 | |
| Other Assets and Liabilities (0.1%) | ||
| Other Assets | 110,584 | |
| Liabilities | (93,195) | |
| 17,389 | ||
| Net Assets (100%) | ||
| Applicable to 1,192,537,433 outstanding $.001 par value shares of | ||
| beneficial interest (unlimited authorization) | 28,058,494 | |
| Net Asset Value Per Share | $23.53 |
46
| Institutional Target Retirement 2025 Fund | |
| Amount | |
| ($000) | |
| Statement of Assets and Liabilities | |
| Assets | |
| Investments in Securities, at Value—Affiliated Funds | 28,041,105 |
| Receivables for Investment Securities Sold | 58,577 |
| Receivables for Accrued Income | 19,647 |
| Receivables for Capital Shares Issued | 32,360 |
| Total Assets | 28,151,689 |
| Liabilities | |
| Payables for Investment Securities Purchased | 19,644 |
| Payables for Capital Shares Redeemed | 67,815 |
| Other Liabilities | 5,736 |
| Total Liabilities | 93,195 |
| Net Assets | 28,058,494 |
| At September 30, 2018, net assets consisted of: | |
| Amount | |
| ($000) | |
| Paid-in Capital | 24,468,341 |
| Undistributed Net Investment Income | 390,798 |
| Accumulated Net Realized Gains | 14,568 |
| Unrealized Appreciation (Depreciation) | 3,184,787 |
| Net Assets | 28,058,494 |
• See Note A in Notes to Financial Statements.
1 Affiliated fund available only to Vanguard funds and certain trusts and accounts managed by Vanguard. Rate shown for Vanguard
Market Liquidity Fund is the 7-day yield.
See accompanying Notes, which are an integral part of the Financial Statements.
47
| Institutional Target Retirement 2025 Fund | |
| Statement of Operations | |
| Year Ended | |
| September 30, 2018 | |
| ($000) | |
| Investment Income | |
| Income | |
| Income Distributions Received from Affiliated Funds | 578,823 |
| Net Investment Income—Note B | 578,823 |
| Realized Net Gain (Loss) | |
| Capital Gain Distributions Received from Affiliated Funds | 1,317 |
| Affiliated Funds Sold | 15,209 |
| Futures Contracts | (288) |
| Realized Net Gain (Loss) | 16,238 |
| Change in Unrealized Appreciation (Depreciation) from Affiliated Funds | 1,005,931 |
| Net Increase (Decrease) in Net Assets Resulting from Operations | 1,600,992 |
See accompanying Notes, which are an integral part of the Financial Statements.
48
Institutional Target Retirement 2025 Fund
Statement of Changes in Net Assets
| Year Ended September 30, | ||
| 2018 | 2017 | |
| ($000) | ($000) | |
| Increase (Decrease) in Net Assets | ||
| Operations | ||
| Net Investment Income | 578,823 | 396,751 |
| Realized Net Gain (Loss) | 16,238 | 6,068 |
| Change in Unrealized Appreciation (Depreciation) | 1,005,931 | 1,638,559 |
| Net Increase (Decrease) in Net Assets Resulting from Operations | 1,600,992 | 2,041,378 |
| Distributions | ||
| Net Investment Income | (458,573) | (282,158) |
| Realized Capital Gain1 | (4,467) | (5,974) |
| Total Distributions | (463,040) | (288,132) |
| Capital Share Transactions | ||
| Issued | 7,898,313 | 7,171,272 |
| Issued in Lieu of Cash Distributions | 456,899 | 284,805 |
| Redeemed | (3,044,748) | (1,225,661) |
| Net Increase (Decrease) from Capital Share Transactions | 5,310,464 | 6,230,416 |
| Total Increase (Decrease) | 6,448,416 | 7,983,662 |
| Net Assets | ||
| Beginning of Period | 21,610,078 | 13,626,416 |
| End of Period2 | 28,058,494 | 21,610,078 |
1 Includes fiscal 2018 and 2017 short-term gain distributions totaling $3,350,000 and $3,311,000, respectively. Short-term gain distributions are treated as ordinary income dividends for tax purposes.
2 Net Assets—End of Period includes undistributed (overdistributed) net investment income of $390,798,000 and $287,626,000.
See accompanying Notes, which are an integral part of the Financial Statements.
49
| Institutional Target Retirement 2025 Fund | ||||
| Financial Highlights | ||||
| June 26, | ||||
| 20151 to | ||||
| Year Ended September 30, | Sept. 30, | |||
| For a Share Outstanding Throughout Each Period | 2018 | 2017 | 2016 | 2015 |
| Net Asset Value, Beginning of Period | $22.46 | $20.48 | $18.65 | $20.00 |
| Investment Operations | ||||
| Net Investment Income2 | .528 | .480 | .452 | .140 |
| Capital Gain Distributions Received 2 | .001 | .005 | .006 | — |
| Net Realized and Unrealized Gain (Loss) on Investments | .997 | 1.895 | 1.538 | (1.490) |
| Total from Investment Operations | 1.526 | 2.380 | 1.996 | (1.350) |
| Distributions | ||||
| Dividends from Net Investment Income | (. 452) | (. 392) | (.165) | — |
| Distributions from Realized Capital Gains | (. 004) | (. 008) | (. 001) | — |
| Total Distributions | (.456) | (.400) | (.166) | — |
| Net Asset Value, End of Period | $23.53 | $22.46 | $20.48 | $18.65 |
| Total Return | 6.85% | 11.85% | 10.76% | -6.75% |
| Ratios/Supplemental Data | ||||
| Net Assets, End of Period (Millions) | $28,058 | $21,610 | $13,626 | $5,362 |
| Ratio of Total Expenses to Average Net Assets | — | — | — | — |
| Acquired Fund Fees and Expenses | 0.09% | 0.09% | 0.10% | 0.10%3 |
| Ratio of Net Investment Income to Average Net Assets | 2.29% | 2.27% | 2.30% | 2.52%3 |
| Portfolio Turnover Rate | 9% | 4% | 4% | 1% |
1 Inception.
2 Calculated based on average shares outstanding.
3 Annualized.
See accompanying Notes, which are an integral part of the Financial Statements.
50
Institutional Target Retirement 2025 Fund
Notes to Financial Statements
Vanguard Institutional Target Retirement 2025 Fund is registered under the Investment Company Act of 1940 as an open-end investment company, or mutual fund. The fund follows a balanced investment strategy by investing in selected Vanguard funds to achieve its targeted allocation of assets to U.S. and international stocks, and U.S. and international bonds. Financial statements and other information about each underlying fund are available on vanguard.com.
A. The following significant accounting policies conform to generally accepted accounting principles for U.S. investment companies. The fund consistently follows such policies in preparing its financial statements.
1. Security Valuation: Investments are valued at the net asset value of each underlying Vanguard fund determined as of the close of the New York Stock Exchange (generally 4 p.m., Eastern time) on the valuation date.
2. Futures Contracts: The fund uses stock and bond futures contracts to a limited extent, with the objectives of maintaining full exposure to the market and maintaining its target asset allocation. The primary risks associated with the use of futures contracts are imperfect correlation between changes in market values of investments held by the fund and the prices of futures contracts, and the possibility of an illiquid market. Counterparty risk involving futures is mitigated because a regulated clearinghouse is the counterparty instead of the clearing broker. To further mitigate counterparty risk, the fund trades futures contracts on an exchange, monitors the financial strength of its clearing brokers and clearinghouse, and has entered into clearing agreements with its clearing brokers. The clearinghouse imposes initial margin requirements to secure the fund’s performance and requires daily settlement of variation margin representing changes in the market value of each contract. Any assets pledged as initial margin for open contracts are noted in the Statement of Net Assets.
Futures contracts are valued at their quoted daily settlement prices. The notional amounts of the contracts are not recorded in the Statement of Net Assets. Fluctuations in the value of the contracts are recorded in the Statement of Assets and Liabilities as an asset (liability) and in the Statement of Operations as unrealized appreciation (depreciation) until the contracts are closed, when they are recorded as realized futures gains (losses).
During the year ended September 30, 2018, the fund’s average investments in long and short futures contracts represented less than 1% and 0% of net assets, respectively, based on the average of the notional amounts at each quarter-end during the period. The fund had no open futures contracts at September 30, 2018.
3. Federal Income Taxes: The fund intends to continue to qualify as a regulated investment company and distribute all of its taxable income. Management has analyzed the fund’s tax positions taken for all open federal income tax years (September 30, 2015–2018), and has concluded that no provision for federal income tax is required in the fund’s financial statements.
4. Distributions: Distributions to shareholders are recorded on the ex-dividend date. Distributions are determined on a tax basis and may differ from net investment income and realized capital gains for financial reporting purposes.
51
Institutional Target Retirement 2025 Fund
5. Credit Facility: The fund and certain other funds managed by The Vanguard Group (“Vanguard”) participate in a $3.1 billion committed credit facility provided by a syndicate of lenders pursuant to a credit agreement that may be renewed annually; each fund is individually liable for its borrowings, if any, under the credit facility. Borrowings may be utilized for temporary and emergency purposes, and are subject to the fund’s regulatory and contractual borrowing restrictions. The participating funds are charged administrative fees and an annual commitment fee of 0.10% of the undrawn amount of the facility; these fees are allocated to the funds based on a method approved by the fund’s board of trustees and borne by the funds in which the fund invests (see Note B). Any borrowings under this facility bear interest at a rate based upon the higher of the one-month London Interbank Offered Rate, federal funds effective rate, or overnight bank funding rate plus an agreed-upon spread.
The fund had no borrowings outstanding at September 30, 2018, or at any time during the period then ended.
6. Other: Income and capital gain distributions received are recorded on the ex-dividend date. Security transactions are accounted for on the date securities are bought or sold. Costs used to determine realized gains (losses) on the sale of investment securities are those of the specific securities sold.
B. In accordance with the terms of a Funds’ Service Agreement (the “FSA”) between Vanguard and the fund, Vanguard furnishes to the fund investment advisory, corporate management, administrative, marketing, and distribution services at Vanguard’s cost of operations (as defined by the FSA). These costs of operations are allocated to the fund based on methods and guidelines approved by the board of trustees. The FSA provides that expenses otherwise allocable to Vanguard funds-of-funds may be reduced or eliminated to the extent of savings realized by the underlying Vanguard funds by virtue of being part of a fund-of-funds. Accordingly, all expenses for services provided by Vanguard to the fund and all other expenses incurred by the fund during the period ended September 30, 2018, were borne by the underlying Vanguard funds in which the fund invests. The fund’s trustees and officers are also trustees and officers, respectively, of the underlying Vanguard funds, as well as directors and employees, respectively, of Vanguard.
C. Various inputs may be used to determine the value of the fund’s investments. These inputs are summarized in three broad levels for financial statement purposes. The inputs or methodologies used to value securities are not necessarily an indication of the risk associated with investing in those securities.
Level 1—Quoted prices in active markets for identical securities.
Level 2—Other significant observable inputs (including quoted prices for similar securities, interest rates, prepayment speeds, credit risk, etc.).
Level 3—Significant unobservable inputs (including the fund’s own assumptions used to determine the fair value of investments). Any investments valued with significant unobservable inputs are noted on the Statement of Net Assets.
At September 30, 2018, 100% of the market value of the fund’s investments was determined based on Level 1 inputs.
52
Institutional Target Retirement 2025 Fund
D. Permanent differences between book-basis and tax-basis components of net assets are reclassified among capital accounts in the financial statements to reflect their tax character. These reclassifications have no effect on net assets or net asset value per share. As of period end, the following permanent differences primarily attributable to the accounting for distributions in connection with fund share redemptions were reclassified to the following accounts:
| Amount | |
| ($000) | |
| Paid-in Capital | 17,511 |
| Undistributed (Overdistributed) Net Investment Income | (17,078) |
| Accumulated Net Realized Gains (Losses) | (433) |
Temporary differences between book-basis and tax-basis components of accumulated net earnings (losses) arise when certain items of income, gain, or loss are recognized in different periods for financial statement and tax purposes; these differences will reverse at some time in the future. The differences are primarily related to the tax deferral of losses on wash sales. As of period end, the tax-basis components of accumulated net earnings (losses) are detailed in the table as follows:
| Amount | |
| ($000) | |
| Undistributed Ordinary Income | 404,255 |
| Undistributed Long-Term Gains | 1,111 |
| Capital Loss Carryforwards (Non-expiring) | — |
| Net Unrealized Gains (Losses) | 3,184,787 |
As of September 30, 2018, gross unrealized appreciation and depreciation for investments and derivatives based on cost for U.S. federal income tax purposes were as follows:
| Amount | ||
| ($000) | ||
| Tax Cost | 24,856,318 | |
| Gross Unrealized Appreciation | 3,493,957 | |
| Gross Unrealized Depreciation | (309,170) | |
| Net Unrealized Appreciation (Depreciation) | 3,184,787 | |
| E. Capital shares issued and redeemed were: | ||
| Year Ended September 30, | ||
| 2018 | 2017 | |
| Shares | Shares | |
| (000) | (000) | |
| Issued | 342,345 | 340,218 |
| Issued in Lieu of Cash Distributions | 19,952 | 14,184 |
| Redeemed | (132,010) | (57,419) |
| Net Increase (Decrease) in Shares Outstanding | 230,287 | 296,983 |
53
Institutional Target Retirement 2025 Fund
At September 30, 2018, one shareholder was the record or beneficial owner of 34% of the fund’s net assets. If the shareholder were to redeem its investment in the fund, the redemption might lead to the realization of taxable capital gains.
| F. Transactions during the period in affiliated underlying Vanguard funds were as follows: | ||||||||
| Current Period Transactions | ||||||||
| Sept. 30, | Proceeds | Realized | Sept. 30, | |||||
| 2017 | from | Net | Change in | Capital Gain | 2018 | |||
| Market | Purchases | Securities | Gain | Unrealized | Distributions | Market | ||
| Value | at Cost | Sold | (Loss) | App. (Dep.) | Income | Received | Value | |
| ($000) | ($000) | ($000) | ($000) | ($000) | ($000) | ($000) | ($000) | |
| Vanguard Market | ||||||||
| Liquidity Fund | 4,152 | NA1 | NA1 | 6 | — | 47 | — | 5 |
| Vanguard Total | ||||||||
| Bond Market II | ||||||||
| Index Fund | 5,490,573 | 3,163,567 | 1,034,798 | 1,270 | (260,484) | 171,455 | 1,317 | 7,360,128 |
| Vanguard Total | ||||||||
| International Bond | ||||||||
| Index Fund | 2,275,281 | 828,108 | 17,908 | — | (1,256) | 58,436 | — | 3,084,225 |
| Vanguard Total | ||||||||
| International Stock | ||||||||
| Index Fund | 5,485,573 | 1,713,013 | 88,660 | 881 | (106,913) | 172,539 | — | 7,003,894 |
| Vanguard Total | ||||||||
| Stock Market | ||||||||
| Index Fund | 8,350,447 | 1,892,412 | 1,037,642 | 13,052 | 1,374,584 | 176,346 | — | 10,592,853 |
| Total | 21,606,026 | 7,597,100 | 2,179,008 | 15,209 | 1,005,931 | 578,823 | 1,317 | 28,041,105 |
| 1 Not applicable—purchases and sales are for temporary cash investment purposes. | ||||||||
G. Management has determined that no events or transactions occurred subsequent to September 30, 2018, that would require recognition or disclosure in these financial statements.
54
Institutional Target Retirement 2030 Fund
Fund Profile
As of September 30, 2018
| Total Fund Characteristics | |
| Ticker Symbol | VTTWX |
| 30-Day SEC Yield | 2.28% |
| Acquired Fund Fees and Expenses1 | 0.09% |
| Allocation to Underlying Vanguard Funds | |
| Vanguard Total Stock Market Index Fund | |
| Institutional Shares | 42.3% |
| Vanguard Total International Stock Index | |
| Fund Investor Shares | 27.9 |
| Vanguard Total Bond Market II Index Fund | |
| Investor Shares | 21.1 |
| Vanguard Total International Bond Index | |
| Fund Admiral Shares | 8.7 |
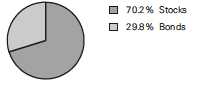
1 This figure—drawn from the prospectus dated January 25, 2018—represents an estimate of the weighted average of the expense ratios and any transaction fees charged by the underlying mutual funds (the ”acquired” funds) in which the Institutional Target Retirement 2030 Fund invests. The fund does not charge any expenses or fees of its own. For the fiscal year ended September 30, 2018, the acquired fund fees and expenses were 0.09%.
55
Institutional Target Retirement 2030 Fund
Performance Summary
All of the returns in this report represent past performance, which is not a guarantee of future results that may be achieved by the fund. (Current performance may be lower or higher than the performance data cited. For performance data current to the most recent month-end, visit our website at vanguard.com/performance.) Note, too, that both investment returns and principal value can fluctuate widely, so an investor’s shares, when sold, could be worth more or less than their original cost. The returns shown do not reflect taxes that a shareholder would pay on fund distributions or on the sale of fund shares.
Cumulative Performance: June 26, 2015, Through September 30, 2018
Initial Investment of $100,000,000
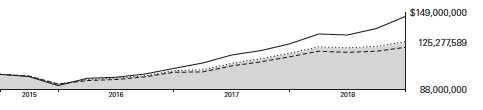
| Average Annual Total Returns | |||
| Periods Ended September 30, 2018 | |||
| Since | Final Value | ||
| One | Inception | of a $100,000,000 | |
| Year | (6/26/2015) | Investment | |
| Institutional Target Retirement 2030 | |||
| Fund* | 7.73% | 7.15% | $125,277,589 |
| Target 2030 Composite Index | 7.94 | 7.36 | 126,067,121 |
| Mixed-Asset Target 2030 Funds | |||
| Average | 6.64 | 6.16 | 121,541,117 |
| MSCI US Broad Market Index | 17.62 | 12.34 | 146,201,479 |
Mixed-Asset Target 2030 Funds Average: Derived from data provided by Lipper, a Thomson Reuters Company.
"Since Inception" performance is calculated from the fund's inception date for both the fund and its comparative standards
See Financial Highlights for dividend and capital gains information.
56
Institutional Target Retirement 2030 Fund
Fiscal-Year Total Returns (%): June 26, 2015, Through September 30, 2018
Institutional Target Retirement 2030 Fund
Financial Statements
Statement of Net Assets
As of September 30, 2018
The fund reports a complete list of its holdings in regulatory filings four times in each fiscal year, at the quarter-ends. For the second and fourth fiscal quarters, the lists appear in the fund’s semiannual and annual reports to shareholders. For the first and third fiscal quarters, the fund files the lists with the Securities and Exchange Commission on Form N-Q. Shareholders can look up the fund’s Forms N-Q on the SEC’s website at sec.gov. Forms N-Q may also be reviewed and copied at the SEC’s Public Reference Room (see the back cover of this report for further information).
| Market | ||
| Value• | ||
| Shares | ($000) | |
| Investment Companies (99.9%) | ||
| U.S. Stock Fund (42.2%) | ||
| Vanguard Total Stock Market Index Fund Institutional Shares | 149,496,891 | 10,890,848 |
| International Stock Fund (27.9%) | ||
| Vanguard Total International Stock Index Fund Investor Shares | 415,149,229 | 7,206,991 |
| U.S. Bond Fund (21.1%) | ||
| 1 Vanguard Total Bond Market II Index Fund Investor Shares | 527,086,335 | 5,444,802 |
| International Bond Fund (8.7%) | ||
| Vanguard Total International Bond Index Fund Admiral Shares | 103,631,665 | 2,255,025 |
| Total Investment Companies (Cost $22,614,961) | 25,797,666 | |
| Temporary Cash Investment (0.0%) | ||
| Money Market Fund (0.0%) | ||
| 1 Vanguard Market Liquidity Fund, 2.209% (Cost $1,144) | 11,444 | 1,144 |
| Total Investments (99.9%) (Cost $22,616,105) | 25,798,810 | |
| Other Assets and Liabilities (0.1%) | ||
| Other Assets | 101,984 | |
| Liabilities | (81,777) | |
| 20,207 | ||
| Net Assets (100%) | ||
| Applicable to 1,080,787,186 outstanding $.001 par value shares of | ||
| beneficial interest (unlimited authorization) | 25,819,017 | |
| Net Asset Value Per Share | $23.89 |
58
| Institutional Target Retirement 2030 Fund | |
| Amount | |
| ($000) | |
| Statement of Assets and Liabilities | |
| Assets | |
| Investments in Securities, at Value—Affiliated Funds | 25,798,810 |
| Receivables for Investment Securities Sold | 52,051 |
| Receivables for Accrued Income | 14,575 |
| Receivables for Capital Shares Issued | 35,358 |
| Total Assets | 25,900,794 |
| Liabilities | |
| Payables for Investment Securities Purchased | 14,505 |
| Payables for Capital Shares Redeemed | 67,272 |
| Total Liabilities | 81,777 |
| Net Assets | 25,819,017 |
| At September 30, 2018, net assets consisted of: | |
| Amount | |
| ($000) | |
| Paid-in Capital | 22,264,847 |
| Undistributed Net Investment Income | 368,241 |
| Accumulated Net Realized Gains | 3,224 |
| Unrealized Appreciation (Depreciation) | 3,182,705 |
| Net Assets | 25,819,017 |
• See Note A in Notes to Financial Statements.
1 Affiliated money market fund available only to Vanguard funds and certain trusts and accounts managed by Vanguard. Rate shown
is the 7-day yield.
See accompanying Notes, which are an integral part of the Financial Statements.
59
| Institutional Target Retirement 2030 Fund | |
| Statement of Operations | |
| Year Ended | |
| September 30, 2018 | |
| ($000) | |
| Investment Income | |
| Income | |
| Income Distributions Received from Affiliated Funds | 518,198 |
| Other Income | 68 |
| Net Investment Income—Note B | 518,266 |
| Realized Net Gain (Loss) | |
| Capital Gain Distributions Received from Affiliated Funds | 925 |
| Affiliated Funds Sold | 2,652 |
| Futures Contracts | (409) |
| Realized Net Gain (Loss) | 3,168 |
| Change in Unrealized Appreciation (Depreciation) from Affiliated Funds | 1,088,192 |
| Net Increase (Decrease) in Net Assets Resulting from Operations | 1,609,626 |
See accompanying Notes, which are an integral part of the Financial Statements.
60
Institutional Target Retirement 2030 Fund
Statement of Changes in Net Assets
| Year Ended September 30, | ||
| 2018 | 2017 | |
| ($000) | ($000) | |
| Increase (Decrease) in Net Assets | ||
| Operations | ||
| Net Investment Income | 518,266 | 345,722 |
| Realized Net Gain (Loss) | 3,168 | 4,897 |
| Change in Unrealized Appreciation (Depreciation) | 1,088,192 | 1,616,456 |
| Net Increase (Decrease) in Net Assets Resulting from Operations | 1,609,626 | 1,967,075 |
| Distributions | ||
| Net Investment Income | (402,466) | (241,723) |
| Realized Capital Gain1 | (2,865) | (3,875) |
| Total Distributions | (405,331) | (245,598) |
| Capital Share Transactions | ||
| Issued | 7,621,180 | 6,851,346 |
| Issued in Lieu of Cash Distributions | 399,201 | 243,168 |
| Redeemed | (2,547,464) | (1,159,952) |
| Net Increase (Decrease) from Capital Share Transactions | 5,472,917 | 5,934,562 |
| Total Increase (Decrease) | 6,677,212 | 7,656,039 |
| Net Assets | ||
| Beginning of Period | 19,141,805 | 11,485,766 |
| End of Period2 | 25,819,017 | 19,141,805 |
1 Includes fiscal 2018 and 2017 short-term gain distributions totaling $2,148,000 and $2,153,000, respectively. Short-term gain
distributions are treated as ordinary income dividends for tax purposes.
2 Net Assets—End of Period includes undistributed (overdistributed) net investment income of $368,241,000 and $252,441,000.
See accompanying Notes, which are an integral part of the Financial Statements.
61
| Institutional Target Retirement 2030 Fund | ||||
| Financial Highlights | ||||
| June 26, | ||||
| 20151 to | ||||
| Year Ended September 30, | Sept. 30, | |||
| For a Share Outstanding Throughout Each Period | 2018 | 2017 | 2016 | 2015 |
| Net Asset Value, Beginning of Period | $22.61 | $20.36 | $18.45 | $20.00 |
| Investment Operations | ||||
| Net Investment Income2 | .531 | .485 | .455 | .145 |
| Capital Gain Distributions Received 2 | .001 | .004 | .004 | — |
| Net Realized and Unrealized Gain (Loss) on Investments | 1.201 | 2.160 | 1.615 | (1.695) |
| Total from Investment Operations | 1.733 | 2.649 | 2.074 | (1.550) |
| Distributions | ||||
| Dividends from Net Investment Income | (. 450) | (. 393) | (.163) | — |
| Distributions from Realized Capital Gains | (. 003) | (. 006) | (. 001) | — |
| Total Distributions | (. 453) | (. 399) | (.164) | — |
| Net Asset Value, End of Period | $23.89 | $22.61 | $20.36 | $18.45 |
| Total Return | 7.73% | 13.27% | 11.30% | -7.75% |
| Ratios/Supplemental Data | ||||
| Net Assets, End of Period (Millions) | $25,819 | $19,142 | $11,486 | $4,431 |
| Ratio of Total Expenses to Average Net Assets | — | — | — | — |
| Acquired Fund Fees and Expenses | 0.09% | 0.09% | 0.10% | 0.10%3 |
| Ratio of Net Investment Income to Average Net Assets | 2.27% | 2.29% | 2.34% | 2.64%3 |
| Portfolio Turnover Rate | 7% | 4% | 3% | 1% |
1 Inception.
2 Calculated based on average shares outstanding.
3 Annualized.
See accompanying Notes, which are an integral part of the Financial Statements.
62
Institutional Target Retirement 2030 Fund
Notes to Financial Statements
Vanguard Institutional Target Retirement 2030 Fund is registered under the Investment Company Act of 1940 as an open-end investment company, or mutual fund. The fund follows a balanced investment strategy by investing in selected Vanguard funds to achieve its targeted allocation of assets to U.S. and international stocks, and U.S. and international bonds. Financial statements and other information about each underlying fund are available on vanguard.com.
A. The following significant accounting policies conform to generally accepted accounting principles for U.S. investment companies. The fund consistently follows such policies in preparing its financial statements.
1. Security Valuation: Investments are valued at the net asset value of each underlying Vanguard fund determined as of the close of the New York Stock Exchange (generally 4 p.m., Eastern time) on the valuation date.
2. Futures Contracts: The fund uses stock and bond futures contracts to a limited extent, with the objectives of maintaining full exposure to the market and maintaining its target asset allocation. The primary risks associated with the use of futures contracts are imperfect correlation between changes in market values of investments held by the fund and the prices of futures contracts, and the possibility of an illiquid market. Counterparty risk involving futures is mitigated because a regulated clearinghouse is the counterparty instead of the clearing broker. To further mitigate counterparty risk, the fund trades futures contracts on an exchange, monitors the financial strength of its clearing brokers and clearinghouse, and has entered into clearing agreements with its clearing brokers. The clearinghouse imposes initial margin requirements to secure the fund’s performance and requires daily settlement of variation margin representing changes in the market value of each contract. Any assets pledged as initial margin for open contracts are noted in the Statement of Net Assets.
Futures contracts are valued at their quoted daily settlement prices. The notional amounts of the contracts are not recorded in the Statement of Net Assets. Fluctuations in the value of the contracts are recorded in the Statement of Assets and Liabilities as an asset (liability) and in the Statement of Operations as unrealized appreciation (depreciation) until the contracts are closed, when they are recorded as realized futures gains (losses).
During the year ended September 30, 2018, the fund’s average investments in long and short futures contracts represented less than 1% and 0% of net assets, respectively, based on the average of the notional amounts at each quarter-end during the period. The fund had no open futures contracts at September 30, 2018
3. Federal Income Taxes: The fund intends to continue to qualify as a regulated investment company and distribute all of its taxable income. Management has analyzed the fund’s tax positions taken for all open federal income tax years (September 30, 2015–2018), and has concluded that no provision for federal income tax is required in the fund’s financial statements.
4. Distributions: Distributions to shareholders are recorded on the ex-dividend date. Distributions are determined on a tax basis and may differ from net investment income and realized capital gains for financial reporting purposes.
63
Institutional Target Retirement 2030 Fund
5. Credit Facility: The fund and certain other funds managed by The Vanguard Group (“Vanguard”) participate in a $3.1 billion committed credit facility provided by a syndicate of lenders pursuant to a credit agreement that may be renewed annually; each fund is individually liable for its borrowings, if any, under the credit facility. Borrowings may be utilized for temporary and emergency purposes, and are subject to the fund’s regulatory and contractual borrowing restrictions. The participating funds are charged administrative fees and an annual commitment fee of 0.10% of the undrawn amount of the facility; these fees are allocated to the funds based on a method approved by the fund’s board of trustees and borne by the funds in which the fund invests (see Note B). Any borrowings under this facility bear interest at a rate based upon the higher of the one-month London Interbank Offered Rate, federal funds effective rate, or overnight bank funding rate plus an agreed-upon spread.
The fund had no borrowings outstanding at September 30, 2018, or at any time during the period then ended.
6. Other: Income and capital gain distributions received are recorded on the ex-dividend date. Security transactions are accounted for on the date securities are bought or sold. Costs used to determine realized gains (losses) on the sale of investment securities are those of the specific securities sold.
B. In accordance with the terms of a Funds’ Service Agreement (the “FSA”) between Vanguard and the fund, Vanguard furnishes to the fund investment advisory, corporate management, administrative, marketing, and distribution services at Vanguard’s cost of operations (as defined by the FSA). These costs of operations are allocated to the fund based on methods and guidelines approved by the board of trustees. The FSA provides that expenses otherwise allocable to Vanguard funds-of-funds may be reduced or eliminated to the extent of savings realized by the underlying Vanguard funds by virtue of being part of a fund-of-funds. Accordingly, all expenses for services provided by Vanguard to the fund and all other expenses incurred by the fund during the period ended September 30, 2018, were borne by the underlying Vanguard funds in which the fund invests. The fund’s trustees and officers are also trustees and officers, respectively, of the underlying Vanguard funds, as well as directors and employees, respectively, of Vanguard.
C. Various inputs may be used to determine the value of the fund’s investments. These inputs are summarized in three broad levels for financial statement purposes. The inputs or methodologies used to value securities are not necessarily an indication of the risk associated with investing in those securities.
Level 1—Quoted prices in active markets for identical securities.
Level 2—Other significant observable inputs (including quoted prices for similar securities, interest rates, prepayment speeds, credit risk, etc.).
Level 3—Significant unobservable inputs (including the fund’s own assumptions used to determine the fair value of investments). Any investments valued with significant unobservable inputs are noted on the Statement of Net Assets.
At September 30, 2018, 100% of the market value of the fund’s investments was determined based on Level 1 inputs.
64
Institutional Target Retirement 2030 Fund
D. Permanent differences between book-basis and tax-basis components of net assets, if any, are reclassified among capital accounts in the financial statements to reflect their tax character. These reclassifications have no effect on net assets or net asset value per share.
Temporary differences between book-basis and tax-basis components of accumulated net earnings (losses) arise when certain items of income, gain, or loss are recognized in different periods for financial statement and tax purposes; these differences will reverse at some time in the future. The differences are primarily related to the tax deferral of losses on wash sales. As of period end, the tax-basis components of accumulated net earnings (losses) are detailed in the table as follows:
| Amount | |
| ($000) | |
| Undistributed Ordinary Income | 370,785 |
| Undistributed Long-Term Gains | 680 |
| Capital Loss Carryforwards (Non-expiring) | — |
| Net Unrealized Gains (Losses) | 3,182,705 |
As of September 30, 2018, gross unrealized appreciation and depreciation for investments and derivatives based on cost for U.S. federal income tax purposes were as follows:
| Amount | ||
| ($000) | ||
| Tax Cost | 22,616,105 | |
| Gross Unrealized Appreciation | 3,424,529 | |
| Gross Unrealized Depreciation | (241,824) | |
| Net Unrealized Appreciation (Depreciation) | 3,182,705 | |
| E. Capital shares issued and redeemed were: | ||
| Year Ended September 30, | ||
| 2018 | 2017 | |
| Shares | Shares | |
| (000) | (000) | |
| Issued | 326,284 | 324,504 |
| Issued in Lieu of Cash Distributions | 17,237 | 12,146 |
| Redeemed | (109,186) | (54,468) |
| Net Increase (Decrease) in Shares Outstanding | 234,335 | 282,182 |
At September 30, 2018, one shareholder was the record or beneficial owner of 35% of the fund’s net assets. If the shareholder were to redeem its investment in the fund, the redemption might lead to the realization of taxable capital gains.
65
Institutional Target Retirement 2030 Fund
| F. Transactions during the period in affiliated underlying Vanguard funds were as follows: | ||||||||
| Current Period Transactions | ||||||||
| Sept. 30, | Proceeds | Realized | Sept. 30, | |||||
| 2017 | from | Net | Change in | Capital Gain | 2018 | |||
| Market | Purchases | Securities | Gain | Unrealized | Distributions | Market | ||
| Value | at Cost | Sold | (Loss) | App. (Dep.) | Income | Received | Value | |
| ($000) | ($000) | ($000) | ($000) | ($000) | ($000) | ($000) | ($000) | |
| Vanguard Market | ||||||||
| Liquidity Fund | 7,534 | NA1 | NA1 | 4 | — | 54 | — | 1,144 |
| Vanguard Total | ||||||||
| Bond Market II | ||||||||
| Index Fund | 3,892,483 | 2,448,529 | 709,591 | — | (186,619) | 123,520 | 925 | 5,444,802 |
| Vanguard Total | ||||||||
| International Bond | ||||||||
| Index Fund | 1,595,870 | 664,859 | 4,480 | — | (1,224) | 41,940 | — | 2,255,025 |
| Vanguard Total | ||||||||
| International Stock | ||||||||
| Index Fund | 5,409,796 | 2,020,126 | 112,564 | (130) | (110,237) | 174,441 | — | 7,206,991 |
| Vanguard Total | ||||||||
| Stock Market | ||||||||
| Index Fund | 8,238,969 | 2,082,435 | 819,606 | 2,778 | 1,386,272 | 178,243 | — 10,890,848 | |
| Total | 19,144,652 | 7,215,949 | 1,646,241 | 2,652 | 1,088,192 | 518,198 | 925 | 25,798,810 |
| 1 Not applicable—purchases and sales are for temporary cash investment purposes. | ||||||||
G. Management has determined that no events or transactions occurred subsequent to September 30, 2018, that would require recognition or disclosure in these financial statements.
66
Institutional Target Retirement 2035 Fund
Fund Profile
As of September 30, 2018
| Total Fund Characteristics | |
| Ticker Symbol | VITFX |
| 30-Day SEC Yield | 2.28% |
| Acquired Fund Fees and Expenses1 | 0.09% |
| Allocation to Underlying Vanguard Funds | |
| Vanguard Total Stock Market Index Fund | |
| Institutional Shares | 46.7% |
| Vanguard Total International Stock Index | |
| Fund Investor Shares | 30.9 |
| Vanguard Total Bond Market II Index Fund | |
| Investor Shares | 15.8 |
| Vanguard Total International Bond Index | |
| Fund Admiral Shares | 6.6 |
Fund Asset Allocation
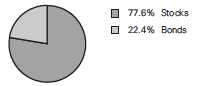
1 This figure—drawn from the prospectus dated January 25, 2018—represents an estimate of the weighted average of the expense ratios and any transaction fees charged by the underlying mutual funds (the ”acquired” funds) in which the Institutional Target Retirement 2035 Fund invests. The fund does not charge any expenses or fees of its own. For the fiscal year ended September 30, 2018, the acquired fund fees and expenses were 0.09%.
67
Institutional Target Retirement 2035 Fund
Performance Summary
All of the returns in this report represent past performance, which is not a guarantee of future results that may be achieved by the fund. (Current performance may be lower or higher than the performance data cited. For performance data current to the most recent month-end, visit our website at vanguard.com/performance.) Note, too, that both investment returns and principal value can fluctuate widely, so an investor’s shares, when sold, could be worth more or less than their original cost. The returns shown do not reflect taxes that a shareholder would pay on fund distributions or on the sale of fund shares.
Cumulative Performance: June 26, 2015, Through September 30, 2018
Initial Investment of $100,000,000
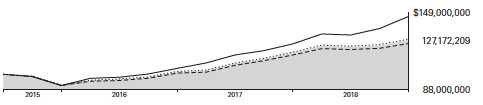
| Average Annual Total Returns | |||
| Periods Ended September 30, 2018 | |||
| Since | Final Value | ||
| One | Inception | of a $100,000,000 | |
| Year | (6/26/2015) | Investment | |
| Institutional Target Retirement 2035 | |||
| Fund* | 8.54% | 7.64% | $127,172,209 |
| Target 2035 Composite Index | 8.80 | 7.86 | 128,001,725 |
| Mixed-Asset Target 2035 Funds | |||
| Average | 7.90 | 6.96 | 124,564,354 |
| MSCI US Broad Market Index | 17.62 | 12.34 | 146,201,479 |
For a benchmark description, see the Glossary.
Mixed-Asset Target 2035 Funds Average: Derived from data provided by Lipper, a Thomson Reuters Company.
"Since Inception" performance is calculated from the fund's inception date for both the fund and its comparative standards.
See Financial Highlights for dividend and capital gains information.
68
Institutional Target Retirement 2035 Fund
Fiscal-Year Total Returns (%): June 26, 2015, Through September 30, 2018
69
Institutional Target Retirement 2035 Fund
Financial Statements
Statement of Net Assets
As of September 30, 2018
The fund reports a complete list of its holdings in regulatory filings four times in each fiscal year, at the quarter-ends. For the second and fourth fiscal quarters, the lists appear in the fund’s semiannual and annual reports to shareholders. For the first and third fiscal quarters, the fund files the lists with the Securities and Exchange Commission on Form N-Q. Shareholders can look up the fund’s Forms N-Q on the SEC’s website at sec.gov. Forms N-Q may also be reviewed and copied at the SEC’s Public Reference Room (see the back cover of this report for further information).
| Market | ||
| Value• | ||
| Shares | ($000) | |
| Investment Companies (99.9%) | ||
| U.S. Stock Fund (46.6%) | ||
| Vanguard Total Stock Market Index Fund Institutional Shares | 152,158,877 | 11,084,774 |
| International Stock Fund (30.9%) | ||
| Vanguard Total International Stock Index Fund Investor Shares | 423,092,714 | 7,344,889 |
| U.S. Bond Fund (15.8%) | ||
| 1 Vanguard Total Bond Market II Index Fund Investor Shares | 363,941,040 | 3,759,511 |
| International Bond Fund (6.6%) | ||
| Vanguard Total International Bond Index Fund Admiral Shares | 71,521,314 | 1,556,304 |
| Total Investment Companies (Cost $20,466,023) | 23,745,478 | |
| Temporary Cash Investment (0.0%) | ||
| Money Market Fund (0.0%) | ||
| 1 Vanguard Market Liquidity Fund, 2.209% (Cost $4) | 36 | 4 |
| Total Investments (99.9%) (Cost $20,466,027) | 23,745,482 | |
| Other Assets and Liabilities (0.1%) | ||
| Other Assets | 100,664 | |
| Liabilities | (83,750) | |
| 16,914 | ||
| Net Assets (100%) | ||
| Applicable to 979,831,072 outstanding $.001 par value shares of | ||
| beneficial interest (unlimited authorization) | 23,762,396 | |
| Net Asset Value Per Share | $24.25 |
70
| Institutional Target Retirement 2035 Fund | |
| Amount | |
| ($000) | |
| Statement of Assets and Liabilities | |
| Assets | |
| Investments in Securities, at Value—Affiliated Funds | 23,745,482 |
| Receivables for Investment Securities Sold | 58,285 |
| Receivables for Accrued Income | 9,996 |
| Receivables for Capital Shares Issued | 32,383 |
| Total Assets | 23,846,146 |
| Liabilities | |
| Payables for Investment Securities Purchased | 9,995 |
| Payables for Capital Shares Redeemed | 73,471 |
| Other Liabilities | 284 |
| Total Liabilities | 83,750 |
| Net Assets | 23,762,396 |
| At September 30, 2018, net assets consisted of: | |
| Amount | |
| ($000) | |
| Paid-in Capital | 20,141,831 |
| Undistributed Net Investment Income | 338,095 |
| Accumulated Net Realized Gains | 3,015 |
| Unrealized Appreciation (Depreciation) | 3,279,455 |
| Net Assets | 23,762,396 |
• See Note A in Notes to Financial Statements.
1 Affiliated fund available only to Vanguard funds and certain trusts and accounts managed by Vanguard. Rate shown for Vanguard
Market Liquidity Fund is the 7-day yield.
See accompanying Notes, which are an integral part of the Financial Statements.
71
| Institutional Target Retirement 2035 Fund | |
| Statement of Operations | |
| Year Ended | |
| September 30, 2018 | |
| ($000) | |
| Investment Income | |
| Income | |
| Income Distributions Received from Affiliated Funds | 473,598 |
| Net Investment Income—Note B | 473,598 |
| Realized Net Gain (Loss) | |
| Capital Gain Distributions Received from Affiliated Funds | 629 |
| Affiliated Funds Sold | 3,121 |
| Futures Contracts | (567) |
| Realized Net Gain (Loss) | 3,183 |
| Change in Unrealized Appreciation (Depreciation) from Affiliated Funds | 1,161,459 |
| Net Increase (Decrease) in Net Assets Resulting from Operations | 1,638,240 |
See accompanying Notes, which are an integral part of the Financial Statements.
72
Institutional Target Retirement 2035 Fund
Statement of Changes in Net Assets
| Year Ended September 30, | ||
| 2018 | 2017 | |
| ($000) | ($000) | |
| Increase (Decrease) in Net Assets | ||
| Operations | ||
| Net Investment Income | 473,598 | 321,318 |
| Realized Net Gain (Loss) | 3,183 | 4,196 |
| Change in Unrealized Appreciation (Depreciation) | 1,161,459 | 1,669,268 |
| Net Increase (Decrease) in Net Assets Resulting from Operations | 1,638,240 | 1,994,782 |
| Distributions | ||
| Net Investment Income | (370,634) | (225,679) |
| Realized Capital Gain1 | (2,936) | (2,578) |
| Total Distributions | (373,570) | (228,257) |
| Capital Share Transactions | ||
| Issued | 7,041,221 | 5,844,698 |
| Issued in Lieu of Cash Distributions | 368,487 | 225,973 |
| Redeemed | (2,487,936) | (962,824) |
| Net Increase (Decrease) from Capital Share Transactions | 4,921,772 | 5,107,847 |
| Total Increase (Decrease) | 6,186,442 | 6,874,372 |
| Net Assets | ||
| Beginning of Period | 17,575,954 | 10,701,582 |
| End of Period2 | 23,762,396 | 17,575,954 |
1 Includes fiscal 2018 and 2017 short-term gain distributions totaling $2,446,000 and $1,489,000, respectively. Short-term gain
distributions are treated as ordinary income dividends for tax purposes.
2 Net Assets—End of Period includes undistributed (overdistributed) net investment income of $338,095,000 and $235,131,000.
See accompanying Notes, which are an integral part of the Financial Statements.
73
| Institutional Target Retirement 2035 Fund | ||||
| Financial Highlights | ||||
| June 26, | ||||
| 20151 to | ||||
| Year Ended September 30, | Sept. 30, | |||
| For a Share Outstanding Throughout Each Period | 2018 | 2017 | 2016 | 2015 |
| Net Asset Value, Beginning of Period | $22.78 | $20.23 | $18.27 | $20.00 |
| Investment Operations | ||||
| Net Investment Income2 | .533 | .489 | .457 | .142 |
| Capital Gain Distributions Received 2 | .001 | .003 | .003 | — |
| Net Realized and Unrealized Gain (Loss) on Investments | 1.394 | 2.457 | 1.664 | (1.872) |
| Total from Investment Operations | 1.928 | 2.949 | 2.124 | (1.730) |
| Distributions | ||||
| Dividends from Net Investment Income | (. 454) | (. 394) | (.164) | — |
| Distributions from Realized Capital Gains | (.004) | (.005) | — | — |
| Total Distributions | (. 458) | (. 399) | (.164) | — |
| Net Asset Value, End of Period | $24.25 | $22.78 | $20.23 | $18.27 |
| Total Return | 8.54% | 14.85% | 11.68% | -8.65% |
| Ratios/Supplemental Data | ||||
| Net Assets, End of Period (Millions) | $23,762 | $17,576 | $10,702 | $4,037 |
| Ratio of Total Expenses to Average Net Assets | — | — | — | — |
| Acquired Fund Fees and Expenses | 0.09% | 0.09% | 0.10% | 0.10%3 |
| Ratio of Net Investment Income to Average Net Assets | 2.25% | 2.30% | 2.37% | 2.62%3 |
| Portfolio Turnover Rate | 8% | 4% | 2% | 0% |
1 Inception.
2 Calculated based on average shares outstanding.
3 Annualized.
See accompanying Notes, which are an integral part of the Financial Statements.
74
Institutional Target Retirement 2035 Fund
Notes to Financial Statements
Vanguard Institutional Target Retirement 2035 Fund is registered under the Investment Company Act of 1940 as an open-end investment company, or mutual fund. The fund follows a balanced investment strategy by investing in selected Vanguard funds to achieve its targeted allocation of assets to U.S. and international stocks, and U.S. and international bonds. Financial statements and other information about each underlying fund are available on vanguard.com.
A. The following significant accounting policies conform to generally accepted accounting principles for U.S. investment companies. The fund consistently follows such policies in preparing its financial statements.
1. Security Valuation: Investments are valued at the net asset value of each underlying Vanguard fund determined as of the close of the New York Stock Exchange (generally 4 p.m., Eastern time) on the valuation date.
2. Futures Contracts: The fund uses stock and bond futures contracts to a limited extent, with the objectives of maintaining full exposure to the market and maintaining its target asset allocation. The primary risks associated with the use of futures contracts are imperfect correlation between changes in market values of investments held by the fund and the prices of futures contracts, and the possibility of an illiquid market. Counterparty risk involving futures is mitigated because a regulated clearinghouse is the counterparty instead of the clearing broker. To further mitigate counterparty risk, the fund trades futures contracts on an exchange, monitors the financial strength of its clearing brokers and clearinghouse, and has entered into clearing agreements with its clearing brokers. The clearinghouse imposes initial margin requirements to secure the fund’s performance and requires daily settlement of variation margin representing changes in the market value of each contract. Any assets pledged as initial margin for open contracts are noted in the Statement of Net Assets.
Futures contracts are valued at their quoted daily settlement prices. The notional amounts of the contracts are not recorded in the Statement of Net Assets. Fluctuations in the value of the contracts are recorded in the Statement of Assets and Liabilities as an asset (liability) and in the Statement of Operations as unrealized appreciation (depreciation) until the contracts are closed, when they are recorded as realized futures gains (losses).
During the year ended September 30, 2018, the fund’s average investments in long and short futures contracts represented less than 1% and 0% of net assets, respectively, based on the average of the notional amounts at each quarter-end during the period. The fund had no open futures contracts at September 30, 2018.
3. Federal Income Taxes: The fund intends to continue to qualify as a regulated investment company and distribute all of its taxable income. Management has analyzed the fund’s tax positions taken for all open federal income tax years (September 30, 2015–2018), and has concluded that no provision for federal income tax is required in the fund’s financial statements.
4. Distributions: Distributions to shareholders are recorded on the ex-dividend date. Distributions are determined on a tax basis and may differ from net investment income and realized capital gains for financial reporting purposes.
75
Institutional Target Retirement 2035 Fund
5. Credit Facility: The fund and certain other funds managed by The Vanguard Group (“Vanguard”) participate in a $3.1 billion committed credit facility provided by a syndicate of lenders pursuant to a credit agreement that may be renewed annually; each fund is individually liable for its borrowings, if any, under the credit facility. Borrowings may be utilized for temporary and emergency purposes, and are subject to the fund’s regulatory and contractual borrowing restrictions. The participating funds are charged administrative fees and an annual commitment fee of 0.10% of the undrawn amount of the facility; these fees are allocated to the funds based on a method approved by the fund’s board of trustees and borne by the funds in which the fund invests (see Note B). Any borrowings under this facility bear interest at a rate based upon the higher of the one-month London Interbank Offered Rate, federal funds effective rate, or overnight bank funding rate plus an agreed-upon spread.
The fund had no borrowings outstanding at September 30, 2018, or at any time during the period then ended.
6. Other: Income and capital gain distributions received are recorded on the ex-dividend date. Security transactions are accounted for on the date securities are bought or sold. Costs used to determine realized gains (losses) on the sale of investment securities are those of the specific securities sold.
B. In accordance with the terms of a Funds’ Service Agreement (the “FSA”) between Vanguard and the fund, Vanguard furnishes to the fund investment advisory, corporate management, administrative, marketing, and distribution services at Vanguard’s cost of operations (as defined by the FSA). These costs of operations are allocated to the fund based on methods and guidelines approved by the board of trustees. The FSA provides that expenses otherwise allocable to Vanguard funds-of-funds may be reduced or eliminated to the extent of savings realized by the underlying Vanguard funds by virtue of being part of a fund-of-funds. Accordingly, all expenses for services provided by Vanguard to the fund and all other expenses incurred by the fund during the period ended September 30, 2018, were borne by the underlying Vanguard funds in which the fund invests. The fund’s trustees and officers are also trustees and officers, respectively, of the underlying Vanguard funds, as well as directors and employees, respectively, of Vanguard.
C. Various inputs may be used to determine the value of the fund’s investments. These inputs are summarized in three broad levels for financial statement purposes. The inputs or methodologies used to value securities are not necessarily an indication of the risk associated with investing in those securities.
Level 1—Quoted prices in active markets for identical securities.
Level 2—Other significant observable inputs (including quoted prices for similar securities, interest rates, prepayment speeds, credit risk, etc.).
Level 3—Significant unobservable inputs (including the fund’s own assumptions used to determine the fair value of investments). Any investments valued with significant unobservable inputs are noted on the Statement of Net Assets.
At September 30, 2018, 100% of the market value of the fund’s investments was determined based on Level 1 inputs.
76
Institutional Target Retirement 2035 Fund
D. Permanent differences between book-basis and tax-basis components of net assets, if any, are reclassified among capital accounts in the financial statements to reflect their tax character. These reclassifications have no effect on net assets or net asset value per share.
Temporary differences between book-basis and tax-basis components of accumulated net earnings (losses) arise when certain items of income, gain, or loss are recognized in different periods for financial statement and tax purposes; these differences will reverse at some time in the future. The differences are primarily related to the tax deferral of losses on wash sales. As of period end, the tax-basis components of accumulated net earnings (losses) are detailed in the table as follows:
| Amount | |
| ($000) | |
| Undistributed Ordinary Income | 340,843 |
| Undistributed Long-Term Gains | 267 |
| Capital Loss Carryforwards (Non-expiring) | — |
| Net Unrealized Gains (Losses) | 3,279,455 |
As of September 30, 2018, gross unrealized appreciation and depreciation for investments and derivatives based on cost for U.S. federal income tax purposes were as follows:
| Amount | ||
| ($000) | ||
| Tax Cost | 20,466,027 | |
| Gross Unrealized Appreciation | 3,468,806 | |
| Gross Unrealized Depreciation | (189,351) | |
| Net Unrealized Appreciation (Depreciation) | 3,279,455 | |
| E. Capital shares issued and redeemed were: | ||
| Year Ended September 30, | ||
| 2018 | 2017 | |
| Shares | Shares | |
| (000) | (000) | |
| Issued | 297,648 | 276,466 |
| Issued in Lieu of Cash Distributions | 15,734 | 11,310 |
| Redeemed | (105,226) | (45,006) |
| Net Increase (Decrease) in Shares Outstanding | 208,156 | 242,770 |
At September 30, 2018, one shareholder was the record or beneficial owner of 33% of the fund’s net assets. If the shareholder were to redeem its investment in the fund, the redemption might lead to the realization of taxable capital gains.
77
Institutional Target Retirement 2035 Fund
| F. Transactions during the period in affiliated underlying Vanguard funds were as follows: | ||||||||
| Current Period Transactions | ||||||||
| Sept. 30, | Proceeds | Realized | Sept. 30, | |||||
| 2017 | from | Net | Change in | Capital Gain | 2018 | |||
| Market | Purchases | Securities | Gain | Unrealized | Distributions | Market | ||
| Value | at Cost | Sold | (Loss) | App. (Dep.) | Income | Received | Value | |
| ($000) | ($000) | ($000) | ($000) | ($000) | ($000) | ($000) | ($000) | |
| Vanguard Market | ||||||||
| Liquidity Fund | 3,600 | NA1 | NA1 | 3 | — | 53 | — | 4 |
| Vanguard Total | ||||||||
| Bond Market II | ||||||||
| Index Fund | 2,659,139 | 1,895,479 | 667,178 | — | (127,929) | 84,966 | 629 | 3,759,511 |
| Vanguard Total | ||||||||
| International Bond | ||||||||
| Index Fund | 1,064,701 | 496,195 | 3,628 | — | (964) | 28,726 | — | 1,556,304 |
| Vanguard Total | ||||||||
| International Stock | ||||||||
| Index Fund | 5,490,662 | 2,076,750 | 102,473 | (1,461) | (118,589) | 178,264 | — | 7,344,889 |
| Vanguard Total | ||||||||
| Stock Market | ||||||||
| Index Fund | 8,357,981 | 2,276,684 | 963,411 | 4,579 | 1,408,941 | 181,589 | — | 11,084,774 |
| Total | 17,576,083 | 6,745,108 | 1,736,690 | 3,121 | 1,161,459 | 473,598 | 629 | 23,745,482 |
| 1 Not applicable—purchases and sales are for temporary cash investment purposes. | ||||||||
G. Management has determined that no events or transactions occurred subsequent to September 30, 2018, that would require recognition or disclosure in these financial statements.
78
Report of Independent Registered Public Accounting Firm
To the Board of Trustees of Vanguard Chester Funds and Shareholders of Vanguard Institutional Target Retirement Income Fund, Vanguard Institutional Target Retirement 2015 Fund, Vanguard Institutional Target Retirement 2020 Fund, Vanguard Institutional Target Retirement 2025 Fund, Vanguard Institutional Target Retirement 2030 Fund and Vanguard Institutional Target Retirement 2035 Fund
Opinions on the Financial Statements
We have audited the accompanying statements of net assets and statements of assets and liabilities of Vanguard Institutional Target Retirement Income Fund, Vanguard Institutional Target Retirement 2015 Fund, Vanguard Institutional Target Retirement 2020 Fund, Vanguard Institutional Target Retirement 2025 Fund, Vanguard Institutional Target Retirement 2030 Fund and Vanguard Institutional Target Retirement 2035 Fund (six of the funds constituting Vanguard Chester Funds, hereafter collectively referred to as the “Funds”) as of September 30, 2018, the related statements of operations for the year ended September 30, 2018, the statements of changes in net assets for each of the two years in the period ended September 30, 2018, including the related notes, and the financial highlights for each of the periods indicated therein (collectively referred to as the “financial statements”). In our opinion, the financial statements present fairly, in all material respects, the financial position of each of the Funds as of September 30, 2018, the results of each of their operations for the year then ended, the changes in each of their net assets for each of the two years in the period ended September 30, 2018 and each of the financial highlights for each of the periods indicated therein in conformity with accounting principles generally accepted in the United States of America.
Basis for Opinions
These financial statements are the responsibility of the Funds’ management. Our responsibility is to express an opinion on the Funds’ financial statements based on our audits. We are a public accounting firm registered with the Public Company Accounting Oversight Board (United States) (“PCAOB”) and are required to be independent with respect to the Funds in accordance with the U.S. federal securities laws and the applicable rules and regulations of the Securities and Exchange Commission and the PCAOB.
We conducted our audits of these financial statements in accordance with the standards of the PCAOB. Those standards require that we plan and perform the audit to obtain reasonable assurance about whether the financial statements are free of material misstatement, whether due to error or fraud.
Our audits included performing procedures to assess the risks of material misstatement of the financial statements, whether due to error or fraud, and performing procedures that respond to those risks. Such procedures included examining, on a test basis, evidence regarding the amounts and disclosures in the financial statements. Our audits also included evaluating the accounting principles used and significant estimates made by management, as well as evaluating the overall presentation of the financial statements. Our procedures included confirmation of securities owned as of September 30, 2018 by agreement to the underlying ownership records of the transfer agent. We believe that our audits provide a reasonable basis for our opinions.
/s/PricewaterhouseCoopers LLP
Philadelphia, Pennsylvania
November 13, 2018
We have served as the auditor of one or more investment companies in The Vanguard Group of Funds since 1975.
79
Special 2018 tax information (unaudited) for Vanguard Institutional Target Retirement Funds
This information for the fiscal year ended September 30, 2018, is included pursuant to provisions of the Internal Revenue Code.
The funds distributed capital gain dividends (20% rate gain distributions) to shareholders during the fiscal year as follows:
| Fund | ($000) |
| Institutional Target Retirement Income Fund | 934 |
| Institutional Target Retirement 2015 Fund | 7,660 |
| Institutional Target Retirement 2020 Fund | 1,854 |
| Institutional Target Retirement 2025 Fund | 1,182 |
| Institutional Target Retirement 2030 Fund | 714 |
| Institutional Target Retirement 2035 Fund | 489 |
For nonresident alien shareholders, 100% of short-term capital gain dividends distributed by the funds are qualified short-term capital gains.
The funds distributed qualified dividend income to shareholders during the fiscal year as follows:
| Fund | ($000) |
| Institutional Target Retirement Income Fund | 31,956 |
| Institutional Target Retirement 2015 Fund | 56,717 |
| Institutional Target Retirement 2020 Fund | 165,127 |
| Institutional Target Retirement 2025 Fund | 234,770 |
| Institutional Target Retirement 2030 Fund | 229,635 |
| Institutional Target Retirement 2035 Fund | 233,804 |
For corporate shareholders, the percentage of investment income (dividend income plus short-term gains, if any) that qualifies for the dividends-received deduction is as follows:
| Fund | Percentage |
| Institutional Target Retirement Income Fund | 10.9% |
| Institutional Target Retirement 2015 Fund | 15.4 |
| Institutional Target Retirement 2020 Fund | 21.8 |
| Institutional Target Retirement 2025 Fund | 26.3 |
| Institutional Target Retirement 2030 Fund | 30.2 |
| Institutional Target Retirement 2035 Fund | 33.5 |
80
The funds designate to shareholders foreign source income and foreign taxes paid as follows:
| Foreign Source Income | Foreign Taxes Paid | |
| Fund | ($000) | ($000) |
| Institutional Target Retirement Income Fund | 35,823 | 1,205 |
| Institutional Target Retirement 2015 Fund | 60,194 | 2,440 |
| Institutional Target Retirement 2020 Fund | 168,764 | 7,772 |
| Institutional Target Retirement 2025 Fund | 230,634 | 11,432 |
| Institutional Target Retirement 2030 Fund | 216,833 | 11,500 |
| Institutional Target Retirement 2035 Fund | 208,179 | 11,705 |
Shareholders will receive more detailed information with their Form 1099-DIV in January 2019 to determine the calendar-year amounts to be included on their 2018 tax returns.
81
About Your Fund’s Expenses
As a shareholder of the fund, you incur ongoing costs, which include costs for portfolio management, administrative services, and shareholder reports (like this one), among others. Operating expenses, which are deducted from a fund’s gross income, directly reduce the investment return of the fund.
A typical fund’s expenses are expressed as a percentage of its average net assets. The Institutional Target Retirement Funds have no direct expenses, but each fund bears its proportionate share of the costs for the underlying funds in which it invests. These indirect expenses make up the acquired fund fees and expenses, also expressed as a percentage of average net assets.
The following examples are intended to help you understand the ongoing cost (in dollars) of investing in your fund and to compare these costs with those of other mutual funds. The examples are based on an investment of $1,000 made at the beginning of the period shown and held for the entire period. The costs were calculated using the acquired fund fees and expenses for each Institutional Target Retirement Fund.
The accompanying table illustrates your fund’s costs in two ways:
• Based on actual fund return. This section helps you to estimate the actual expenses that you paid over the period. The ”Ending Account Value“ shown is derived from the fund‘s actual return, and the third column shows the dollar amount that would have been paid by an investor who started with $1,000 in the fund. You may use the information here, together with the amount you invested, to estimate the expenses that you paid over the period.
To do so, simply divide your account value by $1,000 (for example, an $8,600 account value divided by $1,000 = 8.6), then multiply the result by the number given for your fund under the heading ”Expenses Paid During Period.“
• Based on hypothetical 5% yearly return. This section is intended to help you compare your fund‘s costs with those of other mutual funds. It assumes that the fund had a yearly return of 5% before expenses, but that the expense ratio is unchanged. In this case—because the return used is not the fund’s actual return—the results do not apply to your investment. The example is useful in making comparisons because the Securities and Exchange Commission requires all mutual funds to calculate expenses based on a 5% return. You can assess your fund’s costs by comparing this hypothetical example with the hypothetical examples that appear in shareholder reports of other funds.
Note that the expenses shown in the table are meant to highlight and help you compare ongoing costs only and do not reflect transaction costs incurred by the fund for buying and selling securities. Further, the expenses do not include any purchase, redemption, or account service fees described in the fund prospectus. If such fees were applied to your account, your costs would be higher. Your fund does not carry a “sales load.”
The calculations assume no shares were bought or sold during the period. Your actual costs may have been higher or lower, depending on the amount of your investment and the timing of any purchases or redemptions.
You can find more information about the fund’s expenses, including annual expense ratios, in the Financial Statements section of this report. For additional information on operating expenses and other shareholder costs, please refer to your fund’s current prospectus.
82
| Six Months Ended September 30, 2018 | |||
| Beginning | Ending | Expenses | |
| Account Value | Account Value | Paid During | |
| 3/31/2018 | 9/30/2018 | Period | |
| Based on Actual Fund Return | |||
| Institutional Target Retirement Income Fund | $1,000.00 | $1,017.95 | $0.46 |
| Institutional Target Retirement 2015 Fund | $1,000.00 | $1,023.31 | $0.46 |
| Institutional Target Retirement 2020 Fund | $1,000.00 | $1,030.36 | $0.46 |
| Institutional Target Retirement 2025 Fund | $1,000.00 | $1,035.20 | $0.46 |
| Institutional Target Retirement 2030 Fund | $1,000.00 | $1,039.15 | $0.46 |
| Institutional Target Retirement 2035 Fund | $1,000.00 | $1,043.46 | $0.46 |
| Based on Hypothetical 5% Yearly Return | |||
| Institutional Target Retirement Income Fund | $1,000.00 | $1,024.62 | $0.46 |
| Institutional Target Retirement 2015 Fund | $1,000.00 | $1,024.62 | $0.46 |
| Institutional Target Retirement 2020 Fund | $1,000.00 | $1,024.62 | $0.46 |
| Institutional Target Retirement 2025 Fund | $1,000.00 | $1,024.62 | $0.46 |
| Institutional Target Retirement 2030 Fund | $1,000.00 | $1,024.62 | $0.46 |
| Institutional Target Retirement 2035 Fund | $1,000.00 | $1,024.62 | $0.46 |
The calculations are based on the acquired fund fees and expenses for the most recent six-month period. The funds’ annualized expense figures for that period are (in order as listed from top to bottom above) 0.09%, 0.09%, 0.09%, 0.09%, 0.09%, and 0.09%. The dollar amounts shown as ”Expenses Paid” are equal to the annualized expense figures for the underlying funds multiplied by the average account value over the period, multiplied by the number of days in the most recent six-month period, then divided by the number of days in the most recent 12-month period (183/365).
83
Glossary
30-Day SEC Yield. A fund’s 30-day SEC yield is derived using a formula specified by the U.S. Securities and Exchange Commission. Under the formula, data related to the fund’s security holdings in the previous 30 days are used to calculate the fund’s hypothetical net income for that period, which is then annualized and divided by the fund’s estimated average net assets over the calculation period. For the purposes of this calculation, a security’s income is based on its current market yield to maturity (for bonds), its actual income (for asset-backed securities), or its projected dividend yield (for stocks). Because the SEC yield represents hypothetical annualized income, it will differ—at times significantly—from the fund’s actual experience. As a result, the fund’s income distributions may be higher or lower than implied by the SEC yield.
Acquired Fund Fees and Expenses. Funds that invest in other Vanguard funds incur no direct expenses, but they do bear proportionate shares of the operating, administrative, and advisory expenses of the underlying funds, and they must pay any fees charged by those funds. The figure for acquired fund fees and expenses represents a weighted average of these underlying costs. Acquired is a term that the Securities and Exchange Commission applies to any mutual fund whose shares are owned by another fund.
Expense Ratio. A fund’s total annual operating expenses expressed as a percentage of the fund’s average net assets. The expense ratio includes management and administrative expenses, but does not include the transaction costs of buying and selling portfolio securities.
Inception Date. The date on which the assets of a fund (or one of its share classes) are first invested in accordance with the fund’s investment objective. For funds with a subscription period, the inception date is the day after that period ends. Investment performance is measured from the inception date.
Benchmark Information
Target 2015 Composite Index: Derived by applying the fund’s target asset allocation to the results of the following benchmarks: for international stocks of developed markets, the MSCI EAFE Index through December 15, 2010, the MSCI ACWI ex USA IMI Index through June 2, 2013, and the FTSE Global All Cap ex US Index thereafter; for emerging-market stocks, the Select Emerging Markets Index through August 23, 2006, the MSCI Emerging Markets Index through December 15, 2010, the MSCI ACWI ex USA IMI Index through June 2, 2013, and the FTSE Global All Cap ex US Index thereafter; for U.S. bonds, the Bloomberg Barclays U.S. Aggregate Bond Index through December 31, 2009, and the Bloomberg Barclays U.S. Aggregate Float Adjusted Index thereafter, as well as the Bloomberg Barclays U.S. Treasury Inflation-Protected Securities Index through June 2, 2013, and the Bloomberg Barclays U.S. Treasury Inflation-Protected Securities (TIPS) 0–5 Year Index thereafter; for international bonds, the Bloomberg Barclays Global Aggregate ex-USD Float Adjusted RIC Capped Index beginning June 3, 2013; and for U.S. stocks, the Dow Jones U.S. Total Stock Market Index (formerly known as the Dow Jones Wilshire 5000 Index) through April 22, 2005, the MSCI US Broad Market Index through June 2, 2013, and the CRSP US Total Market Index thereafter. International stock benchmark returns are adjusted for withholding taxes.
84
Target 2020 Composite Index: Derived by applying the fund’s target asset allocation to the results of the following benchmarks: for international stocks of developed markets, the MSCI EAFE Index through December 15, 2010, the MSCI ACWI ex USA IMI Index through June 2, 2013, and the FTSE Global All Cap ex US Index thereafter; for emerging-market stocks, the Select Emerging Markets Index through August 23, 2006, the MSCI Emerging Markets Index through December 15, 2010, the MSCI ACWI ex USA IMI Index through June 2, 2013, and the FTSE Global All Cap ex US Index thereafter; for U.S. bonds, the Bloomberg Barclays U.S. Aggregate Bond Index through December 31, 2009, and the Bloomberg Barclays U.S. Aggregate Float Adjusted Index thereafter; for international bonds, the Bloomberg Barclays Global Aggregate ex-USD Float Adjusted RIC Capped Index beginning June 3, 2013; and for U.S. stocks, the MSCI US Broad Market Index through June 2, 2013, and the CRSP US Total Market Index thereafter. International stock benchmark returns are adjusted for withholding taxes.
Target 2025 Composite Index: Derived by applying the fund’s target asset allocation to the results of the following benchmarks: for international stocks of developed markets, the MSCI EAFE Index through December 15, 2010, the MSCI ACWI ex USA IMI Index through June 2, 2013, and the FTSE Global All Cap ex US Index thereafter; for emerging-market stocks, the Select Emerging Markets Index through August 23, 2006, the MSCI Emerging Markets Index through December 15, 2010, the MSCI ACWI ex USA IMI Index through June 2, 2013, and the FTSE Global All Cap ex US Index thereafter; for U.S. bonds, the Bloomberg Barclays U.S. Aggregate Bond Index through December 31, 2009, and the Bloomberg Barclays U.S. Aggregate Float Adjusted Index thereafter; for international bonds, the Bloomberg Barclays Global Aggregate ex-USD Float Adjusted RIC Capped Index beginning June 3, 2013; and for U.S. stocks, the Dow Jones U.S. Total Stock Market Index (formerly known as the Dow Jones Wilshire 5000 Index) through April 22, 2005, the MSCI US Broad Market Index through June 2, 2013, and the CRSP US Total Market Index thereafter. International stock benchmark returns are adjusted for withholding taxes.
Target 2030 Composite Index: Derived by applying the fund’s target asset allocation to the results of the following benchmarks: for international stocks of developed markets, the MSCI EAFE Index through December 15, 2010, the MSCI ACWI ex USA IMI Index through June 2, 2013, and the FTSE Global All Cap ex US Index thereafter; for emerging-market stocks, the Select Emerging Markets Index through August 23, 2006, the MSCI Emerging Markets Index through December 15, 2010, the MSCI ACWI ex USA IMI Index through June 2, 2013, and the FTSE Global All Cap ex US Index thereafter; for U.S. bonds, the Bloomberg Barclays U.S. Aggregate Bond Index through December 31, 2009, and the Bloomberg Barclays U.S. Aggregate Float Adjusted Index thereafter; for international bonds, the Bloomberg Barclays Global Aggregate ex-USD Float Adjusted RIC Capped Index beginning June 3, 2013; and for U.S. stocks, the MSCI US Broad Market Index through June 2, 2013, and the CRSP US Total Market Index thereafter. International stock benchmark returns are adjusted for withholding taxes.
85
Target 2035 Composite Index: Derived by applying the fund’s target asset allocation to the results of the following benchmarks: for international stocks of developed markets, the MSCI EAFE Index through December 15, 2010, the MSCI ACWI ex USA IMI Index through June 2, 2013, and the FTSE Global All Cap ex US Index thereafter; for emerging-market stocks, the Select Emerging Markets Index through August 23, 2006, the MSCI Emerging Markets Index through December 15, 2010, the MSCI ACWI ex USA IMI Index through June 2, 2013, and the FTSE Global All Cap ex US Index thereafter; for U.S. bonds, the Bloomberg Barclays U.S. Aggregate Bond Index through December 31, 2009, and the Bloomberg Barclays U.S. Aggregate Float Adjusted Index thereafter; for international bonds, the Bloomberg Barclays Global Aggregate ex-USD Float Adjusted RIC Capped Index beginning June 3, 2013; and for U.S. stocks, the Dow Jones U.S. Total Stock Market Index (formerly known as the Dow Jones Wilshire 5000 Index) through April 22, 2005, the MSCI US Broad Market Index through June 2, 2013, and the CRSP US Total Market Index thereafter. International stock benchmark returns are adjusted for withholding taxes.
Target Income Composite Index: Derived by applying the fund’s target asset allocation to the results of the following benchmarks: for international stocks of developed markets, the MSCI EAFE Index through December 15, 2010, the MSCI ACWI ex USA IMI Index through June 2, 2013, and the FTSE Global All Cap ex US Index thereafter; for emerging-market stocks, the Select Emerging Markets Index through August 23, 2006, the MSCI Emerging Markets Index through December 15, 2010, the MSCI ACWI ex USA IMI Index through June 2, 2013, and the FTSE Global All Cap ex US Index thereafter; for U.S. bonds, the Bloomberg Barclays U.S. Aggregate Bond Index through December 31, 2009, and the Bloomberg Barclays U.S. Aggregate Float Adjusted Index thereafter, as well as the Bloomberg Barclays U.S. Treasury Inflation-Protected Securities Index through June 2, 2013, and the Bloomberg Barclays U.S. Treasury Inflation-Protected Securities (TIPS) 0–5 Year Index thereafter; for short-term reserves, the Citigroup Three-Month Treasury Bill Index through June 2, 2013; for international bonds, the Bloomberg Barclays Global Aggregate ex-USD Float Adjusted RIC Capped Index beginning June 3, 2013; and for U.S. stocks, the Dow Jones U.S. Total Stock Market Index (formerly known as the Dow Jones Wilshire 5000 Index) through April 22, 2005, the MSCI US Broad Market Index through June 2, 2013, and the CRSP US Total Market Index thereafter. International stock benchmark returns are adjusted for withholding taxes.
86
BLOOMBERG is a trademark and service mark of Bloomberg Finance L.P. BARCLAYS is a trademark and service mark of Barclays Bank Plc, used under license. Bloomberg Finance L.P. and its affiliates, including Bloomberg Index Services Limited (BISL) (collectively, Bloomberg), or Bloomberg’s licensors, own all proprietary rights in the Bloomberg Barclays U.S. Aggregate Bond Index, Bloomberg Barclays U.S. Aggregate Float Adjusted Index, Bloomberg Barclays U.S. Treasury Inflation Protected Securities Index, Bloomberg Barclays U.S. Treasury Inflation-Protected Securities (TIPS) 0–5 Year Index, and the Bloomberg Barclays Global Aggregate ex-USD Float Adjusted RIC Capped Index (USD Hedged) (the Indices or Bloomberg Barclays Indices).
Neither Barclays Bank Plc, Barclays Capital Inc., or any affiliate (collectively Barclays) or Bloomberg is the issuer or producer of the Institutional Target Retirement Funds (including the Total Bond Market II Index Fund, the Total International Bond Index Fund, and the Short-Term Inflation-Protected Securities Index Fund) and neither Bloomberg nor Barclays has any responsibilities, obligations or duties to investors in the Institutional Target Retirement Funds. The Indices are licensed for use by The Vanguard Group, Inc. (Vanguard) as the sponsor of the Institutional Target Retirement Funds. Bloomberg and Barclays’ only relationship with Vanguard in respect to the Indices is the licensing of the Indices, which is determined, composed and calculated by BISL, or any successor thereto, without regard to the Issuer or the Institutional Target Retirement Funds or the owners of the Institutional Target Retirement Funds.
Additionally, Vanguard may for itself execute transaction(s) with Barclays in or relating to the Indices in connection with the Institutional Target Retirement Funds. Investors acquire the Institutional Target Retirement Funds from Vanguard and investors neither acquire any interest in the Indices nor enter into any relationship of any kind whatsoever with Bloomberg or Barclays upon making an investment in the Institutional Target Retirement Funds. The Institutional Target Retirement Funds are not sponsored, endorsed, sold or promoted by Bloomberg or Barclays. Neither Bloomberg nor Barclays makes any representation or warranty, express or implied regarding the advisability of investing in the Institutional Target Retirement Funds or the advisability of investing in securities generally or the ability of the Indices to track corresponding or relative market performance. Neither Bloomberg nor Barclays has passed on the legality or suitability of the Institutional Target Retirement Funds with respect to any person or entity. Neither Bloomberg nor Barclays is responsible for and has not participated in the determination of the timing of, prices at, or quantities of the Institutional Target Retirement Funds to be issued. Neither Bloomberg nor Barclays has any obligation to take the needs of the Issuer or the owners of the Institutional Target Retirement Funds or any other third party into consideration in determining, composing or calculating the Indices. Neither Bloomberg nor Barclays has any obligation or liability in connection with administration, marketing or trading of the Institutional Target Retirement Funds.
87
The licensing agreement between Bloomberg and Barclays is solely for the benefit of Bloomberg and Barclays and not for the benefit of the owners of the Institutional Target Retirement Funds, investors or other third parties. In addition, the licensing agreement between Vanguard and Bloomberg is solely for the benefit of Vanguard and Bloomberg and not for the benefit of the owners of the Institutional Target Retirement Funds, investors or other third parties.
NEITHER BLOOMBERG NOR BARCLAYS SHALL HAVE ANY LIABILITY TO THE ISSUER, INVESTORS OR TO OTHER THIRD PARTIES FOR THE QUALITY, ACCURACY AND/OR COMPLETENESS OF THE BLOOMBERG BARCLAYS INDICES
OR ANY DATA INCLUDED THEREIN OR FOR INTERRUPTIONS IN THE DELIVERY OF THE BLOOMBERG BARCLAYS INDICES. NEITHER BLOOMBERG NOR BARCLAYS MAKES ANY WARRANTY, EXPRESS OR IMPLIED, AS TO RESULTS TO BE OBTAINED BY THE ISSUER, THE INVESTORS OR ANY OTHER PERSON OR ENTITY FROM THE USE OF THE BLOOMBERG BARCLAYS INDICES OR ANY DATA INCLUDED THEREIN. NEITHER BLOOMBERG NOR BARCLAYS MAKES ANY EXPRESS OR IMPLIED WARRANTIES, AND EACH HEREBY EXPRESSLY DISCLAIMS ALL WARRANTIES OF MERCHANTABILITY OR FITNESS FOR A PARTICULAR PURPOSE OR USE WITH RESPECT TO BLOOMBERG BARCLAYS INDICES OR ANY DATA INCLUDED THEREIN. BLOOMBERG RESERVES THE RIGHT TO CHANGE THE METHODS OF CALCULATION OR PUBLICATION, OR TO CEASE THE CALCULATION OR PUBLICATION OF THE BLOOMBERG BARCLAYS INDICES, AND NEITHER BLOOMBERG NOR BARCLAYS SHALL BE LIABLE FOR ANY MISCALCULATION OF OR ANY INCORRECT, DELAYED OR INTERRUPTED PUBLICATION WITH RESPECT TO ANY OF THE BLOOMBERG BARCLAYS INDICES. NEITHER BLOOMBERG NOR BARCLAYS SHALL BE LIABLE FOR ANY DAMAGES, INCLUDING, WITHOUT LIMITATION, ANY SPECIAL, INDIRECT OR CONSEQUENTIAL DAMAGES, OR ANY LOST PROFITS AND EVEN IF ADVISED OF THE POSSIBILITY OF SUCH, RESULTING FROM THE USE OF BLOOMBERG BARCLAYS INDICES OR ANY DATA INCLUDED THEREIN OR WITH RESPECT TO THE INSTITUTIONAL TARGET RETIREMENT FUNDS.
None of the information supplied by Bloomberg or Barclays and used in this publication may be reproduced in any manner without the prior written permission of both Bloomberg and Barclays Capital, the investment banking division of Barclays Bank Plc. Barclays Bank Plc is registered in England No. 1026167. Registered office 1 Churchill Place London E14 5HP.
© 2018 Bloomberg. Used with Permission.
Source: Bloomberg Index Services Limited. Copyright 2018, Bloomberg. All rights reserved.
88
This page intentionally left blank.
This page intentionally left blank.
The People Who Govern Your Fund
The trustees of your mutual fund are there to see that the fund is operated and managed in your best interests since, as a shareholder, you are a part owner of the fund. Your fund’s trustees also serve on the board of directors of The Vanguard Group, Inc., which is owned by the Vanguard funds and provides services to them on an at-cost basis.
A majority of Vanguard’s board members are independent, meaning that they have no affiliation with Vanguard or the funds they oversee, apart from the sizable personal investments they have made as private individuals. The independent board members have distinguished backgrounds in business, academia, and public service. Each of the trustees and executive officers oversees 211 Vanguard funds.
Information for each trustee and executive officer of the fund appears below. The mailing address of the trustees and officers is P.O. Box 876, Valley Forge, PA 19482. More information about the trustees is in the Statement of Additional Information, which can be obtained, without charge, by contacting Vanguard at 800-662-7447, or online at vanguard.com.
Interested Trustees1
F. William McNabb III
Born in 1957. Trustee since July 2009. Principal occupation(s) during the past five years and other experience: chairman of the board (January 2010–present) of Vanguard and of each of the investment companies served by Vanguard, trustee (2009–present) of each of the investment companies served by Vanguard, and director (2008–present) of Vanguard. Chief executive officer and president (2008–2017) of Vanguard and each of the investment companies served by Vanguard, managing director (1995–2008) of Vanguard, and director (1997–2018) of Vanguard Marketing Corporation. Director (2018–present) of UnitedHealth Group.
Mortimer J. Buckley
Born in 1969. Trustee since January 2018. Principal occupation(s) during the past five years and other experience: chief executive officer (January 2018–present) of Vanguard; chief executive officer, president, and trustee (January 2018–present) of each of the investment companies served by Vanguard; president and director (2017–present) of Vanguard; and president (February 2018–present) of Vanguard Marketing Corporation. Chief investment officer (2013–2017), managing director (2002–2017), head of the Retail Investor Group (2006–2012), and chief information officer (2001–2006) of Vanguard. Chairman of the board (2011–2017) of the Children’s Hospital of Philadelphia.
Independent Trustees
Emerson U. Fullwood
Born in 1948. Trustee since January 2008. Principal occupation(s) during the past five years and other experience: executive chief staff and marketing officer for North America and corporate vice president (retired 2008) of Xerox Corporation (document management products and services). Former president of the Worldwide Channels Group, Latin America, and Worldwide Customer Service and executive chief staff officer of Developing Markets of Xerox. Executive in residence and 2009–2010 Distinguished Minett Professor at the Rochester Institute of Technology. Lead director of SPX FLOW, Inc. (multi-industry manufacturing). Director of the University of Rochester Medical Center, the Monroe Community College Foundation, the United Way of Rochester, North Carolina A&T University, and Roberts Wesleyan College. Trustee of the University of Rochester.
Amy Gutmann
Born in 1949. Trustee since June 2006. Principal occupation(s) during the past five years and other experience: president (2004–present) of the University of Pennsylvania. Christopher H. Browne Distinguished Professor of Political Science, School of Arts and Sciences, and professor of communication, Annenberg School for Communication, with secondary faculty appointments in the Department of Philosophy, School of Arts and Sciences, and at the Graduate School of Education, University of Pennsylvania. Trustee of the National Constitution Center.
1 Mr. McNabb and Mr. Buckley are considered “interested persons,” as defined in the Investment Company Act of 1940, because they are officers of the Vanguard funds.
JoAnn Heffernan Heisen
Born in 1950. Trustee since July 1998. Principal occupation(s) during the past five years and other experience: corporate vice president of Johnson & Johnson (pharmaceuticals/medical devices/consumer products) and member of its executive committee (1997–2008). Chief global diversity officer (retired 2008), vice president and chief information officer (1997–2006), controller (1995–1997), treasurer (1991–1995), and assistant treasurer (1989–1991) of Johnson & Johnson. Director of Skytop Lodge Corporation (hotels) and the Robert Wood Johnson Foundation. Member of the advisory board of the Institute for Women’s Leadership at Rutgers University.
F. Joseph Loughrey
Born in 1949. Trustee since October 2009. Principal occupation(s) during the past five years and other experience: president and chief operating officer (retired 2009) and vice chairman of the board (2008–2009) of Cummins Inc. (industrial machinery). Chairman of the board of Hillenbrand, Inc. (specialized consumer services), Oxfam America, and the Lumina Foundation for Education. Director of the V Foundation for Cancer Research. Member of the advisory council for the College of Arts and Letters and chair of the advisory board to the Kellogg Institute for International Studies, both at the University of Notre Dame.
Mark Loughridge
Born in 1953. Trustee since March 2012. Principal occupation(s) during the past five years and other experience: senior vice president and chief financial officer (retired 2013) of IBM (information technology services). Fiduciary member of IBM’s Retirement Plan Committee (2004–2013), senior vice president and general manager (2002–2004) of IBM Global Financing, vice president and controller (1998–2002) of IBM, and a variety of other prior management roles at IBM. Member of the Council on Chicago Booth.
Scott C. Malpass
Born in 1962. Trustee since March 2012. Principal occupation(s) during the past five years and other experience: chief investment officer (1989–present) and vice president (1996–present) of the University of Notre Dame. Assistant professor of finance at the Mendoza College of Business, University of Notre Dame, and member of the Notre Dame 403(b) Investment Committee. Chairman of the board of TIFF Advisory Services, Inc. Member of the board of Catholic Investment Services, Inc. (investment advisors), the board of advisors for Spruceview Capital Partners, and the board of superintendence of the Institute for the Works of Religion.
Deanna Mulligan
Born in 1963. Trustee since January 2018. Principal occupation(s) during the past five years and other experience: president (2010–present) and chief executive officer (2011–present) of The Guardian Life Insurance Company of America. Chief operating officer (2010–2011) and executive vice president (2008–2010) of Individual Life and Disability of The Guardian Life Insurance Company of America. Member of the board of The Guardian Life Insurance Company of America, the American Council of Life Insurers, the Partnership for New York City (business leadership), and the Committee Encouraging Corporate Philanthropy. Trustee of the Economic Club of New York and the Bruce Museum (arts and science). Member of the Advisory Council for the Stanford Graduate School of Business.
André F. Perold
Born in 1952. Trustee since December 2004. Principal occupation(s) during the past five years and other experience: George Gund Professor of Finance and Banking, Emeritus at the Harvard Business School (retired 2011). Chief investment officer and co-managing partner of HighVista Strategies LLC (private investment firm). Overseer of the Museum of Fine Arts Boston.
Sarah Bloom Raskin
Born in 1961. Trustee since January 2018. Principal occupation(s) during the past five years and other experience: deputy secretary (2014–2017) of the United States Department of the Treasury. Governor (2010–2014) of the Federal Reserve Board. Commissioner (2007–2010) of financial regulation for the State of Maryland. Member of the board of directors (2012–2014) of Neighborhood Reinvestment Corporation. Director of i(x) Investments, LLC.
Peter F. Volanakis
Born in 1955. Trustee since July 2009. Principal occupation(s) during the past five years and other experience: president and chief operating officer (retired 2010) of Corning Incorporated (communications equipment) and director of Corning Incorporated (2000–2010) and Dow Corning (2001–2010). Director (2012) of SPX Corporation (multi-industry manufacturing). Overseer of the Amos Tuck School of Business Administration, Dartmouth College (2001–2013). Chairman of the board of trustees of Colby-Sawyer College. Member of the Board of Hypertherm Inc. (industrial cutting systems, software, and consumables).
Executive Officers
Glenn Booraem
Born in 1967. Principal occupation(s) during the past five years and other experience: principal of Vanguard. Investment stewardship officer (2017–present), treasurer (2015–2017), controller (2010–2015), and assistant controller (2001–2010) of each of the investment companies served by Vanguard.
Christine M. Buchanan
Born in 1970. Principal occupation(s) during the past five years and other experience: principal of Vanguard and global head of Fund Administration at Vanguard. Treasurer (2017–present) of each of the investment companies served by Vanguard. Partner (2005–2017) at KPMG LLP (audit, tax, and advisory services).
Brian Dvorak
Born in 1973. Principal occupation(s) during the past five years and other experience: principal of Vanguard. Chief compliance officer (2017–present) of Vanguard and each of the investment companies served by Vanguard. Assistant vice president (2017–present) of Vanguard Marketing Corporation. Vice president and director of Enterprise Risk Management (2011–2013) at Oppenheimer Funds, Inc.
Thomas J. Higgins
Born in 1957. Principal occupation(s) during the past five years and other experience: principal of Vanguard. Chief financial officer (2008–present) and treasurer (1998–2008) of each of the investment companies served by Vanguard.
Peter Mahoney
Born in 1974. Principal occupation(s) during the past five years and other experience: principal of Vanguard. Controller (2015–present) of each of the investment companies served by Vanguard. Head of International Fund Services (2008–2014) at Vanguard.
Anne E. Robinson
Born in 1970. Principal occupation(s) during the past five years and other experience: general counsel (2016–present) of Vanguard. Secretary (2016–present) of Vanguard and of each of the investment companies served by Vanguard. Managing director (2016–present) of Vanguard. Director and senior vice president (2016–2018) of Vanguard Marketing Corporation. Managing director and general counsel of Global Cards and Consumer Services (2014–2016) at Citigroup. Counsel (2003–2014) at American Express.
Michael Rollings
Born in 1963. Principal occupation(s) during the past five years and other experience: finance director (2017–present) and treasurer (2017) of each of the investment companies served by Vanguard. Managing director (2016–present) of Vanguard. Chief financial officer (2016–present) of Vanguard. Director (2016–present) of Vanguard Marketing Corporation. Executive vice president and chief financial officer (2006–2016) of MassMutual Financial Group.
| Vanguard Senior Management Team | |
| Joseph Brennan | Chris D. McIsaac |
| Mortimer J. Buckley | James M. Norris |
| Gregory Davis | Thomas M. Rampulla |
| John James | Karin A. Risi |
| Martha G. King | Anne E. Robinson |
| John T. Marcante | Michael Rollings |
| Chairman Emeritus and Senior Advisor | |
| John J. Brennan | |
| Chairman, 1996–2009 | |
| Chief Executive Officer and President, 1996–2008 | |
| Founder | |
| John C. Bogle | |
| Chairman and Chief Executive Officer, 1974–1996 | |
 | |
P.O. Box 2600 | |
Connect with Vanguard® > vanguard.com | |
| Fund Information > 800-662-7447 | |
| Direct Investor Account Services > 800-662-2739 | |
| Institutional Investor Services > 800-523-1036 | |
| Text Telephone for People | |
| Who Are Deaf or Hard of Hearing > 800-749-7273 | |
| This material may be used in conjunction | |
| with the offering of shares of any Vanguard | |
| fund only if preceded or accompanied by | |
| the fund’s current prospectus. | |
| All comparative mutual fund data are from Lipper, a | |
| Thomson Reuters Company, or Morningstar, Inc., unless | |
| otherwise noted. | |
| You can obtain a free copy of Vanguard’s proxy voting | |
| guidelines by visiting vanguard.com/proxyreporting or by | |
| calling Vanguard at 800-662-2739. The guidelines are | |
| also available from the SEC’s website, sec.gov. In | |
| addition, you may obtain a free report on how your fund | |
| voted the proxies for securities it owned during the 12 | |
| months ended June 30. To get the report, visit either | |
| vanguard.com/proxyreporting or sec.gov. | |
| You can review and copy information about your fund at | |
| the SEC’s Public Reference Room in Washington, D.C. To | |
| find out more about this public service, call the SEC at | |
| 202-551-8090. Information about your fund is also | |
| available on the SEC’s website, and you can receive | |
| copies of this information, for a fee, by sending a | |
| request in either of two ways: via email addressed to | |
| publicinfo@sec.gov or via regular mail addressed to the | |
| Public Reference Section, Securities and Exchange | |
| Commission, Washington, DC 20549-1520. | |
| © 2018 The Vanguard Group, Inc. | |
| All rights reserved. | |
| Vanguard Marketing Corporation, Distributor. | |
| Q6730 112018 | |
| Annual Report | September 30, 2018 |
| Vanguard Institutional Target |
| Retirement Funds |
| Vanguard Institutional Target Retirement 2040 Fund |
| Vanguard Institutional Target Retirement 2045 Fund |
| Vanguard Institutional Target Retirement 2050 Fund |
| Vanguard Institutional Target Retirement 2055 Fund |
| Vanguard Institutional Target Retirement 2060 Fund |
| Vanguard Institutional Target Retirement 2065 Fund |
Vanguard’s Principles for Investing Success
We want to give you the best chance of investment success. These
principles, grounded in Vanguard’s research and experience, can put you on
the right path.
Goals. Create clear, appropriate investment goals.
Balance. Develop a suitable asset allocation using broadly diversified funds.
Cost. Minimize cost.
Discipline. Maintain perspective and long-term discipline.
A single theme unites these principles: Focus on the things you can control.
We believe there is no wiser course for any investor.
| Contents | |
| Your Fund’s Performance at a Glance. | 1 |
| CEO’s Perspective. | 4 |
| Institutional Target Retirement 2040 Fund. | 6 |
| Institutional Target Retirement 2045 Fund. | 18 |
| Institutional Target Retirement 2050 Fund. | 30 |
| Institutional Target Retirement 2055 Fund. | 42 |
| Institutional Target Retirement 2060 Fund. | 54 |
| Institutional Target Retirement 2065 Fund. | 66 |
| About Your Fund’s Expenses. | 81 |
| Glossary. | 83 |
Please note: The opinions expressed in this report are just that—informed opinions. They should not be considered promises or advice. Also, please keep in mind that the information and opinions cover the period through the date on the front of this report. Of course, the risks of investing in your fund are spelled out in the prospectus.
See the Glossary for definitions of investment terms used in this report.
Your Fund’s Performance at a Glance
• For the 12 months ended September 30, 2018, the six Vanguard Institutional Target Retirement Funds covered in this report recorded returns ranging from 9.39% for the Institutional Target Retirement 2040 Fund to 9.93% for the Institutional Target Retirement 2065 Fund. (The funds with target dates of 2015 through 2035, as well as the Institutional Target Retirement Income Fund, are covered in a separate report.)
• Each fund posted returns that were in line with those of its composite benchmark after expenses. Each fund surpassed the average returns of its peers.
• Vanguard Institutional Target Retirement Funds are designed to reach an allocation of 70% bonds and 30% stocks within seven years after their target dates.
• From their inception dates through September 30, 2018, the funds’ average annual returns ranged from 8.11% for the Institutional Target Retirement 2040 Fund to 11.61% for the Institutional Target Retirement 2065 Fund.
| Total Returns: Fiscal Year Ended September 30, 2018 | |
| Total | |
| Returns | |
| Vanguard Institutional Target Retirement 2040 Fund | 9.39% |
| Target 2040 Composite Index | 9.66 |
| Mixed-Asset Target 2040 Funds Average | 8.36 |
| Mixed-Asset Target 2040 Funds Average: Derived from data provided by Lipper, a Thomson Reuters Company. | |
| Vanguard Institutional Target Retirement 2045 Fund | 9.92% |
| Target 2045 Composite Index | 10.15 |
| Mixed-Asset Target 2045 Funds Average | 9.11 |
| Mixed-Asset Target 2045 Funds Average: Derived from data provided by Lipper, a Thomson Reuters Company. | |
| Vanguard Institutional Target Retirement 2050 Fund | 9.88% |
| Target 2050 Composite Index | 10.15 |
| Mixed-Asset Target 2050 Funds Average | 9.09 |
| Mixed-Asset Target 2050 Funds Average: Derived from data provided by Lipper, a Thomson Reuters Company. | |
| Vanguard Institutional Target Retirement 2055 Fund | 9.84% |
| Target 2055 Composite Index | 10.15 |
| Mixed-Asset Target 2055+ Funds Average | 9.53 |
| Mixed-Asset Target 2055+ Funds Average: Derived from data provided by Lipper, a Thomson Reuters Company. | |
1
| Total | |
| Returns | |
| Vanguard Institutional Target Retirement 2060 Fund | 9.83% |
| Target 2060 Composite Index | 10.15 |
| Mixed-Asset Target 2055+ Funds Average | 9.53 |
| Mixed-Asset Target 2055+ Funds Average: Derived from data provided by Lipper, a Thomson Reuters Company. | |
| Vanguard Institutional Target Retirement 2065 Fund | 9.93% |
| Target 2065 Composite Index | 10.15 |
| Mixed-Asset Target 2055+ Funds Average | 9.53 |
| Mixed-Asset Target 2055+ Funds Average: Derived from data provided by Lipper, a Thomson Reuters Company. | |
| For a benchmark description, see the Glossary. | |
Investments in Target Retirement Funds are subject to the risks of their underlying funds. The year in the fund name refers to the approximate year (the target date) when an investor in the fund would retire and leave the work force. The fund will gradually shift its emphasis from more aggressive investments to more conservative ones based on its target date. An investment in a Target Retirement Fund is not guaranteed at any time, including on or after the target date.
| Total Returns: Inception Through September 30, 2018 | |
| Average | |
| Annual Return | |
| Institutional Target Retirement 2040 Fund (Returns since inception: 6/26/2015) | 8.11% |
| Target 2040 Composite Index | 8.36 |
| Mixed-Asset Target 2040 Funds Average | 7.18 |
| Mixed-Asset Target 2040 Funds Average: Derived from data provided by Lipper, a Thomson Reuters Company. | |
| Institutional Target Retirement 2045 Fund (Returns since inception: 6/26/2015) | 8.44% |
| Target 2045 Composite Index | 8.68 |
| Mixed-Asset Target 2045 Funds Average | 7.66 |
| Mixed-Asset Target 2045 Funds Average: Derived from data provided by Lipper, a Thomson Reuters Company. | |
| Institutional Target Retirement 2050 Fund (Returns since inception: 6/26/2015) | 8.44% |
| Target 2050 Composite Index | 8.68 |
| Mixed-Asset Target 2050 Funds Average | 7.64 |
| Mixed-Asset Target 2050 Funds Average: Derived from data provided by Lipper, a Thomson Reuters Company. | |
| Institutional Target Retirement 2055 Fund (Returns since inception: 6/26/2015) | 8.44% |
| Target 2055 Composite Index | 8.68 |
| Mixed-Asset Target 2055+ Funds Average | 7.94 |
| Mixed-Asset Target 2055+ Funds Average: Derived from data provided by Lipper, a Thomson Reuters Company. | |
| Institutional Target Retirement 2060 Fund (Returns since inception: 6/26/2015) | 8.42% |
| Target 2060 Composite Index | 8.68 |
| Mixed-Asset Target 2055+ Funds Average | 7.94 |
| Mixed-Asset Target 2055+ Funds Average: Derived from data provided by Lipper, a Thomson Reuters Company. | |
2
| Average | |
| Annual Return | |
| Institutional Target Retirement 2065 Fund (Returns since inception: 7/12/2017) | 11.61% |
| Target 2065 Composite Index | 11.65 |
| Spliced Mixed-Asset Target 2055+ Funds Average | 11.28 |
Mixed-Asset Target 2055+ Funds Average: Derived from data provided by Lipper, a Thomson Reuters Company.
The figures shown represent past performance, which is not a guarantee of future results. (Current performance may be lower or higher than the performance data cited. For performance data current to the most recent month-end, visit our website at vanguard.com/performance.) Note, too, that both investment returns and principal value can fluctuate widely, so an investor’s shares, when sold, could be worth more or less than their original cost.
3
CEO’s Perspective

Tim Buckley
President and Chief Executive Officer
Dear Shareholder,
Over the years, I’ve found that prudent investors exhibit a common trait: discipline. No matter how the markets move or what new investing fad hits the headlines, those who stay focused on their goals and tune out the noise are set up for long-term success.
The prime gateway to investing is saving, and you don’t usually become a saver without a healthy dose of discipline. Savers make the decision to sock away part of their income, which means spending less and delaying gratification, no matter how difficult that may be.
Of course, disciplined investing extends beyond diligent saving. The financial markets, in the short term especially, are unpredictable; I have yet to meet the investor who can time them perfectly. It takes discipline to resist the urge to go all-in when markets are frothy or to retreat when things look bleak.
Staying put with your investments is one strategy for handling volatility. Another, rebalancing, requires even more discipline because it means steering your money away from strong performers and toward poorer performers.
Patience—a form of discipline—is also the friend of long-term investors. Higher returns are the potential reward for weathering the market’s turbulence and uncertainty.
4
We have been enjoying one of the longest bull markets in history, but it won’t continue forever. Prepare yourself now for how you will react when volatility comes back. Don’t panic. Don’t chase returns or look for answers outside the asset classes you trust. And be sure to rebalance periodically, even when there’s turmoil.
Whether you’re a master of self-control, get a boost from technology, or work with a professional advisor, know that discipline is necessary to get the most out of your investment portfolio. And know that Vanguard is with you for the entire ride.
Thank you for your continued loyalty.
Sincerely,

Mortimer J. Buckley
President and Chief Executive Officer
October 18, 2018
| Market Barometer | |||
| Average Annual Total Returns | |||
| Periods Ended September 30, 2018 | |||
| One Year | Three Years | Five Years | |
| Stocks | |||
| Russell 1000 Index (Large-caps) | 17.76% | 17.07% | 13.67% |
| Russell 2000 Index (Small-caps) | 15.24 | 17.12 | 11.07 |
| Russell 3000 Index (Broad U.S. market) | 17.58 | 17.07 | 13.46 |
| FTSE All-World ex US Index (International) | 2.13 | 10.18 | 4.51 |
| Bonds | |||
| Bloomberg Barclays U.S. Aggregate Bond Index | |||
| (Broad taxable market) | -1.22% | 1.31% | 2.16% |
| Bloomberg Barclays Municipal Bond Index | |||
| (Broad tax-exempt market) | 0.35 | 2.24 | 3.54 |
| FTSE Three-Month U. S. Treasury Bill Index | 1.57 | 0.80 | 0.48 |
| CPI | |||
| Consumer Price Index | 2.28% | 1.99% | 1.52% |
5
Institutional Target Retirement 2040 Fund
Fund Profile
As of September 30, 2018
| Total Fund Characteristics | |
| Ticker Symbol | VIRSX |
| 30-Day SEC Yield | 2.28% |
| Acquired Fund Fees and Expenses1 | 0.09% |
| Allocation to Underlying Vanguard Funds | |
| Vanguard Total Stock Market Index Fund | |
| Institutional Shares | 51.2% |
| Vanguard Total International Stock Index | |
| Fund Investor Shares | 33.9 |
| Vanguard Total Bond Market II Index Fund | |
| Investor Shares | 10.6 |
| Vanguard Total International Bond Index | |
| Fund Admiral Shares | 4.3 |
Fund Asset Allocation
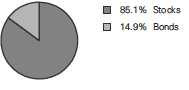
1 This figure—drawn from the prospectus dated January 25, 2018—represents an estimate of the weighted average of the expense ratios and any transaction fees charged by the underlying mutual funds (the ”acquired” funds) in which the Institutional Target Retirement 2040 Fund invests. The fund does not charge any expenses or fees of its own. For the fiscal year ended September 30, 2018, the acquired fund fees and expenses were 0.09%.
6
Institutional Target Retirement 2040 Fund
Performance Summary
All of the returns in this report represent past performance, which is not a guarantee of future results that may be achieved by the fund. (Current performance may be lower or higher than the performance data cited. For performance data current to the most recent month-end, visit our website at vanguard.com/performance.) Note, too, that both investment returns and principal value can fluctuate widely, so an investor’s shares, when sold, could be worth more or less than their original cost. The returns shown do not reflect taxes that a shareholder would pay on fund distributions or on the sale of fund shares.
Cumulative Performance: June 26, 2015, Through September 30, 2018
Initial Investment of $100,000,000
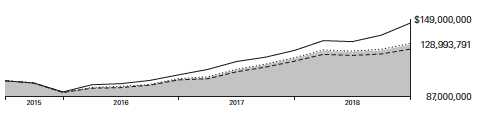
| Average Annual Total Returns | |||
| Periods Ended September 30, 2018 | |||
| Since | Final Value | ||
| One | Inception | of a $100,000,000 | |
| Year | (6/26/2015) | Investment | |
| Institutional Target Retirement 2040 | |||
| Fund* | 9.39% | 8.11% | $128,993,791 |
| Target 2040 Composite Index | 9.66 | 8.36 | 129,933,280 |
| Mixed-Asset Target 2040 Funds | |||
| Average | 8.36 | 7.18 | 125,371,965 |
| MSCI US Broad Market Index | 17.62 | 12.34 | 146,201,479 |
For a benchmark description, see the Glossary.
Mixed-Asset Target 2040 Funds Average: Derived from data provided by Lipper, a Thomson Reuters Company.
"Since Inception" performance is calculated from the fund's inception date for both the fund and its comparative standards.
See Financial Highlights for dividend and capital gains information.
7
Institutional Target Retirement 2040 Fund
Fiscal-Year Total Returns (%): June 26, 2015, Through September 30, 2018
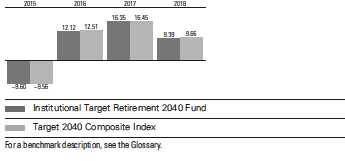
8
Institutional Target Retirement 2040 Fund
Financial Statements
Statement of Net Assets
As of September 30, 2018
The fund reports a complete list of its holdings in regulatory filings four times in each fiscal year, at the quarter-ends. For the second and fourth fiscal quarters, the lists appear in the fund’s semiannual and annual reports to shareholders. For the first and third fiscal quarters, the fund files the lists with the Securities and Exchange Commission on Form N-Q. Shareholders can look up the fund’s Forms N-Q on the SEC’s website at sec.gov. Forms N-Q may also be reviewed and copied at the SEC’s Public Reference Room (see the back cover of this report for further information).
| Market | ||
| Value• | ||
| Shares | ($000) | |
| Investment Companies (99.9%) | ||
| U.S. Stock Fund (51.1%) | ||
| Vanguard Total Stock Market Index Fund Institutional Shares | 145,833,087 | 10,623,941 |
| International Stock Fund (33.9%) | ||
| Vanguard Total International Stock Index Fund Investor Shares | 406,190,644 | 7,051,470 |
| U.S. Bond Fund (10.6%) | ||
| 1 Vanguard Total Bond Market II Index Fund Investor Shares | 214,010,478 | 2,210,728 |
| International Bond Fund (4.3%) | ||
| Vanguard Total International Bond Index Fund Admiral Shares | 41,101,620 | 894,371 |
| Total Investment Companies (Cost $17,720,481) | 20,780,510 | |
| Temporary Cash Investment (0.0%) | ||
| Money Market Fund (0.0%) | ||
| 1 Vanguard Market Liquidity Fund, 2.209% (Cost $748) | 7,483 | 748 |
| Total Investments (99.9%) (Cost $17,721,229) | 20,781,258 | |
| Other Assets and Liabilities (0.1%) | ||
| Other Assets | 93,592 | |
| Liabilities | (76,829) | |
| 16,763 | ||
| Net Assets (100%) | ||
| Applicable to 845,049,193 outstanding $.001 par value shares of | ||
| beneficial interest (unlimited authorization) | 20,798,021 | |
| Net Asset Value Per Share | $24.61 | |
9
| Institutional Target Retirement 2040 Fund | |
| Amount | |
| ($000) | |
| Statement of Assets and Liabilities | |
| Assets | |
| Investments in Securities, at Value—Affiliated Funds | 20,781,258 |
| Receivables for Investment Securities Sold | 55,257 |
| Receivables for Accrued Income | 5,832 |
| Receivables for Capital Shares Issued | 32,503 |
| Total Assets | 20,874,850 |
| Liabilities | |
| Payables for Investment Securities Purchased | 5,831 |
| Payables for Capital Shares Redeemed | 70,998 |
| Total Liabilities | 76,829 |
| Net Assets | 20,798,021 |
| At September 30, 2018, net assets consisted of: | |
| Amount | |
| ($000) | |
| Paid-in Capital | 17,450,527 |
| Undistributed Net Investment Income | 290,298 |
| Accumulated Net Realized Losses | (2,833) |
| Unrealized Appreciation (Depreciation) | 3,060,029 |
| Net Assets | 20,798,021 |
• See Note A in Notes to Financial Statements.
1 Affiliated fund available only to Vanguard funds and certain trusts and accounts managed by Vanguard. Rate shown for Vanguard
Market Liquidity Fund is the 7-day yield.
See accompanying Notes, which are an integral part of the Financial Statements.
10
| Institutional Target Retirement 2040 Fund | |
| Statement of Operations | |
| Year Ended | |
| September 30, 2018 | |
| ($000) | |
| Investment Income | |
| Income | |
| Income Distributions Received from Affiliated Funds | 403,495 |
| Net Investment Income—Note B | 403,495 |
| Realized Net Gain (Loss) | |
| Capital Gain Distributions Received from Affiliated Funds | 346 |
| Affiliated Funds Sold | (2,432) |
| Futures Contracts | (678) |
| Realized Net Gain (Loss) | (2,764) |
| Change in Unrealized Appreciation (Depreciation) from Affiliated Funds | 1,133,364 |
| Net Increase (Decrease) in Net Assets Resulting from Operations | 1,534,095 |
See accompanying Notes, which are an integral part of the Financial Statements.
11
| Institutional Target Retirement 2040 Fund | ||
| Statement of Changes in Net Assets | ||
| Year Ended September 30, | ||
| 2018 | 2017 | |
| ($000) | ($000) | |
| Increase (Decrease) in Net Assets | ||
| Operations | ||
| Net Investment Income | 403,495 | 269,126 |
| Realized Net Gain (Loss) | (2,764) | 2,675 |
| Change in Unrealized Appreciation (Depreciation) | 1,133,364 | 1,540,042 |
| Net Increase (Decrease) in Net Assets Resulting from Operations | 1,534,095 | 1,811,843 |
| Distributions | ||
| Net Investment Income | (310,516) | (185,811) |
| Realized Capital Gain1 | (2,059) | (1,229) |
| Total Distributions | (312,575) | (187,040) |
| Capital Share Transactions | ||
| Issued | 6,519,462 | 5,265,281 |
| Issued in Lieu of Cash Distributions | 307,832 | 185,271 |
| Redeemed | (2,113,307) | (937,018) |
| Net Increase (Decrease) from Capital Share Transactions | 4,713,987 | 4,513,534 |
| Total Increase (Decrease) | 5,935,507 | 6,138,337 |
| Net Assets | ||
| Beginning of Period | 14,862,514 | 8,724,177 |
| End of Period2 | 20,798,021 | 14,862,514 |
1 Includes fiscal 2018 and 2017 short-term gain distributions totaling $1,716,000 and $709,000, respectively. Short-term gain
distributions are treated as ordinary income dividends for tax purposes.
2 Net Assets—End of Period includes undistributed (overdistributed) net investment income of $290,298,000 and $197,319,000.
See accompanying Notes, which are an integral part of the Financial Statements.
12
| Institutional Target Retirement 2040 Fund | ||||
| Financial Highlights | ||||
| June 26, | ||||
| 20151 to | ||||
| Year Ended September 30, | ||||
| For a Share Outstanding | Sept. 30, | |||
| Throughout Each Period | 2018 | 2017 | 2016 | 2015 |
| Net Asset Value, Beginning of Period | $22.93 | $20.10 | $18.08 | $20.00 |
| Investment Operations | ||||
| Net Investment Income2 | .535 | .494 | .461 | .151 |
| Capital Gain Distributions Received 2 | — | .002 | .002 | — |
| Net Realized and Unrealized Gain (Loss) on Investments | 1.601 | 2.730 | 1.718 | (2.071) |
| Total from Investment Operations | 2.136 | 3.226 | 2.181 | (1.920) |
| Distributions | ||||
| Dividends from Net Investment Income | (. 453) | (. 393) | (.161) | — |
| Distributions from Realized Capital Gains | (.003) | (.003) | — | — |
| Total Distributions | (.456) | (.396) | (.161) | — |
| Net Asset Value, End of Period | $24.61 | $22.93 | $20.10 | $18.08 |
| Total Return | 9.39% | 16.35% | 12.12% | -9.60% |
| Ratios/Supplemental Data | ||||
| Net Assets, End of Period (Millions) | $20,798 | $14,863 | $8,724 | $3,032 |
| Ratio of Total Expenses to Average Net Assets | — | — | — | — |
| Acquired Fund Fees and Expenses | 0.09% | 0.09% | 0.10% | 0.10%3 |
| Ratio of Net Investment Income to Average Net Assets | 2.24% | 2.32% | 2.62% | 2.81%3 |
| Portfolio Turnover Rate | 7% | 5% | 0% | 1% |
1 Inception.
2 Calculated based on average shares outstanding.
3 Annualized.
See accompanying Notes, which are an integral part of the Financial Statements.
13
Institutional Target Retirement 2040 Fund
Notes to Financial Statements
Vanguard Institutional Target Retirement 2040 Fund is registered under the Investment Company Act of 1940 as an open-end investment company, or mutual fund. The fund follows a balanced investment strategy by investing in selected Vanguard funds to achieve its targeted allocation of assets to U.S. and international stocks, and U.S. and international bonds. Financial statements and other information about each underlying fund are available on vanguard.com.
A. The following significant accounting policies conform to generally accepted accounting principles for U.S. investment companies. The fund consistently follows such policies in preparing its financial statements.
1. Security Valuation: Investments are valued at the net asset value of each underlying Vanguard fund determined as of the close of the New York Stock Exchange (generally 4 p.m., Eastern time) on the valuation date.
2. Futures Contracts: The fund uses stock and bond futures contracts to a limited extent, with the objectives of maintaining full exposure to the market and maintaining its target asset allocation. The primary risks associated with the use of futures contracts are imperfect correlation between changes in market values of investments held by the fund and the prices of futures contracts, and the possibility of an illiquid market. Counterparty risk involving futures is mitigated because a regulated clearinghouse is the counterparty instead of the clearing broker. To further mitigate counterparty risk, the fund trades futures contracts on an exchange, monitors the financial strength of its clearing brokers and clearinghouse, and has entered into clearing agreements with its clearing brokers. The clearinghouse imposes initial margin requirements to secure the fund’s performance and requires daily settlement of variation margin representing changes in the market value of each contract. Any assets pledged as initial margin for open contracts are noted in the Statement of Net Assets.
Futures contracts are valued at their quoted daily settlement prices. The notional amounts of the contracts are not recorded in the Statement of Net Assets. Fluctuations in the value of the contracts are recorded in the Statement of Assets and Liabilities as an asset (liability) and in the Statement of Operations as unrealized appreciation (depreciation) until the contracts are closed, when they are recorded as realized futures gains (losses).
During the year ended September 30, 2018, the fund’s average investments in long and short futures contracts each represented 0% of net assets, based on the average of the notional amounts at each quarter-end during the period. The fund had no open futures contracts at September 30, 2018.
3. Federal Income Taxes: The fund intends to continue to qualify as a regulated investment company and distribute all of its taxable income. Management has analyzed the fund’s tax positions taken for all open federal income tax years (September 30, 2015–2018), and has concluded that no provision for federal income tax is required in the fund’s financial statements.
4. Distributions: Distributions to shareholders are recorded on the ex-dividend date. Distributions are determined on a tax basis and may differ from net investment income and realized capital gains for financial reporting purposes.
14
Institutional Target Retirement 2040 Fund
5. Credit Facility: The fund and certain other funds managed by The Vanguard Group (“Vanguard”) participate in a $3.1 billion committed credit facility provided by a syndicate of lenders pursuant to a credit agreement that may be renewed annually; each fund is individually liable for its borrowings, if any, under the credit facility. Borrowings may be utilized for temporary and emergency purposes, and are subject to the fund’s regulatory and contractual borrowing restrictions. The participating funds are charged administrative fees and an annual commitment fee of 0.10% of the undrawn amount of the facility; these fees are allocated to the funds based on a method approved by the fund’s board of trustees and borne by the funds in which the fund invests (see Note B). Any borrowings under this facility bear interest at a rate based upon the higher of the one-month London Interbank Offered Rate, federal funds effective rate, or overnight bank funding rate plus an agreed-upon spread.
The fund had no borrowings outstanding at September 30, 2018, or at any time during the period then ended.
6. Other: Income and capital gain distributions received are recorded on the ex-dividend date. Security transactions are accounted for on the date securities are bought or sold. Costs used to determine realized gains (losses) on the sale of investment securities are those of the specific securities sold.
B. In accordance with the terms of a Funds’ Service Agreement (the “FSA”) between Vanguard and the fund, Vanguard furnishes to the fund investment advisory, corporate management, administrative, marketing, and distribution services at Vanguard’s cost of operations (as defined by the FSA). These costs of operations are allocated to the fund based on methods and guidelines approved by the board of trustees. The FSA provides that expenses otherwise allocable to Vanguard funds-of-funds may be reduced or eliminated to the extent of savings realized by the underlying Vanguard funds by virtue of being part of a fund-of-funds. Accordingly, all expenses for services provided by Vanguard to the fund and all other expenses incurred by the fund during the period ended September 30, 2018, were borne by the underlying Vanguard funds in which the fund invests. The fund’s trustees and officers are also trustees and officers, respectively, of the underlying Vanguard funds, as well as directors and employees, respectively, of Vanguard.
C. Various inputs may be used to determine the value of the fund’s investments. These inputs are summarized in three broad levels for financial statement purposes. The inputs or methodologies used to value securities are not necessarily an indication of the risk associated with investing in those securities.
Level 1—Quoted prices in active markets for identical securities.
Level 2—Other significant observable inputs (including quoted prices for similar securities, interest rates, prepayment speeds, credit risk, etc.).
Level 3—Significant unobservable inputs (including the fund’s own assumptions used to determine the fair value of investments). Any investments valued with significant unobservable inputs are noted on the Statement of Net Assets.
At September 30, 2018, 100% of the market value of the fund’s investments was determined based on Level 1 inputs.
15
Institutional Target Retirement 2040 Fund
D. Permanent differences between book-basis and tax-basis components of net assets, if any, are reclassified among capital accounts in the financial statements to reflect their tax character. These reclassifications have no effect on net assets or net asset value per share.
Temporary differences between book-basis and tax-basis components of accumulated net earnings (losses) arise when certain items of income, gain, or loss are recognized in different periods for financial statement and tax purposes; these differences will reverse at some time in the future. The differences are primarily related to the tax deferral of losses on wash sales. As of period end, the tax-basis components of accumulated net earnings (losses) are detailed in the table as follows:
| Amount | |
| ($000) | |
| Undistributed Ordinary Income | 291,293 |
| Undistributed Long-Term Gains | — |
| Capital Loss Carryforwards (Non-expiring) | — |
| Net Unrealized Gains (Losses) | 3,056,201 |
As of September 30, 2018, gross unrealized appreciation and depreciation for investments and derivatives based on cost for U.S. federal income tax purposes were as follows:
| Amount | ||
| ($000) | ||
| Tax Cost | 17,725,057 | |
| Gross Unrealized Appreciation | 3,196,146 | |
| Gross Unrealized Depreciation | (139,945) | |
| Net Unrealized Appreciation (Depreciation) | 3,056,201 | |
| E. Capital shares issued and redeemed were: | ||
| Year Ended September 30, | ||
| 2018 | 2017 | |
| Shares | Shares | |
| (000) | (000) | |
| Issued | 272,240 | 248,613 |
| Issued in Lieu of Cash Distributions | 13,000 | 9,301 |
| Redeemed | (88,336) | (43,745) |
| Net Increase (Decrease) in Shares Outstanding | 196,904 | 214,169 |
At September 30, 2018, one shareholder was the record or beneficial owner of 34% of the fund’s net assets. If the shareholder were to redeem its investment in the fund, the redemption might lead to the realization of taxable capital gains.
16
Institutional Target Retirement 2040 Fund
F. Transactions during the period in affiliated underlying Vanguard funds were as follows:
| Current Period Transactions | ||||||||
| Sept. 30, | Proceeds | Realized | Sept. 30, | |||||
| 2017 | from | Net | Change in | Capital Gain | 2018 | |||
| Market | Purchases | Securities | Gain | Unrealized | Distributions | Market | ||
| Value | at Cost | Sold | (Loss) | App. (Dep.) | Income | Received | Value | |
| ($000) | ($000) | ($000) | ($000) | ($000) | ($000) | ($000) | ($000) | |
| Vanguard Market | ||||||||
| Liquidity Fund | 2,675 | NA1 | NA1 | 5 | — | 52 | — | 748 |
| Vanguard Total | ||||||||
| Bond Market II | ||||||||
| Index Fund | 1,452,659 | 1,162,856 | 332,564 | — | (72,223) | 48,121 | 346 | 2,210,728 |
| Vanguard Total | ||||||||
| International Bond | ||||||||
| Index Fund | 585,456 | 311,724 | 2,140 | — | (669) | 16,016 | — | 894,371 |
| Vanguard Total | ||||||||
| International Stock | ||||||||
| Index Fund | 5,044,829 | 2,272,423 | 146,880 | (3,565) | (115,337) | 168,196 | — | 7,051,470 |
| Vanguard Total | ||||||||
| Stock Market | ||||||||
| Index Fund | 7,780,246 | 2,304,079 | 783,105 | 1,128 | 1,321,593 | 171,110 | — | 10,623,941 |
| Total | 14,865,865 | 6,051,082 | 1,264,689 | (2,432) | 1,133,364 | 403,495 | 346 | 20,781,258 |
| 1 Not applicable—purchases and sales are for temporary cash investment purposes. | ||||||||
G. Management has determined that no events or transactions occurred subsequent to September 30, 2018, that would require recognition or disclosure in these financial statements.
17
Institutional Target Retirement 2045 Fund
Fund Profile
As of September 30, 2018
| Total Fund Characteristics | |
| Ticker Symbol | VITLX |
| 30-Day SEC Yield | 2.28% |
| Acquired Fund Fees and Expenses1 | 0.09% |
| Allocation to Underlying Vanguard Funds | |
| Vanguard Total Stock Market Index Fund | |
| Institutional Shares | 54.1% |
| Vanguard Total International Stock Index | |
| Fund Investor Shares | 35.9 |
| Vanguard Total Bond Market II Index Fund | |
| Investor Shares | 7.1 |
| Vanguard Total International Bond Index | |
| Fund Admiral Shares | 2.9 |
Fund Asset Allocation
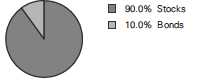
1 This figure—drawn from the prospectus dated January 25, 2018—represents an estimate of the weighted average of the expense ratios and any transaction fees charged by the underlying mutual funds (the ”acquired” funds) in which the Institutional Target Retirement 2045 Fund invests. The fund does not charge any expenses or fees of its own. For the fiscal year ended September 30, 2018, the acquired fund fees and expenses were 0.09%.
18
Institutional Target Retirement 2045 Fund
Performance Summary
All of the returns in this report represent past performance, which is not a guarantee of future results that may be achieved by the fund. (Current performance may be lower or higher than the performance data cited. For performance data current to the most recent month-end, visit our website at vanguard.com/performance.) Note, too, that both investment returns and principal value can fluctuate widely, so an investor’s shares, when sold, could be worth more or less than their original cost. The returns shown do not reflect taxes that a shareholder would pay on fund distributions or on the sale of fund shares.
Cumulative Performance: June 26, 2015, Through September 30, 2018
Initial Investment of $100,000,000
![]()
| Average Annual Total Returns | |||
| Periods Ended September 30, 2018 | |||
| Since | Final Value | ||
| One | Inception | of a $100,000,000 | |
| Year | (6/26/2015) | Investment | |
| Institutional Target Retirement 2045 | |||
| Fund* | 9.92% | 8.44% | $130,273,938 |
| Target 2045 Composite Index | 10.15 | 8.68 | 131,190,128 |
| Mixed-Asset Target 2045 Funds | |||
| Average | 9.11 | 7.66 | 127,214,642 |
| MSCI US Broad Market Index | 17.62 | 12.34 | 146,201,479 |
For a benchmark description, see the Glossary.
Mixed-Asset Target 2045 Funds Average: Derived from data provided by Lipper, a Thomson Reuters Company.
"Since Inception" performance is calculated from the fund's inception date for both the fund and its comparative standards.
See Financial Highlights for dividend and capital gains information.
19
Institutional Target Retirement 2045 Fund
Fiscal-Year Total Returns (%): June 26, 2015, Through September 30, 2018
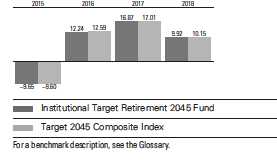
20
Institutional Target Retirement 2045 Fund
Financial Statements
Statement of Net Assets
As of September 30, 2018
The fund reports a complete list of its holdings in regulatory filings four times in each fiscal year, at the quarter-ends. For the second and fourth fiscal quarters, the lists appear in the fund’s semiannual and annual reports to shareholders. For the first and third fiscal quarters, the fund files the lists with the Securities and Exchange Commission on Form N-Q. Shareholders can look up the fund’s Forms N-Q on the SEC’s website at sec.gov. Forms N-Q may also be reviewed and copied at the SEC’s Public Reference Room (see the back cover of this report for further information).
| Market | ||
| Value• | ||
| Shares | ($000) | |
| Investment Companies (99.9%) | ||
| U.S. Stock Fund (54.0%) | ||
| Vanguard Total Stock Market Index Fund Institutional Shares | 128,857,157 | 9,387,244 |
| International Stock Fund (35.9%) | ||
| Vanguard Total International Stock Index Fund Investor Shares | 359,433,328 | 6,239,763 |
| U.S. Bond Fund (7.1%) | ||
| 1 Vanguard Total Bond Market II Index Fund Investor Shares | 119,293,335 | 1,232,300 |
| International Bond Fund (2.9%) | ||
| Vanguard Total International Bond Index Fund Admiral Shares | 23,258,793 | 506,111 |
| Total Investment Companies (Cost $14,771,534) | 17,365,418 | |
| Temporary Cash Investment (0.0%) | ||
| Money Market Fund (0.0%) | ||
| 1 Vanguard Market Liquidity Fund, 2.209% (Cost $866) | 8,661 | 866 |
| Total Investments (99.9%) (Cost $14,772,400) | 17,366,284 | |
| Other Assets and Liabilities (0.1%) | ||
| Other Assets | 84,717 | |
| Liabilities | (67,702) | |
| 17,015 | ||
| Net Assets (100%) | ||
| Applicable to 699,378,949 outstanding $.001 par value shares of | ||
| beneficial interest (unlimited authorization) | 17,383,299 | |
| Net Asset Value Per Share | $24.86 | |
21
| Institutional Target Retirement 2045 Fund | |
| Amount | |
| ($000) | |
| Statement of Assets and Liabilities | |
| Assets | |
| Investments in Securities, at Value—Affiliated Funds | 17,366,284 |
| Receivables for Investment Securities Sold | 49,641 |
| Receivables for Accrued Income | 3,281 |
| Receivables for Capital Shares Issued | 31,785 |
| Other Assets | 10 |
| Total Assets | 17,451,001 |
| Liabilities | |
| Payables for Investment Securities Purchased | 3,280 |
| Payables for Capital Shares Redeemed | 64,422 |
| Total Liabilities | 67,702 |
| Net Assets | 17,383,299 |
| At September 30, 2018, net assets consisted of: | |
| Amount | |
| ($000) | |
| Paid-in Capital | 14,551,458 |
| Undistributed Net Investment Income | 240,468 |
| Accumulated Net Realized Losses | (2,511) |
| Unrealized Appreciation (Depreciation) | 2,593,884 |
| Net Assets | 17,383,299 |
��� See Note A in Notes to Financial Statements.
1 Affiliated fund available only to Vanguard funds and certain trusts and accounts managed by Vanguard. Rate shown for Vanguard
Market Liquidity Fund is the 7-day yield.
See accompanying Notes, which are an integral part of the Financial Statements.
22
| Institutional Target Retirement 2045 Fund | |
| Statement of Operations | |
| Year Ended | |
| September 30, 2018 | |
| ($000) | |
| Investment Income | |
| Income | |
| Income Distributions Received from Affiliated Funds | 331,939 |
| Net Investment Income—Note B | 331,939 |
| Realized Net Gain (Loss) | |
| Capital Gain Distributions Received from Affiliated Funds | 205 |
| Affiliated Funds Sold | (2,139) |
| Futures Contracts | (539) |
| Realized Net Gain (Loss) | (2,473) |
| Change in Unrealized Appreciation (Depreciation) from Affiliated Funds | 990,917 |
| Net Increase (Decrease) in Net Assets Resulting from Operations | 1,320,383 |
See accompanying Notes, which are an integral part of the Financial Statements.
23
| Institutional Target Retirement 2045 Fund | ||
| Statement of Changes in Net Assets | ||
| Year Ended September 30, | ||
| 2018 | 2017 | |
| ($000) | ($000) | |
| Increase (Decrease) in Net Assets | ||
| Operations | ||
| Net Investment Income | 331,939 | 219,189 |
| Realized Net Gain (Loss) | (2,473) | 2,638 |
| Change in Unrealized Appreciation (Depreciation) | 990,917 | 1,297,074 |
| Net Increase (Decrease) in Net Assets Resulting from Operations | 1,320,383 | 1,518,901 |
| Distributions | ||
| Net Investment Income | (252,433) | (147,574) |
| Realized Capital Gain1 | (2,112) | (873) |
| Total Distributions | (254,545) | (148,447) |
| Capital Share Transactions | ||
| Issued | 5,744,083 | 4,325,560 |
| Issued in Lieu of Cash Distributions | 251,301 | 146,968 |
| Redeemed | (1,731,660) | (778,614) |
| Net Increase (Decrease) from Capital Share Transactions | 4,263,724 | 3,693,914 |
| Total Increase (Decrease) | 5,329,562 | 5,064,368 |
| Net Assets | ||
| Beginning of Period | 12,053,737 | 6,989,369 |
| End of Period2 | 17,383,299 | 12,053,737 |
1 Includes fiscal 2018 and 2017 short-term gain distributions totaling $1,946,000 and $493,000, respectively. Short-term gain
distributions are treated as ordinary income dividends for tax purposes.
2 Net Assets—End of Period includes undistributed (overdistributed) net investment income of $240,468,000 and $160,962,000.
See accompanying Notes, which are an integral part of the Financial Statements.
24
| Institutional Target Retirement 2045 Fund | ||||
| Financial Highlights | ||||
| June 26, | ||||
| Year Ended September 30, | 20151 to | |||
| For a Share Outstanding | Sept. 30, | |||
| Throughout Each Period | 2018 | 2017 | 2016 | 2015 |
| Net Asset Value, Beginning of Period | $23.05 | $20.11 | $18.07 | $20.00 |
| Investment Operations | ||||
| Net Investment Income2 | .538 | .497 | .464 | .149 |
| Capital Gain Distributions Received 2 | — | .001 | .002 | — |
| Net Realized and Unrealized Gain (Loss) on Investments | 1.730 | 2.833 | 1.736 | (2.079) |
| Total from Investment Operations | 2.268 | 3.331 | 2.202 | (1.930) |
| Distributions | ||||
| Dividends from Net Investment Income | (. 454) | (. 389) | (.162) | — |
| Distributions from Realized Capital Gains | (.004) | (.002) | — | — |
| Total Distributions | (. 458) | (. 391) | (.162) | — |
| Net Asset Value, End of Period | $24.86 | $23.05 | $20.11 | $18.07 |
| Total Return | 9.92% | 16.87% | 12.24% | -9.65% |
| Ratios/Supplemental Data | ||||
| Net Assets, End of Period (Millions) | $17,383 | $12,054 | $6,989 | $2,317 |
| Ratio of Total Expenses to Average Net Assets | — | — | — | — |
| Acquired Fund Fees and Expenses | 0.09% | 0.09% | 0.10% | 0.10%3 |
| Ratio of Net Investment Income to Average Net Assets | 2.23% | 2.33% | 2.42% | 2.79%3 |
| Portfolio Turnover Rate | 6% | 5% | 1% | 0% |
1 Inception.
2 Calculated based on average shares outstanding.
3 Annualized.
See accompanying Notes, which are an integral part of the Financial Statements.
25
Institutional Target Retirement 2045 Fund
Notes to Financial Statements
Vanguard Institutional Target Retirement 2045 Fund is registered under the Investment Company Act of 1940 as an open-end investment company, or mutual fund. The fund follows a balanced investment strategy by investing in selected Vanguard funds to achieve its targeted allocation of assets to U.S. and international stocks, and U.S. and international bonds. Financial statements and other information about each underlying fund are available on vanguard.com.
A. The following significant accounting policies conform to generally accepted accounting principles for U.S. investment companies. The fund consistently follows such policies in preparing its financial statements.
1. Security Valuation: Investments are valued at the net asset value of each underlying Vanguard fund determined as of the close of the New York Stock Exchange (generally 4 p.m., Eastern time) on the valuation date.
2. Futures Contracts: The fund uses stock and bond futures contracts to a limited extent, with the objectives of maintaining full exposure to the market and maintaining its target asset allocation. The primary risks associated with the use of futures contracts are imperfect correlation between changes in market values of investments held by the fund and the prices of futures contracts, and the possibility of an illiquid market. Counterparty risk involving futures is mitigated because a regulated clearinghouse is the counterparty instead of the clearing broker. To further mitigate counterparty risk, the fund trades futures contracts on an exchange, monitors the financial strength of its clearing brokers and clearinghouse, and has entered into clearing agreements with its clearing brokers. The clearinghouse imposes initial margin requirements to secure the fund’s performance and requires daily settlement of variation margin representing changes in the market value of each contract. Any assets pledged as initial margin for open contracts are noted in the Statement of Net Assets.
Futures contracts are valued at their quoted daily settlement prices. The notional amounts of the contracts are not recorded in the Statement of Net Assets. Fluctuations in the value of the contracts are recorded in the Statement of Assets and Liabilities as an asset (liability) and in the Statement of Operations as unrealized appreciation (depreciation) until the contracts are closed, when they are recorded as realized futures gains (losses).
During the year ended September 30, 2018, the fund’s average investments in long and short futures contracts each represented 0% of net assets, based on the average of the notional amounts at each quarter-end during the period. The fund had no open futures contracts at September 30, 2018.
3. Federal Income Taxes: The fund intends to continue to qualify as a regulated investment company and distribute all of its taxable income. Management has analyzed the fund’s tax positions taken for all open federal income tax years (September 30, 2015–2018), and has concluded that no provision for federal income tax is required in the fund’s financial statements.
4. Distributions: Distributions to shareholders are recorded on the ex-dividend date. Distributions are determined on a tax basis and may differ from net investment income and realized capital gains for financial reporting purposes.
26
Institutional Target Retirement 2045 Fund
5. Credit Facility: The fund and certain other funds managed by The Vanguard Group (“Vanguard”) participate in a $3.1 billion committed credit facility provided by a syndicate of lenders pursuant to a credit agreement that may be renewed annually; each fund is individually liable for its borrowings, if any, under the credit facility. Borrowings may be utilized for temporary and emergency purposes, and are subject to the fund’s regulatory and contractual borrowing restrictions. The participating funds are charged administrative fees and an annual commitment fee of 0.10% of the undrawn amount of the facility; these fees are allocated to the funds based on a method approved by the fund’s board of trustees and borne by the funds in which the fund invests (see Note B). Any borrowings under this facility bear interest at a rate based upon the higher of the one-month London Interbank Offered Rate, federal funds effective rate, or overnight bank funding rate plus an agreed-upon spread.
The fund had no borrowings outstanding at September 30, 2018, or at any time during the period then ended.
6. Other: Income and capital gain distributions received are recorded on the ex-dividend date. Security transactions are accounted for on the date securities are bought or sold. Costs used to determine realized gains (losses) on the sale of investment securities are those of the specific securities sold.
B. In accordance with the terms of a Funds’ Service Agreement (the “FSA”) between Vanguard and the fund, Vanguard furnishes to the fund investment advisory, corporate management, administrative, marketing, and distribution services at Vanguard’s cost of operations (as defined by the FSA). These costs of operations are allocated to the fund based on methods and guidelines approved by the board of trustees. The FSA provides that expenses otherwise allocable to Vanguard funds-of-funds may be reduced or eliminated to the extent of savings realized by the underlying Vanguard funds by virtue of being part of a fund-of-funds. Accordingly, all expenses for services provided by Vanguard to the fund and all other expenses incurred by the fund during the period ended September 30, 2018, were borne by the underlying Vanguard funds in which the fund invests. The fund’s trustees and officers are also trustees and officers, respectively, of the underlying Vanguard funds, as well as directors and employees, respectively, of Vanguard.
C. Various inputs may be used to determine the value of the fund’s investments. These inputs are summarized in three broad levels for financial statement purposes. The inputs or methodologies used to value securities are not necessarily an indication of the risk associated with investing in those securities.
Level 1—Quoted prices in active markets for identical securities.
Level 2—Other significant observable inputs (including quoted prices for similar securities, interest rates, prepayment speeds, credit risk, etc.).
Level 3—Significant unobservable inputs (including the fund’s own assumptions used to determine the fair value of investments). Any investments valued with significant unobservable inputs are noted on the Statement of Net Assets.
At September 30, 2018, 100% of the market value of the fund’s investments was determined based on Level 1 inputs.
27
Institutional Target Retirement 2045 Fund
D. Permanent differences between book-basis and tax-basis components of net assets, if any, are reclassified among capital accounts in the financial statements to reflect their tax character. These reclassifications have no effect on net assets or net asset value per share.
Temporary differences between book-basis and tax-basis components of accumulated net earnings (losses) arise when certain items of income, gain, or loss are recognized in different periods for financial statement and tax purposes; these differences will reverse at some time in the future. The differences are primarily related to the tax deferral of losses on wash sales. As of period end, the tax-basis components of accumulated net earnings (losses) are detailed in the table as follows:
| Amount | |
| ($000) | |
| Undistributed Ordinary Income | 242,046 |
| Undistributed Long-Term Gains | — |
| Capital Loss Carryforwards (Non-expiring) | — |
| Net Unrealized Gains (Losses) | 2,589,795 |
As of September 30, 2018, gross unrealized appreciation and depreciation for investments and derivatives based on cost for U.S. federal income tax purposes were as follows:
| Amount | ||
| ($000) | ||
| Tax Cost | 14,776,489 | |
| Gross Unrealized Appreciation | 2,700,369 | |
| Gross Unrealized Depreciation | (110,574) | |
| Net Unrealized Appreciation (Depreciation) | 2,589,795 | |
| E. Capital shares issued and redeemed were: | ||
| Year Ended September 30, | ||
| 2018 | 2017 | |
| Shares | Shares | |
| (000) | (000) | |
| Issued | 237,715 | 203,890 |
| Issued in Lieu of Cash Distributions | 10,532 | 7,367 |
| Redeemed | (71,706) | (35,984) |
| Net Increase (Decrease) in Shares Outstanding | 176,541 | 175,273 |
At September 30, 2018, one shareholder was the record or beneficial owner of 31% of the fund’s net assets. If the shareholder were to redeem its investment in the fund, the redemption might lead to the realization of taxable capital gains.
28
Institutional Target Retirement 2045 Fund
F. Transactions during the period in affiliated underlying Vanguard funds were as follows:
| Current Period Transactions | ||||||||
| Sept. 30, | Proceeds | Realized | Sept. 30, | |||||
| 2017 | from | Net | Change in | Capital Gain | 2018 | |||
| Market | Purchases | Securities | Gain | Unrealized | Distributions | Market | ||
| Value | at Cost | Sold | (Loss) | App. (Dep.) | Income | Received | Value | |
| ($000) | ($000) | ($000) | ($000) | ($000) | ($000) | ($000) | ($000) | |
| Vanguard Market | ||||||||
| Liquidity Fund | 3,581 | NA1 | NA1 | 3 | — | 69 | — | 866 |
| Vanguard Total | ||||||||
| Bond Market II | ||||||||
| Index Fund | 856,136 | 640,091 | 222,242 | (1,430) | (40,255) | 27,678 | 205 | 1,232,300 |
| Vanguard Total | ||||||||
| International Bond | ||||||||
| Index Fund | 351,712 | 154,793 | — | — | (394) | 9,352 | — | 506,111 |
| Vanguard Total | ||||||||
| International Stock | ||||||||
| Index Fund | 4,305,441 | 2,135,586 | 88,322 | (2,454) | (110,488) | 146,197 | — | 6,239,763 |
| Vanguard Total | ||||||||
| Stock Market | ||||||||
| Index Fund | 6,529,807 | 2,323,343 | 609,702 | 1,742 | 1,142,054 | 148,643 | — | 9,387,244 |
| Total | 12,046,677 | 5,253,813 | 920,266 | (2,139) | 990,917 | 331,939 | 205 | 17,366,284 |
| 1 Not applicable—purchases and sales are for temporary cash investment purposes. | ||||||||
G. Management has determined that no events or transactions occurred subsequent to September 30, 2018, that would require recognition or disclosure in these financial statements.
29
Institutional Target Retirement 2050 Fund
Fund Profile
As of September 30, 2018
| Total Fund Characteristics | |
| Ticker Symbol | VTRLX |
| 30-Day SEC Yield | 2.29% |
| Acquired Fund Fees and Expenses1 | 0.09% |
| Allocation to Underlying Vanguard Funds | |
| Vanguard Total Stock Market Index Fund | |
| Institutional Shares | 54.0% |
| Vanguard Total International Stock Index | |
| Fund Investor Shares | 36.0 |
| Vanguard Total Bond Market II Index Fund | |
| Investor Shares | 7.1 |
| Vanguard Total International Bond Index | |
| Fund Admiral Shares | 2.9 |
Fund Asset Allocation
1 This figure—drawn from the prospectus dated January 25, 2018—represents an estimate of the weighted average of the expense ratios and any transaction fees charged by the underlying mutual funds (the ”acquired” funds) in which the Institutional Target Retirement 2050 Fund invests. The fund does not charge any expenses or fees of its own. For the fiscal year ended September 30, 2018, the acquired fund fees and expenses were 0.09%.
30
Institutional Target Retirement 2050 Fund
Performance Summary
All of the returns in this report represent past performance, which is not a guarantee of future results that may be achieved by the fund. (Current performance may be lower or higher than the performance data cited. For performance data current to the most recent month-end, visit our website at vanguard.com/performance.) Note, too, that both investment returns and principal value can fluctuate widely, so an investor’s shares, when sold, could be worth more or less than their original cost. The returns shown do not reflect taxes that a shareholder would pay on fund distributions or on the sale of fund shares.
Cumulative Performance: June 26, 2015, Through September 30, 2018
Initial Investment of $100,000,000
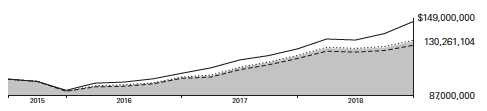
| Average Annual Total Returns | |||
| Periods Ended September 30, 2018 | |||
| Since | Final Value | ||
| One | Inception | of a $100,000,000 | |
| Year | (6/26/2015) | Investment | |
| Institutional Target Retirement 2050 | |||
| Fund* | 9.88% | 8.44% | $130,261,104 |
| Target 2050 Composite Index | 10.15 | 8.68 | 131,190,128 |
| Mixed-Asset Target 2050 Funds | |||
| Average | 9.09 | 7.64 | 127,165,297 |
| MSCI US Broad Market Index | 17.62 | 12.34 | 146,201,479 |
For a benchmark description, see the Glossary.
Mixed-Asset Target 2050 Funds Average: Derived from data provided by Lipper, a Thomson Reuters Company.
"Since Inception" performance is calculated from the fund's inception date for both the fund and its comparative standards.
See Financial Highlights for dividend and capital gains information.
31
Institutional Target Retirement 2050 Fund
Fiscal-Year Total Returns (%): June 26, 2015, Through September 30, 2018
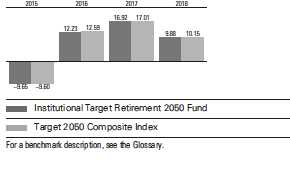
32
Institutional Target Retirement 2050 Fund
Financial Statements
Statement of Net Assets
As of September 30, 2018
The fund reports a complete list of its holdings in regulatory filings four times in each fiscal year, at the quarter-ends. For the second and fourth fiscal quarters, the lists appear in the fund’s semiannual and annual reports to shareholders. For the first and third fiscal quarters, the fund files the lists with the Securities and Exchange Commission on Form N-Q. Shareholders can look up the fund’s Forms N-Q on the SEC’s website at sec.gov. Forms N-Q may also be reviewed and copied at the SEC’s Public Reference Room (see the back cover of this report for further information).
| Market | ||
| Value• | ||
| Shares | ($000) | |
| Investment Companies (99.9%) | ||
| U.S. Stock Fund (54.0%) | ||
| Vanguard Total Stock Market Index Fund Institutional Shares | 91,435,651 | 6,661,087 |
| International Stock Fund (35.9%) | ||
| Vanguard Total International Stock Index Fund Investor Shares | 255,632,402 | 4,437,779 |
| U.S. Bond Fund (7.1%) | ||
| 1 Vanguard Total Bond Market II Index Fund Investor Shares | 84,804,071 | 876,026 |
| International Bond Fund (2.9%) | ||
| Vanguard Total International Bond Index Fund Admiral Shares | 16,454,197 | 358,043 |
| Total Investment Companies (Cost $10,630,219) | 12,332,935 | |
| Temporary Cash Investment (0.0%) | ||
| Money Market Fund (0.0%) | ||
| 1 Vanguard Market Liquidity Fund, 2.209% (Cost $681) | 6,811 | 681 |
| Total Investments (99.9%) (Cost $10,630,900) | 12,333,616 | |
| Other Assets and Liabilities (0.1%) | ||
| Other Assets | 89,320 | |
| Liabilities | (72,495) | |
| 16,825 | ||
| Net Assets (100%) | ||
| Applicable to 496,437,097 outstanding $.001 par value shares of | ||
| beneficial interest (unlimited authorization) | 12,350,441 | |
| Net Asset Value Per Share | $24.88 | |
33
| Institutional Target Retirement 2050 Fund | |
| Amount | |
| ($000) | |
| Statement of Assets and Liabilities | |
| Assets | |
| Investments in Securities, at Value—Affiliated Funds | 12,333,616 |
| Receivables for Investment Securities Sold | 56,727 |
| Receivables for Accrued Income | 2,482 |
| Receivables for Capital Shares Issued | 30,090 |
| Other Assets | 21 |
| Total Assets | 12,422,936 |
| Liabilities | |
| Payables for Investment Securities Purchased | 2,337 |
| Payables for Capital Shares Redeemed | 70,158 |
| Total Liabilities | 72,495 |
| Net Assets | 12,350,441 |
| At September 30, 2018, net assets consisted of: | |
| Amount | |
| ($000) | |
| Paid-in Capital | 10,484,123 |
| Undistributed Net Investment Income | 167,815 |
| Accumulated Net Realized Losses | (4,213) |
| Unrealized Appreciation (Depreciation) | 1,702,716 |
| Net Assets | 12,350,441 |
• See Note A in Notes to Financial Statements.
1 Affiliated fund available only to Vanguard funds and certain trusts and accounts managed by Vanguard. Rate shown for Vanguard
Market Liquidity Fund is the 7-day yield.
See accompanying Notes, which are an integral part of the Financial Statements.
34
| Institutional Target Retirement 2050 Fund | |
| Statement of Operations | |
| Year Ended | |
| September 30, 2018 | |
| ($000) | |
| Investment Income | |
| Income | |
| Income Distributions Received from Affiliated Funds | 228,776 |
| Other Income | 146 |
| Net Investment Income—Note B | 228,922 |
| Realized Net Gain (Loss) | |
| Capital Gain Distributions Received from Affiliated Funds | 137 |
| Affiliated Funds Sold | (3,813) |
| Futures Contracts | (293) |
| Realized Net Gain (Loss) | (3,969) |
| Change in Unrealized Appreciation (Depreciation) from Affiliated Funds | 672,212 |
| Net Increase (Decrease) in Net Assets Resulting from Operations | 897,165 |
See accompanying Notes, which are an integral part of the Financial Statements.
35
| Institutional Target Retirement 2050 Fund | ||
| Statement of Changes in Net Assets | ||
| Year Ended September 30, | ||
| 2018 | 2017 | |
| ($000) | ($000) | |
| Increase (Decrease) in Net Assets | ||
| Operations | ||
| Net Investment Income | 228,922 | 141,810 |
| Realized Net Gain (Loss) | (3,969) | 1,886 |
| Change in Unrealized Appreciation (Depreciation) | 672,212 | 838,364 |
| Net Increase (Decrease) in Net Assets Resulting from Operations | 897,165 | 982,060 |
| Distributions | ||
| Net Investment Income | (165,211) | (90,785) |
| Realized Capital Gain1 | (1,818) | (502) |
| Total Distributions | (167,029) | (91,287) |
| Capital Share Transactions | ||
| Issued | 4,756,671 | 3,268,759 |
| Issued in Lieu of Cash Distributions | 164,754 | 90,205 |
| Redeemed | (1,251,343) | (628,910) |
| Net Increase (Decrease) from Capital Share Transactions | 3,670,082 | 2,730,054 |
| Total Increase (Decrease) | 4,400,218 | 3,620,827 |
| Net Assets | ||
| Beginning of Period | 7,950,223 | 4,329,396 |
| End of Period2 | 12,350,441 | 7,950,223 |
1 Includes fiscal 2018 and 2017 short-term gain distributions totaling $1,707,000 and $287,000 respectively. Short-term gain
distributions are treated as ordinary income dividends for tax purposes.
2 Net Assets—End of Period includes undistributed (overdistributed) net investment income of $167,815,000 and $104,104,000.
See accompanying Notes, which are an integral part of the Financial Statements.
36
| Institutional Target Retirement 2050 Fund | ||||
| Financial Highlights | ||||
| June 26, | ||||
| 20151 to | ||||
| For a Share Outstanding | Year Ended September 30, | Sept. 30, | ||
| Throughout Each Period | 2018 | 2017 | 2016 | 2015 |
| Net Asset Value, Beginning of Period | $23.07 | $20.11 | $18.07 | $20.00 |
| Investment Operations | ||||
| Net Investment Income2 | .542 | .503 | .466 | .149 |
| Capital Gain Distributions Received 2 | — | .001 | .002 | — |
| Net Realized and Unrealized Gain (Loss) on Investments | 1.718 | 2.838 | 1.732 | (2.079) |
| Total from Investment Operations | 2.260 | 3.342 | 2.200 | (1.930) |
| Distributions | ||||
| Dividends from Net Investment Income | (. 445) | (. 380) | (.160) | — |
| Distributions from Realized Capital Gains | (.005) | (.002) | — | — |
| Total Distributions | (. 450) | (. 382) | (.160) | — |
| Net Asset Value, End of Period | $24.88 | $23.07 | $20.11 | $18.07 |
| Total Return | 9.88% | 16.92% | 12.23% | -9.65% |
| Ratios/Supplemental Data | ||||
| Net Assets, End of Period (Millions) | $12,350 | $7,950 | $4,329 | $1,259 |
| Ratio of Total Expenses to Average Net Assets | — | — | — | — |
| Acquired Fund Fees and Expenses | 0.09% | 0.09% | 0.10% | 0.10%3 |
| Ratio of Net Investment Income to Average Net Assets | 2.24% | 2.34% | 2.43% | 2.81%3 |
| Portfolio Turnover Rate | 5% | 5% | 1% | 1% |
1 Inception.
2 Calculated based on average shares outstanding.
3 Annualized.
See accompanying Notes, which are an integral part of the Financial Statements.
37
Institutional Target Retirement 2050 Fund
Notes to Financial Statements
Vanguard Institutional Target Retirement 2050 Fund is registered under the Investment Company Act of 1940 as an open-end investment company, or mutual fund. The fund follows a balanced investment strategy by investing in selected Vanguard funds to achieve its targeted allocation of assets to U.S. and international stocks, and U.S. and international bonds. Financial statements and other information about each underlying fund are available on vanguard.com.
A. The following significant accounting policies conform to generally accepted accounting principles for U.S. investment companies. The fund consistently follows such policies in preparing its financial statements.
1. Security Valuation: Investments are valued at the net asset value of each underlying Vanguard fund determined as of the close of the New York Stock Exchange (generally 4 p.m., Eastern time) on the valuation date.
2. Futures Contracts: The fund uses stock and bond futures contracts to a limited extent, with the objectives of maintaining full exposure to the market and maintaining its target asset allocation. The primary risks associated with the use of futures contracts are imperfect correlation between changes in market values of investments held by the fund and the prices of futures contracts, and the possibility of an illiquid market. Counterparty risk involving futures is mitigated because a regulated clearing-house is the counterparty instead of the clearing broker. To further mitigate counterparty risk, the fund trades futures contracts on an exchange, monitors the financial strength of its clearing brokers and clearinghouse, and has entered into clearing agreements with its clearing brokers. The clearing-house imposes initial margin requirements to secure the fund’s performance and requires daily settlement of variation margin representing changes in the market value of each contract. Any assets pledged as initial margin for open contracts are noted in the Statement of Net Assets.
Futures contracts are valued at their quoted daily settlement prices. The notional amounts of the contracts are not recorded in the Statement of Net Assets. Fluctuations in the value of the contracts are recorded in the Statement of Assets and Liabilities as an asset (liability) and in the Statement of Operations as unrealized appreciation (depreciation) until the contracts are closed, when they are recorded as realized futures gains (losses).
During the year ended September 30, 2018, the fund’s average investments in long and short futures contracts each represented 0% of net assets, based on the average of the notional amounts at each quarter-end during the period. The fund had no open futures contracts at September 30, 2018.
3. Federal Income Taxes: The fund intends to continue to qualify as a regulated investment company and distribute all of its taxable income. Management has analyzed the fund’s tax positions taken for all open federal income tax years (September 30, 2015–2018), and has concluded that no provision for federal income tax is required in the fund’s financial statements.
4. Distributions: Distributions to shareholders are recorded on the ex-dividend date. Distributions are determined on a tax basis and may differ from net investment income and realized capital gains for financial reporting purposes.
38
Institutional Target Retirement 2050 Fund
5. Credit Facility: The fund and certain other funds managed by The Vanguard Group (“Vanguard”) participate in a $3.1 billion committed credit facility provided by a syndicate of lenders pursuant to a credit agreement that may be renewed annually; each fund is individually liable for its borrowings, if any, under the credit facility. Borrowings may be utilized for temporary and emergency purposes, and are subject to the fund’s regulatory and contractual borrowing restrictions. The participating funds are charged administrative fees and an annual commitment fee of 0.10% of the undrawn amount of the facility; these fees are allocated to the funds based on a method approved by the fund’s board of trustees and borne by the funds in which the fund invests (see Note B). Any borrowings under this facility bear interest at a rate based upon the higher of the one-month London Interbank Offered Rate, federal funds effective rate, or overnight bank funding rate plus an agreed-upon spread.
The fund had no borrowings outstanding at September 30, 2018, or at any time during the period then ended.
6. Other: Income and capital gain distributions received are recorded on the ex-dividend date. Security transactions are accounted for on the date securities are bought or sold. Costs used to determine realized gains (losses) on the sale of investment securities are those of the specific securities sold.
B. In accordance with the terms of a Funds’ Service Agreement (the “FSA”) between Vanguard and the fund, Vanguard furnishes to the fund investment advisory, corporate management, administrative, marketing, and distribution services at Vanguard’s cost of operations (as defined by the FSA). These costs of operations are allocated to the fund based on methods and guidelines approved by the board of trustees. The FSA provides that expenses otherwise allocable to Vanguard funds-of-funds may be reduced or eliminated to the extent of savings realized by the underlying Vanguard funds by virtue of being part of a fund-of-funds. Accordingly, all expenses for services provided by Vanguard to the fund and all other expenses incurred by the fund during the period ended September 30, 2018, were borne by the underlying Vanguard funds in which the fund invests. The fund’s trustees and officers are also trustees and officers, respectively, of the underlying Vanguard funds, as well as directors and employees, respectively, of Vanguard.
C. Various inputs may be used to determine the value of the fund’s investments. These inputs are summarized in three broad levels for financial statement purposes. The inputs or methodologies used to value securities are not necessarily an indication of the risk associated with investing in those securities.
Level 1—Quoted prices in active markets for identical securities.
Level 2—Other significant observable inputs (including quoted prices for similar securities, interest rates, prepayment speeds, credit risk, etc.).
Level 3—Significant unobservable inputs (including the fund’s own assumptions used to determine the fair value of investments). Any investments valued with significant unobservable inputs are noted on the Statement of Net Assets.
At September 30, 2018, 100% of the market value of the fund’s investments was determined based on Level 1 inputs.
39
Institutional Target Retirement 2050 Fund
D. Permanent differences between book-basis and tax-basis components of net assets, if any, are reclassified among capital accounts in the financial statements to reflect their tax character. These reclassifications have no effect on net assets or net asset value per share.
Temporary differences between book-basis and tax-basis components of accumulated net earnings (losses) arise when certain items of income, gain, or loss are recognized in different periods for financial statement and tax purposes; these differences will reverse at some time in the future. The differences are primarily related to the tax deferral of losses on wash sales. As of period end, the tax-basis components of accumulated net earnings (losses) are detailed in the table as follows:
| Amount | |
| ($000) | |
| Undistributed Ordinary Income | 168,116 |
| Undistributed Long-Term Gains | — |
| Capital Loss Carryforwards (Non-expiring) | — |
| Net Unrealized Gains (Losses) | 1,698,202 |
As of September 30, 2018, gross unrealized appreciation and depreciation for investments and derivatives based on cost for U.S. federal income tax purposes were as follows:
| Amount | ||
| ($000) | ||
| Tax Cost | 10,635,414 | |
| Gross Unrealized Appreciation | 1,783,751 | |
| Gross Unrealized Depreciation | (85,549) | |
| Net Unrealized Appreciation (Depreciation) | 1,698,202 | |
| E. Capital shares issued and redeemed were: | ||
| Year Ended September 30, | ||
| 2018 | 2017 | |
| Shares | Shares | |
| (000) | (000) | |
| Issued | 196,601 | 153,901 |
| Issued in Lieu of Cash Distributions | 6,899 | 4,519 |
| Redeemed | (51,709) | (29,024) |
| Net Increase (Decrease) in Shares Outstanding | 151,791 | 129,396 |
At September 30, 2018, one shareholder was the record or beneficial owner of 30% of the fund’s net assets. If the shareholder were to redeem its investment in the fund, the redemption might lead to the realization of taxable capital gains.
40
Institutional Target Retirement 2050 Fund
F. Transactions during the period in affiliated underlying Vanguard funds were as follows:
| Current Period Transactions | ||||||||
| Sept. 30, | Proceeds | Realized | Sept. 30, | |||||
| 2017 | from | Net | Change in | Capital Gain | 2018 | |||
| Market | Purchases | Securities | Gain | Unrealized | Distributions | Market | ||
| Value | at Cost | Sold | (Loss) | App. (Dep.) | Income | Received | Value | |
| ($000) | ($000) | ($000) | ($000) | ($000) | ($000) | ($000) | ($000) | |
| Vanguard Market | ||||||||
| Liquidity Fund | 2,047 | NA1 | NA1 | 3 | — | 67 | — | 681 |
| Vanguard Total | ||||||||
| Bond Market II | ||||||||
| Index Fund | 559,679 | 493,838 | 149,077 | (1,103) | (27,311) | 19,012 | 137 | 876,026 |
| Vanguard Total | ||||||||
| International Bond | ||||||||
| Index Fund | 231,846 | 126,479 | — | — | (282) | 6,298 | — | 358,043 |
| Vanguard Total | ||||||||
| International Stock | ||||||||
| Index Fund | 2,840,923 | 1,744,303 | 62,573 | (2,999) | (81,875) | 100,780 | — | 4,437,779 |
| Vanguard Total | ||||||||
| Stock Market | ||||||||
| Index Fund | 4,310,066 | 1,873,211 | 304,156 | 286 | 781,680 | 102,619 | — | 6,661,087 |
| Total | 7,944,561 | 4,237,831 | 515,806 | (3,813) | 672,212 | 228,776 | 137 | 12,333,616 |
| 1 | Not applicable—purchases and sales are for temporary cash investment purposes. |
G. Management has determined that no events or transactions occurred subsequent to September 30, 2018, that would require recognition or disclosure in these financial statements.
41
Institutional Target Retirement 2055 Fund
Fund Profile
As of September 30, 2018
| Total Fund Characteristics | |
| Ticker Symbol | VIVLX |
| 30-Day SEC Yield | 2.30% |
| Acquired Fund Fees and Expenses1 | 0.09% |
| Allocation to Underlying Vanguard Funds | |
| Vanguard Total Stock Market Index Fund | |
| Institutional Shares | 54.0% |
| Vanguard Total International Stock Index | |
| Fund Investor Shares | 36.0 |
| Vanguard Total Bond Market II Index Fund | |
| Investor Shares | 7.1 |
| Vanguard Total International Bond Index | |
| Fund Admiral Shares | 2.9 |
Fund Asset Allocation
1 This figure—drawn from the prospectus dated January 25, 2018—represents an estimate of the weighted average of the expense ratios and any transaction fees charged by the underlying mutual funds (the ”acquired” funds) in which the Institutional Target Retirement 2055 Fund invests. The fund does not charge any expenses or fees of its own. For the fiscal year ended September 30, 2018, the acquired fund fees and expenses were 0.09%.
42
Institutional Target Retirement 2055 Fund
Performance Summary
All of the returns in this report represent past performance, which is not a guarantee of future results that may be achieved by the fund. (Current performance may be lower or higher than the performance data cited. For performance data current to the most recent month-end, visit our website at vanguard.com/performance.) Note, too, that both investment returns and principal value can fluctuate widely, so an investor’s shares, when sold, could be worth more or less than their original cost. The returns shown do not reflect taxes that a shareholder would pay on fund distributions or on the sale of fund shares.
Cumulative Performance: June 26, 2015, Through September 30, 2018
Initial Investment of $100,000,000
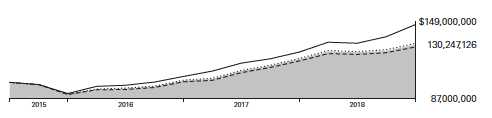
| Average Annual Total Returns | |||
| Periods Ended September 30, 2018 | |||
| Since | Final Value | ||
| One | Inception | of a $100,000,000 | |
| Year | (6/26/2015) | Investment | |
| Institutional Target Retirement 2055 | |||
| Fund* | 9.84% | 8.44% | $130,247,126 |
| Target 2055 Composite Index | 10.15 | 8.68 | 131,190,129 |
| Mixed-Asset Target 2055+ Funds | |||
| Average | 9.53 | 7.94 | 128,299,181 |
| MSCI US Broad Market Index | 17.62 | 12.34 | 146,201,479 |
For a benchmark description, see the Glossary.
Mixed-Asset Target 2055+ Funds Average: Derived from data provided by Lipper, a Thomson Reuters Company.
"Since Inception" performance is calculated from the fund's inception date for both the fund and its comparative standards.
See Financial Highlights for dividend and capital gains information.
43
Institutional Target Retirement 2055 Fund
Fiscal-Year Total Returns (%): June 26, 2015, Through September 30, 2018
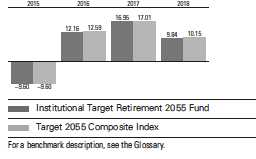
44
Institutional Target Retirement 2055 Fund
Financial Statements
Statement of Net Assets
As of September 30, 2018
The fund reports a complete list of its holdings in regulatory filings four times in each fiscal year, at the quarter-ends. For the second and fourth fiscal quarters, the lists appear in the fund’s semiannual and annual reports to shareholders. For the first and third fiscal quarters, the fund files the lists with the Securities and Exchange Commission on Form N-Q. Shareholders can look up the fund’s Forms N-Q on the SEC’s website at sec.gov. Forms N-Q may also be reviewed and copied at the SEC’s Public Reference Room (see the back cover of this report for further information).
| Market | ||
| Value• | ||
| Shares | ($000) | |
| Investment Companies (99.8%) | ||
| U.S. Stock Fund (53.9%) | ||
| Vanguard Total Stock Market Index Fund Institutional Shares | 40,620,063 | 2,959,172 |
| International Stock Fund (35.9%) | ||
| Vanguard Total International Stock Index Fund Investor Shares | 113,528,765 | 1,970,859 |
| U.S. Bond Fund (7.1%) | ||
| 1 Vanguard Total Bond Market II Index Fund Investor Shares | 37,724,802 | 389,697 |
| International Bond Fund (2.9%) | ||
| Vanguard Total International Bond Index Fund Admiral Shares | 7,282,637 | 158,470 |
| Total Investment Companies (Cost $4,798,208) | 5,478,198 | |
| Temporary Cash Investment (0.0%) | ||
| Money Market Fund (0.0%) | ||
| 1 Vanguard Market Liquidity Fund, 2.209% (Cost $1,254) | 12,538 | 1,254 |
| Total Investments (99.8%) (Cost $4,799,462) | 5,479,452 | |
| Other Assets and Liabilities (0.2%) | ||
| Other Assets | 46,661 | |
| Liabilities | (37,602) | |
| 9,059 | ||
| Net Assets (100%) | ||
| Applicable to 220,228,678 outstanding $.001 par value shares of | ||
| beneficial interest (unlimited authorization) | 5,488,511 | |
| Net Asset Value Per Share | $24.92 | |
45
| Institutional Target Retirement 2055 Fund | |
| Amount | |
| ($000) | |
| Statement of Assets and Liabilities | |
| Assets | |
| Investments in Securities, at Value—Affiliated Funds | 5,479,452 |
| Receivables for Investment Securities Sold | 27,834 |
| Receivables for Accrued Income | 1,036 |
| Receivables for Capital Shares Issued | 17,785 |
| Other Assets | 6 |
| Total Assets | 5,526,113 |
| Liabilities | |
| Payables for Investment Securities Purchased | 1,036 |
| Payables for Capital Shares Redeemed | 36,566 |
| Total Liabilities | 37,602 |
| Net Assets | 5,488,511 |
| At September 30, 2018, net assets consisted of: | |
| Amount | |
| ($000) | |
| Paid-in Capital | 4,738,132 |
| Undistributed Net Investment Income | 72,564 |
| Accumulated Net Realized Losses | (2,175) |
| Unrealized Appreciation (Depreciation) | 679,990 |
| Net Assets | 5,488,511 |
• See Note A in Notes to Financial Statements.
1 Affiliated fund available only to Vanguard funds and certain trusts and accounts managed by Vanguard. Rate shown for Vanguard
Market Liquidity Fund is the 7-day yield.
See accompanying Notes, which are an integral part of the Financial Statements.
46
| Institutional Target Retirement 2055 Fund | |
| Statement of Operations | |
| Year Ended | |
| September 30, 2018 | |
| ($000) | |
| Investment Income | |
| Income | |
| Income Distributions Received from Affiliated Funds | 97,893 |
| Net Investment Income—Note B | 97,893 |
| Realized Net Gain (Loss) | |
| Capital Gain Distributions Received from Affiliated Funds | 57 |
| Affiliated Funds Sold | (2,044) |
| Futures Contracts | (44) |
| Realized Net Gain (Loss) | (2,031) |
| Change in Unrealized Appreciation (Depreciation) from Affiliated Funds | 285,834 |
| Net Increase (Decrease) in Net Assets Resulting from Operations | 381,696 |
See accompanying Notes, which are an integral part of the Financial Statements.
47
| Institutional Target Retirement 2055 Fund | ||
| Statement of Changes in Net Assets | ||
| Year Ended September 30, | ||
| 2018 | 2017 | |
| ($000) | ($000) | |
| Increase (Decrease) in Net Assets | ||
| Operations | ||
| Net Investment Income | 97,893 | 54,997 |
| Realized Net Gain (Loss) | (2,031) | 972 |
| Change in Unrealized Appreciation (Depreciation) | 285,834 | 325,002 |
| Net Increase (Decrease) in Net Assets Resulting from Operations | 381,696 | 380,971 |
| Distributions | ||
| Net Investment Income | (66,180) | (31,435) |
| Realized Capital Gain1 | (970) | (131) |
| Total Distributions | (67,150) | (31,566) |
| Capital Share Transactions | ||
| Issued | 2,472,995 | 1,588,184 |
| Issued in Lieu of Cash Distributions | 66,096 | 31,142 |
| Redeemed | (577,670) | (283,411) |
| Net Increase (Decrease) from Capital Share Transactions | 1,961,421 | 1,335,915 |
| Total Increase (Decrease) | 2,275,967 | 1,685,320 |
| Net Assets | ||
| Beginning of Period | 3,212,544 | 1,527,224 |
| End of Period2 | 5,488,511 | 3,212,544 |
1 Includes fiscal 2018 and 2017 short-term gain distributions totaling $939,000 and $87,000, respectively. Short-term gain
distributions are treated as ordinary income dividends for tax purposes.
2 Net Assets—End of Period includes undistributed (overdistributed) net investment income of $72,564,000 and $40,851,000.
See accompanying Notes, which are an integral part of the Financial Statements.
48
| Institutional Target Retirement 2055 Fund | ||||
| Financial Highlights | ||||
| June 26, | ||||
| 20151 to | ||||
| Year Ended September 30, | ||||
| For a Share Outstanding | Sept. 30, | |||
| Throughout Each Period | 2018 | 2017 | 2016 | 2015 |
| Net Asset Value, Beginning of Period | $23.10 | $20.11 | $18.08 | $20.00 |
| Investment Operations | ||||
| Net Investment Income2 | .547 | .506 | .470 | .157 |
| Capital Gain Distributions Received 2 | — | .001 | .001 | — |
| Net Realized and Unrealized Gain (Loss) on Investments | 1.709 | 2.845 | 1.718 | (2.077) |
| Total from Investment Operations | 2.256 | 3.352 | 2.189 | (1.920) |
| Distributions | ||||
| Dividends from Net Investment Income | (. 430) | (. 360) | (.158) | — |
| Distributions from Realized Capital Gains | (. 006) | (. 002) | (. 001) | — |
| Total Distributions | (. 436) | (. 362) | (.159) | — |
| Net Asset Value, End of Period | $24.92 | $23.10 | $20.11 | $18.08 |
| Total Return | 9.84% | 16.95% | 12.16% | -9.60% |
| Ratios/Supplemental Data | ||||
| Net Assets, End of Period (Millions) | $5,489 | $3,213 | $1,527 | $373 |
| Ratio of Total Expenses to Average Net Assets | — | — | — | — |
| Acquired Fund Fees and Expenses | 0.09% | 0.09% | 0.10% | 0.10%3 |
| Ratio of Net Investment Income to Average Net Assets | 2.26% | 2.36% | 2.47% | 3.05%3 |
| Portfolio Turnover Rate | 5% | 6% | 1% | 1% |
1 Inception.
2 Calculated based on average shares outstanding.
3 Annualized.
See accompanying Notes, which are an integral part of the Financial Statements.
49
Institutional Target Retirement 2055 Fund
Notes to Financial Statements
Vanguard Institutional Target Retirement 2055 Fund is registered under the Investment Company Act of 1940 as an open-end investment company, or mutual fund. The fund follows a balanced investment strategy by investing in selected Vanguard funds to achieve its targeted allocation of assets to U.S. and international stocks, and U.S. and international bonds. Financial statements and other information about each underlying fund are available on vanguard.com.
A. The following significant accounting policies conform to generally accepted accounting principles for U.S. investment companies. The fund consistently follows such policies in preparing its financial statements.
1. Security Valuation: Investments are valued at the net asset value of each underlying Vanguard fund determined as of the close of the New York Stock Exchange (generally 4 p.m., Eastern time) on the valuation date.
2. Futures Contracts: The fund uses stock and bond futures contracts to a limited extent, with the objectives of maintaining full exposure to the market and maintaining its target asset allocation. The primary risks associated with the use of futures contracts are imperfect correlation between changes in market values of investments held by the fund and the prices of futures contracts, and the possibility of an illiquid market. Counterparty risk involving futures is mitigated because a regulated clearinghouse is the counterparty instead of the clearing broker. To further mitigate counterparty risk, the fund trades futures contracts on an exchange, monitors the financial strength of its clearing brokers and clearinghouse, and has entered into clearing agreements with its clearing brokers. The clearinghouse imposes initial margin requirements to secure the fund’s performance and requires daily settlement of variation margin representing changes in the market value of each contract. Any assets pledged as initial margin for open contracts are noted in the Statement of Net Assets.
Futures contracts are valued at their quoted daily settlement prices. The notional amounts of the contracts are not recorded in the Statement of Net Assets. Fluctuations in the value of the contracts are recorded in the Statement of Assets and Liabilities as an asset (liability) and in the Statement of Operations as unrealized appreciation (depreciation) until the contracts are closed, when they are recorded as realized futures gains (losses).
During the year ended September 30, 2018, the fund’s average investments in long and short futures contracts each represented 0% of net assets, based on the average of the notional amounts at each quarter-end during the period. The fund had no open futures contracts at September 30, 2018.
3. Federal Income Taxes: The fund intends to continue to qualify as a regulated investment company and distribute all of its taxable income. Management has analyzed the fund’s tax positions taken for all open federal income tax years (September 30, 2015–2018), and has concluded that no provision for federal income tax is required in the fund’s financial statements.
4. Distributions: Distributions to shareholders are recorded on the ex-dividend date. Distributions are determined on a tax basis and may differ from net investment income and realized capital gains for financial reporting purposes.
50
Institutional Target Retirement 2055 Fund
5. Credit Facility: The fund and certain other funds managed by The Vanguard Group (“Vanguard”) participate in a $3.1 billion committed credit facility provided by a syndicate of lenders pursuant to a credit agreement that may be renewed annually; each fund is individually liable for its borrowings, if any, under the credit facility. Borrowings may be utilized for temporary and emergency purposes, and are subject to the fund’s regulatory and contractual borrowing restrictions. The participating funds are charged administrative fees and an annual commitment fee of 0.10% of the undrawn amount of the facility; these fees are allocated to the funds based on a method approved by the fund’s board of trustees and borne by the funds in which the fund invests (see Note B). Any borrowings under this facility bear interest at a rate based upon the higher of the one-month London Interbank Offered Rate, federal funds effective rate, or overnight bank funding rate plus an agreed-upon spread.
The fund had no borrowings outstanding at September 30, 2018, or at any time during the period then ended.
6. Other: Income and capital gain distributions received are recorded on the ex-dividend date. Security transactions are accounted for on the date securities are bought or sold. Costs used to determine realized gains (losses) on the sale of investment securities are those of the specific securities sold.
B. In accordance with the terms of a Funds’ Service Agreement (the “FSA”) between Vanguard and the fund, Vanguard furnishes to the fund investment advisory, corporate management, administrative, marketing, and distribution services at Vanguard’s cost of operations (as defined by the FSA). These costs of operations are allocated to the fund based on methods and guidelines approved by the board of trustees. The FSA provides that expenses otherwise allocable to Vanguard funds-of-funds may be reduced or eliminated to the extent of savings realized by the underlying Vanguard funds by virtue of being part of a fund-of-funds. Accordingly, all expenses for services provided by Vanguard to the fund and all other expenses incurred by the fund during the period ended September 30, 2018, were borne by the underlying Vanguard funds in which the fund invests. The fund’s trustees and officers are also trustees and officers, respectively, of the underlying Vanguard funds, as well as directors and employees, respectively, of Vanguard.
C. Various inputs may be used to determine the value of the fund’s investments. These inputs are summarized in three broad levels for financial statement purposes. The inputs or methodologies used to value securities are not necessarily an indication of the risk associated with investing in those securities.
Level 1—Quoted prices in active markets for identical securities.
Level 2—Other significant observable inputs (including quoted prices for similar securities, interest rates, prepayment speeds, credit risk, etc.).
Level 3—Significant unobservable inputs (including the fund’s own assumptions used to determine the fair value of investments). Any investments valued with significant unobservable inputs are noted on the Statement of Net Assets.
At September 30, 2018, 100% of the market value of the fund’s investments was determined based on Level 1 inputs.
51
Institutional Target Retirement 2055 Fund
D. Permanent differences between book-basis and tax-basis components of net assets, if any, are reclassified among capital accounts in the financial statements to reflect their tax character. These reclassifications have no effect on net assets or net asset value per share.
Temporary differences between book-basis and tax-basis components of accumulated net earnings (losses) arise when certain items of income, gain, or loss are recognized in different periods for financial statement and tax purposes; these differences will reverse at some time in the future. The differences are primarily related to the tax deferral of losses on wash sales. As of period end, the tax-basis components of accumulated net earnings (losses) are detailed in the table as follows:
| Amount | |
| ($000) | |
| Undistributed Ordinary Income | 72,784 |
| Undistributed Long-Term Gains | 31 |
| Capital Loss Carryforwards (Non-expiring) | — |
| Net Unrealized Gains (Losses) | 677,564 |
As of September 30, 2018, gross unrealized appreciation and depreciation for investments and derivatives based on cost for U.S. federal income tax purposes were as follows:
| Amount | ||
| ($000) | ||
| Tax Cost | 4,801,888 | |
| Gross Unrealized Appreciation | 716,909 | |
| Gross Unrealized Depreciation | (39,345) | |
| Net Unrealized Appreciation (Depreciation) | 677,564 | |
| E. Capital shares issued and redeemed were: | ||
| Year Ended September 30, | ||
| 2018 | 2017 | |
| Shares | Shares | |
| (000) | (000) | |
| Issued | 102,186 | 74,615 |
| Issued in Lieu of Cash Distributions | 2,762 | 1,558 |
| Redeemed | (23,816) | (13,002) |
| Net Increase (Decrease) in Shares Outstanding | 81,132 | 63,171 |
At September 30, 2018, one shareholder was the record or beneficial owner of 28% of the fund’s net assets. If the shareholder were to redeem its investment in the fund, the redemption might lead to the realization of taxable capital gains.
52
Institutional Target Retirement 2055 Fund
| F. Transactions during the period in affiliated underlying Vanguard funds were as follows: | ||||||||
| Current Period Transactions | ||||||||
| Sept. 30, | Proceeds | Realized | Sept. 30, | |||||
| 2017 | from | Net | Change in | Capital Gain | 2018 | |||
| Market | Purchases | Securities | Gain | Unrealized | Distributions | Market | ||
| Value | at Cost | Sold | (Loss) | App. (Dep.) | Income | Received | Value | |
| ($000) | ($000) | ($000) | ($000) | ($000) | ($000) | ($000) | ($000) | |
| Vanguard Market | ||||||||
| Liquidity Fund | 2,132 | NA1 | NA1 | 2 | — | 37 | — | 1,254 |
| Vanguard Total | ||||||||
| Bond Market II | ||||||||
| Index Fund | 225,447 | 239,997 | 63,817 | (428) | (11,502) | 8,101 | 57 | 389,697 |
| Vanguard Total | ||||||||
| International Bond | ||||||||
| Index Fund | 93,488 | 65,137 | — | — | (155) | 2,631 | — | 158,470 |
| Vanguard Total | ||||||||
| International Stock | ||||||||
| Index Fund | 1,145,876 | 890,615 | 28,079 | (1,752) | (35,801) | 43,161 | — | 1,970,859 |
| Vanguard Total | ||||||||
| Stock Market | ||||||||
| Index Fund | 1,742,584 | 1,024,622 | 141,460 | 134 | 333,292 | 43,963 | — | 2,959,172 |
| Total | 3,209,527 | 2,220,371 | 233,356 | (2,044) | 285,834 | 97,893 | 57 | 5,479,452 |
| 1 Not applicable—purchases and sales are for temporary cash investment purposes. | ||||||||
G. Management has determined that no events or transactions occurred subsequent to September 30, 2018, that would require recognition or disclosure in these financial statements.
53
Institutional Target Retirement 2060 Fund
Fund Profile
As of September 30, 2018
| Total Fund Characteristics | |
| Ticker Symbol | VILVX |
| 30-Day SEC Yield | 2.29% |
| Acquired Fund Fees and Expenses1 | 0.09% |
| Allocation to Underlying Vanguard Funds | |
| Vanguard Total Stock Market Index Fund | |
| Institutional Shares | 54.0% |
| Vanguard Total International Stock Index | |
| Fund Investor Shares | 36.0 |
| Vanguard Total Bond Market II Index Fund | |
| Investor Shares | 7.0 |
| Vanguard Total International Bond Index | |
| Fund Admiral Shares | 3.0 |
Fund Asset Allocation
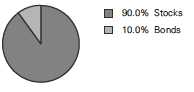
1 This figure—drawn from the prospectus dated January 25, 2018—represents an estimate of the weighted average of the expense ratios and any transaction fees charged by the underlying mutual funds (the ”acquired” funds) in which the Institutional Target Retirement 2060 Fund invests. The fund does not charge any expenses or fees of its own. For the fiscal year ended September 30, 2018, the acquired fund fees and expenses were 0.09%.
54
Institutional Target Retirement 2060 Fund
Performance Summary
All of the returns in this report represent past performance, which is not a guarantee of future results that may be achieved by the fund. (Current performance may be lower or higher than the performance data cited. For performance data current to the most recent month-end, visit our website at vanguard.com/performance.) Note, too, that both investment returns and principal value can fluctuate widely, so an investor’s shares, when sold, could be worth more or less than their original cost. The returns shown do not reflect taxes that a shareholder would pay on fund distributions or on the sale of fund shares.
Cumulative Performance: June 26, 2015, Through September 30, 2018
Initial Investment of $100,000,000
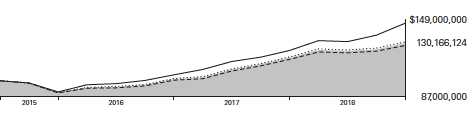
| Average Annual Total Returns | |||
| Periods Ended September 30, 2018 | |||
| Since | Final Value | ||
| One | Inception | of a $100,000,000 | |
| Year | (6/26/2015) | Investment | |
| Institutional Target Retirement 2060 | |||
| Fund* | 9.83% | 8.42% | $130,166,124 |
| Target 2060 Composite Index | 10.15 | 8.68 | 131,190,129 |
| Mixed-Asset Target 2055+ Funds | |||
| Average | 9.53 | 7.94 | 128,299,181 |
| MSCI US Broad Market Index | 17.62 | 12.34 | 146,201,479 |
For a benchmark description, see the Glossary.
Mixed-Asset Target 2055+ Funds Average: Derived from data provided by Lipper, a Thomson Reuters Company.
"Since Inception" performance is calculated from the fund's inception date for both the fund and its comparative standards.
See Financial Highlights for dividend and capital gains information.
55
Institutional Target Retirement 2060 Fund
Fiscal-Year Total Returns (%): June 26, 2015, Through September 30, 2018
56
Institutional Target Retirement 2060 Fund
Financial Statements
Statement of Net Assets
As of September 30, 2018
The fund reports a complete list of its holdings in regulatory filings four times in each fiscal year, at the quarter-ends. For the second and fourth fiscal quarters, the lists appear in the fund’s semiannual and annual reports to shareholders. For the first and third fiscal quarters, the fund files the lists with the Securities and Exchange Commission on Form N-Q. Shareholders can look up the fund’s Forms N-Q on the SEC’s website at sec.gov. Forms N-Q may also be reviewed and copied at the SEC’s Public Reference Room (see the back cover of this report for further information).
| Market | ||
| Value• | ||
| Shares | ($000) | |
| Investment Companies (99.7%) | ||
| U.S. Stock Fund (53.8%) | ||
| Vanguard Total Stock Market Index Fund Institutional Shares | 11,343,435 | 826,369 |
| International Stock Fund (35.9%) | ||
| Vanguard Total International Stock Index Fund Investor Shares | 31,740,984 | 551,024 |
| U.S. Bond Fund (7.0%) | ||
| 1 Vanguard Total Bond Market II Index Fund Investor Shares | 10,386,462 | 107,292 |
| International Bond Fund (3.0%) | ||
| Vanguard Total International Bond Index Fund Admiral Shares | 2,107,361 | 45,856 |
| Total Investment Companies (Cost $1,365,258) | 1,530,541 | |
| Temporary Cash Investment (0.0%) | ||
| Money Market Fund (0.0%) | ||
| 1 Vanguard Market Liquidity Fund, 2.209% (Cost $168) | 1,679 | 168 |
| Total Investments (99.7%) (Cost $1,365,426) | 1,530,709 | |
| Other Assets and Liabilities (0.3%) | ||
| Other Assets | 19,695 | |
| Liabilities | (15,407) | |
| 4,288 | ||
| Net Assets (100%) | ||
| Applicable to 61,604,059 outstanding $.001 par value shares of | ||
| beneficial interest (unlimited authorization) | 1,534,997 | |
| Net Asset Value Per Share | $24.92 | |
57
| Institutional Target Retirement 2060 Fund | |
| Amount | |
| ($000) | |
| Statement of Assets and Liabilities | |
| Assets | |
| Investments in Securities, at Value—Affiliated Funds | 1,530,709 |
| Receivables for Investment Securities Sold | 12,234 |
| Receivables for Accrued Income | 405 |
| Receivables for Capital Shares Issued | 7,052 |
| Other Assets | 4 |
| Total Assets | 1,550,404 |
| Liabilities | |
| Payables for Investment Securities Purchased | 290 |
| Payables for Capital Shares Redeemed | 15,117 |
| Total Liabilities | 15,407 |
| Net Assets | 1,534,997 |
| At September 30, 2018, net assets consisted of: | |
| Amount | |
| ($000) | |
| Paid-in Capital | 1,350,351 |
| Undistributed Net Investment Income | 20,220 |
| Accumulated Net Realized Losses | (857) |
| Unrealized Appreciation (Depreciation) | 165,283 |
| Net Assets | 1,534,997 |
• See Note A in Notes to Financial Statements.
1 Affiliated fund available only to Vanguard funds and certain trusts and accounts managed by Vanguard. Rate shown for Vanguard
Market Liquidity Fund is the 7-day yield.
See accompanying Notes, which are an integral part of the Financial Statements.
58
| Institutional Target Retirement 2060 Fund | |
| Statement of Operations | |
| Year Ended | |
| September 30, 2018 | |
| ($000) | |
| Investment Income | |
| Income | |
| Income Distributions Received from Affiliated Funds | 26,666 |
| Other Income | 115 |
| Net Investment Income—Note B | 26,781 |
| Realized Net Gain (Loss) | |
| Capital Gain Distributions Received from Affiliated Funds | 15 |
| Affiliated Funds Sold | (817) |
| Futures Contracts | (5) |
| Realized Net Gain (Loss) | (807) |
| Change in Unrealized Appreciation (Depreciation) from Affiliated Funds | 74,473 |
| Net Increase (Decrease) in Net Assets Resulting from Operations | 100,447 |
See accompanying Notes, which are an integral part of the Financial Statements.
59
| Institutional Target Retirement 2060 Fund | ||
| Statement of Changes in Net Assets | ||
| Year Ended September 30, | ||
| 2018 | 2017 | |
| ($000) | ($000) | |
| Increase (Decrease) in Net Assets | ||
| Operations | ||
| Net Investment Income | 26,781 | 13,084 |
| Realized Net Gain (Loss) | (807) | 139 |
| Change in Unrealized Appreciation (Depreciation) | 74,473 | 76,789 |
| Net Increase (Decrease) in Net Assets Resulting from Operations | 100,447 | 90,012 |
| Distributions | ||
| Net Investment Income | (16,365) | (7,097) |
| Realized Capital Gain1 | (152) | (28) |
| Total Distributions | (16,517) | (7,125) |
| Capital Share Transactions | ||
| Issued | 821,039 | 479,635 |
| Issued in Lieu of Cash Distributions | 16,151 | 7,005 |
| Redeemed | (195,143) | (95,004) |
| Net Increase (Decrease) from Capital Share Transactions | 642,047 | 391,636 |
| Total Increase (Decrease) | 725,977 | 474,523 |
| Net Assets | ||
| Beginning of Period | 809,020 | 334,497 |
| End of Period2 | 1,534,997 | 809,020 |
1 Includes fiscal 2018 and 2017 short-term gain distributions totaling $144,000 and $22,000 respectively. Short-term gain
distributions are treated as ordinary income dividends for tax purposes.
2 Net Assets—End of Period includes undistributed (overdistributed) net investment income of $20,220,000 and $9,804,000.
See accompanying Notes, which are an integral part of the Financial Statements.
60
| Institutional Target Retirement 2060 Fund | ||||
| Financial Highlights | ||||
| June 26, | ||||
| 20151 to | ||||
| For a Share Outstanding | Year Ended September 30, | Sept. 30, | ||
| Throughout Each Period | 2018 | 2017 | 2016 | 2015 |
| Net Asset Value, Beginning of Period | $23.08 | $20.10 | $18.07 | $20.00 |
| Investment Operations | ||||
| Net Investment Income2 | .554 | .511 | .466 | .135 |
| Capital Gain Distributions Received 2 | — | .001 | .001 | — |
| Net Realized and Unrealized Gain (Loss) on Investments | 1.699 | 2.828 | 1.729 | (2.065) |
| Total from Investment Operations | 2.253 | 3.340 | 2.196 | (1.930) |
| Distributions | ||||
| Dividends from Net Investment Income | (. 409) | (. 359) | (.165) | — |
| Distributions from Realized Capital Gains | (. 004) | (. 001) | (. 001) | — |
| Total Distributions | (. 413) | (. 360) | (.166) | — |
| Net Asset Value, End of Period | $24.92 | $23.08 | $20.10 | $18.07 |
| Total Return | 9.83% | 16.90% | 12.21% | -9.65% |
| Ratios/Supplemental Data | ||||
| Net Assets, End of Period (Millions) | $1,535 | $809 | $334 | $95 |
| Ratio of Total Expenses to Average Net Assets | — | — | — | — |
| Acquired Fund Fees and Expenses | 0.09% | 0.09% | 0.10% | 0.10%3 |
| Ratio of Net Investment Income to Average Net Assets | 2.29% | 2.38% | 2.45% | 2.53%3 |
| Portfolio Turnover Rate | 5% | 7% | 4% | 4% |
1 Inception.
2 Calculated based on average shares outstanding.
3 Annualized.
See accompanying Notes, which are an integral part of the Financial Statements.
61
Institutional Target Retirement 2060 Fund
Notes to Financial Statements
Vanguard Institutional Target Retirement 2060 Fund is registered under the Investment Company Act of 1940 as an open-end investment company, or mutual fund. The fund follows a balanced investment strategy by investing in selected Vanguard funds to achieve its targeted allocation of assets to U.S. and international stocks, and U.S. and international bonds. Financial statements and other information about each underlying fund are available on vanguard.com.
A. The following significant accounting policies conform to generally accepted accounting principles for U.S. investment companies. The fund consistently follows such policies in preparing its financial statements.
1. Security Valuation: Investments are valued at the net asset value of each underlying Vanguard fund determined as of the close of the New York Stock Exchange (generally 4 p.m., Eastern time) on the valuation date.
2. Futures Contracts: The fund uses stock and bond futures contracts to a limited extent, with the objectives of maintaining full exposure to the market and maintaining its target asset allocation. The primary risks associated with the use of futures contracts are imperfect correlation between changes in market values of investments held by the fund and the prices of futures contracts, and the possibility of an illiquid market. Counterparty risk involving futures is mitigated because a regulated clearing-house is the counterparty instead of the clearing broker. To further mitigate counterparty risk, the fund trades futures contracts on an exchange, monitors the financial strength of its clearing brokers and clearinghouse, and has entered into clearing agreements with its clearing brokers. The clearing-house imposes initial margin requirements to secure the fund’s performance and requires daily settlement of variation margin representing changes in the market value of each contract. Any assets pledged as initial margin for open contracts are noted in the Statement of Net Assets.
Futures contracts are valued at their quoted daily settlement prices. The notional amounts of the contracts are not recorded in the Statement of Net Assets. Fluctuations in the value of the contracts are recorded in the Statement of Assets and Liabilities as an asset (liability) and in the Statement of Operations as unrealized appreciation (depreciation) until the contracts are closed, when they are recorded as realized futures gains (losses).
During the year ended September 30, 2018, the fund’s average investments in long and short futures contracts each represented 0% of net assets, based on the average of the notional amounts at each quarter-end during the period. The fund had no open futures contracts at September 30, 2018.
3. Federal Income Taxes: The fund intends to continue to qualify as a regulated investment company and distribute all of its taxable income. Management has analyzed the fund’s tax positions taken for all open federal income tax years (September 30, 2015–2018), and has concluded that no provision for federal income tax is required in the fund’s financial statements.
4. Distributions: Distributions to shareholders are recorded on the ex-dividend date. Distributions are determined on a tax basis and may differ from net investment income and realized capital gains for financial reporting purposes.
62
Institutional Target Retirement 2060 Fund
5. Credit Facility: The fund and certain other funds managed by The Vanguard Group (“Vanguard”) participate in a $3.1 billion committed credit facility provided by a syndicate of lenders pursuant to a credit agreement that may be renewed annually; each fund is individually liable for its borrowings, if any, under the credit facility. Borrowings may be utilized for temporary and emergency purposes, and are subject to the fund’s regulatory and contractual borrowing restrictions. The participating funds are charged administrative fees and an annual commitment fee of 0.10% of the undrawn amount of the facility; these fees are allocated to the funds based on a method approved by the fund’s board of trustees and borne by the funds in which the fund invests (see Note B). Any borrowings under this facility bear interest at a rate based upon the higher of the one-month London Interbank Offered Rate, federal funds effective rate, or overnight bank funding rate plus an agreed-upon spread.
The fund had no borrowings outstanding at September 30, 2018, or at any time during the period then ended.
6. Other: Income and capital gain distributions received are recorded on the ex-dividend date. Security transactions are accounted for on the date securities are bought or sold. Costs used to determine realized gains (losses) on the sale of investment securities are those of the specific securities sold.
B. In accordance with the terms of a Funds’ Service Agreement (the “FSA”) between Vanguard and the fund, Vanguard furnishes to the fund investment advisory, corporate management, administrative, marketing, and distribution services at Vanguard’s cost of operations (as defined by the FSA). These costs of operations are allocated to the fund based on methods and guidelines approved by the board of trustees. The FSA provides that expenses otherwise allocable to Vanguard funds-of-funds may be reduced or eliminated to the extent of savings realized by the underlying Vanguard funds by virtue of being part of a fund-of-funds. Accordingly, all expenses for services provided by Vanguard to the fund and all other expenses incurred by the fund during the period ended September 30, 2018, were borne by the underlying Vanguard funds in which the fund invests. The fund’s trustees and officers are also trustees and officers, respectively, of the underlying Vanguard funds, as well as directors and employees, respectively, of Vanguard.
C. Various inputs may be used to determine the value of the fund’s investments. These inputs are summarized in three broad levels for financial statement purposes. The inputs or methodologies used to value securities are not necessarily an indication of the risk associated with investing in those securities.
Level 1—Quoted prices in active markets for identical securities.
Level 2—Other significant observable inputs (including quoted prices for similar securities, interest rates, prepayment speeds, credit risk, etc.).
Level 3—Significant unobservable inputs (including the fund’s own assumptions used to determine the fair value of investments). Any investments valued with significant unobservable inputs are noted on the Statement of Net Assets.
At September 30, 2018, 100% of the market value of the fund’s investments was determined based on Level 1 inputs.
63
Institutional Target Retirement 2060 Fund
D. Permanent differences between book-basis and tax-basis components of net assets, if any, are reclassified among capital accounts in the financial statements to reflect their tax character. These reclassifications have no effect on net assets or net asset value per share.
Temporary differences between book-basis and tax-basis components of accumulated net earnings (losses) arise when certain items of income, gain, or loss are recognized in different periods for financial statement and tax purposes; these differences will reverse at some time in the future. The differences are primarily related to the tax deferral of losses on wash sales. As of period end, the tax-basis components of accumulated net earnings (losses) are detailed in the table as follows:
| Amount | |
| ($000) | |
| Undistributed Ordinary Income | 20,261 |
| Undistributed Long-Term Gains | 11 |
| Capital Loss Carryforwards (Non-expiring) | — |
| Net Unrealized Gains (Losses) | 164,374 |
As of September 30, 2018, gross unrealized appreciation and depreciation for investments and derivatives based on cost for U.S. federal income tax purposes were as follows:
| Amount | ||
| ($000) | ||
| Tax Cost | 1,366,335 | |
| Gross Unrealized Appreciation | 177,031 | |
| Gross Unrealized Depreciation | (12,657) | |
| Net Unrealized Appreciation (Depreciation) | 164,374 | |
| E. Capital shares issued and redeemed were: | ||
| Year Ended September 30, | ||
| 2018 | 2017 | |
| Shares | Shares | |
| (000) | (000) | |
| Issued | 33,921 | 22,464 |
| Issued in Lieu of Cash Distributions | 675 | 351 |
| Redeemed | (8,051) | (4,397) |
| Net Increase (Decrease) in Shares Outstanding | 26,545 | 18,418 |
At September 30, 2018, one shareholder was the record or beneficial owner of 26% of the fund’s net assets. If the shareholder were to redeem its investment in the fund, the redemption might lead to the realization of taxable capital gains.
64
Institutional Target Retirement 2060 Fund
| F. Transactions during the period in affiliated underlying Vanguard funds were as follows: | ||||||||
| Current Period Transactions | ||||||||
| Sept. 30, | Proceeds | Realized | Sept. 30, | |||||
| 2017 | from | Net | Change in | Capital Gain | 2018 | |||
| Market | Purchases | Securities | Gain | Unrealized | Distributions | Market | ||
| Value | at Cost | Sold | (Loss) | App. (Dep.) | Income | Received | Value | |
| ($000) | ($000) | ($000) | ($000) | ($000) | ($000) | ($000) | ($000) | |
| Vanguard Market | ||||||||
| Liquidity Fund | 1,282 | NA1 | NA1 | — | — | 20 | — | 168 |
| Vanguard Total | ||||||||
| Bond Market II | ||||||||
| Index Fund | 56,647 | 72,685 | 18,828 | (125) | (3,087) | 2,190 | 15 | 107,292 |
| Vanguard Total | ||||||||
| International Bond | ||||||||
| Index Fund | 23,598 | 22,948 | 656 | (10) | (24) | 692 | — | 45,856 |
| Vanguard Total | ||||||||
| International Stock | ||||||||
| Index Fund | 290,323 | 283,764 | 11,210 | (648) | (11,205) | 11,765 | — | 551,024 |
| Vanguard Total | ||||||||
| Stock Market | ||||||||
| Index Fund | 435,873 | 325,010 | 23,269 | (34) | 88,789 | 11,999 | — | 826,369 |
| Total | 807,723 | 704,407 | 53,963 | (817) | 74,473 | 26,666 | 15 | 1,530,709 |
| 1 Not applicable—purchases and sales are for temporary cash investment purposes. | ||||||||
G. Management has determined that no events or transactions occurred subsequent to September 30, 2018, that would require recognition or disclosure in these financial statements.
65
Institutional Target Retirement 2065 Fund
Fund Profile
As of September 30, 2018
| Total Fund Characteristics | |
| Ticker Symbol | VSXFX |
| 30-Day SEC Yield | 2.47% |
| Acquired Fund Fees and Expenses1 | 0.09% |
| Allocation to Underlying Vanguard Funds | |
| Vanguard Total Stock Market Index Fund | |
| Institutional Shares | 54.2% |
| Vanguard Total International Stock Index | |
| Fund Investor Shares | 35.8 |
| Vanguard Total Bond Market II Index Fund | |
| Investor Shares | 7.0 |
| Vanguard Total International Bond Index | |
| Fund Admiral Shares | 3.0 |
Fund Asset Allocation
1 This figure—drawn from the prospectus dated January 25, 2018—represents an estimate of the weighted average of the expense ratios and any transaction fees charged by the underlying mutual funds (the ”acquired” funds) in which the Institutional Target Retirement 2065 Fund invests. The fund does not charge any expenses or fees of its own. For the fiscal year ended September 30, 2018, the acquired fund fees and expenses were 0.09%.
66
Institutional Target Retirement 2065 Fund
Performance Summary
All of the returns in this report represent past performance, which is not a guarantee of future results that may be achieved by the fund. (Current performance may be lower or higher than the performance data cited. For performance data current to the most recent month-end, visit our website at vanguard.com/performance.) Note, too, that both investment returns and principal value can fluctuate widely, so an investor’s shares, when sold, could be worth more or less than their original cost. The returns shown do not reflect taxes that a shareholder would pay on fund distributions or on the sale of fund shares.
Cumulative Performance: July 12, 2017, Through September 30, 2018
Initial Investment of $100,000,000
| Average Annual Total Returns | |||
| Periods Ended September 30, 2018 | |||
| Since | Final Value | ||
| One | Inception | of a $100,000,000 | |
| Year | (7/12/2017) | Investment | |
| Institutional Target Retirement 2065 | |||
| Fund* | 9.93% | 11.61% | $114,325,096 |
| Target 2065 Composite Index | 10.15 | 11.65 | 114,385,097 |
| Mixed-Asset Target 2055+ Funds | |||
| Average | 9.53 | 11.28 | 113,914,181 |
| MSCI US Broad Market Index | 17.62 | 17.66 | 121,929,487 |
For a benchmark description, see the Glossary.
Mixed-Asset Target 2055+ Funds Average: Derived from data provided by Lipper, a Thomson Reuters Company.
"Since Inception" performance is calculated from the fund's inception date for both the fund and its comparative standards.
See Financial Highlights for dividend and capital gains information.
67
Institutional Target Retirement 2065 Fund
Fiscal-Year Total Returns (%): July 12, 2017, Through September 30, 2018
68
Institutional Target Retirement 2065 Fund
Financial Statements
Statement of Net Assets
As of September 30, 2018
The fund reports a complete list of its holdings in regulatory filings four times in each fiscal year, at the quarter-ends. For the second and fourth fiscal quarters, the lists appear in the fund’s semiannual and annual reports to shareholders. For the first and third fiscal quarters, the fund files the lists with the Securities and Exchange Commission on Form N-Q. Shareholders can look up the fund’s Forms N-Q on the SEC’s website at sec.gov. Forms N-Q may also be reviewed and copied at the SEC’s Public Reference Room (see the back cover of this report for further information).
| Market | ||
| Value• | ||
| Shares | ($000) | |
| Investment Companies (99.6%) | ||
| U.S. Stock Fund (54.0%) | ||
| Vanguard Total Stock Market Index Fund Institutional Shares | 718,536 | 52,345 |
| International Stock Fund (35.6%) | ||
| Vanguard Total International Stock Index Fund Investor Shares | 1,988,332 | 34,517 |
| U.S. Bond Fund (7.0%) | ||
| 1 Vanguard Total Bond Market II Index Fund Investor Shares | 654,958 | 6,766 |
| International Bond Fund (3.0%) | ||
| Vanguard Total International Bond Index Fund Admiral Shares | 132,921 | 2,892 |
| Total Investment Companies (Cost $94,303) | 96,520 | |
| Temporary Cash Investment (0.0%) | ||
| Money Market Fund (0.0%) | ||
| 1 Vanguard Market Liquidity Fund, 2.209% (Cost $1) | 6 | 1 |
| Total Investments (99.6%) (Cost $94,304) | 96,521 | |
| Other Assets and Liabilities (0.4%) | ||
| Other Assets | 921 | |
| Liabilities | (538) | |
| 383 | ||
| Net Assets (100%) | ||
| Applicable to 4,270,343 outstanding $.001 par value shares of | ||
| beneficial interest (unlimited authorization) | 96,904 | |
| Net Asset Value Per Share | $22.69 | |
69
| Institutional Target Retirement 2065 Fund | |
| Amount | |
| ($000) | |
| Statement of Assets and Liabilities | |
| Assets | |
| Investments in Securities, at Value—Affiliated Funds | 96,521 |
| Receivables for Investment Securities Sold | 363 |
| Receivables for Accrued Income | 18 |
| Receivables for Capital Shares Issued | 540 |
| Total Assets | 97,442 |
| Liabilities | |
| Payables for Investment Securities Purchased | 18 |
| Payables for Capital Shares Redeemed | 478 |
| Other Liabilities | 42 |
| Total Liabilities | 538 |
| Net Assets | 96,904 |
| At September 30, 2018, net assets consisted of: | |
| Amount | |
| ($000) | |
| Paid-in Capital | 93,660 |
| Undistributed Net Investment Income | 1,074 |
| Accumulated Net Realized Losses | (47) |
| Unrealized Appreciation (Depreciation) | 2,217 |
| Net Assets | 96,904 |
• See Note A in Notes to Financial Statements.
1 Affiliated fund available only to Vanguard funds and certain trusts and accounts managed by Vanguard. Rate shown for Vanguard
Market Liquidity Fund is the 7-day yield.
See accompanying Notes, which are an integral part of the Financial Statements.
70
| Institutional Target Retirement 2065 Fund | |
| Statement of Operations | |
| Year Ended | |
| September 30, 2018 | |
| ($000) | |
| Investment Income | |
| Income | |
| Income Distributions Received from Affiliated Funds | 1,177 |
| Other Income | 8 |
| Net Investment Income—Note B | 1,185 |
| Realized Net Gain (Loss) | |
| Capital Gain Distributions Received from Affiliated Funds | — |
| Affiliated Funds Sold | (43) |
| Futures Contracts | (1) |
| Realized Net Gain (Loss) | (44) |
| Change in Unrealized Appreciation (Depreciation) from Affiliated Funds | 2,145 |
| Net Increase (Decrease) in Net Assets Resulting from Operations | 3,286 |
See accompanying Notes, which are an integral part of the Financial Statements.
71
| Institutional Target Retirement 2065 Fund | ||
| Statement of Changes in Net Assets | ||
| July 12, | ||
| Year Ended | 20171 to | |
| September 30, | September 30, | |
| 2018 | 2017 | |
| ($000) | ($000) | |
| Increase (Decrease) in Net Assets | ||
| Operations | ||
| Net Investment Income | 1,185 | 20 |
| Realized Net Gain (Loss) | (44) | — |
| Change in Unrealized Appreciation (Depreciation) | 2,145 | 72 |
| Net Increase (Decrease) in Net Assets Resulting from Operations | 3,286 | 92 |
| Distributions | ||
| Net Investment Income | (131) | — |
| Realized Capital Gain 2 | (3) | — |
| Total Distributions | (134) | — |
| Capital Share Transactions | ||
| Issued | 125,010 | 5,581 |
| Issued in Lieu of Cash Distributions | 133 | — |
| Redeemed | (36,854) | (210) |
| Net Increase (Decrease) from Capital Share Transactions | 88,289 | 5,371 |
| Total Increase (Decrease) | 91,441 | 5,463 |
| Net Assets | ||
| Beginning of Period | 5,463 | — |
| End of Period3 | 96,904 | 5,463 |
1 Inception.
2 Includes fiscal 2018 and 2017 short-term gain distributions totaling $3,000 and $0 respectively. Short-term gain distributions are
treated as ordinary income dividends for tax purposes.
3 Net Assets—End of Period includes undistributed (overdistributed) net investment income of $1,074,000 and $20,000.
See accompanying Notes, which are an integral part of the Financial Statements.
72
| Institutional Target Retirement 2065 Fund | ||
| Financial Highlights | ||
| July 12, | ||
| Year Ended | 20171 to | |
| Sept. 30, | Sept. 30, | |
| For a Share Outstanding Throughout Each Period | 2018 | 2017 |
| Net Asset Value, Beginning of Period | $20.80 | $20.00 |
| Investment Operations | ||
| Net Investment Income2 | .555 | .197 |
| Capital Gain Distributions Received 2 | — | — |
| Net Realized and Unrealized Gain (Loss) on Investments | 1.503 | 0.603 |
| Total from Investment Operations | 2.058 | 0.800 |
| Distributions | ||
| Dividends from Net Investment Income | (.165) | — |
| Distributions from Realized Capital Gains | (.003) | — |
| Total Distributions | (.168) | — |
| Net Asset Value, End of Period | $22.69 | $20.80 |
| Total Return | 9.93% | 4.00% |
| Ratios/Supplemental Data | ||
| Net Assets, End of Period (Millions) | $97 | $5 |
| Ratio of Total Expenses to Average Net Assets | — | — |
| Acquired Fund Fees and Expenses | 0.09% | 0.09%3 |
| Ratio of Net Investment Income to Average Net Assets | 2.51% | 4.33%3 |
| Portfolio Turnover Rate | 28% | 133% |
1 Inception.
2 Calculated based on average shares outstanding.
3 Annualized.
See accompanying Notes, which are an integral part of the Financial Statements.
73
Institutional Target Retirement 2065 Fund
Notes to Financial Statements
Vanguard Institutional Target Retirement 2065 Fund is registered under the Investment Company Act of 1940 as an open-end investment company, or mutual fund. The fund follows a balanced investment strategy by investing in selected Vanguard funds to achieve its targeted allocation of assets to U.S. and international stocks, and U.S. and international bonds. Financial statements and other information about each underlying fund are available on vanguard.com.
A. The following significant accounting policies conform to generally accepted accounting principles for U.S. investment companies. The fund consistently follows such policies in preparing its financial statements.
1. Security Valuation: Investments are valued at the net asset value of each underlying Vanguard fund determined as of the close of the New York Stock Exchange (generally 4 p.m., Eastern time) on the valuation date.
2. Futures Contracts: The fund uses stock and bond futures contracts to a limited extent, with the objectives of maintaining full exposure to the market and maintaining its target asset allocation. The primary risks associated with the use of futures contracts are imperfect correlation between changes in market values of investments held by the fund and the prices of futures contracts, and the possibility of an illiquid market. Counterparty risk involving futures is mitigated because a regulated clearing-house is the counterparty instead of the clearing broker. To further mitigate counterparty risk, the fund trades futures contracts on an exchange, monitors the financial strength of its clearing brokers and clearinghouse, and has entered into clearing agreements with its clearing brokers. The clearing-house imposes initial margin requirements to secure the fund’s performance and requires daily settlement of variation margin representing changes in the market value of each contract. Any assets pledged as initial margin for open contracts are noted in the Statement of Net Assets.
Futures contracts are valued at their quoted daily settlement prices. The notional amounts of the contracts are not recorded in the Statement of Net Assets. Fluctuations in the value of the contracts are recorded in the Statement of Asset and Liabilities as an asset (liability) and in the Statement of Operations as unrealized appreciation (depreciation) until the contracts are closed, when they are recorded as realized futures gains (losses).
During the year ended September 30, 2018, the fund’s average investments in long and short futures contracts each represented 0% of net assets, based on the average of the notional amounts at each quarter-end during the period. The fund had no open futures contracts at September 30, 2018.
3. Federal Income Taxes: The fund intends to continue to qualify as a regulated investment company and distribute all of its taxable income. Management has analyzed the fund’s tax positions taken for all open federal income tax years (September 30, 2017–2018), and has concluded that no provision for federal income tax is required in the fund’s financial statements.
4. Distributions: Distributions to shareholders are recorded on the ex-dividend date. Distributions are determined on a tax basis and may differ from net investment income and realized capital gains for financial reporting purposes.
74
Institutional Target Retirement 2065 Fund
5. Credit Facility: The fund and certain other funds managed by The Vanguard Group (“Vanguard”) participate in a $3.1 billion committed credit facility provided by a syndicate of lenders pursuant to a credit agreement that may be renewed annually; each fund is individually liable for its borrowings, if any, under the credit facility. Borrowings may be utilized for temporary and emergency purposes, and are subject to the fund’s regulatory and contractual borrowing restrictions. The participating funds are charged administrative fees and an annual commitment fee of 0.10% of the undrawn amount of the facility; these fees are allocated to the funds based on a method approved by the fund’s board of trustees and borne by the funds in which the fund invests (see Note B). Any borrowings under this facility bear interest at a rate based upon the higher of the one-month London Interbank Offered Rate, federal funds effective rate, or overnight bank funding rate plus an agreed-upon spread.
The fund had no borrowings outstanding at September 30, 2018, or at any time during the period then ended.
6. Other: Income and capital gain distributions received are recorded on the ex-dividend date. Security transactions are accounted for on the date securities are bought or sold. Costs used to determine realized gains (losses) on the sale of investment securities are those of the specific securities sold.
B. In accordance with the terms of a Funds’ Service Agreement (the “FSA”) between Vanguard and the fund, Vanguard furnishes to the fund investment advisory, corporate management, administrative, marketing, and distribution services at Vanguard’s cost of operations (as defined by the FSA). These costs of operations are allocated to the fund based on methods and guidelines approved by the board of trustees. The FSA provides that expenses otherwise allocable to Vanguard funds-of-funds may be reduced or eliminated to the extent of savings realized by the underlying Vanguard funds by virtue of being part of a fund-of-funds. Accordingly, all expenses for services provided by Vanguard to the fund and all other expenses incurred by the fund during the period ended September 30, 2018, were borne by the underlying Vanguard funds in which the fund invests. The fund’s trustees and officers are also trustees and officers, respectively, of the underlying Vanguard funds, as well as directors and employees, respectively, of Vanguard.
C. Various inputs may be used to determine the value of the fund’s investments. These inputs are summarized in three broad levels for financial statement purposes. The inputs or methodologies used to value securities are not necessarily an indication of the risk associated with investing in those securities.
Level 1—Quoted prices in active markets for identical securities.
Level 2—Other significant observable inputs (including quoted prices for similar securities, interest rates, prepayment speeds, credit risk, etc.).
Level 3—Significant unobservable inputs (including the fund’s own assumptions used to determine the fair value of investments). Any investments valued with significant unobservable inputs are noted on the Statement of Net Assets.
At September 30, 2018, 100% of the market value of the fund’s investments was determined based on Level 1 inputs.
75
Institutional Target Retirement 2065 Fund
D. Permanent differences between book-basis and tax-basis components of net assets, if any, are reclassified among capital accounts in the financial statements to reflect their tax character. These reclassifications have no effect on net assets or net asset value per share.
Temporary differences between book-basis and tax-basis components of accumulated net earnings (losses) arise when certain items of income, gain, or loss are recognized in different periods for financial statement and tax purposes; these differences will reverse at some time in the future. The differences are primarily related to the tax deferral of losses on wash sales. As of period end, the tax-basis components of accumulated net earnings (losses) are detailed in the table as follows:
| Amount | |
| ($000) | |
| Undistributed Ordinary Income | 1,072 |
| Undistributed Long-Term Gains | — |
| Capital Loss Carryforwards (Non-expiring) | (45) |
| Net Unrealized Gains (Losses) | 2,217 |
As of September 30, 2018, gross unrealized appreciation and depreciation for investments and derivatives based on cost for U.S. federal income tax purposes were as follows:
| Amount | ||
| ($000) | ||
| Tax Cost | 94,304 | |
| Gross Unrealized Appreciation | 3,547 | |
| Gross Unrealized Depreciation | (1,330) | |
| Net Unrealized Appreciation (Depreciation) | 2,217 | |
| E. Capital shares issued and redeemed were: | ||
| Year Ended | July 12, 20171 to | |
| September 30, 2018 | September 30, 2018 | |
| Shares | Shares | |
| (000) | (000) | |
| Issued | 5,679 | 273 |
| Issued in Lieu of Cash Distributions | 6 | — |
| Redeemed | (1,677) | (10) |
| Net Increase (Decrease) in Shares Outstanding | 4,008 | 263 |
| 1 Inception. | ||
76
Institutional Target Retirement 2065 Fund
| F. Transactions during the period in affiliated underlying Vanguard funds were as follows: | ||||||||
| Current Period Transactions | ||||||||
| Sept. 30, | Proceeds | Realized | Sept. 30, | |||||
| 2017 | from | Net | Change in | Capital Gain | 2018 | |||
| Market | Purchases | Securities | Gain | Unrealized | Distributions | Market | ||
| Value | at Cost | Sold | (Loss) | App. (Dep.) | Income | Received | Value | |
| ($000) | ($000) | ($000) | ($000) | ($000) | ($000) | ($000) | ($000) | |
| Vanguard Market | ||||||||
| Liquidity Fund | 86 | NA1 | NA1 | — | — | 5 | — | 1 |
| Vanguard Total | ||||||||
| Bond Market II | ||||||||
| Index Fund | 377 | 7,602 | 1,109 | (6) | (98) | 88 | — | 6,766 |
| Vanguard Total | ||||||||
| International Bond | ||||||||
| Index Fund | 161 | 3,197 | 465 | (3) | 2 | 22 | — | 2,892 |
| Vanguard Total | ||||||||
| International Stock | ||||||||
| Index Fund Investor | ||||||||
| Shares | 1,946 | 37,622 | 3,862 | (38) | (1,151) | 518 | — | 34,517 |
| Vanguard Total | ||||||||
| International Stock | ||||||||
| Index Fund | ||||||||
| ETF Shares2 | — | 221 | 221 | — | — | — | — | — |
| Vanguard Total | ||||||||
| Stock Market | ||||||||
| Index Fund | ||||||||
| Institutional Shares | 2,911 | 52,366 | 6,326 | 2 | 3,392 | 544 | — | 52,345 |
| Vanguard Total | ||||||||
| Stock Market | ||||||||
| Index Fund | ||||||||
| ETF Shares2 | — | 1,204 | 1,206 | 2 | — | — | — | — |
| Total | 5,481 | 102,212 | 13,189 | (43) | (2,145) | 1,177 | — | 96,521 |
| 1 Not applicable—purchases and sales are for temporary cash investment purposes. | ||||||||
| 2 The fund invested in ETF Shares during the period, but sold their positions before period end. | ||||||||
G. Management has determined that no events or transactions occurred subsequent to September 30, 2018, that would require recognition or disclosure in these financial statements.
77
Report of Independent Registered Public Accounting Firm
To the Board of Trustees of Vanguard Chester Funds and Shareholders of Vanguard Institutional Target Retirement 2040 Fund, Vanguard Institutional Target Retirement 2045 Fund, Vanguard Institutional Target Retirement 2050 Fund, Vanguard Institutional Target Retirement 2055 Fund, Vanguard Institutional Target Retirement 2060 Fund and Vanguard Institutional Target Retirement 2065 Fund
Opinions on the Financial Statements
We have audited the accompanying statements of net assets and statements of assets and liabilities of each of the funds indicated in the table below (six of the funds constituting Vanguard Chester Funds, hereafter collectively referred to as the “Funds”) as of September 30, 2018, the related statements of operations and of changes in net assets for each of the periods indicated in the table below, including the related notes, and the financial highlights for each of the periods indicated therein (collectively referred to as the “financial statements”). In our opinion, the financial statements present fairly, in all material respects, the financial position of each of the Funds as of September 30, 2018, the results of each of their operations and the changes in each of their net assets for each of the periods indicated in the table below, and each of the financial highlights for each of the periods indicated therein in conformity with accounting principles generally accepted in the United States of America.
| Vanguard Institutional Target Retirement 2040 Fund | Statements of operations for the year ended |
| Vanguard Institutional Target Retirement 2045 Fund | September 30, 2018 and statements of changes in |
| Vanguard Institutional Target Retirement 2050 Fund | net assets for each of the two years in the period |
| Vanguard Institutional Target Retirement 2055 Fund | ended September 30, 2018 |
| Vanguard Institutional Target Retirement 2060 Fund | |
| Vanguard Institutional Target Retirement 2065 Fund | Statement of operations for the year ended |
| September 30, 2018 and statement of changes | |
| in net assets for the year ended September 30, 2018 | |
| and for the period July 12, 2017 (inception) through | |
| September 30, 2017 | |
Basis for Opinions
These financial statements are the responsibility of the Funds’ management. Our responsibility is to express an opinion on the Funds’ financial statements based on our audits. We are a public accounting firm registered with the Public Company Accounting Oversight Board (United States) (“PCAOB”) and are required to be independent with respect to the Funds in accordance with the U.S. federal securities laws and the applicable rules and regulations of the Securities and Exchange Commission and the PCAOB.
We conducted our audits of these financial statements in accordance with the standards of the PCAOB. Those standards require that we plan and perform the audit to obtain reasonable assurance about whether the financial statements are free of material misstatement, whether due to error or fraud.
Our audits included performing procedures to assess the risks of material misstatement of the financial statements, whether due to error or fraud, and performing procedures that respond to those risks. Such procedures included examining, on a test basis, evidence regarding the amounts and disclosures in the financial statements. Our audits also included evaluating the accounting principles used and significant estimates made by management, as well as evaluating the overall
78
presentation of the financial statements. Our procedures included confirmation of securities owned as of September 30, 2018 by agreement to the underlying ownership records of the transfer agent. We believe that our audits provide a reasonable basis for our opinions.
/s/ PricewaterhouseCoopers LLP
Philadelphia, Pennsylvania
November 13, 2018
We have served as the auditor of one or more investment companies in The Vanguard Group of Funds since 1975.
Special 2018 tax information (unaudited) for Vanguard Institutional Target Retirement Funds
This information for the fiscal year ended September 30, 2018, is included pursuant to provisions of the Internal Revenue Code.
The funds distributed capital gain dividends (20% rate gain distributions) to shareholders during the fiscal year as follows:
| Fund | ($000) |
| Institutional Target Retirement 2040 | 328 |
| Institutional Target Retirement 2045 | 164 |
| Institutional Target Retirement 2050 | 110 |
| Institutional Target Retirement 2055 | 37 |
| Institutional Target Retirement 2060 | 8 |
| Institutional Target Retirement 2065 | — |
79
For nonresident alien shareholders, 100% of short-term capital gain dividends distributed by the funds are qualified short-term capital gains.
The funds distributed qualified dividend income to shareholders during the fiscal year as follows:
| Fund | ($000) |
| Institutional Target Retirement 2040 | 214,172 |
| Institutional Target Retirement 2045 | 180,933 |
| Institutional Target Retirement 2050 | 118,155 |
| Institutional Target Retirement 2055 | 47,292 |
| Institutional Target Retirement 2060 | 11,716 |
| Institutional Target Retirement 2065 | 92 |
For corporate shareholders, the percentage of investment income (dividend income plus short-term gains, if any) that qualifies for the dividends-received deduction is as follows:
| Fund | Percentage |
| Institutional Target Retirement 2040 | 37.3% |
| Institutional Target Retirement 2045 | 39.2 |
| Institutional Target Retirement 2050 | 39.1 |
| Institutional Target Retirement 2055 | 39.1 |
| Institutional Target Retirement 2060 | 38.9 |
| Institutional Target Retirement 2065 | 37.9 |
The funds designate to shareholders foreign source income and foreign taxes paid as follows:
| Foreign Source Income | Foreign Taxes Paid | |
| Fund | ($000) | ($000) |
| Institutional Target Retirement 2040 | 185,886 | 11,006 |
| Institutional Target Retirement 2045 | 157,291 | 9,552 |
| Institutional Target Retirement 2050 | 108,266 | 6,584 |
| Institutional Target Retirement 2055 | 46,293 | 2,819 |
| Institutional Target Retirement 2060 | 12,591 | 768 |
| Institutional Target Retirement 2065 | 544 | 34 |
Shareholders will receive more detailed information with their Form 1099-DIV in January 2019 to determine the calendar-year amounts to be included on their 2018 tax returns.
80
About Your Fund’s Expenses
As a shareholder of the fund, you incur ongoing costs, which include costs for portfolio management, administrative services, and shareholder reports (like this one), among others. Operating expenses, which are deducted from a fund’s gross income, directly reduce the investment return of the fund.
A typical fund’s expenses are expressed as a percentage of its average net assets. The Institutional Target Retirement Funds have no direct expenses, but each fund bears its proportionate share of the costs for the underlying funds in which it invests. These indirect expenses make up the acquired fund fees and expenses, also expressed as a percentage of average net assets.
The following examples are intended to help you understand the ongoing cost (in dollars) of investing in your fund and to compare these costs with those of other mutual funds. The examples are based on an investment of $1,000 made at the beginning of the period shown and held for the entire period. The costs were calculated using the acquired fund fees and expenses for each Institutional Target Retirement Fund.
The accompanying table illustrates your fund’s costs in two ways:
• Based on actual fund return. This section helps you to estimate the actual expenses that you paid over the period. The ”Ending Account Value“ shown is derived from the fund‘s actual return, and the third column shows the dollar amount that would have been paid by an investor who started with $1,000 in the fund. You may use the information here, together with the amount you invested, to estimate the expenses that you paid over the period.
To do so, simply divide your account value by $1,000 (for example, an $8,600 account value divided by $1,000 = 8.6), then multiply the result by the number given for your fund under the heading ”Expenses Paid During Period.“
• Based on hypothetical 5% yearly return. This section is intended to help you compare your fund‘s costs with those of other mutual funds. It assumes that the fund had a yearly return of 5% before expenses, but that the expense ratio is unchanged. In this case—because the return used is not the fund’s actual return—the results do not apply to your investment. The example is useful in making comparisons because the Securities and Exchange Commission requires all mutual funds to calculate expenses based on a 5% return. You can assess your fund’s costs by comparing this hypothetical example with the hypothetical examples that appear in shareholder reports of other funds.
Note that the expenses shown in the table are meant to highlight and help you compare ongoing costs only and do not reflect transaction costs incurred by the fund for buying and selling securities. Further, the expenses do not include any purchase, redemption, or account service fees described in the fund prospectus. If such fees were applied to your account, your costs would be higher. Your fund does not carry a “sales load.”
The calculations assume no shares were bought or sold during the period. Your actual costs may have been higher or lower, depending on the amount of your investment and the timing of any purchases or redemptions.
You can find more information about the fund’s expenses, including annual expense ratios, in the Financial Statements section of this report. For additional information on operating expenses and other shareholder costs, please refer to your fund’s current prospectus.
81
| Six Months Ended September 30, 2018 | |||
| Beginning | Ending | Expenses | |
| Account Value | Account Value | Paid During | |
| 3/31/2018 | 9/30/2018 | Period | |
| Based on Actual Fund Return | |||
| Institutional Target Retirement 2040 Fund | $1,000.00 | $1,047.68 | $0.46 |
| Institutional Target Retirement 2045 Fund | $1,000.00 | $1,050.27 | $0.46 |
| Institutional Target Retirement 2050 Fund | $1,000.00 | $1,050.23 | $0.46 |
| Institutional Target Retirement 2055 Fund | $1,000.00 | $1,050.15 | $0.46 |
| Institutional Target Retirement 2060 Fund | $1,000.00 | $1,050.15 | $0.46 |
| Institutional Target Retirement 2065 Fund | $1,000.00 | $1,049.49 | $0.46 |
| Based on Hypothetical 5% Yearly Return | |||
| Institutional Target Retirement 2040 Fund | $1,000.00 | $1,024.62 | $0.46 |
| Institutional Target Retirement 2045 Fund | $1,000.00 | $1,024.62 | $0.46 |
| Institutional Target Retirement 2050 Fund | $1,000.00 | $1,024.62 | $0.46 |
| Institutional Target Retirement 2055 Fund | $1,000.00 | $1,024.62 | $0.46 |
| Institutional Target Retirement 2060 Fund | $1,000.00 | $1,024.62 | $0.46 |
| Institutional Target Retirement 2065 Fund | $1,000.00 | $1,024.62 | $0.46 |
The calculations are based on the acquired fund fees and expenses for the most recent six-month period. The funds’ annualized expense figures for that period are (in order as listed from top to bottom above) 0.09%, 0.09%, 0.09%, 0.09%, 0.09%, and 0.09%. The dollar amounts shown as ”Expenses Paid” are equal to the annualized average weighted expense ratio for the underlying funds multiplied by the average account value over the period, multiplied by the number of days in the most recent six-month period, then divided by the number of days in the most recent 12-month period (183/365).
82
Glossary
30-Day SEC Yield. A fund’s 30-day SEC yield is derived using a formula specified by the U.S. Securities and Exchange Commission. Under the formula, data related to the fund’s security holdings in the previous 30 days are used to calculate the fund’s hypothetical net income for that period, which is then annualized and divided by the fund’s estimated average net assets over the calculation period. For the purposes of this calculation, a security’s income is based on its current market yield to maturity (for bonds), its actual income (for asset-backed securities), or its projected dividend yield (for stocks). Because the SEC yield represents hypothetical annualized income, it will differ—at times significantly—from the fund’s actual experience. As a result, the fund’s income distributions may be higher or lower than implied by the SEC yield.
Acquired Fund Fees and Expenses. Funds that invest in other Vanguard funds incur no direct expenses, but they do bear proportionate shares of the operating, administrative, and advisory expenses of the underlying funds, and they must pay any fees charged by those funds. The figure for acquired fund fees and expenses represents a weighted average of these underlying costs. Acquired is a term that the Securities and Exchange Commission applies to any mutual fund whose shares are owned by another fund.
Expense Ratio. A fund’s total annual operating expenses expressed as a percentage of the fund’s average net assets. The expense ratio includes management and administrative expenses, but does not include the transaction costs of buying and selling portfolio securities.
Inception Date. The date on which the assets of a fund (or one of its share classes) are first invested in accordance with the fund’s investment objective. For funds with a subscription period, the inception date is the day after that period ends. Investment performance is measured from the inception date.
Benchmark Information
Target 2040 Composite Index: Derived by applying the fund’s target asset allocation to the results of the following benchmarks: for international stocks of developed markets, the MSCI EAFE Index through December 15, 2010, the MSCI ACWI ex USA IMI Index through June 2, 2013, and the FTSE Global All Cap ex US Index thereafter; for emerging-market stocks, the Select Emerging Markets Index through August 23, 2006, the MSCI Emerging Markets Index through December 15, 2010, the MSCI ACWI ex USA IMI Index through June 2, 2013, and the FTSE Global All Cap ex US Index thereafter; for U.S. bonds, the Bloomberg Barclays U.S. Aggregate Bond Index through December 31, 2009, and the Bloomberg Barclays U.S. Aggregate Float Adjusted Index thereafter; for international bonds, the Bloomberg Barclays Global Aggregate ex-USD Float Adjusted RIC Capped Index beginning June 3, 2013; and for U.S. stocks, the MSCI US Broad Market Index through June 2, 2013, and the CRSP US Total Market Index thereafter. International stock benchmark returns are adjusted for withholding taxes.
83
Target 2045 Composite Index: Derived by applying the fund’s target asset allocation to the results of the following benchmarks: for international stocks of developed markets, the MSCI EAFE Index through December 15, 2010, the MSCI ACWI ex USA IMI Index through June 2, 2013, and the FTSE Global All Cap ex US Index thereafter; for emerging-market stocks, the Select Emerging Markets Index through August 23, 2006, the MSCI Emerging Markets Index through December 15, 2010, the MSCI ACWI ex USA IMI Index through June 2, 2013, and the FTSE Global All Cap ex US Index thereafter; for U.S. bonds, the Bloomberg Barclays U.S. Aggregate Bond Index through December 31, 2009, and the Bloomberg Barclays U.S. Aggregate Float Adjusted Index thereafter; for international bonds, the Bloomberg Barclays Global Aggregate ex-USD Float Adjusted RIC Capped Index beginning June 3, 2013; and for U.S. stocks, the Dow Jones U.S. Total Stock Market Index (formerly known as the Dow Jones Wilshire 5000 Index) through April 22, 2005, the MSCI US Broad Market Index through June 2, 2013, and the CRSP US Total Market Index thereafter. International stock benchmark returns are adjusted for withholding taxes.
Target 2050 Composite Index: Derived by applying the fund’s target asset allocation to the results of the following benchmarks: for international stocks of developed markets, the MSCI EAFE Index through December 15, 2010, the MSCI ACWI ex USA IMI Index through June 2, 2013, and the FTSE Global All Cap ex US Index thereafter; for emerging-market stocks, the Select Emerging Markets Index through August 23, 2006, the MSCI Emerging Markets Index through December 15, 2010, the MSCI ACWI ex USA IMI Index through June 2, 2013, and the FTSE Global All Cap ex US Index thereafter; for U.S. bonds, the Bloomberg Barclays U.S. Aggregate Bond Index through December 31, 2009, and the Bloomberg Barclays U.S. Aggregate Float Adjusted Index thereafter; for international bonds, the Bloomberg Barclays Global Aggregate ex-USD Float Adjusted RIC Capped Index beginning June 3, 2013; and for U.S. stocks, the MSCI US Broad Market Index through June 2, 2013, and the CRSP US Total Market Index thereafter. International stock benchmark returns are adjusted for withholding taxes.
Target 2055 Composite Index: Derived by applying the fund’s target asset allocation to the results of the following benchmarks: for international stocks of developed markets, the MSCI EAFE Index through December 15, 2010, the MSCI ACWI ex USA IMI Index through June 2, 2013, and the FTSE Global All Cap ex US Index thereafter; for emerging-market stocks, the MSCI Emerging Markets Index through December 15, 2010, the MSCI ACWI ex USA IMI Index through June 2, 2013, and the FTSE Global All Cap ex US Index thereafter; for U.S. bonds, the Bloomberg Barclays U.S. Aggregate Float Adjusted Index; for international bonds, the Bloomberg Barclays Global Aggregate ex-USD Float Adjusted RIC Capped Index beginning June 3, 2013; and for U.S. stocks, the MSCI US Broad Market Index through June 2, 2013, and the CRSP US Total Market Index thereafter. International stock benchmark returns are adjusted for withholding taxes.
84
Target 2060 Composite Index: Derived by applying the fund’s target asset allocation to the results of the following benchmarks: for international stocks of developed markets, the MSCI ACWI ex USA IMI Index through June 2, 2013, and the FTSE Global All Cap ex US Index thereafter; for emerging-market stocks, the MSCI ACWI ex USA IMI Index through June 2, 2013, and the FTSE Global All Cap ex US Index thereafter; for U.S. bonds, the Bloomberg Barclays U.S. Aggregate Float Adjusted Index; for international bonds, the Bloomberg Barclays Global Aggregate ex-USD Float Adjusted RIC Capped Index beginning June 3, 2013; and for U.S. stocks, the MSCI US Broad Market Index through June 2, 2013, and the CRSP US Total Market Index thereafter. International stock benchmark returns are adjusted for withholding taxes.
Target 2065 Composite Index: Derived by applying the fund’s target asset allocation to the results of the following benchmarks: the FTSE Global All Cap ex US Index for international stocks, the Bloomberg Barclays U.S. Aggregate Float Adjusted Index for U.S. bonds, the Bloomberg Barclays Global Aggregate ex-USD Float Adjusted RIC Capped Index for international bonds, and the CRSP US Total Market Index for U.S. stocks. International stock benchmark returns are adjusted for withholding taxes.
85
BLOOMBERG is a trademark and service mark of Bloomberg Finance L.P. BARCLAYS is a trademark and service mark of Barclays Bank Plc, used under license. Bloomberg Finance L.P. and its affiliates, including Bloomberg Index Services Limited (BISL) (collectively, Bloomberg), or Bloomberg’s licensors, own all proprietary rights in the Bloomberg Barclays U.S. Aggregate Bond Index, Bloomberg Barclays U.S. Aggregate Float Adjusted Index, and the Bloomberg Barclays Global Aggregate ex-USD Float Adjusted RIC Capped Index (USD Hedged) (the Indices or Bloomberg Barclays Indices).
Neither Barclays Bank Plc, Barclays Capital Inc., or any affiliate (collectively Barclays) or Bloomberg is the issuer or producer of the Institutional Target Retirement Funds (including the Total Bond Market II Index Fund and the Total International Bond Index Fund) and neither Bloomberg nor Barclays has any responsibilities, obligations or duties to investors in the Institutional Target Retirement Funds. The Indices are licensed for use by The Vanguard Group, Inc. (Vanguard) as the sponsor of the Institutional Target Retirement Funds. Bloomberg and Barclays’ only relationship with Vanguard in respect to the Indices is the licensing of the Indices, which is determined, composed and calculated by BISL, or any successor thereto, without regard to the Issuer or the Institutional Target Retirement Funds or the owners of the Institutional Target Retirement Funds.
Additionally, Vanguard may for itself execute transaction(s) with Barclays in or relating to the Indices in connection with the Institutional Target Retirement Funds. Investors acquire the Institutional Target Retirement Funds from Vanguard and investors neither acquire any interest in the Indices nor enter into any relationship of any kind whatsoever with Bloomberg or Barclays upon making an investment in the Institutional Target Retirement Funds. The Institutional Target Retirement Funds are not sponsored, endorsed, sold or promoted by Bloomberg or Barclays. Neither Bloomberg nor Barclays makes any representation or warranty, express or implied regarding the advisability of investing in the Institutional Target Retirement Funds or the advisability of investing in securities generally or the ability of the Indices to track corresponding or relative market performance. Neither Bloomberg nor Barclays has passed on the legality or suitability of the Institutional Target Retirement Funds with respect to any person or entity. Neither Bloomberg nor Barclays is responsible for and has not participated in the determination of the timing of, prices at, or quantities of the Institutional Target Retirement Funds to be issued. Neither Bloomberg nor Barclays has any obligation to take the needs of the Issuer or the owners of the Institutional Target Retirement Funds or any other third party into consideration in determining, composing or calculating the Indices. Neither Bloomberg nor Barclays has any obligation or liability in connection with administration, marketing or trading of the Institutional Target Retirement Funds.
86
The licensing agreement between Bloomberg and Barclays is solely for the benefit of Bloomberg and Barclays and not for the benefit of the owners of the Institutional Target Retirement Funds, investors or other third parties. In addition, the licensing agreement between Vanguard and Bloomberg is solely for the benefit of Vanguard and Bloomberg and not for the benefit of the owners of the Institutional Target Retirement Funds, investors or other third parties.
NEITHER BLOOMBERG NOR BARCLAYS SHALL HAVE ANY LIABILITY TO THE ISSUER, INVESTORS OR TO OTHER THIRD PARTIES FOR THE QUALITY, ACCURACY AND/OR COMPLETENESS OF THE BLOOMBERG BARCLAYS INDICES
OR ANY DATA INCLUDED THEREIN OR FOR INTERRUPTIONS IN THE DELIVERY OF THE BLOOMBERG BARCLAYS INDICES. NEITHER BLOOMBERG NOR BARCLAYS MAKES ANY WARRANTY, EXPRESS OR IMPLIED, AS TO RESULTS TO BE OBTAINED BY THE ISSUER, THE INVESTORS OR ANY OTHER PERSON OR ENTITY FROM THE USE OF THE BLOOMBERG BARCLAYS INDICES OR ANY DATA INCLUDED THEREIN. NEITHER BLOOMBERG NOR BARCLAYS MAKES ANY EXPRESS OR IMPLIED WARRANTIES, AND EACH HEREBY EXPRESSLY DISCLAIMS ALL WARRANTIES OF MERCHANTABILITY OR FITNESS FOR A PARTICULAR PURPOSE OR USE WITH RESPECT TO BLOOMBERG BARCLAYS INDICES OR ANY DATA INCLUDED THEREIN. BLOOMBERG RESERVES THE RIGHT TO CHANGE THE METHODS OF CALCULATION OR PUBLICATION, OR TO CEASE THE CALCULATION OR PUBLICATION OF THE BLOOMBERG BARCLAYS INDICES, AND NEITHER BLOOMBERG NOR BARCLAYS SHALL BE LIABLE FOR ANY MISCALCULATION OF OR ANY INCORRECT, DELAYED OR INTERRUPTED PUBLICATION WITH RESPECT TO ANY OF THE BLOOMBERG BARCLAYS INDICES. NEITHER BLOOMBERG NOR BARCLAYS SHALL BE LIABLE FOR ANY DAMAGES, INCLUDING, WITHOUT LIMITATION, ANY SPECIAL, INDIRECT OR CONSEQUENTIAL DAMAGES, OR ANY LOST PROFITS AND EVEN IF ADVISED OF THE POSSIBILITY OF SUCH, RESULTING FROM THE USE OF BLOOMBERG BARCLAYS INDICES OR ANY DATA INCLUDED THEREIN OR WITH RESPECT TO THE INSTITUTIONAL TARGET RETIREMENT FUNDS.
None of the information supplied by Bloomberg or Barclays and used in this publication may be reproduced in any manner without the prior written permission of both Bloomberg and Barclays Capital, the investment banking division of Barclays Bank Plc. Barclays Bank Plc is registered in England No. 1026167. Registered office 1 Churchill Place London E14 5HP.
© 2018 Bloomberg. Used with Permission.
Source: Bloomberg Index Services Limited. Copyright 2018, Bloomberg. All rights reserved.
87
This page intentionally left blank.
This page intentionally left blank.
This page intentionally left blank.
The People Who Govern Your Fund
The trustees of your mutual fund are there to see that the fund is operated and managed in your best interests since, as a shareholder, you are a part owner of the fund. Your fund’s trustees also serve on the board of directors of The Vanguard Group, Inc., which is owned by the Vanguard funds and provides services to them on an at-cost basis.
A majority of Vanguard’s board members are independent, meaning that they have no affiliation with Vanguard or the funds they oversee, apart from the sizable personal investments they have made as private individuals. The independent board members have distinguished backgrounds in business, academia, and public service. Each of the trustees and executive officers oversees 211 Vanguard funds.
Information for each trustee and executive officer of the fund appears below. The mailing address of the trustees and officers is P.O. Box 876, Valley Forge, PA 19482. More information about the trustees is in the Statement of Additional Information, which can be obtained, without charge, by contacting Vanguard at 800-662-7447, or online at vanguard.com.
Interested Trustees1
F. William McNabb III
Born in 1957. Trustee since July 2009. Principal occupation(s) during the past five years and other experience: chairman of the board (January 2010–present) of Vanguard and of each of the investment companies served by Vanguard, trustee (2009–present) of each of the investment companies served by Vanguard, and director (2008–present) of Vanguard. Chief executive officer and president (2008–2017) of Vanguard and each of the investment companies served by Vanguard, managing director (1995–2008) of Vanguard, and director (1997–2018) of Vanguard Marketing Corporation. Director (2018–present) of UnitedHealth Group.
Mortimer J. Buckley
Born in 1969. Trustee since January 2018. Principal occupation(s) during the past five years and other experience: chief executive officer (January 2018–present) of Vanguard; chief executive officer, president, and trustee (January 2018–present) of each of the investment companies served by Vanguard; president and director (2017–present) of Vanguard; and president (February 2018–present) of Vanguard Marketing Corporation. Chief investment officer (2013–2017), managing director (2002–2017), head of the Retail Investor Group (2006–2012), and chief information officer (2001–2006) of Vanguard. Chairman of the board (2011–2017) of the Children’s Hospital of Philadelphia.
Independent Trustees
Emerson U. Fullwood
Born in 1948. Trustee since January 2008. Principal occupation(s) during the past five years and other experience: executive chief staff and marketing officer for North America and corporate vice president (retired 2008) of Xerox Corporation (document management products and services). Former president of the Worldwide Channels Group, Latin America, and Worldwide Customer Service and executive chief staff officer of Developing Markets of Xerox. Executive in residence and 2009–2010 Distinguished Minett Professor at the Rochester Institute of Technology. Lead director of SPX FLOW, Inc. (multi-industry manufacturing). Director of the University of Rochester Medical Center, the Monroe Community College Foundation, the United Way of Rochester, North Carolina A&T University, and Roberts Wesleyan College. Trustee of the University of Rochester.
Amy Gutmann
Born in 1949. Trustee since June 2006. Principal occupation(s) during the past five years and other experience: president (2004–present) of the University of Pennsylvania. Christopher H. Browne Distinguished Professor of Political Science, School of Arts and Sciences, and professor of communication, Annenberg School for Communication, with secondary faculty appointments in the Department of Philosophy, School of Arts and Sciences, and at the Graduate School of Education, University of Pennsylvania. Trustee of the National Constitution Center.
1 Mr. McNabb and Mr. Buckley are considered “interested persons,” as defined in the Investment Company Act of 1940, because they are officers of the Vanguard funds.
JoAnn Heffernan Heisen
Born in 1950. Trustee since July 1998. Principal occupation(s) during the past five years and other experience: corporate vice president of Johnson & Johnson (pharmaceuticals/medical devices/consumer products) and member of its executive committee (1997–2008). Chief global diversity officer (retired 2008), vice president and chief information officer (1997–2006), controller (1995–1997), treasurer (1991–1995), and assistant treasurer (1989–1991) of Johnson & Johnson. Director of Skytop Lodge Corporation (hotels) and the Robert Wood Johnson Foundation. Member of the advisory board of the Institute for Women’s Leadership at Rutgers University.
F. Joseph Loughrey
Born in 1949. Trustee since October 2009. Principal occupation(s) during the past five years and other experience: president and chief operating officer (retired 2009) and vice chairman of the board (2008–2009) of Cummins Inc. (industrial machinery). Chairman of the board of Hillenbrand, Inc. (specialized consumer services), Oxfam America, and the Lumina Foundation for Education. Director of the V Foundation for Cancer Research. Member of the advisory council for the College of Arts and Letters and chair of the advisory board to the Kellogg Institute for International Studies, both at the University of Notre Dame.
Mark Loughridge
Born in 1953. Trustee since March 2012. Principal occupation(s) during the past five years and other experience: senior vice president and chief financial officer (retired 2013) of IBM (information technology services). Fiduciary member of IBM’s Retirement Plan Committee (2004–2013), senior vice president and general manager (2002–2004) of IBM Global Financing, vice president and controller (1998–2002) of IBM, and a variety of other prior management roles at IBM. Member of the Council on Chicago Booth.
Scott C. Malpass
Born in 1962. Trustee since March 2012. Principal occupation(s) during the past five years and other experience: chief investment officer (1989–present) and vice president (1996–present) of the University of Notre Dame. Assistant professor of finance at the Mendoza College of Business, University of Notre Dame, and member of the Notre Dame 403(b) Investment Committee. Chairman of the board of TIFF Advisory Services, Inc. Member of the board of Catholic Investment Services, Inc. (investment advisors), the board of advisors for Spruceview Capital Partners, and the board of superintendence of the Institute for the Works of Religion.
Deanna Mulligan
Born in 1963. Trustee since January 2018. Principal occupation(s) during the past five years and other experience: president (2010–present) and chief executive officer (2011–present) of The Guardian Life Insurance Company of America. Chief operating officer (2010–2011) and executive vice president (2008–2010) of Individual Life and Disability of The Guardian Life Insurance Company of America. Member of the board of The Guardian Life Insurance Company of America, the American Council of Life Insurers, the Partnership for New York City (business leadership), and the Committee Encouraging Corporate Philanthropy. Trustee of the Economic Club of New York and the Bruce Museum (arts and science). Member of the Advisory Council for the Stanford Graduate School of Business.
André F. Perold
Born in 1952. Trustee since December 2004. Principal occupation(s) during the past five years and other experience: George Gund Professor of Finance and Banking, Emeritus at the Harvard Business School (retired 2011). Chief investment officer and co-managing partner of HighVista Strategies LLC (private investment firm). Overseer of the Museum of Fine Arts Boston.
Sarah Bloom Raskin
Born in 1961. Trustee since January 2018. Principal occupation(s) during the past five years and other experience: deputy secretary (2014–2017) of the United States Department of the Treasury. Governor (2010–2014) of the Federal Reserve Board. Commissioner (2007–2010) of financial regulation for the State of Maryland. Member of the board of directors (2012–2014) of Neighborhood Reinvestment Corporation. Director of i(x) Investments, LLC.
Peter F. Volanakis
Born in 1955. Trustee since July 2009. Principal occupation(s) during the past five years and other experience: president and chief operating officer (retired 2010) of Corning Incorporated (communications equipment) and director of Corning Incorporated (2000–2010) and Dow Corning (2001–2010). Director (2012) of SPX Corporation (multi-industry manufacturing). Overseer of the Amos Tuck School of Business Administration, Dartmouth College (2001–2013). Chairman of the board of trustees of Colby-Sawyer College. Member of the Board of Hypertherm Inc. (industrial cutting systems, software, and consumables).
Executive Officers
Glenn Booraem
Born in 1967. Principal occupation(s) during the past five years and other experience: principal of Vanguard. Investment stewardship officer (2017–present), treasurer (2015–2017), controller (2010–2015), and assistant controller (2001–2010) of each of the investment companies served by Vanguard.
Christine M. Buchanan
Born in 1970. Principal occupation(s) during the past five years and other experience: principal of Vanguard and global head of Fund Administration at Vanguard. Treasurer (2017–present) of each of the investment companies served by Vanguard. Partner (2005–2017) at KPMG LLP (audit, tax, and advisory services).
Brian Dvorak
Born in 1973. Principal occupation(s) during the past five years and other experience: principal of Vanguard. Chief compliance officer (2017–present) of Vanguard and each of the investment companies served by Vanguard. Assistant vice president (2017–present) of Vanguard Marketing Corporation. Vice president and director of Enterprise Risk Management (2011–2013) at Oppenheimer Funds, Inc.
Thomas J. Higgins
Born in 1957. Principal occupation(s) during the past five years and other experience: principal of Vanguard. Chief financial officer (2008–present) and treasurer (1998–2008) of each of the investment companies served by Vanguard.
Peter Mahoney
Born in 1974. Principal occupation(s) during the past five years and other experience: principal of Vanguard. Controller (2015–present) of each of the investment companies served by Vanguard. Head of International Fund Services (2008–2014) at Vanguard.
Anne E. Robinson
Born in 1970. Principal occupation(s) during the past five years and other experience: general counsel (2016–present) of Vanguard. Secretary (2016–present) of Vanguard and of each of the investment companies served by Vanguard. Managing director (2016–present) of Vanguard. Director and senior vice president (2016–2018) of Vanguard Marketing Corporation. Managing director and general counsel of Global Cards and Consumer Services (2014–2016) at Citigroup. Counsel (2003–2014) at American Express.
Michael Rollings
Born in 1963. Principal occupation(s) during the past five years and other experience: finance director (2017–present) and treasurer (2017) of each of the investment companies served by Vanguard. Managing director (2016–present) of Vanguard. Chief financial officer (2016–present) of Vanguard. Director (2016–present) of Vanguard Marketing Corporation. Executive vice president and chief financial officer (2006–2016) of MassMutual Financial Group.
| Vanguard Senior Management Team | |
| Joseph Brennan | Chris D. McIsaac |
| Mortimer J. Buckley | James M. Norris |
| Gregory Davis | Thomas M. Rampulla |
| John James | Karin A. Risi |
| Martha G. King | Anne E. Robinson |
| John T. Marcante | Michael Rollings |
| Chairman Emeritus and Senior Advisor | |
| John J. Brennan | |
| Chairman, 1996–2009 | |
| Chief Executive Officer and President, 1996–2008 | |
| Founder | |
| John C. Bogle | |
| Chairman and Chief Executive Officer, 1974–1996 | |
 | |
P.O. Box 2600 | |
Connect with Vanguard® > vanguard.com | |
| Fund Information > 800-662-7447 | |
| Direct Investor Account Services > 800-662-2739 | |
| Institutional Investor Services > 800-523-1036 | |
| Text Telephone for People | |
| Who Are Deaf or Hard of Hearing > 800-749-7273 | |
| This material may be used in conjunction | |
| with the offering of shares of any Vanguard | |
| fund only if preceded or accompanied by | |
| the fund’s current prospectus. | |
| All comparative mutual fund data are from Lipper, a | |
| Thomson Reuters Company, or Morningstar, Inc., unless | |
| otherwise noted. | |
| You can obtain a free copy of Vanguard’s proxy voting | |
| guidelines by visiting vanguard.com/proxyreporting or by | |
| calling Vanguard at 800-662-2739. The guidelines are | |
| also available from the SEC’s website, sec.gov. In | |
| addition, you may obtain a free report on how your fund | |
| voted the proxies for securities it owned during the 12 | |
| months ended June 30. To get the report, visit either | |
| vanguard.com/proxyreporting or sec.gov. | |
| You can review and copy information about your fund at | |
| the SEC’s Public Reference Room in Washington, D.C. To | |
| find out more about this public service, call the SEC at | |
| 202-551-8090. Information about your fund is also | |
| available on the SEC’s website, and you can receive | |
| copies of this information, for a fee, by sending a | |
| request in either of two ways: via email addressed to | |
| publicinfo@sec.gov or via regular mail addressed to the | |
| Public Reference Section, Securities and Exchange | |
| Commission, Washington, DC 20549-1520. | |
| © 2018 The Vanguard Group, Inc. | |
| All rights reserved. | |
| Vanguard Marketing Corporation, Distributor. | |
| Q6730B 112018 | |
Item 2: Code of Ethics. The Registrant has adopted a code of ethics that applies to the Registrant’s principal
executive officer, principal financial officer, principal accounting officer or controller or persons performing similar
functions. The Code of Ethics was amended during the reporting period covered by this report to make certain
technical, non-material changes.
Item 3: Audit Committee Financial Expert. All members of the Audit Committee have been determined by the
Registrant’s Board of Trustees to be Audit Committee Financial Experts and to be independent: JoAnn Heffernan
Heisen, F. Joseph Loughrey, Mark Loughridge, Sarah Bloom Raskin, and Peter F. Volanakis.
Item 4: Principal Accountant Fees and Services.
(a) Audit Fees.
Audit Fees of the Registrant
Fiscal Year Ended September 30, 2018: $34,000
Fiscal Year Ended September 30, 2017: $35,000
Aggregate Audit Fees of Registered Investment Companies in the Vanguard Group.
Fiscal Year Ended September 30, 2018: $9,734,277
Fiscal Year Ended September 30, 2017: $8,424,459
Includes fees billed in connection with audits of the Registrant, other registered investment companies in the
Vanguard complex, The Vanguard Group, Inc. and Vanguard Marketing Corporation.
(b) Audit-Related Fees.
Fiscal Year Ended September 30, 2018: $5,581,336
Fiscal Year Ended September 30, 2017: $3,194,093
Includes fees billed in connection with assurance and related services provided to the Registrant, other
registered investment companies in the Vanguard complex, The Vanguard Group, Inc., and Vanguard
Marketing Corporation.
(c) Tax Fees.
Fiscal Year Ended September 30, 2018: $347,985
Fiscal Year Ended September 30, 2017: $274,313
Includes fees billed in connection with tax compliance, planning, and advice services provided to the
Registrant, other registered investment companies in the Vanguard complex, The Vanguard Group, Inc., and
Vanguard Marketing Corporation.
(d) All Other Fees.
Fiscal Year Ended September 30, 2018: $0
Fiscal Year Ended September 30, 2017: $0
Includes fees billed for services related to tax reported information provided to the Registrant, other registered
investment companies in the Vanguard complex, The Vanguard Group, Inc., and Vanguard Marketing
Corporation.
(e) (1) Pre-Approval Policies. The policy of the Registrant’s Audit Committee is to consider and, if
appropriate, approve before the principal accountant is engaged for such services, all specific audit and non-
audit services provided to: the Registrant, other registered investment companies in the Vanguard complex,
The Vanguard Group, Inc., and entities controlled by The Vanguard Group, Inc. that provide ongoing services
to the Registrant. In making a determination, the Audit Committee considers whether the services are
consistent with maintaining the principal accountant’s independence.
In the event of a contingency situation in which the principal accountant is needed to provide services in
between scheduled Audit Committee meetings, the Chairman of the Audit Committee would be called on to
consider and, if appropriate, pre-approve audit or permitted non-audit services in an amount sufficient to
complete services through the next Audit Committee meeting, and to determine if such services would be
consistent with maintaining the accountant’s independence. At the next scheduled Audit Committee meeting,
services and fees would be presented to the Audit Committee for formal consideration, and, if appropriate,
approval by the entire Audit Committee. The Audit Committee would again consider whether such services and
fees are consistent with maintaining the principal accountant’s independence.
The Registrant’s Audit Committee is informed at least annually of all audit and non-audit services provided
by the principal accountant to the Vanguard complex, whether such services are provided to: the Registrant,
other registered investment companies in the Vanguard complex, The Vanguard Group, Inc., or other entities
controlled by The Vanguard Group, Inc. that provide ongoing services to the Registrant.
(2) No percentage of the principal accountant’s fees or services were approved pursuant to the waiver
provision of paragraph (c)(7)(i)(C) of Rule 2-01 of Regulation S-X.
(f) For the most recent fiscal year, over 50% of the hours worked under the principal accountant’s
engagement were not performed by persons other than full-time, permanent employees of the principal
accountant.
(g) Aggregate Non-Audit Fees.
Fiscal Year Ended September 30, 2018: $347,985
Fiscal Year Ended September 30, 2017: $274,313
Includes fees billed for non-audit services provided to the Registrant, other registered investment companies in
the Vanguard complex, The Vanguard Group, Inc., and Vanguard Marketing Corporation.
(h) For the most recent fiscal year, the Audit Committee has determined that the provision of all non-audit
services was consistent with maintaining the principal accountant’s independence.
Item 5: Audit Committee of Listed Registrants.
The Registrant is a listed issuer as defined in rule 10A-3 under the Securities Exchange Act of 1934 (“Exchange Act”).
The Registrant has a separately-designated standing audit committee established in accordance with Section
3(a)(58)(A) of the Exchange Act. The Registrant’s audit committee members are: JoAnn Heffernan Heisen, F. Joseph
Loughrey, Mark Loughridge, Sarah Bloom Raskin, and Peter F. Volanakis.
Item 6: Investments.
Not Applicable.
Item 7: Disclosure of Proxy Voting Policies and Procedures for Closed-End Management Investment Companies.
Not Applicable.
Item 8: Portfolio Managers of Closed-End Management Investment Companies.
Not Applicable.
Item 9: Purchase of Equity Securities by Closed-End Management Investment Company and Affiliated Purchasers.
Not Applicable.
Item 10: Submission of Matters to a Vote of Security Holders.
Not Applicable.
Item 11: Controls and Procedures.
(a) Disclosure Controls and Procedures. The Principal Executive and Financial Officers concluded
that the Registrant’s Disclosure Controls and Procedures are effective based on their evaluation of the
Disclosure Controls and Procedures as of a date within 90 days of the filing date of this report.
(b) Internal Control Over Financial Reporting. There were no significant changes in Registrant’s
Internal Control Over Financial Reporting or in other factors that could significantly affect this control
subsequent to the date of the evaluation, including any corrective actions with regard to significant deficiencies
and material weaknesses.
Item 12: Disclosure of Securities Lending Activities for Closed-End Management
Investment Companies.
Not Applicable.
Item 13: Exhibits.
(a) Code of Ethics.
(b) Certifications.
Pursuant to the requirements of the Securities Exchange Act of 1934 and the Investment Company Act of
1940, the registrant has duly caused this report to be signed on its behalf by the undersigned, thereunto duly
authorized.
| VANGUARD CHESTER FUNDS | |
| By: | /s/ MORTIMER J. BUCKLEY* |
| MORTIMER J. BUCKLEY | |
| CHIEF EXECUTIVE OFFICER | |
| Date: November 16, 2018 | |
Pursuant to the requirements of the Securities Exchange Act of 1934 and the Investment Company Act of
1940, this report has been signed below by the following persons on behalf of the registrant and in the
capacities and on the dates indicated.
| VANGUARD CHESTER FUNDS | |
| By: | /s/ MORTIMER J. BUCKLEY* |
| MORTIMER J. BUCKLEY | |
| CHIEF EXECUTIVE OFFICER | |
| Date: November 16, 2018 | |
| VANGUARD CHESTER FUNDS | |
| By: | /s/ THOMAS J. HIGGINS* |
| THOMAS J. HIGGINS | |
| CHIEF FINANCIAL OFFICER | |
| Date: November 16, 2018 | |
* By: /s/ Anne E. Robinson
Anne E. Robinson, pursuant to a Power of Attorney filed on January 18, 2018 see file Number 33-32216,
Incorporated by Reference.