UNITED STATES
SECURITIES AND EXCHANGE COMMISSION
Washington, D.C. 20549
FORM N-CSR
CERTIFIED SHAREHOLDER REPORT
OF
REGISTERED MANAGEMENT INVESTMENT COMPANIES
Investment Company Act file number: 811-04098
| Name of Registrant: | Vanguard Chester Funds |
| Address of Registrant: | P.O. Box 2600 |
| Valley Forge, PA 19482 |
| Name and address of agent for service: | Anne E. Robinson, Esquire |
| P.O. Box 876 | |
| Valley Forge, PA 19482 |
Registrant’s telephone number, including area code: (610) 669-1000
Date of fiscal year end: September 30
Date of reporting period: October 1, 2019—September 30, 2020
Item 1: Reports to Shareholders

Annual Report | September 30, 2020
Vanguard PRIMECAP Fund
|
See the inside front cover for important information about access to your fund’s annual and semiannual shareholder reports.
|
Important information about access to shareholder reports
Beginning on January 1, 2021, as permitted by regulations adopted by the Securities and Exchange Commission, paper copies of your fund’s annual and semiannual shareholder reports will no longer be sent to you by mail, unless you specifically request them. Instead, you will be notified by mail each time a report is posted on the website and will be provided with a link to access the report.
If you have already elected to receive shareholder reports electronically, you will not be affected by this change and do not need to take any action. You may elect to receive shareholder reports and other communications from the fund electronically by contacting your financial intermediary (such as a broker-dealer or bank) or, if you invest directly with the fund, by calling Vanguard at one of the phone numbers on the back cover of this report or by logging on to vanguard.com.
You may elect to receive paper copies of all future shareholder reports free of charge. If you invest through a financial intermediary, you can contact the intermediary to request that you continue to receive paper copies. If you invest directly with the fund, you can call Vanguard at one of the phone numbers on the back cover of this report or log on to vanguard.com. Your election to receive paper copies will apply to all the funds you hold through an intermediary or directly with Vanguard.
Contents
| Your Fund’s Performance at a Glance | 1 | |
| Advisor’s Report | 2 | |
| About Your Fund’s Expenses | 6 | |
| Performance Summary | 8 | |
| Financial Statements | 10 | |
| Trustees Approve Advisory Arrangement | 26 |
Please note: The opinions expressed in this report are just that—informed opinions. They should not be considered promises or advice. Also, please keep in mind that the information and opinions cover the period through the date on the front of this report. Of course, the risks of investing in your fund are spelled out in the prospectus.
Your Fund’s Performance at a Glance
· Vanguard PRIMECAP Fund returned 15.13% for Admiral™ Shares and 15.05% for Investor Shares for the 12 months ended September 30, 2020, in line with the return of its benchmark, the Standard & Poor’s 500 Index.
· Stock market indexes across the globe hit record highs in February, then fell sharply as COVID-19 spread beyond China, leading many countries to close nonessential businesses, impose lockdowns, and restrict travel. Massive fiscal and monetary support from governments and central banks, signs of economic healing, and reported progress toward a vaccine all buoyed the markets until September, when investor sentiment soured a little.
· Growth stocks outperformed their value counterparts, and large-capitalization stocks outdistanced mid- and small-caps.
· In the bond markets, volatility rose and liquidity fell in March as the pandemic spread. By the end of the period, however, yields were significantly lower and prices were higher.
· Holdings in the energy and consumer discretionary sectors contributed most to relative performance for the 12 months. Industrials and information technology detracted.
Market Barometer
| Average Annual Total Returns | |||
| Periods Ended September 30, 2020 | |||
| One Year | Three Years | Five Years | |
| Stocks | |||
| Russell 1000 Index (Large-caps) | 16.01% | 12.38% | 14.09% |
| Russell 2000 Index (Small-caps) | 0.39 | 1.77 | 8.00 |
| Russell 3000 Index (Broad U.S. market) | 15.00 | 11.65 | 13.69 |
| FTSE All-World ex US Index (International) | 3.55 | 1.50 | 6.49 |
| Bonds | |||
| Bloomberg Barclays U.S. Aggregate Bond Index | |||
| (Broad taxable market) | 6.98% | 5.24% | 4.18% |
| Bloomberg Barclays Municipal Bond Index | |||
| (Broad tax-exempt market) | 4.09 | 4.28 | 3.84 |
| FTSE Three-Month U.S. Treasury Bill Index | 1.02 | 1.65 | 1.15 |
| CPI | |||
| Consumer Price Index | 1.37% | 1.79% | 1.81% |
1
Advisor’s Report
For the 12 months ended September 30, 2020, Vanguard PRIMECAP Fund returned 15.05% for Investor Shares and 15.13% for Admiral Shares, in line with the 15.15% total return of its benchmark, the Standard & Poor’s 500 Index. Relative to the S&P 500 Index, favorable sector allocation roughly offset unfavorable stock selection during the period.
Investment environment
The fiscal year ended September 30, 2020, was one for the record books. What started uneventfully enough, back when yield curves and trade wars dominated investor concerns, morphed into a time of unprecedented tumult as COVID-19 wreaked global havoc. The U.S. economy endured a “Great Pause” in March and April when local restrictions, designed to mitigate the pandemic’s toll, severely constrained activity and output.
The subsequent economic collapse established several record-setting declines, among them the fastest bear market descent (the S&P 500 Index ultimately lost 34% of its value in just 22 trading sessions), the most job losses (more than 20 million, easily outpacing the Great Depression’s 12 million mark), and the steepest GDP drop (–31.4% in the second quarter). Similar scenes, differing only in timing and magnitude, unfolded around the world, fracturing the once-integrated global economy.
The U.S. government, in tandem with foreign authorities, unleashed a torrent of stimulus and support in response. This monetary-fiscal onslaught featured open-ended assurances from the Federal Reserve to maintain low interest rates and staggering amounts of deficit spending. But reopening the economy proved fraught with difficulty, and the initial recovery stalled somewhat at levels well below pre-pandemic highs.
Equity indexes bounced aggressively starting in late March, ahead of the economy’s turn. The S&P 500 Index surpassed its previous high in less than six months, a record-short bear market dip, and peaked in early September, up more than 60% from its late-March low. But this impressive performance masked substantial dispersion within, reflecting the pandemic’s uniquely disruptive influence. Many companies battled for survival, while some technology-oriented businesses, seemingly ready-made for stay-at-home isolation, thrived. For the full fiscal year, the information technology (+47%), consumer discretionary (+29%), and health care (+20%) sectors fared best, while energy (–45%) and financials (–12%) followed crude oil prices and interest rates sharply lower.
Outlook for U.S. equities
Our view on U.S. equities is decidedly mixed. The post-recession economy has been heavily reliant on artificial and unsustainable measures, including an astounding $2 trillion federal deficit in the second quarter alone and the promise of further stimulus ahead. And, as noted, the market’s apparent strength, unusually concentrated in larger technology stocks, belies a broader fundamental struggle on metaphorical Main Street, creating
2
an unusually bifurcated stock landscape. That said, U.S. Treasury yields hovered at historically depressed levels (0.7% for the 10-year Treasury yield at the end of the fiscal year), providing some support for the S&P 500 Index’s elevated valuation (20.5 times price/earnings valuation on 2021 estimated earnings).
We see more fundamental reasons for optimism in select cases. No therapy or drug has provided a silver bullet against COVID-19 yet, but we still anticipate medical solutions to materialize. Multiple vaccine candidates are on the cusp of clinical outcomes, as are several antibody therapies. Meanwhile, many stocks continue to languish, left behind in this protracted socially distanced existence. Our original expectation of a fairly prompt snapback was misplaced, but we still expect the eventual “new normal” to more closely resemble its 2019 antecedent than the current state of apprehension and isolation. This should divert oxygen from pandemic beneficiaries to a wide swath of struggling companies. A more fulsome recovery may also spur inflation and interest rates upward, which could finally and forcefully shift sentiment from high-multiple growth stocks to inexpensive value stocks.
Portfolio update
The fund’s sector exposures were broadly helpful. The portfolio maintained overweight positions in information technology, health care, and industrials; these sectors accounted for 71% of average assets, compared with 48% in the S&P 500 Index. The portfolio was slightly overweighted in consumer discretionary and underweighted in financials and communication services. The fund maintained limited exposure to consumer staples, energy, materials and real estate.
Stock selection was generally unfavorable, particularly in information technology, industrials, and financials. In information technology, the fund outperformed the market (+29% sector return) but badly lagged the benchmark return (+47%) on insufficient exposure to Apple (+109%). Apple alone contributed more than 300 basis points of underperformance, easily offsetting a terrific performance from the fund’s largest holding, Adobe (+78%).
In industrials, the fund’s significant airlines ownership suffered as travel collapsed, with United (–61%), American (–54%), Delta (–46%), and Southwest (–30%) weighing heavily on results. FedEx (+76%) provided a partial offset. In financials, the fund’s exposure to large banks—notably Wells Fargo (–51%)—detracted.
Elsewhere in the portfolio, consumer discretionary and health care were bright spots. Standout performer Tesla (+791%) rocketed higher on stronger fundamentals and the allure of its seemingly limitless potential. Tesla coupled with Alibaba (+76%) more than offset the fund’s sizable underweight in Amazon (+81%). In health care, large positions in Amgen (+35%) and Eli Lilly (+35%) helped results.
As of September 30, 2020, the fund’s top 10 holdings made up 39% of assets.
3
Advisor perspectives
Perhaps the single most noteworthy feature of today’s equity market is an element of inequity: the sheer relative size of so-called Big Tech. Just four technology stocks—Apple, Microsoft, Amazon, and Google—make up more than 20 percent of the S&P 500 Index. Their combined capitalization (approximately $6 trillion) is roughly equivalent to the bottom 350 constituents of the index or to the Japan Exchange Group, the largest equity market outside the United States. The four stocks’ combined performance has strong-armed the S&P 500 Index to record highs; indeed, in a reflection of broader-based challenges, the S&P 500 Equal Weight Index has not yet approached its pre-COVID peak. History suggests that this concentrated technology frenzy warrants caution. In March 2000—a notoriously exuberant technology market—the four biggest stocks were “just” 16% of the market, and only three were technology stocks; with 2020’s hindsight, we know that story ended poorly for many.
But maybe this time is different, a prospect with which we wrestle daily; after all, Microsoft has defied doubters and maintained its lofty perch in the Big Four. In aggregate, valuations for these heavyweights are high but not irrationally so; their competitive moats seem to deepen with time, a function of their aggressive reinvestment strategy; and technology’s coronation feels less speculative or premature this time around.
And yet the fund’s exposure to these four companies stood at just 10% at the end of the fiscal year, half that of the index, with Microsoft and Google representing the bulk of our ownership. The fund’s underweight positions in Apple and Amazon have created a massive multiyear performance headwind. We acknowledge these two errors of omission, but we remain cautious. Size invites competition, disruption, and regulation. These high-priced titans must be more than impressive to justify their valuations—they must be near-flawless in handling internal and external threats, known and unknown. Our bias is to search elsewhere.
Health care also features prominently in the news and in our portfolio. The pandemic reinforces the incalculable value embedded in existing drugs, therapies, and devices, which facilitate our ongoing fight against disease and death—and which have presumably helped reduce COVID-19’s infection fatality ratio. But the pandemic also highlights how much value remains to be created with future breakthroughs, both in the COVID-19 realm and beyond. The health care sector has unsurprisingly fared well, and consensus estimates project market-leading revenue (+8%) and earnings (+5%) growth in a calendar year more commonly scarred with steep declines. But this is not chiefly a pandemic-fueled surge, and growth should persist indefinitely. Despite ongoing political concerns in a tense election year, we are optimistic that our companies will continue to develop life-saving innovations and that they will be rewarded by the marketplace.
4
Finally, much ink has been spilled in past letters defending our outsized airlines ownership. We viewed them as secular growers, operating in a vastly improved industry structure, and trading of late at less than half of the market’s valuation. Whatever the merits, our investment thesis—and our performance—was dealt a dramatic blow by COVID-19, forcing a structural reset in both our holdings and our thinking. We continue to own these companies, albeit more selectively and with overall lower exposure, ahead of travel’s eventual revival.
Conclusion
We still believe that some semblance of normalcy will prevail. Several pandemic-driven structural changes will likely persist, including a more flexible workforce, the fast-forwarding of digital transitions, and certain business travel indefinitely lost to Zoom. But if and when life does normalize, we expect the market’s winners to be drawn primarily from its pool of COVID-19 losers. Our portfolio is positioned accordingly, focused on stocks whose long-term potential deviates meaningfully from today’s dislocated share prices.
PRIMECAP Management Company
October 16, 2020
5
About Your Fund’s Expenses
As a shareholder of the fund, you incur ongoing costs, which include costs for portfolio management, administrative services, and shareholder reports (like this one), among others. Operating expenses, which are deducted from a fund’s gross income, directly reduce the investment return of the fund.
A fund’s expenses are expressed as a percentage of its average net assets. This figure is known as the expense ratio. The following examples are intended to help you understand the ongoing costs (in dollars) of investing in your fund and to compare these costs with those of other mutual funds. The examples are based on an investment of $1,000 made at the beginning of the period shown and held for the entire period.
The accompanying table illustrates your fund’s costs in two ways:
• Based on actual fund return. This section helps you to estimate the actual expenses that you paid over the period. The ”Ending Account Value“ shown is derived from the fund‘s actual return, and the third column shows the dollar amount that would have been paid by an investor who started with $1,000 in the fund. You may use the information here, together with the amount you invested, to estimate the expenses that you paid over the period.
To do so, simply divide your account value by $1,000 (for example, an $8,600 account value divided by $1,000 = 8.6), then multiply the result by the number given for your fund under the heading ”Expenses Paid During Period.“
• Based on hypothetical 5% yearly return. This section is intended to help you compare your fund‘s costs with those of other mutual funds. It assumes that the fund had a yearly return of 5% before expenses, but that the expense ratio is unchanged. In this case—because the return used is not the fund’s actual return—the results do not apply to your investment. The example is useful in making comparisons because the Securities and Exchange Commission requires all mutual funds to calculate expenses based on a 5% return. You can assess your fund’s costs by comparing this hypothetical example with the hypothetical examples that appear in shareholder reports of other funds.
Note that the expenses shown in the table are meant to highlight and help you compare ongoing costs only and do not reflect transaction costs incurred by the fund for buying and selling securities. Further, the expenses do not include any purchase, redemption, or account service fees described in the fund prospectus. If such fees were applied to your account, your costs would be higher. Your fund does not carry a “sales load.”
The calculations assume no shares were bought or sold during the period. Your actual costs may have been higher or lower, depending on the amount of your investment and the timing of any purchases or redemptions.
You can find more information about the fund’s expenses, including annual expense ratios, in the Financial Statements section of this report. For additional information on operating expenses and other shareholder costs, please refer to your fund’s current prospectus.
6
Six Months Ended September 30, 2020
| Beginning | Ending | Expenses | |
| PRIMECAP Fund | Account Value | Account Value | Paid During |
| 3/31/2020 | 9/30/2020 | Period | |
| Based on Actual Fund Return | |||
| Investor Shares | $1,000.00 | $1,286.33 | $2.17 |
| Admiral Shares | 1,000.00 | 1,286.77 | 1.77 |
| Based on Hypothetical 5% Yearly Return | |||
| Investor Shares | $1,000.00 | $1,023.10 | $1.92 |
| Admiral Shares | 1,000.00 | 1,023.45 | 1.57 |
The calculations are based on expenses incurred in the most recent six-month period. The fund’s annualized six-month expense ratios for that period are 0.38% for Investor Shares and 0.31% for Admiral Shares. The dollar amounts shown as “Expenses Paid” are equal to the annualized expense ratio multiplied by the average account value over the period, multiplied by the number of days in the most recent six-month period, then divided by the number of days in the most recent 12-month period (183/366).
7
PRIMECAP Fund
Performance Summary
All of the returns in this report represent past performance, which is not a guarantee of future results that may be achieved by the fund. (Current performance may be lower or higher than the performance data cited. For performance data current to the most recent month-end, visit our website at vanguard.com/performance.) Note, too, that both investment returns and principal value can fluctuate widely, so an investor’s shares, when sold, could be worth more or less than their original cost. The returns shown do not reflect taxes that a shareholder would pay on fund distributions or on the sale of fund shares.
Cumulative Performance: September 30, 2010, Through September 30, 2020
Initial Investment of $10,000

| Average Annual Total Returns | ||||||
| Periods Ended September 30, 2020 | Final Value | |||||
| One | Five | Ten | of a $10,000 | |||
| Year | Years | Years | Investment | |||
 | PRIMECAP Fund Investor Shares | 15.05% | 14.92% | 14.71% | $39,436 | |
 | S&P 500 Index | 15.15 | 14.15 | 13.74 | 36,244 | |
| Dow Jones U.S. Total Stock Market | ||||||
 | Float Adjusted Index | 14.77 | 13.60 | 13.43 | 35,263 | |
| Final Value | |||||
| One | Five | Ten | of a $50,000 | ||
| Year | Years | Years | Investment | ||
| PRIMECAP Fund Admiral Shares | 15.13% | 15.00% | 14.80% | $198,722 | |
| S&P 500 Index | 15.15 | 14.15 | 13.74 | 181,221 | |
| Dow Jones U.S. Total Stock Market Float Adjusted Index | 14.77 | 13.60 | 13.43 | 176,315 |
See Financial Highlights for dividend and capital gains information.
8
PRIMECAP Fund
Fund Allocation
As of September 30, 2020
| Communication Services | 6.7% |
| Consumer Discretionary | 13.5 |
| Consumer Staples | 0.0 |
| Energy | 0.8 |
| Financials | 6.0 |
| Health Care | 27.7 |
| Industrials | 15.0 |
| Information Technology | 29.5 |
| Materials | 0.8 |
| Real Estate | 0.0 |
The table reflects the fund's investments, except for short term investments. Sector categories are based on the Global Industry Classification Standard (“GICS”), except for the Other category (if applicable), which includes securities that have not been provided a GICS classification as of the effective reporting period.
The Global Industry Classification Standard (“GICS”) was developed by and is the exclusive property and a service mark of MSCI Inc. (“MSCI”) and Standard and Poor’s, a division of McGraw-Hill Companies, Inc. (“S&P”), and is licensed for use by Vanguard. Neither MSCI, S&P nor any third party involved in making or compiling the GICS or any GICS classification makes any express or implied warranties or representations with respect to such standard or classification (or the results to be obtained by the use thereof), and all such parties hereby expressly disclaim all warranties of originality, accuracy, completeness, merchantability or fitness for a particular purpose with respect to any such standard or classification. Without limiting any of the foregoing, in no event shall MSCI, S&P, any of its affiliates or any third party involved in making or compiling the GICS or any GICS classification have any liability for any direct, indirect, special, punitive, consequential or any other damages (including lost profits) even if notified of the possibility of such damages.
9
PRIMECAP Fund
Financial Statements
Schedule of Investments
As of September 30, 2020
The fund files its complete schedule of portfolio holdings with the Securities and Exchange Commission (SEC) for the first and third quarters of each fiscal year as an exhibit to its reports on Form N-PORT. The fund’s Form N-PORT reports are available on the SEC’s website at www.sec.gov.
| Market | |||||
| Value• | |||||
| Shares | ($000) | ||||
| Common Stocks (98.3%) | |||||
| Communication Services (6.5%) | |||||
| * | Alphabet Inc. Class A | 868,016 | 1,272,164 | ||
| * | Alphabet Inc. Class C | 720,159 | 1,058,346 | ||
| * | Baidu Inc. ADR | 5,216,204 | 660,319 | ||
| Activision Blizzard Inc. | 4,970,000 | 402,322 | |||
| Walt Disney Co. | 3,071,625 | 381,127 | |||
| * | Facebook Inc. Class A | 665,900 | 174,399 | ||
| * | Charter Communications Inc. Class A | 251,000 | 156,709 | ||
| * | T-Mobile US Inc. | 360,800 | 41,261 | ||
| Comcast Corp. Class A | 519,269 | 24,022 | |||
| * | Live Nation Entertainment Inc. | 360,150 | 19,405 | ||
| * | Altice USA Inc. Class A | 703,700 | 18,296 | ||
| 4,208,370 | |||||
| Consumer Discretionary (13.3%) | |||||
| * | Alibaba Group Holding Ltd. ADR | 7,779,176 | 2,286,922 | ||
| ^ | Sony Corp. ADR | 16,062,932 | 1,232,830 | ||
| * | Tesla Inc. | 2,768,700 | 1,187,800 | ||
| * | Amazon.com Inc. | 260,410 | 819,961 | ||
| 1 | Whirlpool Corp. | 3,954,372 | 727,169 | ||
| Ross Stores Inc. | 7,410,400 | 691,539 | |||
| TJX Cos. Inc. | 8,684,700 | 483,304 | |||
| *,1 | Mattel Inc. | 26,850,676 | 314,153 | ||
| L Brands Inc. | 7,865,114 | 250,189 | |||
| Royal Caribbean Cruises Ltd. | 2,069,147 | 133,936 | |||
| ^ | Carnival Corp. | 6,596,565 | 100,136 | ||
| eBay Inc. | 1,320,000 | 68,772 | |||
| * | Burlington Stores Inc. | 275,300 | 56,737 | ||
| Marriott International Inc. Class A | 556,710 | 51,540 | |||
| Restaurant Brands International Inc. | 763,500 | 43,909 | |||
| Hilton Worldwide Holdings Inc. | 365,366 | 31,173 | |||
| McDonald’s Corp. | 120,900 | 26,536 | |||
| Las Vegas Sands Corp. | 377,400 | 17,609 | |||
| MGM Resorts International | 553,400 | 12,036 | |||
| * | AutoZone Inc. | 4,950 | 5,829 | ||
| * | Dollar Tree Inc. | 62,000 | 5,663 | ||
| * | Ulta Beauty Inc. | 21,000 | 4,704 | ||
| 8,552,447 | |||||
| Consumer Staples (0.0%) | |||||
| Constellation Brands | |||||
| Inc. Class A | 41,300 | 7,827 | |||
| Mowi ASA | 381,600 | 6,789 | |||
| Altria Group Inc. | 115,100 | 4,447 | |||
| Philip Morris International Inc. | 56,100 | 4,207 | |||
| Kroger Co. | 96,900 | 3,286 | |||
| 26,556 | |||||
| Energy (0.8%) | |||||
| Hess Corp. | 5,247,000 | 214,760 | |||
| Pioneer Natural Resources Co. | 2,205,800 | 189,677 | |||
| EOG Resources Inc. | 1,898,600 | 68,235 | |||
| Noble Energy Inc. | 1,600,000 | 13,680 | |||
| ^,* | Transocean Ltd. | 12,303,573 | 9,928 | ||
| Schlumberger Ltd. | 66,700 | 1,038 | |||
| 497,318 | |||||
| Financials (5.9%) | |||||
| JPMorgan Chase & Co. | 9,194,075 | 885,114 | |||
| Marsh & McLennan Cos. Inc. | 5,710,515 | 654,996 | |||
| Wells Fargo & Co. | 27,747,627 | 652,347 | |||
| Charles Schwab Corp. | 16,656,816 | 603,477 | |||
| Bank of America Corp. | 23,479,132 | 565,612 | |||
| US Bancorp | 3,817,300 | 136,850 | |||
| Progressive Corp. | 1,372,000 | 129,887 | |||
| Citigroup Inc. | 2,047,300 | 88,259 | |||
| Discover Financial Services | 640,125 | 36,986 | |||
| CME Group Inc. | 65,068 | 10,887 | |||
| 3,764,415 | |||||
10
PRIMECAP Fund
| Market | |||||
| Value• | |||||
| Shares | ($000) | ||||
| Health Care (27.2%) | |||||
| Eli Lilly and Co. | 21,225,508 | 3,141,800 | |||
| Amgen Inc. | 10,232,855 | 2,600,782 | |||
| *,1 | Biogen Inc. | 9,117,892 | 2,586,564 | ||
| AstraZeneca plc ADR | 27,646,288 | 1,515,017 | |||
| Thermo Fisher Scientific Inc. | 2,620,402 | 1,156,960 | |||
| Novartis AG ADR | 13,109,825 | 1,140,030 | |||
| * | Boston Scientific Corp. | 28,581,744 | 1,092,108 | ||
| Roche Holding AG | 2,376,182 | 813,939 | |||
| Bristol-Myers Squibb Co. | 9,040,413 | 545,046 | |||
| * | BioMarin Pharmaceutical Inc. | 6,244,839 | 475,107 | ||
| * | Elanco Animal Health Inc. | 15,478,719 | 432,321 | ||
| Abbott Laboratories | 3,574,995 | 389,067 | |||
| * | BeiGene Ltd. ADR | 1,073,340 | 307,447 | ||
| Medtronic plc | 2,035,300 | 211,508 | |||
| Zimmer Biomet Holdings Inc. | 1,475,380 | 200,858 | |||
| 2 | Siemens Healthineers AG | 3,530,571 | 158,483 | ||
| CVS Health Corp. | 2,410,000 | 140,744 | |||
| * | Alcon Inc. | 2,400,412 | 136,703 | ||
| Merck & Co. Inc. | 1,500,000 | 124,425 | |||
| Agilent Technologies Inc. | 827,716 | 83,550 | |||
| Stryker Corp. | 400,500 | 83,452 | |||
| Sanofi ADR | 969,000 | 48,615 | |||
| * | Edwards Lifesciences Corp. | 607,500 | 48,491 | ||
| * | IQVIA Holdings Inc. | 197,009 | 31,055 | ||
| GlaxoSmithKline plc ADR | 548,000 | 20,627 | |||
| UnitedHealth Group Inc. | 1,955 | 609 | |||
| 17,485,308 | |||||
| Industrials (14.8%) | |||||
| FedEx Corp. | 9,166,406 | 2,305,535 | |||
| 1 | Southwest Airlines Co. | 34,230,156 | 1,283,631 | ||
| Siemens AG | 9,812,610 | 1,239,233 | |||
| * | Airbus SE | 9,544,798 | 692,247 | ||
| Caterpillar Inc. | 4,012,708 | 598,495 | |||
| Union Pacific Corp. | 2,653,000 | 522,296 | |||
| * | United Airlines Holdings Inc. | 14,188,203 | 493,040 | ||
| United Parcel Service Inc. Class B | 2,056,670 | 342,703 | |||
| Delta Air Lines Inc. | 10,054,400 | 307,464 | |||
| ^ | American Airlines Group Inc. | 24,421,613 | 300,142 | ||
| Alaska Air Group Inc. | 4,475,600 | 163,941 | |||
| TransDigm Group Inc. | 343,916 | 163,401 | |||
| Textron Inc. | 3,809,200 | 137,474 | |||
| * | Seimens Energy AG Rights | 4,906,305 | 132,306 | ||
| Raytheon Technologies Corp. | 1,983,400 | 114,125 | |||
| CSX Corp. | 1,319,700 | 102,501 | |||
| Deere & Co. | 400,000 | 88,652 | |||
| AMETEK Inc. | 869,550 | 86,433 | |||
| General Dynamics Corp. | 576,330 | 79,781 | |||
| Carrier Global Corp. | 2,330,100 | 71,161 | |||
| Otis Worldwide Corp. | 816,650 | 50,975 | |||
| * | Lyft Inc. Class A | 1,799,380 | 49,573 | ||
| L3Harris Technologies Inc. | 240,000 | 40,762 | |||
| Honeywell International Inc. | 240,000 | 39,506 | |||
| Rockwell Automation Inc. | 178,280 | 39,343 | |||
| Pentair plc | 588,000 | 26,913 | |||
| * | Ryanair Holdings plc ADR | 250,000 | 20,440 | ||
| nVent Electric plc | 887,900 | 15,707 | |||
| Boeing Co. | 70,200 | 11,601 | |||
| * | Uber Technologies Inc. | 21,900 | 799 | ||
| 9,520,180 | |||||
| Information Technology (29.0%) | |||||
| * | Adobe Inc. | 6,645,757 | 3,259,279 | ||
| Microsoft Corp. | 13,982,568 | 2,940,954 | |||
| Texas Instruments Inc. | 16,373,772 | 2,338,011 | |||
| * | Micron Technology Inc. | 29,373,074 | 1,379,360 | ||
| QUALCOMM Inc. | 9,266,845 | 1,090,522 | |||
| KLA Corp. | 5,130,260 | 993,937 | |||
| Intel Corp. | 15,636,892 | 809,678 | |||
| ^ | Telefonaktiebolaget LM Ericsson ADR | 70,696,226 | 769,882 | ||
| NVIDIA Corp. | 1,355,800 | 733,786 | |||
| Intuit Inc. | 1,813,950 | 591,729 | |||
| 1 | NetApp Inc. | 12,649,941 | 554,573 | ||
| Oracle Corp. | 6,789,900 | 405,357 | |||
| HP Inc. | 19,618,316 | 372,552 | |||
| Visa Inc. Class A | 1,643,200 | 328,591 | |||
| Hewlett Packard Enterprise Co. | 34,516,496 | 323,420 | |||
| Analog Devices Inc. | 2,765,900 | 322,891 | |||
| Apple Inc. | 2,130,000 | 246,675 | |||
| Cisco Systems Inc. | 5,432,579 | 213,989 | |||
| * | PayPal Holdings Inc. | 1,030,630 | 203,065 | ||
| Entegris Inc. | 2,395,022 | 178,046 | |||
| Corning Inc. | 5,169,700 | 167,550 | |||
| Applied Materials Inc. | 1,467,700 | 87,255 | |||
11
PRIMECAP Fund
| Market | ||||
| Value• | ||||
| Shares | ($000) | |||
| Mastercard Inc. Class A | 215,600 | 72,909 | ||
| * | Autodesk Inc. | 264,200 | 61,033 | |
| * | BlackBerry Ltd. | 10,505,100 | 48,218 | |
| 1 | Plantronics Inc. | 3,672,300 | 43,480 | |
| * | Palo Alto Networks Inc. | 112,900 | 27,632 | |
| * | Keysight Technologies Inc. | 264,000 | 26,078 | |
| * | Dell Technologies Inc. | 276,000 | 18,682 | |
| Western Digital Corp. | 385,500 | 14,090 | ||
| Perspecta Inc. | 470,023 | 9,142 | ||
| * | Rambus Inc. | 534,697 | 7,320 | |
| * | Infineon Technologies AG ADR | 75,000 | 2,118 | |
| * | Nokia Oyj ADR | 400,000 | 1,564 | |
| * | RingCentral Inc. Class A | 5,000 | 1,373 | |
| * | Okta Inc. | 3,400 | 727 | |
| * | Arista Networks Inc. | 1,500 | 310 | |
| 18,645,778 | ||||
| Materials (0.8%) | ||||
| Albemarle Corp. | 2,735,335 | 244,211 | ||
| Dow Inc. | 1,844,817 | 86,799 | ||
| DuPont de Nemours Inc. | 1,424,216 | 79,015 | ||
| Linde plc | 287,000 | 68,343 | ||
| Corteva Inc. | 1,358,416 | 39,136 | ||
| 517,504 | ||||
| Real Estate (0.0%) | ||||
| Alexandria Real Estate Equities Inc. | 62,800 | 10,048 | ||
| Total Common Stocks | ||||
| (Cost $26,697,157) | 63,227,924 | |||
| Temporary Cash Investment (2.2%) | ||||
| Money Market Fund (2.2%) | ||||
| 3,4 | Vanguard Market Liquidity Fund, 0.117% (Cost $1,421,483) | 14,218,839 | 1,421,884 | |
| Total Investments (100.5%) | |
| (Cost $28,118,640) | 64,649,808 |
| Other Assets and Liabilities—Net (-0.5%) | (326,748) |
| Net Assets (100%) | 64,323,060 |
Cost is in $000.
| • | See Note A in Notes to Financial Statements. |
| ^ | Includes partial security positions on loan to broker-dealers. The total value of securities on loan is $308,043,000. |
| * | Non-income-producing security. |
| 1 | Considered an affiliated company of the fund as the fund owns more than 5% of the outstanding voting securities of such company. |
| 2 | Security exempt from registration under Rule 144A of the Securities Act of 1933. Such securities may be sold in transactions exempt from registration, normally to qualified institutional buyers. At September 30, 2020, the value of this security represented 0.2% of net assets. |
| 3 | Affiliated money market fund available only to Vanguard funds and certain trusts and accounts managed by Vanguard. Rate shown is the 7-day yield. |
| 4 | Collateral of $327,140,000 was received for securities on loan, of which $323,382,000 is held in Vanguard Market Liquidity Fund and $3,758,000 is held in cash. |
ADR—American Depositary Receipt.
See accompanying Notes, which are an integral part of the Financial Statements.
12
PRIMECAP Fund
Statement of Assets and Liabilities
As of September 30, 2020
| ($000s, except shares and per-share amounts) | Amount |
| Assets | |
| Investments in Securities, at Value | |
| Unaffiliated Issuers (Cost $24,519,638) | 57,718,354 |
| Affiliated Issuers (Cost $3,599,002) | 6,931,454 |
| Total Investments in Securities | 64,649,808 |
| Investment in Vanguard | 2,724 |
| Cash | 3,758 |
| Receivables for Investment Securities Sold | 318 |
| Receivables for Accrued Income | 71,639 |
| Receivables for Capital Shares Issued | 3,403 |
| Total Assets | 64,731,650 |
| Liabilities | |
| Payables for Investment Securities Purchased | 16,955 |
| Collateral for Securities on Loan | 327,140 |
| Payables to Investment Advisor | 29,186 |
| Payables for Capital Shares Redeemed | 30,796 |
| Payables to Vanguard | 4,513 |
| Total Liabilities | 408,590 |
| Net Assets | 64,323,060 |
| At September 30, 2020, net assets consisted of: | |
| Paid-in Capital | 22,566,689 |
| Total Distributable Earnings (Loss) | 41,756,371 |
| Net Assets | 64,323,060 |
| Investor Shares—Net Assets | |
| Applicable to 39,877,689 outstanding $.001 par value shares of beneficial interest (unlimited authorization) | 5,696,935 |
| Net Asset Value Per Share—Investor Shares | $142.86 |
| Admiral Shares—Net Assets | |
| Applicable to 395,806,023 outstanding $.001 par value shares of beneficial interest (unlimited authorization) | 58,626,125 |
| Net Asset Value Per Share—Admiral Shares | $148.12 |
See accompanying Notes, which are an integral part of the Financial Statements.
13
PRIMECAP Fund
Statement of Operations
| Year Ended | |
| September 30, 2020 | |
| ($000) | |
| Investment Income | |
| Income | |
| Dividends—Unaffiliated Issuers1 | 991,256 |
| Dividends—Affiliated Issuers | 63,759 |
| Interest—Affiliated Issuers | 14,202 |
| Securities Lending—Net | 8,303 |
| Total Income | 1,077,520 |
| Expenses | |
| Investment Advisory Fees—Note B | 115,611 |
| The Vanguard Group—Note C | |
| Management and Administrative—Investor Shares | 11,012 |
| Management and Administrative—Admiral Shares | 69,791 |
| Marketing and Distribution—Investor Shares | 562 |
| Marketing and Distribution—Admiral Shares | 2,293 |
| Custodian Fees | 2,364 |
| Auditing Fees | 31 |
| Shareholders’ Reports—Investor Shares | 42 |
| Shareholders’ Reports—Admiral Shares | 163 |
| Trustees’ Fees and Expenses | 87 |
| Total Expenses | 201,956 |
| Net Investment Income | 875,564 |
| Realized Net Gain (Loss) | |
| Investment Securities Sold—Unaffiliated Issuers | 5,396,820 |
| Investment Securities Sold—Affiliated Issuers | (321,958) |
| Foreign Currencies | (94) |
| Realized Net Gain (Loss) | 5,074,768 |
| Change in Unrealized Appreciation (Depreciation) | |
| Investment Securities—Unaffiliated Issuers | 3,976,682 |
| Investment Securities—Affiliated Issuers | (1,174,837) |
| Foreign Currencies | 1,617 |
| Change in Unrealized Appreciation (Depreciation) | 2,803,462 |
| Net Increase (Decrease) in Net Assets Resulting from Operations | 8,753,794 |
1 Dividends are net of foreign withholding taxes of $19,194,000.
See accompanying Notes, which are an integral part of the Financial Statements.
14
PRIMECAP Fund
Statement of Changes in Net Assets
| Year Ended September 30, | ||||
| 2020 | 2019 | |||
| ($000) | ($000) | |||
| Increase (Decrease) in Net Assets | ||||
| Operations | ||||
| Net Investment Income | 875,564 | 877,672 | ||
| Realized Net Gain (Loss) | 5,074,768 | 4,100,360 | ||
| Change in Unrealized Appreciation (Depreciation) | 2,803,462 | (6,754,614) | ||
| Net Increase (Decrease) in Net Assets Resulting from Operations | 8,753,794 | (1,776,582) | ||
| Distributions1 | ||||
| Investor Shares | (444,045) | (460,605) | ||
| Admiral Shares | (4,239,627) | (4,127,699) | ||
| Total Distributions | (4,683,672) | (4,588,304) | ||
| Capital Share Transactions | ||||
| Investor Shares | (803,660) | (352,243) | ||
| Admiral Shares | (2,214,671) | 501,276 | ||
| Net Increase (Decrease) from Capital Share Transactions | (3,018,331) | 149,033 | ||
| Total Increase (Decrease) | 1,051,791 | (6,215,853) | ||
| Net Assets | ||||
| Beginning of Period | 63,271,269 | 69,487,122 | ||
| End of Period | 64,323,060 | 63,271,269 | ||
1 Certain prior-period numbers have been reclassified to conform with the current-period presentation.
See accompanying Notes, which are an integral part of the Financial Statements.
15
PRIMECAP Fund
Financial Highlights
Investor Shares
| For a Share Outstanding | Year Ended September 30, | ||||
| Throughout Each Period | 2020 | 2019 | 2018 | 2017 | 2016 |
| Net Asset Value, Beginning of Period | $133.12 | $147.61 | $126.84 | $107.60 | $96.99 |
| Investment Operations | |||||
| Net Investment Income | 1.7451 | 1.7151 | 1.4741 | 1.3981 | 1.401 |
| Net Realized and Unrealized Gain (Loss) on Investments | 17.947 | (6.495) | 26.529 | 23.145 | 15.103 |
| Total from Investment Operations | 19.692 | (4.780) | 28.003 | 24.543 | 16.504 |
| Distributions | |||||
| Dividends from Net Investment Income | (1.690) | (1.470) | (1.400) | (1.356) | (1.114) |
| Distributions from Realized Capital Gains | (8.262) | (8.240) | (5.833) | (3.947) | (4.780) |
| Total Distributions | (9.952) | (9.710) | (7.233) | (5.303) | (5.894) |
| Net Asset Value, End of Period | $142.86 | $133.12 | $147.61 | $126.84 | $107.60 |
| Total Return2 | 15.05% | -2.41% | 22.86% | 23.75% | 17.40% |
| Ratios/Supplemental Data | |||||
| Net Assets, End of Period (Millions) | $5,697 | $6,095 | $7,126 | $7,699 | $7,588 |
| Ratio of Total Expenses to Average Net Assets | 0.38% | 0.38% | 0.38% | 0.39% | 0.39% |
| Ratio of Net Investment Income to Average Net Assets | 1.31% | 1.32% | 1.08% | 1.22% | 1.37% |
| Portfolio Turnover Rate | 6% | 5% | 8% | 8% | 6% |
| 1 | Calculated based on average shares outstanding. |
| 2 | Total returns do not include account service fees that may have applied in the periods shown. Fund prospectuses provide information about any applicable account service fees. |
See accompanying Notes, which are an integral part of the Financial Statements.
16
PRIMECAP Fund
Financial Highlights
Admiral Shares
| For a Share Outstanding | Year Ended September 30, | ||||
| Throughout Each Period | 2020 | 2019 | 2018 | 2017 | 2016 |
| Net Asset Value, Beginning of Period | $138.02 | $153.09 | $131.45 | $111.52 | $100.53 |
| Investment Operations | |||||
| Net Investment Income | 1.9201 | 1.8801 | 1.6221 | 1.5281 | 1.532 |
| Net Realized and Unrealized Gain (Loss)on Investments | 18.600 | (6.756) | 27.508 | 23.981 | 15.645 |
| Total from Investment Operations | 20.520 | (4.876) | 29.130 | 25.509 | 17.177 |
| Distributions | |||||
| Dividends from Net Investment Income | (1.853) | (1.647) | (1.444) | (1.491) | (1.236) |
| Distributions from Realized Capital Gains | (8.567) | (8.547) | (6.046) | (4.088) | (4.951) |
| Total Distributions | (10.420) | (10.194) | (7.490) | (5.579) | (6.187) |
| Net Asset Value, End of Period | $148.12 | $138.02 | $153.09 | $131.45 | $111.52 |
| Total Return2 | 15.13% | -2.34% | 22.95% | 23.83% | 17.48% |
| Ratios/Supplemental Data | |||||
| Net Assets, End of Period (Millions) | $58,626 | $57,177 | $62,361 | $50,615 | $39,852 |
| Ratio of Total Expenses to Average Net Assets | 0.31% | 0.31% | 0.31% | 0.32% | 0.33% |
| Ratio of Net Investment Income to Average Net Assets | 1.39% | 1.39% | 1.15% | 1.29% | 1.43% |
| Portfolio Turnover Rate | 6% | 5% | 8% | 8% | 6% |
| 1 | Calculated based on average shares outstanding. | |
| 2 | Total returns do not include account service fees that may have applied in the periods shown. Fund prospectuses provide information about any applicable account service fees. |
See accompanying Notes, which are an integral part of the Financial Statements.
17
PRIMECAP Fund
Notes to Financial Statements
Vanguard PRIMECAP Fund is registered under the Investment Company Act of 1940 as an open-end investment company, or mutual fund. The fund offers two classes of shares: Investor Shares and Admiral Shares. Each of the share classes has different eligibility and minimum purchase requirements, and is designed for different types of investors.
Market disruptions associated with the COVID-19 pandemic have had a global impact, and uncertainty exists as to the long-term implications. Such disruptions can adversely affect assets of the fund and thus fund performance.
A. The following significant accounting policies conform to generally accepted accounting principles for U.S. investment companies. The fund consistently follows such policies in preparing its financial statements.
1. Security Valuation: Securities are valued as of the close of trading on the New York Stock Exchange (generally 4 p.m., Eastern time) on the valuation date. Equity securities are valued at the latest quoted sales prices or official closing prices taken from the primary market in which each security trades; such securities not traded on the valuation date are valued at the mean of the latest quoted bid and asked prices. Securities for which market quotations are not readily available, or whose values have been affected by events occurring before the fund’s pricing time but after the close of the securities’ primary markets, are valued at their fair values calculated according to procedures adopted by the board of trustees. These procedures include obtaining quotations from an independent pricing service, monitoring news to identify significant market- or security-specific events, and evaluating changes in the values of foreign market proxies (for example, ADRs, futures contracts, or exchange-traded funds), between the time the foreign markets close and the fund’s pricing time. When fair-value pricing is employed, the prices of securities used by a fund to calculate its net asset value may differ from quoted or published prices for the same securities. Investments in Vanguard Market Liquidity Fund are valued at that fund’s net asset value.
2. Foreign Currency: Securities and other assets and liabilities denominated in foreign currencies are translated into U.S. dollars using exchange rates obtained from an independent third party as of the fund’s pricing time on the valuation date. Realized gains (losses) and unrealized appreciation (depreciation) on investment securities include the effects of changes in exchange rates since the securities were purchased, combined with the effects of changes in security prices. Fluctuations in the value of other assets and liabilities resulting from changes in exchange rates are recorded as unrealized foreign currency gains (losses) until the assets or liabilities are settled in cash, at which time they are recorded as realized foreign currency gains (losses).
3. Federal Income Taxes: The fund intends to continue to qualify as a regulated investment company and distribute all of its taxable income. The fund’s tax returns are open to examination by the relevant tax authorities until expiration of the applicable statute of limitations, which is generally three years after the filing of the tax return. Management has analyzed the fund’s tax positions taken for all open federal and state income tax years, and has concluded that no provision for income tax is required in the fund’s financial statements.
4. Distributions: Distributions to shareholders are recorded on the ex-dividend date. Distributions are determined on a tax basis at the fiscal year-end and may differ from net investment income and realized capital gains for financial reporting purposes.
5. Securities Lending: To earn additional income, the fund lends its securities to qualified institutional borrowers. Security loans are subject to termination by the fund at any time, and are required to be secured at all times by collateral in an amount at least equal to the market value of securities loaned.
18
PRIMECAP Fund
Daily market fluctuations could cause the value of loaned securities to be more or less than the value of the collateral received. When this occurs, the collateral is adjusted and settled before the opening of the market on the next business day. The fund further mitigates its counterparty risk by entering into securities lending transactions only with a diverse group of prequalified counterparties, monitoring their financial strength, and entering into master securities lending agreements with its counterparties. The master securities lending agreements provide that, in the event of a counterparty’s default (including bankruptcy), the fund may terminate any loans with that borrower, determine the net amount owed, and sell or retain the collateral up to the net amount owed to the fund; however, such actions may be subject to legal proceedings. While collateral mitigates counterparty risk, in the event of a default, the fund may experience delays and costs in recovering the securities loaned. The fund invests cash collateral received in Vanguard Market Liquidity Fund, and records a liability in the Statement of Assets and Liabilities for the return of the collateral, during the period the securities are on loan. Collateral investments in Vanguard Market Liquidity Fund are subject to market appreciation or depreciation. Securities lending income represents fees charged to borrowers plus income earned on invested cash collateral, less expenses associated with the loan. During the term of the loan, the fund is entitled to all distributions made on or in respect of the loaned securities.
6. Credit Facilities and Interfund Lending Program: The fund and certain other funds managed by The Vanguard Group (“Vanguard”) participate in a $4.3 billion committed credit facility provided by a syndicate of lenders pursuant to a credit agreement and an uncommitted credit facility provided by Vanguard. Both facilities may be renewed annually. Each fund is individually liable for its borrowings, if any, under the credit facilities. Borrowings may be utilized for temporary or emergency purposes, subject to the fund’s regulatory and contractual borrowing restrictions. With respect to the committed credit facility, the participating funds are charged administrative fees and an annual commitment fee of 0.10% of the undrawn committed amount of the facility; these fees are allocated to the funds based on a method approved by the fund’s board of trustees and included in Management and Administrative expenses on the fund’s Statement of Operations. Any borrowings under either facility bear interest at a rate based upon the higher of the one-month London Interbank Offered Rate (or an acceptable alternate rate, if necessary), federal funds effective rate, or overnight bank funding rate plus an agreed-upon spread, except that borrowings under the uncommitted credit facility may bear interest based upon an alternative rate agreed to by the fund and Vanguard.
In accordance with an exemptive order (the “Order”) from the SEC, the fund may participate in a joint lending and borrowing program that allows registered open-end Vanguard funds to borrow money from and lend money to each other for temporary or emergency purposes (the “Interfund Lending Program”), subject to compliance with the terms and conditions of the Order, and to the extent permitted by the fund’s investment objective and investment policies. Interfund loans and borrowings normally extend overnight, but can have a maximum duration of seven days. Loans may be called on one business day’s notice. The interest rate to be charged is governed by the conditions of the Order and internal procedures adopted by the board of trustees. The board of trustees is responsible for overseeing the Interfund Lending Program.
For the year ended September 30, 2020, the fund did not utilize the credit facilities or the Interfund Lending Program.
19
PRIMECAP Fund
7. Other: Dividend income is recorded on the ex-dividend date. Interest income includes income distributions received from Vanguard Market Liquidity Fund and is accrued daily. Security transactions are accounted for on the date securities are bought or sold. Costs used to determine realized gains (losses) on the sale of investment securities are those of the specific securities sold.
Each class of shares has equal rights as to assets and earnings, except that each class separately bears certain class-specific expenses related to maintenance of shareholder accounts (included in Management and Administrative expenses) and shareholder reporting. Marketing and distribution expenses are allocated to each class of shares based on a method approved by the board of trustees. Income, other non-class-specific expenses, and gains and losses on investments are allocated to each class of shares based on its relative net assets.
B. PRIMECAP Management Company provides investment advisory services to the fund for a fee calculated at an annual percentage rate of average net assets. For the year ended September 30, 2020, the investment advisory fee represented an effective annual rate of 0.18% of the fund’s average net assets.
C. In accordance with the terms of a Funds’ Service Agreement (the “FSA”) between Vanguard and the fund, Vanguard furnishes to the fund corporate management, administrative, marketing, and distribution services at Vanguard’s cost of operations (as defined by the FSA). These costs of operations are allocated to the fund based on methods and guidelines approved by the board of trustees and are generally settled twice a month.
Upon the request of Vanguard, the fund may invest up to 0.40% of its net assets as capital in Vanguard. At September 30, 2020, the fund had contributed to Vanguard capital in the amount of $2,724,000, representing less than 0.01% of the fund’s net assets and 1.09% of Vanguard’s capital received pursuant to the FSA. The fund’s trustees and officers are also directors and employees, respectively, of Vanguard.
D. Various inputs may be used to determine the value of the fund’s investments. These inputs are summarized in three broad levels for financial statement purposes. The inputs or methodologies used to value securities are not necessarily an indication of the risk associated with investing in those securities.
Level 1—Quoted prices in active markets for identical securities.
Level 2—Other significant observable inputs (including quoted prices for similar securities, interest rates, prepayment speeds, credit risk, etc.).
Level 3—Significant unobservable inputs (including the fund’s own assumptions used to determine the fair value of investments). Any investments valued with significant unobservable inputs are noted on the Schedule of Investments.
20
PRIMECAP Fund
The following table summarizes the market value of the fund’s investments as of September 30, 2020, based on the inputs used to value them:
| Level 1 | Level 2 | Level 3 | Total | |
| ($000) | ($000) | ($000) | ($000) | |
| Investments | ||||
| Assets | ||||
| Common Stocks | 60,184,928 | 3,042,996 | — | 63,227,924 |
| Temporary Cash Investments | 1,421,884 | — | — | 1,421,884 |
| Total | 61,606,812 | 3,042,996 | — | 64,649,808 |
E. Permanent differences between book-basis and tax-basis components of net assets are reclassified among capital accounts in the financial statements to reflect their tax character. These reclassifications have no effect on net assets or net asset value per share. As of period end, permanent differences primarily attributable to the accounting for foreign currency transactions and distributions in connection with fund share redemptions were reclassified between the following accounts:
| Amount | |
| ($000) | |
| Paid-in Capital | 435,783 |
| Total Distributable Earnings (Loss) | (435,783) |
Temporary differences between book-basis and tax-basis components of total distributable earnings (loss) arise when certain items of income, gain, or loss are recognized in different periods for financial statement and tax purposes; these differences will reverse at some time in the future. The differences are primarily related to the deferral of losses from wash sales. As of period end, the tax-basis components of total distributable earnings (loss) are detailed in the table as follows:
| Amount | |
| ($000) | |
| Undistributed Ordinary Income | 597,765 |
| Undistributed Long-Term Gains | 4,626,133 |
| Capital Loss Carryforwards | — |
| Qualified Late-Year Losses | — |
| Net Unrealized Gains (Losses) | 36,532,473 |
21
PRIMECAP Fund
The tax character of distributions paid was as follows:
| Year Ended September 30, | |||
| 2020 | 2019 | ||
| Amount | Amount | ||
| ($000) | ($000) | ||
| Ordinary Income* | 925,147 | 775,112 | |
| Long-Term Capital Gains | 3,758,525 | 3,813,192 | |
| Total | 4,683,672 | 4,588,304 | |
* Includes short-term capital gains, if any.
As of September 30, 2020, gross unrealized appreciation and depreciation for investments based on cost for U.S. federal income tax purposes were as follows:
| Amount | |
| ($000) | |
| Tax Cost | 28,118,640 |
| Gross Unrealized Appreciation | 40,145,268 |
| Gross Unrealized Depreciation | (3,614,100) |
| Net Unrealized Appreciation (Depreciation) | 36,531,168 |
F. During the year ended September 30, 2020, the fund purchased $3,744,460,000 of investment securities and sold $10,090,425,000 of investment securities, other than temporary cash investments.
| G. | Capital share transactions for each class of shares were: |
| Year Ended September 30, | |||||
| 2020 | 2019 | ||||
| Amount | Shares | Amount | Shares | ||
| ($000) | (000) | ($000) | (000) | ||
| Investor Shares | |||||
| Issued | 547,781 | 4,262 | 625,656 | 4,823 | |
| Issued in Lieu of Cash Distributions | 432,110 | 3,129 | 449,317 | 3,799 | |
| Redeemed | (1,783,551) | (13,296) | (1,427,216) | (11,115) | |
| Net Increase (Decrease)—Investor Shares | (803,660) | (5,905) | (352,243) | (2,493) | |
| Admiral Shares | |||||
| Issued | 2,426,834 | 17,481 | 2,512,990 | 18,918 | |
| Issued in Lieu of Cash Distributions | 3,984,207 | 27,842 | 3,905,419 | 31,871 | |
| Redeemed | (8,625,712) | (63,781) | (5,917,133) | (43,874) | |
| Net Increase (Decrease)—Admiral Shares | (2,214,671) | (18,458) | 501,276 | 6,915 | |
22
PRIMECAP Fund
H. Certain of the fund’s investments are in companies that are considered to be affiliated companies of the fund because the fund owns more than 5% of the outstanding voting securities of the company or the issuer is another member of The Vanguard Group. Transactions during the period in securities of these companies were as follows:
| Current Period Transactions | ||||||||
| Sept. 30, | Proceeds | Realized | Sept. 30, | |||||
| 2019 | from | Net | Change in | Capital Gain | 2020 | |||
| Market | Purchases | Securities | Gain | Unrealized | Distributions | Market | ||
| Value | at Cost | Sold | (Loss) | App. (Dep.) | Income | Received | Value | |
| ($000) | ($000) | ($000) | ($000) | ($000) | ($000) | ($000) | ($000) | |
| Vanguard Market Liquidity Fund | 1,855,920 | NA1 | NA1 | (442) | 100 | 14,202 | — | 1,421,884 |
| American Airlines Group Inc. | 817,917 | — | 71,467 | (214,196) | (232,112) | 6,065 | — | NA2 |
| Biogen Inc. | NA3 | 45,778 | 74,757 | 1,214 | 468,577 | — | — | 2,586,564 |
| Mattel Inc. | 302,366 | 3,458 | 340 | (396) | 9,065 | — | — | 314,153 |
| NetApp Inc. | 679,019 | — | 13,617 | 2,778 | (113,607) | 24,558 | — | 554,573 |
| Plantronics Inc. | 137,050 | — | — | — | (93,570) | 1,102 | — | 43,480 |
| Southwest Airlines Co. | 1,889,408 | 62,129 | 111,386 | (22,059) | (534,461) | 12,500 | — | 1,283,631 |
| United Airlines Holdings Inc. | 1,407,965 | — | 51,808 | (78,100) | (785,017) | — | — | NA2 |
| Whirlpool Corp. | 666,628 | — | 34,890 | (10,757) | 106,188 | 19,534 | — | 727,169 |
| Total | 7,756,273 | (321,958) | (1,174,837) | 77,961 | — | 6,931,454 | ||
1 Not applicable—purchases and sales are for temporary cash investment purposes.
2 Not applicable—at September 30, 2020, the security was still held, but the issuer was no longer an affiliated company of the fund.
3 Not applicable—at September 30, 2019, the issuer was not an affiliated company of the fund.
I. Management has determined that no events or transactions occurred subsequent to September 30, 2020, that would require recognition or disclosure in these financial statements.
23
Report of Independent Registered Public Accounting Firm
To the Board of Trustees of Vanguard Chester Funds and Shareholders of Vanguard PRIMECAP Fund
Opinion on the Financial Statements
We have audited the accompanying statement of assets and liabilities, including the schedule of investments, of Vanguard PRIMECAP Fund (one of the funds constituting Vanguard Chester Funds, referred to hereafter as the “Fund”) as of September 30, 2020, the related statement of operations for the year ended September 30, 2020, the statement of changes in net assets for each of the two years in the period ended September 30, 2020, including the related notes, and the financial highlights for each of the five years in the period ended September 30, 2020 (collectively referred to as the “financial statements”). In our opinion, the financial statements present fairly, in all material respects, the financial position of the Fund as of September 30, 2020, the results of its operations for the year then ended, the changes in its net assets for each of the two years in the period ended September 30, 2020 and the financial highlights for each of the five years in the period ended September 30, 2020 in conformity with accounting principles generally accepted in the United States of America.
Basis for Opinion
These financial statements are the responsibility of the Fund’s management. Our responsibility is to express an opinion on the Fund’s financial statements based on our audits. We are a public accounting firm registered with the Public Company Accounting Oversight Board (United States) (“PCAOB”) and are required to be independent with respect to the Fund in accordance with the
U.S. federal securities laws and the applicable rules and regulations of the Securities and Exchange Commission and the PCAOB.
We conducted our audits of these financial statements in accordance with the standards of the PCAOB. Those standards require that we plan and perform the audit to obtain reasonable assurance about whether the financial statements are free of material misstatement, whether due to error or fraud.
Our audits included performing procedures to assess the risks of material misstatement of the financial statements, whether due to error or fraud, and performing procedures that respond to those risks. Such procedures included examining, on a test basis, evidence regarding the amounts and disclosures in the financial statements. Our audits also included evaluating the accounting principles used and significant estimates made by management, as well as evaluating the overall presentation of the financial statements. Our procedures included confirmation of securities owned as of September 30, 2020 by correspondence with the custodian and brokers and by agreement to the underlying ownership records of the transfer agent; when replies were not received from brokers, we performed other auditing procedures. We believe that our audits provide a reasonable basis for our opinion.
/s/PricewaterhouseCoopers LLP
Philadelphia, Pennsylvania
November 17, 2020
We have served as the auditor of one or more investment companies in The Vanguard Group of Funds since 1975.
24
Special 2020 tax information (unaudited) for Vanguard PRIMECAP Fund
This information for the fiscal year ended September 30, 2020, is included pursuant to provisions of the Internal Revenue Code.
The fund distributed $4,132,080,000 as capital gain dividends (20% rate gain distributions) to shareholders during the fiscal year.
For nonresident alien shareholders, 100% of short-term capital gain dividends distributed by the fund are qualified short-term capital gains.
The fund distributed $925,147,000 of qualified dividend income to shareholders during the fiscal year.
For corporate shareholders, 89.9% of investment income (dividend income plus short-term gains, if any) qualifies for the dividends-received deduction.
25
Trustees Approve Advisory Arrangement
The board of trustees of Vanguard PRIMECAP Fund has renewed the fund’s investment advisory arrangement with PRIMECAP Management Company (PRIMECAP). The board determined that renewing the fund’s advisory arrangement was in the best interests of the fund and its shareholders.
The board based its decision upon an evaluation of the advisor’s investment staff, portfolio management process, and performance. This evaluation included information provided to the board by Vanguard’s Portfolio Review Department, which is responsible for fund and advisor oversight and product management. The Portfolio Review Department met regularly with the advisor and made monthly presentations to the board during the fiscal year that directed the board’s focus to relevant information and topics.
The board, or an investment committee made up of board members, also received information throughout the year during advisor presentations. For each advisor presentation, the board was provided with letters and reports that included information about, among other things, the advisory firm and the advisor’s assessment of the investment environment, portfolio performance, and portfolio characteristics.
In addition, the board received monthly reports, which included a Market and Economic Report, a Fund Dashboard Monthly Summary, and a Fund Performance Report.
Prior to their meeting, the trustees were provided with a memo and material that summarized the information they received over the course of the year. They also considered the factors discussed below, among others. However, no single factor determined whether the board approved the arrangement. Rather, it was the totality of the circumstances that drove the board’s decision.
Nature, extent, and quality of services
The board reviewed the quality of the fund’s investment management services over both the short and long term, and took into account the organizational depth and stability of the advisor. The board considered that PRIMECAP, founded in 1983, is recognized for its long-term approach to growth equity investing. Five experienced portfolio managers are responsible for separate subportfolios, and each portfolio manager employs a fundamental, research-driven approach in seeking to identify companies with long-term growth potential that the market has yet to appreciate. The multi-counselor approach employed by PRIMECAP is designed to emphasize individual decision-making and enable the portfolio managers to invest in their highest-conviction ideas. The advisor’s fundamental research focuses on developing opinions independent from Wall Street’s consensus and maintaining a long-term horizon. PRIMECAP has managed the fund since its inception in 1984.
The board concluded that the advisor’s experience, stability, depth, and performance, among other factors, warranted continuation of the advisory arrangement.
Investment performance
The board considered the short- and long-term performance of the fund, including any periods of outperformance or underperformance compared with a relevant benchmark index and peer group. The board concluded that the performance was such that the advisory arrangement should continue.
26
Cost
The board concluded that the fund’s expense ratio was well below the average expense ratio charged by funds in its peer group and that the fund’s advisory fee rate was also well below the peer-group average.
The board did not consider the profitability of PRIMECAP in determining whether to approve the advisory fee, because PRIMECAP is independent of Vanguard and the advisory fee is the result of arm’s-length negotiations.
The benefit of economies of scale
The board concluded that the fund’s shareholders benefit from economies of scale because of breakpoints in the fund’s advisory fee schedule. The breakpoints reduce the effective rate of the fee as the fund’s assets increase.
The board will consider whether to renew the advisory arrangement again after a one-year period.
27
This page intentionally left blank.
This page intentionally left blank.
This page intentionally left blank.
The People Who Govern Your Fund
The trustees of your mutual fund are there to see that the fund is operated and managed in your best interests since, as a shareholder, you are a part owner of the fund. Your fund’s trustees also serve on the board of directors of The Vanguard Group, Inc., which is owned by the Vanguard funds and provides services to them.
A majority of Vanguard’s board members are independent, meaning that they have no affiliation with Vanguard or the funds they oversee, apart from the sizable personal investments they have made as private individuals. The independent board members have distinguished backgrounds in business, academia, and public service. Each of the trustees and executive officers oversees 213 Vanguard funds.
Information for each trustee and executive officer of the fund appears below. That information, as well as the Vanguard fund count, is as of the date on the cover of this fund report. The mailing address of the trustees and officers is P.O. Box 876, Valley Forge, PA 19482. More information about the trustees is in the Statement of Additional Information, which can be obtained, without charge, by contacting Vanguard at 800-662-7447, or online at vanguard.com.
Interested Trustee1
Mortimer J. Buckley
Born in 1969. Trustee since January 2018. Principal occupation(s) during the past five years and other experience: chairman of the board (2019–present) of Vanguard and of each of the investment companies served by Vanguard; chief executive officer (2018– present) of Vanguard; chief executive officer, president, and trustee (2018–present) of each of the investment companies served by Vanguard; president and director (2017–present) of Vanguard; and president (2018–present) of Vanguard Marketing Corporation. Chief investment officer (2013–2017), managing director (2002–2017), head of the Retail Investor Group (2006–2012), and chief information officer (2001–2006) of Vanguard. Chairman of the board (2011–2017) and trustee (2009–2017) of the Children’s Hospital of Philadelphia; and trustee (2018–present) and vice chair (2019–present) of The Shipley School.
Independent Trustees
Emerson U. Fullwood
Born in 1948. Trustee since January 2008. Principal occupation(s) during the past five years and other experience: executive chief staff and marketing officer for North America and corporate vice president (retired 2008) of Xerox Corporation (document management products and services). Former president of the Worldwide Channels Group, Latin America, and Worldwide Customer Service and executive chief staff officer of Developing Markets of Xerox. Executive in residence and 2009–2010 Distinguished Minett Professor at the Rochester Institute of Technology. Director of SPX FLOW, Inc. (multi-industry manufacturing). Director of the University of Rochester Medical Center, the Monroe Community College Foundation, the United Way of Rochester, North Carolina A&T University, and Roberts Wesleyan College. Trustee of the University of Rochester.
Amy Gutmann
Born in 1949. Trustee since June 2006. Principal occupation(s) during the past five years and other experience: president (2004–present) of the University of Pennsylvania. Christopher H. Browne Distinguished Professor of Political Science, School of Arts and Sciences, and professor of communication, Annenberg School for Communication, with secondary faculty appointments in the Department of Philosophy, School of Arts and Sciences, and at the Graduate School of Education, University of Pennsylvania.
F. Joseph Loughrey
Born in 1949. Trustee since October 2009. Principal occupation(s) during the past five years and other experience: president and chief operating officer (retired 2009) and vice chairman of the board (2008–2009) of Cummins Inc. (industrial machinery). Chairman of the board of Hillenbrand, Inc. (specialized consumer services) and the Lumina Foundation. Director of the V Foundation. Member of the advisory
| 1 | Mr. Buckley is considered an “interested person,” as defined in the Investment Company Act of 1940, because he is an officer of the Vanguard funds. |
council for the College of Arts and Letters and chair of the advisory board to the Kellogg Institute for International Studies, both at the University of Notre Dame.
Mark Loughridge
Born in 1953. Trustee since March 2012. Principal occupation(s) during the past five years and other experience: senior vice president and chief financial officer (retired 2013) of IBM (information technology services). Fiduciary member of IBM’s Retirement Plan Committee (2004–2013), senior vice president and general manager (2002–2004) of IBM Global Financing, vice president and controller (1998–2002) of IBM, and a variety of other prior management roles at IBM. Member of the Council on Chicago Booth.
Scott C. Malpass
Born in 1962. Trustee since March 2012. Principal occupation(s) during the past five years and other experience: chief investment officer (retired June 2020) and vice president (retired June 2020) of the University of Notre Dame. Assistant professor of finance at the Mendoza College of Business, University of Notre Dame, and member of the Notre Dame 403(b) Investment Committee (retired June 2020). Member of the board of Catholic Investment Services, Inc. (investment advisors) and the board of superintendence of the Institute for the Works of Religion.
Deanna Mulligan
Born in 1963. Trustee since January 2018. Principal occupation(s) during the past five years and other experience: board chair (2020–present), chief executive officer (2011–2020), and president (2010–2019) of The Guardian Life Insurance Company of America. Chief operating officer (2010–2011) and executive vice president (2008–2010) of the individual life and disability division of Guardian Life. Member of the board of the American Council of Life Insurers and the board of the Economic Club of New York. Trustee of the Partnership for New York City (business leadership), Chief Executives for Corporate Purpose, NewYork-Presbyterian Hospital, Catalyst, and the Bruce Museum (arts and science). Member of the Advisory Council for the Stanford Graduate School of Business.
André F. Perold
Born in 1952. Trustee since December 2004. Principal occupation(s) during the past five years and other experience: George Gund Professor of Finance and Banking, Emeritus at the Harvard Business School (retired 2011). Chief investment officer and co-managing partner of HighVista Strategies (private investment firm). Member of the board of advisors and member of the investment committee of the Museum of Fine Arts Boston. Member of the board (2018–present) of RIT Capital Partners (investment firm). Member of the investment committee of Partners Health Care System.
Sarah Bloom Raskin
Born in 1961. Trustee since January 2018. Principal occupation(s) during the past five years and other experience: deputy secretary (2014–2017) of the United States Department of the Treasury. Governor (2010–2014) of the Federal Reserve Board. Commissioner (2007–2010) of financial regulation for the State of Maryland. Member of the board of directors (2012–2014) of Neighborhood Reinvestment Corporation. Director (2017–present) of i(x) Investments, LLC; director (2017–present) of Reserve Trust. Rubenstein Fellow (2017–present) of Duke University; trustee (2017–present) of Amherst College, and trustee (2019–present) of the Folger Shakespeare Library.
Peter F. Volanakis
Born in 1955. Trustee since July 2009. Principal occupation(s) during the past five years and other experience: president and chief operating officer (retired 2010) of Corning Incorporated (communications equipment) and director of Corning Incorporated (2000–2010) and Dow Corning (2001–2010). Director (2012) of SPX Corporation (multi-industry manufacturing). Overseer of the Amos Tuck School of Business Administration, Dartmouth College (2001–2013). Chairman of the board of trustees of Colby-Sawyer College. Member of the board of Hypertherm Inc. (industrial cutting systems, software, and consumables).
Executive Officers
John Bendl
Born in 1970. Principal occupation(s) during the past five years and other experience: principal of Vanguard. Chief financial officer (2019–present) of each of the investment companies served by Vanguard. Chief accounting officer, treasurer, and controller of Vanguard (2017–present). Partner (2003–2016) at KPMG (audit, tax, and advisory services).
Christine M. Buchanan
Born in 1970. Principal occupation(s) during the past five years and other experience: principal of Vanguard. Treasurer (2017–present) of each of the investment companies served by Vanguard. Partner (2005–2017) at KPMG (audit, tax, and advisory services).
David Cermak
Born in 1960. Principal occupation(s) during the past five years and other experience: principal of Vanguard. Finance director (2019–present) of each of the investment companies served by Vanguard. Managing director and head (2017–present) of Vanguard Investments Singapore. Managing director and head (2017–2019) of Vanguard Investments Hong Kong. Representative director and head (2014–2017) of Vanguard Investments Japan.
John Galloway
Born in 1973. Principal occupation(s) during the past five years and other experience: principal of Vanguard. Investment stewardship officer (September 2020–present) of each of the investment companies served by Vanguard. Head of Investor Advocacy (February 2020–present) and head of Marketing Strategy and Planning (2017–2020) at Vanguard. Deputy assistant to the President of the United States (2015).
Thomas J. Higgins
Born in 1957. Principal occupation(s) during the past five years and other experience: principal of Vanguard. Finance director (2019–present), chief financial officer (2008–2019), and treasurer (1998–2008) of each of the investment companies served by Vanguard.
Peter Mahoney
Born in 1974. Principal occupation(s) during the past five years and other experience: principal of Vanguard. Controller (2015–present) of each of the investment companies served by Vanguard. Head of International Fund Services (2008–2014) at Vanguard.
Anne E. Robinson
Born in 1970. Principal occupation(s) during the past five years and other experience: general counsel (2016–present) of Vanguard. Secretary (2016–present) of Vanguard and of each of the investment companies served by Vanguard. Managing director (2016–present) of Vanguard. Managing director and general counsel of Global Cards and Consumer Services (2014–2016) at Citigroup. Counsel (2003–2014) at American Express.
Michael Rollings
Born in 1963. Principal occupation(s) during the past five years and other experience: finance director (2017–present) and treasurer (2017) of each of the investment companies served by Vanguard. Managing director (2016–present) of Vanguard. Chief financial officer (2016–present) of Vanguard. Director (2016–present) of Vanguard Marketing Corporation. Executive vice president and chief financial officer (2006–2016) of MassMutual Financial Group.
John E. Schadl
Born in 1972. Principal occupation(s) during the past five years and other experience: principal of Vanguard. Chief compliance officer (2019–present) of Vanguard and of each of the investment companies served by Vanguard. Assistant vice president (2019–present) of Vanguard Marketing Corporation.
Vanguard Senior Management Team
| Joseph Brennan | James M. Norris |
| Mortimer J. Buckley | Thomas M. Rampulla |
| Gregory Davis | Karin A. Risi |
| John James | Anne E. Robinson |
| John T. Marcante | Michael Rollings |
| Chris D. McIsaac | Lauren Valente |

Connect with Vanguard® > vanguard.com
Fund Information > 800-662-7447
Direct Investor Account Services > 800-662-2739
Institutional Investor Services > 800-523-1036
Text Telephone for People
Who Are Deaf or Hard of Hearing > 800-749-7273
This material may be used in conjunction with the offering of shares of any Vanguard fund only if preceded or accompanied by the fund’s current prospectus.
All comparative mutual fund data are from Morningstar, Inc., unless otherwise noted.
You can obtain a free copy of Vanguard’s proxy voting guidelines by visiting vanguard.com/proxyreporting or by calling Vanguard at 800-662-2739. The guidelines are also available from the SEC’s website, www.sec.gov. In addition, you may obtain a free report on how your fund voted the proxies for securities it owned during the 12 months ended June 30. To get the report, visit either vanguard.com/proxyreporting or www.sec.gov.
You can review information about your fund on the SEC’s website, and you can receive copies of this information, for a fee, by sending a request via email addressed to publicinfo@sec.gov.
Source for Bloomberg Barclays indexes: Bloomberg Index Services Limited. Copyright 2020, Bloomberg. All rights reserved.
| © 2020 The Vanguard Group, Inc. | |
| All rights reserved. | |
| Vanguard Marketing Corporation, Distributor. | |
| Q590 112020 |

| Annual Report | September 30, 2020 |
| Vanguard Target Retirement Funds |
| Vanguard Target Retirement Income Fund |
| Vanguard Target Retirement 2015 Fund |
| Vanguard Target Retirement 2020 Fund |
| Vanguard Target Retirement 2025 Fund |
| Vanguard Target Retirement 2030 Fund |
Vanguard Target Retirement 2035 Fund
|
| See the inside front cover for important information about access to your fund’s annual and semiannual shareholder reports. |
Important information about access to shareholder reports
Beginning on January 1, 2021, as permitted by regulations adopted by the Securities and Exchange Commission, paper copies of your fund’s annual and semiannual shareholder reports will no longer be sent to you by mail, unless you specifically request them. Instead, you will be notified by mail each time a report is posted on the website and will be provided with a link to access the report.
If you have already elected to receive shareholder reports electronically, you will not be affected by this change and do not need to take any action. You may elect to receive shareholder reports and other communications from the fund electronically by contacting your financial intermediary (such as a broker-dealer or bank) or, if you invest directly with the fund, by calling Vanguard at one of the phone numbers on the back cover of this report or by logging on to vanguard.com.
You may elect to receive paper copies of all future shareholder reports free of charge. If you invest through a financial intermediary, you can contact the intermediary to request that you continue to receive paper copies. If you invest directly with the fund, you can call Vanguard at one of the phone numbers on the back cover of this report or log on to vanguard.com. Your election to receive paper copies will apply to all the funds you hold through an intermediary or directly with Vanguard.
| Contents | ||
| Your Fund’s Performance at a Glance | 1 | |
| About Your Fund’s Expenses | 2 | |
| Target Retirement Income Fund | 4 | |
| Target Retirement 2015 Fund | 17 | |
| Target Retirement 2020 Fund | 30 | |
| Target Retirement 2025 Fund | 43 | |
| Target Retirement 2030 Fund | 56 | |
| Target Retirement 2035 Fund | 69 |
Please note: The opinions expressed in this report are just that—informed opinions. They should not be considered promises or advice. Also, please keep in mind that the information and opinions cover the period through the date on the front of this report. Of course, the risks of investing in your fund are spelled out in the prospectus.
Your Fund’s Performance at a Glance
· For the 12 months ended September 30, 2020, returns for the six Vanguard Target Retirement Funds covered in this report ranged from 7.35% for the Target Retirement Income Fund to 9.71% for the Target Retirement 2035 Fund. (The funds with target dates of 2040 through 2065 are covered in a separate report.) The funds with a higher allocation to stocks did best. Each fund performed in line with its composite benchmark after expenses.
· The rebound in global stocks that began in March continued in the third quarter. Massive fiscal and monetary support from governments and central banks, signs of economic healing, and reported progress toward a COVID-19 vaccine all buoyed the markets until September, when investor sentiment soured a little.
· In the global bond market, the pandemic led to a wave of issuance, which drove up supply, but demand held up fairly well. U.S. Treasury yields ended the quarter little changed.
· Vanguard Target Retirement Funds are designed to reach an allocation of 70% bonds and 30% stocks within seven years after their target dates. The funds invest all of their assets in Vanguard index funds that seek to match the performance of broad stock and bond market indexes.
· For the 10 years ended September 30, the funds’ average annual returns ranged from 5.60% for the Target Retirement Income Fund to 9.29% for the Target Retirement 2035 Fund.
| Market Barometer | |||
| Average Annual Total Returns | |||
| Periods Ended September 30, 2020 | |||
| One Year | Three Years | Five Years | |
| Stocks | |||
| Russell 1000 Index (Large-caps) | 16.01% | 12.38% | 14.09% |
| Russell 2000 Index (Small-caps) | 0.39 | 1.77 | 8.00 |
| Russell 3000 Index (Broad U.S. market) | 15.00 | 11.65 | 13.69 |
| FTSE All-World ex US Index (International) | 3.55 | 1.50 | 6.49 |
| Bonds | |||
| Bloomberg Barclays U.S. Aggregate Bond Index (Broad taxable market) | 6.98% | 5.24% | 4.18% |
| Bloomberg Barclays Municipal Bond Index (Broad tax-exempt market) | 4.09 | 4.28 | 3.84 |
| FTSE Three-Month U.S. Treasury Bill Index | 1.02 | 1.65 | 1.15 |
| CPI | |||
| Consumer Price Index | 1.37% | 1.79% | 1.81% |
1
About Your Fund’s Expenses
As a shareholder of the fund, you incur ongoing costs, which include costs for portfolio management, administrative services, and shareholder reports (like this one), among others. Operating expenses, which are deducted from a fund’s gross income, directly reduce the investment return of the fund.
A typical fund’s expenses are expressed as a percentage of its average net assets. The Target Retirement Funds have no direct expenses, but each fund bears its proportionate share of the costs for the underlying funds in which it invests. These indirect expenses make up the acquired fund fees and expenses, also expressed as a percentage of average net assets.
The following examples are intended to help you understand the ongoing cost (in dollars) of investing in your fund and to compare these costs with those of other mutual funds. The examples are based on an investment of $1,000 made at the beginning of the period shown and held for the entire period. The costs were calculated using the acquired fund fees and expenses for each Target Retirement Fund.
The accompanying table illustrates your fund’s costs in two ways:
· Based on actual fund return. This section helps you to estimate the actual expenses that you paid over the period. The “Ending Account Value” shown is derived from the fund’s actual return, and the third column shows the dollar amount that would have been paid by an investor who started with $1,000 in the fund. You may use the information here, together with the amount you invested, to estimate the expenses that you paid over the period.
To do so, simply divide your account value by $1,000 (for example, an $8,600 account value divided by $1,000 = 8.6), then multiply the result by the number given for your fund under the heading “Expenses Paid During Period.”
· Based on hypothetical 5% yearly return. This section is intended to help you compare your fund’s costs with those of other mutual funds. It assumes that the fund had a yearly return of 5% before expenses, but that the expense ratio is unchanged. In this case—because the return used is not the fund’s actual return—the results do not apply to your investment. The example is useful in making comparisons because the Securities and Exchange Commission requires all mutual funds to calculate expenses based on a 5% return. You can assess your fund’s costs by comparing this hypothetical example with the hypothetical examples that appear in shareholder reports of other funds.
Note that the expenses shown in the table are meant to highlight and help you compare ongoing costs only and do not reflect transaction costs incurred by the fund for buying and selling securities. Further, the expenses do not include any purchase, redemption, or account service fees described in the fund prospectus. If such fees were applied to your account, your costs would be higher. Your fund does not carry a “sales load.”
The calculations assume no shares were bought or sold during the period. Your actual costs may have been higher or lower, depending on the amount of your investment and the timing of any purchases or redemptions.
You can find more information about the fund’s expenses, including annual expense ratios, in the Financial Statements section of this report. For additional information on operating expenses and other shareholder costs, please refer to your fund’s current prospectus.
2
| Six Months Ended September 30, 2020 | |||
| Beginning | Ending | Expenses | |
| Account Value | Account Value | Paid During | |
| 3/31/2020 | 9/30/2020 | Period | |
| Based on Actual Fund Return | |||
| Target Retirement Income Fund | $1,000.00 | $1,112.06 | $0.63 |
| Target Retirement 2015 Fund | $1,000.00 | $1,127.40 | $0.64 |
| Target Retirement 2020 Fund | $1,000.00 | $1,163.97 | $0.70 |
| Target Retirement 2025 Fund | $1,000.00 | $1,190.50 | $0.71 |
| Target Retirement 2030 Fund | $1,000.00 | $1,211.14 | $0.72 |
| Target Retirement 2035 Fund | $1,000.00 | $1,231.91 | $0.78 |
| Based on Hypothetical 5% Yearly Return | |||
| Target Retirement Income Fund | $1,000.00 | $1,024.40 | $0.61 |
| Target Retirement 2015 Fund | $1,000.00 | $1,024.40 | $0.61 |
| Target Retirement 2020 Fund | $1,000.00 | $1,024.35 | $0.66 |
| Target Retirement 2025 Fund | $1,000.00 | $1,024.35 | $0.66 |
| Target Retirement 2030 Fund | $1,000.00 | $1,024.35 | $0.66 |
| Target Retirement 2035 Fund | $1,000.00 | $1,024.30 | $0.71 |
The calculations are based on the acquired fund fees and expenses for the most recent six-month period. The funds’ annualized expense figures for that period are (in order as listed from top to bottom above) 0.12%, 0.12%, 0.13%, 0.13%, 0.13%, and 0.14%. The dollar amounts shown as “Expenses Paid” are equal to the annualized expense figures for the underlying funds multiplied by the average account value over the period, multiplied by the number of days in the most recent six-month period, then divided by the number of days in the most recent 12-month period (183/366).
3
Target Retirement Income Fund
Performance Summary
All of the returns in this report represent past performance, which is not a guarantee of future results that may be achieved by the fund. (Current performance may be lower or higher than the performance data cited. For performance data current to the most recent month-end, visit our website at vanguard.com/performance.) Note, too, that both investment returns and principal value can fluctuate widely, so an investor’s shares, when sold, could be worth more or less than their original cost. The returns shown do not reflect taxes that a shareholder would pay on fund distributions or on the sale of fund shares.
Cumulative Performance: September 30, 2010, Through September 30, 2020
Initial Investment of $10,000

| Average Annual Total Returns | |||||
| Periods Ended September 30, 2020 | |||||
| Final Value | |||||
| One | Five | Ten | of a $10,000 | ||
| Year | Years | Years | Investment | ||
 | Target Retirement Income Fund | 7.35% | 6.03% | 5.60% | $17,248 |
 | Target Income Composite Index | 8.07 | 6.31 | 5.80 | 17,578 |
 | Bloomberg Barclays U.S. Aggregate Bond Index | 6.98 | 4.18 | 3.64 | 14,291 |
Target Income Composite Index: Derived by applying the fund’s target asset allocation to the results of the following benchmarks: for international stocks of developed markets, the MSCI EAFE Index through December 15, 2010, the MSCI ACWI ex USA IMI Index through June 2, 2013, and the FTSE Global All Cap ex US Index thereafter; for emerging-market stocks, the Select Emerging Markets Index through August 23, 2006, the MSCI Emerging Markets Index through December 15, 2010, the MSCI ACWI ex USA IMI Index through June 2, 2013, and the FTSE Global All Cap ex US Index thereafter; for U.S. bonds, the Bloomberg Barclays U.S. Aggregate Bond Index through December 31, 2009, and the Bloomberg Barclays U.S. Aggregate Float Adjusted Index thereafter, as well as the Bloomberg Barclays U.S. Treasury Inflation-Protected Securities Index through June 2, 2013, and the Bloomberg Barclays U.S. Treasury Inflation-Protected Securities (TIPS) 0–5 Year Index thereafter; for short-term reserves, the Citigroup Three-Month Treasury Bill Index through June 2, 2013; for international bonds, the Bloomberg Barclays Global Aggregate ex-USD Float Adjusted RIC Capped Index Hedged beginning June 3, 2013; and for U.S. stocks, the Dow Jones U.S. Total Stock Market Index (formerly known as the Dow Jones Wilshire 5000 Index) through April 22, 2005, the MSCI US Broad Market Index through June 2, 2013, and the CRSP US Total Market Index thereafter. International stock benchmark returns are adjusted for withholding taxes.
See Financial Highlights for dividend and capital gains information.
4
Target Retirement Income Fund
Underlying Vanguard Funds
As of September 30, 2020
| Vanguard Total Bond Market II Index Fund Investor Shares | 37.4% |
| Vanguard Total Stock Market Index Fund Investor Shares | 17.6 |
| Vanguard Short-Term Inflation-Protected Securities Index Fund Investor Shares | 17.0 |
| Vanguard Total International Bond Index Fund Investor Shares | 15.8 |
| Vanguard Total International Stock Index Fund Investor Shares | 12.2 |
The table reflects the fund’s investments, except for short-term investments and derivatives.
5
Target Retirement Income Fund
Financial Statements
Schedule of Investments
As of September 30, 2020
The fund files its complete schedule of portfolio holdings with the Securities and Exchange Commission (SEC) for the first and third quarters of each fiscal year as an exhibit to its reports on Form N-PORT. The fund’s Form N-PORT reports are available on the SEC’s website at www.sec.gov.
| Market | ||||
| Value• | ||||
| Shares | ($000) | |||
| Investment Companies (98.6%) | ||||
| U.S. Stock Fund (17.4%) | ||||
| Vanguard Total Stock Market Index Fund Investor Shares | 36,827,105 | 3,053,704 | ||
| International Stock Fund (12.0%) | ||||
| Vanguard Total International Stock Index Fund Investor Shares | 125,719,671 | 2,107,062 | ||
| U.S. Bond Funds (53.7%) | ||||
| 1 | Vanguard Total Bond Market II Index Fund Investor Shares | 562,125,490 | 6,486,928 | |
| Vanguard Short-Term Inflation-Protected Securities Index Fund Investor Shares | 116,242,704 | 2,953,727 | ||
| 9,440,655 | ||||
| International Bond Fund (15.5%) | ||||
| Vanguard Total International Bond Index Fund Investor Shares | 235,274,074 | 2,736,237 | ||
| Total Investment Companies (Cost $13,759,575) | 17,337,658 | |||
| Temporary Cash Investment (1.3%) | ||||
| Money Market Fund (1.3%) | ||||
| 1 | Vanguard Market Liquidity Fund, 0.117% (Cost $224,498) | 2,245,079 | 224,508 | |
| Total Investments (99.9%) (Cost $13,984,073) | 17,562,166 | |||
| Other Assets and Liabilities—Net (0.1%) | 13,654 | |||
| Net Assets (100%) | 17,575,820 | |||
Cost is in $000.
| · | See Note A in Notes to Financial Statements. |
| 1 | Affiliated fund available only to Vanguard funds and certain trusts and accounts managed by Vanguard. Rate shown for Vanguard Market Liquidity Fund is the 7-day yield. |
6
Target Retirement Income Fund
| Derivative Financial Instruments Outstanding as of Period End | |||||
| Futures Contracts | |||||
| ($000) | |||||
| Value and | |||||
| Number of | Unrealized | ||||
| Long (Short) | Notional | Appreciation | |||
| Expiration | Contracts | Amount | (Depreciation) | ||
| Long Futures Contracts | |||||
| E-mini S&P 500 Index | December 2020 | 744 | 124,694 | 2,321 | |
| 10-Year U.S. Treasury Note | December 2020 | 744 | 103,811 | 89 | |
| 2,410 | |||||
See accompanying Notes, which are an integral part of the Financial Statements.
7
Target Retirement Income Fund
Statement of Assets and Liabilities
As of September 30, 2020
| ($000s, except shares and per-share amounts) | Amount |
| Assets | |
| Investments in Securities, at Value—Affiliated Funds (Cost $13,984,073) | 17,562,166 |
| Cash Collateral Pledged—Futures Contracts | 8,768 |
| Receivables for Investment Securities Sold | 2,923 |
| Receivables for Accrued Income | 26,979 |
| Receivables for Capital Shares Issued | 16,623 |
| Variation Margin Receivable—Futures Contracts | 681 |
| Total Assets | 17,618,140 |
| Liabilities | |
| Payables for Investment Securities Purchased | 26,980 |
| Payables for Capital Shares Redeemed | 15,154 |
| Variation Margin Payable—Futures Contracts | 186 |
| Total Liabilities | 42,320 |
| Net Assets | 17,575,820 |
| At September 30, 2020, net assets consisted of: | |
| Paid-in Capital | 13,710,954 |
| Total Distributable Earnings (Loss) | 3,864,866 |
| Net Assets | 17,575,820 |
| Net Assets | |
| Applicable to 1,208,772,631 outstanding $.001 par value shares of beneficial interest (unlimited authorization) | 17,575,820 |
| Net Asset Value Per Share | $14.54 |
See accompanying Notes, which are an integral part of the Financial Statements.
8
Target Retirement Income Fund
Statement of Operations
| Year Ended | |
| September 30, 2020 | |
| ($000) | |
| Investment Income | |
| Income | |
| Income Distributions Received from Affiliated Funds | 371,688 |
| Other Income | 12 |
| Net Investment Income—Note B | 371,700 |
| Realized Net Gain (Loss) | |
| Capital Gain Distributions Received from Affiliated Funds | — |
| Affiliated Funds Sold | 281,006 |
| Futures Contracts | 16,534 |
| Realized Net Gain (Loss) | 297,540 |
| Change in Unrealized Appreciation (Depreciation) | |
| Affiliated Funds | 504,374 |
| Futures Contracts | 2,410 |
| Change in Unrealized Appreciation (Depreciation) | 506,784 |
| Net Increase (Decrease) in Net Assets Resulting from Operations | 1,176,024 |
��
See accompanying Notes, which are an integral part of the Financial Statements.
9
Target Retirement Income Fund
Statement of Changes in Net Assets
| Year Ended September 30, | ||
| 2020 | 2019 | |
| ($000) | ($000) | |
| Increase (Decrease) in Net Assets | ||
| Operations | ||
| Net Investment Income | 371,700 | 415,089 |
| Realized Net Gain (Loss) | 297,540 | 22,491 |
| Change in Unrealized Appreciation (Depreciation) | 506,784 | 626,217 |
| Net Increase (Decrease) in Net Assets Resulting from Operations | 1,176,024 | 1,063,797 |
| Distributions1 | ||
| Total Distributions | (378,668) | (656,163) |
| Capital Share Transactions | ||
| Issued | 3,038,878 | 2,449,733 |
| Issued in Lieu of Cash Distributions | 359,137 | 627,398 |
| Redeemed | (3,603,059) | (3,114,349) |
| Net Increase (Decrease) from Capital Share Transactions | (205,044) | (37,218) |
| Total Increase (Decrease) | 592,312 | 370,416 |
| Net Assets | ||
| Beginning of Period | 16,983,508 | 16,613,092 |
| End of Period | 17,575,820 | 16,983,508 |
| 1 | Certain prior-period numbers have been reclassified to conform with the current-period presentation. |
See accompanying Notes, which are an integral part of the Financial Statements.
10
Target Retirement Income Fund
Financial Highlights
| For a Share Outstanding | Year Ended September 30, | ||||
| Throughout Each Period | 2020 | 2019 | 2018 | 2017 | 2016 |
| Net Asset Value, Beginning of Period | $13.85 | $13.52 | $13.46 | $13.08 | $12.59 |
| Investment Operations | |||||
| Net Investment Income | 0.3081 | .3411 | .3341 | .2501 | .229 |
| Capital Gain Distributions Received | — | — | .0011 | .0041 | .007 |
| Net Realized and Unrealized Gain (Loss) on Investments | 0.696 | .533 | .107 | .422 | .692 |
| Total from Investment Operations | 1.004 | .874 | .442 | .676 | .928 |
| Distributions | |||||
| Dividends from Net Investment Income | (.297) | (.352) | (.327) | (.254) | (.227) |
| Distributions from Realized Capital Gains | (.017) | (.192) | (.055) | (.042) | (.211) |
| Total Distributions | (.314) | (.544) | (.382) | (.296) | (.438) |
| Net Asset Value, End of Period | $14.54 | $13.85 | $13.52 | $13.46 | $13.08 |
| Total Return2 | 7.35% | 6.75% | 3.31% | 5.26% | 7.54% |
| Ratios/Supplemental Data | |||||
| Net Assets, End of Period (Millions) | $17,576 | $16,984 | $16,613 | $16,645 | $10,790 |
| Ratio of Total Expenses to Average Net Assets | — | — | — | — | — |
| Acquired Fund Fees and Expenses | 0.12% | 0.12% | 0.12% | 0.13% | 0.13% |
| Ratio of Net Investment Income to Average Net Assets | 2.19% | 2.54% | 2.47% | 1.90% | 1.78% |
| Portfolio Turnover Rate | 17% | 10% | 6% | 8% | 11% |
| 1 | Calculated based on average shares outstanding. |
| 2 | Total returns do not include account service fees that may have applied in the periods shown. Fund prospectuses provide information about any applicable account service fees. |
See accompanying Notes, which are an integral part of the Financial Statements.
11
Target Retirement Income Fund
Notes to Financial Statements
Vanguard Target Retirement Income Fund is registered under the Investment Company Act of 1940 as an open-end investment company, or mutual fund. The fund follows a balanced investment strategy by investing in selected Vanguard funds to achieve its targeted allocation of assets to U.S. and international stocks, and U.S. and international bonds. Financial statements and other information about each underlying fund are available at www.vanguard.com.
Market disruptions associated with the COVID-19 pandemic have had a global impact, and uncertainty exists as to the long-term implications. Such disruptions can adversely affect assets of the fund and thus fund performance.
A. The following significant accounting policies conform to generally accepted accounting principles for U.S. investment companies. The fund consistently follows such policies in preparing its financial statements.
1. Security Valuation: Investments are valued at the net asset value of each underlying Vanguard fund determined as of the close of the New York Stock Exchange (generally 4 p.m., Eastern time) on the valuation date.
2. Futures Contracts: The fund uses stock and bond futures contracts to a limited extent, with the objectives of maintaining full exposure to the market and maintaining its target asset allocation. The primary risks associated with the use of futures contracts are imperfect correlation between changes in market values of investments held by the fund and the prices of futures contracts, and the possibility of an illiquid market. Counterparty risk involving futures is mitigated because a regulated clearinghouse is the counterparty instead of the clearing broker. To further mitigate counterparty risk, the fund trades futures contracts on an exchange, monitors the financial strength of its clearing brokers and clearinghouse, and has entered into clearing agreements with its clearing brokers. The clearinghouse imposes initial margin requirements to secure the fund’s performance and requires daily settlement of variation margin representing changes in the market value of each contract. Any securities pledged as initial margin for open contracts are noted in the Schedule of Investments.
Futures contracts are valued at their quoted daily settlement prices. The notional amounts of the contracts are not recorded in the Statement of Assets and Liabilities. Fluctuations in the value of the contracts are recorded in the Statement of Assets and Liabilities as an asset (liability) and in the Statement of Operations as unrealized appreciation (depreciation) until the contracts are closed, when they are recorded as realized gains (losses) on futures contracts.
During the year ended September 30, 2020, the fund’s average investments in long and short futures contracts represented less than 1% and 0% of net assets, respectively, based on the average of the notional amounts at each quarter-end during the period.
3. Federal Income Taxes: The fund intends to continue to qualify as a regulated investment company and distribute all of its taxable income. The fund’s tax returns are open to examination by the relevant tax authorities until expiration of the applicable statute of limitations, which is generally three years after the filing of the tax return. Management has analyzed the fund’s tax positions taken for all open federal and state income tax years, and has concluded that no provision for income tax is required in the fund’s financial statements.
12
Target Retirement Income Fund
4. Distributions: Distributions to shareholders are recorded on the ex-dividend date. Distributions are determined on a tax basis at the fiscal year-end and may differ from net investment income and realized capital gains for financial reporting purposes.
5. Credit Facilities and Interfund Lending Program: The fund and certain other funds managed by The Vanguard Group (“Vanguard”) participate in a $4.3 billion committed credit facility provided by a syndicate of lenders pursuant to a credit agreement and an uncommitted credit facility provided by Vanguard. Both facilities may be renewed annually. Each fund is individually liable for its borrowings, if any, under the credit facilities. Borrowings may be utilized for temporary or emergency purposes, subject to the fund’s regulatory and contractual borrowing restrictions. With respect to the committed credit facility, the participating funds are charged administrative fees and an annual commitment fee of 0.10% of the undrawn committed amount of the facility; these fees are allocated to the funds based on a method approved by the fund’s board of trustees and borne by the funds in which the fund invests (see Note B). Any borrowings under either facility bear interest at a rate based upon the higher of the one-month London Interbank Offered Rate (or an acceptable alternate rate, if necessary), federal funds effective rate, or overnight bank funding rate plus an agreed-upon spread, except that borrowings under the uncommitted credit facility may bear interest based upon an alternative rate agreed to by the fund and Vanguard.
In accordance with an exemptive order (the “Order”) from the SEC, the fund may participate in a joint lending and borrowing program that allows registered open-end Vanguard funds to borrow money from and lend money to each other for temporary or emergency purposes (the “Interfund Lending Program”), subject to compliance with the terms and conditions of the Order, and to the extent permitted by the fund’s investment objective and investment policies. Interfund loans and borrowings normally extend overnight, but can have a maximum duration of seven days. Loans may be called on one business day’s notice. The interest rate to be charged is governed by the conditions of the Order and internal procedures adopted by the board of trustees. The board of trustees is responsible for overseeing the Interfund Lending Program.
For the year ended September 30, 2020, the fund did not utilize the credit facilities or the Interfund Lending Program.
6. Other: Income and capital gain distributions received are recorded on the ex-dividend date. Security transactions are accounted for on the date securities are bought or sold. Costs used to determine realized gains (losses) on the sale of investment securities are those of the specific securities sold.
B. In accordance with the terms of a Funds’ Service Agreement (the “FSA”) between Vanguard and the fund, Vanguard furnishes to the fund investment advisory, corporate management, administrative, marketing, and distribution services at Vanguard’s cost of operations (as defined by the FSA). These costs of operations are allocated to the fund based on methods and guidelines approved by the board of trustees. The FSA provides that expenses otherwise allocable to Vanguard funds-of-funds may be reduced or eliminated to the extent of savings realized by the underlying Vanguard funds by virtue of being part of a fund-of-funds. Accordingly, all expenses for services provided by Vanguard to the fund and all other expenses incurred by the fund during the period ended September 30, 2020, were borne by the underlying Vanguard funds in which the fund invests. The fund’s trustees and officers are also trustees and officers, respectively, of the underlying Vanguard funds, as well as directors and employees, respectively, of Vanguard.
13
Target Retirement Income Fund
C. Various inputs may be used to determine the value of the fund’s investments and derivatives. These inputs are summarized in three broad levels for financial statement purposes. The inputs or methodologies used to value securities are not necessarily an indication of the risk associated with investing in those securities.
Level 1—Quoted prices in active markets for identical securities.
Level 2—Other significant observable inputs (including quoted prices for similar securities, interest rates, prepayment speeds, credit risk, etc.).
Level 3—Significant unobservable inputs (including the fund’s own assumptions used to determine the fair value of investments). Any investments and derivatives valued with significant unobservable inputs are noted on the Schedule of Investments.
At September 30, 2020, 100% of the market value of the fund’s investments and derivatives was determined based on Level 1 inputs.
D. Permanent differences between book-basis and tax-basis components of net assets are reclassified among capital accounts in the financial statements to reflect their tax character. These reclassifications have no effect on net assets or net asset value per share. As of period end, permanent differences primarily attributable to the accounting for distributions in connection with fund share redemptions were reclassified between the following accounts:
| Amount | |
| ($000) | |
| Paid-in Capital | 29,715 |
| Total Distributable Earnings (Loss) | (29,715) |
Temporary differences between book-basis and tax-basis components of total distributable earnings (loss) arise when certain items of income, gain, or loss are recognized in different periods for financial statement and tax purposes; these differences will reverse at some time in the future. The differences are primarily related to the deferral of losses from wash sales and the recognition of unrealized gains or losses from certain derivative contracts. As of period end, the tax-basis components of total distributable earnings (loss) are detailed in the table as follows:
| Amount | |
| ($000) | |
| Undistributed Ordinary Income | 41,507 |
| Undistributed Long-Term Gains | 245,266 |
| Capital Loss Carryforwards | — |
| Qualified Late-Year Losses | — |
| Net Unrealized Gains (Losses) | 3,578,093 |
14
Target Retirement Income Fund
The tax character of distributions paid was as follows:
| Year Ended September 30, | ||
| 2020 | 2019 | |
| Amount | Amount | |
| ($000) | ($000) | |
| Ordinary Income* | 378,668 | 431,251 |
| Long-Term Capital Gains | — | 224,912 |
| Total | 378,668 | 656,163 |
* Includes short-term capital gains, if any.
As of September 30, 2020, gross unrealized appreciation and depreciation for investments and derivatives based on cost for U.S. federal income tax purposes were as follows:
| Amount | |
| ($000) | |
| Tax Cost | 13,984,073 |
| Gross Unrealized Appreciation | 3,579,817 |
| Gross Unrealized Depreciation | (1,724) |
| Net Unrealized Appreciation (Depreciation) | 3,578,093 |
E. Capital shares issued and redeemed were:
| Year Ended September 30, | ||
| 2020 | 2019 | |
| Shares | Shares | |
| (000) | (000) | |
| Issued | 216,355 | 182,664 |
| Issued in Lieu of Cash Distributions | 25,681 | 48,017 |
| Redeemed | (259,849) | (233,197) |
| Net Increase (Decrease) in Shares Outstanding | (17,813) | (2,516) |
15
Target Retirement Income Fund
F. Transactions during the period in affiliated underlying Vanguard funds were as follows:
| Current Period Transactions | ||||||||
| Sept. 30, | Proceeds | Realized | Sept. 30, | |||||
| 2019 | from | Net | Change in | Capital Gain | 2020 | |||
| Market | Purchases | Securities | Gain | Unrealized | Distributions | Market | ||
| Value | at Cost | Sold | (Loss) | App. (Dep.) | Income | Received | Value | |
| ($000) | ($000) | ($000) | ($000) | ($000) | ($000) | ($000) | ($000) | |
| Vanguard Market Liquidity Fund | 4,215 | NA1 | NA1 | (47) | 10 | 254 | — | 224,508 |
| Vanguard Short-Term Inflation-Protected Securities Index Fund | 2,821,896 | 359,315 | 317,169 | (5,875) | 95,560 | 34,043 | — | 2,953,727 |
| Vanguard Total Bond Market II Index Fund | 6,303,317 | 966,054 | 1,041,076 | 36,033 | 222,600 | 148,039 | — | 6,486,928 |
| Vanguard Total Bond Market ETF2 | — | 18,653 | 18,673 | 20 | — | — | — | — |
| Vanguard Total International Bond Index Fund | 2,738,130 | 315,054 | 287,664 | 12,828 | (42,111) | 85,697 | — | 2,736,237 |
| Vanguard Total International Stock Index Fund | 2,012,186 | 511,607 | 489,938 | (8,427) | 81,634 | 50,729 | — | 2,107,062 |
| Vanguard Total Stock Market Index Fund | 3,104,490 | 726,787 | 1,170,728 | 246,474 | 146,681 | 52,926 | — | 3,053,704 |
| Total | 16,984,234 | 2,897,470 | 3,325,248 | 281,006 | 504,374 | 371,688 | — | 17,562,166 |
1 Not applicable—purchases and sales are for temporary cash investment purposes.
2 The fund invested in ETF Shares during the period, but sold the positions before period end.
G. Management has determined that no events or transactions occurred subsequent to September 30, 2020, that would require recognition or disclosure in these financial statements.
16
Target Retirement 2015 Fund
Performance Summary
All of the returns in this report represent past performance, which is not a guarantee of future results that may be achieved by the fund. (Current performance may be lower or higher than the performance data cited. For performance data current to the most recent month-end, visit our website at vanguard.com/performance.) Note, too, that both investment returns and principal value can fluctuate widely, so an investor’s shares, when sold, could be worth more or less than their original cost. The returns shown do not reflect taxes that a shareholder would pay on fund distributions or on the sale of fund shares.
Cumulative Performance: September 30, 2010, Through September 30, 2020
Initial Investment of $10,000

| Average Annual Total Returns | |||||
| Periods Ended September 30, 2020 | |||||
| Final Value | |||||
| One | Five | Ten | of a $10,000 | ||
| Year | Years | Years | Investment | ||
 | Target Retirement 2015 Fund | 7.68% | 7.04% | 7.04% | $19,753 |
 | Target 2015 Composite Index | 8.37 | 7.35 | 7.23 | 20,099 |
 | MSCI US Broad Market Index | 14.99 | 13.70 | 13.53 | 35,575 |
Target 2015 Composite Index: Derived by applying the fund’s target asset allocation to the results of the following benchmarks: for international stocks of developed markets, the MSCI EAFE Index through December 15, 2010, the MSCI ACWI ex USA IMI Index through June 2, 2013, and the FTSE Global All Cap ex US Index thereafter; for emerging-market stocks, the Select Emerging Markets Index through August 23, 2006, the MSCI Emerging Markets Index through December 15, 2010, the MSCI ACWI ex USA IMI Index through June 2, 2013, and the FTSE Global All Cap ex US Index thereafter; for U.S. bonds, the Bloomberg Barclays U.S. Aggregate Bond Index through December 31, 2009, and the Bloomberg Barclays U.S. Aggregate Float Adjusted Index thereafter, as well as the Bloomberg Barclays U.S. Treasury Inflation-Protected Securities Index through June 2, 2013, and the Bloomberg Barclays U.S. Treasury Inflation-Protected Securities (TIPS) 0–5 Year Index thereafter; for international bonds, the Bloomberg Barclays Global Aggregate ex-USD Float Adjusted RIC Capped Index Hedged beginning June 3, 2013; and for U.S. stocks, the Dow Jones U.S. Total Stock Market Index (formerly known as the Dow Jones Wilshire 5000 Index) through April 22, 2005, the MSCI US Broad Market Index through June 2, 2013, and the CRSP US Total Market Index thereafter. International stock benchmark returns are adjusted for withholding taxes.
See Financial Highlights for dividend and capital gains information.
17
Target Retirement 2015 Fund
Underlying Vanguard Funds
As of September 30, 2020
| Vanguard Total Bond Market II Index Fund Investor Shares | 35.6% |
| Vanguard Total Stock Market Index Fund Investor Shares | 20.0 |
| Vanguard Total International Bond Index Fund Investor Shares | 15.3 |
| Vanguard Short-Term Inflation-Protected Securities Index Fund Investor Shares | 14.9 |
| Vanguard Total International Stock Index Fund Investor Shares | 14.2 |
The table reflects the fund’s investments, except for short-term investments and derivatives.
18
Target Retirement 2015 Fund
Financial Statements
Schedule of Investments
As of September 30, 2020
The fund files its complete schedule of portfolio holdings with the Securities and Exchange Commission (SEC) for the first and third quarters of each fiscal year as an exhibit to its reports on Form N-PORT. The fund’s Form N-PORT reports are available on the SEC’s website at www.sec.gov.
| Market | ||
| Value• | ||
| Shares | ($000) | |
| Investment Companies (98.2%) | ||
| U.S. Stock Fund (19.6%) | ||
| Vanguard Total Stock Market Index Fund Investor Shares | 36,030,179 | 2,987,622 |
| International Stock Fund (13.9%) | ||
| Vanguard Total International Stock Index Fund Investor Shares | 126,361,545 | 2,117,820 |
| U.S. Bond Funds (49.7%) | ||
| 1 Vanguard Total Bond Market II Index Fund Investor Shares | 462,666,454 | 5,339,171 |
| Vanguard Short-Term Inflation-Protected Securities Index Fund Investor Shares | 87,571,807 | 2,225,199 |
| 7,564,370 | ||
| International Bond Fund (15.0%) | ||
| Vanguard Total International Bond Index Fund Investor Shares | 196,734,463 | 2,288,022 |
| Total Investment Companies (Cost $11,407,894) | 14,957,834 | |
| Temporary Cash Investment (1.3%) | ||
| Money Market Fund (1.3%) | ||
| 1 Vanguard Market Liquidity Fund, 0.117% (Cost $196,032) | 1,960,377 | 196,038 |
| Total Investments (99.5%) (Cost $11,603,926) | 15,153,872 | |
| Other Assets and Liabilities—Net (0.5%) | 78,750 | |
| Net Assets (100%) | 15,232,622 |
Cost is in $000.
| • | See Note A in Notes to Financial Statements. |
| 1 | Affiliated fund available only to Vanguard funds and certain trusts and accounts managed by Vanguard. Rate shown for Vanguard Market Liquidity Fund is the 7-day yield. |
| 19 |
Target Retirement 2015 Fund
| Derivative Financial Instruments Outstanding as of Period End | |||||
| Futures Contracts | |||||
| ($000) | |||||
| Value and | |||||
| Number of | Unrealized | ||||
| Long (Short) | Notional | Appreciation | |||
| Expiration | Contracts | Amount | (Depreciation) | ||
| Long Futures Contracts | |||||
| E-mini S&P 500 Index | December 2020 | 1,021 | 171,120 | 3,084 | |
| 10-Year U.S. Treasury Note | December 2020 | 733 | 102,276 | 1 | |
| 3,085 | |||||
See accompanying Notes, which are an integral part of the Financial Statements.
| 20 |
Target Retirement 2015 Fund
Statement of Assets and Liabilities
As of September 30, 2020
| ($000s, except shares and per-share amounts) | Amount |
| Assets | |
| Investments in Securities, at Value—Affiliated Funds (Cost $11,603,926) | 15,153,872 |
| Cash Collateral Pledged—Futures Contracts | 12,202 |
| Receivables for Investment Securities Sold | 80,000 |
| Receivables for Accrued Income | 21,226 |
| Receivables for Capital Shares Issued | 11,991 |
| Variation Margin Receivable—Futures Contracts | 934 |
| Total Assets | 15,280,225 |
| Liabilities | |
| Payables for Investment Securities Purchased | 26,226 |
| Payables for Capital Shares Redeemed | 21,328 |
| Variation Margin Payable—Futures Contracts | 49 |
| Total Liabilities | 47,603 |
| Net Assets | 15,232,622 |
| At September 30, 2020, net assets consisted of: | |
| Paid-in Capital | 10,863,902 |
| Total Distributable Earnings (Loss) | 4,368,720 |
| Net Assets | 15,232,622 |
| Net Assets | |
| Applicable to 961,940,581 outstanding $.001 par value shares of beneficial interest (unlimited authorization) | 15,232,622 |
| Net Asset Value Per Share | $15.84 |
See accompanying Notes, which are an integral part of the Financial Statements.
| 21 |
Target Retirement 2015 Fund
Statement of Operations
| Year Ended | |
| September 30, 2020 | |
| ($000) | |
| Investment Income | |
| Income | |
| Income Distributions Received from Affiliated Funds | 334,593 |
| Other Income | 10 |
| Net Investment Income—Note B | 334,603 |
| Realized Net Gain (Loss) | |
| Capital Gain Distributions Received from Affiliated Funds | — |
| Affiliated Funds Sold | 749,171 |
| Futures Contracts | 15,743 |
| Realized Net Gain (Loss) | 764,914 |
| Change in Unrealized Appreciation (Depreciation) | |
| Affiliated Funds | (10,711) |
| Futures Contracts | 3,085 |
| Change in Unrealized Appreciation (Depreciation) | (7,626) |
| Net Increase (Decrease) in Net Assets Resulting from Operations | 1,091,891 |
See accompanying Notes, which are an integral part of the Financial Statements.
| 22 |
Target Retirement 2015 Fund
Statement of Changes in Net Assets
| Year Ended September 30, | ||
| 2020 | 2019 | |
| ($000) | ($000) | |
| Increase (Decrease) in Net Assets | ||
| Operations | ||
| Net Investment Income | 334,603 | 393,784 |
| Realized Net Gain (Loss) | 764,914 | 354,227 |
| Change in Unrealized Appreciation (Depreciation) | (7,626) | 144,719 |
| Net Increase (Decrease) in Net Assets Resulting from Operations | 1,091,891 | 892,730 |
| Distributions1 | ||
| Total Distributions | (734,000) | (1,036,939) |
| Capital Share Transactions | ||
| Issued | 2,038,962 | 1,965,353 |
| Issued in Lieu of Cash Distributions | 713,503 | 1,009,506 |
| Redeemed | (3,525,024) | (3,593,321) |
| Net Increase (Decrease) from Capital Share Transactions | (772,559) | (618,462) |
| Total Increase (Decrease) | (414,668) | (762,671) |
| Net Assets | ||
| Beginning of Period | 15,647,290 | 16,409,961 |
| End of Period | 15,232,622 | 15,647,290 |
1 Certain prior-period numbers have been reclassified to conform with the current-period presentation.
See accompanying Notes, which are an integral part of the Financial Statements.
| 23 |
Target Retirement 2015 Fund
Financial Highlights
| For a Share Outstanding | Year Ended September 30, | ||||
| Throughout Each Period | 2020 | 2019 | 2018 | 2017 | 2016 |
| Net Asset Value, Beginning of Period | $15.42 | $15.60 | $15.75 | $15.19 | $14.90 |
| Investment Operations | |||||
| Net Investment Income | .3361 | .3761 | .3711 | .3051 | .311 |
| Capital Gain Distributions Received | — | — | .0011 | .0051 | .007 |
| Net Realized and Unrealized Gain (Loss) on Investments | .818 | .455 | .328 | .846 | .968 |
| Total from Investment Operations | 1.154 | .831 | .700 | 1.156 | 1.286 |
| Distributions | |||||
| Dividends from Net Investment Income | (.379) | (.372) | (.318) | (.289) | (.299) |
| Distributions from Realized Capital Gains | (.355) | (.639) | (.532) | (.307) | (.697) |
| Total Distributions | (.734) | (1.011) | (.850) | (.596) | (.996) |
| Net Asset Value, End of Period | $15.84 | $15.42 | $15.60 | $15.75 | $15.19 |
| Total Return2 | 7.68% | 6.08% | 4.54% | 7.95% | 9.03% |
| Ratios/Supplemental Data | |||||
| Net Assets, End of Period (Millions) | $15,233 | $15,647 | $16,410 | $17,250 | $17,479 |
| Ratio of Total Expenses to Average Net Assets | — | — | — | — | — |
| Acquired Fund Fees and Expenses | 0.12% | 0.13% | 0.13% | 0.13% | 0.14% |
| Ratio of Net Investment Income to Average Net Assets | 2.20% | 2.52% | 2.39% | 2.02% | 1.96% |
| Portfolio Turnover Rate | 18% | 10% | 7% | 7% | 9% |
| 1 | Calculated based on average shares outstanding. |
| 2 | Total returns do not include account service fees that may have applied in the periods shown. Fund prospectuses provide information about any applicable account service fees. |
See accompanying Notes, which are an integral part of the Financial Statements.
| 24 |
Target Retirement 2015 Fund
Notes to Financial Statements
Vanguard Target Retirement 2015 Fund is registered under the Investment Company Act of 1940 as an open-end investment company, or mutual fund. The fund follows a balanced investment strategy by investing in selected Vanguard funds to achieve its targeted allocation of assets to U.S. and international stocks, and U.S. and international bonds. Financial statements and other information about each underlying fund are available at www.vanguard.com.
Market disruptions associated with the COVID-19 pandemic have had a global impact, and uncertainty exists as to the long-term implications. Such disruptions can adversely affect assets of the fund and thus fund performance.
A. The following significant accounting policies conform to generally accepted accounting principles for U.S. investment companies. The fund consistently follows such policies in preparing its financial statements.
1. Security Valuation: Investments are valued at the net asset value of each underlying Vanguard fund determined as of the close of the New York Stock Exchange (generally 4 p.m., Eastern time) on the valuation date.
2. Futures Contracts: The fund uses stock and bond futures contracts to a limited extent, with the objectives of maintaining full exposure to the market and maintaining its target asset allocation. The primary risks associated with the use of futures contracts are imperfect correlation between changes in market values of investments held by the fund and the prices of futures contracts, and the possibility of an illiquid market. Counterparty risk involving futures is mitigated because a regulated clearinghouse is the counterparty instead of the clearing broker. To further mitigate counterparty risk, the fund trades futures contracts on an exchange, monitors the financial strength of its clearing brokers and clearinghouse, and has entered into clearing agreements with its clearing brokers. The clearinghouse imposes initial margin requirements to secure the fund’s performance and requires daily settlement of variation margin representing changes in the market value of each contract. Any securities pledged as initial margin for open contracts are noted in the Schedule of Investments.
Futures contracts are valued at their quoted daily settlement prices. The notional amounts of the contracts are not recorded in the Statement of Assets and Liabilities. Fluctuations in the value of the contracts are recorded in the Statement of Assets and Liabilities as an asset (liability) and in the Statement of Operations as unrealized appreciation (depreciation) until the contracts are closed, when they are recorded as realized gains (losses) on futures contracts.
During the year ended September 30, 2020, the fund’s average investments in long and short futures contracts represented less than 1% and 0% of net assets, respectively, based on the average of the notional amounts at each quarter-end during the period.
3. Federal Income Taxes: The fund intends to continue to qualify as a regulated investment company and distribute all of its taxable income. The fund’s tax returns are open to examination by the relevant tax authorities until expiration of the applicable statute of limitations, which is generally three years after the filing of the tax return. Management has analyzed the fund’s tax positions taken for all open federal and state income tax years, and has concluded that no provision for income tax is required in the fund’s financial statements.
4. Distributions: Distributions to shareholders are recorded on the ex-dividend date. Distributions are determined on a tax basis at the fiscal year-end and may differ from net investment income and realized capital gains for financial reporting purposes.
| 25 |
Target Retirement 2015 Fund
5. Credit Facilities and Interfund Lending Program: The fund and certain other funds managed by The Vanguard Group (“Vanguard”) participate in a $4.3 billion committed credit facility provided by a syndicate of lenders pursuant to a credit agreement and an uncommitted credit facility provided by Vanguard. Both facilities may be renewed annually. Each fund is individually liable for its borrowings, if any, under the credit facilities. Borrowings may be utilized for temporary or emergency purposes, subject to the fund’s regulatory and contractual borrowing restrictions. With respect to the committed credit facility, the participating funds are charged administrative fees and an annual commitment fee of 0.10% of the undrawn committed amount of the facility; these fees are allocated to the funds based on a method approved by the fund’s board of trustees and borne by the funds in which the fund invests (see Note B). Any borrowings under either facility bear interest at a rate based upon the higher of the one-month London Interbank Offered Rate (or an acceptable alternate rate, if necessary), federal funds effective rate, or overnight bank funding rate plus an agreed-upon spread, except that borrowings under the uncommitted credit facility may bear interest based upon an alternative rate agreed to by the fund and Vanguard.
In accordance with an exemptive order (the “Order”) from the SEC, the fund may participate in a joint lending and borrowing program that allows registered open-end Vanguard funds to borrow money from and lend money to each other for temporary or emergency purposes (the “Interfund Lending Program”), subject to compliance with the terms and conditions of the Order, and to the extent permitted by the fund’s investment objective and investment policies. Interfund loans and borrowings normally extend overnight, but can have a maximum duration of seven days. Loans may be called on one business day’s notice. The interest rate to be charged is governed by the conditions of the Order and internal procedures adopted by the board of trustees. The board of trustees is responsible for overseeing the Interfund Lending Program.
For the year ended September 30, 2020, the fund did not utilize the credit facilities or the Interfund Lending Program.
6. Other: Income and capital gain distributions received are recorded on the ex-dividend date. Security transactions are accounted for on the date securities are bought or sold. Costs used to determine realized gains (losses) on the sale of investment securities are those of the specific securities sold.
B. In accordance with the terms of a Funds’ Service Agreement (the “FSA”) between Vanguard and the fund, Vanguard furnishes to the fund investment advisory, corporate management, administrative, marketing, and distribution services at Vanguard’s cost of operations (as defined by the FSA). These costs of operations are allocated to the fund based on methods and guidelines approved by the board of trustees. The FSA provides that expenses otherwise allocable to Vanguard funds-of-funds may be reduced or eliminated to the extent of savings realized by the underlying Vanguard funds by virtue of being part of a fund-of-funds. Accordingly, all expenses for services provided by Vanguard to the fund and all other expenses incurred by the fund during the period ended September 30, 2020, were borne by the underlying Vanguard funds in which the fund invests. The fund’s trustees and officers are also trustees and officers, respectively, of the underlying Vanguard funds, as well as directors and employees, respectively, of Vanguard.
| 26 |
Target Retirement 2015 Fund
C. Various inputs may be used to determine the value of the fund’s investments and derivatives. These inputs are summarized in three broad levels for financial statement purposes. The inputs or methodologies used to value securities are not necessarily an indication of the risk associated with investing in those securities.
Level 1—Quoted prices in active markets for identical securities.
Level 2—Other significant observable inputs (including quoted prices for similar securities, interest rates, prepayment speeds, credit risk, etc.).
Level 3—Significant unobservable inputs (including the fund’s own assumptions used to determine the fair value of investments). Any investments and derivatives valued with significant unobservable inputs are noted on the Schedule of Investments.
At September 30, 2020, 100% of the market value of the fund’s investments and derivatives was determined based on Level 1 inputs.
D. Permanent differences between book-basis and tax-basis components of net assets are reclassified among capital accounts in the financial statements to reflect their tax character. These reclassifications have no effect on net assets or net asset value per share. As of period end, permanent differences primarily attributable to the accounting for distributions in connection with fund share redemptions were reclassified between the following accounts:
| Amount | |
| ($000) | |
| Paid-in Capital | 75,083 |
| Total Distributable Earnings (Loss) | (75,083) |
Temporary differences between book-basis and tax-basis components of total distributable earnings (loss) arise when certain items of income, gain, or loss are recognized in different periods for financial statement and tax purposes; these differences will reverse at some time in the future. The differences are primarily related to the deferral of losses from wash sales and the recognition of unrealized gains or losses from certain derivative contracts. As of period end, the tax-basis components of total distributable earnings (loss) are detailed in the table as follows:
| Amount | |
| ($000) | |
| Undistributed Ordinary Income | 152,187 |
| Undistributed Long-Term Gains | 666,587 |
| Capital Loss Carryforwards | — |
| Qualified Late-Year Losses | — |
| Net Unrealized Gains (Losses) | 3,549,946 |
| 27 |
Target Retirement 2015 Fund
The tax character of distributions paid was as follows:
| Year Ended September 30, | ||
| 2020 | 2019 | |
| Amount | Amount | |
| ($000) | ($000) | |
| Ordinary Income * | 393,797 | 387,410 |
| Long-Term Capital Gains | 340,203 | 649,528 |
| Total | 734,000 | 1,036,939 |
* Includes short-term capital gains, if any.
As of September 30, 2020, gross unrealized appreciation and depreciation for investments and derivatives based on cost for U.S. federal income tax purposes were as follows:
| Amount | |
| ($000) | |
| Tax Cost | 11,603,926 |
| Gross Unrealized Appreciation | 3,550,813 |
| Gross Unrealized Depreciation | (867) |
| Net Unrealized Appreciation (Depreciation) | 3,549,946 |
E. Capital shares issued and redeemed were:
| Year Ended September 30, | ||
| 2020 | 2019 | |
| Shares | Shares | |
| (000) | (000) | |
| Issued | 134,165 | 132,213 |
| Issued in Lieu of Cash Distributions | 46,910 | 73,100 |
| Redeemed | (233,997) | (242,220) |
| Net Increase (Decrease) in Shares Outstanding | (52,922) | (36,907) |
| 28 |
Target Retirement 2015 Fund
F. Transactions during the period in affiliated underlying Vanguard funds were as follows:
| Current Period Transactions | |||||||||
| Sept. 30, | Proceeds | Realized | Sept. 30, | ||||||
| 2019 | from | Net | Change in | Capital Gain | 2020 | ||||
| Market | Purchases | Securities | Gain | Unrealized | Distributions | Market | |||
| Value | at Cost | Sold | (Loss) | App. (Dep.) | Income | Received | Value | ||
| ($000) | ($000) | ($000) | ($000) | ($000) | ($000) | ($000) | ($000) | ||
| Vanguard Market Liquidity Fund | 10 | NA1 | NA1 | (26) | 5 | 226 | — | 196,038 | |
| Vanguard Short-Term Inflation-Protected Securities Index Fund | 2,041,604 | 392,870 | 276,986 | (4,814) | 72,525 | 25,322 | — | 2,225,199 | |
| Vanguard Total Bond Market II Index Fund | 5,331,310 | 874,160 | 1,084,051 | 56,269 | 161,483 | 123,922 | — | 5,339,171 | |
| Vanguard Total Bond Market ETF2 | — | 6,143 | 6,150 | 7 | — | — | — | — | |
| Vanguard Total International Bond Index Fund | 2,354,655 | 267,028 | 309,087 | 25,733 | (50,307) | 73,575 | — | 2,288,022 | |
| Vanguard Total International Stock Index Fund | 2,372,022 | 482,532 | 802,328 | 23,828 | 41,766 | 54,787 | — | 2,117,820 | |
| Vanguard Total Stock Market Index Fund | 3,546,381 | 764,002 | 1,734,752 | 648,174 | (236,183) | 56,761 | — | 2,987,622 | |
| Total | 15,645,982 | 2,786,735 | 4,213,354 | 749,171 | (10,711) | 334,593 | — | 15,153,872 | |
| 1 | Not applicable—purchases and sales are for temporary cash investment purposes. |
| 2 | The fund invested in ETF Shares during the period, but sold the positions before period end. |
G. Management has determined that no events or transactions occurred subsequent to September 30, 2020, that would require recognition or disclosure in these financial statements.
| 29 |
Target Retirement 2020 Fund
Performance Summary
All of the returns in this report represent past performance, which is not a guarantee of future results that may be achieved by the fund. (Current performance may be lower or higher than the performance data cited. For performance data current to the most recent month-end, visit our website at vanguard.com/performance.) Note, too, that both investment returns and principal value can fluctuate widely, so an investor’s shares, when sold, could be worth more or less than their original cost. The returns shown do not reflect taxes that a shareholder would pay on fund distributions or on the sale of fund shares.
Cumulative Performance: September 30, 2010, Through September 30, 2020
Initial Investment of $10,000

| Average Annual Total Returns | |||||
| Periods Ended September 30, 2020 | |||||
| Final Value | |||||
| One | Five | Ten | of a $10,000 | ||
| Year | Years | Years | Investment | ||
 | Target Retirement 2020 Fund | 8.51% | 7.96% | 7.81% | $21,210 |
 | Target 2020 Composite Index | 9.31 | 8.30 | 8.09 | 21,765 |
 | MSCI US Broad Market Index | 14.99 | 13.70 | 13.53 | 35,575 |
Target 2020 Composite Index: Derived by applying the fund’s target asset allocation to the results of the following benchmarks: for international stocks of developed markets, the MSCI EAFE Index through December 15, 2010, the MSCI ACWI ex USA IMI Index through June 2, 2013, and the FTSE Global All Cap ex US Index thereafter; for emerging-market stocks, the Select Emerging Markets Index through August 23, 2006, the MSCI Emerging Markets Index through December 15, 2010, the MSCI ACWI ex USA IMI Index through June 2, 2013, and the FTSE Global All Cap ex US Index thereafter; for U.S. bonds, the Bloomberg Barclays U.S. Aggregate Bond Index through December 31, 2009, and the Bloomberg Barclays U.S. Aggregate Float Adjusted Index thereafter; for international bonds, the Bloomberg Barclays Global Aggregate ex-USD Float Adjusted RIC Capped Index Hedged beginning June 3, 2013; and for U.S. stocks, the MSCI US Broad Market Index through June 2, 2013, and the CRSP US Total Market Index thereafter. International stock benchmark returns are adjusted for withholding taxes.
See Financial Highlights for dividend and capital gains information.
| 30 |
Target Retirement 2020 Fund
Underlying Vanguard Funds
As of September 30, 2020
| Vanguard Total Bond Market II Index Fund Investor Shares | 29.8% |
| Vanguard Total Stock Market Index Fund Investor Shares | 28.9 |
| Vanguard Total International Stock Index Fund Investor Shares | 19.9 |
| Vanguard Total International Bond Index Fund Investor Shares | 12.9 |
| Vanguard Short-Term Inflation-Protected Securities Index Fund Investor Shares | 8.5 |
The table reflects the fund’s investments, except for short-term investments and derivatives.
| 31 |
Target Retirement 2020 Fund
Financial Statements
Schedule of Investments
As of September 30, 2020
The fund files its complete schedule of portfolio holdings with the Securities and Exchange Commission (SEC) for the first and third quarters of each fiscal year as an exhibit to its reports on Form N-PORT. The fund’s Form N-PORT reports are available on the SEC’s website at www.sec.gov.
| Market | ||||
| Value• | ||||
| Shares | ($000) | |||
| Investment Companies (98.4%) | ||||
| U.S. Stock Fund (28.5%) | ||||
| Vanguard Total Stock Market Index Fund Investor Shares | 109,464,928 | 9,076,832 | ||
| International Stock Fund (19.6%) | ||||
| Vanguard Total International Stock Index Fund Investor Shares | 373,068,145 | 6,252,622 | ||
| U.S. Bond Funds (37.6%) | ||||
| 1 | Vanguard Total Bond Market II Index Fund Investor Shares | 810,085,592 | 9,348,388 | |
| Vanguard Short-Term Inflation-Protected Securities Index Fund Investor Shares | 104,420,556 | 2,653,326 | ||
| 12,001,714 | ||||
| International Bond Fund (12.7%) | ||||
| Vanguard Total International Bond Index Fund Investor Shares | 347,277,919 | 4,038,842 | ||
| Total Investment Companies (Cost $22,989,580) | 31,370,010 | |||
| Temporary Cash Investment (1.0%) | ||||
| Money Market Fund (1.0%) | ||||
| 1 | Vanguard Market Liquidity Fund, 0.117% (Cost $324,623) | 3,246,364 | 324,637 | |
| Total Investments (99.4%) (Cost $23,314,203) | 31,694,647 | |||
| Other Assets and Liabilities—Net (0.6%) | 192,632 | |||
| Net Assets (100%) | 31,887,279 | |||
Cost is in $000.
| · | See Note A in Notes to Financial Statements. |
| 1 | Affiliated fund available only to Vanguard funds and certain trusts and accounts managed by Vanguard. Rate shown for Vanguard Market Liquidity Fund is the 7-day yield. |
| 32 |
Target Retirement 2020 Fund
| Derivative Financial Instruments Outstanding as of Period End | |||||
| Futures Contracts | |||||
| ($000) | |||||
| Value and | |||||
| Number of | Unrealized | ||||
| Long (Short) | Notional | Appreciation | |||
| Expiration | Contracts | Amount | (Depreciation) | ||
| Long Futures Contracts | |||||
| E-mini S&P 500 Index | December 2020 | 1,612 | 270,171 | 5,872 | |
| 10-Year U.S. Treasury Note | December 2020 | 1,837 | 256,319 | 1 | |
| 5,873 | |||||
See accompanying Notes, which are an integral part of the Financial Statements.
| 33 |
Target Retirement 2020 Fund
Statement of Assets and Liabilities
As of September 30, 2020
| ($000s, except shares and per-share amounts) | Amount |
| Assets | |
| Investments in Securities, at Value—Affiliated Funds (Cost $23,314,203) | 31,694,647 |
| Cash Collateral Pledged—Futures Contracts | 19,230 |
| Receivables for Investment Securities Sold | 210,000 |
| Receivables for Accrued Income | 31,192 |
| Receivables for Capital Shares Issued | 40,429 |
| Variation Margin Receivable—Futures Contracts | 1,475 |
| Total Assets | 31,996,973 |
| Liabilities | |
| Payables for Investment Securities Purchased | 50,192 |
| Payables for Capital Shares Redeemed | 59,391 |
| Variation Margin Payable—Futures Contracts | 111 |
| Total Liabilities | 109,694 |
| Net Assets | 31,887,279 |
| At September 30, 2020, net assets consisted of: | |
| Paid-in Capital | 21,897,614 |
| Total Distributable Earnings (Loss) | 9,989,665 |
| Net Assets | 31,887,279 |
| Net Assets | |
| Applicable to 943,637,747 outstanding $.001 par value shares of beneficial interest (unlimited authorization) | 31,887,279 |
| Net Asset Value Per Share | $33.79 |
See accompanying Notes, which are an integral part of the Financial Statements.
| 34 |
Target Retirement 2020 Fund
Statement of Operations
| Year Ended | |
| September 30, 2020 | |
| ($000) | |
| Investment Income | |
| Income | |
| Income Distributions Received from Affiliated Funds | 705,829 |
| Other Income | 32 |
| Net Investment Income—Note B | 705,861 |
| Realized Net Gain (Loss) | |
| Capital Gain Distributions Received from Affiliated Funds | — |
| Affiliated Funds Sold | 1,421,109 |
| Futures Contracts | 31,677 |
| Realized Net Gain (Loss) | 1,452,786 |
| Change in Unrealized Appreciation (Depreciation) | |
| Affiliated Funds | 320,623 |
| Futures Contracts | 5,873 |
| Change in Unrealized Appreciation (Depreciation) | 326,496 |
| Net Increase (Decrease) in Net Assets Resulting from Operations | 2,485,143 |
See accompanying Notes, which are an integral part of the Financial Statements.
| 35 |
Target Retirement 2020 Fund
Statement of Changes in Net Assets
| Year Ended September 30, | ||
| 2020 | 2019 | |
| ($000) | ($000) | |
| Increase (Decrease) in Net Assets | ||
| Operations | ||
| Net Investment Income | 705,861 | 802,773 |
| Realized Net Gain (Loss) | 1,452,786 | 344,679 |
| Change in Unrealized Appreciation (Depreciation) | 326,496 | 476,788 |
| Net Increase (Decrease) in Net Assets Resulting from Operations | 2,485,143 | 1,624,240 |
| Distributions1 | ||
| Total Distributions | (1,159,070) | (1,431,551) |
| Capital Share Transactions | ||
| Issued | 5,243,714 | 5,598,664 |
| Issued in Lieu of Cash Distributions | 1,131,242 | 1,402,515 |
| Redeemed | (8,603,355) | (7,517,881) |
| Net Increase (Decrease) from Capital Share Transactions | (2,228,399) | (516,702) |
| Total Increase (Decrease) | (902,326) | (324,013) |
| Net Assets | ||
| Beginning of Period | 32,789,605 | 33,113,618 |
| End of Period | 31,887,279 | 32,789,605 |
1 Certain prior-period numbers have been reclassified to conform with the current-period presentation.
See accompanying Notes, which are an integral part of the Financial Statements.
| 36 |
Target Retirement 2020 Fund
Financial Highlights
| For a Share Outstanding | Year Ended September 30, | ||||
| Throughout Each Period | 2020 | 2019 | 2018 | 2017 | 2016 |
| Net Asset Value, Beginning of Period | $32.24 | $32.14 | $31.19 | $29.09 | $27.52 |
| Investment Operations | |||||
| Net Investment Income | .7131 | .7781 | .7291 | .6361 | .619 |
| Capital Gain Distributions Received | — | — | .0021 | .0081 | .012 |
| Net Realized and Unrealized Gain (Loss) on Investments | 1.987 | .736 | 1.079 | 2.231 | 2.065 |
| Total from Investment Operations | 2.700 | 1.514 | 1.810 | 2.875 | 2.696 |
| Distributions | |||||
| Dividends from Net Investment Income | (.789) | (.745) | (.631) | (.562) | (.591) |
| Distributions from Realized Capital Gains | (.361) | (.669) | (.229) | (.213) | (.535) |
| Total Distributions | (1.150) | (1.414) | (.860) | (.775) | (1.126) |
| Net Asset Value, End of Period | $33.79 | $32.24 | $32.14 | $31.19 | $29.09 |
| Total Return2 | 8.51% | 5.29% | 5.87% | 10.17% | 10.05% |
| Ratios/Supplemental Data | |||||
| Net Assets, End of Period (Millions) | $31,887 | $32,790 | $33,114 | $31,263 | $27,542 |
| Ratio of Total Expenses to Average Net Assets | — | — | — | — | — |
| Acquired Fund Fees and Expenses | 0.13% | 0.13% | 0.13% | 0.13% | 0.14% |
| Ratio of Net Investment Income to Average Net Assets | 2.21% | 2.51% | 2.30% | 2.15% | 2.14% |
| Portfolio Turnover Rate | 19% | 13% | 10% | 9% | 15% |
| 1 | Calculated based on average shares outstanding. |
| 2 | Total returns do not include account service fees that may have applied in the periods shown. Fund prospectuses provide information about any applicable account service fees. |
See accompanying Notes, which are an integral part of the Financial Statements.
| 37 |
Target Retirement 2020 Fund
Notes to Financial Statements
Vanguard Target Retirement 2020 Fund is registered under the Investment Company Act of 1940 as an open-end investment company, or mutual fund. The fund follows a balanced investment strategy by investing in selected Vanguard funds to achieve its targeted allocation of assets to U.S. and international stocks, and U.S. and international bonds. Financial statements and other information about each underlying fund are available at www.vanguard.com.
Market disruptions associated with the COVID-19 pandemic have had a global impact, and uncertainty exists as to the long-term implications. Such disruptions can adversely affect assets of the fund and thus fund performance.
A. The following significant accounting policies conform to generally accepted accounting principles for U.S. investment companies. The fund consistently follows such policies in preparing its financial statements.
1. Security Valuation: Investments are valued at the net asset value of each underlying Vanguard fund determined as of the close of the New York Stock Exchange (generally 4 p.m., Eastern time) on the valuation date.
2. Futures Contracts: The fund uses stock and bond futures contracts to a limited extent, with the objectives of maintaining full exposure to the market and maintaining its target asset allocation. The primary risks associated with the use of futures contracts are imperfect correlation between changes in market values of investments held by the fund and the prices of futures contracts, and the possibility of an illiquid market. Counterparty risk involving futures is mitigated because a regulated clearinghouse is the counterparty instead of the clearing broker. To further mitigate counterparty risk, the fund trades futures contracts on an exchange, monitors the financial strength of its clearing brokers and clearinghouse, and has entered into clearing agreements with its clearing brokers. The clearinghouse imposes initial margin requirements to secure the fund’s performance and requires daily settlement of variation margin representing changes in the market value of each contract. Any securities pledged as initial margin for open contracts are noted in the Schedule of Investments.
Futures contracts are valued at their quoted daily settlement prices. The notional amounts of the contracts are not recorded in the Statement of Assets and Liabilities. Fluctuations in the value of the contracts are recorded in the Statement of Assets and Liabilities as an asset (liability) and in the Statement of Operations as unrealized appreciation (depreciation) until the contracts are closed, when they are recorded as realized gains (losses) on futures contracts.
During the year ended September 30, 2020, the fund’s average investments in long and short futures contracts represented less than 1% and 0% of net assets, respectively, based on the average of the notional amounts at each quarter-end during the period.
3. Federal Income Taxes: The fund intends to continue to qualify as a regulated investment company and distribute all of its taxable income. The fund’s tax returns are open to examination by the relevant tax authorities until expiration of the applicable statute of limitations, which is generally three years after the filing of the tax return. Management has analyzed the fund’s tax positions taken for all open federal and state income tax years, and has concluded that no provision for income tax is required in the fund’s financial statements.
4. Distributions: Distributions to shareholders are recorded on the ex-dividend date. Distributions are determined on a tax basis at the fiscal year-end and may differ from net investment income and realized capital gains for financial reporting purposes.
38
Target Retirement 2020 Fund
5. Credit Facilities and Interfund Lending Program: The fund and certain other funds managed by The Vanguard Group (“Vanguard”) participate in a $4.3 billion committed credit facility provided by a syndicate of lenders pursuant to a credit agreement and an uncommitted credit facility provided by Vanguard. Both facilities may be renewed annually. Each fund is individually liable for its borrowings, if any, under the credit facilities. Borrowings may be utilized for temporary or emergency purposes, subject to the fund’s regulatory and contractual borrowing restrictions. With respect to the committed credit facility, the participating funds are charged administrative fees and an annual commitment fee of 0.10% of the undrawn committed amount of the facility; these fees are allocated to the funds based on a method approved by the fund’s board of trustees and borne by the funds in which the fund invests (see Note B). Any borrowings under either facility bear interest at a rate based upon the higher of the one-month London Interbank Offered Rate (or an acceptable alternate rate, if necessary), federal funds effective rate, or overnight bank funding rate plus an agreed-upon spread, except that borrowings under the uncommitted credit facility may bear interest based upon an alternative rate agreed to by the fund and Vanguard.
In accordance with an exemptive order (the “Order”) from the SEC, the fund may participate in a joint lending and borrowing program that allows registered open-end Vanguard funds to borrow money from and lend money to each other for temporary or emergency purposes (the “Interfund Lending Program”), subject to compliance with the terms and conditions of the Order, and to the extent permitted by the fund’s investment objective and investment policies. Interfund loans and borrowings normally extend overnight, but can have a maximum duration of seven days. Loans may be called on one business day’s notice. The interest rate to be charged is governed by the conditions of the Order and internal procedures adopted by the board of trustees. The board of trustees is responsible for overseeing the Interfund Lending Program.
For the year ended September 30, 2020, the fund did not utilize the credit facilities or the Interfund Lending Program.
6. Other: Income and capital gain distributions received are recorded on the ex-dividend date. Security transactions are accounted for on the date securities are bought or sold. Costs used to determine realized gains (losses) on the sale of investment securities are those of the specific securities sold.
B. In accordance with the terms of a Funds’ Service Agreement (the “FSA”) between Vanguard and the fund, Vanguard furnishes to the fund investment advisory, corporate management, administrative, marketing, and distribution services at Vanguard’s cost of operations (as defined by the FSA). These costs of operations are allocated to the fund based on methods and guidelines approved by the board of trustees. The FSA provides that expenses otherwise allocable to Vanguard funds-of-funds may be reduced or eliminated to the extent of savings realized by the underlying Vanguard funds by virtue of being part of a fund-of-funds. Accordingly, all expenses for services provided by Vanguard to the fund and all other expenses incurred by the fund during the period ended September 30, 2020, were borne by the underlying Vanguard funds in which the fund invests. The fund’s trustees and officers are also trustees and officers, respectively, of the underlying Vanguard funds, as well as directors and employees, respectively, of Vanguard.
39
Target Retirement 2020 Fund
C. Various inputs may be used to determine the value of the fund’s investments and derivatives. These inputs are summarized in three broad levels for financial statement purposes. The inputs or methodologies used to value securities are not necessarily an indication of the risk associated with investing in those securities.
Level 1—Quoted prices in active markets for identical securities.
Level 2—Other significant observable inputs (including quoted prices for similar securities, interest rates, prepayment speeds, credit risk, etc.).
Level 3—Significant unobservable inputs (including the fund’s own assumptions used to determine the fair value of investments). Any investments and derivatives valued with significant unobservable inputs are noted on the Schedule of Investments.
At September 30, 2020, 100% of the market value of the fund’s investments and derivatives was determined based on Level 1 inputs.
D. Permanent differences between book-basis and tax-basis components of net assets are reclassified among capital accounts in the financial statements to reflect their tax character. These reclassifications have no effect on net assets or net asset value per share. As of period end, permanent differences primarily attributable to the accounting for distributions in connection with fund share redemptions were reclassified between the following accounts:
| Amount | |
| ($000) | |
| Paid-in Capital | 165,106 |
| Total Distributable Earnings (Loss) | (165,106) |
Temporary differences between book-basis and tax-basis components of total distributable earnings (loss) arise when certain items of income, gain, or loss are recognized in different periods for financial statement and tax purposes; these differences will reverse at some time in the future. The differences are primarily related to the deferral of losses from wash sales and the recognition of unrealized gains or losses from certain derivative contracts. As of period end, the tax-basis components of total distributable earnings (loss) are detailed in the table as follows:
| Amount | |
| ($000) | |
| Undistributed Ordinary Income | 326,171 |
| Undistributed Long-Term Gains | 1,283,050 |
| Capital Loss Carryforwards | — |
| Qualified Late-Year Losses | — |
| Net Unrealized Gains (Losses) | 8,380,444 |
40
Target Retirement 2020 Fund
The tax character of distributions paid was as follows:
| Year Ended September 30, | ||
| 2020 | 2019 | |
| Amount | Amount | |
| ($000) | ($000) | |
| Ordinary Income * | 817,503 | 769,247 |
| Long-Term Capital Gains | 341,567 | 662,304 |
| Total | 1,159,070 | 1,431,551 |
* Includes short-term capital gains, if any.
As of September 30, 2020, gross unrealized appreciation and depreciation for investments and derivatives based on cost for U.S. federal income tax purposes were as follows:
| Amount | |
| ($000) | |
| Tax Cost | 23,314,203 |
| Gross Unrealized Appreciation | 8,381,750 |
| Gross Unrealized Depreciation | (1,306) |
| Net Unrealized Appreciation (Depreciation) | 8,380,444 |
E. Capital shares issued and redeemed were:
| Year Ended September 30, | ||
| 2020 | 2019 | |
| Shares | Shares | |
| (000) | (000) | |
| Issued | 162,609 | 181,093 |
| Issued in Lieu of Cash Distributions | 34,711 | 49,211 |
| Redeemed | (270,581) | (243,796) |
| Net Increase (Decrease) in Shares Outstanding | (73,261) | (13,492) |
41
Target Retirement 2020 Fund
F. Transactions during the period in affiliated underlying Vanguard funds were as follows:
| Current Period Transactions | ||||||||
| Sept. 30, | Proceeds | Realized | Sept. 30, | |||||
| 2019 | from | Net | Change in | Capital Gain | 2020 | |||
| Market | Purchases | Securities | Gain | Unrealized | Distributions | Market | ||
| Value | at Cost | Sold | (Loss) | App. (Dep.) | Income | Received | Value | |
| ($000) | ($000) | ($000) | ($000) | ($000) | ($000) | ($000) | ($000) | |
| Vanguard Market Liquidity Fund | 7,708 | NA1 | NA1 | (31) | 13 | 431 | — | 324,637 |
| Vanguard Short-Term Inflation-Protected Securities Index Fund | 2,145,955 | 848,608 | 417,202 | (3,339) | 79,304 | 29,034 | — | 2,653,326 |
| Vanguard Total Bond Market II Index Fund | 9,579,114 | 1,945,826 | 2,568,438 | 87,968 | 303,918 | 219,489 | — | 9,348,388 |
| Vanguard Total Bond Market ETF2 | — | 5,526 | 5,532 | 6 | — | — | — | — |
| Vanguard Total International Bond Index Fund | 4,211,439 | 570,669 | 697,598 | 28,409 | (74,077) | 131,084 | — | 4,038,842 |
| Vanguard Total International Stock Index Fund | 6,769,805 | 1,072,303 | 1,738,702 | (1,588) | 150,804 | 160,091 | — | 6,252,622 |
| Vanguard Total Stock Market Index Fund | 10,101,340 | 1,639,467 | 3,834,320 | 1,309,684 | (139,339) | 165,700 | — | 9,076,832 |
| Total | 32,815,361 | 6,082,399 | 9,261,792 | 1,421,109 | 320,623 | 705,829 | — | 31,694,647 |
1 Not applicable—purchases and sales are for temporary cash investment purposes.
2 The fund invested in ETF Shares during the period, but sold the positions before period end.
G. Management has determined that no events or transactions occurred subsequent to September 30, 2020, that would require recognition or disclosure in these financial statements.
42
Target Retirement 2025 Fund
Performance Summary
All of the returns in this report represent past performance, which is not a guarantee of future results that may be achieved by the fund. (Current performance may be lower or higher than the performance data cited. For performance data current to the most recent month-end, visit our website at vanguard.com/performance.) Note, too, that both investment returns and principal value can fluctuate widely, so an investor’s shares, when sold, could be worth more or less than their original cost. The returns shown do not reflect taxes that a shareholder would pay on fund distributions or on the sale of fund shares.
Cumulative Performance: September 30, 2010, Through September 30, 2020
Initial Investment of $10,000

| Average Annual Total Returns | |||||
| Periods Ended September 30, 2020 | |||||
| Final Value | |||||
| One | Five | Ten | of a $10,000 | ||
| Year | Years | Years | Investment | ||
 | Target Retirement 2025 Fund | 9.04% | 8.60% | 8.38% | $22,353 |
 | Target 2025 Composite Index | 9.92 | 8.97 | 8.66 | 22,946 |
 | MSCI US Broad Market Index | 14.99 | 13.70 | 13.53 | 35,575 |
Target 2025 Composite Index: Derived by applying the fund’s target asset allocation to the results of the following benchmarks: for international stocks of developed markets, the MSCI EAFE Index through December 15, 2010, the MSCI ACWI ex USA IMI Index through June 2, 2013, and the FTSE Global All Cap ex US Index thereafter; for emerging-market stocks, the Select Emerging Markets Index through August 23, 2006, the MSCI Emerging Markets Index through December 15, 2010, the MSCI ACWI ex USA IMI Index through June 2, 2013, and the FTSE Global All Cap ex US Index thereafter; for U.S. bonds, the Bloomberg Barclays U.S. Aggregate Bond Index through December 31, 2009, and the Bloomberg Barclays U.S. Aggregate Float Adjusted Index thereafter; for international bonds, the Bloomberg Barclays Global Aggregate ex-USD Float Adjusted RIC Capped Index Hedged beginning June 3, 2013; and for U.S. stocks, the Dow Jones U.S. Total Stock Market Index (formerly known as the Dow Jones Wilshire 5000 Index) through April 22, 2005, the MSCI US Broad Market Index through June 2, 2013, and the CRSP US Total Market Index thereafter. International stock benchmark returns are adjusted for withholding taxes.
See Financial Highlights for dividend and capital gains information.
43
Target Retirement 2025 Fund
Underlying Vanguard Funds
As of September 30, 2020
| Vanguard Total Stock Market Index Fund Investor Shares | 35.5% |
| Vanguard Total Bond Market II Index Fund Investor Shares | 28.0 |
| Vanguard Total International Stock Index Fund Investor Shares | 24.0 |
| Vanguard Total International Bond Index Fund Investor Shares | 12.0 |
| Vanguard Short-Term Inflation-Protected Securities Index Fund Investor Shares | 0.5 |
The table reflects the fund’s investments, except for short-term investments and derivatives.
44
Target Retirement 2025 Fund
Financial Statements
Schedule of Investments
As of September 30, 2020
The fund files its complete schedule of portfolio holdings with the Securities and Exchange Commission (SEC) for the first and third quarters of each fiscal year as an exhibit to its reports on Form N-PORT. The fund’s Form N-PORT reports are available on the SEC’s website at www.sec.gov.
| Market | ||||
| Value• | ||||
| Shares | ($000) | |||
| Investment Companies (98.6%) | ||||
| U.S. Stock Fund (35.0%) | ||||
| Vanguard Total Stock Market Index Fund Investor Shares | 196,439,152 | 16,288,734 | ||
| International Stock Fund (23.7%) | ||||
| Vanguard Total International Stock Index Fund Investor Shares | 656,609,998 | 11,004,784 | ||
| U.S. Bond Funds (28.1%) | ||||
| 1 | Vanguard Total Bond Market II Index Fund Investor Shares | 1,113,599,402 | 12,850,937 | |
| Vanguard Short-Term Inflation-Protected Securities Index Fund Investor Shares | 8,893,772 | 225,991 | ||
| 13,076,928 | ||||
| International Bond Fund (11.8%) | ||||
| Vanguard Total International Bond Index Fund Investor Shares | 473,547,094 | 5,507,353 | ||
| Total Investment Companies (Cost $32,087,080) | 45,877,799 | |||
| Temporary Cash Investment (1.0%) | ||||
| Money Market Fund (1.0%) | ||||
| 1 | Vanguard Market Liquidity Fund, 0.117% (Cost $471,221) | 4,712,422 | 471,242 | |
| Total Investments (99.6%) (Cost $32,558,301) | 46,349,041 | |||
| Other Assets and Liabilities—Net (0.4%) | 171,474 | |||
| Net Assets (100%) | 46,520,515 | |||
Cost is in $000.
| · | See Note A in Notes to Financial Statements. |
| 1 | Affiliated fund available only to Vanguard funds and certain trusts and accounts managed by Vanguard. Rate shown for Vanguard Market Liquidity Fund is the 7-day yield. |
| 45 |
Target Retirement 2025 Fund
| Derivative Financial Instruments Outstanding as of Period End |
Futures Contracts
| ($000) | ||||||||
| Value and | ||||||||
| Number of | Unrealized | |||||||
| Long (Short) | Notional | Appreciation | ||||||
| Expiration | Contracts | Amount | (Depreciation) | |||||
| Long Futures Contracts | ||||||||
| E-mini S&P 500 Index | December 2020 | 1,998 | 334,865 | 8,527 | ||||
| 10-Year U.S. Treasury Note | December 2020 | 2,313 | 322,736 | 145 | ||||
| 8,672 |
See accompanying Notes, which are an integral part of the Financial Statements.
| 46 |
Target Retirement 2025 Fund
Statement of Assets and Liabilities
As of September 30, 2020
| ($000s, except shares and per-share amounts) | Amount | |
| Assets | ||
| Investments in Securities, at Value—Affiliated Funds (Cost $32,558,301) | 46,349,041 | |
| Cash Collateral Pledged—Futures Contracts | 23,720 | |
| Receivables for Investment Securities Sold | 196,891 | |
| Receivables for Accrued Income | 26,421 | |
| Receivables for Capital Shares Issued | 50,959 | |
| Variation Margin Receivable—Futures Contracts | 1,828 | |
| Total Assets | 46,648,860 | |
| Liabilities | ||
| Payables for Investment Securities Purchased | 40,421 | |
| Payables for Capital Shares Redeemed | 87,650 | |
| Variation Margin Payable—Futures Contracts | 274 | |
| Total Liabilities | 128,345 | |
| Net Assets | 46,520,515 | |
| At September 30, 2020, net assets consisted of: | ||
| Paid-in Capital | 31,231,898 | |
| Total Distributable Earnings (Loss) | 15,288,617 | |
| Net Assets | 46,520,515 | |
| Net Assets | ||
| Applicable to 2,263,103,001 outstanding $.001 par value shares of beneficial interest (unlimited authorization) | 46,520,515 | |
| Net Asset Value Per Share | $20.56 |
See accompanying Notes, which are an integral part of the Financial Statements.
| 47 |
Target Retirement 2025 Fund
Statement of Operations
| Year Ended | ||
| September 30, 2020 | ||
| ($000) | ||
| Investment Income | ||
| Income | ||
| Income Distributions Received from Affiliated Funds | 1,007,304 | |
| Other Income | 49 | |
| Net Investment Income—Note B | 1,007,353 | |
| Realized Net Gain (Loss) | ||
| Capital Gain Distributions Received from Affiliated Funds | — | |
| Affiliated Funds Sold | 968,113 | |
| Futures Contracts | 47,707 | |
| Realized Net Gain (Loss) | 1,015,820 | |
| Change in Unrealized Appreciation (Depreciation) | ||
| Affiliated Funds | 1,705,863 | |
| Futures Contracts | 8,672 | |
| Change in Unrealized Appreciation (Depreciation) | 1,714,535 | |
| Net Increase (Decrease) in Net Assets Resulting from Operations | 3,737,708 |
See accompanying Notes, which are an integral part of the Financial Statements.
| 48 |
Target Retirement 2025 Fund
Statement of Changes in Net Assets
| Year Ended September 30, | ||||
| 2020 | 2019 | |||
| ($000) | ($000) | |||
| Increase (Decrease) in Net Assets | ||||
| Operations | ||||
| Net Investment Income | 1,007,353 | 1,043,757 | ||
| Realized Net Gain (Loss) | 1,015,820 | 93,771 | ||
| Change in Unrealized Appreciation (Depreciation) | 1,714,535 | 865,279 | ||
| Net Increase (Decrease) in Net Assets Resulting from Operations | 3,737,708 | 2,002,807 | ||
| Distributions1 | ||||
| Total Distributions | (1,174,627) | (1,174,162) | ||
| Capital Share Transactions | ||||
| Issued | 7,933,617 | 7,794,924 | ||
| Issued in Lieu of Cash Distributions | 1,150,386 | 1,152,542 | ||
| Redeemed | (9,272,657) | (7,489,764) | ||
| Net Increase (Decrease) from Capital Share Transactions | (188,654) | 1,457,702 | ||
| Total Increase (Decrease) | 2,374,427 | 2,286,347 | ||
| Net Assets | ||||
| Beginning of Period | 44,146,088 | 41,859,741 | ||
| End of Period | 46,520,515 | 44,146,088 | ||
1 Certain prior-period numbers have been reclassified to conform with the current-period presentation.
See accompanying Notes, which are an integral part of the Financial Statements.
| 49 |
Target Retirement 2025 Fund
Financial Highlights
| For a Share Outstanding | Year Ended September 30, | ||||
| Throughout Each Period | 2020 | 2019 | 2018 | 2017 | 2016 |
| Net Asset Value, Beginning of Period | $19.34 | $19.02 | $18.25 | $16.77 | $15.90 |
| Investment Operations | |||||
| Net Investment Income | .4381 | .4641 | .4191 | .3801 | .362 |
| Capital Gain Distributions Received | — | — | .0011 | .0041 | .006 |
| Net Realized and Unrealized Gain (Loss) on Investments | 1.292 | .390 | .807 | 1.534 | 1.280 |
| Total from Investment Operations | 1.730 | .854 | 1.227 | 1.918 | 1.648 |
| Distributions | |||||
| Dividends from Net Investment Income | (.471) | (.434) | (.369) | (.327) | (.342) |
| Distributions from Realized Capital Gains | (.039) | (.100) | (.088) | (.111) | (.436) |
| Total Distributions | (.510) | (.534) | (.457) | (.438) | (.778) |
| Net Asset Value, End of Period | $20.56 | $19.34 | $19.02 | $18.25 | $16.77 |
| Total Return2 | 9.04% | 4.89% | 6.79% | 11.74% | 10.67% |
| Ratios/Supplemental Data | |||||
| Net Assets, End of Period (Millions) | $46,521 | $44,146 | $41,860 | $37,111 | $31,706 |
| Ratio of Total Expenses to Average Net Assets | — | — | — | — | — |
| Acquired Fund Fees and Expenses | 0.13% | 0.13% | 0.13% | 0.14% | 0.14% |
| Ratio of Net Investment Income to Average Net Assets | 2.25% | 2.51% | 2.24% | 2.21% | 2.18% |
| Portfolio Turnover Rate | 21% | 11% | 8% | 10% | 15% |
| 1 | Calculated based on average shares outstanding. |
| 2 | Total returns do not include account service fees that may have applied in the periods shown. Fund prospectuses provide information about any applicable account service fees. |
See accompanying Notes, which are an integral part of the Financial Statements.
| 50 |
Target Retirement 2025 Fund
Notes to Financial Statements
Vanguard Target Retirement 2025 Fund is registered under the Investment Company Act of 1940 as an open-end investment company, or mutual fund. The fund follows a balanced investment strategy by investing in selected Vanguard funds to achieve its targeted allocation of assets to U.S. and international stocks, and U.S. and international bonds. Financial statements and other information about each underlying fund are available at www.vanguard.com.
Market disruptions associated with the COVID-19 pandemic have had a global impact, and uncertainty exists as to the long-term implications. Such disruptions can adversely affect assets of the fund and thus fund performance.
A. The following significant accounting policies conform to generally accepted accounting principles for U.S. investment companies. The fund consistently follows such policies in preparing its financial statements.
1. Security Valuation: Investments are valued at the net asset value of each underlying Vanguard fund determined as of the close of the New York Stock Exchange (generally 4 p.m., Eastern time) on the valuation date.
2. Futures Contracts: The fund uses stock and bond futures contracts to a limited extent, with the objectives of maintaining full exposure to the market and maintaining its target asset allocation. The primary risks associated with the use of futures contracts are imperfect correlation between changes in market values of investments held by the fund and the prices of futures contracts, and the possibility of an illiquid market. Counterparty risk involving futures is mitigated because a regulated clearinghouse is the counterparty instead of the clearing broker. To further mitigate counterparty risk, the fund trades futures contracts on an exchange, monitors the financial strength of its clearing brokers and clearinghouse, and has entered into clearing agreements with its clearing brokers. The clearinghouse imposes initial margin requirements to secure the fund’s performance and requires daily settlement of variation margin representing changes in the market value of each contract. Any securities pledged as initial margin for open contracts are noted in the Schedule of Investments.
Futures contracts are valued at their quoted daily settlement prices. The notional amounts of the contracts are not recorded in the Statement of Assets and Liabilities. Fluctuations in the value of the contracts are recorded in the Statement of Assets and Liabilities as an asset (liability) and in the Statement of Operations as unrealized appreciation (depreciation) until the contracts are closed, when they are recorded as realized gains (losses) on futures contracts.
During the year ended September 30, 2020, the fund’s average investments in long and short futures contracts represented less than 1% and 0% of net assets, respectively, based on the average of the notional amounts at each quarter-end during the period.
3. Federal Income Taxes: The fund intends to continue to qualify as a regulated investment company and distribute all of its taxable income. The fund’s tax returns are open to examination by the relevant tax authorities until expiration of the applicable statute of limitations, which is generally three years after the filing of the tax return. Management has analyzed the fund’s tax positions taken for all open federal and state income tax years, and has concluded that no provision for income tax is required in the fund’s financial statements.
4. Distributions: Distributions to shareholders are recorded on the ex-dividend date. Distributions are determined on a tax basis at the fiscal year-end and may differ from net investment income and realized capital gains for financial reporting purposes.
| 51 |
Target Retirement 2025 Fund
5. Credit Facilities and Interfund Lending Program: The fund and certain other funds managed by The Vanguard Group (“Vanguard”) participate in a $4.3 billion committed credit facility provided by a syndicate of lenders pursuant to a credit agreement and an uncommitted credit facility provided by Vanguard. Both facilities may be renewed annually. Each fund is individually liable for its borrowings, if any, under the credit facilities. Borrowings may be utilized for temporary or emergency purposes, subject to the fund’s regulatory and contractual borrowing restrictions. With respect to the committed credit facility, the participating funds are charged administrative fees and an annual commitment fee of 0.10% of the undrawn committed amount of the facility; these fees are allocated to the funds based on a method approved by the fund’s board of trustees and borne by the funds in which the fund invests (see Note B). Any borrowings under either facility bear interest at a rate based upon the higher of the one-month London Interbank Offered Rate (or an acceptable alternate rate, if necessary), federal funds effective rate, or overnight bank funding rate plus an agreed-upon spread, except that borrowings under the uncommitted credit facility may bear interest based upon an alternative rate agreed to by the fund and Vanguard.
In accordance with an exemptive order (the “Order”) from the SEC, the fund may participate in a joint lending and borrowing program that allows registered open-end Vanguard funds to borrow money from and lend money to each other for temporary or emergency purposes (the “Interfund Lending Program”), subject to compliance with the terms and conditions of the Order, and to the extent permitted by the fund’s investment objective and investment policies. Interfund loans and borrowings normally extend overnight, but can have a maximum duration of seven days. Loans may be called on one business day’s notice. The interest rate to be charged is governed by the conditions of the Order and internal procedures adopted by the board of trustees. The board of trustees is responsible for overseeing the Interfund Lending Program.
For the year ended September 30, 2020, the fund did not utilize the credit facilities or the Interfund Lending Program.
6. Other: Income and capital gain distributions received are recorded on the ex-dividend date. Security transactions are accounted for on the date securities are bought or sold. Costs used to determine realized gains (losses) on the sale of investment securities are those of the specific securities sold.
B. In accordance with the terms of a Funds’ Service Agreement (the “FSA”) between Vanguard and the fund, Vanguard furnishes to the fund investment advisory, corporate management, administrative, marketing, and distribution services at Vanguard’s cost of operations (as defined by the FSA). These costs of operations are allocated to the fund based on methods and guidelines approved by the board of trustees. The FSA provides that expenses otherwise allocable to Vanguard funds-of-funds may be reduced or eliminated to the extent of savings realized by the underlying Vanguard funds by virtue of being part of a fund-of-funds. Accordingly, all expenses for services provided by Vanguard to the fund and all other expenses incurred by the fund during the period ended September 30, 2020, were borne by the underlying Vanguard funds in which the fund invests. The fund’s trustees and officers are also trustees and officers, respectively, of the underlying Vanguard funds, as well as directors and employees, respectively, of Vanguard.
| 52 |
Target Retirement 2025 Fund
C. Various inputs may be used to determine the value of the fund’s investments and derivatives. These inputs are summarized in three broad levels for financial statement purposes. The inputs or methodologies used to value securities are not necessarily an indication of the risk associated with investing in those securities.
Level 1—Quoted prices in active markets for identical securities.
Level 2—Other significant observable inputs (including quoted prices for similar securities, interest rates, prepayment speeds, credit risk, etc.).
Level 3—Significant unobservable inputs (including the fund’s own assumptions used to determine the fair value of investments). Any investments and derivatives valued with significant unobservable inputs are noted on the Schedule of Investments.
At September 30, 2020, 100% of the market value of the fund’s investments and derivatives was determined based on Level 1 inputs.
D. Permanent differences between book-basis and tax-basis components of net assets are reclassified among capital accounts in the financial statements to reflect their tax character. These reclassifications have no effect on net assets or net asset value per share. As of period end, permanent differences primarily attributable to the accounting for distributions in connection with fund share redemptions were reclassified between the following accounts:
| Amount | ||
| ($000) | ||
| Paid-in Capital | 92,094 | |
| Total Distributable Earnings (Loss) | (92,094) |
Temporary differences between book-basis and tax-basis components of total distributable earnings (loss) arise when certain items of income, gain, or loss are recognized in different periods for financial statement and tax purposes; these differences will reverse at some time in the future. The differences are primarily related to the deferral of losses from wash sales and the recognition of unrealized gains or losses from certain derivative contracts. As of period end, the tax-basis components of total distributable earnings (loss) are detailed in the table as follows:
| Amount | ||
| ($000) | ||
| Undistributed Ordinary Income | 558,359 | |
| Undistributed Long-Term Gains | 939,518 | |
| Capital Loss Carryforwards | — | |
| Qualified Late-Year Losses | — | |
| Net Unrealized Gains (Losses) | 13,790,740 |
| 53 |
Target Retirement 2025 Fund
The tax character of distributions paid was as follows:
| Year Ended September 30, | ||||
| 2020 | 2019 | |||
| Amount | Amount | |||
| ($000) | ($000) | |||
| Ordinary Income * | 1,154,679 | 1,036,454 | ||
| Long-Term Capital Gains | 19,948 | 137,708 | ||
| Total | 1,174,627 | 1,174,162 | ||
* Includes short-term capital gains, if any.
As of September 30, 2020, gross unrealized appreciation and depreciation for investments and derivatives based on cost for U.S. federal income tax purposes were as follows:
| Amount | ||
| ($000) | ||
| Tax Cost | 32,558,301 | |
| Gross Unrealized Appreciation | 13,795,727 | |
| Gross Unrealized Depreciation | (4,987) | |
| Net Unrealized Appreciation (Depreciation) | 13,790,740 |
E. Capital shares issued and redeemed were:
| Year Ended September 30, | ||||
| 2020 | 2019 | |||
| Shares | Shares | |||
| (000) | (000) | |||
| Issued | 405,875 | 422,593 | ||
| Issued in Lieu of Cash Distributions | 57,837 | 68,077 | ||
| Redeemed | (483,645) | (407,912) | ||
| Net Increase (Decrease) in Shares Outstanding | (19,933) | 82,758 | ||
| 54 |
Target Retirement 2025 Fund
F. Transactions during the period in affiliated underlying Vanguard funds were as follows:
| Current Period Transactions | ||||||||||
| Sept. 30, | Proceeds | Realized | Sept. 30, | |||||||
| 2019 | from | Net | Change in | Capital Gain | 2020 | |||||
| Market | Purchases | Securities | Gain | Unrealized | Distributions | Market | ||||
| Value | at Cost | Sold | (Loss) | App. (Dep.) | Income | Received | Value | |||
| ($000) | ($000) | ($000) | ($000) | ($000) | ($000) | ($000) | ($000) | |||
| Vanguard Market Liquidity Fund | 23,149 | NA1 | NA1 | (99) | 21 | 710 | — | 471,242 | ||
| Vanguard Short-Term Inflation-Protected Securities Index Fund | — | 225,625 | — | — | 366 | 1,020 | — | 225,991 | ||
| Vanguard Total Bond Market II Index Fund | 12,038,750 | 4,209,201 | 3,914,751 | 101,441 | 416,296 | 291,362 | — | 12,850,937 | ||
| Vanguard Total Bond Market ETF2 | — | 23,245 | 23,270 | 25 | — | — | — | — | ||
| Vanguard Total International Bond Index Fund | 5,106,622 | 1,313,874 | 861,869 | 8,680 | (59,954) | 165,611 | — | 5,507,353 | ||
| Vanguard Total International Stock Index Fund | 10,791,314 | 1,633,150 | 1,664,367 | (102,091) | 346,778 | 268,913 | — | 11,004,784 | ||
| Vanguard Total Stock Market Index Fund | 16,219,435 | 2,180,827 | 4,074,041 | 960,157 | 1,002,356 | 279,688 | — | 16,288,734 | ||
| Total | 44,179,270 | 9,585,922 | 10,538,298 | 968,113 | 1,705,863 | 1,007,304 | — | 46,349,041 | ||
1 Not applicable—purchases and sales are for temporary cash investment purposes.
2 The fund invested in ETF Shares during the period, but sold the positions before period end.
G. Management has determined that no events or transactions occurred subsequent to September 30, 2020, that would require recognition or disclosure in these financial statements.
| 55 |
Target Retirement 2030 Fund
Performance Summary
All of the returns in this report represent past performance, which is not a guarantee of future results that may be achieved by the fund. (Current performance may be lower or higher than the performance data cited. For performance data current to the most recent month-end, visit our website at vanguard.com/performance.) Note, too, that both investment returns and principal value can fluctuate widely, so an investor’s shares, when sold, could be worth more or less than their original cost. The returns shown do not reflect taxes that a shareholder would pay on fund distributions or on the sale of fund shares.
Cumulative Performance: September 30, 2010, Through September 30, 2020
Initial Investment of $10,000

| Average Annual Total Returns | |||||||||
| Periods Ended September 30, 2020 | |||||||||
| Final Value | |||||||||
| One | Five | Ten | of a $10,000 | ||||||
| Year | Years | Years | Investment | ||||||
 | Target Retirement 2030 Fund | 9.38% | 9.07% | 8.84% | $23,333 | ||||
 | Target 2030 Composite Index | 10.24 | 9.44 | 9.13 | 23,956 | ||||
 | MSCI US Broad Market Index | 14.99 | 13.70 | 13.53 | 35,575 | ||||
Target 2030 Composite Index: Derived by applying the fund’s target asset allocation to the results of the following benchmarks: for international stocks of developed markets, the MSCI EAFE Index through December 15, 2010, the MSCI ACWI ex USA IMI Index through June 2, 2013, and the FTSE Global All Cap ex US Index thereafter; for emerging-market stocks, the Select Emerging Markets Index through August 23, 2006, the MSCI Emerging Markets Index through December 15, 2010, the MSCI ACWI ex USA IMI Index through June 2, 2013, and the FTSE Global All Cap ex US Index thereafter; for U.S. bonds, the Bloomberg Barclays U.S. Aggregate Bond Index through December 31, 2009, and the Bloomberg Barclays U.S. Aggregate Float Adjusted Index thereafter; for international bonds, the Bloomberg Barclays Global Aggregate ex-USD Float Adjusted RIC Capped Index Hedged beginning June 3, 2013; and for U.S. stocks, the MSCI US Broad Market Index through June 2, 2013, and the CRSP US Total Market Index thereafter. International stock benchmark returns are adjusted for withholding taxes.
See Financial Highlights for dividend and capital gains information.
| 56 |
Target Retirement 2030 Fund
Underlying Vanguard Funds
As of September 30, 2020
| Vanguard Total Stock Market Index Fund Investor Shares | 40.4 | % | |
| Vanguard Total International Stock Index Fund Investor Shares | 27.0 | ||
| Vanguard Total Bond Market II Index Fund Investor Shares | 22.7 | ||
| Vanguard Total International Bond Index Fund Investor Shares | 9.9 | ||
| The table reflects the fund’s investments, except for short-term investments and derivatives. | |||
| 57 |
Target Retirement 2030 Fund
Financial Statements
Schedule of Investments
As of September 30, 2020
The fund files its complete schedule of portfolio holdings with the Securities and Exchange Commission (SEC) for the first and third quarters of each fiscal year as an exhibit to its reports on Form N-PORT. The fund’s Form N-PORT reports are available on the SEC’s website at www.sec.gov.
| Market | |||||
| Value• | |||||
| Shares | ($000) | ||||
| Investment Companies (98.6%) | |||||
| U.S. Stock Fund (39.9%) | |||||
| Vanguard Total Stock Market Index Fund Investor Shares | 203,570,853 | 16,880,095 | |||
| International Stock Fund (26.6%) | |||||
| Vanguard Total International Stock Index Fund Investor Shares | 670,748,771 | 11,241,749 | |||
| U.S. Bond Fund (22.4%) | |||||
| 1 | Vanguard Total Bond Market II Index Fund Investor Shares | 819,563,827 | 9,457,767 | ||
| International Bond Fund (9.7%) | |||||
| Vanguard Total International Bond Index Fund Investor Shares | 353,161,429 | 4,107,268 | |||
| Total Investment Companies (Cost $28,909,842) | 41,686,879 | ||||
| Temporary Cash Investment (1.1%) | |||||
| Money Market Fund (1.1%) | |||||
| 1 | Vanguard Market Liquidity Fund, 0.117% (Cost $484,974) | 4,849,891 | 484,989 | ||
| Total Investments (99.7%) (Cost $29,394,816) | 42,171,868 | ||||
| Other Assets and Liabilities—Net (0.3%) | 113,448 | ||||
| Net Assets (100%) | 42,285,316 | ||||
Cost is in $000.
| · | See Note A in Notes to Financial Statements. |
| 1 | Affiliated fund available only to Vanguard funds and certain trusts and accounts managed by Vanguard. Rate shown for Vanguard Market Liquidity Fund is the 7-day yield. |
| 58 |
Target Retirement 2030 Fund
| Derivative Financial Instruments Outstanding as of Period End | ||||
| Futures Contracts | ||||
| ($000) | ||||||||
| Value and | ||||||||
| Number of | Unrealized | |||||||
| Long (Short) | Notional | Appreciation | ||||||
| Expiration | Contracts | Amount | (Depreciation) | |||||
| Long Futures Contracts | ||||||||
| 10-Year U.S. Treasury Note | December 2020 | 2,435 | 339,759 | 248 | ||||
| E-mini S&P 500 Index | December 2020 | 1,477 | 247,545 | 6,557 | ||||
| 6,805 |
See accompanying Notes, which are an integral part of the Financial Statements.
| 59 |
Target Retirement 2030 Fund
Statement of Assets and Liabilities
As of September 30, 2020
| ($000s, except shares and per-share amounts) | Amount | |
| Assets | ||
| Investments in Securities, at Value—Affiliated Funds (Cost $29,394,816) | 42,171,868 | |
| Cash Collateral Pledged—Futures Contracts | 17,310 | |
| Receivables for Investment Securities Sold | 122,001 | |
| Receivables for Accrued Income | 18,706 | |
| Receivables for Capital Shares Issued | 62,357 | |
| Variation Margin Receivable—Futures Contracts | 1,351 | |
| Total Assets | 42,393,593 | |
| Liabilities | ||
| Payables for Investment Securities Purchased | 18,706 | |
| Payables for Capital Shares Redeemed | 89,118 | |
| Variation Margin Payable—Futures Contracts | 453 | |
| Total Liabilities | 108,277 | |
| Net Assets | 42,285,316 | |
| At September 30, 2020, net assets consisted of: | ||
| Paid-in Capital | 28,800,646 | |
| Total Distributable Earnings (Loss) | 13,484,670 | |
| Net Assets | 42,285,316 | |
| Net Assets | ||
| Applicable to 1,123,725,757 outstanding $.001 par value shares of beneficial interest (unlimited authorization) | 42,285,316 | |
| Net Asset Value Per Share | $37.63 |
See accompanying Notes, which are an integral part of the Financial Statements.
| 60 |
Target Retirement 2030 Fund
Statement of Operations
| Year Ended | ||
| September 30, 2020 | ||
| ($000) | ||
| Investment Income | ||
| Income | ||
| Income Distributions Received from Affiliated Funds | 883,865 | |
| Other Income | 44 | |
| Net Investment Income—Note B | 883,909 | |
| Realized Net Gain (Loss) | ||
| Capital Gain Distributions Received from Affiliated Funds | — | |
| Affiliated Funds Sold | 204,792 | |
| Futures Contracts | 31,327 | |
| Realized Net Gain (Loss) | 236,119 | |
| Change in Unrealized Appreciation (Depreciation) | ||
| Affiliated Funds | 2,400,269 | |
| Futures Contracts | 6,805 | |
| Change in Unrealized Appreciation (Depreciation) | 2,407,074 | |
| Net Increase (Decrease) in Net Assets Resulting from Operations | 3,527,102 |
See accompanying Notes, which are an integral part of the Financial Statements.
| 61 |
Target Retirement 2030 Fund
Statement of Changes in Net Assets
| Year Ended September 30, | ||||
| 2020 | 2019 | |||
| ($000) | ($000) | |||
| Increase (Decrease) in Net Assets | ||||
| Operations | ||||
| Net Investment Income | 883,909 | 892,786 | ||
| Realized Net Gain (Loss) | 236,119 | 1 | ||
| Change in Unrealized Appreciation (Depreciation) | 2,407,074 | 649,511 | ||
| Net Increase (Decrease) in Net Assets Resulting from Operations | 3,527,102 | 1,542,298 | ||
| Distributions1 | ||||
| Total Distributions | (970,908) | (869,831) | ||
| Capital Share Transactions | ||||
| Issued | 7,587,027 | 7,520,484 | ||
| Issued in Lieu of Cash Distributions | 954,496 | 856,060 | ||
| Redeemed | (7,926,412) | (5,848,492) | ||
| Net Increase (Decrease) from Capital Share Transactions | 615,111 | 2,528,052 | ||
| Total Increase (Decrease) | 3,171,305 | 3,200,519 | ||
| Net Assets | ||||
| Beginning of Period | 39,114,011 | 35,913,492 | ||
| End of Period | 42,285,316 | 39,114,011 | ||
1 Certain prior-period numbers have been reclassified to conform with the current-period presentation.
See accompanying Notes, which are an integral part of the Financial Statements.
| 62 |
Target Retirement 2030 Fund
Financial Highlights
| For a Share Outstanding | Year Ended September 30, | ||||
| Throughout Each Period | 2020 | 2019 | 2018 | 2017 | 2016 |
| Net Asset Value, Beginning of Period | $35.22 | $34.74 | $32.93 | $29.77 | $27.77 |
| Investment Operations | |||||
| Net Investment Income | .7821 | .8301 | .7541 | .6831 | .634 |
| Capital Gain Distributions Received | — | — | .0011 | .0061 | .008 |
| Net Realized and Unrealized Gain (Loss) on Investments | 2.495 | .486 | 1.744 | 3.167 | 2.390 |
| Total from Investment Operations | 3.277 | 1.316 | 2.499 | 3.856 | 3.032 |
| Distributions | |||||
| Dividends from Net Investment Income | (.867) | (.767) | (.670) | (.576) | (.597) |
| Distributions from Realized Capital Gains | — | (.069) | (.019) | (.120) | (.435) |
| Total Distributions | (.867) | (.836) | (.689) | (.696) | (1.032) |
| Net Asset Value, End of Period | $37.63 | $35.22 | $34.74 | $32.93 | $29.77 |
| Total Return2 | 9.38% | 4.15% | 7.65% | 13.25% | 11.15% |
| Ratios/Supplemental Data | |||||
| Net Assets, End of Period (Millions) | $42,285 | $39,114 | $35,913 | $30,877 | $24,966 |
| Ratio of Total Expenses to Average Net Assets | — | — | — | — | — |
| Acquired Fund Fees and Expenses | 0.14% | 0.14% | 0.14% | 0.14% | 0.15% |
| Ratio of Net Investment Income to Average Net Assets | 2.20% | 2.46% | 2.22% | 2.21% | 2.20% |
| Portfolio Turnover Rate | 21% | 8% | 9% | 9% | 16% |
| 1 | Calculated based on average shares outstanding. |
| 2 | Total returns do not include account service fees that may have applied in the periods shown. Fund prospectuses provide information about any applicable account service fees. |
See accompanying Notes, which are an integral part of the Financial Statements.
| 63 |
Target Retirement 2030 Fund
Notes to Financial Statements
Vanguard Target Retirement 2030 Fund is registered under the Investment Company Act of 1940 as an open-end investment company, or mutual fund. The fund follows a balanced investment strategy by investing in selected Vanguard funds to achieve its targeted allocation of assets to U.S. and international stocks, and U.S. and international bonds. Financial statements and other information about each underlying fund are available at www.vanguard.com.
Market disruptions associated with the COVID-19 pandemic have had a global impact, and uncertainty exists as to the long-term implications. Such disruptions can adversely affect assets of the fund and thus fund performance.
A. The following significant accounting policies conform to generally accepted accounting principles for U.S. investment companies. The fund consistently follows such policies in preparing its financial statements.
1. Security Valuation: Investments are valued at the net asset value of each underlying Vanguard fund determined as of the close of the New York Stock Exchange (generally 4 p.m., Eastern time) on the valuation date.
2. Futures Contracts: The fund uses stock and bond futures contracts to a limited extent, with the objectives of maintaining full exposure to the market and maintaining its target asset allocation. The primary risks associated with the use of futures contracts are imperfect correlation between changes in market values of investments held by the fund and the prices of futures contracts, and the possibility of an illiquid market. Counterparty risk involving futures is mitigated because a regulated clearinghouse is the counterparty instead of the clearing broker. To further mitigate counterparty risk, the fund trades futures contracts on an exchange, monitors the financial strength of its clearing brokers and clearinghouse, and has entered into clearing agreements with its clearing brokers. The clearinghouse imposes initial margin requirements to secure the fund’s performance and requires daily settlement of variation margin representing changes in the market value of each contract. Any securities pledged as initial margin for open contracts are noted in the Schedule of Investments.
Futures contracts are valued at their quoted daily settlement prices. The notional amounts of the contracts are not recorded in the Statement of Assets and Liabilities. Fluctuations in the value of the contracts are recorded in the Statement of Assets and Liabilities as an asset (liability) and in the Statement of Operations as unrealized appreciation (depreciation) until the contracts are closed, when they are recorded as realized gains (losses) on futures contracts.
During the year ended September 30, 2020, the fund’s average investments in long and short futures contracts represented less than 1% and 0% of net assets, respectively, based on the average of the notional amounts at each quarter-end during the period.
3. Federal Income Taxes: The fund intends to continue to qualify as a regulated investment company and distribute all of its taxable income. The fund’s tax returns are open to examination by the relevant tax authorities until expiration of the applicable statute of limitations, which is generally three years after the filing of the tax return. Management has analyzed the fund’s tax positions taken for all open federal and state income tax years, and has concluded that no provision for income tax is required in the fund’s financial statements.
4. Distributions: Distributions to shareholders are recorded on the ex-dividend date. Distributions are determined on a tax basis at the fiscal year-end and may differ from net investment income and realized capital gains for financial reporting purposes.
| 64 |
Target Retirement 2030 Fund
5. Credit Facilities and Interfund Lending Program: The fund and certain other funds managed by The Vanguard Group (“Vanguard”) participate in a $4.3 billion committed credit facility provided by a syndicate of lenders pursuant to a credit agreement and an uncommitted credit facility provided by Vanguard. Both facilities may be renewed annually. Each fund is individually liable for its borrowings, if any, under the credit facilities. Borrowings may be utilized for temporary or emergency purposes, subject to the fund’s regulatory and contractual borrowing restrictions. With respect to the committed credit facility, the participating funds are charged administrative fees and an annual commitment fee of 0.10% of the undrawn committed amount of the facility; these fees are allocated to the funds based on a method approved by the fund’s board of trustees and borne by the funds in which the fund invests (see Note B). Any borrowings under either facility bear interest at a rate based upon the higher of the one-month London Interbank Offered Rate (or an acceptable alternate rate, if necessary), federal funds effective rate, or overnight bank funding rate plus an agreed-upon spread, except that borrowings under the uncommitted credit facility may bear interest based upon an alternative rate agreed to by the fund and Vanguard.
In accordance with an exemptive order (the “Order”) from the SEC, the fund may participate in a joint lending and borrowing program that allows registered open-end Vanguard funds to borrow money from and lend money to each other for temporary or emergency purposes (the “Interfund Lending Program”), subject to compliance with the terms and conditions of the Order, and to the extent permitted by the fund’s investment objective and investment policies. Interfund loans and borrowings normally extend overnight, but can have a maximum duration of seven days. Loans may be called on one business day’s notice. The interest rate to be charged is governed by the conditions of the Order and internal procedures adopted by the board of trustees. The board of trustees is responsible for overseeing the Interfund Lending Program.
For the year ended September 30, 2020, the fund did not utilize the credit facilities or the Interfund Lending Program.
6. Other: Income and capital gain distributions received are recorded on the ex-dividend date. Security transactions are accounted for on the date securities are bought or sold. Costs used to determine realized gains (losses) on the sale of investment securities are those of the specific securities sold.
B. In accordance with the terms of a Funds’ Service Agreement (the “FSA”) between Vanguard and the fund, Vanguard furnishes to the fund investment advisory, corporate management, administrative, marketing, and distribution services at Vanguard’s cost of operations (as defined by the FSA). These costs of operations are allocated to the fund based on methods and guidelines approved by the board of trustees. The FSA provides that expenses otherwise allocable to Vanguard funds-of-funds may be reduced or eliminated to the extent of savings realized by the underlying Vanguard funds by virtue of being part of a fund-of-funds. Accordingly, all expenses for services provided by Vanguard to the fund and all other expenses incurred by the fund during the period ended September 30, 2020, were borne by the underlying Vanguard funds in which the fund invests. The fund’s trustees and officers are also trustees and officers, respectively, of the underlying Vanguard funds, as well as directors and employees, respectively, of Vanguard.
| 65 |
Target Retirement 2030 Fund
C. Various inputs may be used to determine the value of the fund’s investments and derivatives. These inputs are summarized in three broad levels for financial statement purposes. The inputs or methodologies used to value securities are not necessarily an indication of the risk associated with investing in those securities.
Level 1—Quoted prices in active markets for identical securities.
Level 2—Other significant observable inputs (including quoted prices for similar securities, interest rates, prepayment speeds, credit risk, etc.).
Level 3—Significant unobservable inputs (including the fund’s own assumptions used to determine the fair value of investments). Any investments and derivatives valued with significant unobservable inputs are noted on the Schedule of Investments.
At September 30, 2020, 100% of the market value of the fund’s investments and derivatives was determined based on Level 1 inputs.
D. Permanent differences between book-basis and tax-basis components of net assets are reclassified among capital accounts in the financial statements to reflect their tax character. These reclassifications have no effect on net assets or net asset value per share. As of period end, permanent differences primarily attributable to the accounting for distributions in connection with fund share redemptions were reclassified between the following accounts:
| Amount | ||
| ($000) | ||
| Paid-in Capital | 37,524 | |
| Total Distributable Earnings (Loss) | (37,524) |
Temporary differences between book-basis and tax-basis components of total distributable earnings (loss) arise when certain items of income, gain, or loss are recognized in different periods for financial statement and tax purposes; these differences will reverse at some time in the future. The differences are primarily related to the deferral of losses from wash sales and the recognition of unrealized gains or losses from certain derivative contracts. As of period end, the tax-basis components of total distributable earnings (loss) are detailed in the table as follows:
| Amount | ||
| ($000) | ||
| Undistributed Ordinary Income | 521,395 | |
| Undistributed Long-Term Gains | 186,223 | |
| Capital Loss Carryforwards | — | |
| Qualified Late-Year Losses | — | |
| Net Unrealized Gains (Losses) | 12,777,052 |
| 66 |
Target Retirement 2030 Fund
The tax character of distributions paid was as follows:
| Year Ended September 30, | ||||
| 2020 | 2019 | |||
| Amount | Amount | |||
| ($000) | ($000) | |||
| Ordinary Income* | 970,908 | 863,278 | ||
| Long-Term Capital Gains | — | 6,553 | ||
| Total | 970,908 | 869,831 | ||
* Includes short-term capital gains, if any.
As of September 30, 2020, gross unrealized appreciation and depreciation for investments and derivatives based on cost for U.S. federal income tax purposes were as follows:
| Amount | ||
| ($000) | ||
| Tax Cost | 29,394,816 | |
| Gross Unrealized Appreciation | 12,802,421 | |
| Gross Unrealized Depreciation | (25,369) | |
| Net Unrealized Appreciation (Depreciation) | 12,777,052 |
E. Capital shares issued and redeemed were:
| Year Ended September 30, | ||||
| 2020 | 2019 | |||
| Shares | Shares | |||
| (000) | (000) | |||
| Issued | 213,271 | 224,037 | ||
| Issued in Lieu of Cash Distributions | 26,122 | 27,921 | ||
| Redeemed | (226,267) | (175,095) | ||
| Net Increase (Decrease) in Shares Outstanding | 13,126 | 76,863 | ||
| 67 |
Target Retirement 2030 Fund
F. Transactions during the period in affiliated underlying Vanguard funds were as follows:
| Current Period Transactions | |||||||||
| Sept. 30, | Proceeds | Realized | Sept. 30, | ||||||
| 2019 | from | Net | Change in | Capital Gain | 2020 | ||||
| Market | Purchases | Securities | Gain | Unrealized | Distributions | Market | |||
| Value | at Cost | Sold | (Loss) | App. (Dep.) | Income | Received | Value | ||
| ($000) | ($000) | ($000) | ($000) | ($000) | ($000) | ($000) | ($000) | ||
| Vanguard Market Liquidity Fund | 8,567 | NA1 | NA1 | (85) | 15 | 620 | — | 484,989 | |
| Vanguard Total Bond Market II Index Fund | 8,637,980 | 3,556,825 | 3,114,030 | 72,410 | 304,582 | 210,847 | — | 9,457,767 | |
| Vanguard Total Bond Market ETF2 | — | 8,114 | 8,123 | 9 | — | — | — | — | |
| Vanguard Total International Bond Index Fund | 3,659,942 | 1,146,508 | 663,660 | 3,748 | (39,270) | 118,826 | — | 4,107,268 | |
| Vanguard Total International Stock Index Fund | 10,715,003 | 1,530,260 | 1,258,467 | (103,363) | 358,316 | 270,810 | — | 11,241,749 | |
| Vanguard Total Stock Market Index Fund | 16,122,186 | 2,006,289 | 3,257,079 | 232,073 | 1,776,626 | 282,762 | — | 16,880,095 | |
| Total | 39,143,678 | 8,247,996 | 8,301,359 | 204,792 | 2,400,269 | 883,865 | — | 42,171,868 | |
1 Not applicable—purchases and sales are for temporary cash investment purposes.
2 The fund invested in ETF Shares during the period, but sold the positions before period end.
G. Management has determined that no events or transactions occurred subsequent to September 30, 2020, that would require recognition or disclosure in these financial statements.
| 68 |
Target Retirement 2035 Fund
Performance Summary
All of the returns in this report represent past performance, which is not a guarantee of future results that may be achieved by the fund. (Current performance may be lower or higher than the performance data cited. For performance data current to the most recent month-end, visit our website at vanguard.com/performance.) Note, too, that both investment returns and principal value can fluctuate widely, so an investor’s shares, when sold, could be worth more or less than their original cost. The returns shown do not reflect taxes that a shareholder would pay on fund distributions or on the sale of fund shares.
Cumulative Performance: September 30, 2010, Through September 30, 2020
Initial Investment of $10,000
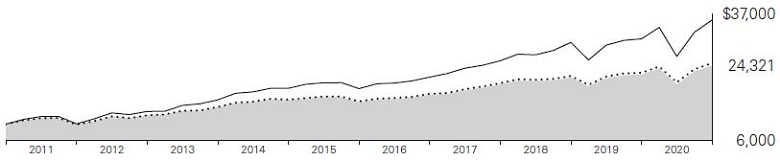
| Average Annual Total Returns | |||||||||
| Periods Ended September 30, 2020 | |||||||||
| Final Value | |||||||||
| One | Five | Ten | of a $10,000 | ||||||
| Year | Years | Years | Investment | ||||||
 | Target Retirement 2035 Fund | 9.71% | 9.53% | 9.29% | $24,321 | ||||
 | Target 2035 Composite Index | 10.51 | 9.90 | 9.58 | 24,971 | ||||
 | MSCI US Broad Market Index | 14.99 | 13.70 | 13.53 | 35,575 | ||||
Target 2035 Composite Index: Derived by applying the fund’s target asset allocation to the results of the following benchmarks: for international stocks of developed markets, the MSCI EAFE Index through December 15, 2010, the MSCI ACWI ex USA IMI Index through June 2, 2013, and the FTSE Global All Cap ex US Index thereafter; for emerging-market stocks, the Select Emerging Markets Index through August 23, 2006, the MSCI Emerging Markets Index through December 15, 2010, the MSCI ACWI ex USA IMI Index through June 2, 2013, and the FTSE Global All Cap ex US Index thereafter; for U.S. bonds, the Bloomberg Barclays U.S. Aggregate Bond Index through December 31, 2009, and the Bloomberg Barclays U.S. Aggregate Float Adjusted Index thereafter; for international bonds, the Bloomberg Barclays Global Aggregate ex-USD Float Adjusted RIC Capped Index Hedged beginning June 3, 2013; and for U.S. stocks, the Dow Jones U.S. Total Stock Market Index (formerly known as the Dow Jones Wilshire 5000 Index) through April 22, 2005, the MSCI US Broad Market Index through June 2, 2013, and the CRSP US Total Market Index thereafter. International stock benchmark returns are adjusted for withholding taxes.
See Financial Highlights for dividend and capital gains information.
| 69 |
Target Retirement 2035 Fund
Underlying Vanguard Funds
As of September 30, 2020
| Vanguard Total Stock Market Index Fund Investor Shares | 44.9 | % | |
| Vanguard Total International Stock Index Fund Investor Shares | 30.1 | ||
| Vanguard Total Bond Market II Index Fund Investor Shares | 17.5 | ||
| Vanguard Total International Bond Index Fund Investor Shares | 7.5 | ||
| The table reflects the fund’s investments, except for short-term investments and derivatives. | |||
| 70 |
Target Retirement 2035 Fund
Financial Statements
Schedule of Investments
As of September 30, 2020
The fund files its complete schedule of portfolio holdings with the Securities and Exchange Commission (SEC) for the first and third quarters of each fiscal year as an exhibit to its reports on Form N-PORT. The fund’s Form N-PORT reports are available on the SEC’s website at www.sec.gov.
| Market | |||
| Value• | |||
| Shares | ($000) | ||
| Investment Companies (98.4%) | |||
| U.S. Stock Fund (44.2%) | |||
| Vanguard Total Stock Market Index Fund Investor Shares | 216,405,731 | 17,944,363 | |
| International Stock Fund (29.6%) | |||
| Vanguard Total International Stock Index Fund Investor Shares | 716,478,413 | 12,008,178 | |
| U.S. Bond Fund (17.2%) | |||
| 1 Vanguard Total Bond Market II Index Fund Investor Shares | 605,254,173 | 6,984,633 | |
| International Bond Fund (7.4%) | |||
| Vanguard Total International Bond Index Fund Investor Shares | 259,267,514 | 3,015,281 | |
| Total Investment Companies (Cost $26,395,636) | 39,952,455 | ||
| Temporary Cash Investment (1.5%) | |||
| Money Market Fund (1.5%) | |||
| 1 Vanguard Market Liquidity Fund, 0.117% (Cost $594,456) | 5,944,764 | 594,477 | |
| Total Investments (99.9%) (Cost $26,990,092) | 40,546,932 | ||
| Other Assets and Liabilities—Net (0.1%) | 49,678 | ||
| Net Assets (100%) | 40,596,610 |
Cost is in $000.
| · | See Note A in Notes to Financial Statements. |
| 1 | Affiliated fund available only to Vanguard funds and certain trusts and accounts managed by Vanguard. Rate shown for Vanguard Market Liquidity Fund is the 7-day yield. |
71
Target Retirement 2035 Fund
| Derivative Financial Instruments Outstanding as of Period End | |||||
| Futures Contracts | |||||
| ($000) | |||||
| Value and | |||||
| Number of | Unrealized | ||||
| Long (Short) | Notional | Appreciation | |||
| Expiration | Contracts | Amount | (Depreciation) | ||
| Long Futures Contracts | |||||
| E-mini S&P 500 Index | December 2020 | 2,123 | 355,815 | 5,855 | |
| 10-Year U.S. Treasury Note | December 2020 | 2,183 | 304,597 | 251 | |
| 6,106 | |||||
See accompanying Notes, which are an integral part of the Financial Statements.
72
Target Retirement 2035 Fund
Statement of Assets and Liabilities
As of September 30, 2020
| ($000s, except shares and per-share amounts) | Amount |
| Assets | |
| Investments in Securities, at Value—Affiliated Funds (Cost $26,990,092) | 40,546,932 |
| Cash Collateral Pledged—Futures Contracts | 25,060 |
| Receivables for Investment Securities Sold | 68,000 |
| Receivables for Accrued Income | 13,833 |
| Receivables for Capital Shares Issued | 40,001 |
| Variation Margin Receivable—Futures Contracts | 1,943 |
| Total Assets | 40,695,769 |
| Liabilities | |
| Payables for Investment Securities Purchased | 13,833 |
| Payables for Capital Shares Redeemed | 84,865 |
| Variation Margin Payable—Futures Contracts | 461 |
| Total Liabilities | 99,159 |
| Net Assets | 40,596,610 |
| At September 30, 2020, net assets consisted of: | |
| Paid-in Capital | 26,326,510 |
| Total Distributable Earnings (Loss) | 14,270,100 |
| Net Assets | 40,596,610 |
| Net Assets | |
| Applicable to 1,753,208,201 outstanding $.001 par value shares of beneficial interest (unlimited authorization) | 40,596,610 |
| Net Asset Value Per Share | $23.16 |
See accompanying Notes, which are an integral part of the Financial Statements.
73
Target Retirement 2035 Fund
Statement of Operations
| Year Ended | |
| September 30, 2020 | |
| ($000) | |
| Investment Income | |
| Income | |
| Income Distributions Received from Affiliated Funds | 825,519 |
| Other Income | 37 |
| Net Investment Income—Note B | 825,556 |
| Realized Net Gain (Loss) | |
| Capital Gain Distributions Received from Affiliated Funds | — |
| Affiliated Funds Sold | 244,210 |
| Futures Contracts | 24,992 |
| Realized Net Gain (Loss) | 269,202 |
| Change in Unrealized Appreciation (Depreciation) | |
| Affiliated Funds | 2,406,453 |
| Futures Contracts | 6,106 |
| Change in Unrealized Appreciation (Depreciation) | 2,412,559 |
| Net Increase (Decrease) in Net Assets Resulting from Operations | 3,507,317 |
See accompanying Notes, which are an integral part of the Financial Statements.
74
Target Retirement 2035 Fund
Statement of Changes in Net Assets
| Year Ended September 30, | ||
| 2020 | 2019 | |
| ($000) | ($000) | |
| Increase (Decrease) in Net Assets | ||
| Operations | ||
| Net Investment Income | 825,556 | 834,948 |
| Realized Net Gain (Loss) | 269,202 | (5,766) |
| Change in Unrealized Appreciation (Depreciation) | 2,412,559 | 378,643 |
| Net Increase (Decrease) in Net Assets Resulting from Operations | 3,507,317 | 1,207,825 |
| Distributions1 | ||
| Total Distributions | (909,779) | (819,561) |
| Capital Share Transactions | ||
| Issued | 6,619,919 | 6,583,434 |
| Issued in Lieu of Cash Distributions | 894,998 | 806,942 |
| Redeemed | (6,642,323) | (5,173,902) |
| Net Increase (Decrease) from Capital Share Transactions | 872,594 | 2,216,474 |
| Total Increase (Decrease) | 3,470,132 | 2,604,738 |
| Net Assets | ||
| Beginning of Period | 37,126,478 | 34,521,740 |
| End of Period | 40,596,610 | 37,126,478 |
1 Certain prior-period numbers have been reclassified to conform with the current-period presentation.
See accompanying Notes, which are an integral part of the Financial Statements.
75
Target Retirement 2035 Fund
Financial Highlights
| For a Share Outstanding | Year Ended September 30, | ||||
| Throughout Each Period | 2020 | 2019 | 2018 | 2017 | 2016 |
| Net Asset Value, Beginning of Period | $21.60 | $21.46 | $20.20 | $18.09 | $16.95 |
| Investment Operations | |||||
| Net Investment Income | .4701 | .5001 | .4591 | .4181 | .393 |
| Capital Gain Distributions Received | — | — | .0011 | .0031 | .003 |
| Net Realized and Unrealized Gain (Loss) on Investments | 1.614 | .146 | 1.243 | 2.180 | 1.530 |
| Total from Investment Operations | 2.084 | .646 | 1.703 | 2.601 | 1.926 |
| Distributions | |||||
| Dividends from Net Investment Income | (.524) | (.464) | (.410) | (.356) | (.371) |
| Distributions from Realized Capital Gains | — | (.042) | (.033) | (.135) | (.415) |
| Total Distributions | (.524) | (.506) | (.443) | (.491) | (.786) |
| Net Asset Value, End of Period | $23.16 | $21.60 | $21.46 | $20.20 | $18.09 |
| Total Return2 | 9.71% | 3.37% | 8.51% | 14.76% | 11.64% |
| Ratios/Supplemental Data | |||||
| Net Assets, End of Period (Millions) | $40,597 | $37,126 | $34,522 | $29,798 | $24,531 |
| Ratio of Total Expenses to Average Net Assets | — | — | — | — | — |
| Acquired Fund Fees and Expenses | 0.14% | 0.14% | 0.14% | 0.14% | 0.15% |
| Ratio of Net Investment Income to Average Net Assets | 2.15% | 2.42% | 2.19% | 2.22% | 2.21% |
| Portfolio Turnover Rate | 18% | 7% | 8% | 9% | 14% |
| 1 | Calculated based on average shares outstanding. |
| 2 | Total returns do not include account service fees that may have applied in the periods shown. Fund prospectuses provide information about any applicable account service fees. |
See accompanying Notes, which are an integral part of the Financial Statements.
76
Target Retirement 2035 Fund
Notes to Financial Statements
Vanguard Target Retirement 2035 Fund is registered under the Investment Company Act of 1940 as an open-end investment company, or mutual fund. The fund follows a balanced investment strategy by investing in selected Vanguard funds to achieve its targeted allocation of assets to U.S. and international stocks, and U.S. and international bonds. Financial statements and other information about each underlying fund are available at www.vanguard.com.
Market disruptions associated with the COVID-19 pandemic have had a global impact, and uncertainty exists as to the long-term implications. Such disruptions can adversely affect assets of the fund and thus fund performance.
A. The following significant accounting policies conform to generally accepted accounting principles for U.S. investment companies. The fund consistently follows such policies in preparing its financial statements.
1. Security Valuation: Investments are valued at the net asset value of each underlying Vanguard fund determined as of the close of the New York Stock Exchange (generally 4 p.m., Eastern time) on the valuation date.
2. Futures Contracts: The fund uses stock and bond futures contracts to a limited extent, with the objectives of maintaining full exposure to the market and maintaining its target asset allocation. The primary risks associated with the use of futures contracts are imperfect correlation between changes in market values of investments held by the fund and the prices of futures contracts, and the possibility of an illiquid market. Counterparty risk involving futures is mitigated because a regulated clearinghouse is the counterparty instead of the clearing broker. To further mitigate counterparty risk, the fund trades futures contracts on an exchange, monitors the financial strength of its clearing brokers and clearinghouse, and has entered into clearing agreements with its clearing brokers. The clearinghouse imposes initial margin requirements to secure the fund’s performance and requires daily settlement of variation margin representing changes in the market value of each contract. Any securities pledged as initial margin for open contracts are noted in the Schedule of Investments.
Futures contracts are valued at their quoted daily settlement prices. The notional amounts of the contracts are not recorded in the Statement of Assets and Liabilities. Fluctuations in the value of the contracts are recorded in the Statement of Assets and Liabilities as an asset (liability) and in the Statement of Operations as unrealized appreciation (depreciation) until the contracts are closed, when they are recorded as realized gains (losses) on futures contracts.
During the year ended September 30, 2020, the fund’s average investments in long and short futures contracts represented less than 1% and 0% of net assets, respectively, based on the average of the notional amounts at each quarter-end during the period.
3. Federal Income Taxes: The fund intends to continue to qualify as a regulated investment company and distribute all of its taxable income. The fund’s tax returns are open to examination by the relevant tax authorities until expiration of the applicable statute of limitations, which is generally three years after the filing of the tax return. Management has analyzed the fund’s tax positions taken for all open federal and state income tax years, and has concluded that no provision for income tax is required in the fund’s financial statements.
4. Distributions: Distributions to shareholders are recorded on the ex-dividend date. Distributions are determined on a tax basis at the fiscal year-end and may differ from net investment income and realized capital gains for financial reporting purposes.
77
Target Retirement 2035 Fund
5. Credit Facilities and Interfund Lending Program: The fund and certain other funds managed by The Vanguard Group (“Vanguard”) participate in a $4.3 billion committed credit facility provided by a syndicate of lenders pursuant to a credit agreement and an uncommitted credit facility provided by Vanguard. Both facilities may be renewed annually. Each fund is individually liable for its borrowings, if any, under the credit facilities. Borrowings may be utilized for temporary or emergency purposes, subject to the fund’s regulatory and contractual borrowing restrictions. With respect to the committed credit facility, the participating funds are charged administrative fees and an annual commitment fee of 0.10% of the undrawn committed amount of the facility; these fees are allocated to the funds based on a method approved by the fund’s board of trustees and borne by the funds in which the fund invests (see Note B). Any borrowings under either facility bear interest at a rate based upon the higher of the one-month London Interbank Offered Rate (or an acceptable alternate rate, if necessary), federal funds effective rate, or overnight bank funding rate plus an agreed-upon spread, except that borrowings under the uncommitted credit facility may bear interest based upon an alternative rate agreed to by the fund and Vanguard.
In accordance with an exemptive order (the “Order”) from the SEC, the fund may participate in a joint lending and borrowing program that allows registered open-end Vanguard funds to borrow money from and lend money to each other for temporary or emergency purposes (the “Interfund Lending Program”), subject to compliance with the terms and conditions of the Order, and to the extent permitted by the fund’s investment objective and investment policies. Interfund loans and borrowings normally extend overnight, but can have a maximum duration of seven days. Loans may be called on one business day’s notice. The interest rate to be charged is governed by the conditions of the Order and internal procedures adopted by the board of trustees. The board of trustees is responsible for overseeing the Interfund Lending Program.
For the year ended September 30, 2020, the fund did not utilize the credit facilities or the Interfund Lending Program.
6. Other: Income and capital gain distributions received are recorded on the ex-dividend date. Security transactions are accounted for on the date securities are bought or sold. Costs used to determine realized gains (losses) on the sale of investment securities are those of the specific securities sold.
B. In accordance with the terms of a Funds’ Service Agreement (the “FSA”) between Vanguard and the fund, Vanguard furnishes to the fund investment advisory, corporate management, administrative, marketing, and distribution services at Vanguard’s cost of operations (as defined by the FSA). These costs of operations are allocated to the fund based on methods and guidelines approved by the board of trustees. The FSA provides that expenses otherwise allocable to Vanguard funds-of-funds may be reduced or eliminated to the extent of savings realized by the underlying Vanguard funds by virtue of being part of a fund-of-funds. Accordingly, all expenses for services provided by Vanguard to the fund and all other expenses incurred by the fund during the period ended September 30, 2020, were borne by the underlying Vanguard funds in which the fund invests. The fund’s trustees and officers are also trustees and officers, respectively, of the underlying Vanguard funds, as well as directors and employees, respectively, of Vanguard.
78
Target Retirement 2035 Fund
C. Various inputs may be used to determine the value of the fund’s investments and derivatives. These inputs are summarized in three broad levels for financial statement purposes. The inputs or methodologies used to value securities are not necessarily an indication of the risk associated with investing in those securities.
Level 1—Quoted prices in active markets for identical securities.
Level 2—Other significant observable inputs (including quoted prices for similar securities, interest rates, prepayment speeds, credit risk, etc.).
Level 3—Significant unobservable inputs (including the fund’s own assumptions used to determine the fair value of investments). Any investments and derivatives valued with significant unobservable inputs are noted on the Schedule of Investments.
At September 30, 2020, 100% of the market value of the fund’s investments and derivatives was determined based on Level 1 inputs.
D. Permanent differences between book-basis and tax-basis components of net assets are reclassified among capital accounts in the financial statements to reflect their tax character. These reclassifications have no effect on net assets or net asset value per share. As of period end, permanent differences primarily attributable to the accounting for distributions in connection with fund share redemptions were reclassified between the following accounts:
| Amount | |||
| ($000) | |||
| Paid-in Capital | 30,480 | ||
| Total Distributable Earnings (Loss) | (30,480) | ||
Temporary differences between book-basis and tax-basis components of total distributable earnings (loss) arise when certain items of income, gain, or loss are recognized in different periods for financial statement and tax purposes; these differences will reverse at some time in the future. The differences are primarily related to the deferral of losses from wash sales and the recognition of unrealized gains or losses from certain derivative contracts. As of period end, the tax-basis components of total distributable earnings (loss) are detailed in the table as follows:
| Amount | |||
| ($000) | |||
| Undistributed Ordinary Income | 500,018 | ||
| Undistributed Long-Term Gains | 213,242 | ||
| Capital Loss Carryforwards | — | ||
| Qualified Late-Year Losses | — | ||
| Net Unrealized Gains (Losses) | 13,556,840 | ||
79
Target Retirement 2035 Fund
The tax character of distributions paid was as follows:
| Year Ended September 30, | ||||
| 2020 | 2019 | |||
| Amount | Amount | |||
| ($000) | ($000) | |||
| Ordinary Income* | 909,779 | 815,423 | ||
| Long-Term Capital Gains | — | 4,138 | ||
| Total | 909,779 | 819,561 | ||
* Includes short-term capital gains, if any.
As of September 30, 2020, gross unrealized appreciation and depreciation for investments and derivatives based on cost for U.S. federal income tax purposes were as follows:
| Amount | ||
| ($000) | ||
| Tax Cost | 26,990,092 | |
| Gross Unrealized Appreciation | 13,602,023 | |
| Gross Unrealized Depreciation | (45,183) | |
| Net Unrealized Appreciation (Depreciation) | 13,556,840 |
E. Capital shares issued and redeemed were:
| Year Ended September 30, | ||||
| 2020 | 2019 | |||
| Shares | Shares | |||
| (000) | (000) | |||
| Issued | 303,971 | 319,514 | ||
| Issued in Lieu of Cash Distributions | 39,637 | 43,129 | ||
| Redeemed | (309,050) | (252,750) | ||
| Net Increase (Decrease) in Shares Outstanding | 34,558 | 109,893 | ||
80
Target Retirement 2035 Fund
F. Transactions during the period in affiliated underlying Vanguard funds were as follows:
| Current Period Transactions | ||||||||||||||||||||||||||||||
| Sept. 30, | Proceeds | Realized | Sept. 30, | |||||||||||||||||||||||||||
| 2019 | from | Net | Change in | Capital Gain | 2020 | |||||||||||||||||||||||||
| Market | Purchases | Securities | Gain | Unrealized | Distributions | Market | ||||||||||||||||||||||||
| Value | at Cost | Sold | (Loss) | App. (Dep.) | Income | Received | Value | |||||||||||||||||||||||
| ($000) | ($000) | ($000) | ($000) | ($000) | ($000) | ($000) | ($000) | |||||||||||||||||||||||
| Vanguard Market Liquidity Fund | 9,487 | NA1 | NA1 | (76) | 20 | 589 | — | 594,477 | ||||||||||||||||||||||
| Vanguard Total Bond Market II Index Fund | 6,178,454 | 2,873,880 | 2,342,333 | 56,516 | 218,116 | 153,198 | — | 6,984,633 | ||||||||||||||||||||||
| Vanguard Total Bond Market ETF2 | — | 5,244 | 5,250 | 6 | — | — | — | — | ||||||||||||||||||||||
| Vanguard Total International Bond Index Fund | 2,693,932 | 878,367 | 529,901 | 2,864 | (29,981) | 86,002 | — | 3,015,281 | ||||||||||||||||||||||
| Vanguard Total International Stock Index Fund | 11,251,819 | 1,450,147 | 952,402 | (66,382) | 324,996 | 287,510 | — | 12,008,178 | ||||||||||||||||||||||
| Vanguard Total Stock Market Index Fund | 17,027,238 | 1,640,180 | 2,867,639 | 251,282 | 1,893,302 | 298,220 | — | 17,944,363 | ||||||||||||||||||||||
| Total | 37,160,930 | 6,847,818 | 6,697,525 | 244,210 | 2,406,453 | 825,519 | — | 40,546,932 | ||||||||||||||||||||||
1 Not applicable—purchases and sales are for temporary cash investment purposes.
2 The fund invested in ETF Shares during the period, but sold the positions before period end.
G. Management has determined that no events or transactions occurred subsequent to September 30, 2020, that would require recognition or disclosure in these financial statements.
81
Report of Independent Registered
Public Accounting Firm
To the Board of Trustees of Vanguard Chester Funds and Shareholders of Vanguard Target Retirement Income Fund, Vanguard Target Retirement 2015 Fund, Vanguard Target Retirement 2020 Fund, Vanguard Target Retirement 2025 Fund, Vanguard Target Retirement 2030 Fund and Vanguard Target Retirement 2035 Fund
Opinions on the Financial Statements
We have audited the accompanying statements of assets and liabilities, including the schedules of investments, of Vanguard Target Retirement Income Fund, Vanguard Target Retirement 2015 Fund, Vanguard Target Retirement 2020 Fund, Vanguard Target Retirement 2025 Fund, Vanguard Target Retirement 2030 Fund and Vanguard Target Retirement 2035 Fund (six of the funds constituting Vanguard Chester Funds, hereafter collectively referred to as the “Funds”) as of September 30, 2020, the related statements of operations for the year ended September 30, 2020, the statements of changes in net assets for each of the two years in the period ended September 30, 2020, including the related notes, and the financial highlights for each of the five years in the period ended September 30, 2020 (collectively referred to as the “financial statements”). In our opinion, the financial statements present fairly, in all material respects, the financial position of each of the Funds as of September 30, 2020, the results of each of their operations for the year then ended, the changes in each of their net assets for each of the two years in the period ended September 30, 2020 and each of the financial highlights for each of the five years in the period ended September 30, 2020 in conformity with accounting principles generally accepted in the United States of America.
Basis for Opinions
These financial statements are the responsibility of the Funds’ management. Our responsibility is to express an opinion on the Funds’ financial statements based on our audits. We are a public accounting firm registered with the Public Company Accounting Oversight Board (United States) (“PCAOB”) and are required to be independent with respect to the Funds in accordance with the U.S. federal securities laws and the applicable rules and regulations of the Securities and Exchange Commission and the PCAOB.
We conducted our audits of these financial statements in accordance with the standards of the PCAOB. Those standards require that we plan and perform the audit to obtain reasonable assurance about whether the financial statements are free of material misstatement, whether due to error or fraud.
Our audits included performing procedures to assess the risks of material misstatement of the financial statements, whether due to error or fraud, and performing procedures that respond to those risks. Such procedures included examining, on a test basis, evidence regarding the amounts and disclosures in the financial statements. Our audits also included evaluating the accounting principles used and significant estimates made by management, as well as evaluating the overall presentation of the financial statements. Our procedures included confirmation of securities owned as of September 30, 2020 by correspondence with the transfer agent. We believe that our audits provide a reasonable basis for our opinions.
/s/PricewaterhouseCoopers LLP
Philadelphia, Pennsylvania
November 12, 2020
We have served as the auditor of one or more investment companies in The Vanguard Group of Funds since 1975.
82
Special 2020 tax information (unaudited) for Vanguard Target Retirement Funds
This information for the fiscal year ended September 30, 2020, is included pursuant to provisions of the Internal Revenue Code.
The funds distributed capital gain dividends (20% rate gain distributions) to shareholders during the fiscal year as follows:
| Fund | ($000) | ||
| Target Retirement Income Fund | $26,970 | ||
| Target Retirement 2015 Fund | 392,501 | ||
| Target Retirement 2020 Fund | 452,812 | ||
| Target Retirement 2025 Fund | 64,566 | ||
| Target Retirement 2030 Fund | 6,424 | ||
| Target Retirement 2035 Fund | 6,105 |
For nonresident alien shareholders, 100% of short-term capital gain dividends distributed by the funds are qualified short-term capital gains.
The funds distributed qualified dividend income to shareholders during the fiscal year as follows:
| Fund | ($000) | ||
| Target Retirement Income Fund | $83,725 | ||
| Target Retirement 2015 Fund | 104,869 | ||
| Target Retirement 2020 Fund | 298,973 | ||
| Target Retirement 2025 Fund | 481,451 | ||
| Target Retirement 2030 Fund | 490,406 | ||
| Target Retirement 2035 Fund | 516,755 |
For corporate shareholders, the percentage of investment income (dividend income plus short-term gains, if any) that qualifies for the dividends-received deduction is as follows:
| Fund | Percentage | ||
| Target Retirement Income Fund | 11.5% | ||
| Target Retirement 2015 Fund | 14.7 | ||
| Target Retirement 2020 Fund | 20.3 | ||
| Target Retirement 2025 Fund | 23.1 | ||
| Target Retirement 2030 Fund | 26.3 | ||
| Target Retirement 2035 Fund | 29.5 | ||
83
The funds designate to shareholders foreign source income and foreign taxes paid as follows:
| Foreign Source Income | Foreign Taxes Paid | ||||||
| Fund | ($000) | ($000) | |||||
| Target Retirement Income Fund | $135,860 | $3,892 | |||||
| Target Retirement 2015 Fund | 128,596 | 4,167 | |||||
| Target Retirement 2020 Fund | 295,378 | 12,015 | |||||
| Target Retirement 2025 Fund | 443,361 | 20,076 | |||||
| Target Retirement 2030 Fund | 400,535 | 20,126 | |||||
| Target Retirement 2035 Fund | 386,891 | 21,290 | |||||
Shareholders will receive more detailed information with their Form 1099-DIV in January 2021 to determine the calendar-year amounts to be included on their 2020 tax returns.
84
BLOOMBERG is a trademark and service mark of Bloomberg Finance L.P. BARCLAYS is a trademark and service mark of Barclays Bank Plc, used under license. Bloomberg Finance L.P. and its affiliates, including Bloomberg Index Services Limited (BISL) (collectively, Bloomberg), or Bloomberg’s licensors, own all proprietary rights in the Bloomberg Barclays U.S. Aggregate Bond Index, Bloomberg Barclays U.S. Aggregate Float Adjusted Index, Bloomberg Barclays U.S. Treasury Inflation Protected Securities Index, Bloomberg Barclays U.S. Treasury Inflation-Protected Securities (TIPS) 0–5 Year Index, and the Bloomberg Barclays Global Aggregate ex-USD Float Adjusted RIC Capped Index (USD Hedged) (the Indices or Bloomberg Barclays Indices).
Neither Barclays Bank Plc, Barclays Capital Inc., or any affiliate (collectively Barclays) or Bloomberg is the issuer or producer of the Target Retirement Funds (including the Total Bond Market II Index Fund, the Total International Bond Index Fund, and the Short-Term Inflation-Protected Securities Index Fund) and neither Bloomberg nor Barclays has any responsibilities, obligations or duties to investors in the Target Retirement Funds. The Indices are licensed for use by The Vanguard Group, Inc. (Vanguard) as the sponsor of the Target Retirement Funds. Bloomberg and Barclays’ only relationship with Vanguard in respect to the Indices is the licensing of the Indices, which is determined, composed and calculated by BISL, or any successor thereto, without regard to the Issuer or the Target Retirement Funds or the owners of the Target Retirement Funds.
Additionally, Vanguard may for itself execute transaction(s) with Barclays in or relating to the Indices in connection with the Target Retirement Funds. Investors acquire the Target Retirement Funds from Vanguard and investors neither acquire any interest in the Indices nor enter into any relationship of any kind whatsoever with Bloomberg or Barclays upon making an investment in the Target Retirement Funds. The Target Retirement Funds are not sponsored, endorsed, sold or promoted by Bloomberg or Barclays. Neither Bloomberg nor Barclays makes any representation or warranty, express or implied regarding the advisability of investing in the Target Retirement Funds or the advisability of investing in securities generally or the ability of the Indices to track corresponding or relative market performance. Neither Bloomberg nor Barclays has passed on the legality or suitability of the Target Retirement Funds with respect to any person or entity. Neither Bloomberg nor Barclays is responsible for and has not participated in the determination of the timing of, prices at, or quantities of the Target Retirement Funds to be issued. Neither Bloomberg nor Barclays has any obligation to take the needs of the Issuer or the owners of the Target Retirement Funds or any other third party into consideration in determining, composing or calculating the Indices. Neither Bloomberg nor Barclays has any obligation or liability in connection with administration, marketing or trading of the Target Retirement Funds.
85
The licensing agreement between Bloomberg and Barclays is solely for the benefit of Bloomberg and Barclays and not for the benefit of the owners of the Target Retirement Funds, investors or other third parties. In addition, the licensing agreement between Vanguard and Bloomberg is solely for the benefit of Vanguard and Bloomberg and not for the benefit of the owners of the Target Retirement Funds, investors or other third parties.
NEITHER BLOOMBERG NOR BARCLAYS SHALL HAVE ANY LIABILITY TO THE ISSUER, INVESTORS OR TO OTHER THIRD PARTIES FOR THE QUALITY, ACCURACY AND/OR COMPLETENESS OF THE BLOOMBERG BARCLAYS INDICES OR ANY DATA INCLUDED THEREIN OR FOR INTERRUPTIONS IN THE DELIVERY OF THE BLOOMBERG BARCLAYS INDICES. NEITHER BLOOMBERG NOR BARCLAYS MAKES ANY WARRANTY, EXPRESS OR IMPLIED, AS TO RESULTS TO BE OBTAINED BY THE ISSUER, THE INVESTORS OR ANY OTHER PERSON OR ENTITY FROM THE USE OF THE BLOOMBERG BARCLAYS INDICES OR ANY DATA INCLUDED THEREIN. NEITHER BLOOMBERG NOR BARCLAYS MAKES ANY EXPRESS OR IMPLIED WARRANTIES, AND EACH HEREBY EXPRESSLY DISCLAIMS ALL WARRANTIES OF MERCHANTABILITY OR FITNESS FOR A PARTICULAR PURPOSE OR USE WITH RESPECT TO BLOOMBERG BARCLAYS INDICES OR ANY DATA INCLUDED THEREIN. BLOOMBERG RESERVES THE RIGHT TO CHANGE THE METHODS OF CALCULATION OR PUBLICATION, OR TO CEASE THE CALCULATION OR PUBLICATION OF THE BLOOMBERG BARCLAYS INDICES, AND NEITHER BLOOMBERG NOR BARCLAYS SHALL BE LIABLE FOR ANY MISCALCULATION OF OR ANY INCORRECT, DELAYED OR INTERRUPTED PUBLICATION WITH RESPECT TO ANY OF THE BLOOMBERG BARCLAYS INDICES. NEITHER BLOOMBERG NOR BARCLAYS SHALL BE LIABLE FOR ANY DAMAGES, INCLUDING, WITHOUT LIMITATION, ANY SPECIAL, INDIRECT OR CONSEQUENTIAL DAMAGES, OR ANY LOST PROFITS AND EVEN IF ADVISED OF THE POSSIBILITY OF SUCH, RESULTING FROM THE USE OF BLOOMBERG BARCLAYS INDICES OR ANY DATA INCLUDED THEREIN OR WITH RESPECT TO THE TARGET RETIREMENT FUNDS.
None of the information supplied by Bloomberg or Barclays and used in this publication may be reproduced in any manner without the prior written permission of both Bloomberg and Barclays Capital, the investment banking division of Barclays Bank Plc. Barclays Bank Plc is registered in England No. 1026167. Registered office 1 Churchill Place London E14 5HP.
© 2020 Bloomberg. Used with Permission.
Source: Bloomberg Index Services Limited. Copyright 2020, Bloomberg. All rights reserved.
86
This page intentionally left blank.
This page intentionally left blank.
This page intentionally left blank.
This page intentionally left blank.
The People Who Govern Your Fund
The trustees of your mutual fund are there to see that the fund is operated and managed in your best interests since, as a shareholder, you are a part owner of the fund. Your fund’s trustees also serve on the board of directors of The Vanguard Group, Inc., which is owned by the Vanguard funds and provides services to them.
A majority of Vanguard’s board members are independent, meaning that they have no affiliation with Vanguard or the funds they oversee, apart from the sizable personal investments they have made as private individuals. The independent board members have distinguished backgrounds in business, academia, and public service. Each of the trustees and executive officers oversees 213 Vanguard funds.
Information for each trustee and executive officer of the fund appears below. That information, as well as the Vanguard fund count, is as of the date on the cover of this fund report. The mailing address of the trustees and officers is P.O. Box 876, Valley Forge, PA 19482. More information about the trustees is in the Statement of Additional Information, which can be obtained, without charge, by contacting Vanguard at 800-662-7447, or online at vanguard.com.
Interested Trustee1
Mortimer J. Buckley
Born in 1969. Trustee since January 2018. Principal occupation(s) during the past five years and other experience: chairman of the board (2019–present) of Vanguard and of each of the investment companies served by Vanguard; chief executive officer (2018–present) of Vanguard; chief executive officer, president, and trustee (2018–present) of each of the investment companies served by Vanguard; president and director (2017–present) of Vanguard; and president (2018-present) of Vanguard Marketing Corporation. Chief investment officer (2013–2017), managing director (2002–2017), head of the Retail Investor Group (2006-2012), and chief information officer (2001–2006) of Vanguard. Chairman of the board (2011–2017) and trustee (2009–2017) of the Children’s Hospital of Philadelphia; and trustee (2018–present) and vice chair (2019–present) of The Shipley School.
Independent Trustees
Emerson U. Fullwood
Born in 1948. Trustee since January 2008. Principal occupation(s) during the past five years and other experience: executive chief staff and marketing officer for North America and corporate vice president (retired 2008) of Xerox Corporation (document management products and services). Former president of the Worldwide Channels Group, Latin America, and Worldwide Customer Service and executive chief staff officer of Developing Markets of Xerox. Executive in residence and 2009–2010 Distinguished Minett Professor at the Rochester Institute of Technology. Director of SPX FLOW, Inc. (multi-industry manufacturing). Director of the University of Rochester Medical Center, the Monroe Community College Foundation, the United Way of Rochester, North Carolina A&T University, and Roberts Wesleyan College. Trustee of the University of Rochester.
Amy Gutmann
Born in 1949. Trustee since June 2006. Principal occupation(s) during the past five years and other experience: president (2004–present) of the University of Pennsylvania. Christopher H. Browne Distinguished Professor of Political Science, School of Arts and Sciences, and professor of communication, Annenberg School for Communication, with secondary faculty appointments in the Department of Philosophy, School of Arts and Sciences, and at the Graduate School of Education, University of Pennsylvania.
F. Joseph Loughrey
Born in 1949. Trustee since October 2009. Principal occupation(s) during the past five years and other experience: president and chief operating officer (retired 2009) and vice chairman of the board (2008–2009) of Cummins Inc. (industrial machinery). Chairman of the board of Hillenbrand, Inc. (specialized consumer services) and the Lumina Foundation. Director of the V Foundation. Member of the advisory
| 1 | Mr. Buckley is considered an “interested person,” as defined in the Investment Company Act of 1940, because he is an officer of the Vanguard funds. |
council for the College of Arts and Letters and chair of the advisory board to the Kellogg Institute for International Studies, both at the University of Notre Dame.
Mark Loughridge
Born in 1953. Trustee since March 2012. Principal occupation(s) during the past five years and other experience: senior vice president and chief financial officer (retired 2013) of IBM (information technology services). Fiduciary member of IBM’s Retirement Plan Committee (2004–2013), senior vice president and general manager (2002–2004) of IBM Global Financing, vice president and controller (1998–2002) of IBM, and a variety of other prior management roles at IBM. Member of the Council on Chicago Booth.
Scott C. Malpass
Born in 1962. Trustee since March 2012. Principal occupation(s) during the past five years and other experience: chief investment officer (retired June 2020) and vice president (retired June 2020) of the University of Notre Dame. Assistant professor of finance at the Mendoza College of Business, University of Notre Dame, and member of the Notre Dame 403(b) Investment Committee (retired June 2020). Member of the board of Catholic Investment Services, Inc. (investment advisors) and the board of superintendence of the Institute for the Works of Religion.
Deanna Mulligan
Born in 1963. Trustee since January 2018. Principal occupation(s) during the past five years and other experience: board chair (2020–present), chief executive officer (2011–2020), and president (2010–2019) of The Guardian Life Insurance Company of America. Chief operating officer (2010–2011) and executive vice president (2008–2010) of the individual life and disability division of Guardian Life. Member of the board of the American Council of Life Insurers and the board of the Economic Club of New York. Trustee of the Partnership for New York City (business leadership), Chief Executives for Corporate Purpose, NewYork- Presbyterian Hospital, Catalyst, and the Bruce Museum (arts and science). Member of the Advisory Council for the Stanford Graduate School of Business.
André F. Perold
Born in 1952. Trustee since December 2004. Principal occupation(s) during the past five years and other experience: George Gund Professor of Finance and Banking, Emeritus at the Harvard Business School (retired 2011). Chief investment officer and co-managing partner of HighVista Strategies (private investment firm). Member of the board of advisors and member of the investment committee of the Museum of Fine Arts Boston. Member of the board (2018–present) of RIT Capital Partners (investment firm). Member of the investment committee of Partners Health Care System.
Sarah Bloom Raskin
Born in 1961. Trustee since January 2018. Principal occupation(s) during the past five years and other experience: deputy secretary (2014–2017) of the United States Department of the Treasury. Governor (2010–2014) of the Federal Reserve Board. Commissioner (2007–2010) of financial regulation for the State of Maryland. Member of the board of directors (2012–2014) of Neighborhood Reinvestment Corporation. Director (2017–present) of i(x) Investments, LLC; director (2017–present) of Reserve Trust. Rubenstein Fellow (2017–present) of Duke University; trustee (2017–present) of Amherst College, and trustee (2019–present) of the Folger Shakespeare Library.
Peter F. Volanakis
Born in 1955. Trustee since July 2009. Principal occupation(s) during the past five years and other experience: president and chief operating officer (retired 2010) of Corning Incorporated (communications equipment) and director of Corning Incorporated (2000–2010) and Dow Corning (2001–2010). Director (2012) of SPX Corporation (multi-industry manufacturing). Overseer of the Amos Tuck School of Business Administration, Dartmouth College (2001–2013). Chairman of the board of trustees of Colby-Sawyer College. Member of the board of Hypertherm Inc. (industrial cutting systems, software, and consumables).
Executive Officers
John Bendl
Born in 1970. Principal occupation(s) during the past five years and other experience: principal of Vanguard. Chief financial officer (2019–present) of each of the investment companies served by Vanguard. Chief accounting officer, treasurer, and controller of Vanguard (2017–present). Partner (2003–2016) at KPMG (audit, tax, and advisory services).
Christine M. Buchanan
Born in 1970. Principal occupation(s) during the past five years and other experience: principal of Vanguard. Treasurer (2017-present) of each of the investment companies served by Vanguard. Partner (2005–2017) at KPMG (audit, tax, and advisory services).
David Cermak
Born in 1960. Principal occupation(s) during the past five years and other experience: principal of Vanguard. Finance director (2019–present) of each of the investment companies served by Vanguard. Managing director and head (2017–present) of Vanguard Investments Singapore. Managing director and head (2017–2019) of Vanguard Investments Hong Kong. Representative director and head (2014–2017) of Vanguard Investments Japan.
John Galloway
Born in 1973. Principal occupation(s) during the past five years and other experience: principal of Vanguard. Investment stewardship officer (September 2020-present) of each of the investment companies served by Vanguard. Head of Investor Advocacy (February 2020-present) and head of Marketing Strategy and Planning (2017-2020) at Vanguard. Deputy assistant to the President of the United States (2015).
Thomas J. Higgins
Born in 1957. Principal occupation(s) during the past five years and other experience: principal of Vanguard. Finance director (2019–present), chief financial officer (2008–2019), and treasurer (1998–2008) of each of the investment companies served by Vanguard.
Peter Mahoney
Born in 1974. Principal occupation(s) during the past five years and other experience: principal of Vanguard. Controller (2015–present) of each of the investment companies served by Vanguard. Head of International Fund Services (2008-2014) at Vanguard.
Anne E. Robinson
Born in 1970. Principal occupation(s) during the past five years and other experience: general counsel (2016-present) of Vanguard. Secretary (2016–present) of Vanguard and of each of the investment companies served by Vanguard. Managing director (2016–present) of Vanguard. Managing director and general counsel of Global Cards and Consumer Services (2014–2016) at Citigroup. Counsel (2003–2014) at American Express.
Michael Rollings
Born in 1963. Principal occupation(s) during the past five years and other experience: finance director (2017–present) and treasurer (2017) of each of the investment companies served by Vanguard. Managing director (2016–present) of Vanguard. Chief financial officer (2016–present) of Vanguard. Director (2016–present) of Vanguard Marketing Corporation. Executive vice president and chief financial officer (2006–2016) of MassMutual Financial Group.
John E. Schadl
Born in 1972. Principal occupation(s) during the past five years and other experience: principal of Vanguard. Chief compliance officer (2019–present) of Vanguard and of each of the investment companies served by Vanguard. Assistant vice president (2019–present) of Vanguard Marketing Corporation.
Vanguard Senior Management Team
| Joseph Brennan | James M. Norris | |
| Mortimer J. Buckley | Thomas M. Rampulla | |
| Gregory Davis | Karin A. Risi | |
| John James | Anne E. Robinson | |
| John T. Marcante | Michael Rollings | |
| Chris D. McIsaac | Lauren Valente |
Connect with Vanguard® > vanguard.com
Fund Information > 800-662-7447
Direct Investor Account Services > 800-662-2739
Institutional Investor Services > 800-523-1036
Text Telephone for People
Who Are Deaf or Hard of Hearing > 800-749-7273
This material may be used in conjunction with the offering of shares of any Vanguard fund only if preceded or accompanied by the fund’s current prospectus.
All comparative mutual fund data are from Morningstar, Inc., unless otherwise noted.
You can obtain a free copy of Vanguard’s proxy voting guidelines by visiting vanguard.com/proxyreporting or by calling Vanguard at 800-662-2739. The guidelines are also available from the SEC’s website, www.sec.gov. In addition, you may obtain a free report on how your fund voted the proxies for securities it owned during the 12 months ended June 30. To get the report, visit either vanguard.com/proxyreporting or www.sec.gov.
You can review information about your fund on the SEC’s website, and you can receive copies of this information, for a fee, by sending a request via email addressed to publicinfo@sec.gov.
| © 2020 The Vanguard Group, Inc. | |
| All rights reserved. | |
| Vanguard Marketing Corporation, Distributor. | |
| Q3080 112020 |

| Annual Report | September 30, 2020 |
| Vanguard Target Retirement Funds |
| Vanguard Target Retirement 2040 Fund |
| Vanguard Target Retirement 2045 Fund |
| Vanguard Target Retirement 2050 Fund |
| Vanguard Target Retirement 2055 Fund |
| Vanguard Target Retirement 2060 Fund |
| Vanguard Target Retirement 2065 Fund |
| See the inside front cover for important information about access to your fund’s annual and semiannual shareholder reports. |
Important information about access to shareholder reports
Beginning on January 1, 2021, as permitted by regulations adopted by the Securities and Exchange Commission, paper copies of your fund’s annual and semiannual shareholder reports will no longer be sent to you by mail, unless you specifically request them. Instead, you will be notified by mail each time a report is posted on the website and will be provided with a link to access the report.
If you have already elected to receive shareholder reports electronically, you will not be affected by this change and do not need to take any action. You may elect to receive shareholder reports and other communications from the fund electronically by contacting your financial intermediary (such as a broker-dealer or bank) or, if you invest directly with the fund, by calling Vanguard at one of the phone numbers on the back cover of this report or by logging on to vanguard.com.
You may elect to receive paper copies of all future shareholder reports free of charge. If you invest through a financial intermediary, you can contact the intermediary to request that you continue to receive paper copies. If you invest directly with the fund, you can call Vanguard at one of the phone numbers on the back cover of this report or log on to vanguard.com. Your election to receive paper copies will apply to all the funds you hold through an intermediary or directly with Vanguard.
| Contents | |
| Your Fund’s Performance at a Glance | 1 |
| About Your Fund’s Expenses | 2 |
| Target Retirement 2040 Fund | 4 |
| Target Retirement 2045 Fund | 17 |
| Target Retirement 2050 Fund | 30 |
| Target Retirement 2055 Fund | 42 |
| Target Retirement 2060 Fund | 54 |
| Target Retirement 2065 Fund | 66 |
Please note: The opinions expressed in this report are just that—informed opinions. They should not be considered promises or advice. Also, please keep in mind that the information and opinions cover the period through the date on the front of this report. Of course, the risks of investing in your fund are spelled out in the prospectus.
Your Fund’s Performance at a Glance
· For the 12 months ended September 30, 2020, returns for the six Vanguard Target Retirement Funds covered in this report ranged from 9.96% for the Target Retirement 2040 Fund to 10.27% for the Target Retirement 2045 Fund. (The funds with target dates of 2015 through 2035, as well as the Target Retirement Income Fund, are covered in a separate report.) Each fund performed in line with its composite benchmark after expenses.
· The rebound in global stocks that began in March continued in the third quarter. Massive fiscal and monetary support from governments and central banks, signs of economic healing, and reported progress toward a COVID-19 vaccine all buoyed the markets until September, when investor sentiment soured a little.
· In the global bond market, the pandemic led to a wave of issuance, which drove up supply, but demand held up fairly well. U.S. Treasury yields ended the quarter little changed.
· Vanguard Target Retirement Funds are designed to reach an allocation of 70% bonds and 30% stocks within seven years after their target dates. The funds invest all of their assets in Vanguard index funds that seek to match the performance of broad stock and bond market indexes.
· For the 10 years ended September 30—or since inception for the two newest funds— the funds’ average annual returns ranged from 8.03% for the Target Retirement 2065 Fund to 9.78% for the Target Retirement 2060 Fund.
Market Barometer
| Average Annual Total Returns | |||
| Periods Ended September 30, 2020 | |||
| One Year | Three Years | Five Years | |
| Stocks | |||
| Russell 1000 Index (Large-caps) | 16.01% | 12.38% | 14.09% |
| Russell 2000 Index (Small-caps) | 0.39 | 1.77 | 8.00 |
| Russell 3000 Index (Broad U.S. market) | 15.00 | 11.65 | 13.69 |
| FTSE All-World ex US Index (International) | 3.55 | 1.50 | 6.49 |
| Bonds | |||
| Bloomberg Barclays U.S. Aggregate Bond Index (Broad taxable market) | 6.98% | 5.24% | 4.18% |
| Bloomberg Barclays Municipal Bond Index (Broad tax-exempt market) | 4.09 | 4.28 | 3.84 |
| FTSE Three-Month U.S. Treasury Bill Index | 1.02 | 1.65 | 1.15 |
| CPI | |||
| Consumer Price Index | 1.37% | 1.79% | 1.81% |
1
About Your Fund’s Expenses
As a shareholder of the fund, you incur ongoing costs, which include costs for portfolio management, administrative services, and shareholder reports (like this one), among others. Operating expenses, which are deducted from a fund’s gross income, directly reduce the investment return of the fund.
A typical fund’s expenses are expressed as a percentage of its average net assets. The Target Retirement Funds have no direct expenses, but each fund bears its proportionate share of the costs for the underlying funds in which it invests. These indirect expenses make up the acquired fund fees and expenses, also expressed as a percentage of average net assets.
The following examples are intended to help you understand the ongoing cost (in dollars) of investing in your fund and to compare these costs with those of other mutual funds. The examples are based on an investment of $1,000 made at the beginning of the period shown and held for the entire period. The costs were calculated using the acquired fund fees and expenses for each Target Retirement Fund.
The accompanying table illustrates your fund’s costs in two ways:
· Based on actual fund return. This section helps you to estimate the actual expenses that you paid over the period. The “Ending Account Value” shown is derived from the fund‘s actual return, and the third column shows the dollar amount that would have been paid by an investor who started with $1,000 in the fund. You may use the information here, together with the amount you invested, to estimate the expenses that you paid over the period.
To do so, simply divide your account value by $1,000 (for example, an $8,600 account value divided by $1,000 = 8.6), then multiply the result by the number given for your fund under the heading “Expenses Paid During Period.”
· Based on hypothetical 5% yearly return. This section is intended to help you compare your fund‘s costs with those of other mutual funds. It assumes that the fund had a yearly return of 5% before expenses, but that the expense ratio is unchanged. In this case—because the return used is not the fund’s actual return—the results do not apply to your investment. The example is useful in making comparisons because the Securities and Exchange Commission requires all mutual funds to calculate expenses based on a 5% return. You can assess your fund’s costs by comparing this hypothetical example with the hypothetical examples that appear in shareholder reports of other funds.
Note that the expenses shown in the table are meant to highlight and help you compare ongoing costs only and do not reflect transaction costs incurred by the fund for buying and selling securities. Further, the expenses do not include any purchase, redemption, or account service fees described in the fund prospectus. If such fees were applied to your account, your costs would be higher. Your fund does not carry a “sales load.”
The calculations assume no shares were bought or sold during the period. Your actual costs may have been higher or lower, depending on the amount of your investment and the timing of any purchases or redemptions.
You can find more information about the fund’s expenses, including annual expense ratios, in the Financial Statements section of this report. For additional information on operating expenses and other shareholder costs, please refer to your fund’s current prospectus.
2
Six Months Ended September 30, 2020
| Beginning | Ending | Expenses | |
| Account Value | Account Value | Paid During | |
| 3/31/2020 | 9/30/2020 | Period | |
| Based on Actual Fund Return | |||
| Target Retirement 2040 Fund | $1,000.00 | $1,252.58 | $0.79 |
| Target Retirement 2045 Fund | $1,000.00 | $1,274.38 | $0.85 |
| Target Retirement 2050 Fund | $1,000.00 | $1,273.93 | $0.85 |
| Target Retirement 2055 Fund | $1,000.00 | $1,273.99 | $0.85 |
| Target Retirement 2060 Fund | $1,000.00 | $1,273.71 | $0.85 |
| Target Retirement 2065 Fund | $1,000.00 | $1,273.10 | $0.85 |
| Based on Hypothetical 5% Yearly Return | |||
| Target Retirement 2040 Fund | $1,000.00 | $1,024.30 | $0.71 |
| Target Retirement 2045 Fund | $1,000.00 | $1,024.25 | $0.76 |
| Target Retirement 2050 Fund | $1,000.00 | $1,024.25 | $0.76 |
| Target Retirement 2055 Fund | $1,000.00 | $1,024.25 | $0.76 |
| Target Retirement 2060 Fund | $1,000.00 | $1,024.25 | $0.76 |
| Target Retirement 2065 Fund | $1,000.00 | $1,024.25 | $0.76 |
The calculations are based on the acquired fund fees and expenses for the most recent six-month period. The funds’ annualized expense figures for the period are (in order as listed from top to bottom above) 0.14%, 0.15%, 0.15%, 0.15%, 0.15%, and 0.15%. The dollar amounts shown as ”Expenses Paid” are equal to the annualized average weighted expense ratio for the underlying funds multiplied by the average account value over the period, multiplied by the number of days in the most recent six-month period, then divided by the number of days in the most recent 12-month period (183/366).
3
Target Retirement 2040 Fund
Performance Summary
All of the returns in this report represent past performance, which is not a guarantee of future results that may be achieved by the fund. (Current performance may be lower or higher than the performance data cited. For performance data current to the most recent month-end, visit our website at vanguard.com/performance.) Note, too, that both investment returns and principal value can fluctuate widely, so an investor’s shares, when sold, could be worth more or less than their original cost. The returns shown do not reflect taxes that a shareholder would pay on fund distributions or on the sale of fund shares.
Cumulative Performance: September 30, 2010, Through September 30, 2020
Initial Investment of $10,000
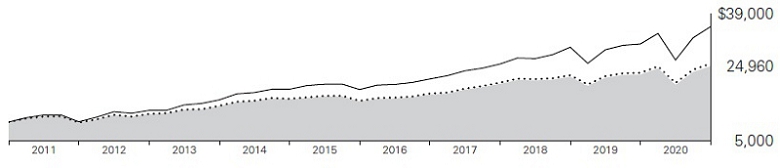
| Average Annual Total Returns | |||||
| Periods Ended September 30, 2020 | |||||
| Final Value | |||||
| One | Five | Ten | of a $10,000 | ||
| Year | Years | Years | Investment | ||
 | Target Retirement 2040 Fund | 9.96% | 9.97% | 9.58% | $24,960 |
 | Target 2040 Composite Index | 10.73 | 10.35 | 9.89 | 25,676 |
 | MSCI US Broad Market Index | 14.99 | 13.70 | 13.53 | 35,575 |
Target 2040 Composite Index: Derived by applying the fund’s target asset allocation to the results of the following benchmarks: for international stocks of developed markets, the MSCI EAFE Index through December 15, 2010, the MSCI ACWI ex USA IMI Index through June 2, 2013, and the FTSE Global All Cap ex US Index thereafter; for emerging-market stocks, the Select Emerging Markets Index through August 23, 2006, the MSCI Emerging Markets Index through December 15, 2010, the MSCI ACWI ex USA IMI Index through June 2, 2013, and the FTSE Global All Cap ex US Index thereafter; for U.S. bonds, the Bloomberg Barclays U.S. Aggregate Bond Index through December 31, 2009, and the Bloomberg Barclays U.S. Aggregate Float Adjusted Index thereafter; for international bonds, the Bloomberg Barclays Global Aggregate ex-USD Float Adjusted RIC Capped Index Hedged beginning June 3, 2013; and for U.S. stocks, the MSCI US Broad Market Index through June 2, 2013, and the CRSP US Total Market Index thereafter. International stock benchmark returns are adjusted for withholding taxes.
See Financial Highlights for dividend and capital gains information.
4
Target Retirement 2040 Fund
Underlying Vanguard Funds
As of September 30, 2020
| Vanguard Total Stock Market Index Fund Investor Shares | 49.7% |
| Vanguard Total International Stock Index Fund Investor Shares | 32.8 |
| Vanguard Total Bond Market II Index Fund Investor Shares | 12.2 |
| Vanguard Total International Bond Index Fund Investor Shares | 5.3 |
The table reflects the fund's investments, except for short-term investments and derivatives.
5
Target Retirement 2040 Fund
Financial Statements
Schedule of Investments
As of September 30, 2020
The fund files its complete schedule of portfolio holdings with the Securities and Exchange Commission (SEC) for the first and third quarters of each fiscal year as an exhibit to its reports on Form N-PORT. The fund’s Form N-PORT reports are available on the SEC’s website at www.sec.gov.
| Market | ||
| Value• | ||
| Shares | ($000) | |
| Investment Companies (99.2%) | ||
| U.S. Stock Fund (49.3%) | ||
| Vanguard Total Stock Market Index Fund Investor Shares | 192,668,270 | 15,976,053 |
| International Stock Fund (32.6%) | ||
| Vanguard Total International Stock Index Fund Investor Shares | 629,546,358 | 10,551,197 |
| U.S. Bond Fund (12.1%) | ||
| 1 Vanguard Total Bond Market II Index Fund Investor Shares | 341,014,544 | 3,935,308 |
| International Bond Fund (5.2%) | ||
| Vanguard Total International Bond Index Fund Investor Shares | 145,881,364 | 1,696,600 |
| Total Investment Companies (Cost $21,749,963) | 32,159,158 | |
| Temporary Cash Investment (0.8%) | ||
| Money Market Fund (0.8%) | ||
| 1 Vanguard Market Liquidity Fund, 0.117% (Cost $247,054) | 2,470,687 | 247,069 |
| Total Investments (100.0%) (Cost $21,997,017) | 32,406,227 | |
| Other Assets and Liabilities—Net (0.0%) | (1,845) | |
| Net Assets (100%) | 32,404,382 |
Cost is in $000.
| • | See Note A in Notes to Financial Statements. |
| 1 | Affiliated fund available only to Vanguard funds and certain trusts and accounts managed by Vanguard. Rate shown for Vanguard Market Liquidity Fund is the 7-day yield. |
6
Target Retirement 2040 Fund
| Derivative Financial Instruments Outstanding as of Period End |
| Futures Contracts |
| ($000) | ||||
| Value and | ||||
| Number of | Unrealized | |||
| Long (Short) | Notional | Appreciation | ||
| Expiration | Contracts | Amount | (Depreciation) | |
| Long Futures Contracts | ||||
| E-mini S&P 500 Index | December 2020 | 346 | 57,990 | 693 |
| 10-Year U.S. Treasury Note | December 2020 | 1,403 | 195,762 | 153 |
| 846 |
See accompanying Notes, which are an integral part of the Financial Statements.
7
Target Retirement 2040 Fund
Statement of Assets and Liabilities
As of September 30, 2020
| ($000s, except shares and per-share amounts) | Amount |
| Assets | |
| Investments in Securities, at Value—Affiliated Funds (Cost $21,997,017) | 32,406,227 |
| Cash Collateral Pledged—Futures Contracts | 3,840 |
| Receivables for Investment Securities Sold | 33,252 |
| Receivables for Accrued Income | 7,751 |
| Receivables for Capital Shares Issued | 38,600 |
| Variation Margin Receivable—Futures Contracts | 317 |
| Total Assets | 32,489,987 |
| Liabilities | |
| Payables for Investment Securities Purchased | 7,751 |
| Payables for Capital Shares Redeemed | 77,503 |
| Variation Margin Payable—Futures Contracts | 351 |
| Total Liabilities | 85,605 |
| Net Assets | 32,404,382 |
| At September 30, 2020, net assets consisted of: | |
| Paid-in Capital | 21,595,553 |
| Total Distributable Earnings (Loss) | 10,808,829 |
| Net Assets | 32,404,382 |
| Net Assets | |
| Applicable to 808,705,137 outstanding $.001 par value shares of beneficial interest (unlimited authorization) | 32,404,382 |
| Net Asset Value Per Share | $40.07 |
See accompanying Notes, which are an integral part of the Financial Statements.
8
Target Retirement 2040 Fund
Statement of Operations
| Year Ended | |
| September 30, 2020 | |
| ($000) | |
| Investment Income | |
| Income | |
| Income Distributions Received from Affiliated Funds | 641,731 |
| Other Income | 23 |
| Net Investment Income—Note B | 641,754 |
| Realized Net Gain (Loss) | |
| Capital Gain Distributions Received from Affiliated Funds | — |
| Affiliated Funds Sold | 41,012 |
| Futures Contracts | 9,242 |
| Realized Net Gain (Loss) | 50,254 |
| Change in Unrealized Appreciation (Depreciation) | |
| Affiliated Funds | 2,177,215 |
| Futures Contracts | 846 |
| Change in Unrealized Appreciation (Depreciation) | 2,178,061 |
| Net Increase (Decrease) in Net Assets Resulting from Operations | 2,870,069 |
See accompanying Notes, which are an integral part of the Financial Statements.
9
Target Retirement 2040 Fund
Statement of Changes in Net Assets
| Year Ended September 30, | ||
| 2020 | 2019 | |
| ($000) | ($000) | |
| Increase (Decrease) in Net Assets | ||
| Operations | ||
| Net Investment Income | 641,754 | 634,780 |
| Realized Net Gain (Loss) | 50,254 | (8,193) |
| Change in Unrealized Appreciation (Depreciation) | 2,178,061 | 137,697 |
| Net Increase (Decrease) in Net Assets Resulting from Operations | 2,870,069 | 764,284 |
| Distributions1 | ||
| Total Distributions | (701,833) | (599,639) |
| Capital Share Transactions | ||
| Issued | 6,050,667 | 5,852,726 |
| Issued in Lieu of Cash Distributions | 690,099 | 590,157 |
| Redeemed | (5,547,404) | (4,010,068) |
| Net Increase (Decrease) from Capital Share Transactions | 1,193,362 | 2,432,815 |
| Total Increase (Decrease) | 3,361,598 | 2,597,460 |
| Net Assets | ||
| Beginning of Period | 29,042,784 | 26,445,324 |
| End of Period | 32,404,382 | 29,042,784 |
1 Certain prior-period numbers have been reclassified to conform with the current-period presentation.
See accompanying Notes, which are an integral part of the Financial Statements.
10
Target Retirement 2040 Fund
Financial Highlights
| For a Share Outstanding | Year Ended September 30, | ||||
| Throughout Each Period | 2020 | 2019 | 2018 | 2017 | 2016 |
| Net Asset Value, Beginning of Period | $37.27 | $37.26 | $34.73 | $30.59 | $28.09 |
| Investment Operations | |||||
| Net Investment Income | .7991 | .8501 | .7861 | .7181 | .660 |
| Capital Gain Distributions Received | — | — | .0011 | .0031 | .003 |
| Net Realized and Unrealized Gain (Loss) on Investments | 2.892 | (.005) | 2.441 | 4.143 | 2.687 |
| Total from Investment Operations | 3.691 | .845 | 3.228 | 4.864 | 3.350 |
| Distributions | |||||
| Dividends from Net Investment Income | (.891) | (.779) | (.684) | (.599) | (.615) |
| Distributions from Realized Capital Gains | — | (.056) | (.014) | (.125) | (.235) |
| Total Distributions | (.891) | (.835) | (.698) | (.724) | (.850) |
| Net Asset Value, End of Period | $40.07 | $37.27 | $37.26 | $34.73 | $30.59 |
| Total Return2 | 9.96% | 2.63% | 9.37% | 16.26% | 12.11% |
| Ratios/Supplemental Data | |||||
| Net Assets, End of Period (Millions) | $32,404 | $29,043 | $26,445 | $22,324 | $17,371 |
| Ratio of Total Expenses to Average Net Assets | — | — | — | — | — |
| Acquired Fund Fees and Expenses | 0.14% | 0.14% | 0.14% | 0.15% | 0.16% |
| Ratio of Net Investment Income to Average Net Assets | 2.12% | 2.38% | 2.17% | 2.23% | 2.23% |
| Portfolio Turnover Rate | 13% | 5% | 8% | 8% | 16% |
| 1 | Calculated based on average shares outstanding. |
| 2 | Total returns do not include account service fees that may have applied in the periods shown. Fund prospectuses provide information about any applicable account service fees. |
See accompanying Notes, which are an integral part of the Financial Statements.
11
Target Retirement 2040 Fund
Notes to Financial Statements
Vanguard Target Retirement 2040 Fund is registered under the Investment Company Act of 1940 as an open-end investment company, or mutual fund. The fund follows a balanced investment strategy by investing in selected Vanguard funds to achieve its targeted allocation of assets to U.S. and international stocks, and U.S. and international bonds. Financial statements and other information about each underlying fund are available at www.vanguard.com.
Market disruptions associated with the COVID-19 pandemic have had a global impact, and uncertainty exists as to the long-term implications. Such disruptions can adversely affect assets of the fund and thus fund performance.
A. The following significant accounting policies conform to generally accepted accounting principles for U.S. investment companies. The fund consistently follows such policies in preparing its financial statements.
1. Security Valuation: Investments are valued at the net asset value of each underlying Vanguard fund determined as of the close of the New York Stock Exchange (generally 4 p.m., Eastern time) on the valuation date.
2. Futures Contracts: The fund uses stock and bond futures contracts to a limited extent, with the objectives of maintaining full exposure to the market and maintaining its target asset allocation. The primary risks associated with the use of futures contracts are imperfect correlation between changes in market values of investments held by the fund and the prices of futures contracts, and the possibility of an illiquid market. Counterparty risk involving futures is mitigated because a regulated clearinghouse is the counterparty instead of the clearing broker. To further mitigate counterparty risk, the fund trades futures contracts on an exchange, monitors the financial strength of its clearing brokers and clearinghouse, and has entered into clearing agreements with its clearing brokers. The clearinghouse imposes initial margin requirements to secure the fund’s performance and requires daily settlement of variation margin representing changes in the market value of each contract. Any securities pledged as initial margin for open contracts are noted in the Schedule of Investments.
Futures contracts are valued at their quoted daily settlement prices. The notional amounts of the contracts are not recorded in the Statement of Assets and Liabilities. Fluctuations in the value of the contracts are recorded in the Statement of Assets and Liabilities as an asset (liability) and in the Statement of Operations as unrealized appreciation (depreciation) until the contracts are closed, when they are recorded as realized gains (losses) on futures contracts.
During the year ended September 30, 2020, the fund’s average investments in long and short futures contracts represented less than 1% and 0% of net assets, respectively, based on the average of the notional amounts at each quarter-end during the period.
3. Federal Income Taxes: The fund intends to continue to qualify as a regulated investment company and distribute all of its taxable income. The fund’s tax returns are open to examination by the relevant tax authorities until expiration of the applicable statute of limitations, which is generally three years after the filing of the tax return. Management has analyzed the fund’s tax positions taken for all open federal and state income tax years, and has concluded that no provision for income tax is required in the fund’s financial statements.
4. Distributions: Distributions to shareholders are recorded on the ex-dividend date. Distributions are determined on a tax basis at the fiscal year-end and may differ from net investment income and realized capital gains for financial reporting purposes.
12
Target Retirement 2040 Fund
5. Credit Facilities and Interfund Lending Program: The fund and certain other funds managed by The Vanguard Group (“Vanguard”) participate in a $4.3 billion committed credit facility provided by a syndicate of lenders pursuant to a credit agreement and an uncommitted credit facility provided by Vanguard. Both facilities may be renewed annually. Each fund is individually liable for its borrowings, if any, under the credit facilities. Borrowings may be utilized for temporary or emergency purposes, subject to the fund’s regulatory and contractual borrowing restrictions. With respect to the committed credit facility, the participating funds are charged administrative fees and an annual commitment fee of 0.10% of the undrawn committed amount of the facility; these fees are allocated to the funds based on a method approved by the fund’s board of trustees and borne by the funds in which the fund invests (see Note B). Any borrowings under either facility bear interest at a rate based upon the higher of the one-month London Interbank Offered Rate (or an acceptable alternate rate, if necessary), federal funds effective rate, or overnight bank funding rate plus an agreed-upon spread, except that borrowings under the uncommitted credit facility may bear interest based upon an alternative rate agreed to by the fund and Vanguard.
In accordance with an exemptive order (the “Order”) from the SEC, the fund may participate in a joint lending and borrowing program that allows registered open-end Vanguard funds to borrow money from and lend money to each other for temporary or emergency purposes (the “Interfund Lending Program”), subject to compliance with the terms and conditions of the Order, and to the extent permitted by the fund’s investment objective and investment policies. Interfund loans and borrowings normally extend overnight, but can have a maximum duration of seven days. Loans may be called on one business day’s notice. The interest rate to be charged is governed by the conditions of the Order and internal procedures adopted by the board of trustees. The board of trustees is responsible for overseeing the Interfund Lending Program.
For the year ended September 30, 2020, the fund did not utilize the credit facilities or the Interfund Lending Program.
6. Other: Income and capital gain distributions received are recorded on the ex-dividend date. Security transactions are accounted for on the date securities are bought or sold. Costs used to determine realized gains (losses) on the sale of investment securities are those of the specific securities sold.
B. In accordance with the terms of a Funds’ Service Agreement (the “FSA”) between Vanguard and the fund, Vanguard furnishes to the fund investment advisory, corporate management, administrative, marketing, and distribution services at Vanguard’s cost of operations (as defined by the FSA). These costs of operations are allocated to the fund based on methods and guidelines approved by the board of trustees. The FSA provides that expenses otherwise allocable to Vanguard funds-of-funds may be reduced or eliminated to the extent of savings realized by the underlying Vanguard funds by virtue of being part of a fund-of-funds. Accordingly, all expenses for services provided by Vanguard to the fund and all other expenses incurred by the fund during the period ended September 30, 2020, were borne by the underlying Vanguard funds in which the fund invests. The fund’s trustees and officers are also trustees and officers, respectively, of the underlying Vanguard funds, as well as directors and employees, respectively, of Vanguard.
13
Target Retirement 2040 Fund
C. Various inputs may be used to determine the value of the fund’s investments and derivatives. These inputs are summarized in three broad levels for financial statement purposes. The inputs or methodologies used to value securities are not necessarily an indication of the risk associated with investing in those securities.
Level 1—Quoted prices in active markets for identical securities.
Level 2—Other significant observable inputs (including quoted prices for similar securities, interest rates, prepayment speeds, credit risk, etc.).
Level 3—Significant unobservable inputs (including the fund’s own assumptions used to determine the fair value of investments). Any investments and derivatives valued with significant unobservable inputs are noted on the Schedule of Investments.
At September 30, 2020, 100% of the market value of the fund’s investments and derivatives was determined based on Level 1 inputs.
D. Permanent differences between book-basis and tax-basis components of net assets are reclassified among capital accounts in the financial statements to reflect their tax character. These reclassifications have no effect on net assets or net asset value per share. As of period end, permanent differences primarily attributable to the accounting for distributions in connection with fund share redemptions were reclassified between the following accounts:
| Amount | |
| ($000) | |
| Paid-in Capital | 15,337 |
| Total Distributable Earnings (Loss) | (15,337) |
Temporary differences between book-basis and tax-basis components of total distributable earnings (loss) arise when certain items of income, gain, or loss are recognized in different periods for financial statement and tax purposes; these differences will reverse at some time in the future. The differences are primarily related to the deferral of losses from wash sales and the recognition of unrealized gains or losses from certain derivative contracts. As of period end, the tax-basis components of total distributable earnings (loss) are detailed in the table as follows:
| Amount | |
| ($000) | |
| Undistributed Ordinary Income | 394,263 |
| Undistributed Long-Term Gains | 5,356 |
| Capital Loss Carryforwards | — |
| Qualified Late-Year Losses | — |
| Net Unrealized Gains (Losses) | 10,409,210 |
14
Target Retirement 2040 Fund
The tax character of distributions paid was as follows:
| Year Ended September 30, | ||
| 2020 | 2019 | |
| Amount | Amount | |
| ($000) | ($000) | |
| Ordinary Income* | 701,833 | 599,053 |
| Long-Term Capital Gains | — | 586 |
| Total | 701,833 | 599,639 |
* Includes short-term capital gains, if any.
As of September 30, 2020, gross unrealized appreciation and depreciation for investments and derivatives based on cost for U.S. federal income tax purposes were as follows:
| Amount | |
| ($000) | |
| Tax Cost | 21,997,017 |
| Gross Unrealized Appreciation | 10,486,330 |
| Gross Unrealized Depreciation | (77,120) |
| Net Unrealized Appreciation (Depreciation) | 10,409,210 |
E. Capital shares issued and redeemed were:
| Year Ended September 30, | ||
| 2020 | 2019 | |
| Shares | Shares | |
| (000) | (000) | |
| Issued | 161,302 | 164,515 |
| Issued in Lieu of Cash Distributions | 17,596 | 18,379 |
| Redeemed | (149,436) | (113,431) |
| Net Increase (Decrease) in Shares Outstanding | 29,462 | 69,463 |
15
Target Retirement 2040 Fund
F. Transactions during the period in affiliated underlying Vanguard funds were as follows:
| Current Period Transactions | |||||||||
| Sept. 30, | Proceeds | Realized | Sept. 30, | ||||||
| 2019 | from | Net | Change in | Capital Gain | 2020 | ||||
| Market | Purchases | Securities | Gain | Unrealized | Distributions | Market | |||
| Value | at Cost | Sold | (Loss) | App. (Dep.) | Income | Received | Value | ||
| ($000) | ($000) | ($000) | ($000) | ($000) | ($000) | ($000) | ($000) | ||
| Vanguard Market Liquidity Fund | 9,867 | NA1 | NA1 | (52) | 15 | 375 | — | 247,069 | |
| Vanguard Total Bond Market ETF2 | — | 5,244 | 5,250 | 6 | — | — | — | — | |
| Vanguard Total Bond Market II Index Fund | 3,396,422 | 1,753,980 | 1,365,950 | 31,293 | 119,563 | 84,643 | — | 3,935,308 | |
| Vanguard Total International Bond Index Fund | 1,444,631 | 576,877 | 307,284 | (2,040) | (15,584) | 47,671 | — | 1,696,600 | |
| Vanguard Total International Stock Index Fund | 9,672,231 | 1,179,889 | 505,954 | (41,404) | 246,435 | 249,510 | — | 10,551,197 | |
| Vanguard Total Stock Market Index Fund | 14,559,106 | 1,254,357 | 1,717,405 | 53,209 | 1,826,786 | 259,532 | — | 15,976,053 | |
| Total | 29,082,257 | 4,770,347 | 3,901,843 | 41,012 | 2,117,215 | 641,731 | — | 32,406,227 | |
1 Not applicable—purchases and sales are for temporary cash investment purposes.
2 The fund invested in ETF Shares during the period, but sold the positions before period end.
G. Management has determined that no events or transactions occurred subsequent to September 30, 2020, that would require recognition or disclosure in these financial statements.
16
Target Retirement 2045 Fund
Performance Summary
All of the returns in this report represent past performance, which is not a guarantee of future results that may be achieved by the fund. (Current performance may be lower or higher than the performance data cited. For performance data current to the most recent month-end, visit our website at vanguard.com/performance.) Note, too, that both investment returns and principal value can fluctuate widely, so an investor’s shares, when sold, could be worth more or less than their original cost. The returns shown do not reflect taxes that a shareholder would pay on fund distributions or on the sale of fund shares.
Cumulative Performance: September 30, 2010, Through September 30, 2020
Initial Investment of $10,000
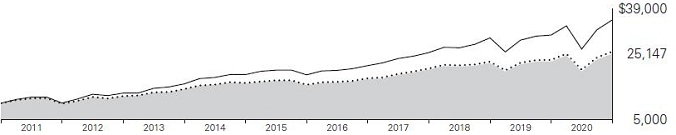
| Average Annual Total Returns | |||||
| Periods Ended September 30, 2020 | |||||
| Final Value | |||||
| One | Five | Ten | of a $10,000 | ||
| Year | Years | Years | Investment | ||
 | Target Retirement 2045 Fund | 10.27% | 10.13% | 9.66% | $25,147 |
 | Target 2045 Composite Index | 10.95 | 10.50 | 9.96 | 25,844 |
 | MSCI US Broad Market Index | 14.99 | 13.70 | 13.53 | 35,575 |
Target 2045 Composite Index: Derived by applying the fund’s target asset allocation to the results of the following benchmarks: for international stocks of developed markets, the MSCI EAFE Index through December 15, 2010, the MSCI ACWI ex USA IMI Index through June 2, 2013, and the FTSE Global All Cap ex US Index thereafter; for emerging-market stocks, the Select Emerging Markets Index through August 23, 2006, the MSCI Emerging Markets Index through December 15, 2010, the MSCI ACWI ex USA IMI Index through June 2, 2013, and the FTSE Global All Cap ex US Index thereafter; for U.S. bonds, the Bloomberg Barclays U.S. Aggregate Bond Index through December 31, 2009, and the Bloomberg Barclays U.S. Aggregate Float Adjusted Index thereafter; for international bonds, the Bloomberg Barclays Global Aggregate ex-USD Float Adjusted RIC Capped Index Hedged beginning June 3, 2013; and for U.S. stocks, the Dow Jones U.S. Total Stock Market Index (formerly known as the Dow Jones Wilshire 5000 Index) through April 22, 2005, the MSCI US Broad Market Index through June 2, 2013, and the CRSP US Total Market Index thereafter. International stock benchmark returns are adjusted for withholding taxes.
See Financial Highlights for dividend and capital gains information.
17
Target Retirement 2045 Fund
Underlying Vanguard Funds
As of September 30, 2020
| Vanguard Total Stock Market Index Fund Investor Shares | 54.5% |
| Vanguard Total International Stock Index Fund Investor Shares | 36.1 |
| Vanguard Total Bond Market II Index Fund Investor Shares | 6.3 |
| Vanguard Total International Bond Index Fund Investor Shares | 3.1 |
The table reflects the fund's investments, except for short-term investments and derivatives.
18
Target Retirement 2045 Fund
Financial Statements
Schedule of Investments
As of September 30, 2020
The fund files its complete schedule of portfolio holdings with the Securities and Exchange Commission (SEC) for the first and third quarters of each fiscal year as an exhibit to its reports on Form N-PORT. The fund’s Form N-PORT reports are available on the SEC’s website at www.sec.gov.
| Market | ||
| Value• | ||
| Shares | ($000) | |
| Investment Companies (98.7%) | ||
| U.S. Stock Fund (53.8%) | ||
| Vanguard Total Stock Market Index Fund Investor Shares | 195,890,890 | 16,243,273 |
| International Stock Fund (35.7%) | ||
| Vanguard Total International Stock Index Fund Investor Shares | 642,980,692 | 10,776,357 |
| U.S. Bond Fund (6.2%) | ||
| 1 Vanguard Total Bond Market II Index Fund Investor Shares | 163,607,196 | 1,888,027 |
| International Bond Fund (3.0%) | ||
| Vanguard Total International Bond Index Fund Investor Shares | 79,153,765 | 920,558 |
| Total Investment Companies (Cost $19,900,819) | 29,828,215 | |
| Temporary Cash Investment (1.3%) | ||
| Money Market Fund (1.3%) | ||
| 1 Vanguard Market Liquidity Fund, 0.117% (Cost $381,062) | 3,810,762 | 381,076 |
| Total Investments (100.0%) (Cost $20,281,881) | 30,209,291 | |
| Other Assets and Liabilities—Net (0.0%) | (3,897) | |
| Net Assets (100%) | 30,205,394 |
Cost is in $000.
| • | See Note A in Notes to Financial Statements. | |
| 1 | Affiliated fund available only to Vanguard funds and certain trusts and accounts managed by Vanguard. Rate shown for Vanguard Market Liquidity Fund is the 7-day yield. |
19
Target Retirement 2045 Fund
Derivative Financial Instruments Outstanding as of Period End
Futures Contracts
| ($000) | |||||
| Value and | |||||
| Number of | Unrealized | ||||
| Long (Short) | Notional | Appreciation | |||
| Expiration | Contracts | Amount | (Depreciation) | ||
| Long Futures Contracts | |||||
| 10-Year U.S. Treasury Note | December 2020 | 2,209 | 308,225 | 225 | |
| E-mini S&P 500 Index | December 2020 | 537 | 90,001 | 944 | |
| 1,169 | |||||
See accompanying Notes, which are an integral part of the Financial Statements.
20
Target Retirement 2045 Fund
Statement of Assets and Liabilities
As of September 30, 2020
| ($000s, except shares and per-share amounts) | Amount |
| Assets | |
| Investments in Securities, at Value—Affiliated Funds (Cost $20,281,881) | 30,209,291 |
| Cash Collateral Pledged—Futures Contracts | 5,970 |
| Receivables for Investment Securities Sold | 33,896 |
| Receivables for Accrued Income | 3,803 |
| Receivables for Capital Shares Issued | 26,993 |
| Variation Margin Receivable—Futures Contracts | 491 |
| Total Assets | 30,280,444 |
| Liabilities | |
| Payables for Investment Securities Purchased | 3,803 |
| Payables for Capital Shares Redeemed | 70,716 |
| Variation Margin Payable—Futures Contracts | 531 |
| Total Liabilities | 75,050 |
| Net Assets | 30,205,394 |
| At September 30, 2020, net assets consisted of: | |
| Paid-in Capital | 19,894,540 |
| Total Distributable Earnings (Loss) | 10,310,854 |
| Net Assets | 30,205,394 |
| Net Assets | |
| Applicable to 1,197,796,831 outstanding $.001 par value shares of beneficial interest (unlimited authorization) | 30,205,394 |
| Net Asset Value Per Share | $25.22 |
See accompanying Notes, which are an integral part of the Financial Statements.
21
Target Retirement 2045 Fund
Statement of Operations
| Year Ended | |
| September 30, 2020 | |
| ($000) | |
| Investment Income | |
| Income | |
| Income Distributions Received from Affiliated Funds | 581,173 |
| Other Income | 14 |
| Net Investment Income—Note B | 581,187 |
| Realized Net Gain (Loss) | |
| Capital Gain Distributions Received from Affiliated Funds | — |
| Affiliated Funds Sold | 44,609 |
| Futures Contracts | 18,904 |
| Realized Net Gain (Loss) | 63,513 |
| Change in Unrealized Appreciation (Depreciation) | |
| Affiliated Funds | 2,122,328 |
| Futures Contracts | 1,169 |
| Change in Unrealized Appreciation (Depreciation) | 2,123,497 |
| Net Increase (Decrease) in Net Assets Resulting from Operations | 2,768,197 |
See accompanying Notes, which are an integral part of the Financial Statements.
22
Target Retirement 2045 Fund
Statement of Changes in Net Assets
| Year Ended September 30, | ||
| 2020 | 2019 | |
| ($000) | ($000) | |
| Increase (Decrease) in Net Assets | ||
| Operations | ||
| Net Investment Income | 581,187 | 575,372 |
| Realized Net Gain (Loss) | 63,513 | (5,828) |
| Change in Unrealized Appreciation (Depreciation) | 2,123,497 | 5,053 |
| Net Increase (Decrease) in Net Assets Resulting from Operations | 2,768,197 | 574,597 |
| Distributions1 | ||
| Total Distributions | (636,663) | (535,587) |
| Capital Share Transactions | ||
| Issued | 5,359,364 | 5,288,388 |
| Issued in Lieu of Cash Distributions | 626,488 | 527,209 |
| Redeemed | (4,581,926) | (3,514,240) |
| Net Increase (Decrease) from Capital Share Transactions | 1,403,926 | 2,301,357 |
| Total Increase (Decrease) | 3,535,460 | 2,340,367 |
| Net Assets | ||
| Beginning of Period | 26,669,934 | 24,329,567 |
| End of Period | 30,205,394 | 26,669,934 |
1 Certain prior-period numbers have been reclassified to conform with the current-period presentation.
See accompanying Notes, which are an integral part of the Financial Statements.
23
Target Retirement 2045 Fund
Financial Highlights
| For a Share Outstanding | Year Ended September 30, | ||||
| Throughout Each Period | 2020 | 2019 | 2018 | 2017 | 2016 |
| Net Asset Value, Beginning of Period | $23.38 | $23.49 | $21.80 | $19.12 | $17.60 |
| Investment Operations | |||||
| Net Investment Income | .4921 | .5271 | .4921 | .4501 | .411 |
| Capital Gain Distributions Received | — | — | — | .0011 | .002 |
| Net Realized and Unrealized Gain (Loss) on Investments | 1.900 | (.128) | 1.636 | 2.696 | 1.692 |
| Total from Investment Operations | 2.392 | .399 | 2.128 | 3.147 | 2.105 |
| Distributions | |||||
| Dividends from Net Investment Income | (.552) | (.483) | (.428) | (.375) | (.386) |
| Distributions from Realized Capital Gains | — | (.026) | (.010) | (.092) | (.199) |
| Total Distributions | (.552) | (.509) | (.438) | (.467) | (.585) |
| Net Asset Value, End of Period | $25.22 | $23.38 | $23.49 | $21.80 | $19.12 |
| Total Return2 | 10.27% | 2.06% | 9.85% | 16.84% | 12.16% |
| Ratios/Supplemental Data | |||||
| Net Assets, End of Period (Millions) | $30,205 | $26,670 | $24,330 | $20,413 | $15,987 |
| Ratio of Total Expenses to Average Net Assets | — | — | — | — | — |
| Acquired Fund Fees and Expenses | 0.15% | 0.15% | 0.15% | 0.15% | 0.16% |
| Ratio of Net Investment Income to Average Net Assets | 2.08% | 2.35% | 2.16% | 2.23% | 2.43% |
| Portfolio Turnover Rate | 9% | 4% | 7% | 8% | 13% |
| 1 | Calculated based on average shares outstanding. | |
| 2 | Total returns do not include account service fees that may have applied in the periods shown. Fund prospectuses provide information about any applicable account service fees. |
See accompanying Notes, which are an integral part of the Financial Statements.
24
Target Retirement 2045 Fund
Notes to Financial Statements
Vanguard Target Retirement 2045 Fund is registered under the Investment Company Act of 1940 as an open-end investment company, or mutual fund. The fund follows a balanced investment strategy by investing in selected Vanguard funds to achieve its targeted allocation of assets to U.S. and international stocks, and U.S. and international bonds. Financial statements and other information about each underlying fund are available at www.vanguard.com.
Market disruptions associated with the COVID-19 pandemic have had a global impact, and uncertainty exists as to the long-term implications. Such disruptions can adversely affect assets of the fund and thus fund performance.
A. The following significant accounting policies conform to generally accepted accounting principles for U.S. investment companies. The fund consistently follows such policies in preparing its financial statements.
1. Security Valuation: Investments are valued at the net asset value of each underlying Vanguard fund determined as of the close of the New York Stock Exchange (generally 4 p.m., Eastern time) on the valuation date.
2. Futures Contracts: The fund uses stock and bond futures contracts to a limited extent, with the objectives of maintaining full exposure to the market and maintaining its target asset allocation. The primary risks associated with the use of futures contracts are imperfect correlation between changes in market values of investments held by the fund and the prices of futures contracts, and the possibility of an illiquid market. Counterparty risk involving futures is mitigated because a regulated clearinghouse is the counterparty instead of the clearing broker. To further mitigate counterparty risk, the fund trades futures contracts on an exchange, monitors the financial strength of its clearing brokers and clearinghouse, and has entered into clearing agreements with its clearing brokers. The clearinghouse imposes initial margin requirements to secure the fund’s performance and requires daily settlement of variation margin representing changes in the market value of each contract. Any securities pledged as initial margin for open contracts are noted in the Schedule of Investments.
Futures contracts are valued at their quoted daily settlement prices. The notional amounts of the contracts are not recorded in the Statement of Assets and Liabilities. Fluctuations in the value of the contracts are recorded in the Statement of Assets and Liabilities as an asset (liability) and in the Statement of Operations as unrealized appreciation (depreciation) until the contracts are closed, when they are recorded as realized gains (losses) on futures contracts.
During the year ended September 30, 2020, the fund’s average investments in long and short futures contracts represented less than 1% and 0% of net assets, respectively, based on the average of the notional amounts at each quarter-end during the period.
3. Federal Income Taxes: The fund intends to continue to qualify as a regulated investment company and distribute all of its taxable income. The fund’s tax returns are open to examination by the relevant tax authorities until expiration of the applicable statute of limitations, which is generally three years after the filing of the tax return. Management has analyzed the fund’s tax positions taken for all open federal and state income tax years, and has concluded that no provision for income tax is required in the fund’s financial statements.
4. Distributions: Distributions to shareholders are recorded on the ex-dividend date. Distributions are determined on a tax basis at the fiscal year-end and may differ from net investment income and realized capital gains for financial reporting purposes.
25
Target Retirement 2045 Fund
5. Credit Facilities and Interfund Lending Program: The fund and certain other funds managed by The Vanguard Group (“Vanguard”) participate in a $4.3 billion committed credit facility provided by a syndicate of lenders pursuant to a credit agreement and an uncommitted credit facility provided by Vanguard. Both facilities may be renewed annually. Each fund is individually liable for its borrowings, if any, under the credit facilities. Borrowings may be utilized for temporary or emergency purposes, subject to the fund’s regulatory and contractual borrowing restrictions. With respect to the committed credit facility, the participating funds are charged administrative fees and an annual commitment fee of 0.10% of the undrawn committed amount of the facility; these fees are allocated to the funds based on a method approved by the fund’s board of trustees and borne by the funds in which the fund invests (see Note B). Any borrowings under either facility bear interest at a rate based upon the higher of the one-month London Interbank Offered Rate (or an acceptable alternate rate, if necessary), federal funds effective rate, or overnight bank funding rate plus an agreed-upon spread, except that borrowings under the uncommitted credit facility may bear interest based upon an alternative rate agreed to by the fund and Vanguard.
In accordance with an exemptive order (the “Order”) from the SEC, the fund may participate in a joint lending and borrowing program that allows registered open-end Vanguard funds to borrow money from and lend money to each other for temporary or emergency purposes (the “Interfund Lending Program”), subject to compliance with the terms and conditions of the Order, and to the extent permitted by the fund’s investment objective and investment policies. Interfund loans and borrowings normally extend overnight, but can have a maximum duration of seven days. Loans may be called on one business day’s notice. The interest rate to be charged is governed by the conditions of the Order and internal procedures adopted by the board of trustees. The board of trustees is responsible for overseeing the Interfund Lending Program.
For the year ended September 30, 2020, the fund did not utilize the credit facilities or the Interfund Lending Program.
6. Other: Income and capital gain distributions received are recorded on the ex-dividend date. Security transactions are accounted for on the date securities are bought or sold. Costs used to determine realized gains (losses) on the sale of investment securities are those of the specific securities sold.
B. In accordance with the terms of a Funds’ Service Agreement (the “FSA”) between Vanguard and the fund, Vanguard furnishes to the fund investment advisory, corporate management, administrative, marketing, and distribution services at Vanguard’s cost of operations (as defined by the FSA). These costs of operations are allocated to the fund based on methods and guidelines approved by the board of trustees. The FSA provides that expenses otherwise allocable to Vanguard funds-of-funds may be reduced or eliminated to the extent of savings realized by the underlying Vanguard funds by virtue of being part of a fund-of-funds. Accordingly, all expenses for services provided by Vanguard to the fund and all other expenses incurred by the fund during the period ended September 30, 2020, were borne by the underlying Vanguard funds in which the fund invests. The fund’s trustees and officers are also trustees and officers, respectively, of the underlying Vanguard funds, as well as directors and employees, respectively, of Vanguard.
26
Target Retirement 2045 Fund
C. Various inputs may be used to determine the value of the fund’s investments and derivatives. These inputs are summarized in three broad levels for financial statement purposes. The inputs or methodologies used to value securities are not necessarily an indication of the risk associated with investing in those securities.
Level 1—Quoted prices in active markets for identical securities.
Level 2—Other significant observable inputs (including quoted prices for similar securities, interest rates, prepayment speeds, credit risk, etc.).
Level 3—Significant unobservable inputs (including the fund’s own assumptions used to determine the fair value of investments). Any investments and derivatives valued with significant unobservable inputs are noted on the Schedule of Investments.
At September 30, 2020, 100% of the market value of the fund’s investments and derivatives was determined based on Level 1 inputs.
D. Permanent differences between book-basis and tax-basis components of net assets are reclassified among capital accounts in the financial statements to reflect their tax character. These reclassifications have no effect on net assets or net asset value per share. As of period end, permanent differences primarily attributable to the accounting for distributions in connection with fund share redemptions were reclassified between the following accounts:
| Amount | |
| ($000) | |
| Paid-in Capital | 13,326 |
| Total Distributable Earnings (Loss) | (13,326) |
Temporary differences between book-basis and tax-basis components of total distributable earnings (loss) arise when certain items of income, gain, or loss are recognized in different periods for financial statement and tax purposes; these differences will reverse at some time in the future. The differences are primarily related to the deferral of losses from wash sales and the recognition of unrealized gains or losses from certain derivative contracts. As of period end, the tax-basis components of total distributable earnings (loss) are detailed in the table as follows:
| Amount | |
| ($000) | |
| Undistributed Ordinary Income | 370,023 |
| Undistributed Long-Term Gains | 13,421 |
| Capital Loss Carryforwards | — |
| Qualified Late-Year Losses | — |
| Net Unrealized Gains (Losses) | 9,927,410 |
27
Target Retirement 2045 Fund
The tax character of distributions paid was as follows:
| Year Ended September 30, | |||
| 2020 | 2019 | ||
| Amount | Amount | ||
| ($000) | ($000) | ||
| Ordinary Income* | 636,663 | 535,205 | |
| Long-Term Capital Gains | — | 382 | |
| Total | 636,663 | 535,587 | |
* Includes short-term capital gains, if any.
As of September 30, 2020, gross unrealized appreciation and depreciation for investments and derivatives based on cost for U.S. federal income tax purposes were as follows:
| Amount | |
| ($000) | |
| Tax Cost | 20,281,881 |
| Gross Unrealized Appreciation | 10,047,728 |
| Gross Unrealized Depreciation | (120,318) |
| Net Unrealized Appreciation (Depreciation) | 9,927,410 |
E. Capital shares issued and redeemed were:
| Year Ended September 30, | |||
| 2020 | 2019 | ||
| Shares | Shares | ||
| (000) | (000) | ||
| Issued | 228,288 | 236,957 | |
| Issued in Lieu of Cash Distributions | 25,292 | 26,255 | |
| Redeemed | (196,369) | (158,490) | |
| Net Increase (Decrease) in Shares Outstanding | 57,211 | 104,722 | |
28
Target Retirement 2045 Fund
F. Transactions during the period in affiliated underlying Vanguard funds were as follows:
| Current Period Transactions | ||||||||
| Sept. 30, | Proceeds | Realized | Sept. 30, | |||||
| 2019 | from | Net | Change in | Capital Gain | 2020 | |||
| Market | Purchases | Securities | Gain | Unrealized | Distributions | Market | ||
| Value | at Cost | Sold | (Loss) | App. (Dep.) | Income | Received | Value | |
| ($000) | ($000) | ($000) | ($000) | ($000) | ($000) | ($000) | ($000) | |
| Vanguard Market Liquidity Fund | 12,586 | NA1 | NA1 | (73) | 14 | 382 | — | 381,076 |
| Vanguard Total Bond Market II Index Fund | 1,907,023 | 810,618 | 905,311 | 21,314 | 54,383 | 44,416 | — | 1,888,027 |
| Vanguard Total International Bond Index Fund | 807,216 | 305,136 | 180,737 | 661 | (11,718) | 26,319 | — | 920,558 |
| Vanguard Total International Stock Index Fund | 9,583,046 | 1,327,354 | 335,357 | (9,177) | 210,491 | 250,734 | — | 10,776,357 |
| Vanguard Total Stock Market Index Fund | 14,386,873 | 1,001,767 | 1,046,409 | 31,884 | 1,869,158 | 259,322 | — | 16,243,273 |
| Total | 26,696,744 | 3,444,875 | 2,467,814 | 44,609 | 2,122,328 | 581,173 | — | 30,209,291 |
1 Not applicable—purchases and sales are for temporary cash investment purposes.
G. Management has determined that no events or transactions occurred subsequent to September 30, 2020, that would require recognition or disclosure in these financial statements.
29
Target Retirement 2050 Fund
Performance Summary
All of the returns in this report represent past performance, which is not a guarantee of future results that may be achieved by the fund. (Current performance may be lower or higher than the performance data cited. For performance data current to the most recent month-end, visit our website at vanguard.com/performance.) Note, too, that both investment returns and principal value can fluctuate widely, so an investor’s shares, when sold, could be worth more or less than their original cost. The returns shown do not reflect taxes that a shareholder would pay on fund distributions or on the sale of fund shares.
Cumulative Performance: September 30, 2010, Through September 30, 2020
Initial Investment of $10,000
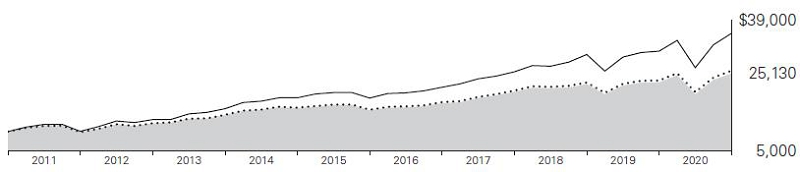
| Average Annual Total Returns | |||||
| Periods Ended September 30, 2020 | |||||
| Final Value | |||||
| One | Five | Ten | of a $10,000 | ||
| Year | Years | Years | Investment | ||
 | Target Retirement 2050 Fund | 10.26% | 10.13% | 9.65% | $25,130 |
 | Target 2050 Composite Index | 10.97 | 10.50 | 9.96 | 25,850 |
 | MSCI US Broad Market Index | 14.99 | 13.70 | 13.53 | 35,575 |
Target 2050 Composite Index: Derived by applying the fund’s target asset allocation to the results of the following benchmarks: for international stocks of developed markets, the MSCI EAFE Index through December 15, 2010, the MSCI ACWI ex USA IMI Index through June 2, 2013, and the FTSE Global All Cap ex US Index thereafter; for emerging-market stocks, the Select Emerging Markets Index through August 23, 2006, the MSCI Emerging Markets Index through December 15, 2010, the MSCI ACWI ex USA IMI Index through June 2, 2013, and the FTSE Global All Cap ex US Index thereafter; for U.S. bonds, the Bloomberg Barclays U.S. Aggregate Bond Index through December 31, 2009, and the Bloomberg Barclays U.S. Aggregate Float Adjusted Index thereafter; for international bonds, the Bloomberg Barclays Global Aggregate ex-USD Float Adjusted RIC Capped Index Hedged beginning June 3, 2013; and for U.S. stocks, the MSCI US Broad Market Index through June 2, 2013, and the CRSP US Total Market Index thereafter. International stock benchmark returns are adjusted for withholding taxes.
See Financial Highlights for dividend and capital gains information.
30
Target Retirement 2050 Fund
Underlying Vanguard Funds
As of September 30, 2020
| Vanguard Total Stock Market Index Fund Investor Shares | 54.5% |
| Vanguard Total International Stock Index Fund Investor Shares | 36.3 |
| Vanguard Total Bond Market II Index Fund Investor Shares | 6.2 |
| Vanguard Total International Bond Index Fund Investor Shares | 3.0 |
The table reflects the fund's investments, except for short-term investments and derivatives.
31
Target Retirement 2050 Fund
Financial Statements
Schedule of Investments
As of September 30, 2020
The fund files its complete schedule of portfolio holdings with the Securities and Exchange Commission (SEC) for the first and third quarters of each fiscal year as an exhibit to its reports on Form N-PORT. The fund’s Form N-PORT reports are available on the SEC’s website at www.sec.gov.
| Market | ||
| Value• | ||
| Shares | ($000) | |
| Investment Companies (98.4%) | ||
| U.S. Stock Fund (53.6%) | ||
| Vanguard Total Stock Market Index Fund Investor Shares | 148,607,617 | 12,322,544 |
| International Stock Fund (35.8%) | ||
| Vanguard Total International Stock Index Fund Investor Shares | 490,254,504 | 8,216,665 |
| U.S. Bond Fund (6.1%) | ||
| 1 Vanguard Total Bond Market II Index Fund Investor Shares | 121,144,737 | 1,398,010 |
| International Bond Fund (2.9%) | ||
| Vanguard Total International Bond Index Fund Investor Shares | 57,431,213 | 667,925 |
| Total Investment Companies (Cost $16,449,177) | 22,605,144 | |
| Temporary Cash Investment (1.6%) | ||
| Money Market Fund (1.6%) | ||
| 1 Vanguard Market Liquidity Fund, 0.117% (Cost $372,742) | 3,727,649 | 372,765 |
| Total Investments (100.0%) (Cost $16,821,919) | 22,977,909 | |
| Other Assets and Liabilities — Net (0.0%) | 736 | |
| Net Assets (100%) | 22,978,645 |
Cost is in $000.
• See Note A in Notes to Financial Statements.
1 Affiliated fund available only to Vanguard funds and certain trusts and accounts managed by Vanguard. Rate shown for Vanguard
Market Liquidity Fund is the 7-day yield.
32
Target Retirement 2050 Fund
Derivative Financial Instruments Outstanding as of Period End
Futures Contracts
| ($000) | ||||||
| Value and | ||||||
| Number of | Unrealized | |||||
| Long (Short) | Notional | Appreciation | ||||
| Expiration | Contracts | Amount | (Depreciation) | |||
| Long Futures Contracts | ||||||
| E-mini S&P 500 Index | December 2020 | 816 | 136,762 | 1,341 | ||
| 10-Year U.S. Treasury Note | December 2020 | 1,754 | 244,738 | 200 | ||
| 1,541 | ||||||
See accompanying Notes, which are an integral part of the Financial Statements.
33
Target Retirement 2050 Fund
Statement of Assets and Liabilities
As of September 30, 2020
| ($000s, except shares and per-share amounts) | Amount |
| Assets | |
| Investments in Securities, at Value—Affiliated Funds (Cost $16,821,919) | 22,977,909 |
| Cash Collateral Pledged—Futures Contracts | 9,400 |
| Receivables for Investment Securities Sold | 16,257 |
| Receivables for Accrued Income | 2,882 |
| Receivables for Capital Shares Issued | 24,861 |
| Variation Margin Receivable—Futures Contracts | 747 |
| Total Assets | 23,032,056 |
| Liabilities | |
| Payables for Investment Securities Purchased | 2,882 |
| Payables for Capital Shares Redeemed | 50,090 |
| Variation Margin Payable—Futures Contracts | 439 |
| Total Liabilities | 53,411 |
| Net Assets | 22,978,645 |
| At September 30, 2020, net assets consisted of: | |
| Paid-in Capital | 16,522,471 |
| Total Distributable Earnings (Loss) | 6,456,174 |
| Net Assets | 22,978,645 |
| Net Assets | |
| Applicable to 565,931,034 outstanding $.001 par value shares of beneficial interest (unlimited authorization) | 22,978,645 |
| Net Asset Value Per Share | $40.60 |
See accompanying Notes, which are an integral part of the Financial Statements.
34
Target Retirement 2050 Fund
Statement of Operations
| Year Ended | |
| September 30, 2020 | |
| ($000) | |
| Investment Income | |
| Income | |
| Income Distributions Received from Affiliated Funds | 434,266 |
| Other Income | 12 |
| Net Investment Income—Note B | 434,278 |
| Realized Net Gain (Loss) | |
| Capital Gain Distributions Received from Affiliated Funds | — |
| Affiliated Funds Sold | 28,074 |
| Futures Contracts | 19,299 |
| Realized Net Gain (Loss) | 47,373 |
| Change in Unrealized Appreciation (Depreciation) | |
| Affiliated Funds | 1,627,047 |
| Futures Contracts | 1,541 |
| Change in Unrealized Appreciation (Depreciation) | 1,628,588 |
| Net Increase (Decrease) in Net Assets Resulting from Operations | 2,110,239 |
See accompanying Notes, which are an integral part of the Financial Statements.
35
Target Retirement 2050 Fund
Statement of Changes in Net Assets
| Year Ended September 30, | ||
| 2020 | 2019 | |
| ($000) | ($000) | |
| Increase (Decrease) in Net Assets | ||
| Operations | ||
| Net Investment Income | 434,278 | 410,082 |
| Realized Net Gain (Loss) | 47,373 | (5,175) |
| Change in Unrealized Appreciation (Depreciation) | 1,628,588 | 41,890 |
| Net Increase (Decrease) in Net Assets Resulting from Operations | 2,110,239 | 446,797 |
| Distributions1 | ||
| Total Distributions | (462,317) | (371,271) |
| Capital Share Transactions | ||
| Issued | 5,098,536 | 4,866,735 |
| Issued in Lieu of Cash Distributions | 453,580 | 364,259 |
| Redeemed | (3,691,857) | (2,640,064) |
| Net Increase (Decrease) from Capital Share Transactions | 1,860,259 | 2,590,930 |
| Total Increase (Decrease) | 3,508,181 | 2,666,456 |
| Net Assets | ||
| Beginning of Period | 19,470,464 | 16,804,008 |
| End of Period | 22,978,645 | 19,470,464 |
1 Certain prior-period numbers have been reclassified to conform with the current-period presentation.
See accompanying Notes, which are an integral part of the Financial Statements.
36
Target Retirement 2050 Fund
Financial Highlights
| For a Share Outstanding | Year Ended September 30, | ||||
| Throughout Each Period | 2020 | 2019 | 2018 | 2017 | 2016 |
| Net Asset Value, Beginning of Period | $37.63 | $37.80 | $35.07 | $30.63 | $27.95 |
| Investment Operations | |||||
| Net Investment Income | .7931 | .8511 | .7941 | .7271 | .636 |
| Capital Gain Distributions Received | — | — | .0011 | .0021 | .003 |
| Net Realized and Unrealized Gain (Loss) on Investments | 3.053 | (.204) | 2.629 | 4.332 | 2.714 |
| Total from Investment Operations | 3.846 | .647 | 3.424 | 5.061 | 3.353 |
| Distributions | |||||
| Dividends from Net Investment Income | (.876) | (.789) | (.684) | (.587) | (.585) |
| Distributions from Realized Capital Gains | — | (.028) | (.010) | (.034) | (.088) |
| Total Distributions | (.876) | (.817) | (.694) | (.621) | (.673) |
| Net Asset Value, End of Period | $40.60 | $37.63 | $37.80 | $35.07 | $30.63 |
| Total Return2 | 10.26% | 2.07% | 9.84% | 16.84% | 12.14% |
| Ratios/Supplemental Data | |||||
| Net Assets, End of Period (Millions) | $22,979 | $19,470 | $16,804 | $13,407 | $9,634 |
| Ratio of Total Expenses to Average Net Assets | — | — | — | — | — |
| Acquired Fund Fees and Expenses | 0.15% | 0.15% | 0.15% | 0.15% | 0.16% |
| Ratio of Net Investment Income to Average Net Assets | 2.08% | 2.36% | 2.16% | 2.24% | 2.24% |
| Portfolio Turnover Rate | 9% | 3% | 7% | 6% | 12% |
| 1 | Calculated based on average shares outstanding. | |
| 2 | Total returns do not include account service fees that may have applied in the periods shown. Fund prospectuses provide information about any applicable account service fees. |
See accompanying Notes, which are an integral part of the Financial Statements.
37
Target Retirement 2050 Fund
Notes to Financial Statements
Vanguard Target Retirement 2050 Fund is registered under the Investment Company Act of 1940 as an open-end investment company, or mutual fund. The fund follows a balanced investment strategy by investing in selected Vanguard funds to achieve its targeted allocation of assets to U.S. and international stocks, and U.S. and international bonds. Financial statements and other information about each underlying fund are available at www.vanguard.com.
Market disruptions associated with the COVID-19 pandemic have had a global impact, and uncertainty exists as to the long-term implications. Such disruptions can adversely affect assets of the fund and thus fund performance.
A. The following significant accounting policies conform to generally accepted accounting principles for U.S. investment companies. The fund consistently follows such policies in preparing its financial statements.
1. Security Valuation: Investments are valued at the net asset value of each underlying Vanguard fund determined as of the close of the New York Stock Exchange (generally 4 p.m., Eastern time) on the valuation date.
2. Futures Contracts: The fund uses stock and bond futures contracts to a limited extent, with the objectives of maintaining full exposure to the market and maintaining its target asset allocation. The primary risks associated with the use of futures contracts are imperfect correlation between changes in market values of investments held by the fund and the prices of futures contracts, and the possibility of an illiquid market. Counterparty risk involving futures is mitigated because a regulated clearinghouse is the counterparty instead of the clearing broker. To further mitigate counterparty risk, the fund trades futures contracts on an exchange, monitors the financial strength of its clearing brokers and clearinghouse, and has entered into clearing agreements with its clearing brokers. The clearinghouse imposes initial margin requirements to secure the fund’s performance and requires daily settlement of variation margin representing changes in the market value of each contract. Any securities pledged as initial margin for open contracts are noted in the Schedule of Investments.
Futures contracts are valued at their quoted daily settlement prices. The notional amounts of the contracts are not recorded in the Statement of Assets and Liabilities. Fluctuations in the value of the contracts are recorded in the Statement of Assets and Liabilities as an asset (liability) and in the Statement of Operations as unrealized appreciation (depreciation) until the contracts are closed, when they are recorded as realized gains (losses) on futures contracts.
During the year ended September 30, 2020, the fund’s average investments in long and short futures contracts represented less than 1% and 0% of net assets, respectively, based on the average of the notional amounts at each quarter-end during the period.
3. Federal Income Taxes: The fund intends to continue to qualify as a regulated investment company and distribute all of its taxable income. The fund’s tax returns are open to examination by the relevant tax authorities until expiration of the applicable statute of limitations, which is generally three years after the filing of the tax return. Management has analyzed the fund’s tax positions taken for all open federal and state income tax years, and has concluded that no provision for income tax is required in the fund’s financial statements.
4. Distributions: Distributions to shareholders are recorded on the ex-dividend date. Distributions are determined on a tax basis at the fiscal year-end and may differ from net investment income and realized capital gains for financial reporting purposes.
38
Target Retirement 2050 Fund
5. Credit Facilities and Interfund Lending Program: The fund and certain other funds managed by The Vanguard Group (“Vanguard”) participate in a $4.3 billion committed credit facility provided by a syndicate of lenders pursuant to a credit agreement and an uncommitted credit facility provided by Vanguard. Both facilities may be renewed annually. Each fund is individually liable for its borrowings, if any, under the credit facilities. Borrowings may be utilized for temporary or emergency purposes, subject to the fund’s regulatory and contractual borrowing restrictions. With respect to the committed credit facility, the participating funds are charged administrative fees and an annual commitment fee of 0.10% of the undrawn committed amount of the facility; these fees are allocated to the funds based on a method approved by the fund’s board of trustees and borne by the funds in which the fund invests (see Note B). Any borrowings under either facility bear interest at a rate based upon the higher of the one-month London Interbank Offered Rate (or an acceptable alternate rate, if necessary), federal funds effective rate, or overnight bank funding rate plus an agreed-upon spread, except that borrowings under the uncommitted credit facility may bear interest based upon an alternative rate agreed to by the fund and Vanguard.
In accordance with an exemptive order (the “Order”) from the SEC, the fund may participate in a joint lending and borrowing program that allows registered open-end Vanguard funds to borrow money from and lend money to each other for temporary or emergency purposes (the “Interfund Lending Program”), subject to compliance with the terms and conditions of the Order, and to the extent permitted by the fund’s investment objective and investment policies. Interfund loans and borrowings normally extend overnight, but can have a maximum duration of seven days. Loans may be called on one business day’s notice. The interest rate to be charged is governed by the conditions of the Order and internal procedures adopted by the board of trustees. The board of trustees is responsible for overseeing the Interfund Lending Program.
For the year ended September 30, 2020, the fund did not utilize the credit facilities or the Interfund Lending Program.
6. Other: Income and capital gain distributions received are recorded on the ex-dividend date. Security transactions are accounted for on the date securities are bought or sold. Costs used to determine realized gains (losses) on the sale of investment securities are those of the specific securities sold.
B. In accordance with the terms of a Funds’ Service Agreement (the “FSA”) between Vanguard and the fund, Vanguard furnishes to the fund investment advisory, corporate management, administrative, marketing, and distribution services at Vanguard’s cost of operations (as defined by the FSA). These costs of operations are allocated to the fund based on methods and guidelines approved by the board of trustees. The FSA provides that expenses otherwise allocable to Vanguard funds-of-funds may be reduced or eliminated to the extent of savings realized by the underlying Vanguard funds by virtue of being part of a fund-of-funds. Accordingly, all expenses for services provided by Vanguard to the fund and all other expenses incurred by the fund during the period ended September 30, 2020, were borne by the underlying Vanguard funds in which the fund invests. The fund’s trustees and officers are also trustees and officers, respectively, of the underlying Vanguard funds, as well as directors and employees, respectively, of Vanguard.
C. Various inputs may be used to determine the value of the fund’s investments and derivatives. These inputs are summarized in three broad levels for financial statement purposes. The inputs or methodologies used to value securities are not necessarily an indication of the risk associated with investing in those securities.
39
Target Retirement 2050 Fund
Level 1—Quoted prices in active markets for identical securities.
Level 2—Other significant observable inputs (including quoted prices for similar securities, interest rates, prepayment speeds, credit risk, etc.).
Level 3—Significant unobservable inputs (including the fund’s own assumptions used to determine the fair value of investments). Any investments and derivatives valued with significant unobservable inputs are noted on the Schedule of Investments.
At September 30, 2020, 100% of the market value of the fund’s investments and derivatives was determined based on Level 1 inputs.
D. Permanent differences between book-basis and tax-basis components of net assets, if any, are reclassified among capital accounts in the financial statements to reflect their tax character. These reclassifications have no effect on net assets or net asset value per share.
Temporary differences between book-basis and tax-basis components of total distributable earnings (loss) arise when certain items of income, gain, or loss are recognized in different periods for financial statement and tax purposes; these differences will reverse at some time in the future. The differences are primarily related to the deferral of losses from wash sales and the recognition of unrealized gains or losses from certain derivative contracts. As of period end, the tax-basis components of total distributable earnings (loss) are detailed in the table as follows:
| Amount | |
| ($000) | |
| Undistributed Ordinary Income | 291,559 |
| Undistributed Long-Term Gains | 8,625 |
| Capital Loss Carryforwards | — |
| Qualified Late-Year Losses | — |
| Net Unrealized Gains (Losses) | 6,155,990 |
The tax character of distributions paid was as follows:
| Year Ended September 30, | ||
| 2020 | 2019 | |
| Amount | Amount | |
| ($000) | ($000) | |
| Ordinary Income* | 462,317 | 370,825 |
| Long-Term Capital Gains | — | 446 |
| Total | 462,317 | 371,271 |
* Includes short-term capital gains, if any.
As of September 30, 2020, gross unrealized appreciation and depreciation for investments and derivatives based on cost for U.S. federal income tax purposes were as follows:
| Amount | |
| ($000) | |
| Tax Cost | 16,821,919 |
| Gross Unrealized Appreciation | 6,272,510 |
| Gross Unrealized Depreciation | (116,520) |
| Net Unrealized Appreciation (Depreciation) | 6,155,990 |
40
Target Retirement 2050 Fund
E. Capital shares issued and redeemed were:
| Year Ended September 30, | ||
| 2020 | 2019 | |
| Shares | Shares | |
| (000) | (000) | |
| Issued | 135,066 | 135,480 |
| Issued in Lieu of Cash Distributions | 11,376 | 11,274 |
| Redeemed | (97,920) | (73,930) |
| Net Increase (Decrease) in Shares Outstanding | 48,522 | 72,824 |
F. Transactions during the period in affiliated underlying Vanguard funds were as follows:
| Current Period Transactions | ||||||||
| Sept. 30, | Proceeds | Realized | Sept. 30, | |||||
| 2019 | from | Net | Change in | Capital Gain | 2020 | |||
| Market | Purchases | Securities | Gain | Unrealized | Distributions | Market | ||
| Value | at Cost | Sold | (Loss) | App. (Dep.) | Income | Received | Value | |
| ($000) | ($000) | ($000) | ($000) | ($000) | ($000) | ($000) | ($000) | |
| Vanguard Market Liquidity Fund | 14,171 | NA1 | NA1 | (63) | 23 | 348 | — | 372,765 |
| Vanguard Total Bond Market II Index Fund | 1,395,754 | 774,697 | 829,044 | 14,186 | 42,417 | 33,066 | — | 1,398,010 |
| Vanguard Total International Bond Index Fund | 584,131 | 210,139 | 118,793 | (819) | (6,733) | 19,501 | — | 667,925 |
| Vanguard Total International Stock Index Fund | 6,993,878 | 1,276,112 | 220,417 | (5,813) | 172,905 | 187,506 | — | 8,216,665 |
| Vanguard Total Stock Market Index Fund | 10,504,597 | 1,010,121 | 631,192 | 20,583 | 1,418,435 | 193,845 | — | 12,322,544 |
| Total | 19,492,531 | 3,271,069 | 1,799,446 | 28,074 | 1,627,047 | 434,266 | — | 22,977,909 |
1 Not applicable—purchases and sales are for temporary cash investment purposes.
G. Management has determined that no events or transactions occurred subsequent to September 30, 2020, that would require recognition or disclosure in these financial statements.
41
Target Retirement 2055 Fund
Performance Summary
All of the returns in this report represent past performance, which is not a guarantee of future results that may be achieved by the fund. (Current performance may be lower or higher than the performance data cited. For performance data current to the most recent month-end, visit our website at vanguard.com/performance.) Note, too, that both investment returns and principal value can fluctuate widely, so an investor’s shares, when sold, could be worth more or less than their original cost. The returns shown do not reflect taxes that a shareholder would pay on fund distributions or on the sale of fund shares.
Cumulative Performance: September 30, 2010, Through September 30, 2020
Initial Investment of $10,000
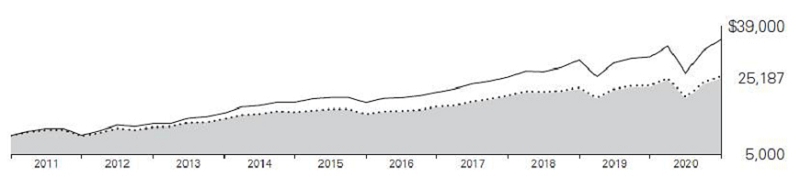
| Average Annual Total Returns | |||||
| Periods Ended September 30, 2020 | |||||
| Final Value | |||||
| One | Five | Ten | of a $10,000 | ||
| Year | Years | Years | Investment | ||
 | Target Retirement 2055 Fund | 10.25% | 10.12% | 9.68% | $25,187 |
 | Target 2055 Composite Index | 10.97 | 10.50 | 9.96 | 25,851 |
 | MSCI US Broad Market Index | 14.99 | 13.70 | 13.53 | 35,575 |
Target 2055 Composite Index: Derived by applying the fund’s target asset allocation to the results of the following benchmarks: for international stocks of developed markets, the MSCI EAFE Index through December 15, 2010, the MSCI ACWI ex USA IMI Index through June 2, 2013, and the FTSE Global All Cap ex US Index thereafter; for emerging-market stocks, the MSCI Emerging Markets Index through December 15, 2010, the MSCI ACWI ex USA IMI Index through June 2, 2013, and the FTSE Global All Cap ex US Index thereafter; for U.S. bonds, the Bloomberg Barclays U.S. Aggregate Float Adjusted Index; for international bonds, the Bloomberg Barclays Global Aggregate ex-USD Float Adjusted RIC Capped Index Hedged beginning June 3, 2013; and for U.S. stocks, the MSCI US Broad Market Index through June 2, 2013, and the CRSP US Total Market Index thereafter. International stock benchmark returns are adjusted for withholding taxes.
See Financial Highlights for dividend and capital gains information.
42
Target Retirement 2055 Fund
Underlying Vanguard Funds
As of September 30, 2020
| Vanguard Total Stock Market Index Fund Investor Shares | 54.4% |
| Vanguard Total International Stock Index Fund Investor Shares | 36.3 |
| Vanguard Total Bond Market II Index Fund Investor Shares | 6.4 |
| Vanguard Total International Bond Index Fund Investor Shares | 2.9 |
The table reflects the fund's investments, except for short-term investments and derivatives.
43
Target Retirement 2055 Fund
Financial Statements
Schedule of Investments
As of September 30, 2020
The fund files its complete schedule of portfolio holdings with the Securities and Exchange Commission (SEC) for the first and third quarters of each fiscal year as an exhibit to its reports on Form N-PORT. The fund’s Form N-PORT reports are available on the SEC’s website at www.sec.gov.
| Market | ||
| Value• | ||
| Shares | ($000) | |
| Investment Companies (98.3%) | ||
| U.S. Stock Fund (53.4%) | ||
| Vanguard Total Stock Market Index Fund Investor Shares | 83,135,500 | 6,893,596 |
| International Stock Fund (35.7%) | ||
| Vanguard Total International Stock Index Fund Investor Shares | 274,775,787 | 4,605,242 |
| U.S. Bond Fund (6.3%) | ||
| 1 Vanguard Total Bond Market II Index Fund Investor Shares | 70,817,869 | 817,238 |
| International Bond Fund (2.9%) | ||
| Vanguard Total International Bond Index Fund Investor Shares | 31,750,010 | 369,253 |
| Total Investment Companies (Cost $10,328,866) | 12,685,329 | |
| Temporary Cash Investment (1.7%) | ||
| Money Market Fund (1.7%) | ||
| 1 Vanguard Market Liquidity Fund, 0.117% (Cost $218,035) | 2,180,559 | 218,056 |
| Total Investments (100.0%) (Cost $10,546,901) | 12,903,385 | |
| Other Assets and Liabilities—Net (0.0%) | (2,256) | |
| Net Assets (100%) | 12,901,129 |
Cost is in $000.
| • | See Note A in Notes to Financial Statements. |
| 1 | Affiliated fund available only to Vanguard funds and certain trusts and accounts managed by Vanguard. Rate shown for Vanguard Market Liquidity Fund is the 7-day yield. |
44
Target Retirement 2055 Fund
Derivative Financial Instruments Outstanding as of Period End
Futures Contracts
| ($000) | ||||
| Value and | ||||
| Number of | Unrealized | |||
| Long (Short) | Notional | Appreciation | ||
| Expiration | Contracts | Amount | (Depreciation) | |
| Long Futures Contracts | ||||
| 10-Year U.S. Treasury Note | December 2020 | 808 | 112,741 | 91 |
| E-mini S&P 500 Index | December 2020 | 657 | 110,113 | 1,101 |
| 1,192 |
See accompanying Notes, which are an integral part of the Financial Statements.
45
Target Retirement 2055 Fund
Statement of Assets and Liabilities
As of September 30, 2020
| ($000s, except shares and per-share amounts) | Amount |
| Assets | |
| Investments in Securities, at Value—Affiliated Issuers (Cost $10,546,901) | 12,903,385 |
| Cash Collateral Pledged—Futures Contracts | 7,710 |
| Receivables for Investment Securities Sold | 7,035 |
| Receivables for Accrued Income | 1,673 |
| Receivables for Capital Shares Issued | 13,082 |
| Variation Margin Receivable—Futures Contracts | 601 |
| Total Assets | 12,933,486 |
| Liabilities | |
| Payables for Investment Securities Purchased | 1,673 |
| Payables for Capital Shares Redeemed | 30,482 |
| Variation Margin Payable—Futures Contracts | 202 |
| Total Liabilities | 32,357 |
| Net Assets | 12,901,129 |
| At September 30, 2020, net assets consisted of: | |
| Paid-in Capital | 10,374,463 |
| Total Distributable Earnings (Loss) | 2,526,666 |
| Net Assets | 12,901,129 |
| Net Assets | |
| Applicable to 292,675,134 outstanding $.001 par value shares of beneficial interest (unlimited authorization) | 12,901,129 |
| Net Asset Value Per Share | $44.08 |
See accompanying Notes, which are an integral part of the Financial Statements.
46
Target Retirement 2055 Fund
Statement of Operations
| Year Ended | |
| September 30, 2020 | |
| ($000) | |
| Investment Income | |
| Income | |
| Income Distributions Received from Affiliated Funds | 236,263 |
| Other Income | 7 |
| Net Investment Income—Note B | 236,270 |
| Realized Net Gain (Loss) | |
| Capital Gain Distributions Received from Affiliated Funds | — |
| Affiliated Funds Sold | 9,471 |
| Futures Contracts | 18,474 |
| Realized Net Gain (Loss) | 27,945 |
| Change in Unrealized Appreciation (Depreciation) | |
| Affiliated Funds | 904,190 |
| Futures Contracts | 1,192 |
| Change in Unrealized Appreciation (Depreciation) | 905,382 |
| Net Increase (Decrease) in Net Assets Resulting from Operations | 1,169,597 |
See accompanying Notes, which are an integral part of the Financial Statements.
47
Target Retirement 2055 Fund
Statement of Changes in Net Assets
| Year Ended September 30, | ||
| 2020 | 2019 | |
| ($000) | ($000) | |
| Increase (Decrease) in Net Assets | ||
| Operations | ||
| Net Investment Income | 236,270 | 207,163 |
| Realized Net Gain (Loss) | 27,945 | 432 |
| Change in Unrealized Appreciation (Depreciation) | 905,382 | 55,011 |
| Net Increase (Decrease) in Net Assets Resulting from Operations | 1,169,597 | 262,606 |
| Distributions1 | ||
| Total Distributions | (240,555) | (169,592) |
| Capital Share Transactions | ||
| Issued | 3,561,374 | 3,278,128 |
| Issued in Lieu of Cash Distributions | 236,321 | 166,487 |
| Redeemed | (2,027,645) | (1,346,248) |
| Net Increase (Decrease) from Capital Share Transactions | 1,770,050 | 2,098,367 |
| Total Increase (Decrease) | 2,699,092 | 2,191,381 |
| Net Assets | ||
| Beginning of Period | 10,202,037 | 8,010,656 |
| End of Period | 12,901,129 | 10,202,037 |
1 Certain prior-period numbers have been reclassified to conform with the current-period presentation.
See accompanying Notes, which are an integral part of the Financial Statements.
48
Target Retirement 2055 Fund
Financial Highlights
| For a Share Outstanding | Year Ended September 30, | ||||
| Throughout Each Period | 2020 | 2019 | 2018 | 2017 | 2016 |
| Net Asset Value, Beginning of Period | $40.84 | $40.95 | $37.98 | $33.15 | $30.14 |
| Investment Operations | |||||
| Net Investment Income | .8621 | .9291 | .8681 | .7961 | .642 |
| Capital Gain Distributions Received | — | — | .0011 | .0021 | .003 |
| Net Realized and Unrealized Gain (Loss) on Investments | 3.307 | (.209) | 2.819 | 4.688 | 2.974 |
| Total from Investment Operations | 4.169 | .720 | 3.688 | 5.486 | 3.619 |
| Distributions | |||||
| Dividends from Net Investment Income | (.929) | (.830) | (.718) | (.654) | (.593) |
| Distributions from Realized Capital Gains | — | — | — | (.002) | (.016) |
| Total Distributions | (.929) | (.830) | (.718) | (.656) | (.609) |
| Net Asset Value, End of Period | $44.08 | $40.84 | $40.95 | $37.98 | $33.15 |
| Total Return2 | 10.25% | 2.09% | 9.79% | 16.86% | 12.13% |
| Ratios/Supplemental Data | |||||
| Net Assets, End of Period (Millions) | $12,901 | $10,202 | $8,011 | $5,600 | $3,399 |
| Ratio of Total Expenses to Average Net Assets | — | — | — | — | — |
| Acquired Fund Fees and Expenses | 0.15% | 0.15% | 0.15% | 0.15% | 0.16% |
| Ratio of Net Investment Income to Average Net Assets | 2.09% | 2.37% | 2.18% | 2.26% | 2.27% |
| Portfolio Turnover Rate | 8% | 3% | 5% | 5% | 8% |
1 Calculated based on average shares outstanding.
2 Total returns do not include account service fees that may have applied in the periods shown. Fund prospectuses provide information about any applicable account service fees.
See accompanying Notes, which are an integral part of the Financial Statements.
49
Target Retirement 2055 Fund
Notes to Financial Statements
Vanguard Target Retirement 2055 Fund is registered under the Investment Company Act of 1940 as an open-end investment company, or mutual fund. The fund follows a balanced investment strategy by investing in selected Vanguard funds to achieve its targeted allocation of assets to U.S. and international stocks, and U.S. and international bonds. Financial statements and other information about each underlying fund are available at www.vanguard.com.
Market disruptions associated with the COVID-19 pandemic have had a global impact, and uncertainty exists as to the long-term implications. Such disruptions can adversely affect assets of the fund and thus fund performance.
A. The following significant accounting policies conform to generally accepted accounting principles for U.S. investment companies. The fund consistently follows such policies in preparing its financial statements.
1. Security Valuation: Investments are valued at the net asset value of each underlying Vanguard fund determined as of the close of the New York Stock Exchange (generally 4 p.m., Eastern time) on the valuation date.
2. Futures Contracts: The fund uses stock and bond futures contracts to a limited extent, with the objectives of maintaining full exposure to the market and maintaining its target asset allocation. The primary risks associated with the use of futures contracts are imperfect correlation between changes in market values of investments held by the fund and the prices of futures contracts, and the possibility of an illiquid market. Counterparty risk involving futures is mitigated because a regulated clearinghouse is the counterparty instead of the clearing broker. To further mitigate counterparty risk, the fund trades futures contracts on an exchange, monitors the financial strength of its clearing brokers and clearinghouse, and has entered into clearing agreements with its clearing brokers. The clearinghouse imposes initial margin requirements to secure the fund’s performance and requires daily settlement of variation margin representing changes in the market value of each contract. Any securities pledged as initial margin for open contracts are noted in the Schedule of Investments.
Futures contracts are valued at their quoted daily settlement prices. The notional amounts of the contracts are not recorded in the Statement of Assets and Liabilities. Fluctuations in the value of the contracts are recorded in the Statement of Assets and Liabilities as an asset (liability) and in the Statement of Operations as unrealized appreciation (depreciation) until the contracts are closed, when they are recorded as realized gains (losses) on futures contracts.
During the year ended September 30, 2020, the fund’s average investments in long and short futures contracts each represented less than 1% and 0% of net assets, respectively, based on the average of the notional amounts at each quarter-end during the period.
3. Federal Income Taxes: The fund intends to continue to qualify as a regulated investment company and distribute all of its taxable income. The fund’s tax returns are open to examination by the relevant tax authorities until expiration of the applicable statute of limitations, which is generally three years after the filing of the tax return. Management has analyzed the fund’s tax positions taken for all open federal and state income tax years, and has concluded that no provision for income tax is required in the fund’s financial statements.
4. Distributions: Distributions to shareholders are recorded on the ex-dividend date. Distributions are determined on a tax basis at the fiscal year-end and may differ from net investment income and realized capital gains for financial reporting purposes.
50
Target Retirement 2055 Fund
5. Credit Facilities and Interfund Lending Program: The fund and certain other funds managed by The Vanguard Group (“Vanguard”) participate in a $4.3 billion committed credit facility provided by a syndicate of lenders pursuant to a credit agreement and an uncommitted credit facility provided by Vanguard. Both facilities may be renewed annually. Each fund is individually liable for its borrowings, if any, under the credit facilities. Borrowings may be utilized for temporary or emergency purposes, subject to the fund’s regulatory and contractual borrowing restrictions. With respect to the committed credit facility, the participating funds are charged administrative fees and an annual commitment fee of 0.10% of the undrawn committed amount of the facility; these fees are allocated to the funds based on a method approved by the fund’s board of trustees and borne by the funds in which the fund invests (see Note B). Any borrowings under either facility bear interest at a rate based upon the higher of the one-month London Interbank Offered Rate (or an acceptable alternate rate, if necessary), federal funds effective rate, or overnight bank funding rate plus an agreed-upon spread, except that borrowings under the uncommitted credit facility may bear interest based upon an alternative rate agreed to by the fund and Vanguard.
In accordance with an exemptive order (the “Order”) from the SEC, the fund may participate in a joint lending and borrowing program that allows registered open-end Vanguard funds to borrow money from and lend money to each other for temporary or emergency purposes (the “Interfund Lending Program”), subject to compliance with the terms and conditions of the Order, and to the extent permitted by the fund’s investment objective and investment policies. Interfund loans and borrowings normally extend overnight, but can have a maximum duration of seven days. Loans may be called on one business day’s notice. The interest rate to be charged is governed by the conditions of the Order and internal procedures adopted by the board of trustees. The board of trustees is responsible for overseeing the Interfund Lending Program.
For the year ended September 30, 2020, the fund did not utilize the credit facilities or the Interfund Lending Program.
6. Other: Income and capital gain distributions received are recorded on the ex-dividend date. Security transactions are accounted for on the date securities are bought or sold. Costs used to determine realized gains (losses) on the sale of investment securities are those of the specific securities sold.
B. In accordance with the terms of a Funds’ Service Agreement (the “FSA”) between Vanguard and the fund, Vanguard furnishes to the fund investment advisory, corporate management, administrative, marketing, and distribution services at Vanguard’s cost of operations (as defined by the FSA). These costs of operations are allocated to the fund based on methods and guidelines approved by the board of trustees. The FSA provides that expenses otherwise allocable to Vanguard funds-of-funds may be reduced or eliminated to the extent of savings realized by the underlying Vanguard funds by virtue of being part of a fund-of-funds. Accordingly, all expenses for services provided by Vanguard to the fund and all other expenses incurred by the fund during the period ended September 30, 2020, were borne by the underlying Vanguard funds in which the fund invests. The fund’s trustees and officers are also trustees and officers, respectively, of the underlying Vanguard funds, as well as directors and employees, respectively, of Vanguard.
C. Various inputs may be used to determine the value of the fund’s investments and derivatives. These inputs are summarized in three broad levels for financial statement purposes. The inputs or methodologies used to value securities are not necessarily an indication of the risk associated with investing in those securities.
51
Target Retirement 2055 Fund
Level 1—Quoted prices in active markets for identical securities.
Level 2—Other significant observable inputs (including quoted prices for similar securities, interest rates, prepayment speeds, credit risk, etc.).
Level 3—Significant unobservable inputs (including the fund’s own assumptions used to determine the fair value of investments). Any investments and derivatives valued with significant unobservable inputs are noted on the Schedule of Investments.
At September 30, 2020, 100% of the market value of the fund’s investments and derivatives was determined based on Level 1 inputs.
D. Permanent differences between book-basis and tax-basis components of net assets, if any, are reclassified among capital accounts in the financial statements to reflect their tax character. These reclassifications have no effect on net assets or net asset value per share.
Temporary differences between book-basis and tax-basis components of total distributable earnings (loss) arise when certain items of income, gain, or loss are recognized in different periods for financial statement and tax purposes; these differences will reverse at some time in the future. The differences are primarily related to the deferral of losses from wash sales and the recognition of unrealized gains or losses from certain derivative contracts. As of period end, the tax-basis components of total distributable earnings (loss) are detailed in the table as follows:
| Amount | |
| ($000) | |
| Undistributed Ordinary Income | 158,620 |
| Undistributed Long-Term Gains | 11,562 |
| Capital Loss Carryforwards | — |
| Qualified Late-Year Losses | — |
| Net Unrealized Gains (Losses) | 2,356,484 |
The tax character of distributions paid was as follows:
| Year Ended September 30, | ||
| 2020 | 2019 | |
| Amount | Amount | |
| ($000) | ($000) | |
| Ordinary Income* | 240,555 | 169,592 |
| Long-Term Capital Gains | — | — |
| Total | 240,555 | 169,592 |
* Includes short-term capital gains, if any.
As of September 30, 2020, gross unrealized appreciation and depreciation for investments and derivatives based on cost for U.S. federal income tax purposes were as follows:
| Amount | |
| ($000) | |
| Tax Cost | 10,546,901 |
| Gross Unrealized Appreciation | 2,450,072 |
| Gross Unrealized Depreciation | (93,588) |
| Net Unrealized Appreciation (Depreciation) | 2,356,484 |
52
Target Retirement 2055 Fund
E. Capital shares issued and redeemed were:
| Year Ended September 30, | ||
| 2020 | 2019 | |
| Shares | Shares | |
| (000) | (000) | |
| Issued | 86,869 | 84,041 |
| Issued in Lieu of Cash Distributions | 5,459 | 4,747 |
| Redeemed | (49,428) | (34,610) |
| Net Increase (Decrease) in Shares Outstanding | 42,900 | 54,178 |
F. Transactions during the period in affiliated underlying Vanguard funds were as follows:
| Current Period Transactions | ||||||||
| Sept. 30, | Proceeds | Realized | Sept. 30, | |||||
| 2019 | from | Net | Change in | Capital Gain | 2020 | |||
| Market | Purchases | Securities | Gain | Unrealized | Distributions | Market | ||
| Value | at Cost | Sold | (Loss) | App. (Dep.) | Income | Received | Value | |
| ($000) | ($000) | ($000) | ($000) | ($000) | ($000) | ($000) | ($000) | |
| Vanguard Market Liquidity Fund | 13,725 | NA1 | NA1 | (37) | 20 | 237 | — | 218,056 |
| Vanguard Total Bond Market ll Index Fund | 731,996 | 476,624 | 422,219 | 5,108 | 25,729 | 18,163 | — | 817,238 |
| Vanguard Total International Bond Index Fund | 301,749 | 127,637 | 56,778 | (635) | (2,720) | 10,402 | — | 369,253 |
| Vanguard Total International Stock Index Fund | 3,658,733 | 946,610 | 90,993 | (235) | 91,127 | 101,870 | — | 4,605,242 |
| Vanguard Total Stock Market Index Fund | 5,503,625 | 896,669 | 302,002 | 5,270 | 790,034 | 105,591 | — | 6,893,596 |
| Total | 10,209,828 | 2,447,540 | 871,992 | 9,471 | 904,190 | 236,263 | — | 12,903,385 |
1 Not applicable—purchases and sales are for temporary cash investment purposes.
G. Management has determined that no events or transactions occurred subsequent to September 30, 2020, that would require recognition or disclosure in these financial statements.
53
Target Retirement 2060 Fund
Performance Summary
All of the returns in this report represent past performance, which is not a guarantee of future results that may be achieved by the fund. (Current performance may be lower or higher than the performance data cited. For performance data current to the most recent month-end, visit our website at vanguard.com/performance.) Note, too, that both investment returns and principal value can fluctuate widely, so an investor’s shares, when sold, could be worth more or less than their original cost. The returns shown do not reflect taxes that a shareholder would pay on fund distributions or on the sale of fund shares.
Cumulative Performance: January 19, 2012, Through September 30, 2020
Initial Investment of $10,000

| Average Annual Total Returns | |||||
| Periods Ended September 30, 2020 | |||||
| Since | Final Value | ||||
| One | Five | Inception | of a $10,000 | ||
| Year | Years | (1/19/2012) | Investment | ||
| Target Retirement 2060 Fund | 10.25% | 10.12% | 9.78% | $22,506 |
| Target 2060 Composite Index | 10.97 | 10.50 | 10.10 | 23,087 |
| MSCI US Broad Market Index | 14.99 | 13.70 | 13.47 | 30,021 |
Target 2060 Composite Index: Derived by applying the fund’s target asset allocation to the results of the following benchmarks: for international stocks of developed markets, the MSCI ACWI ex USA IMI Index through June 2, 2013, and the FTSE Global All Cap ex US Index thereafter; for emerging-market stocks, the MSCI ACWI ex USA IMI Index through June 2, 2013, and the FTSE Global All Cap ex US Index thereafter; for U.S. bonds, the Bloomberg Barclays U.S. Aggregate Float Adjusted Index; for international bonds, the Bloomberg Barclays Global Aggregate ex-USD Float Adjusted RIC Capped Index Hedged beginning June 3, 2013; and for U.S. stocks, the MSCI US Broad Market Index through June 2, 2013, and the CRSP US Total Market Index thereafter. International stock benchmark returns are adjusted for withholding taxes.
"Since Inception" performance is calculated from the inception date for both the fund and its comparative standards.
See Financial Highlights for dividend and capital gains information.
54
Target Retirement 2060 Fund
Underlying Vanguard Funds
As of September 30, 2020
| Vanguard Total Stock Market Index Fund Investor Shares | 54.1% |
| Vanguard Total International Stock Index Fund Investor Shares | 36.1 |
| Vanguard Total Bond Market II Index Fund Investor Shares | 7.0 |
| Vanguard Total International Bond Index Fund Investor Shares | 2.8 |
The table reflects the fund's investments, except for short-term investments and derivatives.
55
Target Retirement 2060 Fund
Financial Statements
Schedule of Investments
As of September 30, 2020
The fund files its complete schedule of portfolio holdings with the Securities and Exchange Commission (SEC) for the first and third quarters of each fiscal year as an exhibit to its reports on Form N-PORT. The fund’s Form N-PORT reports are available on the SEC’s website at www.sec.gov.
| Market | ||
| Value• | ||
| Shares | ($000) | |
| Investment Companies (98.3%) | ||
| U.S. Stock Fund (53.2%) | ||
| Vanguard Total Stock Market Index Fund Investor Shares | 38,665,834 | 3,206,171 |
| International Stock Fund (35.5%) | ||
| Vanguard Total International Stock Index Fund Investor Shares | 127,519,573 | 2,137,228 |
| U.S. Bond Fund (6.8%) | ||
| 1 Vanguard Total Bond Market II Index Fund Investor Shares | 35,760,626 | 412,678 |
| International Bond Fund (2.8%) | ||
| Vanguard Total International Bond Index Fund Investor Shares | 14,279,834 | 166,074 |
| Total Investment Companies (Cost $4,998,023) | 5,922,151 | |
| Temporary Cash Investment (1.7%) | ||
| Money Market Fund (1.7%) | ||
| 1 Vanguard Market Liquidity Fund, 0.117% (Cost $101,888) | 1,018,999 | 101,900 |
| Total Investments (100.0%) (Cost $5,099,911) | 6,024,051 | |
| Other Assets and Liabilities—Net (0.0%) | 2,534 | |
| Net Assets (100%) | 6,026,585 |
Cost is in $000.
| • | See Note A in Notes to Financial Statements. | |
| 1 | Affiliated fund available only to Vanguard funds and certain trusts and accounts managed by Vanguard. Rate shown for Vanguard Market Liquidity Fund is the 7-day yield. |
56
Target Retirement 2060 Fund
| Derivative Financial Instruments Outstanding as of Period End | |||||
| Futures Contracts | |||||
| ($000) | |||||
| Value and | |||||
| Number of | Unrealized | ||||
| Long (Short) | Notional | Appreciation | |||
| Expiration | Contracts | Amount | (Depreciation) | ||
| Long Futures Contracts | |||||
| E-mini S&P 500 Index | December 2020 | 442 | 74,079 | 650 | |
| 10-Year U.S. Treasury Note | December 2020 | 227 | 31,674 | 26 | |
| 676 | |||||
See accompanying Notes, which are an integral part of the Financial Statements.
57
Target Retirement 2060 Fund
Statement of Assets and Liabilities
As of September 30, 2020
| ($000s, except shares and per-share amounts) | Amount |
| Assets | |
| Investments in Securities, at Value—Affiliated Funds (Cost $5,099,911) | 6,024,051 |
| Cash Collateral Pledged—Futures Contracts | 5,260 |
| Receivables for Accrued Income | 816 |
| Receivables for Capital Shares Issued | 8,767 |
| Variation Margin Receivable—Futures Contracts | 404 |
| Total Assets | 6,039,298 |
| Liabilities | |
| Payables for Investment Securities Purchased | 2,961 |
| Payables for Capital Shares Redeemed | 9,695 |
| Variation Margin Payable—Futures Contracts | 57 |
| Total Liabilities | 12,713 |
| Net Assets | 6,026,585 |
| At September 30, 2020, net assets consisted of: | |
| Paid-in Capital | 5,020,452 |
| Total Distributable Earnings (Loss) | 1,006,133 |
| Net Assets | 6,026,585 |
| Net Assets | |
| Applicable to 154,733,930 outstanding $.001 par value shares of | |
| beneficial interest (unlimited authorization) | 6,026,585 |
| Net Asset Value Per Share | $38.95 |
See accompanying Notes, which are an integral part of the Financial Statements.
58
Target Retirement 2060 Fund
Statement of Operations
| Year Ended | |
| September 30, 2020 | |
| ($000) | |
| Investment Income | |
| Income | |
| Income Distributions Received from Affiliated Funds | 106,234 |
| Other Income | 3 |
| Net Investment Income—Note B | 106,237 |
| Realized Net Gain (Loss) | |
| Capital Gain Distributions Received from Affiliated Funds | — |
| Affiliated Funds Sold | 4,900 |
| Futures Contracts | 11,493 |
| Realized Net Gain (Loss) | 16,393 |
| Change in Unrealized Appreciation (Depreciation) | |
| Affiliated Funds | 420,803 |
| Futures Contracts | 676 |
| Change in Unrealized Appreciation (Depreciation) | 421,479 |
| Net Increase (Decrease) in Net Assets Resulting from Operations | 544,109 |
See accompanying Notes, which are an integral part of the Financial Statements.
59
Target Retirement 2060 Fund
Statement of Changes in Net Assets
| Year Ended September 30, | ||
| 2020 | 2019 | |
| ($000) | ($000) | |
| Increase (Decrease) in Net Assets | ||
| Operations | ||
| Net Investment Income | 106,237 | 86,239 |
| Realized Net Gain (Loss) | 16,393 | (656) |
| Change in Unrealized Appreciation (Depreciation) | 421,479 | 29,171 |
| Net Increase (Decrease) in Net Assets Resulting from Operations | 544,109 | 114,754 |
| Distributions1 | ||
| Total Distributions | (102,334) | (68,127) |
| Capital Share Transactions | ||
| Issued | 2,143,394 | 1,629,071 |
| Issued in Lieu of Cash Distributions | 99,595 | 66,263 |
| Redeemed | (1,016,890) | (622,889) |
| Net Increase (Decrease) from Capital Share Transactions | 1,226,099 | 1,072,445 |
| Total Increase (Decrease) | 1,667,874 | 1,119,072 |
| Net Assets | ||
| Beginning of Period | 4,358,711 | 3,239,639 |
| End of Period | 6,026,585 | 4,358,711 |
1 Certain prior-period numbers have been reclassified to conform with the current-period presentation.
See accompanying Notes, which are an integral part of the Financial Statements.
60
Target Retirement 2060 Fund
Financial Highlights
| For a Share Outstanding | Year Ended September 30, | ||||
| Throughout Each Period | 2020 | 2019 | 2018 | 2017 | 2016 |
| Net Asset Value, Beginning of Period | $36.07 | $36.16 | $33.51 | $29.25 | $26.58 |
| Investment Operations | |||||
| Net Investment Income | .7621 | .8221 | .7681 | .7081 | .555 |
| Capital Gain Distributions Received | — | — | — | .0021 | .003 |
| Net Realized and Unrealized Gain (Loss) on Investments | 2.922 | (.192) | 2.495 | 4.126 | 2.635 |
| Total from Investment Operations | 3.684 | .630 | 3.263 | 4.836 | 3.193 |
| Distributions | |||||
| Dividends from Net Investment Income | (.804) | (.717) | (.613) | (.574) | (.503) |
| Distributions from Realized Capital Gains | — | (.003) | — | (.002) | (.020) |
| Total Distributions | (.804) | (.720) | (.613) | (.576) | (.523) |
| Net Asset Value, End of Period | $38.95 | $36.07 | $36.16 | $33.51 | $29.25 |
| Total Return2 | 10.25% | 2.07% | 9.81% | 16.84% | 12.13% |
| Ratios/Supplemental Data | |||||
| Net Assets, End of Period (Millions) | $6,027 | $4,359 | $3,240 | $2,081 | $1,143 |
| Ratio of Total Expenses to Average Net Assets | — | — | — | — | — |
| Acquired Fund Fees and Expenses | 0.15% | 0.15% | 0.15% | 0.15% | 0.16% |
| Ratio of Net Investment Income to Average Net Assets | 2.09% | 2.37% | 2.19% | 2.28% | 2.28% |
| Portfolio Turnover Rate | 6% | 2% | 3% | 4% | 6% |
| 1 | Calculated based on average shares outstanding. |
| 2 | Total returns do not include account service fees that may have applied in the periods shown. Fund prospectuses provide information about any applicable account service fees. |
See accompanying Notes, which are an integral part of the Financial Statements.
61
Target Retirement 2060 Fund
Notes to Financial Statements
Vanguard Target Retirement 2060 Fund is registered under the Investment Company Act of 1940 as an open-end investment company, or mutual fund. The fund follows a balanced investment strategy by investing in selected Vanguard funds to achieve its targeted allocation of assets to U.S. and international stocks, and U.S. and international bonds. Financial statements and other information about each underlying fund are available at www.vanguard.com.
Market disruptions associated with the COVID-19 pandemic have had a global impact, and uncertainty exists as to the long-term implications. Such disruptions can adversely affect assets of the fund and thus fund performance.
A. The following significant accounting policies conform to generally accepted accounting principles for U.S. investment companies. The fund consistently follows such policies in preparing its financial statements.
1. Security Valuation: Investments are valued at the net asset value of each underlying Vanguard fund determined as of the close of the New York Stock Exchange (generally 4 p.m., Eastern time) on the valuation date.
2. Futures Contracts: The fund uses stock and bond futures contracts to a limited extent, with the objectives of maintaining full exposure to the market and maintaining its target asset allocation. The primary risks associated with the use of futures contracts are imperfect correlation between changes in market values of investments held by the fund and the prices of futures contracts, and the possibility of an illiquid market. Counterparty risk involving futures is mitigated because a regulated clearinghouse is the counterparty instead of the clearing broker. To further mitigate counterparty risk, the fund trades futures contracts on an exchange, monitors the financial strength of its clearing brokers and clearinghouse, and has entered into clearing agreements with its clearing brokers. The clearinghouse imposes initial margin requirements to secure the fund’s performance and requires daily settlement of variation margin representing changes in the market value of each contract. Any securities pledged as initial margin for open contracts are noted in the Schedule of Investments.
Futures contracts are valued at their quoted daily settlement prices. The notional amounts of the contracts are not recorded in the Statement of Assets and Liabilities. Fluctuations in the value of the contracts are recorded in the Statement of Assets and Liabilities as an asset (liability) and in the Statement of Operations as unrealized appreciation (depreciation) until the contracts are closed, when they are recorded as realized gains (losses) on futures contracts.
During the year ended September 30, 2020, the fund’s average investments in long and short futures contracts represented less than 1% and 0% of net assets, respectively, based on the average of the notional amounts at each quarter-end during the period.
3. Federal Income Taxes: The fund intends to continue to qualify as a regulated investment company and distribute all of its taxable income. The fund’s tax returns are open to examination by the relevant tax authorities until expiration of the applicable statute of limitations, which is generally three years after the filing of the tax return. Management has analyzed the fund’s tax positions taken for all open federal and state income tax years, and has concluded that no provision for income tax is required in the fund’s financial statements.
4. Distributions: Distributions to shareholders are recorded on the ex-dividend date. Distributions are determined on a tax basis at the fiscal year-end and may differ from net investment income and realized capital gains for financial reporting purposes.
62
Target Retirement 2060 Fund
5. Credit Facilities and Interfund Lending Program: The fund and certain other funds managed by The Vanguard Group (“Vanguard”) participate in a $4.3 billion committed credit facility provided by a syndicate of lenders pursuant to a credit agreement and an uncommitted credit facility provided by Vanguard. Both facilities may be renewed annually. Each fund is individually liable for its borrowings, if any, under the credit facilities. Borrowings may be utilized for temporary or emergency purposes, subject to the fund’s regulatory and contractual borrowing restrictions. With respect to the committed credit facility, the participating funds are charged administrative fees and an annual commitment fee of 0.10% of the undrawn committed amount of the facility; these fees are allocated to the funds based on a method approved by the fund’s board of trustees and borne by the funds in which the fund invests (see Note B). Any borrowings under either facility bear interest at a rate based upon the higher of the one-month London Interbank Offered Rate (or an acceptable alternate rate, if necessary), federal funds effective rate, or overnight bank funding rate plus an agreed-upon spread, except that borrowings under the uncommitted credit facility may bear interest based upon an alternative rate agreed to by the fund and Vanguard.
In accordance with an exemptive order (the “Order”) from the SEC, the fund may participate in a joint lending and borrowing program that allows registered open-end Vanguard funds to borrow money from and lend money to each other for temporary or emergency purposes (the “Interfund Lending Program”), subject to compliance with the terms and conditions of the Order, and to the extent permitted by the fund’s investment objective and investment policies. Interfund loans and borrowings normally extend overnight, but can have a maximum duration of seven days. Loans may be called on one business day’s notice. The interest rate to be charged is governed by the conditions of the Order and internal procedures adopted by the board of trustees. The board of trustees is responsible for overseeing the Interfund Lending Program.
For the year ended September 30, 2020, the fund did not utilize the credit facilities or the Interfund Lending Program.
6. Other: Income and capital gain distributions received are recorded on the ex-dividend date. Security transactions are accounted for on the date securities are bought or sold. Costs used to determine realized gains (losses) on the sale of investment securities are those of the specific securities sold.
B. In accordance with the terms of a Funds’ Service Agreement (the “FSA”) between Vanguard and the fund, Vanguard furnishes to the fund investment advisory, corporate management, administrative, marketing, and distribution services at Vanguard’s cost of operations (as defined by the FSA). These costs of operations are allocated to the fund based on methods and guidelines approved by the board of trustees. The FSA provides that expenses otherwise allocable to Vanguard funds-of-funds may be reduced or eliminated to the extent of savings realized by the underlying Vanguard funds by virtue of being part of a fund-of-funds. Accordingly, all expenses for services provided by Vanguard to the fund and all other expenses incurred by the fund during the period ended September 30, 2020, were borne by the underlying Vanguard funds in which the fund invests. The fund’s trustees and officers are also trustees and officers, respectively, of the underlying Vanguard funds, as well as directors and employees, respectively, of Vanguard.
C. Various inputs may be used to determine the value of the fund’s investments and derivatives. These inputs are summarized in three broad levels for financial statement purposes. The inputs or methodologies used to value securities are not necessarily an indication of the risk associated with investing in those securities.
63
Target Retirement 2060 Fund
Level 1—Quoted prices in active markets for identical securities.
Level 2—Other significant observable inputs (including quoted prices for similar securities, interest rates, prepayment speeds, credit risk, etc.).
Level 3—Significant unobservable inputs (including the fund’s own assumptions used to determine the fair value of investments). Any investments and derivatives valued with significant unobservable inputs are noted on the Schedule of Investments.
At September 30, 2020, 100% of the market value of the fund’s investments and derivatives was determined based on Level 1 inputs.
D. Permanent differences between book-basis and tax-basis components of net assets, if any, are reclassified among capital accounts in the financial statements to reflect their tax character. These reclassifications have no effect on net assets or net asset value per share.
Temporary differences between book-basis and tax-basis components of total distributable earnings (loss) arise when certain items of income, gain, or loss are recognized in different periods for financial statement and tax purposes; these differences will reverse at some time in the future. The differences are primarily related to the deferral of losses from wash sales; and the recognition of unrealized gains or losses from certain derivative contracts. As of period end, the tax-basis components of total distributable earnings (loss) are detailed in the table as follows:
| Amount | |
| ($000) | |
| Undistributed Ordinary Income | 75,136 |
| Undistributed Long-Term Gains | 6,857 |
| Capital Loss Carryforwards | — |
| Qualified Late-Year Losses | — |
| Net Unrealized Gains (Losses) | 924,140 |
The tax character of distributions paid was as follows:
| Year Ended September 30, | ||
| 2020 | 2019 | |
| Amount | Amount | |
| ($000) | ($000) | |
| Ordinary Income* | 102,334 | 68,105 |
| Long-Term Capital Gains | — | 22 |
| Total | 102,334 | 68,127 |
* Includes short-term capital gains, if any.
As of September 30, 2020, gross unrealized appreciation and depreciation for investments and derivatives based on cost for U.S. federal income tax purposes were as follows:
| Amount | |
| ($000) | |
| Tax Cost | 5,099,911 |
| Gross Unrealized Appreciation | 971,719 |
| Gross Unrealized Depreciation | (47,579) |
| Net Unrealized Appreciation (Depreciation) | 924,140 |
64
Target Retirement 2060 Fund
E. Capital shares issued and redeemed were:
| Year Ended September 30, | ||
| 2020 | 2019 | |
| Shares | Shares | |
| (000) | (000) | |
| Issued | 59,404 | 47,218 |
| Issued in Lieu of Cash Distributions | 2,603 | 2,140 |
| Redeemed | (28,099) | (18,120) |
| Net Increase (Decrease) in Shares Outstanding | 33,908 | 31,238 |
F. Transactions during the period in affiliated underlying Vanguard funds were as follows:
| Current Period Transactions | ||||||||
| Sept. 30, | Proceeds | Realized | Sept. 30, | |||||
| 2019 | from | Net | Change in | Capital Gain | 2020 | |||
| Market | Purchases | Securities | Gain | Unrealized | Distributions | Market | ||
| Value | at Cost | Sold | (Loss) | App. (Dep.) | Income | Received | Value | |
| ($000) | ($000) | ($000) | ($000) | ($000) | ($000) | ($000) | ($000) | |
| Vanguard Market Liquidity Fund | 6,033 | NA1 | NA1 | (12) | 13 | 117 | — | 101,900 |
| Vanguard Total Bond Market II Index Fund | 312,722 | 252,779 | 167,309 | 2,164 | 12,322 | 8,310 | — | 412,678 |
| Vanguard Total International Bond Index Fund | 127,829 | 60,603 | 20,935 | (310) | (1,113) | 4,527 | — | 166,074 |
| Vanguard Total International Stock Index Fund | 1,561,857 | 561,000 | 30,764 | — | 45,135 | 45,662 | — | 2,137,228 |
| Vanguard Total Stock Market Index Fund | 2,355,656 | 581,821 | 98,810 | 3,058 | 364,446 | 47,618 | — | 3,206,171 |
| Total | 4,364,097 | 1,456,203 | 317,818 | 4,900 | 420,803 | 106,234 | — | 6,024,051 |
1 Not applicable — purchases and sales are for temporary cash investment purposes.
G. Management has determined that no events or transactions occurred subsequent to September 30, 2020, that would require recognition or disclosure in these financial statements.
65
Target Retirement 2065 Fund
Performance Summary
All of the returns in this report represent past performance, which is not a guarantee of future results that may be achieved by the fund. (Current performance may be lower or higher than the performance data cited. For performance data current to the most recent month-end, visit our website at vanguard.com/performance.) Note, too, that both investment returns and principal value can fluctuate widely, so an investor’s shares, when sold, could be worth more or less than their original cost. The returns shown do not reflect taxes that a shareholder would pay on fund distributions or on the sale of fund shares.
Cumulative Performance: July 12, 2017, Through September 30, 2020
Initial Investment of $10,000
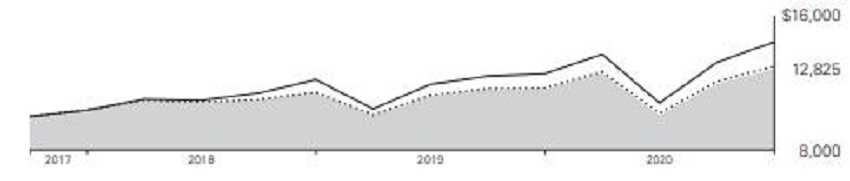
| Average Annual Total Returns | |||||
| Periods Ended September 30, 2020 | |||||
| Since | Final Value | ||||
| One | Inception | of a $10,000 | |||
| Year | (7/12/2017) | Investment | |||
 | Target Retirement 2065 Fund | 10.11% | 8.03% | $12,825 | |
| Target 2065 Composite Index | 10.97 | 8.46 | 12,988 | |
| MSCI US Broad Market Index | 14.99 | 12.06 | 14,429 | |
Target 2065 Composite Index: Derived by applying the fund’s target asset allocation to the results of the following benchmarks: the FTSE Global All Cap ex US Index for international stocks, the Bloomberg Barclays U.S. Aggregate Float Adjusted Index for U.S. bonds, the Bloomberg Barclays Global Aggregate ex-USD Float Adjusted RIC Capped Index Hedged for international bonds, and the CRSP US Total Market Index for U.S. stocks. International stock benchmark returns are adjusted for withholding taxes.
"Since Inception" performance is calculated from the inception date for both the fund and its comparative standards.
See Financial Highlights for dividend and capital gains information.
66
Target Retirement 2065 Fund
Underlying Vanguard Funds
As of September 30, 2020
| Vanguard Total Stock Market Index Fund Investor Shares | 54.6% |
| Vanguard Total International Stock Index Fund Investor Shares | 35.7 |
| Vanguard Total Bond Market II Index Fund Investor Shares | 7.2 |
| Vanguard Total International Bond Index Fund Investor Shares | 2.5 |
The table reflects the fund's investments, except for short-term investments and derivatives.
67
Target Retirement 2065 Fund
Financial Statements
Schedule of Investments
As of September 30, 2020
The fund files its complete schedule of portfolio holdings with the Securities and Exchange Commission (SEC) for the first and third quarters of each fiscal year as an exhibit to its reports on Form N-PORT. The fund’s Form N-PORT reports are available on the SEC’s website at www.sec.gov.
| Market | ||
| Value• | ||
| Shares | ($000) | |
| Investment Companies (98.7%) | ||
| U.S. Stock Fund (54.0%) | ||
| Vanguard Total Stock Market Index Fund Investor Shares | 5,628,941 | 466,752 |
| International Stock Fund (35.2%) | ||
| Vanguard Total International Stock Index Fund Investor Shares | 18,143,376 | 304,083 |
| U.S. Bond Fund (7.1%) | ||
| 1 Vanguard Total Bond Market II Index Fund Investor Shares | 5,290,968 | 61,058 |
| International Bond Fund (2.4%) | ||
| Vanguard Total International Bond Index Fund Investor Shares | 1,809,107 | 21,040 |
| Total Investment Companies (Cost $779,342) | 852,933 | |
| Temporary Cash Investment (1.4%) | ||
| Money Market Fund (1.4%) | ||
| 1 Vanguard Market Liquidity Fund, 0.117% (Cost $12,076) | 120,764 | 12,076 |
| Total Investments (100.1%) (Cost $791,418) | 865,009 | |
| Other Assets and Liabilities — Net (-0.1%) | (802) | |
| Net Assets (100%) | 864,207 |
Cost is in $000.
| • | See Note A in Notes to Financial Statements. |
| 1 | Affiliated fund available only to Vanguard funds and certain trusts and accounts managed by Vanguard. Rate shown for Vanguard Market Liquidity Fund is the 7-day yield. |
68
Target Retirement 2065 Fund
| Derivative Financial Instruments Outstanding as of Period End | ||||||
| Futures Contracts | ||||||
| ($000) | ||||||
| Value and | ||||||
| Number of | Unrealized | |||||
| Long (Short) | Notional | Appreciation | ||||
| Expiration | Contracts | Amount | (Depreciation) | |||
| Long Futures Contracts | ||||||
| E-mini S&P 500 Index | December 2020 | 45 | 7,542 | 64 | ||
| 10-Year U.S. Treasury Note | December 2020 | 35 | 4,884 | 4 | ||
| 68 | ||||||
See accompanying Notes, which are an integral part of the Financial Statements.
69
Target Retirement 2065 Fund
Statement of Assets and Liabilities
As of September 30, 2020
| ($000s, except shares and per-share amounts) | Amount |
| Assets | |
| Investments in Securities, at Value—Affiliated Funds (Cost $791,418) | 865,009 |
| Cash Collateral Pledged—Futures Contracts | 540 |
| Receivables for Accrued Income | 117 |
| Receivables for Capital Shares Issued | 1,330 |
| Variation Margin Receivable—Futures Contracts | 41 |
| Total Assets | 867,037 |
| Liabilities | |
| Payables for Investment Securities Purchased | 827 |
| Payables for Capital Shares Redeemed | 1,994 |
| Variation Margin Payable—Futures Contracts | 9 |
| Total Liabilities | 2,830 |
| Net Assets | 864,207 |
| At September 30, 2020, net assets consisted of: | |
| Paid-in Capital | 780,488 |
| Total Distributable Earnings (Loss) | 83,719 |
| Net Assets | 864,207 |
| Net Assets | |
| Applicable to 35,249,276 outstanding $.001 par value shares of beneficial interest (unlimited authorization) | 864,207 |
| Net Asset Value Per Share | $24.52 |
See accompanying Notes, which are an integral part of the Financial Statements.
70
Target Retirement 2065 Fund
Statement of Operations
| Year Ended | |
| September 30, 2020 | |
| ($000) | |
| Investment Income | |
| Income | |
| Income Distributions Received from Affiliated Funds | 13,149 |
| Other Income | 6 |
| Net Investment Income — Note B | 13,155 |
| Realized Net Gain (Loss) | |
| Capital Gain Distributions Received from Affiliated Funds | — |
| Affiliated Funds Sold | 161 |
| Futures Contracts | 1,018 |
| Realized Net Gain (Loss) | 1,179 |
| Change in Unrealized Appreciation (Depreciation) | |
| Affiliated Funds | 61,416 |
| Futures Contracts | 68 |
| Change in Unrealized Appreciation (Depreciation) | 61,484 |
| Net Increase (Decrease) in Net Assets Resulting from Operations | 75,818 |
See accompanying Notes, which are an integral part of the Financial Statements.
71
Target Retirement 2065 Fund
Statement of Changes in Net Assets
| Year Ended September 30, | ||
| 2020 | 2019 | |
| ($000) | ($000) | |
| Increase (Decrease) in Net Assets | ||
| Operations | ||
| Net Investment Income | 13,155 | 7,243 |
| Realized Net Gain (Loss) | 1,179 | — |
| Change in Unrealized Appreciation (Depreciation) | 61,484 | 7,079 |
| Net Increase (Decrease) in Net Assets Resulting from Operations | 75,818 | 14,322 |
| Distributions1 | ||
| Total Distributions | (9,765) | (3,976) |
| Capital Share Transactions | ||
| Issued | 602,188 | 295,477 |
| Issued in Lieu of Cash Distributions | 9,419 | 3,802 |
| Redeemed | (233,506) | (91,083) |
| Net Increase (Decrease) from Capital Share Transactions | 378,101 | 208,196 |
| Total Increase (Decrease) | 444,154 | 218,542 |
| Net Assets | ||
| Beginning of Period | 420,053 | 201,511 |
| End of Period | 864,207 | 420,053 |
1 Certain prior-period numbers have been reclassified to conform with the current-period presentation.
See accompanying Notes, which are an integral part of the Financial Statements.
72
Target Retirement 2065 Fund
Financial Highlights
| July 12, | ||||
| Year Ended September 30, | 20171 to | |||
| Sept. 30, | ||||
| For a Share Outstanding Throughout Each Period | 2020 | 2019 | 2018 | 2017 |
| Net Asset Value, Beginning of Period | $22.69 | $22.64 | $20.79 | $20.00 |
| Investment Operations | ||||
| Net Investment Income2 | .485 | .529 | .524 | .150 |
| Capital Gain Distributions Received2 | — | — | — | — |
| Net Realized and Unrealized Gain (Loss) on Investments | 1.802 | (.116) | 1.496 | .640 |
| Total from Investment Operations | 2.287 | .413 | 2.020 | .790 |
| Distributions | ||||
| Dividends from Net Investment Income | (.457) | (.363) | (.170) | — |
| Distributions from Realized Capital Gains | — | .0003 | — | — |
| Total Distributions | (.457) | (.363) | (.170) | — |
| Net Asset Value, End of Period | $24.52 | $22.69 | $22.64 | $20.79 |
| Total Return4 | 10.11% | 2.09% | 9.75% | 3.95% |
| Ratios/Supplemental Data | ||||
| Net Assets, End of Period (Millions) | $864 | $420 | $202 | $19 |
| Ratio of Total Expenses to Average Net Assets | — | — | — | — |
| Acquired Fund Fees and Expenses | 0.15% | 0.15% | 0.15% | 0.15%5 |
| Ratio of Net Investment Income to Average Net Assets | 2.11% | 2.42% | 2.37% | 3.30%5 |
| Portfolio Turnover Rate | 6% | 2% | 1% | 29% |
| 1 | Inception. |
| 2 | Calculated based on average shares outstanding. |
| 3 | Distribution was less than $.001 per share. |
| 4 | Total returns do not include account service fees that may have applied in the periods shown. Fund prospectuses provide information about any applicable account service fees. |
| 5 | Annualized. |
See accompanying Notes, which are an integral part of the Financial Statements.
73
Target Retirement 2065 Fund
Notes to Financial Statements
Vanguard Target Retirement 2065 Fund is registered under the Investment Company Act of 1940 as an open-end investment company, or mutual fund. The fund follows a balanced investment strategy by investing in selected Vanguard funds to achieve its targeted allocation of assets to U.S. and international stocks, and U.S. and international bonds. Financial statements and other information about each underlying fund are available at www.vanguard.com.
Market disruptions associated with the COVID-19 pandemic have had a global impact, and uncertainty exists as to the long-term implications. Such disruptions can adversely affect assets of the fund and thus fund performance.
A. The following significant accounting policies conform to generally accepted accounting principles for U.S. investment companies. The fund consistently follows such policies in preparing its financial statements.
1. Security Valuation: Investments are valued at the net asset value of each underlying Vanguard fund determined as of the close of the New York Stock Exchange (generally 4 p.m., Eastern time) on the valuation date.
2. Futures Contracts: The fund uses stock and bond futures contracts to a limited extent, with the objectives of maintaining full exposure to the market and maintaining its target asset allocation. The primary risks associated with the use of futures contracts are imperfect correlation between changes in market values of investments held by the fund and the prices of futures contracts, and the possibility of an illiquid market. Counterparty risk involving futures is mitigated because a regulated clearinghouse is the counterparty instead of the clearing broker. To further mitigate counterparty risk, the fund trades futures contracts on an exchange, monitors the financial strength of its clearing brokers and clearinghouse, and has entered into clearing agreements with its clearing brokers. The clearinghouse imposes initial margin requirements to secure the fund’s performance and requires daily settlement of variation margin representing changes in the market value of each contract. Any securities pledged as initial margin for open contracts are noted in the Schedule of Investments.
Futures contracts are valued at their quoted daily settlement prices. The notional amounts of the contracts are not recorded in the Statement of Assets and Liabilities. Fluctuations in the value of the contracts are recorded in the Statement of Assets and Liabilities as an asset (liability) and in the Statement of Operations as unrealized appreciation (depreciation) until the contracts are closed, when they are recorded as realized gains (losses) on futures contracts.
During the year ended September 30, 2020, the fund’s average investments in long and short futures contracts represented less than 1% and 0% of net assets, respectively, based on the average of the notional amounts at each quarter-end during the period.
3. Federal Income Taxes: The fund intends to continue to qualify as a regulated investment company and distribute all of its taxable income. The fund’s tax returns are open to examination by the relevant tax authorities until expiration of the applicable statute of limitations, which is generally three years after the filing of the tax return. Management has analyzed the fund’s tax positions taken for all open federal and state income tax years, and has concluded that no provision for income tax is required in the fund’s financial statements.
4. Distributions: Distributions to shareholders are recorded on the ex-dividend date. Distributions are determined on a tax basis at the fiscal year-end and may differ from net investment income and realized capital gains for financial reporting purposes.
74
Target Retirement 2065 Fund
5. Credit Facilities and Interfund Lending Program: The fund and certain other funds managed by The Vanguard Group (“Vanguard”) participate in a $4.3 billion committed credit facility provided by a syndicate of lenders pursuant to a credit agreement and an uncommitted credit facility provided by Vanguard. Both facilities may be renewed annually. Each fund is individually liable for its borrowings, if any, under the credit facilities. Borrowings may be utilized for temporary or emergency purposes, subject to the fund’s regulatory and contractual borrowing restrictions. With respect to the committed credit facility, the participating funds are charged administrative fees and an annual commitment fee of 0.10% of the undrawn committed amount of the facility; these fees are allocated to the funds based on a method approved by the fund’s board of trustees and borne by the funds in which the fund invests (see Note B). Any borrowings under either facility bear interest at a rate based upon the higher of the one-month London Interbank Offered Rate (or an acceptable alternate rate, if necessary), federal funds effective rate, or overnight bank funding rate plus an agreed-upon spread, except that borrowings under the uncommitted credit facility may bear interest based upon an alternative rate agreed to by the fund and Vanguard.
In accordance with an exemptive order (the “Order”) from the SEC, the fund may participate in a joint lending and borrowing program that allows registered open-end Vanguard funds to borrow money from and lend money to each other for temporary or emergency purposes (the “Interfund Lending Program”), subject to compliance with the terms and conditions of the Order, and to the extent permitted by the fund’s investment objective and investment policies. Interfund loans and borrowings normally extend overnight, but can have a maximum duration of seven days. Loans may be called on one business day’s notice. The interest rate to be charged is governed by the conditions of the Order and internal procedures adopted by the board of trustees. The board of trustees is responsible for overseeing the Interfund Lending Program.
For the year ended September 30, 2020, the fund did not utilize the credit facilities or the Interfund Lending Program.
6. Other: Income and capital gain distributions received are recorded on the ex-dividend date. Security transactions are accounted for on the date securities are bought or sold. Costs used to determine realized gains (losses) on the sale of investment securities are those of the specific securities sold.
B. In accordance with the terms of a Funds’ Service Agreement (the “FSA”) between Vanguard and the fund, Vanguard furnishes to the fund investment advisory, corporate management, administrative, marketing, and distribution services at Vanguard’s cost of operations (as defined by the FSA). These costs of operations are allocated to the fund based on methods and guidelines approved by the board of trustees. The FSA provides that expenses otherwise allocable to Vanguard funds-of-funds may be reduced or eliminated to the extent of savings realized by the underlying Vanguard funds by virtue of being part of a fund-of-funds. Accordingly, all expenses for services provided by Vanguard to the fund and all other expenses incurred by the fund during the period ended September 30, 2020, were borne by the underlying Vanguard funds in which the fund invests. The fund’s trustees and officers are also trustees and officers, respectively, of the underlying Vanguard funds, as well as directors and employees, respectively, of Vanguard.
C. Various inputs may be used to determine the value of the fund’s investments and derivatives. These inputs are summarized in three broad levels for financial statement purposes. The inputs or methodologies used to value securities are not necessarily an indication of the risk associated with investing in those securities.
75
Target Retirement 2065 Fund
Level 1—Quoted prices in active markets for identical securities.
Level 2—Other significant observable inputs (including quoted prices for similar securities, interest rates, prepayment speeds, credit risk, etc.).
Level 3—Significant unobservable inputs (including the fund’s own assumptions used to determine the fair value of investments). Any investments and derivatives valued with significant unobservable inputs are noted on the Schedule of Investments.
At September 30, 2020, 100% of the market value of the fund’s investments and derivatives was determined based on Level 1 inputs.
D. Permanent differences between book-basis and tax-basis components of net assets, if any, are reclassified among capital accounts in the financial statements to reflect their tax character. These reclassifications have no effect on net assets or net asset value per share.
Temporary differences between book-basis and tax-basis components of total distributable earnings (loss) arise when certain items of income, gain, or loss are recognized in different periods for financial statement and tax purposes; these differences will reverse at some time in the future. The differences are primarily related to the deferral of losses from wash sales and the recognition of unrealized gains or losses from certain derivative contracts. As of period end, the tax-basis components of total distributable earnings (loss) are detailed in the table as follows:
| Amount | |
| ($000) | |
| Undistributed Ordinary Income | 9,477 |
| Undistributed Long-Term Gains | 651 |
| Capital Loss Carryforwards | — |
| Qualified Late-Year Losses | — |
| Net Unrealized Gains (Losses) | 73,591 |
The tax character of distributions paid was as follows:
| Year Ended September 30, | ||
| 2020 | 2019 | |
| Amount | Amount | |
| ($000) | ($000) | |
| Ordinary Income* | 9,765 | 3,972 |
| Long-Term Capital Gains | — | 4 |
| Total | 9,765 | 3,976 |
* Includes short-term capital gains, if any.
As of September 30, 2020, gross unrealized appreciation and depreciation for investments and derivatives based on cost for U.S. federal income tax purposes were as follows:
| Amount | |
| ($000) | |
| Tax Cost | 791,418 |
| Gross Unrealized Appreciation | 82,481 |
| Gross Unrealized Depreciation | (8,890) |
| Net Unrealized Appreciation (Depreciation) | 73,591 |
76
Target Retirement 2065 Fund
E. Capital shares issued and redeemed were:
| Year Ended September 30, | ||
| 2020 | 2019 | |
| Shares | Shares | |
| (000) | (000) | |
| Issued | 26,715 | 13,620 |
| Issued in Lieu of Cash Distributions | 391 | 195 |
| Redeemed | (10,367) | (4,206) |
| Net Increase (Decrease) in Shares Outstanding | 16,739 | 9,609 |
F. Transactions during the period in affiliated underlying Vanguard funds were as follows:
| Current Period Transactions | |||||||||
| Sept. 30, | Proceeds | Realized | Sept. 30, | ||||||
| 2019 | from | Net | Change in | Capital Gain | 2020 | ||||
| Market | Purchases | Securities | Gain | Unrealized | Distributions | Market | |||
| Value | at Cost | Sold | (Loss) | App. (Dep.) | Income | Received | Value | ||
| ($000) | ($000) | ($000) | ($000) | ($000) | ($000) | ($000) | ($000) | ||
| Vanguard Market Liquidity Fund | 351 | NA1 | NA1 | — | — | 17 | — | 12,076 | |
| Vanguard Total Bond Market II Index Fund | 29,564 | 45,961 | 16,268 | 134 | 1,667 | 1,004 | — | 61,058 | |
| Vanguard Total International Bond Index Fund | 12,616 | 12,477 | 4,003 | (23) | (27) | 509 | — | 21,040 | |
| Vanguard Total International Stock Index Fund | 150,631 | 145,804 | 1,160 | — | 8,808 | 5,600 | — | 304,083 | |
| Vanguard Total Stock Market Index Fund | 227,011 | 201,687 | 12,964 | 50 | 50,968 | 6,019 | — | 466,752 | |
| Total | 420,173 | 405,929 | 34,395 | 161 | 61,416 | 13,149 | — | 865,009 | |
1 Not applicable—purchases and sales are for temporary cash investment purposes.
G. Management has determined that no events or transactions occurred subsequent to September 30, 2020, that would require recognition or disclosure in these financial statements.
77
Report of Independent Registered Public Accounting Firm
To the Board of Trustees of Vanguard Chester Funds and Shareholders of Vanguard Target Retirement 2040 Fund, Vanguard Target Retirement 2045 Fund, Vanguard Target Retirement 2050 Fund, Vanguard Target Retirement 2055 Fund, Vanguard Target Retirement 2060 Fund and Vanguard Target Retirement 2065 Fund
Opinions on the Financial Statements
We have audited the accompanying statements of assets and liabilities, including the schedules of investments, of Vanguard Target Retirement 2040 Fund, Vanguard Target Retirement 2045 Fund, Vanguard Target Retirement 2050 Fund, Vanguard Target Retirement 2055 Fund, Vanguard Target Retirement 2060 Fund and Vanguard Target Retirement 2065 Fund (six of the funds constituting Vanguard Chester Funds, hereafter collectively referred to as the “Funds”) as of September 30, 2020, the related statements of operations for the year ended September 30, 2020, the statements of changes in net assets for each of the two years in the period ended September 30, 2020, including the related notes, and the financial highlights for each of the periods indicated therein (collectively referred to as the “financial statements”). In our opinion, the financial statements present fairly, in all material respects, the financial position of each of the Funds as of September 30, 2020, the results of each of their operations for the year then ended, the changes in each of their net assets for each of the two years in the period ended September 30, 2020 and each of the financial highlights for each of the periods indicated therein in conformity with accounting principles generally accepted in the United States of America.
Basis for Opinions
These financial statements are the responsibility of the Funds’ management. Our responsibility is to express an opinion on the Funds’ financial statements based on our audits. We are a public accounting firm registered with the Public Company Accounting Oversight Board (United States) (“PCAOB”) and are required to be independent with respect to the Funds in accordance with the U.S. federal securities laws and the applicable rules and regulations of the Securities and Exchange Commission and the PCAOB.
We conducted our audits of these financial statements in accordance with the standards of the PCAOB. Those standards require that we plan and perform the audit to obtain reasonable assurance about whether the financial statements are free of material misstatement, whether due to error or fraud.
Our audits included performing procedures to assess the risks of material misstatement of the financial statements, whether due to error or fraud, and performing procedures that respond to those risks. Such procedures included examining, on a test basis, evidence regarding the amounts and disclosures in the financial statements. Our audits also included evaluating the accounting principles used and significant estimates made by management, as well as evaluating the overall presentation of the financial statements. Our procedures included confirmation of securities owned as of September 30, 2020 by correspondence with the transfer agent. We believe that our audits provide a reasonable basis for our opinions.
/s/ PricewaterhouseCoopers LLP
Philadelphia, Pennsylvania
November 12, 2020
We have served as the auditor of one or more investment companies in The Vanguard Group of Funds since 1975.
78
Special 2020 tax information (unaudited) for Vanguard Target Retirement Funds
This information for the fiscal year ended September 30, 2020, is included pursuant to provisions of the Internal Revenue Code.
The funds distributed capital gain dividends (20% rate gain distributions) to shareholders during the fiscal year as follows:
| Fund | ($000) |
| Target Retirement 2040 Fund | 123 |
| Target Retirement 2045 Fund | 287 |
| Target Retirement 2050 Fund | — |
| Target Retirement 2055 Fund | — |
| Target Retirement 2060 Fund | — |
| Target Retirement 2065 Fund | — |
For nonresident alien shareholders, 100% of short-term capital gain dividends distributed by the funds are qualified short-term capital gains.
The funds distributed qualified dividend income to shareholders during the fiscal year as follows:
| Fund | ($000) |
| Target Retirement 2040 Fund | 442,225 |
| Target Retirement 2045 Fund | 435,923 |
| Target Retirement 2050 Fund | 316,456 |
| Target Retirement 2055 Fund | 164,612 |
| Target Retirement 2060 Fund | 70,068 |
| Target Retirement 2065 Fund | 6,664 |
For corporate shareholders, the percentage of investment income (dividend income plus short-term gains, if any) that qualifies for the dividends-received deduction is as follows:
| Fund | Percentage |
| Target Retirement 2040 Fund | 33.2% |
| Target Retirement 2045 Fund | 36.2 |
| Target Retirement 2050 Fund | 36.0 |
| Target Retirement 2055 Fund | 36.4 |
| Target Retirement 2060 Fund | 35.8 |
| Target Retirement 2065 Fund | 38.1 |
79
The funds designate to shareholders foreign source income and foreign taxes paid as follows:
| Foreign Source Income | Foreign Taxes Paid | |
| Fund | ($000) | ($000) |
| Target Retirement 2040 Fund | 309,940 | 18,425 |
| Target Retirement 2045 Fund | 290,891 | 18,474 |
| Target Retirement 2050 Fund | 217,362 | 13,815 |
| Target Retirement 2055 Fund | 117,890 | 7,505 |
| Target Retirement 2060 Fund | 52,707 | 3,364 |
| Target Retirement 2065 Fund | 6,418 | 412 |
Shareholders will receive more detailed information with their Form 1099-DIV in January 2021 to determine the calendar-year amounts to be included on their 2020 tax returns.
80
BLOOMBERG is a trademark and service mark of Bloomberg Finance L.P. BARCLAYS is a trademark and service mark of Barclays Bank Plc, used under license. Bloomberg Finance L.P. and its affiliates, including Bloomberg Index Services Limited (BISL) (collectively, Bloomberg), or Bloomberg’s licensors, own all proprietary rights in the Bloomberg Barclays U.S. Aggregate Bond Index, Bloomberg Barclays U.S. Aggregate Float Adjusted Index, and the Bloomberg Barclays Global Aggregate ex-USD Float Adjusted RIC Capped Index (USD Hedged) (the Indices or Bloomberg Barclays Indices).
Neither Barclays Bank Plc, Barclays Capital Inc., or any affiliate (collectively Barclays) or Bloomberg is the issuer or producer of the Target Retirement Funds (including the Total Bond Market II Index Fund and the Total International Bond Index Fund) and neither Bloomberg nor Barclays has any responsibilities, obligations or duties to investors in the Target Retirement Funds. The Indices are licensed for use by The Vanguard Group, Inc. (Vanguard) as the sponsor of the Target Retirement Funds. Bloomberg and Barclays’ only relationship with Vanguard in respect to the Indices is the licensing of the Indices, which is determined, composed and calculated by BISL, or any successor thereto, without regard to the Issuer or the Target Retirement Funds or the owners of the Target Retirement Funds.
Additionally, Vanguard may for itself execute transaction(s) with Barclays in or relating to the Indices in connection with the Target Retirement Funds. Investors acquire the Target Retirement Funds from Vanguard and investors neither acquire any interest in the Indices nor enter into any relationship of any kind whatsoever with Bloomberg or Barclays upon making an investment in the Target Retirement Funds. The Target Retirement Funds are not sponsored, endorsed, sold or promoted by Bloomberg or Barclays. Neither Bloomberg nor Barclays makes any representation or warranty, express or implied regarding the advisability of investing in the Target Retirement Funds or the advisability of investing in securities generally or the ability of the Indices to track corresponding or relative market performance. Neither Bloomberg nor Barclays has passed on the legality or suitability of the Target Retirement Funds with respect to any person or entity. Neither Bloomberg nor Barclays is responsible for and has not participated in the determination of the timing of, prices at, or quantities of the Target Retirement Funds to be issued. Neither Bloomberg nor Barclays has any obligation to take the needs of the Issuer or the owners of the Target Retirement Funds or any other third party into consideration in determining, composing or calculating the Indices. Neither Bloomberg nor Barclays has any obligation or liability in connection with administration, marketing or trading of the Target Retirement Funds.
The licensing agreement between Bloomberg and Barclays is solely for the benefit of Bloomberg and Barclays and not for the benefit of the owners of the Target Retirement Funds, investors or other third parties. In addition, the licensing agreement between Vanguard and Bloomberg is solely for the benefit of Vanguard and Bloomberg and not for the benefit of the owners of the Target Retirement Funds, investors or other third parties.
81
NEITHER BLOOMBERG NOR BARCLAYS SHALL HAVE ANY LIABILITY TO THE ISSUER, INVESTORS OR TO OTHER THIRD PARTIES FOR THE QUALITY, ACCURACY AND/OR COMPLETENESS OF THE BLOOMBERG BARCLAYS INDICES OR ANY DATA INCLUDED THEREIN OR FOR INTERRUPTIONS IN THE DELIVERY OF THE BLOOMBERG BARCLAYS INDICES. NEITHER BLOOMBERG NOR BARCLAYS MAKES ANY WARRANTY, EXPRESS OR IMPLIED, AS TO RESULTS TO BE OBTAINED BY THE ISSUER, THE INVESTORS OR ANY OTHER PERSON OR ENTITY FROM THE USE OF THE BLOOMBERG BARCLAYS INDICES OR ANY DATA INCLUDED THEREIN. NEITHER BLOOMBERG NOR BARCLAYS MAKES ANY EXPRESS OR IMPLIED WARRANTIES, AND EACH HEREBY EXPRESSLY DISCLAIMS ALL WARRANTIES OF MERCHANTABILITY OR FITNESS FOR A PARTICULAR PURPOSE OR USE WITH RESPECT TO BLOOMBERG BARCLAYS INDICES OR ANY DATA INCLUDED THEREIN. BLOOMBERG RESERVES THE RIGHT TO CHANGE THE METHODS OF CALCULATION OR PUBLICATION, OR TO CEASE THE CALCULATION OR PUBLICATION OF THE BLOOMBERG BARCLAYS INDICES, AND NEITHER BLOOMBERG NOR BARCLAYS SHALL BE LIABLE FOR ANY MISCALCULATION OF OR ANY INCORRECT, DELAYED OR INTERRUPTED PUBLICATION WITH RESPECT TO ANY OF THE BLOOMBERG BARCLAYS INDICES. NEITHER BLOOMBERG NOR BARCLAYS SHALL BE LIABLE FOR ANY DAMAGES, INCLUDING, WITHOUT LIMITATION, ANY SPECIAL, INDIRECT OR CONSEQUENTIAL DAMAGES, OR ANY LOST PROFITS AND EVEN IF ADVISED OF THE POSSIBILITY OF SUCH, RESULTING FROM THE USE OF BLOOMBERG BARCLAYS INDICES OR ANY DATA INCLUDED THEREIN OR WITH RESPECT TO THE TARGET RETIREMENT FUNDS.
None of the information supplied by Bloomberg or Barclays and used in this publication may be reproduced in any manner without the prior written permission of both Bloomberg and Barclays Capital, the investment banking division of Barclays Bank Plc. Barclays Bank Plc is registered in England No. 1026167. Registered office 1 Churchill Place London E14 5HP.
© 2020 Bloomberg. Used with Permission.
Source: Bloomberg Index Services Limited. Copyright 2020, Bloomberg. All rights reserved.
82
The People Who Govern Your Fund
The trustees of your mutual fund are there to see that the fund is operated and managed in your best interests since, as a shareholder, you are a part owner of the fund. Your fund’s trustees also serve on the board of directors of The Vanguard Group, Inc., which is owned by the Vanguard funds and provides services to them.
A majority of Vanguard’s board members are independent, meaning that they have no affiliation with Vanguard or the funds they oversee, apart from the sizable personal investments they have made as private individuals. The independent board members have distinguished backgrounds in business, academia, and public service. Each of the trustees and executive officers oversees 213 Vanguard funds.
Information for each trustee and executive officer of the fund appears below. That information, as well as the Vanguard fund count, is as of the date on the cover of this fund report. The mailing address of the trustees and officers is P.O. Box 876, Valley Forge, PA 19482. More information about the trustees is in the Statement of Additional Information, which can be obtained, without charge, by contacting Vanguard at 800-662-7447, or online at vanguard.com.
Interested Trustee1
Mortimer J. Buckley
Born in 1969. Trustee since January 2018. Principal occupation(s) during the past five years and other experience: chairman of the board (2019–present) of Vanguard and of each of the investment companies served by Vanguard; chief executive officer (2018– present) of Vanguard; chief executive officer, president, and trustee (2018–present) of each of the investment companies served by Vanguard; president and director (2017–present) of Vanguard; and president (2018–present) of Vanguard Marketing Corporation. Chief investment officer (2013–2017), managing director (2002–2017), head of the Retail Investor Group (2006–2012), and chief information officer (2001–2006) of Vanguard. Chairman of the board (2011–2017) and trustee (2009–2017) of the Children’s Hospital of Philadelphia; and trustee (2018–present) and vice chair (2019–present) of The Shipley School.
Independent Trustees
Emerson U. Fullwood
Born in 1948. Trustee since January 2008. Principal occupation(s) during the past five years and other experience: executive chief staff and marketing officer for North America and corporate vice president (retired 2008) of Xerox Corporation (document management products and services). Former president of the Worldwide Channels Group, Latin America, and Worldwide Customer Service and executive chief staff officer of Developing Markets of Xerox. Executive in residence and 2009–2010 Distinguished Minett Professor at the Rochester Institute of Technology. Director of SPX FLOW, Inc. (multi-industry manufacturing). Director of the University of Rochester Medical Center, the Monroe Community College Foundation, the United Way of Rochester, North Carolina A&T University, and Roberts Wesleyan College. Trustee of the University of Rochester.
Amy Gutmann
Born in 1949. Trustee since June 2006. Principal occupation(s) during the past five years and other experience: president (2004–present) of the University of Pennsylvania. Christopher H. Browne Distinguished Professor of Political Science, School of Arts and Sciences, and professor of communication, Annenberg School for Communication, with secondary faculty appointments in the Department of Philosophy, School of Arts and Sciences, and at the Graduate School of Education, University of Pennsylvania.
F. Joseph Loughrey
Born in 1949. Trustee since October 2009. Principal occupation(s) during the past five years and other experience: president and chief operating officer (retired 2009) and vice chairman of the board (2008–2009) of Cummins Inc. (industrial machinery). Chairman of the board of Hillenbrand, Inc. (specialized consumer services) and the Lumina Foundation. Director of the V Foundation. Member of the advisory
| 1 | Mr. Buckley is considered an “interested person,” as defined in the Investment Company Act of 1940, because he is an officer of the Vanguard funds. |
council for the College of Arts and Letters and chair of the advisory board to the Kellogg Institute for International Studies, both at the University of Notre Dame.
Mark Loughridge
Born in 1953. Trustee since March 2012. Principal occupation(s) during the past five years and other experience: senior vice president and chief financial officer (retired 2013) of IBM (information technology services). Fiduciary member of IBM’s Retirement Plan Committee (2004–2013), senior vice president and general manager (2002–2004) of IBM Global Financing, vice president and controller (1998–2002) of IBM, and a variety of other prior management roles at IBM. Member of the Council on Chicago Booth.
Scott C. Malpass
Born in 1962. Trustee since March 2012. Principal occupation(s) during the past five years and other experience: chief investment officer (retired June 2020) and vice president (retired June 2020) of the University of Notre Dame. Assistant professor of finance at the Mendoza College of Business, University of Notre Dame, and member of the Notre Dame 403(b) Investment Committee (retired June 2020). Member of the board of Catholic Investment Services, Inc. (investment advisors) and the board of superintendence of the Institute for the Works of Religion.
Deanna Mulligan
Born in 1963. Trustee since January 2018. Principal occupation(s) during the past five years and other experience: board chair (2020–present), chief executive officer (2011–2020), and president (2010–2019) of The Guardian Life Insurance Company of America. Chief operating officer (2010–2011) and executive vice president (2008–2010) of the individual life and disability division of Guardian Life. Member of the board of the American Council of Life Insurers and the board of the Economic Club of New York. Trustee of the Partnership for New York City (business leadership), Chief Executives for Corporate Purpose, NewYork-Presbyterian Hospital, Catalyst, and the Bruce Museum (arts and science). Member of the Advisory Council for the Stanford Graduate School of Business.
André F. Perold
Born in 1952. Trustee since December 2004. Principal occupation(s) during the past five years and other experience: George Gund Professor of Finance and Banking, Emeritus at the Harvard Business School (retired 2011). Chief investment officer and co-managing partner of HighVista Strategies (private investment firm). Member of the board of advisors and member of the investment committee of the Museum of Fine Arts Boston. Member of the board (2018–present) of RIT Capital Partners (investment firm). Member of the investment committee of Partners Health Care System.
Sarah Bloom Raskin
Born in 1961. Trustee since January 2018. Principal occupation(s) during the past five years and other experience: deputy secretary (2014–2017) of the United States Department of the Treasury. Governor (2010–2014) of the Federal Reserve Board. Commissioner (2007–2010) of financial regulation for the State of Maryland. Member of the board of directors (2012–2014) of Neighborhood Reinvestment Corporation. Director (2017–present) of i(x) Investments, LLC; director (2017–present) of Reserve Trust. Rubenstein Fellow (2017–present) of Duke University; trustee (2017–present) of Amherst College, and trustee (2019–present) of the Folger Shakespeare Library.
Peter F. Volanakis
Born in 1955. Trustee since July 2009. Principal occupation(s) during the past five years and other experience: president and chief operating officer (retired 2010) of Corning Incorporated (communications equipment) and director of Corning Incorporated (2000–2010) and Dow Corning (2001–2010). Director (2012) of SPX Corporation (multi-industry manufacturing). Overseer of the Amos Tuck School of Business Administration, Dartmouth College (2001–2013). Chairman of the board of trustees of Colby-Sawyer College. Member of the board of Hypertherm Inc. (industrial cutting systems, software, and consumables).
Executive Officers
John Bendl
Born in 1970. Principal occupation(s) during the past five years and other experience: principal of Vanguard. Chief financial officer (2019–present) of each of the investment companies served by Vanguard. Chief accounting officer, treasurer, and controller of Vanguard (2017–present). Partner (2003–2016) at KPMG (audit, tax, and advisory services).
Christine M. Buchanan
Born in 1970. Principal occupation(s) during the past five years and other experience: principal of Vanguard. Treasurer (2017–present) of each of the investment companies served by Vanguard. Partner (2005–2017) at KPMG (audit, tax, and advisory services).
David Cermak
Born in 1960. Principal occupation(s) during the past five years and other experience: principal of Vanguard. Finance director (2019–present) of each of the investment companies served by Vanguard. Managing director and head (2017–present) of Vanguard Investments Singapore. Managing director and head (2017–2019) of Vanguard Investments Hong Kong. Representative director and head (2014–2017) of Vanguard Investments Japan.
John Galloway
Born in 1973. Principal occupation(s) during the past five years and other experience: principal of Vanguard. Investment stewardship officer (September 2020–present) of each of the investment companies served by Vanguard. Head of Investor Advocacy (February 2020–present) and head of Marketing Strategy and Planning (2017–2020) at Vanguard. Deputy assistant to the President of the United States (2015).
Thomas J. Higgins
Born in 1957. Principal occupation(s) during the past five years and other experience: principal of Vanguard. Finance director (2019–present), chief financial officer (2008–2019), and treasurer (1998–2008) of each of the investment companies served by Vanguard.
Peter Mahoney
Born in 1974. Principal occupation(s) during the past five years and other experience: principal of Vanguard. Controller (2015–present) of each of the investment companies served by Vanguard. Head of International Fund Services (2008–2014) at Vanguard.
Anne E. Robinson
Born in 1970. Principal occupation(s) during the past five years and other experience: general counsel (2016–present) of Vanguard. Secretary (2016–present) of Vanguard and of each of the investment companies served by Vanguard. Managing director (2016–present) of Vanguard. Managing director and general counsel of Global Cards and Consumer Services (2014–2016) at Citigroup. Counsel (2003–2014) at American Express.
Michael Rollings
Born in 1963. Principal occupation(s) during the past five years and other experience: finance director (2017–present) and treasurer (2017) of each of the investment companies served by Vanguard. Managing director (2016–present) of Vanguard. Chief financial officer (2016–present) of Vanguard. Director (2016–present) of Vanguard Marketing Corporation. Executive vice president and chief financial officer (2006–2016) of MassMutual Financial Group.
John E. Schadl
Born in 1972. Principal occupation(s) during the past five years and other experience: principal of Vanguard. Chief compliance officer (2019–present) of Vanguard and of each of the investment companies served by Vanguard. Assistant vice president (2019–present) of Vanguard Marketing Corporation.
| Vanguard Senior Management Team | ||
| Joseph Brennan | James M. Norris | |
| Mortimer J. Buckley | Thomas M. Rampulla | |
| Gregory Davis | Karin A. Risi | |
| John James | Anne E. Robinson | |
| John T. Marcante | Michael Rollings | |
| Chris D. McIsaac | Lauren Valente |
Connect with Vanguard® > vanguard.com
Fund Information > 800-662-7447
Direct Investor Account Services > 800-662-2739
Institutional Investor Services > 800-523-1036
Text Telephone for People
Who Are Deaf or Hard of Hearing > 800-749-7273
This material may be used in conjunction with the offering of shares of any Vanguard fund only if preceded or accompanied by the fund’s current prospectus.
All comparative mutual fund data are from Morningstar, Inc., unless otherwise noted.
You can obtain a free copy of Vanguard’s proxy voting guidelines by visiting vanguard.com/proxyreporting or by calling Vanguard at 800-662-2739. The guidelines are also available from the SEC’s website, www.sec.gov. In addition, you may obtain a free report on how your fund voted the proxies for securities it owned during the 12 months ended June 30. To get the report, visit either vanguard.com/proxyreporting or www.sec.gov.
You can review information about your fund on the SEC’s website, and you can receive copies of this information, for a fee, by sending a request via email addressed to publicinfo@sec.gov.
| © 2020 The Vanguard Group, Inc. | |
| All rights reserved. | |
| Vanguard Marketing Corporation, Distributor. | |
| Q3080B 112020 |

Annual Report | September 30, 2020
Vanguard Institutional Target Retirement Funds
|
Vanguard Institutional Target Retirement Income Fund
Vanguard Institutional Target Retirement 2015 Fund
Vanguard Institutional Target Retirement 2020 Fund
Vanguard Institutional Target Retirement 2025 Fund
Vanguard Institutional Target Retirement 2030 Fund
Vanguard Institutional Target Retirement 2035 Fund
See the inside front cover for important information about access to your fund’s annual and semiannual shareholder reports.
|
Important information about access to shareholder reports
Beginning on January 1, 2021, as permitted by regulations adopted by the Securities and Exchange Commission, paper copies of your fund’s annual and semiannual shareholder reports will no longer be sent to you by mail, unless you specifically request them. Instead, you will be notified by mail each time a report is posted on the website and will be provided with a link to access the report.
If you have already elected to receive shareholder reports electronically, you will not be affected by this change and do not need to take any action. You may elect to receive shareholder reports and other communications from the fund electronically by contacting your financial intermediary (such as a broker-dealer or bank) or, if you invest directly with the fund, by calling Vanguard at one of the phone numbers on the back cover of this report or by logging on to vanguard.com.
You may elect to receive paper copies of all future shareholder reports free of charge. If you invest through a financial intermediary, you can contact the intermediary to request that you continue to receive paper copies. If you invest directly with the fund, you can call Vanguard at one of the phone numbers on the back cover of this report or log on to vanguard.com. Your election to receive paper copies will apply to all the funds you hold through an intermediary or directly with Vanguard.
| Contents | |
| Your Fund’s Performance at a Glance | 1 |
| About Your Fund’s Expenses | 2 |
| Institutional Target Retirement Income Fund | 4 |
| Institutional Target Retirement 2015 Fund | 17 |
| Institutional Target Retirement 2020 Fund | 30 |
| Institutional Target Retirement 2025 Fund | 43 |
| Institutional Target Retirement 2030 Fund | 56 |
| Institutional Target Retirement 2035 Fund | 69 |
Please note: The opinions expressed in this report are just that—informed opinions. They should not be considered promises or advice. Also, please keep in mind that the information and opinions cover the period through the date on the front of this report. Of course, the risks of investing in your fund are spelled out in the prospectus.
Your Fund’s Performance at a Glance
· For the 12 months ended September 30, 2020, returns for the six Vanguard Institutional Target Retirement Funds covered in this report ranged from 7.52% for the Institutional Target Retirement Income Fund to 9.70% for the Institutional Target Retirement 2035 Fund. (The funds with target dates of 2040 through 2065 are covered in a separate report.) The funds with a higher allocation to stocks did best.
· The rebound in global stocks that began in March continued in the third quarter. Massive fiscal and monetary support from governments and central banks, signs of economic healing, and reported progress toward a COVID-19 vaccine all buoyed the markets until September, when investor sentiment soured a little.
· In the global bond market, the pandemic led to a wave of issuance, which drove up supply, but demand held up fairly well. U.S. Treasury yields ended the quarter little changed.
· Vanguard Institutional Target Retirement Funds are designed to reach an allocation of 70% bonds and 30% stocks within seven years after their target dates. The funds invest all of their assets in Vanguard index funds that seek to match the performance of broad stock and bond market indexes.
· From their inception dates through September 30, the funds’ average annual returns ranged from 5.29% for the Institutional Target Retirement Income Fund to 7.22% for the Institutional Target Retirement 2035 Fund.
Market Barometer
| Average Annual Total Returns | |||||||||||
| Periods Ended September 30, 2020 | |||||||||||
| One Year | Three Years | Five Years | |||||||||
| Stocks | |||||||||||
| Russell 1000 Index (Large-caps) | 16.01% | 12.38% | 14.09% | ||||||||
| Russell 2000 Index (Small-caps) | 0.39 | 1.77 | 8.00 | ||||||||
| Russell 3000 Index (Broad U.S. market) | 15.00 | 11.65 | 13.69 | ||||||||
| FTSE All-World ex US Index (International) | 3.55 | 1.50 | 6.49 | ||||||||
| Bonds | |||||||||||
| Bloomberg Barclays U.S. Aggregate Bond Index (Broad taxable market) | 6.98% | 5.24% | 4.18% | ||||||||
| Bloomberg Barclays Municipal Bond Index (Broad tax-exempt market) | 4.09 | 4.28 | 3.84 | ||||||||
| FTSE Three-Month U.S. Treasury Bill Index | 1.02 | 1.65 | 1.15 | ||||||||
| CPI | |||||||||||
| Consumer Price Index | 1.37% | 1.79% | 1.81% | ||||||||
1
About Your Fund’s Expenses
As a shareholder of the fund, you incur ongoing costs, which include costs for portfolio management, administrative services, and shareholder reports (like this one), among others. Operating expenses, which are deducted from a fund’s gross income, directly reduce the investment return of the fund.
A typical fund’s expenses are expressed as a percentage of its average net assets. The Institutional Target Retirement Funds have no direct expenses, but each fund bears its proportionate share of the costs for the underlying funds in which it invests. These indirect expenses make up the acquired fund fees and expenses, also expressed as a percentage of average net assets.
The following examples are intended to help you understand the ongoing cost (in dollars) of investing in your fund and to compare these costs with those of other mutual funds. The examples are based on an investment of $1,000 made at the beginning of the period shown and held for the entire period. The costs were calculated using the acquired fund fees and expenses for each Institutional Target Retirement Fund.
The accompanying table illustrates your fund’s costs in two ways:
· Based on actual fund return. This section helps you to estimate the actual expenses that you paid over the period. The ”Ending Account Value“ shown is derived from the fund‘s actual return, and the third column shows the dollar amount that would have been paid by an investor who started with $1,000 in the fund. You may use the information here, together with the amount you invested, to estimate the expenses that you paid over the period.
To do so, simply divide your account value by $1,000 (for example, an $8,600 account value divided by $1,000 = 8.6), then multiply the result by the number given for your fund under the heading ”Expenses Paid During Period.“
· Based on hypothetical 5% yearly return. This section is intended to help you compare your fund‘s costs with those of other mutual funds. It assumes that the fund had a yearly return of 5% before expenses, but that the expense ratio is unchanged. In this case—because the return used is not the fund’s actual return—the results do not apply to your investment. The example is useful in making comparisons because the Securities and Exchange Commission requires all mutual funds to calculate expenses based on a 5% return. You can assess your fund’s costs by comparing this hypothetical example with the hypothetical examples that appear in shareholder reports of other funds.
Note that the expenses shown in the table are meant to highlight and help you compare ongoing costs only and do not reflect transaction costs incurred by the fund for buying and selling securities. Further, the expenses do not include any purchase, redemption, or account service fees described in the fund prospectus. If such fees were applied to your account, your costs would be higher. Your fund does not carry a “sales load.”
The calculations assume no shares were bought or sold during the period. Your actual costs may have been higher or lower, depending on the amount of your investment and the timing of any purchases or redemptions.
You can find more information about the fund’s expenses, including annual expense ratios, in the Financial Statements section of this report. For additional information on operating expenses and other shareholder costs, please refer to your fund’s current prospectus.
2
Six Months Ended September 30, 2020
| Beginning | Ending | Expenses | |
| Account Value | Account Value | Paid During | |
| 3/31/2020 | 9/30/2020 | Period | |
| Based on Actual Fund Return | |||
| Institutional Target Retirement Income Fund | $1,000.00 | $1,112.78 | $0.48 |
| Institutional Target Retirement 2015 Fund | $1,000.00 | $1,126.82 | $0.48 |
| Institutional Target Retirement 2020 Fund | $1,000.00 | $1,164.03 | $0.49 |
| Institutional Target Retirement 2025 Fund | $1,000.00 | $1,190.43 | $0.49 |
| Institutional Target Retirement 2030 Fund | $1,000.00 | $1,211.12 | $0.50 |
| Institutional Target Retirement 2035 Fund | $1,000.00 | $1,231.56 | $0.50 |
| Based on Hypothetical 5% Yearly Return | |||
| Institutional Target Retirement Income Fund | $1,000.00 | $1,024.55 | $0.46 |
| Institutional Target Retirement 2015 Fund | $1,000.00 | $1,024.55 | $0.46 |
| Institutional Target Retirement 2020 Fund | $1,000.00 | $1,024.55 | $0.46 |
| Institutional Target Retirement 2025 Fund | $1,000.00 | $1,024.55 | $0.46 |
| Institutional Target Retirement 2030 Fund | $1,000.00 | $1,024.55 | $0.46 |
| Institutional Target Retirement 2035 Fund | $1,000.00 | $1,024.55 | $0.46 |
The calculations are based on the acquired fund fees and expenses for the most recent six-month period. The funds’ annualized expense figures for that period are (in order as listed from top to bottom above) 0.09%, 0.09%, 0.09%, 0.09%, 0.09%, and 0.09%. The dollar amounts shown as ”Expenses Paid” are equal to the annualized expense figures for the underlying funds multiplied by the average account value over the period, multiplied by the number of days in the most recent six-month period, then divided by the number of days in the most recent 12-month period (183/366).
3
Institutional Target Retirement Income Fund
Performance Summary
All of the returns in this report represent past performance, which is not a guarantee of future results that may be achieved by the fund. (Current performance may be lower or higher than the performance data cited. For performance data current to the most recent month-end, visit our website at vanguard.com/performance.) Note, too, that both investment returns and principal value can fluctuate widely, so an investor’s shares, when sold, could be worth more or less than their original cost. The returns shown do not reflect taxes that a shareholder would pay on fund distributions or on the sale of fund shares.
Cumulative Performance: June 26, 2015, Through September 30, 2020
Initial Investment of $100,000,000

| Average Annual Total Returns | |||||
| Periods Ended September 30, 2020 | |||||
| Since | Final Value | ||||
| One | Five | Inception | of a $100,000,000 | ||
| Year | Years | (6/26/2015) | Investment | ||
 | Institutional Target Retirement Income Fund | 7.52% | 6.10% | 5.29% | $131,161,006 |
 | Target Income Composite Index | 8.07 | 6.31 | 5.49 | 132,489,181 |
 | Bloomberg Barclays U.S. Aggregate Bond Index | 6.98 | 4.18 | 4.33 | 124,995,641 |
Target Income Composite Index: Derived by applying the fund’s target asset allocation to the results of the following benchmarks: for international stocks of developed markets, the MSCI EAFE Index through December 15, 2010, the MSCI ACWI ex USA IMI Index through June 2, 2013, and the FTSE Global All Cap ex US Index thereafter; for emerging-market stocks, the Select Emerging Markets Index through August 23, 2006, the MSCI Emerging Markets Index through December 15, 2010, the MSCI ACWI ex USA IMI Index through June 2, 2013, and the FTSE Global All Cap ex US Index thereafter; for U.S. bonds, the Bloomberg Barclays U.S. Aggregate Bond Index through December 31, 2009, and the Bloomberg Barclays U.S. Aggregate Float Adjusted Index thereafter, as well as the Bloomberg Barclays U.S. Treasury Inflation-Protected Securities Index through June 2, 2013, and the Bloomberg Barclays U.S. Treasury Inflation-Protected Securities (TIPS) 0–5 Year Index thereafter; for short-term reserves, the Citigroup Three-Month Treasury Bill Index through June 2, 2013; for international bonds, the Bloomberg Barclays Global Aggregate ex-USD Float Adjusted RIC Capped Index Hedged beginning June 3, 2013; and for U.S. stocks, the Dow Jones U.S. Total Stock Market Index (formerly known as the Dow Jones Wilshire 5000 Index) through April 22, 2005, the MSCI US Broad Market Index through June 2, 2013, and the CRSP US Total Market Index thereafter. International stock benchmark returns are adjusted for withholding taxes.
"Since Inception" performance is calculated from the fund’s inception date for both the fund and its comparative standards.
See Financial Highlights for dividend and capital gains information.
4
Institutional Target Retirement Income Fund
Underlying Vanguard Funds
As of September 30, 2020
| Vanguard Total Bond Market II Index Fund Investor Shares | 37.5 | % | |
| Vanguard Total Stock Market Index Fund Institutional Shares | 17.6 | ||
| Vanguard Short-Term Inflation-Protected Securities Index Fund Admiral Shares | 17.0 | ||
| Vanguard Total International Bond Index Fund Admiral Shares | 16.0 | ||
| Vanguard Total International Stock Index Fund Investor Shares | 11.9 |
The table reflects the fund's investments, except for short-term investments and derivatives.
5
Institutional Target Retirement Income Fund
Financial Statements
Schedule of Investments
As of September 30, 2020
The fund files its complete schedule of portfolio holdings with the Securities and Exchange Commission (SEC) for the first and third quarters of each fiscal year as an exhibit to its reports on Form N-PORT. The fund’s Form N-PORT reports are available on the SEC’s website at www.sec.gov.
| Market | ||
| Value• | ||
| Shares | ($000) | |
| Investment Companies (98.6%) | ||
| U.S. Stock Fund (17.3%) | ||
| Vanguard Total Stock Market Index Fund Institutional Shares | 14,725,554 | 1,221,485 |
| International Stock Fund (11.7%) | ||
| Vanguard Total International Stock Index Fund Investor Shares | 49,365,651 | 827,368 |
| U.S. Bond Funds (53.8%) | ||
| 1 Vanguard Total Bond Market II Index Fund Investor Shares | 225,406,529 | 2,601,192 |
| Vanguard Short-Term Inflation-Protected Securities Index Fund Admiral Shares | 46,519,110 | 1,183,446 |
| 3,784,638 | ||
| International Bond Fund (15.8%) | ||
| Vanguard Total International Bond Index Fund Admiral Shares | 47,746,493 | 1,109,628 |
| Total Investment Companies (Cost $6,099,739) | 6,943,119 | |
| Temporary Cash Investment (1.6%) | ||
| Money Market Fund (1.6%) | ||
| 1 Vanguard Market Liquidity Fund, 0.117% (Cost $113,248) | 1,132,507 | 113,251 |
| Total Investments (100.2%) (Cost $6,212,987) | 7,056,370 | |
| Other Assets and Liabilities—Net (-0.2%) | (15,439) | |
| Net Assets (100%) | 7,040,931 |
Cost is in $000.
| • | See Note A in Notes to Financial Statements. |
| 1 | Affiliated fund available only to Vanguard funds and certain trusts and accounts managed by Vanguard. Rate shown for Vanguard Market Liquidity Fund is the 7-day yield. |
6
Institutional Target Retirement Income Fund
| Derivative Financial Instruments Outstanding as of Period End | |||||
| Futures Contracts | |||||
| ($000) | |||||
| Value and | |||||
| Number of | Unrealized | ||||
| Long (Short) | Notional | Appreciation | |||
| Expiration | Contracts | Amount | (Depreciation) | ||
| Long Futures Contracts | |||||
| E-mini S&P 500 Index | December 2020 | 321 | 53,800 | 557 | |
| 10-Year U.S. Treasury Note | December 2020 | 303 | 42,278 | 32 | |
| 589 | |||||
See accompanying Notes, which are an integral part of the Financial Statements.
7
Institutional Target Retirement Income Fund
Statement of Assets and Liabilities
As of September 30, 2020
| ($000s, except shares and per-share amounts) | Amount |
| Assets | |
| Investments in Securities, at Value—Affiliated Funds (Cost $6,212,987) | 7,056,370 |
| Cash Collateral Pledged—Futures Contracts | 5,413 |
| Receivables for Investment Securities Sold | 3,435 |
| Receivables for Accrued Income | 11,509 |
| Receivables for Capital Shares Issued | 5,289 |
| Variation Margin Receivable—Futures Contracts | 431 |
| Total Assets | 7,082,447 |
| Liabilities | |
| Payables for Investment Securities Purchased | 11,509 |
| Payables for Capital Shares Redeemed | 29,906 |
| Variation Margin Payable—Futures Contracts | 101 |
| Total Liabilities | 41,516 |
| Net Assets | 7,040,931 |
| At September 30, 2020, net assets consisted of: | |
| Paid-in Capital | 6,148,730 |
| Total Distributable Earnings (Loss) | 892,201 |
| Net Assets | 7,040,931 |
| Net Assets | |
| Applicable to 300,469,780 outstanding $.001 par value shares of beneficial interest (unlimited authorization) | 7,040,931 |
| Net Asset Value Per Share | $23.43 |
See accompanying Notes, which are an integral part of the Financial Statements.
8
Institutional Target Retirement Income Fund
Statement of Operations
| Year Ended | |
| September 30, 2020 | |
| ($000) | |
| Investment Income | |
| Income | |
| Income Distributions Received from Affiliated Funds | 145,584 |
| Other Income | 3 |
| Net Investment Income—Note B | 145,587 |
| Realized Net Gain (Loss) | |
| Capital Gain Distributions Received from Affiliated Funds | — |
| Affiliated Funds Sold | 36,380 |
| Futures Contracts | 8,842 |
| Realized Net Gain (Loss) | 45,222 |
| Change in Unrealized Appreciation (Depreciation) | |
| Affiliated Funds | 287,834 |
| Futures Contracts | 589 |
| Change in Unrealized Appreciation (Depreciation) | 288,423 |
| Net Increase (Decrease) in Net Assets Resulting from Operations | 479,232 |
See accompanying Notes, which are an integral part of the Financial Statements.
9
Institutional Target Retirement Income Fund
Statement of Changes in Net Assets
| Year Ended September 30, | ||||
| 2020 | 2019 | |||
| ($000) | ($000) | |||
| Increase (Decrease) in Net Assets | ||||
| Operations | ||||
| Net Investment Income | 145,587 | 152,437 | ||
| Realized Net Gain (Loss) | 45,222 | 3,112 | ||
| Change in Unrealized Appreciation (Depreciation) | 288,423 | 247,509 | ||
| Net Increase (Decrease) in Net Assets Resulting from Operations | 479,232 | 403,058 | ||
| Distributions1 | ||||
| Total Distributions | (142,415) | (162,258) | ||
| Capital Share Transactions | ||||
| Issued | 1,518,511 | 1,303,756 | ||
| Issued in Lieu of Cash Distributions | 141,434 | 161,167 | ||
| Redeemed | (1,297,709) | (1,024,418) | ||
| Net Increase (Decrease) from Capital Share Transactions | 362,236 | 440,505 | ||
| Total Increase (Decrease) | 699,053 | 681,305 | ||
| Net Assets | ||||
| Beginning of Period | 6,341,878 | 5,660,573 | ||
| End of Period | 7,040,931 | 6,341,878 | ||
1 Certain prior-period numbers have been reclassified to conform with the current-period presentation.
See accompanying Notes, which are an integral part of the Financial Statements.
10
Institutional Target Retirement Income Fund
Financial Highlights
| For a Share Outstanding | Year Ended September 30, | ||||
| Throughout Each Period | 2020 | 2019 | 2018 | 2017 | 2016 |
| Net Asset Value, Beginning of Period | $22.27 | $21.45 | $21.27 | $20.60 | $19.46 |
| Investment Operations | |||||
| Net Investment Income | .4991 | .5521 | .5371 | .4041 | .341 |
| Capital Gain Distributions Received | — | — | .0021 | .0061 | .010 |
| Net Realized and Unrealized Gain (Loss) | |||||
| on Investments | 1.153 | .860 | .167 | .667 | 1.127 |
| Total from Investment Operations | 1.652 | 1.412 | .706 | 1.077 | 1.478 |
| Distributions | |||||
| Dividends from Net Investment Income | (.481) | (.569) | (.522) | (.398) | (.337) |
| Distributions from Realized Capital Gains | (.011) | (.023) | (.004) | (.009) | (.001) |
| Total Distributions | (.492) | (.592) | (.526) | (.407) | (.338) |
| Net Asset Value, End of Period | $23.43 | $22.27 | $21.45 | $21.27 | $20.60 |
| Total Return | 7.52% | 6.73% | 3.34% | 5.30% | 7.66% |
| Ratios/Supplemental Data | |||||
| Net Assets, End of Period (Millions) | $7,041 | $6,342 | $5,661 | $5,039 | $2,031 |
| Ratio of Total Expenses to Average Net Assets | — | — | — | — | — |
| Acquired Fund Fees and Expenses | 0.09% | 0.09% | 0.09% | 0.09% | 0.09% |
| Ratio of Net Investment Income to | |||||
| Average Net Assets | 2.21% | 2.56% | 2.50% | 1.94% | 1.83% |
| Portfolio Turnover Rate | 21% | 12% | 13% | 7% | 7% |
1 Calculated based on average shares outstanding.
See accompanying Notes, which are an integral part of the Financial Statements.
11
Institutional Target Retirement Income Fund
Notes to Financial Statements
Vanguard Institutional Target Retirement Income Fund is registered under the Investment Company Act of 1940 as an open-end investment company, or mutual fund. The fund follows a balanced investment strategy by investing in selected Vanguard funds to achieve its targeted allocation of assets to U.S. and international stocks, and U.S. and international bonds. Financial statements and other information about each underlying fund are available at www.vanguard.com.
Market disruptions associated with the COVID-19 pandemic have had a global impact, and uncertainty exists as to the long-term implications. Such disruptions can adversely affect assets of the fund and thus fund performance.
A. The following significant accounting policies conform to generally accepted accounting principles for U.S. investment companies. The fund consistently follows such policies in preparing its financial statements.
1. Security Valuation: Investments are valued at the net asset value of each underlying Vanguard fund determined as of the close of the New York Stock Exchange (generally 4 p.m., Eastern time) on the valuation date.
2. Futures Contracts: The fund uses stock and bond futures contracts to a limited extent, with the objectives of maintaining full exposure to the market and maintaining its target asset allocation. The primary risks associated with the use of futures contracts are imperfect correlation between changes in market values of investments held by the fund and the prices of futures contracts, and the possibility of an illiquid market. Counterparty risk involving futures is mitigated because a regulated clearinghouse is the counterparty instead of the clearing broker. To further mitigate counterparty risk, the fund trades futures contracts on an exchange, monitors the financial strength of its clearing brokers and clearinghouse, and has entered into clearing agreements with its clearing brokers. The clearinghouse imposes initial margin requirements to secure the fund’s performance and requires daily settlement of variation margin representing changes in the market value of each contract. Any securities pledged as initial margin for open contracts are noted in the Schedule of Investments.
Futures contracts are valued at their quoted daily settlement prices. The notional amounts of the contracts are not recorded in the Statement of Assets and Liabilities. Fluctuations in the value of the contracts are recorded in the Statement of Assets and Liabilities as an asset (liability) and in the Statement of Operations as unrealized appreciation (depreciation) until the contracts are closed, when they are recorded as realized gains (losses) on futures contracts.
During the year ended September 30, 2020, the fund’s average investments in long and short futures contracts each represented less than 1% and 0% of net assets, respectively, based on the average of the notional amounts at each quarter-end during the period.
3. Federal Income Taxes: The fund intends to continue to qualify as a regulated investment company and distribute all of its taxable income. The fund’s tax returns are open to examination by the relevant tax authorities until expiration of the applicable statute of limitations, which is generally three years after the filing of the tax return. Management has analyzed the fund’s tax positions taken for all open federal and state income tax years, and has concluded that no provision for income tax is required in the fund’s financial statements.
12
Institutional Target Retirement Income Fund
4. Distributions: Distributions to shareholders are recorded on the ex-dividend date. Distributions are determined on a tax basis at the fiscal year-end and may differ from net investment income and realized capital gains for financial reporting purposes.
5. Credit Facilities and Interfund Lending Program: The fund and certain other funds managed by The Vanguard Group (“Vanguard”) participate in a $4.3 billion committed credit facility provided by a syndicate of lenders pursuant to a credit agreement and an uncommitted credit facility provided by Vanguard. Both facilities may be renewed annually. Each fund is individually liable for its borrowings, if any, under the credit facilities. Borrowings may be utilized for temporary or emergency purposes, subject to the fund’s regulatory and contractual borrowing restrictions. With respect to the committed credit facility, the participating funds are charged administrative fees and an annual commitment fee of 0.10% of the undrawn committed amount of the facility; these fees are allocated to the funds based on a method approved by the fund’s board of trustees and borne by the funds in which the fund invests (see Note B). Any borrowings under either facility bear interest at a rate based upon the higher of the one-month London Interbank Offered Rate (or an acceptable alternate rate, if necessary), federal funds effective rate, or overnight bank funding rate plus an agreed-upon spread, except that borrowings under the uncommitted credit facility may bear interest based upon an alternative rate agreed to by the fund and Vanguard.
In accordance with an exemptive order (the “Order”) from the SEC, the fund may participate in a joint lending and borrowing program that allows registered open-end Vanguard funds to borrow money from and lend money to each other for temporary or emergency purposes (the “Interfund Lending Program”), subject to compliance with the terms and conditions of the Order, and to the extent permitted by the fund’s investment objective and investment policies. Interfund loans and borrowings normally extend overnight, but can have a maximum duration of seven days. Loans may be called on one business day’s notice. The interest rate to be charged is governed by the conditions of the Order and internal procedures adopted by the board of trustees. The board of trustees is responsible for overseeing the Interfund Lending Program.
For the year ended September 30, 2020, the fund did not utilize the credit facilities or the Interfund Lending Program.
6. Other: Income and capital gain distributions received are recorded on the ex-dividend date. Security transactions are accounted for on the date securities are bought or sold. Costs used to determine realized gains (losses) on the sale of investment securities are those of the specific securities sold.
B. In accordance with the terms of a Funds’ Service Agreement (the “FSA”) between Vanguard and the fund, Vanguard furnishes to the fund investment advisory, corporate management, administrative, marketing, and distribution services at Vanguard’s cost of operations (as defined by the FSA). These costs of operations are allocated to the fund based on methods and guidelines approved by the board of trustees. The FSA provides that expenses otherwise allocable to Vanguard funds-of-funds may be reduced or eliminated to the extent of savings realized by the underlying Vanguard funds by virtue of being part of a fund-of-funds. Accordingly, all expenses
13
Institutional Target Retirement Income Fund
for services provided by Vanguard to the fund and all other expenses incurred by the fund during the period ended September 30, 2020, were borne by the underlying Vanguard funds in which the fund invests. The fund’s trustees and officers are also trustees and officers, respectively, of the underlying Vanguard funds, as well as directors and employees, respectively, of Vanguard.
C. Various inputs may be used to determine the value of the fund’s investments and derivatives. These inputs are summarized in three broad levels for financial statement purposes. The inputs or methodologies used to value securities are not necessarily an indication of the risk associated with investing in those securities.
Level 1—Quoted prices in active markets for identical securities.
Level 2—Other significant observable inputs (including quoted prices for similar securities, interest rates, prepayment speeds, credit risk, etc.).
Level 3—Significant unobservable inputs (including the fund’s own assumptions used to determine the fair value of investments). Any investments and derivatives valued with significant unobservable inputs are noted on the Schedule of Investments.
At September 30, 2020, 100% of the market value of the fund’s investments and derivatives was determined based on Level 1 inputs.
D. Permanent differences between book-basis and tax-basis components of net assets are reclassified among capital accounts in the financial statements to reflect their tax character. These reclassifications have no effect on net assets or net asset value per share. As of period end, permanent differences primarily attributable to the accounting for distributions in connection with fund share redemptions were reclassified between the following accounts:
| Amount | |||
| ($000) | |||
| Paid-in Capital | 3,377 | ||
| Total Distributable Earnings (Loss) | (3,377) | ||
Temporary differences between book-basis and tax-basis components of total distributable earnings (loss) arise when certain items of income, gain, or loss are recognized in different periods for financial statement and tax purposes; these differences will reverse at some time in the future. The differences are primarily related to the deferral of losses from wash sales and the recognition of unrealized gains or losses from certain derivative contracts. As of period end, the tax-basis components of total distributable earnings (loss) are detailed in the table as follows:
| Amount | |||
| ($000) | |||
| Undistributed Ordinary Income | 26,857 | ||
| Undistributed Long-Term Gains | 21,961 | ||
| Capital Loss Carryforwards | — | ||
| Qualified Late-Year Losses | — | ||
| Net Unrealized Gains (Losses) | 843,383 | ||
14
Institutional Target Retirement Income Fund
The tax character of distributions paid was as follows:
| Year Ended September 30, | ||
| 2020 | 2019 | |
| Amount | Amount | |
| ($000) | ($000) | |
| Ordinary Income* | 142,415 | 160,630 |
| Long-Term Capital Gains | — | 1,628 |
| Total | 142,415 | 162,258 |
* Includes short-term capital gains, if any.
As of September 30, 2020, gross unrealized appreciation and depreciation for investments and derivatives based on cost for U.S. federal income tax purposes were as follows:
| Amount | |
| ($000) | |
| Tax Cost | 6,212,987 |
| Gross Unrealized Appreciation | 844,387 |
| Gross Unrealized Depreciation | (1,004) |
| Net Unrealized Appreciation (Depreciation) | 843,383 |
E. Capital shares issued and redeemed were:
| Year Ended September 30, | ||
| 2020 | 2019 | |
| Shares | Shares | |
| (000) | (000) | |
| Issued | 67,103 | 60,874 |
| Issued in Lieu of Cash Distributions | 6,279 | 7,555 |
| Redeemed | (57,622) | (47,640) |
| Net Increase (Decrease) in Shares Outstanding | 15,760 | 20,789 |
At September 30, 2020, one shareholder was the record or beneficial owner of 31% of the fund’s net assets. If the shareholder were to redeem its investment in the fund, the redemption might lead to the realization of taxable capital gains.
15
Institutional Target Retirement Income Fund
F. Transactions during the period in affiliated underlying Vanguard funds were as follows:
| Current Period Transactions | |||||||||
| Sept. 30, | Proceeds | Realized | Sept. 30, | ||||||
| 2019 | from | Net | Change in | Capital Gain | 2020 | ||||
| Market | Purchases | Securities | Gain | Unrealized | Distributions | Market | |||
| Value | at Cost | Sold | (Loss) | App. (Dep.) | Income | Received | Value | ||
| ($000) | ($000) | ($000) | ($000) | ($000) | ($000) | ($000) | ($000) | ||
| Vanguard Market Liquidity Fund | 3,648 | NA1 | NA1 | (18) | 3 | 118 | — | 113,251 | |
| Vanguard Short-Term Inflation-Protected Securities Index Fund | 1,059,539 | 209,605 | 121,441 | (1,647) | 37,390 | 14,096 | — | 1,183,446 | |
| Vanguard Total Bond Market II Index Fund | 2,366,497 | 589,605 | 457,270 | 8,734 | 93,626 | 57,390 | — | 2,601,192 | |
| Vanguard Total International Bond Index Fund | 1,011,957 | 205,341 | 98,483 | 1,170 | (10,357) | 32,534 | — | 1,109,628 | |
| Vanguard Total International Stock Index Fund | 760,495 | 218,922 | 182,679 | (9,884) | 40,514 | 19,490 | — | 827,368 | |
| Vanguard Total Stock Market Index Fund | 1,144,972 | 436,938 | 525,108 | 38,025 | 126,658 | 21,956 | — | 1,221,485 | |
| Total | 6,347,108 | 1,660,411 | 1,384,981 | 36,380 | 287,834 | 145,584 | — | 7,056,370 | |
1 Not applicable—purchases and sales are for temporary cash investment purposes.
G. Management has determined that no events or transactions occurred subsequent to September 30, 2020, that would require recognition or disclosure in these financial statements.
16
Institutional Target Retirement 2015 Fund
Performance Summary
All of the returns in this report represent past performance, which is not a guarantee of future results that may be achieved by the fund. (Current performance may be lower or higher than the performance data cited. For performance data current to the most recent month-end, visit our website at vanguard.com/performance.) Note, too, that both investment returns and principal value can fluctuate widely, so an investor’s shares, when sold, could be worth more or less than their original cost. The returns shown do not reflect taxes that a shareholder would pay on fund distributions or on the sale of fund shares.
Cumulative Performance: June 26, 2015, Through September 30, 2020
Initial Investment of $100,000,000

| Average Annual Total Returns | ||||||
| Periods Ended September 30, 2020 | ||||||
| Since | Final Value | |||||
| One | Five | Inception | of a $100,000,000 | |||
| Year | Years | (6/26/2015) | Investment | |||
 | Institutional Target Retirement 2015 Fund | 7.77% | 7.11% | 5.77% | $134,339,263 | |
 | Target 2015 Composite Index | 8.37 | 7.35 | 6.00 | 135,880,208 | |
 | MSCI US Broad Market Index | 14.99 | 13.70 | 10.98 | 173,014,030 | |
Target 2015 Composite Index: Derived by applying the fund’s target asset allocation to the results of the following benchmarks: for international stocks of developed markets, the MSCI EAFE Index through December 15, 2010, the MSCI ACWI ex USA IMI Index through June 2, 2013, and the FTSE Global All Cap ex US Index thereafter; for emerging-market stocks, the Select Emerging Markets Index through August 23, 2006, the MSCI Emerging Markets Index through December 15, 2010, the MSCI ACWI ex USA IMI Index through June 2, 2013, and the FTSE Global All Cap ex US Index thereafter; for U.S. bonds, the Bloomberg Barclays U.S. Aggregate Bond Index through December 31, 2009, and the Bloomberg Barclays U.S. Aggregate Float Adjusted Index thereafter, as well as the Bloomberg Barclays U.S. Treasury Inflation-Protected Securities Index through June 2, 2013, and the Bloomberg Barclays U.S. Treasury Inflation-Protected Securities (TIPS) 0–5 Year Index thereafter; for international bonds, the Bloomberg Barclays Global Aggregate ex-USD Float Adjusted RIC Capped Index Hedged beginning June 3, 2013; and for U.S. stocks, the Dow Jones U.S. Total Stock Market Index (formerly known as the Dow Jones Wilshire 5000 Index) through April 22, 2005, the MSCI US Broad Market Index through June 2, 2013, and the CRSP US Total Market Index thereafter. International stock benchmark returns are adjusted for withholding taxes.
"Since Inception" performance is calculated from the fund’s inception date for both the fund and its comparative standards.
See Financial Highlights for dividend and capital gains information.
17
Institutional Target Retirement 2015 Fund
Underlying Vanguard Funds
As of September 30, 2020
| Vanguard Total Bond Market II Index Fund Investor Shares | 35.3 | % | |
| Vanguard Total Stock Market Index Fund Institutional Shares | 20.6 | ||
| Vanguard Total International Bond Index Fund Admiral Shares | 15.2 | ||
| Vanguard Short-Term Inflation-Protected Securities Index Fund Admiral Shares | 14.9 | ||
| Vanguard Total International Stock Index Fund Investor Shares | 14.0 |
The table reflects the fund's investments, except for short-term investments and derivatives.
18
Institutional Target Retirement 2015 Fund
Financial Statements
Schedule of Investments
As of September 30, 2020
The fund files its complete schedule of portfolio holdings with the Securities and Exchange Commission (SEC) for the first and third quarters of each fiscal year as an exhibit to its reports on Form N-PORT. The fund’s Form N-PORT reports are available on the SEC’s website at www.sec.gov.
| Market | |||
| Value· | |||
| Shares | ($000) | ||
| Investment Companies (98.8%) | |||
| U.S. Stock Fund (20.3%) | |||
| Vanguard Total Stock Market Index Fund Institutional Shares | 22,015,074 | 1,826,150 | |
| International Stock Fund (13.8%) | |||
| Vanguard Total International Stock Index Fund Investor Shares | 73,958,402 | 1,239,543 | |
| U.S. Bond Funds (49.7%) | |||
| 1 Vanguard Total Bond Market II Index Fund Investor Shares | 272,439,884 | 3,143,956 | |
| Vanguard Short-Term Inflation-Protected Securities Index Fund Admiral Shares | 51,952,303 | 1,321,667 | |
| 4,465,623 | |||
| International Bond Fund (15.0%) | |||
| Vanguard Total International Bond Index Fund Admiral Shares | 58,213,263 | 1,352,876 | |
| Total Investment Companies (Cost $7,631,268) | 8,884,192 | ||
| Temporary Cash Investment (1.5%) | |||
| Money Market Fund (1.5%) | |||
| 1 Vanguard Market Liquidity Fund, 0.117% (Cost $135,134) | 1,351,385 | 135,139 | |
| Total Investments (100.3%) (Cost $7,766,402) | 9,019,331 | ||
| Other Assets and Liabilities—Net (-0.3%) | (28,764) | ||
| Net Assets (100%) | 8,990,567 |
Cost is in $000.
| • | See Note A in Notes to Financial Statements. |
| 1 | Affiliated fund available only to Vanguard funds and certain trusts and accounts managed by Vanguard. Rate shown for Vanguard Market Liquidity Fund is the 7-day yield. |
19
Institutional Target Retirement 2015 Fund
Derivative Financial Instruments Outstanding as of Period End
Futures Contracts
| ($000) | |||||
| Value and | |||||
| Number of | Unrealized | ||||
| Long (Short) | Notional | Appreciation | |||
| Expiration | Contracts | Amount | (Depreciation) | ||
| Long Futures Contracts | |||||
| 10-Year U.S. Treasury Note | December 2020 | 449 | 62,650 | 39 | |
| E-mini S&P 500 Index | December 2020 | 302 | 50,615 | 1,158 | |
| 1,197 | |||||
See accompanying Notes, which are an integral part of the Financial Statements.
20
Institutional Target Retirement 2015 Fund
Statement of Assets and Liabilities
As of September 30, 2020
| ($000s, except shares and per-share amounts) | Amount |
| Assets | |
| Investments in Securities, at Value—Affiliated Funds (Cost $7,766,402) | 9,019,331 |
| Cash Collateral Pledged—Futures Contracts | 7,920 |
| Receivables for Accrued Income | 13,324 |
| Receivables for Capital Shares Issued | 1,997 |
| Variation Margin Receivable—Futures Contracts | 685 |
| Total Assets | 9,043,257 |
| Liabilities | |
| Payables for Investment Securities Purchased | 13,325 |
| Payables for Capital Shares Redeemed | 39,199 |
| Variation Margin Payable—Futures Contracts | 166 |
| Total Liabilities | 52,690 |
| Net Assets | 8,990,567 |
| At September 30, 2020, net assets consisted of: | |
| Paid-in Capital | 7,498,527 |
| Total Distributable Earnings (Loss) | 1,492,040 |
| Net Assets | 8,990,567 |
| Net Assets | |
| Applicable to 374,703,583 outstanding $.001 par value shares of beneficial interest (unlimited authorization) | 8,990,567 |
| Net Asset Value Per Share | $23.99 |
See accompanying Notes, which are an integral part of the Financial Statements.
21
Institutional Target Retirement 2015 Fund
Statement of Operations
| Year Ended | |
| September 30, 2020 | |
| ($000) | |
| Investment Income | |
| Income | |
| Income Distributions Received from Affiliated Funds | 193,789 |
| Other Income | 7 |
| Net Investment Income—Note B | 193,796 |
| Realized Net Gain (Loss) | |
| Capital Gain Distributions Received from Affiliated Funds | — |
| Affiliated Funds Sold | 159,306 |
| Futures Contracts | 11,909 |
| Realized Net Gain (Loss) | 171,215 |
| Change in Unrealized Appreciation (Depreciation) | |
| Affiliated Funds | 281,676 |
| Futures Contracts | 1,197 |
| Change in Unrealized Appreciation (Depreciation) | 282,873 |
| Net Increase (Decrease) in Net Assets Resulting from Operations | 647,884 |
See accompanying Notes, which are an integral part of the Financial Statements.
22
Institutional Target Retirement 2015 Fund
Statement of Changes in Net Assets
| Year Ended September 30, | ||
| 2020 | 2019 | |
| ($000) | ($000) | |
| Increase (Decrease) in Net Assets | ||
| Operations | ||
| Net Investment Income | 193,796 | 214,324 |
| Realized Net Gain (Loss) | 171,215 | 34,124 |
| Change in Unrealized Appreciation (Depreciation) | 282,873 | 268,085 |
| Net Increase (Decrease) in Net Assets Resulting from Operations | 647,884 | 516,533 |
| Distributions1 | ||
| Total Distributions | (269,259) | (260,266) |
| Capital Share Transactions | ||
| Issued | 1,564,673 | 1,475,692 |
| Issued in Lieu of Cash Distributions | 267,767 | 258,627 |
| Redeemed | (1,945,930) | (1,511,326) |
| Net Increase (Decrease) from Capital Share Transactions | (113,490) | 222,993 |
| Total Increase (Decrease) | 265,135 | 479,260 |
| Net Assets | ||
| Beginning of Period | 8,725,432 | 8,246,172 |
| End of Period | 8,990,567 | 8,725,432 |
1 Certain prior-period numbers have been reclassified to conform with the current-period presentation.
See accompanying Notes, which are an integral part of the Financial Statements.
23
Institutional Target Retirement 2015 Fund
Financial Highlights
| For a Share Outstanding | Year Ended September 30, | ||||
| Throughout Each Period | 2020 | 2019 | 2018 | 2017 | 2016 |
| Net Asset Value, Beginning of Period | $22.96 | $22.39 | $21.87 | $20.64 | $19.06 |
| Investment Operations | |||||
| Net Investment Income | .5101 | .5611 | .5361 | .4331 | .345 |
| Capital Gain Distributions Received | — | — | .0021 | .0061 | .008 |
| Net Realized and Unrealized Gain (Loss) on Investments | 1.243 | .716 | .459 | 1.182 | 1.380 |
| Total from Investment Operations | 1.753 | 1.277 | .997 | 1.621 | 1.733 |
| Distributions | |||||
| Dividends from Net Investment Income | (.579) | (.537) | (.449) | (.381) | (.152) |
| Distributions from Realized Capital Gains | (.144) | (.170) | (.028) | (.010) | (.001) |
| Total Distributions | (.723) | (.707) | (.477) | (.391) | (.153) |
| Net Asset Value, End of Period | $23.99 | $22.96 | $22.39 | $21.87 | $20.64 |
| Total Return | 7.77% | 6.08% | 4.60% | 8.02% | 9.14% |
| Ratios/Supplemental Data | |||||
| Net Assets, End of Period (Millions) | $8,991 | $8,725 | $8,246 | $7,614 | $6,023 |
| Ratio of Total Expenses to Average Net Assets | — | — | — | — | — |
| Acquired Fund Fees and Expenses | 0.09% | 0.09% | 0.09% | 0.09% | 0.09% |
| Ratio of Net Investment Income to | |||||
| Average Net Assets | 2.21% | 2.55% | 2.42% | 2.07% | 2.04% |
| Portfolio Turnover Rate | 24% | 16% | 15% | 10% | 10% |
1 Calculated based on average shares outstanding.
See accompanying Notes, which are an integral part of the Financial Statements.
24
Institutional Target Retirement 2015 Fund
Notes to Financial Statements
Vanguard Institutional Target Retirement 2015 Fund is registered under the Investment Company Act of 1940 as an open-end investment company, or mutual fund. The fund follows a balanced investment strategy by investing in selected Vanguard funds to achieve its targeted allocation of assets to U.S. and international stocks, and U.S. and international bonds. Financial statements and other information about each underlying fund are available at www.vanguard.com.
Market disruptions associated with the COVID-19 pandemic have had a global impact, and uncertainty exists as to the long-term implications. Such disruptions can adversely affect assets of the fund and thus fund performance.
A. The following significant accounting policies conform to generally accepted accounting principles for U.S. investment companies. The fund consistently follows such policies in preparing its financial statements.
1. Security Valuation: Investments are valued at the net asset value of each underlying Vanguard fund determined as of the close of the New York Stock Exchange (generally 4 p.m., Eastern time) on the valuation date.
2. Futures Contracts: The fund uses stock and bond futures contracts to a limited extent, with the objectives of maintaining full exposure to the market and maintaining its target asset allocation. The primary risks associated with the use of futures contracts are imperfect correlation between changes in market values of investments held by the fund and the prices of futures contracts, and the possibility of an illiquid market. Counterparty risk involving futures is mitigated because a regulated clearinghouse is the counterparty instead of the clearing broker. To further mitigate counterparty risk, the fund trades futures contracts on an exchange, monitors the financial strength of its clearing brokers and clearinghouse, and has entered into clearing agreements with its clearing brokers. The clearinghouse imposes initial margin requirements to secure the fund’s performance and requires daily settlement of variation margin representing changes in the market value of each contract. Any securities pledged as initial margin for open contracts are noted in the Schedule of Investments.
Futures contracts are valued at their quoted daily settlement prices. The notional amounts of the contracts are not recorded in the Statement of Assets and Liabilities. Fluctuations in the value of the contracts are recorded in the Statement of Assets and Liabilities as an asset (liability) and in the Statement of Operations as unrealized appreciation (depreciation) until the contracts are closed, when they are recorded as realized gains (losses) on futures contracts.
During the year ended September 30, 2020, the fund’s average investments in long and short futures contracts represented less than 1% and 0% of net assets, respectively, based on the average of the notional amounts at each quarter-end during the period.
3. Federal Income Taxes: The fund intends to continue to qualify as a regulated investment company and distribute all of its taxable income. The fund’s tax returns are open to examination by the relevant tax authorities until expiration of the applicable statute of limitations, which is generally three years after the filing of the tax return. Management has analyzed the fund’s tax positions taken for all open federal and state income tax years, and has concluded that no provision for income tax is required in the fund’s financial statements.
25
Institutional Target Retirement 2015 Fund
4. Distributions: Distributions to shareholders are recorded on the ex-dividend date. Distributions are determined on a tax basis at the fiscal year-end and may differ from net investment income and realized capital gains for financial reporting purposes.
5. Credit Facilities and Interfund Lending Program: The fund and certain other funds managed by The Vanguard Group (“Vanguard”) participate in a $4.3 billion committed credit facility provided by a syndicate of lenders pursuant to a credit agreement and an uncommitted credit facility provided by Vanguard. Both facilities may be renewed annually. Each fund is individually liable for its borrowings, if any, under the credit facilities. Borrowings may be utilized for temporary or emergency purposes, subject to the fund’s regulatory and contractual borrowing restrictions. With respect to the committed credit facility, the participating funds are charged administrative fees and an annual commitment fee of 0.10% of the undrawn committed amount of the facility; these fees are allocated to the funds based on a method approved by the fund’s board of trustees and borne by the funds in which the fund invests (see Note B). Any borrowings under either facility bear interest at a rate based upon the higher of the one-month London Interbank Offered Rate (or an acceptable alternate rate, if necessary), federal funds effective rate, or overnight bank funding rate plus an agreed-upon spread, except that borrowings under the uncommitted credit facility may bear interest based upon an alternative rate agreed to by the fund and Vanguard.
In accordance with an exemptive order (the “Order”) from the SEC, the fund may participate in a joint lending and borrowing program that allows registered open-end Vanguard funds to borrow money from and lend money to each other for temporary or emergency purposes (the “Interfund Lending Program”), subject to compliance with the terms and conditions of the Order, and to the extent permitted by the fund’s investment objective and investment policies. Interfund loans and borrowings normally extend overnight, but can have a maximum duration of seven days. Loans may be called on one business day’s notice. The interest rate to be charged is governed by the conditions of the Order and internal procedures adopted by the board of trustees. The board of trustees is responsible for overseeing the Interfund Lending Program.
For the year ended September 30, 2020, the fund did not utilize the credit facilities or the Interfund Lending Program.
6. Other: Income and capital gain distributions received are recorded on the ex-dividend date. Security transactions are accounted for on the date securities are bought or sold. Costs used to determine realized gains (losses) on the sale of investment securities are those of the specific securities sold.
B. In accordance with the terms of a Funds’ Service Agreement (the “FSA”) between Vanguard and the fund, Vanguard furnishes to the fund investment advisory, corporate management, administrative, marketing, and distribution services at Vanguard’s cost of operations (as defined by the FSA). These costs of operations are allocated to the fund based on methods and guidelines approved by the board of trustees. The FSA provides that expenses otherwise allocable to Vanguard funds-of-funds may be reduced or eliminated to the extent of savings realized by the underlying Vanguard funds by virtue of being part of a fund-of-funds. Accordingly, all expenses
26
Institutional Target Retirement 2015 Fund
for services provided by Vanguard to the fund and all other expenses incurred by the fund during the period ended September 30, 2020, were borne by the underlying Vanguard funds in which the fund invests. The fund’s trustees and officers are also trustees and officers, respectively, of the underlying Vanguard funds, as well as directors and employees, respectively, of Vanguard.
C. Various inputs may be used to determine the value of the fund’s investments and derivatives. These inputs are summarized in three broad levels for financial statement purposes. The inputs or methodologies used to value securities are not necessarily an indication of the risk associated with investing in those securities.
Level 1—Quoted prices in active markets for identical securities.
Level 2—Other significant observable inputs (including quoted prices for similar securities, interest rates, prepayment speeds, credit risk, etc.).
Level 3—Significant unobservable inputs (including the fund’s own assumptions used to determine the fair value of investments). Any investments and derivatives valued with significant unobservable inputs are noted on the Schedule of Investments.
At September 30, 2020, 100% of the market value of the fund’s investments and derivatives was determined based on Level 1 inputs.
D. Permanent differences between book-basis and tax-basis components of net assets are reclassified among capital accounts in the financial statements to reflect their tax character. These reclassifications have no effect on net assets or net asset value per share. As of period end, permanent differences primarily attributable to the accounting for distributions in connection with fund share redemptions were reclassified between the following accounts:
| Amount | |
| ($000) | |
| Paid-in Capital | 18,562 |
| Total Distributable Earnings (Loss) | (18,562) |
Temporary differences between book-basis and tax-basis components of total distributable earnings (loss) arise when certain items of income, gain, or loss are recognized in different periods for financial statement and tax purposes; these differences will reverse at some time in the future. The differences are primarily related to the deferral of losses from wash sales and the recognition of unrealized gains or losses from certain derivative contracts. As of period end, the tax-basis components of total distributable earnings (loss) are detailed in the table as follows:
| Amount | |
| ($000) | |
| Undistributed Ordinary Income | 111,119 |
| Undistributed Long-Term Gains | 127,992 |
| Capital Loss Carryforwards | — |
| Qualified Late-Year Losses | — |
| Net Unrealized Gains (Losses) | 1,252,929 |
27
Institutional Target Retirement 2015 Fund
The tax character of distributions paid was as follows:
| Year Ended September 30, | ||
| 2020 | 2019 | |
| Amount | Amount | |
| ($000) | ($000) | |
| Ordinary Income* | 236,738 | 211,213 |
| Long-Term Capital Gains | 32,521 | 49,053 |
| Total | 269,259 | 260,266 |
* Includes short-term capital gains, if any.
As of September 30, 2020, gross unrealized appreciation and depreciation for investments and derivatives based on cost for U.S. federal income tax purposes were as follows:
| Amount | |
| ($000) | |
| Tax Cost | 7,766,402 |
| Gross Unrealized Appreciation | 1,253,856 |
| Gross Unrealized Depreciation | (927) |
| Net Unrealized Appreciation (Depreciation) | 1,252,929 |
E. Capital shares issued and redeemed were:
| Year Ended September 30, | ||
| 2020 | 2019 | |
| Shares | Shares | |
| (000) | (000) | |
| Issued | 67,872 | 67,681 |
| Issued in Lieu of Cash Distributions | 11,627 | 12,579 |
| Redeemed | (84,778) | (68,538) |
| Net Increase (Decrease) in Shares Outstanding | (5,279) | 11,722 |
At September 30, 2020, one shareholder was the record or beneficial owner of 32% of the fund’s net assets. If the shareholder were to redeem its investment in the fund, the redemption might lead to the realization of taxable capital gains.
28
Institutional Target Retirement 2015 Fund
F. Transactions during the period in affiliated underlying Vanguard funds were as follows:
| Current Period Transactions | |||||||||
| Sept. 30, | Proceeds | Realized | Sept. 30, | ||||||
| 2019 | from | Net | Change in | Capital Gain | 2020 | ||||
| Market | Purchases | Securities | Gain | Unrealized | Distributions | Market | |||
| Value | at Cost | Sold | (Loss) | App. (Dep.) | Income | Received | Value | ||
| ($000) | ($000) | ($000) | ($000) | ($000) | ($000) | ($000) | ($000) | ||
| Vanguard Market Liquidity Fund | 1,347 | NA1 | NA1 | (3) | 4 | 140 | — | 135,139 | |
| Vanguard Short-Term Inflation-Protected Securities Index Fund | 1,164,292 | 296,118 | 178,119 | (1,113) | 40,489 | 15,635 | — | 1,321,667 | |
| Vanguard Total Bond Market II Index Fund | 3,016,657 | 696,648 | 697,454 | 14,491 | 113,614 | 71,169 | — | 3,143,956 | |
| Vanguard Total International Bond Index Fund | 1,287,116 | 243,828 | 166,776 | 3,068 | (14,360) | 40,535 | — | 1,352,876 | |
| Vanguard Total International Stock Index Fund | 1,301,255 | 304,095 | 406,371 | 370 | 40,194 | 31,332 | — | 1,239,543 | |
| Vanguard Total Stock Market Index Fund | 1,956,012 | 560,140 | 934,230 | 142,493 | 101,735 | 34,978 | — | 1,826,150 | |
| Total | 8,726,679 | 2,100,829 | 2,382,950 | 159,306 | 281,676 | 193,789 | — | 9,019,331 | |
1 Not applicable—purchases and sales are for temporary cash investment purposes.
G. Management has determined that no events or transactions occurred subsequent to September 30, 2020, that would require recognition or disclosure in these financial statements.
29
Institutional Target Retirement 2020 Fund
Performance Summary
All of the returns in this report represent past performance, which is not a guarantee of future results that may be achieved by the fund. (Current performance may be lower or higher than the performance data cited. For performance data current to the most recent month-end, visit our website at vanguard.com/performance.) Note, too, that both investment returns and principal value can fluctuate widely, so an investor’s shares, when sold, could be worth more or less than their original cost. The returns shown do not reflect taxes that a shareholder would pay on fund distributions or on the sale of fund shares.
Cumulative Performance: June 26, 2015, Through September 30, 2020
Initial Investment of $100,000,000

| Average Annual Total Returns | |||||
| Periods Ended September 30, 2020 | |||||
| Since | Final Value | ||||
| One | Five | Inception | of a $100,000,000 | ||
| Year | Years | (6/26/2015) | Investment | ||
 | Institutional Target Retirement 2020 Fund | 8.55% | 8.01% | 6.38% | $138,463,828 |
 | Target 2020 Composite Index | 9.31 | 8.30 | 6.65 | 140,332,138 |
 | MSCI US Broad Market Index | 14.99 | 13.70 | 10.98 | 173,014,030 |
Target 2020 Composite Index: Derived by applying the fund’s target asset allocation to the results of the following benchmarks: for international stocks of developed markets, the MSCI EAFE Index through December 15, 2010, the MSCI ACWI ex USA IMI Index through June 2, 2013, and the FTSE Global All Cap ex US Index thereafter; for emerging-market stocks, the Select Emerging Markets Index through August 23, 2006, the MSCI Emerging Markets Index through December 15, 2010, the MSCI ACWI ex USA IMI Index through June 2, 2013, and the FTSE Global All Cap ex US Index thereafter; for U.S. bonds, the Bloomberg Barclays U.S. Aggregate Bond Index through December 31, 2009, and the Bloomberg Barclays U.S. Aggregate Float Adjusted Index thereafter; for international bonds, the Bloomberg Barclays Global Aggregate ex-USD Float Adjusted RIC Capped Index Hedged beginning June 3, 2013; and for U.S. stocks, the MSCI US Broad Market Index through June 2, 2013, and the CRSP US Total Market Index thereafter. International stock benchmark returns are adjusted for withholding taxes.
"Since Inception" performance is calculated from the fund’s inception date for both the fund and its comparative standards.
See Financial Highlights for dividend and capital gains information.
30
Institutional Target Retirement 2020 Fund
Underlying Vanguard Funds
As of September 30, 2020
| Vanguard Total Bond Market II Index Fund Investor Shares | 29.7 | % | |
| Vanguard Total Stock Market Index Fund Institutional Shares | 29.2 | ||
| Vanguard Total International Stock Index Fund Investor Shares | 19.8 | ||
| Vanguard Total International Bond Index Fund Admiral Shares | 12.9 | ||
| Vanguard Short-Term Inflation-Protected Securities Index Fund Admiral Shares | 8.4 |
The table reflects the fund's investments, except for short-term investments and derivatives.
31
Institutional Target Retirement 2020 Fund
Financial Statements
Schedule of Investments
As of September 30, 2020
The fund files its complete schedule of portfolio holdings with the Securities and Exchange Commission (SEC) for the first and third quarters of each fiscal year as an exhibit to its reports on Form N-PORT. The fund’s Form N-PORT reports are available on the SEC’s website at www.sec.gov.
| Market | |||
| Value• | |||
| Shares | ($000) | ||
| Investment Companies (98.8%) | |||
| U.S. Stock Fund (28.9%) | |||
| Vanguard Total Stock Market Index Fund Institutional Shares | 86,151,872 | 7,146,298 | |
| International Stock Fund (19.6%) | |||
| Vanguard Total International Stock Index Fund Investor Shares | 289,698,118 | 4,855,341 | |
| U.S. Bond Funds (37.6%) | |||
| 1 Vanguard Total Bond Market II Index Fund Investor Shares | 628,599,180 | 7,254,034 | |
| Vanguard Short-Term Inflation-Protected Securities Index Fund Admiral Shares | 81,020,433 | 2,061,160 | |
| 9,315,194 | |||
| International Bond Fund (12.7%) | |||
| Vanguard Total International Bond Index Fund Admiral Shares | 135,336,009 | 3,145,209 | |
| Total Investment Companies (Cost $20,447,851) | 24,462,042 | ||
| Temporary Cash Investment (1.5%) | |||
| Money Market Fund (1.5%) | |||
| 1 Vanguard Market Liquidity Fund, 0.117% (Cost $372,444) | 3,724,461 | 372,446 | |
| Total Investments (100.3%) (Cost $20,820,295) | 24,834,488 | ||
| Other Assets and Liabilities—Net (-0.3%) | (84,001) | ||
| Net Assets (100%) | 24,750,487 | ||
Cost is in $000.
| • | See Note A in Notes to Financial Statements. |
| 1 | Affiliated fund available only to Vanguard funds and certain trusts and accounts managed by Vanguard. Rate shown for VanguardMarket Liquidity Fund is the 7-day yield. |
32
Institutional Target Retirement 2020 Fund
Derivative Financial Instruments Outstanding as of Period End
Futures Contracts
| ($000) | |||||
| Value and | |||||
| Number of | Unrealized | ||||
| Long (Short) | Notional | Appreciation | |||
| Expiration | Contracts | Amount | (Depreciation) | ||
| Long Futures Contracts | |||||
| 10-Year U.S. Treasury Note | December 2020 | 1,285 | 179,298 | 60 | |
| E-mini S&P 500 Index | December 2020 | 600 | 100,560 | 2,980 | |
| 3,040 | |||||
See accompanying Notes, which are an integral part of the Financial Statements.
33
Institutional Target Retirement 2020 Fund
Statement of Assets and Liabilities
As of September 30, 2020
| ($000s, except shares and per-share amounts) | Amount |
| Assets | |
| Investments in Securities, at Value—Affiliated Funds (Cost $20,820,295) | 24,834,488 |
| Cash Collateral Pledged—Futures Contracts | 23,830 |
| Receivables for Accrued Income | 25,478 |
| Receivables for Capital Shares Issued | 14,308 |
| Variation Margin Receivable—Futures Contracts | 1,776 |
| Total Assets | 24,899,880 |
| Liabilities | |
| Payables for Investment Securities Purchased | 25,478 |
| Payables for Capital Shares Redeemed | 123,737 |
| Variation Margin Payable—Futures Contracts | 178 |
| Total Liabilities | 149,393 |
| Net Assets | 24,750,487 |
| At September 30, 2020, net assets consisted of: | |
| Paid-in Capital | 20,191,704 |
| Total Distributable Earnings (Loss) | 4,558,783 |
| Net Assets | 24,750,487 |
| Net Assets | |
| Applicable to 987,911,301 outstanding $.001 par value shares of beneficial interest (unlimited authorization) | 24,750,487 |
| Net Asset Value Per Share | $25.05 |
See accompanying Notes, which are an integral part of the Financial Statements.
34
Institutional Target Retirement 2020 Fund
Statement of Operations
| Year Ended | |
| September 30, 2020 | |
| ($000) | |
| Investment Income | |
| Income | |
| Income Distributions Received from Affiliated Funds | 543,056 |
| Other Income | 23 |
| Net Investment Income—Note B | 543,079 |
| Realized Net Gain (Loss) | |
| Capital Gain Distributions Received from Affiliated Funds | — |
| Affiliated Funds Sold | 257,235 |
| Futures Contracts | 30,090 |
| Realized Net Gain (Loss) | 287,325 |
| Change in Unrealized Appreciation (Depreciation) | |
| Affiliated Funds | 1,124,801 |
| Futures Contracts | 3,040 |
| Change in Unrealized Appreciation (Depreciation) | 1,127,841 |
| Net Increase (Decrease) in Net Assets Resulting from Operations | 1,958,245 |
See accompanying Notes, which are an integral part of the Financial Statements.
35
Institutional Target Retirement 2020 Fund
Statement of Changes in Net Assets
| Year Ended September 30, | ||
| 2020 | 2019 | |
| ($000) | ($000) | |
| Increase (Decrease) in Net Assets | ||
| Operations | ||
| Net Investment Income | 543,079 | 579,085 |
| Realized Net Gain (Loss) | 287,325 | 32,952 |
| Change in Unrealized Appreciation (Depreciation) | 1,127,841 | 669,129 |
| Net Increase (Decrease) in Net Assets Resulting from Operations | 1,958,245 | 1,281,166 |
| Distributions1 | ||
| Total Distributions | (644,846) | (530,177) |
| Capital Share Transactions | ||
| Issued | 4,006,225 | 4,175,722 |
| Issued in Lieu of Cash Distributions | 640,431 | 525,289 |
| Redeemed | (5,337,752) | (3,162,786) |
| Net Increase (Decrease) from Capital Share Transactions | (691,096) | 1,538,225 |
| Total Increase (Decrease) | 622,303 | 2,289,214 |
| Net Assets | ||
| Beginning of Period | 24,128,184 | 21,838,970 |
| End of Period | 24,750,487 | 24,128,184 |
1 Certain prior-period numbers have been reclassified to conform with the current-period presentation.
See accompanying Notes, which are an integral part of the Financial Statements.
36
Institutional Target Retirement 2020 Fund
Financial Highlights
| For a Share Outstanding | Year Ended September 30, | |||||
| Throughout Each Period | 2020 | 2019 | 2018 | 2017 | 2016 | |
| Net Asset Value, Beginning of Period | $23.69 | $23.08 | $22.23 | $20.58 | $18.84 | |
| Investment Operations | ||||||
| Net Investment Income1 | .532 | .575 | .532 | .464 | .444 | |
| Capital Gain Distributions Received1 | — | — | .001 | .005 | .007 | |
| Net Realized and Unrealized Gain (Loss) on Investments | 1.469 | .585 | .773 | 1.582 | 1.453 | |
| Total from Investment Operations | 2.001 | 1.160 | 1.306 | 2.051 | 1.904 | |
| Distributions | ||||||
| Dividends from Net Investment Income | (.597) | (.531) | (.448) | (.391) | (.162) | |
| Distributions from Realized Capital Gains | (.044) | (.019) | (.008) | (.010) | (.002) | |
| Total Distributions | (.641) | (.550) | (.456) | (.401) | (.164) | |
| Net Asset Value, End of Period | $25.05 | $23.69 | $23.08 | $22.23 | $20.58 | |
| Total Return | 8.55% | 5.34% | 5.92% | 10.17% | 10.16% | |
| Ratios/Supplemental Data | ||||||
| Net Assets, End of Period (Millions) | $24,750 | $24,128 | $21,839 | $17,587 | $11,613 | |
| Ratio of Total Expenses to Average Net Assets | — | — | — | — | — | |
| Acquired Fund Fees and Expenses | 0.09% | 0.09% | 0.09% | 0.09% | 0.10% | |
| Ratio of Net Investment Income to Average Net Assets | 2.23% | 2.54% | 2.35% | 2.20% | 2.25% | |
| Portfolio Turnover Rate | 24% | 13% | 8% | 6% | 5% | |
1 Calculated based on average shares outstanding.
See accompanying Notes, which are an integral part of the Financial Statements.
37
Institutional Target Retirement 2020 Fund
Notes to Financial Statements
Vanguard Institutional Target Retirement 2020 Fund is registered under the Investment Company Act of 1940 as an open-end investment company, or mutual fund. The fund follows a balanced investment strategy by investing in selected Vanguard funds to achieve its targeted allocation of assets to U.S. and international stocks, and U.S. and international bonds. Financial statements and other information about each underlying fund are available at www.vanguard.com.
Market disruptions associated with the COVID-19 pandemic have had a global impact, and uncertainty exists as to the long-term implications. Such disruptions can adversely affect assets of the fund and thus fund performance.
A. The following significant accounting policies conform to generally accepted accounting principles for U.S. investment companies. The fund consistently follows such policies in preparing its financial statements.
1. Security Valuation: Investments are valued at the net asset value of each underlying Vanguard fund determined as of the close of the New York Stock Exchange (generally 4 p.m., Eastern time) on the valuation date.
2. Futures Contracts: The fund uses stock and bond futures contracts to a limited extent, with the objectives of maintaining full exposure to the market and maintaining its target asset allocation. The primary risks associated with the use of futures contracts are imperfect correlation between changes in market values of investments held by the fund and the prices of futures contracts, and the possibility of an illiquid market. Counterparty risk involving futures is mitigated because a regulated clearinghouse is the counterparty instead of the clearing broker. To further mitigate counterparty risk, the fund trades futures contracts on an exchange, monitors the financial strength of its clearing brokers and clearinghouse, and has entered into clearing agreements with its clearing brokers. The clearinghouse imposes initial margin requirements to secure the fund’s performance and requires daily settlement of variation margin representing changes in the market value of each contract. Any securities pledged as initial margin for open contracts are noted in the Schedule of Investments.
Futures contracts are valued at their quoted daily settlement prices. The notional amounts of the contracts are not recorded in the Statement of Assets and Liabilities. Fluctuations in the value of the contracts are recorded in the Statement of Assets and Liabilities as an asset (liability) and in the Statement of Operations as unrealized appreciation (depreciation) until the contracts are closed, when they are recorded as realized gains (losses) on futures contracts.
During the year ended September 30, 2020, the fund’s average investments in long and short futures contracts represented less than 1% and 0% of net assets, respectively, based on the average of the notional amounts at each quarter-end during the period.
3. Federal Income Taxes: The fund intends to continue to qualify as a regulated investment company and distribute all of its taxable income. The fund’s tax returns are open to examination by the relevant tax authorities until expiration of the applicable statute of limitations, which is generally three years after the filing of the tax return. Management has analyzed the fund’s tax positions taken for all open federal and state income tax years, and has concluded that no provision for income tax is required in the fund’s financial statements.
38
Institutional Target Retirement 2020 Fund
4. Distributions: Distributions to shareholders are recorded on the ex-dividend date. Distributions are determined on a tax basis at the fiscal year-end and may differ from net investment income and realized capital gains for financial reporting purposes.
5. Credit Facilities and Interfund Lending Program: The fund and certain other funds managed by The Vanguard Group (“Vanguard”) participate in a $4.3 billion committed credit facility provided by a syndicate of lenders pursuant to a credit agreement and an uncommitted credit facility provided by Vanguard. Both facilities may be renewed annually. Each fund is individually liable for its borrowings, if any, under the credit facilities. Borrowings may be utilized for temporary or emergency purposes, subject to the fund’s regulatory and contractual borrowing restrictions. With respect to the committed credit facility, the participating funds are charged administrative fees and an annual commitment fee of 0.10% of the undrawn committed amount of the facility; these fees are allocated to the funds based on a method approved by the fund’s board of trustees and borne by the funds in which the fund invests (see Note B). Any borrowings under either facility bear interest at a rate based upon the higher of the one-month London Interbank Offered Rate (or an acceptable alternate rate, if necessary), federal funds effective rate, or overnight bank funding rate plus an agreed-upon spread, except that borrowings under the uncommitted credit facility may bear interest based upon an alternative rate agreed to by the fund and Vanguard.
In accordance with an exemptive order (the “Order”) from the SEC, the fund may participate in a joint lending and borrowing program that allows registered open-end Vanguard funds to borrow money from and lend money to each other for temporary or emergency purposes (the “Interfund Lending Program”), subject to compliance with the terms and conditions of the Order, and to the extent permitted by the fund’s investment objective and investment policies. Interfund loans and borrowings normally extend overnight, but can have a maximum duration of seven days. Loans may be called on one business day’s notice. The interest rate to be charged is governed by the conditions of the Order and internal procedures adopted by the board of trustees. The board of trustees is responsible for overseeing the Interfund Lending Program.
For the year ended September 30, 2020, the fund did not utilize the credit facilities or the Interfund Lending Program.
6. Other: Income and capital gain distributions received are recorded on the ex-dividend date. Security transactions are accounted for on the date securities are bought or sold. Costs used to determine realized gains (losses) on the sale of investment securities are those of the specific securities sold.
B. In accordance with the terms of a Funds’ Service Agreement (the “FSA”) between Vanguard and the fund, Vanguard furnishes to the fund investment advisory, corporate management, administrative, marketing, and distribution services at Vanguard’s cost of operations (as defined by the FSA). These costs of operations are allocated to the fund based on methods and guidelines approved by the board of trustees. The FSA provides that expenses otherwise allocable to Vanguard funds-of-funds may be reduced or eliminated to the extent of savings realized by the underlying Vanguard funds by virtue of being part of a fund-of-funds. Accordingly, all expenses
39
Institutional Target Retirement 2020 Fund
for services provided by Vanguard to the fund and all other expenses incurred by the fund during the period ended September 30, 2020, were borne by the underlying Vanguard funds in which the fund invests. The fund’s trustees and officers are also trustees and officers, respectively, of the underlying Vanguard funds, as well as directors and employees, respectively, of Vanguard.
C. Various inputs may be used to determine the value of the fund’s investments and derivatives. These inputs are summarized in three broad levels for financial statement purposes. The inputs or methodologies used to value securities are not necessarily an indication of the risk associated with investing in those securities.
Level 1—Quoted prices in active markets for identical securities.
Level 2—Other significant observable inputs (including quoted prices for similar securities, interest rates, prepayment speeds, credit risk, etc.).
Level 3—Significant unobservable inputs (including the fund’s own assumptions used to determine the fair value of investments). Any investments and derivatives valued with significant unobservable inputs are noted on the Schedule of Investments.
At September 30, 2020, 100% of the market value of the fund’s investments and derivatives was determined based on Level 1 inputs.
D. Permanent differences between book-basis and tax-basis components of net assets are reclassified among capital accounts in the financial statements to reflect their tax character. These reclassifications have no effect on net assets or net asset value per share. As of period end, permanent differences primarily attributable to the accounting for distributions in connection with fund share redemptions were reclassified between the following accounts:
| Amount | |
| ($000) | |
| Paid-in Capital | 36,250 |
| Total Distributable Earnings (Loss) | (36,250) |
Temporary differences between book-basis and tax-basis components of total distributable earnings (loss) arise when certain items of income, gain, or loss are recognized in different periods for financial statement and tax purposes; these differences will reverse at some time in the future. The differences are primarily related to the deferral of losses from wash sales and the recognition of unrealized gains or losses from certain derivative contracts. As of period end, the tax-basis components of total distributable earnings (loss) are detailed in the table as follows:
| Amount | |
| ($000) | |
| Undistributed Ordinary Income | 354,894 |
| Undistributed Long-Term Gains | 189,696 |
| Capital Loss Carryforwards | — |
| Qualified Late-Year Losses | — |
| Net Unrealized Gains (Losses) | 4,014,193 |
40
Institutional Target Retirement 2020 Fund
The tax character of distributions paid was as follows:
| Year Ended September 30, | ||
| 2020 | 2019 | |
| Amount | Amount | |
| ($000) | ($000) | |
| Ordinary Income* | 643,538 | 529,116 |
| Long-Term Capital Gains | 1,308 | 1,061 |
| Total | 644,846 | 530,177 |
* Includes short-term capital gains, if any.
As of September 30, 2020, gross unrealized appreciation and depreciation for investments and derivatives based on cost for U.S. federal income tax purposes were as follows:
| Amount | ||
| ($000) | ||
| Tax Cost | 20,820,295 | |
| Gross Unrealized Appreciation | 4,017,469 | |
| Gross Unrealized Depreciation | (3,276) | |
| Net Unrealized Appreciation (Depreciation) | 4,014,193 |
E. Capital shares issued and redeemed were:
| Year Ended September 30, | ||||
| 2020 | 2019 | |||
| Shares | Shares | |||
| (000) | (000) | |||
| Issued | 167,623 | 186,336 | ||
| Issued in Lieu of Cash Distributions | 26,519 | 25,097 | ||
| Redeemed | (224,861) | (139,093) | ||
| Net Increase (Decrease) in Shares Outstanding | (30,719) | 72,340 | ||
At September 30, 2020, one shareholder was the record or beneficial owner of 38% of the fund’s net assets. If the shareholder were to redeem its investment in the fund, the redemption might lead to the realization of taxable capital gains.
41
Institutional Target Retirement 2020 Fund
F. Transactions during the period in affiliated underlying Vanguard funds were as follows:
| Current Period Transactions | ||||||||||||||||||||
| Sept. 30, | Proceeds | Realized | Sept. 30, | |||||||||||||||||
| 2019 | from | Net | Change in | Capital Gain | 2020 | |||||||||||||||
| Market | Purchases | Securities | Gain | Unrealized | Distributions | Market | ||||||||||||||
| Value | at Cost | Sold | (Loss) | App. (Dep.) | Income | Received | Value | |||||||||||||
| ($000) | ($000) | ($000) | ($000) | ($000) | ($000) | ($000) | ($000) | |||||||||||||
| Vanguard Market Liquidity Fund | 7,341 | NA1 | NA1 | (25) | 2 | 331 | — | 372,446 | ||||||||||||
| Vanguard Short-Term Inflation-Protected Securities Index Fund | 1,631,586 | 711,900 | 342,048 | (1,294) | 61,016 | 23,714 | — | 2,061,160 | ||||||||||||
| Vanguard Total Bond Market II Index Fund | 7,038,855 | 2,044,889 | 2,136,542 | 49,406 | 257,426 | 166,720 | — | 7,254,034 | ||||||||||||
| Vanguard Total International Bond Index Fund | 3,076,071 | 626,946 | 530,327 | 10,796 | (38,277) | 96,474 | — | 3,145,209 | ||||||||||||
| Vanguard Total International Stock Index Fund | 4,963,136 | 922,859 | 1,154,718 | (75,998) | 200,062 | 120,958 | — | 4,855,341 | ||||||||||||
| Vanguard Total Stock Market Index Fund | 7,443,414 | 1,585,378 | 2,801,416 | 274,350 | 644,572 | 134,859 | — | 7,146,298 | ||||||||||||
| Total | 24,160,403 | 5,891,972 | 6,965,051 | 257,235 | 1,124,801 | 543,056 | — | 24,834,488 | ||||||||||||
1 Not applicable—purchases and sales are for temporary cash investment purposes.
G. Management has determined that no events or transactions occurred subsequent to September 30, 2020, that would require recognition or disclosure in these financial statements.
42
Institutional Target Retirement 2025 Fund
Performance Summary
All of the returns in this report represent past performance, which is not a guarantee of future results that may be achieved by the fund. (Current performance may be lower or higher than the performance data cited. For performance data current to the most recent month-end, visit our website at vanguard.com/performance.) Note, too, that both investment returns and principal value can fluctuate widely, so an investor’s shares, when sold, could be worth more or less than their original cost. The returns shown do not reflect taxes that a shareholder would pay on fund distributions or on the sale of fund shares.
Cumulative Performance: June 26, 2015, Through September 30, 2020
Initial Investment of $100,000,000

| Average Annual Total Returns | |||||
| Periods Ended September 30, 2020 | |||||
| Since | Final Value | ||||
| One | Five | Inception | of a $100,000,000 | ||
| Year | Years | (6/26/2015) | Investment | ||
 | Institutional Target Retirement 2025 Fund | 9.08% | 8.66% | 6.78% | $141,266,070 |
 | Target 2025 Composite Index | 9.92 | 8.97 | 7.07 | 143,274,649 |
 | MSCI US Broad Market Index | 14.99 | 13.70 | 10.98 | 173,014,030 |
Target 2025 Composite Index: Derived by applying the fund’s target asset allocation to the results of the following benchmarks: for international stocks of developed markets, the MSCI EAFE Index through December 15, 2010, the MSCI ACWI ex USA IMI Index through June 2, 2013, and the FTSE Global All Cap ex US Index thereafter; for emerging-market stocks, the Select Emerging Markets Index through August 23, 2006, the MSCI Emerging Markets Index through December 15, 2010, the MSCI ACWI ex USA IMI Index through June 2, 2013, and the FTSE Global All Cap ex US Index thereafter; for U.S. bonds, the Bloomberg Barclays U.S. Aggregate Bond Index through December 31, 2009, and the Bloomberg Barclays U.S. Aggregate Float Adjusted Index thereafter; for international bonds, the Bloomberg Barclays Global Aggregate ex-USD Float Adjusted RIC Capped Index Hedged beginning June 3, 2013; and for U.S. stocks, the Dow Jones U.S. Total Stock Market Index (formerly known as the Dow Jones Wilshire 5000 Index) through April 22, 2005, the MSCI US Broad Market Index through June 2, 2013, and the CRSP US Total Market Index thereafter. International stock benchmark returns are adjusted for withholding taxes.
"Since Inception" performance is calculated from the fund’s inception date for both the fund and its comparative standards.
See Financial Highlights for dividend and capital gains information.
43
Institutional Target Retirement 2025 Fund
Underlying Vanguard Funds
As of September 30, 2020
| Vanguard Total Stock Market Index Fund Institutional Shares | 35.7 | % | ||
| Vanguard Total Bond Market II Index Fund Investor Shares | 27.9 | |||
| Vanguard Total International Stock Index Fund Investor Shares | 23.9 | |||
| Vanguard Total International Bond Index Fund Admiral Shares | 12.0 | |||
| Vanguard Short-Term Inflation-Protected Securities Index Fund Admiral Shares | 0.5 |
The table reflects the fund's investments, except for short-term investments and derivatives.
44
Institutional Target Retirement 2025 Fund
Financial Statements
Schedule of Investments
As of September 30, 2020
The fund files its complete schedule of portfolio holdings with the Securities and Exchange Commission (SEC) for the first and third quarters of each fiscal year as an exhibit to its reports on Form N-PORT. The fund’s Form N-PORT reports are available on the SEC’s website at www.sec.gov.
| Market | |||||||
| Value• | |||||||
| Shares | ($000) | ||||||
| Investment Companies (99.0%) | |||||||
| U.S. Stock Fund (35.3%) | |||||||
| Vanguard Total Stock Market Index Fund Institutional Shares | 155,722,493 | 12,917,181 | |||||
| International Stock Fund (23.7%) | |||||||
| Vanguard Total International Stock Index Fund Investor Shares | 516,455,325 | 8,655,791 | |||||
| U.S. Bond Funds (28.1%) | |||||||
| 1 Vanguard Total Bond Market II Index Fund Investor Shares | 876,940,564 | 10,119,894 | |||||
| Vanguard Short-Term Inflation-Protected Securities Index Fund Admiral Shares | 7,038,190 | 179,052 | |||||
| 10,298,946 | |||||||
| International Bond Fund (11.9%) | |||||||
| Vanguard Total International Bond Index Fund Admiral Shares | 187,557,327 | 4,358,832 | |||||
| Total Investment Companies (Cost $30,111,116) | 36,230,750 | ||||||
| Temporary Cash Investment (1.5%) | |||||||
| Money Market Fund (1.5%) | |||||||
| 1 Vanguard Market Liquidity Fund, 0.117% (Cost $547,338) | 5,473,531 | 547,353 | |||||
| Total Investments (100.5%) (Cost $30,658,454) | 36,778,103 | ||||||
| Other Assets and Liabilities—Net (-0.5%) | (168,680) | ||||||
| Net Assets (100%) | 36,609,423 | ||||||
Cost is in $000.
| • | See Note A in Notes to Financial Statements. |
| 1 | Affiliated fund available only to Vanguard funds and certain trusts and accounts managed by Vanguard. Rate shown for Vanguard Market Liquidity Fund is the 7-day yield. |
45
Institutional Target Retirement 2025 Fund
Derivative Financial Instruments Outstanding as of Period End
Futures Contracts
| ($000) | ||||||
| Value and | ||||||
| Number of | Unrealized | |||||
| Long (Short) | Notional | Appreciation | ||||
| Expiration | Contracts | Amount | (Depreciation) | |||
| Long Futures Contracts | ||||||
| 10-Year U.S. Treasury Note | December 2020 | 1,692 | 236,087 | 186 | ||
| E-mini S&P 500 Index | December 2020 | 944 | 158,214 | 4,007 | ||
| 4,193 | ||||||
See accompanying Notes, which are an integral part of the Financial Statements.
46
Institutional Target Retirement 2025 Fund
Statement of Assets and Liabilities
As of September 30, 2020
| ($000s, except shares and per-share amounts) | Amount |
| Assets | |
| Investments in Securities, at Value—Affiliated Funds (Cost $30,658,454) | 36,778,103 |
| Cash Collateral Pledged—Futures Contracts | 29,571 |
| Receivables for Accrued Income | 20,913 |
| Receivables for Capital Shares Issued | 31,899 |
| Variation Margin Receivable—Futures Contracts | 2,393 |
| Total Assets | 36,862,879 |
| Liabilities | |
| Payables for Investment Securities Purchased | 49,540 |
| Payables for Capital Shares Redeemed | 203,373 |
| Variation Margin Payable—Futures Contracts | 543 |
| Total Liabilities | 253,456 |
| Net Assets | 36,609,423 |
| At September 30, 2020, net assets consisted of: | |
| Paid-in Capital | 29,954,626 |
| Total Distributable Earnings (Loss) | 6,654,797 |
| Net Assets | 36,609,423 |
| Net Assets | |
| Applicable to 1,428,615,252 outstanding $.001 par value shares of beneficial interest (unlimited authorization) | 36,609,423 |
| Net Asset Value Per Share | $25.63 |
See accompanying Notes, which are an integral part of the Financial Statements.
47
Institutional Target Retirement 2025 Fund
Statement of Operations
| Year Ended | |
| September 30, 2020 | |
| ($000) | |
| Investment Income | |
| Income | |
| Income Distributions Received from Affiliated Funds | 794,340 |
| Other Income | 39 |
| Net Investment Income—Note B | 794,379 |
| Realized Net Gain (Loss) | |
| Capital Gain Distributions Received from Affiliated Funds | — |
| Affiliated Funds Sold | 67,402 |
| Futures Contracts | 30,942 |
| Realized Net Gain (Loss) | 98,344 |
| Change in Unrealized Appreciation (Depreciation) | |
| Affiliated Funds | 2,070,544 |
| Futures Contracts | 4,193 |
| Change in Unrealized Appreciation (Depreciation) | 2,074,737 |
| Net Increase (Decrease) in Net Assets Resulting from Operations | 2,967,460 |
See accompanying Notes, which are an integral part of the Financial Statements.
48
Institutional Target Retirement 2025 Fund
Statement of Changes in Net Assets
| Year Ended September 30, | ||
| 2020 | 2019 | |
| ($000) | ($000) | |
| Increase (Decrease) in Net Assets | ||
| Operations | ||
| Net Investment Income | 794,379 | 767,992 |
| Realized Net Gain (Loss) | 98,344 | 7,412 |
| Change in Unrealized Appreciation (Depreciation) | 2,074,737 | 864,318 |
| Net Increase (Decrease) in Net Assets Resulting from Operations | 2,967,460 | 1,639,722 |
| Distributions1 | ||
| Total Distributions | (842,721) | (660,179) |
| Capital Share Transactions | ||
| Issued | 6,521,021 | 6,425,739 |
| Issued in Lieu of Cash Distributions | 837,029 | 653,036 |
| Redeemed | (6,207,898) | (2,782,280) |
| Net Increase (Decrease) from Capital Share Transactions | 1,150,152 | 4,296,495 |
| Total Increase (Decrease) | 3,274,891 | 5,276,038 |
| Net Assets | ||
| Beginning of Period | 33,334,532 | 28,058,494 |
| End of Period | 36,609,423 | 33,334,532 |
1 Certain prior-period numbers have been reclassified to conform with the current-period presentation.
See accompanying Notes, which are an integral part of the Financial Statements.
49
Institutional Target Retirement 2025 Fund
Financial Highlights
| For a Share Outstanding | Year Ended September 30, | |||||
| Throughout Each Period | 2020 | 2019 | 2018 | 2017 | 2016 | |
| Net Asset Value, Beginning of Period | $24.07 | $23.53 | $22.46 | $20.48 | $18.65 | |
| Investment Operations | ||||||
| Net Investment Income1 | .553 | .585 | .528 | .480 | .452 | |
| Capital Gain Distributions Received1 | — | — | .001 | .005 | .006 | |
| Net Realized and Unrealized Gain (Loss) on Investments | 1.613 | .494 | .997 | 1.895 | 1.538 | |
| Total from Investment Operations | 2.166 | 1.079 | 1.526 | 2.380 | 1.996 | |
| Distributions | ||||||
| Dividends from Net Investment Income | (.599) | (.527) | (.452) | (.392) | (.165) | |
| Distributions from Realized Capital Gains | (.007) | (.012) | (.004) | (.008) | (.001) | |
| Total Distributions | (.606) | (.539) | (.456) | (.400) | (.166) | |
| Net Asset Value, End of Period | $25.63 | $24.07 | $23.53 | $22.46 | $20.48 | |
| Total Return | 9.08% | 4.91% | 6.85% | 11.85% | 10.76% | |
| Ratios/Supplemental Data | ||||||
| Net Assets, End of Period (Millions) | $36,609 | $33,335 | $28,058 | $21,610 | $13,626 | |
| Ratio of Total Expenses to Average Net Assets | — | — | — | — | — | |
| Acquired Fund Fees and Expenses | 0.09% | 0.09% | 0.09% | 0.09% | 0.10% | |
| Ratio of Net Investment Income to | ||||||
| Average Net Assets | 2.28% | 2.54% | 2.29% | 2.27% | 2.30% | |
| Portfolio Turnover Rate | 24% | 9% | 9% | 4% | 4% | |
1 Calculated based on average shares outstanding.
See accompanying Notes, which are an integral part of the Financial Statements.
50
Institutional Target Retirement 2025 Fund
Notes to Financial Statements
Vanguard Institutional Target Retirement 2025 Fund is registered under the Investment Company Act of 1940 as an open-end investment company, or mutual fund. The fund follows a balanced investment strategy by investing in selected Vanguard funds to achieve its targeted allocation of assets to U.S. and international stocks, and U.S. and international bonds. Financial statements and other information about each underlying fund are available at www.vanguard.com.
Market disruptions associated with the COVID-19 pandemic have had a global impact, and uncertainty exists as to the long-term implications. Such disruptions can adversely affect assets of the fund and thus fund performance.
A. The following significant accounting policies conform to generally accepted accounting principles for U.S. investment companies. The fund consistently follows such policies in preparing its financial statements.
1. Security Valuation: Investments are valued at the net asset value of each underlying Vanguard fund determined as of the close of the New York Stock Exchange (generally 4 p.m., Eastern time) on the valuation date.
2. Futures Contracts: The fund uses stock and bond futures contracts to a limited extent, with the objectives of maintaining full exposure to the market and maintaining its target asset allocation. The primary risks associated with the use of futures contracts are imperfect correlation between changes in market values of investments held by the fund and the prices of futures contracts, and the possibility of an illiquid market. Counterparty risk involving futures is mitigated because a regulated clearinghouse is the counterparty instead of the clearing broker. To further mitigate counterparty risk, the fund trades futures contracts on an exchange, monitors the financial strength of its clearing brokers and clearinghouse, and has entered into clearing agreements with its clearing brokers. The clearinghouse imposes initial margin requirements to secure the fund’s performance and requires daily settlement of variation margin representing changes in the market value of each contract. Any securities pledged as initial margin for open contracts are noted in the Schedule of Investments.
Futures contracts are valued at their quoted daily settlement prices. The notional amounts of the contracts are not recorded in the Statement of Assets and Liabilities. Fluctuations in the value of the contracts are recorded in the Statement of Assets and Liabilities as an asset (liability) and in the Statement of Operations as unrealized appreciation (depreciation) until the contracts are closed, when they are recorded as realized gains (losses) on futures contracts.
During the year ended September 30, 2020, the fund’s average investments in long and short futures contracts represented less than 1% and 0% of net assets, respectively, based on the average of the notional amounts at each quarter-end during the period.
3. Federal Income Taxes: The fund intends to continue to qualify as a regulated investment company and distribute all of its taxable income. The fund’s tax returns are open to examination by the relevant tax authorities until expiration of the applicable statute of limitations, which is generally three years after the filing of the tax return. Management has analyzed the fund’s tax positions taken for all open federal and state income tax years, and has concluded that no provision for income tax is required in the fund’s financial statements.
51
Institutional Target Retirement 2025 Fund
4. Distributions: Distributions to shareholders are recorded on the ex-dividend date. Distributions are determined on a tax basis at the fiscal year-end and may differ from net investment income and realized capital gains for financial reporting purposes.
5. Credit Facilities and Interfund Lending Program: The fund and certain other funds managed by The Vanguard Group (“Vanguard”) participate in a $4.3 billion committed credit facility provided by a syndicate of lenders pursuant to a credit agreement and an uncommitted credit facility provided by Vanguard. Both facilities may be renewed annually. Each fund is individually liable for its borrowings, if any, under the credit facilities. Borrowings may be utilized for temporary or emergency purposes, subject to the fund’s regulatory and contractual borrowing restrictions. With respect to the committed credit facility, the participating funds are charged administrative fees and an annual commitment fee of 0.10% of the undrawn committed amount of the facility; these fees are allocated to the funds based on a method approved by the fund’s board of trustees and borne by the funds in which the fund invests (see Note B). Any borrowings under either facility bear interest at a rate based upon the higher of the one-month London Interbank Offered Rate (or an acceptable alternate rate, if necessary), federal funds effective rate, or overnight bank funding rate plus an agreed-upon spread, except that borrowings under the uncommitted credit facility may bear interest based upon an alternative rate agreed to by the fund and Vanguard.
In accordance with an exemptive order (the “Order”) from the SEC, the fund may participate in a joint lending and borrowing program that allows registered open-end Vanguard funds to borrow money from and lend money to each other for temporary or emergency purposes (the “Interfund Lending Program”), subject to compliance with the terms and conditions of the Order, and to the extent permitted by the fund’s investment objective and investment policies. Interfund loans and borrowings normally extend overnight, but can have a maximum duration of seven days. Loans may be called on one business day’s notice. The interest rate to be charged is governed by the conditions of the Order and internal procedures adopted by the board of trustees. The board of trustees is responsible for overseeing the Interfund Lending Program.
For the year ended September 30, 2020, the fund did not utilize the credit facilities or the Interfund Lending Program.
6. Other: Income and capital gain distributions received are recorded on the ex-dividend date. Security transactions are accounted for on the date securities are bought or sold. Costs used to determine realized gains (losses) on the sale of investment securities are those of the specific securities sold.
B. In accordance with the terms of a Funds’ Service Agreement (the “FSA”) between Vanguard and the fund, Vanguard furnishes to the fund investment advisory, corporate management, administrative, marketing, and distribution services at Vanguard’s cost of operations (as defined by the FSA). These costs of operations are allocated to the fund based on methods and guidelines approved by the board of trustees. The FSA provides that expenses otherwise allocable to Vanguard funds-of-funds may be reduced or eliminated to the extent of savings realized by the
52
Institutional Target Retirement 2025 Fund
underlying Vanguard funds by virtue of being part of a fund-of-funds. Accordingly, all expenses for services provided by Vanguard to the fund and all other expenses incurred by the fund during the period ended September 30, 2020, were borne by the underlying Vanguard funds in which the fund invests. The fund’s trustees and officers are also trustees and officers, respectively, of the underlying Vanguard funds, as well as directors and employees, respectively, of Vanguard.
C. Various inputs may be used to determine the value of the fund’s investments and derivatives. These inputs are summarized in three broad levels for financial statement purposes. The inputs or methodologies used to value securities are not necessarily an indication of the risk associated with investing in those securities.
Level 1—Quoted prices in active markets for identical securities.
Level 2—Other significant observable inputs (including quoted prices for similar securities, interest rates, prepayment speeds, credit risk, etc.).
Level 3—Significant unobservable inputs (including the fund’s own assumptions used to determine the fair value of investments). Any investments and derivatives valued with significant unobservable inputs are noted on the Schedule of Investments.
At September 30, 2020, 100% of the market value of the fund’s investments and derivatives was determined based on Level 1 inputs.
D. Permanent differences between book-basis and tax-basis components of net assets are reclassified among capital accounts in the financial statements to reflect their tax character. These reclassifications have no effect on net assets or net asset value per share. As of period end, permanent differences primarily attributable to the accounting for distributions in connection with fund share redemptions were reclassified between the following accounts:
| Amount | |
| ($000) | |
| Paid-in Capital | 24,176 |
| Total Distributable Earnings (Loss) | (24,176) |
Temporary differences between book-basis and tax-basis components of total distributable earnings (loss) arise when certain items of income, gain, or loss are recognized in different periods for financial statement and tax purposes; these differences will reverse at some time in the future. The differences are primarily related to the deferral of losses from wash sales and the recognition of unrealized gains or losses from certain derivative contracts. As of period end, the tax-basis components of total distributable earnings (loss) are detailed in the table as follows:
| Amount | |
| ($000) | |
| Undistributed Ordinary Income | 453,409 |
| Undistributed Long-Term Gains | 81,739 |
| Capital Loss Carryforwards | — |
| Qualified Late-Year Losses | — |
| Net Unrealized Gains (Losses) | 6,119,649 |
53
Institutional Target Retirement 2025 Fund
The tax character of distributions paid was as follows:
| Year Ended September 30, | ||
| 2020 | 2019 | |
| Amount | Amount | |
| ($000) | ($000) | |
| Ordinary Income* | 842,721 | 659,068 |
| Long-Term Capital Gains | — | 1,111 |
| Total | 842,721 | 660,179 |
* Includes short-term capital gains, if any.
As of September 30, 2020, gross unrealized appreciation and depreciation for investments and derivatives based on cost for U.S. federal income tax purposes were as follows:
| Amount | |
| ($000) | |
| Tax Cost | 30,658,454 |
| Gross Unrealized Appreciation | 6,171,229 |
| Gross Unrealized Depreciation | (51,580) |
| Net Unrealized Appreciation (Depreciation) | 6,119,649 |
E. Capital shares issued and redeemed were:
| Year Ended September 30, | ||
| 2020 | 2019 | |
| Shares | Shares | |
| (000) | (000) | |
| Issued | 267,358 | 281,963 |
| Issued in Lieu of Cash Distributions | 33,765 | 31,008 |
| Redeemed | (257,510) | (120,506) |
| Net Increase (Decrease) in Shares Outstanding | 43,613 | 192,465 |
At September 30, 2020, one shareholder was the record or beneficial owner of 34% of the fund’s net assets. If the shareholder were to redeem its investment in the fund, the redemption might lead to the realization of taxable capital gains.
54
Institutional Target Retirement 2025 Fund
F. Transactions during the period in affiliated underlying Vanguard funds were as follows:
| Current Period Transactions | ||||||||
| Sept. 30, | Proceeds | Realized | Sept. 30, | |||||
| 2019 | from | Net | Change in | Capital Gain | 2020 | |||
| Market | Purchases | Securities | Gain | Unrealized | Distributions | Market | ||
| Value | at Cost | Sold | (Loss) | App. (Dep.) | Income | Received | Value | |
| ($000) | ($000) | ($000) | ($000) | ($000) | ($000) | ($000) | ($000) | |
| Vanguard Market Liquidity Fund | 10,018 | NA1 | NA1 | (54) | 14 | 530 | — | 547,353 |
| Vanguard Short-Term Inflation-Protected Securities Index Fund | — | 178,176 | — | — | 876 | 857 | — | 179,052 |
| Vanguard Total Bond Market II Index Fund | 9,075,032 | 3,967,281 | 3,337,861 | 60,648 | 354,794 | 226,045 | — | 10,119,894 |
| Vanguard Total International Bond Index Fund | 3,909,420 | 1,157,982 | 675,911 | 4,369 | (37,028) | 127,604 | — | 4,358,832 |
| Vanguard Total International Stock Index Fund | 8,132,250 | 1,549,110 | 1,216,954 | (111,238) | 302,623 | 207,169 | — | 8,655,791 |
| Vanguard Total Stock Market Index Fund | 12,222,096 | 2,391,809 | 3,259,666 | 113,677 | 1,449,265 | 232,135 | — | 12,917,181 |
| Total | 33,348,816 | 9,244,358 | 8,490,392 | 67,402 | 2,070,544 | 794,340 | — | 36,778,103 |
1 Not applicable—purchases and sales are for temporary cash investment purposes.
G. Management has determined that no events or transactions occurred subsequent to September 30, 2020, that would require recognition or disclosure in these financial statements.
55
Institutional Target Retirement 2030 Fund
Performance Summary
All of the returns in this report represent past performance, which is not a guarantee of future results that may be achieved by the fund. (Current performance may be lower or higher than the performance data cited. For performance data current to the most recent month-end, visit our website at vanguard.com/performance.) Note, too, that both investment returns and principal value can fluctuate widely, so an investor’s shares, when sold, could be worth more or less than their original cost. The returns shown do not reflect taxes that a shareholder would pay on fund distributions or on the sale of fund shares.
Cumulative Performance: June 26, 2015, Through September 30, 2020
Initial Investment of $100,000,000
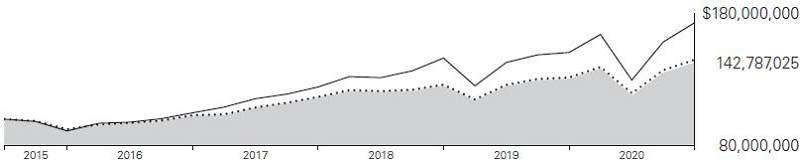
| Average Annual Total Returns | |||||
| Periods Ended September 30, 2020 | |||||
| Since | Final Value | ||||
| One | Five | Inception | of a $100,000,000 | ||
| Year | Years | (6/26/2015) | Investment | ||
 | Institutional Target Retirement 2030 Fund | 9.43% | 9.13% | 7.00% | $142,787,025 |
 | Target 2030 Composite Index | 10.24 | 9.44 | 7.31 | 144,947,665 |
 | MSCI US Broad Market Index | 14.99 | 13.70 | 10.98 | 173,014,030 |
Target 2030 Composite Index: Derived by applying the fund’s target asset allocation to the results of the following benchmarks: for international stocks of developed markets, the MSCI EAFE Index through December 15, 2010, the MSCI ACWI ex USA IMI Index through June 2, 2013, and the FTSE Global All Cap ex US Index thereafter; for emerging-market stocks, the Select Emerging Markets Index through August 23, 2006, the MSCI Emerging Markets Index through December 15, 2010, the MSCI ACWI ex USA IMI Index through June 2, 2013, and the FTSE Global All Cap ex US Index thereafter; for U.S. bonds, the Bloomberg Barclays U.S. Aggregate Bond Index through December 31, 2009, and the Bloomberg Barclays U.S. Aggregate Float Adjusted Index thereafter; for international bonds, the Bloomberg Barclays Global Aggregate ex-USD Float Adjusted RIC Capped Index Hedged beginning June 3, 2013; and for U.S. stocks, the MSCI US Broad Market Index through June 2, 2013, and the CRSP US Total Market Index thereafter. International stock benchmark returns are adjusted for withholding taxes.
"Since Inception" performance is calculated from the fund’s inception date for both the fund and its comparative standards.
See Financial Highlights for dividend and capital gains information.
56
Institutional Target Retirement 2030 Fund
Underlying Vanguard Funds
As of September 30, 2020
| Vanguard Total Stock Market Index Fund Institutional Shares | 40.4 | % | ||
| Vanguard Total International Stock Index Fund Investor Shares | 27.0 | |||
| Vanguard Total Bond Market II Index Fund Investor Shares | 22.7 | |||
| Vanguard Total International Bond Index Fund Admiral Shares | 9.9 |
The table reflects the fund's investments, except for short-term investments and derivatives.
57
Institutional Target Retirement 2030 Fund
Financial Statements
Schedule of Investments
As of September 30, 2020
The fund files its complete schedule of portfolio holdings with the Securities and Exchange Commission (SEC) for the first and third quarters of each fiscal year as an exhibit to its reports on Form N-PORT. The fund’s Form N-PORT reports are available on the SEC’s website at www.sec.gov.
| Market | ||
| Value• | ||
| Shares | ($000) | |
| Investment Companies (98.8%) | ||
| U.S. Stock Fund (39.9%) | ||
| Vanguard Total Stock Market Index Fund Institutional Shares | 172,263,880 | 14,289,289 |
| International Stock Fund (26.7%) | ||
| Vanguard Total International Stock Index Fund Investor Shares | 570,403,971 | 9,559,971 |
| U.S. Bond Fund (22.4%) | ||
| 1 Vanguard Total Bond Market II Index Fund Investor Shares | 696,398,634 | 8,036,440 |
| International Bond Fund (9.8%) | ||
| Vanguard Total International Bond Index Fund Admiral Shares | 150,289,599 | 3,492,730 |
| Total Investment Companies (Cost $29,345,414) | 35,378,430 | |
| Temporary Cash Investment (1.6%) | ||
| Money Market Fund (1.6%) | ||
| 1 Vanguard Market Liquidity Fund, 0.117% (Cost $580,470) | 5,804,903 | 580,490 |
| Total Investments (100.4%) (Cost $29,925,884) | 35,958,920 | |
| Other Assets and Liabilities—Net (-0.4%) | (148,399) | |
| Net Assets (100%) | 35,810,521 |
Cost is in $000.
• See Note A in Notes to Financial Statements.
1 Affiliated fund available only to Vanguard funds and certain trusts and accounts managed by Vanguard. Rate shown for Vanguard Market Liquidity Fund is the 7-day yield.
58
Institutional Target Retirement 2030 Fund
Derivative Financial Instruments Outstanding as of Period End
Futures Contracts
| ($000) | |||||
| Value and | |||||
| Number of | Unrealized | ||||
| Long (Short) | Notional | Appreciation | |||
| Expiration | Contracts | Amount | (Depreciation) | ||
| Long Futures Contracts | |||||
| 10-Year U.S. Treasury Note | December 2020 | 1,853 | 258,551 | 215 | |
| E-mini S&P 500 Index | December 2020 | 1,092 | 183,019 | 4,263 | |
| 4,478 | |||||
See accompanying Notes, which are an integral part of the Financial Statements.
59
Institutional Target Retirement 2030 Fund
Statement of Assets and Liabilities
As of September 30, 2020
| ($000s, except shares and per-share amounts) | Amount |
| Assets | |
| Investments in Securities, at Value—Affiliated Funds (Cost $29,925,884) | 35,958,920 |
| Cash Collateral Pledged—Futures Contracts | 26,031 |
| Receivables for Accrued Income | 15,951 |
| Receivables for Capital Shares Issued | 48,687 |
| Variation Margin Receivable—Futures Contracts | 2,353 |
| Total Assets | 36,051,942 |
| Liabilities | |
| Payables for Investment Securities Purchased | 22,440 |
| Payables for Capital Shares Redeemed | 218,121 |
| Variation Margin Payable—Futures Contracts | 860 |
| Total Liabilities | 241,421 |
| Net Assets | 35,810,521 |
| At September 30, 2020, net assets consisted of: | |
| Paid-in Capital | 29,295,280 |
| Total Distributable Earnings (Loss) | 6,515,241 |
| Net Assets | 35,810,521 |
| Net Assets | |
| Applicable to 1,381,019,779 outstanding $.001 par value shares of beneficial interest (unlimited authorization) | 35,810,521 |
| Net Asset Value Per Share | $25.93 |
See accompanying Notes, which are an integral part of the Financial Statements.
60
Institutional Target Retirement 2030 Fund
Statement of Operations
| Year Ended | |
| September 30, 2020 | |
| ($000) | |
| Investment Income | |
| Income | |
| Income Distributions Received from Affiliated Funds | 746,943 |
| Other Income | 37 |
| Net Investment Income—Note B | 746,980 |
| Realized Net Gain (Loss) | |
| Capital Gain Distributions Received from Affiliated Funds | — |
| Affiliated Funds Sold | 27,267 |
| Futures Contracts | 31,024 |
| Realized Net Gain (Loss) | 58,291 |
| Change in Unrealized Appreciation (Depreciation) | |
| Affiliated Funds | 2,186,432 |
| Futures Contracts | 4,478 |
| Change in Unrealized Appreciation (Depreciation) | 2,190,910 |
| Net Increase (Decrease) in Net Assets Resulting from Operations | 2,996,181 |
See accompanying Notes, which are an integral part of the Financial Statements.
61
Institutional Target Retirement 2030 Fund
Statement of Changes in Net Assets
| Year Ended September 30, | ||
| 2020 | 2019 | |
| ($000) | ($000) | |
| Increase (Decrease) in Net Assets | ||
| Operations | ||
| Net Investment Income | 746,980 | 704,886 |
| Realized Net Gain (Loss) | 58,291 | 6,284 |
| Change in Unrealized Appreciation (Depreciation) | 2,190,910 | 663,899 |
| Net Increase (Decrease) in Net Assets Resulting from Operations | 2,996,181 | 1,375,069 |
| Distributions1 | ||
| Total Distributions | (793,596) | (597,892) |
| Capital Share Transactions | ||
| Issued | 6,940,338 | 6,417,870 |
| Issued in Lieu of Cash Distributions | 786,523 | 590,618 |
| Redeemed | (5,358,586) | (2,365,021) |
| Net Increase (Decrease) from Capital Share Transactions | 2,368,275 | 4,643,467 |
| Total Increase (Decrease) | 4,570,860 | 5,420,644 |
| Net Assets | ||
| Beginning of Period | 31,239,661 | 25,819,017 |
| End of Period | 35,810,521 | 31,239,661 |
1 Certain prior-period numbers have been reclassified to conform with the current-period presentation.
See accompanying Notes, which are an integral part of the Financial Statements.
62
Institutional Target Retirement 2030 Fund
Financial Highlights
| For a Share Outstanding | Year Ended September 30, | ||||
| Throughout Each Period | 2020 | 2019 | 2018 | 2017 | 2016 |
| Net Asset Value, Beginning of Period | $24.27 | $23.89 | $22.61 | $20.36 | $18.45 |
| Investment Operations | |||||
| Net Investment Income1 | .548 | .582 | .531 | .485 | .455 |
| Capital Gain Distributions Received1 | — | — | .001 | .004 | .004 |
| Net Realized and Unrealized Gain (Loss) on Investments | 1.724 | .330 | 1.201 | 2.160 | 1.615 |
| Total from Investment Operations | 2.272 | .912 | 1.733 | 2.649 | 2.074 |
| Distributions | |||||
| Dividends from Net Investment Income | (.607) | (.529) | (.450) | (.393) | (.163) |
| Distributions from Realized Capital Gains | (.005) | (.003) | (.003) | (.006) | (.001) |
| Total Distributions | (.612) | (.532) | (.453) | (.399) | (.164) |
| Net Asset Value, End of Period | $25.93 | $24.27 | $23.89 | $22.61 | $20.36 |
| Total Return | 9.43% | 4.15% | 7.73% | 13.27% | 11.30% |
| Ratios/Supplemental Data | |||||
| Net Assets, End of Period (Millions) | $35,811 | $31,240 | $25,819 | $19,142 | $11,486 |
| Ratio of Total Expenses to Average Net Assets | — | — | — | — | — |
| Acquired Fund Fees and Expenses | 0.09% | 0.09% | 0.09% | 0.09% | 0.10% |
| Ratio of Net Investment Income to | |||||
| Average Net Assets | 2.24% | 2.51% | 2.27% | 2.29% | 2.34% |
| Portfolio Turnover Rate | 21% | 8% | 7% | 4% | 3% |
1 Calculated based on average shares outstanding.
See accompanying Notes, which are an integral part of the Financial Statements.
63
Institutional Target Retirement 2030 Fund
Notes to Financial Statements
Vanguard Institutional Target Retirement 2030 Fund is registered under the Investment Company Act of 1940 as an open-end investment company, or mutual fund. The fund follows a balanced investment strategy by investing in selected Vanguard funds to achieve its targeted allocation of assets to U.S. and international stocks, and U.S. and international bonds. Financial statements and other information about each underlying fund are available at www.vanguard.com.
Market disruptions associated with the COVID-19 pandemic have had a global impact, and uncertainty exists as to the long-term implications. Such disruptions can adversely affect assets of the fund and thus fund performance.
A. The following significant accounting policies conform to generally accepted accounting principles for U.S. investment companies. The fund consistently follows such policies in preparing its financial statements.
1. Security Valuation: Investments are valued at the net asset value of each underlying Vanguard fund determined as of the close of the New York Stock Exchange (generally 4 p.m., Eastern time) on the valuation date.
2. Futures Contracts: The fund uses stock and bond futures contracts to a limited extent, with the objectives of maintaining full exposure to the market and maintaining its target asset allocation. The primary risks associated with the use of futures contracts are imperfect correlation between changes in market values of investments held by the fund and the prices of futures contracts, and the possibility of an illiquid market. Counterparty risk involving futures is mitigated because a regulated clearinghouse is the counterparty instead of the clearing broker. To further mitigate counterparty risk, the fund trades futures contracts on an exchange, monitors the financial strength of its clearing brokers and clearinghouse, and has entered into clearing agreements with its clearing brokers. The clearinghouse imposes initial margin requirements to secure the fund’s performance and requires daily settlement of variation margin representing changes in the market value of each contract. Any securities pledged as initial margin for open contracts are noted in the Schedule of Investments.
Futures contracts are valued at their quoted daily settlement prices. The notional amounts of the contracts are not recorded in the Statement of Assets and Liabilities. Fluctuations in the value of the contracts are recorded in the Statement of Assets and Liabilities as an asset (liability) and in the Statement of Operations as unrealized appreciation (depreciation) until the contracts are closed, when they are recorded as realized gains (losses) on futures contracts.
During the year ended September 30, 2020, the fund’s average investments in long and short futures contracts represented less than 1% and 0% of net assets, respectively, based on the average of the notional amounts at each quarter-end during the period.
3. Federal Income Taxes: The fund intends to continue to qualify as a regulated investment company and distribute all of its taxable income. The fund’s tax returns are open to examination by the relevant tax authorities until expiration of the applicable statute of limitations, which is generally three years after the filing of the tax return. Management has analyzed the fund’s tax positions taken for all open federal and state income tax years, and has concluded that no provision for income tax is required in the fund’s financial statements.
64
Institutional Target Retirement 2030 Fund
4. Distributions: Distributions to shareholders are recorded on the ex-dividend date. Distributions are determined on a tax basis at the fiscal year-end and may differ from net investment income and realized capital gains for financial reporting purposes.
5. Credit Facilities and Interfund Lending Program: The fund and certain other funds managed by The Vanguard Group (“Vanguard”) participate in a $4.3 billion committed credit facility provided by a syndicate of lenders pursuant to a credit agreement and an uncommitted credit facility provided by Vanguard. Both facilities may be renewed annually. Each fund is individually liable for its borrowings, if any, under the credit facilities. Borrowings may be utilized for temporary or emergency purposes, subject to the fund’s regulatory and contractual borrowing restrictions. With respect to the committed credit facility, the participating funds are charged administrative fees and an annual commitment fee of 0.10% of the undrawn committed amount of the facility; these fees are allocated to the funds based on a method approved by the fund’s board of trustees and borne by the funds in which the fund invests (see Note B). Any borrowings under either facility bear interest at a rate based upon the higher of the one-month London Interbank Offered Rate (or an acceptable alternate rate, if necessary), federal funds effective rate, or overnight bank funding rate plus an agreed-upon spread, except that borrowings under the uncommitted credit facility may bear interest based upon an alternative rate agreed to by the fund and Vanguard.
In accordance with an exemptive order (the “Order”) from the SEC, the fund may participate in a joint lending and borrowing program that allows registered open-end Vanguard funds to borrow money from and lend money to each other for temporary or emergency purposes (the “Interfund Lending Program”), subject to compliance with the terms and conditions of the Order, and to the extent permitted by the fund’s investment objective and investment policies. Interfund loans and borrowings normally extend overnight, but can have a maximum duration of seven days. Loans may be called on one business day’s notice. The interest rate to be charged is governed by the conditions of the Order and internal procedures adopted by the board of trustees. The board of trustees is responsible for overseeing the Interfund Lending Program.
For the year ended September 30, 2020, the fund did not utilize the credit facilities or the Interfund Lending Program.
6. Other: Income and capital gain distributions received are recorded on the ex-dividend date. Security transactions are accounted for on the date securities are bought or sold. Costs used to determine realized gains (losses) on the sale of investment securities are those of the specific securities sold.
B. In accordance with the terms of a Funds’ Service Agreement (the “FSA”) between Vanguard and the fund, Vanguard furnishes to the fund investment advisory, corporate management, administrative, marketing, and distribution services at Vanguard’s cost of operations (as defined by the FSA). These costs of operations are allocated to the fund based on methods and guidelines approved by the board of trustees. The FSA provides that expenses otherwise allocable to Vanguard funds-of-funds may be reduced or eliminated to the extent of savings realized by the
65
Institutional Target Retirement 2030 Fund
underlying Vanguard funds by virtue of being part of a fund-of-funds. Accordingly, all expenses for services provided by Vanguard to the fund and all other expenses incurred by the fund during the period ended September 30, 2020, were borne by the underlying Vanguard funds in which the fund invests. The fund’s trustees and officers are also trustees and officers, respectively, of the underlying Vanguard funds, as well as directors and employees, respectively, of Vanguard.
C. Various inputs may be used to determine the value of the fund’s investments and derivatives. These inputs are summarized in three broad levels for financial statement purposes. The inputs or methodologies used to value securities are not necessarily an indication of the risk associated with investing in those securities.
Level 1—Quoted prices in active markets for identical securities.
Level 2—Other significant observable inputs (including quoted prices for similar securities, interest rates, prepayment speeds, credit risk, etc.).
Level 3—Significant unobservable inputs (including the fund’s own assumptions used to determine the fair value of investments). Any investments and derivatives valued with significant unobservable inputs are noted on the Schedule of Investments.
At September 30, 2020, 100% of the market value of the fund’s investments and derivatives was determined based on Level 1 inputs.
D. Permanent differences between book-basis and tax-basis components of net assets are reclassified among capital accounts in the financial statements to reflect their tax character. These reclassifications have no effect on net assets or net asset value per share. As of period end, permanent differences primarily attributable to the accounting for distributions in connection with fund share redemptions were reclassified between the following accounts:
| Amount | |
| ($000) | |
| Paid-in Capital | 18,691 |
| Total Distributable Earnings (Loss) | (18,691) |
Temporary differences between book-basis and tax-basis components of total distributable earnings (loss) arise when certain items of income, gain, or loss are recognized in different periods for financial statement and tax purposes; these differences will reverse at some time in the future. The differences are primarily related to the deferral of losses from wash sales and the recognition of unrealized gains or losses from certain derivative contracts. As of period end, the tax-basis components of total distributable earnings (loss) are detailed in the table as follows:
| Amount | |
| ($000) | |
| Undistributed Ordinary Income | 421,054 |
| Undistributed Long-Term Gains | 61,151 |
| Capital Loss Carryforwards | — |
| Qualified Late-Year Losses | — |
| Net Unrealized Gains (Losses) | 6,033,036 |
66
Institutional Target Retirement 2030 Fund
The tax character of distributions paid was as follows:
| Year Ended September 30, | ||
| 2020 | 2019 | |
| Amount | Amount | |
| ($000) | ($000) | |
| Ordinary Income* | 793,596 | 597,212 |
| Long-Term Capital Gains | — | 680 |
| Total | 793,596 | 597,892 |
* Includes short-term capital gains, if any.
As of September 30, 2020, gross unrealized appreciation and depreciation for investments and derivatives based on cost for U.S. federal income tax purposes were as follows:
| Amount | |
| ($000) | |
| Tax Cost | 29,925,884 |
| Gross Unrealized Appreciation | 6,132,914 |
| Gross Unrealized Depreciation | (99,878) |
| Net Unrealized Appreciation (Depreciation) | 6,033,036 |
E. Capital shares issued and redeemed were:
| Year Ended September 30, | ||
| 2020 | 2019 | |
| Shares | Shares | |
| (000) | (000) | |
| Issued | 282,498 | 279,267 |
| Issued in Lieu of Cash Distributions | 31,248 | 27,952 |
| Redeemed | (219,634) | (101,098) |
| Net Increase (Decrease) in Shares Outstanding | 94,112 | 206,121 |
At September 30, 2020, one shareholder was the record or beneficial owner of 35% of the fund’s net assets. If the shareholder were to redeem its investment in the fund, the redemption might lead to the realization of taxable capital gains.
67
Institutional Target Retirement 2030 Fund
F. Transactions during the period in affiliated underlying Vanguard funds were as follows:
| Current Period Transactions | ||||||||
| Sept. 30, | Proceeds | Realized | Sept. 30, | |||||
| 2019 | from | Net | Change in | Capital Gain | 2020 | |||
| Market | Purchases | Securities | Gain | Unrealized | Distributions | Market | ||
| Value | at Cost | Sold | (Loss) | App. (Dep.) | Income | Received | Value | |
| ($000) | ($000) | ($000) | ($000) | ($000) | ($000) | ($000) | ($000) | |
| Vanguard Market Liquidity Fund | 15,684 | NA1 | NA1 | (65) | 20 | 562 | — | 580,490 |
| Vanguard Total Bond Market II Index Fund | 6,875,728 | 3,542,062 | 2,700,833 | 46,250 | 273,233 | 174,579 | — | 8,036,440 |
| Vanguard Total International Bond Index Fund | 2,952,418 | 1,174,278 | 612,278 | 4,336 | (26,024) | 98,699 | — | 3,492,730 |
| Vanguard Total International Stock Index Fund | 8,541,807 | 1,656,591 | 846,893 | (68,742) | 277,208 | 223,336 | — | 9,559,971 |
| Vanguard Total Stock Market Index Fund | 12,896,361 | 2,606,304 | 2,920,859 | 45,488 | 1,661,995 | 249,767 | — | 14,289,289 |
| Total | 31,281,998 | 8,979,235 | 7,080,863 | 27,267 | 2,186,432 | 746,943 | — | 35,958,920 |
1 Not applicable—purchases and sales are for temporary cash investment purposes.
G. Management has determined that no events or transactions occurred subsequent to September 30, 2020, that would require recognition or disclosure in these financial statements.
68
Institutional Target Retirement 2035 Fund
Performance Summary
All of the returns in this report represent past performance, which is not a guarantee of future results that may be achieved by the fund. (Current performance may be lower or higher than the performance data cited. For performance data current to the most recent month-end, visit our website at vanguard.com/performance.) Note, too, that both investment returns and principal value can fluctuate widely, so an investor’s shares, when sold, could be worth more or less than their original cost. The returns shown do not reflect taxes that a shareholder would pay on fund distributions or on the sale of fund shares.
Cumulative Performance: June 26, 2015, Through September 30, 2020
Initial Investment of $100,000,000

| Average Annual Total Returns | |||||
| Periods Ended September 30, 2020 | |||||
| Since | Final Value | ||||
| One | Five | Inception | of a $100,000,000 | ||
| Year | Years | (6/26/2015) | Investment | ||
 | Institutional Target Retirement 2035 Fund | 9.70% | 9.58% | 7.22% | $144,310,563 |
 | Target 2035 Composite Index | 10.51 | 9.90 | 7.52 | 146,503,604 |
 | MSCI US Broad Market Index | 14.99 | 13.70 | 10.98 | 173,014,030 |
Target 2035 Composite Index: Derived by applying the fund’s target asset allocation to the results of the following benchmarks: for international stocks of developed markets, the MSCI EAFE Index through December 15, 2010, the MSCI ACWI ex USA IMI Index through June 2, 2013, and the FTSE Global All Cap ex US Index thereafter; for emerging-market stocks, the Select Emerging Markets Index through August 23, 2006, the MSCI Emerging Markets Index through December 15, 2010, the MSCI ACWI ex USA IMI Index through June 2, 2013, and the FTSE Global All Cap ex US Index thereafter; for U.S. bonds, the Bloomberg Barclays U.S. Aggregate Bond Index through December 31, 2009, and the Bloomberg Barclays U.S. Aggregate Float Adjusted Index thereafter; for international bonds, the Bloomberg Barclays Global Aggregate ex-USD Float Adjusted RIC Capped Index Hedged beginning June 3, 2013; and for U.S. stocks, the Dow Jones U.S. Total Stock Market Index (formerly known as the Dow Jones Wilshire 5000 Index) through April 22, 2005, the MSCI US Broad Market Index through June 2, 2013, and the CRSP US Total Market Index thereafter. International stock benchmark returns are adjusted for withholding taxes.
"Since Inception" performance is calculated from the fund’s inception date for both the fund and its comparative standards.
See Financial Highlights for dividend and capital gains information.
69
Institutional Target Retirement 2035 Fund
Underlying Vanguard Funds
As of September 30, 2020
| Vanguard Total Stock Market Index Fund Institutional Shares | 45.1 | % | ||
| Vanguard Total International Stock Index Fund Investor Shares | 30.1 | |||
| Vanguard Total Bond Market II Index Fund Investor Shares | 16.9 | |||
| Vanguard Total International Bond Index Fund Admiral Shares | 7.9 |
The table reflects the fund's investments, except for short-term investments and derivatives.
70
Institutional Target Retirement 2035 Fund
Financial Statements
Schedule of Investments
As of September 30, 2020
The fund files its complete schedule of portfolio holdings with the Securities and Exchange Commission (SEC) for the first and third quarters of each fiscal year as an exhibit to its reports on Form N-PORT. The fund’s Form N-PORT reports are available on the SEC’s website at www.sec.gov.
| Market | ||
| Value• | ||
| Shares | ($000) | |
| Investment Companies (98.8%) | ||
| U.S. Stock Fund (44.5%) | ||
| Vanguard Total Stock Market Index Fund Institutional Shares | 176,602,136 | 14,649,147 |
| International Stock Fund (29.8%) | ||
| Vanguard Total International Stock Index Fund Investor Shares | 584,173,954 | 9,790,756 |
| U.S. Bond Fund (16.7%) | ||
| 1 Vanguard Total Bond Market II Index Fund Investor Shares | 476,310,594 | 5,496,624 |
| International Bond Fund (7.8%) | ||
| Vanguard Total International Bond Index Fund Admiral Shares | 110,892,335 | 2,577,138 |
| Total Investment Companies (Cost $26,665,392) | 32,513,665 | |
| Temporary Cash Investment (1.6%) | ||
| Money Market Fund (1.6%) | ||
| 1 Vanguard Market Liquidity Fund, 0.117% (Cost $528,570) | 5,285,949 | 528,595 |
| Total Investments (100.4%) (Cost $27,193,962) | 33,042,260 | |
| Other Assets and Liabilities—Net (-0.4%) | (132,439) | |
| Net Assets (100%) | 32,909,821 |
Cost is in $000.
• See Note A in Notes to Financial Statements.
1 Affiliated fund available only to Vanguard funds and certain trusts and accounts managed by Vanguard. Rate shown for Vanguard
Market Liquidity Fund is the 7-day yield.
71
Institutional Target Retirement 2035 Fund
Derivative Financial Instruments Outstanding as of Period End
Futures Contracts
| ($000) | ||||
| Value and | ||||
| Number of | Unrealized | |||
| Long (Short) | Notional | Appreciation | ||
| Expiration | Contracts | Amount | (Depreciation) | |
| Long Futures Contracts | ||||
| 10-Year U.S. Treasury Note | December 2020 | 2,542 | 354,688 | 329 |
| E-mini S&P 500 Index | December 2020 | 285 | 47,766 | 691 |
| 1,020 |
See accompanying Notes, which are an integral part of the Financial Statements.
72
Institutional Target Retirement 2035 Fund
Statement of Assets and Liabilities
As of September 30, 2020
| ($000s, except shares and per-share amounts) | Amount |
| Assets | |
| Investments in Securities, at Value—Affiliated Funds (Cost $27,193,962) | 33,042,260 |
| Cash Collateral Pledged—Futures Contracts | 12,954 |
| Receivables for Accrued Income | 11,041 |
| Receivables for Capital Shares Issued | 44,878 |
| Variation Margin Receivable—Futures Contracts | 963 |
| Total Assets | 33,112,096 |
| Liabilities | |
| Payables for Investment Securities Purchased | 20,698 |
| Payables for Capital Shares Redeemed | 180,941 |
| Variation Margin Payable—Futures Contracts | 636 |
| Total Liabilities | 202,275 |
| Net Assets | 32,909,821 |
| At September 30, 2020, net assets consisted of: | |
| Paid-in Capital | 26,612,782 |
| Total Distributable Earnings (Loss) | 6,297,039 |
| Net Assets | 32,909,821 |
| Net Assets | |
| Applicable to 1,255,091,595 outstanding $.001 par value shares of | |
| beneficial interest (unlimited authorization) | 32,909,821 |
| Net Asset Value Per Share | $26.22 |
See accompanying Notes, which are an integral part of the Financial Statements.
73
Institutional Target Retirement 2035 Fund
Statement of Operations
| Year Ended | |
| September 30, 2020 | |
| ($000) | |
| Investment Income | |
| Income | |
| Income Distributions Received from Affiliated Funds | 669,990 |
| Other Income | 30 |
| Net Investment Income—Note B | 670,020 |
| Realized Net Gain (Loss) | |
| Capital Gain Distributions Received from Affiliated Funds | — |
| Affiliated Funds Sold | 27,360 |
| Futures Contracts | 29,204 |
| Realized Net Gain (Loss) | 56,564 |
| Change in Unrealized Appreciation (Depreciation) | |
| Affiliated Funds | 2,124,456 |
| Futures Contracts | 1,020 |
| Change in Unrealized Appreciation (Depreciation) | 2,125,476 |
| Net Increase (Decrease) in Net Assets Resulting from Operations | 2,852,060 |
See accompanying Notes, which are an integral part of the Financial Statements.
74
Institutional Target Retirement 2035 Fund
Statement of Changes in Net Assets
| Year Ended September 30, | ||
| 2020 | 2019 | |
| ($000) | ($000) | |
| Increase (Decrease) in Net Assets | ||
| Operations | ||
| Net Investment Income | 670,020 | 634,079 |
| Realized Net Gain (Loss) | 56,564 | (2,464) |
| Change in Unrealized Appreciation (Depreciation) | 2,125,476 | 444,387 |
| Net Increase (Decrease) in Net Assets Resulting from Operations | 2,852,060 | 1,076,002 |
| Distributions1 | ||
| Total Distributions | (710,973) | (540,615) |
| Capital Share Transactions | ||
| Issued | 6,240,319 | 5,824,878 |
| Issued in Lieu of Cash Distributions | 705,511 | 534,790 |
| Redeemed | (4,761,576) | (2,072,971) |
| Net Increase (Decrease) from Capital Share Transactions | 2,184,254 | 4,286,697 |
| Total Increase (Decrease) | 4,325,341 | 4,822,084 |
| Net Assets | ||
| Beginning of Period | 28,584,480 | 23,762,396 |
| End of Period | 32,909,821 | 28,584,480 |
1 Certain prior-period numbers have been reclassified to conform with the current-period presentation.
See accompanying Notes, which are an integral part of the Financial Statements.
75
Institutional Target Retirement 2035 Fund
Financial Highlights
| For a Share Outstanding | Year Ended September 30, | |||||
| Throughout Each Period | 2020 | 2019 | 2018 | 2017 | 2016 | |
| Net Asset Value, Beginning of Period | $24.47 | $24.25 | $22.78 | $20.23 | $18.27 | |
| Investment Operations | ||||||
| Net Investment Income1 | .544 | .579 | .533 | .489 | .457 | |
| Capital Gain Distributions Received1 | — | — | .001 | .003 | .003 | |
| Net Realized and Unrealized Gain (Loss) on Investments | 1.813 | .174 | 1.394 | 2.457 | 1.664 | |
| Total from Investment Operations | 2.357 | .753 | 1.928 | 2.949 | 2.124 | |
| Distributions | ||||||
| Dividends from Net Investment Income | (.606) | (.528) | (.454) | (.394) | (.164) | |
| Distributions from Realized Capital Gains | (.001) | (.005) | (.004) | (.005) | — | |
| Total Distributions | (.607) | (.533) | (.458) | (.399) | (.164) | |
| Net Asset Value, End of Period | $26.22 | $24.47 | $24.25 | $22.78 | $20.23 | |
| Total Return | 9.70% | 3.45% | 8.54% | 14.85% | 11.68% | |
| Ratios/Supplemental Data | ||||||
| Net Assets, End of Period (Millions) | $32,910 | $28,584 | $23,762 | $17,576 | $10,702 | |
| Ratio of Total Expenses to Average Net Assets | — | — | — | — | — | |
| Acquired Fund Fees and Expenses | 0.09% | 0.09% | 0.09% | 0.09% | 0.10% | |
| Ratio of Net Investment Income to | ||||||
| Average Net Assets | 2.20% | 2.47% | 2.25% | 2.30% | 2.37% | |
| Portfolio Turnover Rate | 18% | 7% | 8% | 4% | 2% | |
1 Calculated based on average shares outstanding.
See accompanying Notes, which are an integral part of the Financial Statements.
76
Institutional Target Retirement 2035 Fund
Notes to Financial Statements
Vanguard Institutional Target Retirement 2035 Fund is registered under the Investment Company Act of 1940 as an open-end investment company, or mutual fund. The fund follows a balanced investment strategy by investing in selected Vanguard funds to achieve its targeted allocation of assets to U.S. and international stocks, and U.S. and international bonds. Financial statements and other information about each underlying fund are available at www.vanguard.com.
Market disruptions associated with the COVID-19 pandemic have had a global impact, and uncertainty exists as to the long-term implications. Such disruptions can adversely affect assets of the fund and thus fund performance.
A. The following significant accounting policies conform to generally accepted accounting principles for U.S. investment companies. The fund consistently follows such policies in preparing its financial statements.
1. Security Valuation: Investments are valued at the net asset value of each underlying Vanguard fund determined as of the close of the New York Stock Exchange (generally 4 p.m., Eastern time) on the valuation date.
2. Futures Contracts: The fund uses stock and bond futures contracts to a limited extent, with the objectives of maintaining full exposure to the market and maintaining its target asset allocation. The primary risks associated with the use of futures contracts are imperfect correlation between changes in market values of investments held by the fund and the prices of futures contracts, and the possibility of an illiquid market. Counterparty risk involving futures is mitigated because a regulated clearinghouse is the counterparty instead of the clearing broker. To further mitigate counterparty risk, the fund trades futures contracts on an exchange, monitors the financial strength of its clearing brokers and clearinghouse, and has entered into clearing agreements with its clearing brokers. The clearinghouse imposes initial margin requirements to secure the fund’s performance and requires daily settlement of variation margin representing changes in the market value of each contract. Any securities pledged as initial margin for open contracts are noted in the Schedule of Investments.
Futures contracts are valued at their quoted daily settlement prices. The notional amounts of the contracts are not recorded in the Statement of Assets and Liabilities. Fluctuations in the value of the contracts are recorded in the Statement of Assets and Liabilities as an asset (liability) and in the Statement of Operations as unrealized appreciation (depreciation) until the contracts are closed, when they are recorded as realized gains (losses) on futures contracts.
During the year ended September 30, 2020, the fund’s average investments in long and short futures contracts represented less than 1% and 0% of net assets, respectively, based on the average of the notional amounts at each quarter-end during the period.
3. Federal Income Taxes: The fund intends to continue to qualify as a regulated investment company and distribute all of its taxable income. The fund’s tax returns are open to examination by the relevant tax authorities until expiration of the applicable statute of limitations, which is generally three years after the filing of the tax return. Management has analyzed the fund’s tax positions taken for all open federal and state income tax years, and has concluded that no provision for income tax is required in the fund’s financial statements.
4. Distributions: Distributions to shareholders are recorded on the ex-dividend date. Distributions are determined on a tax basis at the fiscal year-end and may differ from net investment income and realized capital gains for financial reporting purposes.
77
Institutional Target Retirement 2035 Fund
5. Credit Facilities and Interfund Lending Program: The fund and certain other funds managed by The Vanguard Group (“Vanguard”) participate in a $4.3 billion committed credit facility provided by a syndicate of lenders pursuant to a credit agreement and an uncommitted credit facility provided by Vanguard. Both facilities may be renewed annually. Each fund is individually liable for its borrowings, if any, under the credit facilities. Borrowings may be utilized for temporary or emergency purposes, subject to the fund’s regulatory and contractual borrowing restrictions. With respect to the committed credit facility, the participating funds are charged administrative fees and an annual commitment fee of 0.10% of the undrawn committed amount of the facility; these fees are allocated to the funds based on a method approved by the fund’s board of trustees and borne by the funds in which the fund invests (see Note B). Any borrowings under either facility bear interest at a rate based upon the higher of the one-month London Interbank Offered Rate (or an acceptable alternate rate, if necessary), federal funds effective rate, or overnight bank funding rate plus an agreed-upon spread, except that borrowings under the uncommitted credit facility may bear interest based upon an alternative rate agreed to by the fund and Vanguard.
In accordance with an exemptive order (the “Order”) from the SEC, the fund may participate in a joint lending and borrowing program that allows registered open-end Vanguard funds to borrow money from and lend money to each other for temporary or emergency purposes (the “Interfund Lending Program”), subject to compliance with the terms and conditions of the Order, and to the extent permitted by the fund’s investment objective and investment policies. Interfund loans and borrowings normally extend overnight, but can have a maximum duration of seven days. Loans may be called on one business day’s notice. The interest rate to be charged is governed by the conditions of the Order and internal procedures adopted by the board of trustees. The board of trustees is responsible for overseeing the Interfund Lending Program.
For the year ended September 30, 2020, the fund did not utilize the credit facilities or the Interfund Lending Program.
6. Other: Income and capital gain distributions received are recorded on the ex-dividend date. Security transactions are accounted for on the date securities are bought or sold. Costs used to determine realized gains (losses) on the sale of investment securities are those of the specific securities sold.
B. In accordance with the terms of a Funds’ Service Agreement (the “FSA”) between Vanguard and the fund, Vanguard furnishes to the fund investment advisory, corporate management, administrative, marketing, and distribution services at Vanguard’s cost of operations (as defined by the FSA). These costs of operations are allocated to the fund based on methods and guidelines approved by the board of trustees. The FSA provides that expenses otherwise allocable to Vanguard funds-of-funds may be reduced or eliminated to the extent of savings realized by the underlying Vanguard funds by virtue of being part of a fund-of-funds. Accordingly, all expenses for services provided by Vanguard to the fund and all other expenses incurred by the fund during the period ended September 30, 2020, were borne by the underlying Vanguard funds in which the fund invests. The fund’s trustees and officers are also trustees and officers, respectively, of the underlying Vanguard funds, as well as directors and employees, respectively, of Vanguard.
C. Various inputs may be used to determine the value of the fund’s investments and derivatives. These inputs are summarized in three broad levels for financial statement purposes. The inputs or methodologies used to value securities are not necessarily an indication of the risk associated with investing in those securities.
78
Institutional Target Retirement 2035 Fund
Level 1—Quoted prices in active markets for identical securities.
Level 2—Other significant observable inputs (including quoted prices for similar securities, interest rates, prepayment speeds, credit risk, etc.).
Level 3—Significant unobservable inputs (including the fund’s own assumptions used to determine the fair value of investments). Any investments and derivatives valued with significant unobservable inputs are noted on the Schedule of Investments.
At September 30, 2020, 100% of the market value of the fund’s investments and derivative was determined based on Level 1 inputs.
D. Permanent differences between book-basis and tax-basis components of net assets, if any, are reclassified among capital accounts in the financial statements to reflect their tax character. These reclassifications have no effect on net assets or net asset value per share.
Temporary differences between book-basis and tax-basis components of total distributable earnings (loss) arise when certain items of income, gain, or loss are recognized in different periods for financial statement and tax purposes; these differences will reverse at some time in the future. The differences are primarily related to the deferral of losses from wash sales and the recognition of unrealized gains or losses from certain derivative contracts. As of period end, the tax-basis components of total distributable earnings (loss) are detailed in the table as follows:
| Amount | |
| ($000) | |
| Undistributed Ordinary Income | 396,241 |
| Undistributed Long-Term Gains | 52,500 |
| Capital Loss Carryforwards | — |
| Qualified Late-Year Losses | — |
| Net Unrealized Gains (Losses) | 5,848,298 |
The tax character of distributions paid was as follows:
| Year Ended September 30, | |||
| 2020 | 2019 | ||
| Amount | Amount | ||
| ($000) | ($000) | ||
| Ordinary Income* | 710,973 | 540,348 | |
| Long-Term Capital Gains | — | 267 | |
| Total | 710,973 | 540,615 | |
* Includes short-term capital gains, if any.
As of September 30, 2020, gross unrealized appreciation and depreciation for investments and derivatives based on cost for U.S. federal income tax purposes were as follows:
| Amount | |
| ($000) | |
| Tax Cost | 27,193,962 |
| Gross Unrealized Appreciation | 5,970,205 |
| Gross Unrealized Depreciation | (121,907) |
| Net Unrealized Appreciation (Depreciation) | 5,848,298 |
79
Institutional Target Retirement 2035 Fund
E. Capital shares issued and redeemed were:
| Year Ended September 30, | |||
| 2020 | 2019 | ||
| Shares | Shares | ||
| (000) | (000) | ||
| Issued | 252,004 | 251,112 | |
| Issued in Lieu of Cash Distributions | 27,602 | 25,250 | |
| Redeemed | (192,853) | (87,855) | |
| Net Increase (Decrease) in Shares Outstanding | 86,753 | 188,507 | |
At September 30, 2020, one shareholder was the record or beneficial owner of 33% of the fund’s net assets. If the shareholder were to redeem its investment in the fund, the redemption might lead to the realization of taxable capital gains.
F. Transactions during the period in affiliated underlying Vanguard funds were as follows:
| Current Period Transactions | ||||||||
| Sept. 30, | Proceeds | Realized | Sept. 30, | |||||
| 2019 | from | Net | Change in | Capital Gain | 2020 | |||
| Market | Purchases | Securities | Gain | Unrealized | Distributions | Market | ||
| Value | at Cost | Sold | (Loss) | App. (Dep.) | Income | Received | Value | |
| ($000) | ($000) | ($000) | ($000) | ($000) | ($000) | ($000) | ($000) | |
| Vanguard Market Liquidity Fund | 11,647 | NA1 | NA1 | (83) | 25 | 543 | — | 528,595 |
| Vanguard Total Bond Market II Index Fund | 4,834,583 | 2,522,180 | 2,083,685 | 36,344 | 187,202 | 120,953 | — | 5,496,624 |
| Vanguard Total International Bond Index Fund | 2,058,908 | 1,028,800 | 495,722 | 3,165 | (18,013) | 69,302 | — | 2,577,138 |
| Vanguard Total International Stock Index Fund | 8,662,203 | 1,545,323 | 621,521 | (45,711) | 250,462 | 226,560 | — | 9,790,756 |
| Vanguard Total Stock Market Index Fund | 13,034,246 | 2,070,637 | 2,194,161 | 33,645 | 1,704,780 | 252,632 | — | 14,649,147 |
| Total | 28,601,587 | 7,166,940 | 5,395,089 | 27,360 | 2,124,456 | 669,990 | — | 33,042,260 |
1 Not applicable—purchases and sales are for temporary cash investment purposes.
G. Management has determined that no events or transactions occurred subsequent to September 30, 2020, that would require recognition or disclosure in these financial statements.
80
Report of Independent Registered Public Accounting Firm
To the Board of Trustees of Vanguard Chester Funds and Shareholders of Vanguard Institutional Target Retirement Income Fund, Vanguard Institutional Target Retirement 2015 Fund, Vanguard Institutional Target Retirement 2020 Fund, Vanguard Institutional Target Retirement 2025 Fund, Vanguard Institutional Target Retirement 2030 Fund and Vanguard Institutional Target Retirement 2035 Fund
Opinions on the Financial Statements
We have audited the accompanying statements of assets and liabilities, including the schedules of investments, of Vanguard Institutional Target Retirement Income Fund, Vanguard Institutional Target Retirement 2015 Fund, Vanguard Institutional Target Retirement 2020 Fund, Vanguard Institutional Target Retirement 2025 Fund, Vanguard Institutional Target Retirement 2030 Fund and Vanguard Institutional Target Retirement 2035 Fund (six of the funds constituting Vanguard Chester Funds, hereafter collectively referred to as the “Funds”) as of September 30, 2020, the related statements of operations for the year ended September 30, 2020, the statements of changes in net assets for each of the two years in the period ended September 30, 2020, including the related notes, and the financial highlights for each of the five years in the period ended September 30, 2020 (collectively referred to as the “financial statements”). In our opinion, the financial statements present fairly, in all material respects, the financial position of each of the Funds as of September 30, 2020, the results of each of their operations for the year then ended, the changes in each of their net assets for each of the two years in the period ended September 30, 2020 and each of the financial highlights for each of the five years in the period ended September 30, 2020 in conformity with accounting principles generally accepted in the United States of America.
Basis for Opinions
These financial statements are the responsibility of the Funds’ management. Our responsibility is to express an opinion on the Funds’ financial statements based on our audits. We are a public accounting firm registered with the Public Company Accounting Oversight Board (United States) (“PCAOB”) and are required to be independent with respect to the Funds in accordance with the U.S. federal securities laws and the applicable rules and regulations of the Securities and Exchange Commission and the PCAOB.
We conducted our audits of these financial statements in accordance with the standards of the PCAOB. Those standards require that we plan and perform the audit to obtain reasonable assurance about whether the financial statements are free of material misstatement, whether due to error or fraud.
Our audits included performing procedures to assess the risks of material misstatement of the financial statements, whether due to error or fraud, and performing procedures that respond to those risks. Such procedures included examining, on a test basis, evidence regarding the amounts and disclosures in the financial statements. Our audits also included evaluating the accounting principles used and significant estimates made by management, as well as evaluating the overall presentation of the financial statements. Our procedures included confirmation of securities owned as of September 30, 2020 by correspondence with the transfer agent. We believe that our audits provide a reasonable basis for our opinions.
/s/PricewaterhouseCoopers LLP
Philadelphia, Pennsylvania
November 12, 2020
We have served as the auditor of one or more investment companies in The Vanguard Group of Funds since 1975.
81
Special 2020 tax information (unaudited) for Vanguard Institutional Target Retirement Funds
This information for the fiscal year ended September 30, 2020, is included pursuant to provisions of the Internal Revenue Code.
The funds distributed capital gain dividends (20% rate gain distributions) to shareholders during the fiscal year as follows:
| Fund | ($000) |
| Institutional Target Retirement Income Fund | 1,773 |
| Institutional Target Retirement 2015 Fund | 40,436 |
| Institutional Target Retirement 2020 Fund | 9,949 |
| Institutional Target Retirement 2025 Fund | 2,270 |
| Institutional Target Retirement 2030 Fund | 1,445 |
| Institutional Target Retirement 2035 Fund | — |
For nonresident alien shareholders, 100% of short-term capital gain dividends distributed by the funds are qualified short-term capital gains.
The funds distributed qualified dividend income to shareholders during the fiscal year as follows:
| Fund | ($000) |
| Institutional Target Retirement Income Fund | 32,941 |
| Institutional Target Retirement 2015 Fund | 60,964 |
| Institutional Target Retirement 2020 Fund | 229,384 |
| Institutional Target Retirement 2025 Fund | 375,031 |
| Institutional Target Retirement 2030 Fund | 402,003 |
| Institutional Target Retirement 2035 Fund | 406,349 |
For corporate shareholders, the percentage of investment income (dividend income plus short-term gains, if any) that qualifies for the dividends-received deduction is as follows:
| Fund | Percentage |
| Institutional Target Retirement Income Fund | 11.3% |
| Institutional Target Retirement 2015 Fund | 14.3 |
| Institutional Target Retirement 2020 Fund | 18.4 |
| Institutional Target Retirement 2025 Fund | 25.0 |
| Institutional Target Retirement 2030 Fund | 29.3 |
| Institutional Target Retirement 2035 Fund | 32.9 |
82
The funds designate to shareholders foreign source income and foreign taxes paid as follows:
| Foreign Source Income | Foreign Taxes Paid | |
| Fund | ($000) | ($000) |
| Institutional Target Retirement Income Fund | 51,748 | 1,494 |
| Institutional Target Retirement 2015 Fund | 71,985 | 2,380 |
| Institutional Target Retirement 2020 Fund | 220,557 | 9,073 |
| Institutional Target Retirement 2025 Fund | 341,461 | 15,466 |
| Institutional Target Retirement 2030 Fund | 330,843 | 16,599 |
| Institutional Target Retirement 2035 Fund | 306,124 | 16,780 |
Shareholders will receive more detailed information with their Form 1099-DIV in January 2021 to determine the calendar-year amounts to be included on their 2020 tax returns.
83
BLOOMBERG is a trademark and service mark of Bloomberg Finance L.P. BARCLAYS is a trademark and service mark of Barclays Bank Plc, used under license. Bloomberg Finance L.P. and its affiliates, including Bloomberg Index Services Limited (BISL) (collectively, Bloomberg), or Bloomberg’s licensors, own all proprietary rights in the Bloomberg Barclays U.S. Aggregate Bond Index, Bloomberg Barclays U.S. Aggregate Float Adjusted Index, Bloomberg Barclays U.S. Treasury Inflation Protected Securities Index, Bloomberg Barclays U.S. Treasury Inflation-Protected Securities (TIPS) 0–5 Year Index, and the Bloomberg Barclays Global Aggregate ex-USD Float Adjusted RIC Capped Index (USD Hedged) (the Indices or Bloomberg Barclays Indices).
Neither Barclays Bank Plc, Barclays Capital Inc., or any affiliate (collectively Barclays) or Bloomberg is the issuer or producer of the Institutional Target Retirement Funds (including the Total Bond Market II Index Fund, the Total International Bond Index Fund, and the Short-Term Inflation-Protected Securities Index Fund) and neither Bloomberg nor Barclays has any responsibilities, obligations or duties to investors in the Institutional Target Retirement Funds. The Indices are licensed for use by The Vanguard Group, Inc. (Vanguard) as the sponsor of the Institutional Target Retirement Funds. Bloomberg and Barclays’ only relationship with Vanguard in respect to the Indices is the licensing of the Indices, which is determined, composed and calculated by BISL, or any successor thereto, without regard to the Issuer or the Institutional Target Retirement Funds or the owners of the Institutional Target Retirement Funds.
Additionally, Vanguard may for itself execute transaction(s) with Barclays in or relating to the Indices in connection with the Institutional Target Retirement Funds. Investors acquire the Institutional Target Retirement Funds from Vanguard and investors neither acquire any interest in the Indices nor enter into any relationship of any kind whatsoever with Bloomberg or Barclays upon making an investment in the Institutional Target Retirement Funds. The Institutional Target Retirement Funds are not sponsored, endorsed, sold or promoted by Bloomberg or Barclays. Neither Bloomberg nor Barclays makes any representation or warranty, express or implied regarding the advisability of investing in the Institutional Target Retirement Funds or the advisability of investing in securities generally or the ability of the Indices to track corresponding or relative market performance. Neither Bloomberg nor Barclays has passed on the legality or suitability of the Institutional Target Retirement Funds with respect to any person or entity. Neither Bloomberg nor Barclays is responsible for and has not participated in the determination of the timing of, prices at, or quantities of the Institutional Target Retirement Funds to be issued. Neither Bloomberg nor Barclays has any obligation to take the needs of the Issuer or the owners of the Institutional Target Retirement Funds or any other third party into consideration in determining, composing or calculating the Indices. Neither Bloomberg nor Barclays has any obligation or liability in connection with administration, marketing or trading of the Institutional Target Retirement Funds.
84
The licensing agreement between Bloomberg and Barclays is solely for the benefit of Bloomberg and Barclays and not for the benefit of the owners of the Institutional Target Retirement Funds, investors or other third parties. In addition, the licensing agreement between Vanguard and Bloomberg is solely for the benefit of Vanguard and Bloomberg and not for the benefit of the owners of the Institutional Target Retirement Funds, investors or other third parties.
NEITHER BLOOMBERG NOR BARCLAYS SHALL HAVE ANY LIABILITY TO THE ISSUER, INVESTORS OR TO OTHER THIRD PARTIES FOR THE QUALITY, ACCURACY AND/OR COMPLETENESS OF THE BLOOMBERG BARCLAYS INDICES OR ANY DATA INCLUDED THEREIN OR FOR INTERRUPTIONS IN THE DELIVERY OF THE BLOOMBERG BARCLAYS INDICES. NEITHER BLOOMBERG NOR BARCLAYS MAKES ANY WARRANTY, EXPRESS OR IMPLIED, AS TO RESULTS TO BE OBTAINED BY THE ISSUER, THE INVESTORS OR ANY OTHER PERSON OR ENTITY FROM THE USE OF THE BLOOMBERG BARCLAYS INDICES OR ANY DATA INCLUDED THEREIN. NEITHER BLOOMBERG NOR BARCLAYS MAKES ANY EXPRESS OR IMPLIED WARRANTIES, AND EACH HEREBY EXPRESSLY DISCLAIMS ALL WARRANTIES OF MERCHANTABILITY OR FITNESS FOR A PARTICULAR PURPOSE OR USE WITH RESPECT TO BLOOMBERG BARCLAYS INDICES OR ANY DATA INCLUDED THEREIN. BLOOMBERG RESERVES THE RIGHT TO CHANGE THE METHODS OF CALCULATION OR PUBLICATION, OR TO CEASE THE CALCULATION OR PUBLICATION OF THE BLOOMBERG BARCLAYS INDICES, AND NEITHER BLOOMBERG NOR BARCLAYS SHALL BE LIABLE FOR ANY MISCALCULATION OF OR ANY INCORRECT, DELAYED OR INTERRUPTED PUBLICATION WITH RESPECT TO ANY OF THE BLOOMBERG BARCLAYS INDICES. NEITHER BLOOMBERG NOR BARCLAYS SHALL BE LIABLE FOR ANY DAMAGES, INCLUDING, WITHOUT LIMITATION, ANY SPECIAL, INDIRECT OR CONSEQUENTIAL DAMAGES, OR ANY LOST PROFITS AND EVEN IF ADVISED OF THE POSSIBILITY OF SUCH, RESULTING FROM THE USE OF BLOOMBERG BARCLAYS INDICES OR ANY DATA INCLUDED THEREIN OR WITH RESPECT TO THE INSTITUTIONAL TARGET RETIREMENT FUNDS.
None of the information supplied by Bloomberg or Barclays and used in this publication may be reproduced in any manner without the prior written permission of both Bloomberg and Barclays Capital, the investment banking division of Barclays Bank Plc. Barclays Bank Plc is registered in England No. 1026167. Registered office 1 Churchill Place London E14 5HP.
© 2020 Bloomberg. Used with Permission.
Source: Bloomberg Index Services Limited. Copyright 2020, Bloomberg. All rights reserved.
85
This page intentionally left blank.
This page intentionally left blank.
This page intentionally left blank.
This page intentionally left blank.
This page intentionally left blank.
The People Who Govern Your Fund
The trustees of your mutual fund are there to see that the fund is operated and managed in your best interests since, as a shareholder, you are a part owner of the fund. Your fund’s trustees also serve on the board of directors of The Vanguard Group, Inc., which is owned by the Vanguard funds and provides services to them.
A majority of Vanguard’s board members are independent, meaning that they have no affiliation with Vanguard or the funds they oversee, apart from the sizable personal investments they have made as private individuals. The independent board members have distinguished backgrounds in business, academia, and public service. Each of the trustees and executive officers oversees 213 Vanguard funds.
Information for each trustee and executive officer of the fund appears below. That information, as well as the Vanguard fund count, is as of the date on the cover of this fund report. The mailing address of the trustees and officers is P.O. Box 876, Valley Forge, PA 19482. More information about the trustees is in the Statement of Additional Information, which can be obtained, without charge, by contacting Vanguard at 800-662-7447, or online at vanguard.com.
Interested Trustee1
Mortimer J. Buckley
Born in 1969. Trustee since January 2018. Principal occupation(s) during the past five years and other experience: chairman of the board (2019–present) of Vanguard and of each of the investment companies served by Vanguard; chief executive officer (2018– present) of Vanguard; chief executive officer, president, and trustee (2018–present) of each of the investment companies served by Vanguard; president and director (2017–present) of Vanguard; and president (2018–present) of Vanguard Marketing Corporation. Chief investment officer (2013–2017), managing director (2002–2017), head of the Retail Investor Group (2006–2012), and chief information officer (2001–2006) of Vanguard. Chairman of the board (2011–2017) and trustee (2009–2017) of the Children’s Hospital of Philadelphia; and trustee (2018–present) and vice chair (2019–present) of The Shipley School.
Independent Trustees
Emerson U. Fullwood
Born in 1948. Trustee since January 2008. Principal occupation(s) during the past five years and other experience: executive chief staff and marketing officer for North America and corporate vice president (retired 2008) of Xerox Corporation (document management products and services). Former president of the Worldwide Channels Group, Latin America, and Worldwide Customer Service and executive chief staff officer of Developing Markets of Xerox. Executive in residence and 2009–2010 Distinguished Minett Professor at the Rochester Institute of Technology. Director of SPX FLOW, Inc. (multi-industry manufac-turing). Director of the University of Rochester Medical Center, the Monroe Community College Foundation, the United Way of Rochester, North Carolina A&T University, and Roberts Wesleyan College. Trustee of the University of Rochester.
Amy Gutmann
Born in 1949. Trustee since June 2006. Principal occupation(s) during the past five years and other experience: president (2004–present) of the University of Pennsylvania. Christopher H. Browne Distinguished Professor of Political Science, School of Arts and Sciences, and professor of communication, Annenberg School for Communication, with secondary faculty appointments in the Department of Philosophy, School of Arts and Sciences, and at the Graduate School of Education, University of Pennsylvania.
F. Joseph Loughrey
Born in 1949. Trustee since October 2009. Principal occupation(s) during the past five years and other experience: president and chief operating officer (retired 2009) and vice chairman of the board (2008–2009) of Cummins Inc. (industrial machinery). Chairman of the board of Hillenbrand, Inc. (specialized consumer services) and the Lumina Foundation. Director of the V Foundation. Member of the advisory
| 1 | Mr. Buckley is considered an “interested person,” as defined in the Investment Company Act of 1940, because he is an officer of the Vanguard funds. |
council for the College of Arts and Letters and chair of the advisory board to the Kellogg Institute for International Studies, both at the University of Notre Dame.
Mark Loughridge
Born in 1953. Trustee since March 2012. Principal occupation(s) during the past five years and other experience: senior vice president and chief financial officer (retired 2013) of IBM (information technology services). Fiduciary member of IBM’s Retirement Plan Committee (2004–2013), senior vice president and general manager (2002–2004) of IBM Global Financing, vice president and controller (1998–2002) of IBM, and a variety of other prior management roles at IBM. Member of the Council on Chicago Booth.
Scott C. Malpass
Born in 1962. Trustee since March 2012. Principal occupation(s) during the past five years and other experience: chief investment officer (retired June 2020) and vice president (retired June 2020) of the University of Notre Dame. Assistant professor of finance at the Mendoza College of Business, University of Notre Dame, and member of the Notre Dame 403(b) Investment Committee (retired June 2020). Member of the board of Catholic Investment Services, Inc. (investment advisors) and the board of superintendence of the Institute for the Works of Religion.
Deanna Mulligan
Born in 1963. Trustee since January 2018. Principal occupation(s) during the past five years and other experience: board chair (2020–present), chief executive officer (2011–2020), and president (2010–2019) of The Guardian Life Insurance Company of America. Chief operating officer (2010–2011) and executive vice president (2008–2010) of the individual life and disability division of Guardian Life. Member of the board of the American Council of Life Insurers and the board of the Economic Club of New York. Trustee of the Partnership for New York City (business leadership), Chief Executives for Corporate Purpose, NewYork-Presbyterian Hospital, Catalyst, and the Bruce Museum (arts and science). Member of the Advisory Council for the Stanford Graduate School of Business.
André F. Perold
Born in 1952. Trustee since December 2004. Principal occupation(s) during the past five years and other experience: George Gund Professor of Finance and Banking, Emeritus at the Harvard Business School (retired 2011). Chief investment officer and co-managing partner of HighVista Strategies (private investment firm). Member of the board of advisors and member of the investment committee of the Museum of Fine Arts Boston. Member of the board (2018–present) of RIT Capital Partners (investment firm). Member of the investment committee of Partners Health Care System.
Sarah Bloom Raskin
Born in 1961. Trustee since January 2018. Principal occupation(s) during the past five years and other experience: deputy secretary (2014–2017) of the United States Department of the Treasury. Governor (2010–2014) of the Federal Reserve Board. Commissioner (2007–2010) of financial regulation for the State of Maryland. Member of the board of directors (2012–2014) of Neighborhood Reinvestment Corporation. Director (2017–present) of i(x) Investments, LLC; director (2017–present) of Reserve Trust. Rubenstein Fellow (2017–present) of Duke University; trustee (2017–present) of Amherst College, and trustee (2019–present) of the Folger Shakespeare Library.
Peter F. Volanakis
Born in 1955. Trustee since July 2009. Principal occupation(s) during the past five years and other experience: president and chief operating officer (retired 2010) of Corning Incorporated (communications equipment) and director of Corning Incorporated (2000–2010) and Dow Corning (2001–2010). Director (2012) of SPX Corporation (multi-industry manufacturing). Overseer of the Amos Tuck School of Business Administration, Dartmouth College (2001–2013). Chairman of the board of trustees of Colby-Sawyer College. Member of the board of Hypertherm Inc. (industrial cutting systems, software, and consumables).
Executive Officers
John Bendl
Born in 1970. Principal occupation(s) during the past five years and other experience: principal of Vanguard. Chief financial officer (2019–present) of each of the investment companies served by Vanguard. Chief accounting officer, treasurer, and controller of Vanguard (2017–present). Partner (2003–2016) at KPMG (audit, tax, and advisory services).
Christine M. Buchanan
Born in 1970. Principal occupation(s) during the past five years and other experience: principal of Vanguard. Treasurer (2017–present) of each of the investment companies served by Vanguard. Partner (2005–2017) at KPMG (audit, tax, and advisory services).
David Cermak
Born in 1960. Principal occupation(s) during the past five years and other experience: principal of Vanguard. Finance director (2019–present) of each of the investment companies served by Vanguard. Managing director and head (2017–present) of Vanguard Investments Singapore. Managing director and head (2017–2019) of Vanguard Investments Hong Kong. Representative director and head (2014–2017) of Vanguard Investments Japan.
John Galloway
Born in 1973. Principal occupation(s) during the past five years and other experience: principal of Vanguard. Investment stewardship officer (September 2020–present) of each of the investment companies served by Vanguard. Head of Investor Advocacy (February 2020–present) and head of Marketing Strategy and Planning (2017–2020) at Vanguard. Deputy assistant to the President of the United States (2015).
Thomas J. Higgins
Born in 1957. Principal occupation(s) during the past five years and other experience: principal of Vanguard. Finance director (2019–present), chief financial officer (2008–2019), and treasurer (1998–2008) of each of the investment companies served by Vanguard.
Peter Mahoney
Born in 1974. Principal occupation(s) during the past five years and other experience: principal of Vanguard. Controller (2015–present) of each of the investment companies served by Vanguard. Head of International Fund Services (2008–2014) at Vanguard.
Anne E. Robinson
Born in 1970. Principal occupation(s) during the past five years and other experience: general counsel (2016–present) of Vanguard. Secretary (2016–present) of Vanguard and of each of the investment companies served by Vanguard. Managing director (2016–present) of Vanguard. Managing director and general counsel of Global Cards and Consumer Services (2014–2016) at Citigroup. Counsel (2003–2014) at American Express.
Michael Rollings
Born in 1963. Principal occupation(s) during the past five years and other experience: finance director (2017–present) and treasurer (2017) of each of the investment companies served by Vanguard. Managing director (2016–present) of Vanguard. Chief financial officer (2016–present) of Vanguard. Director (2016–present) of Vanguard Marketing Corporation. Executive vice president and chief financial officer (2006–2016) of MassMutual Financial Group.
John E. Schadl
Born in 1972. Principal occupation(s) during the past five years and other experience: principal of Vanguard. Chief compliance officer (2019–present) of Vanguard and of each of the investment companies served by Vanguard. Assistant vice president (2019–present) of Vanguard Marketing Corporation.
Vanguard Senior Management Team
| Joseph Brennan | James M. Norris |
| Mortimer J. Buckley | Thomas M. Rampulla |
| Gregory Davis | Karin A. Risi |
| John James | Anne E. Robinson |
| John T. Marcante | Michael Rollings |
| Chris D. McIsaac | Lauren Valente |
Connect with Vanguard® > vanguard.com
Fund Information > 800-662-7447
Direct Investor Account Services > 800-662-2739
Institutional Investor Services > 800-523-1036
Text Telephone for People
Who Are Deaf or Hard of Hearing > 800-749-7273
This material may be used in conjunction with the offering of shares of any Vanguard fund only if preceded or accompanied by the fund’s current prospectus.
All comparative mutual fund data are from Morningstar, Inc., unless otherwise noted.
You can obtain a free copy of Vanguard’s proxy voting guidelines by visiting vanguard.com/proxyreporting or by calling Vanguard at 800-662-2739. The guidelines are also available from the SEC’s website, www.sec.gov. In addition, you may obtain a free report on how your fund voted the proxies for securities it owned during the 12 months ended June 30. To get the report, visit either vanguard.com/proxyreporting or www.sec.gov.
You can review information about your fund on the SEC’s website, and you can receive copies of this information, for a fee, by sending a request via email addressed to publicinfo@sec.gov.
| © 2020 The Vanguard Group, Inc. All rights reserved. | |
| Vanguard Marketing Corporation, Distributor. | |
| Q6730 112020 |

| Annual Report | September 30, 2020 |
| Vanguard Institutional Target Retirement Funds |
| Vanguard Institutional Target Retirement 2040 Fund |
| Vanguard Institutional Target Retirement 2045 Fund |
| Vanguard Institutional Target Retirement 2050 Fund |
| Vanguard Institutional Target Retirement 2055 Fund |
| Vanguard Institutional Target Retirement 2060 Fund |
| Vanguard Institutional Target Retirement 2065 Fund |
| See the inside front cover for important information about access to your fund’s annual and semiannual shareholder reports. |
Important information about access to shareholder reports
Beginning on January 1, 2021, as permitted by regulations adopted by the Securities and Exchange Commission, paper copies of your fund’s annual and semiannual shareholder reports will no longer be sent to you by mail, unless you specifically request them. Instead, you will be notified by mail each time a report is posted on the website and will be provided with a link to access the report.
If you have already elected to receive shareholder reports electronically, you will not be affected by this change and do not need to take any action. You may elect to receive shareholder reports and other communications from the fund electronically by contacting your financial intermediary (such as a broker-dealer or bank) or, if you invest directly with the fund, by calling Vanguard at one of the phone numbers on the back cover of this report or by logging on to vanguard.com.
You may elect to receive paper copies of all future shareholder reports free of charge. If you invest through a financial intermediary, you can contact the intermediary to request that you continue to receive paper copies. If you invest directly with the fund, you can call Vanguard at one of the phone numbers on the back cover of this report or log on to vanguard.com. Your election to receive paper copies will apply to all the funds you hold through an intermediary or directly with Vanguard.
| Contents | |
| Your Fund’s Performance at a Glance | 1 |
| About Your Fund’s Expenses | 2 |
| Institutional Target Retirement 2040 Fund | 4 |
| Institutional Target Retirement 2045 Fund | 16 |
| Institutional Target Retirement 2050 Fund | 28 |
| Institutional Target Retirement 2055 Fund | 40 |
| Institutional Target Retirement 2060 Fund | 52 |
| Institutional Target Retirement 2065 Fund | 64 |
Please note: The opinions expressed in this report are just that—informed opinions. They should not be considered promises or advice. Also, please keep in mind that the information and opinions cover the period through the date on the front of this report. Of course, the risks of investing in your fund are spelled out in the prospectus.
Your Fund’s Performance at a Glance
· For the 12 months ended September 30, 2020, returns for the six Vanguard Institutional Target Retirement Funds covered in this report ranged from 9.93% for the Institutional Target Retirement 2040 Fund to 10.30% for the Institutional Target Retirement 2060 Fund. Each fund performed in line with its composite benchmark after expenses.
· The rebound in global stocks that began in March continued in the third quarter. Massive fiscal and monetary support from governments and central banks, signs of economic healing, and reported progress toward a COVID-19 vaccine all buoyed the markets until September, when investor sentiment soured a little.
· In the global bond market, the pandemic led to a wave of issuance, which drove up supply, but demand held up fairly well. U.S. Treasury yields ended the quarter little changed.
· Vanguard Institutional Target Retirement Funds are designed to reach an allocation of 70% bonds and 30% stocks within seven years after their target dates. The funds invest all their assets in Vanguard index funds that seek to match the performance of broad stock and bond market indexes.
· From their inception dates through September 30, the funds’ average annual returns ranged from 7.39% for the Institutional Target Retirement 2040 Fund to 8.13% for the Institutional Target Retirement 2065 Fund.
| Market Barometer | |||
| Average Annual Total Returns | |||
| Periods Ended September 30, 2020 | |||
| One Year | Three Years | Five Years | |
| Stocks | |||
| Russell 1000 Index (Large-caps) | 16.01% | 12.38% | 14.09% |
| Russell 2000 Index (Small-caps) | 0.39 | 1.77 | 8.00 |
| Russell 3000 Index (Broad U.S. market) | 15.00 | 11.65 | 13.69 |
| FTSE All-World ex US Index (International) | 3.55 | 1.50 | 6.49 |
| Bonds | |||
| Bloomberg Barclays U.S. Aggregate Bond Index (Broad taxable market) | 6.98% | 5.24% | 4.18% |
| Bloomberg Barclays Municipal Bond Index (Broad tax-exempt market) | 4.09 | 4.28 | 3.84 |
| FTSE Three-Month U.S. Treasury Bill Index | 1.02 | 1.65 | 1.15 |
| CPI | |||
| Consumer Price Index | 1.37% | 1.79% | 1.81% |
1
About Your Fund’s Expenses
As a shareholder of the fund, you incur ongoing costs, which include costs for portfolio management, administrative services, and shareholder reports (like this one), among others. Operating expenses, which are deducted from a fund’s gross income, directly reduce the investment return of the fund.
A typical fund’s expenses are expressed as a percentage of its average net assets. The Institutional Target Retirement Funds have no direct expenses, but each fund bears its proportionate share of the costs for the underlying funds in which it invests. These indirect expenses make up the acquired fund fees and expenses, also expressed as a percentage of average net assets.
The following examples are intended to help you understand the ongoing cost (in dollars) of investing in your fund and to compare these costs with those of other mutual funds. The examples are based on an investment of $1,000 made at the beginning of the period shown and held for the entire period. The costs were calculated using the acquired fund fees and expenses for each Institutional Target Retirement Fund.
The accompanying table illustrates your fund’s costs in two ways:
· Based on actual fund return. This section helps you to estimate the actual expenses that you paid over the period. The “Ending Account Value” shown is derived from the fund’s actual return, and the third column shows the dollar amount that would have been paid by an investor who started with $1,000 in the fund. You may use the information here, together with the amount you invested, to estimate the expenses that you paid over the period.
To do so, simply divide your account value by $1,000 (for example, an $8,600 account value divided by $1,000 = 8.6), then multiply the result by the number given for your fund under the heading “Expenses Paid During Period.”
· Based on hypothetical 5% yearly return. This section is intended to help you compare your fund’s costs with those of other mutual funds. It assumes that the fund had a yearly return of 5% before expenses, but that the expense ratio is unchanged. In this case—because the return used is not the fund’s actual return—the results do not apply to your investment. The example is useful in making comparisons because the Securities and Exchange Commission requires all mutual funds to calculate expenses based on a 5% return. You can assess your fund’s costs by comparing this hypothetical example with the hypothetical examples that appear in shareholder reports of other funds.
Note that the expenses shown in the table are meant to highlight and help you compare ongoing costs only and do not reflect transaction costs incurred by the fund for buying and selling securities. Further, the expenses do not include any purchase, redemption, or account service fees described in the fund prospectus. If such fees were applied to your account, your costs would be higher. Your fund does not carry a “sales load.”
The calculations assume no shares were bought or sold during the period. Your actual costs may have been higher or lower, depending on the amount of your investment and the timing of any purchases or redemptions.
You can find more information about the fund’s expenses, including annual expense ratios, in the Financial Statements section of this report. For additional information on operating expenses and other shareholder costs, please refer to your fund’s current prospectus.
2
| Six Months Ended September 30, 2020 | |||
| Beginning | Ending | Expenses | |
| Account Value | Account Value | Paid During | |
| 3/31/2020 | 9/30/2020 | Period | |
| Based on Actual Fund Return | |||
| Institutional Target Retirement 2040 Fund | $1,000.00 | $1,251.89 | $0.51 |
| Institutional Target Retirement 2045 Fund | $1,000.00 | $1,273.25 | $0.51 |
| Institutional Target Retirement 2050 Fund | $1,000.00 | $1,273.20 | $0.51 |
| Institutional Target Retirement 2055 Fund | $1,000.00 | $1,273.59 | $0.51 |
| Institutional Target Retirement 2060 Fund | $1,000.00 | $1,274.15 | $0.51 |
| Institutional Target Retirement 2065 Fund | $1,000.00 | $1,273.95 | $0.51 |
| Based on Hypothetical 5% Yearly Return | |||
| Institutional Target Retirement 2040 Fund | $1,000.00 | $1,024.55 | $0.46 |
| Institutional Target Retirement 2045 Fund | $1,000.00 | $1,024.55 | $0.46 |
| Institutional Target Retirement 2050 Fund | $1,000.00 | $1,024.55 | $0.46 |
| Institutional Target Retirement 2055 Fund | $1,000.00 | $1,024.55 | $0.46 |
| Institutional Target Retirement 2060 Fund | $1,000.00 | $1,024.55 | $0.46 |
| Institutional Target Retirement 2065 Fund | $1,000.00 | $1,024.55 | $0.46 |
The calculations are based on the acquired fund fees and expenses for the most recent six-month period. The funds’ annualized expense figures for that period are (in order as listed from top to bottom above) 0.09%, 0.09%, 0.09%, 0.09%, 0.09%, and 0.09%. The dollar amounts shown as “Expenses Paid” are equal to the annualized average weighted expense ratio for the underlying funds multiplied by the average account value over the period, multiplied by the number of days in the most recent six-month period, then divided by the number of days in the most recent 12-month period (183/366).
3
Institutional Target Retirement 2040 Fund
Performance Summary
All of the returns in this report represent past performance, which is not a guarantee of future results that may be achieved by the fund. (Current performance may be lower or higher than the performance data cited. For performance data current to the most recent month-end, visit our website at vanguard.com/performance.) Note, too, that both investment returns and principal value can fluctuate widely, so an investor’s shares, when sold, could be worth more or less than their original cost. The returns shown do not reflect taxes that a shareholder would pay on fund distributions or on the sale of fund shares.
Cumulative Performance: June 26, 2015, Through September 30, 2020
Initial Investment of $100,000,000

| Average Annual Total Returns | |||||
| Periods Ended September 30, 2020 | |||||
| Since | Final Value | ||||
| One | Five | Inception | of a $100,000,000 | ||
| Year | Years | (6/26/2015) | Investment | ||
 | Institutional Target Retirement 2040 Fund | 9.93% | 10.00% | 7.39% | $145,566,849 |
 | Target 2040 Composite Index | 10.73 | 10.35 | 7.73 | 147,955,653 |
 | MSCI US Broad Market Index | 14.99 | 13.70 | 10.98 | 173,014,030 |
Target 2040 Composite Index: Derived by applying the fund’s target asset allocation to the results of the following benchmarks: for international stocks of developed markets, the MSCI EAFE Index through December 15, 2010, the MSCI ACWI ex USA IMI Index through June 2, 2013, and the FTSE Global All Cap ex US Index thereafter; for emerging-market stocks, the Select Emerging Markets Index through August 23, 2006, the MSCI Emerging Markets Index through December 15, 2010, the MSCI ACWI ex USA IMI Index through June 2, 2013, and the FTSE Global All Cap ex US Index thereafter; for U.S. bonds, the Bloomberg Barclays U.S. Aggregate Bond Index through December 31, 2009, and the Bloomberg Barclays U.S. Aggregate Float Adjusted Index thereafter; for international bonds, the Bloomberg Barclays Global Aggregate ex-USD Float Adjusted RIC Capped Index Hedged beginning June 3, 2013; and for U.S. stocks, the MSCI US Broad Market Index through June 2, 2013, and the CRSP US Total Market Index thereafter. International stock benchmark returns are adjusted for withholding taxes.
“Since Inception” performance is calculated from the fund’s inception date for both the fund and its comparative standards.
See Financial Highlights for dividend and capital gains information.
4
Institutional Target Retirement 2040 Fund
Underlying Vanguard Funds
As of September 30, 2020
| Vanguard Total Stock Market Index Fund Institutional Shares | 49.5% |
| Vanguard Total International Stock Index Fund Investor Shares | 33.2 |
| Vanguard Total Bond Market II Index Fund Investor Shares | 11.9 |
| Vanguard Total International Bond Index Fund Admiral Shares | 5.4 |
The table reflects the fund’s investments, except for short-term investments and derivatives.
5
Institutional Target Retirement 2040 Fund
Financial Statements
Schedule of Investments
As of September 30, 2020
The fund files its complete schedule of portfolio holdings with the Securities and Exchange Commission (SEC) for the first and third quarters of each fiscal year as an exhibit to its reports on Form N-PORT. The fund’s Form N-PORT reports are available on the SEC’s website at www.sec.gov.
| Market | |||
| Value• | |||
| Shares | ($000) | ||
| Investment Companies (98.8%) | |||
| U.S. Stock Fund (49.0%) | |||
| Vanguard Total Stock Market Index Fund Institutional Shares | 172,094,907 | 14,275,273 | |
| International Stock Fund (32.8%) | |||
| Vanguard Total International Stock Index Fund Investor Shares | 570,116,158 | 9,555,147 | |
| U.S. Bond Fund (11.7%) | |||
| 1 | Vanguard Total Bond Market II Index Fund Investor Shares | 296,656,106 | 3,423,411 |
| International Bond Fund (5.3%) | |||
| Vanguard Total International Bond Index Fund Admiral Shares | 66,551,483 | 1,546,657 | |
| Total Investment Companies (Cost $23,506,651) | 28,800,488 | ||
| Temporary Cash Investment (1.6%) | |||
| Money Market Fund (1.6%) | |||
| 1 | Vanguard Market Liquidity Fund, 0.117% (Cost $468,248) | 4,682,642 | 468,264 |
| Total Investments (100.4%) (Cost $23,974,899) | 29,268,752 | ||
| Other Assets and Liabilities—Net (-0.4%) | (119,151) | ||
| Net Assets (100%) | 29,149,601 | ||
Cost is in $000.
| · | See Note A in Notes to Financial Statements. |
| 1 | Affiliated fund available only to Vanguard funds and certain trusts and accounts managed by Vanguard. Rate shown for Vanguard Market Liquidity Fund is the 7-day yield. |
6
Institutional Target Retirement 2040 Fund
| Derivative Financial Instruments Outstanding as of Period End | |||||
| Futures Contracts | |||||
| ($000) | |||||
| Value and | |||||
| Number of | Unrealized | ||||
| Long (Short) | Notional | Appreciation | |||
| Expiration | Contracts | Amount | (Depreciation) | ||
| Long Futures Contracts | |||||
| 10-Year U.S. Treasury Note | December 2020 | 2,246 | 313,387 | 256 | |
| E-mini S&P 500 Index | December 2020 | 238 | 39,889 | 589 | |
| 845 | |||||
See accompanying Notes, which are an integral part of the Financial Statements.
7
Institutional Target Retirement 2040 Fund
Statement of Assets and Liabilities
As of September 30, 2020
| ($000s, except shares and per-share amounts) | Amount |
| Assets | |
| Investments in Securities, at Value—Affiliated Funds (Cost $23,974,899) | 29,268,752 |
| Cash Collateral Pledged—Futures Contracts | 11,724 |
| Receivables for Accrued Income | 6,797 |
| Receivables for Capital Shares Issued | 42,765 |
| Variation Margin Receivable—Futures Contracts | 869 |
| Total Assets | 29,330,907 |
| Liabilities | |
| Payables for Investment Securities Purchased | 15,773 |
| Payables for Capital Shares Redeemed | 164,972 |
| Variation Margin Payable—Futures Contracts | 561 |
| Total Liabilities | 181,306 |
| Net Assets | 29,149,601 |
| At September 30, 2020, net assets consisted of: | |
| Paid-in Capital | 23,482,203 |
| Total Distributable Earnings (Loss) | 5,667,398 |
| Net Assets | 29,149,601 |
| Net Assets | |
| Applicable to 1,100,251,157 outstanding $.001 par value shares of beneficial interest (unlimited authorization) | 29,149,601 |
| Net Asset Value Per Share | $26.49 |
See accompanying Notes, which are an integral part of the Financial Statements.
8
Institutional Target Retirement 2040 Fund
Statement of Operations
| Year Ended | |
| September 30, 2020 | |
| ($000) | |
| Investment Income | |
| Income | |
| Income Distributions Received from Affiliated Funds | 579,972 |
| Other Income | 21 |
| Net Investment Income—Note B | 579,993 |
| Realized Net Gain (Loss) | |
| Capital Gain Distributions Received from Affiliated Funds | — |
| Affiliated Funds Sold | 17,411 |
| Futures Contracts | 13,634 |
| Realized Net Gain (Loss) | 31,045 |
| Change in Unrealized Appreciation (Depreciation) | |
| Affiliated Funds | 1,989,503 |
| Futures Contracts | 845 |
| Change in Unrealized Appreciation (Depreciation) | 1,990,348 |
| Net Increase (Decrease) in Net Assets Resulting from Operations | 2,601,386 |
See accompanying Notes, which are an integral part of the Financial Statements.
9
Institutional Target Retirement 2040 Fund
Statement of Changes in Net Assets
| Year Ended September 30, | ||
| 2020 | 2019 | |
| ($000) | ($000) | |
| Increase (Decrease) in Net Assets | ||
| Operations | ||
| Net Investment Income | 579,993 | 545,029 |
| Realized Net Gain (Loss) | 31,045 | 1,099 |
| Change in Unrealized Appreciation (Depreciation) | 1,990,348 | 244,321 |
| Net Increase (Decrease) in Net Assets Resulting from Operations | 2,601,386 | 790,449 |
| Distributions1 | ||
| Total Distributions | (616,023) | (455,908) |
| Capital Share Transactions | ||
| Issued | 5,669,183 | 5,254,578 |
| Issued in Lieu of Cash Distributions | 610,821 | 450,585 |
| Redeemed | (4,173,157) | (1,780,334) |
| Net Increase (Decrease) from Capital Share Transactions | 2,106,847 | 3,924,829 |
| Total Increase (Decrease) | 4,092,210 | 4,259,370 |
| Net Assets | ||
| Beginning of Period | 25,057,391 | 20,798,021 |
| End of Period | 29,149,601 | 25,057,391 |
1 Certain prior-period numbers have been reclassified to conform with current-period presentation.
See accompanying Notes, which are an integral part of the Financial Statements.
10
Institutional Target Retirement 2040 Fund
Financial Highlights
| For a Share Outstanding | Year Ended September 30, | ||||
| Throughout Each Period | 2020 | 2019 | 2018 | 2017 | 2016 |
| Net Asset Value, Beginning of Period | $24.66 | $24.61 | $22.93 | $20.10 | $18.08 |
| Investment Operations | |||||
| Net Investment Income1 | .539 | .575 | .535 | .494 | .461 |
| Capital Gain Distributions Received1 | — | — | — | .002 | .002 |
| Net Realized and Unrealized Gain (Loss) on Investments | 1.898 | (.005) | 1.601 | 2.730 | 1.718 |
| Total from Investment Operations | 2.437 | .570 | 2.136 | 3.226 | 2.181 |
| Distributions | |||||
| Dividends from Net Investment Income | (.604) | (.519) | (.453) | (.393) | (.161) |
| Distributions from Realized Capital Gains | (.003) | (.001) | (.003) | (.003) | — |
| Total Distributions | (.607) | (.520) | (.456) | (.396) | (.161) |
| Net Asset Value, End of Period | $26.49 | $24.66 | $24.61 | $22.93 | $20.10 |
| Total Return | 9.93% | 2.65% | 9.39% | 16.35% | 12.12% |
| Ratios/Supplemental Data | |||||
| Net Assets, End of Period (Millions) | $29,150 | $25,057 | $20,798 | $14,863 | $8,724 |
| Ratio of Total Expenses to Average Net Assets | — | — | — | — | — |
| Acquired Fund Fees and Expenses | 0.09% | 0.09% | 0.09% | 0.09% | 0.10% |
| Ratio of Net Investment Income to Average Net Assets | 2.17% | 2.43% | 2.24% | 2.32% | 2.62% |
| Portfolio Turnover Rate | 15% | 5% | 7% | 5% | 0% |
1 Calculated based on average shares outstanding.
See accompanying Notes, which are an integral part of the Financial Statements.
11
Institutional Target Retirement 2040 Fund
Notes to Financial Statements
Vanguard Institutional Target Retirement 2040 Fund is registered under the Investment Company Act of 1940 as an open-end investment company, or mutual fund. The fund follows a balanced investment strategy by investing in selected Vanguard funds to achieve its targeted allocation of assets to U.S. and international stocks, and U.S. and international bonds. Financial statements and other information about each underlying fund are available at www.vanguard.com.
Market disruptions associated with the COVID-19 pandemic have had a global impact, and uncertainty exists as to the long-term implications. Such disruptions can adversely affect assets of the fund and thus fund performance.
A. The following significant accounting policies conform to generally accepted accounting principles for U.S. investment companies. The fund consistently follows such policies in preparing its financial statements.
1. Security Valuation: Investments are valued at the net asset value of each underlying Vanguard fund determined as of the close of the New York Stock Exchange (generally 4 p.m., Eastern time) on the valuation date.
2. Futures Contracts: The fund uses stock and bond futures contracts to a limited extent, with the objectives of maintaining full exposure to the market and maintaining its target asset allocation. The primary risks associated with the use of futures contracts are imperfect correlation between changes in market values of investments held by the fund and the prices of futures contracts, and the possibility of an illiquid market. Counterparty risk involving futures is mitigated because a regulated clearinghouse is the counterparty instead of the clearing broker. To further mitigate counterparty risk, the fund trades futures contracts on an exchange, monitors the financial strength of its clearing brokers and clearinghouse, and has entered into clearing agreements with its clearing brokers. The clearinghouse imposes initial margin requirements to secure the fund’s performance and requires daily settlement of variation margin representing changes in the market value of each contract. Any securities pledged as initial margin for open contracts are noted in the Schedule of Investments.
Futures contracts are valued at their quoted daily settlement prices. The notional amounts of the contracts are not recorded in the Statement of Assets and Liabilities. Fluctuations in the value of the contracts are recorded in the Statement of Assets and Liabilities as an asset (liability) and in the Statement of Operations as unrealized appreciation (depreciation) until the contracts are closed, when they are recorded as realized gains (losses) on futures contracts.
During the year ended September 30, 2020, the fund’s average investments in long and short futures contracts represented less than 1% and 0% of net assets, respectively, based on the average of the notional amounts at each quarter-end during the period.
3. Federal Income Taxes: The fund intends to continue to qualify as a regulated investment company and distribute all of its taxable income. The fund’s tax returns are open to examination by the relevant tax authorities until expiration of the applicable statute of limitations, which is generally three years after the filing of the tax return. Management has analyzed the fund’s tax positions taken for all open federal and state income tax years, and has concluded that no provision for income tax is required in the fund’s financial statements.
4. Distributions: Distributions to shareholders are recorded on the ex-dividend date. Distributions are determined on a tax basis at the fiscal year-end and may differ from net investment income and realized capital gains for financial reporting purposes.
12
Institutional Target Retirement 2040 Fund
5. Credit Facilities and Interfund Lending Program: The fund and certain other funds managed by The Vanguard Group (“Vanguard”) participate in a $4.3 billion committed credit facility provided by a syndicate of lenders pursuant to a credit agreement and an uncommitted credit facility provided by Vanguard. Both facilities may be renewed annually. Each fund is individually liable for its borrowings, if any, under the credit facilities. Borrowings may be utilized for temporary or emergency purposes, subject to the fund’s regulatory and contractual borrowing restrictions. With respect to the committed credit facility, the participating funds are charged administrative fees and an annual commitment fee of 0.10% of the undrawn committed amount of the facility; these fees are allocated to the funds based on a method approved by the fund’s board of trustees and borne by the funds in which the fund invests (see Note B). Any borrowings under either facility bear interest at a rate based upon the higher of the one-month London Interbank Offered Rate (or an acceptable alternate rate, if necessary), federal funds effective rate, or overnight bank funding rate plus an agreed-upon spread, except that borrowings under the uncommitted credit facility may bear interest based upon an alternative rate agreed to by the fund and Vanguard.
In accordance with an exemptive order (the “Order”) from the SEC, the fund may participate in a joint lending and borrowing program that allows registered open-end Vanguard funds to borrow money from and lend money to each other for temporary or emergency purposes (the “Interfund Lending Program”), subject to compliance with the terms and conditions of the Order, and to the extent permitted by the fund’s investment objective and investment policies. Interfund loans and borrowings normally extend overnight, but can have a maximum duration of seven days. Loans may be called on one business day’s notice. The interest rate to be charged is governed by the conditions of the Order and internal procedures adopted by the board of trustees. The board of trustees is responsible for overseeing the Interfund Lending Program.
For the year ended September 30, 2020, the fund did not utilize the credit facilities or the Interfund Lending Program.
6. Other: Income and capital gain distributions received are recorded on the ex-dividend date. Security transactions are accounted for on the date securities are bought or sold. Costs used to determine realized gains (losses) on the sale of investment securities are those of the specific securities sold.
B. In accordance with the terms of a Funds’ Service Agreement (the “FSA”) between Vanguard and the fund, Vanguard furnishes to the fund investment advisory, corporate management, administrative, marketing, and distribution services at Vanguard’s cost of operations (as defined by the FSA). These costs of operations are allocated to the fund based on methods and guidelines approved by the board of trustees. The FSA provides that expenses otherwise allocable to Vanguard funds-of-funds may be reduced or eliminated to the extent of savings realized by the underlying Vanguard funds by virtue of being part of a fund-of-funds. Accordingly, all expenses for services provided by Vanguard to the fund and all other expenses incurred by the fund during the period ended September 30, 2020, were borne by the underlying Vanguard funds in which the fund invests. The fund’s trustees and officers are also trustees and officers, respectively, of the underlying Vanguard funds, as well as directors and employees, respectively, of Vanguard.
C. Various inputs may be used to determine the value of the fund’s investments and derivatives. These inputs are summarized in three broad levels for financial statement purposes. The inputs or methodologies used to value securities are not necessarily an indication of the risk associated with investing in those securities.
13
Institutional Target Retirement 2040 Fund
Level 1—Quoted prices in active markets for identical securities.
Level 2—Other significant observable inputs (including quoted prices for similar securities, interest rates, prepayment speeds, credit risk, etc.).
Level 3—Significant unobservable inputs (including the fund’s own assumptions used to determine the fair value of investments). Any investments and derivatives valued with significant unobservable inputs are noted on the Schedule of Investments.
At September 30, 2020, 100% of the market value of the fund’s investments and derivatives was determined based on Level 1 inputs.
D. Permanent differences between book-basis and tax-basis components of net assets, if any, are reclassified among capital accounts in the financial statements to reflect their tax character. These reclassifications have no effect on net assets or net asset value per share.
Temporary differences between book-basis and tax-basis components of total distributable earnings (loss) arise when certain items of income, gain, or loss are recognized in different periods for financial statement and tax purposes; these differences will reverse at some time in the future. The differences are primarily related to the deferral of losses from wash sales and the recognition of unrealized gains or losses from certain derivative contracts. As of period end, the tax-basis components of total distributable earnings (loss) are detailed in the table as follows:
| Amount | |
| ($000) | |
| Undistributed Ordinary Income | 373,545 |
| Undistributed Long-Term Gains | — |
| Capital Loss Carryforwards | — |
| Qualified Late-Year Losses | — |
| Net Unrealized Gains (Losses) | 5,293,853 |
The tax character of distributions paid was as follows:
| Year Ended September 30, | ||
| 2020 | 2019 | |
| Amount | Amount | |
| ($000) | ($000) | |
| Ordinary Income* | 616,023 | 455,908 |
| Long-Term Capital Gains | — | — |
| Total | 616,023 | 455,908 |
* Includes short-term capital gains, if any.
As of September 30, 2020, gross unrealized appreciation and depreciation for investments and derivatives based on cost for U.S. federal income tax purposes were as follows:
| Amount | |
| ($000) | |
| Tax Cost | 23,974,899 |
| Gross Unrealized Appreciation | 5,435,778 |
| Gross Unrealized Depreciation | (141,925) |
| Net Unrealized Appreciation (Depreciation) | 5,293,853 |
14
Institutional Target Retirement 2040 Fund
E. Capital shares issued and redeemed were:
| Year Ended September 30, | ||
| 2020 | 2019 | |
| Shares | Shares | |
| (000) | (000) | |
| Issued | 228,010 | 224,272 |
| Issued in Lieu of Cash Distributions | 23,538 | 21,214 |
| Redeemed | (167,248) | (74,584) |
| Net Increase (Decrease) in Shares Outstanding | 84,300 | 170,902 |
At September 30, 2020, one shareholder was the record or beneficial owner of 34% of the fund’s net assets. If the shareholder were to redeem its investment in the fund, the redemption might lead to the realization of taxable capital gains.
F. Transactions during the period in affiliated underlying Vanguard funds were as follows:
| Current Period Transactions | ||||||||
| Sept. 30, | Proceeds | Realized | Sept. 30, | |||||
| 2019 | from | Net | Change in | Capital Gain | 2020 | |||
| Market | Purchases | Securities | Gain | Unrealized | Distributions | Market | ||
| Value | at Cost | Sold | (Loss) | App. (Dep.) | Income | Received | Value | |
| ($000) | ($000) | ($000) | ($000) | ($000) | ($000) | ($000) | ($000) | |
| Vanguard Market Liquidity Fund | 13,655 | NA1 | NA1 | (80) | 17 | 420 | — | 468,264 |
| Vanguard Total Bond Market II Index Fund | 2,957,662 | 1,689,587 | 1,358,876 | 22,813 | 112,225 | 74,085 | — | 3,423,411 |
| Vanguard Total International Bond Index Fund | 1,236,906 | 634,444 | 314,933 | 1,068 | (10,828) | 41,910 | — | 1,546,657 |
| Vanguard Total International Stock Index Fund | 8,332,505 | 1,580,556 | 553,068 | (33,391) | 228,545 | 219,340 | — | 9,555,147 |
| Vanguard Total Stock Market Index Fund | 12,545,147 | 1,716,640 | 1,673,059 | 27,001 | 1,659,544 | 244,217 | — | 14,275,273 |
| Total | 25,085,875 | 5,621,227 | 3,899,936 | 17,411 | 1,989,503 | 579,972 | — | 29,268,752 |
1 Not applicable—purchases and sales are for temporary cash investment purposes.
G. Management has determined that no events or transactions occurred subsequent to September 30, 2020, that would require recognition or disclosure in these financial statements.
15
Institutional Target Retirement 2045 Fund
Performance Summary
All of the returns in this report represent past performance, which is not a guarantee of future results that may be achieved by the fund. (Current performance may be lower or higher than the performance data cited. For performance data current to the most recent month-end, visit our website at vanguard.com/performance.) Note, too, that both investment returns and principal value can fluctuate widely, so an investor’s shares, when sold, could be worth more or less than their original cost. The returns shown do not reflect taxes that a shareholder would pay on fund distributions or on the sale of fund shares.
Cumulative Performance: June 26, 2015, Through September 30, 2020
Initial Investment of $100,000,000

| Average Annual Total Returns | |||||
| Periods Ended September 30, 2020 | |||||
| Since | Final Value | ||||
| One | Five | Inception | of a $100,000,000 | ||
| Year | Years | (6/26/2015) | Investment | ||
| Institutional Target Retirement 2045 Fund | 10.17% | 10.16% | 7.53% | $146,574,231 |
| Target 2045 Composite Index | 10.95 | 10.50 | 7.86 | 148,925,257 |
| MSCI US Broad Market Index | 14.99 | 13.70 | 10.98 | 173,014,030 |
Target 2045 Composite Index: Derived by applying the fund’s target asset allocation to the results of the following benchmarks: for international stocks of developed markets, the MSCI EAFE Index through December 15, 2010, the MSCI ACWI ex USA IMI Index through June 2, 2013, and the FTSE Global All Cap ex US Index thereafter; for emerging-market stocks, the Select Emerging Markets Index through August 23, 2006, the MSCI Emerging Markets Index through December 15, 2010, the MSCI ACWI ex USA IMI Index through June 2, 2013, and the FTSE Global All Cap ex US Index thereafter; for U.S. bonds, the Bloomberg Barclays U.S. Aggregate Bond Index through December 31, 2009, and the Bloomberg Barclays U.S. Aggregate Float Adjusted Index thereafter; for international bonds, the Bloomberg Barclays Global Aggregate ex-USD Float Adjusted RIC Capped Index Hedged beginning June 3, 2013; and for U.S. stocks, the Dow Jones U.S. Total Stock Market Index (formerly known as the Dow Jones Wilshire 5000 Index) through April 22, 2005, the MSCI US Broad Market Index through June 2, 2013, and the CRSP US Total Market Index thereafter. International stock benchmark returns are adjusted for withholding taxes.
“Since Inception” performance is calculated from the fund’s inception date for both the fund and its comparative standards.
See Financial Highlights for dividend and capital gains information.
16
Institutional Target Retirement 2045 Fund
Underlying Vanguard Funds
As of September 30, 2020
| Vanguard Total Stock Market Index Fund Institutional Shares | 54.3% |
| Vanguard Total International Stock Index Fund Investor Shares | 36.2 |
| Vanguard Total Bond Market II Index Fund Investor Shares | 6.4 |
| Vanguard Total International Bond Index Fund Admiral Shares | 3.1 |
The table reflects the fund’s investments, except for short-term investments and derivatives.
17
Institutional Target Retirement 2045 Fund
Financial Statements
Schedule of Investments
As of September 30, 2020
The fund files its complete schedule of portfolio holdings with the Securities and Exchange Commission (SEC) for the first and third quarters of each fiscal year as an exhibit to its reports on Form N-PORT. The fund’s Form N-PORT reports are available on the SEC’s website at www.sec.gov.
| Market | |||
| Value• | |||
| Shares | ($000) | ||
| Investment Companies (98.8%) | |||
| U.S. Stock Fund (53.6%) | |||
| Vanguard Total Stock Market Index Fund Institutional Shares | 161,884,998 | 13,428,361 | |
| International Stock Fund (35.8%) | |||
| Vanguard Total International Stock Index Fund Investor Shares | 534,811,659 | 8,963,443 | |
| U.S. Bond Fund (6.3%) | |||
| 1 | Vanguard Total Bond Market II Index Fund Investor Shares | 137,781,891 | 1,590,003 |
| International Bond Fund (3.1%) | |||
| Vanguard Total International Bond Index Fund Admiral Shares | 33,460,419 | 777,620 | |
| Total Investment Companies (Cost $20,261,426) | 24,759,427 | ||
| Temporary Cash Investment (1.6%) | |||
| Money Market Fund (1.6%) | |||
| 1 | Vanguard Market Liquidity Fund, 0.117% (Cost $406,061) | 4,060,873 | 406,087 |
| Total Investments (100.4%) (Cost $20,667,487) | 25,165,514 | ||
| Other Assets and Liabilities—Net (-0.4%) | (99,354) | ||
| Net Assets (100%) | 25,066,160 | ||
Cost is in $000.
| · | See Note A in Notes to Financial Statements. |
| 1 | Affiliated fund available only to Vanguard funds and certain trusts and accounts managed by Vanguard. Rate shown for Vanguard Market Liquidity Fund is the 7-day yield. |
18
Institutional Target Retirement 2045 Fund
| Derivative Financial Instruments Outstanding as of Period End | ||||
| Futures Contracts | ||||
| ($000) | ||||
| Value and | ||||
| Number of | Unrealized | |||
| Long (Short) | Notional | Appreciation | ||
| Expiration | Contracts | Amount | (Depreciation) | |
| Long Futures Contracts | ||||
| E-mini S&P 500 Index | December 2020 | 153 | 25,643 | 431 |
| 10-Year U.S. Treasury Note | December 2020 | 2,066 | 288,272 | 223 |
| 654 | ||||
See accompanying Notes, which are an integral part of the Financial Statements.
19
Institutional Target Retirement 2045 Fund
Statement of Assets and Liabilities
As of September 30, 2020
| ($000s, except shares and per-share amounts) | Amount | |
| Assets | ||
| Investments in Securities, at Value—Affiliated Funds (Cost $20,667,487) | 25,165,514 | |
| Cash Collateral Pledged—Futures Contracts | 8,968 | |
| Receivables for Accrued Income | 3,229 | |
| Receivables for Capital Shares Issued | 42,489 | |
| Variation Margin Receivable—Futures Contracts | 668 | |
| Total Assets | 25,220,868 | |
| Liabilities | ||
| Payables for Investment Securities Purchased | 12,420 | |
| Payables for Capital Shares Redeemed | 141,772 | |
| Variation Margin Payable—Futures Contracts | 516 | |
| Total Liabilities | 154,708 | |
| Net Assets | 25,066,160 | |
| At September 30, 2020, net assets consisted of: | ||
| Paid-in Capital | 20,257,887 | |
| Total Distributable Earnings (Loss) | 4,808,273 | |
| Net Assets | 25,066,160 | |
| Net Assets | ||
| Applicable to 938,708,531 outstanding $.001 par value shares of beneficial interest (unlimited authorization) | 25,066,160 | |
| Net Asset Value Per Share | $26.70 |
See accompanying Notes, which are an integral part of the Financial Statements.
20
Institutional Target Retirement 2045 Fund
Statement of Operations
| Year Ended | ||
| September 30, 2020 | ||
| ($000) | ||
| Investment Income | ||
| Income | ||
| Income Distributions Received from Affiliated Funds | 488,105 | |
| Other Income | 14 | |
| Net Investment Income—Note B | 488,119 | |
| Realized Net Gain (Loss) | ||
| Capital Gain Distributions Received from Affiliated Funds | — | |
| Affiliates Funds Sold | (1,858) | |
| Futures Contracts | 22,185 | |
| Realized Net Gain (Loss) | 20,327 | |
| Change in Unrealized Appreciation (Depreciation) | ||
| Affiliated Funds | 1,771,909 | |
| Futures Contracts | 654 | |
| Change in Unrealized Appreciation (Depreciation) | 1,772,563 | |
| Net Increase (Decrease) in Net Assets Resulting from Operations | 2,281,009 |
See accompanying Notes, which are an integral part of the Financial Statements.
21
Institutional Target Retirement 2045 Fund
Statement of Changes in Net Assets
| Year Ended September 30, | ||||
| 2020 | 2019 | |||
| ($000) | ($000) | |||
| Increase (Decrease) in Net Assets | ||||
| Operations | ||||
| Net Investment Income | 488,119 | 455,897 | ||
| Realized Net Gain (Loss) | 20,327 | (1,387) | ||
| Change in Unrealized Appreciation (Depreciation) | 1,772,563 | 132,234 | ||
| Net Increase (Decrease) in Net Assets Resulting from Operations | 2,281,009 | 586,744 | ||
| Distributions1 | ||||
| Total Distributions | (515,800) | (375,521) | ||
| Capital Share Transactions | ||||
| Issued | 5,171,573 | 4,892,911 | ||
| Issued in Lieu of Cash Distributions | 511,684 | 371,618 | ||
| Redeemed | (3,690,228) | (1,551,129) | ||
| Net Increase (Decrease) from Capital Share Transactions | 1,993,029 | 3,713,400 | ||
| Total Increase (Decrease) | 3,758,238 | 3,924,623 | ||
| Net Assets | ||||
| Beginning of Period | 21,307,922 | 17,383,299 | ||
| End of Period | 25,066,160 | 21,307,922 | ||
1 Certain prior-period numbers have been reclassified to conform with current-period presentation.
See accompanying Notes, which are an integral part of the Financial Statements.
22
Institutional Target Retirement 2045 Fund
Financial Highlights
| For a Share Outstanding | Year Ended September 30, | |||||||||
| Throughout Each Period | 2020 | 2019 | 2018 | 2017 | 2016 | |||||
| Net Asset Value, Beginning of Period | $24.79 | $24.86 | $23.05 | $20.11 | $18.07 | |||||
| Investment Operations | ||||||||||
| Net Investment Income1 | .534 | .574 | .538 | .497 | .464 | |||||
| Capital Gain Distributions Received1 | — | — | — | .001 | .002 | |||||
| Net Realized and Unrealized Gain (Loss) on Investments | 1.976 | (.130) | 1.730 | 2.833 | 1.736 | |||||
| Total from Investment Operations | 2.510 | .444 | 2.268 | 3.331 | 2.202 | |||||
| Distributions | ||||||||||
| Dividends from Net Investment Income | (.600) | (.512) | (.454) | (.389) | (.162) | |||||
| Distributions from Realized Capital Gains | — | (.002) | (.004) | (.002) | — | |||||
| Total Distributions | (.600) | (.514) | (.458) | (.391) | (.162) | |||||
| Net Asset Value, End of Period | $26.70 | $24.79 | $24.86 | $23.05 | $20.11 | |||||
| Total Return | 10.17% | 2.13% | 9.92% | 16.87% | 12.24% | |||||
| Ratios/Supplemental Data | ||||||||||
| Net Assets, End of Period (Millions) | $25,066 | $21,308 | $17,383 | $12,054 | $6,989 | |||||
| Ratio of Total Expenses to Average Net Assets | — | — | — | — | — | |||||
| Acquired Fund Fees and Expenses | 0.09% | 0.09% | 0.09% | 0.09% | 0.10% | |||||
| Ratio of Net Investment Income to Average Net Assets | 2.13% | 2.41% | 2.23% | 2.33% | 2.42% | |||||
| Portfolio Turnover Rate | 12% | 4% | 6% | 5% | 1% | |||||
1 Calculated based on average shares outstanding.
See accompanying Notes, which are an integral part of the Financial Statements.
23
Institutional Target Retirement 2045 Fund
Notes to Financial Statements
Vanguard Institutional Target Retirement 2045 Fund is registered under the Investment Company Act of 1940 as an open-end investment company, or mutual fund. The fund follows a balanced investment strategy by investing in selected Vanguard funds to achieve its targeted allocation of assets to U.S. and international stocks, and U.S. and international bonds. Financial statements and other information about each underlying fund are available at www.vanguard.com.
Market disruptions associated with the COVID-19 pandemic have had a global impact, and uncertainty exists as to the long-term implications. Such disruptions can adversely affect assets of the fund and thus fund performance.
A. The following significant accounting policies conform to generally accepted accounting principles for U.S. investment companies. The fund consistently follows such policies in preparing its financial statements.
1. Security Valuation: Investments are valued at the net asset value of each underlying Vanguard fund determined as of the close of the New York Stock Exchange (generally 4 p.m., Eastern time) on the valuation date.
2. Futures Contracts: The fund uses stock and bond futures contracts to a limited extent, with the objectives of maintaining full exposure to the market and maintaining its target asset allocation. The primary risks associated with the use of futures contracts are imperfect correlation between changes in market values of investments held by the fund and the prices of futures contracts, and the possibility of an illiquid market. Counterparty risk involving futures is mitigated because a regulated clearinghouse is the counterparty instead of the clearing broker. To further mitigate counterparty risk, the fund trades futures contracts on an exchange, monitors the financial strength of its clearing brokers and clearinghouse, and has entered into clearing agreements with its clearing brokers. The clearinghouse imposes initial margin requirements to secure the fund’s performance and requires daily settlement of variation margin representing changes in the market value of each contract. Any securities pledged as initial margin for open contracts are noted in the Schedule of Investments.
Futures contracts are valued at their quoted daily settlement prices. The notional amounts of the contracts are not recorded in the Statement of Assets and Liabilities. Fluctuations in the value of the contracts are recorded in the Statement of Assets and Liabilities as an asset (liability) and in the Statement of Operations as unrealized appreciation (depreciation) until the contracts are closed, when they are recorded as realized gains (losses) on futures contracts.
During the year ended September 30, 2020, the fund’s average investments in long and short futures contracts represented less than 1% and 0% of net assets, respectively, based on the average of the notional amounts at each quarter-end during the period.
3. Federal Income Taxes: The fund intends to continue to qualify as a regulated investment company and distribute all of its taxable income. The fund’s tax returns are open to examination by the relevant tax authorities until expiration of the applicable statute of limitations, which is generally three years after the filing of the tax return. Management has analyzed the fund’s tax positions taken for all open federal and state income tax years, and has concluded that no provision for income tax is required in the fund’s financial statements.
4. Distributions: Distributions to shareholders are recorded on the ex-dividend date. Distributions are determined on a tax basis at the fiscal year-end and may differ from net investment income and realized capital gains for financial reporting purposes.
24
Institutional Target Retirement 2045 Fund
5. Credit Facilities and Interfund Lending Program: The fund and certain other funds managed by The Vanguard Group (“Vanguard”) participate in a $4.3 billion committed credit facility provided by a syndicate of lenders pursuant to a credit agreement and an uncommitted credit facility provided by Vanguard. Both facilities may be renewed annually. Each fund is individually liable for its borrowings, if any, under the credit facilities. Borrowings may be utilized for temporary or emergency purposes, subject to the fund’s regulatory and contractual borrowing restrictions. With respect to the committed credit facility, the participating funds are charged administrative fees and an annual commitment fee of 0.10% of the undrawn committed amount of the facility; these fees are allocated to the funds based on a method approved by the fund’s board of trustees and borne by the funds in which the fund invests (see Note B). Any borrowings under either facility bear interest at a rate based upon the higher of the one-month London Interbank Offered Rate (or an acceptable alternate rate, if necessary), federal funds effective rate, or overnight bank funding rate plus an agreed-upon spread, except that borrowings under the uncommitted credit facility may bear interest based upon an alternative rate agreed to by the fund and Vanguard.
In accordance with an exemptive order (the “Order”) from the SEC, the fund may participate in a joint lending and borrowing program that allows registered open-end Vanguard funds to borrow money from and lend money to each other for temporary or emergency purposes (the “Interfund Lending Program”), subject to compliance with the terms and conditions of the Order, and to the extent permitted by the fund’s investment objective and investment policies. Interfund loans and borrowings normally extend overnight, but can have a maximum duration of seven days. Loans may be called on one business day’s notice. The interest rate to be charged is governed by the conditions of the Order and internal procedures adopted by the board of trustees. The board of trustees is responsible for overseeing the Interfund Lending Program.
For the year ended September 30, 2020, the fund did not utilize the credit facilities or the Interfund Lending Program.
6. Other: Income and capital gain distributions received are recorded on the ex-dividend date. Security transactions are accounted for on the date securities are bought or sold. Costs used to determine realized gains (losses) on the sale of investment securities are those of the specific securities sold.
B. In accordance with the terms of a Funds’ Service Agreement (the “FSA”) between Vanguard and the fund, Vanguard furnishes to the fund investment advisory, corporate management, administrative, marketing, and distribution services at Vanguard’s cost of operations (as defined by the FSA). These costs of operations are allocated to the fund based on methods and guidelines approved by the board of trustees. The FSA provides that expenses otherwise allocable to Vanguard funds-of-funds may be reduced or eliminated to the extent of savings realized by the underlying Vanguard funds by virtue of being part of a fund-of-funds. Accordingly, all expenses for services provided by Vanguard to the fund and all other expenses incurred by the fund during the period ended September 30, 2020, were borne by the underlying Vanguard funds in which the fund invests. The fund’s trustees and officers are also trustees and officers, respectively, of the underlying Vanguard funds, as well as directors and employees, respectively, of Vanguard.
C. Various inputs may be used to determine the value of the fund’s investments and derivatives. These inputs are summarized in three broad levels for financial statement purposes. The inputs or methodologies used to value securities are not necessarily an indication of the risk associated with investing in those securities.
25
Institutional Target Retirement 2045 Fund
Level 1—Quoted prices in active markets for identical securities.
Level 2—Other significant observable inputs (including quoted prices for similar securities, interest rates, prepayment speeds, credit risk, etc.).
Level 3—Significant unobservable inputs (including the fund’s own assumptions used to determine the fair value of investments). Any investments and derivatives valued with significant unobservable inputs are noted on the Schedule of Investments.
At September 30, 2020, 100% of the market value of the fund’s investments and derivatives was determined based on Level 1 inputs.
D. Permanent differences between book-basis and tax-basis components of net assets, if any, are reclassified among capital accounts in the financial statements to reflect their tax character. These reclassifications have no effect on net assets or net asset value per share.
Temporary differences between book-basis and tax-basis components of total distributable earnings (loss) arise when certain items of income, gain, or loss are recognized in different periods for financial statement and tax purposes; these differences will reverse at some time in the future. The differences are primarily related to the deferral of losses from wash sales and the recognition of unrealized gains or losses from certain derivative contracts. As of period end, the tax-basis components of total distributable earnings (loss) are detailed in the table as follows:
| Amount | |
| ($000) | |
| Undistributed Ordinary Income | 310,246 |
| Undistributed Long-Term Gains | — |
| Capital Loss Carryforwards | — |
| Qualified Late-Year Losses | — |
| Net Unrealized Gains (Losses) | 4,498,027 |
The tax character of distributions paid was as follows:
| Year Ended September 30, | ||
| 2020 | 2019 | |
| Amount | Amount | |
| ($000) | ($000) | |
| Ordinary Income* | 515,800 | 375,521 |
| Long-Term Capital Gains | — | — |
| Total | 515,800 | 375,521 |
* Includes short-term capital gains, if any.
As of September 30, 2020, gross unrealized appreciation and depreciation for investments and derivatives based on cost for U.S. federal income tax purposes were as follows:
| Amount | |
| ($000) | |
| Tax Cost | 20,667,487 |
| Gross Unrealized Appreciation | 4,656,259 |
| Gross Unrealized Depreciation | (158,232) |
| Net Unrealized Appreciation (Depreciation) | 4,498,027 |
26
Institutional Target Retirement 2045 Fund
E. Capital shares issued and redeemed were:
| Year Ended September 30, | ||
| 2020 | 2019 | |
| Shares | Shares | |
| (000) | (000) | |
| Issued | 206,754 | 207,342 |
| Issued in Lieu of Cash Distributions | 19,500 | 17,471 |
| Redeemed | (147,252) | (64,485) |
| Net Increase (Decrease) in Shares Outstanding | 79,002 | 160,328 |
At September 30, 2020, one shareholder was the record or beneficial owner of 31% of the fund’s net assets. If this shareholder were to redeem its investment in the fund, the redemption might lead to the realization of taxable capital gains.
F. Transactions during the period in affiliated underlying Vanguard funds were as follows:
| Current Period Transactions | ||||||||
| Sept. 30, | Proceeds | Realized | Sept. 30, | |||||
| 2019 | from | Net | Change in | Capital Gain | 2020 | |||
| Market | Purchases | Securities | Gain | Unrealized | Distributions | Market | ||
| Value | at Cost | Sold | (Loss) | App. (Dep.) | Income | Received | Value | |
| ($000) | ($000) | ($000) | ($000) | ($000) | ($000) | ($000) | ($000) | |
| Vanguard Market Liquidity Fund | 11,719 | NA1 | NA1 | (60) | 26 | 396 | — | 406,087 |
| Vanguard Total Bond Market II Index Fund | 1,492,017 | 873,270 | 839,449 | 13,656 | 50,509 | 36,294 | — | 1,590,003 |
| Vanguard Total International Bond Index Fund | 637,189 | 316,976 | 171,145 | 796 | (6,196) | 21,200 | — | 777,620 |
| Vanguard Total International Stock Index Fund | 7,677,971 | 1,586,733 | 463,908 | (32,433) | 195,080 | 204,008 | — | 8,963,443 |
| Vanguard Total Stock Market Index Fund | 11,511,694 | 1,632,623 | 1,264,629 | 16,183 | 1,532,490 | 226,207 | — | 13,428,361 |
| Total | 21,330,590 | 4,409,602 | 2,739,131 | (1,858) | 1,771,909 | 488,105 | — | 25,165,514 |
1 Not applicable—purchases and sales are for temporary cash investment purposes.
G. Management has determined that no events or transactions occurred subsequent to September 30, 2020, that would require recognition or disclosure in these financial statements.
27
Institutional Target Retirement 2050 Fund
Performance Summary
All of the returns in this report represent past performance, which is not a guarantee of future results that may be achieved by the fund. (Current performance may be lower or higher than the performance data cited. For performance data current to the most recent month-end, visit our website at vanguard.com/performance.) Note, too, that both investment returns and principal value can fluctuate widely, so an investor’s shares, when sold, could be worth more or less than their original cost. The returns shown do not reflect taxes that a shareholder would pay on fund distributions or on the sale of fund shares.
Cumulative Performance: June 26, 2015, Through September 30, 2020
Initial Investment of $100,000,000
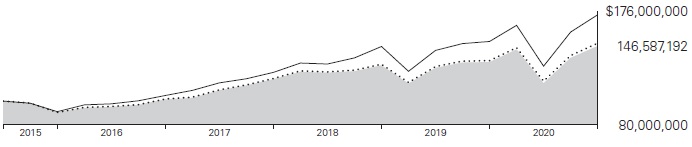
| Average Annual Total Returns | |||||
| Periods Ended September 30, 2020 | |||||
| Since | Final Value | ||||
| One | Five | Inception | of a $100,000,000 | ||
| Year | Years | (6/26/2015) | Investment | ||
| Institutional Target Retirement 2050 Fund | 10.21% | 10.16% | 7.54% | $146,587,192 |
| Target 2050 Composite Index | 10.97 | 10.50 | 7.87 | 148,964,335 |
| MSCI US Broad Market Index | 14.99 | 13.70 | 10.98 | 173,014,030 |
Target 2050 Composite Index: Derived by applying the fund’s target asset allocation to the results of the following benchmarks: for international stocks of developed markets, the MSCI EAFE Index through December 15, 2010, the MSCI ACWI ex USA IMI Index through June 2, 2013, and the FTSE Global All Cap ex US Index thereafter; for emerging-market stocks, the Select Emerging Markets Index through August 23, 2006, the MSCI Emerging Markets Index through December 15, 2010, the MSCI ACWI ex USA IMI Index through June 2, 2013, and the FTSE Global All Cap ex US Index thereafter; for U.S. bonds, the Bloomberg Barclays U.S. Aggregate Bond Index through December 31, 2009, and the Bloomberg Barclays U.S. Aggregate Float Adjusted Index thereafter; for international bonds, the Bloomberg Barclays Global Aggregate ex-USD Float Adjusted RIC Capped Index Hedged beginning June 3, 2013; and for U.S. stocks, the MSCI US Broad Market Index through June 2, 2013, and the CRSP US Total Market Index thereafter. International stock benchmark returns are adjusted for withholding taxes.
“Since Inception” performance is calculated from the fund’s inception date for both the fund and its comparative standards.
See Financial Highlights for dividend and capital gains information.
28
Institutional Target Retirement 2050 Fund
Underlying Vanguard Funds
As of September 30, 2020
| Vanguard Total Stock Market Index Fund Institutional Shares | 54.4% |
| Vanguard Total International Stock Index Fund Investor Shares | 36.3 |
| Vanguard Total Bond Market II Index Fund Investor Shares | 6.2 |
| Vanguard Total International Bond Index Fund Admiral Shares | 3.1 |
The table reflects the fund’s investments, except for short-term investments and derivatives.
29
Institutional Target Retirement 2050 Fund
Financial Statements
Schedule of Investments
As of September 30, 2020
The fund files its complete schedule of portfolio holdings with the Securities and Exchange Commission (SEC) for the first and third quarters of each fiscal year as an exhibit to its reports on Form N-PORT. The fund’s Form N-PORT reports are available on the SEC’s website at www.sec.gov.
| Market | ||
| Value• | ||
| Shares | ($000) | |
| Investment Companies (98.8%) | ||
| U.S. Stock Fund (53.7%) | ||
| Vanguard Total Stock Market Index Fund Institutional Shares | 126,377,979 | 10,483,053 |
| International Stock Fund (35.9%) | ||
| Vanguard Total International Stock Index Fund Investor Shares | 417,928,127 | 7,004,475 |
| U.S. Bond Fund (6.1%) | ||
| 1 Vanguard Total Bond Market II Index Fund Investor Shares | 103,014,277 | 1,188,785 |
| International Bond Fund (3.1%) | ||
| Vanguard Total International Bond Index Fund Admiral Shares | 25,714,098 | 597,596 |
| Total Investment Companies (Cost $16,055,889) | 19,273,909 | |
| Temporary Cash Investment (1.6%) | ||
| Money Market Fund (1.6%) | ||
| 1 Vanguard Market Liquidity Fund, 0.117% (Cost $315,317) | 3,153,389 | 315,339 |
| Total Investments (100.4%) (Cost $16,371,206) | 19,589,248 | |
| Other Assets and Liabilities—Net (-0.4%) | (74,803) | |
| Net Assets (100%) | 19,514,445 |
Cost is in $000.
| · | See Note A in Notes to Financial Statements. |
| 1 | Affiliated fund available only to Vanguard funds and certain trusts and accounts managed by Vanguard. Rate shown for Vanguard Market Liquidity Fund is the 7-day yield. |
30
Institutional Target Retirement 2050 Fund
| Derivative Financial Instruments Outstanding as of Period End | ||||
| Futures Contracts | ||||
| ($000) | ||||
| Value and | ||||
| Number of | Unrealized | |||
| Long (Short) | Notional | Appreciation | ||
| Expiration | Contracts | Amount | (Depreciation) | |
| Long Futures Contracts | ||||
| 10-Year U.S. Treasury Note | December 2020 | 1,263 | 176,228 | 147 |
| E-mini S&P 500 Index | December 2020 | 401 | 67,208 | 870 |
| 1,017 | ||||
See accompanying Notes, which are an integral part of the Financial Statements.
31
Institutional Target Retirement 2050 Fund
Statement of Assets and Liabilities
As of September 30, 2020
| ($000s, except shares and per-share amounts) | Amount |
| Assets | |
| Investments in Securities, at Value—Affiliated Funds (Cost $16,371,206) | 19,589,248 |
| Cash Collateral Pledged—Futures Contracts | 10,807 |
| Receivables for Accrued Income | 2,493 |
| Receivables for Capital Shares Issued | 41,054 |
| Variation Margin Receivable—Futures Contracts | 854 |
| Total Assets | 19,644,456 |
| Liabilities | |
| Payables for Investment Securities Purchased | 9,991 |
| Payables for Capital Shares Redeemed | 119,653 |
| Variation Margin Payable—Futures Contracts | 367 |
| Total Liabilities | 130,011 |
| Net Assets | 19,514,445 |
| At September 30, 2020, net assets consisted of: | |
| Paid-in Capital | 16,047,110 |
| Total Distributable Earnings (Loss) | 3,467,335 |
| Net Assets | 19,514,445 |
| Net Assets | |
| Applicable to 729,427,036 outstanding $.001 par value shares of beneficial interest (unlimited authorization) | 19,514,445 |
| Net Asset Value Per Share | $26.75 |
See accompanying Notes, which are an integral part of the Financial Statements.
32
Institutional Target Retirement 2050 Fund
Statement of Operations
| Year Ended | |
| September 30, 2020 | |
| ($000) | |
| Investment Income | |
| Income | |
| Income Distributions Received from Affiliated Funds | 373,662 |
| Other Income | 10 |
| Net Investment Income—Note B | 373,672 |
| Realized Net Gain (Loss) | |
| Capital Gain Distributions Received from Affiliated Funds | — |
| Affiliated Funds Sold | (2,905) |
| Futures Contracts | 25,419 |
| Realized Net Gain (Loss) | 22,514 |
| Change in Unrealized Appreciation (Depreciation) | |
| Affiliated Funds | 1,395,148 |
| Futures Contracts | 1,017 |
| Change in Unrealized Appreciation (Depreciation) | 1,396,165 |
| Net Increase (Decrease) in Net Assets Resulting from Operations | 1,792,351 |
See accompanying Notes, which are an integral part of the Financial Statements.
33
Institutional Target Retirement 2050 Fund
Statement of Changes in Net Assets
| Year Ended September 30, | ||
| 2020 | 2019 | |
| ($000) | ($000) | |
| Increase (Decrease) in Net Assets | ||
| Operations | ||
| Net Investment Income | 373,672 | 334,430 |
| Realized Net Gain (Loss) | 22,514 | 2,257 |
| Change in Unrealized Appreciation (Depreciation) | 1,396,165 | 120,178 |
| Net Increase (Decrease) in Net Assets Resulting from Operations | 1,792,351 | 456,865 |
| Distributions1 | ||
| Total Distributions | (384,152) | (264,047) |
| Capital Share Transactions | ||
| Issued | 4,693,363 | 4,332,507 |
| Issued in Lieu of Cash Distributions | 381,102 | 261,168 |
| Redeemed | (2,955,065) | (1,150,088) |
| Net Increase (Decrease) from Capital Share Transactions | 2,119,400 | 3,443,587 |
| Total Increase (Decrease) | 3,527,599 | 3,636,405 |
| Net Assets | ||
| Beginning of Period | 15,986,846 | 12,350,441 |
| End of Period | 19,514,445 | 15,986,846 |
1 Certain prior-period numbers have been reclassified to conform with current-period presentation.
See accompanying Notes, which are an integral part of the Financial Statements.
34
Institutional Target Retirement 2050 Fund
Financial Highlights
| For a Share Outstanding | Year Ended September 30, | ||||
| Throughout Each Period | 2020 | 2019 | 2018 | 2017 | 2016 |
| Net Asset Value, Beginning of Period | $24.82 | $24.88 | $23.07 | $20.11 | $18.07 |
| Investment Operations | |||||
| Net Investment Income1 | .535 | .577 | .542 | .503 | .466 |
| Capital Gain Distributions Received1 | — | — | — | .001 | .002 |
| Net Realized and Unrealized Gain (Loss) on Investments | 1.988 | (.134) | 1.718 | 2.838 | 1.732 |
| Total from Investment Operations | 2.523 | .443 | 2.260 | 3.342 | 2.200 |
| Distributions | |||||
| Dividends from Net Investment Income | (.593) | (.502) | (.445) | (.380) | (.160) |
| Distributions from Realized Capital Gains | — | (.001) | (.005) | (.002) | — |
| Total Distributions | (.593) | (.503) | (.450) | (.382) | (.160) |
| Net Asset Value, End of Period | $26.75 | $24.82 | $24.88 | $23.07 | $20.11 |
| Total Return | 10.21% | 2.11% | 9.88% | 16.92% | 12.23% |
| Ratios/Supplemental Data | |||||
| Net Assets, End of Period (Millions) | $19,514 | $15,987 | $12,350 | $7,950 | $4,329 |
| Ratio of Total Expenses to Average Net Assets | — | — | — | — | — |
| Acquired Fund Fees and Expenses | 0.09% | 0.09% | 0.09% | 0.09% | 0.10% |
| Ratio of Net Investment Income to Average Net Assets | 2.14% | 2.42% | 2.24% | 2.34% | 2.43% |
| Portfolio Turnover Rate | 12% | 3% | 5% | 5% | 1% |
1 Calculated based on average shares outstanding.
See accompanying Notes, which are an integral part of the Financial Statements.
35
Institutional Target Retirement 2050 Fund
Notes to Financial Statements
Vanguard Institutional Target Retirement 2050 Fund is registered under the Investment Company Act of 1940 as an open-end investment company, or mutual fund. The fund follows a balanced investment strategy by investing in selected Vanguard funds to achieve its targeted allocation of assets to U.S. and international stocks, and U.S. and international bonds. Financial statements and other information about each underlying fund are available at www.vanguard.com.
Market disruptions associated with the COVID-19 pandemic have had a global impact, and uncertainty exists as to the long-term implications. Such disruptions can adversely affect assets of the fund and thus fund performance.
A. The following significant accounting policies conform to generally accepted accounting principles for U.S. investment companies. The fund consistently follows such policies in preparing its financial statements.
1. Security Valuation: Investments are valued at the net asset value of each underlying Vanguard fund determined as of the close of the New York Stock Exchange (generally 4 p.m., Eastern time) on the valuation date.
2. Futures Contracts: The fund uses stock and bond futures contracts to a limited extent, with the objectives of maintaining full exposure to the market and maintaining its target asset allocation. The primary risks associated with the use of futures contracts are imperfect correlation between changes in market values of investments held by the fund and the prices of futures contracts, and the possibility of an illiquid market. Counterparty risk involving futures is mitigated because a regulated clearinghouse is the counterparty instead of the clearing broker. To further mitigate counterparty risk, the fund trades futures contracts on an exchange, monitors the financial strength of its clearing brokers and clearinghouse, and has entered into clearing agreements with its clearing brokers. The clearinghouse imposes initial margin requirements to secure the fund’s performance and requires daily settlement of variation margin representing changes in the market value of each contract. Any securities pledged as initial margin for open contracts are noted in the Schedule of Investments.
Futures contracts are valued at their quoted daily settlement prices. The notional amounts of the contracts are not recorded in the Statement of Assets and Liabilities. Fluctuations in the value of the contracts are recorded in the Statement of Assets and Liabilities as an asset (liability) and in the Statement of Operations as unrealized appreciation (depreciation) until the contracts are closed, when they are recorded as realized gains (losses) on futures contracts.
During the year ended September 30, 2020, the fund’s average investments in long and short futures contracts represented less than 1% and 0% of net assets, respectively, based on the average of the notional amounts at each quarter-end during the period.
3. Federal Income Taxes: The fund intends to continue to qualify as a regulated investment company and distribute all of its taxable income. The fund’s tax returns are open to examination by the relevant tax authorities until expiration of the applicable statute of limitations, which is generally three years after the filing of the tax return. Management has analyzed the fund’s tax positions taken for all open federal and state income tax years, and has concluded that no provision for income tax is required in the fund’s financial statements.
4. Distributions: Distributions to shareholders are recorded on the ex-dividend date. Distributions are determined on a tax basis at the fiscal year-end and may differ from net investment income and realized capital gains for financial reporting purposes.
36
Institutional Target Retirement 2050 Fund
5. Credit Facilities and Interfund Lending Program: The fund and certain other funds managed by The Vanguard Group (“Vanguard”) participate in a $4.3 billion committed credit facility provided by a syndicate of lenders pursuant to a credit agreement and an uncommitted credit facility provided by Vanguard. Both facilities may be renewed annually. Each fund is individually liable for its borrowings, if any, under the credit facilities. Borrowings may be utilized for temporary or emergency purposes, subject to the fund’s regulatory and contractual borrowing restrictions. With respect to the committed credit facility, the participating funds are charged administrative fees and an annual commitment fee of 0.10% of the undrawn committed amount of the facility; these fees are allocated to the funds based on a method approved by the fund’s board of trustees and borne by the funds in which the fund invests (see Note B). Any borrowings under either facility bear interest at a rate based upon the higher of the one-month London Interbank Offered Rate (or an acceptable alternate rate, if necessary), federal funds effective rate, or overnight bank funding rate plus an agreed-upon spread, except that borrowings under the uncommitted credit facility may bear interest based upon an alternative rate agreed to by the fund and Vanguard.
In accordance with an exemptive order (the “Order”) from the SEC, the fund may participate in a joint lending and borrowing program that allows registered open-end Vanguard funds to borrow money from and lend money to each other for temporary or emergency purposes (the “Interfund Lending Program”), subject to compliance with the terms and conditions of the Order, and to the extent permitted by the fund’s investment objective and investment policies. Interfund loans and borrowings normally extend overnight, but can have a maximum duration of seven days. Loans may be called on one business day’s notice. The interest rate to be charged is governed by the conditions of the Order and internal procedures adopted by the board of trustees. The board of trustees is responsible for overseeing the Interfund Lending Program.
For the year ended September 30, 2020, the fund did not utilize the credit facilities or the Interfund Lending Program.
6. Other: Income and capital gain distributions received are recorded on the ex-dividend date. Security transactions are accounted for on the date securities are bought or sold. Costs used to determine realized gains (losses) on the sale of investment securities are those of the specific securities sold.
B. In accordance with the terms of a Funds’ Service Agreement (the “FSA”) between Vanguard and the fund, Vanguard furnishes to the fund investment advisory, corporate management, administrative, marketing, and distribution services at Vanguard’s cost of operations (as defined by the FSA). These costs of operations are allocated to the fund based on methods and guidelines approved by the board of trustees. The FSA provides that expenses otherwise allocable to Vanguard funds-of-funds may be reduced or eliminated to the extent of savings realized by the underlying Vanguard funds by virtue of being part of a fund-of-funds. Accordingly, all expenses for services provided by Vanguard to the fund and all other expenses incurred by the fund during the period ended September 30, 2020, were borne by the underlying Vanguard funds in which the fund invests. The fund’s trustees and officers are also trustees and officers, respectively, of the underlying Vanguard funds, as well as directors and employees, respectively, of Vanguard.
C. Various inputs may be used to determine the value of the fund’s investments and derivatives. These inputs are summarized in three broad levels for financial statement purposes. The inputs or methodologies used to value securities are not necessarily an indication of the risk associated with investing in those securities.
37
Institutional Target Retirement 2050 Fund
Level 1—Quoted prices in active markets for identical securities.
Level 2—Other significant observable inputs (including quoted prices for similar securities, interest rates, prepayment speeds, credit risk, etc.).
Level 3—Significant unobservable inputs (including the fund’s own assumptions used to determine the fair value of investments). Any investments and derivatives valued with significant unobservable inputs are noted on the Schedule of Investments.
At September 30, 2020, 100% of the market value of the fund’s investments and derivatives was determined based on Level 1 inputs.
D. Permanent differences between book-basis and tax-basis components of net assets, if any, are reclassified among capital accounts in the financial statements to reflect their tax character. These reclassifications have no effect on net assets or net asset value per share.
Temporary differences between book-basis and tax-basis components of total distributable earnings (loss) arise when certain items of income, gain, or loss are recognized in different periods for financial statement and tax purposes; these differences will reverse at some time in the future. The differences are primarily related to the deferral of losses from wash sales and the recognition of unrealized gains or losses from certain derivative contracts. As of period end, the tax-basis components of total distributable earnings (loss) are detailed in the table as follows:
| Amount | |||
| ($000) | |||
| Undistributed Ordinary Income | 249,293 | ||
| Undistributed Long-Term Gains | — | ||
| Capital Loss Carryforwards | — | ||
| Qualified Late-Year Losses | — | ||
| Net Unrealized Gains (Losses) | 3,218,042 |
The tax character of distributions paid was as follows:
| Year Ended September 30, | ||||||
| 2020 | 2019 | |||||
| Amount | Amount | |||||
| ($000) | ($000) | |||||
| Ordinary Income* | 384,152 | 264,047 | ||||
| Long-Term Capital Gains | — | — | ||||
| Total | 384,152 | 264,047 | ||||
* Includes short-term capital gains, if any.
As of September 30, 2020, gross unrealized appreciation and depreciation for investments and derivatives based on cost for U.S. federal income tax purposes were as follows:
| Amount | |||
| ($000) | |||
| Tax Cost | 16,371,206 | ||
| Gross Unrealized Appreciation | 3,351,476 | ||
| Gross Unrealized Depreciation | (133,434) | ||
| Net Unrealized Appreciation (Depreciation) | 3,218,042 |
38
Institutional Target Retirement 2050 Fund
E. Capital shares issued and redeemed were:
| Year Ended September 30, | ||||||
| 2020 | 2019 | |||||
| Shares | Shares | |||||
| (000) | (000) | |||||
| Issued | 188,111 | 183,192 | ||||
| Issued in Lieu of Cash Distributions | 14,496 | 12,261 | ||||
| Redeemed | (117,322) | (47,748) | ||||
| Net Increase (Decrease) in Shares Outstanding | 85,285 | 147,705 | ||||
At September 30, 2020, one shareholder was the record or beneficial owner of 31% of the fund’s net assets. If the shareholder were to redeem its investment in the fund, the redemption might lead to the realization of taxable capital gains.
F. Transactions during the period in affiliated underlying Vanguard funds were as follows:
| Current Period Transactions | |||||||||||||||||
| Sept. 30, | Proceeds | Realized | Sept. 30, | ||||||||||||||
| 2019 | from | Net | Change in | Capital Gain | 2020 | ||||||||||||
| Market | Purchases | Securities | Gain | Unrealized | Distributions | Market | |||||||||||
| Value | at Cost | Sold | (Loss) | App. (Dep.) | Income | Received | Value | ||||||||||
| ($000) | ($000) | ($000) | ($000) | ($000) | ($000) | ($000) | ($000) | ||||||||||
| Vanguard Market Liquidity Fund | 11,719 | NA1 | NA1 | (43) | 22 | 319 | — | 315,339 | |||||||||
| Vanguard Total Bond Market II Index Fund | 1,121,617 | 721,962 | 704,201 | 8,872 | 40,535 | 27,831 | — | 1,188,785 | |||||||||
| Vanguard Total International Bond Index Fund | 476,993 | 243,791 | 119,364 | 207 | (4,031) | 16,005 | — | 597,596 | |||||||||
| Vanguard Total International Stock Index Fund | 5,762,135 | 1,444,315 | 345,354 | (24,407) | 167,786 | 156,222 | — | 7,004,475 | |||||||||
| Vanguard Total Stock Market Index Fund | 8,635,511 | 1,574,120 | 929,880 | 12,466 | 1,190,836 | 173,285 | — | 10,483,053 | |||||||||
| Total | 16,007,975 | 3,984,188 | 2,098,799 | (2,905) | 1,395,148 | 373,662 | — | 19,589,248 | |||||||||
1 Not applicable—purchases and sales are for temporary cash investment purposes.
G. Management has determined that no events or transactions occurred subsequent to September 30, 2020, that would require recognition or disclosure in these financial statements.
39
Institutional Target Retirement 2055 Fund
Performance Summary
All of the returns in this report represent past performance, which is not a guarantee of future results that may be achieved by the fund. (Current performance may be lower or higher than the performance data cited. For performance data current to the most recent month-end, visit our website at vanguard.com/performance.) Note, too, that both investment returns and principal value can fluctuate widely, so an investor’s shares, when sold, could be worth more or less than their original cost. The returns shown do not reflect taxes that a shareholder would pay on fund distributions or on the sale of fund shares.
Cumulative Performance: June 26, 2015, Through September 30, 2020
Initial Investment of $100,000,000
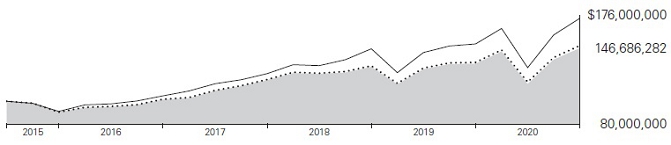
| Average Annual Total Returns | ||||||
| Periods Ended September 30, 2020 | ||||||
| Since | Final Value | |||||
| One | Five | Inception | of a $100,000,000 | |||
| Year | Years | (6/26/2015) | Investment | |||
| Institutional Target Retirement 2055 Fund | 10.24% | 10.17% | 7.55% | $146,686,282 | |
| Target 2055 Composite Index | 10.97 | 10.50 | 7.87 | 148,964,335 | |
| MSCI US Broad Market Index | 14.99 | 13.70 | 10.98 | 173,014,030 | |
Target 2055 Composite Index: Derived by applying the fund’s target asset allocation to the results of the following benchmarks: for international stocks of developed markets, the MSCI EAFE Index through December 15, 2010, the MSCI ACWI ex USA IMI Index through June 2, 2013, and the FTSE Global All Cap ex US Index thereafter; for emerging-market stocks, the MSCI Emerging Markets Index through December 15, 2010, the MSCI ACWI ex USA IMI Index through June 2, 2013, and the FTSE Global All Cap ex US Index thereafter; for U.S. bonds, the Bloomberg Barclays U.S. Aggregate Float Adjusted Index; for international bonds, the Bloomberg Barclays Global Aggregate ex-USD Float Adjusted RIC Capped Index Hedged beginning June 3, 2013; and for U.S. stocks, the MSCI US Broad Market Index through June 2, 2013, and the CRSP US Total Market Index thereafter. International stock benchmark returns are adjusted for withholding taxes.
“Since Inception” performance is calculated from the fund’s inception date for both the fund and its comparative standards.
See Financial Highlights for dividend and capital gains information.
40
Institutional Target Retirement 2055 Fund
Underlying Vanguard Funds
As of September 30, 2020
| Vanguard Total Stock Market Index Fund Institutional Shares | 53.9% | |
| Vanguard Total International Stock Index Fund Investor Shares | 36.4 | |
| Vanguard Total Bond Market II Index Fund Investor Shares | 6.7 | |
| Vanguard Total International Bond Index Fund Admiral Shares | 3.0 |
The table reflects the fund’s investments, except for short-term investments and derivatives.
41
Institutional Target Retirement 2055 Fund
Financial Statements
Schedule of Investments
As of September 30, 2020
The fund files its complete schedule of portfolio holdings with the Securities and Exchange Commission (SEC) for the first and third quarters of each fiscal year as an exhibit to its reports on Form N-PORT. The fund’s Form N-PORT reports are available on the SEC’s website at www.sec.gov.
| Market | ||||
| Value• | ||||
| Shares | ($000) | |||
| Investment Companies (98.8%) | ||||
| U.S. Stock Fund (53.3%) | ||||
| Vanguard Total Stock Market Index Fund Institutional Shares | 69,241,847 | 5,743,611 | ||
| International Stock Fund (36.0%) | ||||
| Vanguard Total International Stock Index Fund Investor Shares | 231,139,660 | 3,873,901 | ||
| U.S. Bond Fund (6.6%) | ||||
| 1 Vanguard Total Bond Market II Index Fund Investor Shares | 61,461,566 | 709,266 | ||
| International Bond Fund (2.9%) | ||||
| Vanguard Total International Bond Index Fund Admiral Shares | 13,698,394 | 318,351 | ||
| Total Investment Companies (Cost $9,137,526) | 10,645,129 | |||
| Temporary Cash Investment (1.6%) | ||||
| Money Market Fund (1.6%) | ||||
| 1 Vanguard Market Liquidity Fund, 0.117% (Cost $174,307) | 1,743,229 | 174,323 | ||
| Total Investments (100.4%) (Cost $9,311,833) | 10,819,452 | |||
| Other Assets and Liabilities—Net (-0.4%) | (45,620) | |||
| Net Assets (100%) | 10,773,832 |
Cost is in $000.
| • | See Note A in Notes to Financial Statements. |
| 1 | Affiliated fund available only to Vanguard funds and certain trusts and accounts managed by Vanguard. Rate shown for Vanguard Market Liquidity Fund is the 7-day yield. |
42
Institutional Target Retirement 2055 Fund
| Derivative Financial Instruments Outstanding as of Period End | ||||||||
| Futures Contracts | ||||||||
| ($000) | ||||||||
| Value and | ||||||||
| Number of | Unrealized | |||||||
| Long (Short) | Notional | Appreciation | ||||||
| Expiration | Contracts | Amount | (Depreciation) | |||||
| Long Futures Contracts | ||||||||
| E-mini S&P 500 Index | December 2020 | 488 | 81,789 | 911 | ||||
| 10-Year U.S. Treasury Note | December 2020 | 423 | 59,022 | 49 | ||||
| 960 | ||||||||
See accompanying Notes, which are an integral part of the Financial Statements.
43
Institutional Target Retirement 2055 Fund
Statement of Assets and Liabilities
As of September 30, 2020
| ($000s, except shares and per-share amounts) | Amount |
| Assets | |
| Investments in Securities, at Value—Affiliated Funds (Cost $9,311,833) | 10,819,452 |
| Cash Collateral Pledged—Futures Contracts | 8,919 |
| Receivables for Accrued Income | 1,466 |
| Receivables for Capital Shares Issued | 27,901 |
| Variation Margin Receivable—Futures Contracts | 678 |
| Total Assets | 10,858,416 |
| Liabilities | |
| Payables for Investment Securities Purchased | 8,231 |
| Payables for Capital Shares Redeemed | 76,235 |
| Variation Margin Payable—Futures Contracts | 118 |
| Total Liabilities | 84,584 |
| Net Assets | 10,773,832 |
| At September 30, 2020, net assets consisted of: | |
| Paid-in Capital | 9,110,726 |
| Total Distributable Earnings (Loss) | 1,663,106 |
| Net Assets | 10,773,832 |
| Net Assets | |
| Applicable to 401,059,393 outstanding $.001 par value shares of beneficial interest (unlimited authorization) | 10,773,832 |
| Net Asset Value Per Share | $26.86 |
See accompanying Notes, which are an integral part of the Financial Statements.
44
Institutional Target Retirement 2055 Fund
Statement of Operations
| Year Ended | |
| September 30, 2020 | |
| ($000) | |
| Investment Income | |
| Income | |
| Income Distributions Received from Affiliated Funds | 199,272 |
| Other Income | 6 |
| Net Investment Income—Note B | 199,278 |
| Realized Net Gain (Loss) | |
| Capital Gain Distributions Received from Affiliated Funds | — |
| Affiliated Funds Sold | 9,371 |
| Futures Contracts | 21,139 |
| Realized Net Gain (Loss) | 30,510 |
| Change in Unrealized Appreciation (Depreciation) | |
| Affiliated Funds | 749,973 |
| Futures Contracts | 960 |
| Change in Unrealized Appreciation (Depreciation) | 750,933 |
| Net Increase (Decrease) in Net Assets Resulting from Operations | 980,721 |
See accompanying Notes, which are an integral part of the Financial Statements.
45
Institutional Target Retirement 2055 Fund
Statement of Changes in Net Assets
| Year Ended September 30, | ||
| 2020 | 2019 | |
| ($000) | ($000) | |
| Increase (Decrease) in Net Assets | ||
| Operations | ||
| Net Investment Income | 199,278 | 158,297 |
| Realized Net Gain (Loss) | 30,510 | 2,477 |
| Change in Unrealized Appreciation (Depreciation) | 750,933 | 77,656 |
| Net Increase (Decrease) in Net Assets Resulting from Operations | 980,721 | 238,430 |
| Distributions1 | ||
| Total Distributions | (190,256) | (116,168) |
| Capital Share Transactions | ||
| Issued | 3,355,236 | 2,789,307 |
| Issued in Lieu of Cash Distributions | 188,762 | 114,709 |
| Redeemed | (1,524,928) | (550,492) |
| Net Increase (Decrease) from Capital Share Transactions | 2,019,070 | 2,353,524 |
| Total Increase (Decrease) | 2,809,535 | 2,475,786 |
| Net Assets | ||
| Beginning of Period | 7,964,297 | 5,488,511 |
| End of Period | 10,773,832 | 7,964,297 |
1 Certain prior-period numbers have been reclassified to conform with current-period presentation.
See accompanying Notes, which are an integral part of the Financial Statements.
46
Institutional Target Retirement 2055 Fund
Financial Highlights
| For a Share Outstanding | Year Ended September 30, | ||||
| Throughout Each Period | 2020 | 2019 | 2018 | 2017 | 2016 |
| Net Asset Value, Beginning of Period | $24.89 | $24.92 | $23.10 | $20.11 | $18.08 |
| Investment Operations | |||||
| Net Investment Income1 | .539 | .582 | .547 | .506 | .470 |
| Capital Gain Distributions Received1 | — | — | — | .001 | .001 |
| Net Realized and Unrealized Gain (Loss) on Investments | 2.001 | (.125) | 1.709 | 2.845 | 1.718 |
| Total from Investment Operations | 2.540 | .457 | 2.256 | 3.352 | 2.189 |
| Distributions | |||||
| Dividends from Net Investment Income | (.569) | (.486) | (.430) | (.360) | (.158) |
| Distributions from Realized Capital Gains | (.001) | (.001) | (.006) | (.002) | (.001) |
| Total Distributions | (.570) | (.487) | (.436) | (.362) | (.159) |
| Net Asset Value, End of Period | $26.86 | $24.89 | $24.92 | $23.10 | $20.11 |
| Total Return | 10.24% | 2.16% | 9.84% | 16.95% | 12.16% |
| Ratios/Supplemental Data | |||||
| Net Assets, End of Period (Millions) | $10,774 | $7,964 | $5,489 | $3,213 | $1,527 |
| Ratio of Total Expenses to Average Net Assets | — | — | — | — | — |
| Acquired Fund Fees and Expenses | 0.09% | 0.09% | 0.09% | 0.09% | 0.10% |
| Ratio of Net Investment Income to Average Net Assets | 2.14% | 2.44% | 2.26% | 2.36% | 2.47% |
| Portfolio Turnover Rate | 10% | 3% | 5% | 6% | 1% |
1 Calculated based on average shares outstanding.
See accompanying Notes, which are an integral part of the Financial Statements.
47
Institutional Target Retirement 2055 Fund
Notes to Financial Statements
Vanguard Institutional Target Retirement 2055 Fund is registered under the Investment Company Act of 1940 as an open-end investment company, or mutual fund. The fund follows a balanced investment strategy by investing in selected Vanguard funds to achieve its targeted allocation of assets to U.S. and international stocks, and U.S. and international bonds. Financial statements and other information about each underlying fund are available at www.vanguard.com.
Market disruptions associated with the COVID-19 pandemic have had a global impact, and uncertainty exists as to the long-term implications. Such disruptions can adversely affect assets of the fund and thus fund performance.
A. The following significant accounting policies conform to generally accepted accounting principles for U.S. investment companies. The fund consistently follows such policies in preparing its financial statements.
1. Security Valuation: Investments are valued at the net asset value of each underlying Vanguard fund determined as of the close of the New York Stock Exchange (generally 4 p.m., Eastern time) on the valuation date.
2. Futures Contracts: The fund uses stock and bond futures contracts to a limited extent, with the objectives of maintaining full exposure to the market and maintaining its target asset allocation. The primary risks associated with the use of futures contracts are imperfect correlation between changes in market values of investments held by the fund and the prices of futures contracts, and the possibility of an illiquid market. Counterparty risk involving futures is mitigated because a regulated clearinghouse is the counterparty instead of the clearing broker. To further mitigate counterparty risk, the fund trades futures contracts on an exchange, monitors the financial strength of its clearing brokers and clearinghouse, and has entered into clearing agreements with its clearing brokers. The clearinghouse imposes initial margin requirements to secure the fund’s performance and requires daily settlement of variation margin representing changes in the market value of each contract. Any securities pledged as initial margin for open contracts are noted in the Schedule of Investments.
Futures contracts are valued at their quoted daily settlement prices. The notional amounts of the contracts are not recorded in the Statement of Assets and Liabilities. Fluctuations in the value of the contracts are recorded in the Statement of Assets and Liabilities as an asset (liability) and in the Statement of Operations as unrealized appreciation (depreciation) until the contracts are closed, when they are recorded as realized gains (losses) on futures contracts.
During the year ended September 30, 2020, the fund’s average investments in long and short futures contracts represented less than 1% and 0% of net assets, respectively, based on the average of the notional amounts at each quarter-end during the period.
3. Federal Income Taxes: The fund intends to continue to qualify as a regulated investment company and distribute all of its taxable income. The fund’s tax returns are open to examination by the relevant tax authorities until expiration of the applicable statute of limitations, which is generally three years after the filing of the tax return. Management has analyzed the fund’s tax positions taken for all open federal and state income tax years, and has concluded that no provision for income tax is required in the fund’s financial statements.
4. Distributions: Distributions to shareholders are recorded on the ex-dividend date. Distributions are determined on a tax basis at the fiscal year-end and may differ from net investment income and realized capital gains for financial reporting purposes.
48
Institutional Target Retirement 2055 Fund
5. Credit Facilities and Interfund Lending Program: The fund and certain other funds managed by The Vanguard Group (“Vanguard”) participate in a $4.3 billion committed credit facility provided by a syndicate of lenders pursuant to a credit agreement and an uncommitted credit facility provided by Vanguard. Both facilities may be renewed annually. Each fund is individually liable for its borrowings, if any, under the credit facilities. Borrowings may be utilized for temporary or emergency purposes, subject to the fund’s regulatory and contractual borrowing restrictions. With respect to the committed credit facility, the participating funds are charged administrative fees and an annual commitment fee of 0.10% of the undrawn committed amount of the facility; these fees are allocated to the funds based on a method approved by the fund’s board of trustees and borne by the funds in which the fund invests (see Note B). Any borrowings under either facility bear interest at a rate based upon the higher of the one-month London Interbank Offered Rate (or an acceptable alternate rate, if necessary), federal funds effective rate, or overnight bank funding rate plus an agreed-upon spread, except that borrowings under the uncommitted credit facility may bear interest based upon an alternative rate agreed to by the fund and Vanguard.
In accordance with an exemptive order (the “Order”) from the SEC, the fund may participate in a joint lending and borrowing program that allows registered open-end Vanguard funds to borrow money from and lend money to each other for temporary or emergency purposes (the “Interfund Lending Program”), subject to compliance with the terms and conditions of the Order, and to the extent permitted by the fund’s investment objective and investment policies. Interfund loans and borrowings normally extend overnight, but can have a maximum duration of seven days. Loans may be called on one business day’s notice. The interest rate to be charged is governed by the conditions of the Order and internal procedures adopted by the board of trustees. The board of trustees is responsible for overseeing the Interfund Lending Program.
For the year ended September 30, 2020, the fund did not utilize the credit facilities or the Interfund Lending Program.
6. Other: Income and capital gain distributions received are recorded on the ex-dividend date. Security transactions are accounted for on the date securities are bought or sold. Costs used to determine realized gains (losses) on the sale of investment securities are those of the specific securities sold.
B. In accordance with the terms of a Funds’ Service Agreement (the “FSA”) between Vanguard and the fund, Vanguard furnishes to the fund investment advisory, corporate management, administrative, marketing, and distribution services at Vanguard’s cost of operations (as defined by the FSA). These costs of operations are allocated to the fund based on methods and guidelines approved by the board of trustees. The FSA provides that expenses otherwise allocable to Vanguard funds-of-funds may be reduced or eliminated to the extent of savings realized by the underlying Vanguard funds by virtue of being part of a fund-of-funds. Accordingly, all expenses for services provided by Vanguard to the fund and all other expenses incurred by the fund during the period ended September 30, 2020, were borne by the underlying Vanguard funds in which the fund invests. The fund’s trustees and officers are also trustees and officers, respectively, of the underlying Vanguard funds, as well as directors and employees, respectively, of Vanguard.
C. Various inputs may be used to determine the value of the fund’s investments and derivatives. These inputs are summarized in three broad levels for financial statement purposes. The inputs or methodologies used to value securities are not necessarily an indication of the risk associated with investing in those securities.
49
Institutional Target Retirement 2055 Fund
Level 1—Quoted prices in active markets for identical securities.
Level 2—Other significant observable inputs (including quoted prices for similar securities, interest rates, prepayment speeds, credit risk, etc.).
Level 3—Significant unobservable inputs (including the fund’s own assumptions used to determine the fair value of investments). Any investments and derivatives valued with significant unobservable inputs are noted on the Schedule of Investments.
At September 30, 2020, 100% of the market value of the fund’s investments and derivatives was determined based on Level 1 inputs.
D. Permanent differences between book-basis and tax-basis components of net assets, if any, are reclassified among capital accounts in the financial statements to reflect their tax character. These reclassifications have no effect on net assets or net asset value per share.
Temporary differences between book-basis and tax-basis components of total distributable earnings (loss) arise when certain items of income, gain, or loss are recognized in different periods for financial statement and tax purposes; these differences will reverse at some time in the future. The differences are primarily related to the deferral of losses from wash sales and the recognition of unrealized gains or losses from certain derivative contracts. As of period end, the tax-basis components of total distributable earnings (loss) are detailed in the table as follows:
| Amount | |
| ($000) | |
| Undistributed Ordinary Income | 143,255 |
| Undistributed Long-Term Gains | 12,232 |
| Capital Loss Carryforwards | — |
| Qualified Late-Year Losses | — |
| Net Unrealized Gains (Losses) | 1,507,619 |
The tax character of distributions paid was as follows:
| Year Ended September 30, | ||
| 2020 | 2019 | |
| Amount | Amount | |
| ($000) | ($000) | |
| Ordinary Income* | 190,089 | 116,138 |
| Long-Term Capital Gains | 167 | 30 |
| Total | 190,256 | 116,168 |
* Includes short-term capital gains, if any.
As of September 30, 2020, gross unrealized appreciation and depreciation for investments and derivatives based on cost for U.S. federal income tax purposes were as follows:
| Amount | |
| ($000) | |
| Tax Cost | 9,311,833 |
| Gross Unrealized Appreciation | 1,593,651 |
| Gross Unrealized Depreciation | (86,032) |
| Net Unrealized Appreciation (Depreciation) | 1,507,619 |
50
Institutional Target Retirement 2055 Fund
E. Capital shares issued and redeemed were:
| Year Ended September 30, | ||
| 2020 | 2019 | |
| Shares | Shares | |
| (000) | (000) | |
| Issued | 134,161 | 117,144 |
| Issued in Lieu of Cash Distributions | 7,153 | 5,370 |
| Redeemed | (60,222) | (22,775) |
| Net Increase (Decrease) in Shares Outstanding | 81,092 | 99,739 |
At September 30, 2020, one shareholder was the record or beneficial owner of 31% of the fund’s net assets. If the shareholder were to redeem its investment in the fund, the redemption might lead to the realization of taxable capital gains.
F. Transactions during the period in affiliated underlying Vanguard funds were as follows:
| Current Period Transactions | ||||||||
| Sept. 30, | Proceeds | Realized | Sept. 30, | |||||
| 2019 | from | Net | Change in | Capital Gain | 2020 | |||
| Market | Purchases | Securities | Gain | Unrealized | Distributions | Market | ||
| Value | at Cost | Sold | (Loss) | App. (Dep.) | Income | Received | Value | |
| ($000) | ($000) | ($000) | ($000) | ($000) | ($000) | ($000) | ($000) | |
| Vanguard Market Liquidity Fund | 9,364 | NA1 | NA1 | (27) | 16 | 193 | — | 174,323 |
| Vanguard Total Bond Market II Index Fund | 574,144 | 490,371 | 381,814 | 3,405 | 23,160 | 15,068 | — | 709,266 |
| Vanguard Total International Bond Index Fund | 232,404 | 141,022 | 53,398 | (174) | (1,503) | 8,296 | — | 318,351 |
| Vanguard Total International Stock Index Fund | 2,859,833 | 1,026,406 | 92,873 | (1,028) | 81,563 | 83,218 | — | 3,873,901 |
| Vanguard Total Stock Market Index Fund | 4,303,877 | 1,227,900 | 442,098 | 7,195 | 646,737 | 92,497 | — | 5,743,611 |
| Total | 7,979,622 | 2,885,699 | 970,183 | 9,371 | 749,973 | 199,272 | — | 10,819,452 |
1 Not applicable—purchases and sales are for temporary cash investment purposes.
G. Management has determined that no events or transactions occurred subsequent to September 30, 2020, that would require recognition or disclosure in these financial statements.
51
Institutional Target Retirement 2060 Fund
Performance Summary
All of the returns in this report represent past performance, which is not a guarantee of future results that may be achieved by the fund. (Current performance may be lower or higher than the performance data cited. For performance data current to the most recent month-end, visit our website at vanguard.com/performance.) Note, too, that both investment returns and principal value can fluctuate widely, so an investor’s shares, when sold, could be worth more or less than their original cost. The returns shown do not reflect taxes that a shareholder would pay on fund distributions or on the sale of fund shares.
Cumulative Performance: June 26, 2015, Through September 30, 2020
Initial Investment of $100,000,000

| Average Annual Total Returns | |||||
| Periods Ended September 30, 2020 | |||||
| Since | Final Value | ||||
| One | Five | Inception | of a $100,000,000 | ||
| Year | Years | (6/26/2015) | Investment | ||
| Institutional Target Retirement 2060 Fund | 10.30% | 10.17% | 7.55% | $146,655,913 |
| Target 2060 Composite Index | 10.97 | 10.50 | 7.87 | 148,964,335 |
| MSCI US Broad Market Index | 14.99 | 13.70 | 10.98 | 173,014,030 |
Target 2060 Composite Index: Derived by applying the fund’s target asset allocation to the results of the following benchmarks: for international stocks of developed markets, the MSCI ACWI ex USA IMI Index through June 2, 2013, and the FTSE Global All Cap ex US Index thereafter; for emerging-market stocks, the MSCI ACWI ex USA IMI Index through June 2, 2013, and the FTSE Global All Cap ex US Index thereafter; for U.S. bonds, the Bloomberg Barclays U.S. Aggregate Float Adjusted Index; for international bonds, the Bloomberg Barclays Global Aggregate ex-USD Float Adjusted RIC Capped Index Hedged beginning June 3, 2013; and for U.S. stocks, the MSCI US Broad Market Index through June 2, 2013, and the CRSP US Total Market Index thereafter. International stock benchmark returns are adjusted for withholding taxes.
“Since Inception” performance is calculated from the fund’s inception date for both the fund and its comparative standards.
See Financial Highlights for dividend and capital gains information.
52
Institutional Target Retirement 2060 Fund
Underlying Vanguard Funds
As of September 30, 2020
| Vanguard Total Stock Market Index Fund Institutional Shares | 54.1% |
| Vanguard Total International Stock Index Fund Investor Shares | 36.2 |
| Vanguard Total Bond Market II Index Fund Investor Shares | 6.9 |
| Vanguard Total International Bond Index Fund Admiral Shares | 2.8 |
The table reflects the fund’s investments, except for short-term investments and derivatives.
53
Institutional Target Retirement 2060 Fund
Financial Statements
Schedule of Investments
As of September 30, 2020
The fund files its complete schedule of portfolio holdings with the Securities and Exchange Commission (SEC) for the first and third quarters of each fiscal year as an exhibit to its reports on Form N-PORT. The fund’s Form N-PORT reports are available on the SEC’s website at www.sec.gov.
| Market | |||
| Value• | |||
| Shares | ($000) | ||
| Investment Companies (98.8%) | |||
| U.S. Stock Fund (53.5%) | |||
| Vanguard Total Stock Market Index Fund Institutional Shares | 25,543,297 | 2,118,816 | |
| International Stock Fund (35.7%) | |||
| Vanguard Total International Stock Index Fund Investor Shares | 84,457,323 | 1,415,505 | |
| U.S. Bond Fund (6.8%) | |||
| 1 | Vanguard Total Bond Market II Index Fund Investor Shares | 23,238,939 | 268,177 |
| International Bond Fund (2.8%) | |||
| Vanguard Total International Bond Index Fund Admiral Shares | 4,721,084 | 109,718 | |
| Total Investment Companies (Cost $3,437,938) | 3,912,216 | ||
| Temporary Cash Investment (1.6%) | |||
| Money Market Fund (1.6%) | |||
| 1 | Vanguard Market Liquidity Fund, 0.117% (Cost $63,876) | 638,798 | 63,880 |
| Total Investments (100.4%) (Cost $3,501,814) | 3,976,096 | ||
| Other Assets and Liabilities—Net (-0.4%) | (14,581) | ||
| Net Assets (100%) | 3,961,515 | ||
Cost is in $000.
| · | See Note A in Notes to Financial Statements. |
| 1 | Affiliated fund available only to Vanguard funds and certain trusts and accounts managed by Vanguard. Rate shown for Vanguard Market Liquidity Fund is the 7-day yield. |
54
Institutional Target Retirement 2060 Fund
| Derivative Financial Instruments Outstanding as of Period End | ||||
| Futures Contracts | ||||
| ($000) | ||||
| Value and | ||||
| Number of | Unrealized | |||
| Long (Short) | Notional | Appreciation | ||
| Expiration | Contracts | Amount | (Depreciation) | |
| Long Futures Contracts | ||||
| E-mini S&P 500 Index | December 2020 | 196 | 32,850 | 375 |
| 10-Year U.S. Treasury Note | December 2020 | 158 | 22,046 | 18 |
| 393 | ||||
See accompanying Notes, which are an integral part of the Financial Statements.
55
Institutional Target Retirement 2060 Fund
Statement of Assets and Liabilities
As of September 30, 2020
| ($000s, except shares and per-share amounts) | Amount |
| Assets | |
| Investments in Securities, at Value—Affiliated Funds (Cost $3,501,814) | 3,976,096 |
| Cash Collateral Pledged—Futures Contracts | 3,302 |
| Receivables for Accrued Income | 540 |
| Receivables for Capital Shares Issued | 11,618 |
| Variation Margin Receivable—Futures Contracts | 261 |
| Total Assets | 3,991,817 |
| Liabilities | |
| Payables for Investment Securities Purchased | 3,652 |
| Payables for Capital Shares Redeemed | 26,597 |
| Variation Margin Payable—Futures Contracts | 53 |
| Total Liabilities | 30,302 |
| Net Assets | 3,961,515 |
| At September 30, 2020, net assets consisted of: | |
| Paid-in Capital | 3,433,029 |
| Total Distributable Earnings (Loss) | 528,486 |
| Net Assets | 3,961,515 |
| Net Assets | |
| Applicable to 147,195,092 outstanding $.001 par value shares of beneficial interest (unlimited authorization) | 3,961,515 |
| Net Asset Value Per Share | $26.91 |
See accompanying Notes, which are an integral part of the Financial Statements.
56
Institutional Target Retirement 2060 Fund
Statement of Operations
| Year Ended | |
| September 30, 2020 | |
| ($000) | |
| Investment Income | |
| Income | |
| Income Distributions Received from Affiliated Funds | 69,223 |
| Other Income | 2 |
| Net Investment Income—Note B | 69,225 |
| Realized Net Gain (Loss) | |
| Capital Gain Distributions Received from Affiliated Funds | — |
| Affiliated Funds Sold | 2,238 |
| Futures Contracts | 7,204 |
| Realized Net Gain (Loss) | 9,442 |
| Change in Unrealized Appreciation (Depreciation) | |
| Affiliated Funds | 277,578 |
| Futures Contracts | 393 |
| Change in Unrealized Appreciation (Depreciation) | 277,971 |
| Net Increase (Decrease) in Net Assets Resulting from Operations | 356,638 |
See accompanying Notes, which are an integral part of the Financial Statements.
57
Institutional Target Retirement 2060 Fund
Statement of Changes in Net Assets
| Year Ended September 30, | ||
| 2020 | 2019 | |
| ($000) | ($000) | |
| Increase (Decrease) in Net Assets | ||
| Operations | ||
| Net Investment Income | 69,225 | 47,983 |
| Realized Net Gain (Loss) | 9,442 | 921 |
| Change in Unrealized Appreciation (Depreciation) | 277,971 | 31,421 |
| Net Increase (Decrease) in Net Assets Resulting from Operations | 356,638 | 80,325 |
| Distributions1 | ||
| Total Distributions | (60,380) | (32,743) |
| Capital Share Transactions | ||
| Issued | 1,671,562 | 1,187,527 |
| Issued in Lieu of Cash Distributions | 59,794 | 32,169 |
| Redeemed | (618,606) | (249,768) |
| Net Increase (Decrease) from Capital Share Transactions | 1,112,750 | 969,928 |
| Total Increase (Decrease) | 1,409,008 | 1,017,510 |
| Net Assets | ||
| Beginning of Period | 2,552,507 | 1,534,997 |
| End of Period | 3,961,515 | 2,552,507 |
1 Certain prior-period numbers have been reclassified to conform with current-period presentation.
See accompanying Notes, which are an integral part of the Financial Statements.
58
Institutional Target Retirement 2060 Fund
Financial Highlights
| For a Share Outstanding | Year Ended September 30, | ||||
| Throughout Each Period | 2020 | 2019 | 2018 | 2017 | 2016 |
| Net Asset Value, Beginning of Period | $24.90 | $24.92 | $23.08 | $20.10 | $18.07 |
| Investment Operations | |||||
| Net Investment Income1 | .542 | .589 | .554 | .511 | .466 |
| Capital Gain Distributions Received1 | — | — | — | .001 | .001 |
| Net Realized and Unrealized Gain (Loss) on Investments | 2.012 | (.132) | 1.699 | 2.828 | 1.729 |
| Total from Investment Operations | 2.554 | .457 | 2.253 | 3.340 | 2.196 |
| Distributions | |||||
| Dividends from Net Investment Income | (.544) | (.476) | (.409) | (.359) | (.165) |
| Distributions from Realized Capital Gains | (.000)2 | (.001) | (.004) | (.001) | (.001) |
| Total Distributions | (.544) | (.477) | (.413) | (.360) | (.166) |
| Net Asset Value, End of Period | $26.91 | $24.90 | $24.92 | $23.08 | $20.10 |
| Total Return | 10.30% | 2.15% | 9.83% | 16.90% | 12.21% |
| Ratios/Supplemental Data | |||||
| Net Assets, End of Period (Millions) | $3,962 | $2,553 | $1,535 | $809 | $334 |
| Ratio of Total Expenses to Average Net Assets | — | — | — | — | — |
| Acquired Fund Fees and Expenses | 0.09% | 0.09% | 0.09% | 0.09% | 0.10% |
| Ratio of Net Investment Income to Average Net Assets | 2.15% | 2.46% | 2.29% | 2.38% | 2.45% |
| Portfolio Turnover Rate | 9% | 3% | 5% | 7% | 4% |
1 Calculated based on average shares outstanding.
2 Distribution was less than $.001 per share.
See accompanying Notes, which are an integral part of the Financial Statements.
59
Institutional Target Retirement 2060 Fund
Notes to Financial Statements
Vanguard Institutional Target Retirement 2060 Fund is registered under the Investment Company Act of 1940 as an open-end investment company, or mutual fund. The fund follows a balanced investment strategy by investing in selected Vanguard funds to achieve its targeted allocation of assets to U.S. and international stocks, and U.S. and international bonds. Financial statements and other information about each underlying fund are available at www.vanguard.com.
Market disruptions associated with the COVID-19 pandemic have had a global impact, and uncertainty exists as to the long-term implications. Such disruptions can adversely affect assets of the fund and thus fund performance.
A. The following significant accounting policies conform to generally accepted accounting principles for U.S. investment companies. The fund consistently follows such policies in preparing its financial statements.
1. Security Valuation: Investments are valued at the net asset value of each underlying Vanguard fund determined as of the close of the New York Stock Exchange (generally 4 p.m., Eastern time) on the valuation date.
2. Futures Contracts: The fund uses stock and bond futures contracts to a limited extent, with the objectives of maintaining full exposure to the market and maintaining its target asset allocation. The primary risks associated with the use of futures contracts are imperfect correlation between changes in market values of investments held by the fund and the prices of futures contracts, and the possibility of an illiquid market. Counterparty risk involving futures is mitigated because a regulated clearinghouse is the counterparty instead of the clearing broker. To further mitigate counterparty risk, the fund trades futures contracts on an exchange, monitors the financial strength of its clearing brokers and clearinghouse, and has entered into clearing agreements with its clearing brokers. The clearinghouse imposes initial margin requirements to secure the fund’s performance and requires daily settlement of variation margin representing changes in the market value of each contract. Any securities pledged as initial margin for open contracts are noted in the Schedule of Investments.
Futures contracts are valued at their quoted daily settlement prices. The notional amounts of the contracts are not recorded in the Statement of Assets and Liabilities. Fluctuations in the value of the contracts are recorded in the Statement of Assets and Liabilities as an asset (liability) and in the Statement of Operations as unrealized appreciation (depreciation) until the contracts are closed, when they are recorded as realized gains (losses) on futures contracts.
During the year ended September 30, 2020, the fund’s average investments in long and short futures contracts represented less than 1% and 0% of net assets, respectively, based on the average of the notional amounts at each quarter-end during the period.
3. Federal Income Taxes: The fund intends to continue to qualify as a regulated investment company and distribute all of its taxable income. The fund’s tax returns are open to examination by the relevant tax authorities until expiration of the applicable statute of limitations, which is generally three years after the filing of the tax return. Management has analyzed the fund’s tax positions taken for all open federal and state income tax years, and has concluded that no provision for income tax is required in the fund’s financial statements.
4. Distributions: Distributions to shareholders are recorded on the ex-dividend date. Distributions are determined on a tax basis at the fiscal year-end and may differ from net investment income and realized capital gains for financial reporting purposes.
60
Institutional Target Retirement 2060 Fund
5. Credit Facilities and Interfund Lending Program: The fund and certain other funds managed by The Vanguard Group (“Vanguard”) participate in a $4.3 billion committed credit facility provided by a syndicate of lenders pursuant to a credit agreement and an uncommitted credit facility provided by Vanguard. Both facilities may be renewed annually. Each fund is individually liable for its borrowings, if any, under the credit facilities. Borrowings may be utilized for temporary or emergency purposes, subject to the fund’s regulatory and contractual borrowing restrictions. With respect to the committed credit facility, the participating funds are charged administrative fees and an annual commitment fee of 0.10% of the undrawn committed amount of the facility; these fees are allocated to the funds based on a method approved by the fund’s board of trustees and borne by the funds in which the fund invests (see Note B). Any borrowings under either facility bear interest at a rate based upon the higher of the one-month London Interbank Offered Rate (or an acceptable alternate rate, if necessary), federal funds effective rate, or overnight bank funding rate plus an agreed-upon spread, except that borrowings under the uncommitted credit facility may bear interest based upon an alternative rate agreed to by the fund and Vanguard.
In accordance with an exemptive order (the “Order”) from the SEC, the fund may participate in a joint lending and borrowing program that allows registered open-end Vanguard funds to borrow money from and lend money to each other for temporary or emergency purposes (the “Interfund Lending Program”), subject to compliance with the terms and conditions of the Order, and to the extent permitted by the fund’s investment objective and investment policies. Interfund loans and borrowings normally extend overnight, but can have a maximum duration of seven days. Loans may be called on one business day’s notice. The interest rate to be charged is governed by the conditions of the Order and internal procedures adopted by the board of trustees. The board of trustees is responsible for overseeing the Interfund Lending Program.
For the year ended September 30, 2020, the fund did not utilize the credit facilities or the Interfund Lending Program.
6. Other: Income and capital gain distributions received are recorded on the ex-dividend date. Security transactions are accounted for on the date securities are bought or sold. Costs used to determine realized gains (losses) on the sale of investment securities are those of the specific securities sold.
B. In accordance with the terms of a Funds’ Service Agreement (the “FSA”) between Vanguard and the fund, Vanguard furnishes to the fund investment advisory, corporate management, administrative, marketing, and distribution services at Vanguard’s cost of operations (as defined by the FSA). These costs of operations are allocated to the fund based on methods and guidelines approved by the board of trustees. The FSA provides that expenses otherwise allocable to Vanguard funds-of-funds may be reduced or eliminated to the extent of savings realized by the underlying Vanguard funds by virtue of being part of a fund-of-funds. Accordingly, all expenses for services provided by Vanguard to the fund and all other expenses incurred by the fund during the period ended September 30, 2020, were borne by the underlying Vanguard funds in which the fund invests. The fund’s trustees and officers are also trustees and officers, respectively, of the underlying Vanguard funds, as well as directors and employees, respectively, of Vanguard.
C. Various inputs may be used to determine the value of the fund’s investments and derivatives. These inputs are summarized in three broad levels for financial statement purposes. The inputs or methodologies used to value securities are not necessarily an indication of the risk associated with investing in those securities.
61
Institutional Target Retirement 2060 Fund
Level 1—Quoted prices in active markets for identical securities.
Level 2—Other significant observable inputs (including quoted prices for similar securities, interest rates, prepayment speeds, credit risk, etc.).
Level 3—Significant unobservable inputs (including the fund’s own assumptions used to determine the fair value of investments). Any investments and derivatives valued with significant unobservable inputs are noted on the Schedule of Investments.
At September 30, 2020, 100% of the market value of the fund’s investments and derivatives was determined based on Level 1 inputs.
D. Permanent differences between book-basis and tax-basis components of net assets, if any, are reclassified among capital accounts in the financial statements to reflect their tax character. These reclassifications have no effect on net assets or net asset value per share.
Temporary differences between book-basis and tax-basis components of total distributable earnings (loss) arise when certain items of income, gain, or loss are recognized in different periods for financial statement and tax purposes; these differences will reverse at some time in the future. The differences are primarily related to the deferral of losses from wash sales and the recognition of unrealized gains or losses from certain derivative contracts. As of period end, the tax-basis components of total distributable earnings (loss) are detailed in the table as follows:
| Amount | |
| ($000) | |
| Undistributed Ordinary Income | 49,598 |
| Undistributed Long-Term Gains | 4,606 |
| Capital Loss Carryforwards | — |
| Qualified Late-Year Losses | — |
| Net Unrealized Gains (Losses) | 474,282 |
The tax character of distributions paid was as follows:
| Year Ended September 30, | ||
| 2020 | 2019 | |
| Amount | Amount | |
| ($000) | ($000) | |
| Ordinary Income* | 60,380 | 32,732 |
| Long-Term Capital Gains | — | 11 |
| Total | 60,380 | 32,743 |
* Includes short-term capital gains, if any.
As of September 30, 2020, gross unrealized appreciation and depreciation for investments and derivatives based on cost for U.S. federal income tax purposes were as follows:
| Amount | |
| ($000) | |
| Tax Cost | 3,501,814 |
| Gross Unrealized Appreciation | 506,228 |
| Gross Unrealized Depreciation | (31,946) |
| Net Unrealized Appreciation (Depreciation) | 474,282 |
62
Institutional Target Retirement 2060 Fund
E. Capital shares issued and redeemed were:
| Year Ended September 30, | ||
| 2020 | 2019 | |
| Shares | Shares | |
| (000) | (000) | |
| Issued | 67,012 | 49,788 |
| Issued in Lieu of Cash Distributions | 2,263 | 1,505 |
| Redeemed | (24,595) | (10,382) |
| Net Increase (Decrease) in Shares Outstanding | 44,680 | 40,911 |
At September 30, 2020, one shareholder was the record or beneficial owner of 30% of the fund’s net assets. If the shareholder were to redeem its investment in the fund, the redemption might lead to the realization of taxable capital gains.
F. Transactions during the period in affiliated underlying Vanguard funds were as follows:
| Current Period Transactions | ||||||||
| Sept. 30, | Proceeds | Realized | Sept. 30, | |||||
| 2019 | from | Net | Change in | Capital Gain | 2020 | |||
| Market | Purchases | Securities | Gain | Unrealized | Distributions | Market | ||
| Value | at Cost | Sold | (Loss) | App. (Dep.) | Income | Received | Value | |
| ($000) | ($000) | ($000) | ($000) | ($000) | ($000) | ($000) | ($000) | |
| Vanguard Market Liquidity Fund | 4,930 | NA1 | NA1 | (6) | 4 | 79 | — | 63,880 |
| Vanguard Total Bond Market II Index Fund | 184,795 | 206,685 | 132,797 | 1,105 | 8,389 | 5,236 | — | 268,177 |
| Vanguard Total International Bond Index Fund | 72,202 | 55,175 | 17,234 | (92) | (333) | 2,769 | — | 109,718 |
| Vanguard Total International Stock Index Fund | 914,175 | 478,655 | 10,761 | — | 33,436 | 28,885 | — | 1,415,505 |
| Vanguard Total Stock Market Index Fund | 1,379,176 | 641,039 | 138,712 | 1,231 | 236,082 | 32,254 | — | 2,118,816 |
| Total | 2,555,278 | 1,381,554 | 299,504 | 2,238 | 277,578 | 69,223 | — | 3,976,096 |
1 Not applicable—purchases and sales are for temporary cash investment purposes.
G. Management has determined that no events or transactions occurred subsequent to September 30, 2020, that would require recognition or disclosure in these financial statements.
63
Institutional Target Retirement 2065 Fund
Performance Summary
All of the returns in this report represent past performance, which is not a guarantee of future results that may be achieved by the fund. (Current performance may be lower or higher than the performance data cited. For performance data current to the most recent month-end, visit our website at vanguard.com/performance.) Note, too, that both investment returns and principal value can fluctuate widely, so an investor’s shares, when sold, could be worth more or less than their original cost. The returns shown do not reflect taxes that a shareholder would pay on fund distributions or on the sale of fund shares.
Cumulative Performance: July 12, 2017, Through September 30, 2020
Initial Investment of $100,000,000
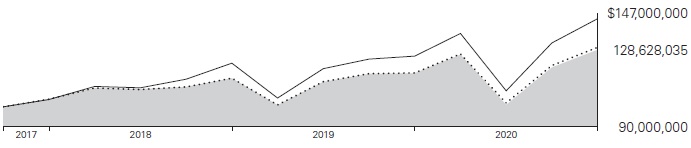
| Average Annual Total Returns | ||||
| Periods Ended September 30, 2020 | ||||
| Since | Final Value | |||
| One | Inception | of a $100,000,000 | ||
| Year | (7/12/2017) | Investment | ||
| Institutional Target Retirement 2065 Fund | 10.06% | 8.13% | $128,628,035 |
| Target 2065 Composite Index | 10.97 | 8.46 | 129,882,485 |
| MSCI US Broad Market Index | 14.99 | 12.06 | 144,290,688 |
Target 2065 Composite Index: Derived by applying the fund’s target asset allocation to the results of the following benchmarks: the FTSE Global All Cap ex US Index for international stocks, the Bloomberg Barclays U.S. Aggregate Float Adjusted Index for U.S. bonds, the Bloomberg Barclays Global Aggregate ex-USD Float Adjusted RIC Capped Index Hedged for international bonds, and the CRSP US Total Market Index for U.S. stocks. International stock benchmark returns are adjusted for withholding taxes.
“Since Inception” performance is calculated from the fund’s inception date for both the fund and its comparative standards.
See Financial Highlights for dividend and capital gains information.
64
Institutional Target Retirement 2065 Fund
Underlying Vanguard Funds
As of September 30, 2020
| Vanguard Total Stock Market Index Fund Institutional Shares | 54.5% |
| Vanguard Total International Stock Index Fund Investor Shares | 35.9 |
| Vanguard Total Bond Market II Index Fund Investor Shares | 7.0 |
| Vanguard Total International Bond Index Fund Admiral Shares | 2.6 |
The table reflects the fund’s investments, except for short-term investments and derivatives.
65
Institutional Target Retirement 2065 Fund
Financial Statements
Schedule of Investments
As of September 30, 2020
The fund files its complete schedule of portfolio holdings with the Securities and Exchange Commission (SEC) for the first and third quarters of each fiscal year as an exhibit to its reports on Form N-PORT. The fund’s Form N-PORT reports are available on the SEC’s website at www.sec.gov.
| Market | |||
| Value• | |||
| Shares | ($000) | ||
| Investment Companies (98.5%) | |||
| U.S. Stock Fund (53.6%) | |||
| Vanguard Total Stock Market Index Fund Institutional Shares | 3,248,485 | 269,462 | |
| International Stock Fund (35.4%) | |||
| Vanguard Total International Stock Index Fund Investor Shares | 10,619,885 | 177,989 | |
| U.S. Bond Fund (6.9%) | |||
| 1 | Vanguard Total Bond Market II Index Fund Investor Shares | 3,024,440 | 34,902 |
| International Bond Fund (2.6%) | |||
| Vanguard Total International Bond Index Fund Admiral Shares | 563,468 | 13,095 | |
| Total Investment Companies (Cost $450,522) | 495,448 | ||
| Temporary Cash Investment (1.5%) | |||
| Money Market Fund (1.5%) | |||
| 1 | Vanguard Market Liquidity Fund, 0.117% (Cost $7,514) | 75,142 | 7,514 |
| Total Investments (100.0%) (Cost $458,036) | 502,962 | ||
| Other Assets and Liabilities—Net (0.0%) | 237 | ||
| Net Assets (100%) | 503,199 | ||
Cost is in $000.
| · | See Note A in Notes to Financial Statements. |
| 1 | Affiliated fund available only to Vanguard funds and certain trusts and accounts managed by Vanguard. Rate shown for Vanguard Market Liquidity Fund is the 7-day yield. |
66
Institutional Target Retirement 2065 Fund
| Derivative Financial Instruments Outstanding as of Period End | ||||
| Futures Contracts | ||||
| ($000) | ||||
| Value and | ||||
| Number of | Unrealized | |||
| Long (Short) | Notional | Appreciation | ||
| Expiration | Contracts | Amount | (Depreciation) | |
| Long Futures Contracts | ||||
| E-mini S&P 500 Index | December 2020 | 31 | 5,195 | 50 |
| 10-Year U.S. Treasury Note | December 2020 | 20 | 2,791 | 2 |
| 52 | ||||
See accompanying Notes, which are an integral part of the Financial Statements.
67
Institutional Target Retirement 2065 Fund
Statement of Assets and Liabilities
As of September 30, 2020
| ($000s, except shares and per-share amounts) | Amount |
| Assets | |
| Investments in Securities, at Value—Affiliated Funds (Cost $458,036) | 502,962 |
| Cash Collateral Pledged—Futures Contracts | 370 |
| Receivables for Investment Securities Sold | 2,764 |
| Receivables for Accrued Income | 69 |
| Receivables for Capital Shares Issued | 3,046 |
| Variation Margin Receivable—Futures Contracts | 28 |
| Total Assets | 509,239 |
| Liabilities | |
| Payables for Investment Securities Purchased | 406 |
| Payables for Capital Shares Redeemed | 5,629 |
| Variation Margin Payable—Futures Contracts | 5 |
| Total Liabilities | 6,040 |
| Net Assets | 503,199 |
| At September 30, 2020, net assets consisted of: | |
| Paid-in Capital | 451,929 |
| Total Distributable Earnings (Loss) | 51,270 |
| Net Assets | 503,199 |
| Net Assets | |
| Applicable to 20,451,255 outstanding $.001 par value shares of beneficial interest (unlimited authorization) | 503,199 |
| Net Asset Value Per Share | $24.60 |
See accompanying Notes, which are an integral part of the Financial Statements.
68
Institutional Target Retirement 2065 Fund
Statement of Operations
| Year Ended | |
| September 30, 2020 | |
| ($000) | |
| Investment Income | |
| Income | |
| Income Distributions Received from Affiliated Funds | 8,075 |
| Net Investment Income—Note B | 8,075 |
| Realized Net Gain (Loss) | |
| Capital Gain Distributions Received from Affiliated Funds | — |
| Affiliated Funds Sold | 22 |
| Futures Contracts | 738 |
| Realized Net Gain (Loss) | 760 |
| Change in Unrealized Appreciation (Depreciation) | |
| Affiliated Funds | 37,971 |
| Futures Contracts | 52 |
| Change in Unrealized Appreciation (Depreciation) | 38,023 |
| Net Increase (Decrease) in Net Assets Resulting from Operations | 46,858 |
See accompanying Notes, which are an integral part of the Financial Statements.
69
Institutional Target Retirement 2065 Fund
Statement of Changes in Net Assets
| Year Ended September 30, | ||
| 2020 | 2019 | |
| ($000) | ($000) | |
| Increase (Decrease) in Net Assets | ||
| Operations | ||
| Net Investment Income | 8,075 | 4,124 |
| Realized Net Gain (Loss) | 760 | 26 |
| Change in Unrealized Appreciation (Depreciation) | 38,023 | 4,738 |
| Net Increase (Decrease) in Net Assets Resulting from Operations | 46,858 | 8,888 |
| Distributions1 | ||
| Total Distributions | (5,739) | (1,981) |
| Capital Share Transactions | ||
| Issued | 395,927 | 208,214 |
| Issued in Lieu of Cash Distributions | 5,685 | 1,977 |
| Redeemed | (185,337) | (68,197) |
| Net Increase (Decrease) from Capital Share Transactions | 216,275 | 141,994 |
| Total Increase (Decrease) | 257,394 | 148,901 |
| Net Assets | ||
| Beginning of Period | 245,805 | 96,904 |
| End of Period | 503,199 | 245,805 |
| 1 | Certain prior-period numbers have been reclassified to conform with current-period presentation. |
See accompanying Notes, which are an integral part of the Financial Statements.
70
Institutional Target Retirement 2065 Fund
Financial Highlights
| July 12, | ||||
| 20171 to | ||||
| Year Ended September 30, | Sept. 30, | |||
| For a Share Outstanding Throughout Each Period | 2020 | 2019 | 2018 | 2017 |
| Net Asset Value, Beginning of Period | $22.78 | $22.69 | $20.80 | $20.00 |
| Investment Operations | ||||
| Net Investment Income2 | .499 | .552 | .555 | .197 |
| Capital Gain Distributions Received2 | — | — | — | — |
| Net Realized and Unrealized Gain (Loss) on Investments | 1.787 | (.107) | 1.503 | .603 |
| Total from Investment Operations | 2.286 | .445 | 2.058 | .800 |
| Distributions | ||||
| Dividends from Net Investment Income | (.465) | (.355) | (.165) | — |
| Distributions from Realized Capital Gains | (.001) | — | (.003) | — |
| Total Distributions | (.466) | (.355) | (.168) | — |
| Net Asset Value, End of Period | $24.60 | $22.78 | $22.69 | $20.80 |
| Total Return | 10.06% | 2.22% | 9.93% | 4.00% |
| Ratios/Supplemental Data | ||||
| Net Assets, End of Period (Millions) | $503 | $246 | $97 | $5 |
| Ratio of Total Expenses to Average Net Assets | — | — | — | — |
| Acquired Fund Fees and Expenses | 0.09% | 0.09% | 0.09% | 0.09%3 |
| Ratio of Net Investment Income to Average Net Assets | 2.17% | 2.51% | 2.51% | 4.33%3 |
| Portfolio Turnover Rate | 14% | 8% | 28% | 133% |
1 Inception.
2 Calculated based on average shares outstanding.
3 Annualized.
See accompanying Notes, which are an integral part of the Financial Statements.
71
Institutional Target Retirement 2065 Fund
Notes to Financial Statements
Vanguard Institutional Target Retirement 2065 Fund is registered under the Investment Company Act of 1940 as an open-end investment company, or mutual fund. The fund follows a balanced investment strategy by investing in selected Vanguard funds to achieve its targeted allocation of assets to U.S. and international stocks, and U.S. and international bonds. Financial statements and other information about each underlying fund are available at www.vanguard.com.
Market disruptions associated with the COVID-19 pandemic have had a global impact, and uncertainty exists as to the long-term implications. Such disruptions can adversely affect assets of the fund and thus fund performance.
A. The following significant accounting policies conform to generally accepted accounting principles for U.S. investment companies. The fund consistently follows such policies in preparing its financial statements.
1. Security Valuation: Investments are valued at the net asset value of each underlying Vanguard fund determined as of the close of the New York Stock Exchange (generally 4 p.m., Eastern time) on the valuation date.
2. Futures Contracts: The fund uses stock and bond futures contracts to a limited extent, with the objectives of maintaining full exposure to the market and maintaining its target asset allocation. The primary risks associated with the use of futures contracts are imperfect correlation between changes in market values of investments held by the fund and the prices of futures contracts, and the possibility of an illiquid market. Counterparty risk involving futures is mitigated because a regulated clearinghouse is the counterparty instead of the clearing broker. To further mitigate counterparty risk, the fund trades futures contracts on an exchange, monitors the financial strength of its clearing brokers and clearinghouse, and has entered into clearing agreements with its clearing brokers. The clearinghouse imposes initial margin requirements to secure the fund’s performance and requires daily settlement of variation margin representing changes in the market value of each contract. Any securities pledged as initial margin for open contracts are noted in the Schedule of Investments.
Futures contracts are valued at their quoted daily settlement prices. The notional amounts of the contracts are not recorded in the Statement of Assets and Liabilities. Fluctuations in the value of the contracts are recorded in the Statement of Assets and Liabilities as an asset (liability) and in the Statement of Operations as unrealized appreciation (depreciation) until the contracts are closed, when they are recorded as realized gains (losses) on futures contracts.
During the year ended September 30, 2020, the fund’s average investments in long and short futures contracts represented less than 1% and 0% of net assets, respectively, based on the average of the notional amounts at each quarter-end during the period.
3. Federal Income Taxes: The fund intends to continue to qualify as a regulated investment company and distribute all of its taxable income. The fund’s tax returns are open to examination by the relevant tax authorities until expiration of the applicable statute of limitations, which is generally three years after the filing of the tax return. Management has analyzed the fund’s tax positions taken for all open federal and state income tax years, and has concluded that no provision for income tax is required in the fund’s financial statements.
4. Distributions: Distributions to shareholders are recorded on the ex-dividend date. Distributions are determined on a tax basis at the fiscal year-end and may differ from net investment income and realized capital gains for financial reporting purposes.
72
Institutional Target Retirement 2065 Fund
5. Credit Facilities and Interfund Lending Program: The fund and certain other funds managed by The Vanguard Group (“Vanguard”) participate in a $4.3 billion committed credit facility provided by a syndicate of lenders pursuant to a credit agreement and an uncommitted credit facility provided by Vanguard. Both facilities may be renewed annually. Each fund is individually liable for its borrowings, if any, under the credit facilities. Borrowings may be utilized for temporary or emergency purposes, subject to the fund’s regulatory and contractual borrowing restrictions. With respect to the committed credit facility, the participating funds are charged administrative fees and an annual commitment fee of 0.10% of the undrawn committed amount of the facility; these fees are allocated to the funds based on a method approved by the fund’s board of trustees and borne by the funds in which the fund invests (see Note B). Any borrowings under either facility bear interest at a rate based upon the higher of the one-month London Interbank Offered Rate (or an acceptable alternate rate, if necessary), federal funds effective rate, or overnight bank funding rate plus an agreed-upon spread, except that borrowings under the uncommitted credit facility may bear interest based upon an alternative rate agreed to by the fund and Vanguard.
In accordance with an exemptive order (the “Order”) from the SEC, the fund may participate in a joint lending and borrowing program that allows registered open-end Vanguard funds to borrow money from and lend money to each other for temporary or emergency purposes (the “Interfund Lending Program”), subject to compliance with the terms and conditions of the Order, and to the extent permitted by the fund’s investment objective and investment policies. Interfund loans and borrowings normally extend overnight, but can have a maximum duration of seven days. Loans may be called on one business day’s notice. The interest rate to be charged is governed by the conditions of the Order and internal procedures adopted by the board of trustees. The board of trustees is responsible for overseeing the Interfund Lending Program.
For the year ended September 30, 2020, the fund did not utilize the credit facilities or the Interfund Lending Program.
6. Other: Income and capital gain distributions received are recorded on the ex-dividend date. Security transactions are accounted for on the date securities are bought or sold. Costs used to determine realized gains (losses) on the sale of investment securities are those of the specific securities sold.
B. In accordance with the terms of a Funds’ Service Agreement (the “FSA”) between Vanguard and the fund, Vanguard furnishes to the fund investment advisory, corporate management, administrative, marketing, and distribution services at Vanguard’s cost of operations (as defined by the FSA). These costs of operations are allocated to the fund based on methods and guidelines approved by the board of trustees. The FSA provides that expenses otherwise allocable to Vanguard funds-of-funds may be reduced or eliminated to the extent of savings realized by the underlying Vanguard funds by virtue of being part of a fund-of-funds. Accordingly, all expenses for services provided by Vanguard to the fund and all other expenses incurred by the fund during the period ended September 30, 2020, were borne by the underlying Vanguard funds in which the fund invests. The fund’s trustees and officers are also trustees and officers, respectively, of the underlying Vanguard funds, as well as directors and employees, respectively, of Vanguard.
C. Various inputs may be used to determine the value of the fund’s investments and derivatives. These inputs are summarized in three broad levels for financial statement purposes. The inputs or methodologies used to value securities are not necessarily an indication of the risk associated with investing in those securities.
73
Institutional Target Retirement 2065 Fund
Level 1—Quoted prices in active markets for identical securities.
Level 2—Other significant observable inputs (including quoted prices for similar securities, interest rates, prepayment speeds, credit risk, etc.).
Level 3—Significant unobservable inputs (including the fund’s own assumptions used to determine the fair value of investments). Any investments and derivatives valued with significant unobservable inputs are noted on the Schedule of Investments.
At September 30, 2020, 100% of the market value of the fund’s investments and derivatives was determined based on Level 1 inputs.
D. Permanent differences between book-basis and tax-basis components of net assets, if any, are reclassified among capital accounts in the financial statements to reflect their tax character. These reclassifications have no effect on net assets or net asset value per share.
Temporary differences between book-basis and tax-basis components of total distributable earnings (loss) arise when certain items of income, gain, or loss are recognized in different periods for financial statement and tax purposes; these differences will reverse at some time in the future. The differences are primarily related to the deferral of losses from wash sales and the recognition of unrealized gains or losses from certain derivative contracts. As of period end, the tax-basis components of total distributable earnings (loss) are detailed in the table as follows:
| Amount | |
| ($000) | |
| Undistributed Ordinary Income | 5,870 |
| Undistributed Long-Term Gains | 474 |
| Capital Loss Carryforwards | — |
| Qualified Late-Year Losses | — |
| Net Unrealized Gains (Losses) | 44,926 |
The tax character of distributions paid was as follows:
| Year Ended September 30, | ||
| 2020 | 2019 | |
| Amount | Amount | |
| ($000) | ($000) | |
| Ordinary Income* | 5,738 | 1,981 |
| Long-Term Capital Gains | 1 | — |
| Total | 5,739 | 1,981 |
* Includes short-term capital gains, if any.
As of September 30, 2020, gross unrealized appreciation and depreciation for investments and derivatives based on cost for U.S. federal income tax purposes were as follows:
| Amount | |
| ($000) | |
| Tax Cost | 458,036 |
| Gross Unrealized Appreciation | 49,745 |
| Gross Unrealized Depreciation | (4,819) |
| Net Unrealized Appreciation (Depreciation) | 44,926 |
74
Institutional Target Retirement 2065 Fund
E. Capital shares issued and redeemed were:
| Year Ended September 30, | ||||
| 2020 | 2019 | |||
| Shares | Shares | |||
| (000) | (000) | |||
| Issued | 17,604 | 9,534 | ||
| Issued in Lieu of Cash Distributions | 235 | 101 | ||
| Redeemed | (8,179) | (3,114) | ||
| Net Increase (Decrease) in Shares Outstanding | 9,660 | 6,521 | ||
F. Transactions during the period in affiliated underlying Vanguard funds were as follows:
| Current Period Transactions | ||||||||||||||||
| Sept. 30, | Proceeds | Realized | Sept. 30, | |||||||||||||
| 2019 | from | Net | Change in | Capital Gain | 2020 | |||||||||||
| Market | Purchases | Securities | Gain | Unrealized | Distributions | Market | ||||||||||
| Value | at Cost | Sold | (Loss) | App. (Dep.) | Income | Received | Value | |||||||||
| ($000) | ($000) | ($000) | ($000) | ($000) | ($000) | ($000) | ($000) | |||||||||
| Vanguard Market Liquidity Fund | 543 | NA1 | NA1 | (1) | — | 11 | — | 7,514 | ||||||||
| Vanguard Total Bond Market II Index Fund | 17,302 | 29,616 | 13,147 | 94 | 1,037 | 594 | — | 34,902 | ||||||||
| Vanguard Total International Bond Index Fund | 7,380 | 6,734 | 1,007 | (1) | (11) | 305 | — | 13,095 | ||||||||
| Vanguard Total International Stock Index Fund | 88,401 | 87,330 | 3,515 | 22 | 5,751 | 3,325 | — | 177,989 | ||||||||
| Vanguard Total Stock Market Index Fund | 133,113 | 140,341 | 35,094 | (92) | 31,194 | 3,840 | — | 269,462 | ||||||||
| Total | 246,739 | 264,021 | 52,763 | 22 | 37,971 | 8,075 | — | 502,962 | ||||||||
1 Not applicable—purchases and sales are for temporary cash investment purposes.
G. Management has determined that no events or transactions occurred subsequent to September 30, 2020, that would require recognition or disclosure in these financial statements.
75
Report of Independent Registered Public Accounting Firm
To the Board of Trustees of Vanguard Chester Funds and Shareholders of Vanguard Institutional Target Retirement 2040 Fund, Vanguard Institutional Target Retirement 2045 Fund, Vanguard Institutional Target Retirement 2050 Fund, Vanguard Institutional Target Retirement 2055 Fund, Vanguard Institutional Target Retirement 2060 Fund and Vanguard Institutional Target Retirement 2065 Fund
Opinions on the Financial Statements
We have audited the accompanying statements of assets and liabilities, including the schedules of investments, of Vanguard Institutional Target Retirement 2040 Fund, Vanguard Institutional Target Retirement 2045 Fund, Vanguard Institutional Target Retirement 2050 Fund, Vanguard Institutional Target Retirement 2055 Fund, Vanguard Institutional Target Retirement 2060 Fund and Vanguard Institutional Target Retirement 2065 Fund (six of the funds constituting Vanguard Chester Funds, hereafter collectively referred to as the “Funds”) as of September 30, 2020, the related statements of operations for the year ended September 30, 2020, the statements of changes in net assets for each of the two years in the period ended September 30, 2020, including the related notes, and the financial highlights for each of the periods indicated therein (collectively referred to as the “financial statements”). In our opinion, the financial statements present fairly, in all material respects, the financial position of each of the Funds as of September 30, 2020, the results of each of their operations for the year then ended, the changes in each of their net assets for each of the two years in the period ended September 30, 2020 and each of the financial highlights for each of the periods indicated therein in conformity with accounting principles generally accepted in the United States of America.
Basis for Opinions
These financial statements are the responsibility of the Funds’ management. Our responsibility is to express an opinion on the Funds’ financial statements based on our audits. We are a public accounting firm registered with the Public Company Accounting Oversight Board (United States) (“PCAOB”) and are required to be independent with respect to the Funds in accordance with the U.S. federal securities laws and the applicable rules and regulations of the Securities and Exchange Commission and the PCAOB.
We conducted our audits of these financial statements in accordance with the standards of the PCAOB. Those standards require that we plan and perform the audit to obtain reasonable assurance about whether the financial statements are free of material misstatement, whether due to error or fraud.
Our audits included performing procedures to assess the risks of material misstatement of the financial statements, whether due to error or fraud, and performing procedures that respond to those risks. Such procedures included examining, on a test basis, evidence regarding the amounts and disclosures in the financial statements. Our audits also included evaluating the accounting principles used and significant estimates made by management, as well as evaluating the overall presentation of the financial statements. Our procedures included confirmation of securities owned as of September 30, 2020 by correspondence with the transfer agent. We believe that our audits provide a reasonable basis for our opinions.
/s/ PricewaterhouseCoopers LLP
Philadelphia, Pennsylvania
November 12, 2020
We have served as the auditor of one or more investment companies in The Vanguard Group of Funds since 1975.
76
Special 2020 tax information (unaudited) for Vanguard Institutional Target Retirement Funds
This information for the fiscal year ended September 30, 2020, is included pursuant to provisions of the Internal Revenue Code.
The funds distributed capital gain dividends (20% rate gain distributions) to shareholders during the fiscal year as follows:
| Fund | ($000) |
| Institutional Target Retirement 2040 Fund | — |
| Institutional Target Retirement 2045 Fund | — |
| Institutional Target Retirement 2050 Fund | — |
| Institutional Target Retirement 2055 Fund | 167 |
| Institutional Target Retirement 2060 Fund | — |
| Institutional Target Retirement 2065 Fund | 1 |
For nonresident alien shareholders, 100% of short-term capital gain dividends distributed by the funds are qualified short-term capital gains.
The funds distributed qualified dividend income to shareholders during the fiscal year as follows:
| Fund | ($000) |
| Institutional Target Retirement 2040 Fund | 389,990 |
| Institutional Target Retirement 2045 Fund | 355,954 |
| Institutional Target Retirement 2050 Fund | 265,065 |
| Institutional Target Retirement 2055 Fund | 131,036 |
| Institutional Target Retirement 2060 Fund | 41,637 |
| Institutional Target Retirement 2065 Fund | 3,951 |
For corporate shareholders, the percentage of investment income (dividend income plus short-term gains, if any) that qualifies for the dividends-received deduction is as follows:
| Fund | Percentage |
| Institutional Target Retirement 2040 Fund | 35.1% |
| Institutional Target Retirement 2045 Fund | 39.1 |
| Institutional Target Retirement 2050 Fund | 38.2 |
| Institutional Target Retirement 2055 Fund | 36.9 |
| Institutional Target Retirement 2060 Fund | 37.7 |
| Institutional Target Retirement 2065 Fund | 39.7 |
77
The funds designate to shareholders foreign source income and foreign taxes paid as follows:
| Foreign Source Income | Foreign Taxes Paid | |
| Fund | ($000) | ($000) |
| Institutional Target Retirement 2040 Fund | 272,393 | 16,197 |
| Institutional Target Retirement 2045 Fund | 236,440 | 15,031 |
| Institutional Target Retirement 2050 Fund | 180,825 | 11,510 |
| Institutional Target Retirement 2055 Fund | 96,086 | 6,131 |
| Institutional Target Retirement 2060 Fund | 33,240 | 2,128 |
| Institutional Target Retirement 2065 Fund | 3,812 | 245 |
Shareholders will receive more detailed information with their Form 1099-DIV in January 2021 to determine the calendar-year amounts to be included on their 2020 tax returns.
78
BLOOMBERG is a trademark and service mark of Bloomberg Finance L.P. BARCLAYS is a trademark and service mark of Barclays Bank Plc, used under license. Bloomberg Finance L.P. and its affiliates, including Bloomberg Index Services Limited (BISL) (collectively, Bloomberg), or Bloomberg’s licensors, own all proprietary rights in the Bloomberg Barclays U.S. Aggregate Bond Index, Bloomberg Barclays U.S. Aggregate Float Adjusted Index, and the Bloomberg Barclays Global Aggregate ex-USD Float Adjusted RIC Capped Index (USD Hedged) (the Indices or Bloomberg Barclays Indices).
Neither Barclays Bank Plc, Barclays Capital Inc., or any affiliate (collectively Barclays) or Bloomberg is the issuer or producer of the Institutional Target Retirement Funds (including the Total Bond Market II Index Fund and the Total International Bond Index Fund) and neither Bloomberg nor Barclays has any responsibilities, obligations or duties to investors in the Institutional Target Retirement Funds. The Indices are licensed for use by The Vanguard Group, Inc. (Vanguard) as the sponsor of the Institutional Target Retirement Funds. Bloomberg and Barclays’ only relationship with Vanguard in respect to the Indices is the licensing of the Indices, which is determined, composed and calculated by BISL, or any successor thereto, without regard to the Issuer or the Institutional Target Retirement Funds or the owners of the Institutional Target Retirement Funds.
Additionally, Vanguard may for itself execute transaction(s) with Barclays in or relating to the Indices in connection with the Institutional Target Retirement Funds. Investors acquire the Institutional Target Retirement Funds from Vanguard and investors neither acquire any interest in the Indices nor enter into any relationship of any kind whatsoever with Bloomberg or Barclays upon making an investment in the Institutional Target Retirement Funds. The Institutional Target Retirement Funds are not sponsored, endorsed, sold or promoted by Bloomberg or Barclays. Neither Bloomberg nor Barclays makes any representation or warranty, express or implied regarding the advisability of investing in the Institutional Target Retirement Funds or the advisability of investing in securities generally or the ability of the Indices to track corresponding or relative market performance. Neither Bloomberg nor Barclays has passed on the legality or suitability of the Institutional Target Retirement Funds with respect to any person or entity. Neither Bloomberg nor Barclays is responsible for and has not participated in the determination of the timing of, prices at, or quantities of the Institutional Target Retirement Funds to be issued. Neither Bloomberg nor Barclays has any obligation to take the needs of the Issuer or the owners of the Institutional Target Retirement Funds or any other third party into consideration in determining, composing or calculating the Indices. Neither Bloomberg nor Barclays has any obligation or liability in connection with administration, marketing or trading of the Institutional Target Retirement Funds.
79
The licensing agreement between Bloomberg and Barclays is solely for the benefit of Bloomberg and Barclays and not for the benefit of the owners of the Institutional Target Retirement Funds, investors or other third parties. In addition, the licensing agreement between Vanguard and Bloomberg is solely for the benefit of Vanguard and Bloomberg and not for the benefit of the owners of the Institutional Target Retirement Funds, investors or other third parties.
NEITHER BLOOMBERG NOR BARCLAYS SHALL HAVE ANY LIABILITY TO THE ISSUER, INVESTORS OR TO OTHER THIRD PARTIES FOR THE QUALITY, ACCURACY AND/OR COMPLETENESS OF THE BLOOMBERG BARCLAYS INDICES OR ANY DATA INCLUDED THEREIN OR FOR INTERRUPTIONS IN THE DELIVERY OF THE BLOOMBERG BARCLAYS INDICES. NEITHER BLOOMBERG NOR BARCLAYS MAKES ANY WARRANTY, EXPRESS OR IMPLIED, AS TO RESULTS TO BE OBTAINED BY THE ISSUER, THE INVESTORS OR ANY OTHER PERSON OR ENTITY FROM THE USE OF THE BLOOMBERG BARCLAYS INDICES OR ANY DATA INCLUDED THEREIN. NEITHER BLOOMBERG NOR BARCLAYS MAKES ANY EXPRESS OR IMPLIED WARRANTIES, AND EACH HEREBY EXPRESSLY DISCLAIMS ALL WARRANTIES OF MERCHANTABILITY OR FITNESS FOR A PARTICULAR PURPOSE OR USE WITH RESPECT TO BLOOMBERG BARCLAYS INDICES OR ANY DATA INCLUDED THEREIN. BLOOMBERG RESERVES THE RIGHT TO CHANGE THE METHODS OF CALCULATION OR PUBLICATION, OR TO CEASE THE CALCULATION OR PUBLICATION OF THE BLOOMBERG BARCLAYS INDICES, AND NEITHER BLOOMBERG NOR BARCLAYS SHALL BE LIABLE FOR ANY MISCALCULATION OF OR ANY INCORRECT, DELAYED OR INTERRUPTED PUBLICATION WITH RESPECT TO ANY OF THE BLOOMBERG BARCLAYS INDICES. NEITHER BLOOMBERG NOR BARCLAYS SHALL BE LIABLE FOR ANY DAMAGES, INCLUDING, WITHOUT LIMITATION, ANY SPECIAL, INDIRECT OR CONSEQUENTIAL DAMAGES, OR ANY LOST PROFITS AND EVEN IF ADVISED OF THE POSSIBILITY OF SUCH, RESULTING FROM THE USE OF BLOOMBERG BARCLAYS INDICES OR ANY DATA INCLUDED THEREIN OR WITH RESPECT TO THE INSTITUTIONAL TARGET RETIREMENT FUNDS.
None of the information supplied by Bloomberg or Barclays and used in this publication may be reproduced in any manner without the prior written permission of both Bloomberg and Barclays Capital, the investment banking division of Barclays Bank Plc. Barclays Bank Plc is registered in England No. 1026167. Registered office 1 Churchill Place London E14 5HP.
© 2020 Bloomberg. Used with Permission.
Source: Bloomberg Index Services Limited. Copyright 2020, Bloomberg. All rights reserved.
80
This page intentionally left blank.
This page intentionally left blank.
The People Who Govern Your Fund
The trustees of your mutual fund are there to see that the fund is operated and managed in your best interests since, as a shareholder, you are a part owner of the fund. Your fund’s trustees also serve on the board of directors of The Vanguard Group, Inc., which is owned by the Vanguard funds and provides services to them.
A majority of Vanguard’s board members are independent, meaning that they have no affiliation with Vanguard or the funds they oversee, apart from the sizable personal investments they have made as private individuals. The independent board members have distinguished backgrounds in business, academia, and public service. Each of the trustees and executive officers oversees 213 Vanguard funds.
Information for each trustee and executive officer of the fund appears below. That information, as well as the Vanguard fund count, is as of the date on the cover of this fund report. The mailing address of the trustees and officers is P.O. Box 876, Valley Forge, PA 19482. More information about the trustees is in the Statement of Additional Information, which can be obtained, without charge, by contacting Vanguard at 800-662-7447, or online at vanguard.com.
Interested Trustee1
Mortimer J. Buckley
Born in 1969. Trustee since January 2018. Principal occupation(s) during the past five years and other experience: chairman of the board (2019-present) of Vanguard and of each of the investment companies served by Vanguard; chief executive officer (2018– present) of Vanguard; chief executive officer, president, and trustee (2018–present) of each of the investment companies served by Vanguard; president and director (2017–present) of Vanguard; and president (2018-present) of Vanguard Marketing Corporation. Chief investment officer (2013–2017), managing director (2002–2017), head of the Retail Investor Group (2006–2012), and chief information officer (2001–2006) of Vanguard. Chairman of the board (2011–2017) and trustee (2009–2017) of the Children’s Hospital of Philadelphia; and trustee (2018-present) and vice chair (2019–present) of The Shipley School.
Independent Trustees
Emerson U. Fullwood
Born in 1948. Trustee since January 2008. Principal occupation(s) during the past five years and other experience: executive chief staff and marketing officer for North America and corporate vice president (retired 2008) of Xerox Corporation (document management products and services). Former president of the Worldwide Channels Group, Latin America, and Worldwide Customer Service and executive chief staff officer of Developing Markets of Xerox. Executive in residence and 2009–2010 Distinguished Minett Professor at the Rochester Institute of Technology. Director of SPX FLOW, Inc. (multi-industry manufacturing). Director of the University of Rochester Medical Center, the Monroe Community College Foundation, the United Way of Rochester, North Carolina A&T University, and Roberts Wesleyan College. Trustee of the University of Rochester.
Amy Gutmann
Born in 1949. Trustee since June 2006. Principal occupation(s) during the past five years and other experience: president (2004-present) of the University of Pennsylvania. Christopher H. Browne Distinguished Professor of Political Science, School of Arts and Sciences, and professor of communication, Annenberg School for Communication, with secondary faculty appointments in the Department of Philosophy, School of Arts and Sciences, and at the Graduate School of Education, University of Pennsylvania.
F. Joseph Loughrey
Born in 1949. Trustee since October 2009. Principal occupation(s) during the past five years and other experience: president and chief operating officer (retired 2009) and vice chairman of the board (2008–2009) of Cummins Inc. (industrial machinery). Chairman of the board of Hillenbrand, Inc. (specialized consumer services) and the Lumina Foundation. Director of the V Foundation. Member of the advisory
| 1 | Mr. Buckley is considered an “interested person,” as defined in the Investment Company Act of 1940, because he is an officer of the Vanguard funds. |
council for the College of Arts and Letters and chair of the advisory board to the Kellogg Institute for International Studies, both at the University of Notre Dame.
Mark Loughridge
Born in 1953. Trustee since March 2012. Principal occupation(s) during the past five years and other experience: senior vice president and chief financial officer (retired 2013) of IBM (information technology services). Fiduciary member of IBM’s Retirement Plan Committee (2004–2013), senior vice president and general manager (2002–2004) of IBM Global Financing, vice president and controller (1998–2002) of IBM, and a variety of other prior management roles at IBM. Member of the Council on Chicago Booth.
Scott C. Malpass
Born in 1962. Trustee since March 2012. Principal occupation(s) during the past five years and other experience: chief investment officer (retired June 2020) and vice president (retired June 2020) of the University of Notre Dame. Assistant professor of finance at the Mendoza College of Business, University of Notre Dame, and member of the Notre Dame 403(b) Investment Committee (retired June 2020). Member of the board of Catholic Investment Services, Inc. (investment advisors) and the board of superintendence of the Institute for the Works of Religion.
Deanna Mulligan
Born in 1963. Trustee since January 2018. Principal occupation(s) during the past five years and other experience: board chair (2020-present), chief executive officer (2011–2020), and president (2010–2019) of The Guardian Life Insurance Company of America. Chief operating officer (2010–2011) and executive vice president (2008–2010) of the individual life and disability division of Guardian Life. Member of the board of the American Council of Life Insurers and the board of the Economic Club of New York. Trustee of the Partnership for New York City (business leadership), Chief Executives for Corporate Purpose, NewYork- Presbyterian Hospital, Catalyst, and the Bruce Museum (arts and science). Member of the Advisory Council for the Stanford Graduate School of Business.
André F. Perold
Born in 1952. Trustee since December 2004. Principal occupation(s) during the past five years and other experience: George Gund Professor of Finance and Banking, Emeritus at the Harvard Business School (retired 2011). Chief investment officer and co-managing partner of HighVista Strategies (private investment firm). Member of the board of advisors and member of the investment committee of the Museum of Fine Arts Boston. Member of the board (2018–present) of RIT Capital Partners (investment firm). Member of the investment committee of Partners Health Care System.
Sarah Bloom Raskin
Born in 1961. Trustee since January 2018. Principal occupation(s) during the past five years and other experience: deputy secretary (2014–2017) of the United States Department of the Treasury. Governor (2010–2014) of the Federal Reserve Board. Commissioner (2007–2010) of financial regulation for the State of Maryland. Member of the board of directors (2012–2014) of Neighborhood Reinvestment Corporation. Director (2017–present) of i(x) Investments, LLC; director (2017–present) of Reserve Trust. Rubenstein Fellow (2017–present) of Duke University; trustee (2017–present) of Amherst College, and trustee (2019–present) of the Folger Shakespeare Library.
Peter F. Volanakis
Born in 1955. Trustee since July 2009. Principal occupation(s) during the past five years and other experience: president and chief operating officer (retired 2010) of Corning Incorporated (communications equipment) and director of Corning Incorporated (2000–2010) and Dow Corning (2001–2010). Director (2012) of SPX Corporation (multi-industry manufacturing). Overseer of the Amos Tuck School of Business Administration, Dartmouth College (2001–2013). Chairman of the board of trustees of Colby-Sawyer College. Member of the board of Hypertherm Inc. (industrial cutting systems, software, and consumables).
Executive Officers
John Bendl
Born in 1970. Principal occupation(s) during the past five years and other experience: principal of Vanguard. Chief financial officer (2019–present) of each of the investment companies served by Vanguard. Chief accounting officer, treasurer, and controller of Vanguard (2017–present). Partner (2003–2016) at KPMG (audit, tax, and advisory services).
Christine M. Buchanan
Born in 1970. Principal occupation(s) during the past five years and other experience: principal of Vanguard. Treasurer (2017–present) of each of the investment companies served by Vanguard. Partner (2005–2017) at KPMG (audit, tax, and advisory services).
David Cermak
Born in 1960. Principal occupation(s) during the past five years and other experience: principal of Vanguard. Finance director (2019–present) of each of the investment companies served by Vanguard. Managing director and head (2017–present) of Vanguard Investments Singapore. Managing director and head (2017–2019) of Vanguard Investments Hong Kong. Representative director and head (2014–2017) of Vanguard Investments Japan.
John Galloway
Born in 1973. Principal occupation(s) during the past five years and other experience: principal of Vanguard. Investment stewardship officer (September 2020–present) of each of the investment companies served by Vanguard. Head of Investor Advocacy (February 2020–present) and head of Marketing Strategy and Planning (2017–2020) at Vanguard. Deputy assistant to the President of the United States (2015).
Thomas J. Higgins
Born in 1957. Principal occupation(s) during the past five years and other experience: principal of Vanguard. Finance director (2019-present), chief financial officer (2008–2019), and treasurer (1998–2008) of each of the investment companies served by Vanguard.
Peter Mahoney
Born in 1974. Principal occupation(s) during the past five years and other experience: principal of Vanguard. Controller (2015–present) of each of the investment companies served by Vanguard. Head of International Fund Services (2008–2014) at Vanguard.
Anne E. Robinson
Born in 1970. Principal occupation(s) during the past five years and other experience: general counsel (2016–present) of Vanguard. Secretary (2016–present) of Vanguard and of each of the investment companies served by Vanguard. Managing director (2016–present) of Vanguard. Managing director and general counsel of Global Cards and Consumer Services (2014–2016) at Citigroup. Counsel (2003–2014) at American Express.
Michael Rollings
Born in 1963. Principal occupation(s) during the past five years and other experience: finance director (2017–present) and treasurer (2017) of each of the investment companies served by Vanguard. Managing director (2016–present) of Vanguard. Chief financial officer (2016–present) of Vanguard. Director (2016–present) of Vanguard Marketing Corporation. Executive vice president and chief financial officer (2006–2016) of MassMutual Financial Group.
John E. Schadl
Born in 1972. Principal occupation(s) during the past five years and other experience: principal of Vanguard. Chief compliance officer (2019-present) of Vanguard and of each of the investment companies served by Vanguard. Assistant vice president (2019–present) of Vanguard Marketing Corporation.
Vanguard Senior Management Team
| Joseph Brennan | James M. Norris | |
| Mortimer J. Buckley | Thomas M. Rampulla | |
| Gregory Davis | Karin A. Risi | |
| John James | Anne E. Robinson | |
| John T. Marcante | Michael Rollings | |
| Chris D. McIsaac | Lauren Valente |
Connect with Vanguard® > vanguard.com
Fund Information > 800-662-7447
Direct Investor Account Services > 800-662-2739
Institutional Investor Services > 800-523-1036
Text Telephone for People
Who Are Deaf or Hard of Hearing > 800-749-7273
This material may be used in conjunction with the offering of shares of any Vanguard fund only if preceded or accompanied by the fund’s current prospectus.
All comparative mutual fund data are from Morningstar, Inc., unless otherwise noted.
You can obtain a free copy of Vanguard’s proxy voting guidelines by visiting vanguard.com/proxyreporting or by calling Vanguard at 800-662-2739. The guidelines are also available from the SEC’s website, www.sec.gov. In addition, you may obtain a free report on how your fund voted the proxies for securities it owned during the 12 months ended June 30. To get the report, visit either vanguard.com/proxyreporting or www.sec.gov.
You can review information about your fund on the SEC’s website, and you can receive copies of this information, for a fee, by sending a request via email addressed to publicinfo@sec.gov.
| © 2020 The Vanguard Group, Inc. | |
| All rights reserved. | |
| Vanguard Marketing Corporation, Distributor. | |
| Q6730B 112020 |
Item 2: Code of Ethics. The Registrant has adopted a code of ethics that applies to the Registrant’s principal executive officer, principal financial officer, principal accounting officer or controller or persons performing similar functions. The Code of Ethics was amended during the reporting period covered by this report to make certain technical, non-material changes.
Item 3: Audit Committee Financial Expert. All members of the Audit Committee have been determined by the Registrant’s Board of Trustees to be Audit Committee Financial Experts and to be independent: F. Joseph Loughrey, Mark Loughridge, Sarah Bloom Raskin, and Peter F. Volanakis.
Item 4: Principal Accountant Fees and Services.
| (a) | Audit Fees. |
Audit Fees of the Registrant.
Fiscal Year Ended September 30, 2020: $31,000
Fiscal Year Ended September 30, 2019: $31,000
Aggregate Audit Fees of Registered Investment Companies in the Vanguard Group.
Fiscal Year Ended September 30, 2020: $10,761,407
Fiscal Year Ended September 30, 2019: $9,568,215
Includes fees billed in connection with audits of the Registrant, other registered investment companies in the Vanguard complex, The Vanguard Group, Inc., and Vanguard Marketing Corporation.
| (b) | Audit-Related Fees. |
Fiscal Year Ended September 30, 2020: $2,915,863
Fiscal Year Ended September 30, 2019: $3,012,031
Includes fees billed in connection with assurance and related services provided to the Registrant, other registered investment companies in the Vanguard complex, The Vanguard Group, Inc., and Vanguard Marketing Corporation.
| (c) | Tax Fees. |
Fiscal Year Ended September 30, 2020: $247,168
Fiscal Year Ended September 30, 2019: $357,238
Includes fees billed in connection with tax compliance, planning, and advice services provided to the Registrant, other registered investment companies in the Vanguard complex, The Vanguard Group, Inc., and Vanguard Marketing Corporation.
| (d) | All Other Fees. |
Fiscal Year Ended September 30, 2020: $115,000
Fiscal Year Ended September 30, 2019: $0
Includes fees billed for services related to tax reported information provided to the Registrant, other registered investment companies in the Vanguard complex, The Vanguard Group, Inc., and Vanguard Marketing Corporation.
(e) (1) Pre-Approval Policies. The policy of the Registrant’s Audit Committee is to consider, and, if appropriate, approve before the principal accountant is engaged for such services, all specific audit and non-audit services provided to: the Registrant, other registered investment companies in the Vanguard complex, The Vanguard Group, Inc., and entities controlled by The Vanguard Group, Inc. that provide ongoing services to the Registrant. In making a determination, the Audit Committee considers whether the services are consistent with maintaining the principal accountant’s independence.
In the event of a contingency situation in which the principal accountant is needed to provide services in between scheduled Audit Committee meetings, the Chairman of the Audit Committee would be called on to consider and, if appropriate, pre-approve audit or permitted non-audit services in an amount sufficient to complete services through the next Audit Committee meeting, and to determine if such services would be consistent with maintaining the accountant’s independence. At the next scheduled Audit Committee meeting, services and fees would be presented to the Audit Committee for formal consideration, and, if appropriate, approval by the entire Audit Committee. The Audit Committee would again consider whether such services and fees are consistent with maintaining the principal accountant’s independence.
The Registrant’s Audit Committee is informed at least annually of all audit and non-audit services provided by the principal accountant to the Vanguard complex, whether such services are provided to: the Registrant, other registered investment companies in the Vanguard complex, The Vanguard Group, Inc., or other entities controlled by The Vanguard Group, Inc. that provide ongoing services to the Registrant.
(2) No percentage of the principal accountant’s fees or services were approved pursuant to the waiver provision of paragraph (c)(7)(i)(C) of Rule 2-01 of Regulation S-X.
(f) For the most recent fiscal year, over 50% of the hours worked under the principal accountant’s engagement were not performed by persons other than full-time, permanent employees of the principal accountant.
(g) Aggregate Non-Audit Fees.
Fiscal Year Ended September 30, 2020: $362,168
Fiscal Year Ended September 30, 2019: $357,238
Includes fees billed for non-audit services provided to the Registrant, other registered investment companies in the Vanguard complex, The Vanguard Group, Inc., and Vanguard Marketing Corporation.
(h) For the most recent fiscal year, the Audit Committee has determined that the provision of all non-audit services was consistent with maintaining the principal accountant’s independence.
Item 5: Audit Committee of Listed Registrants.
The Registrant is a listed issuer as defined in rule 10A-3 under the Securities Exchange Act of 1934 (“Exchange Act”). The Registrant has a separately-designated standing audit committee established in accordance with Section 3(a)(58)(A) of the Exchange Act. The Registrant’s audit committee members are: F. Joseph Loughrey, Mark Loughridge, Sarah Bloom Raskin, and Peter F. Volanakis.
Item 6: Investments.
Not applicable.
Item 7: Disclosure of Proxy Voting Policies and Procedures for Closed-End Management Investment Companies.
Not applicable.
Item 8: Portfolio Managers of Closed-End Management Investment Companies.
Not applicable.
Item 9: Purchase of Equity Securities by Closed-End Management Investment Company and Affiliated Purchasers.
Not applicable.
Item 10: Submission of Matters to a Vote of Security Holders.
Not applicable.
Item 11: Controls and Procedures.
(a) Disclosure Controls and Procedures. The Principal Executive and Financial Officers concluded that the Registrant’s Disclosure Controls and Procedures are effective based on their evaluation of the Disclosure Controls and Procedures as of a date within 90 days of the filing date of this report.
(b) Internal Control Over Financial Reporting. There were no significant changes in the Registrant’s Internal Control Over Financial Reporting or in other factors that could significantly affect this control subsequent to the date of the evaluation, including any corrective actions with regard to significant deficiencies and material weaknesses.
Item 12: Disclosure of Securities Lending Activities for Closed-End Management Investment Companies.
Not applicable.
Item 13: Exhibits.
| (a) | Code of Ethics. | |
| (b) | Certifications. |
Pursuant to the requirements of the Securities Exchange Act of 1934 and the Investment Company Act of 1940, the registrant has duly caused this report to be signed on its behalf by the undersigned, thereunto duly authorized.
| VANGUARD CHESTER FUNDS | ||
| BY: | /s/ MORTIMER J. BUCKLEY* | |
| MORTIMER J. BUCKLEY | ||
| CHIEF EXECUTIVE OFFICER |
Date: November 17, 2020
Pursuant to the requirements of the Securities Exchange Act of 1934 and the Investment Company Act of 1940, this report has been signed below by the following persons on behalf of the registrant and in the capacities and on the dates indicated.
| VANGUARD CHESTER FUNDS | ||
| BY: | /s/ MORTIMER J. BUCKLEY* | |
| MORTIMER J. BUCKLEY | ||
| CHIEF EXECUTIVE OFFICER |
Date: November 17, 2020
| VANGUARD CHESTER FUNDS | ||
| BY: | /s/ JOHN BENDL* | |
| JOHN BENDL | ||
| CHIEF FINANCIAL OFFICER |
Date: November 17, 2020
| * By: | /s/ Anne E. Robinson |
Anne E. Robinson, pursuant to a Power of Attorney filed on October 23, 2020 (see File Number 2-52698), Incorporated by Reference.