 Annual Meeting of Shareholders Presentation by Robert G. Schoenberger Chairman, Chief Executive Officer & President Exhibit 99.1 April 22, 2015 |
 1 Safe Harbor Provision This presentation contains “forward-looking statements” made pursuant to the safe harbor provisions of the Private Securities Litigation Reform Act of 1995. These forward-looking statements include statements regarding Unitil Corporation’s (“Unitil”) financial condition, results of operations, capital expenditures, business strategy, regulatory strategy, market opportunities, and other plans and objectives. In some cases, forward-looking statements can be identified by terminology such as “may,” “will,” “should,” “expects,” “plans,” “anticipates,” “believes,” “estimates,” “predicts,” “potential” or “continue”, the negative of such terms, or other comparable terminology. These forward-looking statements are neither promises nor guarantees, but involve risks and uncertainties that could cause the actual results to differ materially from those set forth in the forward-looking statements. Those risks and uncertainties include: Unitil’s regulatory environment (including regulations relating to climate change, greenhouse gas emissions and other environmental matters); fluctuations in the supply of, demand for, and the prices of energy commodities and transmission capacity and Unitil’s ability to recover energy commodity costs in its rates; customers’ preferred energy sources; severe storms and Unitil’s ability to recover storm costs in its rates; general economic conditions; variations in weather; long-term global climate change; Unitil’s ability to retain its existing customers and attract new customers; Unitil’s energy brokering customers’ performance and energy used under multi-year energy brokering contracts; increased competition; integrity and security of operational and information systems; publicity and reputational risks; and other risks detailed in Unitil's filings with the Securities and Exchange Commission, including those appearing under the caption "Risk Factors" in Unitil's Annual Report on Form 10-K for the year ended December 31, 2014. Readers should not place undue reliance on any forward looking statements, which speak only as of the date they are made. Unitil undertakes no obligation to update any forward- looking statements to reflect any change in Unitil’s expectations or in events, conditions, or circumstances on which any such statements may be based, or that may affect the likelihood that actual results will differ from those set forth in the forward-looking statements. |
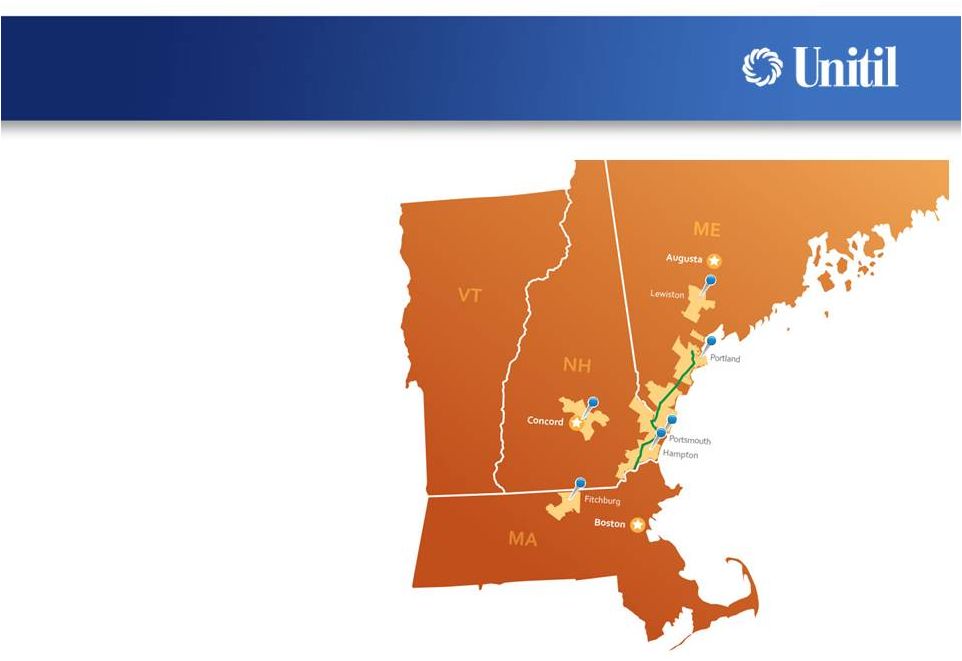 2 Unitil Corporation Unitil Corporation is a Public Utility Holding Company with utility operations in Maine, New Hampshire and Massachusetts serving 180,000 gas and electric customers |
 Generating Financial Results 3 Earnings Per Share 12% CAGR Earnings per share has grown at a 12% annual rate since 2012 $1.43 $1.57 $1.79 2012 2013 2014 |
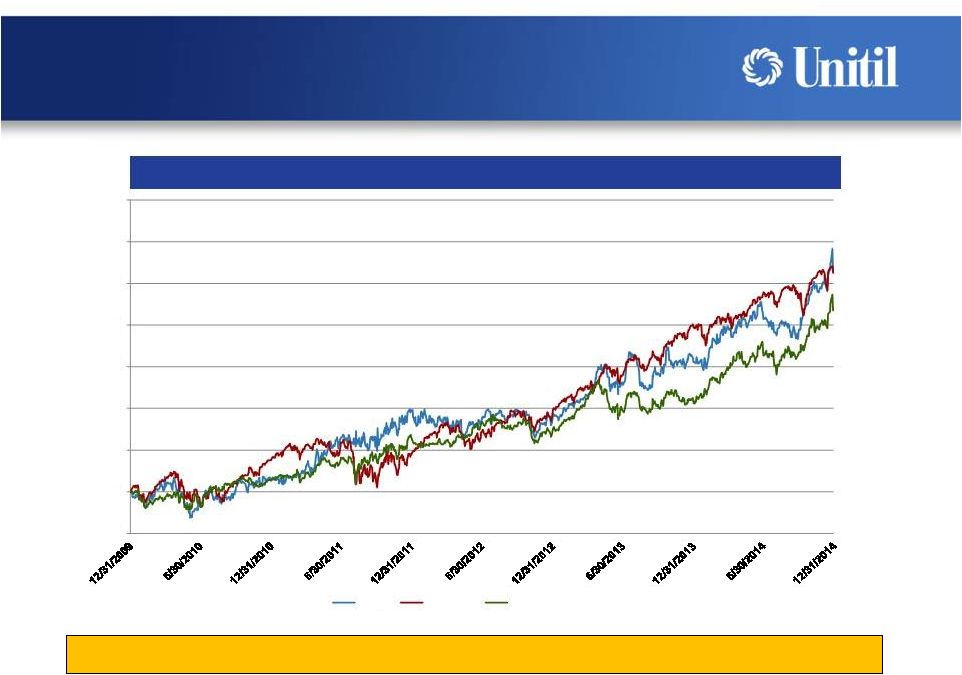 Market Outperformance 4 Unitil 5-year total return of 106% versus 105% for S&P 500 and 87% for S&P Utility -20% 0% 20% 40% 60% 80% 100% 120% Unitil S&P 500 S&P Utility Index 140% 5-Year Total Return |
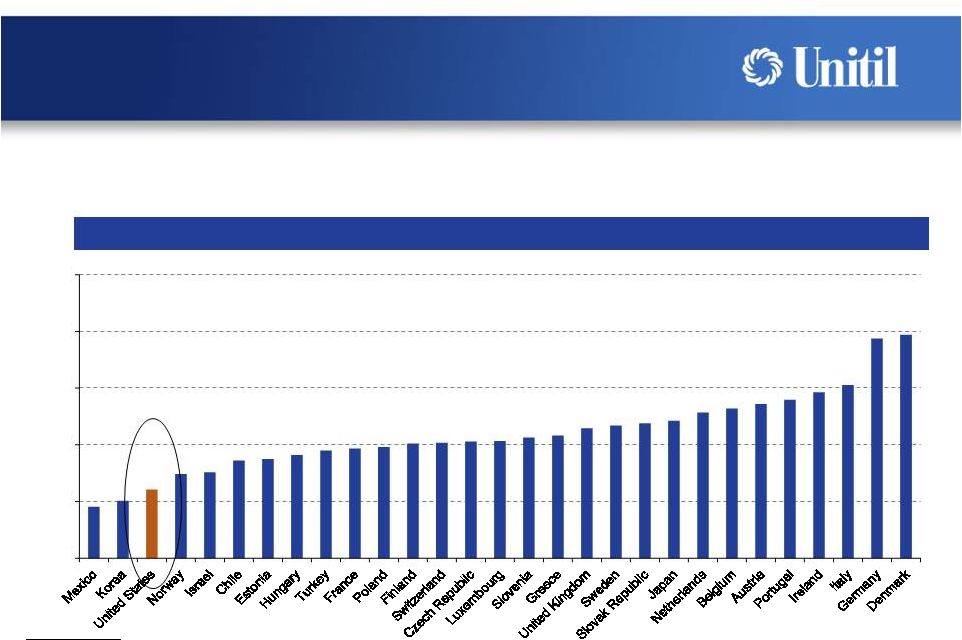 Worldwide Electricity Prices 5 Electricity prices in the USA remain very competitive compared to worldwide electricity prices 2014 prices in US $/kWh Source: IEA Worldwide Electricity Prices $0.00 $0.10 $0.20 $0.30 $0.40 $0.50 |
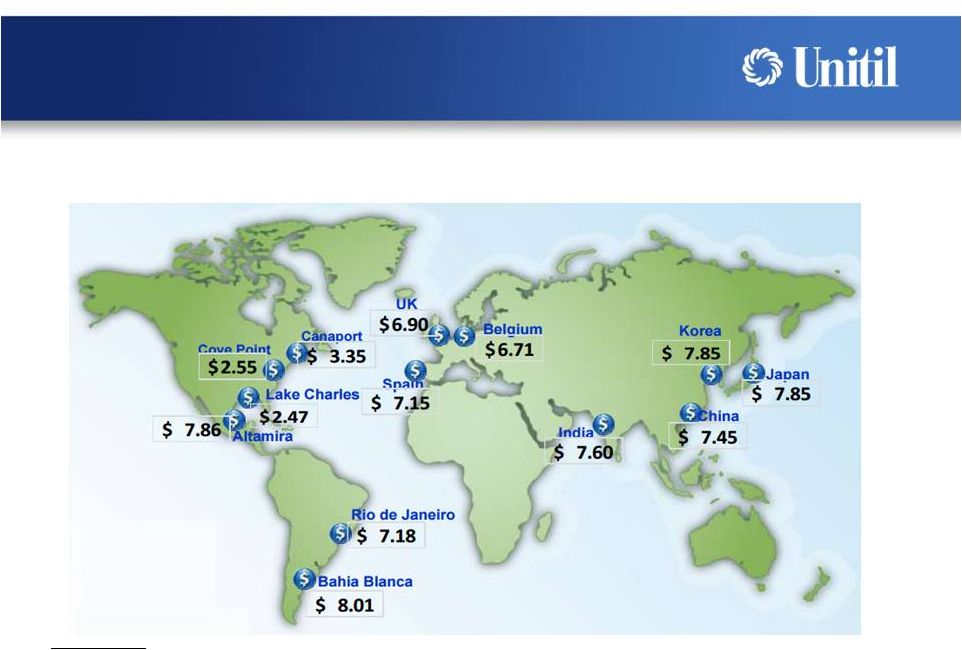 Worldwide Natural Gas Prices 6 LNG/natural gas prices in the USA are well below worldwide LNG/natural gas prices April 2015 LNG prices in US $/MMBtu Source: FERC.gov |
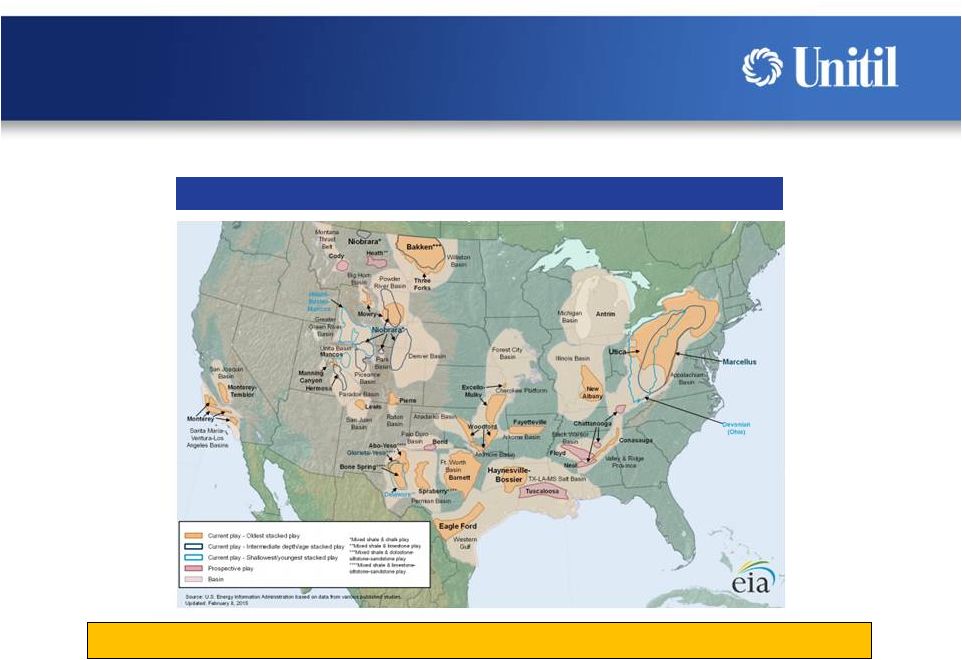 Approximately 100+ years of domestic natural gas supply U.S. Shale Plays Domestic Natural Resources 7 The United States ranks first in oil and gas production worldwide |
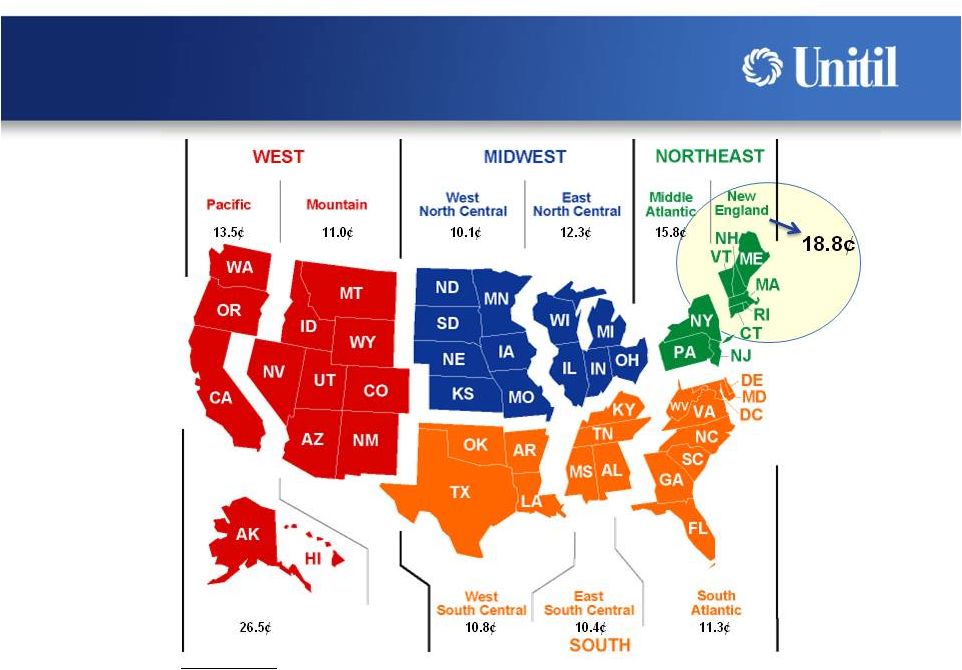 U.S. Electricity Prices 8 December 2014 prices in US cents/kWh Source: EIA |
 Gas Growth Potential 9 Only 60% penetration on existing distribution system means more room to grow Expansion into adjacent service areas provides new opportunities for growth each year Convenient, clean, efficient and low cost natural gas is attracting more and more commercial and industrial high volume users The increasing demand for natural gas in our service areas provides favorable conditions for growth |
 1 Poland New Service Area 2 Wells Extension 3 Lewiston Extension 10 New Service Areas 1 2 3 4 5 Gas Expansion Opportunities Provide Years of Above Industry Average Customer Growth 4 Brentwood New Service Area 5 Dover Extension 6 Hampton Extension 6 |
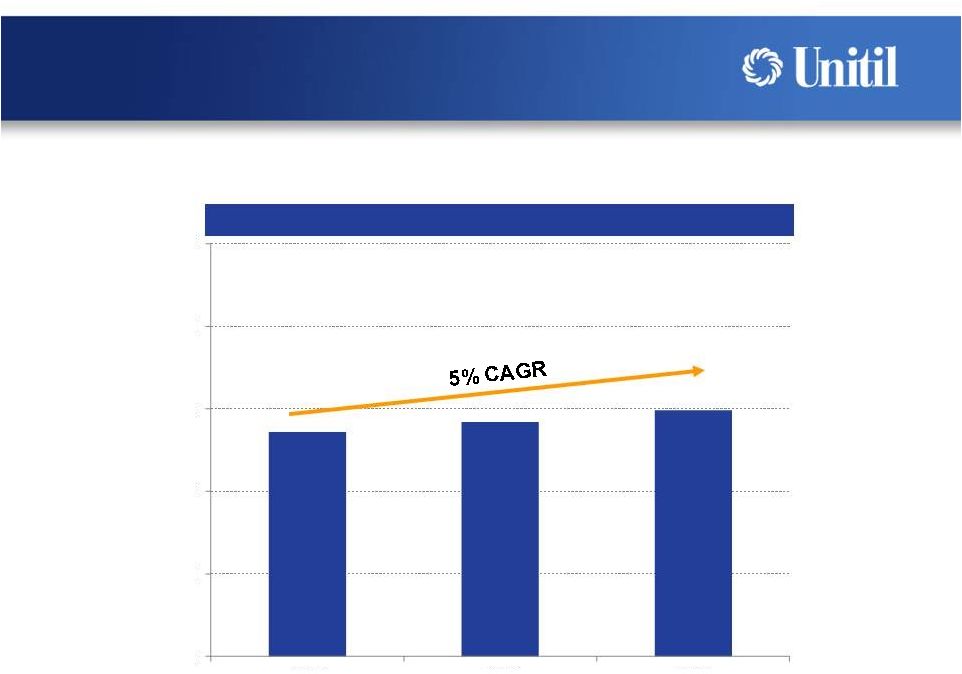 Weather-normalized gas unit sales have grown at a 5% annual rate since 2012 Gas Sales Growth 11 (therms, in millions) *Excludes decoupled gas sales 0 60 120 180 240 300 2012 2013 2014 Weather-Normalized Gas Sales* |
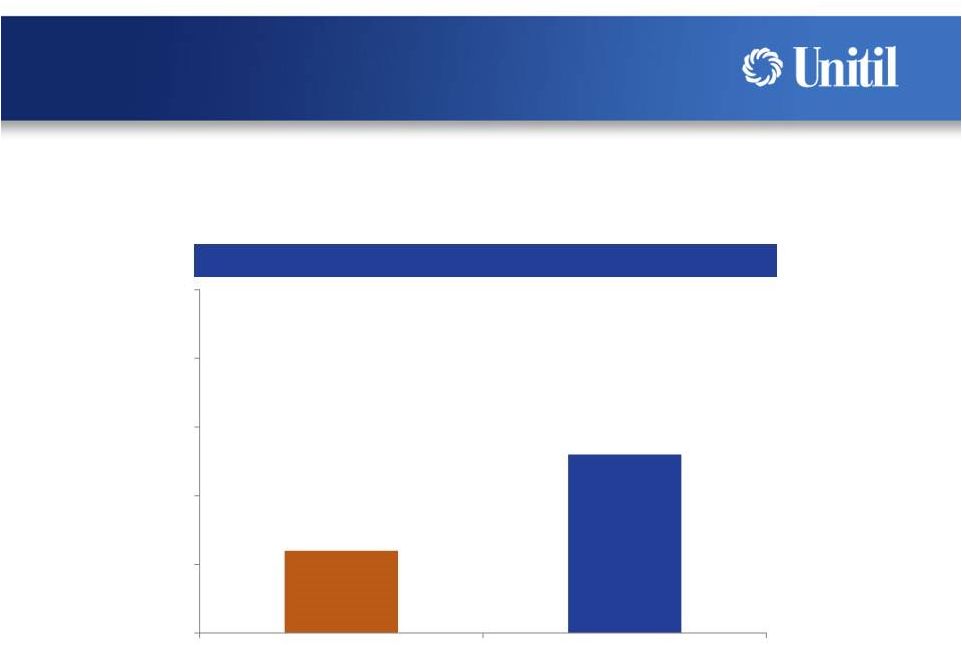 Gas Customer Growth 12 The total number of gas customers served grew 3% in 2014 - triple the New England peer group average growth 1% 3% 0% 1% 2% 3% 4% 5% New England Peer Average Unitil Gas Customer Additions |
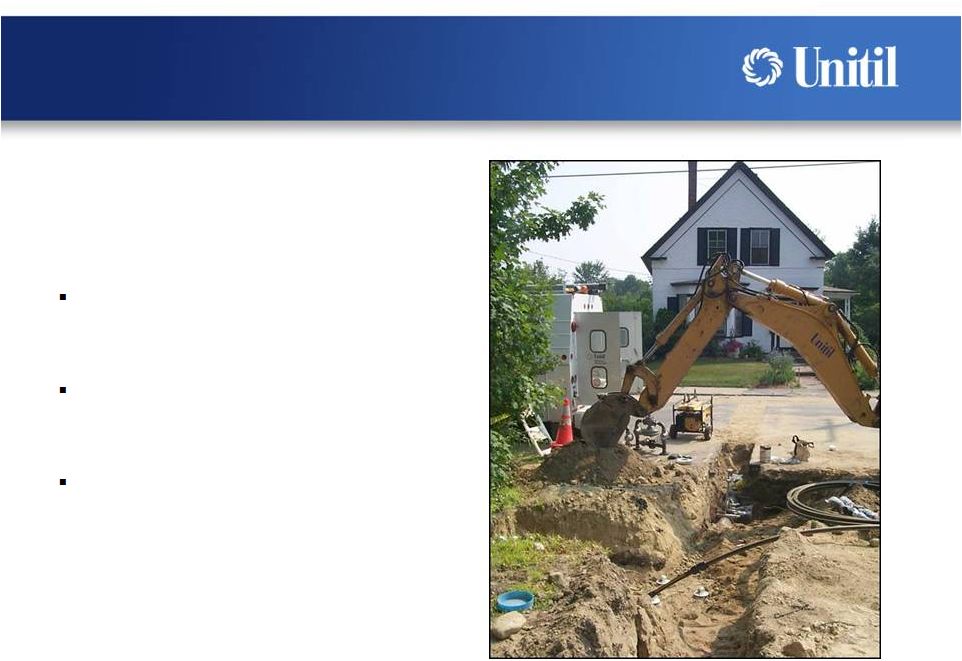
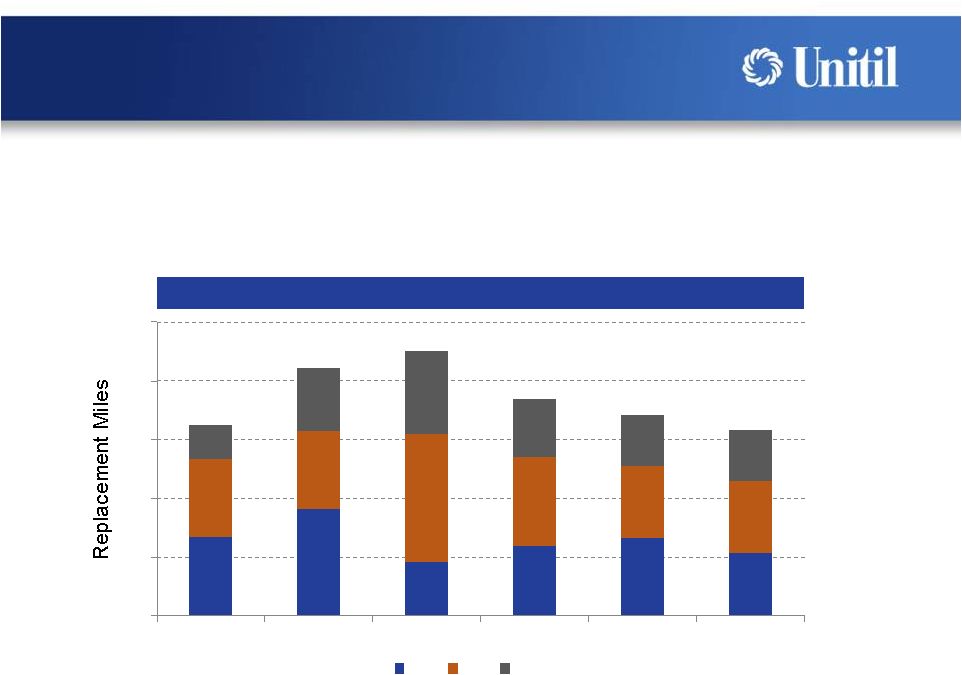 0 4 8 12 16 20 2012 2013 2014 2015 F 2016 F 2017 F ME NH MA Infrastructure Replacement 13 • Modern gas infrastructure – Approximately 70% of gas mains are contemporary materials - polyethylene plastic and protected steel • Replacing ~14 miles of remaining older leak prone mains annually across all three states to achieve continuous improvement and modernization of our entire natural gas delivery system Cast Iron / Bare Steel Miles Replaced |
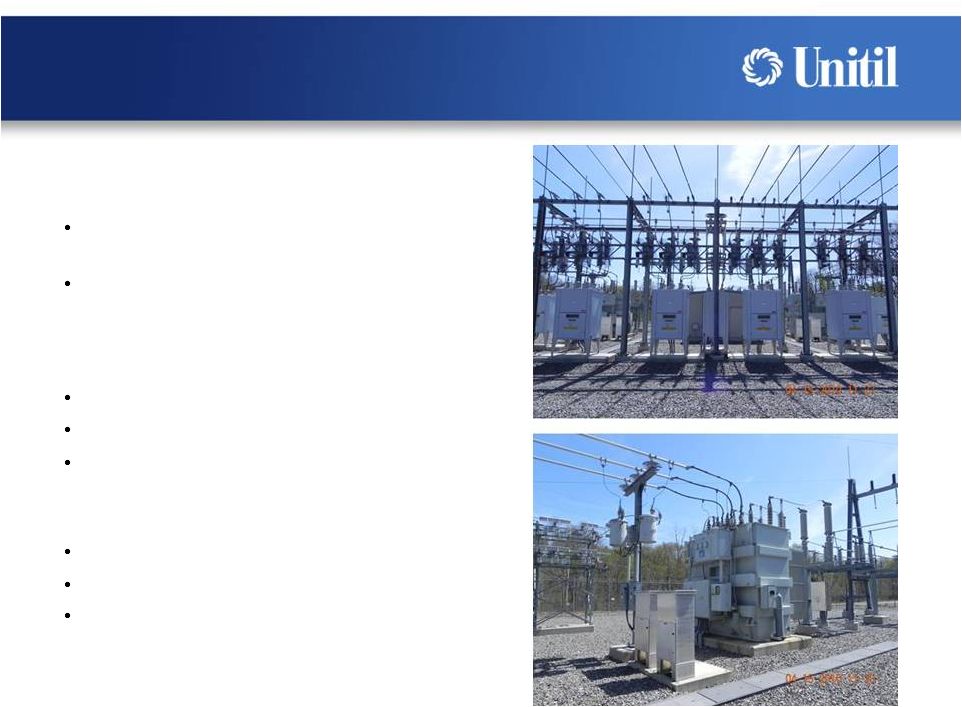 Substation Projects 14 Construction of two major electric distribution substations in New Hampshire began in 2014 Provides capacity to meet forecasted load growth in New Hampshire Enhances reliability and addresses capacity constraints at existing substations Kingston Project: Kingston, NH (Seacoast Region) Construction began 2014; in service 2016 Total cost of ~$12 million Broken Ground Project: Concord, NH (Capital Region) Construction to begin 2015; in service 2017 Total cost of ~$11 million |
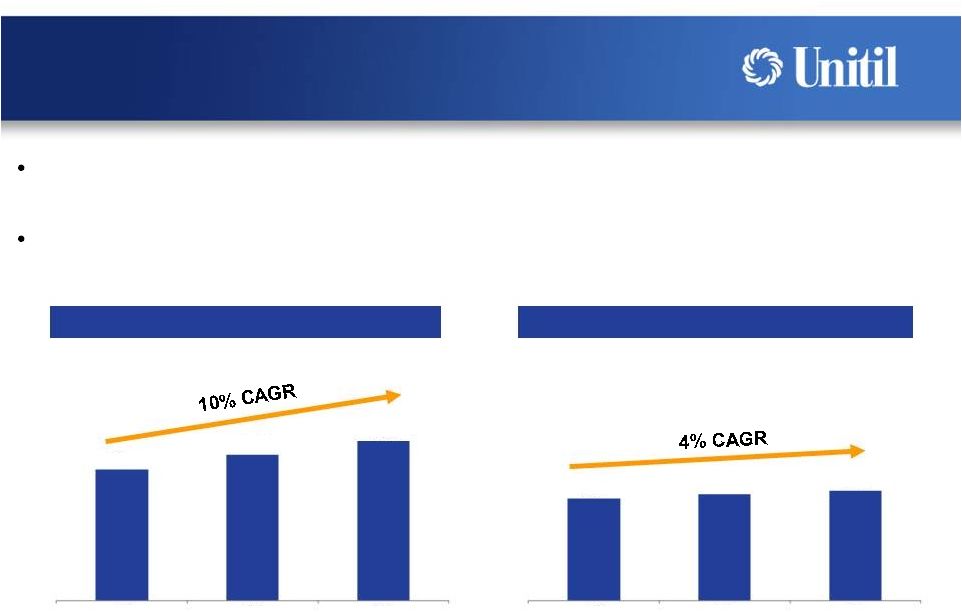 Gas rate base growing at an annual rate of 10% Electric rate base growing at an annual rate of 4% Utility Rate Base Growth 15 ($ in millions) ($ in millions) Gas Rate Base Electric Rate Base $257 $286 $313 $200 $208 $215 2012 2013 2014 2012 2013 2014 |
 Sales and customer growth combined with constructive rate case results and cost trackers continue to drive increases in return on equity Constructive Regulation 16 Return on Equity Achieved ~$60 million (~50% increase to sales margin) in rate relief since 2010 8.0% 8.2% 9.2% 2012 2013 2014 |
 Usource 17 • Manages over $500 million in electric and gas energy contracts in 18 states • Serves over 1,200 customers • $5.7 million of revenue in 2014 • $9.1 million forward book of revenue as of December 31, 2014 • Positioned for sustainable profit growth • 16% profit margin in 2014 Connecticut Minnesota Delaware New Hampshire Florida New Jersey Georgia New York Illinois Ohio Indiana Oklahoma Maine Pennsylvania Maryland Rhode Island Massachusetts Texas Gas & Electric Gas only Competitive Energy Markets Customers |
 18 Dividend Strength Recently increased dividend in Q1 2015 Current quarterly dividend of $0.35 (annual dividend of $1.40 per share) Current dividend yield of ~4% Since incorporation in 1984, Unitil has continuously paid quarterly dividends and has never reduced its dividend rate |
 19 Key Investment Highlights Regulated local distribution utility business model Diversified natural gas and electric sales Growing operations and customer base Regulated rate base growth Strong natural gas system expansion Constructive rate plans and cost trackers Dividend strength Experienced management team |