EXHIBIT 99.1

THIRD QUARTER REPORT 2012
Based on IFRS and expressed in US dollars. For a full explanation of results, the Financial Statements and Management Discussion & Analysis, please see the company’s website,www.barrick.com.
Barrick Announces Third Quarter 2012 Results
TORONTO, November 1, 2012 – Barrick Gold Corporation (NYSE: ABX, TSX: ABX) (Barrick or the “company”) today reported net earnings of $0.62 billion ($0.62 per share) compared to net earnings of $1.37 billion ($1.37 per share) in the same prior year quarter. Adjusted net earnings were $0.85 billion ($0.85 per share)1 compared to $1.38 billion ($1.38 per share) in the third quarter of 2011. Operating cash flow of $1.73 billion and adjusted operating cash flow of $1.27 billion1 for the quarter compared to operating cash flow of $1.90 billion and adjusted operating cash flow of $2.00 billion, respectively, in the same prior year period.
Operating Highlights
| | • | Gold and copper production of 1.78 million ounces and 112 million pounds, respectively | |
| | • | Gold total cash costs of $592 per ounce1 and net cash costs of $537 per ounce1 | |
| | • | Gold total cash margins of $1,063 per ounce1, and net cash margins of $1,118 per ounce1 | |
| | • | C1 cash costs of $2.33 per pound1 and C1 cash margins of $1.19 per pound1 | |
2012 Outlook
| | • | The company expects 2012 gold production of 7.3-7.5 million ounces2, within the original guidance range of 7.3-7.8 million ounces. Total cash costs for gold are anticipated to be $575-$585 per ounce, compared to the previous guidance of $550-$575 per ounce, primarily due to higher cash costs from Australia Pacific and African Barrick Gold (ABG). Net cash costs are anticipated to be $480-$500 per ounce3, within the previous guidance of $460-$500 per ounce. | |
| | • | Full year 2012 copper production is expected to be about 450 million pounds as a result of the delay in first production at Jabal Sayid in Saudi Arabia. C1 cash costs in 2012 are still anticipated to be $2.10-$2.30 per pound. | |
Pueblo Viejo First Gold Production on Schedule and Budget
| | • | During the third quarter, the Pueblo Viejo mine in the Dominican Republic poured its first gold on schedule and within capital guidance. The mine is currently undergoing commissioning, with commercial production anticipated in December 2012. Barrick’s 60 percent share of average annual gold production is anticipated to be 625,000-675,000 ounces at total cash costs of $300-$350 per ounce4 in its first full five years of operation. | |
Pascua-Lama Project Update
| | • | During the quarter, Barrick made substantial progress at Pascua-Lama. Along with construction advancement at site, the company strengthened the construction management team and hired Fluor to assume overall project management. Fluor is a global leader in construction of large mining projects, and the same firm that successfully managed construction of our recently completed Pueblo Viejo mine. | |
| | • | In July, the company announced preliminary results of a review indicating an increase in capital costs to $7.5-$8.0 billion and a delay in first production to mid-2014. Since then, Barrick has been working with Fluor on a more comprehensive top-to-bottom review. This review will be complete by our 2012 year-end results release; however, work to date suggests capital costs will be closer to $8.0-$8.5 billion, with first production in the second half of 2014. | |
Disciplined Capital Allocation Framework
| | • | As a result of Barrick’s on-going portfolio review and cost control focus, the company has cut or deferred approximately $1.0 billion in capex from the initial sustaining and minesite expansion budget for 2013. Despite additional spending at Pascua-Lama, and continued inflationary industry cost pressures, Barrick expects 2013 capex to be largely in line with 2012. | |
| 1 | Adjusted net earnings, adjusted net earnings per share, adjusted operating cash flow, gold total cash costs and net cash costs per ounce, gold total cash margins and net cash margins per ounce, C1 cash costs and C1 cash margins per pound are non-GAAP financial measures. See pages 42-47 of Barrick’s Q3 2012 Report. See page 42 of Barrick’s Q3 2012 report for a change to the definition of adjusted operating cash flow. |
| 2 | All production numbers for Barrick, including expectations for the longer-term outlook, are inclusive of the company’s 73.9% equity interest in ABG. |
| 3 | Based on an assumed realized copper price of $3.50/lb for Q4 2012. |
| 4 | Based on gold and WTI oil price assumptions of $1,300/oz and $90/bbl, respectively. Does not include escalation for future inflation. |
| | | | |
| BARRICK THIRD QUARTER 2012 | | 1 | | PRESS RELEASE |
“We are on track to achieve our production guidance with higher production expected in the fourth quarter,” said Jamie Sokalsky, President and Chief Executive Officer. “Despite some cost pressures, Barrick remains the lowest cost senior gold producer. We poured first gold on schedule and budget at Pueblo Viejo and made substantial progress at Pascua-Lama, which remains our top priority. Both are world-class assets that together are expected to produce about 1.5 million ounces5 at low operating costs. We’re also making progress in support of our disciplined capital allocation framework. We’ve cut or deferred significant capital expenditures that were previously budgeted and we’re continuing to work toward optimizing our asset portfolio. As I have said, returns will drive production; production will not drive returns.”
FINANCIAL RESULTS
Reported net earnings were $0.62 billion or $0.62 per share compared to $1.37 billion or $1.37 per share in the same prior year quarter. Net adjusting items in the quarter totaled $231 million, largely related to:
| | • | $148 million in impairment charges primarily related to an exploration property in Papua New Guinea, acquired as a result of the Kainantu acquisition in 2007; and | |
| | • | $71 million in unrealized losses on non-hedge derivative instruments. | |
Third quarter 2012 adjusted net earnings were $0.85 billion or $0.85 per share compared to $1.38 billion or $1.38 per share in the same prior year period. The lower net earnings and adjusted net earnings primarily reflect lower gold and copper sales volumes, higher cost of sales applicable to gold, and lower realized gold prices.
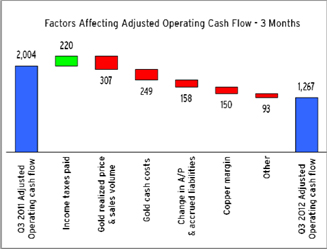
Operating cash flow of $1.73 billion and adjusted operating cash flow of $1.27 billion for the quarter compare to operating cash flow of $1.90 billion and adjusted operating cash flow of $2.00 billion, respectively, in the third quarter of 2011. Adjusted operating cash flow excludes the impact of approximately $0.5 billion of net proceeds related to the settlement of a portion of our Australian dollar hedge positions.
| 5 | Based on Barrick’s share of the estimated combined average annual production in the first full five years of operation. |
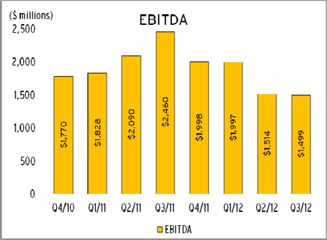
Third quarter EBITDA was $1.50 billion6 compared to $2.46 billion in the same prior year period, reflecting the same factors affecting net earnings.
The third quarter realized gold price was $1,655 per ounce6, five percent lower than the same prior year quarter. Gold total cash margins and net cash margins were $1,063 per ounce and $1,118 per ounce, respectively, compared to $1,290 per ounce and $1,420 per ounce in the third quarter of 2011. C1 cash margins were $1.19 per pound compared to $1.71 per pound in the prior year period. C1 cash costs of $2.33 per pound compared to $1.83 per pound in the prior year period as lower cost production from the Zaldívar mine contributed to a lesser proportion of total copper sales. During the third quarter, sales from Zaldívar were impacted by a labor strike at the port of Antofagasta, which delayed shipment of 26 million pounds. The strike has ended and these sales will be recorded in the fourth quarter.
OPERATING RESULTS
North America Regional Business Unit
The North America Regional Business Unit (RBU) produced 0.80 million ounces at total cash costs of $508 per ounce in the third quarter. Cortez produced 0.23 million ounces at total cash costs of $293 per ounce, in line with expectations, and is anticipated to return to higher production levels in the fourth quarter primarily as a result of mine sequencing.
Goldstrike production of 0.35 million ounces at total cash costs of $507 per ounce benefited, as anticipated, from increased productivity following maintenance improvements in the first half of the year and from access to higher grades in the open pit. We expect full year production for the region to be 3.425-3.55 million ounces at total cash costs of $475-$525 per ounce, both within the previous guidance ranges.
South America Regional Business Unit
South America produced 0.39 million ounces at total cash costs of $440 per ounce in the third quarter. The Veladero mine produced 0.17 million ounces at total cash costs of $523 per ounce, reflecting the impact of lower recoveries due to lower leach pad kinetics during the
| 6 | EBITDA and realized gold price per ounce are non-GAAP financial measures. See pages 42-47 of Barrick’s Q3 2012 Report. |
| | | | |
| BARRICK THIRD QUARTER 2012 | | 2 | | PRESS RELEASE |
third quarter. Leach recoveries have improved with higher solution rates and better ore permeability, which is expected to continue and result in higher fourth quarter production. Lagunas Norte produced 0.19 million ounces at total cash costs of $337 per ounce with access to higher grades following the completion of pit dewatering. We expect full year production for the region to be 1.55-1.65 million ounces at total cash costs of $430-$480 per ounce, both within the previous guidance ranges.
Australia Pacific Regional Business Unit
Australia Pacific produced 0.48 million ounces at total cash costs of $815 per ounce in the third quarter. The Porgera mine produced 0.12 million ounces at total cash costs of $1,026 per ounce, primarily reflecting lower equipment availability and lower underground tons mined. Full year production for Australia Pacific is expected to be about 1.80 million ounces at total cash costs of approximately $800 per ounce, both in line with previous guidance.
African Barrick Gold plc
Third quarter attributable production from ABG was 0.11 million ounces at total cash costs of $965 per ounce. Production and cash costs have been mainly impacted by mill maintenance shutdowns and lower grades at Buzwagi together with equipment availability issues at Bulyanhulu. While production from North Mara was in line with expectations during the quarter, lower equipment availability has delayed access to higher grade ore. As a result, Barrick’s share of 2012 production is expected to be 5-10 percent below the low end of the previous guidance range of 0.500-0.535 million ounces, at total cash costs of $900-$950 per ounce, compared to the previous guidance of $790-$860 per ounce.
Copper
During the third quarter, Barrick strengthened its Global Copper Business Unit (CBU) in line with its objective of maximizing returns and free cash flow from its assets. The changes will further assist in efforts to address the near-term challenges at Lumwana and Jabal Sayid and to evaluate the expansion opportunities at Lumwana and Zaldívar. The copper assets now report to a new senior leadership team led by a CBU President, Mark Fisher. Mr.
Fisher and his team will focus exclusively on optimizing the copper business. “Mark has been an exceptional leader at various large scale Barrick operations and has over 30 years of global mining experience,” said Jamie Sokalsky. “I am confident that this new team is best positioned to maximize the value of the copper assets in the CBU through the realization of operational efficiencies and synergies, and its dedicated focus on managing all aspects of this significant business.”
The Zaldívar copper mine in Chile produced 66 million pounds at C1 cash costs of $1.63 per pound in the third quarter. The Lumwana mine in Zambia produced 45 million pounds of copper at C1 cash costs of $2.90 per pound.
Expected 2012 production for Lumwana is 155-165 million pounds, within prior guidance of 145-165 million pounds, at previously guided C1 cash costs of $3.30-$3.50 per pound. In the second quarter of 2012, we determined the need to advance a number of key initiatives in an effort to achieve better longer-term results. The migration to an owner maintained operation to improve maintenance practices and equipment availability is progressing. Additional staffing and training is underway and maintenance technicians have been redeployed from other sites to assist with the transition. Infrastructure improvements to help mitigate the impact of the annual rainy season have been completed.
Overall higher grades at Lumwana are expected in 2013, with production anticipated to be about 250 million pounds at lower C1 cash costs. The scale of the Chimiwungo ore body is expected to allow for more productive mining and it will be the primary future supply of ore for the operation. Exploration results to date continue to confirm the upside potential of Chimiwungo. We are nearing completion of a substantial in-fill drilling program to provide a more precise model of the ore body for mine planning purposes. We continue to expect completion of these programs at the end of the year and the results will form the basis for an updated resource base and life-of-mine plan. They will also be incorporated into a prefeasibility study on the expansion opportunity for Lumwana, which has the potential to double processing rates.
At the recently constructed Jabal Sayid copper mine, a dedicated EPCM team is working toward achieving full
| | | | |
| BARRICK THIRD QUARTER 2012 | | 3 | | PRESS RELEASE |
compliance with standards for safety and security in order to commence production. During the quarter, the company was notified the operation is not in compliance with standards for safety and security in Saudi Arabia. The previous owner originally designed the mine in compliance with Western Australia standards. The operation is currently expected to achieve full compliance in 2014, at which time production will start. Initial testing has been completed and about 440,000 tonnes of ore at an average grade of 2.25% copper have been stockpiled to date. Average annual production from Jabal Sayid is expected to be 100-130 million pounds at C1 cash costs of $1.50-$1.70 per pound7 in its first full five years of operation. Total project capital expenditures are still anticipated to be about $400 million8.
The company has floor protection on approximately 60 percent of its expected copper production for the remainder of 2012 at an average floor price of $3.75 per pound9 and has full participation to any upside in copper prices.
COST MANAGEMENT
Barrick continues to employ key risk management strategies, which have helped manage our cost exposures, maximize margins and give predictability to our earnings.
The largest currency exposure for the company is the Australian dollar/US dollar exchange rate. During the quarter, with the Australian dollar trading at historically elevated levels against the US dollar, and based on our currency outlook, the company opportunistically unwound approximately AUD$2.6 billion of our Australian dollar hedges at an average spot price of $1.05. We realized net cash proceeds of approximately $0.5 billion upon the settlement of these contracts in the third quarter. The corresponding accounting gains will be recognized in the consolidated statement of income based on the original hedge contract maturity dates, which are between 2012 and 2014, with locked-in gains of approximately $90 million, $280 million, and $110 million positively impacting our total reported cash costs per ounce in Q4 2012, 2013 and 2014, respectively. For the remainder of 2012, every $0.01 movement in the Australian dollar will have a $2 per ounce impact on our consolidated total cash costs. As of
| 7 | Does not include escalation for future inflation. |
| 8 | Does not include escalation for future inflation. |
| 9 | The average realized price on total 2012 production is expected to be reduced by approximately $0.17 per pound as a result of the net premium paid for these positions. |
the end of the third quarter, the company continues to have approximately AUD$1.8 billion hedged, primarily in 2014-2016, at an average rate of about $0.92.
The company has largely mitigated the direct impact of higher crude oil prices through the use of financial contracts and production from Barrick Energy. The contribution from Barrick Energy, along with the financial contracts, provides hedge protection for approximately 75 percent of the expected remaining 2012 fuel consumption.
EXPLORATION UPDATE
The 2012 exploration guidance is $450-$490 million10. We have over 100 exploration drill rigs operating globally, with over one third of these operating at Goldrush and Lumwana.
In Nevada, over 50 drill rigs are currently operating, 12 of which are located at Goldrush. Drilling continues to expand the footprint. The mineralized corridor has now almost doubled, delineated along seven kilometers in strike length. The scale and continuity of the system, and the extent of high grade zones being defined, is providing multiple development scenarios. Based on results to date, we expect significant increases in the already defined indicated and inferred resources by the end of 2012.
At Lumwana, the full contingent of 25 exploration drill rigs is operating at Chimiwungo. As the in-fill drilling program nears completion, results are expected to increase reserves by the end of 2012.
PROJECT UPDATE
Pueblo Viejo
During the third quarter, Pueblo Viejo poured first gold on schedule and within capital guidance of $3.6-$3.8 billion (100% basis). The company’s 60 percent share of annual gold production in the first full five years of operation is expected to average 625,000-675,000 ounces at total cash costs of $300-$350 per ounce11.
The mine is ramping up to commercial production, which is expected in December 2012. Pueblo Viejo is anticipated to produce about 80,000 ounces of gold to Barrick in 2012, however, actual results will vary depending on how the ramp up progresses.
| 10 | Barrick’s exploration programs are designed and conducted under the supervision of Robert Krcmarov, Senior Vice President, Global Exploration of Barrick. |
| 11 | Based on gold and WTI oil price assumptions of $1,300/oz and $90/bbl, respectively. Does not include escalation for future inflation. |
| | | | |
| BARRICK THIRD QUARTER 2012 | | 4 | | PRESS RELEASE |
As part of planned start up activities, the first three autoclaves have been tested at 50 percent to 100 percent of design capacity, with results that are in line with expectations for the initial ramp up period. The fourth autoclave is currently undergoing pre-commissioning testing, prior to planned commissioning in the fourth quarter. Construction of the tailings starter dam achieved its full height of 182.5 meters and the oxygen plant has been commissioned. Over 2.0 million contained ounces of gold have been stockpiled to date. The operations staff have been hired and trained by experienced personnel from our North America RBU.
Construction progress also continued on a 215 MW dual fuel power plant at an estimated net incremental cost of approximately $300 million (100 percent basis) or $180 million (Barrick’s 60 percent share). The power plant is expected to commence operations in 2013 utilizing heavy fuel oil, but have the ability to subsequently transition to lower cost liquid natural gas.
Pascua-Lama
Pascua-Lama is expected to be one of the world’s largest, lowest cost mines and, once in production, is expected to contribute significant free cash flow to the company for many years to come.
During the third quarter, we strengthened the project management and construction teams, and made significant progress in a number of key areas:
| | • | commenced transfer of project management from Barrick to Fluor, the leading global EPCM contractor that successfully managed our recently completed Pueblo Viejo project; | |
| | • | reorganized and strengthened the Barrick project team, including a new project director and the hiring of experienced construction industry experts to improve the oversight and leadership of the project; | |
| | • | increased the quantity and quality of skilled labor, with approximately 1,900 new hires over the past quarter primarily from the province of San Juan and the rest of Argentina; | |
| | • | advanced review of all major contracts, material quantities and prices, unit costs, installation rates and productivity; and | |
| | • | progressed a detailed review of project schedule, including related logistics (e.g. transportation, camps). | |
To date, approximately $3.7 billion has been spent. The tunnel is approximately 60 percent complete and 90 percent of the required material and equipment for the process plant has been committed. Plans are progressing to increase the camp capacity to provide additional project construction flexibility.
As disclosed with Barrick’s second quarter report, preliminary results of a review indicated an increase in capital costs to $7.5-$8.0 billion and a delay in first production to mid-2014. Since then, the company has been working with Fluor to carry out a more comprehensive top-to-bottom review. This review will be complete by our 2012 year-end results release; however, work to date suggests capital costs will be closer to $8.0-$8.5 billion, with first production in the second half of 2014.
Delays in the earthworks and underground works for the process plant are the main reason for the shift in schedule to the second half of 2014. The indicated increase in capital costs is split, roughly evenly, among: i) the impact of the delay of first gold to the second half of 2014; ii) increased labor hours and installation rates after being reviewed in more detail with Fluor during this quarter; and iii) incremental payments to Fluor to assume project and additional construction management, as well as increased incentives for Fluor and other contractors to come in on time and on budget.
Pascua-Lama is a world class resource of nearly 18 million ounces of proven and probable gold reserves and 676 million ounces of silver contained within the gold reserves and a mine life of 25 years. It is expected to produce an average of 800,000-850,000 ounces of gold and 35 million ounces of silver in its first full five years of production. Expected total cash costs remain in the range of $0 to negative $150 per ounce12 using a silver price assumption of $25 per ounce. The company expects to update production and total cash cost guidance for Pascua-Lama with its year-end 2012 results.
| 12 | First full five year average. Based on gold, silver and WTI oil price assumptions of $1,300/oz, $25/oz and $90/bbl, respectively, and assuming a Chilean Peso assumption of 475:1. Inflation escalation assumptions are as of Q2 2012, and do not include escalation for future inflation. |
| | | | |
| BARRICK THIRD QUARTER 2012 | | 5 | | PRESS RELEASE |
2012 OUTLOOK
Barrick expects 2012 gold production of 7.3-7.5 million ounces, within its original guidance of 7.3-7.8 million ounces.
Total cash costs for gold are anticipated to be $575-$585 per ounce, compared to the previous guidance of $550-$575 per ounce, primarily as a result of higher cash costs from Australia Pacific and ABG. Net cash costs are expected to be $480-$500 per ounce, within the previous guidance of $460-$500 per ounce.
Full year 2012 copper production is expected to be about 450 million pounds, as a result of the delay in first production at Jabal Sayid. C1 cash costs in 2012 are still anticipated to be $2.10-$2.30 per pound.
DISCIPLINED CAPITAL ALLOCATION FRAMEWORK
Barrick’s renewed focus on maximizing shareholder value will be achieved through a disciplined approach to capital allocation based on maximizing returns on investment and free cash flow. Under this approach, all capital allocation options, which include organic investment in exploration and projects, and acquisitions or divestitures to improve the quality of our portfolio, will be assessed on the basis of maximizing risk-adjusted returns. Our increased emphasis on free cash flow will position the company, in the future, with the potential to return more capital to shareholders, repay debt, and make additional attractive return investments to upgrade our portfolio.
In June 2012, we initiated a full review of our operations and projects. This portfolio review is an ongoing, dynamic process. Cost control is also a vital part of this review and an integral component of our capital allocation framework. The company has been reviewing company-wide costs and evaluating ways to reduce these, including sustaining capital and general and administrative expenses.
Barrick has made significant progress in support of its renewed focus on disciplined capital allocation. In the second quarter:
| | • | The company cut or deferred about $3 billion in capex that was budgeted over a four year period as a result of recalibrating longer-term production to higher quality, more profitable levels. | |
| | ¡ | | Annual gold production is expected to be about 8 million ounces by 2016. |
| | ¡ | | Annual copper production is expected to be about 600 million pounds by 2015 with the |
| | | opportunity to increase to more than 1 billion pounds if we proceed with the Zaldívar sulfides and Lumwana expansions. |
During the third quarter:
| | • | Barrick cut or deferred about $1.0 billion in capex from the initial sustaining and minesite expansion budget for 2013 as a result of the company’s ongoing portfolio review and cost control focus. Despite additional spending at Pascua-Lama, and continued inflationary industry cost pressures, Barrick expects 2013 capex to be largely in line with 2012. | |
| | • | Barrick confirmed it entered into discussions with China National Gold Group related to the potential sale of its 73.9% equity holding in ABG, which is in line with the focus on portfolio optimization. | |
* * * *
Barrick’s vision is to be the world’s best gold company by finding, acquiring, developing and producing quality reserves in a safe, profitable and socially responsible manner. Barrick’s shares are traded on the Toronto and New York stock exchanges.
| | | | |
| BARRICK THIRD QUARTER 2012 | | 6 | | PRESS RELEASE |
Key Statistics
| | | | | | | | | | | | | | | | |
Barrick Gold Corporation (in United States dollars) | | Three months ended
September 30, | | | Nine months ended
September 30, | |
| (Unaudited) | | 2012 | | | 2011 | | | 2012 | | | 2011 | |
Operating Results | | | | | | | | | | | | | | | | |
Gold production (thousands of ounces)1 | | | 1,779 | | | | 1,928 | | | | 5,402 | | | | 5,862 | |
Gold sold (thousands of ounces) | | | 1,792 | | | | 1,908 | | | | 5,265 | | | | 5,685 | |
Per ounce data | | | | | | | | | | | | | | | | |
Average spot gold price | | $ | 1,652 | | | $ | 1,702 | | | $ | 1,652 | | | $ | 1,534 | |
Average realized gold price2 | | | 1,655 | | | | 1,743 | | | | 1,652 | | | | 1,550 | |
Net cash costs2 | | | 537 | | | | 323 | | | | 501 | | | | 322 | |
Total cash costs2 | | | 592 | | | | 453 | | | | 584 | | | | 445 | |
Depreciation3 | | | 190 | | | | 153 | | | | 184 | | | | 149 | |
Other4 | | | 11 | | | | 16 | | | | 12 | | | | 16 | |
Total production costs | | | 793 | | | | 622 | | | | 780 | | | | 610 | |
Copper credits | | | 55 | | | | 130 | | | | 83 | | | | 123 | |
Copper production (millions of pounds) | | | 112 | | | | 140 | | | | 338 | | | | 308 | |
Copper sold (millions of pounds) | | | 84 | | | | 146 | | | | 318 | | | | 309 | |
Per pound data | | | | | | | | | | | | | | | | |
Average spot copper price | | $ | 3.50 | | | $ | 4.07 | | | $ | 3.61 | | | $ | 4.20 | |
Average realized copper price2 | | | 3.52 | | | | 3.54 | | | | 3.59 | | | | 3.87 | |
C1 cash costs2 | | | 2.33 | | | | 1.83 | | | | 2.22 | | | | 1.60 | |
Depreciation3 | | | 0.53 | | | | 0.29 | | | | 0.50 | | | | 0.27 | |
Other5 | | | 0.42 | | | | 0.58 | | | | 0.22 | | | | 0.34 | |
C3 fully allocated costs2 | | | 3.28 | | | | 2.70 | | | | 2.94 | | | | 2.21 | |
Financial Results (millions) | | | | | | | | | | | | | | | | |
Revenues | | $ | 3,436 | | | $ | 3,971 | | | $ | 10,358 | | | $ | 10,474 | |
Net earnings6 | | | 618 | | | | 1,365 | | | | 2,397 | | | | 3,525 | |
Adjusted net earnings2 | | | 849 | | | | 1,379 | | | | 2,719 | | | | 3,500 | |
EBITDA2 | | | 1,499 | | | | 2,460 | | | | 5,010 | | | | 6,378 | |
Operating cash flow | | | 1,732 | | | | 1,902 | | | | 3,767 | | | | 4,091 | |
Adjusted operating cash flow2 | | | 1,267 | | | | 2,004 | | | | 3,404 | | | | 4,381 | |
Per Share Data (dollars) | | | | | | | | | | | | | | | | |
Net earnings (basic) | | | 0.62 | | | | 1.37 | | | | 2.40 | | | | 3.53 | |
Adjusted net earnings (basic)2 | | | 0.85 | | | | 1.38 | | | | 2.72 | | | | 3.50 | |
Net earnings (diluted) | | | 0.62 | | | | 1.36 | | | | 2.40 | | | | 3.52 | |
Weighted average basic common shares (millions) | | | 1,001 | | | | 999 | | | | 1,001 | | | | 999 | |
Weighted average diluted common shares (millions)7 | | | 1,001 | | | | 1,001 | | | | 1,001 | | | | 1,001 | |
| | | | | | | | | As at | | | As at | |
| | | | | | | | | September 30, | | | December 31, | |
| | | | | | | | | 2012 | | | 2011 | |
Financial Position (millions) | | | | | | | | | | | | | | | | |
Cash and equivalents | | | | | | | | | | $ | 2,530 | | | $ | 2,745 | |
Non-cash working capital | | | | | | | | | | | 2,890 | | | | 2,335 | |
Adjusted debt2 | | | | | | | | | | | 13,681 | | | | 13,058 | |
Net debt2 | | | | | | | | | | | 11,169 | | | | 10,320 | |
Average shareholders’ equity | | | | | | | | | | | 24,268 | | | | 21,418 | |
| 1 | Production includes our equity share of gold production at Highland Gold up to April 26, 2012, the effective date of our sale of Highland Gold. |
| 2 | Realized price, net cash costs, total cash costs, C1 cash costs, C3 fully allocated costs, adjusted net earnings, EBITDA, adjusted operating cash flow, adjusted debt, and net debt are non-GAAP financial performance measures with no standard definition under IFRS. See pages 42-47 of the Company’s MD&A. |
| 3 | Represents equity depreciation expense divided by equity ounces of gold sold or pounds of copper sold. |
| 4 | Represents the Barrick Energy gross margin divided by equity ounces of gold sold. |
| 5 | For a breakdown, see reconciliation of cost of sales to C1 cash costs and C3 fully allocated costs per pound on page 45 of the Company’s MD&A. |
| 6 | Net earnings represents net income attributable to the equity holders of the Company. |
| 7 | Fully diluted includes dilutive effect of stock options. |
| | | | |
| BARRICK THIRD QUARTER 2012 | | 7 | | SUMMARY INFORMATION |
Production and Cost Summary
| | | | | | | | | | | | | | | | | | | | | | | | | | | | | | | | |
| | | Gold Production (attributable ounces) (000’s) | | | Total Cash Costs ($/oz) | |
| | | | | | | | |
| | | Three months ended
September 30, | | | Nine months ended
September 30, | | | Three months ended
September 30, | | | Nine months ended
September 30, | |
| | | | | | | | | | | | | | | | |
| (Unaudited) | | 2012 | | | 2011 | | | 2012 | | | 2011 | | | 2012 | | | 2011 | | | 2012 | | | 2011 | |
| | | | | | | | | | | | | |
Gold | | | | | | | | | | | | | | | | | | | | | | | | | | | | | | | | |
North America | | | 795 | | | | 836 | | | | 2,537 | | | | 2,621 | | | $ | 508 | | | $ | 415 | | | $ | 506 | | | $ | 405 | |
South America | | | 394 | | | | 475 | | | | 1,172 | | | | 1,426 | | | | 440 | | | | 358 | | | | 437 | | | | 358 | |
Australia Pacific | | | 481 | | | | 472 | | | | 1,352 | | | | 1,394 | | | | 815 | | | | 609 | | | | 804 | | | | 601 | |
African Barrick Gold1 | | | 109 | | | | 135 | | | | 329 | | | | 391 | | | | 965 | | | | 687 | | | | 946 | | | | 666 | |
Other2 | | | - | | | | 10 | | | | 12 | | | | 30 | | | | - | | | | - | | | | - | | | | - | |
| |
Total | | | 1,779 | | | | 1,928 | | | | 5,402 | | | | 5,862 | | | $ | 592 | | | $ | 453 | | | $ | 584 | | | $ | 445 | |
| |
| | | | | | | | | | | | | | | | | | | | | | | | | | | | | | | | | | |
| | | Copper Production (attributable pounds) (Millions) | | | | | C1 Cash Costs ($/lb) | |
| | | Three months ended
September 30, | | | Nine months ended
September 30, | | | | | Three months ended
September 30, | | | Nine months ended
September 30, | |
| | | | | | | | | | | | | | | | | | |
(Unaudited) | | | 2012 | | | | 2011 | | | | 2012 | | | | 2011 | | | | | | 2012 | | | | 2011 | | | | 2012 | | | | 2011 | |
| |
Total | | | 112 | | | | 140 | | | | 338 | | | | 308 | | | | | $ | 2.33 | | | $ | 1.83 | | | $ | 2.22 | | | $ | 1.60 | |
| |
| | | | | | | | | | | | | | | | |
| | | Total Gold Production Costs ($/oz) | |
| | | Three months ended
September 30, | | | Nine months ended
September 30, | |
| | | | | | | | |
(Unaudited) | | | 2012 | | | | 2011 | | | | 2012 | | | | 2011 | |
Direct mining costs at market foreign exchange rates | | $ | 617 | | | $ | 500 | | | $ | 618 | | | $ | 493 | |
Gains realized on currency hedge and commodity hedge/economic hedge contracts | | | (46 | ) | | | (58 | ) | | | (48 | ) | | | (53 | ) |
Other3 | | | (11 | ) | | | (16 | ) | | | (12 | ) | | | (16 | ) |
By-product credits | | | (16 | ) | | | (18 | ) | | | (17 | ) | | | (18 | ) |
Copper credits | | | (55 | ) | | | (130 | ) | | | (83 | ) | | | (123 | ) |
| | | | | |
Cash operating costs, net basis | | | 489 | | | | 278 | | | | 458 | | | | 283 | |
Royalties | | | 48 | | | | 45 | | | | 43 | | | | 39 | |
Net cash costs4 | | | 537 | | | | 323 | | | | 501 | | | | 322 | |
Copper credits | | | 55 | | | | 130 | | | | 83 | | | | 123 | |
Total cash costs4 | | | 592 | | | | 453 | | | | 584 | | | | 445 | |
Depreciation | | | 190 | | | | 153 | | | | 184 | | | | 149 | |
Other3 | | | 11 | | | | 16 | | | | 12 | | | | 16 | |
Total production costs | | $ | 793 | | | $ | 622 | | | $ | 780 | | | $ | 610 | |
| | | | | | | | | | | | | | | | |
| | | Total Copper Production Costs ($/lb) | |
| | | Three months ended
September 30, | | | Nine months ended
September 30, | |
| | | | | | | | |
(Unaudited) | | | 2012 | | | | 2011 | | | | 2012 | | | | 2011 | |
C1 cash costs4 | | $ | 2.33 | | | $ | 1.83 | | | $ | 2.22 | | | $ | 1.60 | |
Depreciation | | | 0.53 | | | | 0.29 | | | | 0.50 | | | | 0.27 | |
Other5 | | | 0.42 | | | | 0.58 | | | | 0.22 | | | | 0.34 | |
C3 fully allocated costs4 | | $ | 3.28 | | | $ | 2.70 | | | $ | 2.94 | | | $ | 2.21 | |
| |
| 1 | Figures relating to African Barrick Gold are presented on a 73.9% basis, which reflects our equity share of production. |
| 2 | Includes our equity share of gold production at Highland Gold up to April 26, 2012, the effective date of our sale of Highland Gold. |
| 3 | Represents the Barrick Energy gross margin divided by equity ounces of gold sold. |
| 4 | Total cash costs, net cash costs, C1 cash costs and C3 fully allocated costs are non-GAAP financial performance measures with no standard meaning under IFRS. See pages 44-45 of the Company’s MD&A. |
| 5 | For a breakdown, see reconciliation of cost of sales to C1 cash costs and C3 fully allocated costs per pound on page 45 of the Company’s MD&A. |
| | | | |
| BARRICK THIRD QUARTER 2012 | | 8 | | SUMMARY INFORMATION |
MANAGEMENT’S DISCUSSION AND ANALYSIS (“MD&A”)
This portion of the Quarterly Report provides management’s discussion and analysis (“MD&A”) of the financial condition and results of operations to enable a reader to assess material changes in financial condition and results of operations as at and for the three and nine month periods ended September 30, 2012, in comparison to the corresponding prior–year periods. The MD&A is intended to help the reader understand Barrick Gold Corporation (“Barrick”, “we”, “our” or the “Company”), our operations, financial performance and present and future business environment. This MD&A, which has been prepared as of October 31, 2012, is intended to supplement and complement the condensed unaudited interim consolidated financial statements and notes thereto, prepared in accordance with International Accounting Standard 34 Interim Financial Reporting (“IAS 34”) as issued by the International Accounting Standards Board (“IASB”), for the three and nine month periods ended September 30, 2012 (collectively, the “Financial Statements”), which are included in this Quarterly Report on pages 48 to 71. You are encouraged to review the Financial Statements in conjunction with your review of this MD&A. This MD&A should be read in
conjunction with both the annual audited consolidated financial statements for the two years ended December 31, 2011, the related annual MD&A included in the 2011 Annual Report, and the most recent Form 40–F/Annual Information Form on file with the US Securities and Exchange Commission (“SEC”) and Canadian provincial securities regulatory authorities. Certain notes to the Financial Statements are specifically referred to in this MD&A and such notes are incorporated by reference herein. All dollar amounts in this MD&A are in millions of US dollars, unless otherwise specified.
For the purposes of preparing our MD&A, we consider the materiality of information. Information is considered material if: (i) such information results in, or would reasonably be expected to result in, a significant change in the market price or value of our shares; or (ii) there is a substantial likelihood that a reasonable investor would consider it important in making an investment decision; or (iii) it would significantly alter the total mix of information available to investors. We evaluate materiality with reference to all relevant circumstances, including potential market sensitivity.
CAUTIONARY STATEMENT ON FORWARD-LOOKING INFORMATION
Certain information contained or incorporated by reference in this MD&A, including any information as to our strategy, projects, plans or future financial or operating performance, constitutes "forward-looking statements". All statements, other than statements of historical fact, are forward-looking statements. The words "believe", "expect", "anticipate", "contemplate", "target", "plan", "intend", "continue", "budget", "estimate", "may", "will", "schedule" and similar expressions identify forward-looking statements. Forward-looking statements are necessarily based upon a number of estimates and assumptions that, while considered reasonable by the Company, are inherently subject to significant business, economic and competitive uncertainties and contingencies. Known and unknown factors could cause actual results to differ materially from those projected in the forward-looking statements. Such factors include, but are not limited to: fluctuations in the spot and forward price of gold and copper or certain other commodities (such as silver, diesel fuel and electricity); diminishing quantities or grades of reserves; the impact of inflation; changes in national and local government legislation, taxation, controls, regulations, expropriation or nationalization of property and political or economic developments in Canada, the United States, Dominican Republic, Australia, Papua New Guinea, Chile, Peru, Argentina, Tanzania, Zambia, Saudi Arabia, United Kingdom, Pakistan or Barbados or other countries in which we do or may carry on business in the future; the
impact of global liquidity and credit availability on the timing of cash flows and the values of assets and liabilities based on projected future cash flows; fluctuations in the currency markets (such as Canadian and Australian dollars, Chilean and Argentinean peso, British pound, Peruvian sol, Zambian kwacha, South African rand, Tanzanian shilling, and Papua New Guinean kina versus the US dollar); changes in US dollar interest rates that could impact the mark-to-market value of outstanding derivative instruments and ongoing payments/receipts under interest rate swaps and variable rate debt obligations; risks arising from holding derivative instruments (such as credit risk, market liquidity risk and mark-to-market risk); risk of loss due to acts of war, terrorism, sabotage and civil disturbances; business opportunities that may be presented to, or pursued by, the Company; our ability to successfully integrate acquisitions or complete divestitures; operating or technical difficulties in connection with mining or development activities; employee relations; availability and increased costs associated with mining inputs and labor; increased costs and technical challenges associated with the construction of capital projects; litigation; the speculative nature of mineral exploration and development, including the risks of obtaining necessary licenses and permits; adverse changes in our credit rating; contests over title to properties, particularly title to undeveloped properties; and the organization of our previously held African gold
| | | | |
| BARRICK THIRD QUARTER 2012 | | 9 | | MANAGEMENT’S DISCUSSION AND ANALYSIS |
operations and properties under a separate listed company. In addition, there are risks and hazards associated with the business of mineral exploration, development and mining, including environmental hazards, industrial accidents, unusual or unexpected formations, pressures, cave-ins, flooding and gold bullion or copper cathode losses (and the risk of inadequate insurance, or inability to obtain insurance, to cover these risks). Many of these uncertainties and contingencies can affect our actual results and could cause actual results to differ materially from those expressed or implied in any forward-looking statements made by, or on behalf of, us. Readers are cautioned that forward-looking statements are not guarantees of future performance. All of the forward-looking statements made in this MD&A are qualified by these cautionary statements. Specific reference is made to the most recent Form 40-F/Annual Information Form on file with the SEC and Canadian provincial securities regulatory authorities for a discussion of some of the factors underlying forward-looking statements. We disclaim any intention or obligation to update or revise any forward-looking statements whether as a result of new information, future events or otherwise, except as required by applicable law.
Changes in Presentation of Non-GAAP Financial Performance Measures
We use certain non-GAAP financial performance measures in our MD&A. For a detailed reconciliation of each of the non-GAAP measures used in this MD&A, please see the discussion under “Non-GAAP Financial Performance Measures” beginning on page 42 of our MD&A.
Adjusted Operating Cash Flow
Starting in this MD&A, we have adjusted our operating cash flow to remove the effect of the “settlement of currency contracts”. This settlement activity is not reflective of the underlying capacity of our operations to generate operating cash flow on a recurring basis, and therefore this adjustment will result in a more meaningful operating cash flow measure for investors and analysts to evaluate our performance in the period and assess our future operating cash flow generating capability. We believe that this change is consistent with our definition of adjusted operating cash flow, as described in the Non-GAAP Financial Performance Measures in our 2011 annual MD&A.
| | | | |
| |
| INDEX | | | |
| |
| | | page | |
Financial and Operating Highlights | | | | |
2012 Third Quarter Results | | | 11 | |
Business Overview, Outlook and Market Review | | | 13 | |
| |
Financial and Operating Results | | | | |
Summary of Operating Results | | | 20 | |
Summary Cash Flow Performance | | | 22 | |
Key Operating Performance Metrics | | | 23 | |
Mining Overview | | | 26 | |
Review of Operating Segment Results | | | 27 | |
| |
Financial Condition Review | | | | |
Balance Sheet Review | | | 34 | |
Financial Position and Liquidity | | | 35 | |
Financial Instruments | | | 37 | |
Commitments and Contingencies | | | 39 | |
| |
Review of Quarterly Results | | | 40 | |
| |
IFRS Critical Accounting Policies and Accounting Estimates | | | 40 | |
| |
Non-GAAP Financial Performance Measures | | | 42 | |
| | | | |
| BARRICK THIRD QUARTER 2012 | | 10 | | MANAGEMENT’S DISCUSSION AND ANALYSIS |
FINANCIAL AND OPERATING HIGHLIGHTS
Summary of Financial and Operating Data
| | | | | | | | | | | | | | | | |
| | | For the three months ended September 30 | | | For the nine months ended September 30 | |
| ($ millions, except where indicated) | | 2012 | | | 2011 | | | 2012 | | | 2011 | |
Financial Data | | | | | | | | | | | | | | | | |
Revenue | | | $ 3,436 | | | | $3,971 | | | | $ 10,358 | | | | $10,474 | |
Net earnings1 | | | 618 | | | | 1,365 | | | | 2,397 | | | | 3,525 | |
Per share (“EPS”)2 | | | 0.62 | | | | 1.37 | | | | 2.40 | | | | 3.53 | |
Adjusted net earnings3 | | | 849 | | | | 1,379 | | | | 2,719 | | | | 3,500 | |
Per share (“adjusted EPS”)2,3 | | | 0.85 | | | | 1.38 | | | | 2.72 | | | | 3.50 | |
EBITDA3 | | | 1,499 | | | | 2,460 | | | | 5,010 | | | | 6,378 | |
Total consolidated project capital expenditures | | | 670 | | | | 565 | | | | 1,919 | | | | 1,612 | |
Total capital expenditures – expansion, sustaining, and open pit & underground mine development | | | 812 | | | | 733 | | | | 2,206 | | | | 1,664 | |
Operating cash flow | | | 1,732 | | | | 1,902 | | | | 3,767 | | | | 4,091 | |
Adjusted operating cash flow3 | | | 1,267 | | | | 2,004 | | | | 3,404 | | | | 4,381 | |
Adjusted operating cash flow before working capital changes3 | | | 1,300 | | | | 1,984 | | | | 3,696 | | | | 4,455 | |
Free cash flow3 | | | (191 | ) | | | 573 | | | | (772 | ) | | | 1,014 | |
| | | | | |
| | | | | | | | | | | | | | | | | |
Operating Data | | | | | | | | | | | | | | | | |
| | | | |
Gold | | | | | | | | | | | | | | | | |
Gold produced (000s ounces)4 | | | 1,779 | | | | 1,928 | | | | 5,402 | | | | 5,862 | |
Gold sold (000s ounces) | | | 1,792 | | | | 1,908 | | | | 5,265 | | | | 5,685 | |
Realized price ($ per ounce)3 | | | $ 1,655 | | | | $1,743 | | | | $ 1,652 | | | | $1,550 | |
Net cash costs ($ per ounce)3 | | | $537 | | | | $323 | | | | $ 501 | | | | $322 | |
Total cash costs ($ per ounce)3 | | | $592 | | | | $453 | | | | $ 584 | | | | $445 | |
Copper | | | | | | | | | | | | | | | | |
Copper produced (millions of pounds) | | | 112 | | | | 140 | | | | 338 | | | | 308 | |
Copper sold (millions of pounds) | | | 84 | | | | 146 | | | | 318 | | | | 309 | |
Realized price ($ per pound)3 | | | $ 3.52 | | | | $3.54 | | | | $ 3.59 | | | | $3.87 | |
C1 cash costs ($ per pound)3 | | | $ 2.33 | | | | $1.83 | | | | $ 2.22 | | | | $1.60 | |
| 1 | Net earnings represent net income attributable to the equity holders of the Company. |
| 2 | Calculated using weighted average number of shares outstanding under the basic method. |
| 3 | Adjusted net earnings, adjusted EPS, EBITDA, adjusted operating cash flow, adjusted operating cash flow before working capital changes, free cash flow, realized price, net cash costs, total cash costs and C1 cash costs are non-GAAP financial performance measures with no standardized definition under IFRS. For further information and a detailed reconciliation, please see pages 42 – 47 of this MD&A. |
| 4 | We sold our 20.4% investment in Highland Gold with an effective date of April 26, 2012. Production includes our equity share of gold production at Highland Gold up to that date. |
THIRD QUARTER FINANCIAL AND OPERATING HIGHLIGHTS
| • | | Net earnings and adjusted net earnings for the third quarter 2012 were $618 million and $849 million, respectively, down $747 million and $530 million from the same prior year period. The decrease in net earnings and adjusted net earnings was largely driven by lower gold and copper sales volumes and lower realized gold and copper prices, higher cost of sales applicable to gold, partially offset by lower cost of sales applicable to copper and lower income tax expense. |
| • | | EPS and adjusted EPS for the third quarter 2012 were $0.62 and $0.85, respectively, down 55% and 38%, over the same prior year period. The changes reflect the decrease in both net earnings and adjusted net earnings. |
| • | | EBITDA for the third quarter 2012 was $1,499 million, down 39% over the same prior year period, reflecting the same factors affecting net earnings, except for income tax expense. |
| • | | Operating cash flow for the third quarter 2012 was $1,732 million, down 9% compared to the same prior year period. The decrease in operating cash flow primarily reflects lower net earnings and an increase in net working capital outflow, partially offset by a decrease in income tax payments of $220 million. Income tax payments in third quarter 2012 were $250 million compared to income tax payments of $470 million made in the comparable period in 2011. |
| | | | |
| BARRICK THIRD QUARTER 2012 | | 11 | | MANAGEMENT’S DISCUSSION AND ANALYSIS |
| | Operating cash flow for the third quarter 2012 reflects $465 million in net proceeds related to the settlement of a portion of our Australian dollar hedge positions. The impact of this settlement was removed from the adjusted operating cash flow. Free cash flow for the third quarter of 2012 decreased by $764 million compared to the same prior year period, reflecting the decrease in cash flow and higher capital expenditures on our projects in construction. |
| • | | Significant adjusting items (net of tax effects) in the third quarter include: $148 million in impairment charges, primarily related to asset impairment charges on an exploration property in Papua New Guinea, $16 million in unrealized foreign currency translation losses, $71 million in unrealized losses on non-hedge derivative instruments and $7 million related to the impact of changes in the discount rate used to calculate our rehabilitation liability related to our closed sites. |
| • | | Gold production and sales volumes for the third quarter 2012 were 1,779 million ounces and 1,792 million ounces, respectively, down 8% and 6%, respectively, over the same prior year period, primarily due to lower production at Cortez, Veladero, Lagunas Norte, Kalgoorlie and Buzwagi. |
| • | | Total cash costs for the third quarter 2012 were $592 per ounce, up 31% over the same prior year period. The increase reflects increases in direct mining costs, including higher labor, energy, maintenance and consumable costs across all our regions as well as the impact of lower production levels. Net cash costs for third quarter 2012 were $537 per ounce, an increase of $214 per ounce or 66% compared to the same prior year period, due to higher total cash costs and lower copper credits. |
| • | | Copper production and C1 cash costs for the third quarter 2012 were 112 million pounds and $2.33 per pound respectively, compared to production of 140 million pounds at C1 cash costs of $1.83 per pound in the same prior year period. Copper production decreased in third quarter 2012 primarily due to lower production from Lumwana. C1 cash costs increased in third quarter 2012 primarily due to higher cost production from Lumwana. Copper sales were negatively impacted in third quarter 2012 by the labor strike at the port of Antofagasta as the shipment of 26 million pounds was delayed. These sales will be recorded in the fourth quarter. |
FIRST NINE MONTHS 2012 vs. FIRST NINE MONTHS 2011
| • | | Net earnings and adjusted net earnings for the nine month period of 2012 were $2,397 million and $2,719 million, respectively, compared to net earnings of $3,525 million and adjusted net earnings of $3,500 million recorded in the nine month period of 2011. The decrease in net earnings and adjusted net earnings was largely driven by lower gold sales volumes and lower realized copper prices, higher cost of sales applicable to gold and copper, partially offset by higher realized gold prices, higher copper sales volumes and lower income tax expense. |
| • | | EPS and adjusted EPS for the nine month period of 2012 were $2.40 and $2.72, respectively, down 32% and 22%, respectively, compared to EPS of $3.53 and adjusted EPS of $3.50 for the nine month period of 2011. The decreases were due to the decrease in both net earnings and adjusted net earnings. |
| • | | EBITDA for the nine month period of 2012 was $5,010 million, compared to EBITDA of $6,378 million for the nine month period of 2011. The decrease in EBITDA reflects the same factors affecting net earnings, except for income tax expense. |
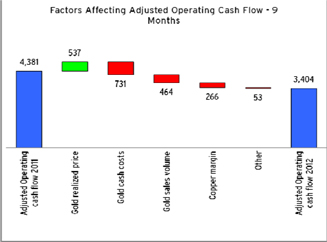
| • | | Operating cash flow was $3,767 million, compared to operating cash flow of $4,091 million for the nine month period of 2011. Adjusted operating cash flow was $3,404 million compared to $4,381 million for the nine month period of 2011. The decreases in operating cash flow and adjusted operating cash flow primarily reflects lower net earnings levels and an increase in net working capital outflows, partially offset by a decrease in income tax payments of $277 million. Income tax payments in the nine month period of 2012 were $1,217 million, compared to the income tax payments of $1,494 million made in the comparable period of 2011, which included about $480 million in payments related to 2010. Adjusted operating cash flow was affected by the same factors as operating cash flow and removes the impact of the $465 million in net proceeds related to the settlement of a portion of our Australian dollar hedge positions. Free cash flow for the nine month period of 2012 decreased by $1,786 million compared to the same prior year period primarily reflecting lower operating cash flow and higher capital expenditures on our projects in construction. |
| • | | Significant adjusting items (net of tax effects) in the nine month period of 2012 include: $266 million in impairment charges, which primarily includes asset impairment charges on an exploration property in Papua New Guinea ($141 million), write-down of our investment in Highland Gold ($84 million) and write-downs on our available-for-sale investments ($32 million), $52 million in unrealized losses on non-hedge derivative instruments, $28 million in unrealized foreign currency translation losses, $13 million in severance costs, $41 million in tax adjustments related to a rate change in Canada and Chile and a foreign income tax assessment, and $14 million in gains from the sale of assets. |
| • | | Gold production and sales volumes for the nine month period of 2012 were 5,402 million ounces and 5,265 million ounces, respectively. In the nine month period of 2011, gold production and sales volumes were 5,862 million and 5,685 million ounces, respectively. The decrease in production and sales volumes compared to the prior year period is primarily due to lower production across all our regions, at business units and particularly at our Veladero, Cortez, and Porgera mines. |
| | | | |
| BARRICK THIRD QUARTER 2012 | | 12 | | MANAGEMENT’S DISCUSSION AND ANALYSIS |
| • | | Total cash costs for gold were $584 per ounce, up $139 per ounce or 31% compared to the nine month period of 2011. The increase reflects increases in direct mining costs, including higher labor, energy, maintenance and consumable costs across all our regions as well as the impact of lower production levels. Net cash costs were $501 per ounce in the nine month period of 2012, an increase of $179 per ounce or 56% compared to the same prior year period. The increase in net cash costs reflects higher total cash costs and lower copper credits. |
| • | | Copper production and C1 cash costs for the nine month period of 2012 were 338 million pounds at C1 cash costs of $2.22 per pound respectively, compared to production of 308 million pounds at C1 cash costs of $1.60 per pound for the nine month period of 2011. Copper production and C1 cash costs increased for the nine month period of 2012 primarily due to the inclusion of a full nine months of higher cost production from Lumwana, compared to only four months in the comparable prior year period. |
Business Overview
Disciplined Capital Allocation Framework
Our renewed focus on maximizing shareholder value will be achieved through a disciplined approach to capital allocation based on maximizing returns on investment and free cash flow. Under this approach, all capital allocation options, which include organic investment in exploration and projects, and acquisitions or divestitures to improve the quality of our portfolio, will be assessed on the basis of maximizing risk-adjusted returns. Our increased emphasis on free cash flow will position the company, in the future, with the potential to return more capital to shareholders, repay debt, and make additional attractive return investments to upgrade our portfolio.
In June 2012, we initiated a full review of our operations and projects. This portfolio review is an on-going, dynamic process. Cost control is also a vital part of this review and an integral component of our capital allocation framework. We have been reviewing company-wide costs and evaluating ways to reduce these, including sustaining capital and general and administrative expenses.
We have made significant progress in support of our renewed focus on disciplined capital allocation. In the second quarter:
| | • | | The company cut or deferred about $3 billion in capex that was budgeted over a four year period as a result of recalibrating longer-term production to higher quality, more profitable levels. |
| | • | | Annual gold production is expected to be about 8 million ounces by 2016. |
| | • | | Annual copper production is expected to be about 600 million pounds by 2015 with the opportunity to increase to more than 1 billion pounds if we proceed with the Zaldívar sulfides and Lumwana expansions. |
During the third quarter:
| | • | | Barrick cut or deferred about $1.0 billion in capex from the initial sustaining and minesite expansion budget for 2013 as a result of our on-going portfolio review and cost control focus. Despite additional spending at Pascua-Lama, and continued inflationary industry cost pressures, we expect 2013 capex to be largely in line with 2012. |
| | • | | As part of the ongoing portfolio review initiated in June and our increased focus on disciplined capital allocation, we continue discussions with China National Gold related to the potential sale of our 73.9% equity share in African Barrick Gold plc (ABG). |
Projects in Construction
Pueblo Viejo
During the third quarter, Pueblo Viejo poured first gold on schedule and within capital guidance of $3.6-$3.8 billion (100% basis). The company’s 60 percent share of annual gold production in the first full five years of operation is expected to average 625,000-675,000 ounces at total cash costs of $300-$350 per ounce1.
The mine is ramping up to commercial production, which is expected in December 2012. Pueblo Viejo is anticipated to produce about 80,000 ounces of gold to Barrick in 2012, however, actual results will vary depending on how the ramp up progresses.
As part of planned start up activities, the first three autoclaves have been tested at 50 percent to 100 percent of design capacity, with results that are in line with expectations for the initial ramp up period. The fourth autoclave is currently undergoing pre-commissioning testing, prior to planned commissioning in the fourth quarter. Construction of the tailings starter dam achieved its full height of 182.5 meters and the oxygen plant has been commissioned. Over 2.0 million contained ounces of gold have been stockpiled to date. The operations staff have been hired and trained by experienced personnel from our North America RBU.
| 1 | Based on gold and WTI oil price assumptions of $1,300/oz and $90/bbl, respectively. Does not include escalation for future inflation. |
| | | | |
| BARRICK THIRD QUARTER 2012 | | 13 | | MANAGEMENT’S DISCUSSION AND ANALYSIS |
Construction progress also continued on a 215 MW dual fuel power plant at an estimated net incremental cost of approximately $300 million (100 percent basis) or $180 million (Barrick’s 60 percent share). The power plant is expected to commence operations in 2013 utilizing heavy fuel oil, but have the ability to subsequently transition to lower cost liquid natural gas.
Jabal Sayid
At the recently constructed Jabal Sayid copper mine, a dedicated EPCM team is working toward achieving full compliance standards for safety and security in order to commence production. During the quarter, the company was notified the operation is not in compliance with standards for safety and security in Saudi Arabia. The previous owner originally designed the mine in compliance with Western Australia safety and security standards. The operation is currently expected to achieve full compliance in 2014, at which time production will start. Initial testing has been completed and about 440,000 tonnes of ore at an average grade of 2.25% copper have been stockpiled to date. Average annual production from Jabal Sayid is expected to be 100-130 million pounds at C1 cash costs of $1.50-$1.70 per pound2 in its first full five years of operation. Total project capital expenditures are still anticipated to be about $400 million3.
Pascua-Lama
Pascua-Lama is expected to be one of the world’s largest, lowest cost mines and, once in production is expected to contribute significant free cash flow to the company for many years to come.
During the third quarter, we strengthened the project management and construction teams, and made significant progress in a number of key areas:
| | • | | commenced transfer of project management from Barrick to Fluor, the leading global EPCM contractor that successfully managed our recently completed Pueblo Viejo project; |
| | • | | reorganized and strengthened the Barrick project team, including a new project director and the hiring of experienced construction industry experts to improve the oversight and leadership of the project; |
| | • | | increased the quantity and quality of skilled labor, with approximately 1,900 new hires over the past quarter primarily from the province of San Juan and the rest of Argentina; |
| | • | | advanced review of all major contracts, material quantities and prices, unit costs, installation rates and productivity; and |
| 2 | Does not include escalation for future inflation. |
| 3 | Does not include escalation for future inflation. |
| | • | | progressed a detailed review of project schedule, including related logistics (e.g. transportation, camps). |
To date, approximately $3.7 billion has been spent. The tunnel is approximately 60 percent complete and 90 percent of the required material and equipment for the process plant has been committed. Plans are progressing to increase the camp capacity to provide additional project construction flexibility.
As disclosed with Barrick’s second quarter report, preliminary results of a review indicated an increase in capital costs to $7.5-$8.0 billion and a delay in first production to mid-2014. Since then, the company has been working with Fluor to carry out a more comprehensive top-to-bottom review. This review will be complete by our 2012 year-end results release; however, work to date suggests capital costs will be closer to $8.0-$8.5 billion, with first production in the second half of 2014.
Delays in the earthworks and underground works for the process plant are the main reason for the shift in schedule to the second half of 2014. The indicated increase in capital costs is split, roughly evenly, among: i) the impact of the delay of first gold to the second half of 2014; ii) increased labor hours and installation rates after being reviewed in more detail with Fluor during this quarter; and iii) incremental payments to Fluor to assume project and additional construction management, as well as increased incentives for Fluor and other contractors to come in on time and on budget.
Pascua-Lama is a world class resource of nearly 18 million ounces of proven and probable gold reserves and 676 million ounces of silver contained within the gold reserves and a mine life of 25 years. It is expected to produce an average of 800,000-850,000 ounces of gold and 35 million ounces of silver in its first full five years of production. Expected total cash costs remain in the range of $0 to negative $150 per ounce4 using a silver price assumption of $25 per ounce. The company expects to update production and total cash cost guidance for Pascua-Lama with its year-end 2012 results.
In September and October 2012, two constitutional rights protection actions were filed in Chile by representatives of an indigenous community and certain other individuals, seeking the suspension of construction of the Chilean portion of the Pascua-Lama project due to alleged non-compliance with the requirements of the Project’s Chilean environmental approval. The Court declined to issue an immediate injunction suspending
| 4 | First full five year average. Based on gold, silver and WTI oil price assumptions of $1,300/oz, $25/oz and $90/bbl, respectively, and assuming a Chilean Peso assumption of 475:1. Inflation escalation assumptions are as of Q2 2012, and do not include escalation for future inflation. |
| | | | |
| BARRICK THIRD QUARTER 2012 | | 14 | | MANAGEMENT’S DISCUSSION AND ANALYSIS |
pre-stripping activities, but both cases have been admitted for review by the Court. We intend to vigorously defend these actions.
Goldstrike Thiosulfate Technology
Construction of the thiosulfate technology project, including the retrofitting of the existing plant, as well as new installations, continued during the quarter. This project allows for continued production from the autoclaves, which were originally expected to cease operations in 2012, and brings forward production of about 3.5 million ounces in the mine plan. First gold production is expected in mid-2014, with an average annual contribution of about 350 to 400 thousand ounces over the first full five years. Project costs are expected to be about $350 million.
Projects at Feasibility/Permitting Stage
Cerro Casale and Donlin Gold
Cerro Casale and Donlin Gold contain large, long life mineral resources in stable jurisdictions, have significant leverage to the price of gold, and therefore represent valuable long-term opportunities for the company. We will maintain and enhance the option value of these projects by advancing permitting activities at reasonable costs which, in the case of Donlin Gold, will take a number of years. During this time, we will monitor the attractiveness of these projects and evaluate alternatives to improve their economics. This will provide the company with the option to make construction decisions in the future should investment conditions warrant. Currently, however, Cerro Casale and Donlin Gold do not meet our investment criteria, and under our disciplined capital allocation framework we would not make a decision to construct them at this time.
Kabanga
At the 50 percent-owned Kabanga nickel project in Tanzania, the Environment Impact Statement (EIS) was submitted to the National Environment Management Council (NEMC) in the first quarter, and a response is now being prepared to the comments received from the NEMC. The draft Mine Development Agreement (MDA) has been lodged with the Ministry of Energy and Minerals, and the resettlement working group has undertaken an asset and census survey as part of the resettlement action plan to engage those families that will need to relocate once the project is approved. Subsequent efforts will be focused on obtaining approval of the EIS and granting of the Environmental Certificate, negotiating the MDA with the Tanzanian government, pursuing the receipt of a Special Mining License, and finalization and approval of the feasibility study.
Projects at Scoping/Pre-Feasibility Stage
Copper Expansion Projects
A scoping study has been completed on the Zaldívar deep sulfides, and a prefeasibility study is now underway with expected completion in 2014. This expansion opportunity has the potential to significantly increase annual mine production starting as early as 2019, increase copper reserves/resources and extend mine life. The scoping study identified that the project has the potential to meet our investment criteria, subject to detailed findings of a prefeasibility and feasibility study.
At Lumwana we are also conducting an exploration drilling program. The results of this program will be incorporated into a new life of mine plan and a prefeasibility study on the expansion opportunity for Lumwana, which has the potential to double processing rates. We expect to complete the prefeasibility study in the second half of 2013.
Cortez Hills Lower Zone
At the Cortez Hills Lower Zone Expansion project in Nevada, advancement continues on the exploration decline. Two exploration rigs continue to delineate the ore body in the lower zone. Infill drilling continues in the upper zone to convert resource to reserve classification. The expansion provides an opportunity to increase production and extend the mine life. A prefeasibility study has been completed and a feasibility study is expected to commence in the fourth quarter 2012. Following a review of this project in second quarter 2012, we determined that the project presently meets our investment criteria, subject to the impact of finalizing a full feasibility study.
Exploration Update
The 2012 exploration guidance is $450-$490 million5, of which over 40 percent is for major exploration programs at Goldrush, Lumwana and Turquoise Ridge. These are key projects with large drill programs which are expected to add to and upgrade gold and copper resources in 2012-2013 and directly contribute to various planned scoping, prefeasibility and expansion studies.
Goldrush
In Nevada, over 50 drill rigs are currently operating, 12 of which are located at Goldrush. Drilling continues to expand the footprint. The mineralized corridor has now almost doubled, delineated along seven kilometers in strike length. The scale and continuity of the system, and the extent of high grade zones being defined, is providing multiple development scenarios. Based on results to date, we expect significant increases in the already defined indicated and inferred resources by the end of 2012.
| 5 | Barrick’s exploration programs are designed and conducted under the supervision of Robert Krcmarov, Senior Vice President, Global Exploration of Barrick. |
| | | | |
| BARRICK THIRD QUARTER 2012 | | 15 | | MANAGEMENT’S DISCUSSION AND ANALYSIS |
Lumwana
At Lumwana, the full contingent of 25 exploration drill rigs is operating at Chimiwungo. As the in-fill drilling program nears completion, results are expected to increase reserves by the end of 2012.
Turquoise Ridge
At the 75 percent-owned Turquoise Ridge operation in Nevada, resource definition drilling has ramped up to 15 drill rigs, which have completed over 232,000 feet (50 percent) of planned 2012 drilling. The drilling is focused on supporting a prefeasibility study for a mine expansion plan by targeting resource upgrades and additions in four principal areas of the deposit.
Other Developments
Argentina passed a federal glacier protection law in October 2010 that restricts mining in areas on or near the nation’s glaciers. Our activities do not take place on glaciers, and are undertaken pursuant to existing environmental approvals issued on the basis of comprehensive environmental impact studies that fully considered potential impacts on water resources, glaciers and other sensitive environmental areas around Veladero and Pascua-Lama. We have a comprehensive range of measures in place to protect such areas and resources. Further, we believe that the new federal law is unconstitutional, as it seeks to legislate matters that are within the constitutional domain of the provinces. The Province of San Juan, where our operations are located, previously enacted glacier protection legislation with which we comply. We believe we are legally entitled to continue our current activities on the basis of existing approvals. On July 3, 2012, the Supreme Court of Argentina overturned temporary injunctions granted by the Federal Court in San Juan suspending the application of the federal law in the Province and in particular to Veladero and Pascua-Lama. The Supreme Court has not yet ruled on the constitutionality of the law. It is possible that others may attempt to bring legal challenges seeking to restrict our activities based on the federal law, including requesting injunctions. We will vigorously oppose any such challenges.
Tanzania has recently amended its Income Tax Act, the effect of which is to subject all indirect share dispositions of controlled Tanzanian entities to tax in Tanzania. The new legislation is very broad, lacks specificity, and accordingly is subject to interpretation. We are continuing to analyze the potential impact of the changes, including the effect of our development agreements, particularly as it relates to our continuing discussions with China National Gold regarding a possible sale of our 73.9% equity share in ABG.
Full year 2012 Outlook
| | | | |
| ($ millions, except per ounce/pound data) | | 2012E | |
Gold production and costs | | | | |
Production (millions of ounces)1 | | | 7.3 – 7.5 | |
Cost of sales | | | 6,100 – 6,400 | |
Gold unit production costs | | | | |
Total cash costs ($ per ounce)2 | | | 575- 585 | |
Net cash costs ($ per ounce)3 | | | 480 - 500 | |
Depreciation ($ per ounce) | | | 185 - 195 | |
Copper production and costs | | | | |
Production (millions of pounds)4 | | | ~450 | |
Cost of sales5 | | | 1,200 - 1,300 | |
Copper unit production costs | | | | |
C1 cash costs ($ per pound)6 | | | 2.10 - 2.30 | |
C3 fully allocated costs ($ per pound)7 | | | 2.90 - 3.10 | |
Other depreciation | | | 65 – 75 | |
Exploration and evaluation expense | | | 420 – 440 | |
Exploration | | | 265 – 275 | |
Evaluation8 | | | 155 – 165 | |
Corporate administration9 | | | 180 – 190 | |
Other expense10 | | | 400 – 425 | |
Other income11 | | | 30 – 40 | |
Finance income | | | 10 – 15 | |
Finance costs12 | | | 210 – 220 | |
Capital expenditures: | | | | |
Minesite sustaining | | | 1,250 - 1,350 | |
Open pit and underground mine development | | | 950 – 1,000 | |
Minesite expansion | | | 850 – 900 | |
Capital projects | | | 2,950 – 3,050 | |
Total capital expenditures13,14 | | | 6,000 – 6,300 | |
Effective income tax expense rate | | | 32 | % |
| 1 | We have narrowed our full year production guidance range from 7.3 - 7.8 million ounces. Our 2012E production guidance range includes Barrick’s share of production from Pueblo Viejo of approximately 80 thousand ounces in the fourth quarter. |
| 2 | We now expect our gold total cash costs guidance range to be $575-$585 per ounce, which is higher than our previously announced cash costs guidance range of $550-$575 per ounce. |
| 3 | We now expect our net cash costs guidance range to be $480-$500 per ounce within our previous guidance range of $460-$500 per ounce. Net cash costs is based on assumed realized copper price of $3.50 per pound for fourth quarter 2012. |
| 4 | We now expect full year copper production to be about 450 million pounds, compared to our previously announced guidance range of 460 - 500 million pounds, principally due to the delayed start up of Jabal Sayid. |
| 5 | We now expect our copper cost of sales to be lower than our previously announced guidance range of $1,300 - $1,500 primarily due to lower copper production following the delayed start up of Jabal Sayid. Our 2012E copper cost of sales was amended in first quarter 2012 to reflect the change in the presentation of treatment and refinement charges incurred on concentrate sales in the consolidated financial statements. Previously these charges were included in cost of sales and they are now deducted from revenues. C1 cash costs include treatment and refinement charges in the per pound calculation. |
| 6 | In second quarter 2012 we increased our C1 cash costs guidance range to $2.10 - $2.30 per pound from our previously announced guidance range of $1.90 - $2.20 per pound. |
| 7 | In second quarter 2012 we increased our C3 fully allocated costs guidance range to $2.90 - $3.10 per pound from our previously announced guidance range of $2.70 - $3.00 per pound to reflect the increase in C1 cash cost guidance. |
| 8 | In second quarter 2012 we increased our 2012E Evaluation costs to $155 - $165 million from our previously announced guidance range of $120 - $130 million. |
| 9 | We now expect our 2012E Corporate Administration to be $180 - $190 million, compared to our original guidance range of $165 - $175 million. |
| 10 | Other expense excludes adjusting items of approximately $314 million. These items do not reflect the underlying operating performance of our core mining business and are not necessarily indicative of future operating results. |
| 11 | Other income excludes adjusting items of approximately $20 million. These items do not reflect the underlying operating performance of our core mining business and are not necessarily indicative of future operating results. |
| 12 | We now expect our 2012E Finance costs to be $210 - $220 million, which is lower than our previously announced guidance range of $250 - $280 million, due to an increase in interest expense eligible for capitalization. |
| 13 | Represents Barrick’s share of capital expenditures. |
| 14 | In second quarter 2012 we increased our total capital expenditures guidance range to $6,000 million - $6,300 million from our previously announced guidance range of $5,500 million - $5,900 million to reflect the increase in Pascua-Lama capital expenditures. |
| | | | |
| BARRICK THIRD QUARTER 2012 | | 16 | | MANAGEMENT’S DISCUSSION AND ANALYSIS |
In the third quarter, we narrowed our production guidance range from the range previously published to reflect the lower expected variability of results over the remainder of the year. We now expect full year gold production to be in the range of 7.3 to 7.5 million ounces, which is within our original guidance range of 7.3 to 7.8 million ounces. Our 2012E production guidance range includes Barrick’s share of expected production from Pueblo Viejo of approximately 80 thousand ounces following commencement of production expected in the fourth quarter.
We now expect total cash costs to be $575-$585 per ounce, compared to our previously announced guidance range of $550-$575 per ounce, primarily due to higher cash costs from Australia Pacific and ABG. We now expect net cash costs to be $480-$500 per ounce, within our previously announced guidance range of $460-$500 per ounce. We continue to expect our gold cost of sales guidance to be in the range of $6.1 billion to $6.4 billion for the year, which is in line with our previously announced guidance range issued in the second quarter.
We have updated our full year copper production to be about 450 million pounds, which is slightly lower than our most recent guidance range of 460 to 500 million pounds, primarily due to the delayed start up of Jabal Sayid in Saudi Arabia. We have also updated our copper cost of sales guidance to be in the range of $1.2 billion to $1.3 billion for the year, which is lower than the previous guidance range of $1.3 billion to $1.5 billion for the year, which reflects the decrease in production.
Starting in first quarter 2012, we introduced a new non-GAAP measure entitled “C1 cash cost” for calculating copper cash cost per pound. The primary difference between C1 cash costs and our previous cash cost calculation is the exclusion of royalties and non-routine charges from C1 cash costs as they are not direct production costs. We continue to expect our C1 cash costs to be in the range of $2.10 to $2.30 per pound, which is in line with our previously announced guidance range issued in the second quarter. C3 fully allocated costs per pound, which include C1 cash costs, depreciation, royalties, exploration and evaluation expense, administration expense and non-routine charges, are expected to be in the range of $2.90 to $3.10 per pound, which is also in line with our previous guidance range.
We continue to expect full year capital expenditures to be in the range of $6.0 billion to $6.3 billion, which is in line with our previous guidance range.
Market Review
Gold and Copper Prices
The market prices of gold and copper are the primary drivers of our profitability and our ability to generate free cash flow for our shareholders. During the third quarter, the gold price experienced continued volatility, generally rising through the quarter, with the price ranging from $1,555 to $1,788 per ounce. The price of gold closed at $1,776 per ounce, while the average quarterly market price of $1,652 represented a $50 per ounce decrease from the $1,702 per ounce average market price in the same prior year period.
Due to concerns over global economic growth, geopolitical issues, sovereign debt and deficit levels, bank stability, future inflation prospects, and continuing accommodative monetary policies put in place by many of the world’s central banks, including the US Federal Reserve’s recent announcement of their intention to begin $40 billion per month of additional purchases of agency mortgage-backed securities until the outlook for the labor market improves substantially, gold has continued to attract investor interest through its role as a safe haven investment, store of value and alternative to fiat currency. This was evidenced in the strong growth of gold-based Exchange Traded Funds (“ETFs”), which increased by 4 million ounces during the quarter to a total of 86 million ounces and helped to fuel the rising price in the quarter. In addition, the limited choice in alternative safe haven investments, debasement of global currencies, and the strength of physical demand for gold in forms such as bars and coins are significant drivers of the overall gold market. We expect a continuation of these trends will be supportive of higher gold prices.
Gold prices also continue to be influenced by trends in global gold mine production and the impact of central bank gold activities. In the most recent year of the current Central Bank Gold Agreement, which ended in September 2012, the signatory members sold only 6 tonnes of gold, or less than 2% of the maximum agreed amount, while global central banks as a whole have been net purchasers of gold since 2010, with a net 457 tonnes of gold being purchased in 2011 and over 230 tonnes reported as purchased to date in 2012.
Copper prices were relatively stable in the third quarter of 2012 compared to recent history, trading in a range of $3.30 per pound to $3.82 per pound. The average price for the third quarter was $3.50 per pound and the closing price was $3.75 per pound. Copper’s strength lies mainly in strong physical demand from emerging markets, especially China, which has resulted in a physical deficit in recent years. In addition, there has been significant investor interest in base metals with strong forward-looking supply/demand fundamentals. Copper prices
| | | | |
| BARRICK THIRD QUARTER 2012 | | 17 | | MANAGEMENT’S DISCUSSION AND ANALYSIS |
should continue to be positively influenced by demand from Asia, the limited availability of scrap and production levels of mines and smelters in the future. In the near term, copper prices will be influenced by expectations of a physical deficit of refined copper as well as the outlook for global economic growth. In particular, a slowdown in Chinese economic growth could have a negative impact on copper prices.
As a result of our copper collar hedge positions that matured in the third quarter, we realized a cash gain of approximately $17 million. For the remainder of 2012, we have floor protection on approximately 60% of our expected copper production at an average floor price of $3.75 per pound and have full participation to any upside in copper prices. Our remaining copper production is subject to market prices. Our realized price on our total 2012 copper production is expected to be reduced by approximately $0.17 per pound as a result of the net premium paid for these positions.
Silver
Silver prices do not significantly impact our current operating earnings, cash flows or gold total cash costs. Silver prices, however, will have a significant impact on the overall economics for our Pascua-Lama project, which is currently in the construction phase. In the first five full years of production, Pascua-Lama is expected to produce an average of 35 million ounces of silver annually.
In the third quarter, silver prices traded in a wide range from $26.50 per ounce to $35.17 per ounce, averaged $29.80 per ounce and closed the quarter at $34.65 per ounce. Silver has managed to remain at elevated levels due mainly to strong investment demand, which is driven by factors similar to those influencing investment demands for gold. The ounces held by global silver ETFs increased by 20 million in the quarter to a total of 512 million ounces. The physical silver market is currently in surplus and investment demand is expected to be the primary driver of prices in the near term.
Currency Exchange Rates
The results of our mining operations outside of the United States are affected by US dollar exchange rates. The largest single exposure we have is to the Australian dollar/US dollar exchange rate. We also have exposure to the Canadian dollar through a combination of Canadian mine operating costs and corporate administration costs, as well as exposure to the Chilean peso as a result of the construction of our Pascua-Lama project and mine operating costs. In addition, we have exposure to the Papua New Guinea kina, Peruvian sol, Zambian kwacha, Tanzanian shilling and Argentinean peso through mine operating and capital costs.
Fluctuations in the US dollar increase the volatility of our costs reported in US dollars, subject to protection that we have put in place through our currency hedging program. The economies of Australia, Canada and Chile have fared well in comparison to many other OECD countries since the onset of the global economic crisis. As a result, the currencies of these countries continue to trade at historically strong levels. In the quarter, the Australian dollar traded in a range of $1.01 to $1.06 against the US dollar, while the US dollar against the Canadian dollar and Chilean peso traded in ranges of $0.96 to $1.03 and CLP 467 to CLP 501, respectively.
In the third quarter, we recorded gains in earnings of approximately $87 million from our Australian, Canadian and Chilean peso hedges, primarily impacting our operating and corporate administration costs. During the quarter, with the Australian dollar trading at historically elevated levels against the US dollar, and based on our currency outlook, the company opportunistically unwound approximately AUD$2.6 billion of our Australian dollar hedges at an average spot price of $1.05. We realized net cash proceeds of approximately $0.5 billion upon the settlement of these contracts. The corresponding accounting gains will be recognized in the consolidated statement of income based on the original hedge contract maturity dates, which are between 2012 and 2014, with locked-in gains of approximately $90 million, $280 million, and $110 million positively impacting our total reported cash costs per ounce in Q4 2012, 2013 and 2014, respectively. However, we now have greater exposure to fluctuations in the price of the Australian dollar, which will have a negative impact on our reported total cash costs should the Australian dollar strengthen and a positive impact should the Australian dollar weaken. For the remainder of 2012, every $0.01 movement in the Australian dollar will have a $2 per ounce impact on our consolidated total cash costs. As of the end of the third quarter, the company continues to have approximately AUD$1.8 billion hedged, primarily in 2014-2016, at an average rate of about 0.92. We also have Chilean peso contracts in place to hedge a portion of our capital expenditures at the Pascua-Lama project. For the remainder of the year, we expect to record hedge gains in net earnings of approximately $100 million on our Australian dollar, Canadian dollar and Chilean peso hedge positions assuming average market exchange rates of $1.04, $0.98 and CLP 472, respectively.
| | | | |
| BARRICK THIRD QUARTER 2012 | | 18 | | MANAGEMENT’S DISCUSSION AND ANALYSIS |
AUD Currency Contracts
| | | | | | | | | | | | | | | | | | | | |
| | | Contracts
(AUD millions) | | | Effective
Average
Hedge
Rate
(AUDUSD) | | | % of
Total
Expected
AUD
Exposure3
Hedged | | | % of
Expected
Operating
Cost
Exposure
Hedged | | | Crystallized
OCI 1
(USDmillions) | |
20122 | | | 85 | | | | 1.01 | | | | 18 | % | | | 23 | % | | | 94 | |
2013 | | | 160 | | | | 0.94 | | | | 9 | % | | | 11 | % | | | 281 | |
2014 | | | 338 | | | | 0.92 | | | | 19 | % | | | 23 | % | | | 111 | |
2015 | | | 707 | | | | 0.92 | | | | 48 | % | | | 58 | % | | | - | |
2016 | | | 479 | | | | 0.90 | | | | 39 | % | | | 43 | % | | | - | |
CAD Currency Contracts
| | | | | | | | | | | | | | | | |
| | | Contracts
(CAD millions)4 | | | Effective
Average Hedge
Rate (USDCAD) | | | % of Total
Expected
CAD Exposure3
Hedged | | | % of Expected
Operating Cost
Exposure
Hedged | |
20122 | | | 110 | | | | 1.00 | | | | 77% | | | | 92% | |
2013 | | | 424 | | | | 1.02 | | | | 78% | | | | 89% | |
2014 | | | 96 | | | | 1.00 | | | | 16% | | | | 20% | |
|
| CLP Currency Contracts | |
| | | Contracts (CLP
millions)5 | | | Effective
Average Hedge
Rate (USDCLP) | | | % of Total
Expected CLP
Exposure3
Hedged | | | % of Expected
Operating Cost
Exposure
Hedged | |
20122 | | | 66,085 | | | | 516 | | | | 55% | | | | 100% | |
2013 | | | 361,325 | | | | 514 | | | | 100% | | | | 100% | |
2014 | | | 287,016 | | | | 509 | | | | 100% | | | | 100% | |
2015 | | | 78,000 | | | | 513 | | | | 31% | | | | 36% | |
| 1 | $94 million will be recognized in earnings in fourth quarter 2012, $281 million in 2013 and $111 million in 2014. |
| 2 | Amounts presented represent contracts for the remaining period 2012. |
| 3 | Includes all forecasted operating, administrative sustainable and eligible project capital expenditures. |
| 4 | Includes $257 million CAD contracts with a cap and floor of $0.98 and $1.08, respectively. |
| 5 | Includes CLP 517,950 million collar contracts that are an economic hedge of operating and administrative and capital expenditures at various South American sites and at our Pascua-Lama project with a cap and floor of 514 and 572, respectively. |
Fuel
Concerns over global economic growth, supply and transportation issues and geopolitical tensions in certain oil producing regions combined to create volatility in oil prices in the third quarter. The price of West Texas Intermediate (“WTI”) crude oil traded in a wide range of $82 to $100 per barrel in the third quarter, averaged, and ended the quarter at $92 per barrel, compared to an average of $90 per barrel in the same prior year period.
On average, we consume approximately 5 million barrels of diesel fuel annually across all our mines. Diesel fuel is refined from crude oil and is therefore subject to similar volatility that affects crude oil prices. Volatility in fuel prices has a significant direct and indirect impact on our production costs. In order to mitigate this volatility, we
employ a strategy of combining the use of financial contracts and our production from Barrick Energy to effectively hedge our exposure to high oil prices. We currently have financial contracts in place totaling 5.5 million barrels, of which 0.6 million are set to mature in the remainder of 2012, representing approximately 45% of our total estimated direct consumption for the remainder of the year. For the following 3 years, we have contracts for 4.8 million barrels representing over 35% of our total estimated direct consumption.
In the third quarter, we recorded a hedge gain of $4 million on our fuel hedge positions (Q3 2011: $13 million gain) and expect to record hedge gains of approximately $5 million for the remainder of 2012 based on an assumed average market WTI crude oil price of $92 per barrel.
For the remainder of 2012, we expect Barrick Energy to produce about 0.8 million barrels of oil equivalent (“boe”). The net contribution from the production of Barrick Energy is expected to provide a natural economic offset equivalent to our expected consumption of about 0.4 million boe. In the third quarter, the spread between the Edmonton Par price that Barrick Energy receives and the WTI price narrowed, but still remains at elevated levels. A continuation of the trend of a high spread would negatively impact the net contribution we expect to receive from Barrick Energy. The Barrick Energy contribution, along with our financial fuel hedges, which are summarized in the table below, provides hedge protection for approximately 75% of our estimated remaining fuel consumption for 2012.
Financial Fuel Hedge Summary
| | | | | | | | | | | | |
| | | Barrels1
(thousands) | | | Average Price | | | % of Expected
Exposure | |
20122 | | | 576 | | | $ | 102 | | | | 43% | |
2013 | | | 2,354 | | | | 91 | | | | 42% | |
2014 | | | 1,500 | | | | 95 | | | | 29% | |
2015 | | | 960 | | | | 92 | | | | 20% | |
| | | | 5,390 | | | $ | 95 | | | | 35% | |
| 1 | Refers to net financial contracts for a combination of WTI, BRENT, ULSD, WTB, MOPS and JET. Products other than WTI and BRENT have market prices in excess of crude due to refining and location premiums. As a result, our average price on hedged barrels for 2012 – 2015 is $88 per barrel on a WTI-equivalent basis. |
| 2 | Amounts presented represent contracts for the remaining period of 2012. |
| | | | |
| BARRICK THIRD QUARTER 2012 | | 19 | | MANAGEMENT’S DISCUSSION AND ANALYSIS |
US Dollar Interest Rates
Beginning in 2008, in response to the contraction of global credit markets and in an effort to spur economic activity and avoid potential deflation, the US Federal Reserve reduced its benchmark rate to between 0% and 0.25%. The benchmark was kept at this level through the third quarter of 2012. During the third quarter, the Federal Open Market Committee of the US Federal Reserve released a statement on monetary policy that noted economic conditions are likely to warrant exceptionally low levels for the benchmark rate at least through mid-2015. In addition, we expect the US Federal Reserve to continue to use monetary policy initiatives in an effort to keep long-term interest rates low and increase employment. We expect such initiatives to be followed by incremental increases to short-term rates once economic conditions and credit markets normalize.
At present, our interest rate exposure mainly relates to interest receipts on our cash balances ($2.5 billion at September 30, 2012); the mark-to-market value of derivative instruments; the fair value and ongoing payments under US dollar interest-rate swaps; and to the interest payments on our variable-rate debt ($2.3 billion at September 30, 2012). Currently, the amount of interest expense recorded in our consolidated statement of income is not materially impacted by changes in interest rates, because the majority of debt was issued at fixed interest rates. The relative amounts of variable-rate financial assets and liabilities may change in the future, depending on the amount of operating cash flow we generate, as well as the level of capital expenditures and our ability to borrow on favorable terms using fixed rate debt instruments.
FINANCIAL AND OPERATING RESULTS
Summary of Operating Results
| | | | | | | | | | | | | | | | |
| | | For the three months ended September 30 | | | For the nine months ended September 30 | |
| ($ millions, except per share data in dollars) | | 2012 | | | 2011 | | | 2012 | | | 2011 | |
Revenues | | | $ 3,436 | | | | $ 3,971 | | | | $ 10,358 | | | | $ 10,474 | |
Net earnings | | | 618 | | | | 1,365 | | | | 2,397 | | | | 3,525 | |
Per share1 | | | 0.62 | | | | 1.37 | | | | 2.40 | | | | 3.53 | |
Adjusted net earnings2 | | | 849 | | | | 1,379 | | | | 2,719 | | | | 3,500 | |
Per share1,2 | | | 0.85 | | | | 1.38 | | | | 2.72 | | | | 3.50 | |
EBITDA2 | | | $ 1,499 | | | | $ 2,460 | | | | $ 5,010 | | | | $ 6,378 | |
| 1 | Calculated using weighted average number of shares outstanding under the basic method. |
| 2 | Adjusted net earnings, adjusted EPS and EBITDA are non-GAAP financial performance measures with no standardized definition under IFRS. For further information and a detailed reconciliation, please see pages 43 – 46 of this MD&A. |
Net earnings for the three and nine month periods ended September 30, 2012 were $618 million and $2,397 million, respectively, compared to net earnings of $1,365 million and $3,525 million for the same prior year periods. Adjusted net earnings for the three and nine month periods ended September 30, 2012 were $849 million and $2,719 million, respectively, compared to adjusted net earnings of $1,379 million and $3,500 million for the same prior year periods. The decrease in net earnings and adjusted net earnings for the three month period ended September 30, 2012 was largely driven by lower gold and copper sales volumes and lower realized gold and copper prices, higher cost of sales applicable to gold, partially offset by lower cost of sales applicable to copper and lower income tax expense. The decrease in net earnings and adjusted net earnings for the nine month period ended September 30, 2012 was largely driven by lower gold sales volumes and lower realized copper prices, higher cost of sales applicable to gold and copper, partially offset by higher realized gold prices, higher copper sales volumes and lower income tax expense.
The significant post-tax adjusting items in the third quarter include: $148 million in impairment charges, primarily related to asset impairment charges
on an exploration property in Papua New Guinea, $16 million in unrealized foreign currency translation losses, $71 million in unrealized losses on non-hedge derivative instruments and $7 million related to the impact of changes in the discount rate used to calculate our rehabilitation liability related to our closed sites. Significant post-tax adjusting items for the nine month periods ended September 30, 2012 include: $266 million in impairment charges, which primarily includes asset impairment charges on an exploration property in Papua New Guinea ($141 million), write-down of our investment in Highland Gold ($84 million) and write-downs on our available-for-sale investments ($32 million), $52 million in unrealized losses on non-hedge derivative instruments, $28 million in unrealized foreign currency translation losses, $13 million in severance costs, $41 million in tax adjustments related to a rate change in Canada and Chile and a foreign income tax assessment and $14 million in gains from the sale of assets.
EBITDA was $1,499 million and $5,010 million in the three and nine month periods ended September 30, 2012, respectively, compared to EBITDA of $2,460
| | | | |
| BARRICK THIRD QUARTER 2012 | | 20 | | MANAGEMENT’S DISCUSSION AND ANALYSIS |
million and $6,378 million in the same prior year periods. The decrease in EBITDA primarily reflects the decrease in pre-tax earnings.
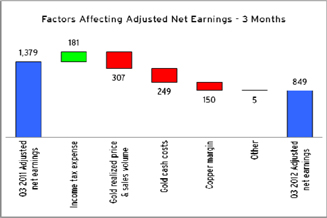
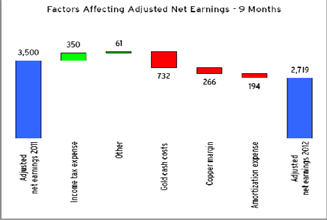
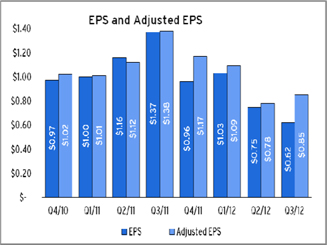
| | | | |
| BARRICK THIRD QUARTER 2012 | | 21 | | MANAGEMENT’S DISCUSSION AND ANALYSIS |
Summary of Cash Flow Performance
| | | | | | | | | | | | | | | | |
| | | For the three months
ended September 30 | | | For the nine months
ended September 30 | |
| ($ millions) | | 2012 | | | 2011 | | | 2012 | | | 2011 | |
Operating cash flow | | | $ 1,732 | | | | $ 1,902 | | | | $ 3,767 | | | | $ 4,091 | |
Adjusted operating cash flow | | | $ 1,267 | | | | $ 2,004 | | | | $ 3,404 | | | | $ 4,381 | |
Adjusted operating cash flow before working capital changes | | | $ 1,300 | | | | $ 1,984 | | | | $ 3,696 | | | | $ 4,455 | |
Operating cash flow and adjusted operating cash flow for the three month period ended September 30, 2012 were $1,732 million and $1,267 million, compared to $1,902 million and $2,004 million, respectively, for the same prior year period. The decrease in operating cash flow primarily reflects lower net earnings and an increased in net working capital outflows, partially offset by a decrease in income tax payments of $220 million. Income tax payments in third quarter 2012 were $250 million, compared to income tax payments of $470 million in the comparable period in 2011. Operating cash flow for the third quarter 2012 reflects $465 million in net proceeds related to the settlement of a portion of our Australian dollar hedge positions. The impact of this settlement was removed from the adjusted operating cash flow.
Operating cash flow for the nine month period ended September 30, 2012 was $3,767 million, compared to operating cash flow of $4,091 million for the same nine month period of 2011. Adjusted operating cash flow for the nine month period ended September 30, 2012 was $3,404 million compared to $4,381 million for the comparable period of 2011. The decreases in operating cash flow and adjusted operating cash flow primarily reflect lower net earnings levels and an increase in net working capital outflows, partially offset by a decrease in income tax payments of $277 million. Income tax payments in the nine month period of 2012 were $1,217 million, compared to income tax payments of $1,494 million made in the comparable period of 2011, which included about $480 million in payments related to 2010. Adjusted operating cash flow was affected by the same factors as operating cash flow and removes the impact of the $465 million in net proceeds related to the settlement of a portion of our Australian dollar hedge positions.
The table below illustrates the impact of changes in gold and copper prices on our earnings and cash flow on an annualized basis, assuming expected 2012 production levels.
| | | | | | | | |
| | | Change in price | | | Annualized approximate impact
on adjusted net earnings and operating
cash flow | |
Gold | | | +/-100/oz | | | | $ 500 million | |
Copper | | | + $ 0.50/lb | | | | $ 150 million | |
Copper | | | - $ 0.50/lb | 1 | | | $ 60 million | |
| 1 | We have certain hedging strategies in place whereby we have hedged a portion of our expected copper production and as a result, our realized copper prices are subject to a floor of $3.75 per pound on approximately 60% of our remaining 2012 production. Consequently, there would be no impact on our adjusted net earnings and operating cash flow for approximately 60% of our remaining expected 2012 copper production if the copper price, which closed at $3.75 per pound on September 28, 2012, decreased below $3.75 per pound. |
| | | | |
| BARRICK THIRD QUARTER 2012 | | 22 | | MANAGEMENT’S DISCUSSION AND ANALYSIS |
Key Operating Performance Metrics
| | | | | | | | | | | | | | | | | | | | | | | | | | | | | | | | |
| | | For the three months ended September 30 | | | For the nine months ended September 30 | |
| | | Gold | | | Copper | | | Gold | | | Copper | |
| ($ millions, except per ounce/pound data in dollars) | | 2012 | | | 2011 | | | 2012 | | | 2011 | | | 2012 | | | 2011 | | | 2012 | | | 2011 | |
Production (000s oz/millions of lbs)1 | | | 1,779 | | | | 1,928 | | | | 112 | | | | 140 | | | | 5,402 | | | | 5,862 | | | | 338 | | | | 308 | |
Revenues | | | | | | | | | | | | | | | | | | | | | | | | | | | | | | | | |
000s oz/millions lbs | | | 1,792 | | | | 1,908 | | | | 84 | | | | 146 | | | | 5,265 | | | | 5,685 | | | | 318 | | | | 309 | |
$ millions2 | | | $ 3,056 | | | | $ 3,395 | | | | $ 307 | | | | $ 489 | | | | $ 8,994 | | | | $ 9,056 | | | | $ 1,148 | | | | $ 1,168 | |
Market price3 | | | 1,652 | | | | 1,702 | | | | 3.50 | | | | 4.07 | | | | 1,652 | | | | 1,534 | | | | 3.61 | | | | 4.20 | |
Realized price3,4 | | | 1,655 | | | | 1,743 | | | | 3.52 | | | | 3.54 | | | | 1,652 | | | | 1,550 | | | | 3.59 | | | | 3.87 | |
Cost of sales | | | 1,529 | | | | 1,293 | | | | 254 | | | | 354 | | | | 4,439 | | | | 3,785 | | | | 861 | | | | 641 | |
Total cash costs3,4 | | | 592 | | | | 453 | | | | | | | | | | | | 584 | | | | 445 | | | | | | | | | |
C1 cash costs3,4 | | | | | | | | | | | 2.33 | | | | 1.83 | | | | | | | | | | | | 2.22 | | | | 1.60 | |
Net cash costs3,4 | | | 537 | | | | 323 | | | | | | | | | | | | 501 | | | | 322 | | | | | | | | | |
| 1 | Reflects our equity share of production. |
| 2 | Represents revenues on a 100% consolidated basis. |
| 3 | Per ounce/pound weighted average. |
| 4 | Realized price, C1 cash costs, total cash costs and net cash costs are non-GAAP financial performance measures with no standardized definition under IFRS. For further information and a detailed reconciliation, please see pages 42 – 46 of this MD&A. |
Revenues
In the third quarter 2012, gold and copper revenues totaled $3,056 million and $307 million, respectively, down 10% and 37% respectively, compared to the third quarter 2011, primarily due to lower realized gold prices and copper prices and lower gold and copper sales volumes. For the nine months ended September 30, 2012, gold and copper revenues totaled $8,994 million and $1,148 million, respectively, down 1% and 2%, respectively, compared to the same prior period in 2011, due to lower gold sales volumes, lower realized copper prices, partially offset by higher realized gold prices and higher copper sales volumes.
Realized gold prices for the three and nine month periods ended September 30, 2012 were $1,655 per ounce and $1,652 per ounce, respectively, down $88 and up $102 per ounce, respectively, compared to the same prior year periods. The decrease in realized prices for the three month period ended September 30, 2012 reflects the decrease in market gold prices. The average quarterly market price of gold was $1,652 per ounce, reflecting a $50 per ounce decrease from the $1,702 per ounce average market price in the same prior year period. The increase in realized price for the nine month period ended September 30, 2012, reflects the increase in market gold prices, which averaged $1,652 per ounce as compared to market gold prices of $1,534 per ounce for the same prior year period. Realized copper prices for the three and nine month periods ended September 30, 2012 were $3.52 per pound and $3.59 per pound, down 1% and 7% respectively, compared to the same prior year periods. The decrease in the copper realized prices for the three month period ended September 30, 2012, reflects lower market prices for copper, which averaged $3.50 per
pound compared to the average market price of $4.07 per pound for the same prior year period. The decrease in the copper realized prices for the nine month period ended September 30, 2012, reflects a decrease in the market prices for copper, which averaged $3.61 per pound compared to an average market price of $4.20 per pound for the same prior year period.
Cost of Sales
Cost of sales applicable to gold for the three and nine month periods ended September 30, 2012 were $1,529 million and $4,439 million, respectively, including depreciation expense of $340 million and $968 million, respectively. This compares to cost of sales of $1,293 million and $3,785 million for the same prior year periods, including depreciation expense of $284 million and $840 million, respectively. The increase in cost of sales for the three month period ended September 30, 2012, reflects higher direct mining costs, including higher labor, energy, maintenance and consumable costs, partially offset by an increase in capitalized waste stripping costs. The increase in cost of sales for the nine month period ended September 30, 2012 reflects higher direct mining costs, partially offset by an increase in capitalized waste stripping costs.
Cost of sales applicable to copper for the three and nine month periods ended September 30, 2012 were $254 million and $861 million, respectively, down 28% and up 34% respectively over the same prior year periods, reflecting lower copper sales volumes and higher direct mining costs at Zaldívar, primarily due to higher power and sulfuric acid prices, and the impact of lower equipment availability at Lumwana. Cost of sales for the
| | | | |
| BARRICK THIRD QUARTER 2012 | | 23 | | MANAGEMENT’S DISCUSSION AND ANALYSIS |
nine month period ended September 30, 2012 was also impacted due to the inclusion of a full period of higher cost production from Lumwana, acquired as part of the Equinox acquisition which closed on June 1, 2011.
Total Cash Costs, C1 Cash Costs and Net Cash Costs
Gold total cash costs for the three and nine month periods ended September 30, 2012 were $592 per ounce and $584 per ounce, respectively, both up 31%, compared to the same prior year periods. The increase reflects the same factors impacting cost of sales applicable to gold, as well as the impact of lower production levels.
Copper C1 cash costs for the three and nine month periods ended September 30, 2012 were $2.33 per pound and $2.22 per pound, respectively, up 27% and 39%, respectively, from the same prior year periods. The increase reflects the same factors impacting cost of sales applicable to copper.
Gold net cash costs for the three and nine month periods ended September 30, 2012 were $537 per ounce and $501 per ounce, respectively, up 66% and 56%, respectively, over the same prior year periods. The increase reflects higher total cash costs per ounce and lower copper credits due to lower realized copper prices and higher C1 cash costs.
Cash Margins
Net cash margins per ounce for the three and nine month periods ended September 30, 2012 were $1,118 per ounce and $1,151 per ounce, respectively, a decrease of 21% and 6%, respectively, over the same prior year periods. Total and net cash margins per ounce illustrate the trends in profitability and the impact of fluctuations in realized prices and net cash costs on our ability to generate earnings and operating cash flow.
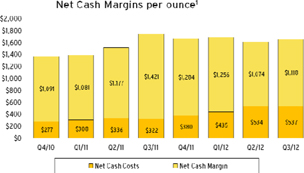
| 1 | Net cash costs and net cash margins are non-GAAP financial performance measures with no standardized definition under IFRS. For further information and a detailed reconciliation, please see pages 45– 47 of this MD&A |
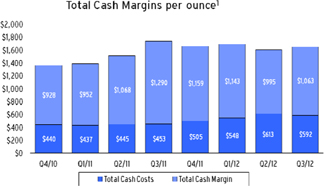
| 1. | Total cash costs and total cash margins are non-GAAP financial performance measures with no standardized definition under IFRS. For further information and a detailed reconciliation, please see pages 44-47 of this MD&A. |
Other Operating Expenses
Other expense for the three and nine month periods ended September 30, 2012 was $142 million and $359 million, respectively, compared to $135 million and $391 million, respectively, for the same prior year periods. The increase in other expense for the third quarter relates to higher currency translation losses and higher RBU general and administrative costs. The decrease in other expense for the nine month period ended September 30, 2012 was primarily due to a $39 million charge in first quarter 2011 for the recognition of a liability for contingent consideration related to the acquisition of the additional 40% of the Cortez property in 2008 and $39 million in acquisition related costs for the Equinox acquisition incurred in the second quarter 2011, partially offset by higher severance costs, higher RBU general and administrative costs and higher corporate social responsibility costs.
Exploration and Evaluation
| | | | | | | | | | | | | | | | |
| | | For the three months
ended September 30 | | | For the nine months
ended September 30 | |
| ($ millions) | | 2012 | | | 2011 | | | 2012 | | | 2011 | |
Exploration: | | | | | | | | | | | | | | | | |
Minesite programs | | | $ 19 | | | | $ 15 | | | | $ 50 | | | | $ 56 | |
Global programs | | | $ 55 | | | | $ 46 | | | | $ 149 | | | | $ 103 | |
Evaluation costs | | | $ 34 | | | | $ 33 | | | | $ 107 | | | | $ 89 | |
| Exploration and evaluation expense | | | $ 108 | | | | $ 94 | | | | $ 306 | | | | $ 248 | |
Exploration and evaluation (“E&E”) expenditures for the three and nine month periods ended September 30, 2012 were $108 million and $306 million respectively. This compares to E&E expenditures for the same prior year periods of $94 million and $248 million, respectively.
The increase is primarily due to increased global exploration activity and an increase in evaluation
| | | | |
| BARRICK THIRD QUARTER 2012 | | 24 | | MANAGEMENT’S DISCUSSION AND ANALYSIS |
expenditures. Exploration expenditures for the global programs increased for the three month and nine month periods ended September 30, 2012, primarily due to programs at Goldrush and Cerro Casale. Minesite exploration expenditures increased for the three months and nine months periods ended September 30, 2012, primarily due to increased exploration activities at Kanowna. The evaluation expenditures increase primarily relates to mine expansion studies at Goldrush.
Finance Cost
| | | | | | | | | | | | | | | | |
| | | For the three months
ended September 30 | | | For the nine months
ended September 30 | |
| ($ millions) | | 2012 | | | 2011 | | | 2012 | | | 2011 | |
Interest Incurred | | | $ 174 | | | | $ 151 | | | | $ 512 | | | | $ 384 | |
Interest Capitalized | | | (152 | ) | | | (99 | ) | | | (420 | ) | | | (276 | ) |
Accretion | | | 11 | | | | 16 | | | | 41 | | | | 40 | |
Finance Cost | | | $ 33 | | | | $ 68 | | | | $ 133 | | | | $ 148 | |
Finance costs incurred for the three and nine month periods ended September 30, 2012 were $33 million and $133 million, respectively, compared to $68 million and $148 million for the same prior year periods. Interest costs incurred for the three and nine month periods ended September 30, 2012 were $174 million and $512 million, respectively, up 15% and 33% from $151 million and $384 million, respectively, from the same prior year periods. The increase in interest costs incurred primarily relates to interest incurred on debt issued and credit facilities drawn on to finance the Equinox acquisition in the second quarter of 2011. Interest capitalized in third quarter 2012 and the nine month period ended September 30, 2012 increased significantly over the comparable prior period primarily due to increased construction activity at our Pueblo Viejo and Pascua-Lama projects. Interest capitalization at Pueblo Viejo is expected to cease in fourth quarter 2012, when the mine is expected to commence commercial production.
Income Tax
Income tax expense was $438 million in the third quarter 2012. After adjusting for the impact of net currency translation losses on deferred tax balances, the impact of tax rate changes in Canada and Chile, and the impact of impairment charges and non-hedge derivatives, the underlying effective tax rate for income in the third quarter 2012 was 32%.
We record deferred tax charges or credits if changes in facts or circumstances affect the estimated tax basis of assets and therefore the amount of deferred tax assets or liabilities to reflect changing expectations in our ability to realize deferred tax assets. The interpretation of tax regulations and legislation and their application to our business is complex and subject to change. We have significant amounts of deferred tax assets, including tax loss carry forwards, and also deferred tax liabilities. Potential changes of any of these amounts, as well as our ability to realize deferred tax assets, could significantly affect net income or cash flow in future periods.
| | | | |
| BARRICK THIRD QUARTER 2012 | | 25 | | MANAGEMENT’S DISCUSSION AND ANALYSIS |
| | | | | | | | | | | | | | | | | | | | | | | | |
| Mining Overview | |
| | | For the three months ended September 30 | | | For the nine months ended September 30 | |
| | | 2012 | | | 2011 | | | % Change | | | 2012 | | | 2011 | | | % Change | |
Gold | | | | | | | | | | | | | | | | | | | | | | | | |
Ore tons mined (000s) | | | 41,046 | | | | 42,653 | | | | (4 | %) | | | 122,618 | | | | 111,174 | | | | 10 | % |
Waste tons mined (000s) | | | 134,711 | | | | 136,259 | | | | (1 | %) | | | 395,678 | | | | 437,123 | | | | (9 | %) |
Total tons mined (000s) | | | 175,758 | | | | 178,912 | | | | (2 | %) | | | 518,295 | | | | 548,297 | | | | (5 | %) |
Ore tons processed (000s) | | | 37,656 | | | | 44,078 | | | | (15 | %) | | | 111,879 | | | | 121,062 | | | | (8 | %) |
Average grade (ozs/ton) | | | 0.054 | | | | 0.052 | | | | 4 | % | | | 0.055 | | | | 0.056 | | | | (2 | %) |
Recovery rate | | | 87.5 | % | | | 84.1 | % | | | 4 | % | | | 87.8 | % | | | 86.5 | % | | | 2 | % |
Gold produced (000s/oz) | | | 1,779 | | | | 1,928 | | | | (8 | %) | | | 5,402 | | | | 5,862 | | | | (8 | %) |
Copper | | | | | | | | | | | | | | | | | | | | | | | | |
Ore tons mined (000s) | | | 14,300 | | | | 13,922 | | | | 3 | % | | | 47,943 | | | | 35,419 | | | | 35 | % |
Waste tons mined (000s) | | | 42,029 | | | | 30,278 | | | | 39 | % | | | 103,480 | | | | 55,416 | | | | 87 | % |
Total tons mined (000s) | | | 56,330 | | | | 44,200 | | | | 27 | % | | | 151,422 | | | | 90,835 | | | | 67 | % |
Ore tons processed (000s) | | | 19,212 | | | | 19,224 | | | | - | | | | 53,497 | | | | 41,861 | | | | 28 | % |
Average grade (percent) | | | 0.520 | | | | 0.562 | | | | (7 | %) | | | 0.510 | | | | 0.547 | | | | (7 | %) |
Copper produced (millions of lbs) | | | 112 | | | | 140 | | | | (20 | %) | | | 338 | | | | 308 | | | | 10 | % |
Production – Gold
Gold production for the three month period ended September 30, 2012 decreased by 8% over the same prior year period, primarily due to lower production in South America, North America and ABG, partially offset by slightly higher production in Australia Pacific. For the nine month period ended September 30, 2012 gold production decreased by 8% over the same prior year period primarily due to lower production across all of our regions.
Tons Mined and Tons Processed – Gold
Total tons mined for the three and nine month periods ended September 30, 2012 were 2% and 5% lower than the same prior year periods. Ore tons processed for the three and nine month periods ended September 30, 2012 were 15% and 8% lower than the same prior year periods. The decreases in tons mined for the three month period ended September 30, 2012 were primarily due to decreased mining activity at Pierina, Golden Sunlight, Porgera and North Mara, partially offset by the increased mining activity at Buzwagi, Cortez, Goldstrike and Round Mountain. The decreases in tons mined for the nine month period ended September 30, 2012 were primarily due to decreased mining activity at Pierina, Golden Sunlight, Veladero, Goldstrike and North Mara, partially offset by the increased mining activity at Buzwagi, Round Mountain and Bald Mountain. The decrease in ore tons processed for the three month period ended were primarily due to decreases at Pierina, Porgera and Round Mountain. The decrease in ore tons processed for the nine month period ended were primarily due to decreases at Pierina, Veladero and Round Mountain, partially offset by an increase at Bald Mountain. Higher tons were mined and processed at Bald Mountain as a result of a mine expansion which was completed towards the end of 2011.
Production – Copper
Copper production for the three month period ended September 30, 2012 decreased by 20% over the same prior year period, primarily due to lower production at Lumwana and lower grade. For the nine month period ended September 30, 2012, copper production increased by 10% over the same prior year period primarily due to the inclusion of production from Lumwana which was acquired as part of the Equinox transaction on June 1, 2011.
Tons Mined and Tons Processed – Copper
Total tons mined for the three and nine month periods ended September 30, 2012 were 27% and 67% higher than the same prior year periods. Ore tons processed for the three and nine month periods ended September 30, 2012 were slightly lower and 28% higher than the same prior year periods, respectively. The increases are primarily due to an increase in tons mined at Lumwana. Ore tons processed decreased slightly for the three month period ended September 30, 2012 primarily due to decreases at Lumwana, partially offset by an increase at Zaldívar. The increase in ore tons processed for the nine month period ended September 30, 2012 was due to increases at both Lumwana and Zaldívar.
| | | | |
| BARRICK THIRD QUARTER 2012 | | 26 | | MANAGEMENT’S DISCUSSION AND ANALYSIS |
Review of Operating Segments Performance
North America
Summary of Financial and Operating Data
| | | | | | | | | | | | | | | | | | | | | | | | |
| | | For the three months ended September 30 | | | For the nine months ended September 30 | |
| | | 2012 | | | 2011 | | | % Change | | | 2012 | | | 2011 | | | % Change | |
Total tons mined (000s) | | | 103,004 | | | | 97,332 | | | | 6 | % | | | 310,972 | | | | 309,994 | | | | | - |
Ore tons processed (000s) | | | 14,965 | | | | 17,388 | | | | (14 | %) | | | 44,562 | | | | 45,045 | | | | (1 | %) |
Average grade (ozs/ton) | | | 0.061 | | | | 0.054 | | | | 13 | % | | | 0.065 | | | | 0.066 | | | | (2 | %) |
Gold produced (000s/oz) | | | 795 | | | | 836 | | | | (5 | %) | | | 2,537 | | | | 2,621 | | | | (3 | %) |
Cost of sales ($ millions) | | | $ 550 | | | | $ 488 | | | | 13 | % | | | $ 1,699 | | | | $ 1,440 | | | | 18 | % |
Total cash costs (per oz) 1 | | | $ 508 | | | | $ 415 | | | | 22 | % | | | $506 | | | | $ 405 | | | | 25 | % |
Segment income ($ millions)2 | | | $ 717 | | | | $ 998 | | | | (28 | %) | | | $ 2,313 | | | | $ 2,452 | | | | (6 | %) |
Segment EBITDA ($ millions)1 | | | $ 862 | | | | $ 1,118 | | | | (23 | %) | | | $ 2,753 | | | | $ 2,828 | | | | (3 | %) |
Capital expenditures ($ millions)3 | | | $ 343 | | | | $ 265 | | | | 29 | % | | | $ 880 | | | | $ 647 | | | | 36 | % |
| 1 | Total cash costs and EBITDA are non-GAAP financial performance measures with no standardized definition under IFRS. For further information and a detailed reconciliation, please see pages 44-46 of this MD&A. |
| 2 | Segment income excludes income taxes. |
| 3 | Amounts presented represent expenditures for minesite expansion, minesite sustaining as well as open pit and underground mine development on a cash basis excluding capitalized interest. |
Segment EBITDA and segment income decreased by $256 million and $281 million, respectively, for the three month period ended September 30, 2012 and $75 million and $139 million, respectively, for the nine month period ended September 30, 2012, compared to the same prior year periods. The decreases for the three month period ended September 30, 2012 were primarily as a result of lower sales volumes, higher total cash costs and lower realized prices. The decreases for the nine month period ended September 30, 2012 reflect the same factors affecting the three month period, except for realized prices which were higher in the nine month period ended September 30, 2012, compared to the same prior year period.
Gold production for the three and nine month periods ended September 30, 2012 was lower by 5% and 3%, respectively, from the same prior year periods. These decreases were mainly due to lower production at Cortez and Ruby Hill, partially offset by higher production at Bald Mountain. In addition, gold production was higher at Goldstrike for the three month period ended September 30, 2012.
Production at Cortez decreased by 35% and 10%, respectively, for the three and nine months period ended September 30, 2012, compared to the same prior year periods, primarily as a result of lower average head grades due to mine sequencing. Production at Ruby Hill decreased by 79% and 66%, respectively for the three and nine months period ended September 30, 2012 compared to the same prior year periods, due to lower ore grades. Production at Bald Mountain increased by 34% and 119% respectively for the three and nine months period ended September 30, 2012 compared to the same
prior year periods, mainly due to higher grade. In addition, higher tons were mined and processed at Bald Mountain for the nine month period ended September 30, 2012 as a result of a mine expansion, which was completed towards the end of 2011. Production at Goldstrike increased by 36% for the three month period ended September 30, 2012 compared to the same prior year period, primarily due to increased productivity following maintenance improvements in the first half of the year and from access to higher grades from the open pit.
Cost of sales for the three and nine month periods ended September 30, 2012 were higher by 13% and 18%, respectively, compared to the same prior year periods, primarily due to higher direct mining costs, particularly for labor and consumables and a decrease in capitalized waste stripping costs at Goldstrike and Cortez. Total cash costs were up 22% and 25%, to $508 per ounce and $506 per ounce, respectively, for the three and nine month periods ended September 30, 2012 compared to the same prior periods, primarily due to the increase in direct mining costs and the impact of lower production levels.
We expect full year production for the region to be 3.425-3.55 million ounces at total cash costs of $475-$525 per ounce, both within the previous guidance ranges.
Capital expenditures for the three and nine month periods ended September 30, 2012 were higher by 29% and 36%, respectively, compared to the same prior year periods, primarily due to higher minesite sustaining capital expenditures at Cortez and higher expansionary capital expenditures at Goldstrike.
| | | | |
| BARRICK THIRD QUARTER 2012 | | 27 | | MANAGEMENT’S DISCUSSION AND ANALYSIS |
South America
Summary of Financial and Operating Data
| | | | | | | | | | | | | | | | | | | | | | | | |
| | | For the three months ended September 30 | | | For the nine months ended September 30 | |
| | | 2012 | | | 2011 | | | % Change | | | 2012 | | | 2011 | | | % Change | |
Total tons mined (000s) | | | 34,579 | | | | 41,064 | | | | (16 | %) | | | 99,670 | | | | 122,965 | | | | (19 | %) |
Ore tons processed (000s) | | | 14,327 | | | | 18,446 | | | | (22 | %) | | | 42,576 | | | | 51,708 | | | | (18 | %) |
Average grade (ozs/ton) | | | 0.031 | | | | 0.035 | | | | (11 | %) | | | 0.031 | | | | 0.034 | | | | (9 | %) |
Gold produced (000s/oz) | | | 394 | | | | 475 | | | | (17 | %) | | | 1,172 | | | | 1,426 | | | | (18 | %) |
Cost of sales ($ millions) | | | $ 258 | | | | $ 219 | | | | 18 | % | | | $ 686 | | | | $ 649 | | | | 6 | % |
Total cash costs (per oz) 1 | | | $ 440 | | | | $ 358 | | | | 23 | % | | | $ 437 | | | | $ 358 | | | | 22 | % |
Segment income ($ millions)2 | | | $ 364 | | | | $ 494 | | | | (26 | %) | | | $ 1,024 | | | | $ 1,299 | | | | (21 | %) |
Segment EBITDA ($ millions)1 | | | $ 437 | | | | $ 550 | | | | (21 | %) | | | $ 1,215 | | | | $ 1,459 | | | | (17 | %) |
Capital expenditures ($ millions)3 | | | $ 79 | | | | $ 80 | | | | (1 | %) | | | $ 235 | | | | $ 204 | | | | 15 | % |
| 1 | Total cash costs and EBITDA are non-GAAP financial performance measures with no standardized definition under IFRS. For further information and a detailed reconciliation, please see pages 44-46 of this MD&A. |
| 2 | Segment income excludes income taxes. |
| 3 | Amounts presented represent expenditures for minesite expansion, minesite sustaining as well as open pit and underground mine development on a cash basis excluding capitalized interest. |
Segment EBITDA and segment income decreased by $113 million and $130 million, respectively, for the three month period ended September 30, 2012 and $244 million and $275 million, respectively, for the nine month period ended September 30, 2012, compared to the same prior year periods. The decreases for the three month period ended September 30, 2012 were primarily as a result of lower sales volumes, higher total cash costs and lower realized prices. The decreases for the nine month period ended September 30, 2012 reflect the same factors affecting the three month period, except for realized prices which were higher in the nine month period ended September 30, 2012, compared to the same prior year period.
Gold production for the three and nine month periods ended September 30, 2012 was lower by 17% and 18%, respectively, compared to the same prior year periods. These decreases were primarily due to lower production at Veladero and Lagunas Norte. Production was lower at Veladero reflecting the impact of lower recoveries due to lower leach pad kinetics during the third quarter. Leach recoveries have improved with higher solution rates and better ore permeability, which is expected to continue and result in higher fourth quarter production. The decrease at Lagunas Norte was due to the processing of lower grade ore due to mine sequencing.
Cost of sales applicable to gold for the three and nine month periods ended September 30, 2012 were higher by 18% and 6%, respectively, compared to the same prior year periods. The increases were primarily due to higher direct mining costs, largely due to inflationary pressures in Argentina and an increase in consumable costs,
partially offset by higher capitalized waste stripping costs at Veladero and the impact of lower sales volume. Total cash costs were up 23% and 22%, to $440 per ounce and $437 per ounce respectively, for the three and nine month periods ended September 30, 2012 compared to the same prior year periods, reflecting higher direct mining costs and the impact of lower production levels.
We expect full year production for the region to be 1.55-1.65 million ounces at total cash costs of $430-$480 per ounce, both within the previous guidance ranges.
Capital expenditures for the three and nine month periods ended September 30, 2012 were slightly lower and higher by 15%, respectively, compared to the same prior year periods. Capital expenditures were slightly lower for the three month period ended September 30, 2012 primarily due to lower minesite sustaining capital expenditures at Veladero, partially offset by higher minesite expansion expenditures at Lagunas Norte. Capital expenditures were higher for the nine month period ended September 30, 2012 primarily due to higher capitalized stripping at Veladero.
| | | | |
| BARRICK THIRD QUARTER 2012 | | 28 | | MANAGEMENT’S DISCUSSION AND ANALYSIS |
Australia Pacific
Summary of Financial and Operating Data
| | | | | | | | | | | | | | | | | | | | | | | | |
| | | For the three months ended September 30 | | | For the nine months ended September 30 | |
| | | 2012 | | | 2011 | | | % Change | | | 2012 | | | 2011 | | | % Change | |
Total tons mined (000s) | | | 27,841 | | | | 30,866 | | | | (10 | %) | | | 79,880 | | | | 87,229 | | | | (8 | %) |
Ore tons processed (000s) | | | 6,825 | | | | 6,560 | | | | 4 | % | | | 20,153 | | | | 19,682 | | | | 2 | % |
Average grade (ozs/ton) | | | 0.080 | | | | 0.083 | | | | (4 | %) | | | 0.077 | | | | 0.082 | | | | (6 | %) |
Gold produced (000s/oz) | | | 481 | | | | 472 | | | | 2 | % | | | 1,352 | | | | 1,394 | | | | (3 | %) |
Cost of sales ($ millions) | | | $ 519 | | | | $ 400 | | | | 30 | % | | | $ 1,454 | | | | $ 1,155 | | | | 26 | % |
Total cash costs (per oz) 1 | | | $ 815 | | | | $ 609 | | | | 34 | % | | | $ 804 | | | | $ 601 | | | | 34 | % |
Segment income ($ millions)2 | | | $ 296 | | | | $ 414 | | | | (29 | %) | | | $ 838 | | | | $ 1,009 | | | | (17 | %) |
Segment EBITDA ($ millions)1 | | | $ 380 | | | | $ 495 | | | | (23 | %) | | | $ 1,076 | | | | $ 1,225 | | | | (12 | %) |
Capital expenditures ($ millions)3 | | | $ 116 | | | | $ 143 | | | | (19 | %) | | | $ 356 | | | | $ 352 | | | | 1 | % |
| 1 | Total cash costs and EBITDA are non-GAAP financial performance measures with no standardized definition under IFRS. For further information and a detailed reconciliation, please see pages 44-46 of this MD&A. |
| 2 | Segment income excludes income taxes. |
| 3 | Amounts presented represent expenditures for minesite expansion, minesite sustaining as well as open pit and underground mine development on a cash basis excluding capitalized interest. |
Segment EBITDA and segment income decreased by $115 million and $118 million, respectively, for the three month period ended September 30, 2012 and $149 million and $171 million, respectively, for the nine month period ended September 30, 2012, compared to the same prior year periods. The decreases for the three month period ended September 30, 2012 were primarily as a result of higher total cash costs and lower realized prices, partially offset by higher sales volumes. The decreases for the nine month period ended September 30, 2012 were primarily due to lower sales volumes, higher total cash costs, partially offset by higher realized prices.
Gold production for the three and nine month periods ended September 30, 2012 was higher by 2% and lower by 3%, respectively, compared to the same prior year periods. Gold production was higher for the three month period ended September 30, 2012, primarily due to higher production at Yilgarn South, Cowal, Kanowna, partially offset by lower production at Kalgoorlie. Gold production was lower for the nine month period ended September 30, 2012, primarily due to lower production at Porgera and Kalgoorlie, partially offset by higher production at Yilgarn South.
Production at Yilgarn South increased by 19% and 35%, respectively, for the three and nine month periods ended September 30, 2012, compared to the same prior year periods due to higher tons mined and processed at Granny Smith and Lawlers and higher head grade at Lawlers for the nine month period ended September 30, 2012. Production was higher at Cowal by 23%, for the three month period ended September 30, 2012, compared to the same prior year period primarily due to a shift in mining activity to higher grade areas of the pit.
Production at Kanowna increased by 26%, for the three month period ended September 30, 2012, compared to the same prior year periods due to higher head grades. Production at Kalgoorlie decreased by 31% and 18% for the three and nine month periods ended September 30, 2012, respectively, compared to the same prior periods as a result of lower grade ore from the open pit. Production at Porgera decreased by 7% and 15%, respectively, for the three and nine month periods ended September 30, 2012, compared to the same prior periods due to pit wall remediation activities, which prevented us from mining in higher grade zones of the pit. Production at Porgera was also impacted by power supply interruptions, labour issues and a decrease in underground mining activity for the nine month period ended September 30, 2012.
Cost of sales applicable to gold for the three and nine month periods ended September 30, 2012 were higher by 30% and 26%, respectively, compared to the same prior year periods. The increases were primarily due to higher direct mining costs, particularly for labor, freight, Porgera power costs and diesel. The increase in direct mining costs was partially offset by an increase in capitalized waste stripping costs at Kalgoorlie. Total cash costs were $815 per ounce and $804 per ounce, both up 34%, respectively, for the three and nine month periods ended September 30, 2012 compared to the same prior periods, reflecting higher direct mining costs and the impact of lower production levels during the nine month period ended September 30, 2012.
Full year production for Australia Pacific is expected to be about 1.80 million ounces at total cash costs of approximately $800 per ounce, both in line with previous guidance.
| | | | |
| BARRICK THIRD QUARTER 2012 | | 29 | | MANAGEMENT’S DISCUSSION AND ANALYSIS |
Capital expenditures for the three and nine month periods ended September 30, 2012 were lower by 19% and slightly higher, respectively, compared to the same prior year periods, primarily due to lower minesite sustaining capital
expenditures at Porgera and Kalgoorlie, partially offset by higher open pit and underground development expenditures at Kalgoorlie.
African Barrick Gold
Summary of Financial and Operating Data
| | | | | | | | | | | | | | | | | | | | | | | | |
| | | For the three months ended September 30 | | | For the nine months ended September 30 | |
| 100% basis | | 2012 | | | 2011 | | | % Change | | | 2012 | | | 2011 | | | % Change | |
Total tons mined (000s) | | | 13,984 | | | | 13,058 | | | | 7 | % | | | 37,582 | | | | 38,036 | | | | (1 | %) |
Ore tons processed (000s) | | | 2,083 | | | | 2,279 | | | | (9 | %) | | | 6,208 | | | | 6,262 | | | | (1 | %) |
Average grade (ozs/ton) | | | 0.079 | | | | 0.092 | | | | (14 | %) | | | 0.082 | | | | 0.097 | | | | (15 | %) |
Gold produced (000s/oz) | | | 148 | | | | 182 | | | | (19 | %) | | | 446 | | | | 528 | | | | (16 | %) |
Cost of sales ($ millions) | | | $ 195 | | | | $ 182 | | | | 7 | % | | | $ 582 | | | | $ 523 | | | | 11 | % |
Total cash costs (per oz) 2 | | | $ 965 | | | | $ 687 | | | | 40 | % | | | $ 946 | | | | $ 666 | | | | 42 | % |
Segment income ($ millions)3 | | | $ 41 | | | | $ 139 | | | | (71 | %) | | | $ 139 | | | | $ 316 | | | | (56 | %) |
Segment EBITDA ($ millions)2 | | | $ 83 | | | | $ 175 | | | | (53 | %) | | | $ 255 | | | | $ 419 | | | | (39 | %) |
Capital expenditures ($ millions)4 | | | $ 121 | | | | $ 85 | | | | 42 | % | | | $ 237 | | | | $ 202 | | | | 17 | % |
| | | | | | |
| | | | | | | | | | | | | | | | | | | | | | | | | |
| | | For the three months ended September 30 | | | For the nine months ended September 30 | |
| 73.9% basis1 | | 2012 | | | 2011 | | | % Change | | | 2012 | | | 2011 | | | % Change | |
Total tons mined (000s) | | | 10,334 | | | | 9,650 | | | | 7 | % | | | 27,773 | | | | 28,109 | | | | (1 | %) |
Ore tons processed (000s) | | | 1,539 | | | | 1,684 | | | | (9 | %) | | | 4,588 | | | | 4,627 | | | | (1 | %) |
Average grade (ozs/ton) | | | 0.079 | | | | 0.092 | | | | (14 | %) | | | 0.082 | | | | 0.097 | | | | (15 | %) |
Gold produced (000s/oz) | | | 109 | | | | 135 | | | | (19 | %) | | | 329 | | | | 391 | | | | (16 | %) |
Cost of sales ($ millions) | | | $ 144 | | | | $ 134 | | | | 7 | % | | | $ 430 | | | | $ 386 | | | | 11 | % |
Total cash costs (per oz) 2 | | | $ 965 | | | | $ 687 | | | | 40 | % | | | $ 946 | | | | $ 666 | | | | 42 | % |
Segment income ($ millions)3 | | | $ 30 | | | | $ 103 | | | | (71 | %) | | | $ 103 | | | | $ 234 | | | | (56 | %) |
Segment EBITDA ($ millions)2 | | | $ 61 | | | | $ 129 | | | | (53 | %) | | | $ 188 | | | | $ 310 | | | | (39 | %) |
Capital expenditures ($ millions)4 | | | $ 89 | | | | $ 63 | | | | 41 | % | | | $ 175 | | | | $ 149 | | | | 17 | % |
| 1 | These amounts represent our equity share of results. The dilution of our ownership interest in ABG to approximately 73.9% impacts our operating statistics from second quarter 2010 onwards. |
| 2 | Total cash costs and EBITDA are non-GAAP financial performance measures with no standardized definition under IFRS. For further information and a detailed reconciliation, please see pages 44-46 of this MD&A. |
| 3 | Segment income excludes income taxes. |
| 4 | Amounts presented represent expenditures for minesite expansion, minesite sustaining as well as open pit and underground mine development on a cash basis excluding capitalized interest. |
Segment EBITDA and segment income, on a 100% basis, decreased by $92 million and $98 million, respectively, for the three month period ended September 30, 2012, and $164 million and $177 million, respectively, for the nine month period ended September 30, 2012 compared to the same prior year periods. The decreases for the three month period ended September 30, 2012 were primarily as a result of lower sales volumes, higher total cash costs and lower realized prices. The decreases for the nine month period ended September 30, 2012 reflects the same factors affecting the three month period, except for realized prices which were higher in the nine month period ended September 30, 2012, compared to the same prior year period.
Gold production, on a 100% basis, for the three and nine month periods ended September 30, 2012 was down 19%
and 16%, respectively, compared to the same prior year periods. The decrease in production was primarily driven by Buzwagi and Tulawaka. Production at Buzwagi decreased by 50% and 36%, respectively, for the three and nine month periods ended September 30, 2012 compared to the same prior year periods due to a significant waste stripping campaign and the processing of lower grade ore. Planned relining of the SAG mills also impacted production levels. Production at Tulawaka decreased by 47% and 39%, respectively, for the three and nine month periods ended September 30, 2012 compared to the same prior year periods, mainly as a result of lower mill throughput due to a switch to batch milling due to the decline in mining rates and ore stockpile levels as Tulawaka nears the end of its economic life.
| | | | |
| BARRICK THIRD QUARTER 2012 | | 30 | | MANAGEMENT’S DISCUSSION AND ANALYSIS |
Cost of sales, on a 100% basis, for the three and nine month periods ended September 30, 2012 were up 7% and 11%, respectively, compared to the same prior year periods, primarily due to an increase in direct mining costs, which is largely due to inflationary pressures reflected in increased labour, consumable costs, general administration and maintenance costs as well as increased energy costs due to increased fuel usage driven by the requirement to self generate power. Total cash costs for the three and nine month periods ended September 30, 2012 were up 40% and 42%, respectively, compared to the same prior year periods, reflecting higher direct mining costs and lower production levels.
We now expect our equity share of gold production for the year to be 5-10 percent below the bottom end of our previous guidance range of 0.500-0.535 million ounces.
The decrease primarily reflects lower than expected production at North Mara in the fourth quarter due to a waste stripping deficit, which will delay access to higher grade areas of the pit, and lower production at Buzwagi.
We now expect total cash costs to be $900 to $950 per ounce, which is higher than the previously announced guidance of $790 to $860 per ounce.
Capital expenditures, on a 100% basis, for the three and nine month periods ended September 30, 2012 were higher by 42% and 17%, respectively, compared to the same prior year periods, primarily due to lower open pit and underground development expenditures at Bulyanhulu.
Capital Projects
Summary of Financial and Operating Data
| | | | | | | | | | | | | | | | | | | | | | | | |
| ($ millions) | | For the three months ended September 30 | | | For the nine months ended September 30 | |
| | | 2012 | | | 2011 | | | % Change | | | 2012 | | | 2011 | | | % Change | |
Total E&E expenses1 | | | 2 | | | | 11 | | | | (82 | %) | | | 21 | | | | 32 | | | | (34 | %) |
Segment income (loss) | | | (18 | ) | | | (30 | ) | | | (40 | %) | | | (56 | ) | | | (53 | ) | | | 6 | % |
Segment EBITDA2 | | | (16 | ) | | | (29 | ) | | | (45 | %) | | | (50 | ) | | | (52 | ) | | | (4 | %) |
Capital expenditures3 | | | | | | | | | | | | | | | | | | | | | | | | |
Pascua-Lama | | | 441 | | | | 301 | | | | 47 | % | | | 1,212 | | | | 799 | | | | 52 | % |
Pueblo Viejo | | | 110 | | | | 113 | | | | (3 | %) | | | 331 | | | | 399 | | | | (17 | %) |
Cerro Casale | | | 5 | | | | 21 | | | | (76 | %) | | | 27 | | | | 62 | | | | (56 | %) |
Equity investees | | | 6 | | | | 9 | | | | (33 | %) | | | 14 | | | | 16 | | | | (13 | %) |
Total capital expenditures | | | 562 | | | | 444 | | | | 27 | % | | | 1,584 | | | | 1,276 | | | | 24 | % |
Currency hedge impact (gain) / loss4 | | | (6 | ) | | | (3 | ) | | | 100 | % | | | (15 | ) | | | (10 | ) | | | 50 | % |
Adjusted capital expenditures | | | 556 | | | | 441 | | | | 26 | % | | | 1,569 | | | | 1,266 | | | | 24 | % |
Capital commitments5 | | | | | | | | | | | | | | | $ 1,923 | | | | $ 1,494 | | | | 29 | % |
| 1 | Amounts presented represent our share of Exploration and Evaluation (“E&E”) expense. |
| 2 | EBITDA is a non-GAAP financial performance measure with no standardized definition under IFRS. For further information and a detailed reconciliation, please see page 46 of this MD&A. |
| 3 | Amounts presented represent our share of capital expenditures on a cash basis. |
| 4 | Amounts presented include impacts of our hedge and non-hedge contracts for pre-production capital at our Pascua Lama and Cerro Casale projects. |
| 5 | Capital commitments represent purchase obligations as at September 30, 2012 where binding commitments have been entered into for long lead capital items related to construction activities at our projects. |
For the three and nine month periods ended September 30, 2012, we spent $2 million and $21 million in E&E expenses, respectively, and incurred $562 million (our share) and $1,584 million (our share) in capital expenditures, respectively. This compares to E&E expenses of $11 million and $32 million, respectively, and capital expenditures of $444 million and $1,276 million, respectively, for the same prior year periods. The increase in capital expenditures primarily relates to increased construction activities at our Pascua-Lama project.
Further information about our projects in construction, namely Pueblo Viejo and Pascua-Lama, and projects in feasibility, namely Cerro Casale and Donlin Gold, is provided in the Business Overview section on pages 13 to 15.
| | | | |
| BARRICK THIRD QUARTER 2012 | | 31 | | MANAGEMENT’S DISCUSSION AND ANALYSIS |
Copper
Summary of Financial and Operating Data
| | | | | | | | | | | | | | | | | | | | | | | | |
| | | For the three months ended September 30 | | | For the nine months ended September 30 | |
| | | 2012 | | | 2011 | | | % Change | | | 2012 | | | 2011 | | | % Change | |
Copper produced (millions of lbs) | | | 112 | | | | 140 | | | | (20 | %) | | | 338 | | | | 308 | | | | 10 | % |
Cost of sales ($ millions) | | | $ 254 | | | | $ 354 | | | | (28 | %) | | | $ 861 | | | | $ 641 | | | | 34 | % |
C1 cash costs (per lb) 1 | | | $ 2.33 | | | | $ 1.83 | | | | 27 | % | | | $ 2.22 | | | | $ 1.60 | | | | 39 | % |
C3 fully allocated costs (per lb) 1 | | | $ 3.28 | | | | $ 2.70 | | | | 23 | % | | | $ 2.94 | | | | $ 2.21 | | | | 34 | % |
Segment income ($ millions)2 | | | $ 39 | | | | $ 129 | | | | (70 | %) | | | $ 263 | | | | $ 529 | | | | (50 | %) |
Segment EBITDA ($ millions)1 | | | $ 86 | | | | $ 193 | | | | (55 | %) | | | $ 430 | | | | $ 639 | | | | (33 | %) |
Capital expenditures ($ millions)3 | | | $ 164 | | | | $ 144 | | | | 14 | % | | | $ 501 | | | | $ 190 | | | | 164 | % |
| 1 | C1 cash costs, C3 fully allocated costs and EBITDA are non-GAAP financial performance measures with no standardized definition under IFRS. For further information and a detailed reconciliation, please see page 42-47 of this MD&A. |
| 2 | Segment income excludes income taxes. |
| 3 | Amounts presented represent expenditures for minesite expansion, minesite sustaining, copper projects as well as open pit and underground mine development on a cash basis excluding capitalized interest. |
Segment EBITDA and segment income decreased by $107 million and $90 million, respectively, in the three month period ended September 30, 2012 and $209 million and $266 million, respectively, in the nine month period ended September 30, 2012, compared to the same prior year periods. The decreases for the three month period ended September 30, 2012 were primarily a result of lower realized copper prices, higher C1 cash costs and lower sales volumes resulting from the labor strike at the port of Antofagasta. The decreases for the nine month period ended September 30, 2012 reflects the same factors affecting the three month period, except for sales volumes which were higher in the nine month period ended September 30, 2012, compared to the same prior year period.
Copper production for the three month period ended September 30, 2012 was lower by 20% from the same prior year periods. The decrease in production level was mainly due to lower production at Lumwana due to lower tons processed due to maintenance at the crusher and the impact of lower ore grade. Copper production for the nine month period ended September 30, 2012 was higher by 10%, from the same prior year period. The increase in production level was primarily due to the inclusion of a full nine months of production from Lumwana. Copper sales were negatively impacted in third quarter 2012 by the labor strike at the port of Antofagasta as the shipment of 26 million pounds was delayed. These sales will be recorded in the fourth quarter.
Cost of sales for the three and nine months periods ended September 30, 2012 were lower by 28% from the same prior year period, primarily due to the impact of lower sales volumes at Zaldívar as the shipments were delayed due to a the labor strike at the port of Antofagasta. Cost of sales for the nine month periods ended September 30,
2012 were higher by 34%, from the same prior year period, primarily due to the inclusion of higher cost Lumwana production. C1 cash costs per pound were up 27% and 39%, to $2.33 and $2.22 per pound, respectively, for the three and nine month periods ended September 30, 2012, primarily reflecting the adverse effect of the above factors on unit production costs.
The Zaldívar copper mine in Chile produced 66 million pounds at C1 cash costs of $1.63 per pound in the third quarter. The Lumwana mine in Zambia produced 45 million pounds of copper at C1 cash costs of $2.90 per pound.
Expected 2012 production for Lumwana is 155-165 million pounds, within prior guidance of 145-165 million pounds, at previously guided C1 cash costs of $3.30-$3.50 per pound. In the second quarter of 2012, we determined the need to advance a number of key initiatives in an effort to achieve better longer-term results. The migration to an owner maintained operation to improve maintenance practices and equipment availability is progressing. Additional staffing and training is underway and maintenance technicians have been redeployed from other sites to assist with the transition. Infrastructure improvements to help mitigate the impact of the annual rainy season have been completed.
During the third quarter, Barrick strengthened its Global Copper Business Unit (CBU) organization by appointing a new President and senior leadership team, which is in line with its objective of maximizing returns and free cash flow from its assets. The changes will further assist in efforts to address the near-term challenges at Lumwana and Jabal Sayid and to evaluate the expansion opportunities at Lumwana and Zaldívar.
| | | | |
| BARRICK THIRD QUARTER 2012 | | 32 | | MANAGEMENT’S DISCUSSION AND ANALYSIS |
Higher grades at Lumwana are expected in 2013, with production anticipated to be about 250 million pounds at lower C1 cash costs. The scale of the Chimiwungo ore body is expected to allow for more productive mining and it will be the primary future supply of ore for the operation. Exploration results to date continue to confirm the upside potential of Chimiwungo. We are nearing completion of a substantial in-fill drilling program to provide a more precise model of the ore body for mine planning purposes. We continue to expect completion of these programs at the end of the year and the results will form the basis for an updated resource base and life-of-mine plan, which will be used to conduct the annual test for goodwill impairment at the end of 2012 and an impairment test for non-current assets if an indicator of impairment is identified. They will also be incorporated into a prefeasibility study on the expansion opportunity for Lumwana, which has the potential to double processing rates. The prefeasibility study is expected to be completed in the second half of 2013.
Full year 2012 and 2013 copper production is now expected to be about 450 million pounds and 500-550 million pounds, respectively, as a result of the delay in first production at Jabal Sayid in Saudi Arabia. C1 cash costs in 2012 are still anticipated to be $2.10-$2.30 per pound.
Capital expenditures for the three and nine month periods ended September 30, 2012 were higher by 14% and 164%, respectively, compared to the same prior year periods. Capital expenditures were higher for the three month period ended September 30, 2012 primarily due to higher open pit development expenditures at Lumwana. Capital expenditures were higher for the nine month period ended September 30, 2012 primarily due to the inclusion of a full nine months of capital expenditures at Jabal Sayid and Lumwana.
Further information about our Jabal Sayid copper project, currently in construction, copper projects in feasibility including Kabanga, copper projects in expansion including Zaldívar Sulfides Expansion and Lumwana Expansion is provided in the Business Overview section on pages 13 to 15.
| | | | |
| BARRICK THIRD QUARTER 2012 | | 33 | | MANAGEMENT’S DISCUSSION AND ANALYSIS |
FINANCIAL CONDITION REVIEW
Summary Balance Sheet and Key Financial Ratios
| | | | | | | | |
($ millions, except ratios and share amounts) | | | As at September 30, 2012 | | | | As at December 31, 2011 | |
Total cash and equivalents | | | $2,530 | | | | $2,745 | |
Non-cash working capital | | | 2,890 | | | | 2,335 | |
Non-current assets | | | 45,710 | | | | 42,339 | |
Other assets | | | 954 | | | | 1,465 | |
Total Assets | | | 52,084 | | | | 48,884 | |
Non-current liabilities excluding adjusted debt | | | 7,988 | | | | 7,557 | |
Adjusted debt1 | | | 13,681 | | | | 13,058 | |
Other liabilities | | | 2,665 | | | | 2,715 | |
Total Liabilities | | | 24,334 | | | | 23,330 | |
Total shareholders’ equity | | | 25,172 | | | | 23,363 | |
Non-controlling interests | | | 2,578 | | | | 2,191 | |
Total Equity | | | $27,750 | | | | $25,554 | |
Dividends | | | $550 | | | | $509 | |
Net debt1 | | | $11,169 | | | | $10,320 | |
Total common shares outstanding (millions of shares)2 | | | 1,001 | | | | 1,000 | |
Key Financial Ratios: | | | | | | | | |
Current ratio3 | | | 1.61:1 | | | | 2.25:1 | |
Adjusted debt-to-equity4 | | | 0.54:1 | | | | 0.56:1 | |
Net debt-to-equity5 | | | 0.44:1 | | | | 0.44:1 | |
Net debt-to-total capitalization6 | | | 0.37:1 | | | | 0.33:1 | |
| 1 | Adjusted debt and net debt are non-GAAP financial performance measures with no standardized definition under IFRS. For further information and a detailed reconciliation, please see page 47 of this MD&A. |
| 2 | Total common shares outstanding do not include 7.5 million stock options. The increase from December 31, 2011 is due to the exercise of stock options. |
| 3 | Represents current assets divided by current liabilities as September 30, 2012 and December 31, 2011. |
| 4 | Represents adjusted debt divided by total shareholders’ equity as at September 30, 2012 and December 31, 2011. |
| 5 | Represents net debt divided by total shareholders’ equity as at September 30, 2012 and December 31, 2011. |
| 6 | Represents net debt divided by capital stock and long-term debt at September 30, 2012 and December 31, 2011. |
Balance Sheet Review
Total assets were $52 billion at September 30, 2012, an increase of $3.2 billion or 7% compared to December 31, 2011. The increase primarily reflects an increase in property, plant and equipment, which primarily reflects the impact of the significant capital expenditures related to our projects in construction. Our asset base is primarily comprised of non-current assets such as property, plant and equipment and goodwill, reflecting the capital intensive nature of the mining business and our history of growing through acquisitions. Other significant assets include production inventories and cash and equivalents. We typically do not carry a material accounts receivable balance, since only sales of concentrate and copper cathode have a settlement period.
Total liabilities increased by $1 billion or 4% compared to December 31, 2011 largely due to the issuance of $2 billion of new debt, which was partially offset by a repayment of $1.45 billion in debt.
Shareholders’ Equity
| | |
As at October 12, 2012 | | Number of shares |
Common shares | | 1,000,636,667 |
Stock options | | 7,488,942 |
Dividends
In the first quarter 2012, our Board of Directors authorized a quarterly dividend of 20 cents per share, which equates to 80 cents per share on an annualized basis and represents a 33% increase from the previous quarterly dividend of 15 cents per share. The amount and timing of any dividends is within the discretion of our Board of Directors. The Board of Directors reviews the dividend policy quarterly based on our current and projected liquidity profile, and capital requirements for capital projects and potential acquisitions.
| | | | |
| BARRICK THIRD QUARTER 2012 | | 34 | | MANAGEMENT’S DISCUSSION AND ANALYSIS |
Comprehensive Income
For the third quarter 2012, other comprehensive income (“OCI”) was a gain of $51 million on an after-tax basis. This change primarily includes unrealized gains of $15 million on available for sale investments and unrealized gains of $98 million on hedge contracts designated for future periods due to changes in currency exchange rates, silver prices, copper prices, and fuel prices. The change also includes reclassification adjustments totaling $106 million for gains on hedge contracts designated for the third quarter 2012 that were transferred to earnings in the third quarter 2012 in conjunction with the recognition in expense of the related hedge exposure. Other changes include $36 million in gains related to the currency translation adjustments on Barrick Energy and other foreign subsidiaries and a $7 million gain due to tax recoveries on the overall increase in OCI.
Included in accumulated OCI at September 30, 2012 were unrealized pre-tax gains on currency, commodity and interest rate hedge contracts totaling $578 million. The balance primarily relates to currency hedge contracts that are designated against operating costs and capital expenditures, primarily over the next three years and are expected to help protect against the impact of the strengthening of the Australian and Canadian dollar exchange rates against the US dollar. These hedge gains/losses are expected to be recorded in earnings at the same time as the corresponding hedged operating costs/depreciation are recorded in earnings.
Financial Position and Liquidity
Our capital structure is comprised of a mix of debt and shareholders’ equity. Since the beginning of 2009, we have issued about $9 billion in new debt securities, primarily to finance acquisitions, the buyout of our gold hedge book and capital expenditures for our Pueblo Viejo and Pascua Lama projects. As a result, our net debt and debt-to-equity ratios have increased over that period.
As at September 30, 2012, net debt was $11.2 billion, and our net debt-to-equity ratio and net debt-to-total capitalization ratios were 0.44:1 and 0.37:1, respectively. This compares to net debt as at December 31, 2011 of $10.3 billion, and net debt-to-equity and net debt-to-total capitalization ratios of 0.44:1 and 0.33:1, respectively. The majority of our outstanding long-term debt matures at various dates beyond 2013. (Please see page 39 of this MD&A for a schedule of principal repayments). In January 2012, we entered into a new credit facility of $4 billion which currently has an interest rate of LIBOR plus 1.20%, which matures in 2017 (the “Third Credit Facility”), which is fully undrawn. We are currently in discussions with the lenders to extend the maturity date of the Third Credit Facility by one year.
Sources and Uses of Net Debt
| | | | | | | | | | | | | | | | |
| | | For the three months
ended September 30 | | | For the nine months
ended September 30 | |
| ($ millions) | | 2012 | | | 2011 | | | 2012 | | | 2011 | |
Operating inflows | | | $ 1,732 | | | | $ 1,902 | | | | $ 3,767 | | | | $ 4,091 | |
Investing activities | | | | | | | | | | | | | | | | |
Capex - minesite sustaining | | | ($ 317 | ) | | | ($ 315 | ) | | | ($ 882 | ) | | | ($ 673 | ) |
Capex - OP &UG | | | (302 | ) | | | (260 | ) | | | (793 | ) | | | (664 | ) |
Capex - minesite expansion1 | | | (204 | ) | | | (182 | ) | | | (586 | ) | | | (360 | ) |
Capex - projects1 | | | (738 | ) | | | (757 | ) | | | (2,197 | ) | | | (1,956 | ) |
Acquisitions | | | - | | | | (337 | ) | | | (15 | ) | | | (7,677 | ) |
Other | | | (45 | ) | | | (60 | ) | | | (29 | ) | | | (102 | ) |
Total investing outflows | | | ($ 1,606 | ) | | | ($ 1,911 | ) | | | ($ 4,502 | ) | | | ($ 11,432 | ) |
Financing activities (excluding debt) | | | | | | | | | | | | | | | | |
Dividends | | | ($ 200 | ) | | | ($ 119 | ) | | | ($ 550 | ) | | | ($ 359 | ) |
Funding from non-controlling interests | | | 132 | | | | 119 | | | | 390 | | | | 298 | |
Repayment of debt related to acquisitions | | | - | | | | - | | | | - | | | | (347 | ) |
Deposit on silver sales agreement | | | 137 | | | | 138 | | | | 137 | | | | 138 | |
Other | | | 1 | | | | 8 | | | | (19 | ) | | | (26 | ) |
Total financing (outflows) inflows | | | $ 70 | | | | $ 146 | | | | ($ 42 | ) | | | ($ 296 | ) |
Other movements | | | ($ 10 | ) | | | ($ 66 | ) | | | ($ 61 | ) | | | ($ 86 | ) |
Adjustment for Pueblo Viejo financing (partner’s share), net of cash | | | ($ 1 | ) | | | $ 4 | | | | ($ 11 | ) | | | $ 64 | |
Net (decrease) increase in net debt | | | ($ 185 | ) | | | ($ 75 | ) | | | $ 849 | | | | $ 7,659 | |
Net debt at beginning of period2 | | | $ 11,354 | | | | $ 10,161 | | | | $ 10,320 | | | | $ 2,427 | |
Net debt at end of period2 | | | $ 11,169 | | | | $ 10,086 | | | | $ 11,169 | | | | $ 10,086 | |
| 1 | The amounts include capitalized interest of $79 million for the three months ended September 30, 2012 (2011: $216 million) and $333 million for the nine months ended September 30, 2012 (2011: $377 million). |
| 2 | Net debt is a non-GAAP financial performance measures with no standardized definition under IFRS. For further information and a detailed reconciliation, please see page 47 of this MD&A. |
In third quarter 2012, our credit rating was downgraded to BBB+ from A- by S&P, with a negative outlook, following our announcement of a capital cost increase and delay to production start-up at our multi-billion-dollar Pascua Lama project. Our credit rating, as established by Moody’s has remained stable throughout this period. Our ability to access unsecured debt markets and the related cost of debt financing is, in part, dependent upon maintaining an acceptable credit rating. We do not expect the change in our credit rating by S&P to adversely affect our ability to access the debt markets, but could impact funding costs for any new debt financing.
| | | | |
| BARRICK THIRD QUARTER 2012 | | 35 | | MANAGEMENT’S DISCUSSION AND ANALYSIS |
The key factors impacting our financial position, and therefore our credit rating, include the following:
| • | | Our market capitalization and the strength of our balance sheet, including the amount of net debt and our net debt-to-equity ratio; |
| • | | Our ability to generate net cash flow from operating activities (refer to cash flow section on page 22 of this MD&A for a discussion of key factors impacting our cash flow in 2012); |
| • | | Expected capital expenditure requirements; |
| • | | The quantity of our gold and copper reserves (refer to page 184 of our 2011 annual report for more information); and |
| • | | Our geo-political risk profile |
At current market gold and copper prices we expect to generate negative free cash flow for the remainder of 2012 and through 2013. This is primarily due to the significant capital expenditures at our Pascua-Lama project as well as the impact of the deferral in its start-up date. In addition, we have approximately $1.8 billion in debt maturing in 2013 that we expect to refinance. Available sources of liquidity for the remainder of the year and beyond include the $4.25 billion of availability under our credit facilities (subject to compliance with covenants and the making of certain representations and warranties, this facility is available for drawdown as a source of financing), future operating cash flow and future debt or equity financing should the need arise. These alternatives should provide us with the flexibility to fund any cash flow shortfall and are continually evaluated to determine the optimal mix of capital resources for our capital needs. A material change in the market price of gold and/or copper or a significant change in our underlying business including changes in projected capital expenditures could impact the timing and magnitude of financing requirements, either positively or negatively.
Cash and equivalents and cash flow
Total cash and cash equivalents as at September 30, 2012 were $2.5 billion6. Our cash position consists of a mix of term deposits, treasury bills and money market investments. Our cash position is primarily denominated in US dollars.
Our primary source of liquidity is operating cash flow. In the first nine months of 2012, we generated $3.8 billion in operating cash flow, compared to $4.1 billion of operating cash flow in the same prior year period. Adjusted
6 Includes $452 million cash held at ABG, which may not be readily deployed outside ABG.
operating cash flow totaled $3.4 billion in the first nine months of 2012, down compared to $4.4 billion in the first nine months of 2011. The decrease in operating cash flow and adjusted operating cash flow primarily reflects lower net earnings levels and an increase in net working capital outflows, partially offset by a decrease in income tax payments (Refer to the table below for changes in our non-cash working capital).
Non-Cash Working Capital
| | | | | | | | |
| (in $ millions) | | As at
September 30, 2012 | | | As at
December 31, 2011 | |
Raw materials | | | | | | | | |
Ore in stockpiles1 | | | $ 2,021 | | | | $ 1,590 | |
Ore on leach pads | | | 634 | | | | 582 | |
Mine operating supplies | | | 1,072 | | | | 885 | |
Work in process | | | 372 | | | | 377 | |
Finished products | | | 305 | | | | 217 | |
Other current assets | | | 133 | | | | 507 | |
Accounts receivable | | | 361 | | | | 426 | |
VAT and fuel tax receivables2 | | | 657 | | | | 466 | |
Accounts payable and other current liabilities | | | (2,665 | ) | | | (2,715 | ) |
Non-cash working capital | | | $ 2,890 | | | | $ 2,335 | |
| 1 | Includes long-term stockpiles of $1,553 million (2011: $1,153 million). |
| 2 | Includes long-term VAT and fuel tax receivables of $424 million (2011: $272 million). |
The principal uses of operating cash flow are to fund our capital expenditures, including construction activities at our advanced projects; acquisitions; dividend payments; and repayments of our outstanding debt. In the first nine months of 2012 we generated $3.8 billion of operating cash flow and spent $4.5 billion on investing activities, primarily on construction of major capital projects (principally Pueblo Viejo, Pascua Lama and Jabal Sayid), a decrease of $6.9 billion compared to the first nine months of 2011, primarily due to the impact of the $7.7 billion acquisition of Equinox in the second quarter of 2011.
Capital expenditures for the three and nine month periods ended September 30, 2012 increased by $27 million and $809 million, respectively, over the same prior year periods. The increases are primarily due to an increase in project capital expenditures, primarily due to increased construction activities at Pascua-Lama, Pueblo Viejo and Jabal Sayid, and an increase in minesite expansion, minesite sustaining and open pit and underground development expenditure. Minesite expansion increased due to increases in North America, ABG and at the Copper business unit for the nine month period ended, September 30, 2012. Minesite sustaining capital expenditures were higher due to increases in
| | | | |
| BARRICK THIRD QUARTER 2012 | | 36 | | MANAGEMENT’S DISCUSSION AND ANALYSIS |
North America and ABG. Open pit and underground development expenditures were higher primarily due to increased open pit and underground activities at Australia Pacific and the Copper business unit.
| | | | | | | | | | | | | | | | |
| Capital Expenditures1 | |
| | | For the three months ended September 30 | | | For the nine months ended September 30 | |
| ($ millions) | | 2012 | | | 2011 | | | 2012 | | | 2011 | |
Capex - gold projects | | | | | | | | | | | | | | | | |
Pascua-Lama | | | $ 441 | | | | $ 301 | | | | $ 1,212 | | | | $ 799 | |
Pueblo Viejo | | | 184 | | | | 189 | | | | 551 | | | | 665 | |
Cerro Casale | | | 7 | | | | 28 | | | | 36 | | | | 82 | |
Capex - copper projects | | | | | | | | | | | | | | | | |
Jabal Sayid | | | $ 38 | | | | $ 47 | | | | $ 120 | | | | $ 66 | |
Total consolidated project capex | | | $ 670 | | | | $ 565 | | | | $ 1,919 | | | | $ 1,612 | |
Total capex - minesite expansion | | | $ 193 | | | | $ 158 | | | | $ 531 | | | | $ 327 | |
Total capex - minesite sustaining | | | $ 317 | | | | $ 315 | | | | $ 882 | | | | $ 673 | |
Total capex - OP and UG | | | $ 302 | | | | $ 260 | | | | $ 793 | | | | $ 664 | |
Capitalized interest | | | 79 | | | | 216 | | | | 333 | | | | 377 | |
Total consolidated capex | | | $ 1,561 | | | | $ 1,514 | | | | $ 4,458 | | | | $ 3,653 | |
Capital expenditures attributable to NCI2 | | | 103 | | | | 83 | | | | 282 | | | | 286 | |
Total capex attributable to Barrick | | | $ 1,458 | | | | $ 1,431 | | | | $ 4,176 | | | | $ 3,367 | |
Total capex - copper | | | 137 | | | | 112 | | | | 430 | | | | 139 | |
Total capex - gold | | | 632 | | | | 582 | | | | 1,661 | | | | 1,423 | |
Total capex - copper projects | | | 44 | | | | 62 | | | | 147 | | | | 81 | |
Total capex - gold projects3 | | | 618 | | | | 612 | | | | 1,821 | | | | 1,589 | |
Capex - other | | | 27 | | | | 63 | | | | 117 | | | | 135 | |
Total capex attributable to Barrick | | | $ 1,458 | | | | $ 1,431 | | | | $ 4,176 | | | | $ 3,367 | |
| 1 | These amounts are presented on a cash basis consistent with the amounts presented on the consolidated statement of cash flows. |
| 2 | Amount reflects our partner’s share of expenditures at the Pueblo Viejo and Cerro Casale project on a cash basis. |
| 3 | On an accrual basis, our share of project capital expenditures is $745 million for the three months ended September 30, 2012 and $2,167 million for the nine months ended September 30, 2012 including capitalized interest. |
Financing inflows for the first nine months of 2012 were $512 million, which primarily consists of $2 billion in debt securities, $390 million in funding received from non-controlling interests, partially offset by $1.45 billion of debt repayments and dividend payments of $550 million. This compares to financing inflows in the first nine months of 2011 of $6,345 million, which reflects the debt issuance of $6.7 billion as a result of our acquisition of Equinox, partially offset by dividend payments of $359 million.
Financial Instruments
As of September 30, 2012, we had 24 counterparties to our derivative positions. We proactively manage our exposure to individual counterparties in order to mitigate both credit and liquidity risks. For those counterparties in a net asset position (total balance attributable to the counterparties is $227 million), three hold greater than 10% of our mark-to-market asset position, with the largest counterparty holding $41 million. On an ongoing basis, we monitor our exposures and ensure that none of the counterparties with which we hold outstanding contracts has declared insolvency. Please refer to note 22 in our annual consolidated financial statements for a description of our risk management policy with respect to financial instruments.
| | | | |
| BARRICK THIRD QUARTER 2012 | | 37 | | MANAGEMENT’S DISCUSSION AND ANALYSIS |
Summary of Financial Instruments
| | | | | | | | | | | | |
| As at September 30, 2012 | | | | | | | | | | |
| Financial Instrument | | Principal/Notional Amount | | | | | Associated Risks |
| | | | | | | | | | | | • Interest rate |
Cash and equivalents | | | | | | | $ 2,530 | | | million | | • Credit |
| | | | | | | | | | | | • Credit |
Accounts receivable | | | | | | | $ 361 | | | million | | • Market |
| | | | | | | | | | | | • Market |
Available-for-sale securities | | | | | | | $ 96 | | | million | | • Liquidity |
Accounts payable | | | | | | | $ 2,260 | | | million | | • Interest rate |
Debt | | | | | | | $ 14,058 | | | million | | • Interest rate |
Restricted share units | | | | | | | $ 48 | | | million | | • Market |
Deferred share units | | | | | | | $ 9 | | | million | | • Market |
Derivative instruments - currency contracts | | | CAD | | | | 738 | | | million | | • Credit |
| | | CLP | | | | 792,426 | | | million | | • Market/liquidity |
| | | AUD | | | | 1,872 | | | million | | • Interest rate |
| | | EUR | | | | 6 | | | million | | |
| | | PGK | | | | 50 | | | million | | |
| | | | ZAR | | | | 620 | | | million | | |
Derivative instruments - silver contracts | | | | | | | 65 | | | million oz | | • Market/liquidity |
Derivative instruments - copper contracts | | | | | | | 72 | | | million lbs | | • Credit |
| | | | | | | | | | | | | • Interest rate |
Derivative instruments - energy contracts | | | Diesel | | | | 6 | | | million bbls | | • Market/liquidity |
| | | Propane | | | | 1 | | | million gallons | | • Credit |
| | | | | | | | | | | | | • Interest rate |
Derivative instruments - interest rate contracts | | | Receive fixed interest rate swaps | | | | $ 200 | | | million | | • Market/liquidity |
Commitments and Contingencies
Capital Expenditures Not Yet Committed
We expect to incur capital expenditures over the next several years for both new mine projects and expansion project at producing mines. The projects are at various stages of exploration or scoping study stage, pre-feasibility/feasibility stage through to the construction execution stage. The ultimate decision to incur capital expenditures at each project is subject to a decision to proceed considering the project investment rate of return
and various other qualitative factors. Four projects were in the construction stage at September 30, 2012, namely Pueblo Viejo, Pascua-Lama, the Goldstrike thiosulfate technology project and Jabal Sayid (refer to pages 13 to 14 for further details). The most significant projects not yet approved for construction are described on pages 14 to 15.
| | | | |
| BARRICK THIRD QUARTER 2012 | | 38 | | MANAGEMENT’S DISCUSSION AND ANALYSIS |
Contractual Obligations and Commitments1
| | | | | | | | | | | | | | | | | | | | | | | | | | | | |
| | | Payments due As at September 30, 2012 | |
| ($ millions) | | 20121 | | | 2013 | | | 2014 | | | 2015 | | | 2016 | | | 2017 and
thereafter | | | Total | |
Debt2 | | | | | | | | | | | | | | | | | | | | | | | | | | | | |
Repayment of principal | | | $- | | | | $1,810 | | | | $1,140 | | | | $190 | | | | $1,590 | | | | $9,142 | | | | $13,872 | |
Capital leases | | | 19 | | | | 46 | | | | 40 | | | | 29 | | | | 23 | | | | 29 | | | | 186 | |
Interest | | | 240 | | | | 613 | | | | 575 | | | | 550 | | | | 523 | | | | 6,344 | | | | 8,845 | |
Provisions for environmental rehabilitation3 | | | 107 | | | | 104 | | | | 90 | | | | 81 | | | | 71 | | | | 1,886 | | | | 2,339 | |
Operating leases | | | 9 | | | | 19 | | | | 18 | | | | 16 | | | | 12 | | | | 72 | | | | 146 | |
Restricted share units | | | 3 | | | | 26 | | | | 19 | | | | - | | | | - | | | | - | | | | 48 | |
Pension benefits and other post-retirement benefits | | | 37 | | | | 28 | | | | 28 | | | | 28 | | | | 28 | | | | 141 | | | | 290 | |
Derivative liabilities4 | | | 2 | | | | 10 | | | | 19 | | | | 22 | | | | 22 | | | | 35 | | | | 110 | |
Purchase obligations for supplies and consumables5 | | | 457 | | | | 392 | | | | 253 | | | | 177 | | | | 110 | | | | 399 | | | | 1,788 | |
Capital commitments6 | | | 899 | | | | 1,201 | | | | 2 | | | | 2 | | | | 2 | | | | 1 | | | | 2,107 | |
Social development costs | | | 12 | | | | 21 | | | | 26 | | | | 49 | | | | 6 | | | | 66 | | | | 180 | |
Total | | | $1,785 | | | | $4,270 | | | | $2,210 | | | | $1,144 | | | | $2,387 | | | | $18,115 | | | | $29,911 | |
| 1 | Represent the obligations and commitments for the remainder of the year. |
| 2 | Debt and Interest - Our debt obligations do not include any subjective acceleration clauses or other clauses that enable the holder of the debt to call for early repayment, except in the event that we breach any of the terms and conditions of the debt or for other customary events of default. The debt and interest amounts include 100% of the Pueblo Viejo financing, even though we have only guaranteed our 60% share. We are not required to post any collateral under any debt obligations. The terms of our debt obligations would not be affected by deterioration in our credit rating. Projected interest payments on variable rate debt were based on interest rates in effect at September 30, 2012. Interest is calculated on our long-term debt obligations using both fixed and variable rates. |
| 3 | Provisions for Environmental Rehabilitation - Amounts presented in the table represent the undiscounted future payments for the expected cost of provisions for environmental rehabilitation. |
| 4 | Derivative Liabilities - Amounts presented in the table relate to derivative contracts disclosed under note 17 to the consolidated financial statements. Payments related to derivative contracts cannot be reasonably estimated given variable market conditions. |
| 5 | Purchase Obligations for Supplies and Consumables - Includes commitments related to new purchase obligations to secure a supply of acid, tires and cyanide for our production process. |
| 6 | Capital Commitments - Purchase obligations for capital expenditures include only those items where binding commitments have been entered into. Commitments at September 30, 2012 mainly relate to construction capital at Pascua-Lama and Jabal Sayid. |
Litigation and Claims
We are currently subject to various litigation as disclosed in note 22 to the consolidated financial statements, and we may be involved in disputes with other parties in the future that may result in litigation. If we are unable to
resolve these disputes favorably, it may have a material adverse impact on our financial condition, cash flow and results of operations.
| | | | |
| BARRICK THIRD QUARTER 2012 | | 39 | | MANAGEMENT’S DISCUSSION AND ANALYSIS |
REVIEW OF QUARTERLY RESULTS
Quarterly Information
| | | | | | | | | | | | | | | | | | | | | | | | | | | | | | | | |
| | | 2012 | | | | | | | | | 2011 | | | | | | | | | | | | 2010 | |
| ($ millions, except where indicated) | | Q3 | | | Q2 | | | Q1 | | | Q4 | | | Q3 | | | Q2 | | | Q1 | | | Q4 | |
Revenues | | $ | 3,436 | | | $ | 3,278 | | | $ | 3,644 | | | $ | 3,761 | | | $ | 3,971 | | | $ | 3,416 | | | $ | 3,087 | | | $ | 3,005 | |
Realized price – gold1 | | | 1,655 | | | | 1,608 | | | | 1,691 | | | | 1,664 | | | | 1,743 | | | | 1,513 | | | | 1,389 | | | | 1,368 | |
Realized price – copper1 | | | 3.52 | | | | 3.45 | | | | 3.78 | | | | 3.69 | | | | 3.54 | | | | 4.07 | | | | 4.25 | | | | 3.99 | |
Cost of sales | | | 1,825 | | | | 1,830 | | | | 1,770 | | | | 1,705 | | | | 1,694 | | | | 1,486 | | | | 1,354 | | | | 1,325 | |
Net earnings2 | | | 618 | | | | 750 | | | | 1,029 | | | | 959 | | | | 1,365 | | | | 1,159 | | | | 1,001 | | | | 961 | |
Per share (dollars)2,3 | | | 0.62 | | | | 0.75 | | | | 1.03 | | | | 0.96 | | | | 1.37 | | | | 1.16 | | | | 1.00 | | | | 0.97 | |
Adjusted net earnings4,2 | | | 849 | | | | 784 | | | | 1,086 | | | | 1,166 | | | | 1,379 | | | | 1,117 | | | | 1,004 | | | | 1,018 | |
Per share (dollars)2,3 | | | 0.85 | | | | 0.78 | | | | 1.09 | | | | 1.17 | | | | 1.38 | | | | 1.12 | | | | 1.01 | | | | 1.02 | |
EBITDA4 | | | 1,499 | | | | 1,514 | | | | 1,997 | | | | 1,998 | | | | 2,460 | | | | 2,090 | | | | 1,828 | | | | 1,770 | |
Operating cash flow | | | 1,732 | | | | 763 | | | | 1,272 | | | | 1,224 | | | | 1,902 | | | | 750 | | | | 1,439 | | | | 866 | |
Adjusted operating cash flow4 | | | 1,267 | | | | 763 | | | | 1,374 | | | | 1,299 | | | | 2,004 | | | | 938 | | | | 1,439 | | | | 1,522 | |
| 1 | Per ounce/pound weighted average. Realized price is a non-GAAP financial performance measure with no standard meaning under IFRS. For further information and a detailed reconciliation, please see page 46 of this MD&A. |
| 2 | Sum of all the quarters may not add up to the yearly total due to rounding. |
| 3 | Calculated using weighted average number of shares outstanding under the basic method of earnings per share. |
| 4 | Adjusted net earnings, EBITDA and adjusted operating cash flow are non-GAAP financial performance measures with no standard definition under IFRS. For further information and a detailed reconciliation, please see pages 42—46 of this MD&A. |
Our financial results for the past several quarters reflect a trend of spot gold prices that have fluctuated around historically high levels and increasing gold and copper production costs, mainly caused by inflationary pressures. This has translated into fluctuating net earnings and adjusted operating cash flow levels depending on the gold and copper realized prices and production levels each quarter. Throughout this time, we have been able to consistently maintain total cash margins of over $1,000 per ounce.
The decreases in both net earnings and adjusted net earnings in the third quarter 2012 were largely driven by higher cost of sales applicable to gold, lower gold and copper sales volumes, higher total cash costs for gold, lower realized gold and copper prices and higher C1 cash costs for copper, partially offset by lower cost of sales applicable to copper.
IFRS CRITICAL ACCOUNTING POLICIES AND ACCOUNTING ESTIMATES
Management has discussed the development and selection of our critical accounting estimates with the Audit Committee of the Board of Directors, and the Audit Committee has reviewed the disclosure relating to such estimates in conjunction with its review of this MD&A. The accounting policies and methods we utilize determine how we report our financial condition and results of operations, and they may require management to make estimates or rely on assumptions about matters that are inherently uncertain. Our significant accounting policies are disclosed in note 2 of our most recent annual consolidated financial statements. A summary of future accounting policy changes is disclosed in note 2 of the accompanying interim consolidated financial statements.
Critical Accounting Estimates and Judgments
Certain accounting estimates have been identified as being “critical” to the presentation of our financial condition and results of operations because they require
us to make subjective and/or complex judgments about matters that are inherently uncertain; or there is a reasonable likelihood that materially different amounts could be reported under different conditions or using different assumptions and estimates. The following is a summary of significant updates to these estimates, since the discussion of these estimates in our 2011 annual MD&A.
Accounting for impairment of non-current assets
We conduct an annual test for impairment of goodwill in the fourth quarter of each fiscal year and at any other time of the year if an indicator of impairment is identified. In addition, non-current assets are tested for impairment when events or changes in circumstances suggest that the carrying amount may not be recoverable. Each quarter we conduct a review of internal factors (such as operating performance, changes in reserves/resources or changes in the mine plans) and
| | | | |
| BARRICK THIRD QUARTER 2012 | | 40 | | MANAGEMENT’S DISCUSSION AND ANALYSIS |
external factors (such as metal prices, discount rates and foreign exchange rates) for each operating site, project and E&E property to determine whether such an indicator of impairment exists. In third quarter 2012, the only indicator of impairment that was identified was at an exploration property in Papua New Guinea acquired in 2007, where we completed an exploration program and a decision was made not to proceed with further exploration activities. We conducted an impairment assessment, and as a result of this assessment we recorded an impairment charge of $141 million to reduce this exploration property to its estimated fair value less cost to sell. In second quarter 2012, the update to Pascua-Lama’s schedule and cost estimate was identified as a triggering event for impairment testing purposes. We assessed the impact and determined that the fair value of the project exceeded its carrying value and consequently no impairment was recorded.
We are also nearing completion of a substantial infill drilling program to provide a more precise model of the ore body for mine planning purposes. These programs are expected to be completed in the fourth quarter of the year and will form the basis for an updated life of mine plan for Lumwana. The updated life of mine plan will provide updated economics, including updated capital and operating costs, and will be used to conduct the annual test for goodwill impairment for our copper business unit at the end of 2012, and an impairment test for non-current assets at Lumwana if an indicator of impairment is identified. The key risk factors for impairment relate to the estimated production levels and unit production costs at the Chimiwungo deposit, which represents about 90% of the future production at Lumwana. If we are not able to support higher production levels at lower unit costs in the LOM plan, there is a risk that an impairment charge will be recorded in the fourth quarter. The current carrying value of Lumwana is $3.8 billion.
Based on the results of our last annual test in fourth quarter 2011, the carrying value of other CGUs that are most sensitive to changes in the key assumptions used in the annual test are:
| | | | |
| As at September 30, 2012 | | Carrying Value | |
Jabal Sayid | | | 1,364 | |
Buzwagi | | | 742 | |
Barrick Energy CGUs | | | 242 | |
Pierina | | | $ 126 | |
Life of mine (“LOM”) Estimates Used to Measure
Depreciation of Property, Plant and Equipment
We depreciate our assets over their useful life, or over the remaining life of the mine (if shorter). We use the units-of-production basis (“UOP”) to depreciate the mining interest component of PP&E whereby the denominator is the expected mineral production based on our most recent LOM plans. At the end of each fiscal year, as part of our business cycle, we update our LOM plans and prospectively revise calculations of depreciation based on these updated LOM plans. The table below illustrates the impact of historic changes in LOM estimates on depreciation for each of our operating segments.
Impact of Historic Changes in LOM Estimates on Depreciation
| | | | | | | | | | | | |
| | | Depreciation increase
(decrease)
Periods ended September 30, 2012 | |
($ millions, except LOM in
millions of contained gold oz/
billions of contained copper
pounds) | | LOM increase
(decrease)1 | | | Three months | | | Nine months | |
Gold | | | | | | | | | | | | |
North America | | | 5.1 | | | | ($10) | | | | ($31) | |
Australia Pacific | | | 1.3 | | | | (2) | | | | (5) | |
African Barrick Gold | | | (1.0) | | | | 2 | | | | 7 | |
South America | | | 1.1 | | | | - | | | | (4) | |
Total Gold | | | 6.5 | | | | $(10) | | | | $(33) | |
Total Copper | | | 0.3 | | | | ($1) | | | | ($2) | |
| 1 | Each year we update our LOM estimates as at the end of the year as part of our normal business cycle. We then use those updated LOM estimates to calculate depreciation expense in the following fiscal year on assets which use the units-of-production method of depreciation. LOM changes presented were calculated as at the end of 2011 and are in millions of contained ounces/pounds. |
Internal Control over Financial Reporting and Disclosure Controls and Procedures
Management is responsible for establishing and maintaining adequate internal control over financial reporting and disclosure controls and procedures as defined in our 2011 annual MD&A.
Together, internal control over financial reporting and disclosure controls and procedures frameworks provide internal control over financial reporting and disclosure. Due to its inherent limitations, internal control over financial reporting and disclosure may not prevent or detect all fraud or misstatements. Further, the effectiveness of internal control over financial reporting and disclosure is subject to the risk that controls may become inadequate because of changes in conditions, or that the degree of compliance with policies or procedures may change.
| | | | |
| BARRICK THIRD QUARTER 2012 | | 41 | | MANAGEMENT’S DISCUSSION AND ANALYSIS |
As described on page 14 of this report, we are continuing a comprehensive review of capital costs and schedule for the Pascua-Lama project and have made changes to strengthen the Pascua-Lama project management team. As part of this review and change in project management team, management will assess the impact on internal control over financial reporting and disclosure.
Management will continue to monitor the effectiveness of its internal control over financial reporting and disclosure and may make modifications from time to time as considered necessary or desirable.
NON-GAAP FINANCIAL PERFORMANCE MEASURES
We use certain non-GAAP financial performance measures in our MD&A. For a detailed description of each of the non-GAAP measures used in this MD&A, please refer to the Non-GAAP Financial Performance Measures in our 2011 annual MD&A. The non-GAAP financial performance measures set out in this MD&A are intended to provide additional information to investors and do not have any standardized definition under IFRS and should not be considered in isolation or as a substitute for measures of performance prepared in accordance with IFRS. The following is a summary of significant updates to these non-GAAP financial performance measures since our 2011 annual MD&A.
Total Cash Costs per pound, C1 Cash Costs per pound and C3 Fully Allocated Costs per pound, Net Cash Costs
Starting in first quarter 2012, we replaced the non-GAAP measure “total cash costs per pound” for our copper business with “C1 cash costs per pound”. We believe that this change will enable investors to better understand the performance of our global copper segment in comparison to other copper producers who present results on a similar basis. As part of this change, we also introduced “C3 fully allocated costs per pound”. The primary difference between total cash costs and
C1 cash costs is that royalties and non-routine charges are excluded from C1 cash costs as they are not direct production costs. C3 fully allocated costs per pound include C1 cash costs, depreciation, royalties, exploration and evaluation expense, administration expense and non-routine charges. These new measures are intended to provide additional information only and do not have any standardized meaning prescribed by IFRS and should not be considered in isolation or as substitutes for measures of performance prepared in accordance with IFRS. Other companies may calculate these measures differently.
Adjusted Operating Cash Flow
Starting in this MD&A, we have adjusted our operating cash flow to remove the effect of the “settlement of currency contracts”. This settlement activity is not reflective of the underlying capacity of our operations to generate operating cash flow on a recurring basis, and therefore this adjustment will result in a more meaningful operating cash flow measure for investors and analysts to evaluate our performance in the period and assess our future operating cash flow generating capability. We believe that this change is consistent with our definition of adjusted operating cash flow, as described in the Non-GAAP Financial Performance Measures in our 2011 annual MD&A.
| | | | |
| BARRICK THIRD QUARTER 2012 | | 42 | | MANAGEMENT’S DISCUSSION AND ANALYSIS |
Adjusted Net Earnings (Adjusted Net Earnings per Share)
Reconciliation of Net Earnings to Adjusted Net Earnings
| | | | | | | | | | | | | | | | |
| ($ millions, except per share amounts in dollars) | | For the three months ended September 30 | | | For the nine months ended September 30 | |
| | | 2012 | | | 2011 | | | 2012 | | | 2011 | |
Net earnings/(losses)attributable to equity holders of the Company | | | $ 618 | | | | $ 1,365 | | | | $ 2,397 | | | | $ 3,525 | |
Significant tax adjustments not related to current period earnings | | | (12) | | | | 28 | | | | (41) | | | | 36 | |
Impairment charges (reversals) related to intangibles, property, plant and equipment, and investments | | | 148 | | | | 8 | | | | 266 | | | | 12 | |
Acquisition/disposition adjustments | | | - | | | | (49) | | | | (14) | | | | (159) | |
Foreign currency translation (gains)/losses | | | 16 | | | | 3 | | | | 28 | | | | (26) | |
Restructuring costs | | | - | | | | - | | | | - | | | | 2 | |
Acquisition related costs2 | | | - | | | | 32 | | | | - | | | | 115 | |
Other items | | | 8 | | | | - | | | | 31 | | | | - | |
Unrealized (gains)/losses on non-hedge derivative instruments | | | 71 | | | | (8) | | | | 52 | | | | (5) | |
Adjusted net earnings | | | $ 849 | | | | $ 1,379 | | | | $ 2,719 | | | | $ 3,500 | |
Net earnings/(losses) per share3 | | | $ 0.62 | | | | $ 1.37 | | | | $ 2.40 | | | | $ 3.53 | |
Adjusted net earnings per share3 | | | $ 0.85 | | | | $ 1.38 | | | | $ 2.72 | | | | $ 3.50 | |
| 1 | Amounts presented in this table are post-tax. |
| 2 | Represents expensed transaction costs, fair value inventory purchase adjustments and realized foreign exchange losses relating to our economic hedge of the purchase price related to the Equinox acquisition. |
| 3 | Calculated using weighted average number of shares outstanding under the basic method of earnings per share. |
Adjusted Operating Cash Flow, Adjusted Operating Cash Flow before Working Capital Changes and Free Cash Flow
Reconciliation of Adjusted Operating Cash Flow
| | | | | | | | | | | | | | | | |
| ($ millions) | | For the three months ended September 30 | | | For the nine months ended September 30 | |
| | | 2012 | | | 2011 | | | 2012 | | | 2011 | |
Operating cash flow | | | $ 1,732 | | | | $ 1,902 | | | | $ 3,767 | | | | $ 4,091 | |
Settlement of contingent consideration | | | - | | | | - | | | | 50 | | | | - | |
Settlement of currency contracts | | | (465) | | | | - | | | | (465) | | | | - | |
Non-recurring tax payments | | | - | | | | - | | | | 52 | | | | - | |
Withholding tax payments | | | - | | | | 86 | | | | - | | | | 86 | |
Acquisition costs expensed and related working capital movements | | | - | | | | 16 | | | | - | | | | 204 | |
Adjusted operating cash flow | | | $ 1,267 | | | | $ 2,004 | | | | $ 3,404 | | | | $ 4,381 | |
Changes in working capital | | | 33 | | | | (20) | | | | 292 | | | | 74 | |
Adjusted operating cash flow before working capital changes | | | $ 1,300 | | | | $ 1,984 | | | | $ 3,696 | | | | $ 4,455 | |
Adjusted operating cash flow | | | $ 1,267 | | | | $ 2,004 | | | | $ 3,404 | | | | $ 4,381 | |
Capital expenditures—Barrick’s share | | | (1,458) | | | | (1,431) | | | | (4,176) | | | | (3,367) | |
Free cash flow | | | ($ 191) | | | | $ 573 | | | | ($ 772) | | | | $ 1,014 | |
| | | | |
| BARRICK THIRD QUARTER 2012 | | 43 | | MANAGEMENT’S DISCUSSION AND ANALYSIS |
Total Cash Costs per ounce, C1 Cash Costs per pound and Net Cash Costs per ounce
Reconciliation of Cost of Sales to Total Cash Costs per ounce and C1 Cash Costs per pound
| | | | | | | | | | | | | | | | | | | | | | | | | | | | | | | | |
| ($ millions) | | Gold | | | Copper | | | Oil and Gas | | | Total | |
| For the three months ended September 30 | | 2012 | | | 2011 | | | 2012 | | | 2011 | | | 2012 | | | 2011 | | | 2012 | | | 2011 | |
Cost of Sales | | $ | 1,529 | | | $ | 1,293 | | | $ | 254 | | | $ | 354 | | | $ | 42 | | | $ | 47 | | | $ | 1,825 | | | $ | 1,694 | |
Less: Depreciation | | | 340 | | | | 284 | | | | 47 | | | | 64 | | | | 26 | | | | 28 | | | | 413 | | | | 376 | |
| | | $ | 1,189 | | | $ | 1,009 | | | $ | 207 | | | $ | 290 | | | $ | 16 | | | $ | 19 | | | $ | 1,412 | | | $ | 1,318 | |
| | | | |
($ millions) | | | Gold | | | | Copper | | | | Oil and Gas | | | | Total | |
For the nine months ended September 30 | | | 2012 | | | | 2011 | | | | 2012 | | | | 2011 | | | | 2012 | | | | 2011 | | | | 2012 | | | | 2011 | |
Cost of Sales | | $ | 4,439 | | | $ | 3,785 | | | $ | 861 | | | $ | 641 | | | $ | 125 | | | $ | 108 | | | $ | 5,425 | | | $ | 4,534 | |
Less: Depreciation | | | 968 | | | | 840 | | | | 165 | | | | 109 | | | | 78 | | | | 68 | | | | 1,211 | | | | 1,017 | |
| | | $ | 3,471 | | | $ | 2,945 | | | $ | 696 | | | $ | 532 | | | $ | 47 | | | $ | 40 | | | $ | 4,214 | | | $ | 3,517 | |
Gold
| | | | | | | | | | | | | | | | |
| ($ millions, except per ounce information in dollars) | | For the three months ended September 30 | | | For the nine months ended September 30 | |
| | | 2012 | | | 2011 | | | 2012 | | | 2011 | |
Cost of sales | | | $1,189 | | | | $1,009 | | | | $3,471 | | | | $2,945 | |
Cost of sales applicable to non-controlling interests1 | | | (42) | | | | (43) | | | | (124) | | | | (126) | |
Cost of sales applicable to ore purchase arrangement | | | (38) | | | | (38) | | | | (119) | | | | (100) | |
Other metal sales | | | (34) | | | | (35) | | | | (101) | | | | (104) | |
Realized non-hedge gains/losses on fuel hedges | | | 4 | | | | (3) | | | | 10 | | | | (6) | |
Treatment and refinement charges2 | | | 3 | | | | 2 | | | | 4 | | | | 7 | |
Impact of Barrick Energy | | | (20) | | | | (28) | | | | (65) | | | | (86) | |
Total cash cost of sales | | | $1,062 | | | | $864 | | | | $3,076 | | | | $2,530 | |
Ounces sold—consolidated basis (000s ounces) | | | 1,834 | | | | 1,963 | | | | 5,394 | | | | 5,845 | |
Ounces sold- non-controlling interest (000s ounces)1 | | | (42) | | | | (55) | | | | (129) | | | | (160) | |
Ounces sold—equity basis (000s ounces) | | | 1,792 | | | | 1,908 | | | | 5,265 | | | | 5,685 | |
Total cash costs per ounce3 | | | $592 | | | | $453 | | | | $584 | | | | $445 | |
| 1 | Relates to interest in ABG held by outside shareholders. |
| 2 | In first quarter 2012, we amended the presentation of treatment and refinement charges incurred on concentrate sales in the consolidated financial statements. Previously, these charges were included in cost of sales and they are now deducted from revenues. We have amended this non-GAAP financial performance measure to reflect this change and therefore result in a measure that is consistent with prior periods. |
| 3 | Total cash costs per ounce may not calculate based on amounts presented in this table due to rounding. |
| | | | |
| BARRICK THIRD QUARTER 2012 | | 44 | | MANAGEMENT’S DISCUSSION AND ANALYSIS |
Copper
| | | | | | | | | | | | | | | | |
| ($ millions, except per pound information in dollars) | | For the three months ended September 30 | | | For the nine months ended September 30 | |
| | | 2012 | | | 2011 | | | 2012 | | | 2011 | |
Cost of sales | | | $ 207 | | | | $ 290 | | | | $ 696 | | | | $ 532 | |
Treatment and refinement charges1 | | | 24 | | | | 34 | | | | 69 | | | | 42 | |
Less: royalties | | | (11 | ) | | | (11 | ) | | | (23 | ) | | | (14 | ) |
Less: non-routine charges | | | (7 | ) | | | (44 | ) | | | (17 | ) | | | (63 | ) |
Other | | | (17 | ) | | | - | | | | (17 | ) | | | - | |
C1 cash cost of sales | | | $ 196 | | | | $ 269 | | | | $ 708 | | | | $ 497 | |
Depreciation/amortization | | | 47 | | | | 64 | | | | 165 | | | | 109 | |
Royalties | | | 11 | | | | 11 | | | | 23 | | | | 14 | |
Non-routine charges | | | 7 | | | | 44 | | | | 17 | | | | 63 | |
Exploration and evaluation | | | 2 | | | | 2 | | | | 8 | | | | 2 | |
Administration costs | | | - | | | | 6 | | | | 5 | | | | 10 | |
Other expense (income) | | | 12 | | | | (2 | ) | | | 11 | | | | (12 | ) |
C3 fully allocated cost of sales | | | $ 275 | | | | $ 394 | | | | $ 937 | | | | $ 683 | |
Pounds sold-consolidated basis (millions pounds) | | | 84 | | | | 146 | | | | 318 | | | | 309 | |
C1 cash cost per pound2 | | | $ 2.33 | | | | $ 1.83 | | | | $ 2.22 | | | | $ 1.60 | |
C3 fully allocated cost per pound2 | | | $ 3.28 | | | | $ 2.70 | | | | $ 2.94 | | | | $ 2.21 | |
| 1 | In first quarter 2012, we amended the presentation of treatment and refinement charges incurred on concentrate sales in the consolidated financial statements. Previously, these charges were included in cost of sales and they are now deducted from revenues. We have amended this non-GAAP financial performance measure to reflect this change and therefore result in a measure that is consistent with prior periods. |
| 2 | C1 cash cost per pound and C3 fully allocated costs per pound may not calculate based on amounts presented in this table due to rounding. |
Net Cash Costs per ounce
| | | | | | | | | | | | | | | | |
| ($ millions, except per ounce/pound data in dollars) | | For the three months ended September 30 | | | For the nine months ended September 30 | |
| | | 2012 | | | 2011 | | | 2012 | | | 2011 | |
Ounces gold sold–equity basis (000s) | | | 1,792 | | | | 1,908 | | | | 5,265 | | | | 5,685 | |
Total cash costs per ounce–equity basis | | | $ 592 | | | | $453 | | | | $ 584 | | | | $ 445 | |
Revenues from copper sales | | | 307 | | | | 489 | | | | 1,148 | | | | 1,168 | |
Other | | | (17 | ) | | | - | | | | (17 | ) | | | - | |
Treatment and refinement charges1 | | | 24 | | | | 34 | | | | 69 | | | | 42 | |
Realized non-hedge copper derivative (losses) gains | | | (20 | ) | | | (5 | ) | | | (57 | ) | | | (16 | ) |
Net revenues from copper excluding realized non-hedgegains/losses from copper contracts | | | $ 294 | | | | $ 518 | | | | $ 1,143 | | | | $ 1,194 | |
Copper C1 cash cost of sales | | | 196 | | | | 269 | | | | 708 | | | | 497 | |
Copper credits | | | 98 | | | | 249 | | | | 435 | | | | 697 | |
Copper credits per ounce2 | | | 55 | | | | 130 | | | | 83 | | | | 123 | |
Net cash costs per ounce | | | $ 537 | | | | $ 323 | | | | $ 501 | | | | $ 322 | |
| 1 | In first quarter 2012, we amended the presentation of treatment and refinement charges incurred on concentrate sales in the consolidated financial statements. Previously, these charges were included in cost of sales and they are now deducted from revenues. We have amended this non-GAAP financial performance measure to reflect this change and therefore result in a measure that is consistent with prior periods. |
| 2 | Copper credits per ounce may not calculate based on amounts presented in this table due to rounding. |
| | | | |
| BARRICK THIRD QUARTER 2012 | | 45 | | MANAGEMENT’S DISCUSSION AND ANALYSIS |
EBITDA
Reconciliation of Net Earnings to EBITDA
| | | | | | | | | | | | | | | | |
| ($ millions, except per share amounts in dollars) | | For the three months ended September 30 | | | For the nine months ended September 30 | |
| | | 2012 | | | 2011 | | | 2012 | | | 2011 | |
Net earnings | | | $ 618 | | | | $ 1,365 | | | | $ 2,397 | | | | $ 3,525 | |
Income tax expense | | | 438 | | | | 654 | | | | 1,278 | | | | 1,698 | |
Finance costs | | | 33 | | | | 68 | | | | 133 | | | | 148 | |
Finance income | | | (3 | ) | | | (3 | ) | | | (9 | ) | | | (10 | ) |
Depreciation | | | 413 | | | | 376 | | | | 1,211 | | | | 1,017 | |
EBITDA | | | $ 1,499 | | | | $ 2,460 | | | | $ 5,010 | | | | $ 6,378 | |
Reported as: | | | | | | | | | | | | | | | | |
Gold | | | | | | | | | | | | | | | | |
North America | | | $ 862 | | | | $ 1,118 | | | | $ 2,753 | | | | $ 2,828 | |
South America | | | 437 | | | | 550 | | | | 1,215 | | | | 1,459 | |
Australia Pacific | | | 380 | | | | 495 | | | | 1,076 | | | | 1,225 | |
African Barrick Gold | | | 83 | | | | 175 | | | | 255 | | | | 419 | |
Copper | | | 86 | | | | 193 | | | | 430 | | | | 639 | |
Capital Projects | | | (16 | ) | | | (29 | ) | | | (50 | ) | | | (52 | ) |
Barrick Energy | | | 13 | | | | 21 | | | | 50 | | | | 71 | |
Other | | | (346 | ) | | | (63 | ) | | | (719 | ) | | | (211 | ) |
EBITDA | | | $ 1,499 | | | | $ 2,460 | | | | $ 5,010 | | | | $ 6,378 | |
Realized Prices
Reconciliation of Sales to Realized Price per ounce/per pound
| | | | | | | | | | | | | | | | | | | | | | | | | | | | | | | | |
| | | For the three months ended September 30 | | | For the nine months ended September 30 | |
($ millions, except per ounce/pound information in
dollars) | | Gold | | | | | | Copper | | | | | | Gold | | | | | | Copper | | | | |
| | | 2012 | | | 2011 | | | 2012 | | | 2011 | | | 2012 | | | 2011 | | | 2012 | | | 2011 | |
Sales | | | $ 3,056 | | | | $ 3,395 | | | | $ 307 | | | | $ 489 | | | | $ 8,994 | | | | $ 9,056 | | | | $ 1,148 | | | | $ 1,168 | |
Sales applicable to non-controlling interests | | | (71) | | | | (95) | | | | - | | | | - | | | | (213) | | | | (249) | | | | - | | | | - | |
Sales attributable to ore purchase agreement | | | (40) | | | | (41) | | | | - | | | | - | | | | (130) | | | | (108) | | | | - | | | | - | |
Realized non-hedge gold/copper derivative (losses)gains | | | (2) | | | | 46 | | | | (20) | | | | (5) | | | | - | | | | 54 | | | | (57) | | | | (16) | |
Treatment and refinement charges1 | | | 3 | | | | 2 | | | | 24 | | | | 34 | | | | 4 | | | | 7 | | | | 69 | | | | 42 | |
Other | | | - | | | | - | | | | (17) | | | | - | | | | - | | | | - | | | | (17) | | | | - | |
Export duties | | | 19 | | | | 18 | | | | - | | | | - | | | | 44 | | | | 50 | | | | - | | | | - | |
Revenues–as adjusted | | | $ 2,965 | | | | $ 3,325 | | | | $ 294 | | | | $ 518 | | | | $ 8,699 | | | | $ 8,810 | | | | $ 1,143 | | | | $ 1,194 | |
Ounces/pounds sold (000s ounces/millions pounds) | | | 1,792 | | | | 1,908 | | | | 84 | | | | 146 | | | | 5,265 | | | | 5,685 | | | | 318 | | | | 309 | |
Realized gold/copper price per ounce/pound2 | | | $ 1,655 | | | | $ 1,743 | | | | $ 3.52 | | | | $ 3.54 | | | | $ 1,652 | | | | $ 1,550 | | | | $ 3.59 | | | | $ 3.87 | |
| 1 | In first quarter 2012, we amended the presentation of treatment and refinement charges incurred on concentrate sales in the consolidated financial statements. Previously, these charges were included in cost of sales and they are now deducted from revenues. We have amended this non-GAAP financial performance measure to reflect this change and therefore result in a measure that is consistent with prior periods. |
| 2 | Realized price per ounce/pound may not calculate based on amounts presented in this table due to rounding. |
| | | | |
| BARRICK THIRD QUARTER 2012 | | 46 | | MANAGEMENT’S DISCUSSION AND ANALYSIS |
Net Cash Margin
Reconciliation of net cash margin per ounce
| | | | | | | | | | | | | | | | | | | | | | | | | | | | | | | | |
| | | For the three months ended September 30 | | | For the nine months ended September 30 | |
| (Per ounce data in dollars) | | Gold | | | Copper | | | Gold | | | Copper | |
| | | 2012 | | | 2011 | | | 2012 | | | 2011 | | | 2012 | | | 2011 | | | 2012 | | | 2011 | |
Realized gold/copper price per ounce/pound | | | $ 1,655 | | | | $ 1,743 | | | | $ 3.52 | | | | $ 3.54 | | | | $ 1,652 | | | | $ 1,550 | | | | $ 3.59 | | | | $ 3.87 | |
Total cash costs per ounce | | | 592 | | | | 453 | | | | | | | | | | | | 584 | | | | 445 | | | | | | | | | |
C1 cash costs per pound | | | | | | | | | | | 2.33 | | | | 1.83 | | | | | | | | | | | | 2.22 | | | | 1.60 | |
Total cash margin per ounce/per pound | | | $ 1,063 | | | | $ 1,290 | | | | $ 1.19 | | | | $ 1.71 | | | | $ 1,068 | | | | $ 1,105 | | | | $ 1.37 | | | | $ 2.27 | |
Copper credit per ounce1 | | | 55 | | | | 130 | | | | | | | | | | | | 83 | | | | 123 | | | | | | | | | |
Net cash margin per ounce | | | $ 1,118 | | | | $ 1,420 | | | | | | | | | | | | $ 1,151 | | | | $ 1,228 | | | | | | | | | |
| 1 | Copper credit per ounce is calculated as the margin from copper sales divided by gold ounces sold. Refer to the calculation in the net cash costs reconciliation on page 45. |
Adjusted Debt and Net Debt
Adjusted Debt and Net Debt Summary
| | | | | | | | |
| ($ millions) | | As at September 30, 2012 | | | As at December 31, 2011 | |
Debt per financial statements | | | $ 13,941 | | | | $ 13,369 | |
Fair value and other adjustments1 | | | 116 | | | | 65 | |
Pueblo Viejo financing –partner’s share2 | | | (376 | ) | | | (376 | ) |
Adjusted debt | | | $ 13,681 | | | | $ 13,058 | |
Cash and equivalents | | | (2,530 | ) | | | (2,745 | ) |
Cash and equivalents –partner’s share at Pueblo Viejo2 | | | 18 | | | | 7 | |
Net debt | | | $ 11,169 | | | | $ 10,320 | |
| 1 | Other adjustment primarily related to issue costs which have been netted against the debt. |
| 2 | We consolidate 100% of Pueblo Viejo in our financial statements; however we have guaranteed only our 60% share of the $940 million financing received to this point. Therefore, we have removed our partner’s share of both the financing and cash and equivalents to ensure comparability. |
| | | | |
| BARRICK THIRD QUARTER 2012 | | 47 | | MANAGEMENT’S DISCUSSION AND ANALYSIS |
Consolidated Statements of Income
| | | | | | | | | | | | | | | | |
| Barrick Gold Corporation | | Three months ended | | | Nine months ended | |
| (in millions of United States dollars, except per share data) (Unaudited) | | September 30, | | | September 30, | |
| | | 2012 | | | 2011 | | | 2012 | | | 2011 | |
| | | | |
Revenue (notes 4 and 5) | | $ | 3,436 | | | $ | 3,971 | | | $ | 10,358 | | | $ | 10,474 | |
Costs and expenses | | | | | | | | | | | | | | | | |
Cost of sales (notes 4 and 6) | | | 1,825 | | | | 1,694 | | | | 5,425 | | | | 4,534 | |
Corporate administration | | | 45 | | | | 43 | | | | 134 | | | | 123 | |
Exploration and evaluation (note 7) | | | 108 | | | | 94 | | | | 306 | | | | 248 | |
Other expense (note 9A) | | | 142 | | | | 135 | | | | 359 | | | | 391 | |
Impairment charges (note 9B) | | | 152 | | | | 19 | | | | 274 | | | | 23 | |
| | | 2,272 | | | | 1,985 | | | | 6,498 | | | | 5,319 | |
Other income (note 9C) | | | 4 | | | | 76 | | | | 41 | | | | 238 | |
Income (loss) from equity investees (note 13) | | | (3 | ) | | | 8 | | | | (9 | ) | | | 13 | |
Gain (loss) on non-hedge derivatives (note 17D) | | | (75 | ) | | | 32 | | | | (75 | ) | | | 8 | |
Income before finance items and income taxes | | | 1,090 | | | | 2,102 | | | | 3,817 | | | | 5,414 | |
Finance items (note 10) | | | | | | | | | | | | | | | | |
Finance income | | | 3 | | | | 3 | | | | 9 | | | | 10 | |
Finance costs | | | (33 | ) | | | (68 | ) | | | (133 | ) | | | (148 | ) |
Income before income taxes | | | 1,060 | | | | 2,037 | | | | 3,693 | | | | 5,276 | |
Income tax expense (note 11) | | | (438 | ) | | | (654 | ) | | | (1,278 | ) | | | (1,698 | ) |
Net income | | $ | 622 | | | $ | 1,383 | | | $ | 2,415 | | | $ | 3,578 | |
Attributable to: | | | | | | | | | | | | | | | | |
Equity holders of Barrick Gold Corporation | | $ | 618 | | | $ | 1,365 | | | $ | 2,397 | | | $ | 3,525 | |
Non-controlling interests (note 21) | | $ | 4 | | | $ | 18 | | | $ | 18 | | | $ | 53 | |
| | | | |
| Earnings per share data attributable to the equity holders of Barrick Gold Corporation (note 8) | | | | | | | | | | | | | | | | |
Net income | | | | | | | | | | | | | | | | |
Basic | | $ | 0.62 | | | $ | 1.37 | | | $ | 2.40 | | | $ | 3.53 | |
Diluted | | $ | 0.62 | | | $ | 1.36 | | | $ | 2.40 | | | $ | 3.52 | |
The accompanying notes are an integral part of these consolidated financial statements.
| | | | |
| BARRICK THIRD QUARTER 2012 | | 48 | | FINANCIAL STATEMENTS (UNAUDITED) |
Consolidated Statements of Comprehensive Income
| | | | | | | | | | | | | | | | |
Barrick Gold Corporation (in millions of United States dollars) (Unaudited) | | Three months ended
September 30, | | | Nine months ended
September 30, | |
| | | 2012 | | | 2011 | | | 2012 | | | 2011 | |
Net income | | $ | 622 | | | $ | 1,383 | | | $ | 2,415 | | | $ | 3,578 | |
| | | | |
Other comprehensive income (loss), net of taxes | | | | | | | | | | | | | | | | |
Unrealized gains (losses) on available-for-sale (“AFS”) financial securities, net of tax $2, $10, $1, $7 | | | 13 | | | | (75 | ) | | | (24 | ) | | | (70 | ) |
Realized (gains) losses and impairments on AFS financial securities, net of tax $nil, $1, $2, $6 | | | 1 | | | | (6 | ) | | | 29 | | | | (50 | ) |
Unrealized gains (losses) on derivatives designated as cash flow hedges, net of tax $16, $4, $14, $17 | | | 82 | | | | (162 | ) | | | 141 | | | | 165 | |
Realized (gains) on derivatives designated as cash flow hedges, net of tax $25, $3, $70, $49 | | | (81 | ) | | | (124 | ) | | | (240 | ) | | | (300 | ) |
Currency translation adjustments, net of tax $nil, $nil, $nil, $nil | | | 36 | | | | (94 | ) | | | 37 | | | | (61 | ) |
Total other comprehensive income (loss) | | | 51 | | | | (461 | ) | | | (57 | ) | | | (316 | ) |
Total comprehensive income | | $ | 673 | | | $ | 922 | | | $ | 2,358 | | | $ | 3,262 | |
Attributable to: | | | | | | | | | | | | | | | | |
| | | | |
Equity holders of Barrick Gold Corporation | | $ | 669 | | | $ | 904 | | | $ | 2,340 | | | $ | 3,209 | |
| | | | |
Non-controlling interests | | $ | 4 | | | $ | 18 | | | $ | 18 | | | $ | 53 | |
The accompanying notes are an integral part of these consolidated financial statements.
| | | | |
| BARRICK THIRD QUARTER 2012 | | 49 | | FINANCIAL STATEMENTS (UNAUDITED) |
Consolidated Statements of Cash Flow
| | | | | | | | | | | | | | | | |
Barrick Gold Corporation (in millions of United States dollars) (Unaudited) | | Three months ended
September 30, | | | Nine months ended
September 30, | |
| | | 2012 | | | 2011 | | | 2012 | | | 2011 | |
OPERATING ACTIVITIES | | | | | | | | | | | | | | | | |
Net income | | $ | 622 | | | $ | 1,383 | | | $ | 2,415 | | | $ | 3,578 | |
Adjusted for the following items: | | | | | | | | | | | | | | | | |
Depreciation | | | 413 | | | | 376 | | | | 1,211 | | | | 1,017 | |
Finance costs (excludes accretion) | | | 22 | | | | 52 | | | | 92 | | | | 108 | |
Impairment charges (note 9B) | | | 152 | | | | 19 | | | | 274 | | | | 23 | |
Income tax expense (note 11) | | | 438 | | | | 654 | | | | 1,278 | | | | 1,698 | |
Increase in inventory | | | (282 | ) | | | (199 | ) | | | (615 | ) | | | (455 | ) |
Proceeds from settlement of Australian dollar hedge contracts | | | 465 | | | | – | | | | 465 | | | | – | |
(Gain) loss on non-hedge derivatives | | | 75 | | | | (32 | ) | | | 75 | | | | (8 | ) |
(Gain) on sale of long-lived assets/investments | | | 2 | | | | (69 | ) | | | (18 | ) | | | (225 | ) |
Other (note 12A) | | | 81 | | | | 243 | | | | (120 | ) | | | (45 | ) |
Operating cash flows before interest and income taxes | | | 1,988 | | | | 2,427 | | | | 5,057 | | | | 5,691 | |
Interest paid | | | (6 | ) | | | (55 | ) | | | (73 | ) | | | (106 | ) |
Income taxes paid | | | (250 | ) | | | (470 | ) | | | (1,217 | ) | | | (1,494 | ) |
Net cash provided by operating activities | | | 1,732 | | | | 1,902 | | | | 3,767 | | | | 4,091 | |
INVESTING ACTIVITIES | | | | | | | | | | | | | | | | |
Property, plant and equipment | | | | | | | | | | | | | | | | |
Capital expenditures (note 4) | | | (1,561 | ) | | | (1,514 | ) | | | (4,458 | ) | | | (3,653 | ) |
Sales proceeds | | | 5 | | | | 15 | | | | 14 | | | | 48 | |
Acquisitions (note 3) | | | – | | | | (337 | ) | | | (15 | ) | | | (7,677 | ) |
Investments | | | | | | | | | | | | | | | | |
Purchases | | | – | | | | (63 | ) | | | – | | | | (72 | ) |
Sales | | | 2 | | | | 9 | | | | 169 | | | | 80 | |
Other investing activities (note 12B) | | | (52 | ) | | | (21 | ) | | | (212 | ) | | | (158 | ) |
Net cash used in investing activities | | | (1,606 | ) | | | (1,911 | ) | | | (4,502 | ) | | | (11,432 | ) |
FINANCING ACTIVITIES | | | | | | | | | | | | | | | | |
Proceeds on exercise of stock options | | | 1 | | | | 10 | | | | 6 | | | | 41 | |
Long-term debt | | | | | | | | | | | | | | | | |
Proceeds | | | – | | | | – | | | | 2,000 | | | | 6,659 | |
Repayments | | | – | | | | (16 | ) | | | (1,446 | ) | | | (365 | ) |
Dividends | | | (200 | ) | | | (119 | ) | | | (550 | ) | | | (359 | ) |
Funding from non-controlling interests | | | 132 | | | | 119 | | | | 390 | | | | 298 | |
Deposit on silver sale agreement | | | 137 | | | | 138 | | | | 137 | | | | 138 | |
Other financing activities (note 12C) | | | – | | | | (2 | ) | | | (25 | ) | | | (67 | ) |
Net cash provided by (used in) financing activities | | | 70 | | | | 130 | | | | 512 | | | | 6,345 | |
Effect of exchange rate changes on cash and equivalents | | | 4 | | | | (19 | ) | | | 8 | | | | (7 | ) |
Net increase (decrease) in cash and equivalents | | | 200 | | | | 102 | | | | (215 | ) | | | (1,003 | ) |
Cash and equivalents at beginning of period(note 17A) | | | 2,330 | | | | 2,863 | | | | 2,745 | | | | 3,968 | |
Cash and equivalents at end of period(note 17A) | | $ | 2,530 | | | $ | 2,965 | | | $ | 2,530 | | | $ | 2,965 | |
The accompanying notes are an integral part of these consolidated financial statements.
| | | | |
| BARRICK THIRD QUARTER 2012 | | 50 | | FINANCIAL STATEMENTS (UNAUDITED) |
Consolidated Balance Sheets
| | | | | | | | |
Barrick Gold Corporation (in millions of United States dollars) (Unaudited) | | As at September 30, | | | As at December 31, | |
| | | 2012 | | | 2011 | |
ASSETS | | | | | | | | |
Current assets | | | | | | | | |
Cash and equivalents (note 17A) | | $ | 2,530 | | | $ | 2,745 | |
Accounts receivable | | | 361 | | | | 426 | |
Inventories (note 14) | | | 2,851 | | | | 2,498 | |
Other current assets | | | 632 | | | | 876 | |
Total current assets | | | 6,374 | | | | 6,545 | |
Non-current assets | | | | | | | | |
Equity in investees (note 13) | | | 255 | | | | 440 | |
Other investments | | | 98 | | | | 161 | |
Property, plant and equipment (note 15) | | | 32,412 | | | | 28,979 | |
Goodwill (note 16) | | | 9,629 | | | | 9,626 | |
Intangible assets | | | 453 | | | | 569 | |
Deferred income tax assets | | | 378 | | | | 409 | |
Non-current portion of inventory (note 14) | | | 1,553 | | | | 1,153 | |
Other assets | | | 932 | | | | 1,002 | |
Total assets | | $ | 52,084 | | | $ | 48,884 | |
LIABILITIES AND EQUITY | | | | | | | | |
Current liabilities | | | | | | | | |
Accounts payable | | | 2,260 | | | | 2,083 | |
Debt (note 17B) | | | 1,299 | | | | 196 | |
Current income tax liabilities | | | 148 | | | | 306 | |
Other current liabilities | | | 257 | | | | 326 | |
Total current liabilities | | | 3,964 | | | | 2,911 | |
Non-current liabilities | | | | | | | | |
Debt (note 17B) | | | 12,642 | | | | 13,173 | |
Provisions (note 19) | | | 2,522 | | | | 2,326 | |
Deferred income tax liabilities | | | 4,299 | | | | 4,231 | |
Other liabilities (note 18) | | | 907 | | | | 689 | |
Total liabilities | | | 24,334 | | | | 23,330 | |
Equity | | | | | | | | |
Capital stock (note 20) | | | 17,911 | | | | 17,892 | |
Retained earnings | | | 6,409 | | | | 4,562 | |
Accumulated other comprehensive income | | | 538 | | | | 595 | |
Other | | | 314 | | | | 314 | |
Total equity attributable to Barrick Gold Corporation shareholders | | | 25,172 | | | | 23,363 | |
Non-controlling interests (note 21) | | | 2,578 | | | | 2,191 | |
Total equity | | | 27,750 | | | | 25,554 | |
Contingencies and commitments (notes 14, 15 and 22) | | | | | | | | |
Total liabilities and equity | | $ | 52,084 | | | $ | 48,884 | |
The accompanying notes are an integral part of these consolidated financial statements.
| | | | |
| BARRICK THIRD QUARTER 2012 | | 51 | | FINANCIAL STATEMENTS (UNAUDITED) |
Consolidated Statements of Changes in Equity
| | | | | | | | | | | | | | | | | | | | | | | | | | | | | | | | |
Barrick Gold Corporation | | | | | Attributable to equity holders of the company | | | | | | | |
(in millions of United States dollars) (Unaudited) | | Common Shares
(in thousands) | | | Capital stock | | | Retained
earnings | | | Accumulated
other
comprehensive
income | | | Other1 | | | Total equity
attributable to
shareholders | | | Non-controlling
interests | | | Total equity | |
At January 1, 2012 | | | 1,000,423 | | | | $17,892 | | | | $4,562 | | | | $595 | | | | $314 | | | | $23,363 | | | | $2,191 | | | | $25,554 | |
Net income | | | - | | | | - | | | | 2,397 | | | | - | | | | - | | | | 2,397 | | | | 18 | | | | 2,415 | |
Total other comprehensive income (loss) | | | - | | | | - | | | | - | | | | (57) | | | | - | | | | (57) | | | | - | | | | (57) | |
Total comprehensive income | | | - | | | | - | | | | 2,397 | | | | (57) | | | | - | | | | 2,340 | | | | 18 | | | | 2,358 | |
Transactions with owners | | | | | | | | | | | | | | | | | | | | | | | | | | | | | | | | |
Dividends | | | - | | | | - | | | | (550) | | | | - | | | | - | | | | (550) | | | | - | | | | (550) | |
Issued on exercise of stock options | | | 204 | | | | 6 | | | | - | | | | - | | | | - | | | | 6 | | | | - | | | | 6 | |
Recognition of stock option expense | | | - | | | | 13 | | | | - | | | | - | | | | - | | | | 13 | | | | - | | | | 13 | |
Funding from non-controlling interests | | | - | | | | - | | | | - | | | | - | | | | - | | | | - | | | | 390 | | | | 390 | |
Other decrease in non-controlling interests | | | - | | | | - | | | | - | | | | - | | | | - | | | | - | | | | (21) | | | | (21) | |
Total transactions with owners | | | 204 | | | | 19 | | | | (550) | | | | - | | | | - | | | | (531) | | | | 369 | | | | (162) | |
At September 30, 2012 | | | 1,000,627 | | | | $17,911 | | | | $6,409 | | | | $538 | | | | $314 | | | | $25,172 | | | | $2,578 | | | | $27,750 | |
| | | | | | | | |
| | | | | | | | | | | | | | | | | | | | | | | | | | | | | | | | | |
At January 1, 2011 | | | 998,500 | | | | $17,820 | | | | $609 | | | | $729 | | | | $314 | | | | $19,472 | | | | $1,745 | | | | $21,217 | |
Net income | | | - | | | | - | | | | 3,525 | | | | - | | | | - | | | | 3,525 | | | | 53 | | | | 3,578 | |
Total other comprehensive income | | | - | | | | - | | | | - | | | | (316) | | | | - | | | | (316) | | | | - | | | | (316) | |
Total comprehensive income | | | - | | | | - | | | | 3,525 | | | | (316) | | | | - | | | | 3,209 | | | | 53 | | | | 3,262 | |
Transactions with owners | | | | | | | | | | | | | | | | | | | | | | | | | | | | | | | | |
Dividends | | | - | | | | - | | | | (359) | | | | - | | | | - | | | | (359) | | | | - | | | | (359) | |
Issued on exercise of stock options | | | 1,295 | | | | 41 | | | | - | | | | - | | | | - | | | | 41 | | | | - | | | | 41 | |
Recognition of stock option expense | | | - | | | | 12 | | | | - | | | | - | | | | - | | | | 12 | | | | - | | | | 12 | |
Funding from non-controlling interests | | | - | | | | - | | | | - | | | | - | | | | - | | | | - | | | | 298 | | | | 298 | |
Other increase in non-controlling interests | | | - | | | | - | | | | - | | | | - | | | | - | | | | - | | | | (7) | | | | (7) | |
Total transactions with owners | | | 1,295 | | | | 53 | | | | (359) | | | | - | | | | - | | | | (306) | | | | 291 | | | | (15) | |
At September 30, 2011 | | | 999,795 | | | | $17,873 | | | | $3,775 | | | | $413 | | | | $314 | | | | $22,375 | | | | $2,089 | | | | $24,464 | |
| 1 | Includes additional paid-in capital as at September 30, 2012: $276 million (December 31, 2011: $276 million; September 30, 2011: $276 million) and convertible borrowings—equity component as at September 30, 2012: $38 million (December 31, 2011: $38 million; September 30, 2011: $38 million). |
The accompanying notes are an integral part of these consolidated financial statements.
| | | | |
| BARRICK THIRD QUARTER 2012 | | 52 | | FINANCIAL STATEMENTS (UNAUDITED) |
NOTES TO CONSOLIDATED FINANCIAL STATEMENTS
Barrick Gold Corporation.Tabular dollar amounts in millions of United States dollars, unless otherwise shown. References to C$, A$, ZAR, CLP, PGK, TZS, JPY, ARS, GBP, EUR and ZMK are to Canadian dollars, Australian dollars, South African rand, Chilean pesos, Papua New Guinea kina, Tanzanian shillings, Japanese yen, Argentinean pesos, British Pound sterling, Euros and Zambian kwacha, respectively.
1 > CORPORATE INFORMATION
Barrick Gold Corporation (“Barrick” or the “Company”) is a corporation governed by the Business Corporation Act (Ontario). The Company’s head and registered office is located at Brookfield Place, TD Canada Trust Tower, 161 Bay Street, Suite 3700, Toronto, Ontario, M5J 2S1. We are principally engaged in the production and sale of gold and copper, as well as related activities such as exploration and mine development. We also hold interests in oil and gas properties located in Canada. Our producing gold mines are concentrated in three regional business units (“RBU”): North America, South America, and Australia Pacific. We also hold a 73.9% equity interest in African Barrick Gold plc (“ABG”), a company listed on the London Stock Exchange that owns gold mines and exploration properties in Africa. Our Copper business unit contains producing copper mines located in Chile and Zambia and a mine under construction located in Saudi Arabia. We sell our gold and copper production into the world market.
2 > SIGNIFICANT ACCOUNTING POLICIES
| A) | Statement of Compliance |
These condensed interim consolidated financial statements have been prepared in accordance with International Accounting Standard 34Interim Financial Reporting (“IAS 34”) as issued by the International Accounting Standards Board (“IASB”). These interim financial statements should be read in conjunction with Barrick’s most recently issued Annual Report which includes information necessary or useful to understanding the Company’s business and financial statement presentation. In particular, the Company’s significant accounting policies were presented in Note 2 of the consolidated financial statements for the year ended December 31, 2011, and have been consistently applied in the preparation of these interim financial statements. These interim financial statements were authorized for issuance by the Board of Directors on October 31, 2012.
Certain comparatives have been restated to conform to current presentation.
| B) | New Accounting Standards |
IFRS 9 Financial Instruments
In November 2009, the IASB issued IFRS 9 Financial Instruments as the first step in its project to replace IAS 39 Financial Instruments: Recognition and Measurement. IFRS 9 retains but simplifies the mixed measurement model and establishes two primary measurement categories for financial assets: amortized cost and fair value. The basis of classification depends on an entity’s business model and the contractual cash flow of the financial asset. Classification is made at the time the financial asset is initially recognized, namely when the entity becomes a party to the contractual provisions of the instrument.
IFRS 9 amends some of the requirements of IFRS 7 Financial Instruments: Disclosures, including added disclosures about investments in equity instruments measured at fair value in Other Comprehensive Income (“OCI”), and guidance on financial liabilities and derecognition of financial instruments. In December 2011, the IASB issued an amendment that adjusted the mandatory effective date of IFRS 9 from January 1, 2013 to January 1, 2015. We are currently assessing the impact of adopting IFRS 9 on our consolidated financial statements, including the possibility of early adoption.
IFRS 10 Consolidated Financial Statements
In May 2011, the IASB issued IFRS 10 Consolidated Financial Statements to replace IAS 27 Consolidated and Separate Financial Statements and SIC 12 Consolidation – Special Purpose Entities. The new consolidation standard changes the definition of control so that the same criteria apply to all entities, both operating and special purpose entities, to determine control. The revised definition focuses on the need to have both power and variable returns before control is present. IFRS 10 is effective for reporting periods starting January 1, 2013 with early adoption permitted. We have commenced a review of all our non-wholly owned entities to assess the impact of adopting IFRS 10 on our consolidated financial statements.
IFRS 11 Joint Arrangements
In May 2011, the IASB issued IFRS 11 Joint Arrangements to replace IAS 31, Interests in Joint Ventures. The new standard defines two types of arrangements: Joint Operations and Joint Ventures. Focus is on the rights and
| | | | |
| BARRICK THIRD QUARTER 2012 | | 53 | | NOTES TO FINANCIAL STATEMENTS (UNAUDITED) |
obligations of the parties involved to reflect the joint arrangement, thereby requiring parties to recognize the individual assets and liabilities to which they have rights or for which they are responsible, even if the joint arrangement operates in a separate legal entity. IFRS 11 is effective for reporting periods starting January 1, 2013 with early adoption permitted. We have commenced a review of all our joint arrangements to assess the impact of adopting IFRS 11 on our consolidated financial statements.
IFRS 12 Disclosure of Interests in Other Entities
In May 2011, the IASB issued IFRS 12 Disclosure of Interests in Other Entities to create a comprehensive disclosure standard to address the requirements for subsidiaries, joint arrangements and associates including the reporting entity’s involvement with other entities. It also includes the requirements for unconsolidated structured entities (i.e. special purpose entities). IFRS 12 is effective for reporting periods starting January 1, 2013 with early adoption permitted. We have commenced a review of the incremental disclosure requirements of IFRS 12 and are currently assessing the impact on our consolidated financial statements.
IFRS 13 Fair Value Measurement
In May 2011, the IASB issued IFRS 13 Fair Value Measurement as a single source of guidance for all fair value measurements required by IFRS to reduce the complexity and improve consistency across its application. The standard provides a definition of fair value and guidance on how to measure fair value as well as a requirement for enhanced disclosures. IFRS 13 is effective for reporting periods starting January 1, 2013 with early adoption permitted. We are currently assessing the impact of adopting IFRS 13 on our consolidated financial statements.
IFRIC 20 Stripping Costs in the Production Phase of a Surface Mine
In October 2011, the IASB issued IFRIC 20 Stripping Costs in the Production Phase of a Surface Mine. IFRIC 20 provides guidance on the accounting for the costs of stripping activity in the production phase of surface mining when two benefits accrue to the entity from the stripping activity: useable ore that can be used to produce inventory and improved access to further quantities of material that will be mined in future periods. IFRIC 20 is effective for reporting periods starting January 1, 2013 with early adoption permitted. We have completed our preliminary assessment of the impact of adopting this standard, which indicates that we will capitalize more waste stripping costs than under our current accounting policy.
| C) | Significant Changes in Estimates |
Gold and Copper Mineral Reserves
At the end of each fiscal year, as part of our annual business cycle, we prepare estimates of the proven and probable reserves and the portion of resources expected to be extracted economically for each mineral property. We prospectively revise calculations of depreciation of property, plant and equipment and also transfer amounts allocated to non-depreciable mining interest to mining interest subject to depreciation based on the ounces/pounds that have become probable of being economically extracted. The effect of changes in the proven and probable reserves and the portion of resources expected to be extracted economically on depreciation expense for the three months ended September 30, 2012 was a decrease of $11 million (2011: $25 million decrease) and for the nine months ended September 30, 2012 was a decrease of $35 million (2011: $74 million decrease). The effect of transfers to mining interest subject to depreciation on depreciation expense for the three months ended September 30, 2012 was an increase of $1 million (2011: $nil) and for the nine months ended September 30, 2012 was an increase of $7 million (2011: $nil).
Provision for Environmental Rehabilitation (“PER”)
Provisions are updated each reporting period for changes to expected cash flows and for the effect of changes in the discount rate, and the change in estimate is added or deducted from the related asset and depreciated over the expected economic life of the operation to which it relates. We recorded $64 million (2011: $154 million) in discount rate adjustments to the PER at our minesites for the three months ended September 30, 2012 and $166 million (2011: $192 million) for the nine months ended September 30, 2012.
Accounting for impairment of non-current assets
We conduct an annual test for impairment of goodwill in the fourth quarter of each fiscal year and at any other time of the year if an indicator of impairment is identified. In addition, non-current assets are tested for impairment when events or changes in circumstances suggest that the carrying amount may not be recoverable. Each quarter we conduct a review of internal factors (such as operating performance, changes in reserves/resources or changes in the mine plans) and external factors (such as metal prices, discount rates and foreign exchange rates) for each operating site, project and E&E property to determine whether such an indicator of impairment exists. In third quarter 2012, the only indicator of impairment that was identified was at an exploration property in Papua New Guinea acquired in 2007, where we completed an exploration program and a decision was made not to
| | | | |
| BARRICK THIRD QUARTER 2012 | | 54 | | NOTES TO FINANCIAL STATEMENTS (UNAUDITED) |
proceed with further exploration activities. We conducted an impairment assessment, and as a result of this assessment we recorded an impairment charge of $141 million to reduce this exploration property to its estimated fair value less cost to sell. In second quarter 2012, the update to Pascua-Lama’s schedule and cost estimate was identified as a triggering event for impairment testing purposes. We assessed the impact and determined that the fair value of the project exceeded its carrying value and consequently no impairment was recorded.
We are nearing completion of a substantial infill drilling program to provide a more precise model of the ore body for mine planning purposes. These programs are expected to be completed in the fourth quarter of the year and will form the basis for an updated life of mine plan for Lumwana. The updated life of mine plan will provide updated economics, including updated capital and operating costs, and will be used to conduct the annual test for goodwill impairment for our copper business unit at the end of 2012, and an impairment test for non-current assets at Lumwana if an indicator of impairment is identified. The key risk factors for impairment relate to the estimated production levels and unit production costs at the Chimiwungo deposit, which represents about 90% of the future production at Lumwana. If we are not able to support higher production levels at lower unit costs in the LOM plan, there is a risk that an impairment charge will be recorded in the fourth quarter. The current carrying value of Lumwana is $3.8 billion.
3 > ACQUISITIONS AND DIVESTITURES
| | | | | | | | | | | | | | | | |
| | | For the three
months ended
September 30 | | | For the nine
months ended
September 30 | |
| | | 2012 | | | 2011 | | | 2012 | | | 2011 | |
Cash paid on acquisition | | | | | | | | | | | | | | | | |
Equinox | | $ | - | | | $ | 269 | | | $ | - | | | $ | 7,482 | |
Oil and Gas acquisitions | | | - | | | | 68 | | | | - | | | | 253 | |
Other | | | - | | | | - | | | | 15 | | | | 25 | |
| | | - | | | | 337 | | | | 15 | | | | 7,760 | |
Less: cash acquired | | | - | | | | - | | | | - | | | | (83 | ) |
| | | $ | - | | | $ | 337 | | | $ | 15 | | | $ | 7,677 | |
Cash proceeds on divesture | | | | | | | | | | | | | | | | |
Highland Gold | | $ | - | | | $ | - | | | $ | 122 | | | $ | - | |
Sedibelo | | | - | | | | - | | | | - | | | | 44 | |
Pinson | | | - | | | | 15 | | | | - | | | | 15 | |
| | | $ | - | | | $ | 15 | | | $ | 122 | | | $ | 59 | |
| A) | Disposition of our 20.4% interest in Highland Gold |
On April 26, 2012, we completed the sale of our 20.4% investment in Highland Gold for net proceeds of $122 million. As a result of the sale of this non-core holding, we recognized an impairment loss of $86 million for the nine month period ended September 30, 2012 representing the difference between the net proceeds and our carrying value.
| B) | Acquisition of Equinox Minerals Limited |
On June 1, 2011, we acquired 83% of the recorded voting shares of Equinox Minerals Limited (“Equinox”), thus obtaining control. Throughout June we obtained a further 13% of the voting shares and obtained the final 4% on July 19, 2011. Total cash consideration paid in second quarter 2011 was $7,213 billion, with a further $269 million paid in third quarter 2011, for total cash consideration of $7,482 million. We have determined that this transaction represents a business combination with Barrick identified as the acquirer. We began consolidating the operating results, cash flows and net assets of Equinox from June 1, 2011.
| C) | Oil and Gas acquisitions |
For the nine month period ended September 30, 2011, our oil and gas subsidiary Barrick Energy completed two acquisitions. On January 14, 2011, Barrick Energy acquired a 50% interest in the Valhalla North property from Penn West (“Valhalla North”), for approximately $25 million. On June 30, 2011, Barrick Energy acquired all of the outstanding shares of Venturion Natural Resources Limited (“Venturion”), a privately held corporation, for approximately $185 million.
| | | | |
| BARRICK THIRD QUARTER 2012 | | 55 | | NOTES TO FINANCIAL STATEMENTS (UNAUDITED) |
These acquisitions were made to acquire additional producing assets, proved and probable reserves, as well as facilities to allow us to grow and expand our energy business. We have determined that these transactions represent business combinations, with Barrick Energy identified as the acquirer. Barrick Energy began consolidating the operating results, cash flows, and net assets of Valhalla North and Venturion from January 14, 2011 and June 30, 2011 respectively.
| D) | Disposition of 10% Interest in Sedibelo |
On March 23, 2011, we disposed of our 10% interest in the Sedibelo platinum project (“Sedibelo”) with a carrying amount of $nil, to the Bakgatla-Ba-Kgafela Tribe (“BBK”), owner of the remaining 90% interest in Sedibelo; and transferred certain long lead items and associated liabilities with carrying amounts of $nil and $23 million respectively, to Newshelf 1101 (Proprietary) Limited for consideration of $44 million. We also settled various outstanding matters between Barrick and the BBK regarding Sedibelo and their respective interests. We recorded a pre-tax gain of $67 million upon the closing of this transaction.
4 > SEGMENT INFORMATION
Barrick’s business is organized into seven primary business units: four regional gold businesses, a global copper business, an oil and gas business, and a capital projects business. Barrick’s Chief Operating Decision Maker reviews the operating results, assesses performance and makes capital allocation decisions at a business unit level. Therefore, these business units are operating segments for financial reporting purposes.
Segment performance is evaluated based on a number of measures including operating income before tax, production levels and unit production costs. Income tax, corporate administration, finance income and costs, impairment charges and reversals, investment write-downs and gains/losses on non-hedge derivatives are managed on a consolidated basis and are therefore not reflected in segment income.
| | | | | | | | | | | | | | | | | | | | | | | | | | | | |
| Consolidated Statement of Income Information | |
| | | | | | |
| | | | | | | Cost of Sales | | | | | | | | | | | | | | | | | |
| For the three months ended September 30, 2012 | | | Revenue | | |
| Direct mining &
royalties |
| | | Depreciation | | |
| Exploration &
evaluation |
| |
| Operating segment
administration |
| |
| Other
expenses
(income |
)1 | |
| Segment
income
(loss |
)2 |
Gold | | | | | | | | | | | | | | | | | | | | | | | | | | | | |
North America | | | $ 1,334 | | | | $ 411 | | | | $ 139 | | | | $ 13 | | | | $ 14 | | | | $ 40 | | | | $ 717 | |
South America | | | 654 | | | | 187 | | | | 71 | | | | 3 | | | | 12 | | | | 17 | | | | 364 | |
Australia Pacific | | | 842 | | | | 437 | | | | 82 | | | | 17 | | | | 13 | | | | (3 | ) | | | 296 | |
ABG | | | 262 | | | | 154 | | | | 41 | | | | 7 | | | | 13 | | | | 6 | | | | 41 | |
Copper3 | | | 307 | | | | 207 | | | | 47 | | | | 2 | | | | - | | | | 12 | | | | 39 | |
Capital Projects4 | | | - | | | | - | | | | 2 | | | | 2 | | | | - | | | | 14 | | | | (18 | ) |
Barrick Energy | | | 37 | | | | 16 | | | | 26 | | | | - | | | | 3 | | | | 5 | | | | (13 | ) |
| | | | $ 3,436 | | | | $ 1,412 | | | | $ 408 | | | | $ 44 | | | | $ 55 | | | | $ 91 | | | | $ 1,426 | |
| | | | |
| BARRICK THIRD QUARTER 2012 | | 56 | | NOTES TO FINANCIAL STATEMENTS (UNAUDITED) |
| | | | | | | | | | | | | | | | | | | | | | | | | | | | |
| Consolidated Statement of Income Information | |
| | | | | | |
| | | | | | | Cost of Sales | | | | | | | | | | | | | | | | | |
| For the three months ended September 30, 2011 | | | Revenue | | |
| Direct mining &
royalties |
| | | Depreciation | | |
| Exploration &
evaluation |
| |
| Operating segment
administration |
| |
| Other expenses
(income |
)1 | |
| Segment
income (loss |
)2 |
Gold | | | | | | | | | | | | | | | | | | | | | | | | | | | | |
North America | | | $ 1,516 | | | | $ 374 | | | | $ 114 | | | | $ 10 | | | | $ 13 | | | | $ 7 | | | | $ 998 | |
South America | | | 738 | | | | 166 | | | | 53 | | | | 3 | | | | 11 | | | | 11 | | | | 494 | |
Australia Pacific | | | 828 | | | | 322 | | | | 78 | | | | 13 | | | | 3 | | | | (2 | ) | | | 414 | |
ABG | | | 353 | | | | 147 | | | | 35 | | | | 7 | | | | 12 | | | | 13 | | | | 139 | |
Copper3 | | | 489 | | | | 290 | | | | 64 | | | | 2 | | | | 6 | | | | (2 | ) | | | 129 | |
Capital Projects4 | | | - | | | | - | | | | - | | | | 11 | | | | 1 | | | | 18 | | | | (30 | ) |
Barrick Energy | | | 47 | | | | 19 | | | | 28 | | | | - | | | | 4 | | | | 3 | | | | (7 | ) |
| | | | $ 3,971 | | | | $ 1,318 | | | | $ 372 | | | | $ 46 | | | | $ 50 | | | | $ 48 | | | | $ 2,137 | |
Consolidated Statement of Income Information | |
| | | | | | |
| | | | | | | Cost of Sales | | | | | | | | | | | | | | | | | |
For the nine months ended September 30, 2012 | | | Revenue | | |
| Direct mining &
royalties |
| | | Depreciation | | |
| Exploration &
evaluation |
| |
| Operating segment
administration |
| |
| Other expenses
(income |
)1 | |
| Segment
income (loss)2 |
|
Gold | | | | | | | | | | | | | | | | | | | | | | | | | | | | |
North America | | | $ 4,144 | | | | $ 1,274 | | | | $ 425 | | | | $ 35 | | | | $ 43 | | | | $ 54 | | | | $ 2,313 | |
South America | | | 1,783 | | | | 503 | | | | 183 | | | | 7 | | | | 23 | | | | 43 | | | | 1,024 | |
Australia Pacific | | | 2,375 | | | | 1,225 | | | | 229 | | | | 40 | | | | 37 | | | | 6 | | | | 838 | |
ABG | | | 795 | | | | 469 | | | | 113 | | | | 18 | | | | 38 | | | | 18 | | | | 139 | |
Copper3 | | | 1,148 | | | | 696 | | | | 165 | | | | 8 | | | | 5 | | | | 11 | | | | 263 | |
Capital Projects4 | | | - | | | | - | | | | 3 | | | | 21 | | | | 2 | | | | 30 | | | | (56 | ) |
Barrick Energy | | | 113 | | | | 47 | | | | 78 | | | | - | | | | 8 | | | | 8 | | | | (28 | ) |
| | | | $ 10,358 | | | | $ 4,214 | | | | $ 1,196 | | | | $ 129 | | | | $ 156 | | | | $ 170 | | | | $ 4,493 | |
Consolidated Statement of Income Information | |
| | | | | | |
| | | | | | | Cost of Sales | | | | | | | | | | | | | | | | | |
For the nine months ended September 30, 2011 | | | Revenue | | |
| Direct mining &
royalties |
| | | Depreciation | | |
| Exploration &
evaluation |
| |
| Operating segment
administration |
| |
| Other expenses
(income |
)1 | |
| Segment
income (loss)2 |
|
Gold | | | | | | | | | | | | | | | | | | | | | | | | | | | | |
North America | | | $ 4,030 | | | | $ 1,079 | | | | $ 361 | | | | $ 27 | | | | $ 31 | | | | $ 80 | | | | $ 2,452 | |
South America | | | 1,985 | | | | 496 | | | | 153 | | | | 5 | | | | 29 | | | | 3 | | | | 1,299 | |
Australia Pacific | | | 2,236 | | | | 947 | | | | 208 | | | | 39 | | | | 27 | | | | 6 | | | | 1,009 | |
ABG | | | 926 | | | | 423 | | | | 100 | | | | 23 | | | | 33 | | | | 31 | | | | 316 | |
Copper3 | | | 1,170 | | | | 532 | | | | 109 | | | | 2 | | | | 10 | | | | (12 | ) | | | 529 | |
Capital Projects4 | | | - | | | | - | | | | - | | | | 32 | | | | 1 | | | | 20 | | | | (53 | ) |
Barrick Energy | | | 127 | | | | 40 | | | | 68 | | | | - | | | | 9 | | | | 8 | | | | 2 | |
| | | | $ 10,474 | | | | $ 3,517 | | | | $ 999 | | | | $ 128 | | | | $ 140 | | | | $ 136 | | | | $ 5,554 | |
| 1 | Other expenses include accretion expense, which is included within finance costs in the consolidated statement of income. For the three months ended September 30, 2012, accretion expense was $11 million (2011: $16 million) and for the nine months ended September 30, 2012, accretion expense was $41 million (2011: $40 million). |
| 2 | We manage the performance of our business units using a measure of income before interest and taxes; consequently, interest income, interest expense and income taxes are not allocated to our regional business units and therefore, not reflected in segment income (loss). |
| 3 | The Copper segment includes exploration and evaluation expense and losses from equity investees that hold copper projects. |
| 4 | The Capital Projects segment relates to our interests in our significant gold projects under construction. Segment income (loss) for the Capital Projects segment includes exploration and evaluation expense and losses from equity investees that hold capital projects. |
| | | | |
| BARRICK THIRD QUARTER 2012 | | 57 | | NOTES TO FINANCIAL STATEMENTS (UNAUDITED) |
| | | | | | | | | | | | | | | | |
| Reconciliation of Segment Income to Income (Loss) from Continuing Operations Before Income Taxes | |
| | | For the three months ended September 30 | | | For the nine months ended September 30 | |
| | | 2012 | | | 2011 | | | 2012 | | | 2011 | |
Segment income | | $ | 1,426 | | | $ | 2,137 | | | $ | 4,493 | | | $ | 5,554 | |
Depreciation of corporate assets | | | (5 | ) | | | (4 | ) | | | (15 | ) | | | (18 | ) |
Global exploration and evaluation costs | | | (67 | ) | | | (51 | ) | | | (186 | ) | | | (129 | ) |
Corporate administration | | | (45 | ) | | | (43 | ) | | | (134 | ) | | | (123 | ) |
Other income (expenses) | | | (3 | ) | | | 23 | | | | (33 | ) | | | 83 | |
Impairment charges | | | (152 | ) | | | (19 | ) | | | (274 | ) | | | (23 | ) |
Finance income | | | 3 | | | | 3 | | | | 9 | | | | 10 | |
Finance costs (excludes accretion) | | | (22 | ) | | | (52 | ) | | | (92 | ) | | | (108 | ) |
Gain (loss) on non-hedge derivatives | | | (75 | ) | | | 32 | | | | (75 | ) | | | 8 | |
Gain from equity investees not attributable to segments | | | - | | | | 11 | | | | - | | | | 22 | |
Income before income taxes | | $ | 1,060 | | | $ | 2,037 | | | $ | 3,693 | | | $ | 5,276 | |
Asset Information
| | | | | | | | | | | | | | | | |
Segment capital expenditures1 | |
| For the three
months ended
September 30 |
| |
| For the nine
months ended
September 30 |
|
| | | | 2012 | | | | 2011 | | | | 2012 | | | | 2011 | |
Gold | | | | | | | | | | | | | | | | |
North America | | $ | 344 | | | $ | 290 | | | $ | 886 | | | $ | 788 | |
South America | | | 85 | | | | 85 | | | | 240 | | | | 208 | |
Australia Pacific | | | 111 | | | | 150 | | | | 349 | | | | 357 | |
ABG | | | 81 | | | | 84 | | | | 209 | | | | 209 | |
Copper | | | 206 | | | | 90 | | | | 571 | | | | 128 | |
Capital Projects | | | 760 | | | | 797 | | | | 2,254 | | | | 2,041 | |
Barrick Energy | | | 21 | | | | 52 | | | | 93 | | | | 114 | |
Segment total | | | 1,608 | | | | 1,548 | | | | 4,602 | | | | 3,845 | |
Other items not allocated to segments | | | 6 | | | | 7 | | | | 24 | | | | 19 | |
Enterprise total | | $ | 1,614 | | | $ | 1,555 | | | $ | 4,626 | | | $ | 3,864 | |
| 1 | Segment capital expenditures are presented for internal management reporting purposes on an accrual basis. Capital expenditures in the Consolidated Statement of Cash Flow are presented on a cash basis. For the three months ended September 30, 2012, cash expenditures were $1,561 million (2011: $1,514 million) and the increase in accrued expenditures was $53 million (2011: $41 million increase). For the nine months ended September 30, 2012, cash expenditures were $4,458 million (2011: $3,653 million) and the increase in accrued expenditures was $168 million (2011: $211 million increase). |
| | | | | | | | | | | | | | | | |
| 5 > REVENUE | | | | | | | | | | | | | | | | |
| | |
| For the three months
ended September 30 |
| |
| For the nine months
ended September 30 |
|
| | | | 2012 | | | | 2011 | | | | 2012 | | | | 2011 | |
Gold bullion sales1 | | | | | | | | | | | | | | | | |
Spot market sales | | $ | 2,984 | | | $ | 3,274 | | | $ | 8,746 | | | $ | 8,717 | |
Concentrate sales2 | | | 72 | | | | 121 | | | | 248 | | | | 339 | |
| | | 3,056 | | | | 3,395 | | | | 8,994 | | | | 9,056 | |
Copper sales1 | | | | | | | | | | | | | | | | |
Copper cathode sales | | | 162 | | | | 272 | | | | 737 | | | | 852 | |
Concentrate sales2 | | | 145 | | | | 217 | | | | 411 | | | | 316 | |
| | | | 307 | | | | 489 | | | | 1,148 | | | | 1,168 | |
Oil and gas sales | | | 37 | | | | 47 | | | | 113 | | | | 127 | |
Other metal sales | | | 36 | | | | 40 | | | | 103 | | | | 123 | |
Total | | $ | 3,436 | | | $ | 3,971 | | | $ | 10,358 | | | $ | 10,474 | |
| 1 | Revenues include amounts transferred from OCI to earnings for commodity cash flow hedges (see note 17C). |
| 2 | Concentrate revenues are presented net of treatment charges and refinement charges incurred on the sale of concentrates. For the three months ended September 30, 2012, treatment charges and refinement charges for gold were $3 million (2011: $2 million) and for copper was $24 million (2011: $34 million). For the nine months ended September 30, 2012, treatment charges and refinement charges for gold were $4 million (2011: $7 million) and for copper was $69 million (2011: $42 million). |
Revenue
In first quarter 2012, we began reclassifying our treatment and refinement charges incurred on the sale of concentrates from cost of sales and began offsetting them against revenue. This change does not have any impact on our net income or net assets. We have restated prior period results to conform to the current presentation.
| | | | |
| BARRICK THIRD QUARTER 2012 | | 58 | | NOTES TO FINANCIAL STATEMENTS (UNAUDITED) |
Provisional Copper and Gold Sales
We have provisionally priced sales for which price finalization, referenced to the relevant copper and gold index, is outstanding at the balance sheet date. Our exposure at September 30, 2012 to the impact of movements in market commodity prices for provisionally priced sales is set out in the following table:
| | | | | | | | | | | | | | | | |
| | | Volumes
subject to
final pricing | | | Impact on net income
before taxation of 10%
movement in market
price US$M | |
For the nine months ended September 30 | | | 2012 | | | | 2011 | | | | 2012 | | | | 2011 | |
Copper pounds (millions) | | | 45 | | | | 82 | | | $ | 17 | | | $ | 27 | |
Gold ounces (000’s) | | | 15 | | | | 57 | | | | 3 | | | | 10 | |
For the three months ended September 30, 2012, our provisionally priced copper sales included provisional pricing gains of $9 million (2011: $58 million loss) and our provisionally priced gold sales included provisional pricing gains of $5 million (2011: $11 million gain). For the nine months ended September 30, 2012, our provisionally priced copper sales included provisional pricing gains of $12 million (2011: $61 million loss) and our provisionally priced gold sales included provisional pricing gains of $4 million (2011: $15 million gain).
At September 30, 2012, our provisionally priced copper and gold sales subject to final settlement were recorded at average prices of $3.73/lb (2011: $3.27/lb) and $1,743/oz (2011: $1,776/oz) respectively. The sensitivities in the above tables have been determined as the impact of a 10 percent change in commodity prices, while holding all other variables constant.
6 > COST OF SALES
| | | | | | | | | | | | | | | | |
| | | For the three months
ended September 30 | | | For the nine months
ended September 30 | |
| | | 2012 | | | 2011 | | | 2012 | | | 2011 | |
Direct mining cost1,2 | | $ | 1,311 | | | $ | 1,219 | | | $ | 3,955 | | | $ | 3,270 | |
Depreciation | | | 413 | | | | 376 | | | | 1,211 | | | | 1,017 | |
Royalty expense | | | 101 | | | | 99 | | | | 259 | | | | 247 | |
| | | $ | 1,825 | | | $ | 1,694 | | | $ | 5,425 | | | $ | 4,534 | |
| 1 | Direct mining cost includes charges to reduce the cost of inventory to net realizable value as follows: $11 million for the three months ended September 30, 2012 (2011: $1 impairment reversal) and $36 million for the nine months ended September 30, 2012 (2011: $nil). |
| 2 | Direct mining cost includes the costs of extracting co-products. |
7 > EXPLORATION AND EVALUATION
| | | | | | | | | | | | | | | | |
| | | For the three months
ended September 30 | | | For the nine months
ended September 30 | |
| | | 2012 | | | 2011 | | | 2012 | | | 2011 | |
Exploration: | | | | | | | | | | | | | | | | |
Minesite exploration | | $ | 19 | | | $ | 15 | | | $ | 50 | | | $ | 56 | |
Global programs | | | 55 | | | | 46 | | | | 149 | | | | 103 | |
| | | 74 | | | | 61 | | | | 199 | | | | 159 | |
Evaluation costs | | | 34 | | | | 33 | | | | 107 | | | | 89 | |
Exploration and evaluation expense1 | | $ | 108 | | | $ | 94 | | | $ | 306 | | | $ | 248 | |
| 1 | Approximates the impact on operating cash flow |
| | | | |
| BARRICK THIRD QUARTER 2012 | | 59 | | NOTES TO FINANCIAL STATEMENTS (UNAUDITED) |
8 > EARNINGS PER SHARE
| | | | | | | | | | | | | | | | | | | | | | | | | | | | | | | | |
| | | For the three months ended September 30 | | | For the nine months ended September 30 | |
| | | 2012 | | | 2011 | | | 2012 | | | 2011 | |
$ millions, except shares in millions and per share amounts in dollars | | | Basic | | | | Diluted | | | | Basic | | | | Diluted | | | | Basic | | | | Diluted | | | | Basic | | | | Diluted | |
Net Income | | $ | 622 | | | $ | 622 | | | $ | 1,383 | | | $ | 1,383 | | | $ | 2,415 | | | $ | 2,415 | | | $ | 3,578 | | | $ | 3,578 | |
Net income attributable to non-controlling interests | | | (4 | ) | | | (4 | ) | | | (18 | ) | | | (18 | ) | | | (18 | ) | | | (18 | ) | | | (53 | ) | | | (53 | ) |
Net income attributable to equity holders of Barrick Gold Corporation | | $ | 618 | | | $ | 618 | | | $ | 1,365 | | | $ | 1,365 | | | $ | 2,397 | | | $ | 2,397 | | | $ | 3,525 | | | $ | 3,525 | |
Weighted average shares outstanding | | | 1,001 | | | | 1,001 | | | | 999 | | | | 999 | | | | 1,001 | | | | 1,001 | | | | 999 | | | | 999 | |
Effect of dilutive securities - stock options | | | - | | | | - | | | | - | | | | 2 | | | | - | | | | - | | | | - | | | | 2 | |
| | | | 1,001 | | | | 1,001 | | | | 999 | | | | 1,001 | | | | 1,001 | | | | 1,001 | | | | 999 | | | | 1,001 | |
Earnings per share data attributable to the equity holders of Barrick Gold Corporation | | | | | | | | | | | | | | | | | | | | | | | | | | | | | | | | |
Net income | | $ | 0.62 | | | $ | 0.62 | | | $ | 1.37 | | | $ | 1.36 | | | $ | 2.40 | | | $ | 2.40 | | | $ | 3.53 | | | $ | 3.52 | |
9 > OTHER CHARGES
A Other Expense
| | | | | | | | | | | | | | | | |
| | | For the three
months ended
September 30 | | | For the nine
months ended
September 30 | |
| | | 2012 | | | 2011 | | | 2012 | | | 2011 | |
Operating segment administration1 | | $ | 55 | | | $ | 50 | | | $ | 156 | | | $ | 140 | |
Corporate social responsibility | | | 15 | | | | 16 | | | | 53 | | | | 34 | |
Changes in estimate of rehabilitation costs at closed mines | | | 15 | | | | 26 | | | | 31 | | | | 36 | |
World Gold Council fees | | | 4 | | | | 2 | | | | 11 | | | | 7 | |
Currency translation losses2 | | | 11 | | | | 4 | | | | 11 | | | | 3 | |
Severance and other restructuring costs | | | 1 | | | | - | | | | 18 | | | | - | |
Contingent purchase consideration3 | | | - | | | | - | | | | - | | | | 39 | |
Equinox acquisition costs | | | - | | | | 2 | | | | - | | | | 39 | |
Other expensed items | | | 41 | | | | 35 | | | | 79 | | | | 93 | |
Total | | $ | 142 | | | $ | 135 | | | $ | 359 | | | $ | 391 | |
| 1 | Relates to costs incurred at business unit offices. |
| 2 | Amounts attributable to currency translation losses on working capital. |
| 3 | Amount relates to the re-measurement of a liability for contingent consideration for the acquisition of the additional 40% of the Cortez property in 2008. |
B Impairment Charges
| | | | | | | | | | | | | | | | |
| | | For the three
months ended
September 30 | | | For the nine
months ended
September 30 | |
| | | 2012 | | | 2011 | | | 2012 | | | 2011 | |
Impairment of long-lived assets1 | | $ | 141 | | | $ | 19 | | | $ | 141 | | | $ | 23 | |
Impairment (reversal) of other investments2 | | | 10 | | | | - | | | | 96 | | | | - | |
Impairment of available for sale investments | | | 1 | | | | - | | | | 37 | | | | - | |
Total | | $ | 152 | | | $ | 19 | | | $ | 274 | | | $ | 23 | |
| 1 | Impairment charge related to long-lived assets for 2012 relates to the asset write-down of an exploration property in Papua New Guinea to its estimated fair value. |
| 2 | Primarily relates to impairment of Highland Gold Mining Limited upon reclassification from equity investees into other investments. Refer to note 3A for further details. |
C Other Income
| | | | | | | | | | | | | | | | |
| | | For the three
months ended
September 30 | | | For the nine months ended
September 30 | |
| | | 2012 | | | 2011 | | | 2012 | | | 2011 | |
Gain on sale of long-lived assets/investments1 | | $ | - | | | $ | 69 | | | $ | 18 | | | $ | 225 | |
Other | | | 4 | | | | 7 | | | | 23 | | | | 13 | |
Total | | $ | 4 | | | $ | 76 | | | $ | 41 | | | $ | 238 | |
| 1 | Primarily relates to the gain on sale of our investments. 2011 gain relates to the disposition of our 10% interest in Sedibelo in first quarter 2011. |
| | | | |
| BARRICK THIRD QUARTER 2012 | | 60 | | NOTES TO FINANCIAL STATEMENTS (UNAUDITED) |
10> FINANCE INCOME AND FINANCE COSTS
a) Finance Income
| | | | | | | | | | | | | | | | |
| | | For the three
months ended
September 30 | | | For the nine
months ended
September 30 | |
| | | 2012 | | | 2011 | | | 2012 | | | 2011 | |
Interest income | | $ | 3 | | | $ | 3 | | | $ | 9 | | | $ | 10 | |
b) Finance Costs
| | | | | | | | | | | | | | | | |
| | | For the three
months ended
September 30 | | | For the nine
months ended
September 30 | |
| | | 2012 | | | 2011 | | | 2012 | | | 2011 | |
Interest | | $ | 171 | | | $ | 148 | | | $ | 506 | | | $ | 376 | |
Amortization of debt issue costs | | | 3 | | | | 4 | | | | 7 | | | | 8 | |
(Gain) losses on interest rate hedges | | | - | | | | (1 | ) | | | (1 | ) | | | - | |
Interest capitalized1 | | | (152 | ) | | | (99 | ) | | | (420 | ) | | | (276 | ) |
Accretion | | | 11 | | | | 16 | | | | 41 | | | | 40 | |
Total | | $ | 33 | | | $ | 68 | | | $ | 133 | | | $ | 148 | |
| 1 | Interest has been capitalized at the rate of interest applicable to the specific borrowings financing the assets under construction or, where financed through general borrowings, at a capitalization rate representing the average interest rate on such borrowings. For the three months ended September 30, 2012, the general capitalization rate was 1.3% (2011: 1.2%) and for the nine months ended September 30, 2012, the general capitalization rate was 4.0% (2011: 4.0%). |
11 > INCOME TAX EXPENSE
| | | | | | | | | | | | | | | | |
| | | For the three
months ended
September 30 | | | For the nine
months ended
September 30 | |
| | | 2012 | | | 2011 | | | 2012 | | | 2011 | |
Current | | $ | 369 | | | $ | 561 | | | $ | 1,124 | | | $ | 1,464 | |
Deferred | | | 69 | | | | 93 | | | | 154 | | | | 234 | |
| | | $ | 438 | | | $ | 654 | | | $ | 1,278 | | | $ | 1,698 | |
Actual effective tax rate | | | 41.3 | % | | | 32.1 | % | | | 34.6 | % | | | 32.2 | % |
Impact of: | | | | | | | | | | | | | | | | |
Net currency translation gains(losses) on deferred tax balances | | | (1.8 | %) | | | 0.7 | % | | | (0.3 | %) | | | 0.7 | % |
Tax rate changes | | | 1.0 | % | | | - | | | | 0.6 | % | | | - | |
Foreign income tax assessment | | | 0.1 | % | | | - | | | | 0.5 | % | | | - | |
Peruvian Tax Court | | | | | | | | | | | | | | | | |
Decision | | | - | | | | (1.4 | %) | | | - | | | | (0.5 | %) |
Dividend withholding tax | | | - | | | | - | | | | - | | | | (0.2 | %) |
Australian functional currency election | | | - | | | | - | | | | - | | | | 0.1 | % |
Impairment charges and non-hedge derivatives | | | (7.8 | %) | | | 1.2 | % | | | (3.1 | %) | | | 0.3 | % |
Other | | | (0.8 | %) | | | 0.4 | % | | | (0.3 | %) | | | 0.4 | % |
Estimated effective tax rate on ordinary income | | | 32.0 | % | | | 33.0 | % | | | 32.0 | % | | | 33.0 | % |
Currency Translation
Deferred tax balances are subject to remeasurement for changes in currency exchange rates each period. The most significant balances are Papua New Guinea and Argentinean net deferred tax liabilities. These translation gains/losses are included within deferred income tax expense/recovery.
Tax Rate Changes
In second quarter 2012, a tax rate change was enacted in the province of Ontario, Canada, resulting in a deferred tax recovery of $11 million.
In third quarter 2012, a tax rate change was enacted in Chile, resulting in current tax expense of $4 million and deferred tax recovery of $15 million
Foreign Income Tax Assessment
In second quarter 2012, a foreign income tax assessment was received which resulted in a current tax recovery of $19 million.
Peruvian Tax Court Decision
In third quarter 2011, we recorded tax expense of $28 million in respect of a Peruvian Tax court decision.
| | | | |
| BARRICK THIRD QUARTER 2012 | | 61 | | NOTES TO FINANCIAL STATEMENTS (UNAUDITED) |
Dividend Withholding Tax
In second quarter 2011, we recorded a $12 million dividend withholding tax expense in respect of funds available from a foreign subsidiary.
Australian Functional Currency Election
In first quarter 2011, we filed an election in Australia to prepare certain of our Australian tax returns using US dollar functional currency effective January 1, 2011. This election resulted in a one-time benefit of $4 million. Going forward, all material Australian tax returns will now be filed using a US dollar functional currency.
12 > CASH FLOW – OTHER ITEMS
| | | | | | | | | | | | | | | | |
| A Operating Cash Flows – Other Items | | For the three months ended
September 30 | | | For the nine months ended
September 30 | |
| | | 2012 | | | 2011 | | | 2012 | | | 2011 | |
Adjustments for non-cash income statement items: | | | | | | | | | | | | | | | | |
Currency translation (gains) losses (note 9A) | | $ | 11 | | | $ | 4 | | | $ | 11 | | | $ | 3 | |
RSU expense | | | 13 | | | | 11 | | | | 28 | | | | 23 | |
Stock option expense | | | 3 | | | | 2 | | | | 13 | | | | 12 | |
(Gain) loss from investment in associates (note 13) | | | 3 | | | | (8 | ) | | | 9 | | | | (13 | ) |
Change in estimate of rehabilitation provisions at closed mines | | | 15 | | | | 26 | | | | 31 | | | | 36 | |
Inventory impairment charges (reversals) (note 14) | | | 11 | | | | (1 | ) | | | 36 | | | | - | |
Accretion | | | 11 | | | | 16 | | | | 41 | | | | 40 | |
Cash flow arising from changes in: | | | | | | | | | | | | | | | | |
Derivative assets and liabilities | | | 9 | | | | 81 | | | | 24 | | | | (45 | ) |
Other current assets | | | 9 | | | | (9 | ) | | | 21 | | | | 3 | |
Value added tax recoverable | | | (30 | ) | | | (59 | ) | | | (25 | ) | | | (76 | ) |
Accounts receivable | | | 45 | | | | 2 | | | | 65 | | | | (4 | ) |
Other current liabilities | | | (40 | ) | | | 11 | | | | (23 | ) | | | (34 | ) |
Prepaid assets | | | 80 | | | | 15 | | | | (110 | ) | | | (51 | ) |
Accounts payable and accrued liabilities | | | (9 | ) | | | 149 | | | | 11 | | | | 62 | |
Other assets and liabilities | | | (37 | ) | | | 15 | | | | (166 | ) | | | 29 | |
Contingent consideration related to the acquisition of the additional 40% of the Cortez property | | | - | | | | - | | | | (50 | ) | | | - | |
Settlement of rehabilitation obligations | | | (13 | ) | | | (12 | ) | | | (36 | ) | | | (30 | ) |
Other net operating activities | | $ | 81 | | | $ | 243 | | | $ | (120 | ) | | $ | (45 | ) |
| | | |
| B Investing Cash Flows – Other Items | | For the three
months ended
September 30 | | | For the nine
months ended
September 30 | |
| | | 2012 | | | 2011 | | | 2012 | | | 2011 | |
Funding of investments in associates (note 13) | | $ | (11 | ) | | $ | (8 | ) | | $ | (33 | ) | | $ | (31 | ) |
Value added tax recoverable on project capital expenditures | | | (39 | ) | | | (65 | ) | | | (168 | ) | | | (129 | ) |
Other | | | (2 | ) | | | 52 | | | | (11 | ) | | | 2 | |
Other net investing activities | | $ | (52 | ) | | $ | (21 | ) | | $ | (212 | ) | | $ | (158 | ) |
| | |
| C Financing Cash Flows – Other Items | | For the three
months ended
September 30 | | | For the nine
months ended
September 30 | |
| | | 2012 | | | 2011 | | | 2012 | | | 2011 | |
Financing fees on long-term debt | | $ | - | | | $ | - | | | $ | (22 | ) | | $ | (59 | ) |
Other | | | - | | | | (2 | ) | | | (3 | ) | | | (8 | ) |
Other net financing activities | | $ | - | | | $ | (2 | ) | | $ | (25 | ) | | $ | (67 | ) |
| | | | |
| BARRICK THIRD QUARTER 2012 | | 62 | | NOTES TO FINANCIAL STATEMENTS (UNAUDITED) |
13 > EQUITY IN INVESTEES
Equity Accounting Method Investment Continuity
| | | | | | | | | | | | | | | | | | | | |
| | | Highland Gold1 | | | Reko Diq2 | | | Donlin Gold | | | Kabanga | | | Total | |
At January 1, 2012 | | | $ 209 | | | | $ 121 | | | | $ 99 | | | | $ 11 | | | | $ 440 | |
Equity pick-up (loss) from equity investees | | | - | | | | (8 | ) | | | (1 | ) | | | - | | | | (9 | ) |
Funds invested | | | - | | | | 8 | | | | 15 | | | | 10 | | | | 33 | |
Transfer to other investments | | | (209 | ) | | | - | | | | - | | | | - | | | | (209 | ) |
At September 30, 2012 | | | $ - | | | | $ 121 | | | | $ 113 | | | | $ 21 | | | | $ 255 | |
Publicly traded | | | Yes | | | | No | | | | No | | | | No | | | | | |
| 1 | Refer to note 3A for further details. |
| 2 | Refer to note 22 for further details. |
14 > INVENTORIES
| | | | | | | | | | | | | | | | |
| | | Gold | | | Copper | |
| | | At September 30, 2012 | | | At December 31, 2011 | | | At September 30, 2012 | | | At December 31, 2011 | |
Raw materials | | | | | | | | | | | | | | | | |
Ore in stockpiles | | | $1,777 | | | | $1,401 | | | | $244 | | | | $189 | |
Ore on leach pads | | | 326 | | | | 335 | | | | 308 | | | | 247 | |
Mine operating supplies | | | 927 | | | | 757 | | | | 145 | | | | 128 | |
Work in process | | | 366 | | | | 371 | | | | 6 | | | | 6 | |
Finished products | | | | | | | | | | | | | | | | |
Gold doré | | | 164 | | | | 111 | | | | - | | | | - | |
Copper cathode | | | - | | | | - | | | | 67 | | | | 14 | |
Copper concentrate | | | - | | | | - | | | | 62 | | | | 89 | |
Gold concentrate | | | 12 | | | | 3 | | | | - | | | | - | |
| | | 3,572 | | | | 2,978 | | | | 832 | | | | 673 | |
Non-current ore in stockpiles1 | | | (1,379 | ) | | | (980 | ) | | | (174 | ) | | | (173 | ) |
| | | | $2,193 | | | | $1,998 | | | | $658 | | | | $500 | |
| 1 | Ore that we do not expect to process in the next 12 months is classified as long-term. |
| | | | | | | | | | | | | | | | |
| | | For the three months ended September 30 | | | For the nine months ended September 30 | |
| | | 2012 | | | 2011 | | | 2012 | | | 2011 | |
Inventory impairment charges | | $ | 11 | | | $ | - | | | $ | 36 | | | $ | 1 | |
Inventory impairment charges reversed | | | - | | | | (1 | ) | | | - | | | | (1 | ) |
Purchase Commitments
At September 30, 2012, we had purchase obligations for supplies and consumables of $1,788 million.
| | | | |
| BARRICK THIRD QUARTER 2012 | | 63 | | NOTES TO FINANCIAL STATEMENTS (UNAUDITED) |
15 > PROPERTY, PLANT, AND EQUIPMENT
| | | | | | | | |
| | | As at
September 30,
2012 | | | As at
December 31,
2011 | |
Depreciable assets | | $ | 15,222 | | | $ | 14,709 | |
| | |
Non-depreciable assets | | | | | | | | |
Capital projects | | | | | | | | |
Pascua-Lama | | | 5,276 | | | | 3,749 | |
Pueblo Viejo1 | | | 4,334 | | | | 3,554 | |
Cerro Casale1 | | | 1,812 | | | | 1,732 | |
Jabal Sayid | | | 1,452 | | | | 1,282 | |
Construction-in-progress | | | 1,688 | | | | 1,314 | |
Acquired mineral resources and exploration potential | | | 2,628 | | | | 2,639 | |
| | | $ | 32,412 | | | $ | 28,979 | |
| 1 | Amounts are presented on a 100% basis and include our partner’s non-controlling interest. |
Capital Commitments
In addition to entering into various operational commitments in the normal course of business, we had capital commitments of $2,107 million at September 30, 2012.
16 > GOODWILL
| | | | | | | | |
| | | As at
September 30,
2012 | | | As at
December 31,
2011 | |
Gold | | | | | | | | |
North America | | $ | 2,376 | | | $ | 2,376 | |
South America | | | 441 | | | | 441 | |
Australia Pacific | | | 1,480 | | | | 1,480 | |
ABG | | | 179 | | | | 179 | |
Gold carrying amount | | $ | 4,476 | | | $ | 4,476 | |
Copper | | | 4,249 | | | | 4,249 | |
Capital Projects | | | 809 | | | | 809 | |
Barrick Energy | | | 95 | | | | 92 | |
Total carrying amount | | $ | 9,629 | | | $ | 9,626 | |
We do not have any goodwill that is deductible for income tax purposes.
17 > FINANCIAL INSTRUMENTS
Financial instruments include cash; evidence of ownership in an entity; or a contract that imposes an obligation on one party and conveys a right to a second entity to deliver/receive cash or another financial instrument.
A Cash and Equivalents
Cash and equivalents include cash, term deposits, treasury bills and money market funds with original maturities of less than 90 days.
B Debt
Credit Facility
We have a credit and guarantee agreement (the “Credit Facility”) with certain lenders, which requires such lenders to make available to us a credit facility of up to $1.5 billion or the equivalent amount in Canadian dollars. $50 million matured in the second quarter of 2012 and an additional $250 million was repaid during the second quarter of 2012. The remaining $1.2 billion matures in April 2013.
Equinox Acquisition Financing
In May 2011, we entered into a credit and guarantee agreement (the “Equinox Credit Facility”) with certain lenders, which required such lenders to make available to us a credit facility of $2 billion or the equivalent amount in Canadian dollars.
In order to finance a portion of the Equinox acquisition, including the payment of related fees and expenses, we drew $1.5 billion on the Credit Facility in May 2011 and $1.0 billion on the Equinox Credit Facility in June 2011.
In June 2011, Barrick, and our wholly-owned subsidiary Barrick North America Finance LLC (“BNAF”), issued an aggregate of $4.0 billion in debt securities. The net proceeds from this offering were used in June 2011 to finance a portion of the acquisition of Equinox, including the payment of related fees and expenses.
Refinancing of Equinox Credit Facility
In January 2012, we finalized a credit and guarantee agreement (the “2012 Credit Facility”) with certain lenders, which requires such lenders to make available to us a credit facility of $4 billion or the equivalent amount of Canadian dollars. The credit facility, which is unsecured, has an interest rate of LIBOR plus 1.20% on drawn amounts, and a commitment rate of 0.175% on undrawn amounts. The $4 billion facility matures in 2017. Coincident with becoming effective, we drew $1 billion on the 2012 Credit Facility, paid down the $1 billion outstanding under the Equinox Credit Facility and then terminated the Equinox Credit Facility.
| | | | |
| BARRICK THIRD QUARTER 2012 | | 64 | | NOTES TO FINANCIAL STATEMENTS (UNAUDITED) |
Pueblo Viejo Project Financing Agreement
In April 2010, Barrick and Goldcorp finalized terms for $1.035 billion (100% basis) in non-recourse project financing for Pueblo Viejo. The amount is divided into three tranches of $400 million, $375 million and $260 million with tenors of 15, 15 and 12 years, respectively. We have drawn $940 million to date and the remaining undrawn amount on this financing agreement was $95 million as at September 30, 2012.
Other Fixed Rate Notes
We provide an unconditional and irrevocable guarantee on debentures totaling $1.25 billion through our wholly-owned indirect subsidiary Barrick (PD) Australia Finance Pty Ltd. and $1.25 billion of notes through our wholly-owned indirect subsidiaries Barrick North America Finance LLC and Barrick Gold Financeco LLC. These guarantees will rank equally with our other unsecured and unsubordinated obligations.
3.85% and 5.25% Notes
On April 3, 2012, Barrick issued an aggregate of $2 billion in debt securities comprised of $1.25 billion of 3.85% notes due 2022 and $750 million of 5.25% notes due 2042. $1.0 billion of the net proceeds from this offering were used to repay existing indebtedness under the 2012 Credit Facility.
| | | | | | | | | | | | | | | | | | | | | | | | |
| SCHEDULED DEBT REPAYMENTS1 | | | | | | | | | | | | | | | | | | |
| | | | 2012 | | | | 2013 | | | | 2014 | | | | 2015 | | | | 2016 | | |
| 2017 and
thereafter |
|
1.75%/2.9%/4.4%/5.7% notes | | | $ - | | | | $ - | | | | $ 700 | | | | $ - | | | | $ 1,100 | | | | $ 2,200 | |
3.85%/5.2% notes | | | - | | | | - | | | | - | | | | - | | | | - | | | | 2,000 | |
5.80%/4.875% notes | | | - | | | | - | | | | 350 | | | | - | | | | - | | | | 400 | |
5.75%/6.35% notes | | | - | | | | - | | | | - | | | | - | | | | 400 | | | | 600 | |
Other fixed rate notes | | | - | | | | 500 | | | | - | | | | - | | | | - | | | | 2,750 | |
Project financing | | | - | | | | 45 | | | | 90 | | | | 90 | | | | 90 | | | | 625 | |
Other debt obligations | | | - | | | | 65 | | | | - | | | | 100 | | | | - | | | | 567 | |
Credit Facility | | | - | | | | 1,200 | | | | - | | | | - | | | | - | | | | - | |
| | | | $ - | | | | $1,810 | | | | $1,140 | | | | $190 | | | | $1,590 | | | | $9,142 | |
Minimum annual payments under capital leases | | | $ 19 | | | | $ 46 | | | | $ 40 | | | | $ 29 | | | | $ 23 | | | | $ 29 | |
| 1 | This table illustrates the contractual undiscounted cash flows, and may not agree with the amounts disclosed in the consolidated balance sheet. |
| | | | |
| BARRICK THIRD QUARTER 2012 | | 65 | | NOTES TO FINANCIAL STATEMENTS (UNAUDITED) |
C Derivative Instruments at September 30, 2012
| | | | | | | | | | | | | | | | | | | | | | | | | | | | | | | | | | |
| | | Notional amount by term to maturity | | | | | Accounting classification by notional amount | |
| | | Within 1 year | | | 2 to 3 years | | | 4+ years | | | Total | | | | | Cash flow
hedge | | | Fair value
hedge | | | Non-hedge | | | Fair
value (USD) | |
US dollar interest rate contracts | | | | | | | | | | | | | | | | | | | | | | | | | | | | | | | | | | |
Total receive - fixed swap positions | | | $ 100 | | | | $ 100 | | | | $ - | | | | $ 200 | | | | | | $ - | | | | $ 200 | | | | $ - | | | | $ 7 | |
Currency contracts | | | | | | | | | | | | | | | | | | | | | | | | | | | | | | | | | | |
A$:US$ contracts (A$ millions) | | | 252 | | | | 960 | | | | 660 | | | | 1,872 | | | | | | 1,774 | | | | - | | | | 98 | | | | 96 | |
C$:US$ contracts (C$ millions) | | | 535 | | | | 203 | | | | - | | | | 738 | | | | | | 630 | | | | - | | | | 108 | | | | 19 | |
CLP:US$ contracts (CLP millions)1 | | | 338,366 | | | | 434,560 | | | | 19,500 | | | | 792,426 | | | | | | 278,011 | | | | - | | | | 514,415 | | | | 74 | |
EUR:US$ contracts (EUR millions) | | | 6 | | | | - | | | | - | | | | 6 | | | | | | - | | | | - | | | | 6 | | | | - | |
PGK:US$ contracts (PGK millions) | | | 50 | | | | - | | | | - | | | | 50 | | | | | | - | | | | - | | | | 50 | | | | - | |
ZAR:US$ contracts (ZAR millions) | | | 488 | | | | 132 | | | | - | | | | 620 | | | | | | - | | | | - | | | | 620 | | | | - | |
| | | | | | | | | | | | | | | | | | | | | | | | | | | | | | | | | | 189 | |
| | | | | | | | | | |
Commodity contracts | | | | | | | | | | | | | | | | | | | | | | | | | | | | | | | | | | |
| Copper collar sell contracts (millions of pounds) | | | 62 | | | | - | | | | - | | | | 62 | | | | | | 60 | | | | - | | | | 2 | | | | 10 | |
| Copper bought floor contracts (millions of pounds) | | | 10 | | | | - | | | | - | | | | 10 | | | | | | 10 | | | | - | | | | - | | | | 1 | |
| Copper bought call contracts (millions of pounds) | | | 60 | | | | - | | | | - | | | | 60 | | | | | | - | | | | - | | | | 60 | | | | - | |
| Silver collar sell contracts (millions of ozs) | | | 2 | | | | 27 | | | | 36 | | | | 65 | | | | | | 58 | | | | - | | | | 7 | | | | (49 | ) |
| Diesel contracts (thousands of barrels)2 | | | 3,349 | | | | 2,801 | | | | 240 | | | | 6,390 | | | | | | 2,567 | | | | - | | | | 3,823 | | | | 26 | |
| Propane contracts (millions of gallons) | | | 1 | | | | - | | | | - | | | | 1 | | | | | | 1 | | | | - | | | | - | | | | - | |
| Natural Gas contracts (thousands of GJ) | | | (460 | ) | | | - | | | | - | | | | (460 | ) | | | | | (460 | ) | | | - | | | | - | | | | - | |
| Electricity contracts (thousands of megawatt hours) | | | 29 | | | | 26 | | | | 2 | | | | 57 | | | | | | - | | | | - | | | | 57 | | | | - | |
| | | | | | | | | | | | | | | | | | | | | | | | | | | | | | | | | (12 | ) |
Total | | | | | | | | | | | | | | | | | | | | | | | | | | | | | | | | $ | 184 | |
| 1 | Non-hedge contracts economically hedge pre-production capital expenditures at our Pascua-Lama and Cerro Casale projects. |
| 2 | Diesel commodity contracts represent a combination of WTI, ULSD, WTB, MOPS, Brent-WTI spread swaps and JET hedge contracts. These derivatives hedge physical supply contracts based on the price of ULSD, WTB, MOPS and JET respectively, plus a spread. WTI represents West Texas Intermediate, WTB represents Waterborne, MOPS represents Mean of Platts Singapore, JET represents Jet Fuel, Brent represents Brent crude, ULSD represents Ultra Low Sulfur Diesel US Gulf Coast. |
| | | | |
| BARRICK THIRD QUARTER 2012 | | 66 | | NOTES TO FINANCIAL STATEMENTS (UNAUDITED) |
Cash Flow Hedge Gains (Losses) in Accumulated Other Comprehensive Income
| | | | | | | | | | | | | | | | | | | | | | | | | | | | | | | | | | | | |
| | | Commodity price hedges | | | | | Currency hedges | | | | | Interest
rate
hedges | | | | |
| | | Gold/Silver | | | Copper | | | Fuel | | | | | Operating
costs | | | Administration/
other costs | | | Capital
expenditures | | | | | Long-
term
debt | | | Total | |
At January 1, 2012 | | | $ 44 | | | | $ 82 | | | | $ 29 | | | | | | $ 572 | | | | $ 19 | | | | $ 18 | | | | | | $ (31) | | | | $ 733 | |
Effective portion of change in fair value of hedging instruments | | | (43 | ) | | | (55) | | | | 3 | | | | | | 213 | | | | 20 | | | | 20 | | | | | | (3) | | | | 155 | |
Transfers to earnings: | | | | | | | | | | | | | | | | | | | | | | | | | | | | | | | | | | | | |
On recording hedged items in earnings/PP&E1 | | | - | | | | (26 | ) | | | (18) | | | | | | (243) | | | | (14 | ) | | | (11) | | | | | | 2 | | | | (310) | |
At September 30, 2012 | | | $ 1 | | | | $ 1 | | | | $ 14 | | | | | | $ 542 | | | | $ 25 | | | | $ 27 | | | | | | $ (32) | | | | $ 578 | |
| 1 | Realized gains (losses) on qualifying currency hedges of capital expenditures are transferred from OCI to PP&E on settlement. |
D Gains (Losses) on Non-hedge Derivatives
| | | | | | | | | | | | | | | | |
| | | For the three
months ended
September 30 | | | For the nine
months ended
September 30 | |
| | | | 2012 | | | | 2011 | | | | 2012 | | | | 2011 | |
| Gains (losses) on non-hedge derivatives | | | | | | | | | | | | | | | | |
Commodity contracts | | | | | | | | | | | | | | | | |
Gold | | $ | (1 | ) | | $ | 46 | | | $ | - | | | $ | 53 | |
Copper | | | (2 | ) | | | (7 | ) | | | (10 | ) | | | (82 | ) |
Fuel | | | 20 | | | | (70 | ) | | | - | | | | (41 | ) |
Currency contracts | | | 33 | | | | (58 | ) | | | 93 | | | | (89 | ) |
Interest rate contracts | | | (1 | ) | | | - | | | | (1 | ) | | | 7 | |
| | | $ | 49 | | | $ | (89 | ) | | $ | 82 | | | $ | (152 | ) |
| Gains (losses) attributable to silver option collar hedges1 | | | (140 | ) | | | 73 | | | | (135 | ) | | | 47 | |
| Gains (losses) attributable to copper option collar hedges1 | | | 1 | | | | 51 | | | | (36 | ) | | | 124 | |
| Gains (losses) attributable to currency option collar hedges1 | | | 14 | | | | (3 | ) | | | 13 | | | | (17 | ) |
Hedge ineffectiveness | | | 1 | | | | - | | | | 1 | | | | 6 | |
| | | $ | (124 | ) | | $ | 121 | | | $ | (157 | ) | | $ | 160 | |
| | | $ | (75 | ) | | $ | 32 | | | $ | (75 | ) | | $ | 8 | |
| 1 | Represents unrealized gains (losses) attributable to changes in the time value of the collars, which are excluded from the hedge effectiveness assessment. |
For the nine month period ended September 30, 2012, we unwound approximately $2.6 billion of our Australian dollar hedges at an average spot price of $1.05. We realized net cash proceeds of approximately $0.5 billion upon settlement of these contracts. The corresponding accounting gains will be recognized in the consolidated statement of income based on the original hedge contract maturity dates, which are between 2012 and 2014.
E Fair Values of Financial Instruments
With the exception of long-term debt, all financial assets and financial liabilities are recorded at fair value or carried at an amount that approximates fair value due to the short-term nature and historically negligible credit losses. The fair value of long-term debt at September 30, 2012 was $15,148 million (December 31, 2011: $14,374 million).
18 > OTHER NON-CURRENT LIABILITIES
| | | | | | | | |
| | | As at
September 30,
2012 | | | As at
December 31,
2011 | |
| Deposit on silver sale agreement | | $ | 612 | | | $ | 453 | |
| Derivative liabilities | | | 102 | | | | 42 | |
| Provision for supply contract restructuring costs | | | 23 | | | | 25 | |
| Provision for offsite remediation | | | 48 | | | | 61 | |
| | |
Other | | | 122 | | | | 108 | |
| | | $ | 907 | | | $ | 689 | |
19 > PROVISIONS
| | | | | | | | |
| | | As at
September 30,
2012 | | | As at
December 31,
2011 | |
| Environmental rehabilitation | | $ | 2,297 | | | $ | 2,080 | |
| Pension benefits | | | 102 | | | | 124 | |
| Other post retirement benefits | | | 25 | | | | 22 | |
| RSUs | | | 23 | | | | 22 | |
| | |
Other | | | 75 | | | | 78 | |
| | | $ | 2,522 | | | $ | 2,326 | |
| | | | |
| BARRICK THIRD QUARTER 2012 | | 67 | | NOTES TO FINANCIAL STATEMENTS (UNAUDITED) |
20 > CAPITAL STOCK
A Common Shares
Our authorized capital stock includes an unlimited number of common shares (issued 1,000,627,044 common shares); 10,000,000 First preferred shares Series A (issued nil); 10,000,000 Series B (issued nil); and 15,000,000 Second preferred shares Series A (issued nil). Our common shares have no par value.
B Dividends
Dividends are declared after a quarter end in the announcement of the results for the quarter. Dividends declared are paid in the same quarter.
21 > NON-CONTROLLING INTERESTS
| | | | | | | | | | | | | | | | |
| | | Pueblo Viejo | | | ABG | | | Cerro Casale | | | Total | |
| At January 1, 2012 | | $ | 937 | | | $ | 752 | | | $ | 502 | | | $ | 2,191 | |
| Share of income (loss) | | | - | | | | 24 | | | | (6 | ) | | | 18 | |
| Cash contributed | | | 373 | | | | - | | | | 17 | | | | 390 | |
| Other decrease in non-controlling interest1 | | | - | | | | (21 | ) | | | - | | | | (21 | ) |
| At September 30, 2012 | | $ | 1,310 | | | $ | 755 | | | $ | 513 | | | $ | 2,578 | |
| 1 | Represents dividends received from ABG and distribution payments to Tulawaka’s outside interest holder. |
22 > LITIGATIONS AND CLAIMS
Certain conditions may exist as of the date the financial statements are issued that may result in a loss to the Company, but which will only be resolved when one or more future events occur or fail to occur. In assessing loss contingencies related to legal proceedings that are pending against us or unasserted claims that may result in such proceedings, the Company and its legal counsel evaluate the perceived merits of any legal proceedings or unasserted claims as well as the perceived merits of the amount of relief sought or expected to be sought. The description of the legal proceedings set out below should be read in conjunction with the “Litigation and Claims” note set out in the Company’s most recently filed Annual Report.
Cortez Hills Complaint
On November 12, 2008, the United States Bureau of Land Management (the “BLM”) issued a Record of Decision approving the Cortez Hills Expansion Project. On November 20, 2008, the TeMoak Shoshone Tribe, the East Fork Band Council of the TeMoak Shoshone Tribe and the Timbisha Shoshone Tribe, the Western
Shoshone Defense Project, and Great Basin Resource Watch filed a lawsuit against the United States seeking to enjoin the majority of the activities comprising the Project on various grounds.
In December 2009, on appeal from a decision denying certain of the plaintiff’s claims, the Ninth Circuit issued an opinion in which it held that the plaintiffs were likely to succeed on two of their claims and ordered that a supplemental Environmental Impact Statement (“EIS”) be prepared by Barrick. On March 15, 2011, the BLM issued its record of decision that approved the supplemental EIS. On January 3, 2012, the District Court issued a decision granting summary judgment in favor of Barrick and the BLM on all remaining issues. The plaintiffs have appealed this decision.
Marinduque Complaint
Placer Dome Inc. was named the sole defendant in a Complaint filed in October 2005 by the Provincial Government of Marinduque, an island province of the Philippines (“Province”), with the District Court in Clark County, Nevada. The Complaint asserted that Placer Dome Inc. was responsible for alleged environmental degradation with consequent economic damages and impacts to the environment in the vicinity of the Marcopper mine that was owned and operated by Marcopper Mining Corporation (“Marcopper”). Placer Dome Inc. indirectly owned a minority shareholding of 39.9% in Marcopper until the divestiture of its shareholding in 1997. The Province sought “to recover damages for injuries to the natural, ecological and wildlife resources within its territory”. In addition, the Province sought compensation for the costs of restoring the environment, an order directing Placer Dome Inc. to undertake and complete “the remediation, environmental cleanup, and balancing of the ecology of the affected areas,” and payment of the costs of environmental monitoring. The Complaint addressed the discharge of mine tailings into Calancan Bay, the 1993 Maguila-guila dam breach, the 1996 Boac river tailings spill, and alleged past and continuing damage from acid rock drainage. In October 2010, the Nevada state court issued an order granting the Company’s motion to dismiss the action on the grounds of forum non conveniens. The Province has appealed the Court’s dismissal order to the Nevada Supreme Court. The Company intends to continue to defend the action vigorously. No amounts have been accrued for any potential loss under this complaint.
| | | | |
| BARRICK THIRD QUARTER 2012 | | 68 | | NOTES TO FINANCIAL STATEMENTS (UNAUDITED) |
Calancan Bay (Philippines) Complaint
In July 2004, a complaint was filed against Marcopper and Placer Dome Inc. in the Regional Trial Court of Boac, on the Philippine island of Marinduque, on behalf of a putative class of fishermen who reside in the communities around Calancan Bay, in northern Marinduque. The complaint alleges injuries to health and economic damages to the local fisheries resulting from the disposal of mine tailings from the Marcopper mine. The total amount of damages claimed is approximately US$1 billion.
In April 2008, Placer Dome Inc. made a special appearance by counsel to move to dismiss the complaint for lack of personal jurisdiction and on other grounds. The plaintiffs have opposed the motion to dismiss. In October 2008, the plaintiffs filed a motion challenging Placer Dome Inc.’s legal capacity to participate in the proceedings in light of its alleged “acquisition” by the Company. Placer Dome Inc. opposed this motion. In January 2009, Marcopper filed an entry of appearance in the action and in March 2012 filed a motion to dismiss the action on various grounds. The plaintiffs have opposed the motion to dismiss. It is not known when the motions will be decided by the Court. The Company intends to defend the action vigorously. No amounts have been accrued for any potential loss under this complaint.
Perilla Complaint
In 2009, Barrick Gold Inc. and Placer Dome Inc. were purportedly served in Ontario with a complaint filed in November 2008 in the Regional Trial Court of Boac, on the Philippine island of Marinduque, on behalf of two named individuals and purportedly on behalf of the approximately 200,000 residents of Marinduque. The complaint alleges injury to the economy and the ecology of Marinduque as a result of the discharge of mine tailings from the Marcopper mine into the Calancan Bay, the Boac River, and the Mogpog River. The plaintiffs are claiming for abatement of a public nuisance allegedly caused by the tailings discharge and for nominal damages for an alleged violation of their constitutional right to a balanced and healthful ecology. In June 2010, Barrick Gold Inc. and Placer Dome Inc. filed a motion to have the Court resolve their unresolved motions to dismiss before considering the plaintiffs’ motion to admit an amended complaint and also filed an opposition to the plaintiffs’ motion to admit on the same basis. It is not known when these motions or the outstanding motions to dismiss will be decided by the Court. The Company intends to defend the action vigorously. No amounts have been accrued for any potential loss under this complaint.
Writ of Kalikasan
On February 25, 2011 a Petition for the Issuance of a Writ of Kalikasan with Prayer for Temporary Environmental Protection Order was filed in the Supreme Court of the Republic of the Philippines in Eliza M. Hernandez, Mamerto M. Lanete and Godofredo L. Manoy versus Placer Dome Inc. and Barrick Gold Corporation (the “Petition”). On March 8, 2011, the Supreme Court issued an En Banc Resolution and Writ of Kalikasan and directed service of summons on Placer Dome Inc. and the Company, ordered Placer Dome Inc. and the Company to make a verified return of the Writ with ten (10) days of service and referred the case to the Court of Appeal for hearing. The Petition alleges that Placer Dome Inc. violated the petitioners’ constitutional right to a balanced and healthful ecology as a result of, amongst other things, the discharge of tailings into Calancan Bay, the 1993 Maguila-Guila dam break, the 1996 Boac river tailings spill and failure of Marcopper to properly decommission the Marcopper mine. The petitioners have pleaded that the Company is liable for the alleged actions and omissions of Placer Dome Inc. which was a minority indirect shareholder of Marcopper at all relevant times and is seeking orders requiring the Company to environmentally remediate the areas in and around the mine site that are alleged to have sustained environmental impacts. The petitioners purported to serve the Company on March 25, 2011. On March 31, 2011, the Company filed an Urgent Motion For Ruling on Jurisdiction with the Supreme Court challenging the constitutionality of the Rules of Procedure in Environmental Cases (the “Environmental Rules”) pursuant to which the Petition was filed, as well as the jurisdiction of the Court over the Company. On November 23, 2011, the Company’s counsel received a Motion for Intervention, dated November 18, 2011, filed with the Supreme Court, in which two local governments, or “baranguays” (Baranguay San Antonio and Baranguay Lobo), seek intervenor status in the proceedings with the intention of seeking a dismissal of the proceedings. No decision has as yet been issued with respect to the Urgent Motion for Ruling on Jurisdiction, the Motion for Intervention, or certain other matters before the Court. The Company intends to continue to defend the action vigorously. No amounts have been accrued for any potential loss under this matter.
| | | | |
| BARRICK THIRD QUARTER 2012 | | 69 | | NOTES TO FINANCIAL STATEMENTS (UNAUDITED) |
Reko Diq Arbitration
On February 15, 2011, Tethyan Copper Company Pakistan (Private) Limited (“TCCP”) (the local operating subsidiary of Tethyan Copper Company (“TCC”)) submitted to the Government of the Province of Balochistan (the “GOB”) an application for a mining lease in respect of the Reko Diq project in Pakistan. Barrick currently indirectly holds 50% of the shares of TCC, with Antofagasta Plc (“Antofagasta”) indirectly holding the other 50%.
TCC believes that, under the Chagai Hills Joint Venture Agreement (the “CHEJVA”) between TCC and the GOB, as well as under the 2002 Balochistan Mineral Rules, TCCP was legally entitled to the mining lease subject only to “routine” government requirements. On November 15, 2011, the GOB notified TCCP of the rejection of TCCP’s application for the mining lease. On November 28, 2011, TCC filed two requests for international arbitration: one against the Government of Pakistan with the International Centre for Settlement of Investment Disputes (“ICSID”) asserting breaches of the Bilateral Investment Treaty between Australia (where TCC is incorporated) and Pakistan, and another against the GOB with the International Chamber of Commerce (“ICC”), asserting breaches of the CHEJVA. Constitution of the ICC and ICSID arbitration panels is complete. TCC has filed petitions for provisional measures before both tribunals, seeking to prevent Pakistan from disposing of or encumbering any rights TCC may have to the property until the arbitration is concluded. The GOB has filed jurisdictional objections before the ICC, and has signaled its intent to file a variety of objections before the tribunals. The GOB opposes provisional measures in part because it is commencing activities as part of a joint venture on a part of the property. A hearing on provisional measures before the ICSID tribunal is set for November 6 in London. A hearing on provisional measures before the ICC has been proposed for December 4.
Pakistani Constitutional Litigation
In November 2006, a Constitutional Petition was filed in the High Court of Balochistan by three Pakistani citizens against: Barrick, the Governments of Balochistan and Pakistan, the Balochistan Development Authority (“BDA”), TCCP, Antofagasta, Muslim Lakhani and BHP (Pakistan) Pvt Limited (“BHP”). The Petition alleged, among other things, that the entry by the BDA into the 1993 Joint Venture Agreement (“JVA”) with BHP to facilitate the exploration of the Reko Diq area and the grant of related exploration licenses were illegal and that the subsequent transfer of the interests of BHP in
the JVA and the licenses to TCC was also illegal and should therefore be set aside. In June 2007, the High Court of Balochistan dismissed the Petition against Barrick and the other respondents in its entirety. In August 2007, the petitioners filed a Civil Petition for Leave to Appeal in the Supreme Court of Pakistan. On May 25, 2011, the Supreme Court ruled, among other things, that the GOB should proceed to expeditiously decide TCCP’s application for the grant of a mining lease, transparently and fairly in accordance with laws and applicable rules. The Supreme Court also ruled that the petitions before the Court would remain pending.
In early 2012, the Supreme Court resumed hearing various petitions relating to TCC and the Reko Diq project, including applications seeking to have the CHEJVA declared invalid and applications seeking an order staying the ICSID and ICC arbitrations. Those proceedings have been inactive for several months, and it is unclear if or when they may continue. TCC continues to pursue its rights under international arbitration and Barrick and TCCP continue to vigorously defend the above actions. No amounts have been accrued for any potential loss under these complaints.
Argentine Glacier Legislation and Litigation
On September 30, 2010, the National Law on Minimum Requirements for the Protection of Glaciers was enacted in Argentina, and came into force in early November 2010. The federal law bans new mining exploration and exploitation activities on glaciers and in the “peri-glacial” environment, and subjects ongoing mining activities to an environmental audit. If such audit identifies significant impacts on glaciers and peri-glacial environment, the relevant authority is empowered to take action, which according to the legislation could include the suspension or relocation of the activity. In November 2010, the Federal Court in the Province of San Juan granted injunctions, based on the unconstitutionality of the federal law, suspending its application in the Province and, in particular to Veladero and Pascua-Lama. The National Supreme Court of Justice of Argentina (the “Supreme Court”) issued a decision determining that this case falls within its jurisdiction. The National State filed a remedy for revocation of the decision of the Federal Court in the Province of San Juan to grant injunctions suspending the application of the federal law in the Province of San Juan. On July 3, 2012, the Supreme Court overturned the injunctions. The Supreme Court has not yet ruled on the constitutionality of the federal law. No amounts have been accrued for any potential loss under this matter.
| | | | |
| BARRICK THIRD QUARTER 2012 | | 70 | | NOTES TO FINANCIAL STATEMENTS (UNAUDITED) |
Pascua Lama Protection Actions
On September 28, 2012, a constitutional rights protection action was filed in the Court of Appeals of Copiapo, Chile by representatives of four Diaguita indigenous communities against Compania Minera Nevada (“CMN”) Barrick’s Chilean subsidiary that holds the Chilean portion of the Pascua Lama Project (the “Project”), and the Environmental Evaluation Commission (“EEC”) of the III Region of Atacama, Chile, the regulatory body with oversight authority over the Project.
On October 22, 2012, a second constitutional rights protection action was filed in the Court of Appeals of Copiapo, Chile by a representative of a Diaguita indigenous community and certain other individuals against CMN and the EEC.
The plaintiffs in the actions allege that the construction of the Project affects their constitutional rights to life and to live in an environment free of contamination. The actions allege certain non-compliances with the Project´s environmental approval in Chile, including the carrying out of pre-stripping activities allegedly prior to full completion and operation of the acid rock drainage water management and treatment system and alleged impacts on the Toro 1, Toro 2 and Esperanza glaciers.
The plaintiffs assert that the alleged non-compliances with the environmental approval, together with the lack of inspections, sanctions and injunctions on the part of the regulatory bodies, have resulted in negative impacts on water sources and contamination, or at least the risk of contamination, of the Estrecho and Huasco rivers.
The relief sought in the actions is the suspension of the construction of the Project in Chile until all environmental obligations are fulfilled. At the time of filing of the first action, the plaintiffs sought the immediate granting of a preliminary injunction to halt pre-stripping activities. The preliminary injunction request was not granted. However, both cases have been admitted for review by the Court. No amounts have been accrued for any potential losses related to these actions.
| | | | |
| BARRICK THIRD QUARTER 2012 | | 71 | | NOTES TO FINANCIAL STATEMENTS (UNAUDITED) |
| | |
CORPORATE OFFICE | | TRANSFER AGENTS AND REGISTRARS |
Barrick Gold Corporation | | CIBC Mellon Trust Company |
Brookfield Place, TD Canada Trust Tower | | c/o Canadian Stock Transfer Company Inc., |
Suite 3700 | | as administrative agent |
161 Bay Street, P.O. Box 212 | | P.O. Box 700, Postal Station B |
Toronto, Canada M5J 2S1 | | Montreal, Quebec, Canada H3B 3K3 |
Tel: (416) 861-9911 Fax: (416) 861-0727 | | or |
Toll-free throughout North America: 1-800-720-7415 | | American Stock Transfer & Trust Company, LLC |
Email:investor@barrick.com | | 6201 – 15 Avenue |
Website:www.barrick.com | | Brooklyn, NY 11219 |
SHARES LISTED | | Tel: (416) 682-3860 Fax: (514) 985-8843 |
ABX - The New York Stock Exchange | | Toll-free throughout North America |
The Toronto Stock Exchange | | Tel: 1-800-387-0825 Fax: 1-888-249-6189 |
| | Email:inquiries@canstockta.com |
| | Website:www.canstockta.com |
INVESTOR CONTACT | | MEDIA CONTACT |
Greg Panagos | | Andy Lloyd |
Senior Vice President | | Director |
Investor Relations and Communications | | Media Relations |
Tel: (416) 309-2943 | | Tel: (416) 307-7414 |
Email:gpanagos@barrick.com | | Email:alloyd@barrick.com |
CAUTIONARY STATEMENT ON FORWARD-LOOKING INFORMATION
Certain information contained or incorporated by reference in this Third Quarter Report 2012, including any information as to our strategy, projects, plans or future financial or operating performance, constitutes "forward-looking statements”. All statements, other than statements of historical fact, are forward-looking statements. The words “believe”, "expect", “anticipate”, “contemplate”, “target”, “plan”, “intend”, “continue”, “budget”, “estimate”, “may”, “will”, “schedule” and similar expressions identify forward-looking statements. Forward-looking statements are necessarily based upon a number of estimates and assumptions that, while considered reasonable by the company, are inherently subject to significant business, economic and competitive uncertainties and contingencies. Known and unknown factors could cause actual results to differ materially from those projected in the forward-looking statements. Such factors include, but are not limited to: fluctuations in the spot and forward price of gold and copper or certain other commodities (such as silver, diesel fuel and electricity); diminishing quantities or grades of reserves; the impact of inflation; changes in national and local government legislation, taxation, controls, regulations, expropriation or nationalization of property and political or economic developments in Canada, the United States and other jurisdictions in which the company does or may carry on business in the future; the impact of global liquidity and credit availability on the timing of cash flows and the values of assets and liabilities based on projected future cash flows; fluctuations in the currency markets; changes in U.S. dollar interest rates; risks arising from holding derivative instruments; risk of loss due to acts of war, terrorism, sabotage and civil disturbances; business opportunities that may be presented to, or pursued by, the company; the ability of the company to successfully integrate acquisitions or complete divestitures; operating or technical difficulties in connection with mining or development activities; employee relations; availability and increased costs associated with mining inputs and labor; increased costs and technical challenges associated with the construction of capital projects; litigation; the speculative nature of mineral exploration and development, including the risks of obtaining necessary licenses and permits; adverse changes in our credit rating; contests over title to properties, particularly title to undeveloped properties; and the organization of our previously held African gold operations and properties under a separate listed company. In addition, there are risks and hazards associated with the business of mineral exploration, development and mining, including environmental hazards, industrial accidents, unusual or unexpected formations, pressures, cave-ins, flooding and gold bullion or copper cathode losses (and the risk of inadequate insurance, or inability to obtain insurance, to cover these risks). Many of these uncertainties and contingencies can affect our actual results and could cause actual results to differ materially from those expressed or implied in any forward-looking statements made by, or on behalf of, us. Readers are cautioned that forward-looking statements are not guarantees of future performance. All of the forward-looking statements made in this Third Quarter Report 2012 are qualified by these cautionary statements. Specific reference is made to the most recent Form 40-F/Annual Information Form on file with the SEC and Canadian provincial securities regulatory authorities for a discussion of some of the factors underlying forward-looking statements.
The company disclaims any intention or obligation to update or revise any forward-looking statements whether as a result of new information, future events or otherwise, except as required by applicable law.