Exhibit 99.1

FIRST QUARTER REPORT 2013
Based on IFRS and expressed in US dollars. For a full explanation of results, the Financial Statements and Management Discussion & Analysis, please see the company’s website,www.barrick.com.
Barrick Reports First Quarter 2013 Results
TORONTO, April 24, 2013 – Barrick Gold Corporation (NYSE: ABX, TSX: ABX) (Barrick or the “company”) today reported strong first quarter 2013 financial and operating results.
| ¡ | Net earnings of $847 million ($0.85 per share). |
| ¡ | Adjusted net earnings of $923 million ($0.92 per share)1. |
| ¡ | Operating cash flow of $1.09 billion. |
| ¡ | Adjusted operating cash flow of $1.16 billion1. |
| ||||||||||
FIRST QUARTER 2013 OPERATING HIGHLIGHTS AND FULL YEAR 2013 GUIDANCE |
| |||||||||
Gold | First Quarter 2013 | 2013 Guidance (previous) | ||||||||
| ||||||||||
Production (000s of ounces) | 1,797 | 7,000-7,400 | ||||||||
All-in sustaining costs ($ per ounce)1 | 919 | 950-1,050 (1,000-1,100) | ||||||||
Total cash costs ($ per ounce)1 | 561 | 610-660 | ||||||||
Copper | ||||||||||
| ||||||||||
Production (millions of pounds) | 127 | 480-540 | ||||||||
C1 cash costs ($ per pound)1 | 2.46 | 2.10-2.30 | ||||||||
C3 fully allocated costs ($ per pound)1 | 3.00 | 2.60-2.85 | ||||||||
| ||||||||||
“Our high quality portfolio of mines combined with our sharp focus on cost management has translated into strong quarterly financial and operating results. It is very rewarding to see that our cost reduction efforts have begun to take effect and are reflected in low all-in sustaining costs of $919 per ounce and total cash costs of only $561 per ounce this quarter. We have also further reduced total capex, exploration and all-in sustaining cost guidance for the full year,” said Jamie Sokalsky, Barrick’s President and CEO. “At Pascua-Lama, we are working to address the environmental and other regulatory requirements on the Chilean side of the project. Concurrently, we are taking a hard look at evaluating all alternatives in light of the uncertainties associated with the suspension of construction in Chile. We are committed to a disciplined approach to capital allocation, based on the principle that returns will drive production, production will not drive returns. While we remain positive on the long-term fundamentals for gold and copper, we don’t rely on higher metal prices to be the only driver of shareholder returns.”
FINANCIAL RESULTS
Net earnings and adjusted net earnings for the first quarter 2013 of $847 million ($0.85 per share) and $923 million ($0.92 per share), respectively, compared to net earnings and adjusted net earnings of $1.04 billion ($1.04 per share) and $1.10 billion ($1.10 per share), respectively, in the same prior year period. The decrease in net earnings and adjusted net earnings was largely driven by lower realized gold and copper prices, lower gold and copper sales volumes and higher cost of sales applicable to gold and copper, partially offset by lower income tax expense.
| 1 | Adjusted net earnings, adjusted net earnings per share, adjusted operating cash flow, all-in sustaining costs per ounce, total cash costs per ounce, C1 cash costs per pound, and C3 fully allocated costs per pound are non-GAAP financial performance measures with no standardized definition under IFRS. See pages 31-34 of Barrick’s First Quarter 2013 Report. |
| BARRICK FIRST QUARTER 2013 | 1 | PRESS RELEASE |
Significant adjusting items (net of tax effects) for the quarter include:
| ¡ | $63 million in unrealized foreign currency translation losses on working capital balances; |
| ¡ | $30 million in other non-recurring expenses; and |
| ¡ | $17 million in unrealized gains on non-hedge derivative instruments. |
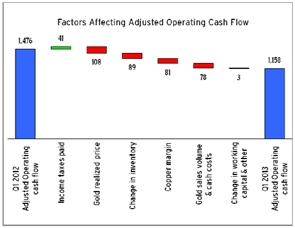
First quarter 2013 operating cash flow of $1.09 billion compares to $1.37 billion in the first quarter of 2012. Adjusted operating cash flow of $1.16 billion removes the impact of the Australian dollar hedge settlement and compares to adjusted operating cash flow of $1.48 billion in the same prior year period.
OPERATING RESULTS
First quarter 2013 gold production was 1.80 million ounces at all-in sustaining and total cash costs of $919 per ounce and $561 per ounce, respectively. All-in sustaining and total cash costs benefited from strong performances at Goldstrike, Cortez, and Veladero. The company reaffirms 2013 gold production guidance of 7.0-7.4 million ounces at total cash costs of $610-$660 per ounce. Full year all-in sustaining cost guidance has been reduced to $950-$1,050 per ounce from the previous guidance of $1,000-$1,100 per ounce.
North America Regional Business Unit
North America produced 0.87 million ounces at all-in sustaining and total cash costs of $770 per ounce and $487 per ounce, respectively. Barrick’s 60 percent share of production from the new Pueblo Viejo mine was 96,000 ounces at total cash costs of $550 per ounce, after achieving commercial production in January. The mine remains on track to ramp up to full capacity in the second half of this year. Barrick’s share of average annual gold production in the first full five years of operation is anticipated to be 0.625-0.675 million ounces at all-in sustaining and total cash costs of $500-$600 per ounce2 and $300-$350 per ounce2, respectively.
The government of the Dominican Republic is asking Pueblo Viejo Dominicana Corporation (jointly owned KWA 60 percent by Barrick and 40 percent by Goldcorp) to accelerate and significantly increase its share of the benefits from Pueblo Viejo. The company, while reserving its rights under the Special Lease Agreement (SLA), which cannot be unilaterally altered, continues to engage in dialogue with the government in an effort to achieve a mutually acceptable outcome.
The Cortez mine produced 0.34 million ounces at total cash costs of $177 per ounce, largely reflecting better than anticipated grades. Goldstrike produced 0.23 million ounces at total cash costs of $605 per ounce primarily as a result of higher than expected grades and recoveries.
We continue to expect full year 2013 production for North America to be 3.55-3.70 million ounces at all-in sustaining and total cash costs of $820-$870 per ounce and $495-$545 per ounce, respectively.
South America Regional Business Unit
South America produced 0.37 million ounces at all-in sustaining and total cash costs of $638 per ounce and $405 per ounce, respectively. Higher silver by-product credits at the Veladero mine and delays in sustaining capital spend at Pierina and Veladero positively impacted all-in sustaining costs.
The Veladero mine contributed 0.21 million ounces at total cash costs of $400 per ounce and Lagunas Norte produced 0.15 million ounces at total cash costs of $333 per ounce. We continue to expect South America to produce 1.25-1.35 million ounces in 2013 at all-in sustaining and total cash costs of $875-$925 per ounce and $550-$600 per ounce, respectively.
| 2 | Based on first full five year average and gold and WTI oil price assumptions of $1,700/oz and $90/bbl, respectively. Does not include escalation for future inflation. |
| BARRICK FIRST QUARTER 2013 | 2 | PRESS RELEASE |
Australia Pacific Regional Business Unit
Australia Pacific produced 0.45 million ounces at all-in sustaining and total cash costs of $1,096 per ounce and $785 per ounce, respectively. Porgera, the region’s largest contributor, produced 0.12 million ounces at total cash costs of $934 per ounce, reflecting the processing of lower cost stockpiles.
We continue to expect full year 2013 production for Australia Pacific to be 1.70-1.85 million ounces at all-in sustaining and total cash costs of $1,200-$1,300 per ounce and $880-$950 per ounce, respectively.
African Barrick Gold plc
First quarter attributable production from African Barrick Gold was 0.11 million ounces at all-in sustaining and total cash costs of $1,561 per ounce and $931 per ounce. We continue to expect Barrick’s share of 2013 production from African Barrick Gold to be 0.40-0.45 million ounces at all-in sustaining and total cash costs of $1,550-$1,600 per ounce and $925-$975 per ounce, respectively.
Global Copper Business Unit
Copper production was 127 million pounds at C1 cash costs of $2.46 per pound and C3 fully allocated costs of $3.00 per pound. Lumwana produced 57 million pounds at C1 cash costs of $3.41 per pound and Zaldívar produced 70 million pounds at C1 cash costs of $1.54 per pound. We continue to expect 2013 copper production to be 480-540 million pounds at C1 cash costs of $2.10-$2.30 per pound and C3 fully allocated costs at $2.60-$2.85 per pound.
Utilizing option collar hedging strategies, the company has protected the downside on approximately half of our remaining 2013 copper production at an average floor price of $3.50 per pound and can participate on the same amount up to an average price of $4.25 per pound3.
PASCUA-LAMA PROJECT UPDATE
Pascua-Lama is one of the world’s largest gold and silver resources with nearly 18 million ounces of proven and probable gold reserves4 , 676 million ounces of silver contained within the gold reserves4, and an expected mine life of 25 years. It is expected to produce an average of 800,000-850,000 ounces of gold and 35 million ounces of silver in its first full five years of operation at all-in sustaining and total cash costs of $50-$200 per ounce5 and negative $150 to $0 per ounce, respectively.
During the fourth quarter of 2012, pre-stripping activities in Chile were halted to address increased dust in the open pit area following stronger than normal winds. The project has since strengthened dust mitigation and control measures. Regulatory restrictions have also been placed on the project due to the need to repair and improve certain aspects of the water management system in Chile. Completion of measures to address these aspects is targeted for first quarter 2014.
On April 9, 2013, the Copiapó Court of Appeals in Chile granted a request for a preliminary injunction to suspend construction activities on the Chilean side of the project pending a hearing on a constitutional rights action filed in September of 2012. The action alleges noncompliance with the environmental requirements of the project’s Chilean environmental approval. Upon confirming the court order, Barrick took immediate steps to suspend construction activities in Chile, which includes work on the primary crusher and the Chilean side of the tunnel that conveys ore from Chile to Argentina. Activities determined to be necessary for environmental protection are expected to continue, upon appropriate authorization as contemplated by the Court. Construction in Argentina, where the majority of Pascua-Lama’s critical infrastructure is located, including the process plant and tailings storage facility, has not been affected. Until we have clarity on the regulatory and
| 3 | The realized price on all 2013 copper production is expected to be reduced by approximately $0.04 per pound as a result of the net premium paid on option hedging strategies. Our remaining copper production is subject to market prices. |
| 4 | For a breakdown of reserves and resources by category and additional information relating to reserves and resources, see pages 25-35 of Barrick’s Form 40-F. |
| 5 | Based on gold, silver and WTI oil price assumptions of $1,700/oz, $30/oz, and $90/bbl, respectively and assuming a Chilean Peso to US dollar exchange rate of 475:1. Does not include escalation for future inflation. It is too early to assess the impact of the construction stoppage in Chile and the impact of any alternatives on the project’s capital cost estimate and schedule as well as the impact on the average annual gold and silver production, all-in sustaining costs and total cash costs over the first full five years of operation. |
| BARRICK FIRST QUARTER 2013 | 3 | PRESS RELEASE |
legal aspects, we are unable to fully assess the impact on the capital budget, operating costs and schedule of the project. The company is at an early stage of evaluating an alternative development plan that involves accelerating the development of another smaller pit in Argentina in order to provide a source of ore for initial production. This alternative could provide ore for about six months of production during commissioning and ramp up, following which the mine plan would be dependent on a continuous supply of Chilean ore. Therefore, if resumption of construction activities in Chile, including the pre-stripping, is delayed beyond late 2013, or if such development alternative is determined not to be feasible, there could be a significant change to the mine plan and an impact on the capital cost and production schedule of the project. The company will continue to evaluate all alternatives, in light of the uncertainties associated with the legal and regulatory actions, and the current commodity price environment, including the possibility of suspending the project.
As of March 31, 2013, approximately $4.8 billion had been spent. During the quarter, the La Mesa substation in Chile was energized and the southern portion of the 23Kv mine distribution loop completed. As of that date, the tunnel was approximately 80 percent complete. In Argentina, construction of the process plant facility advanced with about 70 percent of structural steel erected; 65 percent of concrete poured; and 55 percent of mass earthworks completed.
DISCIPLINED CAPITAL ALLOCATION
Barrick’s strategy prioritizes shareholder value creation by focusing on maximizing risk-adjusted rates of return and free cash flow. The company has taken and will undertake the following steps to re-focus the business and adhere to the principles of its disciplined capital allocation framework based on the principle that returns will drive production, production will not drive returns:
| ¡ | The company has reduced its 2013 outlook in a number of key spending categories, largely driven by its sharp focus on cost control, which is an integral element of its disciplined approach to capital allocation. Barrick launched a company-wide overhead review in the first quarter of 2013 and reduced overhead costs by over $100 million for the full year. We identified approximately $500 million of further reductions to expenditures and have announced revisions to full year 2013 guidance as follows: |
| ¡ | total capex to $5.2-$5.7 billion from previous guidance of $5.7-$6.3 billion; |
| ¡ | all-in sustaining costs to $950-$1,050 per ounce from previous guidance of $1,000-$1,100 per ounce; and |
| ¡ | exploration to $300-$340 million from previous guidance of $400-$440 million. |
| ¡ | The company is pursuing opportunities to optimize our portfolio, including the potential sale of Barrick Energy, Kabanga and other non-core assets. |
| ¡ | In today’s challenging environment, Barrick has no plans to build any new mines. |
| ¡ | The company continues to advance our rapidly expanding Goldrush deposit in Nevada. |
| ¡ | Barrick recalibrated long-term gold production to a higher quality, more profitable target of eight million ounces by 2016. |
Barrick’s vision is to be the world’s best gold mining company by operating in a safe, profitable and responsible manner. Barrick’s shares are traded on the Toronto and New York stock exchanges.
| BARRICK FIRST QUARTER 2013 | 4 | PRESS RELEASE |
Key Statistics
Barrick Gold Corporation | Three months ended | |||||||
(in United States dollars) | March 31, | |||||||
|
| |||||||
(Unaudited) | 2013 | 2012 (restated)7 | ||||||
| ||||||||
Operating Results | ||||||||
Gold production (thousands of ounces)1 | 1,797 | 1,881 | ||||||
Gold sold (thousands of ounces) | 1,747 | 1,783 | ||||||
Per ounce data | ||||||||
Average spot gold price | $ | 1,632 | $ | 1,691 | ||||
Average realized gold price 2 | 1,629 | 1,691 | ||||||
Total cash costs2 | 561 | 540 | ||||||
All-in sustaining costs2 | 919 | 909 | ||||||
Copper production (millions of pounds) | 127 | 117 | ||||||
Copper sold (millions of pounds) | 115 | 119 | ||||||
Per pound data | ||||||||
Average spot copper price | $ | 3.60 | $ | 3.77 | ||||
Average realized copper price2 | 3.56 | 3.78 | ||||||
C1 cash costs2 | 2.46 | 2.04 | ||||||
Depreciation3 | 0.35 | 0.44 | ||||||
Other4 | 0.19 | 0.20 | ||||||
C3 fully allocated costs2 | 3.00 | 2.68 | ||||||
| ||||||||
Financial Results (millions) | ||||||||
Revenues | $ | 3,437 | $ | 3,644 | ||||
Net earnings5 | 847 | 1,039 | ||||||
Adjusted net earnings2 | 923 | 1,096 | ||||||
Operating cash flow | 1,085 | 1,374 | ||||||
Adjusted operating cash flow2 | 1,158 | 1,476 | ||||||
Per Share Data (dollars) | ||||||||
Net earnings (basic) | 0.85 | 1.04 | ||||||
Adjusted net earnings (basic)2 | 0.92 | 1.10 | ||||||
Net earnings (diluted) | 0.85 | 1.04 | ||||||
Weighted average basic common shares (millions) | 1,001 | 1,000 | ||||||
Weighted average diluted common shares (millions)6 | 1,001 | 1,002 | ||||||
| ||||||||
| | As at March 31, | |
| As at December 31, |
| |||
|
| |||||||
| 2013 | 2012 (restated)7 | |||||||
| ||||||||
Financial Position (millions) | ||||||||
Cash and equivalents | $ | 2,342 | $ | 2,097 | ||||
Non-cash working capital | 3,263 | 2,884 | ||||||
| ||||||||
| 1 | Production includes our equity share of gold production at Highland Gold up to April 26, 2012, the effective date of our sale of Highland Gold. Production also includes African Barrick Gold on a 73.9% basis, which reflects our equity share of production. |
| 2 | Realized price, total cash costs, all-in sustaining costs, C1 cash costs, C3 fully allocated costs, adjusted net earnings and adjusted operating cash flow are non-gaap financial performance measures with no standard definition under IFRS. Refer to the Non-Gaap Financial Performance Measures section of the Company’s MD&A. |
| 3 | Represents equity depreciation expense divided by equity ounces of gold sold or pounds of copper sold. |
| 4 | For a breakdown, see reconciliation of cost of sales to C1 cash costs and C3 fully allocated costs per pound in the Non-Gaap Financial Performance Measures section of the Company’s MD&A. |
| 5 | Net earnings represents net income attributable to the equity holders of the Company. |
| 6 | Fully diluted includes dilutive effect of stock options. |
| 7 | Balances related to 2012 have been restated to reflect the impact of the adoption of new accounting pronouncements. See note 2B of the interim consolidated financial statements. |
| BARRICK FIRST QUARTER 2013 | 5 | SUMMARY INFORMATION |
Production and Cost Summary
| Gold Production (attributable ounces) (000’s) | All-in sustaining costs4 ($/oz) | |||||||||||||||
|
|
|
| |||||||||||||
| Three months ended | Three months ended | |||||||||||||||
| March 31, | March 31, | |||||||||||||||
|
|
|
| |||||||||||||
(Unaudited) | 2013 | 2012 | 2013 | 20126 | ||||||||||||
| ||||||||||||||||
Gold | ||||||||||||||||
North America | 872 | 888 | $ | 770 | $ | 782 | ||||||||||
South America | 370 | 451 | 638 | 615 | ||||||||||||
Australia Pacific | 447 | 426 | 1,096 | 1,107 | ||||||||||||
African Barrick Gold1 | 108 | 107 | 1,561 | 1,438 | ||||||||||||
Other2 | - | 9 | - | - | ||||||||||||
| ||||||||||||||||
Total | 1,797 | 1,881 | $ | 919 | $ | 909 | ||||||||||
| ||||||||||||||||
| Copper Production (attributable pounds) (Millions) | C1 Cash Costs ($/lb) | |||||||||||||||
|
|
|
| |||||||||||||
| Three months ended | Three months ended | |||||||||||||||
| March 31, | March 31, | |||||||||||||||
|
|
|
| |||||||||||||
(Unaudited) | 2013 | 2012 | 2013 | 2012 (Restated)6 | ||||||||||||
| ||||||||||||||||
Total | 127 | 117 | $ | 2.46 | $ | 2.04 | ||||||||||
| ||||||||||||||||
| Total Gold Production Costs ($/oz) | ||||||||||||||||
|
| |||||||||||||||
| Three months ended | ||||||||||||||||
| March 31, | ||||||||||||||||
|
| |||||||||||||||
(Unaudited) |
| 2013 | 2012 (Restated)6 | |||||||||||||
| ||||||||||||||||
Direct mining costs at market foreign exchange rates |
| $ | 610 | $ | 588 | |||||||||||
Gains realized on currency hedge and commodity hedge/economic hedge contracts |
| (50) | (57) | |||||||||||||
Other3 |
| (14) | (14) | |||||||||||||
By-product credits |
| (29) | (17) | |||||||||||||
Royalties |
| 44 | 40 | |||||||||||||
| ||||||||||||||||
Total cash costs4 |
| 561 | 540 | |||||||||||||
| ||||||||||||||||
General & administrative costs |
| 44 | 52 | |||||||||||||
Rehabilitation - accretion and amortization |
| 26 | 21 | |||||||||||||
Mine on-site exploration and evaluation costs |
| 11 | 12 | |||||||||||||
Mine development expenditures |
| 156 | 158 | |||||||||||||
Sustaining capital expenditures |
| 121 | 126 | |||||||||||||
| ||||||||||||||||
All-in sustaining costs4 |
| $ | 919 | $ | 909 | |||||||||||
| ||||||||||||||||
| Total Copper Production Costs($/lb) | ||||||||||||||||
|
| |||||||||||||||
| Three months ended | ||||||||||||||||
| March 31, | ||||||||||||||||
|
| |||||||||||||||
(Unaudited) |
| 2013 | 2012 (Restated)6 | |||||||||||||
| ||||||||||||||||
C1 cash costs4 |
| $ | 2.46 | $ | 2.04 | |||||||||||
Depreciation | 0.35 | 0.44 | ||||||||||||||
Other5 | 0.19 | 0.20 | ||||||||||||||
| ||||||||||||||||
C3 fully allocated costs4 |
| $ | 3.00 | $ | 2.68 | |||||||||||
| ||||||||||||||||
| 1 | Figures relating to African Barrick Gold are presented on a 73.9% basis, which reflects our equity share of production. |
| 2 | Includes our equity share of gold production at Highland Gold up to April 26, 2012, the effective date of our sale of Highland Gold. |
| 3 | Represents the Barrick Energy gross margin divided by equity ounces of gold sold. |
| 4 | Total cash costs, all-in sustaining costs, C1 cash costs and C3 fully allocated costs are non-gaap financial performance measures with no standard meaning under IFRS. Refer to the Non-Gaap Financial Performance Measures section of the Company’s MD&A. |
| 5 | For a breakdown, see reconciliation of cost of sales to C1 cash costs and C3 fully allocated costs per pound in the Non-Gaap Financial Performance Measures section of the Company’s MD&A. |
| 6 | Balances related to 2012 have been restated to reflect the impact of the adoption of new accounting pronouncements. See note 2B of the interim consolidated financial statements. |
| BARRICK FIRST QUARTER 2013 | 6 | SUMMARY INFORMATION |
MANAGEMENT’S DISCUSSION AND ANALYSIS (“MD&A”)
This portion of the Quarterly Report provides management’s discussion and analysis (“MD&A”) of the financial condition and results of operations to enable a reader to assess material changes in financial condition and results of operations as at and for the three month period ended March 31, 2013, in comparison to the corresponding prior–year period. The MD&A is intended to help the reader understand Barrick Gold Corporation (“Barrick”, “we”, “our” or the “Company”), our operations, financial performance and present and future business environment. This MD&A, which has been prepared as of April 23, 2013, is intended to supplement and complement the condensed unaudited interim consolidated financial statements and notes thereto, prepared in accordance with International Accounting Standard 34 Interim Financial Reporting (“IAS 34”) as issued by the International Accounting Standards Board (“IASB”), for the three month period ended March 31, 2013 (collectively, the “Financial Statements”), which are included in this Quarterly Report on pages 35 to 56. You are encouraged to review the Financial Statements in conjunction with your review of this MD&A. This MD&A should be read in conjunction with both the annual
audited consolidated financial statements for the two years ended December 31, 2012, the related annual MD&A included in the 2012 Annual Report, and the most recent Form 40–F/Annual Information Form on file with the US Securities and Exchange Commission (“SEC”) and Canadian provincial securities regulatory authorities. Certain notes to the Financial Statements are specifically referred to in this MD&A and such notes are incorporated by reference herein. All dollar amounts in this MD&A are in millions of US dollars, unless otherwise specified.
For the purposes of preparing our MD&A, we consider the materiality of information. Information is considered material if: (i) such information results in, or would reasonably be expected to result in, a significant change in the market price or value of our shares; or (ii) there is a substantial likelihood that a reasonable investor would consider it important in making an investment decision; or (iii) it would significantly alter the total mix of information available to investors. We evaluate materiality with reference to all relevant circumstances, including potential market sensitivity.
CAUTIONARY STATEMENT ON FORWARD-LOOKING INFORMATION
Certain information contained or incorporated by reference in this MD&A, including any information as to our strategy, projects, plans or future financial or operating performance, constitutes “forward-looking statements”. All statements, other than statements of historical fact, are forward-looking statements. The words “believe”, “expect”, “anticipate”, “contemplate”, “target”, “plan”, “intend”, “continue”, “budget”, “estimate”, “may”, “will”, “schedule” and similar expressions identify forward-looking statements. Forward-looking statements are necessarily based upon a number of estimates and assumptions that, while considered reasonable by the Company, are inherently subject to significant business, economic and competitive uncertainties and contingencies. Known and unknown factors could cause actual results to differ materially from those projected in the forward-looking statements. Such factors include, but are not limited to: fluctuations in the spot and forward price of gold and copper or certain other commodities (such as silver, diesel fuel and electricity); changes in national and local government legislation, taxation, controls, regulations, expropriation or nationalization of property and political or economic developments in Canada, the United States and other jurisdictions in which the Company does or may carry on business in the future; diminishing quantities or grades of
reserves; increased costs, delays, suspensions and technical challenges associated with the construction of capital projects; the impact of global liquidity and credit availability on the timing of cash flows and the values of assets and liabilities based on projected future cash flows; adverse changes in our credit rating; the impact of inflation; fluctuations in the currency markets; operating or technical difficulties in connection with mining or development activities; the speculative nature of mineral exploration and development, including the risks of obtaining necessary licenses and permits; contests over title to properties, particularly title to undeveloped properties; risk of loss due to acts of war, terrorism, sabotage and civil disturbances; changes in U.S. dollar interest rates; risks arising from holding derivative instruments; litigation; business opportunities that may be presented to, or pursued by, the Company; our ability to successfully integrate acquisitions or complete divestitures; employee relations; availability and increased costs associated with mining inputs and labor; and the organization of our previously held African gold operations and properties under a separate listed company. In addition, there are risks and hazards associated with the business of mineral exploration, development and mining, including environmental hazards, industrial accidents, unusual or unexpected
| BARRICK FIRST QUARTER 2013 | 7 | MANAGEMENT’S DISCUSSION AND ANALYSIS |
formations, pressures, cave-ins, flooding and gold bullion or copper cathode losses (and the risk of inadequate insurance, or inability to obtain insurance, to cover these risks). Many of these uncertainties and contingencies can affect our actual results and could cause actual results to differ materially from those expressed or implied in any forward-looking statements made by, or on behalf of, us. Readers are cautioned that forward-looking statements are not guarantees of future performance. All of the forward-looking statements made in this MD&A are qualified by these cautionary statements. Specific reference is made to the most recent Form 40-F/Annual
Information Form on file with the SEC and Canadian provincial securities regulatory authorities for a discussion of some of the factors underlying forward-looking statements. We disclaim any intention or obligation to update or revise any forward-looking statements whether as a result of new information, future events or otherwise, except as required by applicable law.
INDEX
| page | ||||
Overview | ||||
Review of 2013 First Quarter Results | 9 | |||
Key Business Developments | 11 | |||
Full year 2013 Outlook | 12 | |||
Market Overview | 13 | |||
Review of Financial Results | ||||
Revenues | 15 | |||
Production Costs | 16 | |||
Corporate Administration | 16 | |||
Other Expense/Other Income | 16 | |||
Exploration and Evaluation | 16 | |||
Capital Expenditures | 17 | |||
Finance Cost/ Finance Income | 17 | |||
Impairment Charges | 17 | |||
Income Tax | 17 | |||
Operational Overview | 18 | |||
Review of Operating Segments Performance | 18 | |||
Financial Condition Review | ||||
Balance Sheet Review | 24 | |||
Financial Position and Liquidity | 25 | |||
Financial Instruments | 27 | |||
Commitments and Contingencies | 28 | |||
Review of Quarterly Results | 29 | |||
IFRS Critical Accounting Policies and Estimates | 29 | |||
Non-GAAP Financial Performance Measures | 31 | |||
| BARRICK FIRST QUARTER 2013 | 8 | MANAGEMENT’S DISCUSSION AND ANALYSIS |
| ||||||||
Review of 2013 First Quarter Results | ||||||||
2013 First Quarter Results | ||||||||
($ millions, except where indicated) | ||||||||
| ||||||||
For the three months ended March 31 | 2013 | 2012 | ||||||
| ||||||||
Financial Data | ||||||||
Revenue | $ 3,437 | $ 3,644 | ||||||
Net earnings1 | 847 | 1,039 | ||||||
Per share (“EPS”)2 | 0.85 | 1.04 | ||||||
Adjusted net earnings3 | 923 | 1,096 | ||||||
Per share (“adjusted EPS”)2,3 | 0.92 | 1.10 | ||||||
Total consolidated project capital expenditures4 | 615 | 630 | ||||||
Total capital expenditures - expansion, sustaining and mine development4 | 768 | 708 | ||||||
Operating cash flow | 1,085 | 1,374 | ||||||
Adjusted operating cash flow3 | 1,158 | 1,476 | ||||||
Free cash flow3 | $ (272) | $ 61 | ||||||
Adjusted return on equity3 | 17% | 18% | ||||||
| ||||||||
| ||||||||
Operating Data | ||||||||
Gold | ||||||||
Gold produced (000s ounces)5 | 1,797 | 1,881 | ||||||
Gold sold (000s ounces) | 1,747 | 1,783 | ||||||
Realized price ($ per ounce)3 | $ 1,629 | $ 1,691 | ||||||
Total cash costs ($ per ounce)3 | $ 561 | $ 540 | ||||||
All-in sustaining costs ($ per ounce)3 | $ 919 | $ 909 | ||||||
Copper | ||||||||
Copper produced (millions of pounds) | 127 | 117 | ||||||
Copper sold (millions of pounds) | 115 | 119 | ||||||
Realized price ($ per pound)3 | $ 3.56 | $ 3.78 | ||||||
C1 cash costs ($ per pound)3 | $ 2.46 | $ 2.04 | ||||||
| ||||||||
| 1 | Net earnings represent net income attributable to the equity holders of the Company. |
| 2 | Calculated using weighted average number of shares outstanding under the basic method. |
| 3 | Adjusted net earnings, adjusted EPS, adjusted operating cash flow, free cash flow, adjusted return on equity, realized price, total cash costs, all-in sustaining costs and C1 cash costs are non-GAAP financial performance measures with no standardized definition under IFRS. For further information and a detailed reconciliation, please see pages 31 – 34 of this MD&A. |
| 4 | These amounts are presented on a cash basis consistent with the amounts presented on the consolidated cash flows. |
| 5 | We sold our 20.4% investment in Highland Gold with an effective date of April 26, 2012. Production includes our equity share of gold production at Highland Gold up to that date. |
Key Highlights: Market Developments
| • | Subsequent to quarter end, the market price of gold, silver and copper declined significantly. These metal prices are the primary drivers of our ability to generate earnings and cash flow, and as a result, a sustained drop in metal prices would have a significant impact on our business, and in particular our financial position and liquidity and the carrying value of our goodwill and non-current assets, including our significant projects. (Please refer to pages 25 to 27 and 30 to 31 of this MD&A for further information on liquidity and impairments risks, respectively.) |
| BARRICK FIRST QUARTER 2013 | 9 | MANAGEMENT’S DISCUSSION AND ANALYSIS |
| • | Our proven and probable gold reserves1 (140 million ounces as at December 31, 2012 calculated using gold price of $1,500 per ounce) are relatively insensitive to a sustained decline in the gold price. A drop in the assumed gold price from $1,500 per ounce to $1,200 per ounce (a 20% decrease) would result in a less than 10% decline in our proven and probable gold reserves. |
| • | The recent drop in metal prices emphasizes the importance of adhering to our previously announced disciplined capital allocation framework, which is based on the principle that returns will drive production, production will not drive returns. |
Key Highlights: Operating Results
| • | Overall, our high quality portfolio of mines met our operating targets in the first quarter 2013, and we remain on track to meet our production, total cash costs and all-in sustaining costs guidance for the year. Our Pueblo Viejo mine reached commercial production in January 2013. |
| • | Net earnings and adjusted net earnings for the first quarter 2013 were $847 million and $923 million, respectively, down $192 million and $173 million from the same prior year period. The decrease in net earnings and adjusted net earnings was largely driven by lower realized gold and copper prices, lower gold and copper sales volumes and higher cost of sales applicable to gold and copper, partially offset by lower income tax expense. |
| • | EPS and adjusted EPS for the first quarter 2013 were $0.85 and $0.92, respectively, down 18% and 16%, over the same prior year period. |
| • | Gold production for the first quarter 2013 was 1.80 million ounces, down 4% from the same prior year period, due to lower production in South America and North America, partially offset by higher production from Australia Pacific. Total cash costs for the first quarter 2013 were $561 per ounce, up 4% over the same prior year period. The increase reflects higher direct mining costs largely due to the impact of processing more ore tons at lower grades. It also reflects lower production levels in South America, our lowest cost region, which resulted in higher consolidated unit production costs. All-in sustaining costs for the first quarter 2013 were $919 per ounce, slightly higher than the same prior year period primarily reflecting an increase in total cash costs, partially offset by lower general and administrative expenditures. |
| • | Copper production for the first quarter 2013 was 127 million pounds, up 9% over the same prior year period, primarily due to higher production from Lumwana, partially offset by lower production at Zaldívar. Copper C1 cash costs for the first quarter 2013 were $2.46 per pound, up 21% over the same prior year period. The increase primarily reflects higher labor and processing costs at Lumwana and an unfavorable sales mix with Lumwana representing a higher proportion of total sales compared to the same prior year period. |
| • | Significant adjusting items (net of tax effects) in the first quarter 2013 include: $63 million in unrealized foreign currency translation losses on working capital balances; $30 million in non-recurring other expenses; partially offset by $17 million in unrealized gains on non-hedge derivative instruments. |
| • | Operating cash flow for the first quarter 2013 was $1,085 million, down 21% over the same prior year period. The decrease in operating cash flow primarily reflects lower net earnings, partially offset by a decrease in income tax payments and positive working capital impacts. Adjusted operating cash flow for the first quarter 2013 was $1,158 million, down 22% over the same prior year period. Adjusted operating cash flow was affected by the same factors as operating cash flow and removes the impact of the Australian dollar hedge settlement and non-recurring tax payments. |
| • | Capital expenditures were $1,430 million, up 1% over the same prior year period. The increase reflects higher project capital expenditures at Pascua–Lama, an increase in minesite expansion expenditures at our operating gold mines and an increase in sustaining capital expenditures, partially offset by lower project capital expenditures at Pueblo Viejo. |
| • | Free cash flow for the first quarter 2013 decreased by $333 million over the same prior year period, primarily reflecting lower operating cash flow and slightly higher capital expenditures. |
| 1 | Calculated in accordance with National Instrument 43-101 as required by Canadian securities regulatory authorities. For United States reporting purposes, Industry Guide 7 (under the Securities Exchange Act of 1934), as interpreted by the Staff of the SEC, applies different standards in order to classify mineralization as a reserve. Accordingly, for U.S. reporting purposes, approximately 1.98 million ounces of reserves at Pueblo Viejo (Barrick’s 60 percent interest) is classified as mineralized material. For a breakdown of reserves and resources by category and additional information relating to reserves and resources, see pages 25-35 of Barrick’s Form 40-F. |
| BARRICK FIRST QUARTER 2013 | 10 | MANAGEMENT’S DISCUSSION AND ANALYSIS |

Key Business Developments
Pascua-Lama
Pascua-Lama is one of the world’s largest gold and silver resources, with nearly 18 million ounces of proven and probable gold reserves2, 676 million ounces of silver contained within the gold reserves, and an expected mine life of 25 years. It is expected to produce an average of 800,000-850,000 ounces of gold and 35 million ounces of silver in its first full five years of operation at all-in sustaining and total cash costs of $50-$2003 per ounce and negative $150 to $0 per ounce2, respectively.
| 2 | For a breakdown of reserves and resources by category and additional information relating to reserves and resources, see pages 25-35 of Barrick’s Form 40-F. |
| 3 | Based on gold, silver and WTI oil price assumptions of $1,700/oz, $30/oz and $90/bbl, respectively, and assuming a Chilean Peso to U.S dollar exchange rate of 475:1. Does not include escalation for future inflation. It is too early to assess the impact of the construction stoppage in Chile and the impact of any alternatives on the project’s capital cost estimate and schedule as well as the impact on the average annual gold and silver production, all-in sustaining costs and total cash costs over the first full five years of operation. |
During the fourth quarter of 2012, pre-stripping activities in Chile were halted to address increased dust in the open pit area following stronger than normal winds. The project has strengthened dust mitigation and control measures. Regulatory restrictions have also been placed on the project due to the need to repair and improve certain aspects of the water management system in Chile. Completion of measures to address these aspects is targeted for first quarter 2014.
On April 9, 2013, the Copiapó Court of Appeals in Chile granted a request for a preliminary injunction to suspend construction activities on the Chilean side of the project pending a hearing on a constitutional rights action filed in September of 2012. The action alleges noncompliance with the environmental requirements of the project’s Chilean environmental approval. Upon confirming the court order, Barrick took immediate steps to suspend construction activities in Chile, which includes work on the primary crusher and the Chilean side of the tunnel that conveys ore from Chile to Argentina. Activities determined to be necessary for environmental protection are expected to continue, upon appropriate authorization as contemplated by the Court. Construction in Argentina, where the majority of Pascua-Lama’s critical infrastructure is located, including the process plant and tailings storage facility, has not been affected. Until we have clarity on the regulatory and legal aspects, we are unable to fully assess the impact on the capital budget, operating costs and schedule of the project. The company is at an early stage of evaluating an alternative development plan that involves accelerating the development of another smaller pit in Argentina in order to provide a source of ore for initial production. This alternative could provide ore for about six months of production during commissioning and ramp up, following which the mine plan would be dependent on a continuous supply of Chilean ore. Therefore, if resumption of construction activities in Chile, including the pre-stripping, is delayed beyond late 2013, or if such development alternative is determined not to be feasible, there could be a significant change to the mine plan and an impact on the capital cost and production schedule of the project. The company will continue to evaluate all alternatives, in light of the uncertainties associated with the legal and regulatory actions, and the current environment, including the possibility of suspending the project.
| BARRICK FIRST QUARTER 2013 | 11 | MANAGEMENT’S DISCUSSION AND ANALYSIS |
As of March 31, 2013, approximately $4.8 billion had been spent. During the quarter, the La Mesa substation in Chile was energized and the southern portion of the 23Kv mine distribution loop completed. As of that date, the tunnel was approximately 80 percent complete. In Argentina, construction of the process plant facility advanced with about 70 percent of structural steel erected; 65 percent of concrete poured; and 55 percent of mass earthworks completed.
Pueblo Viejo
The government of the Dominican Republic is asking the owners of the mine to accelerate and increase the benefits that the Dominican Republic will derive from the mine, including potentially implementing new tax measures. Barrick, while reserving its rights under the Special Lease Agreement (SLA), which cannot be unilaterally altered, continues to engage in dialogue with the government in an effort to achieve a mutually acceptable outcome. The outcome of the dialogue is uncertain but any amendments to the SLA or unilateral action by the government of the Dominican Republic would likely result in significant additional and accelerated payments to the government.
Full year 2013 Outlook
The market prices for gold, silver and copper declined significantly after the end of the first quarter 2013. Consequently, we have updated our key metal price assumption for the remainder of the year for the purposes of preparing our production, costs and capital expenditures guidance (Please see the table below).
| ($ millions, except per ounce/pound data) | 2013E | |||||||
| ||||||||
Gold production and costs | ||||||||
Production (millions of ounces)1 | 7.0 - 7.4 | |||||||
Cost of sales | 6,700 - 7,000 | |||||||
Gold unit production costs | ||||||||
All-in sustaining costs ($ per ounce)2 | 950 - 1,050 | |||||||
Total cash costs ($ per ounce) | 610 - 660 | |||||||
Depreciation ($ per ounce) | 210 - 220 | |||||||
| ||||||||
Copper production and costs | ||||||||
Production (millions of pounds) | 480 - 540 | |||||||
Cost of sales | 1,200- 1,400 | |||||||
Copper unit production costs | ||||||||
C1 cash costs ($ per pound) | 2.10 - 2.30 | |||||||
Depreciation ($ per pound) | 0.30 - 0.40 | |||||||
C3 fully allocated costs ($ per pound) | 2.60 - 2.85 | |||||||
| ||||||||
Exploration and evaluation expense | 280 - 300 | |||||||
Exploration3 | 220 - 230 | |||||||
Evaluation | 60 - 70 | |||||||
Corporate administration | 160 - 180 | |||||||
Other Expense | 420 - 440 | |||||||
Finance costs | 425 - 450 | |||||||
Capitalized interest | 380 - 400 | |||||||
Capital expenditures: | ||||||||
Minesite sustaining | 1,000 - 1,100 | |||||||
Mine development4 | 1,200 - 1,250 | |||||||
Minesite expansion5 | 600 - 650 | |||||||
Projects - initial capital6 | 2,300 - 2,500 | |||||||
Projects - infrastructure7 | 100 - 200 | |||||||
Total capital expenditures8 | 5,200 - 5,700 | |||||||
| ||||||||
Effective income tax rate | 30% | |||||||
| ||||||||
Key Assumptions | Q1 2013 | Original | ||||||
Gold Price ($/ounce) | $1,450 | $1,700 | ||||||
Copper Price ($/pound) | $3.25 | $3.50 | ||||||
Silver Price ($/ounce) | $24 | $32 | ||||||
Oil Price ($/barrel) | $90 �� | $90 | ||||||
AUD Exchange Rate | $1.05 | $1.00 | ||||||
CLP Exchange Rate | 475 | 475 | ||||||
| ||||||||
| 1 | Guidance for gold production reflects Barrick’s equity share of production from ABG (73.9%) and Pueblo Viejo (60%). |
| 2 | We now expect our all-in sustaining costs to be in the range of $950-$1,050 per ounce which is lower than our previously announced all in sustaining costs guidance range of $1,000 -$1,100. |
| 3 | Total exploration budget is now expected to be about $300 million to $340 million, of which about 30% is capitalized as part of mine development from our original guidance range of $400 to $440 million. |
| 4 | We decreased our minesite development expenditures guidance range to $1,200 - $1,250 million from our previously announced guidance range of $1,200 - $1,300 million. |
| 5 | We decreased our minesite expansion expenditures guidance range to $600 - $650 million from our previously announced guidance range of $800 - $900 million. |
| 6 | We decreased our project initial capital expenditures guidance range to $2,300 - $2,500 million from our previously announced guidance range of $2,400 - $2,600 million. |
| 7 | We decreased our project infrastructure capital expenditures guidance range to $100 - $200 million from our previously announced guidance range of $300 - $400 million. |
| 8 | We decreased our total capital expenditures guidance range to $5,200 - $5,700 million from our previously announced guidance range of $5,700 - $6,300 million. |
| BARRICK FIRST QUARTER 2013 | 12 | MANAGEMENT’S DISCUSSION AND ANALYSIS |
A key element of our disciplined capital allocation framework is an ongoing focus on cash flow. As part of this process we have identified approximately $500 million of reductions in expenditures. We will continue to look at opportunities to improve cash flow further throughout 2013. We now expect project capital expenditures to be about $2.4 billion - $2.7 billion, compared to $2.7 billion to $3.0 billion previously. As a result, we have revised our guidance for capital expenditures to a range of $5.2 billion - $5.7 billion from our previously announced range of $5.7 billion - $6.3 billion. We have also reduced our exploration budget by approximately $100 million and now expect to spend about $300 million to $340 million, of which about 30% is capitalized, compared to our original guidance range of $400 to $440 million. Additionally, we have revised our guidance for all-in sustaining costs to $950 - $1,050 per ounce from our previously announced range of $1,000 - $1,100 per ounce.
Market Overview
Gold and Copper
The market prices of gold and copper are the primary drivers of our profitability and our ability to generate free cash flow for our shareholders. During the first quarter, the gold price experienced continued volatility, with the price ranging from $1,556 to $1,696 per ounce. The price of gold closed at $1,598 per ounce, while the average quarterly market price of $1,632 represented a $59 per ounce decrease from the $1,691 per ounce average market price in the same prior year period. Subsequent to the end of the quarter, the price of gold has declined as low as $1,322 per ounce.
While gold spot prices remain volatile, gold continues to attract investment interest through its role as a safe haven investment, store of value and alternative to fiat currency due to concerns over global economic growth, geopolitical issues, sovereign debt and deficit levels, bank stability, future inflation prospects, and continuing accommodative monetary policies put in place by many of the world’s central banks. In particular, the current monetary policies of the US Federal Reserve have a significant impact on the price of gold. During the first quarter, it announced that it would continue to purchase $40 billion per month of agency mortgage-backed securities and $45 billion per month of longer-term Treasury securities in order to support a stronger economic recovery until the outlook for the labor market improves substantially. While there are risks that investor interest in gold will decrease, we believe that the continuing uncertain macroeconomic environment and loose monetary policies, together with the limited choice
of alternative safe haven investments, is supportive of continued strong demand for gold.
Copper prices were relatively stable in the first quarter of 2013, trading in a range of $3.40 per pound to $3.79 per pound. The average price for the first quarter was $3.60 per pound and the closing price was $3.44 per pound. Copper’s strength lies mainly in strong physical demand from emerging markets, especially China, which has resulted in a physical deficit in recent years. Copper prices should continue to be positively influenced by demand from Asia, the limited availability of scrap and production levels of mines and smelters in the future. In the near term, copper prices will be influenced by the outlook for global economic growth. In particular, a slowdown in Chinese economic growth could have a negative impact on copper prices.
Utilizing option collar strategies, the Company has protected the downside on approximately half of our remaining expected 2013 copper production at an average floor price of $3.50 per pound and can participate on the same amount up to an average of $4.25 per pound. Our realized price on all 2013 copper production is expected to be reduced by approximately $0.04 per pound as a result of the net premium paid on option hedging strategies. Our remaining copper production is subject to market prices.
We have provisionally priced copper sales for which final price determination versus the relevant copper index is outstanding at the balance sheet date. As at March 31, 2013, we have recorded 50 million pounds of copper sales subject to final settlement at an average provisional price of $3.41 per pound. The impact to net income before taxation of a 10% movement in the market price of copper would be approximately $17 million, holding all other variables constant.
Silver
Silver prices do not significantly impact our current operating earnings, cash flows or gold total cash costs. Silver prices, however, will have a significant impact on the overall economics for our Pascua-Lama project, which is currently in the construction phase. In the first five full years of production, Pascua-Lama is expected to produce an average of 35 million ounces of silver annually.
In the first quarter, silver prices traded in a range from $27.96 per ounce to $32.48 per ounce, averaged $30.11 per ounce and closed the quarter at $28.64 per ounce. Subsequent to the end of the quarter, the price of silver has declined as low as $22.07 per ounce. The silver price is driven by factors similar to those influencing
| BARRICK FIRST QUARTER 2013 | 13 | MANAGEMENT’S DISCUSSION AND ANALYSIS |
investment demand for gold. The physical silver market is currently in surplus and investment demand is expected to be the primary driver of prices in the near term.
Utilizing option collar strategies, we have hedge protection on a total of 65 million ounces of silver from 2013 to 2018, inclusive, with an average floor price of $23 per ounce and an average ceiling price of $53 per ounce. Total premiums of $0.60 per ounce were paid to achieve these positions.
Currency Exchange Rates
The results of our mining operations outside of the United States are affected by US dollar exchange rates. The largest single exposure we have is to the Australian dollar/US dollar exchange rate. We also have exposure to the Canadian dollar through a combination of Canadian mine operating costs and corporate administration costs, as well as exposure to the Chilean peso as a result of the construction of our Pascua-Lama project and mine operating costs. In addition, we have exposure to the Papua New Guinea kina, Peruvian sol, Zambian kwacha, Tanzanian shilling, Dominican peso and Argentinean peso through mine operating and capital costs.
Fluctuations in the US dollar increase the volatility of our costs reported in US dollars, subject to protection that we have put in place through our currency hedging program. The economies of Australia, Canada and Chile have fared well in comparison to many other OECD countries since the onset of the global economic crisis. As a result, the currencies of these countries continue to trade at historically strong levels. In the quarter, the Australian dollar traded in a range of $1.01 to $1.06 against the US dollar, while the US dollar against the Canadian dollar and Chilean peso traded in ranges of $0.98 to $1.03 and CLP 466 to CLP 480, respectively.
In the first quarter, we recorded gains in earnings of approximately $81 million from our Australian, Canadian and Chilean peso hedges, primarily impacting our operating and corporate administration costs.
AUD Currency Contracts
| ||||||||||||||||||||
| Contracts (AUD millions) | Effective Average Hedge Rate (AUDUSD) | % of Total Expected AUD Exposure2 Hedged | % of Expected Operating Cost Exposure Hedged | Crystallized OCI 1 (USD millions) | ||||||||||||||||
| ||||||||||||||||||||
2013 | 215 | 0.96 | 16% | 20% | 199 | |||||||||||||||
2014 | 338 | 0.92 | 19% | 23% | 109 | |||||||||||||||
2015 | 707 | 0.92 | 42% | 51% | - | |||||||||||||||
2016 | 480 | 0.90 | 30% | 37% | - | |||||||||||||||
| ||||||||||||||||||||
CAD Currency Contracts
| ||||||||||||||||
| Contracts (CAD millions)3 | Effective Average Hedge Rate (USDCAD) | % of Total Expected CAD Exposure2 Hedged | % of Expected | |||||||||||||
| ||||||||||||||||
2013 | 319 | 1.02 | 88% | 100% | ||||||||||||
2014 | 141 | 1.00 | 28% | 32% | ||||||||||||
| ||||||||||||||||
CLP Currency Contracts
| ||||||||||||||||
| Contracts (CLP millions)4 | Effective Average Hedge Rate (USDCLP) | % of Total Expected CLP Exposure2 Hedged | % of Expected | |||||||||||||
| ||||||||||||||||
2013 | 267,131 | 514 | 100% | 100% | ||||||||||||
2014 | 287,016 | 509 | 84% | 100% | ||||||||||||
2015 | 78,000 | 513 | 27% | 43% | ||||||||||||
| ||||||||||||||||
| 1 | $199 million will be recognized in earnings in 2013 and $109 million in 2014. |
| 2 | Includes all forecasted operating, administrative, sustainable and eligible project capital expenditures. |
| 3 | Includes $238 million CAD contracts with a cap and floor of $1.00 and $1.08, respectively. |
| 4 | Includes CLP 343,650 million collar contracts that are an economic hedge of operating, administrative and capital expenditures at various South American sites and at our Pascua-Lama project with a cap and floor of 514 and 572, respectively. |
Fuel
Concerns over global economic growth, supply and transportation issues and geopolitical tensions in certain oil producing regions combined to create volatility in oil prices in the first quarter. The price of West Texas Intermediate (“WTI”) crude oil traded in a range of $89 to $98 per barrel in the first quarter, averaged $94 per barrel, and ended the quarter at $97 per barrel, compared to an average of $103 per barrel in the same prior year period.
In the first quarter, we recorded a hedge gain of $9 million on our fuel hedge positions (Q1 2012: $8 million).
| BARRICK FIRST QUARTER 2013 | 14 | MANAGEMENT’S DISCUSSION AND ANALYSIS |
Financial Fuel Hedge Summary
| ||||||||||||
| Barrels1 (thousands) | Average Price | % of Expected Exposure | ||||||||||
| ||||||||||||
2013 | 1,763 | $ 92 | 44% | |||||||||
2014 | 1,500 | 95 | 29% | |||||||||
2015 | 960 | 92 | 22% | |||||||||
2016 | 720 | 85 | 17% | |||||||||
| ||||||||||||
| 4,943 | $ 91 | 28% | ||||||||||
| ||||||||||||
| 1 | Refers to contracts for a combination of WTI, BRENT and WTI-to-BRENT swaps. As a result, our average price on hedged barrels for 2013 – 2015 is $89 per barrel on a WTI-equivalent basis. |
US Dollar Interest Rates
During the first quarter, the Federal Open Market Committee of the US Federal Reserve released a statement on monetary policy that noted that the current 0% to 0.25% range for the benchmark rate would remain appropriate at least as long as the US unemployment rate remains above 6.5%, projected inflation remains below 2.5% and longer-term inflation expectations continue to be well anchored. In addition, we expect the US Federal Reserve to continue to use monetary policy initiatives, such as purchases of agency-
backed mortgage securities and longer-term Treasury securities, in an effort to keep long-term interest rates low and increase employment. We expect such initiatives to be followed by incremental increases to short-term rates once economic conditions normalize.
At present, our interest rate exposure mainly relates to interest receipts on our cash balances ($2.3 billion at March 31, 2013); the mark-to-market value of derivative instruments; the fair value and ongoing payments under US dollar interest-rate swaps; and to the interest payments on our variable-rate debt ($3.1 billion at March 31, 2013). Currently, the amount of interest expense recorded in our consolidated statement of income is not materially impacted by changes in interest rates, because the majority of debt was issued at fixed interest rates. The relative amounts of variable-rate financial assets and liabilities may change in the future, depending on the amount of operating cash flow we generate, as well as the level of capital expenditures and our ability to borrow on favorable terms using fixed rate debt instruments.
REVIEW OF FINANCIAL RESULTS
Revenue
($ millions, except per ounce/pound data in dollars) |
| |||||||
| ||||||||
For the three months ended March 31 | 2013 | 2012 | ||||||
| ||||||||
Gold | ||||||||
000s oz sold | 1,747 | 1,783 | ||||||
Revenues1 | $ 2,962 | $ 3,122 | ||||||
Market price2 | 1,632 | 1,691 | ||||||
Realized price2,3 | $ 1,629 | $ 1,691 | ||||||
Copper | ||||||||
millions lbs sold | 115 | 119 | ||||||
Revenue1 | $ 383 | $ 445 | ||||||
Market price2 | 3.60 | 3.77 | ||||||
Realized price2,3 | 3.56 | 3.78 | ||||||
Oil & gas sales | $ 38 | $ 42 | ||||||
Other metal sales | $ 54 | $ 35 | ||||||
| ||||||||
| 1 | Represents revenues on a 100% consolidated basis. |
| 2 | Per ounce/pound weighted average. |
| 3 | Realized price is a non-GAAP financial performance measure with no standard meaning under IFRS. For further information and a detailed reconciliation, please see page 34 of this MD&A. |
In the first quarter 2013, gold revenues totaled $2,962 million and copper revenues totaled $383 million, down 5% and 14%, respectively, compared to the same prior year period, primarily due to lower realized gold and copper prices and lower gold and copper sales volumes.
Realized gold prices of $1,629 per ounce in the first quarter 2013 were down $62 per ounce, or 4%, compared to the prior year, reflecting the decrease in market gold prices, which averaged $1,632 per ounce in the first quarter 2013, compared to $1,691 per ounce in the same prior year period. Lower gold sales volumes are primarily a result of lower production in South America and North America, partially offset by higher production in Australia Pacific. Realized copper prices were 6% lower than the prior year, primarily due a to 5% decrease in market copper prices.
| BARRICK FIRST QUARTER 2013 | 15 | MANAGEMENT’S DISCUSSION AND ANALYSIS |
Production Costs
($ millions, except per ounce/pound data in dollars)
| ||||||||
For the three months ended March 31 | 2013 | 2012 | ||||||
| ||||||||
Cost of sales | ||||||||
Direct mining cost | $ 1,333 | $ 1,275 | ||||||
Depreciation | 415 | 399 | ||||||
Royalty expense | 96 | 79 | ||||||
Cost of sales - gold | 1,503 | 1,423 | ||||||
Total cash costs1,2 | 561 | 540 | ||||||
All-in sustaining costs1,2 | 919 | 909 | ||||||
Cost of sales - copper | 307 | 287 | ||||||
C1 cash costs1,2 | $ 2.46 | $ 2.04 | ||||||
C3 fully allocated costs1,2 | $ 3.00 | $ 2.68 | ||||||
| ||||||||
| 1 | Per ounce/pound weighted average. |
| 2 | Total cash cost, all-in sustaining costs, C1 cash costs and C3 fully allocated costs are non-GAAP financial performance measures with no standard meaning under IFRS. For further information and a detailed reconciliation, please see pages 33 - 34 of this MD&A. |
Cost of sales applicable to gold was $1,503 million in the first quarter 2013, up 6% compared to the same prior year period. The increase reflects higher direct mining costs, particularly higher labor, energy, maintenance and consumable costs, which were largely driven by an increase in ore tons processed.
Total cash costs were $561 per ounce in the first quarter 2013, up 4% compared to the $540 per ounce recorded in the same prior year period. The increase reflects the same factors impacting cost of sales applicable to gold, as well as the impact of lower production levels in South America, our lowest-cost RBU, which resulted in higher consolidated unit production costs. All-in sustaining costs for the first quarter 2013 were $919 per ounce, slightly higher than the same prior year period, reflecting the increase in total cash costs, partially offset by lower general and administrative expenditures.
Cost of sales applicable to copper was $307 million, up 7% compared to the $287 million recorded in the same prior year period. The increase reflects primarily higher costs at Lumwana due to higher direct mining costs and increased government royalties, which doubled in Zambia in April 2012, to 6% from 3% previously, partially offset by lower depreciation expense as a result of the impairment charges recorded in the fourth quarter of 2012.
C1 cash costs per pound increased by 21% over the same prior year period primarily due to higher labor and processing costs at Lumwana and an unfavorable sales mix with Lumwana representing a higher proportion of total sales compared to the same prior year period. C3 fully allocated costs per pound increased by 12% over the same prior year period, primarily reflecting the effect of the above factors on C1 cash costs.
Corporate Administration
($ millions) | ||||||||
| ||||||||
For the three months ended March 31 | 2013 | 2012 | ||||||
| ||||||||
Corporate administration expense | $ 45 | $ 48 | ||||||
| ||||||||
Corporate administration costs were $45 million in the first quarter 2013, down slightly compared to the first quarter 2012.
Other Expense/Other Income
($ millions) | ||||||||
| ||||||||
For the three months ended March 31 | 2013 | 2012 | ||||||
| ||||||||
Operating segment administration1 | $ 49 | $ 59 | ||||||
Corporate social responsibility | 12 | 17 | ||||||
Currency translation losses2 | 17 | - | ||||||
Other items | 88 | 41 | ||||||
| ||||||||
Total other expense | $ 166 | $ 117 | ||||||
| ||||||||
Total other income | $ 21 | $ 41 | ||||||
| ||||||||
| 1 | Relates to general and administrative costs incurred at business unit offices. |
| 2 | Amounts attributable to currency translation losses on working capital balances. |
Other expense was $166 million in the first quarter 2013, up 42%, compared to the $117 million recorded in the first quarter 2012. The increase is primarily due to higher currency translation losses on working capital balances and non-recurring other expenses.
Exploration and Evaluation
($ millions) | ||||||||
| ||||||||
For the three months ended March 31 | 2013 | 2012 | ||||||
| ||||||||
Exploration: | ||||||||
Minesite programs | $ 13 | $ 15 | ||||||
Global programs | 32 | 44 | ||||||
Evaluation costs | 9 | 14 | ||||||
| ||||||||
Exploration and evaluation expense | $ 54 | $ 73 | ||||||
| ||||||||
| BARRICK FIRST QUARTER 2013 | 16 | MANAGEMENT’S DISCUSSION AND ANALYSIS |
Exploration and evaluation expense was $54 million in the first quarter 2013, down 26% compared to $73 million in the first quarter 2012. The decrease is primarily due to decreased global exploration costs, primarily due to lower exploration expenditures at Lumwana.
Capital Expenditures1
($ millions) | ||||||||
| ||||||||
For the three months ended March 31 | 2013 | 2012 | ||||||
| ||||||||
Total project capital expenditures2 | $ 615 | $ 630 | ||||||
Total capital expenditures - minesite expansion | 145 | 118 | ||||||
Total capital expenditures - minesite sustaining | 306 | 269 | ||||||
Total capital expenditures - mine development | 317 | 321 | ||||||
Capitalized interest | 47 | 77 | ||||||
| ||||||||
Total consolidated capital expenditures | $1,430 | $1,415 | ||||||
| ||||||||
| 1 | These amounts are presented on a 100 % cash basis consistent with the amounts presented on the consolidated statement of cash flows. |
| 2 | On an accrual basis, our share of project capital expenditures is $717 million including capitalized interest. |
Capital expenditures were $1,430 million in the first quarter 2013, an increase of $15 million, or 1%, compared to the first quarter 2012. The increase is primarily due to an increase in project capital expenditures at Pascua-Lama, partially offset by lower project expenditures at Pueblo Viejo as the mine commenced commercial production at the start of the year and an increase in minesite expansion expenditures in our gold segments and sustaining capital expenditures on our gold and copper segments, partially offset by a decrease in mine development expenditures.
Finance Cost/Finance Income
($ millions) | ||||||||
| ||||||||
For the three months ended March 31 | 2013 | 2012 | ||||||
| ||||||||
Interest incurred | $ 181 | $ 160 | ||||||
Interest capitalized | (90) | (125) | ||||||
Accretion | 17 | 13 | ||||||
| ||||||||
Finance cost | $ 108 | $ 48 | ||||||
| ||||||||
Finance income | $ 3 | $ 3 | ||||||
| ||||||||
Finance costs expensed in the first quarter 2013 were $108 million, compared to $48 million in the same prior year period. Interest costs incurred were $181 million, up 13% compared to the $160 million in the same prior year period. The increase in interest costs incurred reflects higher total debt levels compared to the same prior year period. Interest capitalized in the first quarter 2013 decreased by $35 million compared to the same prior year period, primarily due to Pueblo Viejo entering commercial production in January 2013.
Impairment Charges
($ millions) | ||||||||
| ||||||||
For the three months ended March 31 | 2013 | 2012 | ||||||
| ||||||||
Highland | - | $ 87 | ||||||
Other | 5 | 7 | ||||||
| ||||||||
Total impairment charges | $ 5 | $ 94 | ||||||
| ||||||||
Impairment charges for the first quarter 2013 were $5 million, compared to $94 million in the same prior year period. The charges for first quarter 2012 were primarily related to the write down of our investments in Highland Gold.
Income Tax
Income tax expense was $420 million in the first quarter 2013. After adjusting for the impact of net currency translation losses on deferred tax balances and the impact of impairment charges and non-hedge derivatives, the underlying effective tax rate for income in the first quarter 2013 was 30%.
We record deferred tax charges or credits if changes in facts or circumstances affect the estimated tax basis of assets and therefore the amount of deferred tax assets or liabilities to reflect changing expectations in our ability to realize deferred tax assets. The interpretation of tax regulations and legislation and their application to our business is complex and subject to change. We have significant amounts of deferred tax assets, including tax loss carry forwards, and also deferred tax liabilities. Potential changes of any of these amounts, as well as our ability to realize deferred tax assets, could significantly affect net income or cash flow in future periods.
| BARRICK FIRST QUARTER 2013 | 17 | MANAGEMENT’S DISCUSSION AND ANALYSIS |
Operational Overview
| Gold | Copper | |||||||||||||||||||||||
| ||||||||||||||||||||||||
For the three months ended March 31 | 2013 | 2012 | % Change | 2013 | 2012 | % Change | ||||||||||||||||||
| ||||||||||||||||||||||||
Production (000s oz/millions lbs)1 | 1,797 | 1,881 | (4%) | 127 | 117 | 9% | ||||||||||||||||||
Ore tons mined (000s) | 42,146 | 36,607 | 15% | 16,680 | 15,851 | 5% | ||||||||||||||||||
Waste tons mined (000s) | 125,322 | 130,667 | (4%) | 23,851 | 25,770 | (7%) | ||||||||||||||||||
Total tons mined (000s) | 167,468 | 167,274 | - | 40,531 | 41,621 | (3%) | ||||||||||||||||||
Ore tons processed (000s) | 38,870 | 36,999 | 5% | 17,604 | 17,106 | 3% | ||||||||||||||||||
Average grade (ozs per ton/percent) | 0.054 | 0.057 | (5%) | 0.53 | 0.52 | 2% | ||||||||||||||||||
| ||||||||||||||||||||||||
| 1 | Reflects our equity share of production. |
Gold production in the first quarter 2013 was 4% lower than the same prior year period, due to lower production in South America and North America, partially offset by higher production in Australia Pacific.
Copper production in the first quarter 2013 was 9% higher than the same prior year period, primarily due to higher production at Lumwana, partially offset by lower production at Zaldívar.
Tons Mined and Tons Processed - Gold
Total tons mined increased slightly in the first quarter 2013 and tons processed increased by 5%, compared to the same prior year period. The increases in tons mined were primarily due to increased mining activity at Pierina, Buzwagi, and Pueblo Viejo, partially offset by decreased mining activity at Goldstrike and Ruby Hill. The increase in ore tons processed was primarily due to increases at Pierina and Veladero, partially offset by a decrease at Bald Mountain.
Average Mill Head Grades - Gold
Average mill head grades decreased by approximately 5% in the first quarter 2013 compared to the same prior year period, primarily due to lower ore grades from Bulyanhulu, Turquoise Ridge, Cortez, Lagunas Norte and Veladero, partially offset by higher grades processed at Plutonic, North Mara and Cowal.
Tons Mined and Tons Processed - Copper
Total tons mined decreased in the first quarter 2013 by 3% and ore tons processed increased by 3% compared to the same prior year period. The decrease in tons mined was primarily due to Lumwana. The increase in ore tons processed are primarily due to an increase at Lumwana due to higher ore tons available for processing.
Review of Operating Segments Performance
Barrick’s business is organized into seven primary business units: four regional gold businesses, a global copper business, an oil & gas business, and a Capital Projects business. Barrick’s Chief Operating Decision Maker reviews the operating results, assesses
performance and makes capital allocation decisions for each of these business operations at a business unit level. Therefore, these business units are operating segments for financial reporting purposes. Segment performance is evaluated based on a number of measures including operating income before tax, production levels and unit production costs. Our business unit structure adds value by enabling the realization of operational efficiencies, allocating resources to individual mines/projects more effectively and understanding and managing the local business environment, including labor, consumable costs and supply and government and community relations. Income tax, corporate administration, finance income and costs, impairment charges and reversals, investment write-downs and gains/losses on non-hedge derivatives are managed on a consolidated basis and are therefore not reflected in segment income.
North America
Summary of Operating Data | ||||||||||||
| ||||||||||||
For the three months ended March 31 | 2013 | 2012 | | % Change | | |||||||
| ||||||||||||
Total tons mined (000s) | 96,409 | 101,685 | (5%) | |||||||||
Ore tons processed (000s) | 14,055 | 15,029 | (6%) | |||||||||
Average grade (ozs/ton) | 0.072 | 0.069 | 4% | |||||||||
Gold produced (000s/oz) | 872 | 888 | (2%) | |||||||||
Cost of sales ($ millions) | $ 597 | $ 535 | 12% | |||||||||
Total cash costs (per oz)1 | $ 487 | $ 484 | 1% | |||||||||
All-in sustaining costs (per oz)1 | $ 770 | $ 782 | (2%) | |||||||||
| ||||||||||||
Summary of Financial Data | ||||||||||||
| ||||||||||||
| For the three months ended March 31 | 2013 | 2012 | | % Change | | |||||||
| ||||||||||||
Segment income ($ millions)2 | $ 808 | $ 848 | (5%) | |||||||||
Capital expenditures ( $ millions)3 | $ 287 | $ 256 | 12% | |||||||||
| ||||||||||||
| 1 | Total cash costs and all-in sustaining costs are non-GAAP financial performance measures with no standardized meaning under IFRS. For further information and a detailed reconciliation, please see page 33 of this MD&A. |
| 2 | Segment income excludes income taxes. |
| 3 | Amounts presented represent our share of expenditures for minesite expansion, minesite sustaining as well as mine development on an accrual basis excluding capitalized interest. |
| BARRICK FIRST QUARTER 2013 | 18 | MANAGEMENT’S DISCUSSION AND ANALYSIS |
Gold production for the first quarter 2013 was 2% lower than the same prior year period primarily due to lower production at Cortez, Goldstrike and Bald Mountain. This decrease was partially offset by the start of commercial production at Pueblo Viejo.
Production at Cortez decreased by 18% mainly as a result of a decrease in high-grade refractory tons processed, combined with lower grades at the mill and heap leach pads, partially offset by increased mill and heap leach processing. Production at Goldstrike decreased by 5%, primarily as a result of the processing of lower grade ore and lower recoveries at the autoclave facility, partially offset by increased process throughput. Production at Bald Mountain decreased by 35% as a result of a decrease in ore tons placed on the leach pads as the mine goes through a significant development phase in 2013. Pueblo Viejo production was 96 thousand ounces after achieving commercial production in January 2013.
In the first quarter 2013, cost of sales increased by 12% over the same prior year period, primarily as a result of bringing Pueblo Viejo into commercial production. This increase was partially offset by an increase in capitalized production phase stripping costs at Cortez. Total cash costs per ounce were $487 in the first quarter 2013, up 1% compared to the same prior year period. All-in sustaining costs per ounce were 2% lower due to the impact of higher ounces sold and lower mine development capital expenditures.
Segment income for the first quarter of 2013 was $808 million, a decrease of 5% over the same prior year period. The decrease was primarily the result of lower realized gold prices and the increase in cost of sales described above. Capital expenditures increased by 12%, primarily due to higher minesite expansion capital expenditures.
We continue to expect full year production to be in the range of 3.55 to 3.70 million ounces at total cash costs of $495 to $545 per ounce and at all-in sustaining costs of $820 to $870 per ounce for the region.
Goldstrike Thiosulfate technology project
Construction of the thiosulfate technology project, including the retrofitting of the existing plant and the construction of new installations, continued during the quarter. This project allows for continued production from the autoclaves and brings forward production of about 3.5 million ounces in the mine plan. First gold production is expected in the third quarter 2014, with an average annual contribution of about 350 to 400
thousand ounces over the first full five years. Total project costs are expected to be about $450 million.
Goldrush and Cortez District
In Nevada, drilling in 2012 doubled and upgraded the resource base at Goldrush. The updated measured and indicated resource of 8.4 million ounces represents more than a 500 percent increase from 2011. Additionally, there are 5.7 million ounces in the inferred category. The footprint of the deposit has more than doubled to greater than seven kilometers, and the system still remains open in multiple directions.
The greater Cortez area contains substantial district-scale opportunities, including a new parallel exploration trend identified to the west of Goldrush, and the northern, eastern and southern extensions of the Goldrush system. Exploration drilling programs will be focused on growing and upgrading the resource base, delineating the extent of the system and exploring the potential for extensions to the north and south. In addition, the potential of the newly identified parallel trend to the west will be assessed. As this project advances through prefeasibility, a number of development options are being considered, including open pit mining, underground mining, or a combination of both. Exploration activities in 2013 are supporting these trade-off studies, including:
| • | Focusing on the high grade areas to establish continuity for an early, underground option; |
| • | Targeting the near surface areas of the orebody in the northwest for a potential starter pit; |
| • | Undertaking geotechnical studies to establish potential slope parameters for a large pit scenario, the economics of which is largely driven by the strip ratio and pit wall angles; |
| • | Establishing the metallurgical characteristics of the orebody for processing considerations; |
| • | Defining areas for infrastructure through condemnation drilling; and |
| • | Supporting hydrological studies. |
These trade-off studies will provide a better understanding of the potential of this quality asset and the economic drivers for development, which will form the basis of the prefeasibility study scheduled for completion in late 2014. This district is a cornerstone of Barrick’s current and future success and is located in a mining area well provided with significant infrastructure and expertise.
| BARRICK FIRST QUARTER 2013 | 19 | MANAGEMENT’S DISCUSSION AND ANALYSIS |
South America
Summary of Operating Data
| For the three months ended March 31 | 2013 | 2012 | % Change | |||||||||
Total tons mined (000s) | 37,302 | 32,121 | 16% | |||||||||
Ore tons processed (000s) | 16,802 | 13,951 | 20% | |||||||||
Average grade (ozs/ton) | 0.027 | 0.032 | (16%) | |||||||||
Gold produced (000s/oz) | 370 | 451 | (18%) | |||||||||
Cost of sales ($ millions) | $ 236 | $ 257 | (8%) | |||||||||
Total cash costs (per oz)1 | $ 405 | $ 414 | (2%) | |||||||||
All-in sustaining costs (per oz)1 | $ 638 | $ 615 | 4% | |||||||||
Summary of Financial Data | ||||||||||||
| For the three months ended March 31 | 2013 | 2012 | % Change | |||||||||
Segment income ($ millions)2 | $ 317 | $ 443 | (28%) | |||||||||
Capital expenditures ($ millions)3 | $ 84 | $ 85 | (1%) | |||||||||
| 1 | Total cash costs and all-in sustaining costs are non-GAAP financial performance measures with no standardized meaning under IFRS. For further information and a detailed reconciliation, please see page 34 of this MD&A. |
| 2 | Segment income excludes income taxes. |
| 3 | Amounts presented represent expenditures for minesite expansion, minesite sustaining as well as mine development on an accrual basis excluding capitalized interest. |
Gold production for the first quarter 2013 was 18% lower than the same prior year period. The decrease in production compared to the first quarter 2012 reflects lower production levels across all of our mines, particularly at Lagunas Norte. Production at Lagunas Norte was down by 30% primarily as a result of the scheduled decrease in head grade and a lesser drawdown from leach pad inventory. At Pierina, production for the quarter was down by 35% due to lower grades and a lesser drawdown from the leach pad inventory.
In the first quarter 2013, cost of sales decreased by 8% over the same prior year period, primarily due to the drawdown of lower cost ounces on the leach pads at the mines, partially offset by increased labor rates, increased fuel and explosives consumption due to an increase in total tons mined and increased depreciation expense due to the leach pads drawdown. Total cash costs per ounce were $405 in the first quarter 2013, down 2% compared to the same prior year period mainly due to higher silver by-product credits, which more than offset the impact of higher unit costs and lower production of gold. All-in sustaining costs per ounce were $638 in the first quarter 2013, up 4% compared to the same prior year period reflecting higher minesite sustaining capital expenditures and lower ounces sold, partially offset by lower total cash costs.
Segment income for the first quarter 2013 was $317 million, a decrease of 28% over the same prior year period. The decrease was primarily as a result of lower sales volumes and lower realized gold prices, partially offset by lower total cash costs. Capital expenditures decreased by 1%, due to lower capitalized stripping at all sites.
We continue to expect full year production to be in the range of 1.25 to 1.35 million ounces at total cash costs of $550 to $600 per ounce and all-in sustaining costs of $875 to $925 per ounce for the region.
Australia Pacific
Summary of Operating Data
| For the three months ended March 31 | 2013 | 2012 | % Change | |||||||||
Total tons mined (000s) | 22,351 | 25,634 | (13%) | |||||||||
Ore tons processed (000s) | 6,430 | 6,470 | (1%) | |||||||||
Average grade (ozs/ton) | 0.080 | 0.076 | 5% | |||||||||
Gold produced (000s/oz) | 447 | 426 | 5% | |||||||||
Cost of sales ($ millions) | $ 456 | $ 448 | 2% | |||||||||
Total cash costs (per oz)1 | $ 785 | $ 749 | 5% | |||||||||
All-in sustaining costs (per oz)1 | $ 1,096 | $ 1,107 | (1%) | |||||||||
Summary of Financial Data | ||||||||||||
| For the three months ended March 31 | 2013 | 2012 | % Change | |||||||||
Segment income ($ millions)2 | $ 274 | $ 292 | (6%) | |||||||||
Capital expenditures ($ millions)3 | $ 114 | $ 117 | (3%) | |||||||||
| 1 | Total cash costs and all-in sustaining costs are non-GAAP financial performance measures with no standardized meaning under IFRS. For further information and a detailed reconciliation, please see page 34 of this MD&A. |
| 2 | Segment income excludes income taxes. |
| 3 | Amounts presented represent expenditures for minesite expansion, minesite sustaining as well as mine development on an accrual basis excluding capitalized interest. |
Gold production for the first quarter 2013 was 5% higher than the same prior year period mainly due to increased production at Cowal and Porgera, partially offset by lower production at KCGM.
Production at Cowal increased 39% from the first quarter of 2012 as a result of higher grade ore being mined from the open pit. Porgera production benefited from higher throughput in the first quarter of 2013 due to less operational disruptions compared to first quarter 2012. Production at KCGM decreased by 19% from the same prior year period, mainly due to lower grades from the open pit.
| BARRICK FIRST QUARTER 2013 | 20 | MANAGEMENT’S DISCUSSION AND ANALYSIS |
In the first quarter 2013, cost of sales increased by 2% over the same prior year period, reflecting higher direct mining costs, particularly for labor, freight, Porgera power costs, diesel and an increase in our effective Australian dollar hedge rates from 2012 to 2013, partially offset by an increase in capitalized production phase stripping costs at Porgera.
Total cash costs per ounce were $785 in the first quarter 2013, up 5% compared to the same prior year period due to higher cost of sales. All-in sustaining costs per ounce were $1,096 in the first quarter 2013, down 1% compared to the same prior year period due to lower minesite sustaining capital expenditures.
Segment income for the first quarter 2013 was $274 million, a decrease of 6% over the same prior year period. The decrease was primarily due to a lower realized gold price and higher total cash costs. Capital expenditures decreased by 3%, over the same prior year period, reflecting a reduction of sustaining capital expenditures across all sites, partially offset by an increase in capitalized production phase stripping costs at Porgera.
We continue to expect full year production to be in the range of 1.70 to 1.85 million ounces at total cash costs of $880 to $950 per ounce and all-in sustaining costs of $1,200 to $1,300 per ounce for the region.
African Barrick Gold
100% basis
Summary of Operating Data
| For the three months ended March 31 | 2013 | 2012 | % Change | |||||||||
Total tons mined (000s) | 15,434 | 10,601 | 46% | |||||||||
Ore tons processed (000s) | 2,142 | 2,096 | 2% | |||||||||
Average grade (ozs/ton) | 0.077 | 0.081 | (5%) | |||||||||
Gold produced (000s/oz) | 146 | 145 | 1% | |||||||||
Cost of sales ($ millions) | $ 204 | $ 178 | 15% | |||||||||
Total cash costs (per oz)1 | $ 931 | $ 873 | 7% | |||||||||
All-in sustaining costs (per oz)1 | $ 1,561 | $ 1,438 | 9% | |||||||||
Summary of Financial Data | ||||||||||||
| For the three months ended March 31 | 2013 | 2012 | % Change | |||||||||
Segment income ($ millions)2 | $ 31 | $ 58 | (47%) | |||||||||
Capital expenditures ($ millions)3 | $ 105 | $ 61 | 72% | |||||||||
| 1 | Total cash costs and all-in sustaining costs are non-GAAP financial performance measures with no standardized meaning under IFRS. For further information and a detailed reconciliation, please see page 35 of this MD&A. |
| 2 | Segment income excludes income taxes. |
| 3 | Amounts presented represent expenditures for minesite expansion, minesite sustaining as well as mine development on an accrual basis excluding capitalized interest. |
Production at ABG totaled 146 thousand ounces (Barrick’s share 108 thousand ounces) in the first quarter 2013, up slightly compared to the same prior year period. The increase in production was primarily due to higher production at North Mara, partially offset by lower production at Bulyanhulu and Tulawaka.
Production at North Mara increased by 85% over the first quarter 2012, mainly as a result of the processing of higher grade ore due to the opening of higher grade areas of the pit as a result of the waste stripping program that was undertaken over the past year, combined with an increase in mill recovery rates due to the higher grades and a gold plant upgrade that was completed in 2012. Production at Bulyanhulu decreased by 39% mainly as a result of lower head grade and mining equipment availability issues, which had a negative impact on tons mined compared to the same prior year period. Production at Tulawaka was down 75% compared to the prior year period as underground operations came to an end in the first quarter of 2013.
In the first quarter 2013, cost of sales increased by 15% over the same prior year period, primarily due to an increase in royalty rates (effective second quarter 2012), higher direct mining costs, which are largely due to increased maintenance costs at Buzwagi and North Mara, increased energy and fuel costs due to the requirement to self-generate more power and increased diesel consumption due to higher mining rates, partially offset by an increase in capitalized production phase stripping costs at Buzwagi. Total cash costs per ounce for the first quarter 2013 were $931, up 7% compared to the same prior year period. The increase in total cash costs reflects the same factors impacting cost of sales, as well as the impact of lower production levels at Tulawaka. All-in sustaining costs per ounce were $1,561 in the first quarter 2013, up 9% compared to the same prior year period due to higher total cash costs and an increase in capitalized stripping costs at Buzwagi.
Segment income for the first quarter 2013 was $31 million, a decrease of 47% over the same prior year period. The decrease was primarily due to a lower realized gold price and higher cost of sales.
In the first quarter 2013, capital expenditures were up by 72% compared to the same prior year period, primarily due to higher minesite expansion capital expenditures at Bulyanhulu related to the CIL expansion project and higher capitalized stripping costs at Buzwagi.
| BARRICK FIRST QUARTER 2013 | 21 | MANAGEMENT’S DISCUSSION AND ANALYSIS |
We continue to expect full year equity gold production reflecting our 73.9% ownership of ABG to be in the range of 0.400 to 0.450 million ounces at total cash costs of $925 to $975 per ounce and at all-in sustaining costs of $1,550 to $1,600 per ounce for the region.
Capital Projects
Summary of Financial and Operating Data
($ millions)
| For the three months ended March 31 | 2013 | 2012 | % Change | |||||||||
Segment income (loss) | (62) | (15) | 313% | |||||||||
Capital expenditures - initial capital1 | ||||||||||||
Pascua-Lama | 588 | 321 | 83% | |||||||||
Pueblo Viejo2 | - | 93 | (100%) | |||||||||
Cerro Casale | 3 | 11 | (73%) | |||||||||
Donlin | 4 | 3 | 33% | |||||||||
Capital expenditures - Infrastructure1 | ||||||||||||
Pascua-Lama | 23 | - | 100% | |||||||||
Pueblo Viejo2 | - | 4 | (100%) | |||||||||
Total capital expenditures | $ 618 | $ 432 | 43% | |||||||||
Currency hedge impact (gain) / loss3 | (9) | (8) | 13% | |||||||||
Adjusted capital expenditures | 609 | 424 | 44% | |||||||||
Capital commitments4 | $ 1,522 | $ 2,081 | (27%) | |||||||||
| 1 | Amounts presented represent our share of capital expenditures on an accrual basis excluding capitalized interest. |
| 2 | Amounts reflect our Pueblo Viejo project cost before reaching commercial production up to December 2012. Amounts from January 2013 are recorded in North America segment. |
| 3 | Amounts presented include impacts of our hedge and non-hedge contracts for pre-production capital at our Pascua-Lama and Cerro Casale projects. |
| 4 | Capital commitments represent purchase obligations as at March 31 where binding commitments have been entered into for long lead capital items related to construction activities at our projects. |
The increase in capital expenditures primarily relates to increased construction activities at our Pascua-Lama project.
An update on our Pascua-Lama project is provided on pages 11 to 12 of this MD&A. Please find an update on our other significant projects below.
Cerro Casale
At the Cerro Casale project in Chile, approval of the Environmental Impact Assessment was received in January 2013 from the Servicio de Evaluacion Ambiental, the environmental authority of northern Chile. Cerro Casale, on a 100 percent basis, has total proven and probable gold and copper mineral reserves of 23 million ounces of gold and 5.8 billion pounds of copper.
Kabanga
At the 50 percent-owned Kabanga nickel project in Tanzania, a conceptual closure plan, the final piece of information requested by the National Environment Management Council, was submitted in the first quarter 2013. Kabanga has a total estimated measured and indicated resource of 37.2 million tonnes grading 2.63% nickel and an inferred resource of 21 million tonnes grading 2.6% nickel. Contingent upon the results of the feasibility study and government infrastructure improvement projects, it is expected that the operation may be capable of producing more than 40,000 tonnes per year of nickel-in-concentrate at full production. We are considering a potential disposition of our 50% interest in the Kabanga project in accordance with our disciplined capital allocation framework.
Global Copper
Summary of Operating Data
| For the three months ended March 31 | 2013 | 2012 | % Change | |||||||||
Copper produced (millions of lbs) | 127 | 117 | 9% | |||||||||
Cost of sales ($ millions) | $ 307 | $ 287 | 7% | |||||||||
C1 cash costs (per lb)1 | $ 2.46 | $ 2.04 | 21% | |||||||||
C3 fully allocated costs (per lb)1 | $ 3.00 | $ 2.68 | 12% | |||||||||
Summary of Financial Data | ||||||||||||
| For the three months ended March 31 | 2013 | 2012 | % Change | |||||||||
Segment income ($ millions)2 | $ 51 | $ 158 | (68%) | |||||||||
Capital expenditures ($ millions)3 | $ 101 | $ 133 | (24%) | |||||||||
| 1 | C1 cash costs and C3 fully allocated costs are non-GAAP financial performance measures with no standardized definition under IFRS. For further information and a detailed reconciliation, please see page 34 of this MD&A |
| 2 | Segment income excludes income taxes. |
| 3 | Amounts presented represent expenditures for minesite expansion, minesite sustaining as well mine development on an accrual basis excluding capitalized interest. |
Copper production in the first quarter 2013 was 127 million pounds, which was 9% higher than the same prior year period. Production at Lumwana increased by 39% primarily due to the processing of higher grade ore. Production at Zaldívar decreased by 8% due to a delay in copper production from the main leach pad and lower than expected recovery from secondary sulphide ore. Copper sales were negatively impacted in the first quarter 2013 by the labor strike at the port of Antofagasta, which resulted in a shipment of 12 million pounds being delayed. These sales will be recorded in the second quarter 2013.
Segment income for the first quarter 2013 was $51 million, a decrease of 68% over the same prior year period. The decrease was the result of lower realized copper prices combined with higher costs at Lumwana
| BARRICK FIRST QUARTER 2013 | 22 | MANAGEMENT’S DISCUSSION AND ANALYSIS |
and lower copper sales volumes. Capital expenditures decreased by 24%, over the same prior year period, reflecting lower capital expenditures at the new Jabal Sayid mine as the process infrastructure construction is now complete, lower minesite expansion capital expenditures at Lumwana, partially offset by an increase in sustaining capital expenditures at Lumwana and Zaldívar.
In the first quarter 2013, cost of sales increased by 7% over the same prior year period, primarily due to higher costs at Lumwana due to higher direct mining costs and increased government royalties, which doubled to 6% from 3% in Zambia in April 2012. C1 cash costs per pound increased by 21% over the same prior year period primarily due to higher costs at Lumwana and the impact of a change in our sales mix as a result of a higher proportion of sales coming from Lumwana. Consistent with our expected plans, the turnaround team at Lumwana, in conjunction with the management team at site, have identified a variety of specific improvement projects, including a review of all key contracts, which will be implemented during the balance of 2013 and are expected to improve the efficiency of the core mining operation and reduce the cost of production in the second half of 2013. C3 fully allocated costs per pound increased by 12% over the same prior year period, primarily reflecting the adverse effect of the above factors on C1 cash costs.
We continue to expect full year copper production to be in the range of about 480 to 540 million pounds at C1 cash costs in the range of $2.10 to $2.30 per pound and C3 fully allocated costs in the range of $2.60 to $2.85 per pound.
Jabal Sayid
Construction of the processing infrastructure for the Jabal Sayid copper mine in Saudi Arabia was completed in third quarter 2012, but commissioning was delayed when the company received notification from the HCIS ministry that the mine site was not in compliance with the recently introduced safety and security standards. Following receipt of the notification, all explosives were removed from the site and a dedicated EPCM team has been working towards, and making progress towards, achieving full compliance with these standards in a process that is expected to take until 2014 and cost approximately $100 million. During the first quarter, $13 million was spent on the HCIS compliance project. In the meantime, the number of employees at site has been reduced to minimize costs and management is using 2013 to complete a hauling/hoisting optimization study with
the goal of improving LOM cash flow from the mine when it comes into production in 2014.
Once Jabal Sayid comes into production, the average annual copper output in concentrate is expected to be 100 to 130 million pounds at C1 cash costs of $1.50 to $1.70 per pound4 in its first full five years of operation.
Since the Company acquired its interest in the Jabal Sayid project through its acquisition of Equinox Minerals in 2011, the Deputy Ministry for Mineral Resources (DMMR), which oversees the mining license, has questioned whether such change in the indirect ownership of the project, as well as previous changes in ownership, required the prior consent of DMMR. In December 2012, DMMR required the project to cease commissioning of the plant using stockpiled ore, citing alleged noncompliances with the mining investment law and the mining license, and, in January 2013, required related companies to cease exploration activities, citing noncompliance with the law and the exploration licenses related to the ownership changes. The Company does not believe that such consent was required as a matter of law, but has responded to requests of the DMMR, including through the provision of additional guarantees and undertakings, and stated its firm desire to fully resolve the issues raised by DMMR. However, if the Company is unable to satisfactorily progress discussions with DMMR, it will evaluate its alternatives, which could include temporarily further curtailing or suspending activities on site until a resolution is achieved.
| 4 | Does not include escalation for future inflation. |
| BARRICK FIRST QUARTER 2013 | 23 | MANAGEMENT’S DISCUSSION AND ANALYSIS |
FINANCIAL CONDITION REVIEW
Summary Balance Sheet and Key Financial Ratios
| ($ millions, except ratios and share amounts) | As at March 31, 2013 | As at December 31, 2012 | ||||||
Total cash and equivalents | $ 2,342 | $ 2,097 | ||||||
Working capital | 3,263 | 2,884 | ||||||
Non-current assets | 42,791 | 41,721 | ||||||
Other assets | 601 | 776 | ||||||
Total Assets | $ 48,997 | $ 47,478 | ||||||
Non-current liabilities excluding long-term debt | 6,483 | 6,330 | ||||||
Debt | 14,798 | 13,943 | ||||||
Other liabilities | 2,479 | 2,569 | ||||||
Total Liabilities | $ 23,760 | $ 22,842 | ||||||
Total shareholders’ equity | 22,546 | 21,972 | ||||||
Non-controlling interests | 2,691 | 2,664 | ||||||
Total Equity | $ 25,237 | $ 24,636 | ||||||
Dividends | $ 200 | $ 150 | ||||||
Debt | $ 14,798 | $ 13,943 | ||||||
Total common shares outstanding (millions of shares)1 | 1,001 | 1,001 | ||||||
Key Financial Ratios: | ||||||||
Current ratio2 | 1.96:1 | 1.30:1 | ||||||
Debt-to-equity3 | 0.59:1 | 0.57:1 | ||||||
Debt-to-total capitalization4 | 0.46:1 | 0.46:1 | ||||||
Adjusted return on equity5 | 17% | 18% | ||||||
| 1 | Total common shares outstanding do not include 7.9 million stock options. The increase from December 31, 2012 is due to the exercise of stock options. |
| 2 | Represents current assets divided by current liabilities as at March 31, 2013 and December 31, 2012. |
| 3 | Represents debt divided by total shareholders’ equity (including minority interest) as at March 31, 2013 and December 31, 2012. |
| 4 | Represents debt divided by capital stock and long-term debt as at March 31, 2013 and December 31, 2012. |
| 5 | Represents adjusted net earnings divided by average shareholders’ equity as at March 31, 2013 and December 31, 2012. |
Balance Sheet Review
Total assets were $49 billion at March 31, 2013, an increase of $1.5 billion, or 3%, compared to December 31, 2012. The increase primarily reflects increases in property, plant and equipment, due to the impact of the significant capital expenditures related to our projects in construction. Our asset base is primarily comprised of non-current assets such as property, plant and equipment and goodwill, reflecting the capital intensive nature of the mining business and our history of growing through acquisitions. Other significant assets include production inventories and cash and equivalents. We typically do not carry a material accounts receivable balance, since only sales of concentrate and copper cathode have a settlement period.
Total liabilities increased by $1 billion or 4% compared to December 31, 2012, largely due to a net increase in debt of $800 million.
Shareholders’ Equity
| As at April 12, 2013 | Number of shares | |||
Common shares | 1,001,152,326 | |||
Stock options | 7,899,357 | |||
Comprehensive Income
Comprehensive income consists of net income or loss, together with certain other economic gains and losses, which, collectively, are described as “other comprehensive income” or “OCI”, and excluded from the income statement.
For the first quarter 2013, other comprehensive income was a loss of $76 million on an after-tax basis. The loss reflected gains of $33 million on hedge contracts designated for future periods, caused primarily by changes in currency exchange rates, copper prices, and fuel prices, which were offset by: reclassification adjustments totaling $93 million for gains on hedge
| BARRICK FIRST QUARTER 2013 | 24 | MANAGEMENT’S DISCUSSION AND ANALYSIS |
contracts designated for the first quarter 2013 that were transferred to earnings in conjunction with the recognition in expense of the related hedge exposure; $2 million of gains transferred to earnings related to gains recorded on the sale of shares in various investments and losses for impaired investments; $10 million of losses recorded as a result of changes in the fair value of investments held during the year; $21 million in losses for currency translation adjustments, partially offset by and a $17 million gain due to tax recoveries on the overall decrease in OCI.
Included in accumulated other comprehensive income at March 31, 2013 were unrealized pre-tax gains on currency, commodity and interest rate hedge contracts totaling $433 million. The balance primarily relates to currency hedge contracts that are designated against operating costs and capital expenditures, primarily over the next three years including $308 million remaining in crystallized hedge gains related to our Australian dollar contracts that were settled in the third quarter of 2012. These hedge gains/losses are expected to be recorded in earnings at the same time as the corresponding hedged operating costs/depreciation are recorded in earnings.
Financial Position and Liquidity
Our capital structure comprises a mix of debt and shareholders’ equity. As at March 31, 2013, our total debt was $14.8 billion (debt net of cash and equivalents was $12.5 billion) and our debt-to-equity ratio and debt-to-total capitalization ratios were 0.59:1 and 0.46:1, respectively. This compares to debt as at December 31, 2012 of $13.9 billion (debt net of cash and equivalents was $11.8 billion), and debt-to-equity and debt-to-total capitalization ratios of 0.57:1 and 0.46:1, respectively. The majority of our outstanding long-term debt matures at various dates beyond 2013. In March 2013, we drew $2 billion on the 2012 Credit Facility, which matures in 2018. $1.2 billion of the net proceeds from this drawdown were used to repay existing indebtedness under an older credit facility that matures in April 2013, with the balance of the proceeds being used to finance project capital expenditures and to add to our cash position.
At current market gold and copper prices, we expect to generate negative free cash flow in 2013. This is primarily due to expected total capital expenditures of about $5.2 to $5.7 billion, including $2.3 billion at our Pascua-Lama project. We also have approximately $0.6 billion of debt maturing in the remainder of 2013 and dividend payments that will also impact our overall liquidity. Our primary source of liquidity is our operating cash flow. We plan to issue long-term debt securities in the near term to further improve liquidity. Other options to enhance
liquidity include reducing capital expenditures and administration costs, modifying the dividend policy, drawing the remaining $2.0 billion available under our 2012 Credit Facility (subject to compliance with covenants and the making of certain representations and warranties, this facility is available for drawdown as a source of financing), asset sales and securities issuances. The key financial covenant in the 2012 Credit Facility ($2.0 billion outstanding as at March 31, 2013) requires Barrick to maintain a consolidated tangible net worth (“CTNW”) of at least $3.0 billion (Barrick’s CTNW was $12.6 billion as at March 31, 2013). There are no financial covenants related to Barrick’s public bonds (representing approximately 80% of total debt outstanding). Our credit ratings and general market conditions, among other things, impact our ability to access the market for debt securities as well as our cost of borrowing and the terms of such borrowing. Currently, the Company maintains investment grade credit ratings and market conditions to issue debt securities are strong for such issuers.
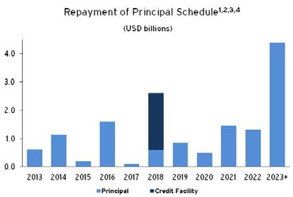
| 1 | There are no financial covenants on public bonds. |
| 2 | There is a financial covenant on the Credit Facility requiring the maintenance of CTNW of $3.0 billion (Barrick’s CTNW was $12.6 billion as at March 31, 2013). $2.0 billion of the $4.0 billion facility is currently drawn. |
| 3 | Credit Ratings on long-term debt are currently investment grade by Moody’s and S&P. In April 2013, Moody’s placed the Company’s long-term debt under review for a possible rating downgrade, noting that should the review result in a downgrade, it is not likely to be more than one notch from Baa1 to Baa2, which remains investment grade. |
| 4 | Principal includes 100% of the Pueblo Viejo financing and 100% of the ABG financing. |
| BARRICK FIRST QUARTER 2013 | 25 | MANAGEMENT’S DISCUSSION AND ANALYSIS |
Cash and equivalents and cash flow
Total cash and cash equivalents as at March 31, 2013 were $2.3 billion5. At quarter end, our cash position consisted of a mix of term deposits, treasury bills and money market investments. Our cash position is primarily denominated in US dollars.
Our primary source of liquidity is operating cash flow. In the first quarter 2013, we generated $1.1 billion in operating cash flow, compared to $1.4 billion of operating cash flow in the first quarter 2012. The decrease in operating cash flow primarily reflects lower net earnings, partially offset by a decrease in income tax payments and positive working capital impacts. The most significant driver of the change in operating cash flow is market gold and copper prices. Future changes in those market prices, either favorable or unfavorable, will continue to have a material impact on our cash flow and liquidity. The table below illustrates the impact of changes in gold and copper prices on our earnings and cash flow on an annualized basis, assuming the mid-point of our expected 2013 production levels.
| Change in price | Annualized approximate impact on adjusted net earnings and operating cash flow | |||||||
Gold | +/-100/oz | +/-$500 million | ||||||
Copper | + $0.50/lb | +$ 180 million | ||||||
Copper | - $0.50/lb1 | -$100 million | ||||||
| 1 | Using copper collars, approximately 50% of our expected 2013 production is hedged at a range of $3.50/lb to $4.25/lb. |
The increase in working capital primarily relates to an increase in inventories and a decrease in accounts payable and other current liabilities. The increase in inventory is related to an increase in ore in stockpiles, principally at Cortez and Ruby Hill, partially offset by a decrease at Goldstrike (refer to the table below for a summary of changes in our working capital balances).
Working Capital
| (in $ millions) | As at March 31, 2013 | As at December 31, 2012 | ||||||
Raw materials | ||||||||
Ore in stockpiles1 | $ 2,101 | $ 1,976 | ||||||
Ore on leach pads | 584 | 590 | ||||||
Mine operating supplies | 1,150 | 1,096 | ||||||
Work in process | 348 | 328 | ||||||
Finished products | 210 | 150 | ||||||
Other current assets | 149 | 125 | ||||||
Accounts receivable | 380 | 449 | ||||||
VAT and fuel tax receivables2 | 820 | 739 | ||||||
| Accounts payable and other current liabilities | (2,479) | (2,569) | ||||||
Working capital | $ 3,263 | $ 2,884 | ||||||
| 1 | Includes long-term stockpiles of $1,584 million (2012: $1,555 million). |
| 2 | Includes long-term VAT and fuel tax receivables of $568 million (2012: $513 million). |
The principal uses of operating cash flow are to fund our capital expenditures, including construction activities at Pascua-Lama and dividend and interest payments.
In the first quarter 2013, cash used in investing activities amounted to $1,489 million, an increase of $53 million compared to the same prior year period, primarily due to an increase in capital expenditures. Capital expenditures, on a cash basis, were $1,430 million in the first quarter 2013, an increase of $15 million or 1% compared to the first quarter 2012. The increase is primarily due to an increase in minesite expansion and minesite sustaining expenditures, partially offset by a decrease in project capital expenditures, primarily due to a decrease in project capital expenditures at Pueblo Viejo, partially offset by increased construction activities at Pascua-Lama. Minesite expansion increased primarily due to higher capital expenditures related to expansion projects at Cortez, Goldstrike and Bulyanhulu. Minesite sustaining capital expenditures were higher at Pueblo Viejo as the mine achieved commercial production in January 2013.
| 5 | Includes $402 million cash held at ABG, which may not be readily deployed outside ABG. |
| BARRICK FIRST QUARTER 2013 | 26 | MANAGEMENT’S DISCUSSION AND ANALYSIS |
Summary of Cash inflow (Outflow)
($ millions)
| For the three months ended March 31 | 2013 | 2012 | ||||||
Operating inflows | $ 1,085 | $ 1,374 | ||||||
Investing activities | ||||||||
Capex - minesite sustaining | $ (306) | $ (269) | ||||||
Capex - mine development | (317) | (321) | ||||||
Capex - minesite expansion1 | (146) | (130) | ||||||
Project capex - initial capital1 | (594) | (694) | ||||||
Project capex - infrastructure1 | (67) | (1) | ||||||
Other | (59) | (21) | ||||||
Total investing outflows | $ (1,489) | $ (1,436) | ||||||
Financing activities | ||||||||
Long-term debt | $ 845 | $ (7) | ||||||
Dividends | (200) | (150) | ||||||
Funding from non-controlling interests | 13 | 140 | ||||||
Other | (7) | (10) | ||||||
Total financing inflows (outflows) | $ 651 | $ (27) | ||||||
Effect of exchange rate | (2) | 8 | ||||||
Change in cash and equivalent | 245 | (81) | ||||||
| 1 | The amounts include capitalized interest of $47 million (2012: $77 million). |
Financing activities in the first quarter 2013 reflect the drawdown on the 2012 Credit Facility of $2 billion, partially offset by debt repayments of $1.2 billion and dividend payments of $200 million, resulting in a net financing cash inflow of $651 million. This compares to a net financing cash outflow in the first quarter 2012 of $27 million, primarily due to dividend payments of $150 million, partially offset by $140 million funding received from non-controlling interest.
Financial Instruments
As of March 31, 2013, we had 24 counterparties to our derivative positions. We proactively manage our exposure to individual counterparties in order to mitigate both credit and liquidity risks. For those counterparties with which we hold a net asset position (total balance attributable to the counterparties is $325 million), three hold greater than 10% of our mark-to-market asset position, with the largest counterparty holding 24%. We have two counterparties with which we are in a net liability position, for a total net liability of $2 million. On an ongoing basis, we monitor our exposures and ensure that none of the counterparties with which we hold outstanding contracts has declared insolvency.
Summary of Financial Instruments
As at March 31, 2013
| Financial Instrument | Principal/Notional Amount | Associated Risks | ||||||||||||||
| — | Interest rate | |||||||||||||||
Cash and equivalents | $ 2,342 | million | — | Credit | ||||||||||||
| — | Credit | |||||||||||||||
Accounts receivable | $ 380 | million | — | Market | ||||||||||||
| — | Market | |||||||||||||||
Available-for-sale securities | $ 50 | million | — | Liquidity | ||||||||||||
Accounts payable | $ 2,202 | million | — | Interest rate | ||||||||||||
Debt | $ 14,914 | million | — | Interest rate | ||||||||||||
Restricted share units | $ 50 | million | — | Market | ||||||||||||
Deferred share units | $ 6 | million | — | Market | ||||||||||||
Derivative instruments - currency contracts | CAD | 564 | million | — | Credit | |||||||||||
| CLP | 632,147 | million | — | Market/liquidity | ||||||||||||
| AUD | 1,840 | million | — | Interest rate | ||||||||||||
| PGK | 40 | million | ||||||||||||||
| ZAR | 1,274 | million | ||||||||||||||
Derivative instruments - silver contracts | 65 | million oz | — | Market/liquidity | ||||||||||||
Derivative instruments - copper contracts | 220 | million lbs | — | Credit | ||||||||||||
| — | Interest rate | |||||||||||||||
Derivative instruments - energy contracts | Diesel | 5 | million bbls | — | Market/liquidity | |||||||||||
| — | Credit | |||||||||||||||
| — | Interest rate | |||||||||||||||
Derivative instruments - interest rate contracts | Receive fixed interest rate swaps | $ 200 | million | — | Market/liquidity | |||||||||||
| BARRICK FIRST QUARTER 2013 | 27 | MANAGEMENT’S DISCUSSION AND ANALYSIS |
Commitments and Contingencies
Capital Expenditures Not Yet Committed
We expect to incur capital expenditures during the next five years for both projects and producing mines. The projects are at various stages of development, from preliminary exploration or scoping study stage through to the construction execution stage. The ultimate decision to incur capital expenditures at each potential site is subject to positive results which allow the project to advance past decision hurdles. Two projects were at
an advanced stage at March 31, 2013, Pascua-Lama and Jabal Sayid ( Please refer to pages 11-12 and page 23 for further details.)
Contractual Obligations and Commitments
Payments due As at March 31, 2013 | ||||||||||||||||||||||||||||
| ($ millions) | 20131 | 2014 | 2015 | 2016 | 2017 | 2018 and thereafter | Total | |||||||||||||||||||||
Debt2 | ||||||||||||||||||||||||||||
Repayment of principal | $ 610 | $ 1,140 | $ 195 | $ 1,600 | $ 100 | $ 11,076 | $ 14,721 | |||||||||||||||||||||
Capital leases | 34 | 40 | 35 | 28 | 24 | 32 | 193 | |||||||||||||||||||||
Interest | 583 | 616 | 596 | 572 | 535 | 5,972 | 8,874 | |||||||||||||||||||||
Provisions for environmental rehabilitation3 | 74 | 143 | 118 | 75 | 80 | 2,175 | 2,665 | |||||||||||||||||||||
Operating leases | 36 | 26 | 24 | 18 | 20 | 55 | 179 | |||||||||||||||||||||
Restricted share units | 24 | 22 | 4 | - | - | - | 50 | |||||||||||||||||||||
Pension benefits and other post-retirement benefits | 24 | 23 | 22 | 22 | 22 | 104 | 217 | |||||||||||||||||||||
Derivative liabilities4 | 10 | 7 | 3 | 1 | 1 | - | 22 | |||||||||||||||||||||
Purchase obligations for supplies and consumables5 | 600 | 302 | 212 | 88 | 87 | 263 | 1,552 | |||||||||||||||||||||
Capital commitments6 | 1,473 | 402 | 12 | - | - | - | 1,887 | |||||||||||||||||||||
Social development costs | 66 | 27 | 26 | 24 | 7 | 62 | 212 | |||||||||||||||||||||
Total | $ 3,534 | $ 2,748 | $ 1,247 | $ 2,428 | $ 876 | $ 19,739 | $ 30,572 | |||||||||||||||||||||
| 1 | Represent the obligations and commitments for the remainder of the year. |
| 2 | Debt and Interest - Our debt obligations do not include any subjective acceleration clauses or other clauses that enable the holder of the debt to call for early repayment, except in the event that we breach any of the terms and conditions of the debt or for other customary events of default. The debt and interest amounts include 100% of the Pueblo Viejo financing, even though we have only guaranteed our 60% share. We are not required to post any collateral under any debt obligations. Projected interest payments on variable rate debt were based on interest rates in effect at March 31, 2013. Interest is calculated on our long-term debt obligations using both fixed and variable rates. |
| 3 | Provisions for Environmental Rehabilitation - Amounts presented in the table represent the undiscounted future payments for the expected cost of provisions for environmental rehabilitation. |
| 4 | Derivative Liabilities - Amounts presented in the table relate to derivative contracts disclosed under note 16 to the consolidated interim financial statements. Payments related to derivative contracts cannot be reasonably estimated given variable market conditions. |
| 5 | Purchase Obligations for Supplies and Consumables - Includes commitments related to new purchase obligations to secure a supply of acid, tires and cyanide for our production process. |
| 6 | Capital Commitments - Purchase obligations for capital expenditures include only those items where binding commitments have been entered into. Commitments at March 31, 2013 mainly relate to construction capital at Pascua-Lama. |
Litigation and Claims
We are currently subject to various litigation as disclosed in note 20 to the consolidated interim financial statements, and we may be involved in disputes with other parties in the future that may result in litigation. If
we are unable to resolve these disputes favorably, it may have a material adverse impact on our financial condition, cash flow and results of operations.
| BARRICK FIRST QUARTER 2013 | 28 | MANAGEMENT’S DISCUSSION AND ANALYSIS |
REVIEW OF QUARTERLY RESULTS
Quarterly Information
| 2013 | 2012 | 20111 | ||||||||||||||||||||||||||||||
| ($ millions, except where indicated) | Q1 | Q4 | Q3 | Q2 | Q1 | Q4 | Q3 | Q2 | ||||||||||||||||||||||||
Revenues | $ 3,437 | $ 4,189 | $ 3,436 | $ 3,278 | $ 3,644 | $ 3,761 | $ 3,971 | $ 3,416 | ||||||||||||||||||||||||
Realized price - gold2 | 1,629 | 1,714 | 1,655 | 1,608 | 1,691 | 1,664 | 1,743 | 1,513 | ||||||||||||||||||||||||
Realized price - copper2 | 3.56 | 3.54 | 3.52 | 3.45 | 3.78 | 3.69 | 3.54 | 4.07 | ||||||||||||||||||||||||
Cost of sales | 1,844 | 2,125 | 1,775 | 1,769 | 1,753 | 1,705 | 1,694 | 1,486 | ||||||||||||||||||||||||
Net earnings/(losses)3 | 847 | (3,013) | 649 | 787 | 1,039 | 959 | 1,365 | 1,159 | ||||||||||||||||||||||||
Per share (dollars)3,4 | 0.85 | (3.01) | 0.65 | 0.79 | 1.04 | 0.96 | 1.37 | 1.16 | ||||||||||||||||||||||||
Adjusted net earnings3,5 | 923 | 1,174 | 880 | 821 | 1,096 | 1,166 | 1,379 | 1,117 | ||||||||||||||||||||||||
Per share (dollars)3,4,5 | 0.92 | 1.18 | 0.88 | 0.82 | 1.10 | 1.17 | 1.38 | 1.12 | ||||||||||||||||||||||||
Operating cash flow | 1,085 | 1,832 | 1,847 | 909 | 1,374 | 1,224 | 1,902 | 750 | ||||||||||||||||||||||||
Adjusted operating cash flow5 | $ 1,158 | $ 1,912 | $ 1,382 | $ 909 | $ 1,476 | $ 1,299 | $ 2,004 | $ 938 | ||||||||||||||||||||||||
| 1 | 2011 information has not been restated to reflect IFRIC 20Stripping Costs in the Production Phase of a Surface Mine. |
| 2 | Per ounce/pound weighted average. Realized price is a non-GAAP financial performance measure with no standard meaning under IFRS. For further information and a detailed reconciliation, please see page 34 of this MD&A. |
| 3 | Sum of all the quarters may not add up to the yearly total due to rounding. |
| 4 | Calculated using weighted average number of shares outstanding under the basic method of earnings per share. |
| 5 | Adjusted net earnings, adjusted EPS and adjusted operating cash flow are non-GAAP financial performance measures with no standard meaning under IFRS. For further information and a detailed reconciliation, please see page 32 of this MD&A. |
Our financial results for the past several quarters reflect a trend of spot gold prices that have fluctuated around historically high levels and increasing gold and copper production costs, mainly caused by inflationary pressures. This has translated into fluctuating net earnings and adjusted operating cash flow levels
depending on the gold and copper realized prices and production levels each quarter. The net loss in fourth quarter 2012 reflected impairment charges at Lumwana and goodwill related to our global copper unit totaling $3.8 billion (net of tax effects).
IFRS CRITICAL ACCOUNTING POLICIES AND ACCOUNTING ESTIMATES
Management has discussed the development and selection of our critical accounting estimates with the Audit Committee of the Board of Directors, and the Audit Committee has reviewed the disclosure relating to such estimates in conjunction with its review of this MD&A. The accounting policies and methods we utilize determine how we report our financial condition and results of operations, and they may require management to make estimates or rely on assumptions about matters that are inherently uncertain. Our significant accounting policies are disclosed in note 2 of our most recent annual consolidated financial statements. A summary of future accounting policy changes is disclosed in note 2 of the accompanying interim consolidated financial statements. A summary of current accounting policy changes is disclosed in note 2(b) of the accompanying interim consolidated financial statements.
Internal Control over Financial Reporting and Disclosure Controls and Procedures
Management is responsible for establishing and maintaining adequate internal control over financial reporting and disclosure controls and procedures as defined in our 2012 annual MD&A.
Together, internal control over financial reporting and disclosure controls and procedures frameworks provide internal control over financial reporting and disclosure. Due to its inherent limitations, internal control over financial reporting and disclosure may not prevent or detect all fraud or misstatements. Further, the effectiveness of internal control over financial reporting and disclosure is subject to the risk that controls may become inadequate because of changes in conditions, or that the degree of compliance with policies or procedures may change.
| BARRICK FIRST QUARTER 2013 | 29 | MANAGEMENT’S DISCUSSION AND ANALYSIS |
Management will continue to monitor the effectiveness of its internal control over financial reporting and disclosure and may make modifications from time to time as considered necessary or desirable.
Critical Accounting Estimates and Judgments
Certain accounting estimates have been identified as being “critical” to the presentation of our financial condition and results of operations because they require us to make subjective and/or complex judgments about matters that are inherently uncertain; or there is a reasonable likelihood that materially different amounts could be reported under different conditions or using different assumptions and estimates. Our significant accounting judgments, estimates and assumptions are disclosed in note 3 of the Annual Consolidated Financial Statements and an update is provided in note 3 of the accompanying interim financial statements.
Accounting for impairment of non-current assets
Non-current assets are tested for impairment when events or changes in circumstances suggest that the carrying amount may not be fully recoverable. We conduct an annual test for impairment of goodwill in the fourth quarter of each fiscal year and at any other time of the year if an indicator of impairment is identified. In first quarter 2013, we identified two indicators of potential impairment.
As at March 31, 2013, the carrying value of ABG exceeded its market capitalization, which is an indicator of potential impairment of the carrying value of our ABG operating segment. We assessed the recoverable amount of the ABG operating segment, including goodwill, and determined that the Value in Use is greater than the carrying value and therefore no impairment was recorded.
On April 9, 2013, the Copiapó Court of Appeals in Chile granted a request for a preliminary injunction to suspend construction activities on the Chilean side of the project pending a hearing on a constitutional rights action filed in September of 2012. The action alleges noncompliance with the environmental requirements of the project’s Chilean environmental approval. Upon confirming the court order, Barrick took immediate steps to suspend construction activities in Chile, which includes work on the primary crusher and the Chilean side of the tunnel that conveys ore from Chile to Argentina. Activities determined to be necessary for environmental protection are expected to continue, upon appropriate authorization as contemplated by the Court. Construction in Argentina, where the majority of Pascua-Lama’s critical infrastructure is located, including the process plant and tailings storage facility, has not been affected. Until we
have clarity on the regulatory and legal aspects, we are unable to fully assess the impact on the capital budget, operating costs and schedule of the project. The company is at an early stage of evaluating an alternative development plan that involves accelerating the development of another smaller pit in Argentina in order to provide a source of ore for initial production. This alternative could provide ore for about six months of production during commissioning and ramp up, following which the mine plan would be dependent on a continuous supply of Chilean ore. Therefore, if resumption of construction activities in Chile, including the pre-stripping, is delayed beyond late 2013, or if such development alternative is determined not to be feasible, there could be a significant change to the mine plan and an impact on the capital cost and production schedule of the project. The company will continue to evaluate all alternatives, in light of the uncertainties associated with the legal and regulatory actions, and the current environment, including the possibility of suspending the project. We identified the granting of the injunction as an indicator of potential impairment. Based on the information available to us, and having assessed the recoverable amount of the project, we concluded that the carrying value of the project was not impaired as at March 31, 2013. To the extent there are significant changes to any of the above metrics, the current carrying amount of the project may not be recoverable, which would result in an impairment charge being recorded for the project.
Subsequent to quarter end, market prices of gold, silver and copper declined significantly and were below levels used in our most recent annual impairment test. If metal prices remain at these levels for an extended period of time, we may need to reassess our long-term price assumptions, and a significant decrease in our long-term price assumptions would be an indicator of potential impairment. Also subsequent to quarter end, the trading price of the company’s shares declined such that the Company’s carrying value of net assets (of approximately $23/share) exceeded its market capitalization, which is also an indicator of potential impairment. If these potential indicators of impairment exist at the end of our next reporting period, we will be required to conduct an impairment assessment.
Based on the results of our last annual test in fourth quarter 2012, and the events identified above, the carrying value of the CGUs that are most sensitive to changes in the key assumptions used in the annual test are:
| BARRICK FIRST QUARTER 2013 | 30 | MANAGEMENT’S DISCUSSION AND ANALYSIS |
| As at March 31, 2013 | Carrying Value | |||
Pascua-Lama | $ 5,9981 | |||
Jabal Sayid | 1,394 | |||
Lumwana | 873 | |||
Buzwagi | 765 | |||
Barrick Energy CGUs | 622 | |||
Kanowna | 162 | |||
Pierina | 147 | |||
Darlot | 80 | |||
| 1 | As noted in our year-end release, the fair value of the Pascua-Lama project exceeded its carrying value by about $1.5 billion. We also noted that a decrease of about 7% in long-term gold prices (from $1,700/oz), a decrease of about 12% in silver prices (from $32/oz), an increase of about 10% in operating costs or an increase of about 15% in the total LOM capital expenditures would, in isolation, cause the estimated recoverable amount to be equal to the carrying value. |
In addition to the above mentioned CGUs, the goodwill of our Australia Pacific and ABG gold segments, our Capital
Projects segment and our Copper segment are also sensitive to changes in the key metal price assumptions used in the annual test. Please refer to note 15 of the accompanying interim consolidated financial statements for the current goodwill balances attributable to these segments.
NON-GAAP FINANCIAL PERFORMANCE MEASURES6
We use certain non-GAAP financial performance measures in our MD&A. For a detailed description of each of the non-GAAP measures used in this MD&A, please refer to the Non-GAAP Financial Performance Measures in our 2012 annual MD&A. The non-GAAP financial performance measures set out in this MD&A are intended to provide additional information to investors and do not have any standardized definition under IFRS and should not be considered in isolation or as a substitute for measures of performance prepared in accordance with IFRS.
Beginning in 2013, we adopted an “all-in sustaining costs per ounce” measure. The Company believes that current operating measures commonly used in the gold industry do not capture all of the sustaining expenditures incurred in order to produce gold, and therefore they do not present a complete picture of a company’s operating performance or its ability to generate free cash flow from its current operations. Similarly, they do not reflect all of the expenditures that would be included in the valuation of a gold mining company. For these reasons, the Company is working with the members of the World Gold Council (“WGC”) to define an all-in sustaining costs measure that better represents the total costs associated with producing gold. We believe this measure will better meet the needs of analysts, investors and other stakeholders of the Company in assessing its operating performance, its ability to generate free cash flow from current operations and its overall value.
The WGC project to define all-in sustaining costs is ongoing and a final standard is expected in the middle of 2013. We expect to conform our disclosure of all-in sustaining costs to the measure that is ultimately approved by the WGC. Our current definition of all-in sustaining costs commences with total cash costs and then adds sustaining capital expenditures, corporate general and administrative costs, mine site exploration and evaluation costs and environmental rehabilitation costs. This measure seeks to represent the total costs of producing gold from current operations, and therefore it does not include capital expenditures attributable to projects or mine expansions, exploration and evaluation costs attributable to growth projects, income tax payments, interest costs or dividend payments. Consequently, this measure is not representative of all of the Company’s cash expenditures. In addition, our calculation of all-in sustaining costs does not include depreciation expense as it does not reflect the impact of expenditures incurred in prior periods. Therefore, it is not indicative of the Company’s overall profitability.
| 6 | The amounts presented in the non-GAAP financial performance measure tables include the results of discontinued operations. |
| BARRICK FIRST QUARTER 2013 | 31 | MANAGEMENT’S DISCUSSION AND ANALYSIS |
Adjusted Net Earnings (Adjusted Net Earnings per Share), Return on Equity
Reconciliation of Net Earnings to Adjusted Net Earnings and Adjusted Return on Equity1
| ($ millions, except per share amounts in dollars) | ||||||||
| For the three months ended March 31 | 2013 | 2012 | ||||||
Net earnings/attributable to equity holders of the Company | $ 847 | $ 1,039 | ||||||
Impairment charges related to intangibles, property, plant and equipment, and investments | 5 | 93 | ||||||
Acquisition/disposition adjustments | (5) | (8) | ||||||
Foreign currency translation (gains)/losses | 63 | (5) | ||||||
Acquisition related costs | - | (1) | ||||||
Non-recurring other expenses | 30 | 1 | ||||||
Unrealized (gains)/losses on non-hedge derivative instruments | (17) | (23) | ||||||
Adjusted net earnings | $ 923 | $ 1,096 | ||||||
Net earnings per share2 | 0.85 | 1.04 | ||||||
Adjusted net earnings per share2 | 0.92 | 1.10 | ||||||
Average shareholders’ equity | $ 22,259 | $ 23,767 | ||||||
Adjusted return on equity3 | 17% | 18% | ||||||
| 1 | Amounts presented in this table are after-tax. |
| 2 | Calculated using weighted average number of shares outstanding under the basic method of earnings per share. |
| 3 | Calculated as annualized adjusted net earnings divided by average shareholders’ equity. |
Adjusted Operating Cash Flow and Free Cash Flow
Reconciliation of Operating Cash Flow to Adjusted Operating Cash Flow and Free Cash Flow
| ($ millions) | ||||||||
| For the three months ended March 31 | 2013 | 2012 | ||||||
Operating cash flow | $ 1,085 | $ 1,374 | ||||||
Settlement of currency contracts | 73 | - | ||||||
Settlement of contingent consideration | - | 50 | ||||||
Non-recurring tax payments | - | 52 | ||||||
Adjusted operating cash flow | $ 1,158 | $ 1,476 | ||||||
Capital expenditures | (1,430) | (1,415) | ||||||
Free cash flow | $ (272) | $ 61 | ||||||
| BARRICK FIRST QUARTER 2013 | 32 | MANAGEMENT’S DISCUSSION AND ANALYSIS |
Total Cash Costs per ounce, All-In Sustaining Costs per ounce, C1 Cash Costs per pound and C3 Fully Allocated Costs per pound
Reconciliation of Cost of Sales to Total Cash Costs per ounce
Gold
| ($ millions, except per ounce information in dollars) | ||||||||
| For the three months ended March 31 | 2013 | 2012 | ||||||
Cost of sales | $ 1,507 | $ 1,437 | ||||||
Cost of sales applicable to non-controlling interests1 | (75) | (48) | ||||||
Cost of sales applicable to ore purchase arrangement | (27) | (46) | ||||||
Other metal sales | (55) | (34) | ||||||
Realized non-hedge gains/losses on fuel hedges | (6) | 3 | ||||||
Treatment and refinement charges | 1 | 1 | ||||||
Total production costs | $ 1,345 | $ 1,313 | ||||||
Depreciation | ($ 342) | ($ 326) | ||||||
Impact of Barrick Energy | (24) | (25) | ||||||
Total cash costs | $ 979 | $ 962 | ||||||
Ounces sold - consolidated basis (000s ounces) | 1,814 | 1,826 | ||||||
Ounces sold - non-controlling interest (000s ounces)1 | (67) | (43) | ||||||
Ounces sold - equity basis (000s ounces) | 1,747 | 1,783 | ||||||
Total production costs per ounce2 | $ 770 | $ 737 | ||||||
Total cash costs per ounce2 | $ 561 | $ 540 | ||||||
| 1 | Relates to interest in ABG held by outside shareholders. |
| 2 | Total cash costs per ounce may not calculate based on amounts presented in this table due to rounding. |
Reconciliation of Total Cash Cost of Sales to All-In Sustaining Costs per ounce
| ($ millions, except per ounce information in dollars) | ||||||||
| For the three months ended March 31 | 2013 | 2012 | ||||||
Total cash cost of sales | $ 979 | $ 962 | ||||||
General & administrative costs | 76 | 92 | ||||||
Rehabilitation - accretion and amortization | 45 | 38 | ||||||
Mine on-site exploration and evaluation costs | 19 | 22 | ||||||
Mine development expenditures2 | 272 | 282 | ||||||
Sustaining capital expenditures2 | 213 | 224 | ||||||
All-in sustaining costs | $ 1,604 | $ 1,620 | ||||||
Ounces sold - consolidated basis (000s ounces) | 1,814 | 1,826 | ||||||
Ounces sold - non-controlling interest (000s ounces)1 | (67) | (43) | ||||||
Ounces sold - equity basis (000s ounces) | 1,747 | 1,783 | ||||||
All-in sustaining costs per ounce3 | $ 919 | $ 909 | ||||||
| 1 | Relates to interest in ABG held by outside shareholders. |
| 2 | Amounts represent our share of capital expenditures. |
| 3 | All-in sustaining costs per ounce may not calculate based on amounts presented in this table due to rounding. |
| BARRICK FIRST QUARTER 2013 | 33 | MANAGEMENT’S DISCUSSION AND ANALYSIS |
Reconciliation of Cost of Sales to C1 Cash Costs per pound
Copper
| ($ millions, except per pound information in dollars) | ||||||||
| For the three months ended March 31 | 2013 | 2012 | ||||||
Cost of sales | $ 307 | $ 287 | ||||||
Depreciation/amortization | (40) | (53) | ||||||
Treatment and refinement charges | 29 | 23 | ||||||
Less: royalties | (12) | (4) | ||||||
Less: non-routine charges | (1) | (12) | ||||||
Other metal sales | - | (1) | ||||||
C1 cash cost of sales | $ 283 | $ 240 | ||||||
Depreciation/amortization | 40 | 53 | ||||||
Royalties | 12 | 4 | ||||||
Non-routine charges | 1 | 12 | ||||||
Administration costs | 6 | 3 | ||||||
Other expense (income) | 3 | 5 | ||||||
C3 fully allocated cost of sales | $ 345 | $ 317 | ||||||
Pounds sold - consolidated basis (millions pounds) | 115 | 119 | ||||||
C1 cash cost per pound1 | $ 2.46 | $ 2.04 | ||||||
C3 fully allocated cost per pound1 | $ 3.00 | $ 2.68 | ||||||
| 1 | C1 cash costs per pound and C3 fully allocated costs per pound may not calculate based on amounts presented in this table due to rounding. |
Realized Prices
Reconciliation of Sales to Realized Price per ounce/per pound1
| ($ millions, except per ounce/pound information in dollars) | Gold | Copper | ||||||||||||||
| For the three months ended March 31 | 2013 | 2012 | 2013 | 2012 | ||||||||||||
Sales | $ 2,962 | $ 3,122 | $ 383 | $ 445 | ||||||||||||
Sales applicable to non-controlling interests | (108) | (73) | - | - | ||||||||||||
Sales attributable to ore purchase agreement | (27) | (49) | - | - | ||||||||||||
Realized non-hedge gold/copper derivative (losses) gains | 1 | (2) | (3) | (19) | ||||||||||||
Treatment and refinement charges | 1 | 1 | 29 | 23 | ||||||||||||
Export duties | 17 | 17 | - | - | ||||||||||||
Revenues - as adjusted | $ 2,846 | $ 3,016 | $ 409 | $ 449 | ||||||||||||
Ounces/pounds sold (000s ounces/millions pounds) | 1,747 | 1,783 | 115 | 119 | ||||||||||||
Realized gold/copper price per ounce/pound1 | $ 1,629 | $ 1,691 | $ 3.56 | $ 3.78 | ||||||||||||
| 1 | Realized price per ounce/pound may not calculate based on amounts presented in this table due to rounding. |
| BARRICK FIRST QUARTER 2013 | 34 | MANAGEMENT’S DISCUSSION AND ANALYSIS |
Consolidated Statements of Income
Barrick Gold Corporation (in millions of United States dollars, except per share data) (Unaudited) | Three months ended March 31, | |||||||
| ||||||||
| 2013 | 2012 | |||||||
| (restated - note 2B) | ||||||||
| ||||||||
Revenue(notes 4 and 5) | $ | 3,437 | $ | 3,644 | ||||
Costs and expenses (income) | ||||||||
Cost of sales (notes 4 and 6) | 1,844 | 1,753 | ||||||
Corporate administration | 45 | 48 | ||||||
Exploration and evaluation (note 7) | 54 | 73 | ||||||
Other expense (note 9A) | 166 | 117 | ||||||
Impairment charges (note 9B) | 5 | 94 | ||||||
Other income (note 9C) | (21) | (41) | ||||||
Loss from equity investees | - | 4 | ||||||
(Gain) on non-hedge derivatives (note 16D) | (42) | (34) | ||||||
Income before finance items and income taxes | 1,386 | 1,630 | ||||||
Finance items | ||||||||
Finance income | 3 | 3 | ||||||
Finance costs (note 10) | (108) | (48) | ||||||
Income before income taxes | 1,281 | 1,585 | ||||||
Income tax expense (note 11) | (420) | (535) | ||||||
Net income | $ | 861 | $ | 1,050 | ||||
Attributable to: | ||||||||
Equity holders of BarrickGold Corporation | $ | 847 | $ | 1,039 | ||||
Non-controlling interests (note 19) | $ | 14 | $ | 11 | ||||
Earnings per share data attributable to the equity holders of Barrick Gold Corporation (note 8) |
| |||||||
Net income | ||||||||
Basic | $ | 0.85 | $ | 1.04 | ||||
Diluted | $ | 0.85 | $ | 1.04 | ||||
The accompanying notes are an integral part of these consolidated financial statements.
| BARRICK FIRST QUARTER 2013 | 35 | FINANCIAL STATEMENTS (UNAUDITED) |
Consolidated Statements of Comprehensive Income
Barrick Gold Corporation
(in millions of United States dollars) (Unaudited) | Three months ended
March 31, | |||||||
| ||||||||
| 2013 | 2012 | |||||||
| (restated - | ||||||||
| note 2B) | ||||||||
| ||||||||
Net income | $ | 861 | $ | 1,050 | ||||
Other comprehensive income (loss), net of taxes | ||||||||
Items that may be reclassified subsequently to profit or loss: | ||||||||
Unrealized gains (losses) on available-for-sale (“AFS”) financial securities, net of tax $2, $nil | (8) | 2 | ||||||
Realized (gains) losses and impairments on AFS financial securities, net of tax $nil, $nil | (2) | - | ||||||
Unrealized gains (losses) on derivatives designated as cash flow hedges, net of tax $3, $2 | 30 | (15) | ||||||
Realized (gains) on derivatives designated as cash flow hedges, net of tax $18, $29 | (75) | (80) | ||||||
Currency translation adjustments, net of tax $nil, $nil
|
| (21)
|
|
| 14
|
| ||
| ||||||||
Total other comprehensive loss | (76) | (79) | ||||||
| ||||||||
Total comprehensive income | $ | 785 | $ | 971 | ||||
| ||||||||
Attributable to: | ||||||||
Equity holders of Barrick Gold Corporation | $ | 771 | $ | 960 | ||||
Non-controlling interests | $ | 14 | $ | 11 | ||||
| ||||||||
The accompanying notes are an integral part of these consolidated financial statements.
| BARRICK FIRST QUARTER 2013 | 36 | FINANCIAL STATEMENTS (UNAUDITED) |
Consolidated Statements of Cash Flow
Barrick Gold Corporation
(in millions of United States dollars) (Unaudited) | Three months ended
March 31, | |||||||
| 2013 | 2012 (restated - note 2B) | |||||||
OPERATING ACTIVITIES | ||||||||
Net income | $ | 861 | $ | 1,050 | ||||
Adjusted for the following items: | ||||||||
Depreciation | 415 | 399 | ||||||
Finance costs (excludes accretion) | 91 | 35 | ||||||
Impairment charges (note 9B) | 5 | 94 | ||||||
Income tax expense (note 11) | 420 | 535 | ||||||
Increase in inventory | (171 | ) | (82 | ) | ||||
(Gain) on non-hedge derivatives | (42 | ) | (34 | ) | ||||
(Gain) on sale of long-lived assets/investments | (8 | ) | (10 | ) | ||||
Other operating activities (note 12A) | (119 | ) | (231 | ) | ||||
Operating cash flows before interest and income taxes | 1,452 | 1,756 | ||||||
Interest paid | (47 | ) | (21 | ) | ||||
Income taxes paid | (320 | ) | (361 | ) | ||||
Net cash provided by operating activities | 1,085 | 1,374 | ||||||
INVESTING ACTIVITIES | ||||||||
Property, plant and equipment | ||||||||
Capital expenditures (note 4) | (1,430 | ) | (1,415 | ) | ||||
Sales proceeds | 2 | - | ||||||
Investments | ||||||||
Sales | 18 | 37 | ||||||
Other investing activities (note 12B) | (79 | ) | (58 | ) | ||||
Net cash used in investing activities | (1,489 | ) | (1,436 | ) | ||||
FINANCING ACTIVITIES | ||||||||
Proceeds on exercise of stock options | 1 | 4 | ||||||
Long-term debt | ||||||||
Proceeds | 2,050 | - | ||||||
Repayments | (1,205 | ) | (7 | ) | ||||
Dividends | (200 | ) | (150 | ) | ||||
Funding from non-controlling interests | 13 | 140 | ||||||
Other financing activities (note 12C) | (8 | ) | (14 | ) | ||||
Net cash provided by (used in) financing activities | 651 | (27 | ) | |||||
Effect of exchange rate changes on cash and equivalents | (2 | ) | 8 | |||||
Net increase (decrease) in cash and equivalents | 245 | (81 | ) | |||||
Cash and equivalents at beginning of period(note 16A) | 2,097 | 2,749 | ||||||
Cash and equivalents at end of period(note 16A) | $ | 2,342 | $ | 2,668 | ||||
The accompanying notes are an integral part of these consolidated financial statements.
| BARRICK FIRST QUARTER 2013 | 37 | FINANCIAL STATEMENTS (UNAUDITED) |
Consolidated Balance Sheets
Barrick Gold Corporation
(in millions of United States dollars) (Unaudited) | As at March 31, | As at December 31, | As at January 1, | |||||||||||
| 2013 | 2012 (restated - note 2B) | 2012 (restated - note 2B) | ||||||||||||
ASSETS | ||||||||||||||
Current assets | ||||||||||||||
Cash and equivalents (note 16A) | $ | 2,342 | $ | 2,097 | $ | 2,749 | ||||||||
Accounts receivable | 380 | 449 | 426 | |||||||||||
Inventories (note 13) | 2,809 | 2,585 | 2,498 | |||||||||||
Other current assets | 675 | 626 | 876 | |||||||||||
Total current assets | 6,206 | 5,757 | 6,549 | |||||||||||
Non-current assets | ||||||||||||||
Equity in investees | 20 | 20 | 341 | |||||||||||
Other investments | 50 | 78 | 161 | |||||||||||
Property, plant and equipment (note 14) | 30,172 | 29,277 | 29,076 | |||||||||||
Goodwill (note 15) | 8,835 | 8,837 | 9,626 | |||||||||||
Intangible assets | 453 | 453 | 569 | |||||||||||
Deferred income tax assets | 488 | 437 | 409 | |||||||||||
Non-current portion of inventory (note 13) | 1,584 | 1,555 | 1,153 | |||||||||||
Other assets | 1,189 | 1,064 | 1,002 | |||||||||||
Total assets | $ | 48,997 | $ | 47,478 | $ | 48,886 | ||||||||
LIABILITIES AND EQUITY | ||||||||||||||
Current liabilities | ||||||||||||||
Accounts payable | $ | 2,202 | $ | 2,267 | $ | 2,085 | ||||||||
Debt (note 16B) | 694 | 1,848 | 196 | |||||||||||
Current income tax liabilities | 37 | 41 | 306 | |||||||||||
Other current liabilities | 240 | 261 | 326 | |||||||||||
Total current liabilities | 3,173 | 4,417 | 2,913 | |||||||||||
Non-current liabilities | ||||||||||||||
Debt (note 16B) | 14,104 | 12,095 | 13,173 | |||||||||||
Provisions | 2,765 | 2,812 | 2,326 | |||||||||||
Deferred income tax liabilities | 2,873 | 2,668 | 4,231 | |||||||||||
Other liabilities | 845 | 850 | 689 | |||||||||||
Total liabilities | 23,760 | 22,842 | 23,332 | |||||||||||
Equity | ||||||||||||||
Capital stock (note 18) | 17,929 | 17,926 | 17,892 | |||||||||||
Retained earnings | 3,916 | 3,269 | 4,562 | |||||||||||
Accumulated other comprehensive | 387 | 463 | 595 | |||||||||||
Other | 314 | 314 | 314 | |||||||||||
Total equity attributable to Barrick Gold Corporation shareholders | 22,546 | 21,972 | 23,363 | |||||||||||
Non-controlling interests (note 19) | 2,691 | 2,664 | 2,191 | |||||||||||
Total equity | 25,237 | 24,636 | 25,554 | |||||||||||
Contingencies and commitments (notes 13, 14 and 20) | ||||||||||||||
Total liabilities and equity | $ | 48,997 | $ | 47,478 | $ | 48,886 | ||||||||
The accompanying notes are an integral part of these consolidated financial statements.
| BARRICK FIRST QUARTER 2013 | 38 | FINANCIAL STATEMENTS (UNAUDITED) |
.Consolidated Statements of Changes in Equity
| Barrick Gold Corporation | Attributable to equity holders of the company | |||||||||||||||||||||||||||||||
| (in millions of United States dollars) (Unaudited) | Common Shares (in thousands) | Capital stock | Retained earnings | Accumulated other comprehensive income1 | Other2 | Total equity shareholders | Non-controlling interests | Total equity | ||||||||||||||||||||||||
At January 1, 2013 (restated - note 2B) | 1,001,108 | $ | 17,926 | $ | 3,269 | $ | 463 | $ | 314 | $ | 21,972 | $ | 2,664 | $ | 24,636 | |||||||||||||||||
Net income | - | - | 847 | - | - | 847 | 14 | 861 | ||||||||||||||||||||||||
Total other comprehensive income (loss) | - | - | - | (76) | - | (76) | - | (76) | ||||||||||||||||||||||||
Total comprehensive income | - | - | 847 | (76) | - | 771 | 14 | 785 | ||||||||||||||||||||||||
Transactions with owners | ||||||||||||||||||||||||||||||||
Dividends | - | - | (200) | - | - | (200) | - | (200) | ||||||||||||||||||||||||
Issued on exercise of stock options | 44 | 1 | - | - | - | 1 | - | 1 | ||||||||||||||||||||||||
Recognition of stock option expense | - | 2 | - | - | - | 2 | - | 2 | ||||||||||||||||||||||||
Funding from non-controlling interests | - | - | - | - | - | - | 13 | 13 | ||||||||||||||||||||||||
Total transactions with owners | 44 | 3 | (200) | - | - | (197) | 13 | (184) | ||||||||||||||||||||||||
At March 31, 2013 | 1,001,152 | $ | 17,929 | $ | 3,916 | $ | 387 | $ | 314 | $ | 22,546 | $ | 2,691 | $ | 25,237 | |||||||||||||||||
At January 1, 2012 (restated - note 2B) | 1,000,423 | $ | 17,892 | $ | 4,562 | $ | 595 | $ | 314 | $ | 23,363 | $ | 2,191 | $ | 25,554 | |||||||||||||||||
Net income | - | - | 1,039 | - | - | 1,039 | 11 | 1,050 | ||||||||||||||||||||||||
Total other comprehensive income | - | - | - | (79) | - | (79) | - | (79) | ||||||||||||||||||||||||
Total comprehensive income | - | - | 1,039 | (79) | - | 960 | 11 | 971 | ||||||||||||||||||||||||
Transactions with owners | ||||||||||||||||||||||||||||||||
Dividends | - | - | (150) | - | - | (150) | - | (150) | ||||||||||||||||||||||||
Issued on exercise of stock options | 124 | 4 | - | - | - | 4 | - | 4 | ||||||||||||||||||||||||
Recognition of stock option expense | - | 3 | - | - | - | 3 | - | 3 | ||||||||||||||||||||||||
Funding from non-controlling interests | - | - | - | - | - | - | 140 | 140 | ||||||||||||||||||||||||
Other decrease in non-controlling interests | - | - | - | - | - | - | (3) | (3) | ||||||||||||||||||||||||
Total transactions with owners | 124 | 7 | (150) | - | - | (143) | 137 | (6) | ||||||||||||||||||||||||
At March 31, 2012 (restated - note 2B) | 1,000,547 | $ | 17,899 | $ | 5,451 | $ | 516 | $ | 314 | $ | 24,180 | $ | 2,339 | $ | 26,519 | |||||||||||||||||
| 1 | Includes cumulative translation losses at March 31, 2013: $8 million (March 31, 2012: $8 million). |
| 2 | Includes additional paid-in capital as at March 31, 2013: $276 million (December 31, 2012: $276 million; March 31, 2012: $276 million) and convertible borrowings - equity component as at March 31, 2013: $38 million (December 31, 2012: $38 million; March 31, 2012: $38 million). |
The accompanying notes are an integral part of these consolidated financial statements.
| BARRICK FIRST QUARTER 2013 | 39 | FINANCIAL STATEMENTS (UNAUDITED) |
NOTES TO CONSOLIDATED
FINANCIAL STATEMENTS
Barrick Gold Corporation.Tabular dollar amounts in millions of United States dollars, unless otherwise shown. References to C$, A$, ZAR, CLP, PGK, TZS, JPY, ARS, GBP, EUR and ZMW are to Canadian dollars, Australian dollars, South African rand, Chilean pesos, Papua New Guinea kina, Tanzanian shillings, Japanese yen, Argentinean pesos, British Pound sterling, Euros and Zambian kwacha, respectively.
1 > CORPORATE INFORMATION
Barrick Gold Corporation (“Barrick” or the “Company”) is a corporation governed by the Business Corporation Act (Ontario). The Company’s head and registered office is located at Brookfield Place, TD Canada Trust Tower, 161 Bay Street, Suite 3700, Toronto, Ontario, M5J 2S1. We are principally engaged in the production and sale of gold and copper, as well as related activities such as exploration and mine development. We also hold interests in oil and gas properties located in Canada. Our producing gold mines are concentrated in three regional business units (“RBU”): North America, South America, and Australia Pacific. We also hold a 73.9% equity interest in African Barrick Gold plc (“ABG”), a company listed on the London Stock Exchange that owns gold mines and exploration properties in Africa. Our Copper business unit contains producing copper mines located in Chile and Zambia and a mine under construction in Saudi Arabia. We sell our gold and copper production into the world market.
2 > SIGNIFICANT ACCOUNTING POLICIES
A) Statement of Compliance
These condensed interim consolidated financial statements have been prepared in accordance with International Accounting Standard 34Interim Financial Reporting (“IAS 34”) as issued by the International Accounting Standards Board (“IASB”). These interim financial statements should be read in conjunction with Barrick’s most recently issued Annual Report which includes information necessary or useful to understanding the Company’s business and financial statement presentation. In particular, the Company’s significant accounting policies were presented in Note 2 of the consolidated financial statements for the year ended December 31, 2012, and have been consistently applied in the preparation of these interim financial statements except as noted for accounting policy changes in note 2B. These interim consolidated financial statements were authorized for issuance by the Board of Directors on April 23, 2013.
Certain comparatives have been restated to conform to current presentation.
B) Changes in Accounting Policies
The Company has adopted the following new standards, along with any consequential amendments, effective January 1, 2013. These changes were made in accordance with the applicable transitional provisions.
IFRS 10 Consolidated Financial Statements
In May 2011, the IASB issued IFRS 10 Consolidated Financial Statements to replace IAS 27 Consolidated and Separate Financial Statements and SIC 12 Consolidation - Special Purpose Entities. The new consolidation standard changes the definition of control so that the same criteria apply to all entities, both operating and special purpose entities, to determine control. The revised definition focuses on the need to have both power and variable returns before control is present. We conducted a review of all our non-wholly owned entities and structured entities and determined that the adoption of IFRS 10 did not result in any change in the consolidation status of any of our subsidiaries and investees.
IFRS 11 Joint Arrangements
In May 2011, the IASB issued IFRS 11 Joint Arrangements to replace IAS 31, Interests in Joint Ventures. The new standard defines two types of arrangements: Joint Operations and Joint Ventures. The focus of the standard is to reflect the rights and obligations of the parties involved in the joint arrangement, regardless of whether the joint arrangement operates through a separate legal entity. Joint arrangements that are classified as joint ventures are accounted for using the equity method of accounting. Joint arrangements that are classified as joint operations require the venturers to recognize the individual assets, liabilities, revenues and expenses to which they have legal rights or are responsible. As a result of adopting IFRS 11, we have classified our interest in the Donlin Gold project as a joint operation. Our 50% interest in the project was previously accounted for using the equity method of accounting.
As a result of the change in accounting, we now recognize our share of the project’s assets, liabilities, revenue and expenses. This change in accounting was adopted as at January 1, 2012 by the derecognition of our equity investment and the recognition of our share of the project’s assets and liabilities. Subsequent to January 1, 2012, we
| BARRICK FIRST QUARTER 2013 | 40 | NOTES TO FINANCIAL STATEMENTS (UNAUDITED) |
have recognized our share of the project’s assets, liabilities, revenues and expenses.
IFRS 12 Disclosure of Interests in Other Entities
In May 2011, the IASB issued IFRS 12 Disclosure of Interests in Other Entities to create a comprehensive disclosure standard to address the requirements for subsidiaries, joint arrangements and associates including the reporting entity’s involvement with other entities. It also includes the requirements for unconsolidated structured entities (i.e. special purpose entities). We have adopted IFRS 12 effective January 1, 2013. The adoption of IFRS 12 will result in incremental disclosures in our annual consolidated financial statements.
IFRS 13 Fair Value Measurement
In May 2011, the IASB issued IFRS 13 Fair Value Measurement as a single source of guidance for all fair value measurements required by IFRS to reduce the complexity and improve consistency across its application. The standard provides a definition of fair value and guidance on how to measure fair value as well as a requirement for enhanced disclosures. We have adopted IFRS 13 on a prospective basis. We have added additional disclosures on fair value measurement in note 17.
IFRIC 20 Stripping Costs in the Production Phase of a Surface Mine
In October 2011, the IASB issued IFRIC 20 Stripping Costs in the Production Phase of a Surface Mine. IFRIC 20 provides guidance on the accounting for the costs of stripping activities during the production phase of surface mining when two benefits accrue to the entity as a result of the stripping: useable ore that can be used to produce inventory and improved access to further quantities of material that will be mined in future periods. We have adopted IFRIC 20 effective January 1, 2013. Upon adoption of IFRIC 20, we assessed the stripping asset on the balance sheet as at January 1, 2012 and determined that there are identifiable component of the ore body with which this stripping asset can be associated, and therefore no balance sheet adjustment was recorded. The adoption of IFRIC 20 has resulted in increased capitalization of waste stripping costs and a reduction in our cost of sales in 2012. If we had not adopted the standard, our net income and capitalized waste stripping costs for current and comparative periods would have decreased.
For the quantitative impact of adopting IFRS 11 and IFRIC 20 on our prior year consolidated financial statements, please refer to tables below.
Adjustments to the consolidated balance sheets:
As at January 1, 2012 | Adjustments for Changes in Accounting Policy | As at January 1, 2012 | ||||||||||||||
| (previously stated) | IFRS 11 | IFRIC 20 | (restated) | |||||||||||||
Cash and equivalents | $ 2,745 | $ 4 | $ - | $ 2,749 | ||||||||||||
Equity in investees | 440 | (99) | - | 341 | ||||||||||||
Property, plant and equipment | 28,979 | 97 | - | 29,076 | ||||||||||||
Accounts payable | (2,083) | (2) | - | (2,085) | ||||||||||||
Increase in net assets/retained earnings | $ - | $ - | ||||||||||||||
Adjustments to the consolidated balance sheets:
| As at December 31, 2012 | Adjustments for Changes in Accounting Policy | As at December 31, 2012 | ||||||||||||||
| (previously stated) | IFRS 11 | IFRIC 20 | (restated) | |||||||||||||
Cash and equivalents | $ 2,093 | $ 4 | $ - | $ 2,097 | ||||||||||||
Inventories | 4,387 | - | (247 | ) | 4,140 | |||||||||||
Equity in investees | 135 | (115 | ) | - | 20 | |||||||||||
Property, plant and equipment | 28,717 | 113 | 447 | 29,277 | ||||||||||||
Deferred income tax assets | 443 | - | (6 | ) | 437 | |||||||||||
Accounts payable | (2,265 | ) | (2 | ) | - | (2,267 | ) | |||||||||
Deferred income tax liabilities | (2,602 | ) | (66 | ) | (2,668 | ) | ||||||||||
Increase in net assets/retained earnings | $ - | $ 128 | ||||||||||||||
| BARRICK FIRST QUARTER 2013 | 41 | NOTES TO FINANCIAL STATEMENTS (UNAUDITED) |
Adjustments to the consolidated statements of income:
| For the three months ended March 31 | 2012 | Adjustments for Changes in Accounting Policy | 2012 | |||||||||||||
| (previously stated) | IFRS 111 | IFRIC 20 | (restated) | |||||||||||||
Cost of sales | $ 1,770 | $ - | $ (17) | $ 1,753 | ||||||||||||
Income tax expense | (529) | - | (6) | (535) | ||||||||||||
Increase in net income | $ - | $ 11 | ||||||||||||||
| 1 | Due to the nature of activities at Donlin Gold, there was no impact on net income. |
Adjustments to the consolidated statements of cash flow:
| For the three months ended March 31 | 2012 | Adjustments For Changes in Accounting Policy | 2012 | |||||||||
| (previously stated) | IFRS 11 | IFRIC 20 | (restated) | |||||||||
Net income | $ 1,039 | $ - | $ 11 | $ 1,050 | ||||||||
Adjusted for the following items: | ||||||||||||
Depreciation | 394 | - | 5 | 399 | ||||||||
Income tax expense | 529 | - | 6 | 535 | ||||||||
Increase (decrease) in inventory | (157) | - | 75 | (82) | ||||||||
Other | (230) | (1) | - | (231) | ||||||||
Net cash provided by operating activities | (1) | 97 | ||||||||||
Capital expenditures | (1,315) | (3) | (97) | (1,415) | ||||||||
Other investing activities | (61) | 3 | - | (58) | ||||||||
Net cash used in investing activities | - | (97) | ||||||||||
Net (decrease) in cash and equivalents | (80) | (1) | - | (81) | ||||||||
Cash and equivalents at beginning of period | 2,745 | 4 | - | 2,749 | ||||||||
Cash and equivalents at end of period | $ 2,665 | $ 3 | $ - | $ 2,668 | ||||||||
Adjustments to the consolidated statements of income:
| For the year ended December 31 | 2012 | Adjustments for Changes in Accounting Policy | 2012 | |||||||||||||
| (previously stated) | IFRS 11 | IFRIC 20 | (restated) | |||||||||||||
Cost of sales | $ 7,654 | $ - | $ (232) | $ 7,422 | ||||||||||||
Impairment | 6,470 | 32 | 6,502 | |||||||||||||
Other expense | 633 | 1 | 634 | |||||||||||||
(Loss) from equity investees | 13 | (1) | 12 | |||||||||||||
Income tax recovery (expense) | 236 | - | (72) | 164 | ||||||||||||
Increase in net income | $ - | $ 128 | ||||||||||||||
Adjustments to the consolidated statements of cash flow:
| For the year ended December 31 | 2012 | Adjustments For Changes in Accounting Policy | 2012 | |||||||||||||
| (previously stated) | IFRS 11 | IFRIC 20 | (restated) | |||||||||||||
Net income | $ (677) | $ - | $ 128 | $ (549) | ||||||||||||
Adjusted for the following items: | ||||||||||||||||
Depreciation | 1,722 | - | 31 | 1,753 | ||||||||||||
Income tax expense (recovery) | (236) | - | 72 | (164) | ||||||||||||
Increase (decrease) in inventory | (616) | - | 256 | (360) | ||||||||||||
Impairment | 6,470 | - | 32 | 6,502 | ||||||||||||
Other | (1,224) | (2) | - | (1,226) | ||||||||||||
Increase (decrease) in cash provided by operating activities | (2) | 519 | ||||||||||||||
Capital expenditures | (6,369) | (15) | (519) | (6,903) | ||||||||||||
Other investing activities | (152) | 17 | - | (135) | ||||||||||||
Increase (decrease) cash used in investing activities | 2 | (519) | ||||||||||||||
Net (decrease) in cash and equivalents | (652) | - | - | (652) | ||||||||||||
Cash and equivalents at beginning of period | 2,745 | 4 | - | 2,749 | ||||||||||||
Cash and equivalents at end of period | $ 2,093 | $ 4 | $ - | $ 2,097 | ||||||||||||
| BARRICK FIRST QUARTER 2013 | 42 | NOTES TO FINANCIAL STATEMENTS (UNAUDITED) |
| C) | New Accounting Standards Issued But Not Yet Effective |
IFRS 9 Financial Instruments
In November 2009, the IASB issued IFRS 9 Financial Instruments as the first step in its project to replace IAS 39 Financial Instruments: Recognition and Measurement. IFRS 9 retains but simplifies the mixed measurement model and establishes two primary measurement categories for financial assets: amortized cost and fair value. The basis of classification depends on an entity’s business model and the contractual cash flow of the financial asset. Classification is made at the time the financial asset is initially recognized, namely when the entity becomes a party to the contractual provisions of the instrument. Requirements for classification and measurement of financial liabilities were added in October 2010 and they largely carried forward existing requirements in IAS 39, except that fair value changes due to an entity’s own credit risk for liabilities designated at fair value through profit and loss would generally be recorded in other comprehensive income rather than the income statement.
IFRS 9 amends some of the requirements of IFRS 7 Financial Instruments: Disclosures, including added disclosures about investments in equity instruments measured at fair value in Other Comprehensive Income (“OCI”), and guidance on financial liabilities and derecognition of financial instruments. In December 2011, the IASB issued an amendment that adjusted the mandatory effective date of IFRS 9 from January 1, 2013 to January 1, 2015. We are currently assessing the impact of adopting IFRS 9 on our consolidated financial statements, including the possibility of early adoption.
3 > SIGNIFICANT JUDGMENTS, ESTIMATES, ASSUMPTIONS AND RISKS
The judgments, estimates, assumptions and risks discussed here reflect updates from the most recently filed annual consolidated financial statements for the year ended December 31, 2012. For judgments, estimates, assumptions and risks related to other areas not discussed in these interim consolidated financial statements, please refer to Notes 3 and 26 of the 2012 annual consolidated financial statements.
A) Gold and Copper Mineral Reserves
At the end of each fiscal year, as part of our annual business cycle, we prepare estimates of the proven and probable reserves and the portion of resources expected to be extracted economically for each mineral property. We prospectively revise calculations of depreciation of property, plant and equipment and also transfer amounts
allocated to non-depreciable mining interest to mining interest subject to depreciation based on the ounces/pounds that have become probable of being economically extracted. The effect of changes in the proven and probable reserves and the portion of resources expected to be extracted economically on depreciation expense for the three months ended March 31, 2013 was a decrease of $13 million (2012: $2 million increase). The effect of transfers to mining interest subject to depreciation on depreciation expense for the three months ended March 31, 2013 was an increase of $2 million (2012: $2 million increase).
B) Provision for Environmental Rehabilitation (“PER”)
Provisions are updated each reporting period for changes to expected cash flows and for the effect of changes in the discount rate, and the change in estimate is added or deducted from the related asset and depreciated over the expected economic life of the operation to which it relates. We recorded $44 million (2012: $11 million) in discount rate adjustments to the PER at our minesites for the three months ended March 31, 2013.
C) Impairment of non-current assets
Non-current assets are tested for impairment when events or changes in circumstances suggest that the carrying amount may not be fully recoverable. We conduct an annual test for impairment of goodwill in the fourth quarter of each fiscal year and at any other time of the year if an indicator of impairment is identified. In first quarter 2013, we identified two indicators of potential impairment.
As at March 31, 2013, the carrying value of ABG exceeded its market capitalization, which is an indicator of potential impairment of the carrying value of our ABG operating segment. We assessed the recoverable amount of the ABG operating segment, including goodwill, and determined that the Value in Use (“VIU”) is greater than the carrying value and therefore no impairment was recorded.
On April 9, 2013, the Copiapó Court of Appeals in Chile granted a request for a preliminary injunction to suspend construction activities on the Chilean side of the project pending a hearing on a constitutional rights action filed in September of 2012. The action alleges noncompliance with the environmental requirements of the project’s Chilean environmental approval. Upon confirming the court order, Barrick took immediate steps to suspend construction activities in Chile, which includes work on the primary crusher and the Chilean side of the tunnel that conveys ore from Chile to Argentina. Activities determined to be necessary for environmental protection are expected to
| BARRICK FIRST QUARTER 2013 | 43 | NOTES TO FINANCIAL STATEMENTS (UNAUDITED) |
continue, upon appropriate authorization as contemplated by the Court. Construction in Argentina, where the majority of Pascua-Lama’s critical infrastructure is located, including the process plant and tailings storage facility, has not been affected. Until we have clarity on the regulatory and legal aspects, we are unable to fully assess the impact on the capital budget, operating costs and schedule of the project. The company is at an early stage of evaluating an alternative development plan that involves accelerating the development of another smaller pit in Argentina in order to provide a source of ore for initial production. This alternative could provide ore for about six months of production during commissioning and ramp up, following which the mine plan would be dependent on a continuous supply of Chilean ore. Therefore, if resumption of construction activities in Chile, including the pre-stripping, is delayed beyond late 2013, or if such development alternative is determined not to be feasible, there could be a significant change to the mine plan and an impact on the capital cost and production schedule of the project. The company will continue to evaluate all alternatives, in light of the uncertainties associated with the legal and regulatory actions, and the current environment, including the possibility of suspending the project. We identified the granting of the injunction as an indicator of potential impairment. Based on the information available to us, and having assessed the recoverable amount of the project, we concluded that the carrying value of the project was not impaired as at March 31, 2013. To the extent there are significant changes to any of the above metrics, the current carrying amount of the project may not be recoverable, which would result in an impairment charge being recorded for the project.
Subsequent to quarter end, market prices of gold, silver and copper declined significantly and were below levels used in our most recent annual impairment test. If metal prices remain at these levels for an extended period of time, we may need to reassess our long-term price assumptions, and a significant decrease in our long-term price assumptions would be an indicator of potential impairment. Also subsequent to quarter end, the trading price of the company’s shares declined such that the Company’s carrying value of net assets (of approximately $23/share) exceeded its market capitalization, which is also an indicator of potential impairment. If these potential indicators of impairment exist at the end of our next reporting period, we will be required to conduct an impairment assessment.
Based on the results of our last annual test in fourth quarter 2012, and the events identified above, the carrying
value of the CGUs that are most sensitive to changes in the key assumptions used in the annual test are:
| As at March 31, 2013 | Carrying Value | |||
Pascua-Lama | $ 5,998 | 1 | ||
Jabal Sayid | 1,394 | |||
Lumwana | 873 | |||
Buzwagi | 765 | |||
Barrick Energy CGUs | 622 | |||
Kanowna | 162 | |||
Pierina | 147 | |||
Darlot | 80 | |||
| 1 | As noted in our year-end release, the fair value of the Pascua-Lama project exceeded its carrying value by about $1.5 billion. We also noted that a decrease of about 7% in long-term gold prices (from $1,700/oz), a decrease of about 12% in silver prices (from $32/oz), an increase of about 10% in operating costs or an increase of about 15% in the total LOM capital expenditures would, in isolation, cause the estimated recoverable amount to be equal to the carrying value. |
In addition to the above mentioned CGUs, the goodwill of our Australia Pacific and ABG gold segments, our Capital Projects segment and our Copper segment are also sensitive to changes in the key metal price assumptions used in the annual test. Please refer to note 15 for the current goodwill balances attributable to these segments.
D) Liquidity risk
Liquidity risk is the risk of loss from not having access to sufficient funds to meet both expected and unexpected cash demands. We manage our exposure to liquidity risk by maintaining adequate cash reserves, access to undrawn credit facilities and access to public debt markets, by staggering the maturities of outstanding debt instruments to mitigate refinancing risk and by continuous monitoring of forecast and actual cash flows. Details of the undrawn credit facility are included in Note 16B. Our ability to access public debt markets and the related cost of debt financing is dependent upon maintaining an investment grade credit rating.
At current market gold and copper prices, we expect to generate negative free cash flow in 2013. This is primarily due to expected total capital expenditures of about $5.2 to $5.7 billion, including $2.3 billion at our Pascua-Lama project. We also have approximately $0.6 billion of debt maturing in the remainder of 2013 and dividend payments that will also impact our overall liquidity. Our primary source of liquidity is our operating cash flow. We plan to issue long-term debt securities in the near term to further improve liquidity. Other options to enhance liquidity include reducing capital expenditures and administration costs, modifying the dividend policy, drawing the remaining $2.0 billion available under our 2012 Credit Facility (subject to compliance with covenants and the making of certain
| BARRICK FIRST QUARTER 2013 | 44 | NOTES TO FINANCIAL STATEMENTS (UNAUDITED) |
representations and warranties, this facility is available for drawdown as a source of financing), asset sales and securities issuances. The key financial covenant in the 2012 Credit Facility ($2.0 billion outstanding as at March 31, 2013) requires Barrick to maintain a consolidated tangible net worth (“CTNW”) of at least $3.0 billion (Barrick’s CTNW was $12.6 billion as at March 31, 2013). There are no financial covenants related to Barrick’s public bonds (representing approximately 80% of total debt outstanding). Our credit ratings and general market conditions, among other things, impact our ability to access
the market for debt securities as well as our cost of borrowing and the terms of such borrowing. Currently, the Company maintains investment grade credit ratings and market conditions to issue debt securities are strong for such issuers.
4 > SEGMENT INFORMATION
Barrick’s business is organized into seven primary operating segments: four regional gold businesses, a global copper business unit, an oil and gas business, and a capital projects group. Barrick’s Chief Operating Decision Maker reviews the operating results, assesses performance and makes capital allocation decisions at an operating segment level. Therefore, these business units are operating segments for financial reporting purposes.
Segment performance is evaluated based on a number of measures including operating income before tax, production levels and unit production costs. Income tax, corporate administration, finance income and costs, impairment charges and reversals, investment write-downs and gains/losses on non-hedge derivatives are managed on a consolidated basis and are therefore not reflected in segment income.
Consolidated Statement of Income Information
| Cost of Sales | ||||||||||||||||||||||||||||
For the three months ended March 31, 2013 | Revenue | Direct mining & royalties | Depreciation | Exploration & evaluation | Operating segment administration | Other expenses (income)1 | Segment income (loss)2 | |||||||||||||||||||||
Gold | ||||||||||||||||||||||||||||
North America | $ 1,431 | $ 440 | $ 157 | $ 1 | $ 14 | $ 11 | $ 808 | |||||||||||||||||||||
South America | 575 | 173 | 63 | 5 | 5 | 12 | 317 | |||||||||||||||||||||
Australia Pacific | 757 | 380 | 76 | 4 | 9 | 14 | 274 | |||||||||||||||||||||
ABG | 253 | 154 | 50 | 5 | 6 | 7 | 31 | |||||||||||||||||||||
Copper3 | 383 | 267 | 40 | - | 6 | 19 | 51 | |||||||||||||||||||||
Capital Projects4 | - | - | 1 | - | 6 | 55 | (62) | |||||||||||||||||||||
Barrick Energy | 38 | 15 | 19 | 6 | 3 | - | (5) | |||||||||||||||||||||
| $ 3,437 | $ 1,429 | $ 406 | $ 21 | $ 49 | $ 118 | $ 1,414 | ||||||||||||||||||||||
| BARRICK FIRST QUARTER 2013 | 45 | NOTES TO FINANCIAL STATEMENTS (UNAUDITED) |
Consolidated Statement of Income Information
| Cost of Sales | ||||||||||||||||||||||||||||
| For the three months ended March 31, 2012 (restated) | Revenue | Direct mining & royalties | Depreciation | Exploration & evaluation | Operating segment administration | Other expenses (income)1 | Segment income (loss)2 | |||||||||||||||||||||
Gold | ||||||||||||||||||||||||||||
North America | $ 1,404 | $ 405 | $ 130 | $ 6 | $ 16 | $ (1) | $ 848 | |||||||||||||||||||||
South America | 718 | 185 | 72 | 1 | 5 | 12 | 443 | |||||||||||||||||||||
Australia Pacific | 769 | 370 | 78 | 13 | 13 | 3 | 292 | |||||||||||||||||||||
ABG | 266 | 143 | 35 | 7 | 15 | 8 | 58 | |||||||||||||||||||||
Copper3 | 445 | 234 | 53 | 4 | 4 | (8) | 158 | |||||||||||||||||||||
Capital Projects4 | - | - | - | - | 4 | 11 | (15) | |||||||||||||||||||||
Barrick Energy | 42 | 17 | 26 | 2 | 2 | - | (5) | |||||||||||||||||||||
| $ 3,644 | $ 1,354 | $ 394 | $ 33 | $ 59 | $ 25 | $ 1,779 | ||||||||||||||||||||||
| 1 | Other expenses include accretion expense, which is included within finance costs in the consolidated statement of income. For the three months ended March 31, 2013, accretion expense was $17 million (2012: $13 million). |
| 2 | We manage the performance of our business units using a measure of income before interest and taxes; consequently, interest income, interest expense and income taxes are not allocated to our regional business units and therefore, not reflected in segment income (loss). |
| 3 | The Copper segment includes exploration and evaluation expense and losses from equity investees that hold copper projects. |
| 4 | The Capital Projects segment relates to our interests in our significant gold projects under construction. |
Reconciliation of Segment Income to Income Before Income Taxes
| For the three months ended March 31 | ||||||||
| 2013 | 2012 (restated) | |||||||
Segment income | $ 1,414 | $ 1,779 | ||||||
Depreciation of corporate assets | (9) | (5) | ||||||
Exploration not managed by segments | (32) | (44) | ||||||
Evaluation not managed by segments | (1) | - | ||||||
Corporate administration | (45) | (48) | ||||||
Other income (expenses) | 5 | (5) | ||||||
Impairment charges | (5) | (94) | ||||||
Finance income | 3 | 3 | ||||||
Finance costs (excludes accretion) | (91) | (35) | ||||||
Gain (loss) on non-hedge derivatives | 42 | 34 | ||||||
Income before income taxes | $ 1,281 | $ 1,585 | ||||||
| Asset Information | ||||||||
| Segment capital expenditures1 | For the three months ended March 31 | |||||||
| 2013 | 2012 (restated) | |||||||
Gold | ||||||||
North America | $ 294 | $ 256 | ||||||
South America | 84 | 85 | ||||||
Australia Pacific | 114 | 119 | ||||||
ABG | 106 | 62 | ||||||
Copper | 101 | 159 | ||||||
Capital Projects | 708 | 596 | ||||||
Barrick Energy | 45 | 55 | ||||||
Segment total | 1,452 | 1,332 | ||||||
Other items not allocated to segments | 2 | 14 | ||||||
Enterprise total | $ 1,454 | $ 1,346 | ||||||
| 1 | Segment capital expenditures are presented for internal management reporting purposes on an accrual basis. Capital expenditures in the Consolidated Statement of Cash Flow are presented on a cash basis. For the three months ended March 31, 2013, cash expenditures were $1,430 million (2012: $1,415 million) and the increase in accrued expenditures was $24 million (2012: $69 million decrease). |
| BARRICK FIRST QUARTER 2013 | 46 | NOTES TO FINANCIAL STATEMENTS (UNAUDITED) |
5 > REVENUE
| For the three months ended March 31 | ||||||||
| 2013 | 2012 | |||||||
Gold bullion sales1 | ||||||||
Spot market sales | $ 2,889 | $ 3,038 | ||||||
Concentrate sales2 | 73 | 84 | ||||||
| 2,962 | 3,122 | |||||||
Copper sales1 | ||||||||
Copper cathode sales | 214 | 302 | ||||||
Concentrate sales2 | 169 | 143 | ||||||
| 383 | 445 | |||||||
Oil and gas sales | 38 | 42 | ||||||
Other metal sales | 54 | 35 | ||||||
Total | $ 3,437 | $ 3,644 | ||||||
| 1 | Revenues include amounts transferred from OCI to earnings for commodity cash flow hedges (see note 16C). |
| 2 | Concentrate revenues are presented net of treatment charges and refinement charges incurred on the sale of concentrates. For the three months ended March 31, 2013, treatment charges and refinement charges for gold were $1 million (2012: $1 million) and for copper was $29 million (2012: $23 million). |
Provisional Copper and Gold Sales
We have provisionally priced sales for which price finalization, referenced to the relevant copper and gold index, is outstanding at the balance sheet date. Our exposure at March 31, 2013 to the impact of movements in market commodity prices for provisionally priced sales is set out in the following table:
| Volumes subject to final pricing | Impact on net income before taxation of 10% movement in market price US$M | |||||||||||||||
| For the three months ended March 31 | 2013 | 2012 | 2013 | 2012 | ||||||||||||
Copper pounds (millions) | 50 | 59 | $ 17 | $ 23 | ||||||||||||
Gold ounces (000’s) | 20 | 32 | 3 | 5 | ||||||||||||
For the three months ended March 31, 2013, our provisionally priced copper sales included provisional pricing loss of $7 million (2012: $22 million gain) and our provisionally priced gold sales included provisional pricing losses of $2 million (2012: $1 million gain).
At March 31, 2013, our provisionally priced copper and gold sales subject to final settlement were recorded at average prices of $3.41/lb (2012: $3.84/lb) and $1,592/oz (2012: $1,674/oz) respectively. The sensitivities in the above table have been determined as the impact of a 10 percent change in commodity prices, while holding all other variables constant.
6 > COST OF SALES
| For the three months ended March 31 | ||||||||
| 2013 | 2012 (restated) | |||||||
Direct mining cost1,2 | $ 1,333 | $ 1,275 | ||||||
Depreciation | 415 | 399 | ||||||
Royalty expense | 96 | 79 | ||||||
| $ 1,844 | $ 1,753 | |||||||
| 1 | Direct mining cost includes charges to reduce the cost of inventory to net realizable value as follows: $8 million for the three months ended March 31, 2013 (2012: $14 million). |
| 2 | Direct mining cost includes the costs of extracting by-products. |
7 > EXPLORATION AND EVALUATION
| For the three months ended March 31 | ||||||||
| 2013 | 2012 (restated) | |||||||
Exploration: | ||||||||
Minesite exploration | $ 13 | $ 15 | ||||||
Global programs | 32 | 44 | ||||||
| 45 | 59 | |||||||
Evaluation costs | 9 | 14 | ||||||
| Exploration and evaluation expense1 | $ 54 | $ 73 | ||||||
| 1 | Approximates the impact on operating cash flow. |
8 > EARNINGS PER SHARE
| For the three months ended March 31 | ||||||||||||||||||||||||
| 2013 | 2012 (restated) | |||||||||||||||||||||||
| ($ millions, except shares in millions and per share amounts in dollars) | Basic | Diluted | Basic | Diluted | ||||||||||||||||||||
Net Income | $ 861 | $ 861 | $ 1,050 | $ 1,050 | ||||||||||||||||||||
Net income attributable to non-controlling interests | (14) | (14) | (11) | (11) | ||||||||||||||||||||
Net income attributable to equity holders of Barrick Gold Corporation | $ 847 | $ 847 | $ 1,039 | $ 1,039 | ||||||||||||||||||||
Weighted average shares outstanding | 1,001 | 1,001 | 1,000 | 1,000 | ||||||||||||||||||||
Effect of dilutive securities - stock options | - | - | - | 2 | ||||||||||||||||||||
| 1,001 | 1,001 | 1,000 | 1,002 | |||||||||||||||||||||
Earnings per share data attributable to the equity holders of Barrick Gold Corporation | ||||||||||||||||||||||||
Net income | $ 0.85 | $ 0.85 | $ 1.04 | $ 1.04 | ||||||||||||||||||||
| BARRICK FIRST QUARTER 2013 | 47 | NOTES TO FINANCIAL STATEMENTS (UNAUDITED) |
9 > OTHER CHARGES
A Other Expense
| For the three months ended March 31 | ||||||||
| 2013 | 2012 (restated) | |||||||
| Operating segment administration1 | $ 49 | $ 59 | ||||||
| Corporate social responsibility | 12 | 17 | ||||||
| Changes in estimate of rehabilitation costs at closed mines | - | 1 | ||||||
| World Gold Council fees | 2 | 2 | ||||||
| Currency translation losses2 | 17 | - | ||||||
| Pension and other post-retirement benefit expense | 1 | - | ||||||
| Other expensed items | 85 | 38 | ||||||
Total | $ 166 | $ 117 | ||||||
| 1 | Relates to costs incurred at business unit offices. |
| 2 | Amounts attributable to currency translation losses on working capital. |
B Impairment Charges
| For the three months ended March 31 | ||||||||
| 2013 | 2012 | |||||||
| Impairment (reversal) of other investments1 | $ - | $ 87 | ||||||
| Impairment of long-lived assets/AFS investments | 5 | 7 | ||||||
| Total | $ 5 | $ 94 | ||||||
| 1 | Relates to impairment of Highland Gold Mining Limited upon reclassification from equity investees into other investments. |
C Other Income
| For the three months ended March 31 | ||||||||
| 2013 | 2012 | |||||||
| Gain on sale of long-lived assets/investments | $ 8 | $ 10 | ||||||
| Changes in estimate of environmental rehabilitation costs at closed mines | 5 | - | ||||||
| Currency translation gains1 | - | 19 | ||||||
| Other | 8 | 12 | ||||||
| Total | $ 21 | $ 41 | ||||||
| 1 | Amounts attributable to currency translation gains on working capital. |
10 > FINANCE COSTS
| For the three months ended March 31 | ||||||||
| 2013 | 2012 | |||||||
| Interest | $ 178 | $ 157 | ||||||
| Amortization of debt issue costs | 3 | 3 | ||||||
| Interest capitalized | (90) | (125) | ||||||
| Accretion | 17 | 13 | ||||||
| Total | $ 108 | $ 48 | ||||||
11 > INCOME TAX EXPENSE
| For the three months ended March 31 | ||||||||
| 2013 | 2012 (restated) | |||||||
| Current | $ 249 | $ 450 | ||||||
| Deferred | 171 | 85 | ||||||
| $ 420 | $ 535 | |||||||
| Actual effective tax rate | 32.8% | 33.8% | ||||||
| Impact of: | ||||||||
| Net currency translation (losses) gains on deferred tax balances | (3.4%) | 0.6% | ||||||
| Impairment charges and non-hedge derivatives | 0.3% | (2.2%) | ||||||
| Other | 0.3% | (0.2%) | ||||||
| Estimated effective tax rate on ordinary income | 30.0% | 32.0% | ||||||
Currency Translation
Deferred tax balances are subject to remeasurement for changes in currency exchange rates each period. The most significant balances are Argentinean net deferred tax liabilities. These translation gains/losses are included within deferred income tax expense/recovery.
| BARRICK FIRST QUARTER 2013 | 48 | NOTES TO FINANCIAL STATEMENTS (UNAUDITED) |
12 > CASH FLOW – OTHER ITEMS
| A Operating Cash Flows – Other Items | For the three months ended March 31 | |||||||
| 2013 | 2012 (restated) | |||||||
| Adjustments for non-cash income statement items: | ||||||||
| Currency translation (gains) losses (note 9) | $ 17 | $ (19) | ||||||
| RSU expense | 4 | 11 | ||||||
| Stock option expense | 2 | 3 | ||||||
| Change in estimate of rehabilitation provisions at closed mines | (5) | 1 | ||||||
| Inventory impairment charges (note 13) | 8 | 14 | ||||||
| Accretion | 17 | 13 | ||||||
| Cash flow arising from changes in: | ||||||||
| Derivative assets and liabilities | (58) | 39 | ||||||
| Other current assets | (14) | - | ||||||
| Value added tax recoverable | (9) | (24) | ||||||
| Accounts receivable | 69 | (10) | ||||||
| Other current liabilities | (22) | - | ||||||
| Prepaid assets | 89 | (51) | ||||||
| Accounts payable and accrued liabilities | (128) | (69) | ||||||
| Other assets and liabilities | (78) | (77) | ||||||
| Contingent consideration related to the acquisition of the additional 40% of the Cortez property | - | (50) | ||||||
| Settlement of rehabilitation obligations | (11) | (12) | ||||||
| Other net operating activities | $ (119) | $ (231) | ||||||
| B Investing Cash Flows – Other Items | For the three months ended March 31 | |||||||
| 2013 | 2012 (restated) | |||||||
Value added tax recoverable on project capital expenditures | $ (72) | $ (45) | ||||||
Other | (7) | (13) | ||||||
Other net investing activities | $ (79) | $ (58) | ||||||
| C Financing Cash Flows – Other Items | For the three months ended March 31 | |||||||
| 2013 | 2012 | |||||||
Financing fees on long-term debt | $ (8) | $ (7) | ||||||
Derivative settlements | - | (7) | ||||||
Other net financing activities | $ (8) | $ (14) | ||||||
| BARRICK FIRST QUARTER 2013 | 49 | NOTES TO FINANCIAL STATEMENTS (UNAUDITED) |
13 > INVENTORIES
| Gold | Copper | |||||||||||||||
| As at December 31, 2012 | As at December 31, 2012 | |||||||||||||||
| As at March 31, 2013 | (restated) | As at March 31, 2013 | (restated) | |||||||||||||
| Raw materials | ||||||||||||||||
| Ore in stockpiles | $ 1,840 | $ 1,703 | $ 261 | $ 273 | ||||||||||||
| Ore on leach pads | 281 | 292 | 303 | 298 | ||||||||||||
| Mine operating supplies | 1,003 | 956 | 147 | 140 | ||||||||||||
| Work in process | 342 | 322 | 6 | 6 | ||||||||||||
| Finished products | ||||||||||||||||
| Gold doré | 148 | 108 | - | - | ||||||||||||
| Copper cathode | - | - | 31 | 11 | ||||||||||||
| Copper concentrate | - | - | 17 | 26 | ||||||||||||
| Gold concentrate | 14 | 5 | - | - | ||||||||||||
| 3,628 | 3,386 | 765 | 754 | |||||||||||||
| Non-current ore in stockpiles1 | (1,345) | (1,314) | (239) | (241) | ||||||||||||
| $ 2,283 | $ 2,072 | $ 526 | $ 513 | |||||||||||||
| 1 | Ore that we do not expect to process in the next 12 months is classified as long-term. |
| For the three months ended March 31 | ||||||||||||
| 2013 | 2012 | |||||||||||
Inventory impairment charges | $ 8 | $ 14 | ||||||||||
Purchase Commitments
At March 31, 2013, we had purchase obligations for supplies and consumables of $1,552 million.
14 > PROPERTY, PLANT, AND EQUIPMENT
As at March 31, 2013 | As at December 31, 2012 | |||||||
Depreciable assets | $ 17,662 | $ 13,414 | ||||||
| Non-depreciable assets | ||||||||
| Capital projects | ||||||||
| Pascua-Lama | 6,536 | 5,861 | ||||||
| Pueblo Viejo1,2 | - | 4,596 | ||||||
| Cerro Casale2 | 1,858 | 1,836 | ||||||
| Jabal Sayid | 1,518 | 1,497 | ||||||
| Donlin Gold | 115 | 113 | ||||||
| Construction-in-progress | 2,203 | 1,590 | ||||||
| Acquired mineral resources and exploration potential | 280 | 370 | ||||||
| $ 30,172 | $ 29,277 | |||||||
| 1 | In first quarter 2013, the property, plant and equipment balance of Pueblo Viejo is recognized as part of depreciable assets as a result of entering production. |
| 2 | Amounts are presented on a 100% basis and include our partner’s non-controlling interest. |
Capital Commitments
In addition to entering into various operational commitments in the normal course of business, we had capital commitments of $1,887 million at March 31, 2013.
15 > GOODWILL
| As at March 31, 2013 | As at December 31, 2012 | |||||||
| Gold | ||||||||
| North America1 | $ 2,788 | $ 2,376 | ||||||
| South America | 441 | 441 | ||||||
| Australia Pacific | 1,480 | 1,480 | ||||||
| ABG | 185 | 185 | ||||||
| Gold carrying amount | $ 4,894 | $ 4,482 | ||||||
| Copper | 3,451 | 3,451 | ||||||
| Capital Projects1 | 397 | 809 | ||||||
| Barrick Energy | 93 | 95 | ||||||
| Total carrying amount | $ 8,835 | $ 8,837 | ||||||
| 1 | In first quarter 2013, we transferred $412 million of goodwill from the Capital Projects segment to the North America segment as a result of Pueblo Viejo entering production. |
We do not have any goodwill that is deductible for income tax purposes.
| BARRICK FIRST QUARTER 2013 | 50 | NOTES TO FINANCIAL STATEMENTS (UNAUDITED) |
16 > FINANCIAL INSTRUMENTS
Financial instruments include cash; evidence of ownership in an entity; or a contract that imposes an obligation on one party and conveys a right to a second entity to deliver/receive cash or another financial instrument.
A Cash and Equivalents
Cash and equivalents include cash, term deposits, treasury bills and money market funds with original maturities of less than 90 days.
B Debt
| As at March 31, 2013 | As at December 31, 2012 | |||||||
1.75%/2.9%/4.4%/5.7% notes1 | $ 3,974 | $ 3,974 | ||||||
3.85%/5.25% notes | 1,985 | 1,985 | ||||||
5.80%/4.875% notes | 750 | 750 | ||||||
5.75%/6.35% notes | 990 | 989 | ||||||
Other fixed rate notes2 | 3,197 | 3,196 | ||||||
Project financing | 893 | 890 | ||||||
Capital leases | 193 | 185 | ||||||
Other debt obligations | 774 | 774 | ||||||
Credit facility expiring in 2013 | - | 1,200 | ||||||
Credit facility expiring in 20183 | 1,992 | - | ||||||
ABG credit facility4 | 50 | - | ||||||
| $ 14,798 | $ 13,943 | |||||||
Less: current portion | (694) | (1,848) | ||||||
| $ 14,104 | $ 12,095 | |||||||
| 1 | Consists of $4.0 billion through our wholly-owned subsidiary Barrick North America Finance LLC (“BNAF Notes”), of which $700 that million matures in 2014, $1.1 billion that matures in 2016, $1.35 billion that matures in 2021 and $850 million that matures in 2041. We provide an unconditional and irrevocable guarantee on all BNAF Notes and generally provide such guarantees on all BNAF notes issued, which will rank equally with our other unsecured and unsubordinated obligations. |
| 2 | Consists of $1.25 billion through our wholly-owned indirect subsidiary Barrick (PD) Australia Finance Pty Ltd. (“BPDAF”), of which $850 million that matures in 2039 and $400 million that matures in 2020. We provide an unconditional and irrevocable guarantee of all BPDAF debt and generally provide such guarantees on all BPDAF notes issued, which will rank equally with our other unsecured and unsubordinated obligations. Also consists of $750 million in notes that matures in 2019, $500 million in notes that mature in 2013, $500 million in notes that mature in 2018 and $250 million in notes that mature in 2038. |
| 3 | Consists of a $4.0 billion credit facility expiring in 2018 of which we drew $2.0 billion in the first quarter 2013. Subsequently, we paid down $1.2 billion under the Credit Facility expiring in April 2013. |
| 4 | Consists of an export credit backed term loan facility for the amount of $142 million of which $50 million was drawn in first quarter 2013 by ABG. |
| BARRICK FIRST QUARTER 2013 | 51 | NOTES TO FINANCIAL STATEMENTS (UNAUDITED) |
C Derivative Instruments at March 31, 2013
| Notional amount by term to maturity | Accounting classification by notional amount | |||||||||||||||||||||||||||||||
| Within 1 year | 2 to 3 years | 4+ years | Total | Cash flow hedge | Fair value hedge | Non- hedge | Fair value (USD) | |||||||||||||||||||||||||
| US dollar interest rate contracts | ||||||||||||||||||||||||||||||||
| Total receive - float swap positions | $ 13 | $ 41 | $ 38 | $ 92 | $ 92 | $ - | $ - | $ (1) | ||||||||||||||||||||||||
| Total receive - fixed swap positions | 100 | 100 | - | 200 | - | 200 | - | 5 | ||||||||||||||||||||||||
| Currency contracts | ||||||||||||||||||||||||||||||||
| A$:US$ contracts (A$ millions) | 390 | 1,075 | 375 | 1,840 | 1,740 | - | 100 | 99 | ||||||||||||||||||||||||
| C$:US$ contracts (C$ millions) | 447 | 117 | - | 564 | 454 | - | 110 | 2 | ||||||||||||||||||||||||
| CLP:US$ contracts (CLP millions)1 | 275,597 | 356,550 | - | 632,147 | 228,697 | - | 403,450 | 66 | ||||||||||||||||||||||||
| PGK:US$ contracts (PGK millions) | 40 | - | - | 40 | - | - | 40 | - | ||||||||||||||||||||||||
| ZAR:US$ contracts (ZAR millions) | 1,004 | 270 | - | 1,274 | 391 | - | 883 | (3) | ||||||||||||||||||||||||
| Commodity contracts | ||||||||||||||||||||||||||||||||
| Copper collar sell contracts | ||||||||||||||||||||||||||||||||
| (millions of pounds) | 213 | - | - | 213 | 213 | - | - | 40 | ||||||||||||||||||||||||
| Copper sold forward contracts | ||||||||||||||||||||||||||||||||
| (millions of pounds) | 7 | - | - | 7 | - | - | 7 | 2 | ||||||||||||||||||||||||
| Silver collar sell contracts | ||||||||||||||||||||||||||||||||
| (millions of ounces) | 9 | 27 | 29 | 65 | 55 | - | 10 | 93 | ||||||||||||||||||||||||
| Diesel contracts (thousands of barrels)2 | 2,138 | 2,265 | 540 | 4,943 | 840 | - | 4,103 | 20 | ||||||||||||||||||||||||
| Electricity contracts (thousands of megawatt hours) | 26 | 46 | - | 72 | - | - | 72 | - | ||||||||||||||||||||||||
| 1 | Non-hedge contracts economically hedge pre-production capital expenditures at our Pascua-Lama and Cerro Casale projects and operating/administration costs at various South American locations. |
| 2 | Diesel commodity contracts represent a combination of WTI, BRENT, and BRENT/WTI spread swaps. These derivatives hedge physical supply contracts based on the price of ULSD, WTB, MOPS and JET, respectively, plus a spread. WTI represents West Texas Intermediate, BRENT represents Brent Crude Oil, and MOPS represents Mean of Platts Singapore. |
Fair Values of Derivative Instruments
| Asset Derivatives | Liability Derivatives | |||||||||||||||||||||||
| Consolidated Balance Sheet Classification | Fair Value at March 31, 2013 | Fair Value at December 31, 2012 | Consolidated Balance Sheet Classification | Fair Value at March 31, 2013 | Fair Value at December 31, 2012 | |||||||||||||||||||
| Derivatives designated as hedging instruments | ||||||||||||||||||||||||
US dollar interest rate contracts | Other assets | $ 5 | $ 6 | Other liabilities | $ 1 | $ - | ||||||||||||||||||
Currency contracts | Other assets | 134 | 133 | Other liabilities | 1 | - | ||||||||||||||||||
Commodity contracts | Other assets | 123 | 81 | Other liabilities | 1 | 11 | ||||||||||||||||||
| Total derivatives classified as hedging instruments | $ 262 | $ 220 | $ 3 | $ 11 | ||||||||||||||||||||
| Derivatives not designated as hedging instruments | ||||||||||||||||||||||||
Currency contracts | Other assets | $ 43 | $ 48 | Other liabilities | $ 12 | $ 9 | ||||||||||||||||||
Commodity contracts | Other assets | 40 | 39 | Other liabilities | 7 | 9 | ||||||||||||||||||
| Total derivatives not designated as hedging instruments | $ 83 | $ 87 | $ 19 | $ 18 | ||||||||||||||||||||
| Total derivatives | $ 345 | $ 307 | $ 22 | $ 29 | ||||||||||||||||||||
| BARRICK FIRST QUARTER 2013 | 52 | NOTES TO FINANCIAL STATEMENTS (UNAUDITED) |
As of March 31, 2013, we had 24 counterparties to our derivative positions. We proactively manage our exposure to individual counterparties in order to mitigate both credit and liquidity risks. For those counterparties with which we hold a net asset position (total balance attributable to the counterparties is $325 million), three hold greater than 10% of our mark-to-market asset position, with the largest counterparty holding 24%. We have two counterparties with which we are in a net liability position, for a total net liability of $2 million. On an ongoing basis, we monitor our exposures and ensure that none of the counterparties with which we hold outstanding contracts has declared insolvency.
Cash Flow Hedge Gains (Losses) in Accumulated Other Comprehensive Income
| Commodity price hedges | Currency hedges | Interest rate hedges | ||||||||||||||||||||||||||||||||||||
| Gold/Silver | Copper | Fuel | Operating costs | Administration/ other costs | Capital expenditures | Long-term debt | Total | |||||||||||||||||||||||||||||||
| At January 1, 2013 | $ 10 | $ - | $ 7 | $ 456 | $ 25 | $ 26 | $ (31) | $ 493 | ||||||||||||||||||||||||||||||
| Effective portion of change in fair value of hedging instruments | 9 | 15 | 2 | 9 | (3) | 2 | (1) | 33 | ||||||||||||||||||||||||||||||
| Transfers to earnings: | ||||||||||||||||||||||||||||||||||||||
| On recording hedged items in earnings/PP&E1 | - | (2) | (4) | (78) | (3) | (7) | 1 | (93) | ||||||||||||||||||||||||||||||
| Hedge ineffectiveness due to changes in original forecasted transaction | - | - | - | - | - | - | - | - | ||||||||||||||||||||||||||||||
| At March 31, 2013 | $ 19 | $ 13 | $ 5 | $ 387 | $ 19 | $ 21 | $ (31) | $ 433 | ||||||||||||||||||||||||||||||
| 1 | Realized gains (losses) on qualifying currency hedges of capital expenditures are transferred from OCI to PP&E on settlement. |
D Gains (Losses) on Non-hedge Derivatives
| For the three months ended March 31 | ||||
| 2013 | 2012 | |||
| Gains (losses) on non-hedge derivatives | ||||
| Commodity contracts | ||||
| Gold | $ 1 | $ (2) | ||
| Silver | (1) | - | ||
| Copper | 4 | (7) | ||
| Fuel | 6 | 31 | ||
| Currency contracts | 17 | 67 | ||
| $ 27 | $ 89 | |||
| Gains (losses) attributable to silver option collar hedges1 | 20 | (51) | ||
| Gains (losses) attributable to copper option collar hedges1 | (3) | (7) | ||
| Gains (losses) attributable to currency option collar hedges1 | (2) | 3 | ||
| $ 15 | $ (55) | |||
| $ 42 | $ 34 | |||
| 1 | Represents unrealized gains (losses) attributable to changes in the time value of the collars, which are excluded from the hedge effectiveness assessment. |
17 > FAIR VALUE MEASUREMENTS
Fair value is the price that would be received to sell an asset or paid to transfer a liability in an orderly transaction between market participants at the measurement date. The fair value hierarchy establishes three levels to classify the inputs to valuation techniques used to measure fair value. Level 1 inputs are quoted prices (unadjusted) in active markets for identical assets or liabilities. Level 2 inputs are quoted prices in markets that are not active, quoted prices for similar assets or liabilities in active markets, inputs other than quoted prices that are observable for the asset or liability (for example, interest rate and yield curves observable at commonly quoted intervals, forward pricing curves used to value currency and commodity contracts and volatility measurements used to value option contracts), or inputs that are derived principally from or corroborated by observable market data or other means. Level 3 inputs are unobservable (supported by little or no market activity). The fair value hierarchy gives the highest priority to Level 1 inputs and the lowest priority to Level 3 inputs.
| BARRICK FIRST QUARTER 2013 | 53 | NOTES TO FINANCIAL STATEMENTS (UNAUDITED) |
A Assets and Liabilities Measure at Fair Value on a Recurring Basis
| As at March 31, 2013 | Quoted prices in active markets for identical assets (Level 1) | Significant other observable inputs (Level 2) | Significant unobservable (Level 3) | Aggregate fair value | ||||||||||||
| Cash and equivalents | $ 2,342 | $ - | $ - | $ 2,342 | ||||||||||||
| Available-for-sale securities | 50 | - | - | 50 | ||||||||||||
| Derivatives | - | 323 | - | 323 | ||||||||||||
| Receivables from provisional copper and gold sales | - | 196 | - | 196 | ||||||||||||
| $ 2,392 | $ 519 | $ - | $ 2,911 | |||||||||||||
B Fair Values of Financial Assets and Liabilities
| As at Mar. 31, 2013 | As at Dec. 31, 2012 | |||||||||||||||
| Carrying amount | Estimated fair value | Carrying amount | Estimated fair value | |||||||||||||
| Financial assets | ||||||||||||||||
| Other receivables | $ 160 | $ 160 | $ 156 | $ 156 | ||||||||||||
| Available-for-sale securities1 | 50 | 50 | 78 | 78 | ||||||||||||
| Derivative assets | 345 | 345 | 307 | 307 | ||||||||||||
| $ 555 | $ 555 | $ 541 | $ 541 | |||||||||||||
| Financial liabilities | ||||||||||||||||
| Debt2 | 14,798 | 16,053 | 13,943 | 15,502 | ||||||||||||
| Derivative liabilities | 22 | 22 | 29 | 29 | ||||||||||||
| Other liabilities | 298 | 298 | 323 | 323 | ||||||||||||
| $ 15,118 | $ 16,373 | $ 14,295 | $ 15,854 | |||||||||||||
| 1 | Recorded at fair value. Quoted market prices are used to determine fair value. |
| 2 | Debt is generally recorded at amortized cost except for obligations that are designated in a fair-value hedge relationship, in which case the carrying amount is adjusted for changes in fair value of the hedging instrument in periods when a hedge relationship exists. The fair value of debt is primarily determined using quoted market prices. Balance includes both current and long-term portions of debt. |
We do not offset financial assets with financial liabilities.
Valuation Techniques
Available-for-Sale Securities
The fair value of available-for-sale securities is determined based on the closing price of each security at the balance sheet date. The closing price is a quoted market price obtained from the exchange that is the principal active market for the particular security, and therefore available-
for-sale securities are classified within Level 1 of the fair value hierarchy.
Derivative Instruments
The fair value of derivative instruments is determined using either present value techniques or option pricing models that utilize a variety of inputs that are a combination of quoted prices and market-corroborated inputs. The fair value of all our derivative contracts includes an adjustment for credit risk. For counterparties in a net asset position, credit risk is based upon the observed credit default swap spread for each particular counterparty, as appropriate. For counterparties in a net liability position, credit risk is based upon Barrick’s observed credit default swap spread. The fair value of US dollar interest rate and currency swap contracts is determined by discounting contracted cash flows using a discount rate derived from observed LIBOR and swap rate curves and CDS rates. In the case of currency contracts, we convert non-US dollar cash flows into US dollars using an exchange rate derived from currency swap curves and CDS rates. The fair value of commodity forward contracts is determined by discounting contractual cash flows using a discount rate derived from observed LIBOR and swap rate curves and CDS rates. Contractual cash flows are calculated using a forward pricing curve derived from observed forward prices for each commodity. Derivative instruments are classified within Level 2 of the fair value hierarchy.
Receivables from Provisional Copper and Gold Sales
The fair value of receivables rising from copper and gold sales contracts that contain provisional pricing mechanisms is determined using the appropriate quoted forward price from the exchange that is the principal active market for the particular metal. As such, these receivables, which meet the definition of an embedded derivative, are classified within Level 2 of the fair value hierarchy.
18 > CAPITAL STOCK
A Common Shares
Our authorized capital stock includes an unlimited number of common shares (issued 1,001,152,326 common shares); 10,000,000 First preferred shares Series A (issued nil); 10,000,000 Series B (issued nil); and 15,000,000 Second preferred shares Series A (issued nil). Our common shares have no par value.
B Dividends
Dividends are declared after a quarter end in the announcement of the results for the quarter. Dividends declared are paid in the same quarter.
| BARRICK FIRST QUARTER 2013 | 54 | NOTES TO FINANCIAL STATEMENTS (UNAUDITED) |
19 > NON-CONTROLLING INTERESTS
| Pueblo Viejo | ABG | Cerro Casale | Total | |||||||||||||
At January 1, 2013 (restated) | $ 1,405 | $ 747 | $ 512 | $ 2,664 | ||||||||||||
Share of income (loss) | 14 | 1 | (1) | 14 | ||||||||||||
Cash contributed | 11 | - | 2 | 13 | ||||||||||||
At March 31, 2013 | $ 1,430 | $ 748 | $ 513 | $ 2,691 | ||||||||||||
20 > CONTINGENCIES
Certain conditions may exist as of the date the financial statements are issued that may result in a loss to the Company, but which will only be resolved when one or more future events occur or fail to occur.
Except as noted below, no material changes have occurred with respect to the matters disclosed in Note 34 “Contingencies” to the Company’s audited consolidated financial statements for the year ended December 31, 2012 (the “Consolidated Financial Statements”), and no new contingencies have occurred that are material to the Company since the issuance of the Consolidated Financial Statements.
The description set out below should be read in conjunction with Note 34 “Contingencies” to the Consolidated Financial Statements.
A) Litigation and Claims Update
Pascua-Lama Constitutional Protection Action
On April 9, 2013, the Court granted the plaintiffs’ request for a preliminary injunction to suspend construction activities on the Chilean side of the Project, except for those activities deemed necessary for environmental protection, pending a hearing on the merits of the constitutional rights protection action filed in September 2012. On April 19, 2013, the Court denied the Company’s motion requesting the Court to reconsider its decision to issue the preliminary injunction, while leaving open the possibility of another request to lift the preliminary injunction in the future. The constitutional rights protection action filed in October 2012 has been abandoned for lack of prosecution.
Reko Diq Arbitration
In February 2013, the ICC tribunal issued a ruling denying Tethyan Copper Company’s request for provisional measures. This ruling was similar to that issued by the ICSID tribunal in December 2012.
A merits hearing in the ICSID matter is scheduled for February 2014, and a merits hearing in the ICC matter is scheduled for June 2014.
B) Other Contingencies Update
Pueblo Viejo
On February 27, 2013, President Medina of the Dominican Republic, in his first Independence Day speech to the National Assembly, announced that the government would submit to Congress a bill that would establish a tax on “unforeseen income” of mineral-exporting companies unless Pueblo Viejo Dominicana Corporation (“PVDC”) would promptly agree to the government’s demands to increase the benefits to the government under the Special Lease Agreement (“SLA”) at the Pueblo Viejo mine.
The Company, while fully reserving its rights under the SLA, which cannot be unilaterally altered, has engaged in dialogue with representatives of the government in an effort to achieve a mutually acceptable outcome. This could potentially involve a renegotiation of the SLA and/or the imposition of other measures, for instance to provide for an increase in the payment of taxes in the earlier years of the mine life, and could have a significant negative effect on project economics and, in particular, the distribution of profits and cash flows of the mine. To date the parties have been unable to reach agreement. The government has threatened to take unilateral action, such as introducing the “unforeseen income” tax announced by the President or blocking the export of minerals. Such actions would constitute a violation of the SLA, which provides for international arbitration of disputes under the Arbitration Rules of the International Chamber of Commerce. Any such actions taken by the government in an effort to extract greater revenues would negatively affect the profitability and cash flow of the mine. The potential operational impacts of any such action are difficult to predict at this time. Depending on the nature and extent of any unilateral actions that the government may take, the Company could, among other things, decide to curtail, or suspend production at the mine, or to pay the tax under protest, while pursuing its rights under international arbitration. The Company is also aware of various legal proceedings which, among other things, seek to challenge the constitutionality of the SLA.
On April 4, 2013, the main opposition party in the Dominican Republic introduced a bill in the Chamber of Deputies that would establish a windfall profit tax on PVDC. To the Company’s knowledge, no further action has been taken by the Chamber of Deputies with respect to this bill.
| BARRICK FIRST QUARTER 2013 | 55 | NOTES TO FINANCIAL STATEMENTS (UNAUDITED) |
On March 13, 2013, customs authorities in the Dominican Republic prevented PVDC from exporting a shipment of gold and silver from the Pueblo Viejo mine. The shipment was subsequently released and shipped out of the Dominican Republic on March 18, 2013. In late March and early April 2013, PVDC was informed of certain additional requirements that will apply to shipments of gold and silver from the Pueblo Viejo mine. PVDC is complying with these new measures.
| BARRICK FIRST QUARTER 2013 | 56 | NOTES TO FINANCIAL STATEMENTS (UNAUDITED) |
CORPORATE OFFICE
Barrick Gold Corporation
Brookfield Place, TD Canada Trust Tower
Suite 3700
161 Bay Street, P.O. Box 212
Toronto, Canada M5J 2S1
Tel: (416) 861-9911 Fax: (416) 861-0727
Toll-free throughout North America: 1-800-720-7415
Email: investor@barrick.com
Website: www.barrick.com
SHARES LISTED
ABX - | The New York Stock Exchange | |
The Toronto Stock Exchange |
TRANSFER AGENTS AND REGISTRARS
CIBC Mellon Trust Company
c/o Canadian Stock Transfer Company Inc.,
as administrative agent
P.O. Box 700, Postal Station B
Montreal, Quebec, Canada H3B 3K3
or
American Stock Transfer & Trust Company, LLC
6201 - 15 Avenue
Brooklyn, NY 11219
Tel: 1-800-387-0825
Toll-free throughout North America
Fax: (416) 643-5501 or 1-888-249-6189
Email: inquiries@canstockta.com
Website: www.canstockta.com
INVESTOR CONTACT
Greg Panagos
Senior Vice President
Investor Relations and Communications
Tel: (416) 309-2943
Email: gpanagos@barrick.com
MEDIA CONTACT
Andy Lloyd
Director
Media Relations
Tel: (416) 307-7414
Email: alloyd@barrick.com
CAUTIONARY STATEMENT ON FORWARD-LOOKING INFORMATION
Certain information contained or incorporated by reference in this First Quarter Report 2013, including any information as to our strategy, projects, plans or future financial or operating performance, constitutes “forward-looking statements”. All statements, other than statements of historical fact, are forward-looking statements. The words “believe”, “expect”, “anticipate”, “contemplate”, “target”, “plan”, “intend”, “continue”, “budget”, “estimate”, “may”, “will”, “schedule” and similar expressions identify forward-looking statements. Forward-looking statements are necessarily based upon a number of estimates and assumptions that, while considered reasonable by the company, are inherently subject to significant business, economic and competitive uncertainties and contingencies. Known and unknown factors could cause actual results to differ materially from those projected in the forward-looking statements. Such factors include, but are not limited to: fluctuations in the spot and forward price of gold and copper or certain other commodities (such as silver, diesel fuel and electricity); changes in national and local government legislation, taxation, controls, regulations, expropriation or nationalization of property and political or economic developments in Canada, the United States and other jurisdictions in which the company does or may carry on business in the future; diminishing quantities or grades of reserves; increased costs, delays, suspensions and technical challenges associated with the construction of capital projects; the impact of global liquidity and credit availability on the timing of cash flows and the values of assets and liabilities based on projected future cash flows; adverse changes in our credit rating; the impact of inflation; fluctuations in the currency markets; operating or technical difficulties in connection with mining or development activities; the speculative nature of mineral exploration and development, including the risks of obtaining necessary licenses and permits; contests over title to properties, particularly title to undeveloped properties; risk of loss due to acts of war, terrorism, sabotage and civil disturbances; changes in U.S. dollar interest rates; risks arising from holding derivative instruments; litigation; business opportunities that may be presented to, or pursued by, the company; our ability to successfully integrate acquisitions or complete divestitures; employee relations; availability and increased costs associated with mining inputs and labor; and; the organization of our previously held African gold operations and properties under a separate listed company. In addition, there are risks and hazards associated with the business of mineral exploration, development and mining, including environmental hazards, industrial accidents, unusual or unexpected formations, pressures, cave-ins, flooding and gold bullion or copper cathode losses (and the risk of inadequate insurance, or inability to obtain insurance, to cover these risks). Many of these uncertainties and contingencies can affect our actual results and could cause actual results to differ materially from those expressed or implied in any forward-looking statements made by, or on behalf of, us. Readers are cautioned that forward-looking statements are not guarantees of future performance. All of the forward-looking statements made in this First Quarter Report 2013 are qualified by these cautionary statements. Specific reference is made to the most recent Form 40-F/Annual Information Form on file with the SEC and Canadian provincial securities regulatory authorities for a discussion of some of the factors underlying forward-looking statements.
The company disclaims any intention or obligation to update or revise any forward-looking statements whether as a result of new information, future events or otherwise, except as required by applicable law.