Table of Contents
UNITED STATES
SECURITIES AND EXCHANGE COMMISSION
Washington, D.C. 20549
FORM N-CSR
CERTIFIED SHAREHOLDER REPORT OF REGISTERED
MANAGEMENT INVESTMENT COMPANIES
Investment Company Act file number: 811-04236
JPMorgan Trust II
(Exact name of registrant as specified in charter)
270 Park Avenue
New York, NY 10017
(Address of principal executive offices) (Zip code)
Frank J. Nasta
270 Park Avenue
New York, NY 10017
(Name and Address of Agent for Service)
Registrant’s telephone number, including area code: (800) 480-4111
Date of fiscal year end: June 30
Date of reporting period: July 1, 2016 through June 30, 2017
Form N-CSR is to be used by management investment companies to file reports with the Commission not later than 10 days after the transmission to stockholders of any report that is required to be transmitted to stockholders under Rule 30e-1 under the Investment Company Act of 1940 (17 CFR 270.30e-1). The Commission may use the information provided on Form N-CSR in its regulatory, disclosure review, inspection, and policymaking roles.
A registrant is required to disclose the information specified by Form N-CSR, and the Commission will make this information public. A registrant is not required to respond to the collection of information contained in Form N-CSR unless the Form displays a currently valid Office of Management and Budget (“OMB”) control number. Please direct comments concerning the accuracy of the information collection burden estimate and any suggestions for reducing the burden to Secretary, Securities and Exchange Commission, 450 Fifth Street, NW, Washington, DC 20549-0609. The OMB has reviewed this collection of information under the clearance requirements of 44 U.S.C. Section 3507.
Table of Contents
ITEM 1. REPORTS TO STOCKHOLDERS.
The following is a copy of the report transmitted to shareholders pursuant to Rule 30e-1 under the Investment Company Act of 1940 (17 CFR 270.30e-1).
Table of Contents
Annual Report
J.P. Morgan Small Cap Funds
June 30, 2017
JPMorgan Dynamic Small Cap Growth Fund
JPMorgan Small Cap Core Fund
JPMorgan Small Cap Equity Fund
JPMorgan Small Cap Growth Fund
JPMorgan Small Cap Value Fund
JPMorgan U.S. Small Company Fund

Table of Contents
Investments in a Fund are not deposits or obligations of, or guaranteed or endorsed by, any bank and are not insured or guaranteed by the FDIC, the Federal Reserve Board or any other government agency. You could lose money if you sell when a Fund’s share price is lower than when you invested.
Past performance is no guarantee of future performance. The general market views expressed in this report are opinions based on market and other conditions through the end of the reporting period and are subject to change without notice. These views are not intended to predict the future performance of a Fund or the securities markets. References to specific securities and their issuers are for illustrative purposes only and are not intended to be, and should not be interpreted as, recommendations to purchase or sell such securities. Such views are not meant as investment advice and may not be relied on as an indication of trading intent on behalf of any Fund.
Prospective investors should refer to the Funds’ prospectuses for a discussion of the Funds’ investment objectives, strategies and risks. Call J.P. Morgan Funds Service Center at 1-800-480-4111 for a prospectus containing more complete information about a Fund, including management fees and other expenses. Please read it carefully before investing.
Table of Contents
August 4, 2017 (Unaudited)
Dear Shareholder,
The current U.S. economic expansion entered its eighth year in 2017 and growth in developed and emerging market economies grew more synchronized even as U.S. growth showed some signs of easing. Global financial markets generally benefitted from steady economic growth amid an environment of low inflation, low volatility and rising corporate profits.
 |
“In the U.S., the continued economic expansion, muted inflation, corporate earnings growth and historically low volatility in financial markets helped to drive key equity market indexes to multiple record closing highs throughout the past twelve months.” |
While economic growth in the U.S. and China largely drove the global recovery throughout 2016, by June 2017 the world’s other leading economies had picked up sufficiently enough for the Organization for Economic Co-operation and Development to forecast global growth at 3.5% in 2017 and 3.6% in 2018.
U.S. gross domestic product (GDP) growth slowed to 1.2% in the first quarter of 2017 from 2.5% and 3.5% growth in the fourth quarter and third quarters of 2016, respectively. Meanwhile, the U.S. unemployment rate continued its downward trend throughout the past twelve months, dropping to 4.4% in June 2017 from 4.9% one year earlier. In response to these numbers, along with nascent signs of price inflation, the U.S. Federal Reserve (the “Fed”) raised interest rates in December 2016 and again in June 2017 and signaled it would raise rates once more before the end of the year. Further, Fed Chairwoman Janet Yellen indicated she was prepared to begin partially unwinding the central bank’s $4.5 trillion balance sheet in assets purchased through its quantitative easing program. An increase in consumer spending helped second-quarter 2017 GDP climb by 2.6% from a year earlier.
Notably, by mid-2017 domestic price inflation had dropped below the Fed’s target of 2% growth and wage growth was below many economists’ expectations, the latter despite an environment of essentially full employment for U.S. workers. These trends — and the Fed’s acknowledgment of them — provided some near-term uncertainty about the central bank’s commitment to tightening monetary policy.
Throughout the twelve months ended June 30, 2017, global oil prices remained a key focal point for policy makers, economists and investors. Global crude prices reached 15-month highs in October 2016 and received further support from the Organization of Petroleum Exporting Countries’ December 2016 decision to curb production. However, continued oversupply of crude and natural gas, partly due to continued U.S. production, pushed the price of a barrel of benchmark West Texas Intermediate crude oil down to $46 by the end of June 2017.
Meanwhile, the leading economies of Europe continued to strengthen from what had been an anemic expansion. Annualized GDP for the 19 core euro area nations rose 1.9% in the first quarter of 2017 and 2.1% in the second quarter. The June 2017 aggregate unemployment rate for those nations fell to 9.1%, its lowest level since March 2009. Also, in separate elections in 2017, voters in the Netherlands and France largely rejected populist campaigns espousing policies to limit free trade and immigration. The election results provided another boost to global equity prices.
In the U.S., the continued economic expansion, muted inflation, corporate earnings growth and historically low volatility in financial markets helped to drive key equity market indexes to multiple record closing highs throughout the past twelve months. U.S. investors appeared to shrug off intermittent political and policy dramas emanating from Washington, D.C. and extended the run-up in U.S. equity prices into its eighth consecutive year — one of the longest on record.
Over the twelve month period, U.S. and foreign markets largely rewarded those who remained fully invested in financial markets and we believe the fundamental virtues of patience and diversification remain essential to prudent investment strategy.
We look forward to managing your investment needs for years to come. Should you have any questions, please visit www.jpmorganfunds.com or contact the J.P. Morgan Funds Service Center at 1-800-480-4111.
Sincerely yours,

George C.W. Gatch
CEO, Global Funds Management & Institutional,
J.P. Morgan Asset Management
| JUNE 30, 2017 | J.P. MORGAN SMALL CAP FUNDS | 1 | ||||||
Table of Contents
J.P. Morgan Small Cap Funds
TWELVE MONTHS ENDED JUNE 30, 2017 (Unaudited)
Overall, U.S. equity markets provided positive returns and key stock market indexes reached multiple record highs throughout the twelve month reporting period. Steady global economic growth, continued low inflation and strong corporate earnings all served to support equity prices, both in the U.S. and elsewhere.
While U.S. equity prices rose throughout most of 2016, they experienced a sustained rally following the November 8, 2016 election amid investor expectations for increased infrastructure spending and tax cuts under the incoming Trump administration and Republican Party majorities in the U.S. Congress. Even as those expectations faded, U.S. equity prices continued to climb.
In February 2017, the Standard & Poor’s 500 Index (the “S&P 500”) reached nine new closing highs and the Dow Jones Industrial Average (the “DJIA”) closed at new highs for 12 consecutive days, matching a record set in 1987. The following month, the S&P 500 crossed 2,400 points in intraday trading for the first time and the DJIA crossed 21,000 points for the first time. While the rally in U.S. equities stalled in April 2017, record high U.S. corporate operating earnings rekindled the rise in stock prices and the S&P 500 posted seven new closing highs in May 2017 and four new closing highs in June 2017.
Importantly, U.S. financial market volatility remained historically low throughout the reporting period, with a brief spike ahead of the November 2016 election. By the end of June 2017, the CBOE Volatility Index which measures S&P 500 options to gauge market expectations of near-term volatility, stood at roughly half of its historical average.
Overall, small capitalization stocks generally outperformed mid cap and large cap stocks, while growth stocks generally outperformed value stocks. For the twelve months ended June 30, 2017, the Russell 2000 Index returned 24.60%.
| 2 | J.P. MORGAN SMALL CAP FUNDS | JUNE 30, 2017 | ||||
Table of Contents
JPMorgan Dynamic Small Cap Growth Fund
FUND COMMENTARY
TWELVE MONTHS ENDED JUNE 30, 2017 (Unaudited)
| REPORTING PERIOD RETURN: | ||||
| Fund (Class A Shares, without a sales charge)* | 34.99% | |||
| Russell 2000 Growth Index | 24.40% | |||
| Net Assets as of 6/30/17 (In Thousands) | $ | 170,392 | ||
INVESTMENT OBJECTIVE**
The JPMorgan Dynamic Small Cap Growth Fund (the “Fund”) seeks capital growth over the long term.
WHAT WERE THE MAIN DRIVERS OF THE FUND’S PERFORMANCE?
The Fund’s Class A Shares, without a sales charge, outperformed the Russell 2000 Growth Index (the “Benchmark”) for the twelve months ended June 30, 2017. The Fund’s security selection and overweight position in the information technology sector and its security selection in the health care sector were leading contributors to performance relative to the Benchmark, while the Fund’s security selection in the materials sector was a leading detractor from relative performance.
Leading individual contributors to relative performance included the Fund’s overweight positions in Shopify Inc., Exact Sciences Corp. and Teladoc Inc. Shares of Shopify, a provider of sales software for small and mid-sized businesses, rose amid consistent positive earnings and expanded services. Shares of Exact Sciences, a medical diagnostics company, rose in 2017 amid increased physician and insurer adoption of its colon cancer screening test. Shares of Teladoc, a provider of on-demand, remote health care, rose after the company reported improved cash flow.
Leading individual detractors from relative performance included the Fund’s overweight positions in TherapeuticsMD Inc. and Advanced Drainage Systems Inc. and its underweight position in Chemours Co. Shares of TherapeuticsMD, a drug maker, fell in mid-2017 after the U.S. Food and Drug Administration cited problems with the company’s product labeling. Shares of Advanced Drainage Systems, a manufacturer of thermoplastic water pipes, fell in late 2016 after the company delayed required financial reporting. Shares of Chemours, a chemicals manufacturer, rose after the company settled personal injury lawsuits related to toxic chemicals.
HOW WAS THE FUND POSITIONED?
The Fund’s portfolio managers utilized a bottom-up approach to stock selection, researching individual companies in an effort to construct portfolios of stocks that have strong fundamentals.
The Fund’s portfolio managers preferred to invest in high quality companies with durable franchises that, in their view, possessed the ability to generate strong future earnings growth.
| TOP TEN EQUITY HOLDINGS OF THE PORTFOLIO*** | ||||||||
| 1. | John Bean Technologies Corp. | 1.8 | % | |||||
| 2. | Boyd Gaming Corp. | 1.8 | ||||||
| 3. | Masonite International Corp. | 1.5 | ||||||
| 4. | Summit Materials, Inc., Class A | 1.5 | ||||||
| 5. | RingCentral, Inc., Class A | 1.5 | ||||||
| 6. | Littelfuse, Inc. | 1.5 | ||||||
| 7. | Kite Pharma, Inc. | 1.4 | ||||||
| 8. | Texas Capital Bancshares, Inc. | 1.3 | ||||||
| 9. | Graco, Inc. | 1.3 | ||||||
| 10. | Trex Co., Inc. | 1.3 | ||||||
PORTFOLIO COMPOSITION BY SECTOR*** | ||||
| Information Technology | 27.3 | % | ||
| Health Care | 22.1 | |||
| Industrials | 19.2 | |||
| Consumer Discretionary | 11.9 | |||
| Financials | 5.6 | |||
| Consumer Staples | 4.5 | |||
| Materials | 3.9 | |||
| Real Estate | 2.0 | |||
| Energy | 1.4 | |||
| Short-Term Investment | 2.1 | |||
| * | The return shown is based on net asset values calculated for shareholder transactions and may differ from the return shown in the financial highlights, which reflects adjustments made to the net asset values in accordance with accounting principles generally accepted in the United States of America. |
| ** | The adviser seeks to achieve the Fund’s objective. There can be no guarantee it will be achieved. |
| *** | Percentages indicated are based on total investments as of June 30, 2017. The Fund’s portfolio composition is subject to change. |
| JUNE 30, 2017 | J.P. MORGAN SMALL CAP FUNDS | 3 | ||||||
Table of Contents
JPMorgan Dynamic Small Cap Growth Fund
FUND COMMENTARY
TWELVE MONTHS ENDED JUNE 30, 2017 (Unaudited) (continued)
AVERAGE ANNUAL TOTAL RETURNS AS OF JUNE 30, 2017 | ||||||||||||||||
| INCEPTION DATE OF CLASS | 1 YEAR | 5 YEAR | 10 YEAR | |||||||||||||
CLASS A SHARES | May 19, 1997 | |||||||||||||||
With Sales Charge* | 27.90 | % | 13.36 | % | 6.42 | % | ||||||||||
Without Sales Charge | 34.99 | 14.58 | 6.99 | |||||||||||||
CLASS C SHARES | January 7, 1998 | |||||||||||||||
With CDSC** | 33.34 | 14.01 | 6.42 | |||||||||||||
Without CDSC | 34.34 | 14.01 | 6.42 | |||||||||||||
CLASS I SHARES (FORMERLY SELECT CLASS SHARES) | April 5, 1999 | 35.36 | 14.89 | 7.34 | ||||||||||||
| * | Sales Charge for Class A Shares is 5.25%. |
| ** | Assumes a 1% CDSC (contingent deferred sales charge) for the one year period and 0% CDSC thereafter. |
TEN YEAR PERFORMANCE (6/30/07 TO 6/30/17)
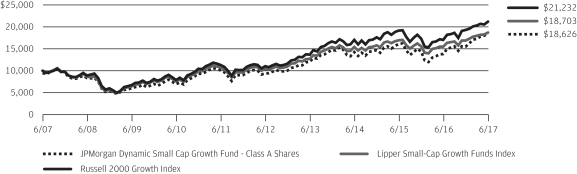
The performance quoted is past performance and is not a guarantee of future results. Mutual funds are subject to certain market risks. Investment returns and principal value of an investment will fluctuate so that an investor’s shares, when redeemed, may be worth more or less than their original cost. Current performance may be higher or lower than the performance data shown. For up-to-date month-end performance information please call 1-800-480-4111.
The graph illustrates comparative performance for $10,000 invested in Class A Shares of the JPMorgan Dynamic Small Cap Growth Fund, the Russell 2000 Growth Index and the Lipper Small-Cap Growth Funds Index from June 30, 2007 to June 30, 2017. The performance of the Fund assumes reinvestment of all dividends and capital gain distributions, if any, and includes a sales charge. The performance of the Russell 2000 Growth Index does not reflect the deduction of expenses or a sales charge associated with a mutual fund and has been adjusted to reflect reinvestment of all dividends and capital gain distributions of the securities included in the benchmark, if applicable. The performance of the Lipper Small-Cap Growth Funds Index includes expenses associated with a mutual fund, such as investment management fees. These expenses are not identical to the expenses incurred by the Fund. The Russell 2000 Growth Index
is an unmanaged index which measures the performance of those Russell 2000 companies with higher price-to-book ratios and higher forecasted growth values. The Lipper Small-Cap Growth Funds Index is an index based on the total returns of certain mutual funds within the Fund’s designated category as determined by Lipper, Inc. Investors cannot invest directly in an index.
Class A Shares have a $1,000 minimum initial investment and carry a 5.25% sales charge.
Fund performance may reflect the waiver of the Fund’s fees and reimbursement of expenses for certain periods since the inception date. Without these waivers and reimbursements, performance would have been lower. Also, performance shown in this section does not reflect the deduction of taxes that a shareholder would pay on Fund distributions or redemptions of Fund shares.
The returns shown are based on net asset values calculated for shareholder transactions and may differ from the returns shown in the financial highlights, which reflect adjustments made to the net asset values in accordance with accounting principles generally accepted in the United States of America.
| 4 | J.P. MORGAN SMALL CAP FUNDS | JUNE 30, 2017 | ||||
Table of Contents
FUND COMMENTARY
TWELVE MONTHS ENDED JUNE 30, 2017 (Unaudited)
| REPORTING PERIOD RETURN: | ||||
| Fund (Class R5 Shares)*1 | 26.85% | |||
| Russell 2000 Index | 24.60% | |||
| Net Assets as of 6/30/2017 (In Thousands) | $ | 210,745 | ||
INVESTMENT OBJECTIVE**
The JPMorgan Small Cap Core Fund (the “Fund”) seeks capital growth over the long term.
WHAT WERE THE MAIN DRIVERS OF THE FUND’S PERFORMANCE?
The Fund’s Class R5 Shares outperformed the Russell 2000 Index (the “Benchmark”) for the twelve months ended June 30, 2017. The Fund’s security selection in the information technology sector was a leading contributor to performance relative to the Benchmark. The Fund’s security selection in the materials and consumer staples sectors was a leading detractor from relative performance.
Leading individual contributors to relative performance included the Fund’s overweight positions in Extreme Networks Inc., Take-Two Interactive Software Inc. and Ultra Clean Holdings Inc. Shares of Extreme Networks, a provider of information network equipment and services, rose after the company offered to acquire Avaya Inc. Shares of Take-Two Interactive Software, a maker of computer and video games, rose on better-than-expected earnings. Shares of Ultra Clean Holdings, a maker of semiconductor manufacturing equipment, rose on better-than-expected earnings.
Leading individual detractors from relative performance included the Fund’s overweight positions in First Solar Inc., Essendant Inc. and Geo Group Inc. Shares of First Solar, a provider of solar energy systems that was not held in the Benchmark, fell after the company was removed from the Standard & Poor’s 500 Index. Shares of Essendant, an office products distributor, fell after the company reported a drop in revenue and earnings. Shares of Geo Group, a prison real estate investment trust, fell after the company announced its $360 million acquisition of Community Education Centers
HOW WAS THE FUND POSITIONED?
In accordance with its investment process, the Fund’s portfolio managers take limited sector bets and construct the Fund so that stock selection is typically the primary driver of its relative performance versus the Benchmark. The Fund’s portfolio managers employ a bottom-up approach to stock selection, using quantitative screening and proprietary analysis to
construct a portfolio of companies that they believe are attractively valued and possess strong momentum. During the reporting period, the Fund was managed and positioned in accordance with this investment process.
| TOP TEN EQUITY HOLDINGS OF THE PORTFOLIO*** | ||||||||
| 1. | Trinseo SA | 1.1 | % | |||||
| 2. | Office Depot, Inc. | 1.1 | ||||||
| 3. | GEO Group, Inc. (The) | 1.1 | ||||||
| 4. | Masimo Corp. | 1.1 | ||||||
| 5. | Taylor Morrison Home Corp., Class A | 1.1 | ||||||
| 6. | Sanmina Corp. | 1.0 | ||||||
| 7. | Integer Holdings Corp. | 1.0 | ||||||
| 8. | East West Bancorp, Inc. | 1.0 | ||||||
| 9. | Bloomin’ Brands, Inc. | 1.0 | ||||||
| 10. | Extreme Networks, Inc. | 1.0 | ||||||
PORTFOLIO COMPOSITION BY SECTOR*** | ||||
| Industrials | 18.4 | % | ||
| Financials | 17.5 | |||
| Information Technology | 15.7 | |||
| Health Care | 14.4 | |||
| Consumer Discretionary | 9.5 | |||
| Real Estate | 7.0 | |||
| Materials | 4.3 | |||
| Utilities | 3.2 | |||
| Energy | 3.0 | |||
| Consumer Staples | 2.0 | |||
| Telecommunication Services | 0.1 | |||
| Short-Term Investment | 4.9 | |||
| * | The return shown is based on net asset values calculated for shareholder transactions and may differ from the return shown in the financial highlights, which reflects adjustments made to the net asset values in accordance with accounting principles generally accepted in the United States of America. |
| ** | The adviser seeks to achieve the Fund’s objective. There can be no guarantee it will be achieved. |
| *** | Percentages indicated are based on total investments as of June 30, 2017. The Fund’s portfolio composition is subject to change. |
| 1 | On September 15, 2016, the Fund’s Select Class Shares were re-designated and renamed as Class R5 Shares. |
| JUNE 30, 2017 | J.P. MORGAN SMALL CAP FUNDS | 5 | ||||||
Table of Contents
JPMorgan Small Cap Core Fund
FUND COMMENTARY
TWELVE MONTHS ENDED JUNE 30, 2017 (Unaudited) (continued)
AVERAGE ANNUAL TOTAL RETURNS AS OF JUNE 30, 2017 | ||||||||||||||
| INCEPTION DATE OF CLASS | 1 YEAR | 5 YEAR | 10 YEAR | |||||||||||
CLASS A SHARES | May 31, 2016 | |||||||||||||
With Sales Charge* | 19.66 | % | 14.24 | % | 6.57 | % | ||||||||
Without Sales Charge | 26.29 | 15.48 | 7.14 | |||||||||||
CLASS C SHARES | May 31, 2016 | |||||||||||||
With CDSC** | 24.68 | 15.36 | 7.08 | |||||||||||
Without CDSC | 25.68 | 15.36 | 7.08 | |||||||||||
CLASS I SHARES | January 3, 2017 | 26.71 | 15.57 | 7.18 | ||||||||||
CLASS R5 SHARES (FORMERLY SELECT CLASS SHARES) | January 1, 1997 | 26.85 | 15.59 | 7.19 | ||||||||||
CLASS R6 SHARES | May 31, 2016 | 26.94 | 15.61 | 7.20 | ||||||||||
| * | Sales Charge for Class A Shares is 5.25%. |
| ** | Assumes a 1% CDSC (contingent deferred sales charge) for the one year period and 0% CDSC thereafter. |
TEN YEAR PERFORMANCE (6/30/07 TO 6/30/17)
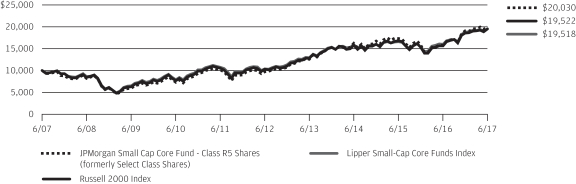
The performance quoted is past performance and is not a guarantee of future results. Mutual funds are subject to certain market risks. Investment returns and principal value of an investment will fluctuate so that an investor’s shares, when redeemed, may be worth more or less than their original cost. Current performance may be higher or lower than the performance data shown. For up-to-date month-end performance information please call 1-800-480-4111.
Returns for Class A, Class C, Class I and Class R6 Shares prior to their inception date are based on the performance of Class R5 Shares, formerly named the Select Class Shares. The actual returns of Class A, Class C and Class I Shares would have been lower than those shown because Class A, Class C and Class I Shares have higher expenses than Class R5 Shares. The actual returns of the Class R6 Shares would have been different than those shown because Class R6 Shares have different expenses than Class R5 Shares.
The graph illustrates comparative performance for $1,000,000 invested in Class R5 Shares of the JPMorgan Small Cap Core Fund, the Russell 2000 Index and the Lipper Small-Cap Core Funds Index from June 30, 2007 to June 30, 2017. The performance of the Fund assumes reinvestment of all dividends and capital gain distributions, if any, and does not include a sales charge. The performance of the Russell 2000 Index does not reflect the deduction of expenses or a sales charge associated with a mutual fund and has been adjusted to reflect reinvestment of all dividends and capital gain distributions of the
securities included in the benchmark, if applicable. The performance of the Lipper Small-Cap Core Funds Index includes expenses associated with a mutual fund, such as investment management fees. These expenses are not identical to the expenses incurred by the Fund. The Russell 2000 Index is an unmanaged index which measures the performance of the 2000 smallest stocks (on the basis of capitalization) in the Russell 3000 Index. The Lipper Small-Cap Core Funds Index is an index based on the total returns of certain mutual funds within the Fund’s designated category as determined by Lipper, Inc. Investors cannot invest directly in an index.
Class R5 Shares have a $1,000,000 minimum initial investment.
Fund performance may reflect the waiver of the Fund’s fees and reimbursement of expenses for certain periods since the inception date. Without these waivers and reimbursements, performance would have been lower. Also, performance shown in this section does not reflect the deduction of taxes that a shareholder would pay on Fund distributions or redemptions of Fund shares.
The returns shown are based on net asset values calculated for shareholder transactions and may differ from the returns shown in the financial highlights, which reflect adjustments made to the net asset values in accordance with accounting principles generally accepted in the United States of America.
| 6 | J.P. MORGAN SMALL CAP FUNDS | JUNE 30, 2017 | ||||
Table of Contents
JPMorgan Small Cap Equity Fund
FUND COMMENTARY
TWELVE MONTHS ENDED JUNE 30, 2017 (Unaudited)
| REPORTING PERIOD RETURN: | ||||
| Fund (Class A Shares, without a sales charge)* | 20.14% | |||
| Russell 2000 Index | 24.60% | |||
| Net Assets as of 6/30/2017 (In Thousands) | $6,288,443 | |||
INVESTMENT OBJECTIVE**
The JPMorgan Small Cap Equity Fund (the “Fund”) seeks capital growth over the long term.
WHAT WERE THE MAIN DRIVERS OF THE FUND’S PERFORMANCE?
The Fund’s Class A Shares, without a sales charge, underperformed the Russell 2000 Index (the “Benchmark”) for the twelve months ended June 30, 2017. The Fund’s security selection and overweight position in the consumer discretionary sector and its security selection and underweight position in the information technology sector were leading detractors from performance relative to the Benchmark. The Fund’s security selection in the health care sector was a leading contributor to relative performance.
Leading individual detractors from relative performance included the Fund’s overweight positions in Zoe’s Kitchen Inc., Crocs Inc. and National Retail Properties Inc. Shares of Zoe’s Kitchen, a restaurant chain operator, fell after the company reported lower-than-expected sales amid a general decline in customer traffic in the restaurant sector. Shares of Crocs, a footwear maker, fell in late 2016 after the company reported lower-than-expected sales and reduced its revenue forecast. Shares of National Retail Properties, a real estate investment trust that was not held in the Benchmark, fell after the company’s cash flow forecast was lower than analysts expected.
Leading individual contributors to relative performance included the Fund’s overweight positions in Toro Co., Idexx Laboratories Inc. and AdvancePierre Foods Holdings Inc. Shares of Toro, a maker of landscaping and irrigation products, rose after the company reported better-than-expected earnings and raised its revenue forecast. Shares of Idexx Laboratories, a maker of veterinary care products, rose after the company reported better-than-expected earnings. Shares of AdvancePierre Foods Holdings, a provider of pre-made sandwiches, rose on news of a $4.2 billion takeover offer from Tyson Foods Inc.
HOW WAS THE FUND POSITIONED?
The Fund’s portfolio managers employed a bottom-up approach to stock selection, constructing portfolios based on company fundamentals and proprietary analysis. The Fund’s
portfolio managers looked for companies that, in their view, had leading competitive advantages, predictable and durable business models, and sustainable free cash flow generation with management teams committed to increasing intrinsic value.
| TOP TEN EQUITY HOLDINGS OF THE PORTFOLIO*** | ||||||||
| 1. | Toro Co. (The) | 2.9 | % | |||||
| 2. | AptarGroup, Inc. | 2.4 | ||||||
| 3. | Pool Corp. | 1.9 | ||||||
| 4. | Spectrum Brands Holdings, Inc. | 1.9 | ||||||
| 5. | West Pharmaceutical Services, Inc. | 1.8 | ||||||
| 6. | Catalent, Inc. | 1.8 | ||||||
| 7. | HealthSouth Corp. | 1.7 | ||||||
| 8. | Performance Food Group Co. | 1.5 | ||||||
| 9. | Brunswick Corp. | 1.5 | ||||||
| 10. | RBC Bearings, Inc. | 1.5 | ||||||
PORTFOLIO COMPOSITION BY SECTOR*** | ||||
| Industrials | 17.8 | % | ||
| Financials | 16.8 | |||
| Consumer Discretionary | 14.2 | |||
| Information Technology | 12.3 | |||
| Health Care | 12.1 | |||
| Materials | 6.1 | |||
| Real Estate | 5.9 | |||
| Consumer Staples | 3.4 | |||
| Energy | 3.4 | |||
| Utilities | 2.6 | |||
| Mutual Funds | 1.2 | |||
| Short-Term Investment | 4.2 | |||
| * | The return shown is based on net asset values calculated for shareholder transactions and may differ from the return shown in the financial highlights, which reflects adjustments made to the net asset values in accordance with accounting principles generally accepted in the United States of America. |
| ** | The adviser seeks to achieve the Fund’s objective. There can be no guarantee it will be achieved. |
| *** | Percentages indicated are based on total investments as of June 30, 2017. The Fund’s portfolio composition is subject to change. |
| JUNE 30, 2017 | J.P. MORGAN SMALL CAP FUNDS | 7 | ||||||
Table of Contents
JPMorgan Small Cap Equity Fund
FUND COMMENTARY
TWELVE MONTHS ENDED JUNE 30, 2017 (Unaudited) (continued)
AVERAGE ANNUAL TOTAL RETURNS AS OF JUNE 30, 2017 | ||||||||||||||
| INCEPTION DATE OF CLASS | 1 YEAR | 5 YEAR | 10 YEAR | |||||||||||
CLASS A SHARES | December 20, 1994 | |||||||||||||
With Sales Charge* | 13.83 | % | 13.42 | % | 9.06 | % | ||||||||
Without Sales Charge | 20.14 | 14.65 | 9.65 | |||||||||||
CLASS C SHARES | February 19, 2005 | |||||||||||||
With CDSC** | 18.53 | 14.09 | 9.11 | |||||||||||
Without CDSC | 19.53 | 14.09 | 9.11 | |||||||||||
CLASS I SHARES | May 7, 1996 | 20.48 | 15.00 | 9.98 | ||||||||||
CLASS R2 SHARES | November 3, 2008 | 19.83 | 14.37 | 9.41 | ||||||||||
CLASS R3 SHARES | September 9, 2016 | 20.18 | 14.66 | 9.66 | ||||||||||
CLASS R4 SHARES | September 9, 2016 | 20.49 | 15.00 | 9.98 | ||||||||||
CLASS R5 SHARES | May 15, 2006 | 20.74 | 15.23 | 10.20 | ||||||||||
CLASS R6 SHARES | May 31, 2016 | 20.80 | 15.24 | 10.21 | ||||||||||
| * | Sales Charge for Class A Shares is 5.25%. |
| ** | Assumes a 1% CDSC (contingent deferred sales charge) for the one year period and 0% CDSC thereafter. |
TEN YEAR PERFORMANCE (6/30/07 TO 6/30/17)
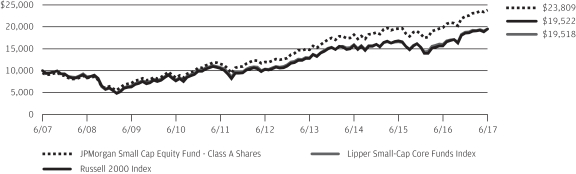
The performance quoted is past performance and is not a guarantee of future results. Mutual funds are subject to certain market risks. Investment returns and principal value of an investment will fluctuate so that an investor’s shares, when redeemed, may be worth more or less than their original cost. Current performance may be higher or lower than the performance data shown. For up-to-date month-end performance information please call 1-800-480-4111.
Returns for Class R2 and Class R3 Shares prior to their inception date are based on the performance of Class A Shares. The actual returns of Class R2 Shares would have been lower than those shown because Class R2 Shares have higher expenses than Class A Shares. The actual returns of Class R3 Shares would have been different than those shown because Class R3 Shares have different expenses than Class A Shares.
Returns for Class R4 Shares prior to their inception date are based on the performance of the Class I Shares (formerly Select Class Shares). The actual returns for Class R4 Shares would have been similar to those shown because Class R4 Shares have similar expenses to Class I Shares.
Returns for Class R6 Shares prior to their inception date are based on the performance of the Class R5 Shares. The actual returns of Class R6 Shares would have been different than those shown because Class R6 Shares have different expenses than Class R5 Shares.
The graph illustrates comparative performance for $10,000 invested in Class A Shares of the JPMorgan Small Cap Equity Fund, the Russell 2000 Index and the Lipper Small-Cap Core Funds Index from June 30, 2007 to June 30, 2017.
The performance of the Fund assumes reinvestment of all dividends and capital gain distributions, if any, and includes a sales charge. The performance of the Russell 2000 Index does not reflect the deduction of expenses or a sales charge associated with a mutual fund and has been adjusted to reflect reinvestment of all dividends and capital gain distributions of the securities included in the benchmark, if applicable. The performance of the Lipper Small-Cap Core Funds Index includes expenses associated with a mutual fund, such as investment management fees. These expenses are not identical to the expenses incurred by the Fund. The Russell 2000 Index is an unmanaged index which measures the performance of the 2000 smallest stocks (on the basis of capitalization) in the Russell 3000 Index. The Lipper Small-Cap Core Funds Index is an index based on the total returns of certain mutual funds within the Fund’s designated category as determined by Lipper, Inc. Investors cannot invest directly in an index.
Class A Shares have a $1,000 minimum initial investment and carry a 5.25% sales charge.
Fund performance may reflect the waiver of the Fund’s fees and reimbursement of expenses for certain periods since the inception date. Without these waivers and reimbursements, performance would have been lower. Also, performance shown in this section does not reflect the deduction of taxes that a shareholder would pay on Fund distributions or redemptions of Fund shares.
The returns shown are based on net asset values calculated for shareholder transactions and may differ from the returns shown in the financial highlights, which reflect adjustments made to the net asset values in accordance with accounting principles generally accepted in the United States of America.
| 8 | J.P. MORGAN SMALL CAP FUNDS | JUNE 30, 2017 | ||||
Table of Contents
JPMorgan Small Cap Growth Fund
FUND COMMENTARY
TWELVE MONTHS ENDED JUNE 30, 2017 (Unaudited)
| REPORTING PERIOD RETURN: | ||||
| Fund (Class A Shares, without a sales charge)* | 34.36% | |||
| Russell 2000 Growth Index | 24.40% | |||
| Net Assets as of 6/30/2017 (In Thousands) | $1,315,928 | |||
INVESTMENT OBJECTIVE**
The JPMorgan Small Cap Growth Fund (the “Fund”) seeks long-term capital growth primarily by investing in a portfolio of equity securities of small-capitalization and emerging growth companies.
WHAT WERE THE MAIN DRIVERS OF THE FUND’S PERFORMANCE?
The Fund’s Class A Shares, without a sales charge, outperformed the Russell 2000 Growth Index (the “Benchmark”) for the twelve months ended June 30, 2017. The Fund’s security selection in the consumer discretionary sector and its security selection and overweight position in the information technology sector were leading contributors to performance relative to the Benchmark. The Fund’s security selection in the materials sector was a leading detractor from relative performance.
Leading individual contributors to relative performance included the Fund’s overweight positions in Shopify Inc., Exact Sciences Corp. and Teladoc Inc. Shares of Shopify, a provider of sales software for small and mid-sized businesses, rose amid consistent positive earnings and expanded services. Shares of Exact Sciences, a medical diagnostics company, rose in 2017 amid increased physician and insurer adoption of its colon cancer screening test. Shares of Teladoc, a provider of on-demand, remote health care, rose after the company reported improved cash flow.
Leading individual detractors from relative performance included the Fund’s overweight positions in TherapeuticsMD Inc. and Advanced Drainage Systems Inc. and its underweight position in Chemours Co. Shares of TherapeuticsMD, a drug maker, fell in mid-2017 after the U.S. Food and Drug Administration cited problems with the company’s product labeling. Shares of Advanced Drainage Systems, a manufacturer of thermoplastic water pipes, fell in late 2016 after the company delayed required financial reporting. Shares of Chemours, a chemicals manufacturer, rose after the company settled personal injury lawsuits related to toxic chemicals.
HOW WAS THE FUND POSITIONED?
The Fund’s portfolio managers utilized a bottom-up approach to stock selection, researching individual companies in an effort to construct portfolios of stocks that have strong fundamentals.
The Fund’s portfolio managers preferred to invest in high quality companies with durable franchises that, in their view, possessed the ability to generate strong future earnings growth.
| TOP TEN EQUITY HOLDINGS OF THE PORTFOLIO*** | ||||||||
| 1. | John Bean Technologies Corp. | 1.8 | % | |||||
| 2. | Boyd Gaming Corp. | 1.8 | ||||||
| 3. | Masonite International Corp. | 1.5 | ||||||
| 4. | Summit Materials, Inc., Class A | 1.5 | ||||||
| 5. | RingCentral, Inc., Class A | 1.4 | ||||||
| 6. | Littelfuse, Inc. | 1.4 | ||||||
| 7. | Kite Pharma, Inc. | 1.3 | ||||||
| 8. | Texas Capital Bancshares, Inc. | 1.3 | ||||||
| 9. | Graco, Inc. | 1.3 | ||||||
| 10. | Trex Co., Inc. | 1.2 | ||||||
PORTFOLIO COMPOSITION BY SECTOR*** | ||||
| Information Technology | 27.1 | % | ||
| Health Care | 21.7 | |||
| Industrials | 19.0 | |||
| Consumer Discretionary | 11.9 | |||
| Financials | 5.6 | |||
| Consumer Staples | 4.5 | |||
| Materials | 3.8 | |||
| Real Estate | 2.0 | |||
| Energy | 1.3 | |||
| Short-Term Investment | 3.1 | |||
| * | The return shown is based on net asset values calculated for shareholder transactions and may differ from the return shown in the financial highlights, which reflects adjustments made to the net asset values in accordance with accounting principles generally accepted in the United States of America. |
| ** | The adviser seeks to achieve the Fund’s objective. There can be no guarantee it will be achieved. |
| *** | Percentages indicated are based on total investments as of June 30, 2017. The Fund’s portfolio composition is subject to change. |
| JUNE 30, 2017 | J.P. MORGAN SMALL CAP FUNDS | 9 | ||||||
Table of Contents
JPMorgan Small Cap Growth Fund
FUND COMMENTARY
TWELVE MONTHS ENDED JUNE 30, 2017 (Unaudited) (continued)
AVERAGE ANNUAL TOTAL RETURNS AS OF JUNE 30, 2017 | ||||||||||||||
| INCEPTION DATE OF CLASS | 1 YEAR | 5 YEAR | 10 YEAR | |||||||||||
CLASS A SHARES | July 1, 1991 | |||||||||||||
With Sales Charge* | 27.34 | % | 13.44 | % | 7.59 | % | ||||||||
Without Sales Charge | 34.36 | 14.68 | 8.17 | |||||||||||
CLASS C SHARES | November 4, 1997 | |||||||||||||
With CDSC** | 32.67 | 14.09 | 7.59 | |||||||||||
Without CDSC | 33.67 | 14.09 | 7.59 | |||||||||||
CLASS I SHARES (FORMERLY SELECT CLASS SHARES) | March 26, 1996 | 34.61 | 14.96 | 8.43 | ||||||||||
CLASS L SHARES (FORMERLY INSTITUTIONAL CLASS SHARES) | February 19, 2005 | 34.93 | 15.14 | 8.60 | ||||||||||
CLASS R2 SHARES | November 3, 2008 | 33.96 | 14.39 | 7.90 | ||||||||||
CLASS R5 SHARES | September 9, 2016 | 34.93 | 15.14 | 8.60 | ||||||||||
CLASS R6 SHARES | November 30, 2010 | 34.99 | 15.26 | 8.67 | ||||||||||
| * | Sales Charge for Class A Shares is 5.25%. |
| ** | Assumes a 1% CDSC (contingent deferred sales charge) for the one year period and 0% CDSC thereafter. |
TEN YEAR PERFORMANCE (6/30/07 TO 6/30/17)
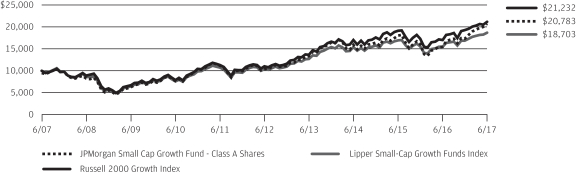
The performance quoted is past performance and is not a guarantee of future results. Mutual funds are subject to certain market risks. Investment returns and principal value of an investment will fluctuate so that an investor’s shares, when redeemed, may be worth more or less than their original cost. Current performance may be higher or lower than the performance data shown. For up-to-date month-end performance information please call 1-800-480-4111.
Returns for Class R2 Shares prior to their inception date are based on the performance of Class A Shares. All prior class performance for Class R2 Shares has been adjusted to reflect the differences in expenses between classes.
Returns for Class R5 and Class R6 Shares prior to their inception date are based on the performance of Class L Shares (formerly Institutional Class Shares). The actual returns for Class R5 and Class R6 Shares would have been different than those shown because Class R5 and Class R6 Shares have different expenses than Class L Shares.
The graph illustrates comparative performance for $10,000 invested in Class A Shares of the JPMorgan Small Cap Growth Fund, the Russell 2000 Growth Index and the Lipper Small-Cap Growth Funds Index from June 30, 2007 to June 30, 2017. The performance of the Fund assumes reinvestment of all dividends and capital gain distributions, if any, and includes a sales charge. The performance of the Russell 2000 Growth Index does not reflect the deduction of expenses or a sales charge associated with a mutual fund and has been adjusted to reflect
reinvestment of all dividends and capital gain distributions of the securities included in the benchmark, if applicable. The performance of the Lipper Small-Cap Growth Funds Index includes expenses associated with a mutual fund, such as investment management fees. These expenses are not identical to the expenses incurred by the Fund. The Russell 2000 Growth Index is an unmanaged index which measures the performance of those Russell 2000 companies with higher price-to-book ratios and higher forecasted growth values. The Lipper Small-Cap Growth Funds Index is an index based on the total returns of certain mutual funds within the Fund’s designated category as determined by Lipper, Inc. Investors cannot invest directly in an index.
Class A Shares have a $1,000 minimum initial investment and carry a 5.25% sales charge.
Fund performance may reflect the waiver of the Fund’s fees and reimbursement of expenses for certain periods since the inception date. Without these waivers and reimbursements, performance would have been lower. Also, performance shown in this section does not reflect the deduction of taxes that a shareholder would pay on Fund distributions or redemptions of Fund shares.
The returns shown are based on net asset values calculated for shareholder transactions and may differ from the returns shown in the financial highlights, which reflect adjustments made to the net asset values in accordance with accounting principles generally accepted in the United States of America.
| 10 | J.P. MORGAN SMALL CAP FUNDS | JUNE 30, 2017 | ||||
Table of Contents
FUND COMMENTARY
TWELVE MONTHS ENDED JUNE 30, 2017 (Unaudited)
| REPORTING PERIOD RETURN: | ||||
| Fund (Class I Shares)*1 | 19.30% | |||
| Russell 2000 Value Index | 24.86% | |||
| Net Assets as of 6/30/2017 (In Thousands) | $2,115,203 | |||
INVESTMENT OBJECTIVE**
The JPMorgan Small Cap Value Fund (the “Fund”) seeks long-term capital growth primarily by investing in equity securities of small-capitalization companies.
WHAT WERE THE MAIN DRIVERS OF THE FUND’S PERFORMANCE?
The Fund’s Class I Shares underperformed the Russell 2000 Value Index (the “Benchmark”) for the twelve months ended June 30, 2017. The Fund’s security selection in the health care and energy sectors was a leading detractor from performance relative to the Benchmark, while the Fund’s security selection in the consumer discretionary and information technology sectors was a leading contributor to relative performance.
Leading individual detractors from relative performance included the Fund’s overweight positions in SeaDrill Ltd., Windstream Holdings Inc. and FTI Consulting Inc. Shares of SeaDrill, an offshore oil drilling contractor, fell after the company announced it might file for bankruptcy. Shares of Windstream Holdings Co., a communications technology provider, fell after the company reported a wider-than-expected loss. Shares of FTI Consulting, a business advisory company, fell on lower-than-expected earnings.
Leading individual contributors to relative performance included the Fund’s overweight positions in Take-Two Interactive Software Inc., Children’s Place Inc. and Rex American Resources Corp. Shares of Take-Two Interactive Software, a maker of computer and video games that was not held in the Benchmark, rose on better-than-expected earnings. Shares of Children’s Place, a retailer of children’s apparel that was not held in the Benchmark, rose after the company reported better-than-expected earnings and sales. Shares of Rex American Resources, an ethanol producer, rose after the company reported strong growth in sales and earnings.
HOW WAS THE FUND POSITIONED?
In accordance with its investment process, the Fund’s portfolio managers take limited sector bets and construct the Fund so that stock selection is typically the primary driver of its relative performance versus the Benchmark. The Fund’s portfolio managers use a quantitative ranking methodology to identify stocks in each sector that, in their view, trade at attractive levels. Through bottom-up fundamental research, they seek
companies that they believe have attractive valuations, exhibit high earnings quality and have management teams that make effective capital deployment decisions. During the reporting period, the Fund was managed and positioned in accordance with this investment process.
| TOP TEN EQUITY HOLDINGS OF THE PORTFOLIO*** | ||||||||
| 1. | Benchmark Electronics, Inc. | 1.2 | % | |||||
| 2. | EMCOR Group, Inc. | 1.1 | ||||||
| 3. | Westamerica Bancorp | 1.1 | ||||||
| 4. | Dillard’s, Inc., Class A | 1.1 | ||||||
| 5. | Take-Two Interactive Software, Inc. | 1.0 | ||||||
| 6. | Tech Data Corp. | 1.0 | ||||||
| 7. | CNO Financial Group, Inc. | 1.0 | ||||||
| 8. | ACCO Brands Corp. | 1.0 | ||||||
| 9. | CYS Investments, Inc. | 1.0 | ||||||
| 10. | Wabash National Corp. | 1.0 | ||||||
PORTFOLIO COMPOSITION BY SECTOR*** | ||||
| Financials | 30.2 | % | ||
| Industrials | 13.5 | |||
| Consumer Discretionary | 10.6 | |||
| Real Estate | 10.3 | |||
| Information Technology | 9.9 | |||
| Utilities | 6.5 | |||
| Health Care | 5.8 | |||
| Energy | 4.8 | |||
| Materials | 4.5 | |||
| Consumer Staples | 1.9 | |||
| Telecommunication Services | 0.0 | |||
| Short-Term Investment | 2.0 | |||
| * | The return shown is based on net asset values calculated for shareholder transactions and may differ from the return shown in the financial highlights, which reflects adjustments made to the net asset values in accordance with accounting principles generally accepted in the United States of America. |
| ** | The adviser seeks to achieve the Fund’s objective. There can be no guarantee it will be achieved. |
| *** | Percentages indicated are based on total investments as of June 30, 2017. The Fund’s portfolio composition is subject to change. |
| 1 | On April 3, 2017, the Fund’s Select Class Shares were renamed Class I Shares. |
| JUNE 30, 2017 | J.P. MORGAN SMALL CAP FUNDS | 11 | ||||||
Table of Contents
JPMorgan Small Cap Value Fund
FUND COMMENTARY
TWELVE MONTHS ENDED JUNE 30, 2017 (Unaudited) (continued)
AVERAGE ANNUAL TOTAL RETURNS AS OF JUNE 30, 2017 | ||||||||||||||
| INCEPTION DATE OF CLASS | 1 YEAR | 5 YEAR | 10 YEAR | |||||||||||
CLASS A SHARES | January 27, 1995 | |||||||||||||
With Sales Charge* | 12.75 | % | 11.51 | % | 5.56 | % | ||||||||
Without Sales Charge | 19.01 | 12.72 | 6.13 | |||||||||||
CLASS C SHARES | March 22, 1999 | |||||||||||||
With CDSC** | 17.27 | 12.04 | 5.49 | |||||||||||
Without CDSC | 18.27 | 12.04 | 5.49 | |||||||||||
CLASS I SHARES | January 27, 1995 | 19.30 | 13.01 | 6.40 | ||||||||||
CLASS R2 SHARES | November 3, 2008 | 18.68 | 12.44 | 5.86 | ||||||||||
CLASS R3 SHARES | September 9, 2016 | 18.99 | 12.70 | 6.11 | ||||||||||
CLASS R4 SHARES | September 9, 2016 | 19.24 | 12.98 | 6.38 | ||||||||||
CLASS R5 SHARES | May 15, 2006 | 19.43 | 13.12 | 6.50 | ||||||||||
CLASS R6 SHARES | February 22, 2005 | 19.59 | 13.22 | 6.57 | ||||||||||
| * | Sales Charge for Class A Shares is 5.25%. |
| ** | Assumes a 1% CDSC (contingent deferred sales charge) for the one year period and 0% CDSC thereafter. |
TEN YEAR PERFORMANCE (6/30/07 TO 6/30/17)
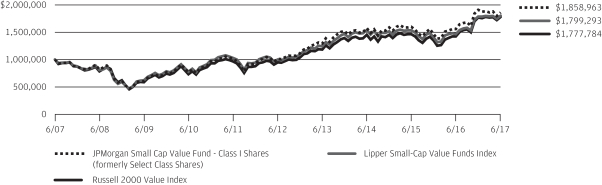
The performance quoted is past performance and is not a guarantee of future results. Mutual funds are subject to certain market risks. Investment returns and principal value of an investment will fluctuate so that an investor’s shares, when redeemed, may be worth more or less than their original cost. Current performance may be higher or lower than the performance data shown. For up-to-date month-end performance information please call 1-800-480-4111.
Returns for Class R2 and Class R4 Shares prior to their inception date are based on the performance of the Class I Shares (formerly Select Class Shares). Returns for the Class R3 Shares prior to their inception dates are based on the performance of Class A Shares. Prior performance for Class R2, Class R3 and Class R4 Shares has been adjusted to reflect the differences in expenses between classes.
The graph illustrates comparative performance for $1,000,000 invested in Class I Shares of the JPMorgan Small Cap Value Fund, the Russell 2000 Value Index and the Lipper Small-Cap Value Funds Index from June 30, 2007 to June 30, 2017. The performance of the Fund assumes reinvestment of all dividends and capital gain distributions, if any, and does not include a sales charge. The performance of the Russell 2000 Value Index does not reflect the deduction of expenses or a sales charge associated with a mutual fund and has been adjusted to reflect reinvestment of all dividends and capital
gain distributions of the securities included in the benchmark, if applicable. The performance of the Lipper Small-Cap Value Funds Index includes expenses associated with a mutual fund, such as investment management fees. These expenses are not identical to the expenses incurred by the Fund. The Russell 2000 Value Index is an unmanaged index which measures the performance of those Russell 2000 companies with lower price-to-book ratios and lower forecasted growth values. The Lipper Small-Cap Value Funds Index is an index based on the total returns of certain mutual funds within the Fund’s designated category as determined by Lipper, Inc. Investors cannot invest directly in an index.
Class I Shares have a $1,000,000 minimum initial investment.
Fund performance may reflect the waiver of the Fund’s fees and reimbursement of expenses for certain periods since the inception date. Without these waivers and reimbursements, performance would have been lower. Also, performance shown in this section does not reflect the deduction of taxes that a shareholder would pay on Fund distributions or redemptions of Fund shares.
The returns shown are based on net asset values calculated for shareholder transactions and may differ from the returns shown in the financial highlights, which reflect adjustments made to the net asset values in accordance with accounting principles generally accepted in the United States of America.
| 12 | J.P. MORGAN SMALL CAP FUNDS | JUNE 30, 2017 | ||||
Table of Contents
JPMorgan U.S. Small Company Fund
FUND COMMENTARY
TWELVE MONTHS ENDED JUNE 30, 2017 (Unaudited)
| REPORTING PERIOD RETURN: | ||||
| Fund (Class L Shares)*1 | 20.50% | |||
| Russell 2000 Index | 24.60% | |||
| Net Assets as of 6/30/2017 (In Thousands) | $1,751,673 | |||
INVESTMENT OBJECTIVE**
The JPMorgan U.S. Small Company Fund (the “Fund”) seeks to provide high total return from a portfolio of small company stocks.
WHAT WERE THE MAIN DRIVERS OF THE FUND’S PERFORMANCE?
The Fund’s Class L Shares underperformed the Russell 2000 Index (the “Benchmark”) for the twelve months ended June 30, 2017. The Fund’s security selection in the health care and industrials sectors was a leading detractor from performance relative to the Benchmark, while the Fund’s security selection in the information technology sector was a leading contributor to relative performance.
Leading individual detractors from relative performance included the Fund’s overweight positions in Huron Consulting Group Inc., Windstream Holdings Inc. and GNC Holdings Inc. Shares of Huron Consulting Group, a provider of management consulting, fell after the company reported lower-than-expected earnings and revenue. Shares of Windstream Holdings, a communications technology provider, fell after the company reported a wider-than-expected loss. Shares of GNC Holdings, a retailer of health supplements, fell after the company reported a drop in sales.
Leading individual contributors to relative performance included the Fund’s overweight positions in Take-Two Interactive Software Inc., Children’s Place Inc. and InvenSense Inc. Shares of Take-Two Interactive Software, a maker of computer and video games, rose on better-than-expected earnings. Shares of Children’s Place, a retailer of children’s apparel, rose after the company reported better-than-expected earnings and sales. Shares of InvenSense, a maker of motion tracking systems and gyroscopes for consumer electronics, rose after the company agreed to a $1.3 billion takeover by TDK Corp.
HOW WAS THE FUND POSITIONED?
In accordance with its investment process, the Fund’s portfolio managers take limited sector bets and construct the Fund so that stock selection is typically the primary driver of its relative performance versus the Benchmark. The Fund’s portfolio managers use a quantitative ranking methodology to identify stocks in each sector that, in their view, trade at attractive levels. Through bottom-up fundamental research, they seek
companies that exhibit high earnings quality and have management teams that make effective capital deployment decisions. During the reporting period, the Fund was managed and positioned in accordance with this investment process.
| TOP TEN EQUITY HOLDINGS OF THE PORTFOLIO*** | ||||||||
| 1. | Taylor Morrison Home Corp., Class A | 1.3 | % | |||||
| 2. | Tivity Health, Inc. | 1.1 | ||||||
| 3. | Take-Two Interactive Software, Inc. | 1.1 | ||||||
| 4. | Aspen Technology, Inc. | 1.1 | ||||||
| 5. | CoreSite Realty Corp. | 1.1 | ||||||
| 6. | Wright Medical Group NV | 1.1 | ||||||
| 7. | Children’s Place, Inc. (The) | 1.0 | ||||||
| 8. | REX American Resources Corp. | 1.0 | ||||||
| 9. | ACCO Brands Corp. | 1.0 | ||||||
| 10. | EMCOR Group, Inc. | 0.9 | ||||||
PORTFOLIO COMPOSITION BY SECTOR*** | ||||
| Financials | 17.5 | % | ||
| Information Technology | 16.6 | |||
| Industrials | 15.0 | |||
| Health Care | 14.4 | |||
| Consumer Discretionary | 11.7 | |||
| Real Estate | 6.3 | |||
| Materials | 3.7 | |||
| Energy | 3.5 | |||
| Utilities | 3.5 | |||
| Consumer Staples | 2.7 | |||
| Telecommunication Services | 0.6 | |||
| Short-Term Investment | 4.5 | |||
| * | The return shown is based on net asset values calculated for shareholder transactions and may differ from the return shown in the financial highlights, which reflects adjustments made to the net asset values in accordance with accounting principles generally accepted in the United States of America. |
| ** | The adviser seeks to achieve the Fund’s objective. There can be no guarantee it will be achieved. |
| *** | Percentages indicated are based on total investments as of June 30, 2017. The Fund’s portfolio composition is subject to change. |
| 1 | On December 1, 2016, the Fund’s Institutional Class Shares were re-designated and renamed Class L Shares. |
| JUNE 30, 2017 | J.P. MORGAN SMALL CAP FUNDS | 13 | ||||||
Table of Contents
JPMorgan U.S. Small Company Fund
FUND COMMENTARY
TWELVE MONTHS ENDED JUNE 30, 2017 (Unaudited) (continued)
AVERAGE ANNUAL TOTAL RETURNS AS OF JUNE 30, 2017 | ||||||||||||||
| INCEPTION DATE OF CLASS | 1 YEAR | 5 YEAR | 10 YEAR | |||||||||||
CLASS A SHARES | November 1, 2007 | |||||||||||||
With Sales Charge* | 13.65 | % | 13.09 | % | 6.50 | % | ||||||||
Without Sales Charge | 19.97 | 14.31 | 7.08 | |||||||||||
CLASS C SHARES | November 1, 2007 | |||||||||||||
With CDSC** | 18.43 | 13.77 | 6.57 | |||||||||||
Without CDSC | 19.43 | 13.77 | 6.57 | |||||||||||
CLASS I SHARES (FORMERLY SELECT CLASS SHARES) | September 10, 2001 | 20.29 | 14.62 | 7.35 | ||||||||||
CLASS L SHARES (FORMERLY INSTITUTIONAL CLASS SHARES) | November 4, 1993 | 20.50 | 14.81 | 7.54 | ||||||||||
CLASS R2 SHARES | November 1, 2011 | 19.70 | 14.04 | 6.93 | ||||||||||
CLASS R3 SHARES | September 9, 2016 | 19.98 | 14.31 | 7.08 | ||||||||||
CLASS R4 SHARES | September 9, 2016 | 20.30 | 14.63 | 7.36 | ||||||||||
CLASS R5 SHARES | September 9, 2016 | 20.45 | 14.80 | 7.54 | ||||||||||
CLASS R6 SHARES | November 1, 2011 | 20.64 | 14.93 | 7.60 | ||||||||||
| * | Sales Charge for Class A Shares is 5.25%. |
| ** | Assumes a 1% CDSC (contingent deferred sales charge) for the one year period and 0% CDSC thereafter. |
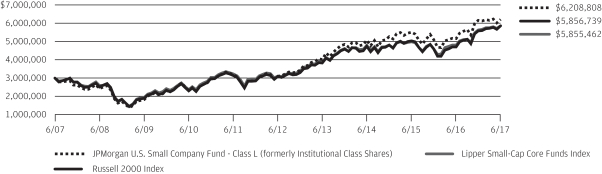
TEN YEAR PERFORMANCE (6/30/07 TO 6/30/17)
The performance quoted is past performance and is not a guarantee of future results. Mutual funds are subject to certain market risks. Investment returns and principal value of an investment will fluctuate so that an investor’s shares, when redeemed, may be worth more or less than their original cost. Current performance may be higher or lower than the performance data shown. For up-to-date month-end performance information please call 1-800-480-4111.
Returns for Class A, Class C and Class R4 Shares prior to their inception dates are based on the performance of the Class I Shares (formerly Select Class Shares). The actual returns for Class A and Class C Shares would have been lower than those shown because Class A and Class C Shares have higher expenses than Class I Shares. The actual returns for Class R4 Shares would have been similar to those shown because Class R4 Shares have similar expenses to Class I Shares.
Returns for Class R2 prior to their inception date are based on the performance of the Class A Shares from November 1, 2007 to October 31, 2011 and the performance of Class I Shares prior to November 1, 2007. Returns for Class R3 prior to their inception date are based on the performance of Class A Shares from November 1, 2007 to September 8, 2016 and the performance of Class I Shares prior to November 1, 2007. The actual returns of Class R2 Shares would have been lower than those shown because Class R2 Shares have higher expenses than Class A Shares and Class I Shares. The actual returns for Class R3 Shares would have been similar to those shown because Class R3 Shares have similar expenses to Class A Shares and higher expenses than Class I Shares.
Returns for Class R5 and Class R6 Shares prior to their inception date are based on the performance of the Class L Shares (formerly Institutional Class Shares). The actual returns of Class R5 Shares would have been lower than those shown because Class R5 Shares have higher expenses than Class L Shares. The actual returns of Class R6 Shares would have been different than these shown because Class R6 Shares have different expenses than Class L Shares.
The graph illustrates comparative performance for $3,000,000 invested in Class L Shares of the JPMorgan U.S. Small Company Fund, the Russell 2000 Index and the Lipper Small-Cap Core Funds Index from June 30, 2007 to June 30, 2017. The performance of the Fund assumes reinvestment of all dividends and capital gain distributions, if any, and does not include a sales charge. The performance of the Russell 2000 Index does not reflect the deduction of expenses associated with a mutual fund and has been adjusted to reflect reinvestment of all dividends and capital gain distributions of the securities included in the benchmark, if applicable. The performance of the Lipper Small-Cap Core Funds Index includes expenses associated with a mutual fund, such as investment management fees. These expenses are not identical to the expenses incurred by the Fund. The Russell 2000 Index is an unmanaged index which measures the performance of the 2000 smallest stocks (on the basis of capitalization) in the Russell 3000 Index. The Lipper Small-Cap Core Funds Index is an index based on the total returns of certain mutual funds within the Fund’s designated category as determined by Lipper, Inc. Investors cannot invest directly in an index.
Class L Shares have a $3,000,000 minimum initial investment.
Fund performance may reflect the waiver of the Fund’s fees and reimbursement of expenses for certain periods since the inception date. Without these waivers and reimbursements, performance would have been lower. Also, performance shown in this section does not reflect the deduction of taxes that a shareholder would pay on Fund distributions or redemptions of Fund shares.
The returns shown are based on net asset values calculated for shareholder transactions and may differ from the returns shown in the financial highlights, which reflect adjustments made to the net asset values in accordance with accounting principles generally accepted in the United States of America.
| 14 | J.P. MORGAN SMALL CAP FUNDS | JUNE 30, 2017 | ||||
Table of Contents
JPMorgan Dynamic Small Cap Growth Fund
SCHEDULE OF PORTFOLIO INVESTMENTS
AS OF JUNE 30, 2017
(Amounts in thousands)
| SHARES | SECURITY DESCRIPTION | VALUE($) | ||||||
Common Stocks — 97.6% | ||||||||
Consumer Discretionary — 11.9% |
| |||||||
Distributors — 1.1% |
| |||||||
| 16 | Pool Corp. | 1,853 | ||||||
|
| |||||||
Diversified Consumer Services — 0.7% |
| |||||||
| 15 | Bright Horizons Family Solutions, Inc. (a) | 1,176 | ||||||
|
| |||||||
Hotels, Restaurants & Leisure — 3.9% |
| |||||||
| 124 | Boyd Gaming Corp. | 3,085 | ||||||
| 37 | Texas Roadhouse, Inc. | 1,875 | ||||||
| 8 | Vail Resorts, Inc. | 1,613 | ||||||
|
| |||||||
| 6,573 | ||||||||
|
| |||||||
Household Durables — 0.6% |
| |||||||
| 83 | TRI Pointe Group, Inc. (a) | 1,096 | ||||||
|
| |||||||
Internet & Direct Marketing Retail — 1.0% |
| |||||||
| 21 | Wayfair, Inc., Class A (a) | 1,610 | ||||||
|
| |||||||
Multiline Retail — 0.9% |
| |||||||
| 37 | Ollie’s Bargain Outlet Holdings, Inc. (a) | 1,579 | ||||||
|
| |||||||
Specialty Retail — 2.6% |
| |||||||
| 13 | Burlington Stores, Inc. (a) | 1,185 | ||||||
| 17 | Lithia Motors, Inc., Class A | 1,592 | ||||||
| 12 | Penske Automotive Group, Inc. | 516 | ||||||
| 57 | Tile Shop Holdings, Inc. | 1,178 | ||||||
|
| |||||||
| 4,471 | ||||||||
|
| |||||||
Textiles, Apparel & Luxury Goods — 1.1% |
| |||||||
| 69 | Wolverine World Wide, Inc. | 1,932 | ||||||
|
| |||||||
Total Consumer Discretionary | 20,290 | |||||||
|
| |||||||
Consumer Staples — 4.5% |
| |||||||
Food & Staples Retailing — 2.1% |
| |||||||
| 9 | Casey’s General Stores, Inc. | 961 | ||||||
| 58 | Performance Food Group Co. (a) | 1,593 | ||||||
| 44 | Sprouts Farmers Market, Inc. (a) | 994 | ||||||
|
| |||||||
| 3,548 | ||||||||
|
| |||||||
Food Products — 1.3% |
| |||||||
| 74 | Freshpet, Inc. (a) | 1,224 | ||||||
| 28 | Snyder’s-Lance, Inc. | 977 | ||||||
|
| |||||||
| 2,201 | ||||||||
|
| |||||||
Personal Products — 1.1% |
| |||||||
| 72 | elf Beauty, Inc. (a) | 1,968 | ||||||
|
| |||||||
Total Consumer Staples | 7,717 | |||||||
|
| |||||||
Energy — 1.4% |
| |||||||
Oil, Gas & Consumable Fuels — 1.4% |
| |||||||
| 7 | Diamondback Energy, Inc. (a) | 652 | ||||||
| 62 | Jagged Peak Energy, Inc. (a) | 830 | ||||||
| SHARES | SECURITY DESCRIPTION | VALUE($) | ||||||
Oil, Gas & Consumable Fuels — continued |
| |||||||
| 26 | RSP Permian, Inc. (a) | 830 | ||||||
|
| |||||||
Total Energy | 2,312 | |||||||
|
| |||||||
Financials — 5.6% |
| |||||||
Banks — 2.4% |
| |||||||
| 21 | Bank of the Ozarks, Inc. | 983 | ||||||
| 6 | Signature Bank (a) | 893 | ||||||
| 28 | Texas Capital Bancshares, Inc. (a) | 2,199 | ||||||
|
| |||||||
| 4,075 | ||||||||
|
| |||||||
Capital Markets — 2.7% |
| |||||||
| 29 | Evercore Partners, Inc., Class A | 2,071 | ||||||
| 34 | Financial Engines, Inc. | 1,230 | ||||||
| 128 | PennantPark Investment Corp. | 948 | ||||||
| 41 | WisdomTree Investments, Inc. | 422 | ||||||
|
| |||||||
| 4,671 | ||||||||
|
| |||||||
Thrifts & Mortgage Finance — 0.5% |
| |||||||
| 35 | BofI Holding, Inc. (a) | 824 | ||||||
|
| |||||||
Total Financials | 9,570 | |||||||
|
| |||||||
Health Care — 22.1% |
| |||||||
Biotechnology — 9.4% |
| |||||||
| 20 | ACADIA Pharmaceuticals, Inc. (a) | 545 | ||||||
| 24 | Axovant Sciences Ltd. (a) | 546 | ||||||
| 56 | Bellicum Pharmaceuticals, Inc. (a) | 656 | ||||||
| 30 | Biohaven Pharmaceutical Holding Co. Ltd., (Canada) (a) | 757 | ||||||
| 41 | Coherus Biosciences, Inc. (a) | 595 | ||||||
| 59 | Exact Sciences Corp. (a) | 2,073 | ||||||
| 30 | FibroGen, Inc. (a) | 962 | ||||||
| 83 | Halozyme Therapeutics, Inc. (a) | 1,067 | ||||||
| 66 | Ignyta, Inc. (a) | 680 | ||||||
| 27 | Insmed, Inc. (a) | 455 | ||||||
| 22 | Kite Pharma, Inc. (a) | 2,303 | ||||||
| 12 | Neurocrine Biosciences, Inc. (a) | 558 | ||||||
| 18 | Portola Pharmaceuticals, Inc. (a) | 1,017 | ||||||
| 34 | REGENXBIO, Inc. (a) | 663 | ||||||
| 14 | Sage Therapeutics, Inc. (a) | 1,130 | ||||||
| 18 | Spark Therapeutics, Inc. (a) | 1,067 | ||||||
| 2 | TESARO, Inc. (a) | 286 | ||||||
| 32 | Versartis, Inc. (a) | 553 | ||||||
|
| |||||||
| 15,913 | ||||||||
|
| |||||||
Health Care Equipment & Supplies — 4.7% |
| |||||||
| 142 | GenMark Diagnostics, Inc. (a) | 1,685 | ||||||
| 22 | Insulet Corp. (a) | 1,145 | ||||||
| 73 | K2M Group Holdings, Inc. (a) | 1,788 | ||||||
SEE NOTES TO FINANCIAL STATEMENTS.
| JUNE 30, 2017 | J.P. MORGAN SMALL CAP FUNDS | 15 | ||||||
Table of Contents
JPMorgan Dynamic Small Cap Growth Fund
SCHEDULE OF PORTFOLIO INVESTMENTS
AS OF JUNE 30, 2017 (continued)
(Amounts in thousands)
| SHARES | SECURITY DESCRIPTION | VALUE($) | ||||||
Common Stocks — continued | ||||||||
Health Care Equipment & Supplies — continued |
| |||||||
| 19 | Nevro Corp. (a) | 1,426 | ||||||
| 170 | Novadaq Technologies, Inc., (Canada) (a) | 1,991 | ||||||
|
| |||||||
| 8,035 | ||||||||
|
| |||||||
Health Care Providers & Services — 3.5% |
| |||||||
| 43 | Acadia Healthcare Co., Inc. (a) | 2,132 | ||||||
| 55 | Teladoc, Inc. (a) | 1,922 | ||||||
| 11 | WellCare Health Plans, Inc. (a) | 1,895 | ||||||
|
| |||||||
| 5,949 | ||||||||
|
| |||||||
Health Care Technology — 1.7% |
| |||||||
| 75 | Evolent Health, Inc., Class A (a) | 1,905 | ||||||
| 17 | Veeva Systems, Inc., Class A (a) | 1,041 | ||||||
|
| |||||||
| 2,946 | ||||||||
|
| |||||||
Pharmaceuticals — 2.8% |
| |||||||
| 100 | Horizon Pharma plc (a) | 1,191 | ||||||
| 61 | Nektar Therapeutics (a) | 1,200 | ||||||
| 44 | Revance Therapeutics, Inc. (a) | 1,159 | ||||||
| 226 | TherapeuticsMD, Inc. (a) | 1,194 | ||||||
|
| |||||||
| 4,744 | ||||||||
|
| |||||||
Total Health Care | 37,587 | |||||||
|
| |||||||
Industrials — 19.1% |
| |||||||
Aerospace & Defense — 1.8% |
| |||||||
| 28 | HEICO Corp. | 1,992 | ||||||
| 21 | Hexcel Corp. | 1,105 | ||||||
|
| |||||||
| 3,097 | ||||||||
|
| |||||||
Air Freight & Logistics — 0.8% |
| |||||||
| 21 | XPO Logistics, Inc. (a) | 1,363 | ||||||
|
| |||||||
Building Products — 6.4% |
| |||||||
| 82 | Advanced Drainage Systems, Inc. | 1,639 | ||||||
| 21 | Fortune Brands Home & Security, Inc. | 1,386 | ||||||
| 34 | JELD-WEN Holding, Inc. (a) | 1,106 | ||||||
| 11 | Lennox International, Inc. | 2,107 | ||||||
| 34 | Masonite International Corp. (a) | 2,595 | ||||||
| 32 | Trex Co., Inc. (a) | 2,139 | ||||||
|
| |||||||
| 10,972 | ||||||||
|
| |||||||
Commercial Services & Supplies — 0.9% |
| |||||||
| 66 | Advanced Disposal Services, Inc. (a) | 1,500 | ||||||
|
| |||||||
Industrial Conglomerates — 0.6% |
| |||||||
| 10 | Carlisle Cos., Inc. | 945 | ||||||
|
| |||||||
Machinery — 5.3% |
| |||||||
| 20 | Graco, Inc. | 2,193 | ||||||
| 13 | ITT, Inc. | 526 | ||||||
| 32 | John Bean Technologies Corp. | 3,129 | ||||||
| SHARES | SECURITY DESCRIPTION | VALUE($) | ||||||
Machinery — continued |
| |||||||
| 12 | Middleby Corp. (The) (a) | 1,457 | ||||||
| 26 | Oshkosh Corp. | 1,789 | ||||||
|
| |||||||
| 9,094 | ||||||||
|
| |||||||
Marine — 0.5% |
| |||||||
| 14 | Kirby Corp. (a) | 931 | ||||||
|
| |||||||
Road & Rail — 1.1% |
| |||||||
| 19 | Old Dominion Freight Line, Inc. | 1,809 | ||||||
|
| |||||||
Trading Companies & Distributors — 1.7% |
| |||||||
| 50 | H&E Equipment Services, Inc. | 1,021 | ||||||
| 49 | Rush Enterprises, Inc., Class A (a) | 1,809 | ||||||
|
| |||||||
| 2,830 | ||||||||
|
| |||||||
Total Industrials | 32,541 | |||||||
|
| |||||||
Information Technology — 27.2% |
| |||||||
Communications Equipment — 1.3% |
| |||||||
| 38 | Ciena Corp. (a) | 946 | ||||||
| 71 | Quantenna Communications, Inc. (a) | 1,357 | ||||||
|
| |||||||
| 2,303 | ||||||||
|
| |||||||
Electronic Equipment, Instruments & Components — 1.4% |
| |||||||
| 15 | Littelfuse, Inc. | 2,466 | ||||||
|
| |||||||
Internet Software & Services — 9.5% |
| |||||||
| 28 | 2U, Inc. (a) | 1,329 | ||||||
| 56 | Cloudera, Inc. (a) | 893 | ||||||
| 5 | CoStar Group, Inc. (a) | 1,216 | ||||||
| 52 | Envestnet, Inc. (a) | 2,050 | ||||||
| 49 | GoDaddy, Inc., Class A (a) | 2,084 | ||||||
| 39 | GrubHub, Inc. (a) | 1,721 | ||||||
| 39 | Instructure, Inc. (a) | 1,162 | ||||||
| 29 | MuleSoft, Inc., Class A (a) | 729 | ||||||
| 51 | Nutanix, Inc., Class A (a) | 1,025 | ||||||
| 38 | Okta, Inc. (a) | 874 | ||||||
| 14 | Shopify, Inc., (Canada), Class A (a) | 1,240 | ||||||
| 36 | Trade Desk, Inc. (The), Class A (a) | 1,788 | ||||||
|
| |||||||
| 16,111 | ||||||||
|
| |||||||
Semiconductors & Semiconductor Equipment — 4.7% |
| |||||||
| 28 | Cavium, Inc. (a) | 1,735 | ||||||
| 39 | Inphi Corp. (a) | 1,334 | ||||||
| 30 | MACOM Technology Solutions Holdings, Inc. (a) | 1,670 | ||||||
| 21 | MKS Instruments, Inc. | 1,417 | ||||||
| 19 | Monolithic Power Systems, Inc. | 1,787 | ||||||
|
| |||||||
| 7,943 | ||||||||
|
| |||||||
Software — 10.3% |
| |||||||
| 34 | Appian Corp. (a) | 619 | ||||||
| 36 | Atlassian Corp. plc, (Australia), Class A (a) | 1,277 | ||||||
SEE NOTES TO FINANCIAL STATEMENTS.
| 16 | J.P. MORGAN SMALL CAP FUNDS | JUNE 30, 2017 | ||||
Table of Contents
| SHARES | SECURITY DESCRIPTION | VALUE($) | ||||||
Common Stocks — continued | ||||||||
Software — continued |
| |||||||
| 30 | Guidewire Software, Inc. (a) | 2,054 | ||||||
| 19 | HubSpot, Inc. (a) | 1,246 | ||||||
| 19 | Imperva, Inc. (a) | 916 | ||||||
| 29 | Paycom Software, Inc. (a) | 1,994 | ||||||
| 18 | Proofpoint, Inc. (a) | 1,528 | ||||||
| 68 | RingCentral, Inc., Class A (a) | 2,478 | ||||||
| 28 | Take-Two Interactive Software, Inc. (a) | 2,065 | ||||||
| 9 | Tyler Technologies, Inc. (a) | 1,615 | ||||||
| 61 | Zendesk, Inc. (a) | 1,693 | ||||||
|
| |||||||
| 17,485 | ||||||||
|
| |||||||
Total Information Technology | 46,308 | |||||||
|
| |||||||
Materials — 3.8% |
| |||||||
Chemicals — 1.2% |
| |||||||
| 111 | Ferro Corp. (a) | 2,034 | ||||||
|
| |||||||
Construction Materials — 2.6% |
| |||||||
| 21 | Eagle Materials, Inc. | 1,943 | ||||||
| 89 | Summit Materials, Inc., Class A (a) | 2,556 | ||||||
|
| |||||||
| 4,499 | ||||||||
|
| |||||||
Total Materials | 6,533 | |||||||
|
| |||||||
| SHARES | SECURITY DESCRIPTION | VALUE($) | ||||||
Real Estate — 2.0% |
| |||||||
Equity Real Estate Investment Trusts (REITs) — 1.0% |
| |||||||
| 32 | CubeSmart | 762 | ||||||
| 20 | Highwoods Properties, Inc. | 1,019 | ||||||
|
| |||||||
| 1,781 | ||||||||
|
| |||||||
Real Estate Management & Development — 1.0% |
| |||||||
| 30 | RE/MAX Holdings, Inc., Class A | 1,680 | ||||||
|
| |||||||
Total Real Estate | 3,461 | |||||||
|
| |||||||
Total Common Stocks | 166,319 | |||||||
|
| |||||||
Short-Term Investment — 2.1% | ||||||||
Investment Company — 2.1% |
| |||||||
| 3,593 | JPMorgan U.S. Government Money Market Fund, Institutional Class Shares, 0.840% (b) (l) | 3,593 | ||||||
|
| |||||||
Total Investments — 99.7% | 169,912 | |||||||
Other Assets in Excess of | 480 | |||||||
|
| |||||||
NET ASSETS — 100.0% | $ | 170,392 | ||||||
|
| |||||||
Percentages indicated are based on net assets.
SEE NOTES TO FINANCIAL STATEMENTS.
| JUNE 30, 2017 | J.P. MORGAN SMALL CAP FUNDS | 17 | ||||||
Table of Contents
JPMorgan Small Cap Core Fund
SCHEDULE OF PORTFOLIO INVESTMENTS
AS OF JUNE 30, 2017
(Amounts in thousands)
| SHARES | SECURITY DESCRIPTION | VALUE($) | ||||||
Common Stocks — 96.9% | ||||||||
Consumer Discretionary — 9.6% |
| |||||||
Auto Components — 1.4% |
| |||||||
| 59 | American Axle & Manufacturing Holdings, Inc. (a) | 918 | ||||||
| 17 | Cooper-Standard Holdings, Inc. (a) | 1,750 | ||||||
| 9 | Dana, Inc. | 203 | ||||||
| 2 | Stoneridge, Inc. (a) | 28 | ||||||
| 5 | Tower International, Inc. | 116 | ||||||
|
| |||||||
| 3,015 | ||||||||
|
| |||||||
Diversified Consumer Services — 0.3% |
| |||||||
| 2 | Capella Education Co. | 147 | ||||||
| 2 | Grand Canyon Education, Inc. (a) | 188 | ||||||
| 21 | K12, Inc. (a) | 385 | ||||||
|
| |||||||
| 720 | ||||||||
|
| |||||||
Hotels, Restaurants & Leisure — 1.7% |
| |||||||
| 97 | Bloomin’ Brands, Inc. | 2,067 | ||||||
| 7 | DineEquity, Inc. | 326 | ||||||
| 1 | Jack in the Box, Inc. | 49 | ||||||
| 35 | Pinnacle Entertainment, Inc. (a) | 682 | ||||||
| 21 | Ruth’s Hospitality Group, Inc. | 448 | ||||||
|
| |||||||
| 3,572 | ||||||||
|
| |||||||
Household Durables — 2.3% |
| |||||||
| 14 | Helen of Troy Ltd. (a) | 1,335 | ||||||
| 9 | Hooker Furniture Corp. | 370 | ||||||
| 6 | KB Home | 134 | ||||||
| 21 | Libbey, Inc. | 166 | ||||||
| 18 | Lifetime Brands, Inc. | 321 | ||||||
| 2 | NACCO Industries, Inc., Class A | 122 | ||||||
| 95 | Taylor Morrison Home Corp., Class A (a) | 2,291 | ||||||
|
| |||||||
| 4,739 | ||||||||
|
| |||||||
Internet & Direct Marketing Retail — 0.1% |
| |||||||
| 13 | Liberty TripAdvisor Holdings, Inc., Class A (a) | 148 | ||||||
|
| |||||||
Media — 1.0% |
| |||||||
| 61 | Gannett Co., Inc. | 533 | ||||||
| 38 | Gray Television, Inc. (a) | 526 | ||||||
| 3 | Nexstar Media Group, Inc., Class A | 187 | ||||||
| 23 | Sinclair Broadcast Group, Inc., Class A | 760 | ||||||
| 12 | Townsquare Media, Inc., Class A (a) | 124 | ||||||
|
| |||||||
| 2,130 | ||||||||
|
| |||||||
Specialty Retail — 2.7% |
| |||||||
| 28 | Caleres, Inc. | 772 | ||||||
| 16 | Children’s Place, Inc. (The) | 1,644 | ||||||
| 19 | Express, Inc. (a) | 126 | ||||||
| 4 | Floor & Decor Holdings, Inc., Class A (a) | 169 | ||||||
| 4 | Group 1 Automotive, Inc. | 266 | ||||||
| SHARES | SECURITY DESCRIPTION | VALUE($) | ||||||
Specialty Retail — continued |
| |||||||
| 421 | Office Depot, Inc. | 2,372 | ||||||
| 79 | Pier 1 Imports, Inc. | 412 | ||||||
| 2 | Tailored Brands, Inc. | 20 | ||||||
|
| |||||||
| 5,781 | ||||||||
|
| |||||||
Textiles, Apparel & Luxury Goods — 0.1% |
| |||||||
| 9 | Perry Ellis International, Inc. (a) | 181 | ||||||
|
| |||||||
Total Consumer Discretionary | 20,286 | |||||||
|
| |||||||
Consumer Staples — 2.1% |
| |||||||
Food & Staples Retailing — 0.7% |
| |||||||
| 42 | SpartanNash Co. | 1,095 | ||||||
| 39 | SUPERVALU, Inc. (a) | 129 | ||||||
| 11 | US Foods Holding Corp. (a) | 299 | ||||||
|
| |||||||
| 1,523 | ||||||||
|
| |||||||
Food Products — 1.0% |
| |||||||
| 35 | Dean Foods Co. | 597 | ||||||
| 28 | Pilgrim’s Pride Corp. (a) | 617 | ||||||
| 4 | Pinnacle Foods, Inc. | 233 | ||||||
| 3 | Sanderson Farms, Inc. | 382 | ||||||
| 2 | TreeHouse Foods, Inc. (a) | 196 | ||||||
|
| |||||||
| 2,025 | ||||||||
|
| |||||||
Household Products — 0.4% |
| |||||||
| 25 | Central Garden & Pet Co., Class A (a) | 739 | ||||||
|
| |||||||
Personal Products — 0.0% (g) | ||||||||
| 2 | USANA Health Sciences, Inc. (a) | 101 | ||||||
|
| |||||||
Total Consumer Staples | 4,388 | |||||||
|
| |||||||
Energy — 3.1% |
| |||||||
Energy Equipment & Services — 1.1% |
| |||||||
| 32 | Archrock, Inc. | 360 | ||||||
| 26 | Exterran Corp. (a) | 691 | ||||||
| 76 | McDermott International, Inc. (a) | 546 | ||||||
| 7 | PHI, Inc. (Non-Voting) (a) | 66 | ||||||
| 36 | RigNet, Inc. (a) | 581 | ||||||
|
| |||||||
| 2,244 | ||||||||
|
| |||||||
Oil, Gas & Consumable Fuels — 2.0% |
| |||||||
| 210 | Abraxas Petroleum Corp. (a) | 340 | ||||||
| 1 | Arch Coal, Inc., Class A | 96 | ||||||
| 57 | Delek US Holdings, Inc. | 1,511 | ||||||
| 114 | Denbury Resources, Inc. (a) | 174 | ||||||
| 72 | EP Energy Corp., Class A (a) | 263 | ||||||
| 8 | Green Plains, Inc. | 168 | ||||||
| 20 | Jagged Peak Energy, Inc. (a) | 260 | ||||||
| 29 | Pacific Ethanol, Inc. (a) | 179 | ||||||
SEE NOTES TO FINANCIAL STATEMENTS.
| 18 | J.P. MORGAN SMALL CAP FUNDS | JUNE 30, 2017 | ||||
Table of Contents
| SHARES | SECURITY DESCRIPTION | VALUE($) | ||||||
Common Stocks — continued | ||||||||
Oil, Gas & Consumable Fuels — continued |
| |||||||
| 33 | Renewable Energy Group, Inc. (a) | 426 | ||||||
| 1 | REX American Resources Corp. (a) | 59 | ||||||
| 39 | SRC Energy, Inc. (a) | 263 | ||||||
| 196 | W&T Offshore, Inc. (a) | 384 | ||||||
| 3 | Westmoreland Coal Co. (a) | 14 | ||||||
| 3 | World Fuel Services Corp. | 113 | ||||||
|
| |||||||
| 4,250 | ||||||||
|
| |||||||
Total Energy | 6,494 | |||||||
|
| |||||||
Financials — 17.9% |
| |||||||
Banks — 10.5% |
| |||||||
| 4 | Cadence BanCorp (a) | 94 | ||||||
| 8 | Cathay General Bancorp | 308 | ||||||
| 3 | Central Valley Community Bancorp | 67 | ||||||
| 2 | Community Trust Bancorp, Inc. | 75 | ||||||
| 3 | CU Bancorp (a) | 119 | ||||||
| 4 | Customers Bancorp, Inc. (a) | 111 | ||||||
| 36 | East West Bancorp, Inc. | 2,089 | ||||||
| 2 | Enterprise Financial Services Corp. | 69 | ||||||
| 14 | Fidelity Southern Corp. | 330 | ||||||
| 19 | Financial Institutions, Inc. | 557 | ||||||
| 164 | First BanCorp, (Puerto Rico) (a) | 951 | ||||||
| 5 | First Business Financial Services, Inc. | 116 | ||||||
| 6 | First Community Bancshares, Inc. | 155 | ||||||
| 5 | First Financial Bancorp | 138 | ||||||
| 13 | First Foundation, Inc. (a) | 220 | ||||||
| 8 | First Hawaiian, Inc. | 236 | ||||||
| 41 | First Merchants Corp. | 1,653 | ||||||
| 52 | Fulton Financial Corp. | 980 | ||||||
| 39 | Hancock Holding Co. | 1,887 | ||||||
| 34 | Hanmi Financial Corp. | 967 | ||||||
| 16 | Heritage Financial Corp. | 419 | ||||||
| 14 | Hilltop Holdings, Inc. | 360 | ||||||
| 61 | Hope Bancorp, Inc. | 1,135 | ||||||
| 2 | Howard Bancorp, Inc. (a) | 44 | ||||||
| 6 | IBERIABANK Corp. | 483 | ||||||
| 4 | MainSource Financial Group, Inc. | 142 | ||||||
| 3 | NBT Bancorp, Inc. | 113 | ||||||
| 4 | Northeast Bancorp | 81 | ||||||
| 3 | Pacific Mercantile Bancorp (a) | 24 | ||||||
| 25 | PacWest Bancorp | 1,169 | ||||||
| 48 | Popular, Inc., (Puerto Rico) | 2,022 | ||||||
| 11 | Preferred Bank | 564 | ||||||
| 2 | Premier Financial Bancorp, Inc. | 41 | ||||||
| 6 | Shore Bancshares, Inc. | 102 | ||||||
| 3 | Sierra Bancorp | 70 | ||||||
| SHARES | SECURITY DESCRIPTION | VALUE($) | ||||||
Banks — continued |
| |||||||
| 4 | Southern National Bancorp of Virginia, Inc. | 72 | ||||||
| 2 | Stonegate Bank | 83 | ||||||
| 2 | SVB Financial Group (a) | 282 | ||||||
| 106 | TCF Financial Corp. | 1,682 | ||||||
| 2 | Towne Bank | 62 | ||||||
| 15 | TriCo Bancshares | 533 | ||||||
| 15 | TriState Capital Holdings, Inc. (a) | 383 | ||||||
| 6 | Triumph Bancorp, Inc. (a) | 149 | ||||||
| 21 | Zions Bancorp | 931 | ||||||
|
| |||||||
| 22,068 | ||||||||
|
| |||||||
Capital Markets — 1.5% |
| |||||||
| 84 | BGC Partners, Inc., Class A | 1,064 | ||||||
| 3 | Evercore Partners, Inc., Class A | 221 | ||||||
| 17 | Houlihan Lokey, Inc. | 587 | ||||||
| 14 | INTL. FCStone, Inc. (a) | 547 | ||||||
| 27 | OM Asset Management plc | 398 | ||||||
| 3 | Piper Jaffray Cos. | 181 | ||||||
| 1 | Stifel Financial Corp. (a) | 66 | ||||||
|
| |||||||
| 3,064 | ||||||||
|
| |||||||
Consumer Finance — 1.4% |
| |||||||
| 35 | FirstCash, Inc. | 2,041 | ||||||
| 24 | Green Dot Corp., Class A (a) | 932 | ||||||
|
| |||||||
| 2,973 | ||||||||
|
| |||||||
Diversified Financial Services — 0.1% |
| |||||||
| 12 | FNFV Group (a) | 191 | ||||||
| 3 | Marlin Business Services Corp. | 71 | ||||||
|
| |||||||
| 262 | ||||||||
|
| |||||||
Insurance — 2.8% |
| |||||||
| 50 | American Equity Investment Life Holding Co. | 1,304 | ||||||
| 8 | Aspen Insurance Holdings Ltd., (Bermuda) | 377 | ||||||
| 63 | CNO Financial Group, Inc. | 1,309 | ||||||
| 12 | First American Financial Corp. | 514 | ||||||
| 6 | HCI Group, Inc. | 290 | ||||||
| 15 | Kinsale Capital Group, Inc. | 556 | ||||||
| 5 | Maiden Holdings Ltd. | 56 | ||||||
| 4 | National General Holdings Corp. | 75 | ||||||
| 4 | Selective Insurance Group, Inc. | 187 | ||||||
| 16 | Stewart Information Services Corp. | 730 | ||||||
| 4 | United Fire Group, Inc. | 185 | ||||||
| 15 | Universal Insurance Holdings, Inc. | 372 | ||||||
|
| |||||||
| 5,955 | ||||||||
|
| |||||||
SEE NOTES TO FINANCIAL STATEMENTS.
| JUNE 30, 2017 | J.P. MORGAN SMALL CAP FUNDS | 19 | ||||||
Table of Contents
JPMorgan Small Cap Core Fund
SCHEDULE OF PORTFOLIO INVESTMENTS
AS OF JUNE 30, 2017 (continued)
(Amounts in thousands)
| SHARES | SECURITY DESCRIPTION | VALUE($) | ||||||
Common Stocks — continued | ||||||||
Mortgage Real Estate Investment Trusts (REITs) — 0.6% |
| |||||||
| 9 | Capstead Mortgage Corp. | 96 | ||||||
| 5 | Invesco Mortgage Capital, Inc. | 85 | ||||||
| 61 | Redwood Trust, Inc. | 1,040 | ||||||
|
| |||||||
| 1,221 | ||||||||
|
| |||||||
Thrifts & Mortgage Finance — 1.0% |
| |||||||
| 4 | BankFinancial Corp. | 64 | ||||||
| 7 | Dime Community Bancshares, Inc. | 139 | ||||||
| 9 | HomeStreet, Inc. (a) | 261 | ||||||
| 7 | Meta Financial Group, Inc. | 667 | ||||||
| 12 | OceanFirst Financial Corp. | 320 | ||||||
| 9 | PennyMac Financial Services, Inc., Class A (a) | 147 | ||||||
| 9 | Walker & Dunlop, Inc. (a) | 433 | ||||||
| 2 | Washington Federal, Inc. | 56 | ||||||
|
| |||||||
| 2,087 | ||||||||
|
| |||||||
Total Financials | 37,630 | |||||||
|
| |||||||
Health Care — 14.6% |
| |||||||
Biotechnology — 5.3% |
| |||||||
| 10 | Acorda Therapeutics, Inc. (a) | 187 | ||||||
| 45 | Aduro Biotech, Inc. (a) | 508 | ||||||
| 4 | AMAG Pharmaceuticals, Inc. (a) | 70 | ||||||
| 69 | Amicus Therapeutics, Inc. (a) | 698 | ||||||
| 7 | AnaptysBio, Inc. (a) | 170 | ||||||
| 9 | Audentes Therapeutics, Inc. (a) | 180 | ||||||
| 23 | Axovant Sciences Ltd. (a) | 543 | ||||||
| 7 | Bellicum Pharmaceuticals, Inc. (a) | 77 | ||||||
| 7 | Bluebird Bio, Inc. (a) | 683 | ||||||
| 17 | Cara Therapeutics, Inc. (a) | 262 | ||||||
| 183 | Catalyst Pharmaceuticals, Inc. (a) | 505 | ||||||
| 8 | Corvus Pharmaceuticals, Inc. (a) | 98 | ||||||
| 61 | Dynavax Technologies Corp. (a) | 584 | ||||||
| 19 | Epizyme, Inc. (a) | 291 | ||||||
| 8 | Esperion Therapeutics, Inc. (a) | 347 | ||||||
| 7 | FibroGen, Inc. (a) | 216 | ||||||
| 7 | Global Blood Therapeutics, Inc. (a) | 191 | ||||||
| 5 | Immune Design Corp. (a) | 45 | ||||||
| 30 | Insmed, Inc. (a) | 508 | ||||||
| 5 | Jounce Therapeutics, Inc. (a) | 76 | ||||||
| 1 | Karyopharm Therapeutics, Inc. (a) | 7 | ||||||
| 1 | Loxo Oncology, Inc. (a) | 80 | ||||||
| 20 | Mersana Therapeutics, Inc. (a) | 277 | ||||||
| 7 | Momenta Pharmaceuticals, Inc. (a) | 123 | ||||||
| 24 | Ra Pharmaceuticals, Inc. (a) | 448 | ||||||
| 3 | Radius Health, Inc. (a) | 127 | ||||||
| 3 | Sage Therapeutics, Inc. (a) | 263 | ||||||
| 12 | Sarepta Therapeutics, Inc. (a) | 411 | ||||||
| SHARES | SECURITY DESCRIPTION | VALUE($) | ||||||
Biotechnology — continued |
| |||||||
| 30 | Selecta Biosciences, Inc. (a) | 598 | ||||||
| 3 | Seres Therapeutics, Inc. (a) | 32 | ||||||
| 9 | Spark Therapeutics, Inc. (a) | 544 | ||||||
| 52 | Synergy Pharmaceuticals, Inc. (a) | 232 | ||||||
| 13 | Syros Pharmaceuticals, Inc. (a) | 211 | ||||||
| 3 | TESARO, Inc. (a) | 476 | ||||||
| 10 | Ultragenyx Pharmaceutical, Inc. (a) | 640 | ||||||
| 9 | Vanda Pharmaceuticals, Inc. (a) | 153 | ||||||
| 11 | Xencor, Inc. (a) | 236 | ||||||
|
| |||||||
| 11,097 | ||||||||
|
| |||||||
Health Care Equipment & Supplies — 3.8% |
| |||||||
| 18 | Cutera, Inc. (a) | 469 | ||||||
| 1 | Inogen, Inc. (a) | 139 | ||||||
| 51 | Integer Holdings Corp. (a) | 2,210 | ||||||
| 59 | Invacare Corp. | 780 | ||||||
| 45 | Lantheus Holdings, Inc. (a) | 796 | ||||||
| 26 | Masimo Corp. (a) | 2,343 | ||||||
| 75 | OraSure Technologies, Inc. (a) | 1,292 | ||||||
|
| |||||||
| 8,029 | ||||||||
|
| |||||||
Health Care Providers & Services — 3.4% |
| |||||||
| 23 | Addus HomeCare Corp. (a) | 841 | ||||||
| 19 | AMN Healthcare Services, Inc. (a) | 730 | ||||||
| 71 | Cross Country Healthcare, Inc. (a) | 923 | ||||||
| 2 | Envision Healthcare Corp. (a) | 141 | ||||||
| 43 | Kindred Healthcare, Inc. | 506 | ||||||
| 21 | Molina Healthcare, Inc. (a) | 1,475 | ||||||
| 25 | Owens & Minor, Inc. | 799 | ||||||
| 14 | PharMerica Corp. (a) | 372 | ||||||
| 31 | RadNet, Inc. (a) | 238 | ||||||
| 25 | Surgery Partners, Inc. (a) | 560 | ||||||
| 4 | WellCare Health Plans, Inc. (a) | 657 | ||||||
|
| |||||||
| 7,242 | ||||||||
|
| |||||||
Health Care Technology — 0.3% |
| |||||||
| 34 | HMS Holdings Corp. (a) | 629 | ||||||
|
| |||||||
Life Sciences Tools & Services — 0.4% |
| |||||||
| 10 | INC Research Holdings, Inc., Class A (a) | 585 | ||||||
| 3 | PRA Health Sciences, Inc. (a) | 195 | ||||||
|
| |||||||
| 780 | ||||||||
|
| |||||||
Pharmaceuticals — 1.4% |
| |||||||
| 8 | Amphastar Pharmaceuticals, Inc. (a) | 143 | ||||||
| 20 | Assembly Biosciences, Inc. (a) | 413 | ||||||
| 10 | Horizon Pharma plc (a) | 113 | ||||||
| 3 | Medicines Co. (The) (a) | 110 | ||||||
SEE NOTES TO FINANCIAL STATEMENTS.
| 20 | J.P. MORGAN SMALL CAP FUNDS | JUNE 30, 2017 | ||||
Table of Contents
| SHARES | SECURITY DESCRIPTION | VALUE($) | ||||||
Common Stocks — continued | ||||||||
Pharmaceuticals — continued |
| |||||||
| 14 | Nektar Therapeutics (a) | 282 | ||||||
| 41 | Ocular Therapeutix, Inc. (a) | 376 | ||||||
| 7 | Pacira Pharmaceuticals, Inc. (a) | 334 | ||||||
| 7 | Reata Pharmaceuticals, Inc., Class A (a) | 212 | ||||||
| 8 | Revance Therapeutics, Inc. (a) | 222 | ||||||
| 120 | TherapeuticsMD, Inc. (a) | 634 | ||||||
| 5 | Theravance Biopharma, Inc., (Cayman Islands) (a) | 187 | ||||||
|
| |||||||
| 3,026 | ||||||||
|
| |||||||
Total Health Care | 30,803 | |||||||
|
| |||||||
Industrials — 18.8% |
| |||||||
Aerospace & Defense — 1.5% |
| |||||||
| 16 | AAR Corp. | 572 | ||||||
| 13 | Engility Holdings, Inc. (a) | 370 | ||||||
| 7 | HEICO Corp., Class A | 462 | ||||||
| 3 | Moog, Inc., Class A (a) | 230 | ||||||
| 49 | Vectrus, Inc. (a) | 1,593 | ||||||
|
| |||||||
| 3,227 | ||||||||
|
| |||||||
Air Freight & Logistics — 0.2% |
| |||||||
| 5 | Atlas Air Worldwide Holdings, Inc. (a) | 240 | ||||||
| 4 | Park-Ohio Holdings Corp. | 147 | ||||||
|
| |||||||
| 387 | ||||||||
|
| |||||||
Airlines — 0.7% |
| |||||||
| 10 | Hawaiian Holdings, Inc. (a) | 474 | ||||||
| 31 | SkyWest, Inc. | 1,088 | ||||||
|
| |||||||
| 1,562 | ||||||||
|
| |||||||
Building Products — 0.8% |
| |||||||
| 3 | American Woodmark Corp. (a) | 246 | ||||||
| 8 | JELD-WEN Holding, Inc. (a) | 263 | ||||||
| 12 | Universal Forest Products, Inc. | 1,083 | ||||||
|
| |||||||
| 1,592 | ||||||||
|
| |||||||
Commercial Services & Supplies — 3.1% |
| |||||||
| 14 | ABM Industries, Inc. | 590 | ||||||
| 147 | ACCO Brands Corp. (a) | 1,708 | ||||||
| 3 | CECO Environmental Corp. | 29 | ||||||
| 27 | Essendant, Inc. | 394 | ||||||
| 3 | Herman Miller, Inc. | 79 | ||||||
| 17 | Interface, Inc. | 324 | ||||||
| 12 | Kimball International, Inc., Class B | 203 | ||||||
| 5 | Knoll, Inc. | 102 | ||||||
| 57 | Quad/Graphics, Inc. | 1,308 | ||||||
| 30 | Steelcase, Inc., Class A | 425 | ||||||
| 4 | Viad Corp. | 185 | ||||||
| SHARES | SECURITY DESCRIPTION | VALUE($) | ||||||
Commercial Services & Supplies — continued |
| |||||||
| 2 | VSE Corp. | 73 | ||||||
| 45 | West Corp. | 1,043 | ||||||
|
| |||||||
| 6,463 | ||||||||
|
| |||||||
Construction & Engineering — 1.5% |
| |||||||
| 15 | EMCOR Group, Inc. | 967 | ||||||
| 34 | HC2 Holdings, Inc. (a) | 198 | ||||||
| 33 | MasTec, Inc. (a) | 1,467 | ||||||
| 17 | Sterling Construction Co., Inc. (a) | 227 | ||||||
| 13 | Tutor Perini Corp. (a) | 378 | ||||||
|
| |||||||
| 3,237 | ||||||||
|
| |||||||
Electrical Equipment — 1.2% |
| |||||||
| 6 | EnerSys | 427 | ||||||
| 103 | General Cable Corp. | 1,677 | ||||||
| 8 | Powell Industries, Inc. | 249 | ||||||
| 3 | Regal Beloit Corp. | 280 | ||||||
|
| |||||||
| 2,633 | ||||||||
|
| |||||||
Machinery — 3.9% |
| |||||||
| 6 | Barnes Group, Inc. | 331 | ||||||
| 20 | Columbus McKinnon Corp. | 496 | ||||||
| 16 | Federal Signal Corp. | 277 | ||||||
| 58 | Global Brass & Copper Holdings, Inc. | 1,760 | ||||||
| 5 | Greenbrier Cos., Inc. (The) | 243 | ||||||
| 2 | Hurco Cos., Inc. | 59 | ||||||
| 4 | Hyster-Yale Materials Handling, Inc. | 281 | ||||||
| 8 | Kadant, Inc. | 570 | ||||||
| 3 | Kennametal, Inc. | 120 | ||||||
| 106 | Meritor, Inc. (a) | 1,769 | ||||||
| 2 | NN, Inc. | 60 | ||||||
| 1 | Standex International Corp. | 121 | ||||||
| 10 | TriMas Corp. (a) | 202 | ||||||
| 84 | Wabash National Corp. | 1,852 | ||||||
|
| |||||||
| 8,141 | ||||||||
|
| |||||||
Marine — 0.2% |
| |||||||
| 64 | Costamare, Inc., (Monaco) | 466 | ||||||
|
| |||||||
Professional Services — 3.9% |
| |||||||
| 62 | Acacia Research Corp. (a) | 255 | ||||||
| 28 | Barrett Business Services, Inc. | 1,622 | ||||||
| 5 | CRA International, Inc. | 177 | ||||||
| 14 | ICF International, Inc. (a) | 664 | ||||||
| 18 | Insperity, Inc. | 1,292 | ||||||
| 2 | Kelly Services, Inc., Class A | 39 | ||||||
| 75 | RPX Corp. (a) | 1,039 | ||||||
| 29 | TriNet Group, Inc. (a) | 940 | ||||||
SEE NOTES TO FINANCIAL STATEMENTS.
| JUNE 30, 2017 | J.P. MORGAN SMALL CAP FUNDS | 21 | ||||||
Table of Contents
JPMorgan Small Cap Core Fund
SCHEDULE OF PORTFOLIO INVESTMENTS
AS OF JUNE 30, 2017 (continued)
(Amounts in thousands)
| SHARES | SECURITY DESCRIPTION | VALUE($) | ||||||
Common Stocks — continued | ||||||||
Professional Services — continued |
| |||||||
| 60 | TrueBlue, Inc. (a) | 1,577 | ||||||
| 8 | WageWorks, Inc. (a) | 511 | ||||||
|
| |||||||
| 8,116 | ||||||||
|
| |||||||
Road & Rail — 0.8% |
| |||||||
| 68 | ArcBest Corp. | 1,394 | ||||||
| 10 | Schneider National, Inc., Class B | 224 | ||||||
| 3 | Universal Logistics Holdings, Inc. | 38 | ||||||
| 3 | YRC Worldwide, Inc. (a) | 37 | ||||||
|
| |||||||
| 1,693 | ||||||||
|
| |||||||
Trading Companies & Distributors — 1.0% |
| |||||||
| 9 | Applied Industrial Technologies, Inc. | 508 | ||||||
| 12 | GMS, Inc. (a) | 331 | ||||||
| 65 | MRC Global, Inc. (a) | 1,069 | ||||||
| – | (h) | Neff Corp., Class A (a) | 4 | |||||
| 3 | Veritiv Corp. (a) | 135 | ||||||
|
| |||||||
| 2,047 | ||||||||
|
| |||||||
Total Industrials | 39,564 | |||||||
|
| |||||||
Information Technology — 16.0% |
| |||||||
Communications Equipment — 1.2% |
| |||||||
| 16 | Ciena Corp. (a) | 388 | ||||||
| 223 | Extreme Networks, Inc. (a) | 2,058 | ||||||
|
| |||||||
| 2,446 | ||||||||
|
| |||||||
Electronic Equipment, Instruments & Components — 3.7% |
| |||||||
| 1 | Anixter International, Inc. (a) | 110 | ||||||
| 46 | Benchmark Electronics, Inc. (a) | 1,478 | ||||||
| 21 | Fitbit, Inc., Class A (a) | 109 | ||||||
| 31 | Insight Enterprises, Inc. (a) | 1,225 | ||||||
| 1 | KEMET Corp. (a) | 7 | ||||||
| 29 | Kimball Electronics, Inc. (a) | 525 | ||||||
| 2 | Littelfuse, Inc. | 409 | ||||||
| 9 | Methode Electronics, Inc. | 353 | ||||||
| 9 | Plexus Corp. (a) | 452 | ||||||
| 59 | Sanmina Corp. (a) | 2,240 | ||||||
| 10 | Tech Data Corp. (a) | 961 | ||||||
|
| |||||||
| 7,869 | ||||||||
|
| |||||||
Internet Software & Services — 1.9% |
| |||||||
| 7 | Alteryx, Inc., Class A (a) | 133 | ||||||
| 23 | Bankrate, Inc. (a) | 298 | ||||||
| 55 | Blucora, Inc. (a) | 1,172 | ||||||
| 25 | Cloudera, Inc. (a) | 393 | ||||||
| 9 | Cornerstone OnDemand, Inc. (a) | 324 | ||||||
| 6 | Coupa Software, Inc. (a) | 174 | ||||||
| 18 | Five9, Inc. (a) | 392 | ||||||
| SHARES | SECURITY DESCRIPTION | VALUE($) | ||||||
Internet Software & Services — continued |
| |||||||
| 101 | Limelight Networks, Inc. (a) | 290 | ||||||
| 3 | MuleSoft, Inc., Class A (a) | 67 | ||||||
| 14 | Okta, Inc. (a) | 310 | ||||||
| 37 | Tintri, Inc. (a) | 265 | ||||||
| 18 | Yext, Inc. (a) | 244 | ||||||
|
| |||||||
| 4,062 | ||||||||
|
| |||||||
IT Services — 2.5% |
| |||||||
| 2 | Blackhawk Network Holdings, Inc. (a) | 76 | ||||||
| 11 | Euronet Worldwide, Inc. (a) | 983 | ||||||
| 32 | Everi Holdings, Inc. (a) | 229 | ||||||
| 2 | EVERTEC, Inc., (Puerto Rico) | 41 | ||||||
| 21 | Planet Payment, Inc. (a) | 70 | ||||||
| 14 | Sykes Enterprises, Inc. (a) | 477 | ||||||
| 144 | Travelport Worldwide Ltd. | 1,983 | ||||||
| 101 | Unisys Corp. (a) | 1,296 | ||||||
|
| |||||||
| 5,155 | ||||||||
|
| |||||||
Semiconductors & Semiconductor Equipment — 3.5% |
| |||||||
| 3 | Advanced Energy Industries, Inc. (a) | 183 | ||||||
| 30 | Alpha & Omega Semiconductor Ltd. (a) | 494 | ||||||
| 18 | Cirrus Logic, Inc. (a) | 1,098 | ||||||
| 30 | Cohu, Inc. | 477 | ||||||
| 100 | Cypress Semiconductor Corp. | 1,359 | ||||||
| 106 | IXYS Corp. (a) | 1,743 | ||||||
| 5 | Nanometrics, Inc. (a) | 120 | ||||||
| 7 | Rudolph Technologies, Inc. (a) | 160 | ||||||
| 18 | Sigma Designs, Inc. (a) | 103 | ||||||
| 81 | Ultra Clean Holdings, Inc. (a) | 1,524 | ||||||
| 17 | Xcerra Corp. (a) | 162 | ||||||
|
| |||||||
| 7,423 | ||||||||
|
| |||||||
Software — 3.2% |
| |||||||
| 2 | Blackline, Inc. (a) | 61 | ||||||
| 15 | CommVault Systems, Inc. (a) | 864 | ||||||
| 3 | MicroStrategy, Inc., Class A (a) | 489 | ||||||
| 3 | QAD, Inc., Class A | 83 | ||||||
| 3 | Qualys, Inc. (a) | 126 | ||||||
| 6 | RealPage, Inc. (a) | 216 | ||||||
| 31 | RingCentral, Inc., Class A (a) | 1,118 | ||||||
| 25 | Take-Two Interactive Software, Inc. (a) | 1,851 | ||||||
| 105 | TiVo Corp. | 1,965 | ||||||
|
| |||||||
| 6,773 | ||||||||
|
| |||||||
Total Information Technology | 33,728 | |||||||
|
| |||||||
SEE NOTES TO FINANCIAL STATEMENTS.
| 22 | J.P. MORGAN SMALL CAP FUNDS | JUNE 30, 2017 | ||||
Table of Contents
| SHARES | SECURITY DESCRIPTION | VALUE($) | ||||||
Common Stocks — continued | ||||||||
Materials — 4.4% |
| |||||||
Chemicals — 2.4% |
| |||||||
| 14 | Chemours Co. (The) | 523 | ||||||
| 18 | FutureFuel Corp. | 276 | ||||||
| 18 | Innophos Holdings, Inc. | 794 | ||||||
| 1 | Innospec, Inc. | 89 | ||||||
| 13 | Minerals Technologies, Inc. | 938 | ||||||
| 14 | OMNOVA Solutions, Inc. (a) | 141 | ||||||
| 35 | Trinseo SA | 2,404 | ||||||
|
| |||||||
| 5,165 | ||||||||
|
| |||||||
Containers & Packaging — 0.5% |
| |||||||
| 12 | Berry Global Group, Inc. (a) | 697 | ||||||
| 22 | Graphic Packaging Holding Co. | 309 | ||||||
|
| |||||||
| 1,006 | ||||||||
|
| |||||||
Metals & Mining — 0.7% |
| |||||||
| 67 | AK Steel Holding Corp. (a) | 439 | ||||||
| 54 | Cliffs Natural Resources, Inc. (a) | 371 | ||||||
| 6 | Commercial Metals Co. | 112 | ||||||
| 4 | Ryerson Holding Corp. (a) | 43 | ||||||
| 11 | Warrior Met Coal, Inc. | 192 | ||||||
| 4 | Worthington Industries, Inc. | 219 | ||||||
|
| |||||||
| 1,376 | ||||||||
|
| |||||||
Paper & Forest Products — 0.8% |
| |||||||
| 13 | Boise Cascade Co. (a) | 410 | ||||||
| 24 | Louisiana-Pacific Corp. (a) | 579 | ||||||
| 20 | Schweitzer-Mauduit International, Inc. | 735 | ||||||
|
| |||||||
| 1,724 | ||||||||
|
| |||||||
Total Materials | 9,271 | |||||||
|
| |||||||
Real Estate — 7.1% |
| |||||||
Equity Real Estate Investment Trusts (REITs) — 6.9% |
| |||||||
| 5 | American Campus Communities, Inc. | 217 | ||||||
| 10 | Armada Hoffler Properties, Inc. | 126 | ||||||
| 150 | Ashford Hospitality Trust, Inc. | 912 | ||||||
| 16 | Bluerock Residential Growth REIT, Inc. | 211 | ||||||
| 9 | Chatham Lodging Trust | 184 | ||||||
| 8 | Chesapeake Lodging Trust | 200 | ||||||
| 1 | CorEnergy Infrastructure Trust, Inc. | 37 | ||||||
| 9 | CoreSite Realty Corp. | 929 | ||||||
| 29 | Cousins Properties, Inc. | 252 | ||||||
| 3 | CyrusOne, Inc. | 139 | ||||||
| 9 | DCT Industrial Trust, Inc. | 459 | ||||||
| 17 | DiamondRock Hospitality Co. | 181 | ||||||
| 9 | DuPont Fabros Technology, Inc. | 563 | ||||||
| 5 | Easterly Government Properties, Inc. | 111 | ||||||
| SHARES | SECURITY DESCRIPTION | VALUE($) | ||||||
Equity Real Estate Investment Trusts (REITs) — continued |
| |||||||
| 8 | Education Realty Trust, Inc. | 315 | ||||||
| 1 | EPR Properties | 104 | ||||||
| 44 | First Industrial Realty Trust, Inc. | 1,252 | ||||||
| 3 | Franklin Street Properties Corp. | 35 | ||||||
| 80 | GEO Group, Inc. (The) | 2,363 | ||||||
| 5 | Government Properties Income Trust | 97 | ||||||
| 7 | Highwoods Properties, Inc. | 375 | ||||||
| 6 | Hudson Pacific Properties, Inc. | 188 | ||||||
| 9 | InfraREIT, Inc. | 163 | ||||||
| 7 | New Senior Investment Group, Inc. | 72 | ||||||
| 21 | NexPoint Residential Trust, Inc. | 532 | ||||||
| 4 | Parkway, Inc. | 84 | ||||||
| 9 | Preferred Apartment Communities, Inc., Class A | 143 | ||||||
| 2 | PS Business Parks, Inc. | 225 | ||||||
| 3 | Ramco-Gershenson Properties Trust | 37 | ||||||
| 40 | Retail Opportunity Investments Corp. | 762 | ||||||
| 23 | Rexford Industrial Realty, Inc. | 620 | ||||||
| 22 | RLJ Lodging Trust | 427 | ||||||
| 49 | Summit Hotel Properties, Inc. | 918 | ||||||
| 3 | Sun Communities, Inc. | 229 | ||||||
| 38 | Sunstone Hotel Investors, Inc. | 619 | ||||||
| 23 | Xenia Hotels & Resorts, Inc. | 446 | ||||||
|
| |||||||
| 14,527 | ||||||||
|
| |||||||
Real Estate Management & Development — 0.2% |
| |||||||
| 26 | Forestar Group, Inc. (a) | 444 | ||||||
|
| |||||||
Total Real Estate | 14,971 | |||||||
|
| |||||||
Telecommunication Services — 0.1% |
| |||||||
Diversified Telecommunication Services — 0.1% |
| |||||||
| 7 | IDT Corp., Class B | 107 | ||||||
|
| |||||||
Utilities — 3.2% |
| |||||||
Electric Utilities — 1.9% |
| |||||||
| 2 | El Paso Electric Co. | 82 | ||||||
| 6 | IDACORP, Inc. | 488 | ||||||
| 3 | MGE Energy, Inc. | 223 | ||||||
| 38 | Portland General Electric Co. | 1,721 | ||||||
| 82 | Spark Energy, Inc., Class A | 1,541 | ||||||
|
| |||||||
| 4,055 | ||||||||
|
| |||||||
Gas Utilities — 0.9% |
| |||||||
| 14 | New Jersey Resources Corp. | 542 | ||||||
| 13 | Southwest Gas Holdings, Inc. | 927 | ||||||
| 5 | WGL Holdings, Inc. | 400 | ||||||
|
| |||||||
| 1,869 | ||||||||
|
| |||||||
SEE NOTES TO FINANCIAL STATEMENTS.
| JUNE 30, 2017 | J.P. MORGAN SMALL CAP FUNDS | 23 | ||||||
Table of Contents
JPMorgan Small Cap Core Fund
SCHEDULE OF PORTFOLIO INVESTMENTS
AS OF JUNE 30, 2017 (continued)
(Amounts in thousands, except for number of Futures contracts)
| SHARES | SECURITY DESCRIPTION | VALUE($) | ||||||
Common Stocks — continued | ||||||||
Independent Power and Renewable Electricity |
| |||||||
| 48 | Atlantic Power Corp. (a) | 116 | ||||||
| 15 | Dynegy, Inc. (a) | 122 | ||||||
| 11 | Ormat Technologies, Inc. | 646 | ||||||
|
| |||||||
| 884 | ||||||||
|
| |||||||
Water Utilities — 0.0% (g) |
| |||||||
| 2 | Consolidated Water Co. Ltd., (Cayman Islands) | 30 | ||||||
|
| |||||||
Total Utilities | 6,838 | |||||||
|
| |||||||
Total Common Stocks | 204,080 | |||||||
|
| |||||||
| NUMBER OF WARRANTS | ||||||||
Warrant — 0.0% | ||||||||
Financials — 0.0% |
| |||||||
Consumer Finance — 0.0% |
| |||||||
| 2 | Emergent Capital, Inc., expiring 10/01/19 (Strike Price $10.75) (a) | — | ||||||
|
| |||||||
| SHARES | SECURITY DESCRIPTION | VALUE($) | ||||||
Short-Term Investment — 5.0% | ||||||||
Investment Company — 5.0% |
| |||||||
| 10,565 | JPMorgan U.S. Government Money Market Fund, Institutional Class Shares, 0.840% (b) (l) | 10,565 | ||||||
|
| |||||||
Total Investments — 101.9% | 214,645 | |||||||
Liabilities in Excess of | (3,900 | ) | ||||||
|
| |||||||
NET ASSETS — 100.0% | $ | 210,745 | ||||||
|
| |||||||
Percentages indicated are based on net assets.
| Futures Contracts | ||||||||||||||||||||
| NUMBER OF CONTRACTS | DESCRIPTION | EXPIRATION DATE | TRADING CURRENCY | NOTIONAL VALUE AT JUNE 30, 2017 | NET UNREALIZED APPRECIATION (DEPRECIATION) | |||||||||||||||
Long Futures Outstanding |
| |||||||||||||||||||
| 87 | Mini Russell 2000 Index | 09/15/17 | USD | $ | 6,152 | $ | 12 | |||||||||||||
|
| |||||||||||||||||||
SEE NOTES TO FINANCIAL STATEMENTS.
| 24 | J.P. MORGAN SMALL CAP FUNDS | JUNE 30, 2017 | ||||
Table of Contents
JPMorgan Small Cap Equity Fund
SCHEDULE OF PORTFOLIO INVESTMENTS
AS OF JUNE 30, 2017
(Amounts in thousands)
| SHARES | SECURITY DESCRIPTION | VALUE($) | ||||||
Common Stocks — 94.8% | ||||||||
Consumer Discretionary — 14.2% |
| |||||||
Auto Components — 0.9% |
| |||||||
| 532 | LCI Industries | 54,515 | ||||||
|
| |||||||
Distributors — 2.0% |
| |||||||
| 1,038 | Pool Corp. | 122,030 | ||||||
|
| |||||||
Diversified Consumer Services — 1.0% |
| |||||||
| 1,628 | ServiceMaster Global Holdings, Inc. (a) | 63,804 | ||||||
|
| |||||||
Hotels, Restaurants & Leisure — 2.4% |
| |||||||
| 1,407 | Brinker International, Inc. | 53,589 | ||||||
| 611 | Monarch Casino & Resort, Inc. (a) | 18,471 | ||||||
| 894 | Papa John’s International, Inc. | 64,174 | ||||||
| 1,423 | Zoe’s Kitchen, Inc. (a) | 16,953 | ||||||
|
| |||||||
| 153,187 | ||||||||
|
| |||||||
Internet & Direct Marketing Retail — 0.3% |
| |||||||
| 2,191 | Blue Apron Holdings, Inc., Class A (a) | 20,462 | ||||||
|
| |||||||
Leisure Products — 2.7% |
| |||||||
| 2,467 | Acushnet Holdings Corp. | 48,940 | ||||||
| 1,505 | Brunswick Corp. | 94,399 | ||||||
| 1,013 | Malibu Boats, Inc., Class A (a) | 26,198 | ||||||
|
| |||||||
| 169,537 | ||||||||
|
| |||||||
Media — 2.8% |
| |||||||
| 2,162 | Cinemark Holdings, Inc. | 83,992 | ||||||
| 1,048 | Emerald Expositions Events, Inc. | 22,955 | ||||||
| 3,743 | EW Scripps Co. (The), Class A (a) | 66,668 | ||||||
|
| |||||||
| 173,615 | ||||||||
|
| |||||||
Specialty Retail — 1.3% |
| |||||||
| 3,114 | American Eagle Outfitters, Inc. | 37,524 | ||||||
| 4,728 | Chico’s FAS, Inc. | 44,540 | ||||||
|
| |||||||
| 82,064 | ||||||||
|
| |||||||
Textiles, Apparel & Luxury Goods — 0.8% |
| |||||||
| 591 | Carter’s, Inc. | 52,535 | ||||||
|
| |||||||
Total Consumer Discretionary | 891,749 | |||||||
|
| |||||||
Consumer Staples — 3.4% |
| |||||||
Food & Staples Retailing — 1.5% |
| |||||||
| 3,474 | Performance Food Group Co. (a) | 95,180 | ||||||
|
| |||||||
Household Products — 1.9% |
| |||||||
| 965 | Spectrum Brands Holdings, Inc. | 120,628 | ||||||
|
| |||||||
Total Consumer Staples | 215,808 | |||||||
|
| |||||||
Energy — 3.4% |
| |||||||
Energy Equipment & Services — 2.6% |
| |||||||
| 585 | Core Laboratories NV | 59,275 | ||||||
| 622 | Dril-Quip, Inc. (a) | 30,361 | ||||||
| SHARES | SECURITY DESCRIPTION | VALUE($) | ||||||
Energy Equipment & Services — continued |
| |||||||
| 3,839 | Patterson-UTI Energy, Inc. | 77,501 | ||||||
|
| |||||||
| 167,137 | ||||||||
|
| |||||||
Oil, Gas & Consumable Fuels — 0.8% |
| |||||||
| 7,169 | SRC Energy, Inc. (a) | 48,245 | ||||||
|
| |||||||
Total Energy | 215,382 | |||||||
|
| |||||||
Financials — 16.9% |
| |||||||
Banks — 11.3% |
| |||||||
| 2,914 | Associated Banc-Corp. | 73,426 | ||||||
| 2,314 | BankUnited, Inc. | 78,008 | ||||||
| 804 | Commerce Bancshares, Inc. | 45,665 | ||||||
| 1,483 | First Financial Bancorp | 41,090 | ||||||
| 1,987 | First Hawaiian, Inc. | 60,853 | ||||||
| 4,295 | First Horizon National Corp. | 74,821 | ||||||
| 638 | First Interstate BancSystem, Inc., Class A | 23,748 | ||||||
| 1,268 | Glacier Bancorp, Inc. | 46,437 | ||||||
| 1,502 | Great Western Bancorp, Inc. | 61,279 | ||||||
| 913 | IBERIABANK Corp. | 74,390 | ||||||
| 1,523 | Western Alliance Bancorp (a) | 74,948 | ||||||
| 752 | Wintrust Financial Corp. | 57,500 | ||||||
|
| |||||||
| 712,165 | ||||||||
|
| |||||||
Capital Markets — 4.2% |
| |||||||
| 1,053 | Eaton Vance Corp. | 49,813 | ||||||
| 334 | FactSet Research Systems, Inc. | 55,541 | ||||||
| 1,074 | Lazard Ltd., Class A | 49,754 | ||||||
| 976 | Moelis & Co., Class A | 37,902 | ||||||
| 852 | Morningstar, Inc. | 66,755 | ||||||
|
| |||||||
| 259,765 | ||||||||
|
| |||||||
Insurance — 1.4% |
| |||||||
| 625 | Kinsale Capital Group, Inc. | 23,306 | ||||||
| 1,083 | ProAssurance Corp. | 65,822 | ||||||
|
| |||||||
| 89,128 | ||||||||
|
| |||||||
Total Financials | 1,061,058 | |||||||
|
| |||||||
Health Care — 12.2% |
| |||||||
Health Care Equipment & Supplies — 2.6% |
| |||||||
| 296 | ICU Medical, Inc. (a) | 50,977 | ||||||
| 1,201 | West Pharmaceutical Services, Inc. | 113,513 | ||||||
|
| |||||||
| 164,490 | ||||||||
|
| |||||||
Health Care Providers & Services — 4.1% |
| |||||||
| 830 | HealthEquity, Inc. (a) | 41,342 | ||||||
| 2,179 | HealthSouth Corp. | 105,446 | ||||||
| 461 | Magellan Health, Inc. (a) | 33,630 | ||||||
| 410 | WellCare Health Plans, Inc. (a) | 73,702 | ||||||
|
| |||||||
| 254,120 | ||||||||
|
| |||||||
SEE NOTES TO FINANCIAL STATEMENTS.
| JUNE 30, 2017 | J.P. MORGAN SMALL CAP FUNDS | 25 | ||||||
Table of Contents
JPMorgan Small Cap Equity Fund
SCHEDULE OF PORTFOLIO INVESTMENTS
AS OF JUNE 30, 2017 (continued)
(Amounts in thousands)
| SHARES | SECURITY DESCRIPTION | VALUE($) | ||||||
Common Stocks — continued | ||||||||
Health Care Technology — 2.1% |
| |||||||
| 1,371 | Cotiviti Holdings, Inc. (a) | 50,909 | ||||||
| 998 | Medidata Solutions, Inc. (a) | 78,044 | ||||||
|
| |||||||
| 128,953 | ||||||||
|
| |||||||
Life Sciences Tools & Services — 1.5% |
| |||||||
| 1,499 | Patheon NV (a) | 52,275 | ||||||
| 1,313 | VWR Corp. (a) | 43,339 | ||||||
|
| |||||||
| 95,614 | ||||||||
|
| |||||||
Pharmaceuticals — 1.9% |
| |||||||
| 3,202 | Catalent, Inc. (a) | 112,406 | ||||||
| 180 | Prestige Brands Holdings, Inc. (a) | 9,493 | ||||||
|
| |||||||
| 121,899 | ||||||||
|
| |||||||
Total Health Care | 765,076 | |||||||
|
| |||||||
Industrials — 17.8% |
| |||||||
Building Products — 0.9% |
| |||||||
| 1,193 | JELD-WEN Holding, Inc. (a) | 38,739 | ||||||
| 573 | USG Corp. (a) | 16,632 | ||||||
|
| |||||||
| 55,371 | ||||||||
|
| |||||||
Commercial Services & Supplies — 3.7% |
| |||||||
| 861 | Advanced Disposal Services, Inc. (a) | 19,562 | ||||||
| 2,183 | Brady Corp., Class A | 73,996 | ||||||
| 1,444 | Herman Miller, Inc. | 43,898 | ||||||
| 1,447 | KAR Auction Services, Inc. | 60,733 | ||||||
| 660 | US Ecology, Inc. | 33,320 | ||||||
|
| |||||||
| 231,509 | ||||||||
|
| |||||||
Electrical Equipment — 0.7% |
| |||||||
| 1,298 | Generac Holdings, Inc. (a) | 46,881 | ||||||
|
| |||||||
Machinery — 8.4% |
| |||||||
| 2,005 | Allison Transmission Holdings, Inc. | 75,201 | ||||||
| 1,215 | Altra Industrial Motion Corp. | 48,344 | ||||||
| 996 | Douglas Dynamics, Inc. | 32,764 | ||||||
| 641 | Lincoln Electric Holdings, Inc. | 59,051 | ||||||
| 481 | Proto Labs, Inc. (a) | 32,320 | ||||||
| 926 | RBC Bearings, Inc. (a) | 94,251 | ||||||
| 2,645 | Toro Co. (The) | 183,244 | ||||||
|
| |||||||
| 525,175 | ||||||||
|
| |||||||
Road & Rail — 2.1% |
| |||||||
| 1,566 | Knight Transportation, Inc. | 58,033 | ||||||
| 873 | Landstar System, Inc. | 74,747 | ||||||
|
| |||||||
| 132,780 | ||||||||
|
| |||||||
| SHARES | SECURITY DESCRIPTION | VALUE($) | ||||||
| �� | ||||||||
Trading Companies & Distributors — 2.0% |
| |||||||
| 1,093 | Applied Industrial Technologies, Inc. | 64,512 | ||||||
| 403 | Watsco, Inc. | 62,143 | ||||||
|
| |||||||
| 126,655 | ||||||||
|
| |||||||
Total Industrials | 1,118,371 | |||||||
|
| |||||||
Information Technology — 12.3% |
| |||||||
Internet Software & Services — 2.6% |
| |||||||
| 1,495 | GrubHub, Inc. (a) | 65,163 | ||||||
| 961 | Instructure, Inc. (a) | 28,336 | ||||||
| 1,805 | Q2 Holdings, Inc. (a) | 66,695 | ||||||
|
| |||||||
| 160,194 | ||||||||
|
| |||||||
IT Services — 0.9% |
| |||||||
| 1,293 | CoreLogic, Inc. (a) | 56,098 | ||||||
|
| |||||||
Semiconductors & Semiconductor Equipment — 1.3% |
| |||||||
| 1,135 | Cabot Microelectronics Corp. | 83,762 | ||||||
|
| |||||||
Software — 7.5% |
| |||||||
| 1,011 | Aspen Technology, Inc. (a) | 55,850 | ||||||
| 639 | Blackbaud, Inc. | 54,796 | ||||||
| 714 | Cision Ltd. (a) | 7,351 | ||||||
| 1,051 | Guidewire Software, Inc. (a) | 72,205 | ||||||
| 638 | Imperva, Inc. (a) | 30,549 | ||||||
| 1,099 | Manhattan Associates, Inc. (a) | 52,818 | ||||||
| 252 | MicroStrategy, Inc., Class A (a) | 48,214 | ||||||
| 785 | Splunk, Inc. (a) | 44,658 | ||||||
| 662 | Tableau Software, Inc., Class A (a) | 40,538 | ||||||
| 374 | Tyler Technologies, Inc. (a) | 65,668 | ||||||
|
| |||||||
| 472,647 | ||||||||
|
| |||||||
Total Information Technology | 772,701 | |||||||
|
| |||||||
Materials — 6.1% |
| |||||||
Chemicals — 2.6% |
| |||||||
| 2,011 | GCP Applied Technologies, Inc. (a) | 61,343 | ||||||
| 352 | Quaker Chemical Corp. | 51,153 | ||||||
| 2,216 | Valvoline, Inc. | 52,570 | ||||||
|
| |||||||
| 165,066 | ||||||||
|
| |||||||
Containers & Packaging — 3.5% |
| |||||||
| 1,711 | AptarGroup, Inc. | 148,590 | ||||||
| 1,210 | Crown Holdings, Inc. (a) | 72,218 | ||||||
|
| |||||||
| 220,808 | ||||||||
|
| |||||||
Total Materials | 385,874 | |||||||
|
| |||||||
Real Estate — 5.9% |
| |||||||
Equity Real Estate Investment Trusts (REITs) — 3.9% |
| |||||||
| 882 | EastGroup Properties, Inc. | 73,928 | ||||||
| 1,810 | National Retail Properties, Inc. | 70,790 | ||||||
SEE NOTES TO FINANCIAL STATEMENTS.
| 26 | J.P. MORGAN SMALL CAP FUNDS | JUNE 30, 2017 | ||||
Table of Contents
| SHARES | SECURITY DESCRIPTION | VALUE($) | ||||||
Common Stocks — continued | ||||||||
Equity Real Estate Investment Trusts (REITs) — continued |
| |||||||
| 2,143 | Outfront Media, Inc. | 49,552 | ||||||
| 2,723 | RLJ Lodging Trust | 54,105 | ||||||
|
| |||||||
| 248,375 | ||||||||
|
| |||||||
Real Estate Management & Development — 2.0% |
| |||||||
| 1,670 | HFF, Inc., Class A | 58,072 | ||||||
| 2,032 | Realogy Holdings Corp. | 65,929 | ||||||
|
| |||||||
| 124,001 | ||||||||
|
| |||||||
Total Real Estate | 372,376 | |||||||
|
| |||||||
Utilities — 2.6% |
| |||||||
Electric Utilities — 1.3% |
| |||||||
| 1,852 | Portland General Electric Co. | 84,604 | ||||||
|
| |||||||
Multi-Utilities — 1.3% |
| |||||||
| 1,316 | NorthWestern Corp. | 80,300 | ||||||
|
| |||||||
Total Utilities | 164,904 | |||||||
|
| |||||||
Total Common Stocks | 5,963,299 | |||||||
|
| |||||||
| SHARES | SECURITY DESCRIPTION | VALUE($) | ||||||
Exchange Traded Fund — 1.2% | ||||||||
U.S. Equity — 1.2% |
| |||||||
| 535 | iShares Russell 2000 Fund | 75,407 | ||||||
|
| |||||||
Short-Term Investment — 4.3% | ||||||||
Investment Company — 4.3% |
| |||||||
| 267,273 | JPMorgan U.S. Government Money Market Fund, Institutional Class Shares, 0.840% (b) (l) | 267,273 | ||||||
|
| |||||||
Total Investments — 100.3% | 6,305,979 | |||||||
Liabilities in Excess of | (17,536 | ) | ||||||
|
| |||||||
NET ASSETS — 100.0% | $ | 6,288,443 | ||||||
|
| |||||||
Percentages indicated are based on net assets.
SEE NOTES TO FINANCIAL STATEMENTS.
| JUNE 30, 2017 | J.P. MORGAN SMALL CAP FUNDS | 27 | ||||||
Table of Contents
JPMorgan Small Cap Growth Fund
SCHEDULE OF PORTFOLIO INVESTMENTS
AS OF JUNE 30, 2017
(Amounts in thousands)
| SHARES | SECURITY DESCRIPTION | VALUE($) | ||||||
Common Stocks — 99.1% | ||||||||
Consumer Discretionary — 12.1% |
| |||||||
Distributors — 1.1% |
| |||||||
| 124 | Pool Corp. | 14,553 | ||||||
|
| |||||||
Diversified Consumer Services — 0.7% |
| |||||||
| 120 | Bright Horizons Family Solutions, Inc. (a) | 9,243 | ||||||
|
| |||||||
Hotels, Restaurants & Leisure — 3.9% |
| |||||||
| 976 | Boyd Gaming Corp. | 24,204 | ||||||
| 289 | Texas Roadhouse, Inc. | 14,723 | ||||||
| 63 | Vail Resorts, Inc. | 12,769 | ||||||
|
| |||||||
| 51,696 | ||||||||
|
| |||||||
Household Durables — 0.7% |
| |||||||
| 653 | TRI Pointe Group, Inc. (a) | 8,618 | ||||||
|
| |||||||
Internet & Direct Marketing Retail — 1.0% |
| |||||||
| 165 | Wayfair, Inc., Class A (a) | 12,680 | ||||||
|
| |||||||
Multiline Retail — 0.9% |
| |||||||
| 292 | Ollie’s Bargain Outlet Holdings, Inc. (a) | 12,423 | ||||||
|
| |||||||
Specialty Retail — 2.7% |
| |||||||
| 102 | Burlington Stores, Inc. (a) | 9,355 | ||||||
| 133 | Lithia Motors, Inc., Class A | 12,507 | ||||||
| 93 | Penske Automotive Group, Inc. | 4,071 | ||||||
| 449 | Tile Shop Holdings, Inc. | 9,263 | ||||||
|
| |||||||
| 35,196 | ||||||||
|
| |||||||
Textiles, Apparel & Luxury Goods — 1.1% |
| |||||||
| 542 | Wolverine World Wide, Inc. | 15,169 | ||||||
|
| |||||||
Total Consumer Discretionary | 159,578 | |||||||
|
| |||||||
Consumer Staples — 4.6% |
| |||||||
Food & Staples Retailing — 2.1% |
| |||||||
| 71 | Casey’s General Stores, Inc. | 7,555 | ||||||
| 457 | Performance Food Group Co. (a) | 12,509 | ||||||
| 345 | Sprouts Farmers Market, Inc. (a) | 7,820 | ||||||
|
| |||||||
| 27,884 | ||||||||
|
| |||||||
Food Products — 1.3% |
| |||||||
| 583 | Freshpet, Inc. (a) | 9,676 | ||||||
| 222 | Snyder’s-Lance, Inc. | 7,686 | ||||||
|
| |||||||
| 17,362 | ||||||||
|
| |||||||
Personal Products — 1.2% |
| |||||||
| 568 | elf Beauty, Inc. (a) | 15,453 | ||||||
|
| |||||||
Total Consumer Staples | 60,699 | |||||||
|
| |||||||
Energy — 1.4% |
| |||||||
Oil, Gas & Consumable Fuels — 1.4% |
| |||||||
| 56 | Diamondback Energy, Inc. (a) | 4,984 | ||||||
| 489 | Jagged Peak Energy, Inc. (a) | 6,531 | ||||||
| SHARES | SECURITY DESCRIPTION | VALUE($) | ||||||
Oil, Gas & Consumable Fuels — continued |
| |||||||
| 202 | RSP Permian, Inc. (a) | 6,534 | ||||||
|
| |||||||
Total Energy | 18,049 | |||||||
|
| |||||||
Financials — 5.7% |
| |||||||
Banks — 2.4% |
| |||||||
| 165 | Bank of the Ozarks, Inc. | 7,727 | ||||||
| 48 | Signature Bank (a) | 6,824 | ||||||
| 223 | Texas Capital Bancshares, Inc. (a) | 17,263 | ||||||
|
| |||||||
| 31,814 | ||||||||
|
| |||||||
Capital Markets — 2.8% |
| |||||||
| 231 | Evercore Partners, Inc., Class A | 16,262 | ||||||
| 264 | Financial Engines, Inc. | 9,668 | ||||||
| 1,009 | PennantPark Investment Corp. | 7,458 | ||||||
| 328 | WisdomTree Investments, Inc. | 3,336 | ||||||
|
| |||||||
| 36,724 | ||||||||
|
| |||||||
Thrifts & Mortgage Finance — 0.5% |
| |||||||
| 274 | BofI Holding, Inc. (a) | 6,491 | ||||||
|
| |||||||
Total Financials | 75,029 | |||||||
|
| |||||||
Health Care — 22.1% |
| |||||||
Biotechnology — 9.5% |
| |||||||
| 154 | ACADIA Pharmaceuticals, Inc. (a) | 4,303 | ||||||
| 186 | Axovant Sciences Ltd. (a) | 4,320 | ||||||
| 443 | Bellicum Pharmaceuticals, Inc. (a) | 5,173 | ||||||
| 239 | Biohaven Pharmaceutical Holding Co. Ltd., (Canada) (a) | 5,968 | ||||||
| 327 | Coherus Biosciences, Inc. (a) | 4,686 | ||||||
| 461 | Exact Sciences Corp. (a) | 16,308 | ||||||
| 234 | FibroGen, Inc. (a) | 7,572 | ||||||
| 656 | Halozyme Therapeutics, Inc. (a) | 8,407 | ||||||
| 519 | Ignyta, Inc. (a) | 5,372 | ||||||
| 210 | Insmed, Inc. (a) | 3,597 | ||||||
| 174 | Kite Pharma, Inc. (a) | 18,086 | ||||||
| 96 | Neurocrine Biosciences, Inc. (a) | 4,398 | ||||||
| 141 | Portola Pharmaceuticals, Inc. (a) | 7,923 | ||||||
| 264 | REGENXBIO, Inc. (a) | 5,222 | ||||||
| 111 | Sage Therapeutics, Inc. (a) | 8,875 | ||||||
| 141 | Spark Therapeutics, Inc. (a) | 8,395 | ||||||
| 16 | TESARO, Inc. (a) | 2,273 | ||||||
| 250 | Versartis, Inc. (a) | 4,364 | ||||||
|
| |||||||
| 125,242 | ||||||||
|
| |||||||
Health Care Equipment & Supplies — 4.5% |
| |||||||
| 1,118 | GenMark Diagnostics, Inc. (a) | 13,229 | ||||||
| 176 | Insulet Corp. (a) | 9,008 | ||||||
| 576 | K2M Group Holdings, Inc. (a) | 14,041 | ||||||
SEE NOTES TO FINANCIAL STATEMENTS.
| 28 | J.P. MORGAN SMALL CAP FUNDS | JUNE 30, 2017 | ||||
Table of Contents
| SHARES | SECURITY DESCRIPTION | VALUE($) | ||||||
Common Stocks — continued | ||||||||
Health Care Equipment & Supplies — continued |
| |||||||
| 151 | Nevro Corp. (a) | 11,205 | ||||||
| 987 | Novadaq Technologies, Inc., (Canada) (a) | 11,568 | ||||||
|
| |||||||
| 59,051 | ||||||||
|
| |||||||
Health Care Providers & Services — 3.6% |
| |||||||
| 340 | Acadia Healthcare Co., Inc. (a) | 16,789 | ||||||
| 435 | Teladoc, Inc. (a) | 15,096 | ||||||
| 83 | WellCare Health Plans, Inc. (a) | 14,914 | ||||||
|
| |||||||
| 46,799 | ||||||||
|
| |||||||
Health Care Technology — 1.7% |
| |||||||
| 582 | Evolent Health, Inc., Class A (a) | 14,764 | ||||||
| 134 | Veeva Systems, Inc., Class A (a) | 8,195 | ||||||
|
| |||||||
| 22,959 | ||||||||
|
| |||||||
Pharmaceuticals — 2.8% |
| |||||||
| 789 | Horizon Pharma plc (a) | 9,367 | ||||||
| 483 | Nektar Therapeutics (a) | 9,437 | ||||||
| 345 | Revance Therapeutics, Inc. (a) | 9,115 | ||||||
| 1,782 | TherapeuticsMD, Inc. (a) | 9,390 | ||||||
|
| |||||||
| 37,309 | ||||||||
|
| |||||||
Total Health Care | 291,360 | |||||||
|
| |||||||
Industrials — 19.5% |
| |||||||
Aerospace & Defense — 1.9% |
| |||||||
| 221 | HEICO Corp. | 15,912 | ||||||
| 165 | Hexcel Corp. | 8,690 | ||||||
|
| |||||||
| 24,602 | ||||||||
|
| |||||||
Air Freight & Logistics — 0.8% |
| |||||||
| 166 | XPO Logistics, Inc. (a) | 10,712 | ||||||
|
| |||||||
Building Products — 6.5% |
| |||||||
| 640 | Advanced Drainage Systems, Inc. | 12,874 | ||||||
| 167 | Fortune Brands Home & Security, Inc. | 10,888 | ||||||
| 268 | JELD-WEN Holding, Inc. (a) | 8,694 | ||||||
| 90 | Lennox International, Inc. | 16,539 | ||||||
| 270 | Masonite International Corp. (a) | 20,365 | ||||||
| 248 | Trex Co., Inc. (a) | 16,793 | ||||||
|
| |||||||
| 86,153 | ||||||||
|
| |||||||
Commercial Services & Supplies — 0.9% |
| |||||||
| 518 | Advanced Disposal Services, Inc. (a) | 11,780 | ||||||
|
| |||||||
Industrial Conglomerates — 0.6% |
| |||||||
| 78 | Carlisle Cos., Inc. | 7,437 | ||||||
|
| |||||||
Machinery — 5.4% |
| |||||||
| 158 | Graco, Inc. | 17,215 | ||||||
| 104 | ITT, Inc. | 4,171 | ||||||
| 251 | John Bean Technologies Corp. | 24,549 | ||||||
| SHARES | SECURITY DESCRIPTION | VALUE($) | ||||||
Machinery — continued |
| |||||||
| 94 | Middleby Corp. (The) (a) | 11,444 | ||||||
| 208 | Oshkosh Corp. | 14,294 | ||||||
|
| |||||||
| 71,673 | ||||||||
|
| |||||||
Marine — 0.6% |
| |||||||
| 110 | Kirby Corp. (a) | 7,327 | ||||||
|
| |||||||
Road & Rail — 1.1% |
| |||||||
| 149 | Old Dominion Freight Line, Inc. | 14,207 | ||||||
|
| |||||||
Trading Companies & Distributors — 1.7% |
| |||||||
| 394 | H&E Equipment Services, Inc. | 8,034 | ||||||
| 382 | Rush Enterprises, Inc., Class A (a) | 14,200 | ||||||
|
| |||||||
| 22,234 | ||||||||
|
| |||||||
Total Industrials | 256,125 | |||||||
|
| |||||||
Information Technology — 27.7% |
| |||||||
Communications Equipment — 1.4% |
| |||||||
| 297 | Ciena Corp. (a) | 7,443 | ||||||
| 561 | Quantenna Communications, Inc. (a) | 10,661 | ||||||
|
| |||||||
| 18,104 | ||||||||
|
| |||||||
Electronic Equipment, Instruments & Components — 1.5% |
| |||||||
| 117 | Littelfuse, Inc. | 19,356 | ||||||
|
| |||||||
Internet Software & Services — 9.6% |
| |||||||
| 223 | 2U, Inc. (a) | 10,470 | ||||||
| 439 | Cloudera, Inc. (a) | 7,027 | ||||||
| 36 | CoStar Group, Inc. (a) | 9,554 | ||||||
| 406 | Envestnet, Inc. (a) | 16,094 | ||||||
| 386 | GoDaddy, Inc., Class A (a) | 16,358 | ||||||
| 310 | GrubHub, Inc. (a) | 13,521 | ||||||
| 310 | Instructure, Inc. (a) | 9,138 | ||||||
| 230 | MuleSoft, Inc., Class A (a) | 5,743 | ||||||
| 400 | Nutanix, Inc., Class A (a) | 8,065 | ||||||
| 307 | Okta, Inc. (a) | 7,004 | ||||||
| 112 | Shopify, Inc., (Canada), Class A (a) | 9,762 | ||||||
| 280 | Trade Desk, Inc. (The), Class A (a) | 14,036 | ||||||
|
| |||||||
| 126,772 | ||||||||
|
| |||||||
Semiconductors & Semiconductor Equipment — 4.8% |
| |||||||
| 220 | Cavium, Inc. (a) | 13,655 | ||||||
| 306 | Inphi Corp. (a) | 10,480 | ||||||
| 236 | MACOM Technology Solutions Holdings, Inc. (a) | 13,188 | ||||||
| 165 | MKS Instruments, Inc. | 11,130 | ||||||
| 146 | Monolithic Power Systems, Inc. | 14,028 | ||||||
|
| |||||||
| 62,481 | ||||||||
|
| |||||||
Software — 10.4% |
| |||||||
| 269 | Appian Corp. (a) | 4,891 | ||||||
| 286 | Atlassian Corp. plc, (Australia), Class A (a) | 10,049 | ||||||
SEE NOTES TO FINANCIAL STATEMENTS.
| JUNE 30, 2017 | J.P. MORGAN SMALL CAP FUNDS | 29 | ||||||
Table of Contents
JPMorgan Small Cap Growth Fund
SCHEDULE OF PORTFOLIO INVESTMENTS
AS OF JUNE 30, 2017 (continued)
(Amounts in thousands)
| SHARES | SECURITY DESCRIPTION | VALUE($) | ||||||
Common Stocks — continued | ||||||||
Software — continued |
| |||||||
| 235 | Guidewire Software, Inc. (a) | 16,128 | ||||||
| 149 | HubSpot, Inc. (a) | 9,803 | ||||||
| 151 | Imperva, Inc. (a) | 7,207 | ||||||
| 229 | Paycom Software, Inc. (a) | 15,657 | ||||||
| 138 | Proofpoint, Inc. (a) | 12,003 | ||||||
| 532 | RingCentral, Inc., Class A (a) | 19,445 | ||||||
| 222 | Take-Two Interactive Software, Inc. (a) | 16,265 | ||||||
| 72 | Tyler Technologies, Inc. (a) | 12,685 | ||||||
| 479 | Zendesk, Inc. (a) | 13,295 | ||||||
|
| |||||||
| 137,428 | ||||||||
|
| |||||||
Total Information Technology | 364,141 | |||||||
|
| |||||||
Materials — 3.9% |
| |||||||
Chemicals — 1.2% |
| |||||||
| 888 | Ferro Corp. (a) | 16,248 | ||||||
|
| |||||||
Construction Materials — 2.7% |
| |||||||
| 165 | Eagle Materials, Inc. | 15,254 | ||||||
| 695 | Summit Materials, Inc., Class A (a) | 20,057 | ||||||
|
| |||||||
| 35,311 | ||||||||
|
| |||||||
Total Materials | 51,559 | |||||||
|
| |||||||
| SHARES | SECURITY DESCRIPTION | VALUE($) | ||||||
Real Estate — 2.1% |
| |||||||
Equity Real Estate Investment Trusts (REITs) — 1.1% |
| |||||||
| 250 | CubeSmart | 5,999 | ||||||
| 158 | Highwoods Properties, Inc. | 8,012 | ||||||
|
| |||||||
| 14,011 | ||||||||
|
| |||||||
Real Estate Management & Development — 1.0% |
| |||||||
| 235 | RE/MAX Holdings, Inc., Class A | 13,198 | ||||||
|
| |||||||
Total Real Estate | 27,209 | |||||||
|
| |||||||
Total Common Stocks | 1,303,749 | |||||||
|
| |||||||
Short-Term Investment — 3.2% | ||||||||
Investment Company — 3.2% |
| |||||||
| 41,963 | JPMorgan U.S. Government Money Market Fund, Institutional Class Shares, 0.840% (b) (l) | 41,963 | ||||||
|
| |||||||
Total Investments — 102.3% | 1,345,712 | |||||||
Liabilities in Excess of | (29,784 | ) | ||||||
|
| |||||||
NET ASSETS — 100.0% | $ | 1,315,928 | ||||||
|
| |||||||
Percentages indicated are based on net assets.
SEE NOTES TO FINANCIAL STATEMENTS.
| 30 | J.P. MORGAN SMALL CAP FUNDS | JUNE 30, 2017 | ||||
Table of Contents
JPMorgan Small Cap Value Fund
SCHEDULE OF PORTFOLIO INVESTMENTS
AS OF JUNE 30, 2017
(Amounts in thousands)
| SHARES | SECURITY DESCRIPTION | VALUE($) | ||||||
Common Stocks — 97.6% | ||||||||
Consumer Discretionary — 10.6% |
| |||||||
Auto Components — 0.9% |
| |||||||
| 458 | Cooper Tire & Rubber Co. | 16,530 | ||||||
| 185 | Stoneridge, Inc. (a) | 2,845 | ||||||
|
| |||||||
| 19,375 | ||||||||
|
| |||||||
Diversified Consumer Services — 1.0% |
| |||||||
| 82 | American Public Education, Inc. (a) | 1,932 | ||||||
| 310 | Ascent Capital Group, Inc., Class A (a) | 4,757 | ||||||
| 232 | Houghton Mifflin Harcourt Co. (a) | 2,847 | ||||||
| 318 | K12, Inc. (a) | 5,697 | ||||||
| 624 | Regis Corp. (a) | 6,409 | ||||||
|
| |||||||
| 21,642 | ||||||||
|
| |||||||
Hotels, Restaurants & Leisure — 2.4% |
| |||||||
| 88 | Bob Evans Farms, Inc. | 6,292 | ||||||
| 133 | Intrawest Resorts Holdings, Inc. (a) | 3,167 | ||||||
| 964 | La Quinta Holdings, Inc. (a) | 14,243 | ||||||
| 473 | Penn National Gaming, Inc. (a) | 10,129 | ||||||
| 450 | Pinnacle Entertainment, Inc. (a) | 8,884 | ||||||
| 326 | Ruth’s Hospitality Group, Inc. | 7,087 | ||||||
| 49 | Speedway Motorsports, Inc. | 888 | ||||||
|
| |||||||
| 50,690 | ||||||||
|
| |||||||
Household Durables — 1.1% |
| |||||||
| 35 | AV Homes, Inc. (a) | 704 | ||||||
| 421 | Beazer Homes USA, Inc. (a) | 5,778 | ||||||
| 1 | CSS Industries, Inc. | 38 | ||||||
| 291 | Hovnanian Enterprises, Inc., Class A (a) | 815 | ||||||
| 430 | KB Home | 10,302 | ||||||
| 57 | NACCO Industries, Inc., Class A | 4,060 | ||||||
| 38 | UCP, Inc., Class A (a) | 414 | ||||||
|
| |||||||
| 22,111 | ||||||||
|
| |||||||
Internet & Direct Marketing Retail — 0.3% |
| |||||||
| 577 | Liberty TripAdvisor Holdings, Inc., Class A (a) | 6,698 | ||||||
|
| |||||||
Media — 0.2% |
| |||||||
| 226 | Eros International plc, (India) (a) | 2,589 | ||||||
| 101 | EW Scripps Co. (The), Class A (a) | 1,793 | ||||||
|
| |||||||
| 4,382 | ||||||||
|
| |||||||
Multiline Retail — 1.1% |
| |||||||
| 391 | Dillard’s, Inc., Class A | 22,539 | ||||||
|
| |||||||
Specialty Retail — 2.2% |
| |||||||
| 302 | Aaron’s, Inc. | 11,759 | ||||||
| 224 | Chico’s FAS, Inc. | 2,110 | ||||||
| 168 | Children’s Place, Inc. (The) | 17,112 | ||||||
| 19 | Floor & Decor Holdings, Inc., Class A (a) | 754 | ||||||
| 1,365 | Office Depot, Inc. | 7,696 | ||||||
| SHARES | SECURITY DESCRIPTION | VALUE($) | ||||||
Specialty Retail — continued |
| |||||||
| 1,268 | Pier 1 Imports, Inc. | 6,580 | ||||||
|
| |||||||
| 46,011 | ||||||||
|
| |||||||
Textiles, Apparel & Luxury Goods — 1.4% |
| |||||||
| 1,293 | Fossil Group, Inc. (a) | 13,381 | ||||||
| 585 | Iconix Brand Group, Inc. (a) | 4,040 | ||||||
| 451 | Movado Group, Inc. | 11,397 | ||||||
| 57 | Perry Ellis International, Inc. (a) | 1,102 | ||||||
|
| |||||||
| 29,920 | ||||||||
|
| |||||||
Total Consumer Discretionary | 223,368 | |||||||
|
| |||||||
Consumer Staples — 1.9% |
| |||||||
Food & Staples Retailing — 0.1% |
| |||||||
| 73 | SpartanNash Co. | 1,903 | ||||||
| 18 | Village Super Market, Inc., Class A | 477 | ||||||
|
| |||||||
| 2,380 | ||||||||
|
| |||||||
Food Products — 0.6% |
| |||||||
| 629 | Darling Ingredients, Inc. (a) | 9,894 | ||||||
| 70 | Dean Foods Co. | 1,192 | ||||||
| 51 | Fresh Del Monte Produce, Inc. | 2,607 | ||||||
|
| |||||||
| 13,693 | ||||||||
|
| |||||||
Household Products — 0.3% |
| |||||||
| 198 | Central Garden & Pet Co., Class A (a) | 5,929 | ||||||
|
| |||||||
Tobacco — 0.9% |
| |||||||
| 294 | Universal Corp. | 18,989 | ||||||
|
| |||||||
Total Consumer Staples | 40,991 | |||||||
|
| |||||||
Energy — 4.8% |
| |||||||
Energy Equipment & Services — 2.0% |
| |||||||
| 943 | Archrock, Inc. | 10,747 | ||||||
| 5 | Natural Gas Services Group, Inc. (a) | 117 | ||||||
| 2,724 | Noble Corp. plc | 9,859 | ||||||
| 369 | Parker Drilling Co. (a) | 498 | ||||||
| 1,284 | Rowan Cos. plc, Class A (a) | 13,148 | ||||||
| 446 | Unit Corp. (a) | 8,346 | ||||||
|
| |||||||
| 42,715 | ||||||||
|
| |||||||
Oil, Gas & Consumable Fuels — 2.8% |
| |||||||
| 2,294 | Bill Barrett Corp. (a) | 7,043 | ||||||
| 636 | Delek US Holdings, Inc. | 16,821 | ||||||
| 3,710 | Denbury Resources, Inc. (a) | 5,677 | ||||||
| 2,225 | EP Energy Corp., Class A (a) | 8,144 | ||||||
| 18 | Renewable Energy Group, Inc. (a) | 232 | ||||||
| 177 | REX American Resources Corp. (a) | 17,053 | ||||||
| 466 | Sanchez Energy Corp. (a) | 3,345 | ||||||
|
| |||||||
| 58,315 | ||||||||
|
| |||||||
Total Energy | 101,030 | |||||||
|
| |||||||
SEE NOTES TO FINANCIAL STATEMENTS.
| JUNE 30, 2017 | J.P. MORGAN SMALL CAP FUNDS | 31 | ||||||
Table of Contents
JPMorgan Small Cap Value Fund
SCHEDULE OF PORTFOLIO INVESTMENTS
AS OF JUNE 30, 2017 (continued)
(Amounts in thousands)
| SHARES | SECURITY DESCRIPTION | VALUE($) | ||||||
Common Stocks — continued | ||||||||
Financials — 30.1% |
| |||||||
Banks — 18.7% |
| |||||||
| 129 | 1st Source Corp. | 6,194 | ||||||
| 8 | American National Bankshares, Inc. | 277 | ||||||
| 77 | BancFirst Corp. | 7,419 | ||||||
| 447 | BancorpSouth, Inc. | 13,634 | ||||||
| 196 | Bank of Hawaii Corp. | 16,237 | ||||||
| 90 | Brookline Bancorp, Inc. | 1,311 | ||||||
| 37 | Bryn Mawr Bank Corp. | 1,568 | ||||||
| 20 | Cadence BanCorp (a) | 431 | ||||||
| 68 | Capital Bank Financial Corp., Class A | 2,576 | ||||||
| 247 | Cathay General Bancorp | 9,362 | ||||||
| 547 | Central Pacific Financial Corp. | 17,208 | ||||||
| 29 | Central Valley Community Bancorp | 640 | ||||||
| 10 | Century Bancorp, Inc., Class A | 630 | ||||||
| 23 | Citizens & Northern Corp. | 535 | ||||||
| 173 | City Holding Co. | 11,402 | ||||||
| 65 | Columbia Banking System, Inc. | 2,599 | ||||||
| 162 | Community Bank System, Inc. | 9,051 | ||||||
| 146 | Community Trust Bancorp, Inc. | 6,403 | ||||||
| 15 | East West Bancorp, Inc. | 863 | ||||||
| 294 | FCB Financial Holdings, Inc., Class A (a) | 14,053 | ||||||
| 83 | Financial Institutions, Inc. | 2,479 | ||||||
| 36 | First Bancorp | 1,129 | ||||||
| 1,449 | First BanCorp, (Puerto Rico) (a) | 8,389 | ||||||
| 91 | First Busey Corp. | 2,653 | ||||||
| 10 | First Citizens BancShares, Inc., Class A | 3,727 | ||||||
| 1,453 | First Commonwealth Financial Corp. | 18,424 | ||||||
| 72 | First Community Bancshares, Inc. | 1,972 | ||||||
| 130 | First Financial Bancorp | 3,587 | ||||||
| 91 | First Financial Bankshares, Inc. | 4,005 | ||||||
| 25 | First Financial Corp. | 1,173 | ||||||
| 115 | First Hawaiian, Inc. | 3,534 | ||||||
| 121 | First Interstate BancSystem, Inc., Class A | 4,485 | ||||||
| 175 | Flushing Financial Corp. | 4,928 | ||||||
| 423 | Fulton Financial Corp. | 8,033 | ||||||
| 254 | Glacier Bancorp, Inc. | 9,292 | ||||||
| 44 | Great Southern Bancorp, Inc. | 2,354 | ||||||
| 125 | Great Western Bancorp, Inc. | 5,101 | ||||||
| 398 | Hancock Holding Co. | 19,498 | ||||||
| 29 | Heritage Financial Corp. | 770 | ||||||
| 546 | Hope Bancorp, Inc. | 10,187 | ||||||
| 66 | Independent Bank Corp. | 1,431 | ||||||
| 1,164 | Investors Bancorp, Inc. | 15,556 | ||||||
| 50 | Lakeland Financial Corp. | 2,294 | ||||||
| 170 | MainSource Financial Group, Inc. | 5,696 | ||||||
| 23 | Mercantile Bank Corp. | 715 | ||||||
| SHARES | SECURITY DESCRIPTION | VALUE($) | ||||||
Banks — continued |
| |||||||
| 674 | OFG Bancorp, (Puerto Rico) | 6,736 | ||||||
| 94 | Pacific Continental Corp. | 2,394 | ||||||
| 186 | PacWest Bancorp | 8,696 | ||||||
| 63 | Park Sterling Corp. | 749 | ||||||
| 21 | Preferred Bank | 1,128 | ||||||
| 23 | Republic Bancorp, Inc., Class A | 835 | ||||||
| 26 | S&T Bancorp, Inc. | 940 | ||||||
| 32 | Sandy Spring Bancorp, Inc. | 1,297 | ||||||
| 93 | Southside Bancshares, Inc. | 3,243 | ||||||
| 170 | Southwest Bancorp, Inc. | 4,336 | ||||||
| 69 | State Bank Financial Corp. | 1,866 | ||||||
| 23 | Stock Yards Bancorp, Inc. | 883 | ||||||
| 27 | Tompkins Financial Corp. | 2,086 | ||||||
| 31 | TriState Capital Holdings, Inc. (a) | 771 | ||||||
| 424 | Trustmark Corp. | 13,636 | ||||||
| 266 | UMB Financial Corp. | 19,935 | ||||||
| 706 | Umpqua Holdings Corp. | 12,958 | ||||||
| 442 | Union Bankshares Corp. | 14,969 | ||||||
| 91 | Valley National Bancorp | 1,069 | ||||||
| 46 | Washington Trust Bancorp, Inc. | 2,351 | ||||||
| 134 | Webster Financial Corp. | 6,977 | ||||||
| 16 | West Bancorp, Inc. | 370 | ||||||
| 411 | Westamerica Bancorp | 23,049 | ||||||
|
| |||||||
| 395,079 | ||||||||
|
| |||||||
Capital Markets — 1.0% |
| |||||||
| 52 | Arlington Asset Investment Corp., Class A | 711 | ||||||
| 60 | Investment Technology Group, Inc. | 1,279 | ||||||
| 560 | KCG Holdings, Inc., Class A (a) | 11,166 | ||||||
| 55 | Oppenheimer Holdings, Inc., Class A | 897 | ||||||
| 93 | Stifel Financial Corp. (a) | 4,267 | ||||||
| 33 | Virtus Investment Partners, Inc. | 3,628 | ||||||
|
| |||||||
| 21,948 | ||||||||
|
| |||||||
Consumer Finance — 0.5% |
| |||||||
| 404 | EZCORP, Inc., Class A (a) | 3,108 | ||||||
| 108 | Nelnet, Inc., Class A | 5,091 | ||||||
| 68 | Regional Management Corp. (a) | 1,600 | ||||||
|
| |||||||
| 9,799 | ||||||||
|
| |||||||
Diversified Financial Services — 0.3% |
| |||||||
| 291 | FNFV Group (a) | 4,596 | ||||||
| 39 | Marlin Business Services Corp. | 976 | ||||||
|
| |||||||
| 5,572 | ||||||||
|
| |||||||
Insurance — 4.6% |
| |||||||
| 78 | Argo Group International Holdings Ltd. | 4,721 | ||||||
| 976 | CNO Financial Group, Inc. | 20,377 | ||||||
SEE NOTES TO FINANCIAL STATEMENTS.
| 32 | J.P. MORGAN SMALL CAP FUNDS | JUNE 30, 2017 | ||||
Table of Contents
| SHARES | SECURITY DESCRIPTION | VALUE($) | ||||||
Common Stocks — continued | ||||||||
Insurance — continued |
| |||||||
| 14 | Global Indemnity Ltd., (Cayman Islands) (a) | 535 | ||||||
| 87 | Hallmark Financial Services, Inc. (a) | 985 | ||||||
| 128 | Heritage Insurance Holdings, Inc. | 1,661 | ||||||
| 280 | Horace Mann Educators Corp. | 10,592 | ||||||
| 1,550 | MBIA, Inc. (a) | 14,614 | ||||||
| 70 | Navigators Group, Inc. (The) | 3,826 | ||||||
| 255 | Primerica, Inc. | 19,293 | ||||||
| 210 | ProAssurance Corp. | 12,756 | ||||||
| 470 | Third Point Reinsurance Ltd., (Bermuda) (a) | 6,529 | ||||||
| 18 | Universal Insurance Holdings, Inc. | 446 | ||||||
|
| |||||||
| 96,335 | ||||||||
|
| |||||||
Mortgage Real Estate Investment Trusts (REITs) — 2.0% |
| |||||||
| 112 | AG Mortgage Investment Trust, Inc. | 2,051 | ||||||
| 1,222 | Capstead Mortgage Corp. | 12,747 | ||||||
| 2,398 | CYS Investments, Inc. | 20,166 | ||||||
| 148 | Ellington Residential Mortgage REIT | 2,162 | ||||||
| 362 | Invesco Mortgage Capital, Inc. | 6,052 | ||||||
|
| |||||||
| 43,178 | ||||||||
|
| |||||||
Thrifts & Mortgage Finance — 3.0% |
| |||||||
| 29 | BankFinancial Corp. | 428 | ||||||
| 1,171 | Beneficial Bancorp, Inc. | 17,572 | ||||||
| 295 | Charter Financial Corp. | 5,308 | ||||||
| 41 | First Defiance Financial Corp. | 2,160 | ||||||
| 95 | Kearny Financial Corp. | 1,412 | ||||||
| 371 | Meridian Bancorp, Inc. | 6,267 | ||||||
| 666 | Northfield Bancorp, Inc. | 11,420 | ||||||
| 33 | Oritani Financial Corp. | 563 | ||||||
| 19 | Territorial Bancorp, Inc. | 586 | ||||||
| 51 | United Community Financial Corp. | 422 | ||||||
| 116 | United Financial Bancorp, Inc. | 1,931 | ||||||
| 257 | Walker & Dunlop, Inc. (a) | 12,525 | ||||||
| 106 | Waterstone Financial, Inc. | 1,992 | ||||||
| 23 | WSFS Financial Corp. | 1,057 | ||||||
|
| |||||||
| 63,643 | ||||||||
|
| |||||||
Total Financials | 635,554 | |||||||
|
| |||||||
Health Care — 5.8% |
| |||||||
Biotechnology — 2.2% |
| |||||||
| 56 | Acorda Therapeutics, Inc. (a) | 1,103 | ||||||
| 231 | AMAG Pharmaceuticals, Inc. (a) | 4,258 | ||||||
| 167 | BioCryst Pharmaceuticals, Inc. (a) | 930 | ||||||
| 79 | Enanta Pharmaceuticals, Inc. (a) | 2,825 | ||||||
| 203 | Five Prime Therapeutics, Inc. (a) | 6,115 | ||||||
| 1,570 | Idera Pharmaceuticals, Inc. (a) | 2,700 | ||||||
| 13 | Immune Design Corp. (a) | 129 | ||||||
| SHARES | SECURITY DESCRIPTION | VALUE($) | ||||||
Biotechnology — continued |
| |||||||
| 742 | Iovance Biotherapeutics, Inc. (a) | 5,453 | ||||||
| 14 | MacroGenics, Inc. (a) | 243 | ||||||
| 349 | Otonomy, Inc. (a) | 6,575 | ||||||
| 61 | Radius Health, Inc. (a) | 2,736 | ||||||
| 572 | Rigel Pharmaceuticals, Inc. (a) | 1,561 | ||||||
| 299 | Syndax Pharmaceuticals, Inc. (a) | 4,183 | ||||||
| 281 | Tocagen, Inc. (a) | 3,379 | ||||||
| 264 | Versartis, Inc. (a) | 4,614 | ||||||
|
| |||||||
| 46,804 | ||||||||
|
| |||||||
Health Care Equipment & Supplies — 1.2% |
| |||||||
| 272 | Halyard Health, Inc. (a) | 10,669 | ||||||
| 513 | Wright Medical Group NV (a) | 14,113 | ||||||
|
| |||||||
| 24,782 | ||||||||
|
| |||||||
Health Care Providers & Services — 1.7% |
| |||||||
| 47 | American Renal Associates Holdings, Inc. (a) | 865 | ||||||
| 223 | Community Health Systems, Inc. (a) | 2,221 | ||||||
| 255 | Cross Country Healthcare, Inc. (a) | 3,288 | ||||||
| 245 | Genesis Healthcare, Inc. (a) | 426 | ||||||
| 455 | Kindred Healthcare, Inc. | 5,304 | ||||||
| 107 | Molina Healthcare, Inc. (a) | 7,409 | ||||||
| 233 | Owens & Minor, Inc. | 7,500 | ||||||
| 100 | Tivity Health, Inc. (a) | 3,993 | ||||||
| 115 | Triple-S Management Corp., (Puerto Rico), Class B (a) | 1,945 | ||||||
| 18 | WellCare Health Plans, Inc. (a) | 3,304 | ||||||
|
| |||||||
| 36,255 | ||||||||
|
| |||||||
Pharmaceuticals — 0.7% |
| |||||||
| 78 | Amphastar Pharmaceuticals, Inc. (a) | 1,388 | ||||||
| 160 | Dermira, Inc. (a) | 4,659 | ||||||
| 160 | Endocyte, Inc. (a) | 240 | ||||||
| 92 | Medicines Co. (The) (a) | 3,497 | ||||||
| 97 | MyoKardia, Inc. (a) | 1,276 | ||||||
| 222 | Zynerba Pharmaceuticals, Inc. (a) | 3,767 | ||||||
|
| |||||||
| 14,827 | ||||||||
|
| |||||||
Total Health Care | 122,668 | |||||||
|
| |||||||
Industrials — 13.4% |
| |||||||
Aerospace & Defense — 1.7% |
| |||||||
| 193 | AAR Corp. | 6,711 | ||||||
| 96 | Curtiss-Wright Corp. | 8,838 | ||||||
| 371 | DigitalGlobe, Inc. (a) | 12,368 | ||||||
| 103 | Moog, Inc., Class A (a) | 7,373 | ||||||
|
| |||||||
| 35,290 | ||||||||
|
| |||||||
Building Products — 0.0% (g) | ||||||||
| 29 | Gibraltar Industries, Inc. (a) | 1,023 | ||||||
|
| |||||||
SEE NOTES TO FINANCIAL STATEMENTS.
| JUNE 30, 2017 | J.P. MORGAN SMALL CAP FUNDS | 33 | ||||||
Table of Contents
JPMorgan Small Cap Value Fund
SCHEDULE OF PORTFOLIO INVESTMENTS
AS OF JUNE 30, 2017 (continued)
(Amounts in thousands)
| SHARES | SECURITY DESCRIPTION | VALUE($) | ||||||
Common Stocks — continued | ||||||||
Commercial Services & Supplies — 2.7% |
| |||||||
| 1,737 | ACCO Brands Corp. (a) | 20,241 | ||||||
| 1,009 | ARC Document Solutions, Inc. (a) | 4,197 | ||||||
| 367 | CECO Environmental Corp. | 3,369 | ||||||
| 100 | Ennis, Inc. | 1,904 | ||||||
| 144 | Essendant, Inc. | 2,135 | ||||||
| 411 | Quad/Graphics, Inc. | 9,411 | ||||||
| 143 | VSE Corp. | 6,419 | ||||||
| 385 | West Corp. | 8,983 | ||||||
|
| |||||||
| 56,659 | ||||||||
|
| |||||||
Construction & Engineering — 1.5% |
| |||||||
| 43 | Argan, Inc. | 2,568 | ||||||
| 365 | EMCOR Group, Inc. | 23,870 | ||||||
| 207 | MYR Group, Inc. (a) | 6,425 | ||||||
|
| |||||||
| 32,863 | ||||||||
|
| |||||||
Electrical Equipment — 0.3% |
| |||||||
| 224 | General Cable Corp. | 3,654 | ||||||
| 86 | Powell Industries, Inc. | 2,748 | ||||||
|
| |||||||
| 6,402 | ||||||||
|
| |||||||
Machinery — 2.6% |
| |||||||
| 114 | AGCO Corp. | 7,656 | ||||||
| 183 | Briggs & Stratton Corp. | 4,405 | ||||||
| 322 | Douglas Dynamics, Inc. | 10,604 | ||||||
| 31 | Graham Corp. | 604 | ||||||
| 262 | Harsco Corp. (a) | 4,215 | ||||||
| 54 | Hurco Cos., Inc. | 1,876 | ||||||
| 73 | Kadant, Inc. | 5,452 | ||||||
| 914 | Wabash National Corp. | 20,096 | ||||||
|
| |||||||
| 54,908 | ||||||||
|
| |||||||
Marine — 0.3% |
| |||||||
| 708 | Costamare, Inc., (Monaco) | 5,179 | ||||||
| 18 | Matson, Inc. | 542 | ||||||
|
| |||||||
| 5,721 | ||||||||
|
| |||||||
Professional Services — 2.3% |
| |||||||
| 822 | Acacia Research Corp. (a) | 3,370 | ||||||
| 134 | Barrett Business Services, Inc. | 7,655 | ||||||
| 32 | CRA International, Inc. | 1,173 | ||||||
| 38 | Franklin Covey Co. (a) | 740 | ||||||
| 469 | FTI Consulting, Inc. (a) | 16,410 | ||||||
| 262 | Huron Consulting Group, Inc. (a) | 11,327 | ||||||
| 598 | RPX Corp. (a) | 8,339 | ||||||
|
| |||||||
| 49,014 | ||||||||
|
| |||||||
| SHARES | SECURITY DESCRIPTION | VALUE($) | ||||||
Road & Rail — 0.7% |
| |||||||
| 381 | ArcBest Corp. | 7,849 | ||||||
| 75 | Schneider National, Inc., Class B | 1,680 | ||||||
| 472 | YRC Worldwide, Inc. (a) | 5,243 | ||||||
|
| |||||||
| 14,772 | ||||||||
|
| |||||||
Trading Companies & Distributors — 1.3% |
| |||||||
| 163 | DXP Enterprises, Inc. (a) | 5,613 | ||||||
| 743 | MRC Global, Inc. (a) | 12,275 | ||||||
| 51 | Neff Corp., Class A (a) | 977 | ||||||
| 447 | Titan Machinery, Inc. (a) | 8,037 | ||||||
|
| |||||||
| 26,902 | ||||||||
|
| |||||||
Total Industrials | 283,554 | |||||||
|
| |||||||
Information Technology — 9.8% |
| |||||||
Communications Equipment — 0.8% |
| |||||||
| 232 | Finisar Corp. (a) | 6,030 | ||||||
| 80 | InterDigital, Inc. | 6,215 | ||||||
| 723 | Sonus Networks, Inc. (a) | 5,376 | ||||||
|
| |||||||
| 17,621 | ||||||||
|
| |||||||
Electronic Equipment, Instruments & Components — 4.1% |
| |||||||
| 242 | Bel Fuse, Inc., Class B | 5,965 | ||||||
| 749 | Benchmark Electronics, Inc. (a) | 24,206 | ||||||
| 109 | Insight Enterprises, Inc. (a) | 4,339 | ||||||
| 204 | Tech Data Corp. (a) | 20,553 | ||||||
| 1,028 | TTM Technologies, Inc. (a) | 17,848 | ||||||
| 774 | Vishay Intertechnology, Inc. | 12,840 | ||||||
|
| |||||||
| 85,751 | ||||||||
|
| |||||||
Internet Software & Services — 0.0% (g) |
| |||||||
| 66 | Liquidity Services, Inc. (a) | 417 | ||||||
| 41 | TechTarget, Inc. (a) | 426 | ||||||
|
| |||||||
| 843 | ||||||||
|
| |||||||
IT Services — 0.9% |
| |||||||
| 23 | Convergys Corp. | 540 | ||||||
| 41 | EVERTEC, Inc., (Puerto Rico) | 713 | ||||||
| 153 | Travelport Worldwide Ltd. | 2,102 | ||||||
| 1,197 | Unisys Corp. (a) | 15,324 | ||||||
|
| |||||||
| 18,679 | ||||||||
|
| |||||||
Semiconductors & Semiconductor Equipment — 1.3% |
| |||||||
| 893 | Amkor Technology, Inc. (a) | 8,725 | ||||||
| 996 | Cypress Semiconductor Corp. | 13,595 | ||||||
| 180 | Xperi Corp. | 5,361 | ||||||
|
| |||||||
| 27,681 | ||||||||
|
| |||||||
SEE NOTES TO FINANCIAL STATEMENTS.
| 34 | J.P. MORGAN SMALL CAP FUNDS | JUNE 30, 2017 | ||||
Table of Contents
| SHARES | SECURITY DESCRIPTION | VALUE($) | ||||||
Common Stocks — continued | ||||||||
Software — 2.7% |
| |||||||
| 5 | Aspen Technology, Inc. (a) | 293 | ||||||
| 76 | Fair Isaac Corp. | 10,637 | ||||||
| 538 | Progress Software Corp. | 16,604 | ||||||
| 323 | Rubicon Project, Inc. (The) (a) | 1,662 | ||||||
| 295 | Take-Two Interactive Software, Inc. (a) | 21,610 | ||||||
| 358 | TiVo Corp. | 6,671 | ||||||
|
| |||||||
| 57,477 | ||||||||
|
| |||||||
Total Information Technology | 208,052 | |||||||
|
| |||||||
Materials — 4.5% |
| |||||||
Chemicals — 1.5% |
| |||||||
| 197 | American Vanguard Corp. | 3,400 | ||||||
| 33 | Chemours Co. (The) | 1,233 | ||||||
| 202 | FutureFuel Corp. | 3,041 | ||||||
| 26 | Innophos Holdings, Inc. | 1,118 | ||||||
| 125 | Minerals Technologies, Inc. | 9,157 | ||||||
| 98 | Olin Corp. | 2,961 | ||||||
| 710 | Rayonier Advanced Materials, Inc. | 11,158 | ||||||
|
| |||||||
| 32,068 | ||||||||
|
| |||||||
Containers & Packaging — 0.4% |
| |||||||
| 438 | Graphic Packaging Holding Co. | 6,036 | ||||||
| 66 | Myers Industries, Inc. | 1,175 | ||||||
|
| |||||||
| 7,211 | ||||||||
|
| |||||||
Metals & Mining — 2.1% |
| |||||||
| 850 | AK Steel Holding Corp. (a) | 5,583 | ||||||
| 298 | Carpenter Technology Corp. | 11,139 | ||||||
| 363 | Cliffs Natural Resources, Inc. (a) | 2,509 | ||||||
| 26 | Ryerson Holding Corp. (a) | 258 | ||||||
| 161 | Schnitzer Steel Industries, Inc., Class A | 4,055 | ||||||
| 567 | SunCoke Energy, Inc. (a) | 6,176 | ||||||
| 61 | Warrior Met Coal, Inc. | 1,048 | ||||||
| 279 | Worthington Industries, Inc. | 14,006 | ||||||
|
| |||||||
| 44,774 | ||||||||
|
| |||||||
Paper & Forest Products — 0.5% |
| |||||||
| 118 | Domtar Corp. | 4,545 | ||||||
| 157 | Schweitzer-Mauduit International, Inc. | 5,856 | ||||||
|
| |||||||
| 10,401 | ||||||||
|
| |||||||
Total Materials | 94,454 | |||||||
|
| |||||||
Real Estate — 10.2% |
| |||||||
Equity Real Estate Investment Trusts (REITs) — 9.3% |
| |||||||
| 28 | American Assets Trust, Inc. | 1,087 | ||||||
| 235 | Apartment Investment & Management Co., Class A | 10,090 | ||||||
| 352 | Ashford Hospitality Prime, Inc. | 3,619 | ||||||
| SHARES | SECURITY DESCRIPTION | VALUE($) | ||||||
Equity Real Estate Investment Trusts (REITs) — continued |
| |||||||
| 1,067 | Ashford Hospitality Trust, Inc. | 6,486 | ||||||
| 432 | CBL & Associates Properties, Inc. | 3,638 | ||||||
| 328 | Cedar Realty Trust, Inc. | 1,588 | ||||||
| 99 | CoreSite Realty Corp. | 10,260 | ||||||
| 289 | DCT Industrial Trust, Inc. | 15,440 | ||||||
| 380 | DiamondRock Hospitality Co. | 4,162 | ||||||
| 83 | DuPont Fabros Technology, Inc. | 5,064 | ||||||
| 79 | EPR Properties | 5,649 | ||||||
| 847 | FelCor Lodging Trust, Inc. | 6,109 | ||||||
| 150 | First Industrial Realty Trust, Inc. | 4,299 | ||||||
| 582 | First Potomac Realty Trust | 6,468 | ||||||
| 58 | Franklin Street Properties Corp. | 644 | ||||||
| 174 | Getty Realty Corp. | 4,373 | ||||||
| 87 | Gladstone Commercial Corp. | 1,898 | ||||||
| 544 | Government Properties Income Trust | 9,959 | ||||||
| 35 | Highwoods Properties, Inc. | 1,795 | ||||||
| 190 | Hospitality Properties Trust | 5,533 | ||||||
| 352 | InfraREIT, Inc. | 6,745 | ||||||
| 145 | Kite Realty Group Trust | 2,743 | ||||||
| 95 | LaSalle Hotel Properties | 2,819 | ||||||
| 118 | LTC Properties, Inc. | 6,054 | ||||||
| 152 | Mack-Cali Realty Corp. | 4,117 | ||||||
| 278 | Monogram Residential Trust, Inc. | 2,702 | ||||||
| 240 | Pebblebrook Hotel Trust | 7,731 | ||||||
| 431 | Pennsylvania REIT | 4,881 | ||||||
| 219 | Potlatch Corp. | 9,995 | ||||||
| 100 | PS Business Parks, Inc. | 13,292 | ||||||
| 550 | RAIT Financial Trust | 1,204 | ||||||
| 378 | RLJ Lodging Trust | 7,517 | ||||||
| 14 | Saul Centers, Inc. | 823 | ||||||
| 600 | Sunstone Hotel Investors, Inc. | 9,669 | ||||||
| 16 | Taubman Centers, Inc. | 977 | ||||||
| 93 | Urstadt Biddle Properties, Inc., Class A | 1,837 | ||||||
| 516 | Washington Prime Group, Inc. | 4,322 | ||||||
| 11 | Washington REIT | 351 | ||||||
|
| |||||||
| 195,940 | ||||||||
|
| |||||||
Real Estate Management & Development — 0.9% |
| |||||||
| 165 | Alexander & Baldwin, Inc. | 6,815 | ||||||
| 541 | Forestar Group, Inc. (a) | 9,282 | ||||||
| 223 | St Joe Co. (The) (a) | 4,183 | ||||||
|
| |||||||
| 20,280 | ||||||||
|
| |||||||
Total Real Estate | 216,220 | |||||||
|
| |||||||
Telecommunication Services — 0.0% (g) |
| |||||||
Diversified Telecommunication Services — 0.0% (g) |
| |||||||
| 34 | IDT Corp., Class B | 488 | ||||||
|
| |||||||
SEE NOTES TO FINANCIAL STATEMENTS.
| JUNE 30, 2017 | J.P. MORGAN SMALL CAP FUNDS | 35 | ||||||
Table of Contents
JPMorgan Small Cap Value Fund
SCHEDULE OF PORTFOLIO INVESTMENTS
AS OF JUNE 30, 2017 (continued)
(Amounts in thousands, except number of Futures contracts)
| SHARES | SECURITY DESCRIPTION | VALUE($) | ||||||
Common Stocks — continued | ||||||||
Utilities — 6.5% |
| |||||||
Electric Utilities — 1.6% |
| |||||||
| 308 | El Paso Electric Co. | 15,898 | ||||||
| 394 | Portland General Electric Co. | 18,006 | ||||||
| 48 | Spark Energy, Inc., Class A | 895 | ||||||
|
| |||||||
| 34,799 | ||||||||
|
| |||||||
Gas Utilities — 1.9% |
| |||||||
| 267 | Northwest Natural Gas Co. | 15,962 | ||||||
| 180 | Southwest Gas Holdings, Inc. | 13,114 | ||||||
| 150 | Spire, Inc. | 10,463 | ||||||
|
| |||||||
| 39,539 | ||||||||
|
| |||||||
Independent Power and Renewable Electricity |
| |||||||
| 2,399 | Atlantic Power Corp. (a) | 5,758 | ||||||
| 1,350 | Dynegy, Inc. (a) | 11,168 | ||||||
| 330 | Pattern Energy Group, Inc. | 7,876 | ||||||
|
| |||||||
| 24,802 | ||||||||
|
| |||||||
Multi-Utilities — 1.2% |
| |||||||
| 296 | Avista Corp. | 12,572 | ||||||
| 157 | NorthWestern Corp. | 9,562 | ||||||
| 62 | Unitil Corp. | 2,981 | ||||||
|
| |||||||
| 25,115 | ||||||||
|
| |||||||
| SHARES | SECURITY DESCRIPTION | VALUE($) | ||||||
Water Utilities — 0.6% |
| |||||||
| 169 | American States Water Co. | 8,031 | ||||||
| 133 | California Water Service Group | 4,891 | ||||||
|
| |||||||
| 12,922 | ||||||||
|
| |||||||
Total Utilities | 137,177 | |||||||
|
| |||||||
Total Common Stocks | 2,063,556 | |||||||
|
| |||||||
| NUMBER OF WARRANTS | ||||||||
Warrant — 0.0% | ||||||||
Financials — 0.0% |
| |||||||
Consumer Finance — 0.0% |
| |||||||
| 3 | Emergent Capital, Inc., expiring 10/01/19 (Strike Price $10.75) (a) | — | ||||||
|
| |||||||
| SHARES | ||||||||
Short-Term Investment — 2.0% | ||||||||
Investment Company — 2.0% |
| |||||||
| 42,684 | JPMorgan U.S. Government Money Market Fund, Institutional Class Shares, 0.840% (b) (l) | 42,684 | ||||||
|
| |||||||
Total Investments — 99.6% | 2,106,240 | |||||||
Other Assets in Excess of | 8,963 | |||||||
|
| |||||||
NET ASSETS — 100.0% | $ | 2,115,203 | ||||||
|
| |||||||
Percentages indicated are based on net assets.
| Futures Contracts | ||||||||||||||||||||
| NUMBER OF CONTRACTS | DESCRIPTION | EXPIRATION DATE | TRADING CURRENCY | NOTIONAL VALUE AT JUNE 30, 2017 | NET UNREALIZED APPRECIATION (DEPRECIATION) | |||||||||||||||
Long Futures Outstanding |
| |||||||||||||||||||
| 668 | Mini Russell 2000 | 09/15/17 | USD | $ | 47,238 | $ | (159 | ) | ||||||||||||
|
| |||||||||||||||||||
SEE NOTES TO FINANCIAL STATEMENTS.
| 36 | J.P. MORGAN SMALL CAP FUNDS | JUNE 30, 2017 | ||||
Table of Contents
JPMorgan U.S. Small Company Fund
SCHEDULE OF PORTFOLIO INVESTMENTS
AS OF JUNE 30, 2017
(Amounts in thousands)
| SHARES | SECURITY DESCRIPTION | VALUE($) | ||||||
Common Stocks — 95.3% | ||||||||
Consumer Discretionary — 11.7% |
| |||||||
Auto Components — 1.1% |
| |||||||
| 59 | Cooper Tire & Rubber Co. | 2,137 | ||||||
| 381 | Stoneridge, Inc. (a) | 5,870 | ||||||
| 192 | Tenneco, Inc. | 11,103 | ||||||
|
| |||||||
| 19,110 | ||||||||
|
| |||||||
Diversified Consumer Services — 0.6% |
| |||||||
| 179 | Ascent Capital Group, Inc., Class A (a) | 2,752 | ||||||
| 189 | Houghton Mifflin Harcourt Co. (a) | 2,325 | ||||||
| 419 | Regis Corp. (a) | 4,306 | ||||||
| 9 | Strayer Education, Inc. | 802 | ||||||
|
| |||||||
| 10,185 | ||||||||
|
| |||||||
Hotels, Restaurants & Leisure — 3.1% |
| |||||||
| 593 | Bloomin’ Brands, Inc. | 12,592 | ||||||
| 11 | DineEquity, Inc. | 471 | ||||||
| 125 | Intrawest Resorts Holdings, Inc. (a) | 2,968 | ||||||
| 334 | La Quinta Holdings, Inc. (a) | 4,930 | ||||||
| 475 | Penn National Gaming, Inc. (a) | 10,169 | ||||||
| 398 | Pinnacle Entertainment, Inc. (a) | 7,855 | ||||||
| 321 | Ruby Tuesday, Inc. (a) | 644 | ||||||
| 71 | Scientific Games Corp., Class A (a) | 1,848 | ||||||
| 439 | Sonic Corp. | 11,632 | ||||||
| 97 | Speedway Motorsports, Inc. | 1,769 | ||||||
|
| |||||||
| 54,878 | ||||||||
|
| |||||||
Household Durables — 1.6% |
| |||||||
| 56 | AV Homes, Inc. (a) | 1,117 | ||||||
| 65 | NACCO Industries, Inc., Class A | 4,598 | ||||||
| 944 | Taylor Morrison Home Corp., Class A (a) | 22,661 | ||||||
| 44 | UCP, Inc., Class A (a) | 476 | ||||||
|
| |||||||
| 28,852 | ||||||||
|
| |||||||
Internet & Direct Marketing Retail — 0.2% |
| |||||||
| 294 | Liberty TripAdvisor Holdings, Inc., Class A (a) | 3,408 | ||||||
|
| |||||||
Media — 0.8% |
| |||||||
| 278 | Eros International plc, (India) (a) | 3,186 | ||||||
| 323 | Sinclair Broadcast Group, Inc., Class A | 10,614 | ||||||
|
| |||||||
| 13,800 | ||||||||
|
| |||||||
Multiline Retail — 0.5% |
| |||||||
| 156 | Big Lots, Inc. | 7,549 | ||||||
| 19 | Dillard’s, Inc., Class A | 1,079 | ||||||
|
| |||||||
| 8,628 | ||||||||
|
| |||||||
Specialty Retail — 2.6% |
| |||||||
| 58 | Aaron’s, Inc. | 2,268 | ||||||
| 211 | Barnes & Noble Education, Inc. (a) | 2,238 | ||||||
| 178 | Children’s Place, Inc. (The) | 18,164 | ||||||
| SHARES | SECURITY DESCRIPTION | VALUE($) | ||||||
Specialty Retail — continued |
| |||||||
| 16 | Floor & Decor Holdings, Inc., Class A (a) | 608 | ||||||
| 534 | GNC Holdings, Inc., Class A | 4,505 | ||||||
| 402 | Office Depot, Inc. | 2,268 | ||||||
| 1,126 | Pier 1 Imports, Inc. | 5,843 | ||||||
| 248 | Select Comfort Corp. (a) | 8,798 | ||||||
|
| |||||||
| 44,692 | ||||||||
|
| |||||||
Textiles, Apparel & Luxury Goods — 1.2% |
| |||||||
| 543 | Fossil Group, Inc. (a) | 5,622 | ||||||
| 250 | Iconix Brand Group, Inc. (a) | 1,726 | ||||||
| 216 | Movado Group, Inc. | 5,449 | ||||||
| 68 | Perry Ellis International, Inc. (a) | 1,321 | ||||||
| 232 | Wolverine World Wide, Inc. | 6,493 | ||||||
|
| |||||||
| 20,611 | ||||||||
|
| |||||||
Total Consumer Discretionary | 204,164 | |||||||
|
| |||||||
Consumer Staples — 2.7% |
| |||||||
Food & Staples Retailing — 0.2% |
| |||||||
| 105 | Ingles Markets, Inc., Class A | 3,487 | ||||||
|
| |||||||
Food Products — 1.9% |
| |||||||
| 1,045 | Darling Ingredients, Inc. (a) | 16,444 | ||||||
| 299 | Dean Foods Co. | 5,083 | ||||||
| 191 | Pilgrim’s Pride Corp. (a) | 4,195 | ||||||
| 57 | Post Holdings, Inc. (a) | 4,442 | ||||||
| 24 | Sanderson Farms, Inc. | 2,822 | ||||||
| 23 | Seneca Foods Corp., Class A (a) | 720 | ||||||
|
| |||||||
| 33,706 | ||||||||
|
| |||||||
Personal Products — 0.1% |
| |||||||
| 21 | Herbalife Ltd. (a) | 1,462 | ||||||
| 16 | Medifast, Inc. | 643 | ||||||
|
| |||||||
| 2,105 | ||||||||
|
| |||||||
Tobacco — 0.5% |
| |||||||
| 120 | Universal Corp. | 7,770 | ||||||
|
| |||||||
Total Consumer Staples | 47,068 | |||||||
|
| |||||||
Energy — 3.5% |
| |||||||
Energy Equipment & Services — 0.7% |
| |||||||
| 377 | Archrock, Inc. | 4,297 | ||||||
| 6 | Natural Gas Services Group, Inc. (a) | 142 | ||||||
| 362 | Parker Drilling Co. (a) | 489 | ||||||
| 361 | Rowan Cos. plc, Class A (a) | 3,700 | ||||||
| 34 | SEACOR Holdings, Inc. (a) | 1,176 | ||||||
| 34 | SEACOR Marine Holdings, Inc. (a) | 702 | ||||||
| 140 | Unit Corp. (a) | 2,616 | ||||||
|
| |||||||
| 13,122 | ||||||||
|
| |||||||
SEE NOTES TO FINANCIAL STATEMENTS.
| JUNE 30, 2017 | J.P. MORGAN SMALL CAP FUNDS | 37 | ||||||
Table of Contents
JPMorgan U.S. Small Company Fund
SCHEDULE OF PORTFOLIO INVESTMENTS
AS OF JUNE 30, 2017 (continued)
(Amounts in thousands)
| SHARES | SECURITY DESCRIPTION | VALUE($) | ||||||
Common Stocks — continued | ||||||||
Oil, Gas & Consumable Fuels — 2.8% |
| |||||||
| 17 | Adams Resources & Energy, Inc. | 682 | ||||||
| 1,224 | Bill Barrett Corp. (a) | 3,756 | ||||||
| 400 | Delek US Holdings, Inc. | 10,587 | ||||||
| 1,529 | Denbury Resources, Inc. (a) | 2,339 | ||||||
| 933 | EP Energy Corp., Class A (a) | 3,413 | ||||||
| 86 | International Seaways, Inc. (a) | 1,862 | ||||||
| 393 | Renewable Energy Group, Inc. (a) | 5,092 | ||||||
| 184 | REX American Resources Corp. (a) | 17,757 | ||||||
| 375 | Sanchez Energy Corp. (a) | 2,695 | ||||||
| 123 | Westmoreland Coal Co. (a) | 598 | ||||||
|
| |||||||
| 48,781 | ||||||||
|
| |||||||
Total Energy | 61,903 | |||||||
|
| |||||||
Financials — 17.5% |
| |||||||
Banks — 9.3% |
| |||||||
| 61 | 1st Source Corp. | 2,943 | ||||||
| 95 | BancFirst Corp. | 9,138 | ||||||
| 251 | BancorpSouth, Inc. | 7,665 | ||||||
| 16 | Cadence BanCorp (a) | 344 | ||||||
| 197 | Capital Bank Financial Corp., Class A | 7,487 | ||||||
| 98 | Cathay General Bancorp | 3,731 | ||||||
| 323 | Central Pacific Financial Corp. | 10,152 | ||||||
| 23 | Central Valley Community Bancorp | 510 | ||||||
| 39 | Chemical Financial Corp. | 1,864 | ||||||
| 26 | Citizens & Northern Corp. | 596 | ||||||
| 62 | City Holding Co. | 4,110 | ||||||
| 405 | CVB Financial Corp. | 9,093 | ||||||
| 4 | East West Bancorp, Inc. | 230 | ||||||
| 302 | FCB Financial Holdings, Inc., Class A (a) | 14,397 | ||||||
| 410 | First Commonwealth Financial Corp. | 5,203 | ||||||
| 27 | First Community Bancshares, Inc. | 749 | ||||||
| 65 | First Financial Bancorp | 1,795 | ||||||
| 91 | First Hawaiian, Inc. | 2,774 | ||||||
| 66 | First Interstate BancSystem, Inc., Class A | 2,455 | ||||||
| 83 | Flushing Financial Corp. | 2,348 | ||||||
| 105 | Fulton Financial Corp. | 2,003 | ||||||
| 32 | Great Western Bancorp, Inc. | 1,322 | ||||||
| 42 | Guaranty Bancorp | 1,129 | ||||||
| 201 | Hope Bancorp, Inc. | 3,742 | ||||||
| 59 | IBERIABANK Corp. | 4,821 | ||||||
| 130 | Independent Bank Corp. | 3,391 | ||||||
| 276 | Investors Bancorp, Inc. | 3,683 | ||||||
| 30 | MainSource Financial Group, Inc. | 1,002 | ||||||
| 23 | National Bank Holdings Corp., Class A | 760 | ||||||
| 228 | OFG Bancorp, (Puerto Rico) | 2,276 | ||||||
| 67 | PacWest Bancorp | 3,138 | ||||||
| SHARES | SECURITY DESCRIPTION | VALUE($) | ||||||
Banks — continued |
| |||||||
| 186 | People’s United Financial, Inc. | 3,281 | ||||||
| 28 | Sierra Bancorp | 697 | ||||||
| 40 | Simmons First National Corp., Class A | 2,121 | ||||||
| 20 | Southside Bancshares, Inc. | 689 | ||||||
| 47 | Southwest Bancorp, Inc. | 1,193 | ||||||
| 253 | TCF Financial Corp. | 4,026 | ||||||
| 87 | Trustmark Corp. | 2,785 | ||||||
| 61 | UMB Financial Corp. | 4,552 | ||||||
| 305 | Union Bankshares Corp. | 10,326 | ||||||
| 59 | Webster Financial Corp. | 3,065 | ||||||
| 40 | West Bancorp, Inc. | 953 | ||||||
| 250 | Westamerica Bancorp | 13,993 | ||||||
|
| |||||||
| 162,532 | ||||||||
|
| |||||||
Capital Markets — 1.1% |
| |||||||
| 36 | Federated Investors, Inc., Class B | 1,020 | ||||||
| 13 | Houlihan Lokey, Inc. | 450 | ||||||
| 145 | KCG Holdings, Inc., Class A (a) | 2,895 | ||||||
| 53 | MarketAxess Holdings, Inc. | 10,678 | ||||||
| 21 | Stifel Financial Corp. (a) | 970 | ||||||
| 21 | Virtus Investment Partners, Inc. | 2,297 | ||||||
|
| |||||||
| 18,310 | ||||||||
|
| |||||||
Consumer Finance — 0.6% |
| |||||||
| 11 | Credit Acceptance Corp. (a) | 2,828 | ||||||
| 516 | EZCORP, Inc., Class A (a) | 3,972 | ||||||
| 82 | Nelnet, Inc., Class A | 3,874 | ||||||
| 20 | Regional Management Corp. (a) | 470 | ||||||
|
| |||||||
| 11,144 | ||||||||
|
| |||||||
Insurance — 2.5% |
| |||||||
| 18 | Ambac Financial Group, Inc. (a) | 316 | ||||||
| 40 | American Equity Investment Life Holding Co. | 1,041 | ||||||
| 28 | Aspen Insurance Holdings Ltd., (Bermuda) | 1,416 | ||||||
| 18 | Blue Capital Reinsurance Holdings Ltd., (Bermuda) | 326 | ||||||
| 347 | CNO Financial Group, Inc. | 7,245 | ||||||
| 64 | First American Financial Corp. | 2,847 | ||||||
| 23 | Global Indemnity Ltd., (Cayman Islands) (a) | 900 | ||||||
| 81 | Kemper Corp. | 3,131 | ||||||
| 594 | MBIA, Inc. (a) | 5,604 | ||||||
| 96 | Navigators Group, Inc. (The) | 5,292 | ||||||
| 100 | Primerica, Inc. | 7,605 | ||||||
| 77 | ProAssurance Corp. | 4,669 | ||||||
| 16 | Stewart Information Services Corp. | 703 | ||||||
| 125 | Third Point Reinsurance Ltd., (Bermuda) (a) | 1,733 | ||||||
| 28 | Universal Insurance Holdings, Inc. | 716 | ||||||
|
| |||||||
| 43,544 | ||||||||
|
| |||||||
SEE NOTES TO FINANCIAL STATEMENTS.
| 38 | J.P. MORGAN SMALL CAP FUNDS | JUNE 30, 2017 | ||||
Table of Contents
| SHARES | SECURITY DESCRIPTION | VALUE($) | ||||||
Common Stocks — continued | ||||||||
Mortgage Real Estate Investment Trusts (REITs) — 1.2% |
| |||||||
| 690 | Capstead Mortgage Corp. | 7,197 | ||||||
| 1,704 | CYS Investments, Inc. | 14,328 | ||||||
|
| |||||||
| 21,525 | ||||||||
|
| |||||||
Thrifts & Mortgage Finance — 2.8% |
| |||||||
| 21 | BankFinancial Corp. | 316 | ||||||
| 638 | Beneficial Bancorp, Inc. | 9,570 | ||||||
| 23 | Capitol Federal Financial, Inc. | 324 | ||||||
| 69 | Charter Financial Corp. | 1,238 | ||||||
| 22 | First Defiance Financial Corp. | 1,180 | ||||||
| 313 | Kearny Financial Corp. | 4,647 | ||||||
| 601 | Meridian Bancorp, Inc. | 10,159 | ||||||
| 258 | MGIC Investment Corp. (a) | 2,885 | ||||||
| 120 | NMI Holdings, Inc., Class A (a) | 1,372 | ||||||
| 560 | Northfield Bancorp, Inc. | 9,604 | ||||||
| 151 | Walker & Dunlop, Inc. (a) | 7,368 | ||||||
|
| |||||||
| 48,663 | ||||||||
|
| |||||||
Total Financials | 305,718 | |||||||
|
| |||||||
Health Care — 14.3% |
| |||||||
Biotechnology — 5.3% |
| |||||||
| 95 | ACADIA Pharmaceuticals, Inc. (a) | 2,647 | ||||||
| 742 | Achillion Pharmaceuticals, Inc. (a) | 3,404 | ||||||
| 225 | Aimmune Therapeutics, Inc. (a) | 4,620 | ||||||
| 206 | Alder Biopharmaceuticals, Inc. (a) | 2,358 | ||||||
| 588 | Amicus Therapeutics, Inc. (a) | 5,924 | ||||||
| 280 | Arena Pharmaceuticals, Inc. (a) | 4,720 | ||||||
| 48 | Avexis, Inc. (a) | 3,960 | ||||||
| 122 | Bellicum Pharmaceuticals, Inc. (a) | 1,424 | ||||||
| 166 | Biohaven Pharmaceutical Holding Co. Ltd., (Canada) (a) | 4,140 | ||||||
| 197 | Cara Therapeutics, Inc. (a) | 3,035 | ||||||
| 214 | CytomX Therapeutics, Inc. (a) | 3,317 | ||||||
| 103 | Edge Therapeutics, Inc. (a) | 1,060 | ||||||
| 148 | Flexion Therapeutics, Inc. (a) | 2,982 | ||||||
| 156 | Global Blood Therapeutics, Inc. (a) | 4,275 | ||||||
| 17 | Karyopharm Therapeutics, Inc. (a) | 153 | ||||||
| 161 | Mersana Therapeutics, Inc. (a) | 2,246 | ||||||
| 178 | Myriad Genetics, Inc. (a) | 4,602 | ||||||
| 89 | Prothena Corp. plc, (Ireland) (a) | 4,817 | ||||||
| 28 | Sage Therapeutics, Inc. (a) | 2,222 | ||||||
| 153 | Sarepta Therapeutics, Inc. (a) | 5,171 | ||||||
| 96 | Selecta Biosciences, Inc. (a) | 1,910 | ||||||
| 168 | Seres Therapeutics, Inc. (a) | 1,895 | ||||||
| 1,361 | Synergy Pharmaceuticals, Inc. (a) | 6,054 | ||||||
| 321 | TG Therapeutics, Inc. (a) | 3,225 | ||||||
| SHARES | SECURITY DESCRIPTION | VALUE($) | ||||||
Biotechnology — continued |
| |||||||
| 83 | Ultragenyx Pharmaceutical, Inc. (a) | 5,168 | ||||||
| 235 | Versartis, Inc. (a) | 4,102 | ||||||
| 173 | Xencor, Inc. (a) | 3,650 | ||||||
|
| |||||||
| 93,081 | ||||||||
|
| |||||||
Health Care Equipment & Supplies — 2.7% |
| |||||||
| 179 | Halyard Health, Inc. (a) | 7,031 | ||||||
| 119 | Masimo Corp. (a) | 10,860 | ||||||
| 200 | Orthofix International NV (a) | 9,310 | ||||||
| 22 | Utah Medical Products, Inc. | 1,607 | ||||||
| 671 | Wright Medical Group NV (a) | 18,446 | ||||||
|
| |||||||
| 47,254 | ||||||||
|
| |||||||
Health Care Providers & Services — 4.1% |
| |||||||
| 272 | Civitas Solutions, Inc. (a) | 4,753 | ||||||
| 621 | Cross Country Healthcare, Inc. (a) | 8,013 | ||||||
| 730 | Genesis Healthcare, Inc. (a) | 1,270 | ||||||
| 238 | Kindred Healthcare, Inc. | 2,776 | ||||||
| 75 | Landauer, Inc. | 3,917 | ||||||
| 202 | Molina Healthcare, Inc. (a) | 13,954 | ||||||
| 375 | Owens & Minor, Inc. | 12,084 | ||||||
| 502 | Tivity Health, Inc. (a) | 20,017 | ||||||
| 30 | WellCare Health Plans, Inc. (a) | 5,423 | ||||||
|
| |||||||
| 72,207 | ||||||||
|
| |||||||
Health Care Technology — 0.3% |
| |||||||
| 255 | HMS Holdings Corp. (a) | 4,714 | ||||||
|
| |||||||
Life Sciences Tools & Services — 0.2% |
| |||||||
| 72 | INC Research Holdings, Inc., Class A (a) | 4,200 | ||||||
|
| |||||||
Pharmaceuticals — 1.7% |
| |||||||
| 294 | MyoKardia, Inc. (a) | 3,854 | ||||||
| 270 | Nektar Therapeutics (a) | 5,271 | ||||||
| 103 | Pacira Pharmaceuticals, Inc. (a) | 4,927 | ||||||
| 176 | Paratek Pharmaceuticals, Inc. (a) | 4,244 | ||||||
| 34 | Prestige Brands Holdings, Inc. (a) | 1,817 | ||||||
| 156 | Reata Pharmaceuticals, Inc., Class A (a) | 4,929 | ||||||
| 181 | Revance Therapeutics, Inc. (a) | 4,776 | ||||||
|
| |||||||
| 29,818 | ||||||||
|
| |||||||
Total Health Care | 251,274 | |||||||
|
| |||||||
Industrials — 15.0% |
| |||||||
Aerospace & Defense — 1.5% |
| |||||||
| 94 | AAR Corp. | 3,278 | ||||||
| 78 | Curtiss-Wright Corp. | 7,122 | ||||||
| 317 | DigitalGlobe, Inc. (a) | 10,545 | ||||||
| 71 | Moog, Inc., Class A (a) | 5,099 | ||||||
|
| |||||||
| 26,044 | ||||||||
|
| |||||||
SEE NOTES TO FINANCIAL STATEMENTS.
| JUNE 30, 2017 | J.P. MORGAN SMALL CAP FUNDS | 39 | ||||||
Table of Contents
JPMorgan U.S. Small Company Fund
SCHEDULE OF PORTFOLIO INVESTMENTS
AS OF JUNE 30, 2017 (continued)
(Amounts in thousands)
| SHARES | SECURITY DESCRIPTION | VALUE($) | ||||||
Common Stocks — continued | ||||||||
Airlines — 0.2% |
| |||||||
| 47 | Alaska Air Group, Inc. | 4,174 | ||||||
|
| |||||||
Building Products — 1.1% |
| |||||||
| 486 | Continental Building Products, Inc. (a) | 11,317 | ||||||
| 145 | Gibraltar Industries, Inc. (a) | 5,151 | ||||||
| 180 | Ply Gem Holdings, Inc. (a) | 3,231 | ||||||
|
| |||||||
| 19,699 | ||||||||
|
| |||||||
Commercial Services & Supplies — 2.9% |
| |||||||
| 1,466 | ACCO Brands Corp. (a) | 17,079 | ||||||
| 95 | ARC Document Solutions, Inc. (a) | 395 | ||||||
| 503 | CECO Environmental Corp. | 4,614 | ||||||
| 121 | Deluxe Corp. | 8,403 | ||||||
| 343 | Ennis, Inc. | 6,559 | ||||||
| 69 | Essendant, Inc. | 1,028 | ||||||
| 75 | Interface, Inc. | 1,466 | ||||||
| 110 | VSE Corp. | 4,957 | ||||||
| 234 | West Corp. | 5,466 | ||||||
|
| |||||||
| 49,967 | ||||||||
|
| |||||||
Construction & Engineering — 1.4% |
| |||||||
| 253 | EMCOR Group, Inc. | 16,522 | ||||||
| 62 | MasTec, Inc. (a) | 2,813 | ||||||
| 142 | MYR Group, Inc. (a) | 4,417 | ||||||
|
| |||||||
| 23,752 | ||||||||
|
| |||||||
Electrical Equipment — 0.5% |
| |||||||
| 168 | Generac Holdings, Inc. (a) | 6,084 | ||||||
| 104 | Powell Industries, Inc. | 3,318 | ||||||
|
| |||||||
| 9,402 | ||||||||
|
| |||||||
Machinery — 2.3% |
| |||||||
| 244 | Actuant Corp., Class A | 5,995 | ||||||
| 372 | Briggs & Stratton Corp. | 8,958 | ||||||
| 301 | Douglas Dynamics, Inc. | 9,913 | ||||||
| 42 | Graham Corp. | 820 | ||||||
| 72 | Harsco Corp. (a) | 1,154 | ||||||
| 82 | Kadant, Inc. | 6,144 | ||||||
| 358 | Wabash National Corp. | 7,871 | ||||||
|
| |||||||
| 40,855 | ||||||||
|
| |||||||
Marine — 0.6% |
| |||||||
| 512 | Costamare, Inc., (Monaco) | 3,741 | ||||||
| 198 | Matson, Inc. | 5,951 | ||||||
|
| |||||||
| 9,692 | ||||||||
|
| |||||||
Professional Services — 2.3% |
| |||||||
| 706 | Acacia Research Corp. (a) | 2,896 | ||||||
| 208 | Barrett Business Services, Inc. | 11,941 | ||||||
| SHARES | SECURITY DESCRIPTION | VALUE($) | ||||||
Professional Services — continued |
| |||||||
| 81 | Franklin Covey Co. (a) | 1,572 | ||||||
| 346 | Huron Consulting Group, Inc. (a) | 14,943 | ||||||
| 33 | TriNet Group, Inc. (a) | 1,087 | ||||||
| 120 | WageWorks, Inc. (a) | 8,084 | ||||||
|
| |||||||
| 40,523 | ||||||||
|
| |||||||
Road & Rail — 0.7% |
| |||||||
| 132 | ArcBest Corp. | 2,709 | ||||||
| 60 | Schneider National, Inc., Class B | 1,331 | ||||||
| 253 | Swift Transportation Co. (a) | 6,710 | ||||||
| 145 | YRC Worldwide, Inc. (a) | 1,612 | ||||||
|
| |||||||
| 12,362 | ||||||||
|
| |||||||
Trading Companies & Distributors — 1.5% |
| |||||||
| 86 | Applied Industrial Technologies, Inc. | 5,061 | ||||||
| 153 | DXP Enterprises, Inc. (a) | 5,278 | ||||||
| 511 | MRC Global, Inc. (a) | 8,433 | ||||||
| 2 | Neff Corp., Class A (a) | 40 | ||||||
| 368 | Titan Machinery, Inc. (a) | 6,608 | ||||||
|
| |||||||
| 25,420 | ||||||||
|
| |||||||
Total Industrials | 261,890 | |||||||
|
| |||||||
Information Technology — 16.5% |
| |||||||
Communications Equipment — 1.3% |
| |||||||
| 141 | Ciena Corp. (a) | 3,535 | ||||||
| 549 | Extreme Networks, Inc. (a) | 5,063 | ||||||
| 196 | InterDigital, Inc. | 15,159 | ||||||
|
| |||||||
| 23,757 | ||||||||
|
| |||||||
Electronic Equipment, Instruments & Components — 2.9% |
| |||||||
| 104 | Bel Fuse, Inc., Class B | 2,559 | ||||||
| 479 | Benchmark Electronics, Inc. (a) | 15,485 | ||||||
| 53 | ePlus, Inc. (a) | 3,927 | ||||||
| 2 | KEMET Corp. (a) | 28 | ||||||
| 435 | Knowles Corp. (a) | 7,355 | ||||||
| 17 | ScanSource, Inc. (a) | 685 | ||||||
| 142 | Tech Data Corp. (a) | 14,342 | ||||||
| 21 | TTM Technologies, Inc. (a) | 370 | ||||||
| 378 | Vishay Intertechnology, Inc. | 6,271 | ||||||
|
| |||||||
| 51,022 | ||||||||
|
| |||||||
Internet Software & Services — 1.9% |
| |||||||
| 225 | Bankrate, Inc. (a) | 2,885 | ||||||
| 206 | Cloudera, Inc. (a) | 3,305 | ||||||
| 199 | DHI Group, Inc. (a) | 568 | ||||||
| 101 | Liquidity Services, Inc. (a) | 643 | ||||||
| 148 | Nutanix, Inc., Class A (a) | 2,980 | ||||||
| 109 | Okta, Inc. (a) | 2,494 | ||||||
SEE NOTES TO FINANCIAL STATEMENTS.
| 40 | J.P. MORGAN SMALL CAP FUNDS | JUNE 30, 2017 | ||||
Table of Contents
| SHARES | SECURITY DESCRIPTION | VALUE($) | ||||||
Common Stocks — continued | ||||||||
Internet Software & Services — continued |
| |||||||
| 12 | Stamps.com, Inc. (a) | 1,797 | ||||||
| 303 | Tintri, Inc. (a) | 2,201 | ||||||
| 332 | Web.com Group, Inc. (a) | 8,387 | ||||||
| 183 | Yelp, Inc. (a) | 5,491 | ||||||
| 151 | Yext, Inc. (a) | 2,018 | ||||||
|
| |||||||
| 32,769 | ||||||||
|
| |||||||
IT Services — 1.9% |
| |||||||
| 195 | Convergys Corp. | 4,632 | ||||||
| 118 | CSG Systems International, Inc. | 4,776 | ||||||
| 30 | Euronet Worldwide, Inc. (a) | 2,595 | ||||||
| 39 | EVERTEC, Inc., (Puerto Rico) | 666 | ||||||
| 94 | Science Applications International Corp. | 6,498 | ||||||
| 284 | Travelport Worldwide Ltd. | 3,902 | ||||||
| 791 | Unisys Corp. (a) | 10,128 | ||||||
|
| |||||||
| 33,197 | ||||||||
|
| |||||||
Semiconductors & Semiconductor Equipment — 3.0% |
| |||||||
| 29 | Advanced Energy Industries, Inc. (a) | 1,902 | ||||||
| 262 | Alpha & Omega Semiconductor Ltd. (a) | 4,371 | ||||||
| 540 | Amkor Technology, Inc. (a) | 5,271 | ||||||
| 359 | Cohu, Inc. | 5,652 | ||||||
| 247 | Integrated Device Technology, Inc. (a) | 6,370 | ||||||
| 21 | Silicon Laboratories, Inc. (a) | 1,449 | ||||||
| 204 | Synaptics, Inc. (a) | 10,539 | ||||||
| 117 | Xcerra Corp. (a) | 1,141 | ||||||
| 534 | Xperi Corp. | 15,922 | ||||||
|
| |||||||
| 52,617 | ||||||||
|
| |||||||
Software — 5.5% |
| |||||||
| 267 | ACI Worldwide, Inc. (a) | 5,964 | ||||||
| 345 | Aspen Technology, Inc. (a) | 19,087 | ||||||
| 152 | Barracuda Networks, Inc. (a) | 3,514 | ||||||
| 18 | Blackline, Inc. (a) | 636 | ||||||
| 90 | Fair Isaac Corp. | 12,603 | ||||||
| 50 | Manhattan Associates, Inc. (a) | 2,403 | ||||||
| 507 | Progress Software Corp. | 15,667 | ||||||
| 27 | Proofpoint, Inc. (a) | 2,362 | ||||||
| 51 | Qualys, Inc. (a) | 2,089 | ||||||
| 334 | Synchronoss Technologies, Inc. (a) | 5,497 | ||||||
| 270 | Take-Two Interactive Software, Inc. (a) | 19,835 | ||||||
| 104 | VASCO Data Security International, Inc. (a) | 1,492 | ||||||
| 124 | Workiva, Inc. (a) | 2,370 | ||||||
| 458 | Zix Corp. (a) | 2,608 | ||||||
|
| |||||||
| 96,127 | ||||||||
|
| |||||||
Total Information Technology | 289,489 | |||||||
|
| |||||||
| SHARES | SECURITY DESCRIPTION | VALUE($) | ||||||
Materials — 3.7% |
| |||||||
Chemicals — 2.1% |
| |||||||
| 84 | American Vanguard Corp. | 1,442 | ||||||
| 162 | FutureFuel Corp. | 2,437 | ||||||
| 19 | Koppers Holdings, Inc. (a) | 669 | ||||||
| 127 | Minerals Technologies, Inc. | 9,304 | ||||||
| 44 | Olin Corp. | 1,323 | ||||||
| 293 | OMNOVA Solutions, Inc. (a) | 2,859 | ||||||
| 341 | Rayonier Advanced Materials, Inc. | 5,362 | ||||||
| 184 | Trinseo SA | 12,627 | ||||||
|
| |||||||
| 36,023 | ||||||||
|
| |||||||
Containers & Packaging — 0.6% |
| |||||||
| 771 | Graphic Packaging Holding Co. | 10,620 | ||||||
| 36 | Myers Industries, Inc. | 643 | ||||||
|
| |||||||
| 11,263 | ||||||||
|
| |||||||
Metals & Mining — 0.9% |
| |||||||
| 280 | AK Steel Holding Corp. (a) | 1,842 | ||||||
| 60 | Carpenter Technology Corp. | 2,231 | ||||||
| 53 | SunCoke Energy, Inc. (a) | 582 | ||||||
| 49 | Warrior Met Coal, Inc. | 836 | ||||||
| 198 | Worthington Industries, Inc. | 9,928 | ||||||
|
| |||||||
| 15,419 | ||||||||
|
| |||||||
Paper & Forest Products — 0.1% |
| |||||||
| 46 | Domtar Corp. | 1,779 | ||||||
|
| |||||||
Total Materials | 64,484 | |||||||
|
| |||||||
Real Estate — 6.3% |
| |||||||
Equity Real Estate Investment Trusts (REITs) — 5.7% |
| |||||||
| 109 | American Assets Trust, Inc. | 4,274 | ||||||
| 727 | Ashford Hospitality Trust, Inc. | 4,422 | ||||||
| 119 | CBL & Associates Properties, Inc. | 1,000 | ||||||
| 181 | CoreSite Realty Corp. | 18,739 | ||||||
| 78 | CubeSmart | 1,877 | ||||||
| 94 | DCT Industrial Trust, Inc. | 5,010 | ||||||
| 116 | DiamondRock Hospitality Co. | 1,266 | ||||||
| 51 | EastGroup Properties, Inc. | 4,274 | ||||||
| 5 | EPR Properties | 388 | ||||||
| 30 | Equity LifeStyle Properties, Inc. | 2,564 | ||||||
| 58 | First Industrial Realty Trust, Inc. | 1,663 | ||||||
| 100 | Franklin Street Properties Corp. | 1,111 | ||||||
| 23 | Gladstone Commercial Corp. | 499 | ||||||
| 110 | Government Properties Income Trust | 2,005 | ||||||
| 203 | Hersha Hospitality Trust | 3,761 | ||||||
| 44 | Highwoods Properties, Inc. | 2,206 | ||||||
| 119 | Hospitality Properties Trust | 3,457 | ||||||
SEE NOTES TO FINANCIAL STATEMENTS.
| JUNE 30, 2017 | J.P. MORGAN SMALL CAP FUNDS | 41 | ||||||
Table of Contents
JPMorgan U.S. Small Company Fund
SCHEDULE OF PORTFOLIO INVESTMENTS
AS OF JUNE 30, 2017 (continued)
(Amounts in thousands, except number of Futures contracts)
| SHARES | SECURITY DESCRIPTION | VALUE($) | ||||||
Common Stocks — continued | ||||||||
Equity Real Estate Investment Trusts (REITs) — continued |
| |||||||
| 35 | InfraREIT, Inc. | 663 | ||||||
| 122 | LTC Properties, Inc. | 6,280 | ||||||
| 105 | Mack-Cali Realty Corp. | 2,842 | ||||||
| 103 | Monogram Residential Trust, Inc. | 999 | ||||||
| 15 | National Retail Properties, Inc. | 575 | ||||||
| 61 | Pennsylvania REIT | 695 | ||||||
| 163 | Potlatch Corp. | 7,444 | ||||||
| 21 | PS Business Parks, Inc. | 2,740 | ||||||
| 214 | Ramco-Gershenson Properties Trust | 2,764 | ||||||
| 557 | RLJ Lodging Trust | 11,074 | ||||||
| 57 | Saul Centers, Inc. | 3,305 | ||||||
| 37 | Summit Hotel Properties, Inc. | 694 | ||||||
| 39 | Taubman Centers, Inc. | 2,293 | ||||||
|
| |||||||
| 100,884 | ||||||||
|
| |||||||
Real Estate Management & Development — 0.6% |
| |||||||
| 35 | Alexander & Baldwin, Inc. | 1,457 | ||||||
| 468 | Forestar Group, Inc. (a) | 8,028 | ||||||
| 23 | St Joe Co. (The) (a) | 429 | ||||||
|
| |||||||
| 9,914 | ||||||||
|
| |||||||
Total Real Estate | 110,798 | |||||||
|
| |||||||
Telecommunication Services — 0.6% |
| |||||||
Diversified Telecommunication Services — 0.6% |
| |||||||
| 231 | IDT Corp., Class B | 3,321 | ||||||
| 2,002 | Windstream Holdings, Inc. | 7,769 | ||||||
|
| |||||||
Total Telecommunication Services | 11,090 | |||||||
|
| |||||||
Utilities — 3.5% |
| |||||||
Electric Utilities — 1.3% |
| |||||||
| 119 | El Paso Electric Co. | 6,137 | ||||||
| 88 | PNM Resources, Inc. | 3,355 | ||||||
| 209 | Portland General Electric Co. | 9,540 | ||||||
| 170 | Spark Energy, Inc., Class A | 3,203 | ||||||
|
| |||||||
| 22,235 | ||||||||
|
| |||||||
Gas Utilities — 0.6% |
| |||||||
| 30 | Northwest Natural Gas Co. | 1,777 | ||||||
| 59 | Southwest Gas Holdings, Inc. | 4,325 | ||||||
| 70 | Spire, Inc. | 4,855 | ||||||
|
| |||||||
| 10,957 | ||||||||
|
| |||||||
| SHARES | SECURITY DESCRIPTION | VALUE($) | ||||||
Independent Power and Renewable Electricity |
| |||||||
| 1,532 | Atlantic Power Corp. (a) | 3,676 | ||||||
| 922 | Dynegy, Inc. (a) | 7,625 | ||||||
| 163 | Pattern Energy Group, Inc. | 3,886 | ||||||
|
| |||||||
| 15,187 | ||||||||
|
| |||||||
Multi-Utilities — 0.2% |
| |||||||
| 30 | Avista Corp. | 1,257 | ||||||
| 32 | NorthWestern Corp. | 1,971 | ||||||
|
| |||||||
| 3,228 | ||||||||
|
| |||||||
Water Utilities — 0.5% |
| |||||||
| 196 | American States Water Co. | 9,268 | ||||||
|
| |||||||
Total Utilities | 60,875 | |||||||
|
| |||||||
Total Common Stocks | 1,668,753 | |||||||
|
| |||||||
| NUMBER OF WARRANTS | ||||||||
Warrant — 0.0% | ||||||||
Financials — 0.0% |
| |||||||
Consumer Finance — 0.0% | ||||||||
| — | (h) | Emergent Capital, Inc., expiring 10/01/19 (Strike Price $10.75) (a) | — | |||||
|
| |||||||
Short-Term Investment — 4.5% | ||||||||
Investment Company — 4.5% |
| |||||||
| 78,822 | JPMorgan U.S. Government Money Market Fund, Institutional Class Shares, 0.840% (b) (l) | 78,822 | ||||||
|
| |||||||
Total Investments — 99.8% | 1,747,575 | |||||||
Other Assets in Excess of | 4,098 | |||||||
|
| |||||||
NET ASSETS — 100.0% | $ | 1,751,673 | ||||||
|
| |||||||
Percentages indicated are based on net assets.
| Futures Contracts | ||||||||||||||||||||
| NUMBER OF CONTRACTS | DESCRIPTION | EXPIRATION DATE | TRADING CURRENCY | NOTIONAL VALUE AT JUNE 30, 2017 | NET UNREALIZED APPRECIATION (DEPRECIATION) | |||||||||||||||
Long Futures Outstanding |
| |||||||||||||||||||
| 1,098 | Mini Russell 2000 | 09/15/17 | USD | $ | 77,645 | $ | (106 | ) | ||||||||||||
|
| |||||||||||||||||||
SEE NOTES TO FINANCIAL STATEMENTS.
| 42 | J.P. MORGAN SMALL CAP FUNDS | JUNE 30, 2017 | ||||
Table of Contents
J.P. Morgan Small Cap Funds
NOTES TO SCHEDULES OF PORTFOLIO INVESTMENTS
AS OF JUNE 30, 2017
| REIT | — Real Estate Investment Trust | |
| USD | — United States Dollar | |
| (a) | — Non-income producing security. | |
| (b) | — Investment in affiliate. Money market fund is registered under the Investment Company Act of 1940, as amended, and advised by J.P. Morgan Investment Management Inc. |
| (g) | — Amount rounds to less than 0.05%. | |
| (h) | — Amount rounds to less than 500. | |
| (l) | — The rate shown is the current yield as of June 30, 2017. |
SEE NOTES TO FINANCIAL STATEMENTS.
| JUNE 30, 2017 | J.P. MORGAN SMALL CAP FUNDS | 43 | ||||||
Table of Contents
STATEMENTS OF ASSETS AND LIABILITIES
AS OF JUNE 30, 2017
(Amounts in thousands, except per share amounts)
| Dynamic Small Cap Growth Fund | Small Cap Core Fund | Small Cap Equity Fund | ||||||||||
ASSETS: |
| |||||||||||
Investments in non-affiliates, at value | $ | 166,319 | $ | 204,080 | $ | 6,038,706 | ||||||
Investments in affiliates, at value | 3,593 | 10,565 | 267,273 | |||||||||
|
|
|
|
|
| |||||||
Total investment securities, at value | 169,912 | 214,645 | 6,305,979 | |||||||||
Cash | — | 3 | — | |||||||||
Deposits at broker for futures contracts | — | 540 | — | |||||||||
Receivables: | ||||||||||||
Investment securities sold | 1,060 | 1,163 | 13,678 | |||||||||
Fund shares sold | 462 | 97 | 8,386 | |||||||||
Dividends from non-affiliates | 67 | 192 | 6,143 | |||||||||
Dividends from affiliates | 1 | 3 | 178 | |||||||||
|
|
|
|
|
| |||||||
Total Assets | 171,502 | 216,643 | 6,334,364 | |||||||||
|
|
|
|
|
| |||||||
LIABILITIES: | ||||||||||||
Payables: | ||||||||||||
Investment securities purchased | 526 | 5,547 | 31,729 | |||||||||
Fund shares redeemed | 288 | 162 | 8,901 | |||||||||
Variation margin on futures contracts | — | 16 | — | |||||||||
Accrued liabilities: | ||||||||||||
Investment advisory fees | 82 | 89 | 3,245 | |||||||||
Administration fees | 6 | — | 376 | |||||||||
Distribution fees | 36 | 1 | 348 | |||||||||
Service fees | 35 | 8 | 806 | |||||||||
Custodian and accounting fees | 2 | 8 | 21 | |||||||||
Trustees’ and Chief Compliance Officer’s fees | — | — | 2 | |||||||||
Printing and mailing cost | 76 | 41 | 243 | |||||||||
Other | 59 | 26 | 250 | |||||||||
|
|
|
|
|
| |||||||
Total Liabilities | 1,110 | 5,898 | 45,921 | |||||||||
|
|
|
|
|
| |||||||
Net Assets | $ | 170,392 | $ | 210,745 | $ | 6,288,443 | ||||||
|
|
|
|
|
| |||||||
SEE NOTES TO FINANCIAL STATEMENTS.
| 44 | J.P. MORGAN SMALL CAP FUNDS | JUNE 30, 2017 | ||||
Table of Contents
| Dynamic Small Cap Growth Fund | Small Cap Core Fund | Small Cap Equity Fund | ||||||||||
NET ASSETS: |
| |||||||||||
Paid-in-Capital | $ | 99,475 | $ | 142,492 | $ | 4,528,931 | ||||||
Accumulated undistributed (distributions in excess of) net investment income | (669 | ) | 184 | 13,011 | ||||||||
Accumulated net realized gains (losses) | 7,154 | 13,581 | 248,658 | |||||||||
Net unrealized appreciation (depreciation) | 64,432 | 54,488 | 1,497,843 | |||||||||
|
|
|
|
|
| |||||||
Total Net Assets | $ | 170,392 | $ | 210,745 | $ | 6,288,443 | ||||||
|
|
|
|
|
| |||||||
Net Assets: | ||||||||||||
Class A | $ | 66,189 | $ | 2,203 | $ | 1,135,394 | ||||||
Class C | 36,707 | 1,017 | 171,352 | |||||||||
Class I (formerly Select Class) | 67,496 | 3,545 | 2,722,213 | |||||||||
Class R2 | — | — | 13,078 | |||||||||
Class R3 | — | — | 104 | |||||||||
Class R4 | — | — | 60 | |||||||||
Class R5 | — | 187,198 | 1,267,593 | |||||||||
Class R6 | — | 16,782 | 978,649 | |||||||||
|
|
|
|
|
| |||||||
Total | $ | 170,392 | $ | 210,745 | $ | 6,288,443 | ||||||
|
|
|
|
|
| |||||||
Outstanding units of beneficial interest (shares) | ||||||||||||
($0.0001 par value; unlimited number of shares authorized): | ||||||||||||
Class A | 3,005 | 42 | 23,347 | |||||||||
Class C | 2,144 | 20 | 4,622 | |||||||||
Class I (formerly Select Class) | 2,718 | 67 | 48,885 | |||||||||
Class R2 | — | — | 274 | |||||||||
Class R3 | — | — | 2 | |||||||||
Class R4 | — | — | 1 | |||||||||
Class R5 | — | 3,557 | 22,701 | |||||||||
Class R6 | — | 319 | 17,529 | |||||||||
Net Asset Value (a): | ||||||||||||
Class A — Redemption price per share | $ | 22.03 | $ | 52.32 | $ | 48.63 | ||||||
Class C — Offering price per share (b) | 17.12 | 52.14 | 37.07 | |||||||||
Class I (formerly Select Class) — Offering and redemption price per share | 24.83 | 52.58 | 55.69 | |||||||||
Class R2 —Offering and redemption price per share | — | — | 47.81 | |||||||||
Class R3 — Offering and redemption price per share | — | — | 48.54 | |||||||||
Class R4 — Offering and redemption price per share | — | — | 55.64 | |||||||||
Class R5 — Offering and redemption price per share | — | 52.64 | 55.84 | |||||||||
Class R6 — Offering and redemption price per share | — | 52.57 | 55.83 | |||||||||
Class A maximum sales charge | 5.25 | % | 5.25 | % | 5.25 | % | ||||||
Class A maximum public offering price per share | $ | 23.25 | $ | 55.22 | $ | 51.32 | ||||||
|
|
|
|
|
| |||||||
Cost of investments in non-affiliates | $ | 101,887 | $ | 149,604 | $ | 4,540,863 | ||||||
Cost of investments in affiliates | 3,593 | 10,565 | 267,273 | |||||||||
| (a) | Per share amounts may not recalculate due to rounding of net assets and/or shares outstanding. |
| (b) | Redemption price for Class C Shares varies based upon length of time the shares are held. |
SEE NOTES TO FINANCIAL STATEMENTS.
| JUNE 30, 2017 | J.P. MORGAN SMALL CAP FUNDS | 45 | ||||||
Table of Contents
STATEMENTS OF ASSETS AND LIABILITIES
AS OF JUNE 30, 2017 (continued)
(Amounts in thousands, except per share amounts)
| Small Cap Growth Fund | Small Cap Value Fund | U.S. Small Company Fund | ||||||||||
ASSETS: |
| |||||||||||
Investments in non-affiliates, at value | $ | 1,303,749 | $ | 2,063,556 | $ | 1,668,753 | ||||||
Investments in affiliates, at value | 41,963 | 42,684 | 78,822 | |||||||||
|
|
|
|
|
| |||||||
Total investment securities, at value | 1,345,712 | 2,106,240 | 1,747,575 | |||||||||
Deposits at broker for futures contracts | — | 2,272 | 3,712 | |||||||||
Receivables: | ||||||||||||
Due from custodian | — | 4,044 | — | |||||||||
Investment securities sold | 8,326 | 16,316 | 9,100 | |||||||||
Fund shares sold | 2,594 | 1,729 | 2,392 | |||||||||
Dividends from non-affiliates | 522 | 3,603 | 2,262 | |||||||||
Dividends from affiliates | 23 | 24 | 28 | |||||||||
|
|
|
|
|
| |||||||
Total Assets | 1,357,177 | 2,134,228 | 1,765,069 | |||||||||
|
|
|
|
|
| |||||||
LIABILITIES: | ||||||||||||
Payables: | ||||||||||||
Due to custodian | — | (a) | 6 | 43 | ||||||||
Investment securities purchased | 4,164 | 9,848 | 9,154 | |||||||||
Fund shares redeemed | 36,023 | 7,172 | 2,450 | |||||||||
Variation margin on futures contracts | — | 124 | 203 | |||||||||
Accrued liabilities: | ||||||||||||
Investment advisory fees | 687 | 1,115 | 857 | |||||||||
Administration fees | 78 | 140 | 116 | |||||||||
Distribution fees | 62 | 160 | 104 | |||||||||
Service fees | 102 | 174 | 255 | |||||||||
Custodian and accounting fees | 4 | 7 | 10 | |||||||||
Trustees’ and Chief Compliance Officer’s fees | — | (a) | — | — | ||||||||
Printing and mailing cost | 56 | 82 | 77 | |||||||||
Other | 73 | 197 | 127 | |||||||||
|
|
|
|
|
| |||||||
Total Liabilities | 41,249 | 19,025 | 13,396 | |||||||||
|
|
|
|
|
| |||||||
Net Assets | $ | 1,315,928 | $ | 2,115,203 | $ | 1,751,673 | ||||||
|
|
|
|
|
| |||||||
| (a) | Amount rounds to less than 500. |
SEE NOTES TO FINANCIAL STATEMENTS.
| 46 | J.P. MORGAN SMALL CAP FUNDS | JUNE 30, 2017 | ||||
Table of Contents
| Small Cap Growth Fund | Small Cap Value Fund | U.S. Small Company Fund | ||||||||||
NET ASSETS: |
| |||||||||||
Paid-in-Capital | $ | 851,131 | $ | 1,621,207 | $ | 1,452,702 | ||||||
Accumulated undistributed (distributions in excess of) net investment income | (2,738 | ) | 2,857 | 823 | ||||||||
Accumulated net realized gains (losses) | 29,829 | 70,495 | 51,176 | |||||||||
Net unrealized appreciation (depreciation) | 437,706 | 420,644 | 246,972 | |||||||||
|
|
|
|
|
| |||||||
Total Net Assets | $ | 1,315,928 | $ | 2,115,203 | $ | 1,751,673 | ||||||
|
|
|
|
|
| |||||||
Net Assets: | ||||||||||||
Class A | $ | 196,403 | $ | 518,464 | $ | 244,958 | ||||||
Class C | 20,352 | 40,349 | 49,946 | |||||||||
Class I (formerly Select Class) | 110,644 | 344,875 | 387,043 | |||||||||
Class L (formerly Institutional Class) | 360,044 | — | 711,139 | |||||||||
Class R2 | 23,569 | 60,282 | 51,511 | |||||||||
Class R3 | — | 13,390 | 9,560 | |||||||||
Class R4 | — | 39 | 794 | |||||||||
Class R5 | 1,186 | 130,338 | 145 | |||||||||
Class R6 | 603,730 | 1,007,466 | 296,577 | |||||||||
|
|
|
|
|
| |||||||
Total | $ | 1,315,928 | $ | 2,115,203 | $ | 1,751,673 | ||||||
|
|
|
|
|
| |||||||
Outstanding units of beneficial interest (shares) | ||||||||||||
($0.0001 par value; unlimited number of shares authorized): | ||||||||||||
Class A | 13,263 | 17,769 | 13,536 | |||||||||
Class C | 1,812 | 1,644 | 2,870 | |||||||||
Class I (formerly Select Class) | 6,840 | 11,197 | 20,952 | |||||||||
Class L (formerly Institutional Class) | 21,695 | — | 38,516 | |||||||||
Class R2 | 1,638 | 2,083 | 2,892 | |||||||||
Class R3 | — | 459 | 530 | |||||||||
Class R4 | — | 1 | 43 | |||||||||
Class R5 | 71 | 4,231 | 8 | |||||||||
Class R6 | 36,090 | 32,675 | 16,047 | |||||||||
Net Asset Value (a): | ||||||||||||
Class A — Redemption price per share | $ | 14.81 | $ | 29.18 | $ | 18.10 | ||||||
Class C — Offering price per share (b) | 11.23 | 24.55 | 17.40 | |||||||||
Class I (formerly Select Class) — Offering and redemption price per share | 16.18 | 30.80 | 18.47 | |||||||||
Class L (formerly Institutional Class) — Offering and redemption price per share | 16.60 | — | 18.46 | |||||||||
Class R2 — Offering and redemption price per share | 14.39 | 28.94 | 17.81 | |||||||||
Class R3 — Offering and redemption price per share | — | 29.14 | 18.03 | |||||||||
Class R4 — Offering and redemption price per share | — | 30.77 | 18.44 | |||||||||
Class R5 — Offering and redemption price per share | 16.60 | 30.80 | 18.45 | |||||||||
Class R6 — Offering and redemption price per share | 16.73 | 30.83 | 18.48 | |||||||||
Class A maximum sales charge | 5.25 | % | 5.25 | % | 5.25 | % | ||||||
Class A maximum public offering price per share | $ | 15.63 | $ | 30.80 | $ | 19.10 | ||||||
|
|
|
|
|
| |||||||
Cost of investments in non-affiliates | $ | 866,043 | $ | 1,642,753 | $ | 1,421,675 | ||||||
Cost of investments in affiliates | 41,963 | 42,684 | 78,822 | |||||||||
| (a) | Per share amounts may not recalculate due to rounding of net assets and/or shares outstanding. |
| (b) | Redemption price for Class C Shares varies based upon length of time the shares are held. |
SEE NOTES TO FINANCIAL STATEMENTS.
| JUNE 30, 2017 | J.P. MORGAN SMALL CAP FUNDS | 47 | ||||||
Table of Contents
STATEMENTS OF OPERATIONS
FOR THE YEAR ENDED JUNE 30, 2017
(Amounts in thousands)
| Dynamic Small Cap Growth Fund | Small Cap Core Fund | Small Cap Equity Fund | ||||||||||
INVESTMENT INCOME: |
| |||||||||||
Interest income from affiliates | $ | — | (a) | $ | — | (a) | $ | 36 | ||||
Dividend income from non-affiliates | 739 | 2,261 | 79,188 | |||||||||
Dividend income from affiliates | 10 | 24 | 1,142 | |||||||||
|
|
|
|
|
| |||||||
Total investment income | 749 | 2,285 | 80,366 | |||||||||
|
|
|
|
|
| |||||||
EXPENSES: | ||||||||||||
Investment advisory fees | 1,037 | 1,242 | 34,197 | |||||||||
Administration fees | 131 | 156 | 4,302 | |||||||||
Distribution fees: | ||||||||||||
Class A | 151 | 2 | 2,706 | |||||||||
Class C | 263 | 3 | 1,051 | |||||||||
Class R2 | — | — | 50 | |||||||||
Class R3 (b) | — | — | — | (a) | ||||||||
Service fees: | ||||||||||||
Class A | 151 | 2 | 2,706 | |||||||||
Class C | 88 | 1 | 350 | |||||||||
Class I (formerly Select Class) (c) | 160 | 3 | 5,498 | |||||||||
Class R2 | — | — | 25 | |||||||||
Class R3 (b) | — | — | — | (a) | ||||||||
Class R4 (b) | — | — | — | (a) | ||||||||
Class R5 (d) | — | 185 | 780 | |||||||||
Custodian and accounting fees | 31 | 55 | 172 | |||||||||
Professional fees | 45 | 73 | 106 | |||||||||
Trustees’ and Chief Compliance Officer’s fees | 25 | 25 | 37 | |||||||||
Printing and mailing costs | 50 | 110 | 292 | |||||||||
Registration and filing fees | 52 | 128 | 650 | |||||||||
Transfer agency fees (See Note 2.D.) | 24 | 12 | 160 | |||||||||
Sub-transfer agency fees (See Note 2.D.) | 152 | 123 | 3,039 | |||||||||
Other | 7 | 9 | 91 | |||||||||
|
|
|
|
|
| |||||||
Total expenses | 2,367 | 2,129 | 56,212 | |||||||||
|
|
|
|
|
| |||||||
Less fees waived | (360 | ) | (569 | ) | (3,508 | ) | ||||||
Less earnings credits | — | — | — | (a) | ||||||||
Less expense reimbursements | — | (34 | ) | (60 | ) | |||||||
|
|
|
|
|
| |||||||
Net expenses | 2,007 | 1,526 | 52,644 | |||||||||
|
|
|
|
|
| |||||||
Net investment income (loss) | (1,258 | ) | 759 | 27,722 | ||||||||
|
|
|
|
|
| |||||||
REALIZED/UNREALIZED GAINS (LOSSES): | ||||||||||||
Net realized gain (loss) on transactions from: | ||||||||||||
Investments in non-affiliates | 23,961 | 20,081 | 265,294 | |||||||||
Futures | — | 835 | — | |||||||||
|
|
|
|
|
| |||||||
Net realized gain (loss) | 23,961 | 20,916 | 265,294 | |||||||||
|
|
|
|
|
| |||||||
Change in net unrealized appreciation/depreciation on: | ||||||||||||
Investments in non-affiliates | 25,078 | 21,614 | 631,255 | |||||||||
Futures | — | (73 | ) | — | ||||||||
|
|
|
|
|
| |||||||
Change in net unrealized appreciation/depreciation | 25,078 | 21,541 | 631,255 | |||||||||
|
|
|
|
|
| |||||||
Net realized/unrealized gains (losses) | 49,039 | 42,457 | 896,549 | |||||||||
|
|
|
|
|
| |||||||
Change in net assets resulting from operations | $ | 47,781 | $ | 43,216 | $ | 924,271 | ||||||
|
|
|
|
|
| |||||||
| (a) | Amount rounds to less than 500. |
| (b) | Commencement of offering of class of shares effective September 9, 2016 for Small Cap Equity Fund. |
| (c) | Commencement of offering of Select Class effective January 3, 2017. Select Class was renamed Class I effective April 3, 2017 for Small Cap Core Fund. |
| (d) | Effective September 15, 2016, Select Class was renamed Class R5 for Small Cap Core Fund. |
SEE NOTES TO FINANCIAL STATEMENTS.
| 48 | J.P. MORGAN SMALL CAP FUNDS | JUNE 30, 2017 | ||||
Table of Contents
Small Cap | Small Cap Value Fund | U.S. Small Company Fund | ||||||||||
INVESTMENT INCOME: |
| |||||||||||
Interest income from affiliates | $ | — | $ | 2 | $ | 5 | ||||||
Dividend income from non-affiliates | 5,355 | 32,653 | 20,261 | |||||||||
Dividend income from affiliates | 103 | 242 | 238 | |||||||||
|
|
|
|
|
| |||||||
Total investment income | 5,458 | 32,897 | 20,504 | |||||||||
|
|
|
|
|
| |||||||
EXPENSES: | ||||||||||||
Investment advisory fees | 7,496 | 12,914 | 9,800 | |||||||||
Administration fees | 943 | 1,625 | 1,336 | |||||||||
Distribution fees: | ||||||||||||
Class A | 460 | 1,398 | 625 | |||||||||
Class C | 146 | 328 | 374 | |||||||||
Class R2 | 109 | 273 | 210 | |||||||||
Class R3 (a) | — | 7 | 3 | |||||||||
Service fees: | ||||||||||||
Class A | 460 | 1,398 | 625 | |||||||||
Class C | 48 | 109 | 125 | |||||||||
Class I (formerly Select Class) | 271 | 820 | 852 | |||||||||
Class L (formerly Institutional Class) | 300 | — | 735 | |||||||||
Class R2 | 55 | 136 | 105 | |||||||||
Class R3 (a) | — | 7 | 3 | |||||||||
Class R4 (a) | — | — | (b) | — | (b) | |||||||
Class R5 (c) | 1 | 73 | — | (b) | ||||||||
Custodian and accounting fees | 53 | 106 | 94 | |||||||||
Professional fees | 58 | 71 | 61 | |||||||||
Trustees’ and Chief Compliance Officer’s fees | 27 | 30 | 29 | |||||||||
Printing and mailing costs | 88 | 186 | 211 | |||||||||
Registration and filing fees | 113 | 135 | 177 | |||||||||
Transfer agency fees (See Note 2.D.) | 67 | 410 | 69 | |||||||||
Sub-transfer agency fees (See Note 2.D.) | 578 | �� | 1,196 | 1,140 | ||||||||
Other | 27 | 53 | 38 | |||||||||
|
|
|
|
|
| |||||||
Total expenses | 11,300 | 21,275 | 16,612 | |||||||||
|
|
|
|
|
| |||||||
Less fees waived | (815 | ) | (1,636 | ) | (908 | ) | ||||||
Less expense reimbursements | (19 | ) | (22 | ) | (9 | ) | ||||||
|
|
|
|
|
| |||||||
Net expenses | 10,466 | 19,617 | 15,695 | |||||||||
|
|
|
|
|
| |||||||
Net investment income (loss) | (5,008 | ) | 13,280 | 4,809 | ||||||||
|
|
|
|
|
| |||||||
REALIZED/UNREALIZED GAINS (LOSSES): | ||||||||||||
Net realized gain (loss) on transactions from: | ||||||||||||
Investments in non-affiliates | 83,723 | 93,699 | 86,690 | |||||||||
Futures | — | 10,604 | 11,292 | |||||||||
|
|
|
|
|
| |||||||
Net realized gain (loss) | 83,723 | 104,303 | 97,982 | |||||||||
|
|
|
|
|
| |||||||
Change in net unrealized appreciation/depreciation on: | ||||||||||||
Investments in non-affiliates | 264,591 | 217,176 | 176,441 | |||||||||
Futures | — | (715 | ) | (627 | ) | |||||||
|
|
|
|
|
| |||||||
Change in net unrealized appreciation/depreciation | 264,591 | 216,461 | 175,814 | |||||||||
|
|
|
|
|
| |||||||
Net realized/unrealized gains (losses) | 348,314 | 320,764 | 273,796 | |||||||||
|
|
|
|
|
| |||||||
Change in net assets resulting from operations | $ | 343,306 | $ | 334,044 | $ | 278,605 | ||||||
|
|
|
|
|
| |||||||
| (a) | Commencement of offering of class of shares effective September 9, 2016 for Small Cap Value Fund and U.S. Small Company Fund. |
| (b) | Amount rounds to less than 500. |
| (c) | Commencement of offering of class of shares effective September 9, 2016 for Small Cap Growth Fund and U.S. Small Company Fund. |
SEE NOTES TO FINANCIAL STATEMENTS.
| JUNE 30, 2017 | J.P. MORGAN SMALL CAP FUNDS | 49 | ||||||
Table of Contents
STATEMENTS OF CHANGES IN NET ASSETS
FOR THE PERIODS INDICATED
(Amounts in thousands)
| Dynamic Small Cap Growth Fund | Small Cap Core Fund | |||||||||||||||
| Year Ended June 30, 2017 | Year Ended June 30, 2016 | Year Ended June 30, 2017 | Year Ended June 30, 2016 | |||||||||||||
CHANGE IN NET ASSETS RESULTING FROM OPERATIONS: | ||||||||||||||||
Net investment income (loss) | $ | (1,258 | ) | $ | (2,182 | ) | $ | 759 | $ | 1,397 | ||||||
Net realized gain (loss) | 23,961 | 28,187 | 20,916 | 67,374 | ||||||||||||
Change in net unrealized appreciation/depreciation | 25,078 | (117,590 | ) | 21,541 | (151,923 | ) | ||||||||||
|
|
|
|
|
|
|
| |||||||||
Change in net assets resulting from operations | 47,781 | (91,585 | ) | 43,216 | (83,152 | ) | ||||||||||
|
|
|
|
|
|
|
| |||||||||
DISTRIBUTIONS TO SHAREHOLDERS: | ||||||||||||||||
Class A (a) | ||||||||||||||||
From net investment income | — | — | — | (b) | — | |||||||||||
From net realized gains | (8,616 | ) | (8,870 | ) | (7 | ) | — | |||||||||
Class C (a) | ||||||||||||||||
From net investment income | — | — | — | (b) | — | |||||||||||
From net realized gains | (6,161 | ) | (6,681 | ) | (5 | ) | — | |||||||||
Class I (formerly Select Class) (c) | ||||||||||||||||
From net realized gains | (8,471 | ) | (40,293 | ) | — | — | ||||||||||
Class R5 (d) | ||||||||||||||||
From net investment income | — | — | (599 | ) | (4,787 | ) | ||||||||||
From net realized gains | — | — | (17,764 | ) | (69,898 | ) | ||||||||||
Class R6 (a) | ||||||||||||||||
From net investment income | — | — | — | (b) | — | |||||||||||
From net realized gains | — | — | (2 | ) | — | |||||||||||
|
|
|
|
|
|
|
| |||||||||
Total distributions to shareholders | (23,248 | ) | (55,844 | ) | (18,377 | ) | (74,685 | ) | ||||||||
|
|
|
|
|
|
|
| |||||||||
CAPITAL TRANSACTIONS: | ||||||||||||||||
Change in net assets resulting from capital transactions | (7,047 | ) | (209,461 | ) | 21,270 | (493,179 | ) | |||||||||
|
|
|
|
|
|
|
| |||||||||
NET ASSETS: | ||||||||||||||||
Change in net assets | 17,486 | (356,890 | ) | 46,109 | (651,016 | ) | ||||||||||
Beginning of period | 152,906 | 509,796 | 164,636 | 815,652 | ||||||||||||
|
|
|
|
|
|
|
| |||||||||
End of period | $ | 170,392 | $ | 152,906 | $ | 210,745 | $ | 164,636 | ||||||||
|
|
|
|
|
|
|
| |||||||||
Accumulated undistributed (distributions in excess of) net investment income | $ | (669 | ) | $ | (658 | ) | $ | 184 | $ | (31 | ) | |||||
|
|
|
|
|
|
|
| |||||||||
| (a) | Commencement of offering of class of shares effective May 31, 2016 for Small Cap Core Fund. |
| (b) | Amount rounds to less than 500. |
| (c) | Commencement of offering of Select Class effective January 3, 2017. Select Class was renamed Class I effective April 3, 2017 for Small Cap Core Fund. |
| (d) | Effective September 15, 2016, Select Class was renamed Class R5 for Small Cap Core Fund. |
SEE NOTES TO FINANCIAL STATEMENTS.
| 50 | J.P. MORGAN SMALL CAP FUNDS | JUNE 30, 2017 | ||||
Table of Contents
| Small Cap Equity Fund | Small Cap Growth Fund | |||||||||||||||
| Year Ended June 30, 2017 | Year Ended June 30, 2016 | Year Ended June 30, 2017 | Year Ended June 30, 2016 | |||||||||||||
CHANGE IN NET ASSETS RESULTING FROM OPERATIONS: | ||||||||||||||||
Net investment income (loss) | $ | 27,722 | $ | 17,832 | $ | (5,008 | ) | $ | (4,817 | ) | ||||||
Net realized gain (loss) | 265,294 | 399,193 | 83,723 | 3,683 | ||||||||||||
Change in net unrealized appreciation/depreciation | 631,255 | (343,741 | ) | 264,591 | (172,393 | ) | ||||||||||
|
|
|
|
|
|
|
| |||||||||
Change in net assets resulting from operations | 924,271 | 73,284 | 343,306 | (173,527 | ) | |||||||||||
|
|
|
|
|
|
|
| |||||||||
DISTRIBUTIONS TO SHAREHOLDERS: | ||||||||||||||||
Class A | ||||||||||||||||
From net investment income | (3,188 | ) | (2,634 | ) | — | — | ||||||||||
From net realized gains | (32,659 | ) | (51,657 | ) | (6,279 | ) | (17,982 | ) | ||||||||
Class C | ||||||||||||||||
From net investment income | (479 | ) | — | — | — | |||||||||||
From net realized gains | (5,074 | ) | (2,993 | ) | (877 | ) | (2,222 | ) | ||||||||
Class I (formerly Select Class) | ||||||||||||||||
From net investment income | (9,633 | ) | (3,556 | ) | — | — | ||||||||||
From net realized gains | (53,162 | ) | (59,055 | ) | (3,529 | ) | (8,776 | ) | ||||||||
Class L (formerly Institutional Class) | ||||||||||||||||
From net realized gains | — | — | (9,811 | ) | (19,628 | ) | ||||||||||
Class R2 | ||||||||||||||||
From net investment income | (23 | ) | — | — | — | |||||||||||
From net realized gains | (276 | ) | (211 | ) | (772 | ) | (1,956 | ) | ||||||||
Class R3 (a) | ||||||||||||||||
From net investment income | — | (b) | — | — | — | |||||||||||
From net realized gains | (1 | ) | — | — | — | |||||||||||
Class R4 (a) | ||||||||||||||||
From net investment income | — | (b) | — | — | — | |||||||||||
From net realized gains | — | (b) | — | — | — | |||||||||||
Class R5 (c) | ||||||||||||||||
From net investment income | (5,428 | ) | (7,998 | ) | — | — | ||||||||||
From net realized gains | (25,600 | ) | (77,242 | ) | (28 | ) | — | |||||||||
Class R6 (d) | ||||||||||||||||
From net investment income | (3,830 | ) | — | — | — | |||||||||||
From net realized gains | (15,853 | ) | — | (15,304 | ) | (34,132 | ) | |||||||||
|
|
|
|
|
|
|
| |||||||||
Total distributions to shareholders | (155,206 | ) | (205,346 | ) | (36,600 | ) | (84,696 | ) | ||||||||
|
|
|
|
|
|
|
| |||||||||
CAPITAL TRANSACTIONS: | ||||||||||||||||
Change in net assets resulting from capital transactions | 2,070,448 | 187,154 | (27,916 | ) | 50,292 | |||||||||||
|
|
|
|
|
|
|
| |||||||||
NET ASSETS: | ||||||||||||||||
Change in net assets | 2,839,513 | 55,092 | 278,790 | (207,931 | ) | |||||||||||
Beginning of period | 3,448,930 | 3,393,838 | 1,037,138 | 1,245,069 | ||||||||||||
|
|
|
|
|
|
|
| |||||||||
End of period | $ | 6,288,443 | $ | 3,448,930 | $ | 1,315,928 | $ | 1,037,138 | ||||||||
|
|
|
|
|
|
|
| |||||||||
Accumulated undistributed (distributions in excess of) net investment income | $ | 13,011 | $ | 8,726 | $ | (2,738 | ) | $ | (1,912 | ) | ||||||
|
|
|
|
|
|
|
| |||||||||
| (a) | Commencement of offering of class of shares effective September 9, 2016 for Small Cap Equity Fund. |
| (b) | Amount rounds to less than 500. |
| (c) | Commencement of offering of class of shares effective September 9, 2016 for Small Cap Growth Fund. |
| (d) | Commencement of offering of class of shares effective May 31, 2016 for Small Cap Equity Fund. |
SEE NOTES TO FINANCIAL STATEMENTS.
| JUNE 30, 2017 | J.P. MORGAN SMALL CAP FUNDS | 51 | ||||||
Table of Contents
STATEMENTS OF CHANGES IN NET ASSETS
FOR THE PERIODS INDICATED (continued)
(Amounts in thousands)
| Small Cap Value Fund | U.S. Small Company Fund | |||||||||||||||
| Year Ended June 30, 2017 | Year Ended June 30, 2016 | Year Ended June 30, 2017 | Year Ended June 30, 2016 | |||||||||||||
CHANGE IN NET ASSETS RESULTING FROM OPERATIONS: | ||||||||||||||||
Net investment income (loss) | $ | 13,280 | $ | 16,276 | $ | 4,809 | $ | 4,777 | ||||||||
Net realized gain (loss) | 104,303 | (11,621 | ) | 97,982 | (25,653 | ) | ||||||||||
Change in net unrealized appreciation/depreciation | 216,461 | (52,243 | ) | 175,814 | (37,299 | ) | ||||||||||
|
|
|
|
|
|
|
| |||||||||
Change in net assets resulting from operations | 334,044 | (47,588 | ) | 278,605 | (58,175 | ) | ||||||||||
|
|
|
|
|
|
|
| |||||||||
DISTRIBUTIONS TO SHAREHOLDERS: | ||||||||||||||||
Class A | ||||||||||||||||
From net investment income | (2,556 | ) | (3,316 | ) | (192 | ) | (375 | ) | ||||||||
From net realized gains | (390 | ) | (24,024 | ) | (15 | ) | (9,859 | ) | ||||||||
Class C | ||||||||||||||||
From net investment income | (124 | ) | (138 | ) | — | — | ||||||||||
From net realized gains | (36 | ) | (2,266 | ) | (3 | ) | (1,985 | ) | ||||||||
Class I (formerly Select Class) | ||||||||||||||||
From net investment income | (1,795 | ) | (2,589 | ) | (967 | ) | (1,045 | ) | ||||||||
From net realized gains | (217 | ) | (11,883 | ) | (19 | ) | (11,139 | ) | ||||||||
Class L (formerly Institutional Class) | ||||||||||||||||
From net investment income | — | — | (3,751 | ) | (2,157 | ) | ||||||||||
From net realized gains | — | — | (45 | ) | (16,302 | ) | ||||||||||
Class R2 | ||||||||||||||||
From net investment income | (181 | ) | (176 | ) | — | (36 | ) | |||||||||
From net realized gains | (37 | ) | (2,034 | ) | (2 | ) | (1,197 | ) | ||||||||
Class R3 (a) | ||||||||||||||||
From net investment income | (2 | ) | — | — | (b) | — | ||||||||||
From net realized gains | — | (b) | — | — | (b) | — | ||||||||||
Class R4 (a) | ||||||||||||||||
From net investment income | — | (b) | — | — | (b) | — | ||||||||||
From net realized gains | — | (b) | — | — | (b) | — | ||||||||||
Class R5 (c) | ||||||||||||||||
From net investment income | (730 | ) | (877 | ) | — | (b) | — | |||||||||
From net realized gains | (73 | ) | (4,226 | ) | — | (b) | — | |||||||||
Class R6 | ||||||||||||||||
From net investment income | (6,792 | ) | (7,344 | ) | (1,045 | ) | (620 | ) | ||||||||
From net realized gains | (552 | ) | (33,390 | ) | (11 | ) | (4,031 | ) | ||||||||
|
|
|
|
|
|
|
| |||||||||
Total distributions to shareholders | (13,485 | ) | (92,263 | ) | (6,050 | ) | (48,746 | ) | ||||||||
|
|
|
|
|
|
|
| |||||||||
CAPITAL TRANSACTIONS: | ||||||||||||||||
Change in net assets resulting from capital transactions | 41,312 | 22,440 | 155,806 | 458,685 | ||||||||||||
|
|
|
|
|
|
|
| |||||||||
NET ASSETS: | ||||||||||||||||
Change in net assets | 361,871 | (117,411 | ) | 428,361 | 351,764 | |||||||||||
Beginning of period | 1,753,332 | 1,870,743 | 1,323,312 | 971,548 | ||||||||||||
|
|
|
|
|
|
|
| |||||||||
End of period | $ | 2,115,203 | $ | 1,753,332 | $ | 1,751,673 | $ | 1,323,312 | ||||||||
|
|
|
|
|
|
|
| |||||||||
Accumulated undistributed (distributions in excess of) net investment income | $ | 2,857 | $ | 2,643 | $ | 823 | $ | 2,547 | ||||||||
|
|
|
|
|
|
|
| |||||||||
| (a) | Commencement of offering of class of shares effective September 9, 2016. |
| (b) | Amount rounds to less than 500. |
| (c) | Commencement of offering of class of shares effective September 9, 2016 for U.S. Small Company Fund. |
SEE NOTES TO FINANCIAL STATEMENTS.
| 52 | J.P. MORGAN SMALL CAP FUNDS | JUNE 30, 2017 | ||||
Table of Contents
| Dynamic Small Cap Growth Fund | Small Cap Core Fund | |||||||||||||||
| Year Ended June 30, 2017 | Year Ended June 30, 2016 | Year Ended June 30, 2017 | Year Ended June 30, 2016 | |||||||||||||
CAPITAL TRANSACTIONS: | ||||||||||||||||
Class A (a) | ||||||||||||||||
Proceeds from shares issued | $ | 11,085 | $ | 10,070 | $ | 2,255 | $ | 23 | ||||||||
Distributions reinvested | 6,122 | 6,411 | 7 | — | ||||||||||||
Cost of shares redeemed | (16,068 | ) | (14,402 | ) | (154 | ) | — | |||||||||
|
|
|
|
|
|
|
| |||||||||
Change in net assets resulting from Class A capital transactions | $ | 1,139 | $ | 2,079 | $ | 2,108 | $ | 23 | ||||||||
|
|
|
|
|
|
|
| |||||||||
Class C (a) | ||||||||||||||||
Proceeds from shares issued | $ | 11,882 | $ | 13,161 | $ | 1,055 | $ | 20 | ||||||||
Distributions reinvested | 888 | 856 | 5 | — | ||||||||||||
Cost of shares redeemed | (12,954 | ) | (17,151 | ) | (93 | ) | — | |||||||||
|
|
|
|
|
|
|
| |||||||||
Change in net assets resulting from Class C capital transactions | $ | (184 | ) | $ | (3,134 | ) | $ | 967 | $ | 20 | ||||||
|
|
|
|
|
|
|
| |||||||||
Class I (formerly Select Class) (b) | ||||||||||||||||
Proceeds from shares issued | $ | 15,936 | $ | 68,912 | $ | 3,813 | $ | — | ||||||||
Distributions reinvested | 8,203 | 39,841 | — | — | ||||||||||||
Cost of shares redeemed | (32,141 | ) | (317,159 | ) | (391 | ) | — | |||||||||
|
|
|
|
|
|
|
| |||||||||
Change in net assets resulting from Class I capital transactions | $ | (8,002 | ) | $ | (208,406 | ) | $ | 3,422 | $ | — | ||||||
|
|
|
|
|
|
|
| |||||||||
Class R5 (c) | ||||||||||||||||
Proceeds from shares issued | $ | — | $ | — | $ | 38,644 | $ | 82,011 | ||||||||
Distributions reinvested | — | — | 15,729 | 71,593 | ||||||||||||
Cost of shares redeemed | — | — | (55,810 | ) | (116,062 | ) | ||||||||||
Redemptions in-kind (See Note 7) | — | — | — | (530,784 | ) | |||||||||||
|
|
|
|
|
|
|
| |||||||||
Change in net assets resulting from Class R5 capital transactions | $ | — | $ | — | $ | (1,437) | $ | (493,242) | ||||||||
|
|
|
|
|
|
|
| |||||||||
Class R6 (a) | ||||||||||||||||
Proceeds from shares issued | $ | — | $ | — | $ | 16,336 | $ | 20 | ||||||||
Distributions reinvested | — | — | 2 | — | ||||||||||||
Cost of shares redeemed | — | — | (128 | ) | — | |||||||||||
|
|
|
|
|
|
|
| |||||||||
Change in net assets resulting from Class R6 capital transactions | $ | — | $ | — | $ | 16,210 | $ | 20 | ||||||||
|
|
|
|
|
|
|
| |||||||||
Total change in net assets resulting from capital transactions | $ | (7,047 | ) | $ | (209,461 | ) | $ | 21,270 | $ | (493,179 | ) | |||||
|
|
|
|
|
|
|
| |||||||||
| (a) | Commencement of offering of class of shares effective May 31, 2016 for Small Cap Core Fund. |
| (b) | Commencement of offering of Select Class effective January 3, 2017. Select Class was renamed Class I effective April 3, 2017 for Small Cap Core Fund. |
| (c) | Effective September 15, 2016, Select Class was renamed Class R5 for Small Cap Core Fund. |
SEE NOTES TO FINANCIAL STATEMENTS.
| JUNE 30, 2017 | J.P. MORGAN SMALL CAP FUNDS | 53 | ||||||
Table of Contents
STATEMENTS OF CHANGES IN NET ASSETS
FOR THE PERIODS INDICATED (continued)
(Amounts in thousands)
| Dynamic Small Cap Growth Fund | Small Cap Core Fund | |||||||||||||||
| Year Ended June 30, 2017 | Year Ended June 30, 2016 | Year Ended June 30, 2017 | Year Ended June 30, 2016 | |||||||||||||
SHARE TRANSACTIONS: | ||||||||||||||||
Class A (a) | ||||||||||||||||
Issued | 554 | 478 | 44 | 1 | ||||||||||||
Reinvested | 331 | 327 | — | (b) | — | |||||||||||
Redeemed | (784 | ) | (712 | ) | (3 | ) | — | |||||||||
|
|
|
|
|
|
|
| |||||||||
Change in Class A Shares | 101 | 93 | 41 | 1 | ||||||||||||
|
|
|
|
|
|
|
| |||||||||
Class C (a) | ||||||||||||||||
Issued | 773 | 780 | 21 | 1 | ||||||||||||
Reinvested | 62 | 54 | — | (b) | — | |||||||||||
Redeemed | (793 | ) | (1,015 | ) | (2 | ) | — | |||||||||
|
|
|
|
|
|
|
| |||||||||
Change in Class C Shares | 42 | (181 | ) | 19 | 1 | |||||||||||
|
|
|
|
|
|
|
| |||||||||
Class I (formerly Select Class) | ||||||||||||||||
Issued | 694 | 3,027 | 75 | — | ||||||||||||
Reinvested | 395 | 1,842 | — | — | ||||||||||||
Redeemed | (1,422 | ) | (15,456 | ) | (8 | ) | — | |||||||||
|
|
|
|
|
|
|
| |||||||||
Change in Class I Shares | (333 | ) | (10,587 | ) | 67 | — | ||||||||||
|
|
|
|
|
|
|
| |||||||||
Class R5 (c) | ||||||||||||||||
Issued | — | — | 766 | 1,600 | ||||||||||||
Reinvested | — | — | 316 | 1,578 | ||||||||||||
Redeemed | — | — | (1,110 | ) | (2,421 | ) | ||||||||||
Redemptions in-kind (See Note 7) | — | — | — | (11,691 | ) | |||||||||||
|
|
|
|
|
|
|
| |||||||||
Change in Class R5 Shares | — | — | (28 | ) | (10,934 | ) | ||||||||||
|
|
|
|
|
|
|
| |||||||||
Class R6 (a) | ||||||||||||||||
Issued | — | — | 320 | 1 | ||||||||||||
Reinvested | — | — | — | (b) | — | |||||||||||
Redeemed | — | — | (2 | ) | — | |||||||||||
|
|
|
|
|
|
|
| |||||||||
Change in Class R6 Shares | — | — | 318 | 1 | ||||||||||||
|
|
|
|
|
|
|
| |||||||||
| (a) | Commencement of offering of class of shares effective May 31, 2016 for Small Cap Core Fund. |
| (b) | Amount rounds to less than 500. |
| (c) | Effective September 15, 2016, Select Class was renamed Class R5 for Small Cap Core Fund. |
SEE NOTES TO FINANCIAL STATEMENTS.
| 54 | J.P. MORGAN SMALL CAP FUNDS | JUNE 30, 2017 | ||||
Table of Contents
| Small Cap Equity Fund | Small Cap Growth Fund | |||||||||||||||
| Year Ended June 30, 2017 | Year Ended June 30, 2016 | Year Ended June 30, 2017 | Year Ended June 30, 2016 | |||||||||||||
CAPITAL TRANSACTIONS: | ||||||||||||||||
Class A | ||||||||||||||||
Proceeds from shares issued | $ | 712,876 | $ | 797,670 | $ | 44,992 | $ | 34,331 | ||||||||
Distributions reinvested | 33,701 | 49,673 | 5,928 | 17,120 | ||||||||||||
Cost of shares redeemed | (501,564 | ) | (225,187 | ) | (82,003 | ) | (82,368 | ) | ||||||||
Redemptions in-kind (See Note 7) | — | (545,339 | ) | — | — | |||||||||||
|
|
|
|
|
|
|
| |||||||||
Change in net assets resulting from Class A capital transactions | $ | 245,013 | $ | 76,817 | $ | (31,083 | ) | $ | (30,917 | ) | ||||||
|
|
|
|
|
|
|
| |||||||||
Class C | ||||||||||||||||
Proceeds from shares issued | $ | 102,287 | $ | 39,875 | $ | 4,659 | $ | 1,342 | ||||||||
Distributions reinvested | 5,234 | 2,583 | 747 | 1,891 | ||||||||||||
Cost of shares redeemed | (23,821 | ) | (7,079 | ) | (7,991 | ) | (5,168 | ) | ||||||||
|
|
|
|
|
|
|
| |||||||||
Change in net assets resulting from Class C capital transactions | $ | 83,700 | $ | 35,379 | $ | (2,585 | ) | $ | (1,935 | ) | ||||||
|
|
|
|
|
|
|
| |||||||||
Class I (formerly Select Class) | ||||||||||||||||
Proceeds from shares issued | $ | 1,796,080 | $ | 643,933 | $ | 43,698 | $ | 29,505 | ||||||||
Distributions reinvested | 56,261 | 55,589 | 3,134 | 7,984 | ||||||||||||
Cost of shares redeemed | (712,211 | ) | (816,497 | ) | (66,724 | ) | (63,523 | ) | ||||||||
|
|
|
|
|
|
|
| |||||||||
Change in net assets resulting from Class I capital transactions | $ | 1,140,130 | $ | (116,975 | ) | $ | (19,892 | ) | $ | (26,034 | ) | |||||
|
|
|
|
|
|
|
| |||||||||
Class L (formerly Institutional Class) | ||||||||||||||||
Proceeds from shares issued | $ | — | $ | — | $ | 143,110 | $ | 114,481 | ||||||||
Distributions reinvested | — | — | 8,911 | 18,231 | ||||||||||||
Cost of shares redeemed | — | — | (142,376 | ) | (81,578 | ) | ||||||||||
|
|
|
|
|
|
|
| |||||||||
Change in net assets resulting from Class L capital transactions | $ | — | $ | — | $ | 9,645 | $ | 51,134 | ||||||||
|
|
|
|
|
|
|
| |||||||||
Class R2 | ||||||||||||||||
Proceeds from shares issued | $ | 11,048 | $ | 3,684 | $ | 3,047 | $ | 3,627 | ||||||||
Distributions reinvested | 156 | 147 | 749 | 1,908 | ||||||||||||
Cost of shares redeemed | (4,834 | ) | (1,850 | ) | (7,190 | ) | (6,699 | ) | ||||||||
|
|
|
|
|
|
|
| |||||||||
Change in net assets resulting from Class R2 capital transactions | $ | 6,370 | $ | 1,981 | $ | (3,394 | ) | $ | (1,164 | ) | ||||||
|
|
|
|
|
|
|
| |||||||||
Class R3 (a) | ||||||||||||||||
Proceeds from shares issued | $ | 100 | $ | — | $ | — | $ | — | ||||||||
Distributions reinvested | 1 | — | — | — | ||||||||||||
Cost of shares redeemed | — | (b) | — | — | — | |||||||||||
|
|
|
|
|
|
|
| |||||||||
Change in net assets resulting from Class R3 capital transactions | $ | 101 | $ | — | $ | — | $ | — | ||||||||
|
|
|
|
|
|
|
| |||||||||
Class R4 (a) | ||||||||||||||||
Proceeds from shares issued | $ | 68 | $ | — | $ | — | $ | — | ||||||||
Distributions reinvested | — | (b) | — | — | — | |||||||||||
Cost of shares redeemed | (12 | ) | — | — | — | |||||||||||
|
|
|
|
|
|
|
| |||||||||
Change in net assets resulting from Class R4 capital transactions | $ | 56 | $ | — | $ | — | $ | — | ||||||||
|
|
|
|
|
|
|
| |||||||||
Class R5 (c) | ||||||||||||||||
Proceeds from shares issued | $ | 537,839 | $ | 327,668 | $ | 2,006 | $ | — | ||||||||
Distributions reinvested | 28,546 | 80,413 | 28 | — | ||||||||||||
Cost of shares redeemed | (825,391 | ) | (243,746 | ) | (1,033 | ) | — | |||||||||
|
|
|
|
|
|
|
| |||||||||
Change in net assets resulting from Class R5 capital transactions | $ | (259,006 | ) | $ | 164,335 | $ | 1,001 | $ | — | |||||||
|
|
|
|
|
|
|
| |||||||||
SEE NOTES TO FINANCIAL STATEMENTS.
| JUNE 30, 2017 | J.P. MORGAN SMALL CAP FUNDS | 55 | ||||||
Table of Contents
STATEMENTS OF CHANGES IN NET ASSETS
FOR THE PERIODS INDICATED (continued)
(Amounts in thousands)
| Small Cap Equity Fund | Small Cap Growth Fund | |||||||||||||||
| Year Ended June 30, 2017 | Year Ended June 30, 2016 | Year Ended June 30, 2017 | Year Ended June 30, 2016 | |||||||||||||
CAPITAL TRANSACTIONS: (continued) | ||||||||||||||||
Class R6 (d) | ||||||||||||||||
Proceeds from shares issued | $ | 956,921 | $ | 25,790 | $ | 97,840 | $ | 130,485 | ||||||||
Distributions reinvested | 19,663 | — | 15,303 | 34,132 | ||||||||||||
Cost of shares redeemed | (122,500 | ) | (173 | ) | (94,751 | ) | (105,409 | ) | ||||||||
|
|
|
|
|
|
|
| |||||||||
Change in net assets resulting from Class R6 capital transactions | $ | 854,084 | $ | 25,617 | $ | 18,392 | $ | 59,208 | ||||||||
|
|
|
|
|
|
|
| |||||||||
Total change in net assets resulting from capital transactions | $ | 2,070,448 | $ | 187,154 | $ | (27,916 | ) | $ | 50,292 | |||||||
|
|
|
|
|
|
|
| |||||||||
| (a) | Commencement of offering of class of shares effective September 9, 2016 for Small Cap Equity Fund. |
| (b) | Amount rounds to less than 500. |
| (c) | Commencement of offering of class of shares effective September 9, 2016 for Small Cap Growth Fund. |
| (d) | Commencement of offering of class of shares effective May 31, 2016 for Small Cap Equity Fund. |
SEE NOTES TO FINANCIAL STATEMENTS.
| 56 | J.P. MORGAN SMALL CAP FUNDS | JUNE 30, 2017 | ||||
Table of Contents
| Small Cap Equity Fund | Small Cap Growth Fund | |||||||||||||||
| Year Ended June 30, 2017 | Year Ended June 30, 2016 | Year Ended June 30, 2017 | Year Ended June 30, 2016 | |||||||||||||
SHARE TRANSACTIONS: | ||||||||||||||||
Class A | ||||||||||||||||
Issued | 15,821 | 20,677 | 3,363 | 2,821 | ||||||||||||
Reinvested | 733 | 1,292 | 476 | 1,466 | ||||||||||||
Redeemed | (10,880 | ) | (5,663 | ) | (6,238 | ) | (7,028 | ) | ||||||||
Redemptions in-kind (See Note 7) | — | (13,733 | ) | — | — | |||||||||||
|
|
|
|
|
|
|
| |||||||||
Change in Class A Shares | 5,674 | 2,573 | (2,399 | ) | (2,741 | ) | ||||||||||
|
|
|
|
|
|
|
| |||||||||
Class C |
| |||||||||||||||
Issued | 2,965 | 1,307 | 448 | 143 | ||||||||||||
Reinvested | 149 | 87 | 79 | 210 | ||||||||||||
Redeemed | (671 | ) | (228 | ) | (782 | ) | (572 | ) | ||||||||
|
|
|
|
|
|
|
| |||||||||
Change in Class C Shares | 2,443 | 1,166 | (255 | ) | (219 | ) | ||||||||||
|
|
|
|
|
|
|
| |||||||||
Class I (formerly Select Class) |
| |||||||||||||||
Issued | 34,733 | 14,082 | 2,997 | 2,235 | ||||||||||||
Reinvested | 1,069 | 1,270 | 231 | 630 | ||||||||||||
Redeemed | (13,483 | ) | (17,314 | ) | (4,614 | ) | (4,737 | ) | ||||||||
|
|
|
|
|
|
|
| |||||||||
Change in Class I Shares | 22,319 | (1,962 | ) | (1,386 | ) | (1,872 | ) | |||||||||
|
|
|
|
|
|
|
| |||||||||
Class L (formerly Institutional Class) |
| |||||||||||||||
Issued | — | — | 9,579 | 8,718 | ||||||||||||
Reinvested | — | — | 640 | 1,407 | ||||||||||||
Redeemed | — | — | (9,866 | ) | (6,315 | ) | ||||||||||
|
|
|
|
|
|
|
| |||||||||
Change in Class L Shares | — | — | 353 | 3,810 | ||||||||||||
|
|
|
|
|
|
|
| |||||||||
Class R2 |
| |||||||||||||||
Issued | 248 | 93 | 236 | 309 | ||||||||||||
Reinvested | 3 | 4 | 62 | 167 | ||||||||||||
Redeemed | (106 | ) | (46 | ) | (568 | ) | (566 | ) | ||||||||
|
|
|
|
|
|
|
| |||||||||
Change in Class R2 Shares | 145 | 51 | (270 | ) | (90 | ) | ||||||||||
|
|
|
|
|
|
|
| |||||||||
Class R3 (a) | ||||||||||||||||
Issued | 2 | — | — | — | ||||||||||||
Reinvested | — | (b) | — | — | — | |||||||||||
Redeemed | — | (b) | — | — | — | |||||||||||
|
|
|
|
|
|
|
| |||||||||
Change in Class R3 Shares | 2 | — | — | — | ||||||||||||
|
|
|
|
|
|
|
| |||||||||
Class R4 (a) | ||||||||||||||||
Issued | 1 | — | — | — | ||||||||||||
Reinvested | — | (b) | — | — | — | |||||||||||
Redeemed | — | (b) | — | — | — | |||||||||||
|
|
|
|
|
|
|
| |||||||||
Change in Class R4 Shares | 1 | — | — | — | ||||||||||||
|
|
|
|
|
|
|
| |||||||||
Class R5 (c) | ||||||||||||||||
Issued | 10,246 | 7,138 | 137 | — | ||||||||||||
Reinvested | 541 | 1,832 | 2 | — | ||||||||||||
Redeemed | (16,447 | ) | (5,295 | ) | (68 | ) | — | |||||||||
|
|
|
|
|
|
|
| |||||||||
Change in Class R5 Shares | (5,660 | ) | 3,675 | 71 | — | |||||||||||
|
|
|
|
|
|
|
| |||||||||
SEE NOTES TO FINANCIAL STATEMENTS.
| JUNE 30, 2017 | J.P. MORGAN SMALL CAP FUNDS | 57 | ||||||
Table of Contents
STATEMENTS OF CHANGES IN NET ASSETS
FOR THE PERIODS INDICATED (continued)
(Amounts in thousands)
| Small Cap Equity Fund | Small Cap Growth Fund | |||||||||||||||
| Year Ended June 30, 2017 | Year Ended June 30, 2016 | Year Ended June 30, 2017 | Year Ended June 30, 2016 | |||||||||||||
SHARE TRANSACTIONS: (continued) | ||||||||||||||||
Class R6 (d) | ||||||||||||||||
Issued | 18,906 | 549 | 6,529 | 10,137 | ||||||||||||
Reinvested | 372 | — | 1,091 | 2,617 | ||||||||||||
Redeemed | (2,294 | ) | (4 | ) | (6,293 | ) | (8,387 | ) | ||||||||
|
|
|
|
|
|
|
| |||||||||
Change in Class R6 Shares | 16,984 | 545 | 1,327 | 4,367 | ||||||||||||
|
|
|
|
|
|
|
| |||||||||
| (a) | Commencement of offering of class of shares effective September 9, 2016 for Small Cap Equity Fund. |
| (b) | Amount rounds to less than 500. |
| (c) | Commencement of offering of class of shares effective September 9, 2016 for Small Cap Growth Fund. |
| (d) | Commencement of offering of class of shares effective May 31, 2016 for Small Cap Equity Fund. |
SEE NOTES TO FINANCIAL STATEMENTS.
| 58 | J.P. MORGAN SMALL CAP FUNDS | JUNE 30, 2017 | ||||
Table of Contents
| Small Cap Value Fund | U.S. Small Company Fund | |||||||||||||||
| Year Ended June 30, 2017 | Year Ended June 30, 2016 | Year Ended June 30, 2017 | Year Ended June 30, 2016 | |||||||||||||
CAPITAL TRANSACTIONS: | ||||||||||||||||
Class A | ||||||||||||||||
Proceeds from shares issued | $ | 164,312 | $ | 138,661 | $ | 110,173 | $ | 112,560 | ||||||||
Distributions reinvested | 2,757 | 25,666 | 184 | 9,251 | ||||||||||||
Cost of shares redeemed | (295,769 | ) | (186,013 | ) | (135,423 | ) | (108,488 | ) | ||||||||
|
|
|
|
|
|
|
| |||||||||
Change in net assets resulting from Class A capital transactions | $ | (128,700 | ) | $ | (21,686 | ) | $ | (25,066 | ) | $ | 13,323 | |||||
|
|
|
|
|
|
|
| |||||||||
Class C | ||||||||||||||||
Proceeds from shares issued | $ | 6,479 | $ | 3,797 | $ | 13,089 | $ | 17,408 | ||||||||
Distributions reinvested | 145 | 2,160 | 3 | 1,817 | ||||||||||||
Cost of shares redeemed | (14,435 | ) | (10,313 | ) | (17,634 | ) | (12,981 | ) | ||||||||
|
|
|
|
|
|
|
| |||||||||
Change in net assets resulting from Class C capital transactions | $ | (7,811 | ) | $ | (4,356 | ) | $ | (4,542 | ) | $ | 6,244 | |||||
|
|
|
|
|
|
|
| |||||||||
Class I (formerly Select Class) | ||||||||||||||||
Proceeds from shares issued | $ | 154,661 | $ | 106,814 | $ | 151,877 | $ | 166,060 | ||||||||
Distributions reinvested | 1,883 | 12,987 | 921 | 11,293 | ||||||||||||
Cost of shares redeemed | (126,507 | ) | (325,752 | ) | (113,193 | ) | (105,988 | ) | ||||||||
|
|
|
|
|
|
|
| |||||||||
Change in net assets resulting from Class I capital transactions | $ | 30,037 | $ | (205,951 | ) | $ | 39,605 | $ | 71,365 | |||||||
|
|
|
|
|
|
|
| |||||||||
Class L (formerly Institutional Class) | ||||||||||||||||
Proceeds from shares issued | $ | — | $ | — | $ | 318,606 | $ | 366,693 | ||||||||
Distributions reinvested | — | — | 3,378 | 17,359 | ||||||||||||
Cost of shares redeemed | — | — | (322,926 | ) | (113,529 | ) | ||||||||||
|
|
|
|
|
|
|
| |||||||||
Change in net assets resulting from Class L capital transactions | $ | — | $ | — | $ | (942 | ) | $ | 270,523 | |||||||
|
|
|
|
|
|
|
| |||||||||
Class R2 | ||||||||||||||||
Proceeds from shares issued | $ | 27,657 | $ | 16,117 | $ | 24,052 | $ | 25,767 | ||||||||
Distributions reinvested | 203 | 2,028 | 2 | 944 | ||||||||||||
Cost of shares redeemed | (23,402 | ) | (15,854 | ) | (13,867 | ) | (7,774 | ) | ||||||||
|
|
|
|
|
|
|
| |||||||||
Change in net assets resulting from Class R2 capital transactions | $ | 4,458 | $ | 2,291 | $ | 10,187 | $ | 18,937 | ||||||||
|
|
|
|
|
|
|
| |||||||||
Class R3 (a) | ||||||||||||||||
Proceeds from shares issued | $ | 15,085 | $ | — | $ | 9,868 | $ | — | ||||||||
Distributions reinvested | 2 | — | — | (b) | — | |||||||||||
Cost of shares redeemed | (1,818 | ) | — | (478 | ) | — | ||||||||||
|
|
|
|
|
|
|
| |||||||||
Change in net assets resulting from Class R3 capital transactions | $ | 13,269 | $ | — | $ | 9,390 | $ | — | ||||||||
|
|
|
|
|
|
|
| |||||||||
Class R4 (a) | ||||||||||||||||
Proceeds from shares issued | $ | 37 | $ | — | $ | 862 | $ | — | ||||||||
Distributions reinvested | — | (b) | — | — | (b) | — | ||||||||||
Cost of shares redeemed | — | — | (81 | ) | — | |||||||||||
|
|
|
|
|
|
|
| |||||||||
Change in net assets resulting from Class R4 capital transactions | $ | 37 | $ | — | $ | 781 | $ | — | ||||||||
|
|
|
|
|
|
|
| |||||||||
Class R5 (c) | ||||||||||||||||
Proceeds from shares issued | $ | 74,810 | $ | 31,169 | $ | 142 | $ | — | ||||||||
Distributions reinvested | 736 | 4,681 | — | (b) | — | |||||||||||
Cost of shares redeemed | (59,662 | ) | (34,423 | ) | — | (b) | — | |||||||||
|
|
|
|
|
|
|
| |||||||||
Change in net assets resulting from Class R5 capital transactions | $ | 15,884 | $ | 1,427 | $ | 142 | $ | — | ||||||||
|
|
|
|
|
|
|
| |||||||||
SEE NOTES TO FINANCIAL STATEMENTS.
| JUNE 30, 2017 | J.P. MORGAN SMALL CAP FUNDS | 59 | ||||||
Table of Contents
STATEMENTS OF CHANGES IN NET ASSETS
FOR THE PERIODS INDICATED (continued)
(Amounts in thousands)
| Small Cap Value Fund | U.S. Small Company Fund | |||||||||||||||
| Year Ended June 30, 2017 | Year Ended June 30, 2016 | Year Ended June 30, 2017 | Year Ended June 30, 2016 | |||||||||||||
CAPITAL TRANSACTIONS: (continued) | ||||||||||||||||
Class R6 | ||||||||||||||||
Proceeds from shares issued | $ | 310,196 | $ | 383,830 | $ | 178,533 | $ | 100,275 | ||||||||
Distributions reinvested | 7,344 | 40,732 | 1,023 | 4,436 | ||||||||||||
Cost of shares redeemed | (203,402 | ) | (173,847 | ) | (53,305 | ) | (26,418 | ) | ||||||||
|
|
|
|
|
|
|
| |||||||||
Change in net assets resulting from Class R6 capital transactions | $ | 114,138 | $ | 250,715 | $ | 126,251 | $ | 78,293 | ||||||||
|
|
|
|
|
|
|
| |||||||||
Total change in net assets resulting from capital transactions | $ | 41,312 | $ | 22,440 | $ | 155,806 | $ | 458,685 | ||||||||
|
|
|
|
|
|
|
| |||||||||
| (a) | Commencement of offering of class of shares effective September 9, 2016. |
| (b) | Amount rounds to less than 500. |
| (c) | Commencement of offering of class of shares effective September 9, 2016 for U.S. Small Company Fund. |
SEE NOTES TO FINANCIAL STATEMENTS.
| 60 | J.P. MORGAN SMALL CAP FUNDS | JUNE 30, 2017 | ||||
Table of Contents
| Small Cap Value Fund | U.S. Small Company Fund | |||||||||||||||
| Year Ended June 30, 2017 | Year Ended June 30, 2016 | Year Ended June 30, 2017 | Year Ended June 30, 2016 | |||||||||||||
SHARE TRANSACTIONS: | ||||||||||||||||
Class A | ||||||||||||||||
Issued | 5,807 | 5,761 | 6,362 | 7,413 | ||||||||||||
Reinvested | 95 | 1,114 | 10 | 626 | ||||||||||||
Redeemed | (10,507 | ) | (7,728 | ) | (7,832 | ) | (7,196 | ) | ||||||||
|
|
|
|
|
|
|
| |||||||||
Change in Class A Shares | (4,605 | ) | (853 | ) | (1,460 | ) | 843 | |||||||||
|
|
|
|
|
|
|
| |||||||||
Class C |
| |||||||||||||||
Issued | 269 | 184 | 773 | 1,176 | ||||||||||||
Reinvested | 6 | 111 | — | (a) | 127 | |||||||||||
Redeemed | (608 | ) | (506 | ) | (1,055 | ) | (897 | ) | ||||||||
|
|
|
|
|
|
|
| |||||||||
Change in Class C Shares | (333 | ) | (211 | ) | (282 | ) | 406 | |||||||||
|
|
|
|
|
|
|
| |||||||||
Class I (formerly Select Class) |
| |||||||||||||||
Issued | 5,207 | 4,250 | 8,467 | 10,694 | ||||||||||||
Reinvested | 62 | 535 | 50 | 748 | ||||||||||||
Redeemed | (4,216 | ) | (12,338 | ) | (6,374 | ) | (6,898 | ) | ||||||||
|
|
|
|
|
|
|
| |||||||||
Change in Class I Shares | 1,053 | (7,553 | ) | 2,143 | 4,544 | |||||||||||
|
|
|
|
|
|
|
| |||||||||
Class L (formerly Institutional Class) |
| |||||||||||||||
Issued | — | — | 18,258 | 24,199 | ||||||||||||
Reinvested | — | — | 181 | 1,150 | ||||||||||||
Redeemed | — | — | (18,084 | ) | (7,566 | ) | ||||||||||
|
|
|
|
|
|
|
| |||||||||
Change in Class L Shares | — | — | 355 | 17,783 | ||||||||||||
|
|
|
|
|
|
|
| |||||||||
Class R2 |
| |||||||||||||||
Issued | 979 | 675 | 1,399 | 1,706 | ||||||||||||
Reinvested | 7 | 89 | — | (a) | 65 | |||||||||||
Redeemed | (835 | ) | (669 | ) | (814 | ) | (528 | ) | ||||||||
|
|
|
|
|
|
|
| |||||||||
Change in Class R2 Shares | 151 | 95 | 585 | 1,243 | ||||||||||||
|
|
|
|
|
|
|
| |||||||||
Class R3 (b) |
| |||||||||||||||
Issued | 520 | — | 557 | — | ||||||||||||
Reinvested | — | (a) | — | — | (a) | — | ||||||||||
Redeemed | (61 | ) | — | (27 | ) | — | ||||||||||
|
|
|
|
|
|
|
| |||||||||
Change in Class R3 Shares | 459 | — | 530 | — | ||||||||||||
|
|
|
|
|
|
|
| |||||||||
Class R4 (b) |
| |||||||||||||||
Issued | 1 | — | 47 | — | ||||||||||||
Reinvested | — | (a) | — | — | (a) | — | ||||||||||
Reinvested | — | — | (4 | ) | — | |||||||||||
|
|
|
|
|
|
|
| |||||||||
Change in Class R4 Shares | 1 | — | 43 | — | ||||||||||||
|
|
|
|
|
|
|
| |||||||||
Class R5 (c) |
| |||||||||||||||
Issued | 2,462 | 1,223 | 8 | — | ||||||||||||
Reinvested | 24 | 193 | — | (a) | — | |||||||||||
Redeemed | (1,978 | ) | (1,376 | ) | — | (a) | — | |||||||||
|
|
|
|
|
|
|
| |||||||||
Change in Class R5 Shares | 508 | 40 | 8 | — | ||||||||||||
|
|
|
|
|
|
|
| |||||||||
SEE NOTES TO FINANCIAL STATEMENTS.
| JUNE 30, 2017 | J.P. MORGAN SMALL CAP FUNDS | 61 | ||||||
Table of Contents
STATEMENTS OF CHANGES IN NET ASSETS
FOR THE PERIODS INDICATED (continued)
(Amounts in thousands)
| Small Cap Value Fund | U.S. Small Company Fund | |||||||||||||||
| Year Ended June 30, 2017 | Year Ended June 30, 2016 | Year Ended June 30, 2017 | Year Ended June 30, 2016 | |||||||||||||
SHARE TRANSACTIONS: (continued) | ||||||||||||||||
Class R6 |
| |||||||||||||||
Issued | 10,248 | 14,544 | 9,897 | 6,414 | ||||||||||||
Reinvested | 240 | 1,675 | 55 | 294 | ||||||||||||
Redeemed | (6,799 | ) | (7,015 | ) | (2,985 | ) | (1,663 | ) | ||||||||
|
|
|
|
|
|
|
| |||||||||
Change in Class R6 Shares | 3,689 | 9,204 | 6,967 | 5,045 | ||||||||||||
|
|
|
|
|
|
|
| |||||||||
| (a) | Amount rounds to less than 500. |
| (b) | Commencement of offering of class of shares effective September 9, 2016. |
| (c) | Commencement of offering of class of shares effective September 9, 2016 for U.S. Small Company Fund. |
SEE NOTES TO FINANCIAL STATEMENTS.
| 62 | J.P. MORGAN SMALL CAP FUNDS | JUNE 30, 2017 | ||||
Table of Contents
THIS PAGE IS INTENTIONALLY LEFT BLANK
| JUNE 30, 2017 | J.P. MORGAN SMALL CAP FUNDS | 63 | ||||||
Table of Contents
FOR THE PERIODS INDICATED
| Per share operating performance | ||||||||||||||||||||
| Investment operations | Distributions | |||||||||||||||||||
| Net asset value, beginning of period | Net investment income (loss) (a) | Net realized and unrealized gains (losses) on investments | Total from investment operations | Net realized gain | ||||||||||||||||
Dynamic Small Cap Growth Fund | ||||||||||||||||||||
Class A | ||||||||||||||||||||
Year Ended June 30, 2017 | $ | 19.14 | $ | (0.16 | ) | $ | 6.24 | $ | 6.08 | $ | (3.19 | ) | ||||||||
Year Ended June 30, 2016 | 26.04 | (0.16 | ) | (3.52 | ) | (3.68 | ) | (3.22 | ) | |||||||||||
Year Ended June 30, 2015 | 25.11 | (0.20 | ) | 3.17 | 2.97 | (2.04 | ) | |||||||||||||
Year Ended June 30, 2014 | 23.10 | (0.24 | ) | 4.44 | 4.20 | (2.19 | ) | |||||||||||||
Year Ended June 30, 2013 | 18.83 | (0.14 | )(d) | 5.17 | 5.03 | (0.76 | ) | |||||||||||||
Class C | ||||||||||||||||||||
Year Ended June 30, 2017 | 15.58 | (0.21 | ) | 4.94 | 4.73 | (3.19 | ) | |||||||||||||
Year Ended June 30, 2016 | 21.97 | (0.22 | ) | (2.95 | ) | (3.17 | ) | (3.22 | ) | |||||||||||
Year Ended June 30, 2015 | 21.61 | (0.28 | ) | 2.68 | 2.40 | (2.04 | ) | |||||||||||||
Year Ended June 30, 2014 | 20.25 | (0.32 | ) | 3.87 | 3.55 | (2.19 | ) | |||||||||||||
Year Ended June 30, 2013 | 16.68 | (0.22 | )(d) | 4.55 | 4.33 | (0.76 | ) | |||||||||||||
Class I (formerly Select Class) | ||||||||||||||||||||
Year Ended June 30, 2017 | 21.17 | (0.12 | ) | 6.97 | 6.85 | (3.19 | ) | |||||||||||||
Year Ended June 30, 2016 | 28.34 | (0.14 | ) | (3.81 | ) | (3.95 | ) | (3.22 | ) | |||||||||||
Year Ended June 30, 2015 | 27.08 | (0.15 | ) | 3.45 | 3.30 | (2.04 | ) | |||||||||||||
Year Ended June 30, 2014 | 24.70 | (0.19 | ) | 4.76 | 4.57 | (2.19 | ) | |||||||||||||
Year Ended June 30, 2013 | 20.02 | (0.07 | )(d) | 5.51 | 5.44 | (0.76 | ) | |||||||||||||
| (a) | Calculated based upon average shares outstanding. |
| (b) | Includes adjustments in accordance with accounting principles generally accepted in the United States of America and as such, the net asset values for financial reporting purposes and the returns based upon those net asset values may differ from the net asset values and returns for shareholder transactions. |
| (c) | Includes earnings credits and interest expense, if applicable, each of which is less than 0.005% unless otherwise noted. |
| (d) | Reflects special dividends paid out during the period by one of the Fund’s holdings. Had the Fund not received the special dividends, the net investment income (loss) per share would have been $(0.20), $(0.27) and $(0.14) for Class A, Class C and Class I Shares, respectively, and the net investment income (loss) ratio would have been (1.00)%, (1.51)% and (0.64)% for Class A, Class C and Class I Shares, respectively. |
SEE NOTES TO FINANCIAL STATEMENTS.
| 64 | J.P. MORGAN SMALL CAP FUNDS | JUNE 30, 2017 | ||||
Table of Contents
| Ratios/Supplemental data | |||||||||||||||||||||||||
| Ratios to average net assets | ||||||||||||||||||||||||||
| Net asset value, end of period | Total return (excludes sales charge) (b) | Net assets, end of period (000’s) | Net expenses (c) | Net investment income (loss) | Expenses | Portfolio turnover rate | ||||||||||||||||||||
| $ | 22.03 | 34.99 | % | $ | 66,189 | 1.25 | % | (0.78 | )% | 1.48 | % | 41 | % | |||||||||||||
| 19.14 | (14.42 | ) | 55,583 | 1.25 | (0.76 | ) | 1.51 | 56 | ||||||||||||||||||
| 26.04 | 13.02 | 73,175 | 1.25 | (0.82 | ) | 1.44 | 48 | |||||||||||||||||||
| 25.11 | 18.56 | 86,997 | 1.33 | (0.95 | ) | 1.38 | 65 | |||||||||||||||||||
| 23.10 | 27.61 | 77,408 | 1.44 | (0.70 | )(d) | 1.44 | 65 | |||||||||||||||||||
| 17.12 | 34.25 | 36,707 | 1.74 | (1.28 | ) | 2.04 | 41 | |||||||||||||||||||
| 15.58 | (14.80 | ) | 32,734 | 1.75 | (1.27 | ) | 2.12 | 56 | ||||||||||||||||||
| 21.97 | 12.46 | 50,162 | 1.75 | (1.32 | ) | 2.02 | 48 | |||||||||||||||||||
| 21.61 | 17.93 | 55,458 | 1.83 | (1.45 | ) | 1.88 | 65 | |||||||||||||||||||
| 20.25 | 26.96 | 54,171 | 1.94 | (1.20 | )(d) | 1.94 | 65 | |||||||||||||||||||
| 24.83 | 35.29 | 67,496 | 1.00 | (0.53 | ) | 1.18 | 41 | |||||||||||||||||||
| 21.17 | (14.19 | ) | 64,589 | 1.00 | (0.57 | ) | 1.09 | 56 | ||||||||||||||||||
| 28.34 | 13.30 | 386,459 | 1.00 | (0.57 | ) | 1.11 | 48 | |||||||||||||||||||
| 27.08 | 18.87 | 417,048 | 1.06 | (0.69 | ) | 1.13 | 65 | |||||||||||||||||||
| 24.70 | 28.02 | 387,402 | 1.09 | (0.33 | )(d) | 1.19 | 65 | |||||||||||||||||||
SEE NOTES TO FINANCIAL STATEMENTS.
| JUNE 30, 2017 | J.P. MORGAN SMALL CAP FUNDS | 65 | ||||||
Table of Contents
FINANCIAL HIGHLIGHTS
FOR THE PERIODS INDICATED (continued)
| Per share operating performance | |||||||||||||||||||||||||||
| Investment operations | Distributions | |||||||||||||||||||||||||||
| Net asset value, beginning of period | Net investment income (loss) | Net realized and unrealized gains (losses) on investments | Total from investment operations | Net investment income | Net realized gain | Total distributions | ||||||||||||||||||||||
Small Cap Core Fund | ||||||||||||||||||||||||||||
Class A | ||||||||||||||||||||||||||||
Year Ended June 30, 2017 | $ | 45.88 | $ | (0.04 | )(e) | $ | 11.81 | $ | 11.77 | $ | (0.20 | ) | $ | (5.13 | ) | $ | (5.33 | ) | ||||||||||
May 31, 2016 (f) through June 30, 2016 | 45.81 | 0.02 | (e)(g) | 0.05 | 0.07 | — | — | — | ||||||||||||||||||||
Class C |
| |||||||||||||||||||||||||||
Year Ended June 30, 2017 | 45.86 | (0.24 | )(e) | 11.74 | 11.50 | (0.09 | ) | (5.13 | ) | (5.22 | ) | |||||||||||||||||
May 31, 2016 (f) through June 30, 2016 | 45.81 | — | (e)(g)(h) | 0.05 | 0.05 | — | — | — | ||||||||||||||||||||
Class I |
| |||||||||||||||||||||||||||
January 3, 2017 (f) through June 30, 2017 | 50.44 | 0.07 | (e) | 2.07 | 2.14 | — | — | — | ||||||||||||||||||||
Class R5 (formerly Select Class) |
| |||||||||||||||||||||||||||
Year Ended June 30, 2017 | 45.90 | 0.20 | (e) | 11.83 | 12.03 | (0.16 | ) | (5.13 | ) | (5.29 | ) | |||||||||||||||||
Year Ended June 30, 2016 | 56.18 | 0.15 | (e)(g) | (5.25 | ) | (5.10 | ) | (0.32 | ) | (4.86 | ) | (5.18 | ) | |||||||||||||||
Year Ended June 30, 2015 | 58.70 | 0.37 | (e) | 3.20 | 3.57 | (0.10 | ) | (5.99 | ) | (6.09 | ) | |||||||||||||||||
Year Ended June 30, 2014 | 48.11 | 0.15 | (i) | 13.44 | 13.59 | (0.27 | ) | (2.73 | ) | (3.00 | ) | |||||||||||||||||
Year Ended June 30, 2013 | 37.54 | 0.37 | (j) | 10.63 | 11.00 | (0.43 | ) | — | (0.43 | ) | ||||||||||||||||||
Class R6 |
| |||||||||||||||||||||||||||
Year Ended June 30, 2017 | 45.90 | 0.29 | (e) | 11.76 | 12.05 | (0.25 | ) | (5.13 | ) | (5.38 | ) | |||||||||||||||||
May 31, 2016 (f) through June 30, 2016 | 45.81 | 0.04 | (e)(g) | 0.05 | 0.09 | — | — | — | ||||||||||||||||||||
| (a) | Annualized for periods less than one year, unless otherwise noted. |
| (b) | Not annualized for periods less than one year. |
| (c) | Includes adjustments in accordance with accounting principles generally accepted in the United States of America and as such, the net asset values for financial reporting purposes and the returns based upon those net asset values may differ from the net asset values and returns for shareholder transactions. |
| (d) | Includes earnings credits and interest expense, if applicable, each of which is less than 0.005% unless otherwise noted. |
| (e) | Calculated based upon average shares outstanding. |
| (f) | Commencement of offering of class of shares. |
| (g) | Net investment income (loss) may appear disproportionate among the classes due to the timing of recognition of income and changes in the relative size of the classes. |
| (h) | Amount rounds to less than $0.005. |
| (i) | Reflects special dividends paid out during the period by one of the Fund’s holdings. Had the Fund not received the special dividends, the net investment income (loss) per share would have been $0.09 and the net investment income (loss) ratio would have been 0.17% for Class R5 Shares. |
| (j) | Reflects special dividends paid out during the period by one of the Fund’s holdings. Had the Fund not received the special dividends, the net investment income (loss) per share would have been $0.19 and the net investment income (loss) ratio would have been 0.44% for Class R5 Shares. |
SEE NOTES TO FINANCIAL STATEMENTS.
| 66 | J.P. MORGAN SMALL CAP FUNDS | JUNE 30, 2017 | ||||
Table of Contents
| Ratios/Supplemental data | |||||||||||||||||||||||||
| Ratios to average net assets (a) | ||||||||||||||||||||||||||
| Net asset value, end of period | Total return (excludes sales charge) (b)(c) | Net assets, end of period (000’s) | Net expenses (d) | Net investment income (loss) | Expenses | Portfolio turnover rate (b) | ||||||||||||||||||||
| $ | 52.32 | 26.29 | % | $ | 2,203 | 1.24 | % | (0.07 | )% | 1.45 | % | 61 | % | |||||||||||||
| 45.88 | 0.15 | 23 | 1.25 | 0.56 | (g) | 1.39 | 58 | |||||||||||||||||||
| 52.14 | 25.68 | 1,017 | 1.74 | (0.47 | ) | 1.96 | 61 | |||||||||||||||||||
| 45.86 | 0.11 | 20 | 1.74 | 0.06 | (g) | 1.89 | 58 | |||||||||||||||||||
| 52.58 | 4.24 | 3,545 | 0.99 | 0.26 | 1.21 | 61 | ||||||||||||||||||||
| 52.64 | 26.87 | 187,198 | 0.79 | 0.40 | 1.11 | 61 | ||||||||||||||||||||
| 45.90 | (8.97 | ) | 164,573 | 0.80 | 0.30 | (g) | 1.16 | 58 | ||||||||||||||||||
| 56.18 | 7.01 | 815,652 | 0.80 | 0.66 | 1.13 | 56 | ||||||||||||||||||||
| 58.70 | 28.95 | 703,307 | 0.79 | 0.28 | (i) | 1.12 | 51 | |||||||||||||||||||
| 48.11 | 29.50 | 522,295 | 0.79 | 0.84 | (j) | 1.19 | 55 | |||||||||||||||||||
| 52.57 | 26.94 | 16,782 | 0.74 | 0.56 | 0.98 | 61 | ||||||||||||||||||||
| 45.90 | 0.20 | 20 | 0.74 | 1.06 | (g) | 0.88 | 58 | |||||||||||||||||||
SEE NOTES TO FINANCIAL STATEMENTS.
| JUNE 30, 2017 | J.P. MORGAN SMALL CAP FUNDS | 67 | ||||||
Table of Contents
FINANCIAL HIGHLIGHTS
FOR THE PERIODS INDICATED (continued)
| Per share operating performance | |||||||||||||||||||||||||||
| Investment operations | Distributions | |||||||||||||||||||||||||||
| Net asset value, beginning of period | Net investment income (loss) (b) | Net realized and unrealized gains (losses) on investments | Total from investment operations | Net investment income | Net realized gain | Total distributions | ||||||||||||||||||||||
Small Cap Equity Fund |
| |||||||||||||||||||||||||||
Class A |
| |||||||||||||||||||||||||||
Year Ended June 30, 2017 | $ | 41.68 | $ | 0.11 | $ | 8.21 | $ | 8.32 | $ | (0.12 | ) | $ | (1.25 | ) | $ | (1.37 | ) | |||||||||||
Year Ended June 30, 2016 | 44.68 | 0.13 | (f) | 0.08 | 0.21 | (0.14 | ) | (3.07 | ) | (3.21 | ) | |||||||||||||||||
Year Ended June 30, 2015 | 46.56 | 0.08 | 2.98 | 3.06 | (0.08 | ) | (4.86 | ) | (4.94 | ) | ||||||||||||||||||
Year Ended June 30, 2014 | 39.94 | 0.10 | (g) | 8.97 | 9.07 | (0.07 | ) | (2.38 | ) | (2.45 | ) | |||||||||||||||||
Year Ended June 30, 2013 | 36.02 | 0.29 | (h) | 7.39 | 7.68 | (0.36 | ) | (3.40 | ) | (3.76 | ) | |||||||||||||||||
Class C |
| |||||||||||||||||||||||||||
Year Ended June 30, 2017 | 32.21 | (0.09 | ) | 6.31 | 6.22 | (0.11 | ) | (1.25 | ) | (1.36 | ) | |||||||||||||||||
Year Ended June 30, 2016 | 35.32 | (0.06 | )(f) | 0.02 | (0.04 | ) | — | (3.07 | ) | (3.07 | ) | |||||||||||||||||
Year Ended June 30, 2015 | 37.96 | (0.12 | ) | 2.34 | 2.22 | — | (4.86 | ) | (4.86 | ) | ||||||||||||||||||
Year Ended June 30, 2014 | 33.06 | (0.10 | )(g) | 7.38 | 7.28 | — | (2.38 | ) | (2.38 | ) | ||||||||||||||||||
Year Ended June 30, 2013 | 30.46 | 0.09 | (h) | 6.15 | 6.24 | (0.24 | ) | (3.40 | ) | (3.64 | ) | |||||||||||||||||
Class I (formerly Select Class) |
| |||||||||||||||||||||||||||
Year Ended June 30, 2017 | 47.50 | 0.28 | 9.37 | 9.65 | (0.21 | ) | (1.25 | ) | (1.46 | ) | ||||||||||||||||||
Year Ended June 30, 2016 | 50.31 | 0.25 | (f) | 0.17 | 0.42 | (0.16 | ) | (3.07 | ) | (3.23 | ) | |||||||||||||||||
Year Ended June 30, 2015 | 51.78 | 0.24 | 3.36 | 3.60 | (0.21 | ) | (4.86 | ) | (5.07 | ) | ||||||||||||||||||
Year Ended June 30, 2014 | 44.14 | 0.26 | (g) | 9.94 | 10.20 | (0.18 | ) | (2.38 | ) | (2.56 | ) | |||||||||||||||||
Year Ended June 30, 2013 | 39.41 | 0.44 | (h) | 8.15 | 8.59 | (0.46 | ) | (3.40 | ) | (3.86 | ) | |||||||||||||||||
Class R2 |
| |||||||||||||||||||||||||||
Year Ended June 30, 2017 | 41.08 | — | (i) | 8.08 | 8.08 | (0.10 | ) | (1.25 | ) | (1.35 | ) | |||||||||||||||||
Year Ended June 30, 2016 | 44.04 | 0.01 | (f) | 0.10 | 0.11 | — | (3.07 | ) | (3.07 | ) | ||||||||||||||||||
Year Ended June 30, 2015 | 45.99 | (0.04 | ) | 2.95 | 2.91 | — | (4.86 | ) | (4.86 | ) | ||||||||||||||||||
Year Ended June 30, 2014 | 39.52 | (0.01 | )(g) | 8.86 | 8.85 | — | (2.38 | ) | (2.38 | ) | ||||||||||||||||||
Year Ended June 30, 2013 | 35.67 | 0.20 | (h) | 7.31 | 7.51 | (0.26 | ) | (3.40 | ) | (3.66 | ) | |||||||||||||||||
Class R3 | ||||||||||||||||||||||||||||
September 9, 2016 (k) through June 30, 2017 | 43.22 | 0.12 | 6.68 | 6.80 | (0.23 | ) | (1.25 | ) | (1.48 | ) | ||||||||||||||||||
Class R4 |
| |||||||||||||||||||||||||||
September 9, 2016 (k) through June 30, 2017 | 49.28 | 0.23 | 7.63 | 7.86 | (0.25 | ) | (1.25 | ) | (1.50 | ) | ||||||||||||||||||
Class R5 |
| |||||||||||||||||||||||||||
Year Ended June 30, 2017 | 47.57 | 0.36 | 9.42 | 9.78 | (0.26 | ) | (1.25 | ) | (1.51 | ) | ||||||||||||||||||
Year Ended June 30, 2016 | 50.43 | 0.36 | (f) | 0.15 | 0.51 | (0.30 | ) | (3.07 | ) | (3.37 | ) | |||||||||||||||||
Year Ended June 30, 2015 | 51.88 | 0.34 | 3.37 | 3.71 | (0.30 | ) | (4.86 | ) | (5.16 | ) | ||||||||||||||||||
Year Ended June 30, 2014 | 44.21 | 0.36 | (g) | 9.96 | 10.32 | (0.27 | ) | (2.38 | ) | (2.65 | ) | |||||||||||||||||
Year Ended June 30, 2013 | 39.47 | 0.52 | (h) | 8.16 | 8.68 | (0.54 | ) | (3.40 | ) | (3.94 | ) | |||||||||||||||||
Class R6 |
| |||||||||||||||||||||||||||
Year Ended June 30, 2017 | 47.57 | 0.46 | 9.34 | 9.80 | (0.29 | ) | (1.25 | ) | (1.54 | ) | ||||||||||||||||||
May 31, 2016 (k) through June 30, 2016 | 47.04 | 0.06 | (f) | 0.47 | 0.53 | — | — | — | ||||||||||||||||||||
| (a) | Annualized for periods less than one year, unless otherwise noted. |
| (b) | Calculated based upon average shares outstanding. |
| (c) | Not annualized for periods less than one year. |
| (d) | Includes adjustments in accordance with accounting principles generally accepted in the United States of America and as such, the net asset values for financial reporting purposes and the returns based upon those net asset values may differ from the net asset values and returns for shareholder transactions. |
| (e) | Includes earnings credits and interest expense, if applicable, each of which is less than 0.005% unless otherwise noted. |
| (f) | Net investment income (loss) may appear disproportionate among classes due to the timing of recognition of income and changes in the relative size of the classes. |
| (g) | Reflects special dividends paid out during the period by several of the Fund’s holdings. Had the Fund not received the special dividends, the net investment income (loss) per share would have been $(0.04), $(0.21), $0.10, $(0.15) and $0.20 for Class A, Class C, Class I, Class R2 and Class R5 Shares, respectively, and the net investment income (loss) ratio would have been (0.09)%, (0.59)%, 0.21%, (0.34)% and 0.41% for Class A, Class C, Class I, Class R2 and Class R5 Class Shares, respectively. |
SEE NOTES TO FINANCIAL STATEMENTS.
| 68 | J.P. MORGAN SMALL CAP FUNDS | JUNE 30, 2017 | ||||
Table of Contents
| Ratios/Supplemental data | |||||||||||||||||||||||||
| Ratios to average net assets (a) | ||||||||||||||||||||||||||
| Net asset value, end of period | Total return (excludes sales charge) (c)(d) | Net assets, end of period (000’s) | Net expenses (e) | Net investment income (loss) | Expenses | Portfolio turnover rate (c) | ||||||||||||||||||||
| $ | 48.63 | 20.14 | % | $ | 1,135,394 | 1.29 | % | 0.24 | % | 1.35 | % | 21 | % | |||||||||||||
| 41.68 | 1.10 | 736,629 | 1.29 | 0.31 | (f) | 1.38 | 32 | |||||||||||||||||||
| 44.68 | 7.49 | 674,619 | 1.29 | 0.17 | 1.39 | 20 | ||||||||||||||||||||
| 46.56 | 23.27 | 738,967 | 1.29 | 0.23 | (g) | 1.37 | 30 | |||||||||||||||||||
| 39.94 | 23.11 | 696,784 | 1.29 | 0.78 | (h) | 1.39 | 25 | |||||||||||||||||||
| 37.07 | 19.53 | 171,352 | 1.79 | (0.25 | ) | 1.84 | 21 | |||||||||||||||||||
| 32.21 | 0.63 | 70,176 | 1.79 | (0.20 | )(f) | 1.85 | 32 | |||||||||||||||||||
| 35.32 | 6.92 | 35,783 | 1.79 | (0.33 | ) | 1.87 | 20 | |||||||||||||||||||
| 37.96 | 22.67 | 39,824 | 1.79 | (0.26 | )(g) | 1.87 | 30 | |||||||||||||||||||
| 33.06 | 22.50 | 37,039 | 1.79 | 0.28 | (h) | 1.88 | 25 | |||||||||||||||||||
| 55.69 | 20.50 | 2,722,213 | 0.99 | 0.54 | 1.07 | 21 | ||||||||||||||||||||
| 47.50 | 1.41 | 1,261,772 | 0.99 | 0.54 | (f) | 1.14 | 32 | |||||||||||||||||||
| 50.31 | 7.81 | 1,435,112 | 0.99 | 0.48 | 1.14 | 20 | ||||||||||||||||||||
| 51.78 | 23.65 | 1,443,768 | 0.99 | 0.53 | (g) | 1.12 | 30 | |||||||||||||||||||
| 44.14 | 23.48 | 1,134,887 | 0.99 | 1.07 | (h) | 1.14 | 25 | |||||||||||||||||||
| 47.81 | 19.85 | 13,078 | 1.53 | 0.00 | (j) | 1.73 | 21 | |||||||||||||||||||
| 41.08 | 0.85 | 5,313 | 1.54 | 0.03 | (f) | 1.72 | 32 | |||||||||||||||||||
| 44.04 | 7.23 | 3,446 | 1.54 | (0.08 | ) | 1.73 | 20 | |||||||||||||||||||
| 45.99 | 22.95 | 3,883 | 1.54 | (0.02 | )(g) | 1.62 | 30 | |||||||||||||||||||
| 39.52 | 22.80 | 4,909 | 1.54 | 0.53 | (h) | 1.64 | 25 | |||||||||||||||||||
| 48.54 | 15.92 | 104 | 1.24 | 0.32 | 1.36 | 21 | ||||||||||||||||||||
| 55.64 | 16.14 | 60 | 0.99 | 0.55 | 1.14 | 21 | ||||||||||||||||||||
| 55.84 | 20.74 | 1,267,593 | 0.79 | 0.68 | 0.86 | 21 | ||||||||||||||||||||
| 47.57 | 1.62 | 1,349,107 | 0.79 | 0.78 | (f) | 0.86 | 32 | |||||||||||||||||||
| 50.43 | 8.03 | 1,244,878 | 0.79 | 0.68 | 0.89 | 20 | ||||||||||||||||||||
| 51.88 | 23.90 | 1,177,534 | 0.79 | 0.73 | (g) | 0.92 | 30 | |||||||||||||||||||
| 44.21 | 23.71 | 814,942 | 0.79 | 1.25 | (h) | 0.94 | 25 | |||||||||||||||||||
| 55.83 | 20.80 | 978,649 | 0.74 | 0.85 | 0.76 | 21 | ||||||||||||||||||||
| 47.57 | 1.13 | 25,933 | 0.73 | 1.60 | (f) | 0.75 | 32 | |||||||||||||||||||
| (h) | Reflects special dividends paid out during the period by several of the Fund’s holdings. Had the Fund not received the special dividends, the net investment income (loss) per share would have been $0.05, $(0.11), $0.18, $(0.04) and $0.26 for Class A, Class C, Class I, Class R2 and Class R5 Shares, respectively, and the net investment income (loss) ratio would have been 0.14%, (0.36)%, 0.44%, (0.10)% and 0.62% for Class A, Class C, Class I, Class R2 and Class R5 Shares, respectively. |
| (i) | Amount rounds to less than $0.005. |
| (j) | Amount rounds to less than 0.005%. |
| (k) | Commencement of offering of class of shares. |
SEE NOTES TO FINANCIAL STATEMENTS.
| JUNE 30, 2017 | J.P. MORGAN SMALL CAP FUNDS | 69 | ||||||
Table of Contents
FINANCIAL HIGHLIGHTS
FOR THE PERIODS INDICATED (continued)
| Per share operating performance | ||||||||||||||||||||
| Investment operations | Distributions | |||||||||||||||||||
| Net asset value, beginning of period | Net investment income (loss) (b) | Net realized gains | Total from investment operations | Net realized gain | ||||||||||||||||
Small Cap Growth Fund |
| |||||||||||||||||||
Class A |
| |||||||||||||||||||
Year Ended June 30, 2017 | $ | 11.43 | $ | (0.10 | ) | $ | 3.94 | $ | 3.84 | $ | (0.46 | ) | ||||||||
Year Ended June 30, 2016 | 14.50 | (0.09 | ) | (1.94 | ) | (2.03 | ) | (1.04 | ) | |||||||||||
Year Ended June 30, 2015 | 13.96 | (0.11 | )(f) | 1.77 | 1.66 | (1.12 | ) | |||||||||||||
Year Ended June 30, 2014 | 13.00 | (0.12 | ) | 2.52 | 2.40 | (1.44 | ) | |||||||||||||
Year Ended June 30, 2013 | 11.13 | (0.06 | )(g) | 2.94 | 2.88 | (1.01 | ) | |||||||||||||
Class C |
| |||||||||||||||||||
Year Ended June 30, 2017 | 8.82 | (0.13 | ) | 3.00 | 2.87 | (0.46 | ) | |||||||||||||
Year Ended June 30, 2016 | 11.50 | (0.12 | ) | (1.52 | ) | (1.64 | ) | (1.04 | ) | |||||||||||
Year Ended June 30, 2015 | 11.36 | (0.14 | )(f) | 1.40 | 1.26 | (1.12 | ) | |||||||||||||
Year Ended June 30, 2014 | 10.87 | (0.16 | ) | 2.09 | 1.93 | (1.44 | ) | |||||||||||||
Year Ended June 30, 2013 | 9.51 | (0.10 | )(g) | 2.47 | 2.37 | (1.01 | ) | |||||||||||||
Class I (formerly Select Class) |
| |||||||||||||||||||
Year Ended June 30, 2017 | 12.42 | (0.07 | ) | 4.29 | 4.22 | (0.46 | ) | |||||||||||||
Year Ended June 30, 2016 | 15.61 | (0.07 | ) | (2.08 | ) | (2.15 | ) | (1.04 | ) | |||||||||||
Year Ended June 30, 2015 | 14.91 | (0.08 | )(f) | 1.90 | 1.82 | (1.12 | ) | |||||||||||||
Year Ended June 30, 2014 | 13.77 | (0.09 | ) | 2.67 | 2.58 | (1.44 | ) | |||||||||||||
Year Ended June 30, 2013 | 11.70 | (0.03 | )(g) | 3.11 | 3.08 | (1.01 | ) | |||||||||||||
Class L (formerly Institutional Class) |
| |||||||||||||||||||
Year Ended June 30, 2017 | 12.72 | (0.05 | ) | 4.39 | 4.34 | (0.46 | ) | |||||||||||||
Year Ended June 30, 2016 | 15.93 | (0.05 | ) | (2.12 | ) | (2.17 | ) | (1.04 | ) | |||||||||||
Year Ended June 30, 2015 | 15.17 | (0.06 | )(f) | 1.94 | 1.88 | (1.12 | ) | |||||||||||||
Year Ended June 30, 2014 | 13.96 | (0.07 | ) | 2.72 | 2.65 | (1.44 | ) | |||||||||||||
Year Ended June 30, 2013 | 11.84 | (0.01 | )(g) | 3.14 | 3.13 | (1.01 | ) | |||||||||||||
Class R2 |
| |||||||||||||||||||
Year Ended June 30, 2017 | 11.15 | (0.13 | ) | 3.83 | 3.70 | (0.46 | ) | |||||||||||||
Year Ended June 30, 2016 | 14.20 | (0.12 | ) | (1.89 | ) | (2.01 | ) | (1.04 | ) | |||||||||||
Year Ended June 30, 2015 | 13.73 | (0.14 | )(f) | 1.73 | 1.59 | (1.12 | ) | |||||||||||||
Year Ended June 30, 2014 | 12.84 | (0.16 | ) | 2.49 | 2.33 | (1.44 | ) | |||||||||||||
Year Ended June 30, 2013 | 11.03 | (0.09 | )(g) | 2.91 | 2.82 | (1.01 | ) | |||||||||||||
Class R5 |
| |||||||||||||||||||
September 9, 2016 (h) through June 30, 2017 | 13.75 | (0.04 | ) | 3.35 | 3.31 | (0.46 | ) | |||||||||||||
Class R6 |
| |||||||||||||||||||
Year Ended June 30, 2017 | 12.80 | (0.04 | ) | 4.43 | 4.39 | (0.46 | ) | |||||||||||||
Year Ended June 30, 2016 | 16.01 | (0.03 | ) | (2.14 | ) | (2.17 | ) | (1.04 | ) | |||||||||||
Year Ended June 30, 2015 | 15.23 | (0.05 | )(f) | 1.95 | 1.90 | (1.12 | ) | |||||||||||||
Year Ended June 30, 2014 | 14.00 | (0.06 | ) | 2.73 | 2.67 | (1.44 | ) | |||||||||||||
Year Ended June 30, 2013 | 11.85 | — | (g)(i) | 3.16 | 3.16 | (1.01 | ) | |||||||||||||
| (a) | Annualized for periods less than one year, unless otherwise noted. |
| (b) | Calculated based upon average shares outstanding. |
| (c) | Not annualized for periods less than one year. |
| (d) | Includes adjustments in accordance with accounting principles generally accepted in the United States of America and as such, the net asset values for financial reporting purposes and the returns based upon those net asset values may differ from the net asset values and returns for shareholder transactions. |
| (e) | Includes earnings credits and interest expense, if applicable, each of which is less than 0.005% unless otherwise noted. |
| (f) | Net investment income (loss) may appear disproportionate among classes due to the timing of recognition of income and changes in the relative size of the classes. |
| (g) | Reflects special dividends paid out during the period by one of the Fund’s holdings. Had the Fund not received the special dividends, the net investment income (loss) per share would have been $(0.09), $(0.13),$(0.07), $(0.05), $(0.12) and $(0.04) for Class A, Class C, Class I, Class L, Class R2 and Class R6 Shares, respectively, and the net investment income (loss) ratio would have been (0.80)%, (1.30)%, (0.54)%, (0.40)%, (1.04)% and (0.29)% for Class A, Class C, Class I, Class L, Class R2 and Class R6 Shares, respectively. |
| (h) | Commencement of offering of class of shares. |
| (i) | Amount rounds to less than $0.005. |
| (j) | Amount rounds to less than 0.005%. |
SEE NOTES TO FINANCIAL STATEMENTS.
| 70 | J.P. MORGAN SMALL CAP FUNDS | JUNE 30, 2017 | ||||
Table of Contents
| Ratios/Supplemental data | |||||||||||||||||||||||||
| Ratios to average net assets (a) | ||||||||||||||||||||||||||
| Net asset value, end of period | Total return (excludes sales charge) (c)(d) | Net assets, end of period (000’s) | Net expenses (e) | Net investment income (loss) | Expenses | Portfolio turnover rate (c) | ||||||||||||||||||||
| $ | 14.81 | 34.36 | % | $ | 196,403 | 1.24 | % | (0.75 | )% | 1.40 | % | 42 | % | |||||||||||||
| 11.43 | (14.17 | ) | 179,093 | 1.25 | (0.77 | ) | 1.50 | 47 | ||||||||||||||||||
| 14.50 | 13.04 | 266,805 | 1.25 | (0.82 | )(f) | 1.42 | 50 | |||||||||||||||||||
| 13.96 | 18.94 | 282,408 | 1.25 | (0.86 | ) | 1.37 | 58 | |||||||||||||||||||
| 13.00 | 27.94 | 249,986 | 1.24 | (0.50 | )(g) | 1.42 | 60 | |||||||||||||||||||
| 11.23 | 33.51 | 20,352 | 1.74 | (1.25 | ) | 1.85 | 42 | |||||||||||||||||||
| 8.82 | (14.50 | ) | 18,218 | 1.75 | (1.27 | ) | 1.91 | 47 | ||||||||||||||||||
| 11.50 | 12.47 | 26,297 | 1.75 | (1.32 | )(f) | 1.87 | 50 | |||||||||||||||||||
| 11.36 | 18.29 | 28,035 | 1.75 | (1.36 | ) | 1.87 | 58 | |||||||||||||||||||
| 10.87 | 27.30 | 25,415 | 1.74 | (1.00 | )(g) | 1.92 | 60 | |||||||||||||||||||
| 16.18 | 34.69 | 110,644 | 1.00 | (0.50 | ) | 1.12 | 42 | |||||||||||||||||||
| 12.42 | (13.92 | ) | 102,174 | 1.00 | (0.52 | ) | 1.18 | 47 | ||||||||||||||||||
| 15.61 | 13.29 | 157,631 | 1.00 | (0.57 | )(f) | 1.16 | 50 | |||||||||||||||||||
| 14.91 | 19.20 | 156,585 | 1.00 | (0.62 | ) | 1.12 | 58 | |||||||||||||||||||
| 13.77 | 28.30 | 148,078 | 1.00 | (0.25 | )(g) | 1.17 | 60 | |||||||||||||||||||
| 16.60 | 34.82 | 360,044 | 0.85 | (0.35 | ) | 0.93 | 42 | |||||||||||||||||||
| 12.72 | (13.76 | ) | 271,369 | 0.85 | (0.35 | ) | 0.96 | 47 | ||||||||||||||||||
| 15.93 | 13.47 | 279,248 | 0.85 | (0.42 | )(f) | 0.95 | 50 | |||||||||||||||||||
| 15.17 | 19.46 | 302,087 | 0.85 | (0.46 | ) | 0.97 | 58 | |||||||||||||||||||
| 13.96 | 28.39 | 230,458 | 0.85 | (0.11 | )(g) | 1.02 | 60 | |||||||||||||||||||
| 14.39 | 33.96 | 23,569 | 1.49 | (1.00 | ) | 1.70 | 42 | |||||||||||||||||||
| 11.15 | (14.34 | ) | 21,276 | 1.50 | (1.01 | ) | 1.85 | 47 | ||||||||||||||||||
| 14.20 | 12.74 | 28,364 | 1.50 | (1.07 | )(f) | 1.72 | 50 | |||||||||||||||||||
| 13.73 | 18.62 | 31,119 | 1.50 | (1.11 | ) | 1.62 | 58 | |||||||||||||||||||
| 12.84 | 27.64 | 26,561 | 1.49 | (0.75 | )(g) | 1.67 | 60 | |||||||||||||||||||
| 16.60 | 24.72 | 1,186 | 0.82 | (0.31 | ) | 0.84 | 42 | |||||||||||||||||||
| 16.73 | 34.99 | 603,730 | 0.75 | (0.25 | ) | 0.76 | 42 | |||||||||||||||||||
| 12.80 | (13.69 | ) | 445,008 | 0.75 | (0.25 | ) | 0.77 | 47 | ||||||||||||||||||
| 16.01 | 13.55 | 486,724 | 0.75 | (0.31 | )(f) | 0.79 | 50 | |||||||||||||||||||
| 15.23 | 19.55 | 355,032 | 0.75 | (0.36 | ) | 0.87 | 58 | |||||||||||||||||||
| 14.00 | 28.63 | 248,415 | 0.75 | 0.00 | (g)(j) | 0.92 | 60 | |||||||||||||||||||
SEE NOTES TO FINANCIAL STATEMENTS.
| JUNE 30, 2017 | J.P. MORGAN SMALL CAP FUNDS | 71 | ||||||
Table of Contents
FINANCIAL HIGHLIGHTS
FOR THE PERIODS INDICATED (continued)
| Per share operating performance | |||||||||||||||||||||||||||
| Investment operations | Distributions | |||||||||||||||||||||||||||
| Net asset value, beginning of period | Net investment income (loss) (b) | Net realized and unrealized gains (losses) on investments | Total from investment operations | Net investment income | Net realized gain | Total distributions | ||||||||||||||||||||||
Small Cap Value Fund |
| |||||||||||||||||||||||||||
Class A |
| |||||||||||||||||||||||||||
Year Ended June 30, 2017 | $ | 24.64 | $ | 0.11 | (f) | $ | 4.58 | $ | 4.69 | $ | (0.13 | ) | $ | (0.02 | ) | $ | (0.15 | ) | ||||||||||
Year Ended June 30, 2016 | 26.65 | 0.17 | (0.94 | ) | (0.77 | ) | (0.15 | ) | (1.09 | ) | (1.24 | ) | ||||||||||||||||
Year Ended June 30, 2015 | 27.98 | 0.22 | (0.01 | ) | 0.21 | (0.20 | ) | (1.34 | ) | (1.54 | ) | |||||||||||||||||
Year Ended June 30, 2014 | 23.77 | 0.12 | (g) | 4.87 | 4.99 | (0.11 | ) | (0.67 | ) | (0.78 | ) | |||||||||||||||||
Year Ended June 30, 2013 | 18.75 | 0.21 | (h) | 5.04 | 5.25 | (0.23 | ) | — | (0.23 | ) | ||||||||||||||||||
Class C |
| |||||||||||||||||||||||||||
Year Ended June 30, 2017 | 20.82 | (0.05 | )(f) | 3.87 | 3.82 | (0.07 | ) | (0.02 | ) | (0.09 | ) | |||||||||||||||||
Year Ended June 30, 2016 | 22.77 | 0.02 | (0.82 | ) | (0.80 | ) | (0.06 | ) | (1.09 | ) | (1.15 | ) | ||||||||||||||||
Year Ended June 30, 2015 | 24.19 | 0.05 | (0.02 | ) | 0.03 | (0.11 | ) | (1.34 | ) | (1.45 | ) | |||||||||||||||||
Year Ended June 30, 2014 | 20.73 | (0.03 | )(g) | 4.22 | 4.19 | (0.06 | ) | (0.67 | ) | (0.73 | ) | |||||||||||||||||
Year Ended June 30, 2013 | 16.40 | 0.06 | (h) | 4.41 | 4.47 | (0.14 | ) | — | (0.14 | ) | ||||||||||||||||||
Class I (formerly Select Class) |
| |||||||||||||||||||||||||||
Year Ended June 30, 2017 | 25.97 | 0.20 | (f) | 4.81 | 5.01 | (0.16 | ) | (0.02 | ) | (0.18 | ) | |||||||||||||||||
Year Ended June 30, 2016 | 28.00 | 0.23 | (0.97 | ) | (0.74 | ) | (0.20 | ) | (1.09 | ) | (1.29 | ) | ||||||||||||||||
Year Ended June 30, 2015 | 29.31 | 0.31 | (0.02 | ) | 0.29 | (0.26 | ) | (1.34 | ) | (1.60 | ) | |||||||||||||||||
Year Ended June 30, 2014 | 24.86 | 0.20 | (g) | 5.09 | 5.29 | (0.17 | ) | (0.67 | ) | (0.84 | ) | |||||||||||||||||
Year Ended June 30, 2013 | 19.58 | 0.26 | (h) | 5.29 | 5.55 | (0.27 | ) | — | (0.27 | ) | ||||||||||||||||||
Class R2 |
| |||||||||||||||||||||||||||
Year Ended June 30, 2017 | 24.48 | 0.04 | (f) | 4.53 | 4.57 | (0.09 | ) | (0.02 | ) | (0.11 | ) | |||||||||||||||||
Year Ended June 30, 2016 | 26.49 | 0.11 | (0.94 | ) | (0.83 | ) | (0.09 | ) | (1.09 | ) | (1.18 | ) | ||||||||||||||||
Year Ended June 30, 2015 | 27.83 | 0.16 | (0.02 | ) | 0.14 | (0.14 | ) | (1.34 | ) | (1.48 | ) | |||||||||||||||||
Year Ended June 30, 2014 | 23.67 | 0.07 | (g) | 4.83 | 4.90 | (0.07 | ) | (0.67 | ) | (0.74 | ) | |||||||||||||||||
Year Ended June 30, 2013 | 18.68 | 0.15 | (h) | 5.03 | 5.18 | (0.19 | ) | — | (0.19 | ) | ||||||||||||||||||
Class R3 |
| |||||||||||||||||||||||||||
September 9, 2016 (i) through June 30, 2017 | 25.89 | 0.12 | (f) | 3.31 | 3.43 | (0.16 | ) | (0.02 | ) | (0.18 | ) | |||||||||||||||||
Class R4 |
| |||||||||||||||||||||||||||
September 9, 2016 (i) through June 30, 2017 | 27.30 | 0.18 | (f) | 3.49 | 3.67 | (0.18 | ) | (0.02 | ) | (0.20 | ) | |||||||||||||||||
Class R5 |
| |||||||||||||||||||||||||||
Year Ended June 30, 2017 | 25.97 | 0.23 | (f) | 4.81 | 5.04 | (0.19 | ) | (0.02 | ) | (0.21 | ) | |||||||||||||||||
Year Ended June 30, 2016 | 28.01 | 0.26 | (0.98 | ) | (0.72 | ) | (0.23 | ) | (1.09 | ) | (1.32 | ) | ||||||||||||||||
Year Ended June 30, 2015 | 29.31 | 0.34 | (0.02 | ) | 0.32 | (0.28 | ) | (1.34 | ) | (1.62 | ) | |||||||||||||||||
Year Ended June 30, 2014 | 24.85 | 0.23 | (g) | 5.09 | 5.32 | (0.19 | ) | (0.67 | ) | (0.86 | ) | |||||||||||||||||
Year Ended June 30, 2013 | 19.58 | 0.29 | (h) | 5.27 | 5.56 | (0.29 | ) | — | (0.29 | ) | ||||||||||||||||||
Class R6 |
| |||||||||||||||||||||||||||
Year Ended June 30, 2017 | 25.99 | 0.27 | (f) | 4.82 | 5.09 | (0.23 | ) | (0.02 | ) | (0.25 | ) | |||||||||||||||||
Year Ended June 30, 2016 | 28.03 | 0.31 | (1.00 | ) | (0.69 | ) | (0.26 | ) | (1.09 | ) | (1.35 | ) | ||||||||||||||||
Year Ended June 30, 2015 | 29.33 | 0.37 | (0.02 | ) | 0.35 | (0.31 | ) | (1.34 | ) | (1.65 | ) | |||||||||||||||||
Year Ended June 30, 2014 | 24.87 | 0.24 | (g) | 5.09 | 5.33 | (0.20 | ) | (0.67 | ) | (0.87 | ) | |||||||||||||||||
Year Ended June 30, 2013 | 19.59 | 0.29 | (h) | 5.29 | 5.58 | (0.30 | ) | — | (0.30 | ) | ||||||||||||||||||
| (a) | Annualized for periods less than one year, unless otherwise noted. |
| (b) | Calculated based upon average shares outstanding. |
| (c) | Not annualized for periods less than one year. |
| (d) | Includes adjustments in accordance with accounting principles generally accepted in the United States of America and as such, the net asset values for financial reporting purposes and the returns based upon those net asset values may differ from the net asset values and returns for shareholder transactions. |
| (e) | Includes earnings credits and interest expense, if applicable, each of which is less than 0.005% unless otherwise noted. |
| (f) | Net investment income (loss) may appear disproportionate among classes due to the timing of recognition of income and changes in the relative size of the classes. |
| (g) | Reflects special dividends paid out during the period by one of the Fund’s holdings. Had the Fund not received the special dividends, the net investment income (loss) per share would have been $0.11, $(0.05), $0.18, $0.05, $0.22 and $0.23 for Class A, Class C, Class I, Class R2, Class R5 and Class R6 Shares, respectively, and the net investment income (loss) ratio would have been 0.41%, (0.20)%, 0.66%, 0.20%, 0.79% and 0.82% for Class A, Class C, Class I, Class R2, Class R5 and Class R6 Shares, respectively. |
SEE NOTES TO FINANCIAL STATEMENTS.
| 72 | J.P. MORGAN SMALL CAP FUNDS | JUNE 30, 2017 | ||||
Table of Contents
| Ratios/Supplemental data | |||||||||||||||||||||||||
| Ratios to average net assets (a) | ||||||||||||||||||||||||||
| Net asset value, end of period | Total return (excludes sales charge) (c)(d) | Net assets, end of period (000’s) | Net expenses (e) | Net investment income (loss) | Expenses | Portfolio turnover rate (c) | ||||||||||||||||||||
| $ | 29.18 | 19.01 | % | $ | 518,464 | 1.24 | % | 0.39 | %(f) | 1.44 | % | 41 | % | |||||||||||||
| 24.64 | (2.54 | ) | 551,313 | 1.25 | 0.69 | 1.53 | 46 | |||||||||||||||||||
| 26.65 | 1.04 | 618,977 | 1.24 | 0.84 | 1.44 | 38 | ||||||||||||||||||||
| 27.98 | 21.24 | 516,950 | 1.24 | 0.46 | (g) | 1.40 | 40 | |||||||||||||||||||
| 23.77 | 28.08 | 332,177 | 1.24 | 0.98 | (h) | 1.39 | 38 | |||||||||||||||||||
| 24.55 | 18.32 | 40,349 | 1.85 | (0.21 | )(f) | 1.86 | 41 | |||||||||||||||||||
| 20.82 | (3.12 | ) | 41,161 | 1.86 | 0.07 | 1.94 | 46 | |||||||||||||||||||
| 22.77 | 0.42 | 49,815 | 1.85 | 0.23 | 1.89 | 38 | ||||||||||||||||||||
| 24.19 | 20.45 | 52,909 | 1.84 | (0.15 | )(g) | 1.89 | 40 | |||||||||||||||||||
| 20.73 | 27.35 | 41,108 | 1.85 | 0.34 | (h) | 1.89 | 38 | |||||||||||||||||||
| 30.80 | 19.30 | 344,875 | 0.99 | 0.67 | (f) | 1.11 | 41 | |||||||||||||||||||
| 25.97 | (2.28 | ) | 263,436 | 1.00 | 0.88 | 1.18 | 46 | |||||||||||||||||||
| 28.00 | 1.27 | 495,605 | 0.99 | 1.10 | 1.14 | 38 | ||||||||||||||||||||
| 29.31 | 21.52 | 404,848 | 0.99 | 0.71 | (g) | 1.15 | 40 | |||||||||||||||||||
| 24.86 | 28.47 | 266,018 | 0.99 | 1.19 | (h) | 1.14 | 38 | |||||||||||||||||||
| 28.94 | 18.68 | 60,282 | 1.52 | 0.14 | (f) | 1.75 | 41 | |||||||||||||||||||
| 24.48 | (2.78 | ) | 47,309 | 1.50 | 0.45 | 1.91 | 46 | |||||||||||||||||||
| 26.49 | 0.77 | 48,675 | 1.49 | 0.59 | 1.76 | 38 | ||||||||||||||||||||
| 27.83 | 20.95 | 47,939 | 1.49 | 0.25 | (g) | 1.66 | 40 | |||||||||||||||||||
| 23.67 | 27.79 | 15,500 | 1.49 | 0.69 | (h) | 1.64 | 38 | |||||||||||||||||||
| 29.14 | 13.24 | 13,390 | 1.27 | 0.53 | (f) | 1.28 | 41 | |||||||||||||||||||
| 30.77 | 13.44 | 39 | 1.06 | 0.75 | (f) | 1.10 | 41 | |||||||||||||||||||
| 30.80 | 19.43 | 130,338 | 0.88 | 0.77 | (f) | 0.89 | 41 | |||||||||||||||||||
| 25.97 | (2.21 | ) | 96,674 | 0.90 | 1.04 | 0.93 | 46 | |||||||||||||||||||
| 28.01 | 1.39 | 103,149 | 0.91 | 1.19 | 0.93 | 38 | ||||||||||||||||||||
| 29.31 | 21.67 | 79,792 | 0.90 | 0.85 | (g) | 0.95 | 40 | |||||||||||||||||||
| 24.85 | 28.53 | 32,304 | 0.90 | 1.28 | (h) | 0.94 | 38 | |||||||||||||||||||
| 30.83 | 19.59 | 1,007,466 | 0.76 | 0.90 | (f) | 0.76 | 41 | |||||||||||||||||||
| 25.99 | (2.07 | ) | 753,439 | 0.77 | 1.21 | 0.77 | 46 | |||||||||||||||||||
| 28.03 | 1.49 | 554,522 | 0.79 | 1.32 | 0.81 | 38 | ||||||||||||||||||||
| 29.33 | 21.71 | 453,645 | 0.85 | 0.87 | (g) | 0.90 | 40 | |||||||||||||||||||
| 24.87 | 28.62 | 207,613 | 0.85 | 1.32 | (h) | 0.89 | 38 | |||||||||||||||||||
| (h) | Reflects special dividends paid out during the period by one of the Fund’s holdings. Had the Fund not received the special dividends, the net investment income (loss) per share would have been $0.12, $(0.01), $0.17, $0.06, $0.19 and $0.20 for Class A, Class C, Class I, Class R2, Class R5 and Class R6 Shares, respectively, and the net investment income (loss) ratio would have been 0.57%, (0.08)%, 0.77%, 0.27%, 0.86% and 0.89% for Class A, Class C, Class I, Class R2, Class R5 and Class R6 Shares, respectively. |
| (i) | Commencement of offering of class of shares. |
SEE NOTES TO FINANCIAL STATEMENTS.
| JUNE 30, 2017 | J.P. MORGAN SMALL CAP FUNDS | 73 | ||||||
Table of Contents
FINANCIAL HIGHLIGHTS
FOR THE PERIODS INDICATED (continued)
| Per share operating performance | |||||||||||||||||||||||||||
| Investment operations | Distributions | |||||||||||||||||||||||||||
| Net asset value, beginning of period | Net investment income (loss) (b) | Net realized and unrealized gains (losses) on investments | Total from investment operations | Net investment income | Net realized gain | Total distributions | ||||||||||||||||||||||
U.S. Small Company Fund |
| |||||||||||||||||||||||||||
Class A |
| |||||||||||||||||||||||||||
Year Ended June 30, 2017 | $ | 15.09 | $ | — | (f)(g) | $ | 3.02 | $ | 3.02 | $ | (0.01 | ) | $ | — | (g) | $ | (0.01 | ) | ||||||||||
Year Ended June 30, 2016 | 16.96 | 0.02 | (1.20 | ) | (1.18 | ) | (0.02 | ) | (0.67 | ) | (0.69 | ) | ||||||||||||||||
Year Ended June 30, 2015 | 16.25 | 0.03 | 1.22 | 1.25 | — | (0.54 | ) | (0.54 | ) | |||||||||||||||||||
Year Ended June 30, 2014 | 13.17 | (0.01 | )(h) | 3.39 | 3.38 | (0.01 | ) | (0.29 | ) | (0.30 | ) | |||||||||||||||||
Year Ended June 30, 2013 | 10.31 | 0.04 | (i) | 2.89 | 2.93 | (0.07 | ) | — | (0.07 | ) | ||||||||||||||||||
Class C |
| |||||||||||||||||||||||||||
Year Ended June 30, 2017 | 14.57 | (0.08 | )(f) | 2.91 | 2.83 | — | — | (g) | — | (g) | ||||||||||||||||||
Year Ended June 30, 2016 | 16.46 | (0.05 | ) | (1.17 | ) | (1.22 | ) | — | (0.67 | ) | (0.67 | ) | ||||||||||||||||
Year Ended June 30, 2015 | 15.86 | (0.05 | ) | 1.19 | 1.14 | — | (0.54 | ) | (0.54 | ) | ||||||||||||||||||
Year Ended June 30, 2014 | 12.91 | (0.08 | )(h) | 3.32 | 3.24 | — | (0.29 | ) | (0.29 | ) | ||||||||||||||||||
Year Ended June 30, 2013 | 10.14 | (0.02 | )(i) | 2.83 | 2.81 | (0.04 | ) | — | (0.04 | ) | ||||||||||||||||||
Class I (formerly Select Class) |
| |||||||||||||||||||||||||||
Year Ended June 30, 2017 | 15.40 | 0.04 | (f) | 3.08 | 3.12 | (0.05 | ) | — | (g) | (0.05 | ) | |||||||||||||||||
Year Ended June 30, 2016 | 17.29 | 0.06 | (1.22 | ) | (1.16 | ) | (0.06 | ) | (0.67 | ) | (0.73 | ) | ||||||||||||||||
Year Ended June 30, 2015 | 16.53 | 0.08 | 1.24 | 1.32 | (0.02 | ) | (0.54 | ) | (0.56 | ) | ||||||||||||||||||
Year Ended June 30, 2014 | 13.37 | 0.03 | (g) | 3.45 | 3.48 | (0.03 | ) | (0.29 | ) | (0.32 | ) | |||||||||||||||||
Year Ended June 30, 2013 | 10.45 | 0.08 | (h) | 2.92 | 3.00 | (0.08 | ) | — | (0.08 | ) | ||||||||||||||||||
Class L (formerly Institutional Class) |
| |||||||||||||||||||||||||||
Year Ended June 30, 2017 | 15.39 | 0.08 | (f) | 3.08 | 3.16 | (0.09 | ) | — | (g) | (0.09 | ) | |||||||||||||||||
Year Ended June 30, 2016 | 17.28 | 0.10 | (1.24 | ) | (1.14 | ) | (0.08 | ) | (0.67 | ) | (0.75 | ) | ||||||||||||||||
Year Ended June 30, 2015 | 16.51 | 0.11 | 1.24 | 1.35 | (0.04 | ) | (0.54 | ) | (0.58 | ) | ||||||||||||||||||
Year Ended June 30, 2014 | 13.35 | 0.06 | (h) | 3.44 | 3.50 | (0.05 | ) | (0.29 | ) | (0.34 | ) | |||||||||||||||||
Year Ended June 30, 2013 | 10.43 | 0.10 | (i) | 2.92 | 3.02 | (0.10 | ) | — | (0.10 | ) | ||||||||||||||||||
Class R2 |
| |||||||||||||||||||||||||||
Year Ended June 30, 2017 | 14.88 | (0.04 | )(f) | 2.97 | 2.93 | — | — | (g) | — | (g) | ||||||||||||||||||
Year Ended June 30, 2016 | 16.77 | (0.01 | ) | (1.19 | ) | (1.20 | ) | (0.02 | ) | (0.67 | ) | (0.69 | ) | |||||||||||||||
Year Ended June 30, 2015 | 16.12 | (0.01 | ) | 1.20 | 1.19 | — | (0.54 | ) | (0.54 | ) | ||||||||||||||||||
Year Ended June 30, 2014 | 13.09 | (0.05 | )(h) | 3.38 | 3.33 | (0.01 | ) | (0.29 | ) | (0.30 | ) | |||||||||||||||||
Year Ended June 30, 2013 | 10.25 | (0.02 | )(i) | 2.90 | 2.88 | (0.04 | ) | — | (0.04 | ) | ||||||||||||||||||
Class R3 |
| |||||||||||||||||||||||||||
September 9, 2016(j) through June 30, 2017 | 16.02 | 0.04 | (f) | 2.04 | 2.08 | (0.07 | ) | — | (g) | (0.07 | ) | |||||||||||||||||
Class R4 |
| |||||||||||||||||||||||||||
September 9, 2016(j) through June 30, 2017 | 16.36 | 0.13 | (f) | 2.04 | 2.17 | (0.09 | ) | — | (g) | (0.09 | ) | |||||||||||||||||
Class R5 |
| |||||||||||||||||||||||||||
September 9, 2016(j) through June 30, 2017 | 16.35 | 0.07 | (f) | 2.13 | 2.20 | (0.10 | ) | — | (g) | (0.10 | ) | |||||||||||||||||
Class R6 |
| |||||||||||||||||||||||||||
Year Ended June 30, 2017 | 15.40 | 0.10 | (f) | 3.08 | 3.18 | (0.10 | ) | — | (g) | (0.10 | ) | |||||||||||||||||
Year Ended June 30, 2016 | 17.29 | 0.11 | (1.23 | ) | (1.12 | ) | (0.10 | ) | (0.67 | ) | (0.77 | ) | ||||||||||||||||
Year Ended June 30, 2015 | 16.52 | 0.12 | 1.24 | 1.36 | (0.05 | ) | (0.54 | ) | (0.59 | ) | ||||||||||||||||||
Year Ended June 30, 2014 | 13.35 | 0.06 | (h) | 3.46 | 3.52 | (0.06 | ) | (0.29 | ) | (0.35 | ) | |||||||||||||||||
Year Ended June 30, 2013 | 10.43 | 0.11 | (i) | 2.91 | 3.02 | (0.10 | ) | — | (0.10 | ) | ||||||||||||||||||
| (a) | Annualized for periods less than one year, unless otherwise noted. |
| (b) | Calculated based upon average shares outstanding. |
| (c) | Not annualized for periods less than one year. |
| (d) | Includes adjustments in accordance with accounting principles generally accepted in the United States of America and as such, the net asset values for financial reporting purposes and the returns based upon those net asset values may differ from the net asset values and returns for shareholder transactions. |
| (e) | Includes earnings credits and interest expense, if applicable, each of which is less than 0.005% unless otherwise noted. |
| (f) | Net investment income (loss) may appear disproportionate among classes due to the timing of recognition of income and changes in the relative size of the classes. |
| (g) | Amount rounds to less than $0.005. |
SEE NOTES TO FINANCIAL STATEMENTS.
| 74 | J.P. MORGAN SMALL CAP FUNDS | JUNE 30, 2017 | ||||
Table of Contents
| Ratios/Supplemental data | |||||||||||||||||||||||||
| Ratios to average net assets (a) | ||||||||||||||||||||||||||
| Net asset value, end of period | Total return (excludes sales charge) (c)(d) | Net assets, end of period (000’s) | Net expenses (e) | Net investment income (loss) | Expenses | Portfolio turnover rate (c) | ||||||||||||||||||||
| $ | 18.10 | 20.04 | % | $ | 244,958 | 1.25 | % | (0.01 | )%(f) | 1.35 | % | 53 | % | |||||||||||||
| 15.09 | (6.86 | ) | 226,309 | 1.26 | 0.15 | 1.44 | 49 | |||||||||||||||||||
| 16.96 | 7.98 | 240,064 | 1.25 | 0.21 | 1.40 | 56 | ||||||||||||||||||||
| 16.25 | 25.86 | 126,858 | 1.25 | (0.08 | )(h) | 1.34 | 51 | |||||||||||||||||||
| 13.17 | 28.54 | 49,607 | 1.25 | 0.31 | (i) | 1.43 | 54 | |||||||||||||||||||
| 17.40 | 19.43 | 49,946 | 1.75 | (0.51 | )(f) | 1.85 | 53 | |||||||||||||||||||
| 14.57 | (7.35 | ) | 45,932 | 1.76 | (0.34 | ) | 1.91 | 49 | ||||||||||||||||||
| 16.46 | 7.47 | 45,202 | 1.75 | (0.28 | ) | 1.88 | 56 | |||||||||||||||||||
| 15.86 | 25.27 | 22,539 | 1.75 | (0.57 | )(h) | 1.84 | 51 | |||||||||||||||||||
| 12.91 | 27.83 | 6,972 | 1.75 | (0.18 | )(i) | 1.93 | 54 | |||||||||||||||||||
| 18.47 | 20.29 | 387,043 | 1.01 | 0.25 | (f) | 1.05 | 53 | |||||||||||||||||||
| 15.40 | (6.63 | ) | 289,631 | 1.00 | 0.42 | 1.11 | 49 | |||||||||||||||||||
| 17.29 | 8.25 | 246,645 | 1.00 | 0.45 | 1.11 | 56 | ||||||||||||||||||||
| 16.53 | 26.21 | 160,279 | 1.00 | 0.17 | (h) | 1.09 | 51 | |||||||||||||||||||
| 13.37 | 28.81 | 66,928 | 1.00 | 0.64 | (i) | 1.21 | 54 | |||||||||||||||||||
| 18.46 | 20.50 | 711,139 | 0.82 | 0.43 | (f) | 0.87 | 53 | |||||||||||||||||||
| 15.39 | (6.48 | ) | 587,279 | 0.82 | 0.63 | 0.90 | 49 | |||||||||||||||||||
| 17.28 | 8.49 | 352,036 | 0.82 | 0.64 | 0.94 | 56 | ||||||||||||||||||||
| 16.51 | 26.42 | 216,698 | 0.82 | 0.39 | (h) | 0.94 | 51 | |||||||||||||||||||
| 13.35 | 29.08 | 30,226 | 0.82 | 0.79 | (i) | 1.05 | 54 | |||||||||||||||||||
| 17.81 | 19.70 | 51,511 | 1.50 | (0.24 | )(f) | 1.69 | 53 | |||||||||||||||||||
| 14.88 | (7.09 | ) | 34,326 | 1.51 | (0.05 | ) | 1.75 | 49 | ||||||||||||||||||
| 16.77 | 7.66 | 17,846 | 1.50 | (0.04 | ) | 1.66 | 56 | |||||||||||||||||||
| 16.12 | 25.66 | 9,785 | 1.50 | (0.32 | )(h) | 1.59 | 51 | |||||||||||||||||||
| 13.09 | 28.19 | 1,744 | 1.50 | (0.20 | )(i) | 1.65 | 54 | |||||||||||||||||||
| 18.03 | 13.01 | 9,560 | 1.23 | 0.25 | (f) | 1.24 | 53 | |||||||||||||||||||
| 18.44 | 13.24 | 794 | 1.00 | 0.89 | (f) | 1.07 | 53 | |||||||||||||||||||
| 18.45 | 13.44 | 145 | 0.83 | 0.51 | (f) | 0.90 | 53 | |||||||||||||||||||
| 18.48 | 20.64 | 296,577 | 0.72 | 0.55 | (f) | 0.72 | 53 | |||||||||||||||||||
| 15.40 | (6.39 | ) | 139,835 | 0.73 | 0.71 | 0.74 | 49 | |||||||||||||||||||
| 17.29 | 8.54 | 69,755 | 0.73 | 0.73 | 0.76 | 56 | ||||||||||||||||||||
| 16.52 | 26.54 | 45,604 | 0.75 | 0.42 | (h) | 0.84 | 51 | |||||||||||||||||||
| 13.35 | 29.17 | 17,232 | 0.75 | 0.95 | (i) | 0.97 | 54 | |||||||||||||||||||
| (h) | Reflects special dividends paid out during the period by one of the Fund’s holdings. Had the Fund not received the special dividends, the net investment income(loss) per share would have been $(0.02), $(0.09), $0.02, $0.05, $(0.05), and $0.06 for Class A, Class C, Class I, Class L, Class R2 and Class R6 Shares, respectively, and the net investment income (loss) ratio would have been (0.12)%, (0.61)%, 0.13%, 0.34%, (0.36)% and 0.38% for Class A, Class C, Class I, Class L, Class R2 and Class R6 Class Shares, respectively. |
| (i) | Reflects special dividends paid out during the period by one of the Fund’s holdings. Had the Fund not received the special dividends, the net investment income (loss) per share would have been $(0.01), $(0.07), $0.03, $0.05, $(0.07) and $0.07 for Class A, Class C, Class I, Class L, Class R2 and Class R6 Class Shares, respectively, and the net investment income (loss) ratio would have been (0.08)%, (0.57)%, 0.25%, 0.41%, (0.58)% and 0.56% for Class A, Class C, Class I, Class L, Class R2 and Class R6 Shares, respectively. |
| (j) | Commencement of offering of class of shares. |
SEE NOTES TO FINANCIAL STATEMENTS.
| JUNE 30, 2017 | J.P. MORGAN SMALL CAP FUNDS | 75 | ||||||
Table of Contents
AS OF JUNE 30, 2017
1. Organization
JPMorgan Trust I (“JPM I”) and JPMorgan Trust II (“JPM II”) (collectively, the “Trusts”) were formed on November 12, 2004, as Delaware statutory trusts, pursuant to Declarations of Trust dated November 5, 2004 and are registered under the Investment Company Act of 1940, as amended (the “1940 Act”), as open-end management investment companies.
The following are 6 separate funds of the Trusts (collectively, the “Funds”) covered by this report:
| Classes Offered | Trust | Diversified/Non-Diversified | ||||
| Dynamic Small Cap Growth Fund | Class A, Class C and Class I* | JPM I | Diversified | |||
| Small Cap Core Fund | Class A, Class C, Class I**, Class R5*** and Class R6 | JPM I | Diversified | |||
| Small Cap Equity Fund | Class A, Class C, Class I*, Class R2, Class R3****, Class R4****, Class R5 and Class R6 | JPM I | Diversified | |||
| Small Cap Growth Fund | Class A, Class C, Class I*, Class L^, Class R2, Class R5^^ and Class R6 | JPM II | Diversified | |||
| Small Cap Value Fund | Class A, Class C, Class I*, Class R2, Class R3****, Class R4****, Class R5 and Class R6 | JPM II | Diversified | |||
| U.S. Small Company Fund | Class A, Class C, Class I*, Class L^, Class R2, Class R3****, Class R4****, Class R5^^ and Class R6 | JPM I | Diversified |
| * | Effective April 3, 2017, Select Class was renamed Class I. |
| ** | Select Class commenced operations on January 3, 2017 and was renamed Class I effective April 3, 2017 for Small Cap Core Fund. |
| *** | Effective September 15, 2016, Select Class was renamed Class R5 for Small Cap Core Fund. |
| **** | Class R3 and Class R4 commenced operations on September 9, 2016 for Small Cap Equity Fund, Small Cap Value Fund and U.S. Small Company Fund. |
| ^ | Effective December 1, 2016, Institutional Class was renamed Class L. |
| ^^ | Class R5 Shares commenced operations on September 9, 2016 for Small Cap Growth Fund and U.S. Small Company Fund. |
The investment objectives of Dynamic Small Cap Growth Fund, Small Cap Core Fund and Small Cap Equity Fund are to seek capital growth over the long term.
The investment objective of Small Cap Growth Fund is to seek long-term capital growth primarily by investing in a portfolio of equity securities of small-capitalization and emerging growth companies.
The investment objective of Small Cap Value Fund is to seek long-term capital growth primarily by investing in equity securities of small-capitalization companies.
The investment objective of U.S. Small Company Fund is to seek to provide high total return from a portfolio of small company stocks.
All share classes of the Dynamic Small Cap Growth Fund are publicly offered only on a limited basis. Effective December 1, 2016 Class L Shares for the Small Cap Growth Fund and U.S. Small Company Fund were publicly offered on a limited basis. Investors are not eligible to purchase shares of the Funds unless they meet certain requirements as described in the Funds’ prospectuses. Effective as of the close of business on August 12, 2016 through September 14, 2016, Class R5 Shares of the Small Cap Core Fund were publicly offered only on a limited basis. Effective August 25, 2016, all share classes of the Small Cap Growth Fund were publicly offered.
Prior to November 16, 2015, and subsequent to December 30, 2016, all share classes of the Small Cap Equity Fund were publicly offered only on a limited basis. During the period November 16, 2015 through December 29, 2016, Small Cap Equity Fund was publicly offered.
Class A Shares generally provide for a front-end sales charge while Class C Shares provide for a contingent deferred sales charge (“CDSC”). No sales charges are assessed with respect to Class I, Class L, Class R2, Class R3, Class R4, Class R5 and Class R6 Shares. All classes of shares have equal rights as to earnings, assets and voting privileges, except that each class may bear different transfer agency, sub-transfer agency (through April 2, 2017), distribution and service fees and each class has exclusive voting rights with respect to its distribution plan and shareholder servicing agreements. Effective April 3, 2017, sub-transfer agency and service fees were consolidated into a single service fee. Certain Class A Shares, for which front-end sales charges have been waived, may be subject to a CDSC as described in the Funds’ prospectus. Beginning on November 14, 2017, Class C Shares will automatically convert to Class A Shares after ten years.
J.P. Morgan Investment Management Inc. (“JPMIM”), an indirect, wholly-owned subsidiary of JPMorgan Chase & Co. (“JPMorgan”), acts as Adviser (the “Adviser”) and Administrator (the “Administrator”) to the Funds.
2. Significant Accounting Policies
The following is a summary of significant accounting policies followed by the Funds in the preparation of their financial statements. The Funds are investment companies and, accordingly, follow the investment company accounting and reporting guidance of the Financial Accounting Standards Board Accounting Standards Codification Topic 946 — Investment Companies, which is part of U.S. generally accepted accounting principles (“GAAP”). The preparation of financial statements in conformity with GAAP requires management to make estimates and assumptions that affect the reported amounts of assets and liabilities and disclosure of contingent assets and liabilities at the date of the financial statements and the reported amounts of increases and decreases in net assets from operations during the reporting period. Actual results could differ from those estimates.
| 76 | J.P. MORGAN SMALL CAP FUNDS | JUNE 30, 2017 | ||||
Table of Contents
A. Valuation of Investments — The valuation of investments is in accordance with GAAP and the Funds’ valuation policies set forth by and under the supervision and responsibility of the Board of Trustees (the “Board”), which established the following approach to valuation, as described more fully below: (i) investments for which market quotations are readily available shall be valued at such unadjusted quoted prices and (ii) all other investments for which market quotations are not readily available shall be valued at their fair value as determined in good faith by the Board.
The Administrator has established the J.P. Morgan Investment Management Americas Valuation Committee (“AVC”) to assist the Board with the oversight and monitoring of the valuation of the Funds’ investments. The Administrator implements the valuation policies of the Funds’ investments, as directed by the Board. The AVC oversees and carries out the policies for the valuation of investments held in the Funds. This includes monitoring the appropriateness of fair values based on results of ongoing valuation oversight, including but not limited to consideration of macro or security specific events, market events and pricing vendor and broker due diligence. The Administrator is responsible for discussing and assessing the potential impacts to the fair values on an ongoing basis, and at least on a quarterly basis with the AVC and the Board.
A market-based approach is primarily used to value the Funds’ investments. Investments for which market quotations are not readily available are fair valued by approved affiliated and unaffiliated pricing vendors or third party broker-dealers (collectively referred to as “Pricing Services”) or may be internally fair valued using methods set forth by the valuation policies approved by the Board. This may include related or comparable assets or liabilities, recent transactions, market multiples, book values, and other relevant information for the investment to determine the fair value of the investment. An income-based valuation approach may be used in which the anticipated future cash flows of the investment are discounted to calculate the fair value. Discounts may also be applied due to the nature or duration of any restrictions on the disposition of the investments. Valuations may be based upon current market prices of securities that are comparable in coupon, rating, maturity and industry. It is possible that the estimated values may differ significantly from the values that would have been used, had a ready market for the investments existed, and such differences could be material.
Equities and other exchange-traded instruments are valued at the last sale price or official market closing price on the primary exchange on which the instrument is traded before the net asset values (“NAV”) of the Funds are calculated on a valuation date. Investments in open-end investment companies (the “Underlying Funds”) are valued at each Underlying Fund’s NAV per share as of the report date.
Futures are generally valued on the basis of available market quotations.
Valuations reflected in this report are as of the report date. As a result, changes in valuation due to market events and/or issuer related events after the report date and prior to issuance of the report are not reflected herein.
The various inputs that are used in determining the valuation of the Funds’ investments are summarized into the three broad levels listed below.
| • | Level 1 — Unadjusted inputs using quoted prices in active markets for identical investments. |
| • | Level 2 — Other significant observable inputs including, but not limited to, quoted prices for similar investments, inputs other than quoted prices that are observable for investments (such as interest rates, prepayment speeds, credit risk, etc.) or other market corroborated inputs. |
| • | Level 3 — Significant inputs based on the best information available in the circumstances, to the extent observable inputs are not available (including the Funds’ assumptions in determining the fair value of investments). |
A financial instrument’s level within the fair value hierarchy is based on the lowest level of any input, both individually and in the aggregate, that is significant to the fair value measurement. The inputs or methodology used for valuing instruments are not necessarily an indication of the risk associated with investing in those instruments.
The following tables represent each valuation input as presented on the Schedules of Portfolio Investments (“SOIs”) (amounts in thousands):
Dynamic Small Cap Growth Fund
| Level 1 Quoted prices | Level 2 Other significant observable inputs | Level 3 Significant | Total | |||||||||||||
Total Investments in Securities (a) | $ | 169,912 | $ | — | $ | — | $ | 169,912 | ||||||||
|
|
|
|
|
|
|
| |||||||||
Small Cap Core Fund | ||||||||||||||||
| Level 1 Quoted prices | Level 2 Other significant observable inputs | Level 3 Significant | Total | |||||||||||||
Total Investments in Securities (b) | $ | 214,645 | $ | — | $ | — | (c) | $ | 214,645 | |||||||
|
|
|
|
|
|
|
| |||||||||
Appreciation in Other Financial Instruments |
| |||||||||||||||
Futures Contracts | $ | 12 | $ | — | $ | — | $ | 12 | ||||||||
|
|
|
|
|
|
|
| |||||||||
| JUNE 30, 2017 | J.P. MORGAN SMALL CAP FUNDS | 77 | ||||||
Table of Contents
NOTES TO FINANCIAL STATEMENTS
AS OF JUNE 30, 2017 (continued)
Small Cap Equity Fund | ||||||||||||||||
Level 1 Quoted prices | Level 2 Other significant observable inputs | Level 3 Significant | Total | |||||||||||||
Total Investments in Securities (a) | $ | 6,305,979 | $ | — | $ | — | $ | 6,305,979 | ||||||||
|
|
|
|
|
|
|
| |||||||||
Small Cap Growth Fund | ||||||||||||||||
| Level 1 Quoted prices | Level 2 Other significant observable inputs | Level 3 Significant | Total | |||||||||||||
Total Investments in Securities (a) | $ | 1,345,712 | $ | — | $ | — | $ | 1,345,712 | ||||||||
|
|
|
|
|
|
|
| |||||||||
| Small Cap Value Fund | ||||||||||||||||
Level 1 Quoted prices | Level 2 Other significant observable inputs | Level 3 Significant unobservable inputs | Total | |||||||||||||
Total Investments in Securities (b) | $ | 2,106,240 | $ | — | $ | — | (c) | $ | 2,106,240 | |||||||
|
|
|
|
|
|
|
| |||||||||
Depreciation in Other Financial Instruments |
| |||||||||||||||
Futures Contracts | $ | (159 | ) | $ | — | $ | — | $ | (159 | ) | ||||||
|
|
|
|
|
|
|
| |||||||||
| U.S. Small Company Fund | ||||||||||||||||
Level 1 Quoted prices | Level 2 Other significant observable inputs | Level 3 Significant unobservable inputs | Total | |||||||||||||
Total Investments in Securities (b) | $ | 1,747,575 | $ | — | $ | — | (c) | $ | 1,747,575 | |||||||
|
|
|
|
|
|
|
| |||||||||
Depreciation in Other Financial Instruments |
| |||||||||||||||
Futures Contracts | $ | (106 | ) | $ | — | $ | — | $ | (106 | ) | ||||||
|
|
|
|
|
|
|
| |||||||||
| (a) | All portfolio holdings designated as level 1 are disclosed individually on the SOIs. Please refer to the SOIs for asset class specifics of portfolio holdings. |
| (b) | Portfolio holdings designated in level 1 and level 3 are disclosed individually on the SOIs. Level 3 consists of a warrant. Please refer to the SOIs for industry specifics of portfolio holdings. |
| (c) | Value is zero. |
There were no transfers among any levels during the year ended June 30, 2017.
B. Futures Contracts — Small Cap Core Fund, Small Cap Value Fund and U.S. Small Company Fund used index futures contracts to gain or reduce exposure to the stock market, maintain liquidity or minimize transaction costs. The Funds buy futures contracts to invest incoming cash in the market or sell futures in response to cash outflows, thereby simulating an invested position in the underlying index while maintaining a cash balance for liquidity.
Futures contracts provide for the delayed delivery of the underlying instrument at a fixed price or are settled for a cash amount based on the change in the value of the underlying instrument at a specific date in the future. Upon entering into a futures contract, the Funds are required to deposit with the broker, cash or securities in an amount equal to a certain percentage of the contract amount, which is referred to as the initial margin deposit. Subsequent payments, referred to as variation margin, are made or received by the Funds periodically and are based on changes in the market value of open futures contracts. Changes in the market value of open futures contracts are recorded as change in net unrealized appreciation/ depreciation on the Statements of Operations. Realized gains or losses, representing the difference between the value of the contract at the time it was opened and the value at the time it was closed, are reported on the Statements of Operations at the closing or expiration of the futures contract. Securities deposited as initial margin are designated on the SOIs and cash deposited is recorded on the Statements of Assets and Liabilities. A receivable from and/or a payable to brokers for the daily variation margin is also recorded on the Statements of Assets and Liabilities.
The use of futures contracts exposes the Funds to equity price risk. The Funds may be subject to the risk that the change in the value of the futures contract may not correlate perfectly with the underlying instrument. Use of long futures contracts subjects the Funds to risk of loss in excess of the amounts shown on the Statements of Assets and Liabilities, up to the notional amount of the futures contracts. Use of short futures contracts subjects the Funds to unlimited risk of loss. The Funds may enter into futures contracts only on exchanges or boards of trade. The exchange or board of trade acts as the counterparty to each futures transaction; therefore, the Funds’ credit risk is limited to failure of the exchange or board of trade. Under some circumstances, futures exchanges may establish daily limits on the amount that the price of a futures contract can vary from the previous day’s settlement price, which could effectively prevent liquidation of positions.
| 78 | J.P. MORGAN SMALL CAP FUNDS | JUNE 30, 2017 | ||||
Table of Contents
The table below discloses the volume of the Funds’ futures contracts activity during the year ended June 30, 2017 (amounts in thousands):
| Small Cap Core Fund | Small Cap Value Fund | U.S. Small Company Fund | ||||||||||
Futures Contracts — Equity: | ||||||||||||
Average Notional Balance Long | $ | 4,881 | $ | 54,432 | $ | 51,678 | ||||||
Ending Notional Balance Long | 6,152 | 47,238 | 77,645 | |||||||||
The Funds’ futures contracts are not subject to master netting arrangements (the right to close out all transactions traded with a counterparty and net amounts owed or due across transactions).
C. Security Transactions and Investment Income — Investment transactions are accounted for on the trade date (the date the order to buy or sell is executed). Securities gains and losses are calculated on a specifically identified cost basis. Interest income is determined on the basis of coupon interest accrued using the effective interest method which adjusts for amortization of premiums and accretion of discounts. Dividend income net of foreign taxes withheld, if any, is recorded on the ex-dividend date or when a Fund first learns of the dividend.
To the extent such information is publicly available, the Funds record distributions received in excess of income earned from underlying investments as a reduction of cost of investments and/or realized gain. Such amounts are based on estimates if actual amounts are not available and actual amounts of income, realized gain and return of capital may differ from the estimated amounts. The Funds adjust the estimated amounts of the components of distributions (and consequently their net investment income) as necessary once the issuers provide information about the actual composition of the distributions.
D. Allocation of Income and Expenses — Expenses directly attributable to a fund are charged directly to that fund, while the expenses attributable to more than one fund of the Trusts are allocated among the respective funds. In calculating the NAV of each class, investment income, realized and unrealized gains and losses and expenses, other than class specific expenses, are allocated daily to each class of shares based upon the proportion of net assets of each class at the beginning of each day.
Transfer agency fees are class-specific expenses and sub-transfer agency fees were class-specific expenses up through April 2, 2017. Effective April 3, 2017, the Funds ceased making direct payments to financial intermediaries for any applicable sub-transfer agency services. Payments to financial intermediaries for sub-transfer agency services are made by JPMorgan Distribution Services, Inc. from the Shareholder Servicing Fee, which has been renamed as the Service Fee.
The amount of the transfer agency fees and sub-transfer agency fees charged to each class of the Funds for the year ended June 30, 2017 are as follows (amounts in thousands):
| Class A | Class C | Class I | Class L | Class R2 | Class R3 | Class R4 | Class R5 | Class R6 | Total | |||||||||||||||||||||||||||||||
Dynamic Small Cap Growth Fund | ||||||||||||||||||||||||||||||||||||||||
Transfer agency fees | $ | 19 | $ | 2 | $ | 3 | n/a | n/a | n/a | n/a | n/a | n/a | $ | 24 | ||||||||||||||||||||||||||
Sub-transfer agency fees | 51 | 60 | 41 | n/a | n/a | n/a | n/a | n/a | n/a | 152 | ||||||||||||||||||||||||||||||
Small Cap Core Fund | ||||||||||||||||||||||||||||||||||||||||
Transfer agency fees | — | (a) | — | (a) | — | (a) | n/a | n/a | n/a | n/a | $ | 9 | $ | 3 | 12 | |||||||||||||||||||||||||
Sub-transfer agency fees | — | (a) | — | (a) | — | (a) | n/a | n/a | n/a | n/a | 123 | — | 123 | |||||||||||||||||||||||||||
Small Cap Equity Fund | ||||||||||||||||||||||||||||||||||||||||
Transfer agency fees | 61 | 8 | 57 | n/a | $ | 2 | $ | — | (a) | $ | — | (a) | 23 | 9 | 160 | |||||||||||||||||||||||||
Sub-transfer agency fees | 1,024 | 106 | 1,388 | n/a | 20 | — | — | 501 | — | 3,039 | ||||||||||||||||||||||||||||||
Small Cap Growth Fund | ||||||||||||||||||||||||||||||||||||||||
Transfer agency fees | 47 | 3 | 6 | $ | 5 | 1 | n/a | n/a | — | (a) | 5 | 67 | ||||||||||||||||||||||||||||
Sub-transfer agency fees | 218 | 14 | 115 | 191 | 40 | n/a | n/a | — | (a) | — | 578 | |||||||||||||||||||||||||||||
Small Cap Value Fund | ||||||||||||||||||||||||||||||||||||||||
Transfer agency fees | 326 | 6 | 11 | n/a | 43 | 1 | — | (a) | 5 | 18 | 410 | |||||||||||||||||||||||||||||
Sub-transfer agency fees | 689 | 38 | 312 | n/a | 89 | — | (a) | — | 68 | — | 1,196 | |||||||||||||||||||||||||||||
U.S. Small Company Fund | ||||||||||||||||||||||||||||||||||||||||
Transfer agency fees | 21 | 8 | 12 | 12 | 8 | — | (a) | — | (a) | — | (a) | 8 | 69 | |||||||||||||||||||||||||||
Sub-transfer agency fees | 325 | 57 | 264 | 410 | 84 | — | (a) | — | — | — | 1,140 | |||||||||||||||||||||||||||||
| (a) | Amount rounds to less than 500. |
E. Federal Income Taxes — Each Fund is treated as a separate taxable entity for Federal income tax purposes. Each Fund’s policy is to comply with the provisions of the Internal Revenue Code of 1986, as amended (the “Code”), applicable to regulated investment companies and to distribute to shareholders all of its distributable net investment income and net realized capital gains on investments. Accordingly, no provision for Federal income tax is necessary. Management has reviewed the Funds’ tax positions for all open tax years and has determined that as of June 30, 2017, no liability for income tax is required in the Funds’ financial statements for net unrecognized tax benefits. However, management’s conclusions may be subject to future review based on changes in, or the interpretation of, the accounting standards or tax laws and regulations. Each of the Funds’ Federal tax returns for the prior three fiscal years remains subject to examination by the Internal Revenue Service.
| JUNE 30, 2017 | J.P. MORGAN SMALL CAP FUNDS | 79 | ||||||
Table of Contents
NOTES TO FINANCIAL STATEMENTS
AS OF JUNE 30, 2017 (continued)
F. Distributions to Shareholders — Distributions from net investment income are generally declared and paid at least annually, except for Small Cap Value Fund, which are generally declared and paid quarterly. Distributions are declared separately for each class. No class has preferential dividend rights; differences in per share rates are due to differences in separate class expenses. Net realized capital gains, if any, are distributed by each Fund at least annually. The amount of distributions from net investment income and net realized capital gains is determined in accordance with Federal income tax regulations, which may differ from GAAP. To the extent these “book/tax” differences are permanent in nature (i.e., that they result from other than timing of recognition — “temporary differences”), such amounts are reclassified within the capital accounts based on their Federal tax-basis treatment.
The following amounts were reclassified within the capital accounts (amounts in thousands):
| Paid-in-Capital | Accumulated undistributed (distributions in excess of) net investment income | Accumulated net realized gains (losses) | ||||||||||
Dynamic Small Cap Growth Fund | $ | — | $ | 1,247 | $ | (1,247 | ) | |||||
Small Cap Core Fund | (98 | ) | 55 | 43 | ||||||||
Small Cap Equity Fund | 122 | (856 | ) | 734 | ||||||||
Small Cap Growth Fund | (4,360 | ) | 4,182 | 178 | ||||||||
Small Cap Value Fund | — | (886 | ) | 886 | ||||||||
U.S. Small Company Fund | — | (a) | (578 | ) | 578 | |||||||
| (a) | Amount rounds to less than 500. |
The reclassifications for the Funds relate primarily to net operating losses, tax equalization and investments in partnerships.
3. Fees and Other Transactions with Affiliates
A. Investment Advisory Fee — Pursuant to Investment Advisory Agreements, the Adviser supervises the investments of each Fund and for such services is paid a fee. The fee is accrued daily and paid monthly based on each Fund’s respective average daily net assets. The annual rate for each Fund is as follows:
Dynamic Small Cap Growth Fund | 0.65 | % | ||
Small Cap Core Fund | 0.65 | |||
Small Cap Equity Fund | 0.65 | |||
Small Cap Growth Fund | 0.65 | |||
Small Cap Value Fund | 0.65 | |||
U.S. Small Company Fund | 0.60 |
The Adviser waived Investment Advisory fees and/or reimbursed expenses as outlined in Note 3.F.
B. Administration Fee — Pursuant to Administration Agreements, the Administrator, provides certain administration services to the Funds. In consideration of these services, the Administrator receives a fee accrued daily and paid monthly at an annual rate of 0.15% of the first $25 billion of the average daily net assets of all funds in the J.P. Morgan Funds Complex covered by the Administration Agreement (excluding certain funds of funds and money market funds) and 0.075% of the average daily net assets in excess of $25 billion of all such funds. For the year ended June 30, 2017, the effective annualized rate was 0.08% of each Fund’s average daily net assets, notwithstanding any fee waivers and/or expense reimbursements.
The Administrator waived Administration fees as outlined in Note 3.F.
JPMorgan Chase Bank, N.A. (“JPMCB”), a wholly-owned subsidiary of JPMorgan, serves as the Funds’ sub-administrator (the “Sub-administrator”). For its services as Sub-administrator, JPMCB receives a portion of the fees payable to the Administrator.
C. Distribution Fees — Pursuant to a Distribution Agreement, JPMorgan Distribution Services, Inc. (the “JPMDS”), a wholly-owned subsidiary of JPMorgan, serves as the Trusts’ principal underwriter and promotes and arranges for the sale of each Fund’s shares.
The Board has adopted a Distribution Plan (the “Distribution Plan”) for Class A, Class C, Class R2 and Class R3 Shares of the Funds, as applicable, in accordance with Rule 12b-1 under the 1940 Act. Class L, Class R4, Class R5, Class R6 and Class I Shares do not charge a distribution fee. The Distribution Plan provides that each Fund shall pay distribution fees, including payments to the JPMDS, at annual rates of the average daily net assets as shown in the table below:
| Class A | Class C | Class R2 | Class R3 | |||||||||||||
Dynamic Small Cap Growth Fund | 0.25 | % | 0.75 | % | n/a | n/a | ||||||||||
Small Cap Core Fund | 0.25 | 0.75 | n/a | n/a | ||||||||||||
Small Cap Equity Fund | 0.25 | 0.75 | 0.50 | % | 0.25 | % | ||||||||||
Small Cap Growth Fund | 0.25 | 0.75 | 0.50 | n/a | ||||||||||||
Small Cap Value Fund | 0.25 | 0.75 | 0.50 | 0.25 | ||||||||||||
U.S. Small Company Fund | 0.25 | 0.75 | 0.50 | 0.25 | ||||||||||||
| 80 | J.P. MORGAN SMALL CAP FUNDS | JUNE 30, 2017 | ||||
Table of Contents
In addition, the JPMDS is entitled to receive the front-end sales charges from purchases of Class A Shares and the CDSC from redemptions of Class C Shares and certain Class A Shares for which front-end sales charges have been waived. For the year ended June 30, 2017, the JPMDS retained the following (amounts in thousands):
| Front-End Sales Charge | CDSC | |||||||
Dynamic Small Cap Growth Fund | $ | 1 | $ | — | ||||
Small Cap Core Fund | 2 | — | ||||||
Small Cap Equity Fund | 193 | 2 | ||||||
Small Cap Growth Fund | 49 | — | (a) | |||||
Small Cap Value Fund | 32 | — | (a) | |||||
U.S. Small Company Fund | 28 | 1 | ||||||
| (a) | Amount rounds to less than 500. |
D. Service Fees — The Trusts, on behalf of the Funds, have entered into a Shareholder Servicing Agreement with the JPMDS under which the JPMDS provides certain support services to the shareholders. The Class R6 Shares do not charge a service fee. For performing these services, the JPMDS receives a fee that is accrued daily and paid monthly equal to a percentage of the average daily net assets as shown in the table below:
| Class A | Class C | Class I | Class L | Class R2 | Class R3 | Class R4 | Class R5 | |||||||||||||||||||||||||
Dynamic Small Cap Growth Fund | 0.25 | % | 0.25 | % | 0.25 | % | n/a | n/a | n/a | n/a | n/a | |||||||||||||||||||||
Small Cap Core Fund | 0.25 | 0.25 | 0.25 | n/a | n/a | n/a | n/a | 0.10 | %* | |||||||||||||||||||||||
Small Cap Equity Fund | 0.25 | 0.25 | 0.25 | n/a | 0.25 | % | 0.25 | % | 0.25 | % | 0.10 | ** | ||||||||||||||||||||
Small Cap Growth Fund | 0.25 | 0.25 | 0.25 | 0.10 | % | 0.25 | n/a | n/a | 0.10 | ** | ||||||||||||||||||||||
Small Cap Value Fund | 0.25 | 0.25 | 0.25 | n/a | 0.25 | 0.25 | 0.25 | 0.10 | ** | |||||||||||||||||||||||
U.S. Small Company Fund | 0.25 | 0.25 | 0.25 | 0.10 | 0.25 | 0.25 | 0.25 | 0.10 | ** | |||||||||||||||||||||||
| * | Prior to April 3, 2017, the service fee for Class R5 Shares was 0.05% and prior to September 16, 2016, the service fee for Class R5 Shares was 0.25%. |
| ** | Prior to April 3, 2017, the service fee for Class R5 Shares was 0.05%. |
The JPMDS has entered into shareholder services contracts with affiliated and unaffiliated financial intermediaries who provide shareholder services and other related services to their clients or customers who invest in the Funds under which the JPMDS will pay all or a portion of such fees earned to financial intermediaries for performing such services.
The JPMDS waived service fees as outlined in Note 3.F.
E. Custodian and Accounting Fees — JPMCB provides portfolio custody and accounting services to the Funds. For performing these services, the Funds pay JPMCB transaction and asset-based fees that vary according to the number of transactions and positions, plus out-of-pocket expenses. The amounts paid directly to JPMCB by the Funds for custody and accounting services are included in Custodian and accounting fees on the Statements of Operations. Payments to the custodian may be reduced by credits earned by each Fund, based on uninvested cash balances held by the custodian. Such earnings credits, if any, are presented separately on the Statements of Operations.
Interest expense paid to the custodian related to cash overdrafts, if any, is included in Interest expense to affiliates on the Statements of Operations.
F. Waivers and Reimbursements — The Adviser, Administrator and/or JPMDS have contractually agreed to waive fees and/or reimburse the Funds to the extent that total annual operating expenses (excluding acquired fund fees and expenses other than certain money market fund fees as described below, dividend and interest expenses related to short sales, interest, taxes, expenses related to litigation and potential litigation and extraordinary expenses) exceed the percentages of the Funds’ respective average daily net assets as shown in the table below:
| Class A | Class C | Class I | Class L | Class R2 | Class R3 | Class R4 | Class R5 | Class R6 | ||||||||||||||||||||||||||||
Dynamic Small Cap Growth Fund | 1.25 | % | 1.75 | % | 1.00 | % | n/a | n/a | n/a | n/a | n/a | n/a | ||||||||||||||||||||||||
Small Cap Core Fund | 1.25 | 1.75 | 1.00 | n/a | n/a | n/a | n/a | 0.80 | % | 0.75 | % | |||||||||||||||||||||||||
Small Cap Equity Fund | 1.30 | 1.80 | 1.00 | n/a | 1.55 | % | 1.25 | % | 1.00 | % | 0.80 | 0.75 | ||||||||||||||||||||||||
Small Cap Growth Fund | 1.25 | 1.75 | 1.00 | 0.85 | % | 1.50 | n/a | n/a | 0.85 | 0.75 | ||||||||||||||||||||||||||
Small Cap Value Fund | 1.25 | 1.86 | 1.00 | n/a | 1.61 | * | 1.36 | 1.11 | 0.91 | 0.86 | ||||||||||||||||||||||||||
U.S. Small Company Fund | 1.26 | 1.76 | 1.01 | 0.83 | 1.51 | 1.26 | 1.01 | 0.86 | 0.76 | |||||||||||||||||||||||||||
| * | For Class R2 Shares of Small Cap Value Fund, the Adviser, Administrator and/or JPMDS contractually waived fees and/or reimbursed the Fund to the extent that total annual operating expenses (excluding acquired fund fees and expenses other than certain money market fund fees as described below, dividend and interest expenses related to short sales, interest, taxes, expenses related to litigation and potential litigation and extraordinary expenses) exceeded 1.50% of the Fund’s average daily net assets during the period July 1, 2016 through October 31, 2016. The contractual expense percentage in the table above is in place from November 1, 2016 until at least October 31, 2018. During the period November 1, 2016 through June 30, 2017, the Adviser, Administrator and/or JPMDS voluntarily waived fees and/or reimbursed the Fund to the extent that total annual operating expenses for Class R2 Shares exceeded 1.50%. The Fund’s service providers are under no obligation to continue the voluntary waivers and may discontinue them at any time. |
| JUNE 30, 2017 | J.P. MORGAN SMALL CAP FUNDS | 81 | ||||||
Table of Contents
NOTES TO FINANCIAL STATEMENTS
AS OF JUNE 30, 2017 (continued)
Except as noted above, the expense limitation agreements were in effect for the year ended June 30, 2017. The contractual expense limitation percentages in the table above are in place until at least October 31, 2018 for Class R5 Shares of Small Cap Core Fund. For all other classes, the contractual expense limitation percentages in the table above are in place until at least October 31, 2017.
For the year ended June 30, 2017, the Funds’ service providers waived fees and/or reimbursed expenses for each of the Funds as follows (amounts in thousands). None of these parties expect the Funds to repay any such waived fees and reimbursed expenses in future years.
| Contractual Waivers | ||||||||||||||||||||
| Investment Advisory Fees | Administration Fees | Service Fees | Total | Contractual Reimbursements | ||||||||||||||||
Dynamic Small Cap Growth Fund | $ | 187 | $ | 98 | $ | 71 | $ | 356 | $ | — | ||||||||||
Small Cap Core Fund | 282 | 146 | 132 | 560 | 34 | |||||||||||||||
Small Cap Equity Fund | 279 | 186 | 2,623 | 3,088 | 60 | |||||||||||||||
Small Cap Growth Fund | 96 | 63 | 622 | 781 | 19 | |||||||||||||||
Small Cap Value Fund | 2 | — | 1,539 | 1,541 | 22 | |||||||||||||||
U.S. Small Company Fund | — | — | 813 | 813 | 9 | |||||||||||||||
Additionally, the Funds may invest in one or more money market funds advised by the Adviser or its affiliates (affiliated money market funds). The Adviser, Administrator and/or JPMDS, as shareholder servicing agent, have contractually agreed to waive fees and/or reimburse expenses in an amount sufficient to offset the respective net fees each collects from the affiliated money market fund on the applicable Funds’ investment in such affiliated money market fund.
The amount of waivers resulting from investments in these money market funds for the year ended June 30, 2017 was as follows (amounts in thousands):
Dynamic Small Cap Growth Fund | $ | 4 | ||
Small Cap Core Fund | 9 | |||
Small Cap Equity Fund | 420 | |||
Small Cap Growth Fund | 34 | |||
Small Cap Value Fund | 95 | |||
U.S. Small Company Fund | 95 |
G. Other — Certain officers of the Trusts are affiliated with the Adviser, the Administrator and the JPMDS. Such officers, with the exception of the Chief Compliance Officer, receive no compensation from the Funds for serving in their respective roles.
The Board appointed a Chief Compliance Officer to the Funds in accordance with Federal securities regulations. Each Fund, along with other affiliated funds, makes reimbursement payments, on a pro-rata basis, to the Administrator for a portion of the fees associated with the Office of the Chief Compliance Officer. Such fees are included in Trustees’ and Chief Compliance Officer’s fees on the Statements of Operations.
The Trusts adopted a Trustee Deferred Compensation Plan (the “Plan”) which allows the Independent Trustees to defer the receipt of all or a portion of compensation related to performance of their duties as Trustees. The deferred fees are invested in various J.P. Morgan Funds until distribution in accordance with the Plan.
During the year ended June 30, 2017, the Funds purchased securities from an underwriting syndicate in which the principal underwriter or members of the syndicate were affiliated with the Adviser.
The Funds may use related party broker-dealers. For the year ended June 30, 2017, the Funds incurred brokerage commissions with broker-dealers affiliated with the Adviser as follows (amounts in thousands):
Small Cap Core Fund | $ | — | (a) | |
Small Cap Equity Fund | — | (a) | ||
Small Cap Value Fund | 4 | |||
Small Cap Growth Fund | 4 |
| (a) | Amount rounds to less than 500. |
The Securities and Exchange Commission (“SEC”) has granted an exemptive order permitting the Funds to engage in principal transactions with J.P. Morgan Securities, Inc., an affiliated broker, involving taxable money market instruments, subject to certain conditions.
| 82 | J.P. MORGAN SMALL CAP FUNDS | JUNE 30, 2017 | ||||
Table of Contents
4. Investment Transactions
During the year ended June 30, 2017, purchases and sales of investments (excluding short-term investments and transfers in-kind) were as follows (amounts in thousands):
Purchases (excluding U.S. | Sales (excluding U.S. | |||||||
Dynamic Small Cap Growth Fund | $ | 65,023 | $ | 97,943 | ||||
Small Cap Core Fund | 117,956 | 112,369 | ||||||
Small Cap Equity Fund | 2,913,675 | 1,065,686 | ||||||
Small Cap Growth Fund | 477,756 | 539,792 | ||||||
Small Cap Value Fund | 808,555 | 781,766 | ||||||
U.S. Small Company Fund | 956,143 | 834,696 | ||||||
During the year ended June 30, 2017, there were no purchases or sales of U.S. Government securities.
5. Federal Income Tax Matters
For Federal income tax purposes, the estimated cost and unrealized appreciation (depreciation) in value of investment securities held at June 30, 2017 were as follows (amounts in thousands):
Aggregate Cost | Gross Unrealized Appreciation | Gross Unrealized Depreciation | Net Unrealized Appreciation (Depreciation) | |||||||||||||
Dynamic Small Cap Growth Fund | $ | 109,320 | $ | 63,215 | $ | 2,623 | $ | 60,592 | ||||||||
Small Cap Core Fund | 161,745 | 59,346 | 6,446 | 52,900 | ||||||||||||
Small Cap Equity Fund | 4,812,452 | 1,613,934 | 120,407 | 1,493,527 | ||||||||||||
Small Cap Growth Fund | 918,935 | 452,658 | 25,881 | 426,777 | ||||||||||||
Small Cap Value Fund | 1,691,077 | 526,787 | 111,624 | 415,163 | ||||||||||||
U.S. Small Company Fund | 1,510,716 | 330,935 | 94,076 | 236,859 | ||||||||||||
The difference between book and tax basis appreciation (depreciation) on investments is primarily attributed to wash sale loss deferrals and non-taxable dividends.
The tax character of distributions paid during the year ended June 30, 2017 was as follows (amounts in thousands):
Ordinary Income* | Net Long-Term Capital Gains | Total Distribution Paid | ||||||||||
Dynamic Small Cap Growth Fund | $ | 127 | $ | 23,121 | $ | 23,248 | ||||||
Small Cap Core Fund | 599 | 17,778 | 18,377 | |||||||||
Small Cap Equity Fund | 22,582 | 132,624 | 155,206 | |||||||||
Small Cap Growth Fund | — | 36,600 | 36,600 | |||||||||
Small Cap Value Fund | 12,657 | 828 | 13,485 | |||||||||
U.S. Small Company Fund | 6,050 | — | 6,050 | |||||||||
| * | Short-term gains are treated as ordinary income for income tax purposes. |
The tax character of distributions paid during the year ended June 30, 2016 was as follows (amounts in thousands):
| Ordinary Income* | Net Long-Term | Total Distributions Paid | ||||||||||
Dynamic Small Cap Growth Fund | $ | — | $ | 55,844 | $ | 55,844 | ||||||
Small Cap Core Fund | 16,109 | 58,576 | 74,685 | |||||||||
Small Cap Equity Fund | 37,477 | 167,869 | 205,346 | |||||||||
Small Cap Growth Fund | — | 84,696 | 84,696 | |||||||||
Small Cap Value Fund | 15,467 | 76,796 | 92,263 | |||||||||
U.S. Small Company Fund | 16,789 | 31,957 | 48,746 | |||||||||
| * | Short-term gains are treated as ordinary income for income tax purposes. |
| JUNE 30, 2017 | J.P. MORGAN SMALL CAP FUNDS | 83 | ||||||
Table of Contents
NOTES TO FINANCIAL STATEMENTS
AS OF JUNE 30, 2017 (continued)
As of June 30, 2017, the estimated components of net assets (excluding paid-in-capital) on a tax basis were as follows (amounts in thousands):
Current Distributable Ordinary Income | Current Distributable Long-Term Capital Gain or | Unrealized Appreciation (Depreciation) | ||||||||||
Dynamic Small Cap Growth Fund | $ | 1,335 | $ | 9,658 | $ | 60,592 | ||||||
Small Cap Core Fund | 1,313 | 14,076 | 52,900 | |||||||||
Small Cap Equity Fund | 72,306 | 193,737 | 1,493,527 | |||||||||
Small Cap Growth Fund | — | 40,759 | 426,777 | |||||||||
Small Cap Value Fund | 2,894 | 75,976 | 415,163 | |||||||||
U.S. Small Company Fund | 837 | 61,292 | 236,859 | |||||||||
For the Funds, the cumulative timing differences primarily consist of late year ordinary loss deferrals, wash sale loss deferrals and non-taxable dividends.
At June 30, 2017, the Funds did not have any capital loss carryforwards.
Late year ordinary losses incurred after December 31 and net capital losses incurred after October 31 and within the taxable year are deemed to arise on the first business day of the Funds’ next taxable year. For the year ended June 30, 2017, the following Funds deferred to July 1, 2017 late year ordinary losses of (amounts in thousands):
| Late Year Ordinary Loss | ||||
Dynamic Small Cap Growth Fund | $ | 647 | ||
Small Cap Growth Fund | 2,706 | |||
6. Borrowings
The Funds rely upon an exemptive order granted by the SEC (the “Order”) permitting the establishment and operation of an Interfund Lending Facility (the “Facility”). The Facility allows the Funds to directly lend and borrow money to or from any other fund relying upon the Order at rates beneficial to both the borrowing and lending funds. Advances under the Facility are taken primarily for temporary or emergency purposes, including the meeting of redemption requests that otherwise might require the untimely disposition of securities, and are subject to each Fund’s borrowing restrictions. The Interfund loan rate is determined, as specified in the Order, by averaging the current repurchase agreement rate and the current bank loan rate. The Order was granted to JPM II and may be relied upon by the Funds because the Funds and the series of JPM II are all investment companies in the same “group of investment companies” (as defined in Section 12(d)(1)(G) of the 1940 Act).
The Trusts and JPMCB have entered into a financing arrangement. Under this arrangement, JPMCB provides an unsecured, uncommitted credit facility in the aggregate amount of $100 million to certain of the J.P. Morgan Funds, including the Funds. Advances under the arrangement are taken primarily for temporary or emergency purposes, including the meeting of redemption requests that otherwise might require the untimely disposition of securities, and are subject to each Fund’s borrowing restrictions. Interest on borrowings is payable at a rate determined by JPMCB at the time of borrowing. This agreement has been extended until November 6, 2017.
The Funds had no borrowings outstanding from another fund or from the unsecured, uncommitted credit facility during the year ended June 30, 2017.
In addition, effective August 16, 2016, the Trust along with certain other trusts (“Borrowers”) entered into a joint syndicated senior unsecured revolving credit facility totaling $1.5 billion (“Credit Facility”) with various lenders and The Bank of New York Mellon, as administrative agent for the lenders. This Credit Facility provides a source of funds to the Borrowers for temporary and emergency purposes, including the meeting of redemption requests that otherwise might require the untimely disposition of securities. Under the terms of the Credit Facility, a borrowing fund must have a minimum of $25,000,000 in adjusted net asset value and not exceed certain adjusted net asset coverage ratios prior to and during the time in which any borrowings are outstanding. If a fund does not comply with the aforementioned requirements, the fund must remediate within three business days with respect to the $25,000,000 minimum adjusted net asset value or within one business day with respect to certain asset coverage ratios or the administrative agent at the request of, or with the consent of, the lenders may terminate the Credit Facility and declare any outstanding borrowings to be due and payable immediately.
Interest associated with any borrowing under the Credit Facility is charged to the borrowing fund at a rate of interest equal to 1.00% plus the greater of the federal funds effective annualized rate or one month LIBOR. The annual commitment fee to maintain the Credit Facility is 0.15% and is incurred on the unused portion of the Credit Facility and is allocated to all participating funds pro rata based on their respective net assets. Effective August 15, 2017, this agreement has been amended and restated for a term of 364 days, unless extended.
| 84 | J.P. MORGAN SMALL CAP FUNDS | JUNE 30, 2017 | ||||
Table of Contents
The Funds had no borrowings outstanding from Credit Facility at June 30, 2017. Average borrowings from the Credit Facility for, or at any time during the year ended June 30, 2017, were as follows (amounts in thousands):
| Average Borrowings | Average Interest Rate Paid | Number of Days Outstanding | Interest Paid | |||||||||||||
Small Cap Equity Fund | $ | 500 | 1.53 | % | 1 | $ | — | (a) | ||||||||
| (a) | Amount rounds to less than 500. |
7. Redemptions In-Kind
During the year ended June 30, 2016, certain shareholders sold their shares of Small Cap Core Fund and Small Cap Equity Fund. The portfolio securities were delivered primarily by means of a redemption in-kind in exchange for shares of the Fund. Cash and portfolio securities were transferred as of the close of business on the date and at the market value listed below (amounts in thousands):
| December 18, 2015 | Value | Realized Gains (Losses) | Type | |||||||||
Small Cap Core Fund — Class R5* | $ | 530,784 | ** | $ | 35,980 | Redemption in-kind | ||||||
| March 18, 2016 | Value | Realized Gains (Losses) | Type | |||||||||
Small Cap Equity Fund — Class A | $ | 545,339 | *** | 235,174 | Redemption in-kind | |||||||
| * | Effective September 15, 2016, Class I was renamed Class R5 for Small Cap Core Fund. |
| ** | This amount includes cash of approximately $16,676,000 associated with the redemptions in-kind. |
| *** | This amount includes cash of approximately $26,463,000 associated with the redemptions in-kind. |
8. Risks, Concentrations and Indemnifications
In the normal course of business, the Funds enter into contracts that contain a variety of representations which provide general indemnifications. Each Fund’s maximum exposure under these arrangements is unknown. The amount of exposure would depend on future claims that may be made against each Fund that have not yet occurred. However, based on experience, the Funds expect the risk of loss to be remote.
As of June 30, 2017, the Funds had omnibus accounts which owned more than 10% of the Funds outstanding shares as follows:
| Number of Non-Affiliated Omnibus Accounts | % of the Fund | |||||||
Dynamic Small Cap Growth Fund | 3 | 57.5 | % | |||||
Small Cap Core Fund | 2 | 29.1 | ||||||
Small Cap Equity Fund | 3 | 12.2 | ||||||
U.S. Small Company Fund | 6 | 29.2 | ||||||
As of June 30, 2017, the JPMorgan SmartRetirement Funds, which are affiliated funds of funds, owned in the aggregate, shares representing more than 10% of the net assets of the following Funds:
JPMorgan SmartRetirement Funds | ||||
Small Cap Growth Fund | 29.8 | % | ||
Small Cap Value Fund | 17.6 | |||
Significant shareholder transactions by these shareholders may impact the Funds’ performance.
Because the Funds may invest a significant portion of their assets in REITs, the Funds may be subject to certain risks similar to those associated with direct investments in real estate. REITs may be affected by changes in the value of their underlying properties and by defaults by tenants. REITs depend generally on their ability to generate cash flow to make distributions to shareholders, and certain REITs have self-liquidation provisions by which mortgages held may be paid in full and distributions of capital returns may be made at any time.
Derivatives may be riskier than other types of investments because they may be more sensitive to changes in economic and market conditions and could result in losses that significantly exceed the Funds’ original investment. Derivatives also expose the Funds to counterparty risk (the risk that the derivative counterparty will not fulfill its contractual obligations), including credit risk of the derivative counterparty.
9. Investment Company Reporting Modernization
In October 2016, the U.S. Securities and Exchange Commission adopted new rules and forms, and amendments to certain current rules and forms, to modernize the reporting and disclosure of information by registered investment companies. In part, the final rules amend Regulation S-X and will require standardized, enhanced disclosures about derivatives in investment company financial statements, as well as other amendments. The
amendments to Regulation S-X will apply to Funds’ fiscal year ends on or after August 1, 2017. At this time, management is currently evaluating the impact of the Regulation S-X amendments on the Funds’ financial statements and related disclosures. The adoption will have no effect on the Funds’ net assets or results of operations.
| JUNE 30, 2017 | J.P. MORGAN SMALL CAP FUNDS | 85 | ||||||
Table of Contents
REPORT OF INDEPENDENT REGISTERED PUBLIC ACCOUNTING FIRM
To the Board of Trustees of JPMorgan Trust I and JPMorgan Trust II and the Shareholders of JPMorgan Dynamic Small Cap Growth Fund, JPMorgan Small Cap Core Fund, JPMorgan Small Cap Equity Fund, JPMorgan Small Cap Growth Fund, JPMorgan Small Cap Value Fund and JPMorgan U.S. Small Company Fund
In our opinion, the accompanying statements of assets and liabilities, including the schedules of portfolio investments, and the related statements of operations and of changes in net assets and the financial highlights present fairly, in all material respects, the financial position of JPMorgan Dynamic Small Cap Growth Fund, JPMorgan Small Cap Core Fund, JPMorgan Small Cap Equity Fund and JPMorgan U.S. Small Company Fund (each a separate series of JPMorgan Trust I) and JPMorgan Small Cap Growth Fund and JPMorgan Small Cap Value Fund (each a separate series of JPMorgan Trust II) (hereafter collectively referred to as the “Funds”) as of June 30, 2017, the results of each of their operations for the year then ended, the changes in each of their net assets for each of the two years in the period then ended and the financial highlights for each of the periods indicated therein, in conformity with accounting principles generally accepted in the United States of America. These financial statements and financial highlights (hereafter referred to as “financial statements”) are the responsibility of the Funds’ management. Our responsibility is to express an opinion on these financial statements based on our audits. We conducted our audits of these financial statements in accordance with the standards of the Public Company Accounting Oversight Board (United States). Those standards require that we plan and perform the audit to obtain reasonable assurance about whether the financial statements are free of material misstatement. An audit includes examining, on a test basis, evidence supporting the amounts and disclosures in the financial statements, assessing the accounting principles used and significant estimates made by management, and evaluating the overall financial statement presentation. We believe that our audits, which included confirmation of securities as of June 30, 2017 by correspondence with the transfer agent, custodian and brokers, provide a reasonable basis for our opinions.
PricewaterhouseCoopers LLP
New York, New York
August 25, 2017
| 86 | J.P. MORGAN SMALL CAP FUNDS | JUNE 30, 2017 | ||||
Table of Contents
(Unaudited)
The Funds’ Statement of Additional Information includes additional information about the Funds’ Trustees and is available, without charge, upon request by calling 1-800-480-4111 or on the J.P. Morgan Funds’ website at www.jpmorganfunds.com.
Name (Year of Birth); Positions With the Funds (1) | Principal Occupations During Past 5 Years | Number of Portfolios in Fund Complex Overseen by Trustee (2) | Other Directorships Held Outside Fund Complex During Past 5 Years | |||
Independent Trustees | ||||||
| John F. Finn (1947); Trustee of Trusts since 2005; Trustee of heritage One Group Mutual Funds since 1998. | Chairman (1985-present), Chief Executive Officer, Gardner, Inc. (supply chain management company serving industrial and consumer markets) (1974-present). | 150 | Director, Greif, Inc. (GEF) (industrial package products and services) (2007-present); Trustee, Columbus Association for the Performing Arts (1988-present); Director, Cardinal Health, Inc. (CAH) (1994-2014). | |||
| Dr. Matthew Goldstein (1941); Chairman since 2013; Trustee of Trusts since 2005; Trustee of heritage J.P. Morgan Funds since 2003. | Chancellor Emeritus, City University of New York (2015-present); Professor, City University of New York (2013-present); Chancellor, City University of New York (1999-2013); President, Adelphi University (New York) (1998-1999). | 150 | Trustee, Museum of Jewish Heritage (2011-present); Trustee, National Museum of Mathematics (present); Chair, Association of College and University Administrators (present). | |||
| Dennis P. Harrington (1950); Trustee of Trusts since 2017. | Retired; Partner, Deloitte LLP (1984-2012). | 149 | None | |||
| Frankie D. Hughes (1952); Trustee of Trusts since 2008. | President, Ashland Hughes Properties (property management) (2014-present); President and Chief Investment Officer, Hughes Capital Management, Inc. (fixed income asset management) (1993-2014). | 150 | None | |||
Raymond Kanner (1953); Trustee of the Trusts since 2017. | Retired; Managing Director & Chief Investment Officer, IBM Retirement Funds (2007-2016). | 149 | Director, Emerging Markets Growth Fund (1997-2016); Acting Executive Director, Committee on Investment of Employee Benefit Assets (CIEBA), 2016-17; Advisory Board Member, Betterment for Business (2016-present) (robo advisor); Advisory Board Member, Blue Star Indexes (2013-present) (index creator); Member, Russell Index Client Advisory Board (2001-2015). | |||
| Peter C. Marshall (1942); Trustee of Trusts since 2005; Trustee of heritage One Group Mutual Funds since 1985. | Self-employed business consultant (2002-present). | 150 | None | |||
| Mary E. Martinez (1960); Trustee of Trusts since 2013. | Associate, Special Properties, a Christie’s International Real Estate Affiliate (2010-present); Managing Director, Bank of America (Asset Management) (2007-2008); Chief Operating Officer, U.S. Trust Asset Management, U.S. Trust Company (asset management) (2003-2007); President, Excelsior Funds (registered investment companies) (2004-2005). | 150 | None | |||
| Marilyn McCoy* (1948); Trustee of Trusts since 2005; Trustee of heritage One Group Mutual Funds since 1999. | Vice President of Administration and Planning, Northwestern University (1985-present). | 150 | None | |||
| JUNE 30, 2017 | J.P. MORGAN SMALL CAP FUNDS | 87 | ||||||
Table of Contents
TRUSTEES
(Unaudited) (continued)
Name (Year of Birth); Positions With the Funds (1) | Principal Occupations During Past 5 Years | Number of Portfolios in Fund Complex Overseen by Trustee (2) | Other Directorships Held Outside Fund Complex During Past 5 Years | |||
Independent Trustees (continued) | ||||||
| Mitchell M. Merin (1953); Trustee of Trusts since 2013. | Retired; President and Chief Operating Officer, Morgan Stanley Investment Management, Member Morgan Stanley & Co. Management Committee (registered investment adviser) (1985-2005). | 150 | Director, Sun Life Financial (SLF) (2007-2013) (financial services and insurance). | |||
| Dr. Robert A. Oden, Jr. (1946); Trustee of Trusts since 2005; Trustee of heritage One Group Mutual Funds since 1997. | Retired; President, Carleton College (2002-2010); President, Kenyon College (1995-2002). | 150 | Chairman, Dartmouth-Hitchcock Medical Center (2011-present); Trustee, American Schools of Oriental Research (2011-present); Trustee, American University in Cairo (1999-2014); Trustee, American Museum of Fly Fishing (2013-present). | |||
| Marian U. Pardo** (1946); Trustee of Trusts since 2013. | Managing Director and Founder, Virtual Capital Management LLC (Investment Consulting) (2007-present); Managing Director, Credit Suisse Asset Management (portfolio manager) (2003-2006). | 150 | Member, Board of Governors, Columbus Citizens Foundation (not-for-profit supporting philanthropic and cultural programs) (2006-present). | |||
| Frederick W. Ruebeck (1939); Trustee of Trusts since 2005; Trustee of heritage One Group Mutual Funds since 1994. | Consultant (2000-present); Advisor, JP Greene & Associates, LLC (broker-dealer) (2000-2009); Chief Investment Officer, Wabash College (2004-2015); Director of Investments, Eli Lilly and Company (pharmaceuticals) (1988-1999). | 150 | Trustee, Wabash College | |||
| James J. Schonbachler (1943); Trustee of Trusts since 2005; Trustee of heritage J.P. Morgan Funds since 2001. | Retired; Managing Director of Bankers Trust Company (financial services) (1968-1998). | 150 | None | |||
| (1) | The Trustees serve for an indefinite term, subject to the Trusts’ current retirement policy, which is age 78 for all Trustees. |
| (2) | A Fund Complex means two or more registered investment companies that hold themselves out to investors as related companies for purposes of investment and investor services or have a common investment adviser or have an investment adviser that is an affiliated person of the investment adviser of any of the other registered investment companies. The J.P. Morgan Funds Complex for which the Board of Trustees serves currently includes twelve registered investment companies (150 funds). |
| * | Two members of the Board of Trustees of Northwestern University are executive officers of registered investment advisers (not affiliated with JPMorgan) that are under common control with sub-advisers to certain J.P. Morgan Funds. |
| ** | In connection with prior employment with JPMorgan Chase, Ms. Pardo was the recipient of non-qualified pension plan payments from JPMorgan Chase in the amount of approximately $2,055 per month, which she irrevocably waived effective January 1, 2013, and deferred compensation payments from JPMorgan Chase in the amount of approximately $7,294 per year, which ended in January 2013. In addition, Ms. Pardo receives payments from a fully-funded qualified plan, which is not an obligation of JPMorgan Chase. |
The contact address for each of the Trustees is 270 Park Avenue, New York, NY 10017.
| 88 | J.P. MORGAN SMALL CAP FUNDS | JUNE 30, 2017 | ||||
Table of Contents
(Unaudited)
Name (Year of Birth), Positions Held with the Trusts (Since) | Principal Occupations During Past 5 Years | |
| Brian S. Shlissel (1964), President and Principal Executive Officer (2016) | Managing Director and Chief Administrative Officer for J.P. Morgan pooled vehicles, J.P. Morgan Investment Management Inc. (formerly JPMorgan Funds Management, Inc.) (2014 – present); Managing Director and Head of Mutual Fund Services, Allianz Global Investors; President and Chief Executive Officer, Allianz Global Investors Mutual Funds and PIMCO Closed-End Funds (1999-2014) | |
| Laura M. Del Prato (1964), Treasurer and Principal Financial Officer (2014)* | Managing Director, J.P. Morgan Investment Management Inc. (formerly JPMorgan Funds Management, Inc.) since 2014; Partner, Cohen Fund Audit Services, Ltd. (2012-2013); Partner (2004-2012) and various other titles (1990-2004) at KPMG, LLP. | |
| Frank J. Nasta (1964), Secretary (2008) | Managing Director and Associate General Counsel, JPMorgan Chase since 2008. | |
| Stephen M. Ungerman (1953), Chief Compliance Officer (2005) | Managing Director, JPMorgan Chase & Co.; Mr. Ungerman has been with JPMorgan Chase & Co. since 2000. | |
Elizabeth A. Davin (1964), Assistant Secretary (2005)* | Executive Director and Assistant General Counsel, JPMorgan Chase since February 2012; formerly Vice President and Assistant General Counsel, JPMorgan Chase from 2005 to February 2012; Senior Counsel, JPMorgan Chase (formerly Bank One Corporation) from 2004 to 2005. | |
| Jessica K. Ditullio (1962), Assistant Secretary (2005)* | Executive Director and Assistant General Counsel, JPMorgan Chase. Ms. Ditullio has been with JPMorgan Chase (formerly Bank One Corporation) since 1990. | |
| John T. Fitzgerald (1975), Assistant Secretary (2008) | Executive Director and Assistant General Counsel, JPMorgan Chase. Mr. Fitzgerald has been with JPMorgan Chase since 2005. | |
| Carmine Lekstutis (1980), Assistant Secretary (2011) | Executive Director and Assistant General Counsel, JPMorgan Chase since February 2015; formerly Vice President and Assistant General Counsel, JPMorgan Chase from 2011 to February 2015. | |
| Gregory S. Samuels (1980), Assistant Secretary (2010) | Executive Director and Assistant General Counsel, JPMorgan Chase since 2014; formerly Vice President and Assistant General Counsel, JPMorgan Chase since 2010. | |
| Pamela L. Woodley (1971), Assistant Secretary (2012)** | Vice President and Assistant General Counsel, JPMorgan Chase since November 2004. | |
Zachary E. Vonnegut-Gabovitch (1986) Assistant Secretary (2017) | Vice President and Assistant General Counsel, JPMorgan Chase since September 2016; Associate, Morgan, Lewis & Bockius (law firm) from 2012 to 2016. | |
Michael M. D’Ambrosio (1969), Assistant Treasurer (2012) | Managing Director, J.P. Morgan Investment Management Inc. (formerly JPMorgan Funds Management, Inc.) since May 2014; formerly Executive Director, JPMorgan Funds Management, Inc. from 2012 to May 2014; prior to joining JPMorgan Chase, Mr. D’Ambrosio was a Tax Director at PricewaterhouseCoopers LLP since 2006. | |
Lauren A. Paino (1973), Assistant Treasurer (2014)** | Executive Director, J.P. Morgan Investment Management Inc. (formerly JPMorgan Funds Management, Inc.) since August 2013; formerly Director, Credit Suisse Asset Management from 2000-2013. | |
| Joseph Parascondola (1963), Assistant Treasurer (2011)** | Vice President, J.P. Morgan Investment Management Inc. (formerly JPMorgan Funds Management, Inc.) since August 2006. | |
| Matthew J. Plastina (1970), Assistant Treasurer (2011)** | Executive Director, J.P. Morgan Investment Management Inc. (formerly JPMorgan Funds Management, Inc.) since February 2016; Vice President, JPMorgan Funds Management, Inc. from 2010 to January 2016. | |
Gillian I. Sands (1969), Assistant Treasurer (2012)** | Vice President, J.P. Morgan Investment Management Inc. (formerly JPMorgan Funds Management, Inc.) since September 2012; Assistant Treasurer, Wells Fargo Funds Management (2007-2009). | |
The contact address for each of the officers, unless otherwise noted, is 270 Park Avenue, New York, NY 10017.
| * | The contact address for the officer is 1111 Polaris Parkway, Columbus, OH 43240. |
| ** | The contact address for the officer is 4 New York Plaza, New York, NY 10004. |
| JUNE 30, 2017 | J.P. MORGAN SMALL CAP FUNDS | 89 | ||||||
Table of Contents
SCHEDULE OF SHAREHOLDER EXPENSES
(Unaudited)
Hypothetical $1,000 Investment
As a shareholder of the Funds, you incur two types of costs: (1) transaction costs, including sales charges (loads) on purchase payments and (2) ongoing costs, including investment advisory fees, administration fees, distribution fees and other Fund expenses. The examples below are intended to help you understand your ongoing costs (in dollars) of investing in the Funds and to compare these ongoing costs with the ongoing costs of investing in other mutual funds. The examples assume that you had a $1,000 investment in each Class at the beginning of the reporting period, January 1, 2017, and continued to hold your shares at the end of the reporting period, June 30, 2017.
Actual Expenses
For each Class of each Fund in the table below, the first line provides information about actual account values and actual expenses. You may use the information in this line, together with the amount you invested, to estimate the expenses that you paid over the period. Simply divide your account value by $1,000 (for example, an $8,600 account value divided by $1,000 = 8.6), then multiply the result by the number in the first line of each Class under the heading entitled “Expenses Paid During the period” to estimate the expenses you paid on your account during this period.
Hypothetical Example for Comparison Purposes
The second line of each Class in the table below provides information about hypothetical account values and hypothetical expenses based on the Class’ actual expense ratio and an assumed rate of return of 5% per year before expenses, which is not the Class’ actual return. The hypothetical account values and expenses may not be used to estimate the actual ending account balance or expenses you paid for the period. You may use this information to compare the ongoing costs of investing in the Class of the Funds and other funds. To do so, compare this 5% hypothetical example with the 5% hypothetical examples that appear in the shareholder reports of the other funds. Please note that the expenses shown in the table are meant to highlight your ongoing costs only and do not reflect any transaction costs, such as sales charges (loads) or redemption fees. Therefore, the second line for each Class in the table is useful in comparing ongoing costs only, and will not help you determine the relative total costs of owning different funds. In addition, if these transaction costs were included, your costs would have been higher. The examples also assume all dividends and distributions have been reinvested.
Beginning Account Value January 1, 2017 | Ending Account Value June 30, 2017 | Expenses Paid During the Period* | Annualized Expense Ratio | |||||||||||||
Dynamic Small Cap Growth Fund | ||||||||||||||||
Class A | ||||||||||||||||
Actual* | $ | 1,000.00 | $ | 1,201.90 | $ | 6.82 | 1.25 | % | ||||||||
Hypothetical* | 1,000.00 | 1,018.60 | 6.26 | 1.25 | ||||||||||||
Class C | ||||||||||||||||
Actual* | 1,000.00 | 1,198.90 | 9.54 | 1.75 | ||||||||||||
Hypothetical* | 1,000.00 | 1,016.12 | 8.75 | 1.75 | ||||||||||||
Class I (formerly Select Class) | ||||||||||||||||
Actual* | 1,000.00 | 1,203.60 | 5.46 | 1.00 | ||||||||||||
Hypothetical* | 1,000.00 | 1,019.84 | 5.01 | 1.00 | ||||||||||||
Small Cap Core Fund | ||||||||||||||||
Class A | ||||||||||||||||
Actual** | 1,000.00 | 1,046.20 | 6.29 | 1.24 | ||||||||||||
Hypothetical* | 1,000.00 | 1,018.65 | 6.21 | 1.24 | ||||||||||||
Class C | ||||||||||||||||
Actual* | 1,000.00 | 1,043.60 | 8.82 | 1.74 | ||||||||||||
Hypothetical* | 1,000.00 | 1,016.17 | 8.70 | 1.74 | ||||||||||||
Class I (formerly Select Class) | ||||||||||||||||
Actual* | 1,000.00 | 1,042.40 | 4.93 | 0.99 | ||||||||||||
Hypothetical* | 1,000.00 | 1,019.89 | 4.96 | 0.99 | ||||||||||||
Class R5 | ||||||||||||||||
Actual* | 1,000.00 | 1,048.80 | 4.01 | 0.79 | ||||||||||||
Hypothetical* | 1,000.00 | 1,020.88 | 3.96 | 0.79 | ||||||||||||
Class R6 | ||||||||||||||||
Actual* | 1,000.00 | 1,048.90 | 3.76 | 0.74 | ||||||||||||
Hypothetical* | 1,000.00 | 1,021.12 | 3.71 | 0.74 | ||||||||||||
| 90 | J.P. MORGAN SMALL CAP FUNDS | JUNE 30, 2017 | ||||
Table of Contents
Beginning Account Value January 1, 2017 | Ending Account Value June 30, 2017 | Expenses Paid During the Period* | Annualized Expense Ratio | |||||||||||||
Small Cap Equity Fund | ||||||||||||||||
Class A | ||||||||||||||||
Actual* | $ | 1,000.00 | $ | 1,064.80 | $ | 6.60 | 1.29 | % | ||||||||
Hypothetical* | 1,000.00 | 1,018.40 | 6.46 | 1.29 | ||||||||||||
Class C | ||||||||||||||||
Actual* | 1,000.00 | 1,062.20 | 9.15 | 1.79 | ||||||||||||
Hypothetical* | 1,000.00 | 1,015.92 | 8.95 | 1.79 | ||||||||||||
Class I (formerly Select Class) | ||||||||||||||||
Actual* | 1,000.00 | 1,066.70 | 5.07 | 0.99 | ||||||||||||
Hypothetical* | 1,000.00 | 1,019.89 | 4.96 | 0.99 | ||||||||||||
Class R2 | ||||||||||||||||
Actual* | 1,000.00 | 1,063.90 | 7.83 | 1.53 | ||||||||||||
Hypothetical* | 1,000.00 | 1,017.21 | 7.65 | 1.53 | ||||||||||||
Class R3 | ||||||||||||||||
Actual* | 1,000.00 | 1,065.40 | 6.35 | 1.24 | ||||||||||||
Hypothetical* | 1,000.00 | 1,018.65 | 6.21 | 1.24 | ||||||||||||
Class R4 | ||||||||||||||||
Actual* | 1,000.00 | 1,066.50 | 5.07 | 0.99 | ||||||||||||
Hypothetical* | 1,000.00 | 1,019.89 | 4.96 | 0.99 | ||||||||||||
Class R5 | ||||||||||||||||
Actual* | 1,000.00 | 1,067.70 | 4.05 | 0.79 | ||||||||||||
Hypothetical* | 1,000.00 | 1,020.88 | 3.96 | 0.79 | ||||||||||||
Class R6 | ||||||||||||||||
Actual* | 1,000.00 | 1,067.90 | 3.79 | 0.74 | ||||||||||||
Hypothetical* | 1,000.00 | 1,021.12 | 3.71 | 0.74 | ||||||||||||
Small Cap Growth Fund | ||||||||||||||||
Class A | ||||||||||||||||
Actual* | 1,000.00 | 1,198.20 | 6.81 | 1.25 | ||||||||||||
Hypothetical* | 1,000.00 | 1,018.60 | 6.26 | 1.25 | ||||||||||||
Class C | ||||||||||||||||
Actual* | 1,000.00 | 1,194.70 | 9.47 | 1.74 | ||||||||||||
Hypothetical* | 1,000.00 | 1,016.17 | 8.70 | 1.74 | ||||||||||||
Class I (formerly Select Class) | ||||||||||||||||
Actual* | 1,000.00 | 1,200.30 | 5.46 | 1.00 | ||||||||||||
Hypothetical* | 1,000.00 | 1,019.84 | 5.01 | 1.00 | ||||||||||||
Class L (formerly Institutional Class) | ||||||||||||||||
Actual* | 1,000.00 | 1,201.20 | 4.64 | 0.85 | ||||||||||||
Hypothetical* | 1,000.00 | 1,020.58 | 4.26 | 0.85 | ||||||||||||
Class R2 | ||||||||||||||||
Actual* | 1,000.00 | 1,197.20 | 8.12 | 1.49 | ||||||||||||
Hypothetical* | 1,000.00 | 1,017.41 | 7.45 | 1.49 | ||||||||||||
Class R5 | ||||||||||||||||
Actual* | 1,000.00 | 1,201.20 | 4.53 | 0.83 | ||||||||||||
Hypothetical* | 1,000.00 | 1,020.68 | 4.16 | 0.83 | ||||||||||||
Class R6 | ||||||||||||||||
Actual* | 1,000.00 | 1,201.00 | 4.09 | 0.75 | ||||||||||||
Hypothetical* | 1,000.00 | 1,021.08 | 3.76 | 0.75 | ||||||||||||
Small Cap Value Fund | ||||||||||||||||
Class A | ||||||||||||||||
Actual* | 1,000.00 | 974.00 | 6.07 | 1.24 | ||||||||||||
Hypothetical* | 1,000.00 | 1,018.65 | 6.21 | 1.24 | ||||||||||||
Class C | ||||||||||||||||
Actual* | 1,000.00 | 971.10 | 9.09 | 1.86 | ||||||||||||
Hypothetical* | 1,000.00 | 1,015.57 | 9.30 | 1.86 | ||||||||||||
| JUNE 30, 2017 | J.P. MORGAN SMALL CAP FUNDS | 91 | ||||||
Table of Contents
SCHEDULE OF SHAREHOLDER EXPENSES
(Unaudited) (continued)
Hypothetical $1,000 Investment
Beginning Account Value January 1, 2017 | Ending Account Value June 30, 2017 | Expenses Paid During the Period* | Annualized Expense Ratio | |||||||||||||
Small Cap Value Fund (continued) | ||||||||||||||||
Class I (formerly Select Class) | ||||||||||||||||
Actual* | $ | 1,000.00 | $ | 975.30 | $ | 4.85 | 0.99 | % | ||||||||
Hypothetical* | 1,000.00 | 1,019.89 | 4.96 | 0.99 | ||||||||||||
Class R2 | ||||||||||||||||
Actual* | 1,000.00 | 972.40 | 7.53 | 1.54 | ||||||||||||
Hypothetical* | 1,000.00 | 1,017.16 | 7.70 | 1.54 | ||||||||||||
Class R3 | ||||||||||||||||
Actual* | 1,000.00 | 973.80 | 6.22 | 1.27 | ||||||||||||
Hypothetical* | 1,000.00 | 1,018.50 | 6.36 | 1.27 | ||||||||||||
Class R4 | ||||||||||||||||
Actual* | 1,000.00 | 974.80 | 5.34 | 1.09 | ||||||||||||
Hypothetical* | 1,000.00 | 1,019.39 | 5.46 | 1.09 | ||||||||||||
Class R5 | ||||||||||||||||
Actual* | 1,000.00 | 975.60 | 4.26 | 0.87 | ||||||||||||
Hypothetical* | 1,000.00 | 1,020.48 | 4.36 | 0.87 | ||||||||||||
Class R6 | ||||||||||||||||
Actual* | 1,000.00 | 976.20 | 3.72 | 0.76 | ||||||||||||
Hypothetical* | 1,000.00 | 1,021.03 | 3.81 | 0.76 | ||||||||||||
U.S. Small Company Fund | ||||||||||||||||
Class A | ||||||||||||||||
Actual* | 1,000.00 | 1,006.70 | 6.27 | 1.26 | ||||||||||||
Hypothetical* | 1,000.00 | 1,018.55 | 6.31 | 1.26 | ||||||||||||
Class C | ||||||||||||||||
Actual* | 1,000.00 | 1,004.00 | 8.75 | 1.76 | ||||||||||||
Hypothetical* | 1,000.00 | 1,016.07 | 8.80 | 1.76 | ||||||||||||
Class I (formerly Select Class) | ||||||||||||||||
Actual* | 1,000.00 | 1,007.60 | 5.03 | 1.01 | ||||||||||||
Hypothetical* | 1,000.00 | 1,019.79 | 5.06 | 1.01 | ||||||||||||
Class L (formerly Institutional Class) | ||||||||||||||||
Actual* | 1,000.00 | 1,008.70 | 4.08 | 0.82 | ||||||||||||
Hypothetical* | 1,000.00 | 1,020.73 | 4.11 | 0.82 | ||||||||||||
Class R2 | ||||||||||||||||
Actual* | 1,000.00 | 1,005.10 | 7.51 | 1.51 | ||||||||||||
Hypothetical* | 1,000.00 | 1,017.31 | 7.55 | 1.51 | ||||||||||||
Class R3 | ||||||||||||||||
Actual* | 1,000.00 | 1,006.10 | 6.17 | 1.24 | ||||||||||||
Hypothetical* | 1,000.00 | 1,018.65 | 6.21 | 1.24 | ||||||||||||
Class R4 | ||||||||||||||||
Actual* | 1,000.00 | 1,007.70 | 5.03 | 1.01 | ||||||||||||
Hypothetical* | 1,000.00 | 1,019.79 | 5.06 | 1.01 | ||||||||||||
Class R5 | ||||||||||||||||
Actual* | 1,000.00 | 1,008.70 | 4.23 | 0.85 | ||||||||||||
Hypothetical* | 1,000.00 | 1,020.58 | 4.26 | 0.85 | ||||||||||||
Class R6 | ||||||||||||||||
Actual* | 1,000.00 | 1,009.30 | 3.59 | 0.72 | ||||||||||||
Hypothetical* | 1,000.00 | 1,021.22 | 3.61 | 0.72 | ||||||||||||
| * | Expenses are equal to each Class’ respective annualized expense ratio, multiplied by the average account value over the period, multiplied by 181/365 (to reflect the one-half year period). |
| ** | Expense is equal to the Class’s respective annualized expense ratio, multiplied by the average account value over the period, multiplied by 178/365 (to reflect the actual period). Commencement of operations was January 3, 2017. |
| 92 | J.P. MORGAN SMALL CAP FUNDS | JUNE 30, 2017 | ||||
Table of Contents
(Unaudited)
Certain tax information for the J.P. Morgan Funds is required to be provided to shareholders based upon the Funds’ income and distributions for the taxable year ended June 30, 2017. The information and distributions reported in this letter may differ from the information and taxable distributions reported to the shareholders for the calendar year ending December 31, 2017. The information necessary to complete your income tax returns for the calendar year ending December 31, 2017 will be provided under separate cover.
Dividends Received Deductions (DRD)
Each fund listed below had the following percentage, or maximum allowable percentage, of ordinary income distributions eligible for the 70% dividends received deductions for corporate shareholders for the fiscal year ended June 30, 2017:
| Dividends Received Deduction | ||||
Dynamic Small Cap Growth Fund | 49.40 | % | ||
Small Cap Core Fund | 100.00 | |||
Small Cap Equity Fund | 88.31 | |||
Small Cap Value Fund | 100.00 | |||
U.S. Small Company Fund | 100.00 | |||
Long Term Capital Gain
Each fund listed below distributed the following amount, or maximum allowable amount, of long-term capital gain dividends for the fiscal year ended June 30, 2017 (amounts in thousands):
| Long-Term Capital Gain Distribution | ||||
Dynamic Small Cap Growth Fund | $ | 23,121 | ||
Small Cap Core Fund | 17,778 | |||
Small Cap Equity Fund | 132,624 | |||
Small Cap Growth Fund | 36,600 | |||
Small Cap Value Fund | 828 | |||
Qualified Dividend Income (QDI)
Each fund listed below had the following amount, or maximum allowable amount, of ordinary income distributions treated as qualified dividends for the fiscal year ended June 30, 2017 (amounts in thousands):
| Qualified Dividend Income | ||||
Dynamic Small Cap Growth Fund | $ | 128 | ||
Small Cap Core Fund | 599 | |||
Small Cap Equity Fund | 22,582 | |||
Small Cap Value Fund | 12,657 | |||
U.S. Small Company Fund | 6,050 | |||
| JUNE 30, 2017 | J.P. MORGAN SMALL CAP FUNDS | 93 | ||||||
Table of Contents

Rev. January 2011
| FACTS | WHAT DOES J.P. MORGAN FUNDS DO WITH YOUR PERSONAL INFORMATION? |
| Why? | Financial companies choose how they share your personal information. Federal law gives consumers the right to limit some but not all sharing. Federal law also requires us to tell you how we collect, share, and protect your personal information. Please read this notice carefully to understand what we do. |
| What? | The types of personal information we collect and share depend on the product or service you have with us. This information can include:
◾ Social Security number and account balances
◾ transaction history and account transactions
◾ checking account information and wire transfer instructions
When you are no longer our customer, we continue to share your information as described in this notice. |
| How? | All financial companies need to share customers’ personal information to run their everyday business. In the section below, we list the reasons financial companies can share their customers’ personal information; the reasons J.P. Morgan Funds chooses to share; and whether you can limit this sharing. |
| Reasons we can share your personal information | Does J.P. Morgan Funds share? | Can you limit this sharing? | ||
For our everyday business purposes — such as to process your transactions, maintain your account(s), respond to court orders and legal investigations, or report to credit bureaus | Yes | No | ||
For marketing purposes — to offer our products and services to you | Yes | No | ||
| For joint marketing with other financial companies | No | We don’t share | ||
For our affiliates’ everyday business purposes — information about your transactions and experiences | No | We don’t share | ||
For our affiliates’ everyday business purposes — information about your creditworthiness | No | We don’t share | ||
| For nonaffiliates to market to you | No | We don’t share |
| Questions? | Call 1-800-480-4111 or go to www.jpmorganfunds.com | |

Table of Contents
Page 2 |
| Who we are | ||
| Who is providing this notice? | J.P. Morgan Funds | |
| What we do | ||
| How does J.P. Morgan Funds protect my personal information? | To protect your personal information from unauthorized access and use, we use security measures that comply with federal law. These measures include computer safeguards and secured files and buildings. We authorize our employees to access your information only when they need it to do their work and we require companies that work for us to protect your information. | |
How does J.P. Morgan Funds collect my personal information? | We collect your personal information, for example, when you:
◾ open an account or provide contact information
◾ give us your account information or pay us by check
◾ make a wire transfer
We also collect your personal information from others, such as credit bureaus, affiliates and other companies. | |
| Why can’t I limit all sharing? | Federal law gives you the right to limit only
◾ sharing for affiliates’ everyday business purposes – information about your creditworthiness
◾ affiliates from using your information to market to you
◾ sharing for nonaffiliates to market to you
State laws and individual companies may give you additional rights to limit sharing. | |
| Definitions | ||
| Affiliates | Companies related by common ownership or control. They can be financial and nonfinancial companies.
◾ J.P. Morgan Funds does not share with our affiliates. | |
| Nonaffiliates | Companies not related by common ownership or control. They can be financial and nonfinancial companies.
◾ J.P. Morgan Funds does not share with nonaffiliates so they can market to you. | |
| Joint Marketing | A formal agreement between nonaffiliated financial companies that together market financial products or services to you.
◾ J.P. Morgan Funds doesn’t jointly market. | |
Table of Contents
J.P. Morgan Funds are distributed by JPMorgan Distribution Services, Inc., which is an affiliate of JPMorgan Chase & Co. Affiliates of JPMorgan Chase & Co. receive fees for providing various services to the funds.
Contact JPMorgan Distribution Services, Inc. at 1-800-480-4111 for a fund prospectus. You can also visit us at www.jpmorganfunds.com. Investors should carefully consider the investment objectives and risk as well as charges and expenses of the mutual fund before investing. The prospectus contains this and other information about the mutual fund. Read the prospectus carefully before investing.
Investors may obtain information about the Securities Investor Protection Corporation (SIPC), including the SIPC brochure by visiting www.sipc.org or by calling SIPC at 202-371-8300.
Each Fund files a complete schedule of its fund holdings for the first and third quarters of its fiscal year with the SEC on Form N-Q. The Funds’ Forms N-Q are available on the SEC’s website at http://www.sec.gov and may be reviewed and copied at the SEC’s Public Reference Room in Washington, DC. Information on the operation of the SEC’s Public Reference Room may be obtained by calling 1-800-SEC-0330. Shareholders may request the Form N-Q without charge by calling 1-800-480-4111 or by visiting the J.P. Morgan Funds’ website at www.jpmorganfunds.com.
A description of each Fund’s policies and procedures with respect to the disclosure of each Fund’s holdings is available in the prospectus and Statement of Additional Information.
A copy of proxy policies and procedures is available without charge upon request by calling 1-800-480-4111 and on the Funds’ website at www.jpmorganfunds.com. A description of such policies and procedures is on the SEC’s website at www.sec.gov. The Trustees have delegated the authority to vote proxies for securities owned by the Funds to the Adviser. A copy of the Funds’ voting record for the most recent 12-month period ended June 30 is available on the SEC’s website at www.sec.gov or at the Funds’ website at www.jpmorganfunds.com no later than August 31 of each year. The Funds’ proxy voting record will include, among other things, a brief description of the matter voted on for each fund security, and will state how each vote was cast, for example, for or against the proposal.

Table of Contents

J.P. Morgan Asset Management is the marketing name for the asset management businesses of JPMorgan Chase & Co. Those businesses include, but are not limited to, J.P. Morgan Investment Management Inc., Security Capital Research & Management Incorporated and J.P. Morgan Alternative Asset Management, Inc.
| © JPMorgan Chase & Co., 2017. All rights reserved. June 2017. | AN-SC-617 |
Table of Contents
Annual Report
J.P. Morgan Mid Cap/Multi-Cap Funds
June 30, 2017
JPMorgan Growth Advantage Fund
JPMorgan Mid Cap Equity Fund
JPMorgan Mid Cap Growth Fund
JPMorgan Mid Cap Value Fund
JPMorgan Multi-Cap Market Neutral Fund
JPMorgan Value Advantage Fund

Table of Contents
| CEO’s Letter | 1 | |||
| Market Overview | 2 | |||
Fund Commentaries: | ||||
| 3 | ||||
| 5 | ||||
| 7 | ||||
| 9 | ||||
| 11 | ||||
| 14 | ||||
| Schedules of Portfolio Investments | 16 | |||
| Financial Statements | 40 | |||
| Financial Highlights | 56 | |||
| Notes to Financial Statements | 68 | |||
| Report of Independent Registered Public Accounting Firm | 79 | |||
| Trustees | 80 | |||
| Officers | 82 | |||
| Schedule of Shareholder Expenses | 83 | |||
| 86 | ||||
| Privacy Policy — Located at the back of this Annual Report | ||||
Investments in a Fund are not deposits or obligations of, or guaranteed or endorsed by, any bank and are not insured or guaranteed by the FDIC, the Federal Reserve Board or any other government agency. You could lose money if you sell when a Fund’s share price is lower than when you invested.
Past performance is no guarantee of future performance. The general market views expressed in this report are opinions based on market and other conditions through the end of the reporting period and are subject to change without notice. These views are not intended to predict the future performance of a Fund or the securities markets. References to specific securities and their issuers are for illustrative purposes only and are not intended to be, and should not be interpreted as, recommendations to purchase or sell such securities. Such views are not meant as investment advice and may not be relied on as an indication of trading intent on behalf of any Fund.
Prospective investors should refer to the Funds’ prospectuses for a discussion of the Funds’ investment objectives, strategies and risks. Call J.P. Morgan Funds Service Center at 1-800-480-4111 for a prospectus containing more complete information about a Fund, including management fees and other expenses. Please read it carefully before investing.
Table of Contents
August 4, 2017 (Unaudited)
Dear Shareholder,
The current U.S. economic expansion entered its eighth year in 2017 and growth in developed and emerging market economies grew more synchronized even as U.S. growth showed some signs of easing. Global financial markets generally benefitted from steady economic growth amid an environment of low inflation, low volatility and rising corporate profits.
 |
“In the U.S., the continued economic expansion, muted inflation, corporate earnings growth and historically low volatility in financial markets helped to drive key equity market indexes to multiple record closing highs throughout the past twelve months.” |
While economic growth in the U.S. and China largely drove the global recovery throughout 2016, by June 2017 the world’s other leading economies had picked up sufficiently enough for the Organization for Economic Co-operation and Development to forecast global growth at 3.5% in 2017 and 3.6% in 2018.
U.S. gross domestic product (GDP) growth slowed to 1.2% in the first quarter of 2017 from 2.5% and 3.5% growth in the fourth quarter and third quarters of 2016, respectively. Meanwhile, the U.S. unemployment rate continued its downward trend throughout the past twelve months, dropping to 4.4% in June 2017 from 4.9% one year earlier. In response to these numbers, along with nascent signs of price inflation, the U.S. Federal Reserve (the “Fed”) raised interest rates in December 2016 and again in June 2017 and signaled it would raise rates once more before the end of the year. Further, Fed Chairwoman Janet Yellen indicated she was prepared to begin partially unwinding the central bank’s $4.5 trillion balance sheet in assets purchased through its quantitative easing program. An increase in consumer spending helped second-quarter 2017 GDP climb by 2.6% from a year earlier.
Notably, by mid-2017 domestic price inflation had dropped below the Fed’s target of 2% growth and wage growth was below many economists’ expectations, the latter despite an environment of essentially full employment for U.S. workers. These trends — and the Fed’s acknowledgment of them — provided some near-term uncertainty about the central bank’s commitment to tightening monetary policy.
Throughout the twelve months ended June 30, 2017, global oil prices remained a key focal point for policy makers, economists and investors. Global crude prices reached 15-month highs in October 2016 and received further support from the Organization of Petroleum Exporting Countries’ December 2016 decision to curb production. However, continued oversupply of crude and natural gas, partly due to continued U.S. production, pushed the price of a barrel of benchmark West Texas Intermediate crude oil down to $46 by the end of June 2017.
Meanwhile, the leading economies of Europe continued to strengthen from what had been an anemic expansion. Annualized GDP for the 19 core euro area nations rose 1.9% in the first quarter of 2017 and 2.1% in the second quarter. The June 2017 aggregate unemployment rate for those nations fell to 9.1%, its lowest level since March 2009. Also, in separate elections in 2017, voters in the Netherlands and France largely rejected populist campaigns espousing policies to limit free trade and immigration. The election results provided another boost to global equity prices.
In the U.S., the continued economic expansion, muted inflation, corporate earnings growth and historically low volatility in financial markets helped to drive key equity market indexes to multiple record closing highs throughout the past twelve months. U.S. investors appeared to shrug off intermittent political and policy dramas emanating from Washington, D.C. and extended the run-up in U.S. equity prices into its eighth consecutive year — one of the longest on record.
Over the twelve month period, U.S. and foreign markets largely rewarded those who remained fully invested in financial markets and we believe the fundamental virtues of patience and diversification remain essential to prudent investment strategy.
We look forward to managing your investment needs for years to come. Should you have any questions, please visit www.jpmorganfunds.com or contact the J.P. Morgan Funds Service Center at 1-800-480-4111.
Sincerely yours,

George C.W. Gatch
CEO, Global Funds Management & Institutional,
J.P. Morgan Asset Management
| JUNE 30, 2017 | J.P. MORGAN MID CAP/MULTI-CAP FUNDS | 1 | ||||||
Table of Contents
J.P. Morgan Mid Cap/Multi-Cap Funds
MARKET OVERVIEW
TWELVE MONTHS ENDED JUNE 30, 2017 (Unaudited)
Overall, U.S. equity markets provided positive returns and key stock market indexes reached multiple record highs throughout the twelve month reporting period. Steady global economic growth, continued low inflation and strong corporate earnings all served to support equity prices, both in the U.S. and elsewhere.
While U.S. equity prices rose throughout most of 2016, they experienced a sustained rally following the November 8, 2016 election amid investor expectations for increased infrastructure spending and tax cuts under the incoming Trump administration and Republican Party majorities in the U.S. Congress. Even as those expectations faded, U.S. equity prices continued to climb.
In February 2017, the Standard & Poor’s 500 Index (the “S&P 500”) reached nine new closing highs and the Dow Jones Industrial Average (the “DJIA”) closed at new highs for 12 consecutive days, matching a record set in 1987. The following month, the S&P 500 crossed 2,400 points in intraday trading for the first time and the DJIA crossed 21,000 points for the first time. While the rally in U.S. equities stalled in April 2017, record high U.S. corporate operating earnings rekindled the rise in stock prices and the S&P 500 posted seven new closing highs in May 2017 and four new closing highs in June 2017.
Importantly, U.S. financial market volatility remained historically low throughout the reporting period, with a brief spike ahead of the November 2016 election. By the end of June 2017, the CBOE Volatility Index, which measures S&P 500 options to gauge market expectations of near-term volatility, stood at roughly half of its historical average.
Overall, small capitalization stocks generally outperformed mid cap and large cap stocks, while growth stocks generally outperformed value stocks. For the twelve months ended June 30, 2017, the Russell Midcap Index returned 16.48%.
| 2 | J.P. MORGAN MID CAP/MULTI-CAP FUNDS | JUNE 30, 2017 | ||||
Table of Contents
JPMorgan Growth Advantage Fund
FUND COMMENTARY
TWELVE MONTHS ENDED JUNE 30, 2017 (Unaudited)
| REPORTING PERIOD RETURN: | ||||
| Fund (Class A Shares, without a sales charge)* | 24.48% | |||
| Russell 3000 Growth Index | 20.72% | |||
| Net Assets as of 6/30/2017 (In Thousands) | $ | 7,097,910 | ||
INVESTMENT OBJECTIVE**
The JPMorgan Growth Advantage Fund (the “Fund”) seeks to provide long-term capital growth.
WHAT WERE THE MAIN DRIVERS OF THE FUND’S PERFORMANCE?
The Fund’s Class A Shares, without a sales charge, outperformed the Russell 3000 Growth Index (the “Benchmark”) for the twelve months ended June 30, 2017. The Fund’s security selection in the financials sector and its overweight position and security selection in the technology sector were leading contributors to performance relative to the Benchmark. The Fund’s security selection in the materials & processing sector and its underweight position and security selection in the producer durables sector were leading detractors from relative performance.
Leading individual contributors to relative performance included the Fund’s overweight positions in Arista Networks Inc., Kite Pharma Inc. and Wayfair Inc. Shares of Arista Networks, a maker of computer networking technology, rose as the company reported four consecutive quarters of earnings growth. Shares of Kite Pharma, a maker of anti-cancer treatments, rose on positive results from drug trials. Shares of Wayfair, an online retailer of home furniture, rose after the company reported better-than-expected earnings and raised its earnings forecast.
Leading individual detractors from relative performance included the Fund’s underweight position in Apple Inc. and its overweight positions in Acuity Brands Inc. and Dollar General Corp. Shares of Apple, a maker of smartphones, computers and related devices, rose after the company posted earnings growth on better-than-expected sales and pricing for its iPhones. Shares of Acuity Brands, a maker of lighting and building management systems, fell after the company reported lower-than-expected earnings. Shares of Dollar General, a discount retail chain, fell after the company reported lower-than-expected sales and a slump in earnings.
HOW WAS THE FUND POSITIONED?
The Fund’s portfolio managers utilized a bottom-up approach to stock selection, researching individual companies across market capitalizations in an effort to construct portfolios of
stocks that have strong fundamentals. The Fund’s portfolio managers sought to invest in high quality companies with durable franchises that, in their view, possessed the ability to generate strong future earnings growth.
| TOP TEN EQUITY HOLDINGS OF THE PORTFOLIO*** | ||||||||
| 1. | Alphabet, Inc., Class C | 6.2 | % | |||||
| 2. | Apple, Inc. | 4.8 | ||||||
| 3. | Amazon.com, Inc. | 4.2 | ||||||
| 4. | Facebook, Inc., Class A | 3.8 | ||||||
| 5. | UnitedHealth Group, Inc. | 3.3 | ||||||
| 6. | Waste Connections, Inc., (Canada) | 2.7 | ||||||
| 7. | Mohawk Industries, Inc. | 2.3 | ||||||
| 8. | Microsoft Corp. | 2.2 | ||||||
| 9. | Electronic Arts, Inc. | 2.0 | ||||||
| 10. | Charles Schwab Corp. (The) | 1.9 | ||||||
PORTFOLIO COMPOSITION BY SECTOR*** | ||||
| Information Technology | 41.0 | % | ||
| Consumer Discretionary | 15.5 | |||
Health Care | 14.3 | |||
Industrials | 13.7 | |||
Financials | 7.5 | |||
Materials | 1.7 | |||
Energy | 1.3 | |||
Real Estate | 1.0 | |||
Consumer Staples | 0.6 | |||
| Short-Term Investment | 3.4 | |||
| * | The return shown is based on net asset values calculated for shareholder transactions and may differ from the return shown in the financial highlights, which reflects adjustments made to the net asset values in accordance with accounting principles generally accepted in the United States of America. |
| ** | The adviser seeks to achieve the Fund’s objective. There can be no guarantee it will be achieved. |
| *** | Percentages indicated are based on total investments as of June 30, 2017. The Fund’s portfolio composition is subject to change. |
| JUNE 30, 2017 | J.P. MORGAN MID CAP/MULTI-CAP FUNDS | 3 | ||||||
Table of Contents
JPMorgan Growth Advantage Fund
FUND COMMENTARY
TWELVE MONTHS ENDED JUNE 30, 2017 (Unaudited) (continued)
AVERAGE ANNUAL TOTAL RETURNS AS OF JUNE 30, 2017 | ||||||||||||||
| INCEPTION DATE OF CLASS | 1 YEAR | 5 YEAR | 10 YEAR | |||||||||||
CLASS A SHARES | October 29, 1999 | |||||||||||||
With Sales Charge* | 17.94 | % | 15.26 | % | 8.96 | % | ||||||||
Without Sales Charge | 24.48 | 16.52 | 9.55 | |||||||||||
CLASS C SHARES | May 1, 2006 | |||||||||||||
With CDSC** | 22.86 | 15.94 | 8.99 | |||||||||||
Without CDSC | 23.86 | 15.94 | 8.99 | |||||||||||
CLASS I SHARES (FORMERLY SELECT CLASS SHARES) | May 1, 2006 | 24.75 | 16.74 | 9.77 | ||||||||||
CLASS R3 SHARES | May 31, 2017 | 24.47 | 16.52 | 9.58 | ||||||||||
CLASS R4 SHARES | May 31, 2017 | 24.76 | 16.80 | 9.84 | ||||||||||
CLASS R5 SHARES | January 8, 2009 | 24.93 | 16.98 | 9.95 | ||||||||||
CLASS R6 SHARES | December 23, 2013 | 25.07 | 17.07 | 9.99 | ||||||||||
| * | Sales Charge for Class A Shares is 5.25%. |
| ** | Assumes a 1% CDSC (contingent deferred sales charge) for the one year period and 0% CDSC thereafter. |
TEN YEAR PERFORMANCE (6/30/07/ TO 6/30/17)
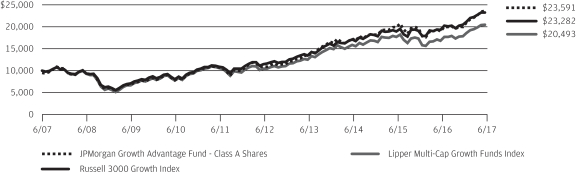
The performance quoted is past performance and is not a guarantee of future results. Mutual funds are subject to certain market risks. Investment returns and principal value of an investment will fluctuate so that an investor’s shares, when redeemed, may be worth more or less than their original cost. Current performance may be higher or lower than the performance data shown. For up-to-date month-end performance information please call 1-800-480-4111.
Returns for Class R3 Shares prior to their inception date are based on the performance of Class A Shares. The actual returns for Class R3 Shares would have been lower than those shown because Class R3 Shares have higher expenses than Class A Shares.
Returns for Class R4 and Class R5 Shares prior to their inception dates are based on the performance of Class I Shares. The actual returns of Class R4 Shares would have been lower than those shown because Class R4 Shares have higher expenses than Class I Shares. The actual returns of Class R5 Shares would have been different than those shown because Class R5 Shares have different expenses than Class I Shares.
Returns for Class R6 Shares prior to their inception date are based on the performance of Class R5 Shares from January 8, 2009 to December 22, 2013 and Class I Shares prior to January 8, 2009. The actual returns of Class R6 Shares would have been different than those shown because Class R6 Shares have different expenses than Class R5 Shares and Class I Shares.
The graph illustrates comparative performance for $10,000 invested in Class A Shares of the JPMorgan Growth Advantage Fund, the Russell 3000 Growth Index and the Lipper Multi-Cap Growth Funds Index from June 30, 2007 to June 30,
2017. The performance of the Fund assumes reinvestment of all dividends and capital gain distributions, if any, and includes a sales charge. The performance of the Russell 3000 Growth Index does not reflect the deduction of expenses or a sales charge associated with a mutual fund and has been adjusted to reflect reinvestment of all dividends and capital gain distributions of the securities included in the benchmark, if applicable. The performance of the Lipper Multi-Cap Growth Funds Index includes expenses associated with a mutual fund, such as investment management fees. These expenses are not identical to the expenses incurred by the Fund. The Russell 3000 Growth Index is an unmanaged index which measures the performance of those Russell 3000 companies (largest 3000 U.S. companies) with higher price-to-book ratios and higher forecasted growth values. The Lipper Multi-Cap Growth Funds Index is an index based on total returns of certain mutual funds within the Fund’s designated category as determined by Lipper, Inc. Investors cannot invest directly in an index.
Class A Shares have a $1,000 minimum initial investment and carry a 5.25% sales charge.
Fund performance may reflect the waiver of the Fund’s fees and reimbursement of expenses for certain periods since the inception date. Without these waivers and reimbursements, performance would have been lower. Also, performance shown in this section does not reflect the deduction of taxes that a shareholder would pay on Fund distributions or redemptions of Fund shares.
The returns shown are based on net asset values calculated for shareholder transactions and may differ from the returns shown in the financial highlights, which reflect adjustments made to the net asset values in accordance with accounting principles generally accepted in the United States of America.
| 4 | J.P. MORGAN MID CAP/MULTI-CAP FUNDS | JUNE 30, 2017 | ||||
Table of Contents
FUND COMMENTARY
TWELVE MONTHS ENDED JUNE 30, 2017 (Unaudited)
| REPORTING PERIOD RETURN: | ||||
| Fund (Class I Shares)(1)* | 16.99% | |||
| Russell Midcap Index | 16.48% | |||
| Net Assets as of 6/30/2017 (In Thousands) | $ | 2,808,478 | ||
INVESTMENT OBJECTIVE**
The JPMorgan Mid Cap Equity Fund (the “Fund”) seeks long-term capital growth.
WHAT WERE THE MAIN DRIVERS OF THE FUND’S PERFORMANCE?
The Fund’s Class I Shares outperformed the Russell Midcap Index (the “Benchmark”) for the twelve months ended June 30, 2017. The Fund’s security selection in the financials sector and its overweight position in the technology sector were leading contributors to performance relative to the Benchmark, while the Fund’s security selection in the producer durables and materials & processing sectors was a leading detractor from relative performance.
Leading individual contributors to relative performance included the Fund’s overweight positions in Kite Pharma, Arista Networks Inc. and Waste Connections Inc. Shares of Kite Pharma, a maker of anti-cancer treatments that was not held in the Benchmark, rose on positive results from drug trials. Shares of Arista Networks, a maker of computer networking technology, rose as the company reported four consecutive quarters of earnings growth. Shares of Waste Connections, a municipal waste processor not held in the Benchmark, rose after the company reported better-than-expected results.
Leading individual detractors from relative performance included the Fund’s overweight positions in EQT Corp., Kroger Co. and Dollar General Corp. Shares of EQT, a natural gas producer, fell amid weakness in natural prices and after the company announced its $6.7 billion takeover offer for Rice Energy Inc. Shares of Kroger, a supermarket chain not held in the Benchmark, fell amid investor expectations that Amazon.com Inc.’s acquisition of Whole Foods Market Inc. would hurt Kroger’s sales and profit margins. Shares of Dollar General, a discount retail chain, fell in the early part of 2017 after the company reported lower-than-expected sales and a slump in earnings.
HOW WAS THE FUND POSITIONED?
The Fund’s portfolio managers employed a bottom-up approach to stock selection, constructing a portfolio based on company fundamentals, quantitative screening and proprietary fundamental analysis. The Fund’s portfolio managers sought to identify dominant franchises with predictable business models
deemed capable of achieving, in their view, sustained growth, as well as undervalued companies with the potential to grow their intrinsic value per share.
| TOP TEN EQUITY HOLDINGS OF THE PORTFOLIO*** | ||||||||
| 1. | Mohawk Industries, Inc | 2.3 | % | |||||
| 2. | Waste Connections, Inc., (Canada) | 1.6 | ||||||
| 3. | Amphenol Corp., Class A | 1.5 | ||||||
| 4. | Hilton Worldwide Holdings, Inc | 1.3 | ||||||
| 5. | Fortune Brands Home & Security, Inc | 1.3 | ||||||
| 6. | Humana, Inc | 1.0 | ||||||
| 7. | CBRE Group, Inc., Class A | 1.0 | ||||||
| 8. | First Republic Bank | 1.0 | ||||||
| 9. | EQT Corp | 0.9 | ||||||
| 10. | Loews Corp | 0.9 | ||||||
PORTFOLIO COMPOSITION BY SECTOR*** | ||||
| Information Technology | 18.6 | % | ||
| Consumer Discretionary | 17.6 | |||
| Financials | 15.5 | |||
| Industrials | 13.6 | |||
| Health Care | 9.4 | |||
| Real Estate | 5.7 | |||
| Utilities | 4.2 | |||
| Energy | 4.0 | |||
| Consumer Staples | 3.6 | |||
| Materials | 3.6 | |||
| Short-Term Investment | 4.2 | |||
| * | The return shown is based on net asset values calculated for shareholder transactions and may differ from the return shown in the financial highlights, which reflects adjustments made to the net asset values in accordance with accounting principles generally accepted in the United States of America. |
| ** | The adviser seeks to achieve the Fund’s objective. There can be no guarantee it will be achieved. |
| *** | Percentages indicated are based on total investments as of June 30, 2017. The Fund’s portfolio composition is subject to change. |
| (1) | On April 3, 2017, the Fund’s Select Class Shares were renamed Class I Shares. |
| JUNE 30, 2017 | J.P. MORGAN MID CAP/MULTI-CAP FUNDS | 5 | ||||||
Table of Contents
JPMorgan Mid Cap Equity Fund
FUND COMMENTARY
TWELVE MONTHS ENDED JUNE 30, 2017 (Unaudited) (continued)
AVERAGE ANNUAL TOTAL RETURNS AS OF JUNE 30, 2017 | ||||||||||||||
| INCEPTION DATE OF CLASS | 1 YEAR | 5 YEAR | 10 YEAR | |||||||||||
CLASS A SHARES | November 2, 2009 | |||||||||||||
With Sales Charge* | 10.46 | % | 13.10 | % | 7.25 | % | ||||||||
Without Sales Charge | 16.59 | 14.33 | 7.83 | |||||||||||
CLASS C SHARES | November 2, 2009 | |||||||||||||
With CDSC** | 15.01 | 13.76 | 7.42 | |||||||||||
Without CDSC | 16.01 | 13.76 | 7.42 | |||||||||||
CLASS I SHARES (FORMERLY SELECT CLASS SHARES) | January 1, 1997 | 16.99 | 14.73 | 8.12 | ||||||||||
CLASS R2 SHARES | March 14, 2014 | 16.30 | 14.14 | 7.74 | ||||||||||
CLASS R5 SHARES | March 14, 2014 | 17.11 | 14.81 | 8.15 | ||||||||||
CLASS R6 SHARES | March 14, 2014 | 17.18 | 14.85 | 8.17 | ||||||||||
| * | Sales Charge for Class A Shares is 5.25%. |
| ** | Assumes a 1% CDSC (contingent deferred sales charge) for the one year period and 0% CDSC thereafter. |
TEN YEAR PERFORMANCE (6/30/07 TO 6/30/17)
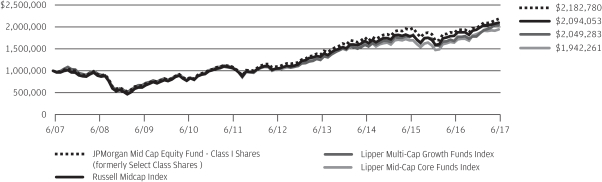
The performance quoted is past performance and is not a guarantee of future results. Mutual funds are subject to certain market risks. Investment returns and principal value of an investment will fluctuate so that an investor’s shares, when redeemed, may be worth more or less than their original cost. Current performance may be higher or lower than the performance data shown. For up-to-date month-end performance information please call 1-800-480-4111.
Returns for Class A and Class C Shares prior to their inception date are based on the performance of Class I Shares. The actual returns of Class A and Class C Shares would have been lower than those shown because Class A and Class C Shares have higher expenses than Class I Shares.
Returns for Class R2 Shares prior to their inception date are based on the performance of Class A Shares from November 2, 2009 to March 13, 2014 and Class I Shares prior to November 2, 2009. The actual returns of Class R2 Shares would have been lower than those shown because Class R2 Shares have higher expenses than Class A and Class I Shares.
Returns for Class R5 and Class R6 Shares prior to their inception date are based on the performance of Class I Shares. The actual returns of Class R5 and Class R6 Shares would have been different because Class R5 and Class R6 Shares have different expenses than Class I Shares.
The graph illustrates comparative performance for $1,000,000 invested in the Class I Shares of JPMorgan Mid Cap Equity Fund, the Russell Midcap Index, the Lipper Multi-Cap Core Funds Index and the Lipper Multi-Cap Growth Funds Index from June 30, 2007 to June 30, 2017 . The performance of the Fund
assumes reinvestment of all dividends and capital gain distributions, if any, and does not include a sales charge. The performance of the Russell Midcap Index does not reflect the deduction of expenses or a sales charge associated with a mutual fund and has been adjusted to reflect reinvestment of all dividends and capital gain distributions of the securities included in the benchmark, if applicable. The performance of the Lipper Mid-Cap Core Funds Index and the Lipper Multi-Cap Growth Funds Index includes expenses associated with a mutual fund, such as investment management fees. These expenses are not identical to the expenses incurred by the Fund. The Russell Midcap Index is an unmanaged index which measures the performance of the 800 smallest companies in the Russell 1000 Index. The Lipper Mid-Cap Core Funds Index and the Lipper Multi-Cap Growth Funds Index are indices based on total returns of certain mutual funds within the mid cap fund categories as determined by Lipper, Inc. Investors cannot invest directly in an index.
Class I Shares have a $1,000,000 minimum initial investment.
Fund performance may reflect the waiver of the Fund’s fees and reimbursement of expenses for certain periods since the inception date. Without these waivers and reimbursements, performance would have been lower. Also, performance shown in this section does not reflect the deduction of taxes that a shareholder would pay on Fund distributions or redemptions of Fund shares.
The returns shown are based on net asset values calculated for shareholder transactions and may differ from the returns shown in the financial highlights, which reflect adjustments made to the net asset values in accordance with accounting principles generally accepted in the United States of America.
| 6 | �� | J.P. MORGAN MID CAP/MULTI-CAP FUNDS | JUNE 30, 2017 | |||
Table of Contents
FUND COMMENTARY
TWELVE MONTHS ENDED JUNE 30, 2017 (Unaudited)
| REPORTING PERIOD RETURN: | ||||
| Fund (Class I Shares)(1)* | 19.89% | |||
| Russell Midcap Growth Index | 17.05% | |||
| Net Assets as of 6/30/2017 (In Thousands) | $ | 3,088,278 | ||
INVESTMENT OBJECTIVE**
The JPMorgan Mid Cap Growth Fund (the “Fund”) seeks growth of capital.
WHAT WERE THE MAIN DRIVERS OF THE FUND’S PERFORMANCE?
The Fund’s Class I Shares outperformed the Russell Midcap Growth Index (the “Benchmark”) for the twelve months ended June 30, 2017. The Fund’s overweight position and security selection in the technology sector and its security selection in the consumer discretionary sector were leading contributors to performance relative to the Benchmark. The Fund’s security selection in the health care and materials & process sectors was a leading detractor from relative performance.
Leading individual contributors to relative performance included the Fund’s overweight positions in Kite Pharma Inc., Arista Networks Inc. and East West Bancorp Inc. Shares of Kite Pharma, a maker of anti-cancer treatments that was not held in the Benchmark, rose on positive results from drug trials. Shares of Arista Networks, a maker of computer networking technology, rose as the company reported four consecutive quarters of earnings growth. Shares of East West Bancorp, a California regional bank, rose on investor expectations for rising interest rates in the U.S.
Leading individual detractors from relative performance included the Fund’s overweight positions in Range Resources Corp., Acuity Brands Inc. and Dollar General Corp. Shares of Range Resources, a natural gas producer that was not held in the Benchmark, fell amid a decline in global gas prices in the second half of the reporting period. Shares of Acuity Brands, a maker of lighting and building management systems, fell after the company reported lower-than-expected earnings. Shares of Dollar General, a discount retail chain, fell after the company reported lower-than-expected sales and a slump in earnings.
HOW WAS THE FUND POSITIONED?
The Fund’s portfolio managers utilized a bottom-up approach to stock selection, researching individual companies in an effort to construct a portfolio of stocks that have strong fundamentals. The Fund’s portfolio managers sought to invest in high quality companies with durable franchises that, in their view, possessed the ability to generate strong future earnings growth.
| TOP TEN EQUITY HOLDINGS OF THE PORTFOLIO*** | ||||||||
| 1. | Waste Connections, Inc., (Canada) | 3.1 | % | |||||
| 2. | Mohawk Industries, Inc. | 2.7 | ||||||
| 3. | Amphenol Corp., Class A | 1.9 | ||||||
| 4. | Global Payments, Inc. | 1.7 | ||||||
| 5. | Gartner, Inc. | 1.7 | ||||||
| 6. | Concho Resources, Inc. | 1.6 | ||||||
| 7. | Hilton Worldwide Holdings, Inc. | 1.6 | ||||||
| 8. | Electronic Arts, Inc. | 1.6 | ||||||
| 9. | Lennox International, Inc. | 1.6 | ||||||
| 10. | Southwest Airlines Co. | 1.5 | ||||||
PORTFOLIO COMPOSITION BY SECTOR*** | ||||
| Information Technology | 27.6 | % | ||
| Industrials | 19.7 | |||
| Consumer Discretionary | 18.1 | |||
| Health Care | 13.6 | |||
| Financials | 9.5 | |||
| Materials | 2.5 | |||
| Energy | 2.1 | |||
| Real Estate | 1.3 | |||
| Consumer Staples | 1.1 | |||
| Short-Term Investment | | 4.5 | | |
| * | The return shown is based on net asset values calculated for shareholder transactions and may differ from the return shown in the financial highlights, which reflects adjustments made to the net asset values in accordance with accounting principles generally accepted in the United States of America. |
| ** | The adviser seeks to achieve the Fund’s objective. There can be no guarantee it will be achieved. |
| *** | Percentages indicated are based on total investments as of June 30 2017. The Fund’s portfolio composition is subject to change. |
| (1) | On April 3, 2017, the Fund’s Select Class Shares were renamed Class I Shares. |
| JUNE 30, 2017 | J.P. MORGAN MID CAP/MULTI-CAP FUNDS | 7 | ||||||
Table of Contents
JPMorgan Mid Cap Growth Fund
FUND COMMENTARY
TWELVE MONTHS ENDED JUNE 30, 2017 (Unaudited) (continued)
AVERAGE ANNUAL TOTAL RETURNS AS OF JUNE 30, 2017 | ||||||||||||||
| INCEPTION DATE OF CLASS | 1 YEAR | 5 YEAR | 10 YEAR | |||||||||||
CLASS A SHARES | February 18, 1992 | |||||||||||||
With Sales Charge* | 13.24 | % | 13.51 | % | 7.19 | % | ||||||||
Without Sales Charge | 19.52 | 14.74 | 7.77 | |||||||||||
CLASS C SHARES | November 4, 1997 | |||||||||||||
With CDSC** | 17.87 | 14.16 | 7.20 | |||||||||||
Without CDSC | 18.87 | 14.16 | 7.20 | |||||||||||
CLASS I SHARES (FORMERLY SELECT CLASS SHARES) | March 2, 1989 | 19.89 | 15.10 | 8.10 | ||||||||||
CLASS R2 SHARES | June 19, 2009 | 19.30 | 14.55 | 7.60 | ||||||||||
CLASS R3 SHARES | September 9, 2016 | 19.51 | 14.74 | 7.77 | ||||||||||
CLASS R4 SHARES | September 9, 2016 | 19.83 | 15.03 | 8.05 | ||||||||||
CLASS R5 SHARES | November 1, 2011 | 20.06 | 15.26 | 8.19 | ||||||||||
CLASS R6 SHARES | November 1, 2011 | 20.11 | 15.31 | 8.22 | ||||||||||
| * | Sales Charge for Class A Shares is 5.25%. |
| ** | Assumes a 1% CDSC (contingent deferred sales charge) for the one year period and 0% CDSC thereafter. |
TEN YEAR PERFORMANCE (6/30/07 TO 6/30/17)
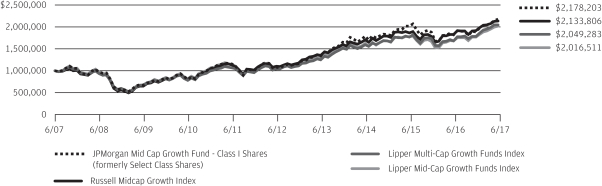
The performance quoted is past performance and is not a guarantee of future results. Mutual funds are subject to certain market risks. Investment returns and principal value of an investment will fluctuate so that an investor’s shares, when redeemed, may be worth more or less than their original cost. Current performance may be higher or lower than the performance data shown. For up-to-date month-end performance information please call 1-800-480-4111.
Returns for the Class R2, Class R3, Class R4, Class R5 and Class R6 Shares prior to their inception dates are based on the performance of Class I Shares. Prior performance for Class R2, Class R3 and Class R4 Shares has been adjusted to reflect the differences in expenses between classes. The actual returns of Class R5 and Class R6 Shares would have been different than those shown because Class R5 and Class R6 Shares have different expenses than Class I Shares.
The graph illustrates comparative performance for $1,000,000 invested in Class I Shares of the JPMorgan Mid Cap Growth Fund, the Russell Midcap Growth Index, the Lipper Mid-Cap Growth Funds Index and the Lipper Multi-Cap Growth Funds Index from June 30, 2007 to June 30, 2017. The performance of the Fund assumes reinvestment of all dividends and capital gain distributions, if any, and does not include a sales charge. The performance of the Russell Midcap Growth Index does not reflect the deduction of expenses or a sales charge associated with a mutual fund and has been adjusted to reflect reinvestment of all dividends and capital gain distributions of the securities included in the
benchmark, if applicable. The performance of the Lipper Mid-Cap Growth Funds Index and the Lipper Multi-Cap Growth Funds Index includes expenses associated with a mutual fund, such as investment management fees. These expenses are not identical to the expenses incurred by the Fund. The Russell Midcap Growth Index is an unmanaged index which measures the performance of those Russell Midcap companies with higher price-to-book ratios and higher forecasted growth values. The Lipper Mid-Cap Growth Funds Index and the Lipper Multi-Cap Growth Funds Index are indices based on total returns of certain mutual funds as determined by Lipper, Inc. Investors cannot invest directly in an index.
Class I Shares have a $1,000,000 minimum initial investment.
Fund performance may reflect the waiver of the Fund’s fees and reimbursement of expenses for certain periods since the inception date. Without these waivers and reimbursements, performance would have been lower. Also, performance shown in this section does not reflect the deduction of taxes that a shareholder would pay on Fund distributions or redemptions of Fund shares.
The returns shown are based on net asset values calculated for shareholder transactions and may differ from the returns shown in the financial highlights, which reflect adjustments made to the net asset values in accordance with accounting principles generally accepted in the United States of America.
| 8 | J.P. MORGAN MID CAP/MULTI-CAP FUNDS | JUNE 30, 2017 | ||||
Table of Contents
FUND COMMENTARY
TWELVE MONTHS ENDED JUNE 30, 2017 (Unaudited)
| REPORTING PERIOD RETURN: | ||||
| Fund (Class L Shares)(1)* | 14.39% | |||
| Russell Midcap Value Index | 15.93% | |||
| Net Assets as of 6/30/2017 (In Thousands) | $ | 18,403,012 | ||
INVESTMENT OBJECTIVE**
The JPMorgan Mid Cap Value Fund (the “Fund”) seeks growth from capital appreciation.
WHAT WERE THE MAIN DRIVERS OF THE FUND’S PERFORMANCE?
The Fund’s Class L Shares underperformed the Russell Midcap Value Index (the “Benchmark”) for the twelve months ended June 30, 2017. The Fund’s security selection and underweight position in the industrials sector and its security selection and overweight position in the consumer staples sector were leading detractors from performance relative to the Benchmark. The Fund’s underweight position in the energy sector and its overweight position in the financials sector were leading contributors to relative performance.
Leading individual detractors from relative performance included the Fund’s overweight positions in AutoZone Inc., Kroger Co. and EQT Corp. Shares of AutoZone, an auto parts retailer and distributor, fell after the company reported lower-than-expected earnings and sales. Shares of Kroger, a supermarket chain not held in the Benchmark, fell amid investor expectations that Amazon.com Inc.’s acquisition of Whole Foods Market Inc. would hurt Kroger’s sales and profit margins. Shares of EQT, a natural gas producer, fell amid weakness in natural gas prices and after the company announced its $6.7 billion takeover offer for Rice Energy Inc.
Leading individual contributors to relative performance included the Fund’s overweight positions in WestRock Co., Humana Inc. and Best Buy Inc. Shares of WestRock, a paper and packaging manufacturer, rose after the company reported better-than-expected earnings and sales growth. Shares of Humana, a health insurance company not held in the Benchmark, rose after it agreed to terminate its proposed merger with Aetna Inc. Shares of Best Buy, a consumer electronics retail chain, rose after the company reported better-than-expected sales growth.
HOW WAS THE FUND POSITIONED?
The Fund’s portfolio managers utilized a bottom-up approach to stock selection and sought to identify durable franchises
possessing the ability to generate, in their view, sustainable levels of free cash flow.
| TOP TEN EQUITY HOLDINGS OF THE PORTFOLIO*** | ||||||||
| 1. | Mohawk Industries, Inc. | 2.0 | % | |||||
| 2. | Loews Corp. | 1.8 | ||||||
| 3. | Energen Corp. | 1.8 | ||||||
| 4. | EQT Corp. | 1.7 | ||||||
| 5. | M&T Bank Corp. | 1.7 | ||||||
| 6. | Expedia, Inc. | 1.6 | ||||||
| 7. | Ball Corp. | 1.5 | ||||||
| 8. | Xcel Energy, Inc. | 1.5 | ||||||
| 9. | CMS Energy Corp. | 1.5 | ||||||
| 10. | Newell Brands, Inc. | 1.5 | ||||||
PORTFOLIO COMPOSITION BY SECTOR*** | ||||
| Financials | 22.1 | % | ||
| Consumer Discretionary | 17.0 | |||
| Real Estate | 9.7 | |||
| Information Technology | 9.4 | |||
| Utilities | 8.6 | |||
| Industrials | 7.5 | |||
| Consumer Staples | 5.9 | |||
| Energy | 5.6 | |||
| Health Care | 5.2 | |||
| Materials | 4.7 | |||
| Short-Term Investment | 4.3 | |||
| * | The return shown is based on net asset values calculated for shareholder transactions and may differ from the return shown in the financial highlights, which reflects adjustments made to the net asset values in accordance with accounting principles generally accepted in the United States of America. |
| ** | The adviser seeks to achieve the Fund’s objective. There can be no guarantee it will be achieved. |
| *** | Percentages indicated are based on total investments as of June 30, 2017. The Fund’s portfolio composition is subject to change. |
| (1) | On December 1, 2016, the Fund’s Institutional Class Shares were renamed Class L Shares. |
| JUNE 30, 2017 | J.P. MORGAN MID CAP/MULTI-CAP FUNDS | 9 | ||||||
Table of Contents
JPMorgan Mid Cap Value Fund
FUND COMMENTARY
TWELVE MONTHS ENDED JUNE 30, 2017 (Unaudited) (continued)
AVERAGE ANNUAL TOTAL RETURNS AS OF JUNE 30, 2017 | ||||||||||||||
| INCEPTION DATE OF CLASS | 1 YEAR | 5 YEAR | 10 YEAR | |||||||||||
CLASS A SHARES | April 30, 2001 | |||||||||||||
With Sales Charge* | 7.86 | % | 12.76 | % | 7.25 | % | ||||||||
Without Sales Charge | 13.83 | 13.99 | 7.83 | |||||||||||
CLASS C SHARES | April 30, 2001 | |||||||||||||
With CDSC** | 12.24 | 13.41 | 7.28 | |||||||||||
Without CDSC | 13.24 | 13.41 | 7.28 | |||||||||||
CLASS I SHARES (FORMERLY SELECT CLASS SHARES) | October 31, 2001 | 14.12 | 14.27 | 8.10 | ||||||||||
CLASS L SHARES (FORMERLY INSTITUTIONAL SHARES) | November 13, 1997 | 14.39 | 14.55 | 8.37 | ||||||||||
CLASS R2 SHARES | November 3, 2008 | 13.53 | 13.69 | 7.59 | ||||||||||
CLASS R3 SHARES | September 9, 2016 | 13.85 | 13.99 | 7.83 | ||||||||||
CLASS R4 SHARES | September 9, 2016 | 14.09 | 14.26 | 8.10 | ||||||||||
CLASS R5 SHARES | September 9, 2016 | 14.34 | 14.54 | 8.36 | ||||||||||
CLASS R6 SHARES | September 9, 2016 | 14.41 | 14.55 | 8.37 | ||||||||||
| * | Sales Charge for Class A Shares is 5.25%. |
| ** | Assumes a 1% CDSC (contingent deferred sales charge) for the one year period and 0% CDSC thereafter. |
TEN YEAR PERFORMANCE (6/30/07 TO 6/30/17)
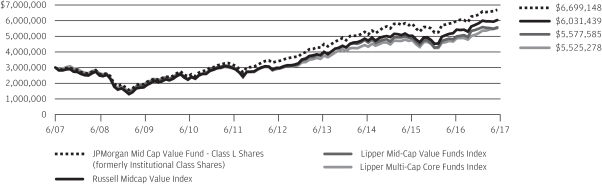
The performance quoted is past performance and is not a guarantee of future results. Mutual funds are subject to certain market risks. Investment returns and principal value of an investment will fluctuate so that an investor’s shares, when redeemed, may be worth more or less than their original cost. Current performance may be higher or lower than the performance data shown. For up-to-date month-end performance information please call 1-800-480-4111.
Returns for Class R2 and Class R3 Shares prior to their inception dates are based on the performance of Class A Shares. The actual returns of Class R2 and Class R3 Shares would have been lower than those shown because Class R2 and Class R3 Shares have higher expenses than Class A Shares.
Returns for the Class R4 Shares prior to their inception date are based on the performance of Class I Shares. The actual returns of Class R4 Shares would have been lower because Class R4 Shares have higher expenses than Class I Shares.
Returns for the Class R5 and R6 Shares prior to their inception dates are based on the performance of Class L Shares. The actual returns of Class R5 Shares would have been lower than those shown because Class R5 Shares have higher expenses than Class L Shares. The actual returns for Class R6 Shares would have been similar to those shown because Class R6 Shares have similar expenses to Class L Shares.
The graph illustrates comparative performance for $3,000,000 invested in Class L Shares of the JPMorgan Mid Cap Value Fund, the Russell Midcap Value Index, the Lipper Mid-Cap Value Funds Index and the Lipper Multi-Cap Core Funds Index from June 30, 2007 to June 30, 2017. The performance of the Fund assumes reinvestment of all dividends and capital gain distributions, if any, and
does not include a sales charge. The performance of the Russell Midcap Value Index does not reflect the deduction of expenses or a sales charge associated with a mutual fund and has been adjusted to reflect reinvestment of all dividends and capital gain distributions of the securities included in the benchmark, if applicable. The performance of the Lipper Mid-Cap Value Funds Index and the Lipper Multi-Cap Core Funds Index includes expenses associated with a mutual fund, such as investment management fees. These expenses are not identical to the expenses incurred by the Fund. The Russell Midcap Value Index is an unmanaged index which measures the performance of those Russell Midcap companies with lower price-to-book ratios and lower forecasted growth values. The Lipper Mid-Cap Value Funds Index and the Lipper Multi-Cap Core Funds Index are indices based on total returns of certain mutual funds within the mid cap and multi cap fund categories, respectively, as determined by Lipper, Inc. Investors cannot invest directly in an index.
Class L Shares have a $3,000,000 minimum initial investment.
Fund performance may reflect the waiver of the Fund’s fees and reimbursement of expenses for certain periods since the inception date. Without these waivers and reimbursements, performance would have been lower. Also, performance shown in this section does not reflect the deduction of taxes that a shareholder would pay on Fund distributions or redemptions of Fund shares.
The returns shown are based on net asset values calculated for shareholder transactions and may differ from the returns shown in the financial highlights, which reflect adjustments made to the net asset values in accordance with accounting principles generally accepted in the United States of America.
| 10 | J.P. MORGAN MID CAP/MULTI-CAP FUNDS | JUNE 30, 2017 | ||||
Table of Contents
JPMorgan Multi-Cap Market Neutral Fund
FUND COMMENTARY
TWELVE MONTHS ENDED JUNE 30, 2017 (Unaudited)
| REPORTING PERIOD RETURN: | ||||
Fund (Class I Shares)(1)* | 0.99% | |||
| BofA Merrill Lynch 3-Month U.S. Treasury Bill Index | 0.49% | |||
| Net Assets as of 6/30/17 (In Thousands) | $ | 124,385 | ||
INVESTMENT OBJECTIVE**
The JPMorgan Multi-Cap Market Neutral Fund (the “Fund”) seeks long-term capital preservation and growth by using strategies designed to produce returns which have no correlation with general domestic market performance.
WHAT WERE THE MAIN DRIVERS OF THE FUND’S PERFORMANCE?
The Fund’s Class I Shares outperformed the BofA Merrill Lynch 3-Month U.S. Treasury Bill Index (the “Benchmark”) for the twelve months ended June 30, 2017. U.S. equity securities, which were not included in the Benchmark, generally outperformed U.S. Treasury bonds during the reporting period. The Fund’s overall security selection in the industrials and materials sectors helped the Fund’s performance relative to the Benchmark, while the Fund’s overall security selection in the energy and consumer discretionary sectors detracted from relative performance.
Leading individual contributors to Fund returns included its short positions in Under Armour Inc. and Frontier Communications Corp. and its long position in Best Buy Co. Shares of Under Armour, an athletics apparel maker, fell after the company posted a quarterly loss. Shares of Frontier Communications, a provider of voice, data and video services, fell after the company reduced its quarterly dividend and reported lower-than-expected earnings. Shares of Best Buy, a consumer electronics retail chain, rose after the company reported better-than-expected sales growth.
Leading individual detractors from Fund returns included its short positions in Tesla Inc., Sprint Corp. and Wayfair Inc. Shares of Tesla, a maker of electric cars, rose on continued strong demand for its automobiles. Shares of Sprint, a telecommunications provider, rose on news reports that the company was engaged in merger negotiations. Shares of Wayfair, an online retailer of home furniture, rose after the company reported better-than-expected earnings and raised its earnings forecast.
HOW WAS THE FUND POSITIONED?
The Fund’s portfolio managers employed a bottom-up approach to stock selection, constructing a portfolio based on company fundamentals, quantitative screening and proprietary fundamental analysis. The Fund’s portfolio managers sought to identify dominant franchises with predictable business models deemed capable of achieving, in their view, sustained growth, as well as undervalued companies with the potential to grow their intrinsic value per share. Companies that ranked lowest based on these factors were selected by the Fund’s portfolio managers for possible short sales.
| TOP TEN LONG POSITIONS OF THE PORTFOLIO*** | ||||||||
| 1. | Restaurant Brands International, Inc., (Canada) | 1.2 | % | |||||
| 2. | Amgen, Inc. | 1.1 | ||||||
| 3. | Gilead Sciences, Inc. | 1.1 | ||||||
| 4. | Landstar System, Inc. | 1.1 | ||||||
| 5. | Allergan plc | 1.1 | ||||||
| 6. | Huntsman Corp. | 1.1 | ||||||
| 7. | ManpowerGroup, Inc. | 1.1 | ||||||
| 8. | Regal Beloit Corp. | 1.1 | ||||||
| 9. | Sirius XM Holdings, Inc. | 1.1 | ||||||
| 10. | International Business Machines Corp. | 1.0 | ||||||
| TOP TEN SHORT POSITIONS OF THE PORTFOLIO**** | ||||||||
| 1. | AMERCO | 1.4 | % | |||||
| 2. | NIKE, Inc., Class B | 1.3 | ||||||
| 3. | Sempra Energy . | 1.3 | ||||||
| 4. | Acuity Brands, Inc. | 1.3 | ||||||
| 5. | Ball Corp. | 1.3 | ||||||
| 6. | Bristol-Myers Squibb Co. | 1.2 | ||||||
| 7. | Zoetis, Inc. | 1.2 | ||||||
| 8. | People’s United Financial, Inc. | 1.2 | ||||||
| 9. | DexCom, Inc. | 1.2 | ||||||
| 10. | Envision Healthcare Corp. | 1.2 | ||||||
| JUNE 30, 2017 | J.P. MORGAN MID CAP/MULTI-CAP FUNDS | 11 | ||||||
Table of Contents
JPMorgan Multi-Cap Market Neutral Fund
FUND COMMENTARY
TWELVE MONTHS ENDED JUNE 30, 2017 (Unaudited) (continued)
LONG POSITION PORTFOLIO COMPOSITION BY SECTOR*** | ||||
Information Technology | 22.2 | % | ||
Industrials . | 17.1 | |||
Consumer Discretionary | 14.3 | |||
Health Care | 12.8 | |||
Consumer Staples | 5.5 | |||
Financials | 5.5 | |||
Materials | 4.4 | |||
Utilities | 4.0 | |||
Real Estate | 1.6 | |||
Energy | 1.5 | |||
Telecommunication Services | 0.3 | |||
Short-Term Investment | 10.8 | |||
SHORT POSITION PORTFOLIO COMPOSITION BY SECTOR**** | ||||
| Information Technology | 24.8 | % | ||
Industrials | 19.6 | |||
Consumer Discretionary | 16.1 | |||
| Health Care | 14.5 | |||
Financials | 7.0 | |||
| Consumer Staples | 5.6 | |||
Materials | 5.1 | |||
Utilities | 3.8 | |||
Real Estate | 1.7 | |||
| Energy | 1.2 | |||
| Telecommunication Services | 0.6 | |||
| * | The return shown is based on net asset values calculated for shareholder transactions and may differ from the return shown in the financial highlights, which reflects adjustments made to the net asset values in accordance with accounting principles generally accepted in the United States of America. |
| ** | The adviser seeks to achieve the Fund’s objective. There can be no guarantee it will be achieved. |
| *** | Percentages indicated are based on total long investments as of June 30, 2017. The Fund’s portfolio composition is subject to change. |
| **** | Percentages indicated are based on total short investments as of June 30, 2017. The Fund’s portfolio composition is subject to change. |
| (1) | On April 3, 2017, the Fund’s Select Class Shares were renamed Class I Shares. |
| 12 | J.P. MORGAN MID CAP/MULTI-CAP FUNDS | JUNE 30, 2017 | ||||
Table of Contents
AVERAGE ANNUAL TOTAL RETURNS AS OF JUNE 30, 2017 | ||||||||||||||
| INCEPTION DATE OF CLASS | 1 YEAR | 5 YEAR | 10 YEAR | |||||||||||
CLASS A SHARES | May 23, 2003 | |||||||||||||
With Sales Charge* | (4.59 | )% | (0.51 | )% | (1.20 | )% | ||||||||
Without Sales Charge | 0.71 | 0.57 | (0.66 | ) | ||||||||||
CLASS C SHARES | May 23, 2003 | |||||||||||||
With CDSC** | (0.78 | ) | 0.02 | (1.31 | ) | |||||||||
Without CDSC | 0.22 | 0.02 | (1.31 | ) | ||||||||||
CLASS I SHARES (FORMERLY SELECT CLASS SHARES) | May 23, 2003 | 0.99 | 0.82 | (0.42 | ) | |||||||||
| * | Sales Charge for Class A Shares is 5.25%. |
| ** | Assumes a 1% CDSC (contingent deferred sales charge) for the one year periods and 0% CDSC thereafter. |
TEN YEAR PERFORMANCE (6/30/07 TO 6/30/17)
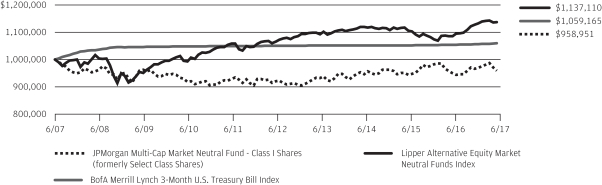
The performance quoted is past performance and is not a guarantee of future results. Mutual funds are subject to certain market risks. Investment returns and principal value of an investment will fluctuate so that an investor’s shares, when redeemed, may be worth more or less than their original cost. Current performance may be higher or lower than the performance data shown. For up-to-date month-end performance information please call 1-800-480-4111.
The graph illustrates comparative performance for $1,000,000 invested in Class I Shares of the JPMorgan Multi-Cap Market Neutral Fund, the BofA Merrill Lynch 3-Month U.S. Treasury Bill Index and the Lipper Alternative Equity Market Neutral Funds Index from June 30, 2007 to June 30, 2017. The performance of the Fund assumes reinvestment of all dividends and capital gain distributions, if any, and does not include a sales charge. The performance of the BofA Merrill Lynch 3-Month U.S. Treasury Bill Index does not reflect the deduction of expenses or a sales charge associated with a mutual fund and has been adjusted to reflect reinvestment of all dividends and capital gain distributions of the securities included in the benchmark, if applicable. The performance of the Lipper Alternative Equity Market Neutral Funds Index includes expenses associated with a mutual fund, such as investment management fees. These expenses are not identical to the expenses incurred by the Fund. The BofA
Merrill Lynch 3-Month U.S. Treasury Bill Index is comprised of a single issue purchased at the beginning of the month and held for a full month. Each month the index is rebalanced and the issue selected is the outstanding Treasury Bill that matures closest to, but not beyond, 3 months from the rebalancing date. The Lipper Alternative Equity Market Neutral Funds Index is an index based on total returns of certain mutual funds within the Fund’s designated category as determined by Lipper, Inc. Investors cannot invest directly in an index.
Class I Shares have a $1,000,000 minimum initial investment.
Fund performance may reflect the waiver of the Fund’s fees and reimbursement of expenses for certain periods since the inception date. Without these waivers and reimbursements, performance would have been lower. Also, performance shown in this section does not reflect the deduction of taxes that a shareholder would pay on Fund distributions or redemptions of Fund shares.
The returns shown are based on net asset values calculated for shareholder transactions and may differ from the returns shown in the financial highlights, which reflect adjustments made to the net asset values in accordance with accounting principles generally accepted in the United States of America.
| JUNE 30, 2017 | J.P. MORGAN MID CAP/MULTI-CAP FUNDS | 13 | ||||||
Table of Contents
FUND COMMENTARY
TWELVE MONTHS ENDED JUNE 30, 2017 (Unaudited)
| REPORTING PERIOD RETURN: | ||||
| Fund (Class L Shares)(1)* | 18.17% | |||
| Russell 3000 Value Index | 16.21% | |||
| Net Assets as of 6/30/2017 (In Thousands) | $ | 11,058,026 | ||
INVESTMENT OBJECTIVE**
The JPMorgan Value Advantage Fund (the “Fund”) seeks to provide long-term total return from a combination of income and capital gains.
WHAT WERE THE MAIN DRIVERS OF THE FUND’S PERFORMANCE?
The Fund’s Class L Shares outperformed the Russell 3000 Value Index (the “Benchmark”) for the twelve months ended June 30, 2017. The Fund’s underweight position and security selection in the energy sector and its overweight position in the financials sector were leading contributors to performance relative to the Benchmark, while the Fund’s security selection in the consumer staples sector and its underweight position in the information technology sector were leading detractors from relative performance.
Leading individual contributors to performance relative to the Benchmark included the Fund’s underweight positions in General Electric Co. and Berkshire Hathaway Inc. and its overweight position in Delta Air Lines Inc. Shares of General Electric, an industrial conglomerate not held in the Fund, fell amid investor concerns about the company’s strategic direction under a new chief executive. Shares of Berkshire Hathaway, an investment management company that was not held by the Fund, fell after the company reported lower earnings. Shares of Delta Air Lines, an airline operator, rose after the company raised its annual dividend, unveiled a $5 billion stock repurchase program and forecast profit margin expansion.
Leading individual detractors from relative performance included the Fund’s overweight positions in AutoZone Inc., Loews Corp. and Kroger Co. Shares of AutoZone, an auto parts retailer and distributor, fell after the company reported lower-than-expected earnings and sales. Shares of Loews, an investment management company, fell as the company underperformed its peers and announced a $1.2 billion purchase of Consolidated Container Co. Shares of Kroger, a supermarket chain, fell amid investor expectations that Amazon.com Inc.’s acquisition of Whole Foods Market Inc. would hurt Kroger’s sales and profit margins.
HOW WAS THE FUND POSITIONED?
The Fund’s portfolio managers utilized a bottom-up approach to stock selection and sought to identify durable franchises possessing the ability to generate, in the portfolio managers’
view, significant levels of free cash flow. During the reporting period, the Fund’s largest average overweight position remained the consumer discretionary sector, where the Fund’s portfolio managers found what they believed to be compelling investment opportunities. The Fund’s largest average underweight position was in the energy sector.
| TOP TEN EQUITY HOLDINGS OF THE PORTFOLIO*** | ||||||||
| 1. | Wells Fargo & Co. | 3.5 | % | |||||
| 2. | Bank of America Corp. | 2.6 | ||||||
| 3. | Pfizer, Inc. | 2.3 | ||||||
| 4. | Capital One Financial Corp. | 2.1 | ||||||
| 5. | Exxon Mobil Corp. | 1.9 | ||||||
| 6. | Delta Air Lines, Inc. | 1.9 | ||||||
| 7. | Loews Corp. | 1.8 | ||||||
| 8. | Johnson & Johnson | 1.7 | ||||||
| 9. | American International Group, Inc. | 1.5 | ||||||
| 10. | PNC Financial Services Group, Inc. (The) | 1.5 | ||||||
PORTFOLIO COMPOSITION BY SECTOR*** | ||||
| Financials | 30.6 | % | ||
| Consumer Discretionary | 14.4 | |||
| Health Care | 9.8 | |||
| Energy | 7.4 | |||
| Information Technology | 6.6 | |||
| Industrials | 6.4 | |||
| Consumer Staples | 6.2 | |||
| Real Estate | 5.5 | |||
| Utilities | 5.3 | |||
| Materials | 3.9 | |||
| Telecommunication Services | 0.7 | |||
| Short-Term Investment | 3.2 | |||
| * | The return shown is based on net asset values calculated for shareholder transactions and may differ from the return shown in the financial highlights, which reflects adjustments made to the net asset values in accordance with accounting principles generally accepted in the United States of America. |
| ** | The adviser seeks to achieve the Fund’s objective. There can be no guarantee it will be achieved. |
| *** | Percentages indicated are based on total investments as of June 30, 2017. The Fund’s portfolio composition is subject to change. |
| (1) | On December 1, 2016, the Fund’s Institutional Class Shares were renamed Class L Shares. |
| 14 | J.P. MORGAN MID CAP/MULTI-CAP FUNDS | JUNE 30, 2017 | ||||
Table of Contents
AVERAGE ANNUAL TOTAL RETURNS AS OF JUNE 30, 2017 | ||||||||||||||||
| INCEPTION DATE OF CLASS | 1 YEAR | 5 YEAR | 10 YEAR | |||||||||||||
CLASS A SHARES | February 28, 2005 | |||||||||||||||
With Sales Charge* | 11.42 | % | 11.96 | % | 6.88 | % | ||||||||||
Without Sales Charge | 17.60 | 13.18 | 7.45 | |||||||||||||
CLASS C SHARES | February 28, 2005 | |||||||||||||||
With CDSC** | 15.98 | 12.61 | 6.92 | |||||||||||||
Without CDSC | 16.98 | 12.61 | 6.92 | |||||||||||||
CLASS I SHARES (FORMERLY SELECT CLASS SHARES) | February 28, 2005 | 17.89 | 13.45 | 7.72 | ||||||||||||
CLASS L SHARES (FORMERLY INSTITUTIONAL SHARES) | February 28, 2005 | 18.17 | 13.74 | 8.00 | ||||||||||||
CLASS R3 SHARES | September 9, 2016 | 17.55 | 13.17 | 7.45 | ||||||||||||
CLASS R4 SHARES | September 9, 2016 | 17.90 | 13.46 | 7.72 | ||||||||||||
CLASS R5 SHARES | September 9, 2016 | 18.10 | 13.73 | 7.99 | ||||||||||||
CLASS R6 SHARES | September 9, 2016 | 18.15 | 13.74 | 8.00 | ||||||||||||
| * | Sales Charge for Class A Shares is 5.25%. |
| ** | Assumes a 1% CDSC (contingent deferred sales charge) for the one year period and 0% CDSC thereafter. |
TEN YEAR PERFORMANCE (6/30/07 TO 6/30/17)
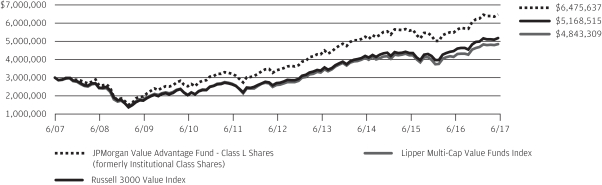
The performance quoted is past performance and is not a guarantee of future results. Mutual funds are subject to certain market risks. Investment returns and principal value of an investment will fluctuate so that an investor’s shares, when redeemed, may be worth more or less than their original cost. Current performance may be higher or lower than the performance data shown. For up-to-date month-end performance information please call 1-800-480-4111.
Returns for Class R3 Shares prior to their inception date are based on the performance of Class A Shares. The actual returns of Class R3 Shares would have been lower than those shown because Class R3 Shares have higher expenses than Class A Shares.
Returns for the Class R4 Shares prior to their inception date are based on the performance of Class I Shares. The actual returns of Class R4 Shares would have been lower because Class R4 Shares have higher expenses than Class I Shares.
Returns for the Class R5 and R6 Shares prior to their inception dates are based on the performance of Class L Shares. The actual returns of Class R5 Shares would have been lower than those shown because Class R5 Shares have higher expenses than Class L Shares. The actual returns for Class R6 Shares would have been similar to those shown because Class R6 Shares have similar expenses to Class L Shares.
The graph illustrates comparative performance for $3,000,000 invested in Class L Shares of the JPMorgan Value Advantage Fund, the Russell 3000 Value Index and the Lipper Multi-Cap Value Funds Index from June 30, 2007 to June 30, 2017. The performance of the Fund assumes reinvestment of all divi-
dends and capital gain distributions, if any, and does not include a sales charge. The performance of the Russell 3000 Value Index does not reflect the deduction of expenses or a sales charge associated with a mutual fund and has been adjusted to reflect reinvestment of all dividends and capital gain distributions of the securities included in the benchmark, if applicable. The performance of the Lipper Multi-Cap Value Funds Index includes expenses associated with a mutual fund, such as investment management fees. These expenses are not identical to the expenses incurred by the Fund. The Russell 3000 Value Index is an unmanaged index which measures the performance of those Russell 3000 companies (largest 3000 U.S. companies) with lower price-to-book ratios and lower forecasted growth values. The Lipper Multi-Cap Value Funds Index is an index based on total returns of certain mutual funds within the Fund’s designated category as determined by Lipper, Inc. Investors cannot invest directly in an index.
Class L Shares have a $3,000,000 minimum initial investment.
Fund performance may reflect the waiver of the Fund’s fees and reimbursement of expenses for certain periods since the inception date. Without these waivers and reimbursements, performance would have been lower. Also, performance shown in this section does not reflect the deduction of taxes that a shareholder would pay on Fund distributions or redemptions of Fund shares.
The returns shown are based on net asset values calculated for shareholder transactions and may differ from the returns shown in the financial highlights, which reflect adjustments made to the net asset values in accordance with accounting principles generally accepted in the United States of America.
| JUNE 30, 2017 | J.P. MORGAN MID CAP/MULTI-CAP FUNDS | 15 | ||||||
Table of Contents
JPMorgan Growth Advantage Fund
SCHEDULE OF PORTFOLIO INVESTMENTS
AS OF JUNE 30, 2017
(Amounts in thousands)
| SHARES | SECURITY DESCRIPTION | VALUE($) | ||||||
Common Stocks — 97.3% | ||||||||
Consumer Discretionary — 15.6% |
| |||||||
Automobiles — 0.7% |
| |||||||
| 142 | Tesla, Inc. (a) | 51,276 | ||||||
|
| |||||||
Distributors — 0.8% | ||||||||
| 1,721 | LKQ Corp. (a) | 56,707 | ||||||
|
| |||||||
Hotels, Restaurants & Leisure — 3.4% | ||||||||
| 1,121 | Hilton Grand Vacations, Inc. (a) | 40,436 | ||||||
| 1,261 | Hilton Worldwide Holdings, Inc. | 78,001 | ||||||
| 1,018 | Norwegian Cruise Line Holdings Ltd. (a) | 55,251 | ||||||
| 1,142 | Starbucks Corp. | 66,613 | ||||||
|
| |||||||
| 240,301 | ||||||||
|
| |||||||
Household Durables — 2.3% | ||||||||
| 675 | Mohawk Industries, Inc. (a) | 163,117 | ||||||
|
| |||||||
Internet & Direct Marketing Retail — 7.6% | ||||||||
| 312 | Amazon.com, Inc. (a) | 302,210 | ||||||
| 427 | Netflix, Inc. (a) | 63,813 | ||||||
| 66 | Priceline Group, Inc. (The) (a) | 123,454 | ||||||
| 617 | Wayfair, Inc., Class A (a) | 47,466 | ||||||
|
| |||||||
| 536,943 | ||||||||
|
| |||||||
Multiline Retail — 0.2% | ||||||||
| 327 | Nordstrom, Inc. | 15,616 | ||||||
|
| |||||||
Specialty Retail — 0.6% | ||||||||
| 143 | Ulta Beauty, Inc. (a) | 41,090 | ||||||
|
| |||||||
Total Consumer Discretionary | 1,105,050 | |||||||
|
| |||||||
Consumer Staples — 0.6% | ||||||||
Beverages — 0.6% | ||||||||
| 828 | Monster Beverage Corp. (a) | 41,120 | ||||||
|
| |||||||
Energy — 1.3% |
| |||||||
Oil, Gas & Consumable Fuels — 1.3% |
| |||||||
| 415 | Concho Resources, Inc. (a) | 50,459 | ||||||
| 479 | EOG Resources, Inc. | 43,359 | ||||||
|
| |||||||
Total Energy | 93,818 | |||||||
|
| |||||||
Financials — 7.5% |
| |||||||
Banks — 2.3% |
| |||||||
| 684 | Comerica, Inc. | 50,089 | ||||||
| 1,182 | East West Bancorp, Inc. | 69,241 | ||||||
| 480 | First Republic Bank | 48,068 | ||||||
|
| |||||||
| 167,398 | ||||||||
|
| |||||||
Capital Markets — 5.2% | ||||||||
| 149 | BlackRock, Inc. | 62,812 | ||||||
| 3,093 | Charles Schwab Corp. (The) | 132,880 | ||||||
| 682 | Lazard Ltd., Class A | 31,601 | ||||||
| 628 | Nasdaq, Inc. | 44,889 | ||||||
| SHARES | SECURITY DESCRIPTION | VALUE($) | ||||||
Capital Markets — continued |
| |||||||
| 654 | S&P Global, Inc. | 95,521 | ||||||
|
| |||||||
| 367,703 | ||||||||
|
| |||||||
Total Financials | 535,101 | |||||||
|
| |||||||
Health Care — 14.5% |
| |||||||
Biotechnology — 4.3% |
| |||||||
| 1,354 | Exact Sciences Corp. (a) | 47,898 | ||||||
| 859 | Gilead Sciences, Inc. | 60,793 | ||||||
| 691 | Kite Pharma, Inc. (a) | 71,678 | ||||||
| 193 | Sage Therapeutics, Inc. (a) | 15,394 | ||||||
| 531 | Spark Therapeutics, Inc. (a) | 31,734 | ||||||
| 580 | Vertex Pharmaceuticals, Inc. (a) | 74,770 | ||||||
|
| |||||||
| 302,267 | ||||||||
|
| |||||||
Health Care Equipment & Supplies — 0.5% | ||||||||
| 40 | Intuitive Surgical, Inc. (a) | 37,041 | ||||||
|
| |||||||
Health Care Providers & Services — 6.0% | ||||||||
| 1,924 | Acadia Healthcare Co., Inc. (a) | 95,022 | ||||||
| 315 | Humana, Inc. | 75,795 | ||||||
| 659 | Teladoc, Inc. (a) | 22,857 | ||||||
| 1,263 | UnitedHealth Group, Inc. | 234,186 | ||||||
|
| |||||||
| 427,860 | ||||||||
|
| |||||||
Health Care Technology — 1.2% |
| |||||||
| 1,699 | Evolent Health, Inc., Class A (a) | 43,064 | ||||||
| 704 | Veeva Systems, Inc., Class A (a) | 43,150 | ||||||
|
| |||||||
| 86,214 | ||||||||
|
| |||||||
Life Sciences Tools & Services — 0.9% |
| |||||||
| 341 | Illumina, Inc. (a) | 59,188 | ||||||
|
| |||||||
Pharmaceuticals — 1.6% |
| |||||||
| 425 | Jazz Pharmaceuticals plc (a) | 66,134 | ||||||
| 990 | Revance Therapeutics, Inc. (a) | 26,144 | ||||||
| 4,052 | TherapeuticsMD, Inc. (a) | 21,352 | ||||||
|
| |||||||
| 113,630 | ||||||||
|
| |||||||
Total Health Care | 1,026,200 | |||||||
|
| |||||||
Industrials — 13.8% |
| |||||||
Airlines — 2.1% |
| |||||||
| 974 | Delta Air Lines, Inc. | 52,332 | ||||||
| 1,610 | Southwest Airlines Co. | 100,070 | ||||||
|
| |||||||
| 152,402 | ||||||||
|
| |||||||
Building Products — 2.3% |
| |||||||
| 1,113 | Fortune Brands Home & Security, Inc. | 72,631 | ||||||
| 497 | Lennox International, Inc. | 91,251 | ||||||
|
| |||||||
| 163,882 | ||||||||
|
| |||||||
SEE NOTES TO FINANCIAL STATEMENTS.
| 16 | J.P. MORGAN MID CAP/MULTI-CAP FUNDS | JUNE 30, 2017 | ||||
Table of Contents
| SHARES | SECURITY DESCRIPTION | VALUE($) | ||||||
Common Stocks — continued | ||||||||
Commercial Services & Supplies — 3.2% |
| |||||||
| 1,044 | Copart, Inc. (a) | 33,196 | ||||||
| 3,040 | Waste Connections, Inc., (Canada) | 195,840 | ||||||
|
| |||||||
| 229,036 | ||||||||
|
| |||||||
Electrical Equipment — 0.9% |
| |||||||
| 305 | Acuity Brands, Inc. | 62,000 | ||||||
|
| |||||||
Machinery — 3.7% |
| |||||||
| 373 | John Bean Technologies Corp. | 36,515 | ||||||
| 292 | Middleby Corp. (The) (a) | 35,444 | ||||||
| 545 | Oshkosh Corp. | 37,512 | ||||||
| 627 | Stanley Black & Decker, Inc. | 88,238 | ||||||
| 533 | WABCO Holdings, Inc. (a) | 67,912 | ||||||
|
| |||||||
| 265,621 | ||||||||
|
| |||||||
Professional Services — 0.8% |
| |||||||
| 391 | Equifax, Inc. | 53,676 | ||||||
|
| |||||||
Road & Rail — 0.8% |
| |||||||
| 565 | Old Dominion Freight Line, Inc. | 53,854 | ||||||
|
| |||||||
Total Industrials | 980,471 | |||||||
|
| |||||||
Information Technology — 41.3% |
| |||||||
Communications Equipment — 1.3% |
| |||||||
| 384 | Arista Networks, Inc. (a) | 57,572 | ||||||
| 289 | Palo Alto Networks, Inc. (a) | 38,671 | ||||||
|
| |||||||
| 96,243 | ||||||||
|
| |||||||
Electronic Equipment, Instruments & Components — 2.4% |
| |||||||
| 1,125 | Amphenol Corp., Class A | 83,062 | ||||||
| 2,811 | Corning, Inc. | 84,459 | ||||||
|
| |||||||
| 167,521 | ||||||||
|
| |||||||
Internet Software & Services — 11.3% |
| |||||||
| 491 | Alphabet, Inc., Class C (a) | 446,101 | ||||||
| 1,821 | Facebook, Inc., Class A (a) | 274,965 | ||||||
| 1,948 | GoDaddy, Inc., Class A (a) | 82,613 | ||||||
|
| |||||||
| 803,679 | ||||||||
|
| |||||||
IT Services — 7.1% |
| |||||||
| 953 | Global Payments, Inc. | 86,084 | ||||||
| 993 | Mastercard, Inc., Class A | 120,612 | ||||||
| 1,586 | PayPal Holdings, Inc. (a) | 85,110 | ||||||
| 1,351 | Vantiv, Inc., Class A (a) | 85,572 | ||||||
| 1,363 | Visa, Inc., Class A | 127,794 | ||||||
|
| |||||||
| 505,172 | ||||||||
|
| |||||||
Semiconductors & Semiconductor Equipment — 4.7% |
| |||||||
| 1,405 | Applied Materials, Inc. | 58,036 | ||||||
| 377 | Broadcom Ltd. | 87,907 | ||||||
| 852 | Cavium, Inc. (a) | 52,941 | ||||||
| SHARES | SECURITY DESCRIPTION | VALUE($) | ||||||
Semiconductors & Semiconductor Equipment — continued |
| |||||||
| 302 | Lam Research Corp. | 42,669 | ||||||
| 626 | NVIDIA Corp. | 90,451 | ||||||
|
| |||||||
| 332,004 | ||||||||
|
| |||||||
Software — 9.6% |
| |||||||
| 584 | Adobe Systems, Inc. (a) | 82,658 | ||||||
| 1,320 | Electronic Arts, Inc. (a) | 139,519 | ||||||
| 573 | Guidewire Software, Inc. (a) | 39,337 | ||||||
| 2,265 | Microsoft Corp. | 156,126 | ||||||
| 951 | salesforce.com, Inc. (a) | 82,383 | ||||||
| 536 | ServiceNow, Inc. (a) | 56,784 | ||||||
| 1,678 | Snap, Inc., Class A (a) | 29,811 | ||||||
| 993 | Splunk, Inc. (a) | 56,463 | ||||||
| 549 | Take-Two Interactive Software, Inc. (a) | 40,252 | ||||||
|
| |||||||
| 683,333 | ||||||||
|
| |||||||
Technology Hardware, Storage & Peripherals — 4.9% |
| |||||||
| 2,404 | Apple, Inc. | 346,188 | ||||||
|
| |||||||
Total Information Technology | 2,934,140 | |||||||
|
| |||||||
Materials — 1.7% |
| |||||||
Construction Materials — 1.7% |
| |||||||
| 699 | Eagle Materials, Inc. | 64,555 | ||||||
| 432 | Vulcan Materials Co. | 54,713 | ||||||
|
| |||||||
Total Materials | 119,268 | |||||||
|
| |||||||
Real Estate — 1.0% |
| |||||||
Real Estate Management & Development — 1.0% |
| |||||||
| 1,963 | CBRE Group, Inc., Class A (a) | 71,461 | ||||||
|
| |||||||
Total Common Stocks | 6,906,629 | |||||||
|
| |||||||
Short-Term Investment — 3.5% | ||||||||
Investment Company — 3.5% |
| |||||||
| 246,532 | JPMorgan U.S. Government Money Market Fund, Institutional Class shares, 0.840% (b) (l) | 246,532 | ||||||
|
| |||||||
Total Investments — 100.8% | 7,153,161 | |||||||
Liabilities in Excess of | (55,251 | ) | ||||||
|
| |||||||
NET ASSETS — 100.0% | $ | 7,097,910 | ||||||
|
| |||||||
Percentages indicated are based on net assets.
SEE NOTES TO FINANCIAL STATEMENTS.
| JUNE 30, 2017 | J.P. MORGAN MID CAP/MULTI-CAP FUNDS | 17 | ||||||
Table of Contents
JPMorgan Mid Cap Equity Fund
SCHEDULE OF PORTFOLIO INVESTMENTS
AS OF JUNE 30, 2017
(Amounts in thousands)
| SHARES | SECURITY DESCRIPTION | VALUE($) | ||||||
Common Stocks — 96.2% | ||||||||
Consumer Discretionary — 17.8% |
| |||||||
Auto Components — 0.4% |
| |||||||
| 284 | BorgWarner, Inc. | 12,034 | ||||||
|
| |||||||
Automobiles — 0.6% |
| |||||||
| 15 | Tesla, Inc. (a) | 5,315 | ||||||
| 115 | Thor Industries, Inc. | 11,999 | ||||||
|
| |||||||
| 17,314 | ||||||||
|
| |||||||
Distributors — 1.0% |
| |||||||
| 134 | Genuine Parts Co. | 12,393 | ||||||
| 468 | LKQ Corp. (a) | 15,427 | ||||||
|
| |||||||
| 27,820 | ||||||||
|
| |||||||
Diversified Consumer Services — 0.3% |
| |||||||
| 96 | Bright Horizons Family Solutions, Inc. (a) | 7,412 | ||||||
|
| |||||||
Hotels, Restaurants & Leisure — 3.7% |
| |||||||
| 354 | Aramark | 14,523 | ||||||
| 363 | Hilton Grand Vacations, Inc. (a) | 13,073 | ||||||
| 581 | Hilton Worldwide Holdings, Inc. | 35,961 | ||||||
| 50 | Marriott International, Inc., Class A | 5,015 | ||||||
| 237 | Norwegian Cruise Line Holdings Ltd. (a) | 12,893 | ||||||
| 447 | Red Rock Resorts, Inc., Class A | 10,515 | ||||||
| 56 | Vail Resorts, Inc. | 11,358 | ||||||
|
| |||||||
| 103,338 | ||||||||
|
| |||||||
Household Durables — 3.1% |
| |||||||
| 275 | Mohawk Industries, Inc. (a) | 66,524 | ||||||
| 386 | Newell Brands, Inc. | 20,724 | ||||||
|
| |||||||
| 87,248 | ||||||||
|
| |||||||
Internet & Direct Marketing Retail — 1.1% |
| |||||||
| 147 | Expedia, Inc. | 21,929 | ||||||
| 131 | Wayfair, Inc., Class A (a) | 10,102 | ||||||
|
| |||||||
| 32,031 | ||||||||
|
| |||||||
Media — 1.2% |
| |||||||
| 160 | CBS Corp. (Non-Voting), Class B | 10,193 | ||||||
| 226 | DISH Network Corp., Class A (a) | 14,177 | ||||||
| 134 | Scripps Networks Interactive, Inc., Class A | 9,174 | ||||||
|
| |||||||
| 33,544 | ||||||||
|
| |||||||
Multiline Retail — 1.2% |
| |||||||
| 348 | Kohl’s Corp. | 13,453 | ||||||
| 426 | Nordstrom, Inc. | 20,374 | ||||||
|
| |||||||
| 33,827 | ||||||||
|
| |||||||
Specialty Retail — 3.5% |
| |||||||
| 20 | AutoZone, Inc. (a) | 11,569 | ||||||
| 237 | Bed Bath & Beyond, Inc. | 7,198 | ||||||
| 203 | Best Buy Co., Inc. | 11,644 | ||||||
| SHARES | SECURITY DESCRIPTION | VALUE($) | ||||||
Specialty Retail — continued |
| |||||||
| 447 | Gap, Inc. (The) | 9,833 | ||||||
| 53 | O’Reilly Automotive, Inc. (a) | 11,659 | ||||||
| 266 | Ross Stores, Inc. | 15,362 | ||||||
| 142 | Tiffany & Co. | 13,359 | ||||||
| 56 | Ulta Beauty, Inc. (a) | 16,062 | ||||||
|
| |||||||
| 96,686 | ||||||||
|
| |||||||
Textiles, Apparel & Luxury Goods — 1.7% |
| |||||||
| 162 | Coach, Inc. | 7,688 | ||||||
| 561 | Gildan Activewear, Inc., (Canada) | 17,229 | ||||||
| 133 | PVH Corp. | 15,229 | ||||||
| 98 | Ralph Lauren Corp. | 7,210 | ||||||
|
| |||||||
| 47,356 | ||||||||
|
| |||||||
Total Consumer Discretionary | 498,610 | |||||||
|
| |||||||
Consumer Staples — 3.6% |
| |||||||
Beverages — 1.5% |
| |||||||
| 71 | Constellation Brands, Inc., Class A | 13,749 | ||||||
| 178 | Dr Pepper Snapple Group, Inc. | 16,194 | ||||||
| 54 | Molson Coors Brewing Co., Class B | 4,673 | ||||||
| 152 | Monster Beverage Corp. (a) | 7,541 | ||||||
|
| |||||||
| 42,157 | ||||||||
|
| |||||||
Food & Staples Retailing — 0.7% |
| |||||||
| 81 | Casey’s General Stores, Inc. | 8,719 | ||||||
| 463 | Kroger Co. (The) | 10,793 | ||||||
|
| |||||||
| 19,512 | ||||||||
|
| |||||||
Food Products — 0.3% |
| |||||||
| 124 | TreeHouse Foods, Inc. (a) | 10,132 | ||||||
|
| |||||||
Household Products — 0.2% |
| |||||||
| 102 | Energizer Holdings, Inc. | 4,905 | ||||||
|
| |||||||
Personal Products — 0.9% |
| |||||||
| 613 | Coty, Inc., Class A | 11,507 | ||||||
| 176 | Edgewell Personal Care Co. (a) | 13,416 | ||||||
|
| |||||||
| 24,923 | ||||||||
|
| |||||||
Total Consumer Staples | 101,629 | |||||||
|
| |||||||
Energy — 4.0% |
| |||||||
Oil, Gas & Consumable Fuels — 4.0% |
| |||||||
| 192 | Concho Resources, Inc. (a) | 23,297 | ||||||
| 515 | Energen Corp. (a) | 25,404 | ||||||
| 449 | EQT Corp. | 26,290 | ||||||
| 488 | PBF Energy, Inc., Class A | 10,860 | ||||||
| 294 | Range Resources Corp. | 6,805 | ||||||
| 632 | Williams Cos., Inc. (The) | 19,135 | ||||||
|
| |||||||
Total Energy | 111,791 | |||||||
|
| |||||||
SEE NOTES TO FINANCIAL STATEMENTS.
| 18 | J.P. MORGAN MID CAP/MULTI-CAP FUNDS | JUNE 30, 2017 | ||||
Table of Contents
| SHARES | SECURITY DESCRIPTION | VALUE($) | ||||||
Common Stocks — continued | ||||||||
Financials — 15.2% |
| |||||||
Banks — 5.6% |
| |||||||
| 420 | Citizens Financial Group, Inc. | 14,996 | ||||||
| 133 | Comerica, Inc. | 9,756 | ||||||
| 282 | East West Bancorp, Inc. | 16,531 | ||||||
| 703 | Fifth Third Bancorp | 18,249 | ||||||
| 270 | First Republic Bank | 27,073 | ||||||
| 773 | Huntington Bancshares, Inc. | 10,446 | ||||||
| 146 | M&T Bank Corp. | 23,639 | ||||||
| 81 | Signature Bank (a) | 11,583 | ||||||
| 330 | SunTrust Banks, Inc. | 18,700 | ||||||
| 128 | Zions Bancorp | 5,624 | ||||||
|
| |||||||
| 156,597 | ||||||||
|
| |||||||
Capital Markets — 5.0% |
| |||||||
| 62 | Affiliated Managers Group, Inc. | 10,234 | ||||||
| 82 | Ameriprise Financial, Inc. | 10,425 | ||||||
| 438 | Invesco Ltd. | 15,418 | ||||||
| 233 | Lazard Ltd., Class A | 10,776 | ||||||
| 199 | Nasdaq, Inc. | 14,198 | ||||||
| 160 | Northern Trust Corp. | 15,534 | ||||||
| 159 | Raymond James Financial, Inc. | 12,738 | ||||||
| 149 | S&P Global, Inc. | 21,723 | ||||||
| 207 | T Rowe Price Group, Inc. | 15,387 | ||||||
| 343 | TD Ameritrade Holding Corp. | 14,754 | ||||||
|
| |||||||
| 141,187 | ||||||||
|
| |||||||
Consumer Finance — 0.4% |
| |||||||
| 501 | Ally Financial, Inc. | 10,470 | ||||||
|
| |||||||
Insurance — 4.2% |
| |||||||
| 13 | Alleghany Corp. (a) | 7,712 | ||||||
| 51 | Chubb Ltd. | 7,471 | ||||||
| 352 | Hartford Financial Services Group, Inc. (The) | 18,522 | ||||||
| 543 | Loews Corp. | 25,421 | ||||||
| 216 | Marsh & McLennan Cos., Inc. | 16,854 | ||||||
| 191 | Progressive Corp. (The) | 8,400 | ||||||
| 228 | Unum Group | 10,653 | ||||||
| 90 | WR Berkley Corp. | 6,250 | ||||||
| 410 | XL Group Ltd., (Bermuda) | 17,950 | ||||||
|
| |||||||
| 119,233 | ||||||||
|
| |||||||
Total Financials | 427,487 | |||||||
|
| |||||||
Health Care — 9.5% |
| |||||||
Biotechnology — 2.1% |
| |||||||
| 191 | ACADIA Pharmaceuticals, Inc. (a) | 5,324 | ||||||
| 97 | BioMarin Pharmaceutical, Inc. (a) | 8,809 | ||||||
| 77 | Incyte Corp. (a) | 9,708 | ||||||
| 66 | Intercept Pharmaceuticals, Inc. (a) | 8,003 | ||||||
| SHARES | SECURITY DESCRIPTION | VALUE($) | ||||||
Biotechnology — continued |
| |||||||
| 134 | Kite Pharma, Inc. (a) | 13,943 | ||||||
| 91 | Vertex Pharmaceuticals, Inc. (a) | 11,676 | ||||||
|
| |||||||
| 57,463 | ||||||||
|
| |||||||
Health Care Equipment & Supplies — 1.1% |
| |||||||
| 207 | DENTSPLY SIRONA, Inc. | 13,424 | ||||||
| 75 | Edwards Lifesciences Corp. (a) | 8,910 | ||||||
| 9 | Intuitive Surgical, Inc. (a) | 8,418 | ||||||
|
| |||||||
| 30,752 | ||||||||
|
| |||||||
Health Care Providers & Services — 4.6% |
| |||||||
| 388 | Acadia Healthcare Co., Inc. (a) | 19,140 | ||||||
| 127 | AmerisourceBergen Corp. | 11,977 | ||||||
| 139 | Centene Corp. (a) | 11,135 | ||||||
| 86 | Cigna Corp. | 14,389 | ||||||
| 66 | Henry Schein, Inc. (a) | 12,006 | ||||||
| 122 | Humana, Inc. | 29,400 | ||||||
| 40 | Laboratory Corp. of America Holdings (a) | 6,104 | ||||||
| 398 | Premier, Inc., Class A (a) | 14,314 | ||||||
| 98 | Universal Health Services, Inc., Class B | 11,936 | ||||||
|
| |||||||
| 130,401 | ||||||||
|
| |||||||
Health Care Technology — 0.4% |
| |||||||
| 200 | Veeva Systems, Inc., Class A (a) | 12,237 | ||||||
|
| |||||||
Life Sciences Tools & Services — 0.8% |
| |||||||
| 125 | Illumina, Inc. (a) | 21,652 | ||||||
|
| |||||||
Pharmaceuticals — 0.5% |
| |||||||
| 92 | Jazz Pharmaceuticals plc (a) | 14,290 | ||||||
|
| |||||||
Total Health Care | 266,795 | |||||||
|
| |||||||
Industrials — 13.8% |
| |||||||
Aerospace & Defense — 0.3% |
| |||||||
| 151 | HEICO Corp., Class A | 9,346 | ||||||
|
| |||||||
Airlines — 0.8% |
| |||||||
| 350 | Southwest Airlines Co. | 21,768 | ||||||
|
| |||||||
Building Products — 2.1% |
| |||||||
| 544 | Fortune Brands Home & Security, Inc. | 35,483 | ||||||
| 123 | Lennox International, Inc. | 22,614 | ||||||
|
| |||||||
| 58,097 | ||||||||
|
| |||||||
Commercial Services & Supplies — 2.0% |
| |||||||
| 327 | Copart, Inc. (a) | 10,396 | ||||||
| 694 | Waste Connections, Inc., (Canada) | 44,714 | ||||||
|
| |||||||
| 55,110 | ||||||||
|
| |||||||
Electrical Equipment — 1.7% |
| |||||||
| 77 | Acuity Brands, Inc. | 15,673 | ||||||
| 216 | AMETEK, Inc. | 13,098 | ||||||
SEE NOTES TO FINANCIAL STATEMENTS.
| JUNE 30, 2017 | J.P. MORGAN MID CAP/MULTI-CAP FUNDS | 19 | ||||||
Table of Contents
JPMorgan Mid Cap Equity Fund
SCHEDULE OF PORTFOLIO INVESTMENTS
AS OF JUNE 30, 2017 (continued)
(Amounts in thousands)
| SHARES | SECURITY DESCRIPTION | VALUE($) | ||||||
Common Stocks — continued | ||||||||
Electrical Equipment — continued |
| |||||||
| 109 | Hubbell, Inc. | 12,293 | ||||||
| 79 | Regal Beloit Corp. | 6,439 | ||||||
|
| |||||||
| 47,503 | ||||||||
|
| |||||||
Industrial Conglomerates — 0.8% |
| |||||||
| 241 | Carlisle Cos., Inc. | 22,951 | ||||||
|
| |||||||
Machinery — 4.2% |
| |||||||
| 284 | Fortive Corp. | 18,004 | ||||||
| 120 | IDEX Corp. | 13,581 | ||||||
| 107 | Middleby Corp. (The) (a) | 12,977 | ||||||
| 164 | Oshkosh Corp. | 11,324 | ||||||
| 107 | Snap-on, Inc. | 16,906 | ||||||
| 138 | Stanley Black & Decker, Inc. | 19,421 | ||||||
| 141 | WABCO Holdings, Inc. (a) | 17,992 | ||||||
| 99 | Wabtec Corp. | 9,086 | ||||||
|
| |||||||
| 119,291 | ||||||||
|
| |||||||
Professional Services — 0.7% |
| |||||||
| 145 | Equifax, Inc. | 19,940 | ||||||
|
| |||||||
Road & Rail — 0.5% |
| |||||||
| 145 | Old Dominion Freight Line, Inc. | 13,819 | ||||||
|
| |||||||
Trading Companies & Distributors — 0.7% |
| |||||||
| 161 | MSC Industrial Direct Co., Inc., Class A | 13,817 | ||||||
| 42 | United Rentals, Inc. (a) | 4,756 | ||||||
|
| |||||||
| 18,573 | ||||||||
|
| |||||||
Total Industrials | 386,398 | |||||||
|
| |||||||
Information Technology — 18.7% |
| |||||||
Communications Equipment — 1.8% |
| |||||||
| 98 | Arista Networks, Inc. (a) | 14,618 | ||||||
| 371 | CommScope Holding Co., Inc. (a) | 14,113 | ||||||
| 76 | Harris Corp. | 8,301 | ||||||
| 103 | Palo Alto Networks, Inc. (a) | 13,750 | ||||||
|
| |||||||
| 50,782 | ||||||||
|
| |||||||
Electronic Equipment, Instruments & Components — 4.3% |
| |||||||
| 582 | Amphenol Corp., Class A | 42,977 | ||||||
| 222 | Arrow Electronics, Inc. (a) | 17,446 | ||||||
| 266 | CDW Corp. | 16,633 | ||||||
| 629 | Corning, Inc. | 18,889 | ||||||
| 62 | IPG Photonics Corp. (a) | 9,067 | ||||||
| 419 | Keysight Technologies, Inc. (a) | 16,321 | ||||||
|
| |||||||
| 121,333 | ||||||||
|
| |||||||
Internet Software & Services — 0.8% |
| |||||||
| 434 | GoDaddy, Inc., Class A (a) | 18,398 | ||||||
| 312 | Match Group, Inc. (a) | 5,424 | ||||||
|
| |||||||
| 23,822 | ||||||||
|
| |||||||
| SHARES | SECURITY DESCRIPTION | VALUE($) | ||||||
IT Services — 3.1% |
| |||||||
| 196 | Gartner, Inc. (a) | 24,257 | ||||||
| 273 | Global Payments, Inc. | 24,657 | ||||||
| 171 | Jack Henry & Associates, Inc. | 17,712 | ||||||
| 319 | Vantiv, Inc., Class A (a) | 20,225 | ||||||
|
| |||||||
| 86,851 | ||||||||
|
| |||||||
Semiconductors & Semiconductor Equipment — 3.5% |
| |||||||
| 821 | Advanced Micro Devices, Inc. (a) | 10,241 | ||||||
| 122 | Analog Devices, Inc. | 9,460 | ||||||
| 349 | Applied Materials, Inc. | 14,421 | ||||||
| 39 | Broadcom Ltd. | 9,042 | ||||||
| 212 | Cavium, Inc. (a) | 13,153 | ||||||
| 20 | KLA-Tencor Corp. | 1,835 | ||||||
| 132 | Lam Research Corp. | 18,711 | ||||||
| 63 | NVIDIA Corp. | 9,064 | ||||||
| 384 | Teradyne, Inc. | 11,526 | ||||||
|
| |||||||
| 97,453 | ||||||||
|
| |||||||
Software — 5.2% |
| |||||||
| 243 | Atlassian Corp. plc, (Australia), Class A (a) | 8,538 | ||||||
| 214 | Electronic Arts, Inc. (a) | 22,666 | ||||||
| 170 | Guidewire Software, Inc. (a) | 11,708 | ||||||
| 164 | Red Hat, Inc. (a) | 15,741 | ||||||
| 176 | ServiceNow, Inc. (a) | 18,614 | ||||||
| 271 | Splunk, Inc. (a) | 15,406 | ||||||
| 239 | Synopsys, Inc. (a) | 17,445 | ||||||
| 206 | Take-Two Interactive Software, Inc. (a) | 15,080 | ||||||
| 53 | Tyler Technologies, Inc. (a) | 9,293 | ||||||
| 121 | Workday, Inc., Class A (a) | 11,698 | ||||||
|
| |||||||
| 146,189 | ||||||||
|
| |||||||
Total Information Technology | 526,430 | |||||||
|
| |||||||
Materials — 3.6% |
| |||||||
Chemicals — 0.4% |
| |||||||
| 31 | Sherwin-Williams Co. (The) | 10,811 | ||||||
|
| |||||||
Construction Materials — 1.3% |
| |||||||
| 198 | Eagle Materials, Inc. | 18,281 | ||||||
| 138 | Vulcan Materials Co. | 17,469 | ||||||
|
| |||||||
| 35,750 | ||||||||
|
| |||||||
Containers & Packaging — 1.9% |
| |||||||
| 512 | Ball Corp. | 21,611 | ||||||
| 429 | Silgan Holdings, Inc. | 13,636 | ||||||
| 342 | WestRock Co. | 19,363 | ||||||
|
| |||||||
| 54,610 | ||||||||
|
| |||||||
Total Materials | 101,171 | |||||||
|
| |||||||
SEE NOTES TO FINANCIAL STATEMENTS.
| 20 | J.P. MORGAN MID CAP/MULTI-CAP FUNDS | JUNE 30, 2017 | ||||
Table of Contents
| SHARES | SECURITY DESCRIPTION | VALUE($) | ||||||
Common Stocks — continued | ||||||||
Real Estate — 5.7% |
| |||||||
Equity Real Estate Investment Trusts (REITs) — 4.7% |
| |||||||
| 134 | American Campus Communities, Inc. | 6,340 | ||||||
| 229 | American Homes 4 Rent, Class A | 5,168 | ||||||
| 66 | AvalonBay Communities, Inc. | 12,718 | ||||||
| 92 | Boston Properties, Inc. | 11,282 | ||||||
| 481 | Brixmor Property Group, Inc. | 8,607 | ||||||
| 27 | Essex Property Trust, Inc. | 7,039 | ||||||
| 58 | Federal Realty Investment Trust | 7,317 | ||||||
| 265 | GGP, Inc. | 6,243 | ||||||
| 82 | HCP, Inc. | 2,607 | ||||||
| 538 | Kimco Realty Corp. | 9,869 | ||||||
| 348 | Outfront Media, Inc. | 8,036 | ||||||
| 218 | Park Hotels & Resorts, Inc. | 5,881 | ||||||
| 307 | Rayonier, Inc. | 8,847 | ||||||
| 99 | Regency Centers Corp. | 6,220 | ||||||
| 136 | Vornado Realty Trust | 12,805 | ||||||
| 275 | Weyerhaeuser Co. | 9,228 | ||||||
| 76 | WP Carey, Inc. | 5,044 | ||||||
|
| |||||||
| 133,251 | ||||||||
|
| |||||||
Real Estate Management & Development — 1.0% |
| |||||||
| 754 | CBRE Group, Inc., Class A (a) | 27,435 | ||||||
|
| |||||||
Total Real Estate | 160,686 | |||||||
|
| |||||||
Utilities — 4.3% |
| |||||||
Electric Utilities — 1.6% |
| |||||||
| 255 | Edison International | 19,944 | ||||||
| 62 | Westar Energy, Inc. | 3,298 | ||||||
| 462 | Xcel Energy, Inc. | 21,205 | ||||||
|
| |||||||
| 44,447 | ||||||||
|
| |||||||
Gas Utilities — 0.5% |
| |||||||
| 243 | National Fuel Gas Co. | 13,569 | ||||||
|
| |||||||
Multi-Utilities — 2.2% |
| |||||||
| 145 | CenterPoint Energy, Inc. | 3,976 | ||||||
| 451 | CMS Energy Corp. | 20,878 | ||||||
| 155 | Sempra Energy | 17,521 | ||||||
| 321 | WEC Energy Group, Inc. | 19,728 | ||||||
|
| |||||||
| 62,103 | ||||||||
|
| |||||||
Total Utilities | 120,119 | |||||||
|
| |||||||
Total Common Stocks | 2,701,116 | |||||||
|
| |||||||
Master Limited Partnership — 0.4% | ||||||||
Financials — 0.4% |
| |||||||
Capital Markets — 0.4% |
| |||||||
| 274 | Oaktree Capital Group LLC | 12,768 | ||||||
|
| |||||||
| SHARES | SECURITY DESCRIPTION | VALUE($) | ||||||
Short-Term Investment — 4.3% | ||||||||
Investment Company — 4.3% |
| |||||||
| 119,456 | JPMorgan U.S. Government Money Market Fund, Institutional Class Shares, 0.840% (b) (l) | 119,456 | ||||||
|
| |||||||
Total Investments — 100.9% | 2,833,340 | |||||||
Liabilities in Excess of | (24,862 | ) | ||||||
|
| |||||||
NET ASSETS — 100.0% | $ | 2,808,478 | ||||||
|
| |||||||
Percentages indicated are based on net assets.
SEE NOTES TO FINANCIAL STATEMENTS.
| JUNE 30, 2017 | J.P. MORGAN MID CAP/MULTI-CAP FUNDS | 21 | ||||||
Table of Contents
JPMorgan Mid Cap Growth Fund
SCHEDULE OF PORTFOLIO INVESTMENTS
AS OF JUNE 30, 2017
(Amounts in thousands)
| SHARES | SECURITY DESCRIPTION | VALUE($) | ||||||
Common Stocks — 95.5% | ||||||||
Consumer Discretionary — 18.3% |
| |||||||
Automobiles — 1.2% |
| |||||||
| 32 | Tesla, Inc. (a) | 11,625 | ||||||
| 251 | Thor Industries, Inc. | 26,203 | ||||||
|
| |||||||
| 37,828 | ||||||||
|
| |||||||
Distributors — 1.1% |
| |||||||
| 1,022 | LKQ Corp. (a) | 33,681 | ||||||
|
| |||||||
Diversified Consumer Services — 0.5% |
| |||||||
| 210 | Bright Horizons Family Solutions, Inc. (a) | 16,191 | ||||||
|
| |||||||
Hotels, Restaurants & Leisure — 5.9% |
| |||||||
| 774 | Aramark | 31,706 | ||||||
| 631 | Hilton Grand Vacations, Inc. (a) | 22,753 | ||||||
| 813 | Hilton Worldwide Holdings, Inc. | 50,300 | ||||||
| 518 | Norwegian Cruise Line Holdings Ltd. (a) | 28,147 | ||||||
| 975 | Red Rock Resorts, Inc., Class A | 22,961 | ||||||
| 122 | Vail Resorts, Inc. | 24,786 | ||||||
|
| |||||||
| 180,653 | ||||||||
|
| |||||||
Household Durables — 2.7% |
| |||||||
| 346 | Mohawk Industries, Inc. (a) | 83,739 | ||||||
|
| |||||||
Internet & Direct Marketing Retail — 0.7% |
| |||||||
| 287 | Wayfair, Inc., Class A (a) | 22,052 | ||||||
|
| |||||||
Media — 0.7% |
| |||||||
| 293 | Scripps Networks Interactive, Inc., Class A | 20,035 | ||||||
|
| |||||||
Multiline Retail — 0.7% |
| |||||||
| 439 | Nordstrom, Inc. | 20,973 | ||||||
|
| |||||||
Specialty Retail — 3.0% |
| |||||||
| 116 | O’Reilly Automotive, Inc. (a) | 25,476 | ||||||
| 581 | Ross Stores, Inc. | 33,546 | ||||||
| 122 | Ulta Beauty, Inc. (a) | 35,045 | ||||||
|
| |||||||
| 94,067 | ||||||||
|
| |||||||
Textiles, Apparel & Luxury Goods — 1.8% |
| |||||||
| 355 | Coach, Inc. | 16,787 | ||||||
| 1,224 | Gildan Activewear, Inc., (Canada) | 37,618 | ||||||
|
| |||||||
| 54,405 | ||||||||
|
| |||||||
Total Consumer Discretionary | 563,624 | |||||||
|
| |||||||
Consumer Staples — 1.1% |
| |||||||
Beverages — 0.5% |
| |||||||
| 331 | Monster Beverage Corp. (a) | 16,468 | ||||||
|
| |||||||
Food & Staples Retailing — 0.6% |
| |||||||
| 178 | Casey’s General Stores, Inc. | 19,033 | ||||||
|
| |||||||
Total Consumer Staples | 35,501 | |||||||
|
| |||||||
| SHARES | SECURITY DESCRIPTION | VALUE($) | ||||||
Energy — 2.1% |
| |||||||
Oil, Gas & Consumable Fuels — 2.1% |
| |||||||
| 419 | Concho Resources, Inc. (a) | 50,863 | ||||||
| 641 | Range Resources Corp. | 14,860 | ||||||
|
| |||||||
Total Energy | 65,723 | |||||||
|
| |||||||
Financials — 8.7% |
| |||||||
Banks — 3.6% |
| |||||||
| 291 | Comerica, Inc. | 21,298 | ||||||
| 616 | East West Bancorp, Inc. | 36,094 | ||||||
| 282 | First Republic Bank | 28,188 | ||||||
| 176 | Signature Bank (a) | 25,298 | ||||||
|
| |||||||
| 110,878 | ||||||||
|
| |||||||
Capital Markets — 5.1% |
| |||||||
| 135 | Affiliated Managers Group, Inc. | 22,360 | ||||||
| 508 | Lazard Ltd., Class A | 23,535 | ||||||
| 434 | Nasdaq, Inc. | 31,005 | ||||||
| 325 | S&P Global, Inc. | 47,422 | ||||||
| 749 | TD Ameritrade Holding Corp. | 32,214 | ||||||
|
| |||||||
| 156,536 | ||||||||
|
| |||||||
Total Financials | 267,414 | |||||||
|
| |||||||
Health Care — 13.7% |
| |||||||
Biotechnology — 4.1% |
| |||||||
| 417 | ACADIA Pharmaceuticals, Inc. (a) | 11,627 | ||||||
| 212 | BioMarin Pharmaceutical, Inc. (a) | 19,245 | ||||||
| 168 | Incyte Corp. (a) | 21,191 | ||||||
| 144 | Intercept Pharmaceuticals, Inc. (a) | 17,479 | ||||||
| 294 | Kite Pharma, Inc. (a) | 30,448 | ||||||
| 198 | Vertex Pharmaceuticals, Inc. (a) | 25,502 | ||||||
|
| |||||||
| 125,492 | ||||||||
|
| |||||||
Health Care Equipment & Supplies — 2.2% |
| |||||||
| 452 | DENTSPLY SIRONA, Inc. | 29,308 | ||||||
| 165 | Edwards Lifesciences Corp. (a) | 19,462 | ||||||
| 20 | Intuitive Surgical, Inc. (a) | 18,333 | ||||||
|
| |||||||
| 67,103 | ||||||||
|
| |||||||
Health Care Providers & Services — 4.0% |
| |||||||
| 846 | Acadia Healthcare Co., Inc. (a) | 41,772 | ||||||
| 304 | Centene Corp. (a) | 24,316 | ||||||
| 117 | Humana, Inc. | 28,077 | ||||||
| 868 | Premier, Inc., Class A (a) | 31,255 | ||||||
|
| |||||||
| 125,420 | ||||||||
|
| |||||||
Health Care Technology — 0.9% |
| |||||||
| 436 | Veeva Systems, Inc., Class A (a) | 26,722 | ||||||
|
| |||||||
SEE NOTES TO FINANCIAL STATEMENTS.
| 22 | J.P. MORGAN MID CAP/MULTI-CAP FUNDS | JUNE 30, 2017 | ||||
Table of Contents
| SHARES | SECURITY DESCRIPTION | VALUE($) | ||||||
Common Stocks — continued | ||||||||
Life Sciences Tools & Services — 1.5% |
| |||||||
| 272 | Illumina, Inc. (a) | 47,280 | ||||||
|
| |||||||
Pharmaceuticals — 1.0% |
| |||||||
| 201 | Jazz Pharmaceuticals plc (a) | 31,204 | ||||||
|
| |||||||
Total Health Care | 423,221 | |||||||
|
| |||||||
Industrials — 19.9% |
| |||||||
Aerospace & Defense — 0.7% |
| |||||||
| 329 | HEICO Corp., Class A | 20,411 | ||||||
|
| |||||||
Airlines — 1.6% |
| |||||||
| 765 | Southwest Airlines Co. | 47,537 | ||||||
|
| |||||||
Building Products — 3.1% |
| |||||||
| 721 | Fortune Brands Home & Security, Inc. | 47,038 | ||||||
| 269 | Lennox International, Inc. | 49,387 | ||||||
|
| |||||||
| 96,425 | ||||||||
|
| |||||||
Commercial Services & Supplies — 3.9% |
| |||||||
| 714 | Copart, Inc. (a) | 22,702 | ||||||
| 1,516 | Waste Connections, Inc., (Canada) | 97,640 | ||||||
|
| |||||||
| 120,342 | ||||||||
|
| |||||||
Electrical Equipment — 1.1% |
| |||||||
| 168 | Acuity Brands, Inc. | 34,197 | ||||||
|
| |||||||
Industrial Conglomerates — 0.5% |
| |||||||
| 174 | Carlisle Cos., Inc. | 16,593 | ||||||
|
| |||||||
Machinery — 6.3% |
| |||||||
| 621 | Fortive Corp. | 39,308 | ||||||
| 233 | Middleby Corp. (The) (a) | 28,330 | ||||||
| 359 | Oshkosh Corp. | 24,735 | ||||||
| 301 | Stanley Black & Decker, Inc. | 42,416 | ||||||
| 308 | WABCO Holdings, Inc. (a) | 39,286 | ||||||
| 217 | Wabtec Corp. | 19,846 | ||||||
|
| |||||||
| 193,921 | ||||||||
|
| |||||||
Professional Services — 1.4% |
| |||||||
| 317 | Equifax, Inc. | 43,535 | ||||||
|
| |||||||
Road & Rail — 1.0% |
| |||||||
| 317 | Old Dominion Freight Line, Inc. | 30,182 | ||||||
|
| |||||||
Trading Companies & Distributors — 0.3% |
| |||||||
| 92 | United Rentals, Inc. (a) | 10,381 | ||||||
|
| |||||||
Total Industrials | 613,524 | |||||||
|
| |||||||
Information Technology — 27.9% |
| |||||||
Communications Equipment — 2.6% |
| |||||||
| 213 | Arista Networks, Inc. (a) | 31,938 | ||||||
| 166 | Harris Corp. | 18,126 | ||||||
| 224 | Palo Alto Networks, Inc. (a) | 30,016 | ||||||
|
| |||||||
| 80,080 | ||||||||
|
| |||||||
| SHARES | SECURITY DESCRIPTION | VALUE($) | ||||||
Electronic Equipment, Instruments & Components — 3.9% |
| |||||||
| 801 | Amphenol Corp., Class A | 59,095 | ||||||
| 1,373 | Corning, Inc. | 41,247 | ||||||
| 136 | IPG Photonics Corp. (a) | 19,779 | ||||||
|
| |||||||
| 120,121 | ||||||||
|
| |||||||
Internet Software & Services — 1.3% |
| |||||||
| 947 | GoDaddy, Inc., Class A (a) | 40,176 | ||||||
|
| |||||||
IT Services — 4.9% |
| |||||||
| 429 | Gartner, Inc. (a) | 52,983 | ||||||
| 596 | Global Payments, Inc. | 53,839 | ||||||
| 697 | Vantiv, Inc., Class A (a) | 44,170 | ||||||
|
| |||||||
| 150,992 | ||||||||
|
| |||||||
Semiconductors & Semiconductor Equipment — 6.1% |
| |||||||
| 1,792 | Advanced Micro Devices, Inc. (a) | 22,360 | ||||||
| 762 | Applied Materials, Inc. | 31,486 | ||||||
| 85 | Broadcom Ltd. | 19,724 | ||||||
| 462 | Cavium, Inc. (a) | 28,716 | ||||||
| 289 | Lam Research Corp. | 40,858 | ||||||
| 137 | NVIDIA Corp. | 19,776 | ||||||
| 838 | Teradyne, Inc. | 25,168 | ||||||
|
| |||||||
| 188,088 | ||||||||
|
| |||||||
Software — 9.1% |
| |||||||
| 530 | Atlassian Corp. plc, (Australia), Class A (a) | 18,642 | ||||||
| 468 | Electronic Arts, Inc. (a) | 49,499 | ||||||
| 372 | Guidewire Software, Inc. (a) | 25,562 | ||||||
| 359 | Red Hat, Inc. (a) | 34,374 | ||||||
| 383 | ServiceNow, Inc. (a) | 40,648 | ||||||
| 591 | Splunk, Inc. (a) | 33,641 | ||||||
| 449 | Take-Two Interactive Software, Inc. (a) | 32,933 | ||||||
| 115 | Tyler Technologies, Inc. (a) | 20,273 | ||||||
| 263 | Workday, Inc., Class A (a) | 25,541 | ||||||
|
| |||||||
| 281,113 | ||||||||
|
| |||||||
Total Information Technology | 860,570 | |||||||
|
| |||||||
Materials — 2.5% |
| |||||||
Construction Materials — 2.5% |
| |||||||
| 432 | Eagle Materials, Inc. | 39,909 | ||||||
| 301 | Vulcan Materials Co. | 38,139 | ||||||
|
| |||||||
Total Materials | 78,048 | |||||||
|
| |||||||
Real Estate — 1.3% |
| |||||||
Real Estate Management & Development — 1.3% |
| |||||||
| 1,107 | CBRE Group, Inc., Class A (a) | 40,292 | ||||||
|
| |||||||
Total Common Stocks | 2,947,917 | |||||||
|
| |||||||
SEE NOTES TO FINANCIAL STATEMENTS.
| JUNE 30, 2017 | J.P. MORGAN MID CAP/MULTI-CAP FUNDS | 23 | ||||||
Table of Contents
JPMorgan Mid Cap Growth Fund
SCHEDULE OF PORTFOLIO INVESTMENTS
AS OF JUNE 30, 2017 (continued)
(Amounts in thousands)
| SHARES | SECURITY DESCRIPTION | VALUE($) | ||||||
Master Limited Partnership — 0.9% | ||||||||
Financials — 0.9% |
| |||||||
Capital Markets — 0.9% |
| |||||||
| 598 | Oaktree Capital Group LLC | 27,876 | ||||||
|
| |||||||
Short-Term Investment — 4.5% | ||||||||
Investment Company — 4.5% |
| |||||||
| 139,641 | JPMorgan U.S. Government Money Market Fund, Institutional Class Shares, | 139,641 | ||||||
|
| |||||||
Total Investments — 100.9% | 3,115,434 | |||||||
Liabilities in Excess of | (27,156 | ) | ||||||
|
| |||||||
NET ASSETS — 100.0% | $ | 3,088,278 | ||||||
|
| |||||||
Percentages indicated are based on net assets.
SEE NOTES TO FINANCIAL STATEMENTS.
| 24 | J.P. MORGAN MID CAP/MULTI-CAP FUNDS | JUNE 30, 2017 | ||||
Table of Contents
JPMorgan Mid Cap Value Fund
SCHEDULE OF PORTFOLIO INVESTMENTS
AS OF JUNE 30, 2017
(Amounts in thousands)
| SHARES | SECURITY DESCRIPTION | VALUE($) | ||||||
Common Stocks — 95.6% | ||||||||
Consumer Discretionary — 17.0% |
| |||||||
Auto Components — 0.9% |
| |||||||
| 3,717 | BorgWarner, Inc. | 157,455 | ||||||
|
| |||||||
Distributors — 0.9% |
| |||||||
| 1,746 | Genuine Parts Co. | 161,957 | ||||||
|
| |||||||
Hotels, Restaurants & Leisure — 1.5% |
| |||||||
| 962 | Hilton Grand Vacations, Inc. (a) | 34,683 | ||||||
| 2,743 | Hilton Worldwide Holdings, Inc. | 169,668 | ||||||
| 659 | Marriott International, Inc., Class A | 66,137 | ||||||
|
| |||||||
| 270,488 | ||||||||
|
| |||||||
Household Durables — 3.5% |
| |||||||
| 1,528 | Mohawk Industries, Inc. (a) | 369,296 | ||||||
| 5,070 | Newell Brands, Inc. | 271,834 | ||||||
|
| |||||||
| 641,130 | ||||||||
|
| |||||||
Internet & Direct Marketing Retail — 1.5% |
| |||||||
| 1,915 | Expedia, Inc. | 285,283 | ||||||
|
| |||||||
Media — 1.7% |
| |||||||
| 2,101 | CBS Corp. (Non-Voting), Class B | 133,989 | ||||||
| 2,965 | DISH Network Corp., Class A (a) | 186,101 | ||||||
|
| |||||||
| 320,090 | ||||||||
|
| |||||||
Multiline Retail — 1.7% |
| |||||||
| 4,568 | Kohl’s Corp. | 176,648 | ||||||
| 2,944 | Nordstrom, Inc. | 140,800 | ||||||
|
| |||||||
| 317,448 | ||||||||
|
| |||||||
Specialty Retail — 3.8% |
| |||||||
| 265 | AutoZone, Inc. (a) | 150,990 | ||||||
| 3,115 | Bed Bath & Beyond, Inc. | 94,687 | ||||||
| 2,668 | Best Buy Co., Inc. | 152,942 | ||||||
| 5,793 | Gap, Inc. (The) | 127,379 | ||||||
| 1,861 | Tiffany & Co. | 174,703 | ||||||
|
| |||||||
| 700,701 | ||||||||
|
| |||||||
Textiles, Apparel & Luxury Goods — 1.5% |
| |||||||
| 1,746 | PVH Corp. | 199,934 | ||||||
| 1,012 | Ralph Lauren Corp. | 74,672 | ||||||
|
| |||||||
| 274,606 | ||||||||
|
| |||||||
Total Consumer Discretionary | 3,129,158 | |||||||
|
| |||||||
Consumer Staples — 5.9% |
| |||||||
Beverages — 2.5% |
| |||||||
| 932 | Constellation Brands, Inc., Class A | 180,549 | ||||||
| 2,333 | Dr Pepper Snapple Group, Inc. | 212,520 | ||||||
| 713 | Molson Coors Brewing Co., Class B | 61,599 | ||||||
|
| |||||||
| 454,668 | ||||||||
|
| |||||||
| SHARES | SECURITY DESCRIPTION | VALUE($) | ||||||
Food & Staples Retailing — 0.8% |
| |||||||
| 6,076 | Kroger Co. (The) | 141,700 | ||||||
|
| |||||||
Food Products — 0.7% | ||||||||
| 1,630 | TreeHouse Foods, Inc. (a) | 133,194 | ||||||
|
| |||||||
Household Products — 0.4% | ||||||||
| 1,347 | Energizer Holdings, Inc. | 64,673 | ||||||
|
| |||||||
Personal Products — 1.5% | ||||||||
| 5,869 | Coty, Inc., Class A | 110,106 | ||||||
| 2,289 | Edgewell Personal Care Co. (a) | 173,981 | ||||||
|
| |||||||
| 284,087 | ||||||||
|
| |||||||
Total Consumer Staples | 1,078,322 | |||||||
|
| |||||||
Energy — 5.6% |
| |||||||
Oil, Gas & Consumable Fuels — 5.6% | ||||||||
| 6,746 | Energen Corp. (a) | 333,028 | ||||||
| 5,307 | EQT Corp. | 310,962 | ||||||
| 6,384 | PBF Energy, Inc., Class A | 142,100 | ||||||
| 8,268 | Williams Cos., Inc. (The) | 250,367 | ||||||
|
| |||||||
Total Energy | 1,036,457 | |||||||
|
| |||||||
Financials — 22.0% |
| |||||||
Banks — 7.5% |
| |||||||
| 5,305 | Citizens Financial Group, Inc. | 189,299 | ||||||
| 9,225 | Fifth Third Bancorp | 239,480 | ||||||
| 1,869 | First Republic Bank | 187,060 | ||||||
| 10,157 | Huntington Bancshares, Inc. | 137,318 | ||||||
| 1,905 | M&T Bank Corp. | 308,482 | ||||||
| 4,326 | SunTrust Banks, Inc. | 245,367 | ||||||
| 1,681 | Zions Bancorp | 73,815 | ||||||
|
| |||||||
| 1,380,821 | ||||||||
|
| |||||||
Capital Markets — 5.0% |
| |||||||
| 1,076 | Ameriprise Financial, Inc. | 137,017 | ||||||
| 5,752 | Invesco Ltd. | 202,401 | ||||||
| 2,088 | Northern Trust Corp. | 202,961 | ||||||
| 2,086 | Raymond James Financial, Inc. | 167,339 | ||||||
| 2,722 | T Rowe Price Group, Inc. | 201,989 | ||||||
|
| |||||||
| 911,707 | ||||||||
|
| |||||||
Consumer Finance — 0.7% |
| |||||||
| 6,515 | Ally Financial, Inc. | 136,161 | ||||||
|
| |||||||
Insurance — 8.5% | ||||||||
| 171 | Alleghany Corp. (a) | 101,490 | ||||||
| 676 | Chubb Ltd. | 98,333 | ||||||
| 4,736 | Hartford Financial Services Group, Inc. (The) | 248,964 | ||||||
| 7,121 | Loews Corp. | 333,321 | ||||||
| 2,837 | Marsh & McLennan Cos., Inc. | 221,172 | ||||||
SEE NOTES TO FINANCIAL STATEMENTS.
| JUNE 30, 2017 | J.P. MORGAN MID CAP/MULTI-CAP FUNDS | 25 | ||||||
Table of Contents
JPMorgan Mid Cap Value Fund
SCHEDULE OF PORTFOLIO INVESTMENTS
AS OF JUNE 30, 2017 (continued)
(Amounts in thousands)
| SHARES | SECURITY DESCRIPTION | VALUE($) | ||||||
Common Stocks — continued | ||||||||
Insurance — continued |
| |||||||
| 2,506 | Progressive Corp. (The) | 110,509 | ||||||
| 3,002 | Unum Group | 140,003 | ||||||
| 1,190 | WR Berkley Corp. | 82,345 | ||||||
| 5,377 | XL Group Ltd., (Bermuda) | 235,523 | ||||||
|
| |||||||
| 1,571,660 | ||||||||
|
| |||||||
Mortgage Real Estate Investment Trusts (REITs) — 0.3% |
| |||||||
| 2,341 | Starwood Property Trust, Inc. | 52,420 | ||||||
|
| |||||||
Total Financials | 4,052,769 | |||||||
|
| |||||||
Health Care — 5.2% |
| |||||||
Health Care Providers & Services — 5.2% |
| |||||||
| 1,664 | AmerisourceBergen Corp. | 157,322 | ||||||
| 1,129 | Cigna Corp. | 188,923 | ||||||
| 851 | Henry Schein, Inc. (a) | 155,791 | ||||||
| 898 | Humana, Inc. | 216,036 | ||||||
| 522 | Laboratory Corp. of America Holdings (a) | 80,489 | ||||||
| 1,276 | Universal Health Services, Inc., Class B | 155,767 | ||||||
|
| |||||||
Total Health Care | 954,328 | |||||||
|
| |||||||
Industrials — 7.5% |
| |||||||
Building Products — 1.0% |
| |||||||
| 2,806 | Fortune Brands Home & Security, Inc. | 183,076 | ||||||
|
| |||||||
Electrical Equipment — 2.2% |
| |||||||
| 2,830 | AMETEK, Inc. | 171,387 | ||||||
| 1,427 | Hubbell, Inc. | 161,441 | ||||||
| 1,040 | Regal Beloit Corp. | 84,816 | ||||||
|
| |||||||
| 417,644 | ||||||||
|
| |||||||
Industrial Conglomerates — 1.1% |
| |||||||
| 2,112 | Carlisle Cos., Inc. | 201,512 | ||||||
|
| |||||||
Machinery — 2.2% |
| |||||||
| 1,578 | IDEX Corp. | 178,333 | ||||||
| 1,404 | Snap-on, Inc. | 221,845 | ||||||
|
| |||||||
| 400,178 | ||||||||
|
| |||||||
Trading Companies & Distributors — 1.0% |
| |||||||
| 2,110 | MSC Industrial Direct Co., Inc., Class A | 181,403 | ||||||
|
| |||||||
Total Industrials | 1,383,813 | |||||||
|
| |||||||
Information Technology — 9.4% |
| |||||||
Communications Equipment — 1.0% |
| |||||||
| 4,872 | CommScope Holding Co., Inc. (a) | 185,285 | ||||||
|
| |||||||
Electronic Equipment, Instruments & Components — 4.7% |
| |||||||
| 2,829 | Amphenol Corp., Class A | 208,809 | ||||||
| 2,919 | Arrow Electronics, Inc. (a) | 228,932 | ||||||
| 3,491 | CDW Corp. | 218,289 | ||||||
| 5,502 | Keysight Technologies, Inc. (a) | 214,188 | ||||||
|
| |||||||
| 870,218 | ||||||||
|
| |||||||
| SHARES | SECURITY DESCRIPTION | VALUE($) | ||||||
Internet Software & Services — 0.4% |
| |||||||
| 4,113 | Match Group, Inc. (a) | 71,482 | ||||||
|
| |||||||
IT Services — 1.3% |
| |||||||
| 2,231 | Jack Henry & Associates, Inc. | 231,745 | ||||||
|
| |||||||
Semiconductors & Semiconductor Equipment — 0.8% |
| |||||||
| 1,598 | Analog Devices, Inc. | 124,359 | ||||||
| 262 | KLA-Tencor Corp. | 24,010 | ||||||
|
| |||||||
| 148,369 | ||||||||
|
| |||||||
Software — 1.2% |
| |||||||
| 3,130 | Synopsys, Inc. (a) | 228,251 | ||||||
|
| |||||||
Total Information Technology | 1,735,350 | |||||||
|
| |||||||
Materials — 4.7% |
| |||||||
Chemicals — 0.8% |
| |||||||
| 405 | Sherwin-Williams Co. (The) | 142,054 | ||||||
|
| |||||||
Containers & Packaging — 3.9% |
| |||||||
| 6,715 | Ball Corp. | 283,447 | ||||||
| 5,634 | Silgan Holdings, Inc. | 179,035 | ||||||
| 4,484 | WestRock Co. | 254,036 | ||||||
|
| |||||||
| 716,518 | ||||||||
|
| |||||||
Total Materials | 858,572 | |||||||
|
| |||||||
Real Estate — 9.7% |
| |||||||
Equity Real Estate Investment Trusts (REITs) — 9.1% |
| |||||||
| 1,766 | American Campus Communities, Inc. | 83,520 | ||||||
| 3,020 | American Homes 4 Rent, Class A | 68,167 | ||||||
| 869 | AvalonBay Communities, Inc. | 167,018 | ||||||
| 1,205 | Boston Properties, Inc. | 148,225 | ||||||
| 6,331 | Brixmor Property Group, Inc. | 113,203 | ||||||
| 360 | Essex Property Trust, Inc. | 92,649 | ||||||
| 755 | Federal Realty Investment Trust | 95,422 | ||||||
| 3,492 | GGP, Inc. | 82,278 | ||||||
| 1,084 | HCP, Inc. | 34,655 | ||||||
| 6,056 | Kimco Realty Corp. | 111,127 | ||||||
| 4,573 | Outfront Media, Inc. | 105,731 | ||||||
| 2,875 | Park Hotels & Resorts, Inc. | 77,521 | ||||||
| 4,044 | Rayonier, Inc. | 116,346 | ||||||
| 1,308 | Regency Centers Corp. | 81,964 | ||||||
| 1,791 | Vornado Realty Trust | 168,168 | ||||||
| 3,622 | Weyerhaeuser Co. | 121,334 | ||||||
|
| |||||||
| 1,667,328 | ||||||||
|
| |||||||
Real Estate Management & Development — 0.6% |
| |||||||
| 3,245 | CBRE Group, Inc., Class A (a) | 118,108 | ||||||
|
| |||||||
Total Real Estate | 1,785,436 | |||||||
|
| |||||||
SEE NOTES TO FINANCIAL STATEMENTS.
| 26 | J.P. MORGAN MID CAP/MULTI-CAP FUNDS | JUNE 30, 2017 | ||||
Table of Contents
| SHARES | SECURITY DESCRIPTION | VALUE($) | ||||||
Common Stocks — continued | ||||||||
Utilities — 8.6% |
| |||||||
Electric Utilities — 3.2% |
| |||||||
| 3,346 | Edison International | 261,591 | ||||||
| 824 | Westar Energy, Inc. | 43,693 | ||||||
| 6,062 | Xcel Energy, Inc. | 278,106 | ||||||
|
| |||||||
| 583,390 | ||||||||
|
| |||||||
Gas Utilities — 1.0% |
| |||||||
| 3,179 | National Fuel Gas Co. | 177,543 | ||||||
|
| |||||||
Multi-Utilities — 4.4% |
| |||||||
| 1,900 | CenterPoint Energy, Inc. | 52,016 | ||||||
| 5,921 | CMS Energy Corp. | 273,841 | ||||||
| 2,033 | Sempra Energy | 229,250 | ||||||
| 4,205 | WEC Energy Group, Inc. | 258,126 | ||||||
|
| |||||||
| 813,233 | ||||||||
|
| |||||||
Total Utilities | 1,574,166 | |||||||
|
| |||||||
Total Common Stocks | 17,588,371 | |||||||
|
| |||||||
Short-Term Investment — 4.3% | ||||||||
Investment Company — 4.3% |
| |||||||
| 795,573 | JPMorgan U.S. Government Money Market Fund, Institutional Class Shares, 0.840% (b) (l) | 795,573 | ||||||
|
| |||||||
Total Investments — 99.9% | 18,383,944 | |||||||
Other Assets in Excess of | 19,068 | |||||||
|
| |||||||
NET ASSETS — 100.0% | $ | 18,403,012 | ||||||
|
| |||||||
Percentages indicated are based on net assets.
SEE NOTES TO FINANCIAL STATEMENTS.
| JUNE 30, 2017 | J.P. MORGAN MID CAP/MULTI-CAP FUNDS | 27 | ||||||
Table of Contents
JPMorgan Multi-Cap Market Neutral Fund
SCHEDULE OF PORTFOLIO INVESTMENTS
AS OF JUNE 30, 2017
(Amounts in thousands)
| SHARES | SECURITY DESCRIPTION | VALUE($) | ||||||
Long Positions — 100.5% | ||||||||
Common Stocks — 89.7% | ||||||||
Consumer Discretionary — 14.3% |
| |||||||
Automobiles — 0.5% |
| |||||||
| 19 | General Motors Co. | 680 | ||||||
|
| |||||||
Hotels, Restaurants & Leisure — 4.4% |
| |||||||
| 11 | Darden Restaurants, Inc. | 1,002 | ||||||
| 14 | Dunkin’ Brands Group, Inc. | 747 | ||||||
| 44 | International Game Technology plc | 796 | ||||||
| 24 | Restaurant Brands International, Inc., (Canada) | 1,470 | ||||||
| 60 | Wendy’s Co. (The) | 926 | ||||||
| 5 | Wyndham Worldwide Corp. | 530 | ||||||
|
| |||||||
| 5,471 | ||||||||
|
| |||||||
Household Durables — 2.3% |
| |||||||
| 18 | DR Horton, Inc. (j) | 605 | ||||||
| 9 | Lennar Corp., Class A | 460 | ||||||
| — | (h) | NVR, Inc. (a) (j) | 542 | |||||
| 17 | Tupperware Brands Corp. | 1,212 | ||||||
|
| |||||||
| 2,819 | ||||||||
|
| |||||||
Media — 2.5% |
| |||||||
| 16 | CBS Corp. (Non-Voting), Class B | 998 | ||||||
| 14 | Sinclair Broadcast Group, Inc., Class A | 474 | ||||||
| 241 | Sirius XM Holdings, Inc. | 1,318 | ||||||
| 23 | TEGNA, Inc. | 331 | ||||||
|
| |||||||
| 3,121 | ||||||||
|
| |||||||
Multiline Retail — 0.9% |
| |||||||
| 28 | Kohl’s Corp. | 1,094 | ||||||
|
| |||||||
Specialty Retail — 2.5% |
| |||||||
| 11 | Bed Bath & Beyond, Inc. | 347 | ||||||
| 20 | Best Buy Co., Inc. (j) | 1,168 | ||||||
| 119 | Staples, Inc. (j) | 1,196 | ||||||
| 4 | Tiffany & Co. | 387 | ||||||
|
| |||||||
| 3,098 | ||||||||
|
| |||||||
Textiles, Apparel & Luxury Goods — 1.2% |
| |||||||
| 12 | Michael Kors Holdings Ltd. (a) | 428 | ||||||
| 10 | PVH Corp. | 1,122 | ||||||
|
| |||||||
| 1,550 | ||||||||
|
| |||||||
Total Consumer Discretionary | 17,833 | |||||||
|
| |||||||
Consumer Staples — 5.6% |
| |||||||
Food & Staples Retailing — 1.4% |
| |||||||
| 7 | Sysco Corp. (j) | 374 | ||||||
| 17 | Wal-Mart Stores, Inc. | 1,303 | ||||||
|
| |||||||
| 1,677 | ||||||||
|
| |||||||
| SHARES | SECURITY DESCRIPTION | VALUE($) | ||||||
Food Products — 3.1% |
| |||||||
| 11 | Conagra Brands, Inc. | 386 | ||||||
| 4 | JM Smucker Co. (The) | 462 | ||||||
| 55 | Pilgrim’s Pride Corp. (a) (j) | 1,196 | ||||||
| — | (h) | Seaboard Corp. | 599 | |||||
| 19 | Tyson Foods, Inc., Class A | 1,218 | ||||||
|
| |||||||
| 3,861 | ||||||||
|
| |||||||
Household Products — 0.2% |
| |||||||
| 6 | Energizer Holdings, Inc. | 296 | ||||||
|
| |||||||
Personal Products — 0.9% |
| |||||||
| 18 | Nu Skin Enterprises, Inc., Class A (j) | 1,111 | ||||||
|
| |||||||
Total Consumer Staples | 6,945 | |||||||
|
| |||||||
Energy — 1.5% |
| |||||||
Energy Equipment & Services — 0.8% |
| |||||||
| 10 | National Oilwell Varco, Inc. | 342 | ||||||
| 18 | Oceaneering International, Inc. | 419 | ||||||
| 10 | TechnipFMC plc, (United Kingdom) (a) | 281 | ||||||
|
| |||||||
| 1,042 | ||||||||
|
| |||||||
Oil, Gas & Consumable Fuels — 0.7% |
| |||||||
| 26 | Devon Energy Corp. | 837 | ||||||
|
| |||||||
Total Energy | 1,879 | |||||||
|
| |||||||
Financials — 5.5% |
| |||||||
Banks — 2.7% |
| |||||||
| 9 | BOK Financial Corp. | 730 | ||||||
| 18 | Citizens Financial Group, Inc. | 658 | ||||||
| 22 | Popular, Inc., (Puerto Rico) | 911 | ||||||
| 25 | Synovus Financial Corp. | 1,119 | ||||||
|
| |||||||
| 3,418 | ||||||||
|
| |||||||
Capital Markets — 1.1% |
| |||||||
| 4 | Morgan Stanley | 157 | ||||||
| 11 | MSCI, Inc. | 1,162 | ||||||
|
| |||||||
| 1,319 | ||||||||
|
| |||||||
Consumer Finance — 0.4% |
| |||||||
| 33 | Navient Corp. | 548 | ||||||
|
| |||||||
Diversified Financial Services — 0.3% |
| |||||||
| 11 | Voya Financial, Inc. | 388 | ||||||
|
| |||||||
Mortgage Real Estate Investment Trusts (REITs) — 0.5% |
| |||||||
| 59 | Two Harbors Investment Corp. | 580 | ||||||
|
| |||||||
Thrifts & Mortgage Finance — 0.5% |
| |||||||
| 54 | MGIC Investment Corp. (a) | 610 | ||||||
|
| |||||||
Total Financials | 6,863 | |||||||
|
| |||||||
SEE NOTES TO FINANCIAL STATEMENTS.
| 28 | J.P. MORGAN MID CAP/MULTI-CAP FUNDS | JUNE 30, 2017 | ||||
Table of Contents
| SHARES | SECURITY DESCRIPTION | VALUE($) | ||||||
Long Positions — continued | ||||||||
Common Stocks — continued | ||||||||
Health Care — 12.8% |
| |||||||
Biotechnology — 3.6% |
| |||||||
| 8 | Amgen, Inc. (j) | 1,426 | ||||||
| 2 | Biogen, Inc. (a) | 556 | ||||||
| 20 | Gilead Sciences, Inc. (j) | 1,396 | ||||||
| 9 | United Therapeutics Corp. (a) | 1,127 | ||||||
|
| |||||||
| 4,505 | ||||||||
|
| |||||||
Health Care Equipment & Supplies — 1.3% |
| |||||||
| 4 | Hill-Rom Holdings, Inc. | 348 | ||||||
| 28 | Hologic, Inc. (a) (j) | 1,255 | ||||||
|
| |||||||
| 1,603 | ||||||||
|
| |||||||
Health Care Providers & Services — 4.9% |
| |||||||
| 8 | Aetna, Inc. | 1,169 | ||||||
| 4 | Centene Corp. (a) | 313 | ||||||
| 12 | Express Scripts Holding Co. (a) (j) | 769 | ||||||
| 5 | Humana, Inc. | 1,155 | ||||||
| 3 | McKesson Corp. | 424 | ||||||
| 4 | Molina Healthcare, Inc. (a) | 277 | ||||||
| 6 | Quest Diagnostics, Inc. | 706 | ||||||
| 7 | WellCare Health Plans, Inc. (a) | 1,239 | ||||||
|
| |||||||
| 6,052 | ||||||||
|
| |||||||
Pharmaceuticals — 3.0% |
| |||||||
| 6 | Allergan plc | 1,349 | ||||||
| 32 | Endo International plc (a) | 355 | ||||||
| 24 | Horizon Pharma plc (a) | 288 | ||||||
| 21 | Mallinckrodt plc (a) | 924 | ||||||
| 26 | Pfizer, Inc. | 871 | ||||||
|
| |||||||
| 3,787 | ||||||||
|
| |||||||
Total Health Care | 15,947 | |||||||
|
| |||||||
Industrials — 17.2% |
| |||||||
Aerospace & Defense — 1.9% |
| |||||||
| 6 | Boeing Co. (The) (j) | 1,122 | ||||||
| 13 | Curtiss-Wright Corp. | 1,230 | ||||||
|
| |||||||
| 2,352 | ||||||||
|
| |||||||
Airlines — 2.6% |
| |||||||
| 6 | American Airlines Group, Inc. | 301 | ||||||
| 7 | Copa Holdings SA, (Panama), Class A | 848 | ||||||
| 19 | Delta Air Lines, Inc. | 1,005 | ||||||
| 15 | United Continental Holdings, Inc. (a) | 1,099 | ||||||
|
| |||||||
| 3,253 | ||||||||
|
| |||||||
Commercial Services & Supplies — 0.7% |
| |||||||
| 60 | Pitney Bowes, Inc. (j) | 899 | ||||||
|
| |||||||
| SHARES | SECURITY DESCRIPTION | VALUE($) | ||||||
Construction & Engineering — 1.0% |
| |||||||
| 23 | Jacobs Engineering Group, Inc. | 1,255 | ||||||
|
| |||||||
Electrical Equipment — 2.4% |
| |||||||
| 16 | EnerSys | 1,136 | ||||||
| 16 | Regal Beloit Corp. | 1,327 | ||||||
| 3 | Rockwell Automation, Inc. | 506 | ||||||
|
| |||||||
| 2,969 | ||||||||
|
| |||||||
Machinery — 4.1% |
| |||||||
| 7 | AGCO Corp. | 443 | ||||||
| 31 | Allison Transmission Holdings, Inc. (j) | 1,165 | ||||||
| 5 | Cummins, Inc. | 864 | ||||||
| 1 | Deere & Co. | 65 | ||||||
| 18 | Donaldson Co., Inc. | 832 | ||||||
| 8 | Parker-Hannifin Corp. | 1,243 | ||||||
| 10 | Timken Co. (The) | 469 | ||||||
|
| |||||||
| 5,081 | ||||||||
|
| |||||||
Professional Services — 1.1% |
| |||||||
| 12 | ManpowerGroup, Inc. | 1,328 | ||||||
|
| |||||||
Road & Rail — 1.4% |
| |||||||
| 16 | Landstar System, Inc. | 1,359 | ||||||
| 16 | Swift Transportation Co. (a) | 419 | ||||||
|
| |||||||
| 1,778 | ||||||||
|
| |||||||
Trading Companies & Distributors — 2.0% |
| |||||||
| 11 | United Rentals, Inc. (a) (j) | 1,217 | ||||||
| 21 | WESCO International, Inc. (a) | 1,188 | ||||||
|
| |||||||
| 2,405 | ||||||||
|
| |||||||
Total Industrials | 21,320 | |||||||
|
| |||||||
Information Technology — 22.3% |
| |||||||
Communications Equipment — 0.9% |
| |||||||
| 6 | CommScope Holding Co., Inc. (a) | 241 | ||||||
| 7 | F5 Networks, Inc. (a) | 861 | ||||||
|
| |||||||
| 1,102 | ||||||||
|
| |||||||
Electronic Equipment, Instruments & Components — 0.7% |
| |||||||
| 14 | Corning, Inc. (j) | 409 | ||||||
| 5 | Zebra Technologies Corp., Class A (a) | 510 | ||||||
|
| |||||||
| 919 | ||||||||
|
| |||||||
Internet Software & Services — 1.1% |
| |||||||
| 9 | eBay, Inc. (a) (j) | 326 | ||||||
| 4 | j2 Global, Inc. | 351 | ||||||
| 8 | VeriSign, Inc. (a) (j) | 718 | ||||||
|
| |||||||
| 1,395 | ||||||||
|
| |||||||
SEE NOTES TO FINANCIAL STATEMENTS.
| JUNE 30, 2017 | J.P. MORGAN MID CAP/MULTI-CAP FUNDS | 29 | ||||||
Table of Contents
JPMorgan Multi-Cap Market Neutral Fund
SCHEDULE OF PORTFOLIO INVESTMENTS
AS OF JUNE 30, 2017 (continued)
(Amounts in thousands)
| SHARES | SECURITY DESCRIPTION | VALUE($) | ||||||
Long Positions — continued | ||||||||
Common Stocks — continued | ||||||||
IT Services — 5.5% |
| |||||||
| 11 | CSRA, Inc. | 347 | ||||||
| 16 | DXC Technology Co. | 1,222 | ||||||
| 65 | First Data Corp., Class A (a) | 1,177 | ||||||
| 8 | International Business Machines Corp. (j) | 1,304 | ||||||
| 4 | Science Applications International Corp. | 311 | ||||||
| 42 | Teradata Corp. (a) | 1,229 | ||||||
| 65 | Western Union Co. (The) | 1,232 | ||||||
|
| |||||||
| 6,822 | ||||||||
|
| |||||||
Semiconductors & Semiconductor Equipment — 2.9% |
| |||||||
| 17 | Applied Materials, Inc. | 698 | ||||||
| 9 | Lam Research Corp. (j) | 1,249 | ||||||
| 35 | Marvell Technology Group Ltd., (Bermuda) | 580 | ||||||
| 26 | ON Semiconductor Corp. (a) | 360 | ||||||
| 23 | Teradyne, Inc. | 699 | ||||||
|
| |||||||
| 3,586 | ||||||||
|
| |||||||
Software — 7.4% |
| |||||||
| 6 | Aspen Technology, Inc. (a) | 337 | ||||||
| 11 | Autodesk, Inc. (a) | 1,059 | ||||||
| 35 | Cadence Design Systems, Inc. (a) | 1,175 | ||||||
| 14 | Citrix Systems, Inc. (a) | 1,144 | ||||||
| 60 | Nuance Communications, Inc. (a) (j) | 1,038 | ||||||
| 22 | Oracle Corp. | 1,123 | ||||||
| 9 | Red Hat, Inc. (a) | 852 | ||||||
| 14 | Take-Two Interactive Software, Inc. (a) | 1,058 | ||||||
| 12 | TiVo Corp. | 232 | ||||||
| 13 | VMware, Inc., Class A (a) | 1,161 | ||||||
|
| |||||||
| 9,179 | ||||||||
|
| |||||||
Technology Hardware, Storage & Peripherals — 3.8% |
| |||||||
| 3 | Apple, Inc. | 461 | ||||||
| 67 | HP, Inc. (j) | 1,171 | ||||||
| 22 | NCR Corp. (a) | 903 | ||||||
| 22 | NetApp, Inc. (j) | 874 | ||||||
| 16 | Seagate Technology plc | 629 | ||||||
| 7 | Western Digital Corp. | 598 | ||||||
| 4 | Xerox Corp. | 121 | ||||||
|
| |||||||
| 4,757 | ||||||||
|
| |||||||
Total Information Technology | 27,760 | |||||||
|
| |||||||
Materials — 4.5% |
| |||||||
Chemicals — 1.7% |
| |||||||
| 8 | Cabot Corp. (j) | 438 | ||||||
| 52 | Huntsman Corp. (j) | 1,337 | ||||||
| 4 | LyondellBasell Industries NV, Class A | 336 | ||||||
|
| |||||||
| 2,111 | ||||||||
|
| |||||||
| SHARES | SECURITY DESCRIPTION | VALUE($) | ||||||
Containers & Packaging — 1.3% |
| |||||||
| 6 | Berry Global Group, Inc. (a) | 342 | ||||||
| 4 | Packaging Corp. of America | 465 | ||||||
| 15 | WestRock Co. | 860 | ||||||
|
| |||||||
| 1,667 | ||||||||
|
| |||||||
Metals & Mining — 1.5% |
| |||||||
| 15 | Alcoa Corp. | 493 | ||||||
| 34 | Steel Dynamics, Inc. | 1,212 | ||||||
| 4 | United States Steel Corp. | 90 | ||||||
|
| |||||||
| 1,795 | ||||||||
|
| |||||||
Total Materials | 5,573 | |||||||
|
| |||||||
Real Estate — 1.6% |
| |||||||
Equity Real Estate Investment Trusts (REITs) — 1.6% |
| |||||||
| 29 | American Homes 4 Rent, Class A | 651 | ||||||
| 17 | Equity Commonwealth (a) | 525 | ||||||
| 8 | GEO Group, Inc. (The) | 237 | ||||||
| 66 | VEREIT, Inc. | 540 | ||||||
|
| |||||||
Total Real Estate | 1,953 | |||||||
|
| |||||||
Telecommunication Services — 0.3% |
| |||||||
Diversified Telecommunication Services — 0.1% |
| |||||||
| 5 | CenturyLink, Inc. | 123 | ||||||
|
| |||||||
Wireless Telecommunication Services — 0.2% |
| |||||||
| 32 | Sprint Corp. (a) (j) | 259 | ||||||
|
| |||||||
Total Telecommunication Services | 382 | |||||||
|
| |||||||
Utilities — 4.1% |
| |||||||
Electric Utilities — 0.5% |
| |||||||
| 19 | FirstEnergy Corp. | 565 | ||||||
|
| |||||||
Independent Power and Renewable Electricity Producers — 1.9% | ||||||||
| 112 | AES Corp. | 1,244 | ||||||
| 62 | NRG Energy, Inc. | 1,063 | ||||||
|
| |||||||
| 2,307 | ||||||||
|
| |||||||
Multi-Utilities — 1.7% |
| |||||||
| 34 | CenterPoint Energy, Inc. | 941 | ||||||
| 47 | MDU Resources Group, Inc. | 1,237 | ||||||
|
| |||||||
| 2,178 | ||||||||
|
| |||||||
Total Utilities | 5,050 | |||||||
|
| |||||||
Total Common Stocks | 111,505 | |||||||
|
| |||||||
SEE NOTES TO FINANCIAL STATEMENTS.
| 30 | J.P. MORGAN MID CAP/MULTI-CAP FUNDS | JUNE 30, 2017 | ||||
Table of Contents
| SHARES | SECURITY DESCRIPTION | VALUE($) | ||||||
Long Positions — continued | ||||||||
Short-Term Investment — 10.8% | ||||||||
Investment Company — 10.8% |
| |||||||
| 13,435 | JPMorgan U.S. Government Money Market Fund, Institutional Class Shares, 0.840% (b) (l) | 13,435 | ||||||
|
| |||||||
Total Investments — 100.5% | 124,940 | |||||||
Liabilities in Excess of | (555 | ) | ||||||
|
| |||||||
NET ASSETS — 100.0% | $ | 124,385 | ||||||
|
| |||||||
Short Positions — 87.9% | ||||||||
Common Stocks — 87.9% | ||||||||
Consumer Discretionary — 14.2% |
| |||||||
Automobiles — 0.9% |
| |||||||
| 3 | Tesla, Inc. (a) | 1,166 | ||||||
|
| |||||||
Diversified Consumer Services — 1.9% |
| |||||||
| 15 | Bright Horizons Family Solutions, Inc. (a) | 1,148 | ||||||
| 31 | ServiceMaster Global Holdings, Inc. (a) | 1,227 | ||||||
|
| |||||||
| 2,375 | ||||||||
|
| |||||||
Hotels, Restaurants & Leisure — 2.4% |
| |||||||
| 3 | Chipotle Mexican Grill, Inc. (a) | 1,176 | ||||||
| 19 | Starbucks Corp. | 1,089 | ||||||
| 13 | Texas Roadhouse, Inc. | 652 | ||||||
|
| |||||||
| 2,917 | ||||||||
|
| |||||||
Internet & Direct Marketing Retail — 1.0% |
| |||||||
| 5 | Netflix, Inc. (a) | 803 | ||||||
| 7 | TripAdvisor, Inc. (a) | 271 | ||||||
| 2 | Wayfair, Inc., Class A (a) | 150 | ||||||
|
| |||||||
| 1,224 | ||||||||
|
| |||||||
Leisure Products — 0.6% |
| |||||||
| 8 | Polaris Industries, Inc. | 719 | ||||||
|
| |||||||
Media — 2.3% |
| |||||||
| 42 | AMC Entertainment Holdings, Inc., Class A | 960 | ||||||
| 4 | Charter Communications, Inc., Class A (a) | 1,191 | ||||||
| 4 | Madison Square Garden Co. (The), Class A (a) | 753 | ||||||
|
| |||||||
| 2,904 | ||||||||
|
| |||||||
Specialty Retail — 2.5% |
| |||||||
| 3 | Advance Auto Parts, Inc. | 367 | ||||||
| 10 | L Brands, Inc. | 519 | ||||||
| 18 | Murphy USA, Inc. (a) | 1,299 | ||||||
| 3 | TJX Cos., Inc. (The) | 229 | ||||||
| 14 | Tractor Supply Co. | 737 | ||||||
|
| |||||||
| 3,151 | ||||||||
|
| |||||||
| SHARES | SECURITY DESCRIPTION | VALUE($) | ||||||
Textiles, Apparel & Luxury Goods — 2.6% |
| |||||||
| 24 | NIKE, Inc., Class B | 1,431 | ||||||
| 52 | Under Armour, Inc., Class A (a) | 1,137 | ||||||
| 11 | VF Corp. | 616 | ||||||
|
| |||||||
| 3,184 | ||||||||
|
| |||||||
Total Consumer Discretionary | 17,640 | |||||||
|
| |||||||
Consumer Staples — 4.9% |
| |||||||
Beverages — 1.8% |
| |||||||
| 22 | Brown-Forman Corp., Class B | 1,069 | ||||||
| 6 | Constellation Brands, Inc., Class A | 1,177 | ||||||
|
| |||||||
| 2,246 | ||||||||
|
| |||||||
Food & Staples Retailing — 0.8% |
| |||||||
| 10 | Casey’s General Stores, Inc. | 1,069 | ||||||
|
| |||||||
Food Products — 1.0% |
| |||||||
| 6 | Kraft Heinz Co. (The) | 516 | ||||||
| 22 | Snyder’s-Lance, Inc. | 745 | ||||||
|
| |||||||
| 1,261 | ||||||||
|
| |||||||
Personal Products — 1.3% |
| |||||||
| 60 | Coty, Inc., Class A | 1,127 | ||||||
| 5 | Estee Lauder Cos., Inc. (The), Class A | 442 | ||||||
|
| |||||||
| 1,569 | ||||||||
|
| |||||||
Total Consumer Staples | 6,145 | |||||||
|
| |||||||
Energy — 1.1% |
| |||||||
Oil, Gas & Consumable Fuels — 1.1% |
| |||||||
| 18 | EQT Corp. | 1,025 | ||||||
| 51 | Kosmos Energy Ltd., (Ghana) (a) | 328 | ||||||
|
| |||||||
Total Energy | 1,353 | |||||||
|
| |||||||
Financials — 6.2% |
| |||||||
Banks — 1.1% |
| |||||||
| 76 | People’s United Financial, Inc. | 1,345 | ||||||
|
| |||||||
Capital Markets — 1.9% |
| |||||||
| 15 | Artisan Partners Asset Management, Inc., Class A | 457 | ||||||
| 5 | CME Group, Inc. | 579 | ||||||
| 21 | Federated Investors, Inc., Class B | 601 | ||||||
| 20 | Interactive Brokers Group, Inc., Class A | 752 | ||||||
|
| |||||||
| 2,389 | ||||||||
|
| |||||||
Consumer Finance — 0.3% |
| |||||||
| 14 | OneMain Holdings, Inc. (a) | 347 | ||||||
|
| |||||||
Insurance — 1.0% |
| |||||||
| 2 | Cincinnati Financial Corp. | 170 | ||||||
| 1 | Markel Corp. (a) | 1,049 | ||||||
|
| |||||||
| 1,219 | ||||||||
|
| |||||||
SEE NOTES TO FINANCIAL STATEMENTS.
| JUNE 30, 2017 | J.P. MORGAN MID CAP/MULTI-CAP FUNDS | 31 | ||||||
Table of Contents
JPMorgan Multi-Cap Market Neutral Fund
SCHEDULE OF PORTFOLIO INVESTMENTS
AS OF JUNE 30, 2017 (continued)
(Amounts in thousands)
| SHARES | SECURITY DESCRIPTION | VALUE($) | ||||||
Short Positions — continued | ||||||||
Common Stocks — continued | ||||||||
Thrifts & Mortgage Finance — 1.9% |
| |||||||
| 92 | New York Community Bancorp, Inc. | 1,207 | ||||||
| 75 | TFS Financial Corp. | 1,162 | ||||||
|
| |||||||
| 2,369 | ||||||||
|
| |||||||
Total Financials | 7,669 | |||||||
|
| |||||||
Health Care — 12.7% |
| |||||||
Biotechnology — 2.9% |
| |||||||
| 12 | ACADIA Pharmaceuticals, Inc. (a) | 341 | ||||||
| 3 | Alnylam Pharmaceuticals, Inc. (a) | 267 | ||||||
| 4 | BioMarin Pharmaceutical, Inc. (a) | 329 | ||||||
| 4 | Bluebird Bio, Inc. (a) | 402 | ||||||
| 3 | Intercept Pharmaceuticals, Inc. (a) | 312 | ||||||
| 12 | Juno Therapeutics, Inc. (a) | 355 | ||||||
| 73 | OPKO Health, Inc. (a) | 482 | ||||||
| 3 | Puma Biotechnology, Inc. (a) | 260 | ||||||
| 1 | Regeneron Pharmaceuticals, Inc. (a) | 700 | ||||||
| 4 | Seattle Genetics, Inc. (a) | 216 | ||||||
|
| |||||||
| 3,664 | ||||||||
|
| |||||||
Health Care Equipment & Supplies — 1.2% |
| |||||||
| 3 | DENTSPLY SIRONA, Inc. | 204 | ||||||
| 18 | DexCom, Inc. (a) | 1,332 | ||||||
|
| |||||||
| 1,536 | ||||||||
|
| |||||||
Health Care Providers & Services — 5.4% |
| |||||||
| 26 | Acadia Healthcare Co., Inc. (a) | 1,273 | ||||||
| 21 | Envision Healthcare Corp. (a) | 1,329 | ||||||
| 7 | Henry Schein, Inc. (a) | 1,199 | ||||||
| 15 | LifePoint Health, Inc. (a) | 1,006 | ||||||
| 21 | Patterson Cos., Inc. | 1,002 | ||||||
| 44 | Tenet Healthcare Corp. (a) | 841 | ||||||
|
| |||||||
| 6,650 | ||||||||
|
| |||||||
Health Care Technology — 0.1% |
| |||||||
| 1 | athenahealth, Inc. (a) | 151 | ||||||
|
| |||||||
Pharmaceuticals — 3.1% | ||||||||
| 10 | Akorn, Inc. (a) | 325 | ||||||
| 24 | Bristol-Myers Squibb Co. | 1,356 | ||||||
| 16 | Catalent, Inc. (a) | 552 | ||||||
| 6 | Medicines Co. (The) (a) | 226 | ||||||
| 22 | Zoetis, Inc. | 1,346 | ||||||
|
| |||||||
| 3,805 | ||||||||
|
| |||||||
Total Health Care | 15,806 | |||||||
|
| |||||||
| SHARES | SECURITY DESCRIPTION | VALUE($) | ||||||
Industrials — 17.2% |
| |||||||
Aerospace & Defense — 1.8% |
| |||||||
| 23 | Hexcel Corp. | 1,193 | ||||||
| 4 | TransDigm Group, Inc. | 1,022 | ||||||
|
| |||||||
| 2,215 | ||||||||
|
| |||||||
Airlines — 0.4% |
| |||||||
| 11 | Spirit Airlines, Inc. (a) | 544 | ||||||
|
| |||||||
Building Products — 1.0% |
| |||||||
| 27 | Armstrong World Industries, Inc. (a) | 1,234 | ||||||
|
| |||||||
Commercial Services & Supplies — 1.0% |
| |||||||
| 80 | Covanta Holding Corp. | 1,054 | ||||||
| 3 | Rollins, Inc. | 130 | ||||||
|
| |||||||
| 1,184 | ||||||||
|
| |||||||
Construction & Engineering — 1.0% |
| |||||||
| 81 | KBR, Inc. | 1,238 | ||||||
|
| |||||||
Electrical Equipment — 1.1% |
| |||||||
| 7 | Acuity Brands, Inc. | 1,418 | ||||||
|
| |||||||
Industrial Conglomerates — 1.5% |
| |||||||
| 12 | Carlisle Cos., Inc. | 1,164 | ||||||
| 25 | General Electric Co. | 678 | ||||||
|
| |||||||
| 1,842 | ||||||||
|
| |||||||
Machinery — 4.0% |
| |||||||
| 14 | Flowserve Corp. | 672 | ||||||
| 11 | ITT, Inc. | 436 | ||||||
| 1 | Middleby Corp. (The) (a) | 88 | ||||||
| 8 | Snap-on, Inc. | 1,228 | ||||||
| 32 | Trinity Industries, Inc. | 901 | ||||||
| 6 | Wabtec Corp. | 540 | ||||||
| 19 | Xylem, Inc. | 1,059 | ||||||
|
| |||||||
| 4,924 | ||||||||
|
| |||||||
Marine — 0.6% |
| |||||||
| 12 | Kirby Corp. (a) | 792 | ||||||
|
| |||||||
Professional Services — 0.3% |
| |||||||
| 7 | IHS Markit Ltd. (a) | 320 | ||||||
|
| |||||||
Road & Rail — 2.6% |
| |||||||
| 4 | AMERCO | 1,483 | ||||||
| 12 | Genesee & Wyoming, Inc., Class A (a) | 790 | ||||||
| 6 | Old Dominion Freight Line, Inc. | 581 | ||||||
| 5 | Ryder System, Inc. | 390 | ||||||
|
| |||||||
| 3,244 | ||||||||
|
| |||||||
SEE NOTES TO FINANCIAL STATEMENTS.
| 32 | J.P. MORGAN MID CAP/MULTI-CAP FUNDS | JUNE 30, 2017 | ||||
Table of Contents
| SHARES | SECURITY DESCRIPTION | VALUE($) | ||||||
Short Positions — continued | ||||||||
Common Stocks — continued | ||||||||
Trading Companies & Distributors — 1.9% |
| |||||||
| 26 | Fastenal Co. | 1,147 | ||||||
| 8 | Watsco, Inc. | 1,268 | ||||||
|
| |||||||
| 2,415 | ||||||||
|
| |||||||
Total Industrials | 21,370 | |||||||
|
| |||||||
Information Technology — 21.8% |
| |||||||
Communications Equipment — 0.9% |
| |||||||
| 17 | ViaSat, Inc. (a) | 1,148 | ||||||
|
| |||||||
Electronic Equipment, Instruments & Components — 4.4% |
| |||||||
| 17 | Amphenol Corp., Class A | 1,253 | ||||||
| 2 | Coherent, Inc. (a) | 394 | ||||||
| 6 | Littelfuse, Inc. | 974 | ||||||
| 33 | National Instruments Corp. | 1,317 | ||||||
| 8 | Universal Display Corp. | 819 | ||||||
| 39 | VeriFone Systems, Inc. (a) | 697 | ||||||
|
| |||||||
| 5,454 | ||||||||
|
| |||||||
Internet Software & Services — 2.6% |
| |||||||
| 2 | CoStar Group, Inc. (a) | 422 | ||||||
| 5 | Facebook, Inc., Class A (a) | 728 | ||||||
| 133 | Pandora Media, Inc. (a) | 1,186 | ||||||
| 20 | Twilio, Inc., Class A (a) | 586 | ||||||
| 12 | Yelp, Inc. (a) | 346 | ||||||
|
| |||||||
| 3,268 | ||||||||
|
| |||||||
IT Services — 4.5% |
| |||||||
| 16 | Broadridge Financial Solutions, Inc. | 1,196 | ||||||
| 1 | Cognizant Technology Solutions Corp., Class A | 83 | ||||||
| 21 | Genpact Ltd. | 591 | ||||||
| 9 | Jack Henry & Associates, Inc. | 919 | ||||||
| 12 | Paychex, Inc. | 697 | ||||||
| 41 | Sabre Corp. | 882 | ||||||
| 12 | WEX, Inc. (a) | 1,246 | ||||||
|
| |||||||
| 5,614 | ||||||||
|
| |||||||
Semiconductors & Semiconductor Equipment — 3.1% |
| |||||||
| 65 | Advanced Micro Devices, Inc. (a) | 807 | ||||||
| 19 | Cavium, Inc. (a) | 1,159 | ||||||
| 4 | First Solar, Inc. (a) | 168 | ||||||
| 8 | MACOM Technology Solutions Holdings, Inc. (a) | 422 | ||||||
| 13 | Monolithic Power Systems, Inc. | 1,241 | ||||||
|
| |||||||
| 3,797 | ||||||||
|
| |||||||
Software — 6.3% |
| |||||||
| 10 | Blackbaud, Inc. | 890 | ||||||
| 11 | Ellie Mae, Inc. (a) | 1,209 | ||||||
| SHARES | SECURITY DESCRIPTION | VALUE($) | ||||||
Software — continued |
| |||||||
| 57 | FireEye, Inc. (a) | 872 | ||||||
| 17 | Guidewire Software, Inc. (a) | 1,142 | ||||||
| 14 | salesforce.com, Inc. (a) | 1,173 | ||||||
| 2 | ServiceNow, Inc. (a) | 231 | ||||||
| 5 | Splunk, Inc. (a) | 256 | ||||||
| 4 | Tableau Software, Inc., Class A (a) | 236 | ||||||
| 4 | Tyler Technologies, Inc. (a) | 698 | ||||||
| 5 | Ultimate Software Group, Inc. (The) (a) | 1,129 | ||||||
|
| |||||||
| 7,836 | ||||||||
|
| |||||||
Total Information Technology | 27,117 | |||||||
|
| |||||||
Materials — 4.5% |
| |||||||
Chemicals — 1.1% |
| |||||||
| 5 | Air Products & Chemicals, Inc. | 728 | ||||||
| 24 | CF Industries Holdings, Inc. | 671 | ||||||
|
| |||||||
| 1,399 | ||||||||
|
| |||||||
Construction Materials — 0.2% |
| |||||||
| 2 | Vulcan Materials Co. | 288 | ||||||
|
| |||||||
Containers & Packaging — 1.2% |
| |||||||
| 33 | Ball Corp. | 1,407 | ||||||
|
| |||||||
Metals & Mining — 2.0% |
| |||||||
| 19 | Compass Minerals International, Inc. | 1,219 | ||||||
| 5 | Royal Gold, Inc. | 405 | ||||||
| 11 | Southern Copper Corp., (Peru) | 375 | ||||||
| 51 | Tahoe Resources, Inc. | 440 | ||||||
|
| |||||||
| 2,439 | ||||||||
|
| |||||||
Total Materials | 5,533 | |||||||
|
| |||||||
Real Estate — 1.5% |
| |||||||
Equity Real Estate Investment Trusts (REITs) — 1.0% |
| |||||||
| 16 | Life Storage, Inc. | 1,213 | ||||||
|
| |||||||
Real Estate Management & Development — 0.5% |
| |||||||
| 5 | Jones Lang LaSalle, Inc. | 672 | ||||||
|
| |||||||
Total Real Estate | 1,885 | |||||||
|
| |||||||
Telecommunication Services — 0.5% |
| |||||||
Wireless Telecommunication Services — 0.5% |
| |||||||
| 24 | Telephone & Data Systems, Inc. | 674 | ||||||
|
| |||||||
Utilities — 3.3% |
| |||||||
Electric Utilities — 0.6% |
| |||||||
| 28 | Great Plains Energy, Inc. | 812 | ||||||
|
| |||||||
Gas Utilities — 0.5% |
| |||||||
| 8 | Atmos Energy Corp. | 626 | ||||||
|
| |||||||
SEE NOTES TO FINANCIAL STATEMENTS.
| JUNE 30, 2017 | J.P. MORGAN MID CAP/MULTI-CAP FUNDS | 33 | ||||||
Table of Contents
JPMorgan Multi-Cap Market Neutral Fund
SCHEDULE OF PORTFOLIO INVESTMENTS
AS OF JUNE 30, 2017 (continued)
(Amounts in thousands, except number of Futures contracts)
| SHARES | SECURITY DESCRIPTION | VALUE($) | ||||||
Short Positions — continued | ||||||||
Common Stocks — continued | ||||||||
Multi-Utilities — 2.2% |
| |||||||
| 16 | Dominion Energy, Inc. | 1,262 | ||||||
| 13 | Sempra Energy | 1,424 | ||||||
|
| |||||||
| 2,686 | ||||||||
|
| |||||||
Total Utilities | 4,124 | |||||||
|
| |||||||
Total Securities Sold Short | $ | 109,316 | ||||||
|
| |||||||
Percentages indicated are based on net assets.
| Futures Contracts | ||||||||||||||||||||
| NUMBER OF CONTRACTS | DESCRIPTION | EXPIRATION DATE | TRADING CURRENCY | NOTIONAL VALUE AT JUNE 30, 2017 | NET UNREALIZED APPRECIATION (DEPRECIATION) | |||||||||||||||
Short Futures Outstanding | ||||||||||||||||||||
| (7 | ) | E-mini S&P 500 Index | 09/15/17 | USD | $ | (847 | ) | $ | 5 | |||||||||||
| (9 | ) | E-mini S&P MidCap 400 Index | 09/15/17 | USD | (1,572 | ) | 8 | |||||||||||||
|
| |||||||||||||||||||
| $ | 13 | |||||||||||||||||||
|
| |||||||||||||||||||
SEE NOTES TO FINANCIAL STATEMENTS.
| 34 | J.P. MORGAN MID CAP/MULTI-CAP FUNDS | JUNE 30, 2017 | ||||
Table of Contents
JPMorgan Value Advantage Fund
SCHEDULE OF PORTFOLIO INVESTMENTS
AS OF JUNE 30, 2017
(Amounts in thousands)
| SHARES | SECURITY DESCRIPTION | VALUE($) | ||||||
Common Stocks — 96.8% | ||||||||
Consumer Discretionary — 14.4% |
| |||||||
Distributors — 0.7% |
| |||||||
| 862 | Genuine Parts Co. | 79,963 | ||||||
|
| |||||||
Hotels, Restaurants & Leisure — 1.8% |
| |||||||
| 1,425 | Brinker International, Inc. | 54,299 | ||||||
| 1,145 | Hilton Worldwide Holdings, Inc. | 70,800 | ||||||
| 3,964 | La Quinta Holdings, Inc. (a) | 58,549 | ||||||
| 719 | Red Rock Resorts, Inc., Class A | 16,940 | ||||||
|
| |||||||
| 200,588 | ||||||||
|
| |||||||
Household Durables — 0.5% |
| |||||||
| 956 | Newell Brands, Inc. | 51,251 | ||||||
|
| |||||||
Internet & Direct Marketing Retail — 0.9% |
| |||||||
| 668 | Expedia, Inc. | 99,571 | ||||||
|
| |||||||
Media — 5.0% |
| |||||||
| 1,551 | CBS Corp. (Non-Voting), Class B | 98,893 | ||||||
| 266 | Charter Communications, Inc., Class A (a) | 89,463 | ||||||
| 3,612 | Clear Channel Outdoor Holdings, Inc., Class A | 17,519 | ||||||
| 2,416 | DISH Network Corp., Class A (a) | 151,616 | ||||||
| 2,996 | Entercom Communications Corp., Class A | 31,009 | ||||||
| 1,078 | Nexstar Media Group, Inc., Class A | 64,494 | ||||||
| 1,228 | Sinclair Broadcast Group, Inc., Class A | 40,411 | ||||||
| 598 | Time Warner, Inc. | 60,055 | ||||||
|
| |||||||
| 553,460 | ||||||||
|
| |||||||
Multiline Retail — 0.8% |
| |||||||
| 2,219 | Kohl’s Corp. | 85,825 | ||||||
|
| |||||||
Specialty Retail — 3.8% | ||||||||
| 153 | AutoZone, Inc. (a) | 87,201 | ||||||
| 1,459 | Bed Bath & Beyond, Inc. | 44,362 | ||||||
| 981 | Best Buy Co., Inc. | 56,268 | ||||||
| 1,744 | Gap, Inc. (The) | 38,341 | ||||||
| 503 | Home Depot, Inc. (The) | 77,117 | ||||||
| 692 | Murphy USA, Inc. (a) | 51,256 | ||||||
| 724 | Tiffany & Co. | 67,980 | ||||||
|
| |||||||
| 422,525 | ||||||||
|
| |||||||
Textiles, Apparel & Luxury Goods — 0.9% |
| |||||||
| 1,129 | Columbia Sportswear Co. | 65,574 | ||||||
| 1,404 | Hanesbrands, Inc. | 32,523 | ||||||
|
| |||||||
| 98,097 | ||||||||
|
| |||||||
Total Consumer Discretionary | 1,591,280 | |||||||
|
| |||||||
Consumer Staples — 6.2% |
| |||||||
Beverages — 1.4% |
| |||||||
| 787 | Dr Pepper Snapple Group, Inc. | 71,692 | ||||||
| 893 | Molson Coors Brewing Co., Class B | 77,142 | ||||||
|
| |||||||
| 148,834 | ||||||||
|
| |||||||
| SHARES | SECURITY DESCRIPTION | VALUE($) | ||||||
Food & Staples Retailing — 1.8% |
| |||||||
| 1,044 | CVS Health Corp. | 84,022 | ||||||
| 2,507 | Kroger Co. (The) | 58,460 | ||||||
| 730 | Walgreens Boots Alliance, Inc. | 57,182 | ||||||
|
| |||||||
| 199,664 | ||||||||
|
| |||||||
Food Products — 1.3% |
| |||||||
| 946 | Post Holdings, Inc. (a) | 73,433 | ||||||
| 913 | TreeHouse Foods, Inc. (a) | 74,559 | ||||||
|
| |||||||
| 147,992 | ||||||||
|
| |||||||
Household Products — 1.2% |
| |||||||
| 455 | Energizer Holdings, Inc. | 21,867 | ||||||
| 1,262 | Procter & Gamble Co. (The) | 109,960 | ||||||
|
| |||||||
| 131,827 | ||||||||
|
| |||||||
Personal Products — 0.5% |
| |||||||
| 2,976 | Coty, Inc., Class A | 55,824 | ||||||
|
| |||||||
Total Consumer Staples | 684,141 | |||||||
|
| |||||||
Energy — 7.4% |
| |||||||
Oil, Gas & Consumable Fuels — 7.4% |
| |||||||
| 1,716 | Apache Corp. | 82,224 | ||||||
| 1,833 | ConocoPhillips | 80,586 | ||||||
| 1,451 | EQT Corp. | 84,990 | ||||||
| 2,559 | Exxon Mobil Corp. | 206,549 | ||||||
| 4,452 | Kinder Morgan, Inc. | 85,296 | ||||||
| 1,689 | Marathon Petroleum Corp. | 88,386 | ||||||
| 710 | Occidental Petroleum Corp. | 42,484 | ||||||
| 2,433 | PBF Energy, Inc., Class A | 54,169 | ||||||
| 1,122 | Phillips 66 | 92,760 | ||||||
|
| |||||||
Total Energy | 817,444 | |||||||
|
| |||||||
Financials — 30.6% |
| |||||||
Banks — 14.8% |
| |||||||
| 11,852 | Bank of America Corp. | 287,534 | ||||||
| 2,144 | Citigroup, Inc. | 143,413 | ||||||
| 3,331 | Citizens Financial Group, Inc. | 118,865 | ||||||
| 2,658 | Fifth Third Bancorp | 68,990 | ||||||
| 709 | First Republic Bank | 70,957 | ||||||
| 923 | M&T Bank Corp. | 149,418 | ||||||
| 1,332 | PNC Financial Services Group, Inc. (The) | 166,287 | ||||||
| 2,255 | SunTrust Banks, Inc. | 127,879 | ||||||
| 2,235 | US Bancorp | 116,036 | ||||||
| 6,994 | Wells Fargo & Co. | 387,544 | ||||||
|
| |||||||
| 1,636,923 | ||||||||
|
| |||||||
Capital Markets — 3.8% |
| |||||||
| 1,891 | Charles Schwab Corp. (The) | 81,250 | ||||||
| 1,661 | Invesco Ltd. | 58,449 | ||||||
SEE NOTES TO FINANCIAL STATEMENTS.
| JUNE 30, 2017 | J.P. MORGAN MID CAP/MULTI-CAP FUNDS | 35 | ||||||
Table of Contents
JPMorgan Value Advantage Fund
SCHEDULE OF PORTFOLIO INVESTMENTS
AS OF JUNE 30, 2017 (continued)
(Amounts in thousands)
| SHARES | SECURITY DESCRIPTION | VALUE($) | ||||||
Common Stocks — continued | ||||||||
Capital Markets — continued |
| |||||||
| 1,690 | Morgan Stanley | 75,286 | ||||||
| 784 | Northern Trust Corp. | 76,218 | ||||||
| 1,821 | T Rowe Price Group, Inc. | 135,102 | ||||||
|
| |||||||
| 426,305 | ||||||||
|
| |||||||
Consumer Finance — 2.8% |
| |||||||
| 3,654 | Ally Financial, Inc. | 76,375 | ||||||
| 2,831 | Capital One Financial Corp. | 233,897 | ||||||
|
| |||||||
| 310,272 | ||||||||
|
| |||||||
Insurance — 9.2% |
| |||||||
| 44 | Alleghany Corp. (a) | 26,288 | ||||||
| 1,450 | Allied World Assurance Co. Holdings AG | 76,687 | ||||||
| 2,665 | American International Group, Inc. | 166,589 | ||||||
| 862 | Athene Holding Ltd., Class A (a) | 42,752 | ||||||
| 690 | Chubb Ltd. | 100,319 | ||||||
| 2,002 | CNO Financial Group, Inc. | 41,810 | ||||||
| 2,134 | Hartford Financial Services Group, Inc. (The) | 112,173 | ||||||
| 4,215 | Loews Corp. | 197,300 | ||||||
| 407 | Marsh & McLennan Cos., Inc. | 31,733 | ||||||
| 476 | Prudential Financial, Inc. | 51,512 | ||||||
| 855 | Travelers Cos., Inc. (The) | 108,167 | ||||||
| 1,328 | Unum Group | 61,910 | ||||||
|
| |||||||
| 1,017,240 | ||||||||
|
| |||||||
Total Financials | 3,390,740 | |||||||
|
| |||||||
Health Care — 9.8% |
| |||||||
Health Care Providers & Services — 3.4% |
| |||||||
| 900 | Aetna, Inc. | 136,597 | ||||||
| 273 | Cigna Corp. | 45,633 | ||||||
| 1,001 | HCA Healthcare, Inc. (a) | 87,247 | ||||||
| 564 | UnitedHealth Group, Inc. | 104,584 | ||||||
|
| |||||||
| 374,061 | ||||||||
|
| |||||||
Life Sciences Tools & Services — 0.3% |
| |||||||
| 864 | VWR Corp. (a) | 28,524 | ||||||
|
| |||||||
Pharmaceuticals — 6.1% |
| |||||||
| 307 | Allergan plc | 74,527 | ||||||
| 1,407 | Johnson & Johnson | 186,188 | ||||||
| 2,523 | Merck & Co., Inc. | 161,721 | ||||||
| 7,614 | Pfizer, Inc. | 255,761 | ||||||
|
| |||||||
| 678,197 | ||||||||
|
| |||||||
Total Health Care | 1,080,782 | |||||||
|
| |||||||
Industrials — 6.4% |
| |||||||
Aerospace & Defense — 1.2% |
| |||||||
| 1,079 | United Technologies Corp. | 131,765 | ||||||
|
| |||||||
| SHARES | SECURITY DESCRIPTION | VALUE($) | ||||||
Airlines — 1.8% |
| |||||||
| 3,832 | Delta Air Lines, Inc. | 205,915 | ||||||
|
| |||||||
Industrial Conglomerates — 2.0% |
| |||||||
| 1,011 | Carlisle Cos., Inc. | 96,403 | ||||||
| 918 | Honeywell International, Inc. | 122,403 | ||||||
|
| |||||||
| 218,806 | ||||||||
|
| |||||||
Machinery — 1.4% |
| |||||||
| 1,015 | Dover Corp. | 81,416 | ||||||
| 492 | Illinois Tool Works, Inc. | 70,461 | ||||||
|
| |||||||
| 151,877 | ||||||||
|
| |||||||
Total Industrials | 708,363 | |||||||
|
| |||||||
Information Technology — 6.6% |
| |||||||
Communications Equipment — 1.4% |
| |||||||
| 3,730 | Cisco Systems, Inc. | 116,749 | ||||||
| 1,070 | CommScope Holding Co., Inc. (a) | 40,688 | ||||||
|
| |||||||
| 157,437 | ||||||||
|
| |||||||
Electronic Equipment, Instruments & Components — 0.7% |
| |||||||
| 958 | Arrow Electronics, Inc. (a) | 75,143 | ||||||
|
| |||||||
IT Services — 0.6% | ||||||||
| 1,342 | PayPal Holdings, Inc. (a) | 72,041 | ||||||
|
| |||||||
Semiconductors & Semiconductor Equipment — 2.0% |
| |||||||
| 412 | KLA-Tencor Corp. | 37,664 | ||||||
| 1,158 | QUALCOMM, Inc. | 63,930 | ||||||
| 1,527 | Texas Instruments, Inc. | 117,454 | ||||||
|
| |||||||
| 219,048 | ||||||||
|
| |||||||
Software — 1.3% | ||||||||
| 2,013 | Microsoft Corp. | 138,772 | ||||||
|
| |||||||
Technology Hardware, Storage & Peripherals — 0.6% |
| |||||||
| 3,944 | Hewlett Packard Enterprise Co. | 65,434 | ||||||
|
| |||||||
Total Information Technology | 727,875 | |||||||
|
| |||||||
Materials — 3.9% |
| |||||||
Chemicals — 0.2% | ||||||||
| 685 | AdvanSix, Inc. (a) | 21,399 | ||||||
|
| |||||||
Construction Materials — 0.8% |
| |||||||
| 389 | Martin Marietta Materials, Inc. | 86,601 | ||||||
|
| |||||||
Containers & Packaging — 2.6% | ||||||||
| 3,131 | Ball Corp. | 132,171 | ||||||
| 4,151 | Graphic Packaging Holding Co. | 57,195 | ||||||
| 1,749 | WestRock Co. | 99,125 | ||||||
|
| |||||||
| 288,491 | ||||||||
|
| |||||||
Paper & Forest Products — 0.3% |
| |||||||
| 1,681 | KapStone Paper and Packaging Corp. | 34,669 | ||||||
|
| |||||||
Total Materials | 431,160 | |||||||
|
| |||||||
SEE NOTES TO FINANCIAL STATEMENTS.
| 36 | J.P. MORGAN MID CAP/MULTI-CAP FUNDS | JUNE 30, 2017 | ||||
Table of Contents
| SHARES | SECURITY DESCRIPTION | VALUE($) | ||||||
Common Stocks — continued | ||||||||
Real Estate — 5.5% |
| |||||||
Equity Real Estate Investment Trusts (REITs) — 4.9% |
| |||||||
| 3,160 | American Homes 4 Rent, Class A | 71,332 | ||||||
| 3,703 | Brixmor Property Group, Inc. | 66,205 | ||||||
| 671 | EastGroup Properties, Inc. | 56,196 | ||||||
| 3,687 | Kimco Realty Corp. | 67,663 | ||||||
| 621 | Mid-America Apartment Communities, Inc. | 65,488 | ||||||
| 2,674 | Outfront Media, Inc. | 61,831 | ||||||
| 801 | Park Hotels & Resorts, Inc. | 21,602 | ||||||
| 2,989 | Rayonier, Inc. | 85,995 | ||||||
| 1,291 | Weyerhaeuser Co. | 43,245 | ||||||
|
| |||||||
| 539,557 | ||||||||
|
| |||||||
Real Estate Management & Development — 0.6% |
| |||||||
| 1,879 | CBRE Group, Inc., Class A (a) | 68,402 | ||||||
|
| |||||||
Total Real Estate | 607,959 | |||||||
|
| |||||||
Telecommunication Services — 0.7% |
| |||||||
Diversified Telecommunication Services — 0.7% |
| |||||||
| 1,752 | Verizon Communications, Inc. | 78,266 | ||||||
|
| |||||||
Utilities — 5.3% |
| |||||||
Electric Utilities — 4.7% |
| |||||||
| 1,546 | American Electric Power Co., Inc. | 107,423 | ||||||
| 646 | Duke Energy Corp. | 53,981 | ||||||
| 994 | Edison International | 77,706 | ||||||
| 987 | Eversource Energy | 59,909 | ||||||
| 817 | NextEra Energy, Inc. | 114,443 | ||||||
| 2,322 | Xcel Energy, Inc. | 106,526 | ||||||
|
| |||||||
| 519,988 | ||||||||
|
| |||||||
Multi-Utilities — 0.6% |
| |||||||
| 559 | Sempra Energy | 63,043 | ||||||
|
| |||||||
Total Utilities | 583,031 | |||||||
|
| |||||||
Total Common Stocks | 10,701,041 | |||||||
|
| |||||||
| NUMBER OF RIGHTS | ||||||||
Rights — 0.0% (g) | ||||||||
Consumer Discretionary — 0.0% (g) |
| |||||||
Media — 0.0% (g) |
| |||||||
| 2,982 | Media General, Inc., CVR (a) | — | (h) | |||||
|
| |||||||
| SHARES | SECURITY DESCRIPTION | VALUE($) | ||||||
Short-Term Investment — 3.2% | ||||||||
Investment Company — 3.2% | ||||||||
| 353,110 | JPMorgan U.S. Government | 353,110 | ||||||
|
| |||||||
Total Investments — 100.0% | 11,054,151 | |||||||
Other Assets in Excess of | 3,875 | |||||||
|
| |||||||
NET ASSETS — 100.0% | $ | 11,058,026 | ||||||
|
| |||||||
Percentages indicated are based on net assets.
SEE NOTES TO FINANCIAL STATEMENTS.
| JUNE 30, 2017 | J.P. MORGAN MID CAP/MULTI-CAP FUNDS | 37 | ||||||
Table of Contents
J.P. Morgan Mid Cap/Multi-Cap Funds
NOTES TO SCHEDULES OF PORTFOLIO INVESTMENTS
AS OF JUNE 30, 2017
| CVR | — Contingent Value Rights | |
| USD | — United States Dollar | |
(a) | — Non-income producing security. | |
| (b) | — Investment in affiliate. Money market fund is registered under the Investment Company Act of 1940, as amended, and advised by J.P. Morgan Investment Management Inc. | |
| (g) | — Amount rounds to less than 0.05%. | |
| (h) | — Amount rounds to less than 500. | |
| (j) | — All or a portion of this security is segregated as collateral for short sales. The total value of securities and cash segregated as collateral is approximately $20,404,000 and $109,968,000, respectively. | |
| (l) | — The rate shown is the current yield as of June 30, 2017. |
SEE NOTES TO FINANCIAL STATEMENTS.
| 38 | J.P. MORGAN MID CAP/MULTI-CAP FUNDS | JUNE 30, 2017 | ||||
Table of Contents
THIS PAGE IS INTENTIONALLY LEFT BLANK
| JUNE 30, 2017 | J.P. MORGAN MID CAP/MULTI-CAP FUNDS | 39 | ||||||
Table of Contents
STATEMENTS OF ASSETS AND LIABILITIES
AS OF JUNE 30, 2017
(Amounts in thousands, except per share amounts)
| Growth Advantage Fund | Mid Cap Equity Fund | Mid Cap Growth Fund | ||||||||||
ASSETS: | ||||||||||||
Investments in non-affiliates, at value | $ | 6,906,629 | $ | 2,713,884 | $ | 2,975,793 | ||||||
Investments in affiliates, at value | 246,532 | 119,456 | 139,641 | |||||||||
|
|
|
|
|
| |||||||
Total investment securities, at value | 7,153,161 | 2,833,340 | 3,115,434 | |||||||||
Cash | — | — | (a) | — | ||||||||
Receivables: | ||||||||||||
Due from custodian | — | 1,950 | — | |||||||||
Investment securities sold | 12,605 | 3,122 | 5,147 | |||||||||
Fund shares sold | 10,263 | 2,772 | 5,946 | |||||||||
Dividends from non-affiliates | 807 | 2,295 | 809 | |||||||||
Dividends from affiliates | 169 | 78 | 72 | |||||||||
|
|
|
|
|
| |||||||
Total Assets | 7,177,005 | 2,843,557 | 3,127,408 | |||||||||
|
|
|
|
|
| |||||||
LIABILITIES: | ||||||||||||
Payables: | ||||||||||||
Investment securities purchased | 8,523 | 15,465 | 26,018 | |||||||||
Fund shares redeemed | 64,462 | 17,337 | 10,301 | |||||||||
Accrued liabilities: | ||||||||||||
Investment advisory fees | 3,799 | 1,484 | 1,606 | |||||||||
Administration fees | 478 | 186 | 189 | |||||||||
Distribution fees | 700 | 97 | 261 | |||||||||
Service fees | 720 | 177 | 385 | |||||||||
Custodian and accounting fees | 14 | 7 | 8 | |||||||||
Trustees’ and Chief Compliance Officer’s fees | 16 | — | — | (a) | ||||||||
Other | 383 | 326 | 362 | |||||||||
|
|
|
|
|
| |||||||
Total Liabilities | 79,095 | 35,079 | 39,130 | |||||||||
|
|
|
|
|
| |||||||
Net Assets | $ | 7,097,910 | $ | 2,808,478 | $ | 3,088,278 | ||||||
|
|
|
|
|
| |||||||
| (a) | Amount rounds to less than 500. |
SEE NOTES TO FINANCIAL STATEMENTS.
| 40 | J.P. MORGAN MID CAP/MULTI-CAP FUNDS | JUNE 30, 2017 | ||||
Table of Contents
| Growth Advantage Fund | Mid Cap Equity Fund | Mid Cap Growth Fund | ||||||||||
NET ASSETS: | ||||||||||||
Paid-in-Capital | $ | 4,631,805 | $ | 1,927,673 | $ | 2,293,950 | ||||||
Accumulated undistributed (distributions in excess of) net investment income | (9,977 | ) | 2,627 | (5,294 | ) | |||||||
Accumulated net realized gains (losses) | 38,460 | 64,271 | 85,830 | |||||||||
Net unrealized appreciation (depreciation) | 2,437,622 | 813,907 | 713,792 | |||||||||
|
|
|
|
|
| |||||||
Total Net Assets | $ | 7,097,910 | $ | 2,808,478 | $ | 3,088,278 | ||||||
|
|
|
|
|
| |||||||
Net Assets: | ||||||||||||
Class A | $ | 1,550,092 | $ | 378,055 | $ | 915,226 | ||||||
Class C | 605,999 | 30,596 | 90,640 | |||||||||
Class I (formerly Select Class) | 1,691,899 | 778,378 | 1,050,151 | |||||||||
Class R2 | — | 600 | 35,242 | |||||||||
Class R3 | 20 | — | 152 | |||||||||
Class R4 | 20 | — | 129 | |||||||||
Class R5 | 95,952 | 1,804 | 247,068 | |||||||||
Class R6 | 3,153,928 | 1,619,045 | 749,670 | |||||||||
|
|
|
|
|
| |||||||
Total | $ | 7,097,910 | $ | 2,808,478 | $ | 3,088,278 | ||||||
|
|
|
|
|
| |||||||
Outstanding units of beneficial interest (shares) | ||||||||||||
($0.0001 par value; unlimited number of shares authorized): | ||||||||||||
Class A | 86,344 | 7,791 | 32,697 | |||||||||
Class C | 37,898 | 650 | 4,004 | |||||||||
Class I (formerly Select Class) | 91,931 | 15,844 | 33,038 | |||||||||
Class R2 | — | 12 | 1,163 | |||||||||
Class R3 | 1 | — | 5 | |||||||||
Class R4 | 1 | — | 4 | |||||||||
Class R5 | 5,134 | 37 | 7,700 | |||||||||
Class R6 | 168,084 | 32,922 | 23,283 | |||||||||
Net Asset Value (a): | ||||||||||||
Class A — Redemption price per share | $ | 17.95 | $ | 48.53 | $ | 27.99 | ||||||
Class C — Offering price per share (b) | 15.99 | 47.05 | 22.64 | |||||||||
Class I (formerly Select Class) — Offering and redemption price per share | 18.40 | 49.13 | 31.79 | |||||||||
Class R2 — Offering and redemption price per share | — | 48.21 | 30.31 | |||||||||
Class R3 — Offering and redemption price per share | 17.96 | — | 31.71 | |||||||||
Class R4 — Offering and redemption price per share | 18.40 | — | 31.77 | |||||||||
Class R5 — Offering and redemption price per share | 18.69 | 49.17 | 32.09 | |||||||||
Class R6 — Offering and redemption price per share | 18.76 | 49.18 | 32.20 | |||||||||
Class A maximum sales charge | 5.25 | % | 5.25 | % | 5.25 | % | ||||||
Class A maximum public offering price per share | $ | 18.94 | $ | 51.22 | $ | 29.54 | ||||||
|
|
|
|
|
| |||||||
Cost of investments in non-affiliates | $ | 4,469,007 | $ | 1,899,977 | $ | 2,262,001 | ||||||
Cost of investments in affiliates | 246,532 | 119,456 | 139,641 | |||||||||
| (a) | Per share amounts may not recalculate due to rounding of net assets and/or shares outstanding. |
| (b) | Redemption price for Class C Shares varies based upon length of time the shares are held. |
SEE NOTES TO FINANCIAL STATEMENTS.
| JUNE 30, 2017 | J.P. MORGAN MID CAP/MULTI-CAP FUNDS | 41 | ||||||
Table of Contents
STATEMENTS OF ASSETS AND LIABILITIES
AS OF JUNE 30, 2017 (continued)
(Amounts in thousands, except per share amounts)
| Mid Cap Value Fund | Multi-Cap Market Neutral Fund | Value Advantage Fund | ||||||||||
ASSETS: | ||||||||||||
Investments in non-affiliates, at value | $ | 17,588,371 | $ | 111,505 | $ | 10,701,041 | ||||||
Investments in affiliates, at value | 795,573 | 13,435 | 353,110 | |||||||||
|
|
|
|
|
| |||||||
Total investment securities, at value | 18,383,944 | 124,940 | 11,054,151 | |||||||||
Restricted cash | — | 17 | — | |||||||||
Cash | — | 69 | — | |||||||||
Deposits at broker for futures contracts | — | 185 | — | |||||||||
Deposits at broker for securities sold short | — | 109,951 | — | |||||||||
Receivables: | ||||||||||||
Investment securities sold | 20,062 | 515 | — | |||||||||
Fund shares sold | 75,610 | 4 | 18,539 | |||||||||
Dividends from non-affiliates | 25,267 | 194 | 8,599 | |||||||||
Dividends from affiliates | 413 | 8 | 258 | |||||||||
|
|
|
|
|
| |||||||
Total Assets | 18,505,296 | 235,883 | 11,081,547 | |||||||||
|
|
|
|
|
| |||||||
LIABILITIES: | ||||||||||||
Payables: | ||||||||||||
Securities sold short, at value | — | 109,316 | — | |||||||||
Dividend expense to non-affiliates on securities sold short | — | 67 | — | |||||||||
Investment securities purchased | 19,144 | 943 | 4,860 | |||||||||
Fund shares redeemed | 68,819 | 1,047 | 9,855 | |||||||||
Variation margin on futures contracts | — | 1 | — | |||||||||
Accrued liabilities: | ||||||||||||
Investment advisory fees | 9,597 | 54 | 5,555 | |||||||||
Administration fees | 1,200 | — | 668 | |||||||||
Distribution fees | 762 | 3 | 761 | |||||||||
Service fees | 1,108 | 24 | 696 | |||||||||
Custodian and accounting fees | 42 | 3 | 29 | |||||||||
Trustees’ and Chief Compliance Officer’s fees | 93 | — | (a) | 48 | ||||||||
Other | 1,519 | 40 | 1,049 | |||||||||
|
|
|
|
|
| |||||||
Total Liabilities | 102,284 | 111,498 | 23,521 | |||||||||
|
|
|
|
|
| |||||||
Net Assets | $ | 18,403,012 | $ | 124,385 | $ | 11,058,026 | ||||||
|
|
|
|
|
| |||||||
| (a) | Amount rounds to less than 500. |
SEE NOTES TO FINANCIAL STATEMENTS.
| 42 | J.P. MORGAN MID CAP/MULTI-CAP FUNDS | JUNE 30, 2017 | ||||
Table of Contents
| Mid Cap Value Fund | Multi-Cap Market Neutral Fund | Value Advantage Fund | ||||||||||
NET ASSETS: | ||||||||||||
Paid-in-Capital | $ | 11,863,507 | $ | 116,891 | $ | 8,484,737 | ||||||
Accumulated undistributed (distributions in excess of) net investment income | 72,501 | (202 | ) | 57,021 | ||||||||
Accumulated net realized gains (losses) | 241,239 | (7,525 | ) | 35,311 | ||||||||
Net unrealized appreciation (depreciation) | 6,225,765 | 15,221 | 2,480,957 | |||||||||
|
|
|
|
|
| |||||||
Total Net Assets | $ | 18,403,012 | $ | 124,385 | $ | 11,058,026 | ||||||
|
|
|
|
|
| |||||||
Net Assets: | ||||||||||||
Class A | $ | 2,149,689 | $ | 5,295 | $ | 1,432,370 | ||||||
Class C | 452,351 | 3,286 | 746,521 | |||||||||
Class I (formerly Select Class) | 2,902,646 | 115,804 | 2,165,577 | |||||||||
Class L (formerly Institutional Class) | 12,478,637 | — | 3,643,327 | |||||||||
Class R2 | 85,287 | — | — | |||||||||
Class R3 | 19,262 | — | 385 | |||||||||
Class R4 | 3,537 | — | 34 | |||||||||
Class R5 | 30,334 | — | 422 | |||||||||
Class R6 | 281,269 | — | 3,069,390 | |||||||||
|
|
|
|
|
| |||||||
Total | $ | 18,403,012 | $ | 124,385 | $ | 11,058,026 | ||||||
|
|
|
|
|
| |||||||
Outstanding units of beneficial interest (shares) | ||||||||||||
($0.0001 par value; unlimited number of shares authorized): | ||||||||||||
Class A | 56,864 | 531 | 42,888 | |||||||||
Class C | 12,446 | 353 | 22,487 | |||||||||
Class I (formerly Select Class) | 75,916 | 11,321 | 64,416 | |||||||||
Class L (formerly Institutional Class) | 322,404 | — | 108,326 | |||||||||
Class R2 | 2,347 | — | — | |||||||||
Class R3 | 511 | — | 12 | |||||||||
Class R4 | 93 | — | 1 | |||||||||
Class R5 | 784 | — | 12 | |||||||||
Class R6 | 7,270 | — | 91,334 | |||||||||
Net Asset Value (a): | ||||||||||||
Class A — Redemption price per share | $ | 37.80 | $ | 9.97 | $ | 33.40 | ||||||
Class C — Offering price per share (b) | 36.35 | 9.31 | 33.20 | |||||||||
Class I (formerly Select Class) — Offering and redemption price per share | 38.24 | 10.23 | 33.62 | |||||||||
Class L (formerly Institutional Class) — Offering and redemption price per share | 38.70 | — | 33.63 | |||||||||
Class R2 — Offering and redemption price per share | 36.33 | — | — | |||||||||
Class R3 — Offering and redemption price per share | 37.67 | — | 33.24 | |||||||||
Class R4 — Offering and redemption price per share | 38.16 | — | 33.55 | |||||||||
Class R5 — Offering and redemption price per share | 38.67 | — | 33.59 | |||||||||
Class R6 — Offering and redemption price per share | 38.69 | — | 33.61 | |||||||||
Class A maximum sales charge | 5.25 | % | 5.25 | % | 5.25 | % | ||||||
Class A maximum public offering price per share | $ | 39.89 | $ | 10.52 | $ | 35.25 | ||||||
|
|
|
|
|
| |||||||
Cost of investments in non-affiliates | $ | 11,362,606 | $ | 93,859 | $ | 8,220,084 | ||||||
Cost of investments in affiliates | 795,573 | 13,435 | 353,110 | |||||||||
Proceeds from securities sold short | — | 106,878 | — | |||||||||
| (a) | Per share amounts may not recalculate due to rounding of net assets and/or shares outstanding. |
| (b) | Redemption price for Class C Shares varies based upon length of time the shares are held. |
SEE NOTES TO FINANCIAL STATEMENTS.
| JUNE 30, 2017 | J.P. MORGAN MID CAP/MULTI-CAP FUNDS | 43 | ||||||
Table of Contents
STATEMENTS OF OPERATIONS
FOR THE YEAR ENDED JUNE 30, 2017
(Amounts in thousands)
| Growth Advantage Fund | Mid Cap Equity Fund | Mid Cap Fund | ||||||||||
INVESTMENT INCOME: |
| |||||||||||
Interest income from affiliates | $ | 11 | $ | 4 | $ | 3 | ||||||
Dividend income from non-affiliates | 42,896 | 30,604 | 19,191 | |||||||||
Dividend income from affiliates | 774 | 435 | 351 | |||||||||
|
|
|
|
|
| |||||||
Total investment income | 43,681 | 31,043 | 19,545 | |||||||||
|
|
|
|
|
| |||||||
EXPENSES: |
| |||||||||||
Investment advisory fees | 41,539 | 16,901 | 18,725 | |||||||||
Administration fees | 5,226 | 2,127 | 2,356 | |||||||||
Distribution fees: | ||||||||||||
Class A | 3,978 | 886 | 2,296 | |||||||||
Class C | 4,427 | 236 | 697 | |||||||||
Class R2 | — | 3 | 152 | |||||||||
Class R3 (a)(b) | — | (c) | — | — | (c) | |||||||
Service fees: | ||||||||||||
Class A | 3,978 | 886 | 2,296 | |||||||||
Class C | 1,476 | 79 | 233 | |||||||||
Class I (formerly Select Class) | 3,014 | 1,743 | 2,363 | |||||||||
Class R2 | — | 1 | 76 | |||||||||
Class R3 (a)(b) | — | (c) | — | — | (c) | |||||||
Class R4 (a)(b) | — | (c) | — | — | (c) | |||||||
Class R5 | 55 | 2 | 144 | |||||||||
Custodian and accounting fees | 173 | 74 | 93 | |||||||||
Interest expense to affiliates | — | (c) | — | — | ||||||||
Professional fees | 100 | 71 | 77 | |||||||||
Trustees’ and Chief Compliance Officer’s fees | 48 | 33 | 31 | |||||||||
Printing and mailing costs | 368 | 235 | 228 | |||||||||
Registration and filing fees | 213 | 109 | 137 | |||||||||
Transfer agency fees (See Note 2.E.) | 213 | 43 | 430 | |||||||||
Sub-transfer agency fees (See Note 2.E.) | 2,009 | 949 | 1,712 | |||||||||
Other | 164 | 51 | 60 | |||||||||
|
|
|
|
|
| |||||||
Total expenses | 66,981 | 24,429 | 32,106 | |||||||||
|
|
|
|
|
| |||||||
Less fees waived | (2,436 | ) | (1,939 | ) | (3,158 | ) | ||||||
Less expense reimbursements | (7 | ) | (23 | ) | (114 | ) | ||||||
|
|
|
|
|
| |||||||
Net expenses | 64,538 | 22,467 | 28,834 | |||||||||
|
|
|
|
|
| |||||||
Net investment income (loss) | (20,857 | ) | 8,576 | (9,289 | ) | |||||||
|
|
|
|
|
| |||||||
REALIZED/UNREALIZED GAINS (LOSSES): | ||||||||||||
Net realized gain (loss) on transactions from investments in non-affiliates | 258,483 | 120,548 | 128,903 | |||||||||
Change in net unrealized appreciation/depreciation on investments in non-affiliates | 1,188,472 | 282,160 | 403,806 | |||||||||
|
|
|
|
|
| |||||||
Net realized/unrealized gains (losses) | 1,446,955 | 402,708 | 532,709 | |||||||||
|
|
|
|
|
| |||||||
Change in net assets resulting from operations | $ | 1,426,098 | $ | 411,284 | $ | 523,420 | ||||||
|
|
|
|
|
| |||||||
| (a) | Commencement of offering of class of shares effective May 31, 2017 for Growth Advantage Fund. |
| (b) | Commencement of offering of class of shares effective September 9, 2016 for Mid Cap Growth Fund. |
| (c) | Amount rounds to less than 500. |
SEE NOTES TO FINANCIAL STATEMENTS.
| 44 | J.P. MORGAN MID CAP/MULTI-CAP FUNDS | JUNE 30, 2017 | ||||
Table of Contents
| Mid Cap Value Fund | Multi-Cap Market Neutral Fund | Value Advantage Fund | ||||||||||
INVESTMENT INCOME: | ||||||||||||
Interest income from non-affiliates | $ | — | $ | — | (a) | $ | — | |||||
Interest income from affiliates | — | (a) | — | (a) | 23 | |||||||
Dividend income from non-affiliates | 287,975 | 2,230 | 216,570 | |||||||||
Dividend income from affiliates | 3,332 | 65 | 1,251 | |||||||||
Interest income from non-affiliates on securities sold short | — | 245 | — | |||||||||
Foreign taxes withheld | 63 | — | 71 | |||||||||
|
|
|
|
|
| |||||||
Total investment income | 291,370 | 2,540 | 217,915 | |||||||||
|
|
|
|
|
| |||||||
EXPENSES: | ||||||||||||
Investment advisory fees | 111,486 | 1,285 | 67,827 | |||||||||
Administration fees | 14,027 | 131 | 8,535 | |||||||||
Distribution fees: | ||||||||||||
Class A | 5,588 | 14 | 4,408 | |||||||||
Class C | 3,957 | 38 | 5,668 | |||||||||
Class R2 | 338 | — | — | |||||||||
Class R3 (b) | 4 | — | — | (a) | ||||||||
Service fees: | ||||||||||||
Class A | 5,588 | 14 | 4,408 | |||||||||
Class C | 1,319 | 13 | 1,890 | |||||||||
Class I (formerly Select Class) | 6,710 | 375 | 3,688 | |||||||||
Class L (formerly Institutional Class) | 11,555 | — | 4,438 | |||||||||
Class R2 | 169 | — | — | |||||||||
Class R3 (b) | 4 | — | — | (a) | ||||||||
Class R4 (b) | 1 | — | — | (a) | ||||||||
Class R5 (b) | 2 | — | — | (a) | ||||||||
Custodian and accounting fees | 470 | 34 | 285 | |||||||||
Interest expense to affiliates | — | (a) | 5 | — | ||||||||
Professional fees | 420 | 53 | 274 | |||||||||
Interest expense to non-affiliates | — | — | (a) | — | ||||||||
Trustees’ and Chief Compliance Officer’s fees | 129 | 26 | 81 | |||||||||
Printing and mailing costs | 1,203 | 13 | 987 | |||||||||
Registration and filing fees | 589 | 41 | 368 | |||||||||
Transfer agency fees (See Note 2.E.) | 994 | 4 | 245 | |||||||||
Sub-transfer agency fees (See Note 2.E.) | 11,135 | 16 | 3,780 | |||||||||
Other | 398 | 7 | 172 | |||||||||
Dividend expense to non-affiliates on securities sold short | — | 1,846 | — | |||||||||
|
|
|
|
|
| |||||||
Total expenses | 176,086 | 3,915 | 107,054 | |||||||||
|
|
|
|
|
| |||||||
Less fees waived | (19,838 | ) | (448 | ) | (8,721 | ) | ||||||
Less expense reimbursements | (5,540 | ) | — | (588 | ) | |||||||
|
|
|
|
|
| |||||||
Net expenses | 150,708 | 3,467 | 97,745 | |||||||||
|
|
|
|
|
| |||||||
Net investment income (loss) | 140,662 | (927 | ) | 120,170 | ||||||||
|
|
|
|
|
| |||||||
REALIZED/UNREALIZED GAINS (LOSSES): | ||||||||||||
Net realized gain (loss) on transactions from: | ||||||||||||
Investments in non-affiliates | 458,502 | 24,173 | 526,307 | |||||||||
Futures | — | (234 | ) | — | ||||||||
Securities sold short | — | (20,442 | ) | — | ||||||||
|
|
|
|
|
| |||||||
Net realized gain (loss) | 458,502 | 3,497 | 526,307 | |||||||||
|
|
|
|
|
| |||||||
Change in net unrealized appreciation/depreciation on: | ||||||||||||
Investments in non-affiliates | 1,674,398 | 3,712 | 1,078,370 | |||||||||
Futures | — | 43 | — | |||||||||
Securities sold short | — | (3,896 | ) | — | ||||||||
|
|
|
|
|
| |||||||
Change in net unrealized appreciation/depreciation | 1,674,398 | (141 | ) | 1,078,370 | ||||||||
|
|
|
|
|
| |||||||
Net realized/unrealized gains (losses) | 2,132,900 | 3,356 | 1,604,677 | |||||||||
|
|
|
|
|
| |||||||
Change in net assets resulting from operations | $ | 2,273,562 | $ | 2,429 | $ | 1,724,847 | ||||||
|
|
|
|
|
| |||||||
| (a) | Amount rounds to less than 500. |
| (b) | Commencement of offering of class of shares effective September 9, 2016 for Mid Cap Value Fund and Value Advantage Fund. |
SEE NOTES TO FINANCIAL STATEMENTS.
| JUNE 30, 2017 | J.P. MORGAN MID CAP/MULTI-CAP FUNDS | 45 | ||||||
Table of Contents
STATEMENTS OF CHANGES IN NET ASSETS
FOR THE PERIODS INDICATED
(Amounts in thousands)
| Growth Advantage Fund | Mid Cap Equity Fund | |||||||||||||||
| Year Ended June 30, 2017 | Year Ended June 30, 2016 | Year Ended June 30, 2017 | Year Ended June 30, 2016 | |||||||||||||
CHANGE IN NET ASSETS RESULTING FROM OPERATIONS: | ||||||||||||||||
Net investment income (loss) | $ | (20,857 | ) | $ | (20,440 | ) | $ | 8,576 | $ | 8,836 | ||||||
Net realized gain (loss) | 258,483 | (145,387 | ) | 120,548 | 58,144 | |||||||||||
Change in net unrealized appreciation/depreciation | 1,188,472 | (181,585 | ) | 282,160 | (300,510 | ) | ||||||||||
|
|
|
|
|
|
|
| |||||||||
Change in net assets resulting from operations | 1,426,098 | (347,412 | ) | 411,284 | (233,530 | ) | ||||||||||
|
|
|
|
|
|
|
| |||||||||
DISTRIBUTIONS TO SHAREHOLDERS: | ||||||||||||||||
Class A | ||||||||||||||||
From net investment income | — | — | (356 | ) | (182 | ) | ||||||||||
From net realized gains | — | (57,173 | ) | (10,459 | ) | (12,309 | ) | |||||||||
Class C | ||||||||||||||||
From net realized gains | — | (20,218 | ) | (964 | ) | (1,246 | ) | |||||||||
Class I (formerly Select Class) | ||||||||||||||||
From net investment income | — | — | (2,165 | ) | (2,603 | ) | ||||||||||
From net realized gains | — | (48,267 | ) | (20,374 | ) | (75,744 | ) | |||||||||
Class R2 | ||||||||||||||||
From net investment income | — | — | — | (a) | — | (a) | ||||||||||
From net realized gains | — | — | (19 | ) | (39 | ) | ||||||||||
Class R5 | ||||||||||||||||
From net investment income | — | — | (11 | ) | (7 | ) | ||||||||||
From net realized gains | — | (2,457 | ) | (84 | ) | (147 | ) | |||||||||
Class R6 | ||||||||||||||||
From net investment income | — | — | (6,472 | ) | (3,761 | ) | ||||||||||
From net realized gains | — | (86,200 | ) | (46,392 | ) | (61,528 | ) | |||||||||
|
|
|
|
|
|
|
| |||||||||
Total distributions to shareholders | — | (214,315 | ) | (87,296 | ) | (157,566 | ) | |||||||||
|
|
|
|
|
|
|
| |||||||||
CAPITAL TRANSACTIONS: | ||||||||||||||||
Change in net assets resulting from capital transactions | (291,788 | ) | 1,337,047 | 120,141 | (547,848 | ) | ||||||||||
|
|
|
|
|
|
|
| |||||||||
NET ASSETS: | ||||||||||||||||
Change in net assets | 1,134,310 | 775,320 | 444,129 | (938,944 | ) | |||||||||||
Beginning of period | 5,963,600 | 5,188,280 | 2,364,349 | 3,303,293 | ||||||||||||
|
|
|
|
|
|
|
| |||||||||
End of period | $ | 7,097,910 | $ | 5,963,600 | $ | 2,808,478 | $ | 2,364,349 | ||||||||
|
|
|
|
|
|
|
| |||||||||
Accumulated undistributed (distributions in excess of) net investment income | $ | (9,977 | ) | $ | (8,414 | ) | $ | 2,627 | $ | 3,375 | ||||||
|
|
|
|
|
|
|
| |||||||||
| (a) | Amount rounds to less than 500. |
SEE NOTES TO FINANCIAL STATEMENTS.
| 46 | J.P. MORGAN MID CAP/MULTI-CAP FUNDS | JUNE 30, 2017 | ||||
Table of Contents
| Mid Cap Growth Fund | Mid Cap Value Fund | |||||||||||||||
| Year Ended June 30, 2017 | Year Ended June 30, 2016 | Year Ended June 30, 2017 | Year Ended June 30, 2016 | |||||||||||||
CHANGE IN NET ASSETS RESULTING FROM OPERATIONS: | ||||||||||||||||
Net investment income (loss) | $ | (9,289 | ) | $ | (11,080 | ) | $ | 140,662 | $ | 133,064 | ||||||
Net realized gain (loss) | 128,903 | 181,344 | 458,502 | 921,071 | ||||||||||||
Change in net unrealized appreciation/depreciation | 403,806 | (478,421 | ) | 1,674,398 | (753,064 | ) | ||||||||||
|
|
|
|
|
|
|
| |||||||||
Change in net assets resulting from operations | 523,420 | (308,157 | ) | 2,273,562 | 301,071 | |||||||||||
|
|
|
|
|
|
|
| |||||||||
DISTRIBUTIONS TO SHAREHOLDERS: | ||||||||||||||||
Class A | ||||||||||||||||
From net investment income | — | — | (9,018 | ) | (9,590 | ) | ||||||||||
From net realized gains | (449 | ) | (56,339 | ) | (135,546 | ) | (130,210 | ) | ||||||||
Class C | ||||||||||||||||
From net realized gains | (55 | ) | (6,714 | ) | (33,147 | ) | (31,402 | ) | ||||||||
Class I (formerly Select Class) | ||||||||||||||||
From net investment income | — | — | (17,549 | ) | (14,584 | ) | ||||||||||
From net realized gains | (390 | ) | (50,435 | ) | (155,821 | ) | (117,229 | ) | ||||||||
Class L (formerly Institutional Class) | ||||||||||||||||
From net investment income | — | — | (100,129 | ) | (89,774 | ) | ||||||||||
From net realized gains | — | — | (669,173 | ) | (526,794 | ) | ||||||||||
Class R2 | ||||||||||||||||
From net investment income | — | — | (133 | ) | (113 | ) | ||||||||||
From net realized gains | (11 | ) | (1,533 | ) | (4,114 | ) | (3,769 | ) | ||||||||
Class R3 (a) | ||||||||||||||||
From net investment income | — | — | — | (b) | — | |||||||||||
From net realized gains | — | (b) | — | (1 | ) | — | ||||||||||
Class R4 (a) | ||||||||||||||||
From net investment income | — | — | — | (b) | — | |||||||||||
From net realized gains | — | (b) | — | (1 | ) | — | ||||||||||
Class R5 (c) | ||||||||||||||||
From net investment income | — | — | — | (b) | — | |||||||||||
From net realized gains | (96 | ) | (8,974 | ) | (1 | ) | — | |||||||||
Class R6 (c) | ||||||||||||||||
From net investment income | — | — | (437 | ) | — | |||||||||||
From net realized gains | (275 | ) | (23,518 | ) | (2,480 | ) | — | |||||||||
|
|
|
|
|
|
|
| |||||||||
Total distributions to shareholders | (1,276 | ) | (147,513 | ) | (1,127,550 | ) | (923,465 | ) | ||||||||
|
|
|
|
|
|
|
| |||||||||
CAPITAL TRANSACTIONS: | ||||||||||||||||
Change in net assets resulting from capital transactions | (285,349 | ) | 244,627 | 1,692,858 | 227,463 | |||||||||||
|
|
|
|
|
|
|
| |||||||||
NET ASSETS: | ||||||||||||||||
Change in net assets | 236,795 | (211,043 | ) | 2,838,870 | (394,931 | ) | ||||||||||
Beginning of period | 2,851,483 | 3,062,526 | 15,564,142 | 15,959,073 | ||||||||||||
|
|
|
|
|
|
|
| |||||||||
End of period | $ | 3,088,278 | $ | 2,851,483 | $ | 18,403,012 | $ | 15,564,142 | ||||||||
|
|
|
|
|
|
|
| |||||||||
Accumulated undistributed (distributions in excess of) net investment income | $ | (5,294 | ) | $ | (4,220 | ) | $ | 72,501 | $ | 59,105 | ||||||
|
|
|
|
|
|
|
| |||||||||
| (a) | Commencement of offering of class of shares effective September 9, 2016 for Mid Cap Growth and Mid Cap Value Fund. |
| (b) | Amount rounds to less than 500. |
| (c) | Commencement of offering of class of shares effective September 9, 2016 for Mid Cap Value Fund. |
SEE NOTES TO FINANCIAL STATEMENTS.
| JUNE 30, 2017 | J.P. MORGAN MID CAP/MULTI-CAP FUNDS | 47 | ||||||
Table of Contents
STATEMENTS OF CHANGES IN NET ASSETS
FOR THE PERIODS INDICATED (continued)
(Amounts in thousands)
| Multi-Cap Market Neutral Fund | Value Advantage Fund | |||||||||||||||
| Year Ended June 30, 2017 | Year Ended June 30, 2016 | Year Ended June 30, 2017 | Year Ended June 30, 2016 | |||||||||||||
CHANGE IN NET ASSETS RESULTING FROM OPERATIONS: | ||||||||||||||||
Net investment income (loss) | $ | (927 | ) | $ | (1,875 | ) | $ | 120,170 | $ | 137,198 | ||||||
Net realized gain (loss) | 3,497 | 30,953 | 526,307 | (206,123 | ) | |||||||||||
Change in net unrealized appreciation/depreciation | (141 | ) | (24,115 | ) | 1,078,370 | (248,822 | ) | |||||||||
|
|
|
|
|
|
|
| |||||||||
Change in net assets resulting from operations | 2,429 | 4,963 | 1,724,847 | (317,747 | ) | |||||||||||
|
|
|
|
|
|
|
| |||||||||
DISTRIBUTIONS TO SHAREHOLDERS: | ||||||||||||||||
Class A | ||||||||||||||||
From net investment income | — | — | (17,004 | ) | (13,377 | ) | ||||||||||
From net realized gains | — | — | — | (22,474 | ) | |||||||||||
Class C | ||||||||||||||||
From net investment income | — | — | (4,071 | ) | (1,450 | ) | ||||||||||
From net realized gains | — | — | — | (7,412 | ) | |||||||||||
Class I (formerly Select Class) | ||||||||||||||||
From net investment income | — | — | (17,338 | ) | (9,572 | ) | ||||||||||
From net realized gains | — | — | — | (14,779 | ) | |||||||||||
Class L (formerly Institutional Class) | ||||||||||||||||
From net investment income | — | — | (51,645 | ) | (77,515 | ) | ||||||||||
From net realized gains | — | — | — | (69,917 | ) | |||||||||||
Class R3 (a) | ||||||||||||||||
From net investment income | — | — | — | (b) | — | |||||||||||
Class R4 (a) | ||||||||||||||||
From net investment income | — | — | — | (b) | — | |||||||||||
Class R5 (a) | ||||||||||||||||
From net investment income | — | — | — | (b) | — | |||||||||||
Class R6 (a) | ||||||||||||||||
From net investment income | — | — | (44,017 | ) | — | |||||||||||
|
|
|
|
|
|
|
| |||||||||
Total distributions to shareholders | — | — | (134,075 | ) | (216,496 | ) | ||||||||||
|
|
|
|
|
|
|
| |||||||||
CAPITAL TRANSACTIONS: | ||||||||||||||||
Change in net assets resulting from capital transactions | (66,147 | ) | (107,540 | ) | (623,697 | ) | (669,313 | ) | ||||||||
|
|
|
|
|
|
|
| |||||||||
NET ASSETS: | ||||||||||||||||
Change in net assets | (63,718 | ) | (102,577 | ) | 967,075 | (1,203,556 | ) | |||||||||
Beginning of period | 188,103 | 290,680 | 10,090,951 | 11,294,507 | ||||||||||||
|
|
|
|
|
|
|
| |||||||||
End of period | $ | 124,385 | $ | 188,103 | $ | 11,058,026 | $ | 10,090,951 | ||||||||
|
|
|
|
|
|
|
| |||||||||
Accumulated undistributed (distributions in excess of) net investment income | $ | (202 | ) | $ | (583 | ) | $ | 57,021 | $ | 73,682 | ||||||
|
|
|
|
|
|
|
| |||||||||
| (a) | Commencement of offering of class of shares effective September 9, 2016 for Value Advantage Fund. |
| (b) | Amount rounds to less than 500. |
SEE NOTES TO FINANCIAL STATEMENTS.
| 48 | J.P. MORGAN MID CAP/MULTI-CAP FUNDS | JUNE 30, 2017 | ||||
Table of Contents
| Growth Advantage Fund | Mid Cap Equity Fund | |||||||||||||||
| Year Ended June 30, 2017 | Year Ended June 30, 2016 | Year Ended June 30, 2017 | Year Ended June 30, 2016 | |||||||||||||
CAPITAL TRANSACTIONS: | ||||||||||||||||
Class A | ||||||||||||||||
Proceeds from shares issued | $ | 381,174 | $ | 1,090,924 | $ | 121,592 | $ | 174,026 | ||||||||
Distributions reinvested | — | 56,255 | 10,791 | 12,454 | ||||||||||||
Cost of shares redeemed | (822,569 | ) | (535,940 | ) | (133,304 | ) | (64,301 | ) | ||||||||
|
|
|
|
|
|
|
| |||||||||
Change in net assets resulting from Class A capital transactions | $ | (441,395 | ) | $ | 611,239 | $ | (921 | ) | $ | 122,179 | ||||||
|
|
|
|
|
|
|
| |||||||||
Class C | ||||||||||||||||
Proceeds from shares issued | $ | 114,033 | $ | 406,222 | $ | 7,205 | $ | 12,272 | ||||||||
Distributions reinvested | — | 18,351 | 964 | 1,246 | ||||||||||||
Cost of shares redeemed | (227,966 | ) | (105,053 | ) | (13,282 | ) | (4,843 | ) | ||||||||
|
|
|
|
|
|
|
| |||||||||
Change in net assets resulting from Class C capital transactions | $ | (113,933 | ) | $ | 319,520 | $ | (5,113 | ) | $ | 8,675 | ||||||
|
|
|
|
|
|
|
| |||||||||
Class I (formerly Select Class) | ||||||||||||||||
Proceeds from shares issued | $ | 917,922 | $ | 709,570 | $ | 289,476 | $ | 250,507 | ||||||||
Distributions reinvested | — | 31,907 | 19,559 | 64,677 | ||||||||||||
Cost of shares redeemed | (424,343 | ) | (865,494 | ) | (241,418 | ) | (1,207,577 | ) | ||||||||
|
|
|
|
|
|
|
| |||||||||
Change in net assets resulting from Class I capital transactions | $ | 493,579 | $ | (124,017 | ) | $ | 67,617 | $ | (892,393 | ) | ||||||
|
|
|
|
|
|
|
| |||||||||
Class R2 | ||||||||||||||||
Proceeds from shares issued | $ | — | $ | — | $ | 107 | $ | 235 | ||||||||
Distributions reinvested | — | — | 13 | 27 | ||||||||||||
Cost of shares redeemed | — | — | (284 | ) | (320 | ) | ||||||||||
|
|
|
|
|
|
|
| |||||||||
Change in net assets resulting from Class R2 capital transactions | $ | — | $ | — | $ | (164 | ) | $ | (58 | ) | ||||||
|
|
|
|
|
|
|
| |||||||||
Class R3 (a) | ||||||||||||||||
Proceeds from shares issued | $ | 20 | $ | — | $ | — | $ | — | ||||||||
|
|
|
|
|
|
|
| |||||||||
Change in net assets resulting from Class R3 capital transactions | $ | 20 | $ | — | $ | — | $ | — | ||||||||
|
|
|
|
|
|
|
| |||||||||
Class R4 (a) | ||||||||||||||||
Proceeds from shares issued | $ | 20 | $ | — | $ | — | $ | — | ||||||||
|
|
|
|
|
|
|
| |||||||||
Change in net assets resulting from Class R4 capital transactions | $ | 20 | $ | — | $ | — | $ | — | ||||||||
|
|
|
|
|
|
|
| |||||||||
Class R5 | ||||||||||||||||
Proceeds from shares issued | $ | 17,853 | $ | 41,933 | $ | 831 | $ | 2,174 | ||||||||
Distributions reinvested | — | 2,457 | 95 | 154 | ||||||||||||
Cost of shares redeemed | (23,614 | ) | (15,257 | ) | (2,320 | ) | (861 | ) | ||||||||
|
|
|
|
|
|
|
| |||||||||
Change in net assets resulting from Class R5 capital transactions | $ | (5,761 | ) | $ | 29,133 | $ | (1,394 | ) | $ | 1,467 | ||||||
|
|
|
|
|
|
|
| |||||||||
Class R6 | ||||||||||||||||
Proceeds from shares issued | $ | 161,959 | $ | 708,587 | $ | 173,778 | $ | 260,148 | ||||||||
Distributions reinvested | — | 83,297 | 52,511 | 65,041 | ||||||||||||
Cost of shares redeemed | (386,277 | ) | (290,712 | ) | (166,173 | ) | (112,907 | ) | ||||||||
|
|
|
|
|
|
|
| |||||||||
Change in net assets resulting from Class R6 capital transactions | $ | (224,318 | ) | $ | 501,172 | $ | 60,116 | $ | 212,282 | |||||||
|
|
|
|
|
|
|
| |||||||||
Total change in net assets resulting from capital transactions | $ | (291,788 | ) | $ | 1,337,047 | $ | 120,141 | $ | (547,848 | ) | ||||||
|
|
|
|
|
|
|
| |||||||||
| (a) | Commencement of offering of class of shares effective May 31, 2017 for Growth Advantage Fund. |
SEE NOTES TO FINANCIAL STATEMENTS.
| JUNE 30, 2017 | J.P. MORGAN MID CAP/MULTI-CAP FUNDS | 49 | ||||||
Table of Contents
STATEMENTS OF CHANGES IN NET ASSETS
FOR THE PERIODS INDICATED (continued)
(Amounts in thousands)
| Growth Advantage Fund | Mid Cap Equity Fund | |||||||||||||||
| Year Ended June 30, 2017 | Year Ended June 30, 2016 | Year Ended June 30, 2017 | Year Ended June 30, 2016 | |||||||||||||
SHARE TRANSACTIONS: | ||||||||||||||||
Class A | ||||||||||||||||
Issued | 23,931 | 73,064 | 2,680 | 4,101 | ||||||||||||
Reinvested | — | 3,824 | 244 | 299 | ||||||||||||
Redeemed | (51,511 | ) | (37,546 | ) | (2,942 | ) | (1,522 | ) | ||||||||
|
|
|
|
|
|
|
| |||||||||
Change in Class A Shares | (27,580 | ) | 39,342 | (18 | ) | 2,878 | ||||||||||
|
|
|
|
|
|
|
| |||||||||
Class C | ||||||||||||||||
Issued | 7,911 | 30,118 | 164 | 297 | ||||||||||||
Reinvested | — | 1,389 | 22 | 30 | ||||||||||||
Redeemed | (16,036 | ) | (8,092 | ) | (302 | ) | (116 | ) | ||||||||
|
|
|
|
|
|
|
| |||||||||
Change in Class C Shares | (8,125 | ) | 23,415 | (116 | ) | 211 | ||||||||||
|
|
|
|
|
|
|
| |||||||||
Class I (formerly Select Class) | ||||||||||||||||
Issued | 55,638 | 46,757 | 6,309 | 5,728 | ||||||||||||
Reinvested | — | 2,122 | 436 | 1,536 | ||||||||||||
Redeemed | (26,275 | ) | (62,228 | ) | (5,239 | ) | (30,292 | ) | ||||||||
|
|
|
|
|
|
|
| |||||||||
Change in Class I Shares | 29,363 | (13,349 | ) | 1,506 | (23,028 | ) | ||||||||||
|
|
|
|
|
|
|
| |||||||||
Class R2 | ||||||||||||||||
Issued | — | — | 2 | 6 | ||||||||||||
Reinvested | — | — | — | (a) | 1 | |||||||||||
Redeemed | — | — | (6 | ) | (8 | ) | ||||||||||
|
|
|
|
|
|
|
| |||||||||
Change in Class R2 Shares | — | — | (4 | ) | (1 | ) | ||||||||||
|
|
|
|
|
|
|
| |||||||||
Class R3 (b) | ||||||||||||||||
Issued | 1 | — | — | — | ||||||||||||
|
|
|
|
|
|
|
| |||||||||
Change in Class R3 Shares | 1 | — | — | — | ||||||||||||
|
|
|
|
|
|
|
| |||||||||
Class R4 (b) | ||||||||||||||||
Issued | 1 | — | — | — | ||||||||||||
|
|
|
|
|
|
|
| |||||||||
Change in Class R4 Shares | 1 | — | — | — | ||||||||||||
|
|
|
|
|
|
|
| |||||||||
Class R5 | ||||||||||||||||
Issued | 1,062 | 2,743 | 19 | 47 | ||||||||||||
Reinvested | — | 161 | 2 | 4 | ||||||||||||
Redeemed | (1,434 | ) | (1,010 | ) | (49 | ) | (20 | ) | ||||||||
|
|
|
|
|
|
|
| |||||||||
Change in Class R5 Shares | (372 | ) | 1,894 | (28 | ) | 31 | ||||||||||
|
|
|
|
|
|
|
| |||||||||
Class R6 | ||||||||||||||||
Issued | 9,786 | 47,326 | 3,807 | 6,062 | ||||||||||||
Reinvested | — | 5,459 | 1,169 | 1,544 | ||||||||||||
Redeemed | (23,089 | ) | (19,751 | ) | (3,615 | ) | (2,766 | ) | ||||||||
|
|
|
|
|
|
|
| |||||||||
Change in Class R6 Shares | (13,303 | ) | 33,034 | 1,361 | 4,840 | |||||||||||
|
|
|
|
|
|
|
| |||||||||
| (a) | Amount rounds to less than 500. |
| (b) | Commencement of offering of class of shares effective May 31, 2017 for Growth Advantage Fund. |
SEE NOTES TO FINANCIAL STATEMENTS.
| 50 | J.P. MORGAN MID CAP/MULTI-CAP FUNDS | JUNE 30, 2017 | ||||
Table of Contents
| Mid Cap Growth Fund | Mid Cap Value Fund | |||||||||||||||
| Year Ended June 30, 2017 | Year Ended June 30, 2016 | Year Ended June 30, 2017 | Year Ended June 30, 2016 | |||||||||||||
CAPITAL TRANSACTIONS: | ||||||||||||||||
Class A | ||||||||||||||||
Proceeds from shares issued | $ | 98,041 | $ | 297,295 | $ | 419,157 | $ | 358,763 | ||||||||
Distributions reinvested | 434 | 54,215 | 131,659 | 127,887 | ||||||||||||
Cost of shares redeemed | (295,300 | ) | (221,243 | ) | (852,023 | ) | (694,701 | ) | ||||||||
|
|
|
|
|
|
|
| |||||||||
Change in net assets resulting from Class A capital transactions | $ | (196,825 | ) | $ | 130,267 | $ | (301,207 | ) | $ | (208,051 | ) | |||||
|
|
|
|
|
|
|
| |||||||||
Class C | ||||||||||||||||
Proceeds from shares issued | $ | 16,838 | $ | 56,492 | $ | 23,292 | $ | 28,896 | ||||||||
Distributions reinvested | 49 | 5,744 | 26,948 | 25,199 | ||||||||||||
Cost of shares redeemed | (38,935 | ) | (23,954 | ) | (180,218 | ) | (73,557 | ) | ||||||||
|
|
|
|
|
|
|
| |||||||||
Change in net assets resulting from Class C capital transactions | $ | (22,048 | ) | $ | 38,282 | $ | (129,978 | ) | $ | (19,462 | ) | |||||
|
|
|
|
|
|
|
| |||||||||
Class I (formerly Select Class) | ||||||||||||||||
Proceeds from shares issued | $ | 310,137 | $ | 596,426 | $ | 963,041 | $ | 575,208 | ||||||||
Distributions reinvested | 339 | 41,535 | 157,140 | 119,621 | ||||||||||||
Cost of shares redeemed | (362,253 | ) | (484,304 | ) | (727,688 | ) | (626,053 | ) | ||||||||
Redemptions in-kind (See Note 7) | — | (602,118 | ) | — | — | |||||||||||
|
|
|
|
|
|
|
| |||||||||
Change in net assets resulting from Class I capital transactions | $ | (51,777 | ) | $ | (448,461 | ) | $ | 392,493 | $ | 68,776 | ||||||
|
|
|
|
|
|
|
| |||||||||
Class L (formerly Institutional Class) | ||||||||||||||||
Proceeds from shares issued | $ | — | $ | — | $ | 3,537,449 | $ | 2,148,891 | ||||||||
Distributions reinvested | — | �� | — | 668,445 | 515,077 | |||||||||||
Cost of shares redeemed | — | — | (2,817,548 | ) | (2,275,447 | ) | ||||||||||
|
|
|
|
|
|
|
| |||||||||
Change in net assets resulting from Class L capital transactions | $ | — | $ | — | $ | 1,388,346 | $ | 388,521 | ||||||||
|
|
|
|
|
|
|
| |||||||||
Class R2 | ||||||||||||||||
Proceeds from shares issued | $ | 17,018 | $ | 31,035 | $ | 37,304 | $ | 14,006 | ||||||||
Distributions reinvested | 10 | 1,494 | 3,910 | 3,715 | ||||||||||||
Cost of shares redeemed | (19,788 | ) | (6,825 | ) | (26,653 | ) | (20,042 | ) | ||||||||
|
|
|
|
|
|
|
| |||||||||
Change in net assets resulting from Class R2 capital transactions | $ | (2,760 | ) | $ | 25,704 | $ | 14,561 | $ | (2,321 | ) | ||||||
|
|
|
|
|
|
|
| |||||||||
Class R3 (a) | ||||||||||||||||
Proceeds from shares issued | $ | 154 | $ | — | $ | 19,636 | $ | — | ||||||||
Distributions reinvested | — | (b) | — | 1 | — | |||||||||||
Cost of shares redeemed | (12 | ) | — | (706 | ) | — | ||||||||||
|
|
|
|
|
|
|
| |||||||||
Change in net assets resulting from Class R3 capital transactions | $ | 142 | $ | — | $ | 18,931 | $ | — | ||||||||
|
|
|
|
|
|
|
| |||||||||
Class R4 (a) | ||||||||||||||||
Proceeds from shares issued | $ | 122 | $ | — | $ | 3,529 | $ | — | ||||||||
Distributions reinvested | — | (b) | — | 1 | — | |||||||||||
Cost of shares redeemed | (2 | ) | — | (38 | ) | — | ||||||||||
|
|
|
|
|
|
|
| |||||||||
Change in net assets resulting from Class R4 capital transactions | $ | 120 | $ | — | $ | 3,492 | $ | — | ||||||||
|
|
|
|
|
|
|
| |||||||||
Class R5 (c) | ||||||||||||||||
Proceeds from shares issued | $ | 40,930 | $ | 120,489 | $ | 30,405 | $ | — | ||||||||
Distributions reinvested | 91 | 8,974 | 1 | — | ||||||||||||
Cost of shares redeemed | (60,912 | ) | (42,206 | ) | (421 | ) | — | |||||||||
|
|
|
|
|
|
|
| |||||||||
Change in net assets resulting from Class R5 capital transactions | $ | (19,891 | ) | $ | 87,257 | $ | 29,985 | $ | — | |||||||
|
|
|
|
|
|
|
| |||||||||
Class R6 (c) | ||||||||||||||||
Proceeds from shares issued | $ | 197,543 | $ | 509,276 | $ | 292,949 | $ | — | ||||||||
Distributions reinvested | 274 | 23,176 | 2,917 | — | ||||||||||||
Cost of shares redeemed | (190,127 | ) | (120,874 | ) | (19,631 | ) | — | |||||||||
|
|
|
|
|
|
|
| |||||||||
Change in net assets resulting from Class R6 capital transactions | $ | 7,690 | $ | 411,578 | $ | 276,235 | $ | — | ||||||||
|
|
|
|
|
|
|
| |||||||||
Total change in net assets resulting from capital transactions | $ | (285,349 | ) | $ | 244,627 | $ | 1,692,858 | $ | 227,463 | |||||||
|
|
|
|
|
|
|
| |||||||||
| (a) | Commencement of offering of class of shares effective September 9, 2016 for Mid Cap Growth and Mid Cap Value Fund. |
| (b) | Amount rounds to less than 500. |
| (c) | Commencement of offering of class of shares effective September 9, 2016 for Mid Cap Value Fund. |
SEE NOTES TO FINANCIAL STATEMENTS.
| JUNE 30, 2017 | J.P. MORGAN MID CAP/MULTI-CAP FUNDS | 51 | ||||||
Table of Contents
STATEMENTS OF CHANGES IN NET ASSETS
FOR THE PERIODS INDICATED (continued)
(Amounts in thousands)
| Mid Cap Growth Fund | Mid Cap Value Fund | |||||||||||||||
| Year Ended June 30, 2017 | Year Ended June 30, 2016 | Year Ended June 30, 2017 | Year Ended June 30, 2016 | |||||||||||||
SHARE TRANSACTIONS: | ||||||||||||||||
Class A | ||||||||||||||||
Issued | 3,890 | 11,900 | 11,445 | 10,465 | ||||||||||||
Reinvested | 18 | 2,266 | 3,648 | 3,881 | ||||||||||||
Redeemed | (11,718 | ) | (9,178 | ) | (23,250 | ) | (20,274 | ) | ||||||||
|
|
|
|
|
|
|
| |||||||||
Change in Class A Shares | (7,810 | ) | 4,988 | (8,157 | ) | (5,928 | ) | |||||||||
|
|
|
|
|
|
|
| |||||||||
Class C | ||||||||||||||||
Issued | 818 | 2,722 | 663 | 877 | ||||||||||||
Reinvested | 3 | 295 | 778 | 794 | ||||||||||||
Redeemed | (1,896 | ) | (1,230 | ) | (5,080 | ) | (2,221 | ) | ||||||||
|
|
|
|
|
|
|
| |||||||||
Change in Class C Shares | (1,075 | ) | 1,787 | (3,639 | ) | (550 | ) | |||||||||
|
|
|
|
|
|
|
| |||||||||
Class I (formerly Select Class) | ||||||||||||||||
Issued | 10,786 | 21,225 | 26,028 | 16,809 | ||||||||||||
Reinvested | 12 | 1,536 | 4,300 | 3,589 | ||||||||||||
Redeemed | (12,803 | ) | (17,722 | ) | (19,566 | ) | (18,078 | ) | ||||||||
Redemptions in-kind (See Note 7) | — | (20,287 | ) | — | — | |||||||||||
|
|
|
|
|
|
|
| |||||||||
Change in Class I Shares | (2,005 | ) | (15,248 | ) | 10,762 | 2,320 | ||||||||||
|
|
|
|
|
|
|
| |||||||||
Class L (formerly Institutional Class) | ||||||||||||||||
Issued | — | — | 94,419 | 61,500 | ||||||||||||
Reinvested | — | — | 18,060 | 15,274 | ||||||||||||
Redeemed | — | — | (75,042 | ) | (65,137 | ) | ||||||||||
|
|
|
|
|
|
|
| |||||||||
Change in Class L Shares | — | — | 37,437 | 11,637 | ||||||||||||
|
|
|
|
|
|
|
| |||||||||
Class R2 | ||||||||||||||||
Issued | 629 | 1,143 | 1,050 | 421 | ||||||||||||
Reinvested | — | (a) | 57 | 113 | 117 | |||||||||||
Redeemed | (729 | ) | (266 | ) | (754 | ) | (606 | ) | ||||||||
|
|
|
|
|
|
|
| |||||||||
Change in Class R2 Shares | (100 | ) | 934 | 409 | (68 | ) | ||||||||||
|
|
|
|
|
|
|
| |||||||||
Class R3 (b) | ||||||||||||||||
Issued | 5 | — | 530 | — | ||||||||||||
Reinvested | — | (a) | — | — | (a) | — | ||||||||||
Redeemed | — | (a) | — | (19 | ) | — | ||||||||||
|
|
|
|
|
|
|
| |||||||||
Change in Class R3 Shares | 5 | — | 511 | — | ||||||||||||
|
|
|
|
|
|
|
| |||||||||
Class R4 (b) | ||||||||||||||||
Issued | 4 | — | 94 | — | ||||||||||||
Reinvested | — | (a) | — | — | (a) | — | ||||||||||
Redeemed | — | (a) | — | (1 | ) | — | ||||||||||
|
|
|
|
|
|
|
| |||||||||
Change in Class R4 Shares | 4 | — | 93 | — | ||||||||||||
|
|
|
|
|
|
|
| |||||||||
Class R5 (c) | ||||||||||||||||
Issued | 1,404 | 4,352 | 795 | — | ||||||||||||
Reinvested | 3 | 329 | — | (a) | — | |||||||||||
Redeemed | (2,103 | ) | (1,554 | ) | (11 | ) | — | |||||||||
|
|
|
|
|
|
|
| |||||||||
Change in Class R5 Shares | (696 | ) | 3,127 | 784 | — | |||||||||||
|
|
|
|
|
|
|
| |||||||||
Class R6 (c) | ||||||||||||||||
Issued | 6,766 | 18,275 | 7,706 | — | ||||||||||||
Reinvested | 10 | 849 | 79 | — | ||||||||||||
Redeemed | (6,595 | ) | (4,509 | ) | (515 | ) | — | |||||||||
|
|
|
|
|
|
|
| |||||||||
Change in Class R6 Shares | 181 | 14,615 | 7,270 | — | ||||||||||||
|
|
|
|
|
|
|
| |||||||||
| (a) | Amount rounds to less than 500. |
| (b) | Commencement of offering of class of shares effective September 9, 2016 for Mid Cap Growth and Mid Cap Value Fund. |
| (c) | Commencement of offering of class of shares effective September 9, 2016 for Mid Cap Value Fund. |
SEE NOTES TO FINANCIAL STATEMENTS.
| 52 | J.P. MORGAN MID CAP/MULTI-CAP FUNDS | JUNE 30, 2017 | ||||
Table of Contents
| Multi-Cap Market Neutral Fund | Value Advantage Fund | |||||||||||||||
| Year Ended June 30, 2017 | Year Ended June 30, 2016 | Year Ended June 30, 2017 | Year Ended June 30, 2016 | |||||||||||||
CAPITAL TRANSACTIONS: | ||||||||||||||||
Class A | ||||||||||||||||
Proceeds from shares issued | $ | 1,341 | $ | 3,218 | $ | 526,758 | $ | 696,311 | ||||||||
Distributions reinvested | — | — | 16,190 | 34,339 | ||||||||||||
Cost of shares redeemed | (2,701 | ) | (2,889 | ) | (1,438,824 | ) | (1,032,013 | ) | ||||||||
|
|
|
|
|
|
|
| |||||||||
Change in net assets resulting from Class A capital transactions | $ | (1,360 | ) | $ | 329 | $ | (895,876 | ) | $ | (301,363 | ) | |||||
|
|
|
|
|
|
|
| |||||||||
Class C | ||||||||||||||||
Proceeds from shares issued | $ | 57 | $ | 1,852 | $ | 124,351 | $ | 188,939 | ||||||||
Distributions reinvested | — | — | 3,544 | 7,489 | ||||||||||||
Cost of shares redeemed | (2,962 | ) | (2,446 | ) | (223,429 | ) | (140,118 | ) | ||||||||
|
|
|
|
|
|
|
| |||||||||
Change in net assets resulting from Class C capital transactions | $ | (2,905 | ) | $ | (594 | ) | $ | (95,534 | ) | $ | 56,310 | |||||
|
|
|
|
|
|
|
| |||||||||
Class I (formerly Select Class) | ||||||||||||||||
Proceeds from shares issued | $ | 1,846 | $ | 4,346 | $ | 1,247,895 | $ | 675,086 | ||||||||
Distributions reinvested | — | — | 12,528 | 17,378 | ||||||||||||
Cost of shares redeemed | (63,728 | ) | (111,621 | ) | (728,849 | ) | (2,253,026 | ) | ||||||||
|
|
|
|
|
|
|
| |||||||||
Change in net assets resulting from Class I capital transactions | $ | (61,882 | ) | $ | (107,275 | ) | $ | 531,574 | $ | (1,560,562 | ) | |||||
|
|
|
|
|
|
|
| |||||||||
Class L (formerly Institutional Class) | ||||||||||||||||
Proceeds from shares issued | $ | — | $ | — | $ | 1,631,959 | $ | 3,435,571 | ||||||||
Distributions reinvested | — | — | 45,687 | 138,955 | ||||||||||||
Cost of shares redeemed | — | — | (3,876,760 | ) | (2,438,224 | ) | ||||||||||
Redemptions in-kind (See Note 7) | — | — | (644,712 | ) | — | |||||||||||
|
|
|
|
|
|
|
| |||||||||
Change in net assets resulting from Class L capital transactions | $ | — | $ | — | $ | (2,843,826 | ) | $ | 1,136,302 | |||||||
|
|
|
|
|
|
|
| |||||||||
Class R3 (a) | ||||||||||||||||
Proceeds from shares issued | $ | — | $ | — | $ | 393 | $ | — | ||||||||
Distributions reinvested | — | — | — | (b) | — | |||||||||||
Cost of shares redeemed | — | — | (15 | ) | — | |||||||||||
|
|
|
|
|
|
|
| |||||||||
Change in net assets resulting from Class R3 capital transactions | $ | — | $ | — | $ | 378 | $ | — | ||||||||
|
|
|
|
|
|
|
| |||||||||
Class R4 (a) | ||||||||||||||||
Proceeds from shares issued | $ | — | $ | — | $ | 31 | $ | — | ||||||||
Distributions reinvested | — | — | — | (b) | — | |||||||||||
Cost of shares redeemed | — | — | — | (b) | — | |||||||||||
|
|
|
|
|
|
|
| |||||||||
Change in net assets resulting from Class R4 capital transactions | $ | — | $ | — | $ | 31 | $ | — | ||||||||
|
|
|
|
|
|
|
| |||||||||
Class R5 (a) | ||||||||||||||||
Proceeds from shares issued | $ | — | $ | — | $ | 415 | $ | — | ||||||||
Distributions reinvested | — | — | — | (b) | — | |||||||||||
Cost of shares redeemed | — | — | — | (b) | — | |||||||||||
|
|
|
|
|
|
|
| |||||||||
Change in net assets resulting from Class R5 capital transactions | $ | — | $ | — | $ | 415 | $ | — | ||||||||
|
|
|
|
|
|
|
| |||||||||
Class R6 (a) | ||||||||||||||||
Proceeds from shares issued | $ | — | $ | — | $ | 2,989,115 | $ | — | ||||||||
Distributions reinvested | — | — | 44,017 | — | ||||||||||||
Cost of shares redeemed | — | — | (353,991 | ) | — | |||||||||||
|
|
|
|
|
|
|
| |||||||||
Change in net assets resulting from Class R6 capital transactions | $ | — | $ | — | $ | 2,679,141 | $ | — | ||||||||
|
|
|
|
|
|
|
| |||||||||
Total change in net assets resulting from capital transactions | $ | (66,147 | ) | $ | (107,540 | ) | $ | (623,697 | ) | $ | (669,313 | ) | ||||
|
|
|
|
|
|
|
| |||||||||
| (a) | Commencement of offering of class of shares effective September 9, 2016 for Value Advantage Fund. |
| (b) | Amount rounds to less than 500. |
SEE NOTES TO FINANCIAL STATEMENTS.
| JUNE 30, 2017 | J.P. MORGAN MID CAP/MULTI-CAP FUNDS | 53 | ||||||
Table of Contents
STATEMENTS OF CHANGES IN NET ASSETS
FOR THE PERIODS INDICATED (continued)
(Amounts in thousands)
| Multi-Cap Market Neutral Fund | Value Advantage Fund | |||||||||||||||
| Year Ended June 30, 2017 | Year Ended June 30, 2016 | Year Ended June 30, 2017 | Year Ended June 30, 2016 | |||||||||||||
SHARE TRANSACTIONS: | ||||||||||||||||
Class A | ||||||||||||||||
Issued | 133 | 316 | 16,726 | 24,694 | ||||||||||||
Reinvested | — | — | 497 | 1,244 | ||||||||||||
Redeemed | (270 | ) | (284 | ) | (45,710 | ) | (36,328 | ) | ||||||||
|
|
|
|
|
|
|
| |||||||||
Change in Class A Shares | (137 | ) | 32 | (28,487 | ) | (10,390 | ) | |||||||||
|
|
|
|
|
|
|
| |||||||||
Class C | ||||||||||||||||
Issued | 6 | 194 | 3,919 | 6,724 | ||||||||||||
Reinvested | — | — | 109 | 273 | ||||||||||||
Redeemed | (315 | ) | (258 | ) | (7,093 | ) | (5,029 | ) | ||||||||
|
|
|
|
|
|
|
| |||||||||
Change in Class C Shares | (309 | ) | (64 | ) | (3,065 | ) | 1,968 | |||||||||
|
|
|
|
|
|
|
| |||||||||
Class I (formerly Select Class) | ||||||||||||||||
Issued | 180 | 416 | 38,266 | 24,052 | ||||||||||||
Reinvested | — | — | 383 | 626 | ||||||||||||
Redeemed | (6,171 | ) | (10,669 | ) | (23,245 | ) | (78,871 | ) | ||||||||
|
|
|
|
|
|
|
| |||||||||
Change in Class I Shares | (5,991 | ) | (10,253 | ) | 15,404 | (54,193 | ) | |||||||||
|
|
|
|
|
|
|
| |||||||||
Class L (formerly Institutional Class) | ||||||||||||||||
Issued | — | — | 51,361 | 120,136 | ||||||||||||
Reinvested | — | — | 1,397 | 5,004 | ||||||||||||
Redeemed | — | — | (129,686 | ) | (88,948 | ) | ||||||||||
Redemptions in-kind (See Note 7) | — | — | (19,228 | ) | — | |||||||||||
|
|
|
|
|
|
|
| |||||||||
Change in Class L Shares | — | — | (96,156 | ) | 36,192 | |||||||||||
|
|
|
|
|
|
|
| |||||||||
Class R3 (a) | ||||||||||||||||
Issued | — | — | 12 | — | ||||||||||||
Reinvested | — | — | — | (b) | — | |||||||||||
Redeemed | — | — | — | (b) | — | |||||||||||
|
|
|
|
|
|
|
| |||||||||
Change in Class R3 Shares | — | — | 12 | — | ||||||||||||
|
|
|
|
|
|
|
| |||||||||
Class R4 (a) | ||||||||||||||||
Issued | — | — | 1 | — | ||||||||||||
Reinvested | — | — | — | (b) | — | |||||||||||
|
|
|
|
|
|
|
| |||||||||
Change in Class R4 Shares | — | — | 1 | — | ||||||||||||
|
|
|
|
|
|
|
| |||||||||
Class R5 (a) | ||||||||||||||||
Issued | — | — | 12 | — | ||||||||||||
Reinvested | — | — | — | (b) | — | |||||||||||
Redeemed | — | — | — | (b) | — | |||||||||||
|
|
|
|
|
|
|
| |||||||||
Change in Class R5 Shares | — | — | 12 | — | ||||||||||||
|
|
|
|
|
|
|
| |||||||||
Class R6 (a) | ||||||||||||||||
Issued | — | — | 100,995 | — | ||||||||||||
Reinvested | — | — | 1,347 | — | ||||||||||||
Redeemed | — | — | (11,008 | ) | — | |||||||||||
|
|
|
|
|
|
|
| |||||||||
Change in Class R6 Shares | — | — | 91,334 | — | ||||||||||||
|
|
|
|
|
|
|
| |||||||||
| (a) | Commencement of offering of class of shares effective September 9, 2016 for Value Advantage Fund. |
| (b) | Amount rounds to less than 500. |
SEE NOTES TO FINANCIAL STATEMENTS.
| 54 | J.P. MORGAN MID CAP/MULTI-CAP FUNDS | JUNE 30, 2017 | ||||
Table of Contents
THIS PAGE IS INTENTIONALLY LEFT BLANK
| JUNE 30, 2017 | J.P. MORGAN MID CAP/MULTI-CAP FUNDS | 55 | ||||||
Table of Contents
FOR THE PERIODS INDICATED
| Per share operating performance | ||||||||||||||||||||||||||||
| Investment operations | Distributions | |||||||||||||||||||||||||||
| Net asset value, beginning of period | Net investment income (loss) (b) | Net realized and unrealized gains (losses) on investments | Total from investment operations | Net investment income | Net realized gain | Total distributions | ||||||||||||||||||||||
Growth Advantage Fund | ||||||||||||||||||||||||||||
Class A | ||||||||||||||||||||||||||||
Year Ended June 30, 2017 | $ | 14.42 | $ | (0.09 | ) | $ | 3.62 | $ | 3.53 | $ | — | $ | — | $ | — | |||||||||||||
Year Ended June 30, 2016 | 15.74 | (0.08 | ) | (0.71 | ) | (0.79 | ) | — | (0.53 | ) | (0.53 | ) | ||||||||||||||||
Year Ended June 30, 2015 | 14.24 | (0.10 | ) | 2.17 | 2.07 | — | (0.57 | ) | (0.57 | ) | ||||||||||||||||||
Year Ended June 30, 2014 | 11.43 | (0.07 | ) | 3.52 | 3.45 | — | (0.64 | ) | (0.64 | ) | ||||||||||||||||||
Year Ended June 30, 2013 | 9.49 | 0.01 | (f) | 1.97 | 1.98 | (0.01 | ) | (0.03 | ) | (0.04 | ) | |||||||||||||||||
Class C | ||||||||||||||||||||||||||||
Year Ended June 30, 2017 | 12.91 | (0.15 | ) | 3.23 | 3.08 | — | — | — | ||||||||||||||||||||
Year Ended June 30, 2016 | 14.22 | (0.14 | ) | (0.64 | ) | (0.78 | ) | — | (0.53 | ) | (0.53 | ) | ||||||||||||||||
Year Ended June 30, 2015 | 12.98 | (0.15 | ) | 1.96 | 1.81 | — | (0.57 | ) | (0.57 | ) | ||||||||||||||||||
Year Ended June 30, 2014 | 10.51 | (0.12 | ) | 3.23 | 3.11 | — | (0.64 | ) | (0.64 | ) | ||||||||||||||||||
Year Ended June 30, 2013 | 8.77 | (0.04 | )(f) | 1.81 | 1.77 | — | (0.03 | ) | (0.03 | ) | ||||||||||||||||||
Class I (formerly Select Class) | ||||||||||||||||||||||||||||
Year Ended June 30, 2017 | 14.75 | (0.05 | ) | 3.70 | 3.65 | — | — | — | ||||||||||||||||||||
Year Ended June 30, 2016 | 16.06 | (0.06 | ) | (0.72 | ) | (0.78 | ) | — | (0.53 | ) | (0.53 | ) | ||||||||||||||||
Year Ended June 30, 2015 | 14.50 | (0.07 | ) | 2.20 | 2.13 | — | (0.57 | ) | (0.57 | ) | ||||||||||||||||||
Year Ended June 30, 2014 | 11.60 | (0.04 | ) | 3.58 | 3.54 | — | (0.64 | ) | (0.64 | ) | ||||||||||||||||||
Year Ended June 30, 2013 | 9.63 | 0.04 | (f) | 1.98 | 2.02 | (0.02 | ) | (0.03 | ) | (0.05 | ) | |||||||||||||||||
Class R3 | ||||||||||||||||||||||||||||
May 31, 2017 (g) through June 30, 2017 | 17.85 | (0.01 | ) | 0.12 | 0.11 | — | — | — | ||||||||||||||||||||
Class R4 | ||||||||||||||||||||||||||||
May 31, 2017 (g) through June 30, 2017 | 18.29 | — | (h) | 0.11 | 0.11 | — | — | — | ||||||||||||||||||||
Class R5 | ||||||||||||||||||||||||||||
Year Ended June 30, 2017 | 14.96 | (0.03 | ) | 3.76 | 3.73 | — | — | — | ||||||||||||||||||||
Year Ended June 30, 2016 | 16.25 | (0.03 | ) | (0.73 | ) | (0.76 | ) | — | (0.53 | ) | (0.53 | ) | ||||||||||||||||
Year Ended June 30, 2015 | 14.63 | (0.04 | ) | 2.23 | 2.19 | — | (0.57 | ) | (0.57 | ) | ||||||||||||||||||
Year Ended June 30, 2014 | 11.68 | (0.02 | ) | 3.61 | 3.59 | — | (0.64 | ) | (0.64 | ) | ||||||||||||||||||
Year Ended June 30, 2013 | 9.69 | 0.06 | (f) | 2.01 | 2.07 | (0.05 | ) | (0.03 | ) | (0.08 | ) | |||||||||||||||||
Class R6 | ||||||||||||||||||||||||||||
Year Ended June 30, 2017 | 15.00 | (0.01 | ) | 3.77 | 3.76 | — | — | — | ||||||||||||||||||||
Year Ended June 30, 2016 | 16.27 | (0.01 | ) | (0.73 | ) | (0.74 | ) | — | (0.53 | ) | (0.53 | ) | ||||||||||||||||
Year Ended June 30, 2015 | 14.64 | (0.03 | ) | 2.23 | 2.20 | — | (0.57 | ) | (0.57 | ) | ||||||||||||||||||
December 23, 2013 (g) through June 30, 2014 | 13.86 | (0.01 | ) | 0.79 | 0.78 | — | — | — | ||||||||||||||||||||
| (a) | Annualized for periods less than one year, unless otherwise noted. |
| (b) | Calculated based upon average shares outstanding. |
| (c) | Not annualized for periods less than one year. |
| (d) | Includes adjustments in accordance with accounting principles generally accepted in the United States of America and as such, the net asset values for financial reporting purposes and the returns based upon those net asset values may differ from the net asset values and returns for shareholder transactions. |
| (e) | Includes earnings credits and interest expense, if applicable, each of which is less than 0.005% unless otherwise noted. |
| (f) | Reflects special dividends paid out during the period by several of the Fund’s holdings. Had the Fund not received the special dividends, the net investment income (loss) per share would have been $(0.02), $(0.06), $0.01 and $0.03 for Class A, Class C, Class I and Class R5 Shares, respectively, and the net investment income (loss) ratio would have been (0.17)%, (0.66)%, 0.09% and 0.27% for Class A, Class C, Class I and Class R5 Shares, respectively. |
| (g) | Commencement of offering of class of shares. |
| (h) | Amount rounds to less than $0.005. |
SEE NOTES TO FINANCIAL STATEMENTS.
| 56 | J.P. MORGAN MID CAP/MULTI-CAP FUNDS | JUNE 30, 2017 | ||||
Table of Contents
| Ratios/Supplemental data | |||||||||||||||||||||||||
| Ratios to average net assets (a) | ||||||||||||||||||||||||||
| Net asset value, end of period | Total return (excludes sales charge) (c)(d) | Net assets, end of period (000’s) | Net expenses (e) | Net income | Expenses without waivers, reimbursements and earnings credits | Portfolio turnover rate (c) | ||||||||||||||||||||
| $ | 17.95 | 24.48 | % | $ | 1,550,092 | 1.24 | % | (0.56 | )% | 1.32 | % | 34 | % | |||||||||||||
| 14.42 | (5.07 | ) | 1,643,136 | 1.25 | (0.55 | ) | 1.35 | 46 | ||||||||||||||||||
| 15.74 | 14.99 | 1,174,260 | 1.24 | (0.65 | ) | 1.35 | 46 | |||||||||||||||||||
| 14.24 | 30.69 | 717,564 | 1.24 | (0.51 | ) | 1.31 | 62 | |||||||||||||||||||
| 11.43 | 20.95 | 276,670 | 1.24 | 0.11 | (f) | 1.28 | 76 | |||||||||||||||||||
| 15.99 | 23.86 | 605,999 | 1.74 | (1.06 | ) | 1.82 | 34 | |||||||||||||||||||
| 12.91 | (5.55 | ) | 594,190 | 1.75 | (1.04 | ) | 1.85 | 46 | ||||||||||||||||||
| 14.22 | 14.43 | 321,500 | 1.74 | (1.14 | ) | 1.84 | 46 | |||||||||||||||||||
| 12.98 | 30.12 | 144,229 | 1.74 | (1.01 | ) | 1.81 | 62 | |||||||||||||||||||
| 10.51 | 20.27 | 42,655 | 1.74 | (0.38 | )(f) | 1.78 | 76 | |||||||||||||||||||
| 18.40 | 24.75 | 1,691,899 | 1.00 | (0.31 | ) | 1.04 | 34 | |||||||||||||||||||
| 14.75 | (4.91 | ) | 922,981 | 1.08 | (0.41 | ) | 1.09 | 46 | ||||||||||||||||||
| 16.06 | 15.14 | 1,219,501 | 1.09 | (0.48 | ) | 1.09 | 46 | |||||||||||||||||||
| 14.50 | 31.03 | 975,175 | 1.05 | (0.30 | ) | 1.06 | 62 | |||||||||||||||||||
| 11.60 | 21.14 | 842,783 | 1.03 | 0.37 | (f) | 1.03 | 76 | |||||||||||||||||||
| 17.96 | 0.62 | 20 | 1.25 | (0.55 | ) | 1.25 | 34 | |||||||||||||||||||
| 18.40 | 0.60 | 20 | 0.99 | (0.29 | ) | 1.00 | 34 | |||||||||||||||||||
| 18.69 | 24.93 | 95,952 | 0.85 | (0.17 | ) | 0.88 | 34 | |||||||||||||||||||
| 14.96 | (4.72 | ) | 82,358 | 0.89 | (0.20 | ) | 0.90 | 46 | ||||||||||||||||||
| 16.25 | 15.42 | 58,686 | 0.86 | (0.25 | ) | 0.87 | 46 | |||||||||||||||||||
| 14.63 | 31.25 | 1,453,864 | 0.85 | (0.11 | ) | 0.86 | 62 | |||||||||||||||||||
| 11.68 | 21.49 | 835,233 | 0.83 | 0.55 | (f) | 0.84 | 76 | |||||||||||||||||||
| 18.76 | 25.07 | 3,153,928 | 0.74 | (0.06 | ) | 0.75 | 34 | |||||||||||||||||||
| 15.00 | (4.59 | ) | 2,720,935 | 0.76 | (0.07 | ) | 0.76 | 46 | ||||||||||||||||||
| 16.27 | 15.48 | 2,414,333 | 0.76 | (0.17 | ) | 0.77 | 46 | |||||||||||||||||||
| 14.64 | 5.63 | 271,958 | 0.80 | (0.15 | ) | 0.82 | 62 | |||||||||||||||||||
SEE NOTES TO FINANCIAL STATEMENTS.
| JUNE 30, 2017 | J.P. MORGAN MID CAP/MULTI-CAP FUNDS | 57 | ||||||
Table of Contents
FINANCIAL HIGHLIGHTS
FOR THE PERIODS INDICATED (continued)
| Per share operating performance | ||||||||||||||||||||||||||||
| Investment operations | Distributions | |||||||||||||||||||||||||||
| Net asset value, beginning of period | Net investment income (loss) (b) | Net realized gains (losses) on | Total from investment operations | Net investment income | Net realized gain | Total distributions | ||||||||||||||||||||||
Mid Cap Equity Fund | ||||||||||||||||||||||||||||
Class A | ||||||||||||||||||||||||||||
Year Ended June 30, 2017 | $ | 42.95 | $ | (0.02 | ) | $ | 7.02 | $ | 7.00 | $ | (0.05 | ) | $ | (1.37 | ) | $ | (1.42 | ) | ||||||||||
Year Ended June 30, 2016 | 47.12 | (0.01 | ) | (2.02 | ) | (2.03 | ) | (0.03 | ) | (2.11 | ) | (2.14 | ) | |||||||||||||||
Year Ended June 30, 2015 | 44.91 | (0.03 | ) | 4.32 | 4.29 | (0.02 | ) | (2.06 | ) | (2.08 | ) | |||||||||||||||||
Year Ended June 30, 2014 | 38.10 | (0.04 | ) | 10.25 | 10.21 | (0.02 | ) | (3.38 | ) | (3.40 | ) | |||||||||||||||||
Year Ended June 30, 2013 | 30.97 | 0.10 | (f) | 7.36 | 7.46 | (0.07 | ) | (0.26 | ) | (0.33 | ) | |||||||||||||||||
Class C | ||||||||||||||||||||||||||||
Year Ended June 30, 2017 | 41.85 | (0.25 | ) | 6.82 | 6.57 | — | (1.37 | ) | (1.37 | ) | ||||||||||||||||||
Year Ended June 30, 2016 | 46.16 | (0.23 | ) | (1.97 | ) | (2.20 | ) | — | (2.11 | ) | (2.11 | ) | ||||||||||||||||
Year Ended June 30, 2015 | 44.21 | (0.25 | ) | 4.23 | 3.98 | — | (2.03 | ) | (2.03 | ) | ||||||||||||||||||
Year Ended June 30, 2014 | 37.71 | (0.24 | ) | 10.12 | 9.88 | — | (3.38 | ) | (3.38 | ) | ||||||||||||||||||
Year Ended June 30, 2013 | 30.75 | (0.07 | )(f) | 7.29 | 7.22 | — | (g) | (0.26 | ) | (0.26 | ) | |||||||||||||||||
Class I (formerly Select Class) | ||||||||||||||||||||||||||||
Year Ended June 30, 2017 | 43.41 | 0.14 | 7.09 | 7.23 | (0.14 | ) | (1.37 | ) | (1.51 | ) | ||||||||||||||||||
Year Ended June 30, 2016 | 47.47 | 0.11 | (1.99 | ) | (1.88 | ) | (0.07 | ) | (2.11 | ) | (2.18 | ) | ||||||||||||||||
Year Ended June 30, 2015 | 45.15 | 0.13 | 4.34 | 4.47 | (0.09 | ) | (2.06 | ) | (2.15 | ) | ||||||||||||||||||
Year Ended June 30, 2014 | 38.22 | 0.11 | 10.30 | 10.41 | (0.10 | ) | (3.38 | ) | (3.48 | ) | ||||||||||||||||||
Year Ended June 30, 2013 | 31.05 | 0.20 | (f) | 7.40 | 7.60 | (0.17 | ) | (0.26 | ) | (0.43 | ) | |||||||||||||||||
Class R2 | ||||||||||||||||||||||||||||
Year Ended June 30, 2017 | 42.75 | (0.14 | ) | 6.98 | 6.84 | (0.01 | ) | (1.37 | ) | | (1.38 | ) | ||||||||||||||||
Year Ended June 30, 2016 | 46.98 | (0.13 | ) | (1.99 | ) | (2.12 | ) | — | (2.11 | ) | | (2.11 | ) | |||||||||||||||
Year Ended June 30, 2015 | 44.87 | (0.14 | ) | 4.30 | 4.16 | — | (2.05 | ) | | (2.05 | ) | |||||||||||||||||
March 14, 2014 (h) through June 30, 2014 | 42.92 | (0.05 | ) | 2.01 | 1.96 | (0.01 | ) | — | | (0.01 | ) | |||||||||||||||||
Class R5 | ||||||||||||||||||||||||||||
Year Ended June 30, 2017 | 43.43 | 0.18 | 7.11 | 7.29 | (0.18 | ) | (1.37 | ) | | (1.55 | ) | |||||||||||||||||
Year Ended June 30, 2016 | 47.49 | 0.18 | (2.03 | ) | (1.85 | ) | (0.10 | ) | (2.11 | ) | | (2.21 | ) | |||||||||||||||
Year Ended June 30, 2015 | 45.15 | 0.20 | 4.33 | 4.53 | (0.13 | ) | (2.06 | ) | | (2.19 | ) | |||||||||||||||||
March 14, 2014 (h) through June 30, 2014 | 43.14 | 0.04 | 2.02 | 2.06 | (0.05 | ) | — | | (0.05 | ) | ||||||||||||||||||
Class R6 | ||||||||||||||||||||||||||||
Year Ended June 30, 2017 | 43.44 | 0.21 | 7.09 | 7.30 | (0.19 | ) | (1.37 | ) | | (1.56 | ) | |||||||||||||||||
Year Ended June 30, 2016 | 47.49 | 0.20 | (2.02 | ) | (1.82 | ) | (0.12 | ) | (2.11 | ) | | (2.23 | ) | |||||||||||||||
Year Ended June 30, 2015 | 45.15 | 0.20 | 4.34 | 4.54 | (0.14 | ) | (2.06 | ) | | (2.20 | ) | |||||||||||||||||
March 14, 2014 (h) through June 30, 2014 | 43.14 | 0.04 | 2.02 | 2.06 | (0.05 | ) | — | (0.05 | ) | |||||||||||||||||||
| (a) | Annualized for periods less than one year, unless otherwise noted. |
| (b) | Calculated based upon average shares outstanding. |
| (c) | Not annualized for periods less than one year. |
| (d) | Includes adjustments in accordance with accounting principles generally accepted in the United States of America and as such, the net asset values for financial reporting purposes and the returns based upon those net asset values may differ from the net asset values and returns for shareholder transactions. |
| (e) | Includes earnings credits and interest expense, if applicable, each of which is less than 0.005% unless otherwise noted. |
| (f) | Reflects special dividends paid out during the period by several of the Fund’s holdings. Had the Fund not received the special dividends, the net investment income (loss) per share would have been $0.03, $(0.14) and $0.14 for Class A, Class C and Class I Shares, respectively, and the net investment income (loss) ratio would have been 0.09%, (0.39)% and 0.39% for Class A, Class C and Class I Shares , respectively. |
| (g) | Amount rounds to less than $0.005. |
| (h) | Commencement of offering of class of shares. |
SEE NOTES TO FINANCIAL STATEMENTS.
| 58 | J.P. MORGAN MID CAP/MULTI-CAP FUNDS | JUNE 30, 2017 | ||||
Table of Contents
| Ratios/Supplemental data | |||||||||||||||||||||||||
| Ratios to average net assets (a) | ||||||||||||||||||||||||||
| Net asset value, end of period | Total return (excludes sales charge) (c)(d) | Net assets, end of period (000’s) | Net expenses (e) | Net income | without waivers, | Portfolio turnover rate (c) | ||||||||||||||||||||
| $ | 48.53 | 16.61 | % | $ | 378,055 | 1.24 | % | (0.05 | )% | 1.37 | % | 38 | % | |||||||||||||
| 42.95 | (4.17 | ) | 335,424 | 1.25 | (0.03 | ) | 1.43 | 39 | ||||||||||||||||||
| 47.12 | 9.99 | 232,320 | 1.24 | (0.06 | ) | 1.44 | 41 | |||||||||||||||||||
| 44.91 | 27.96 | 156,016 | 1.24 | (0.08 | ) | 1.41 | 47 | |||||||||||||||||||
| 38.10 | 24.23 | 21,171 | 1.24 | 0.27 | (f) | 1.49 | 67 | |||||||||||||||||||
| 47.05 | 16.01 | 30,596 | 1.74 | (0.56 | ) | 1.92 | 38 | |||||||||||||||||||
| 41.85 | (4.64 | ) | 32,045 | 1.75 | (0.54 | ) | 1.96 | 39 | ||||||||||||||||||
| 46.16 | 9.44 | 25,597 | 1.74 | (0.56 | ) | 1.91 | 41 | |||||||||||||||||||
| 44.21 | 27.34 | 20,018 | 1.74 | (0.57 | ) | 1.93 | 47 | |||||||||||||||||||
| 37.71 | 23.60 | 6,136 | 1.74 | (0.21 | )(f) | 2.00 | 67 | |||||||||||||||||||
| 49.13 | 17.01 | 778,378 | 0.89 | 0.30 | 1.08 | 38 | ||||||||||||||||||||
| 43.41 | (3.81 | ) | 622,440 | 0.90 | 0.25 | 1.20 | 39 | |||||||||||||||||||
| 47.47 | 10.35 | 1,773,929 | 0.89 | 0.29 | 1.16 | 41 | ||||||||||||||||||||
| 45.15 | 28.45 | 1,773,321 | 0.89 | 0.27 | 1.18 | 47 | ||||||||||||||||||||
| 38.22 | 24.64 | 932,920 | 0.89 | 0.57 | (f) | 1.23 | 67 | |||||||||||||||||||
| 48.21 | 16.30 | 600 | 1.49 | (0.31 | ) | 1.69 | 38 | |||||||||||||||||||
| 42.75 | (4.38 | ) | 688 | 1.50 | (0.30 | ) | 1.81 | 39 | ||||||||||||||||||
| 46.98 | 9.71 | 823 | 1.49 | (0.31 | ) | 1.69 | 41 | |||||||||||||||||||
| 44.87 | 4.56 | 688 | 1.47 | (0.41 | ) | 1.60 | 47 | |||||||||||||||||||
| 49.17 | 17.14 | 1,804 | 0.79 | 0.40 | 0.87 | 38 | ||||||||||||||||||||
| 43.43 | (3.73 | ) | 2,840 | 0.80 | 0.42 | 0.91 | 39 | |||||||||||||||||||
| 47.49 | 10.49 | 1,636 | 0.79 | 0.43 | 0.88 | 41 | ||||||||||||||||||||
| 45.15 | 4.77 | 91 | 0.78 | 0.27 | 0.91 | 47 | ||||||||||||||||||||
| 49.18 | 17.18 | 1,619,045 | 0.74 | 0.45 | 0.75 | 38 | ||||||||||||||||||||
| 43.44 | (3.66 | ) | 1,370,912 | 0.74 | 0.46 | 0.77 | 39 | |||||||||||||||||||
| 47.49 | 10.53 | 1,268,988 | 0.74 | 0.45 | 0.80 | 41 | ||||||||||||||||||||
| 45.15 | 4.78 | 823,036 | 0.73 | 0.34 | 0.86 | 47 | ||||||||||||||||||||
SEE NOTES TO FINANCIAL STATEMENTS.
| JUNE 30, 2017 | J.P. MORGAN MID CAP/MULTI-CAP FUNDS | 59 | ||||||
Table of Contents
FINANCIAL HIGHLIGHTS
FOR THE PERIODS INDICATED (continued)
| Per share operating performance | ||||||||||||||||||||
| Investment operations | Distributions | |||||||||||||||||||
| Net asset value, beginning of period | Net investment income (loss) (b) | Net realized and unrealized gains (losses) on investments | Total from investment operations | Net realized gain | ||||||||||||||||
Mid Cap Growth Fund | ||||||||||||||||||||
Class A | ||||||||||||||||||||
Year Ended June 30, 2017 | $ | 23.43 | $ | (0.14 | ) | $ | 4.71 | $ | 4.57 | $ | (0.01 | ) | ||||||||
Year Ended June 30, 2016 | 27.71 | (0.15 | ) | (2.67 | ) | (2.82 | ) | (1.46 | ) | |||||||||||
Year Ended June 30, 2015 | 27.49 | (0.18 | ) | 3.19 | 3.01 | (2.79 | ) | |||||||||||||
Year Ended June 30, 2014 | 22.99 | (0.13 | )(f) | 7.42 | 7.29 | (2.79 | ) | |||||||||||||
Year Ended June 30, 2013 | 19.52 | (0.04 | )(g) | 4.50 | 4.46 | (0.99 | ) | |||||||||||||
Class C | ||||||||||||||||||||
Year Ended June 30, 2017 | 19.05 | (0.22 | ) | 3.82 | 3.60 | (0.01 | ) | |||||||||||||
Year Ended June 30, 2016 | 22.93 | (0.22 | ) | (2.20 | ) | (2.42 | ) | (1.46 | ) | |||||||||||
Year Ended June 30, 2015 | 23.35 | (0.26 | ) | 2.63 | 2.37 | (2.79 | ) | |||||||||||||
Year Ended June 30, 2014 | 19.97 | (0.22 | )(f) | 6.39 | 6.17 | (2.79 | ) | |||||||||||||
Year Ended June 30, 2013 | 17.17 | (0.12 | )(g) | 3.91 | 3.79 | (0.99 | ) | |||||||||||||
Class I (formerly Select Class) | ||||||||||||||||||||
Year Ended June 30, 2017 | 26.52 | (0.07 | ) | 5.35 | 5.28 | (0.01 | ) | |||||||||||||
Year Ended June 30, 2016 | 31.06 | (0.09 | ) | (2.99 | ) | (3.08 | ) | (1.46 | ) | |||||||||||
Year Ended June 30, 2015 | 30.39 | (0.11 | ) | 3.57 | 3.46 | (2.79 | ) | |||||||||||||
Year Ended June 30, 2014 | 25.08 | (0.06 | )(f) | 8.16 | 8.10 | (2.79 | ) | |||||||||||||
Year Ended June 30, 2013 | 21.15 | 0.03 | (g) | 4.89 | 4.92 | (0.99 | ) | |||||||||||||
Class R2 | ||||||||||||||||||||
Year Ended June 30, 2017 | 25.41 | (0.21 | ) | 5.12 | 4.91 | (0.01 | ) | |||||||||||||
Year Ended June 30, 2016 | 29.96 | (0.18 | ) | (2.91 | ) | (3.09 | ) | (1.46 | ) | |||||||||||
Year Ended June 30, 2015 | 29.54 | (0.24 | ) | 3.45 | 3.21 | (2.79 | ) | |||||||||||||
Year Ended June 30, 2014 | 24.56 | (0.20 | )(f) | 7.97 | 7.77 | (2.79 | ) | |||||||||||||
Year Ended June 30, 2013 | 20.83 | (0.07 | )(g) | 4.79 | 4.72 | (0.99 | ) | |||||||||||||
Class R3 | ||||||||||||||||||||
September 9, 2016 (h) through June 30, 2017 | 27.06 | (0.13 | ) | 4.79 | 4.66 | (0.01 | ) | |||||||||||||
Class R4 | ||||||||||||||||||||
September 9, 2016 (h) through June 30, 2017 | 27.06 | (0.06 | ) | 4.78 | 4.72 | (0.01 | ) | |||||||||||||
Class R5 | ||||||||||||||||||||
Year Ended June 30, 2017 | 26.74 | (0.03 | ) | 5.39 | 5.36 | (0.01 | ) | |||||||||||||
Year Ended June 30, 2016 | 31.26 | (0.03 | ) | (3.03 | ) | (3.06 | ) | (1.46 | ) | |||||||||||
Year Ended June 30, 2015 | 30.52 | (0.07 | ) | 3.60 | 3.53 | (2.79 | ) | |||||||||||||
Year Ended June 30, 2014 | 25.15 | (0.02 | )(f) | 8.18 | 8.16 | (2.79 | ) | |||||||||||||
Year Ended June 30, 2013 | 21.18 | 0.06 | (g) | 4.90 | 4.96 | (0.99 | ) | |||||||||||||
Class R6 | ||||||||||||||||||||
Year Ended June 30, 2017 | 26.82 | (0.02 | ) | 5.41 | 5.39 | (0.01 | ) | |||||||||||||
Year Ended June 30, 2016 | 31.33 | (0.02 | ) | (3.03 | ) | (3.05 | ) | (1.46 | ) | |||||||||||
Year Ended June 30, 2015 | 30.57 | (0.06 | ) | 3.61 | 3.55 | (2.79 | ) | |||||||||||||
Year Ended June 30, 2014 | 25.17 | — | (f)(i) | 8.19 | 8.19 | (2.79 | ) | |||||||||||||
Year Ended June 30, 2013 | 21.19 | 0.08 | (g) | 4.89 | 4.97 | (0.99 | ) | |||||||||||||
| (a) | Annualized for periods less than one year, unless otherwise noted. |
| (b) | Calculated based upon average shares outstanding. |
| (c) | Not annualized for periods less than one year. |
| (d) | Includes adjustments in accordance with accounting principles generally accepted in the United States of America and as such, the net asset values for financial reporting purposes and the returns based upon those net asset values may differ from the net asset values and returns for shareholder transactions. |
| (e) | Includes earnings credits and interest expense, if applicable, each of which is less than 0.005% unless otherwise noted. |
| (f) | Reflects special dividends paid out during the period by several of the Fund’s holdings. Had the Fund not received the special dividends the net investment income (loss) per share would have been $(0.14), $(0.23), $(0.06), $(0.20), $(0.02) and $(0.01) and for Class A, Class C, Class I, Class R2, Class R5 and Class R6 Shares, respectively, and the net investment income (loss) ratio would have been (0.53)%, (1.03)%, (0.22)%, (0.73)%, (0.08)%, (0.03)% for Class A, Class C, Class I, Class R2, Class R5 and Class R6 Shares, respectively. |
| (g) | Reflects special dividends paid out during the period by several of the Fund’s holdings. Had the Fund not received the special dividends, the net investment income (loss) per share would have been $(0.09), $(0.17), $(0.02), $(0.13), $0.01 and $0.02 for Class A, Class C, Class I, Class R2, Class R5 and Class R6 Shares, respectively, and the net investment income (loss) ratio would have been (0.42)%, (0.92)%, (0.10)%, (0.57)%, 0.04% and 0.09% for Class A, Class C, Class I, Class R2, Class R5 and Class R6 Shares, respectively. |
| (h) | Commencement of offering of class of shares. |
| (i) | Amount rounds to less than $0.005. |
SEE NOTES TO FINANCIAL STATEMENTS.
| 60 | J.P. MORGAN MID CAP/MULTI-CAP FUNDS | JUNE 30, 2017 | ||||
Table of Contents
| Ratios/Supplemental data | |||||||||||||||||||||||||
| Ratios to average net assets (a) | ||||||||||||||||||||||||||
| Net asset value, end of period | Total return (excludes sales charge) (c)(d) | Net assets, end of period (000’s) | Net expenses (e) | Net investment income (loss) | Expenses without waivers, reimbursements and earnings credits | Portfolio turnover rate (c) | ||||||||||||||||||||
| $ | 27.99 | 19.52 | % | $ | 915,226 | 1.23 | % | (0.56 | )% | 1.36 | % | 41 | % | |||||||||||||
| 23.43 | (10.29 | ) | 949,148 | 1.24 | (0.59 | ) | 1.40 | 56 | ||||||||||||||||||
| 27.71 | 12.37 | 984,262 | 1.23 | (0.68 | ) | 1.35 | 57 | |||||||||||||||||||
| 27.49 | 33.44 | 765,310 | 1.24 | (0.51 | )(f) | 1.37 | 69 | |||||||||||||||||||
| 22.99 | 23.70 | 586,787 | 1.23 | (0.17 | )(g) | 1.45 | 70 | |||||||||||||||||||
| 22.64 | 18.92 | 90,640 | 1.73 | (1.06 | ) | 1.85 | 41 | |||||||||||||||||||
| 19.05 | (10.70 | ) | 96,729 | 1.74 | (1.08 | ) | 1.90 | 56 | ||||||||||||||||||
| 22.93 | 11.78 | 75,494 | 1.73 | (1.19 | ) | 1.86 | 57 | |||||||||||||||||||
| 23.35 | 32.85 | 41,047 | 1.73 | (1.01 | )(f) | 1.86 | 69 | |||||||||||||||||||
| 19.97 | 23.03 | 23,745 | 1.73 | (0.67 | )(g) | 1.95 | 70 | |||||||||||||||||||
| 31.79 | 19.92 | 1,050,151 | 0.92 | (0.25 | ) | 1.08 | 41 | |||||||||||||||||||
| 26.52 | (10.01 | ) | 929,489 | 0.93 | (0.31 | ) | 1.13 | 56 | ||||||||||||||||||
| 31.06 | 12.68 | 1,562,284 | 0.92 | (0.37 | ) | 1.12 | 57 | |||||||||||||||||||
| 30.39 | 33.91 | 1,254,748 | 0.93 | (0.20 | )(f) | 1.12 | 69 | |||||||||||||||||||
| 25.08 | 24.06 | 894,740 | 0.93 | 0.14 | (g) | 1.20 | 70 | |||||||||||||||||||
| 30.31 | 19.34 | 35,242 | 1.42 | (0.74 | ) | 1.69 | 41 | |||||||||||||||||||
| 25.41 | (10.42 | ) | 32,092 | 1.40 | (0.71 | ) | 1.71 | 56 | ||||||||||||||||||
| 29.96 | 12.18 | 9,868 | 1.39 | (0.85 | ) | 1.64 | 57 | |||||||||||||||||||
| 29.54 | 33.25 | 1,852 | 1.40 | (0.71 | )(f) | 1.59 | 69 | |||||||||||||||||||
| 24.56 | 23.46 | 320 | 1.39 | (0.32 | )(g) | 1.71 | 70 | |||||||||||||||||||
| 31.71 | 17.24 | 152 | 1.23 | (0.54 | ) | 1.42 | 41 | |||||||||||||||||||
| 31.77 | 17.46 | 129 | 0.98 | (0.23 | ) | 1.10 | 41 | |||||||||||||||||||
| 32.09 | 20.06 | 247,068 | 0.78 | (0.10 | ) | 0.89 | 41 | |||||||||||||||||||
| 26.74 | (9.87 | ) | 224,498 | 0.79 | (0.13 | ) | 0.91 | 56 | ||||||||||||||||||
| 31.26 | 12.87 | 164,713 | 0.78 | (0.25 | ) | 0.87 | 57 | |||||||||||||||||||
| 30.52 | 34.06 | 27,454 | 0.79 | (0.06 | )(f) | 0.92 | 69 | |||||||||||||||||||
| 25.15 | 24.22 | 17,848 | 0.79 | 0.28 | (g) | 1.00 | 70 | |||||||||||||||||||
| 32.20 | 20.11 | 749,670 | 0.73 | (0.06 | ) | 0.76 | 41 | |||||||||||||||||||
| 26.82 | (9.82 | ) | 619,527 | 0.73 | (0.06 | ) | 0.77 | 56 | ||||||||||||||||||
| 31.33 | 12.92 | 265,905 | 0.73 | (0.19 | ) | 0.78 | 57 | |||||||||||||||||||
| 30.57 | 34.16 | 86,150 | 0.74 | (0.01 | )(f) | 0.86 | 69 | |||||||||||||||||||
| 25.17 | 24.26 | 47,434 | 0.74 | 0.34 | (g) | 0.98 | 70 | |||||||||||||||||||
SEE NOTES TO FINANCIAL STATEMENTS.
| JUNE 30, 2017 | J.P. MORGAN MID CAP/MULTI-CAP FUNDS | 61 | ||||||
Table of Contents
FINANCIAL HIGHLIGHTS
FOR THE PERIODS INDICATED (continued)
| Per share operating performance |
| |||||||||||||||||||||||||||
| Investment operations | Distributions | |||||||||||||||||||||||||||
| Net asset value, beginning of period | Net investment income (loss) (b) | Net realized and unrealized gains (losses) on investments | Total from investment operations | Net investment income | Net realized gain | Total distributions | ||||||||||||||||||||||
Mid Cap Value Fund | ||||||||||||||||||||||||||||
Class A | ||||||||||||||||||||||||||||
Year Ended June 30, 2017 | $ | 35.41 | $ | 0.17 | $ | 4.60 | $ | 4.77 | $ | (0.14 | ) | $ | (2.24 | ) | $ | (2.38 | ) | |||||||||||
Year Ended June 30, 2016 | 36.98 | 0.19 | 0.33 | 0.52 | (0.14 | ) | (1.95 | ) | (2.09 | ) | ||||||||||||||||||
Year Ended June 30, 2015 | 37.25 | 0.20 | 2.52 | 2.72 | (0.20 | ) | (2.79 | ) | (2.99 | ) | ||||||||||||||||||
Year Ended June 30, 2014 | 31.68 | 0.15 | (f) | 7.02 | 7.17 | (0.15 | ) | (1.45 | ) | (1.60 | ) | |||||||||||||||||
Year Ended June 30, 2013 | 25.80 | 0.19 | (g) | 6.20 | 6.39 | (0.29 | ) | (0.22 | ) | (0.51 | ) | |||||||||||||||||
Class C | ||||||||||||||||||||||||||||
Year Ended June 30, 2017 | 34.17 | (0.02 | ) | 4.44 | 4.42 | — | (2.24 | ) | (2.24 | ) | ||||||||||||||||||
Year Ended June 30, 2016 | 35.79 | 0.01 | 0.32 | 0.33 | — | (1.95 | ) | (1.95 | ) | |||||||||||||||||||
Year Ended June 30, 2015 | 36.19 | 0.01 | 2.44 | 2.45 | (0.06 | ) | (2.79 | ) | (2.85 | ) | ||||||||||||||||||
Year Ended June 30, 2014 | 30.84 | (0.03 | )(f) | 6.83 | 6.80 | — | (h) | (1.45 | ) | (1.45 | ) | |||||||||||||||||
Year Ended June 30, 2013 | 25.14 | 0.05 | (g) | 6.03 | 6.08 | (0.16 | ) | (0.22 | ) | (0.38 | ) | |||||||||||||||||
Class I (formerly Select Class) | ||||||||||||||||||||||||||||
Year Ended June 30, 2017 | 35.79 | 0.27 | 4.66 | 4.93 | (0.24 | ) | (2.24 | ) | (2.48 | ) | ||||||||||||||||||
Year Ended June 30, 2016 | 37.36 | 0.28 | 0.33 | 0.61 | (0.23 | ) | (1.95 | ) | (2.18 | ) | ||||||||||||||||||
Year Ended June 30, 2015 | 37.61 | 0.28 | 2.55 | 2.83 | (0.29 | ) | (2.79 | ) | (3.08 | ) | ||||||||||||||||||
Year Ended June 30, 2014 | 31.95 | 0.23 | (f) | 7.10 | 7.33 | (0.22 | ) | (1.45 | ) | (1.67 | ) | |||||||||||||||||
Year Ended June 30, 2013 | 26.01 | 0.27 | (g) | 6.24 | 6.51 | (0.35 | ) | (0.22 | ) | (0.57 | ) | |||||||||||||||||
Class L (formerly Institutional Class) | ||||||||||||||||||||||||||||
Year Ended June 30, 2017 | 36.19 | 0.36 | 4.71 | 5.07 | (0.32 | ) | (2.24 | ) | (2.56 | ) | ||||||||||||||||||
Year Ended June 30, 2016 | 37.76 | 0.37 | 0.33 | 0.70 | (0.32 | ) | (1.95 | ) | (2.27 | ) | ||||||||||||||||||
Year Ended June 30, 2015 | 37.99 | 0.40 | 2.56 | 2.96 | (0.40 | ) | (2.79 | ) | (3.19 | ) | ||||||||||||||||||
Year Ended June 30, 2014 | 32.26 | 0.32 | (f) | 7.17 | 7.49 | (0.31 | ) | (1.45 | ) | (1.76 | ) | |||||||||||||||||
Year Ended June 30, 2013 | 26.24 | 0.34 | (g) | 6.31 | 6.65 | (0.41 | ) | (0.22 | ) | (0.63 | ) | |||||||||||||||||
Class R2 | ||||||||||||||||||||||||||||
Year Ended June 30, 2017 | 34.14 | 0.07 | 4.43 | 4.50 | (0.07 | ) | (2.24 | ) | (2.31 | ) | ||||||||||||||||||
Year Ended June 30, 2016 | 35.73 | 0.10 | 0.32 | 0.42 | (0.06 | ) | (1.95 | ) | (2.01 | ) | ||||||||||||||||||
Year Ended June 30, 2015 | 36.14 | 0.10 | 2.43 | 2.53 | (0.15 | ) | (2.79 | ) | (2.94 | ) | ||||||||||||||||||
Year Ended June 30, 2014 | 30.81 | 0.06 | (f) | 6.82 | 6.88 | (0.10 | ) | (1.45 | ) | (1.55 | ) | |||||||||||||||||
Year Ended June 30, 2013 | 25.18 | 0.12 | (g) | 6.03 | 6.15 | (0.30 | ) | (0.22 | ) | (0.52 | ) | |||||||||||||||||
Class R3 | ||||||||||||||||||||||||||||
September 9, 2016 (i) through June 30, 2017 | 35.78 | 0.26 | 4.15 | 4.41 | (0.28 | ) | (2.24 | ) | (2.52 | ) | ||||||||||||||||||
Class R4 | ||||||||||||||||||||||||||||
September 9, 2016 (i) through June 30, 2017 | 36.18 | 0.38 | 4.15 | 4.53 | (0.31 | ) | (2.24 | ) | (2.55 | ) | ||||||||||||||||||
Class R5 | ||||||||||||||||||||||||||||
September 9, 2016 (i) through June 30, 2017 | 36.60 | 0.36 | 4.28 | 4.64 | (0.33 | ) | (2.24 | ) | (2.57 | ) | ||||||||||||||||||
Class R6 | ||||||||||||||||||||||||||||
September 9, 2016 (i) through June 30, 2017 | 36.60 | 0.32 | 4.34 | 4.66 | (0.33 | ) | (2.24 | ) | (2.57 | ) | ||||||||||||||||||
| (a) | Annualized for periods less than one year, unless otherwise noted. |
| (b) | Calculated based upon average shares outstanding. |
| (c) | Not annualized for periods less than one year. |
| (d) | Includes adjustments in accordance with accounting principles generally accepted in the United States of America and as such, the net asset values for financial reporting purposes and the returns based upon those net asset values may differ from the net asset values and returns for shareholder transactions. |
| (e) | Includes earnings credits and interest expense, if applicable, each of which is less than 0.005% unless otherwise noted. |
| (f) | Reflects special dividends paid out during the period by several of the Fund’s holdings. Had the Fund not received the special dividends the net investment income (loss) per share would have been $0.14, $(0.03), $0.05, $0.23 and $0.32 for Class A, Class C, Class R2, Class I and Class L Shares, respectively and the net investment income (loss) ratio would have been 0.41%, (0.10)%, 0.16%, 0.90% and 0.66% for Class A, Class C, Class R2, Class L and Class I Shares, respectively. |
| (g) | Reflects special dividends paid out during the period by several of the Fund’s holdings. Had the Fund not received the special dividends the net investment income (loss) per share would have been $0.16, $0.01, $0.09, $0.23 and $0.31 for Class A, Class C, Class R2, Class I and Class L Shares, respectively and the net investment income (loss) ratio would have been 0.55%, 0.04%, 0.31%, 0.80% and 1.04% for Class A, Class C, Class R2, Class I and Class L Shares, respectively. |
| (h) | Amount rounds to less than $0.005. |
| (i) | Commencement of offering of class of shares. |
SEE NOTES TO FINANCIAL STATEMENTS.
| 62 | J.P. MORGAN MID CAP/MULTI-CAP FUNDS | JUNE 30, 2017 | ||||
Table of Contents
| Ratios/Supplemental data | |||||||||||||||||||||||||
| Ratios to average net assets (a) | ||||||||||||||||||||||||||
| Net asset value, end of period | Total return (excludes sales charge) (c)(d) | Net assets, end of period (000’s) | Net expenses (e) | Net investment income (loss) | Expenses without waivers, reimbursements and earnings credits | Portfolio turnover rate (c) | ||||||||||||||||||||
| $ | 37.80 | 13.83 | % | $ | 2,149,689 | 1.23 | % | 0.45 | % | 1.36 | % | 23 | % | |||||||||||||
| 35.41 | 1.85 | 2,302,567 | 1.24 | 0.54 | 1.41 | 20 | ||||||||||||||||||||
| 36.98 | 7.68 | 2,623,772 | 1.23 | 0.53 | 1.38 | 18 | ||||||||||||||||||||
| 37.25 | 23.25 | 3,404,974 | 1.23 | 0.42 | (f) | 1.37 | 25 | |||||||||||||||||||
| 31.68 | 25.06 | 3,157,503 | 1.23 | 0.67 | (g) | 1.38 | 23 | |||||||||||||||||||
| 36.35 | 13.27 | 452,351 | 1.74 | (0.06 | ) | 1.80 | 23 | |||||||||||||||||||
| 34.17 | 1.35 | 549,619 | 1.75 | 0.03 | 1.83 | 20 | ||||||||||||||||||||
| 35.79 | 7.12 | 595,385 | 1.74 | 0.03 | 1.84 | 18 | ||||||||||||||||||||
| 36.19 | 22.63 | 608,283 | 1.74 | (0.09 | )(f) | 1.87 | 25 | |||||||||||||||||||
| 30.84 | 24.43 | 534,813 | 1.74 | 0.16 | (g) | 1.88 | 23 | |||||||||||||||||||
| 38.24 | 14.15 | 2,902,646 | 0.98 | 0.72 | 1.07 | 23 | ||||||||||||||||||||
| 35.79 | 2.11 | 2,332,160 | 0.99 | 0.80 | 1.11 | 20 | ||||||||||||||||||||
| 37.36 | 7.92 | 2,347,703 | 0.98 | 0.75 | 1.10 | 18 | ||||||||||||||||||||
| 37.61 | 23.59 | 2,967,759 | 0.98 | 0.67 | (f) | 1.12 | 25 | |||||||||||||||||||
| 31.95 | 25.35 | 2,870,752 | 0.98 | 0.92 | (g) | 1.13 | 23 | |||||||||||||||||||
| 38.70 | 14.39 | 12,478,637 | 0.74 | 0.96 | 0.91 | 23 | ||||||||||||||||||||
| 36.19 | 2.35 | 10,313,629 | 0.75 | 1.04 | 0.94 | 20 | ||||||||||||||||||||
| 37.76 | 8.19 | 10,320,516 | 0.74 | 1.05 | 0.94 | 18 | ||||||||||||||||||||
| 37.99 | 23.88 | 8,581,992 | 0.74 | 0.92 | (f) | 0.97 | 25 | |||||||||||||||||||
| 32.26 | 25.68 | 6,627,529 | 0.74 | 1.16 | (g) | 0.98 | 23 | |||||||||||||||||||
| 36.33 | 13.53 | 85,287 | 1.49 | 0.21 | 1.65 | 23 | ||||||||||||||||||||
| 34.14 | 1.61 | 66,167 | 1.50 | 0.29 | 1.75 | 20 | ||||||||||||||||||||
| 35.73 | 7.38 | 71,697 | 1.49 | 0.28 | 1.71 | 18 | ||||||||||||||||||||
| 36.14 | 22.94 | 71,958 | 1.49 | 0.17 | (f) | 1.62 | 25 | |||||||||||||||||||
| 30.81 | 24.71 | 57,003 | 1.49 | 0.43 | (g) | 1.63 | 23 | |||||||||||||||||||
| 37.67 | 12.70 | 19,262 | 1.24 | 0.87 | 1.35 | 23 | ||||||||||||||||||||
| 38.16 | 12.89 | 3,537 | 0.99 | 1.26 | 1.10 | 23 | ||||||||||||||||||||
| 38.67 | 13.06 | 30,334 | 0.84 | 1.18 | 1.02 | 23 | ||||||||||||||||||||
| 38.69 | 13.13 | 281,269 | 0.74 | 1.05 | 0.75 | 23 | ||||||||||||||||||||
SEE NOTES TO FINANCIAL STATEMENTS.
| JUNE 30, 2017 | J.P. MORGAN MID CAP/MULTI-CAP FUNDS | 63 | ||||||
Table of Contents
FINANCIAL HIGHLIGHTS
FOR THE PERIODS INDICATED (continued)
| Per share operating performance | |||||||||||||||
| Investment operations | ||||||||||||||||
| Net asset value, beginning of period | Net investment income (loss) (a) | Net realized and unrealized gains (losses) on investments | Total from investment operations | |||||||||||||
Multi-Cap Market Neutral Fund | ||||||||||||||||
Class A | ||||||||||||||||
Year Ended June 30, 2017 | $ | 9.90 | $ | (0.08 | ) | $ | 0.15 | $ | 0.07 | |||||||
Year Ended June 30, 2016 | 9.87 | (0.10 | ) | 0.13 | 0.03 | |||||||||||
Year Ended June 30, 2015 | 9.91 | (0.11 | ) | 0.07 | (0.04 | ) | ||||||||||
Year Ended June 30, 2014 | 9.79 | (0.13 | ) | 0.25 | 0.12 | |||||||||||
Year Ended June 30, 2013 | 9.69 | (0.11 | )(e) | 0.21 | 0.10 | |||||||||||
Class C | ||||||||||||||||
Year Ended June 30, 2017 | 9.29 | (0.12 | ) | 0.14 | 0.02 | |||||||||||
Year Ended June 30, 2016 | 9.31 | (0.14 | ) | 0.12 | (0.02 | ) | ||||||||||
Year Ended June 30, 2015 | 9.40 | (0.15 | ) | 0.06 | (0.09 | ) | ||||||||||
Year Ended June 30, 2014 | 9.33 | (0.17 | ) | 0.24 | 0.07 | |||||||||||
Year Ended June 30, 2013 | 9.30 | (0.17 | )(e) | 0.20 | 0.03 | |||||||||||
Class I (formerly Select Class) | ||||||||||||||||
Year Ended June 30, 2017 | 10.13 | (0.06 | ) | 0.16 | 0.10 | |||||||||||
Year Ended June 30, 2016 | 10.07 | (0.08 | ) | 0.14 | 0.06 | |||||||||||
Year Ended June 30, 2015 | 10.09 | (0.09 | ) | 0.07 | (0.02 | ) | ||||||||||
Year Ended June 30, 2014 | 9.94 | (0.11 | ) | 0.26 | 0.15 | |||||||||||
Year Ended June 30, 2013 | 9.82 | (0.09 | )(e) | 0.21 | 0.12 | |||||||||||
| (a) | Calculated based upon average shares outstanding. |
| (b) | Includes adjustments in accordance with accounting principles generally accepted in the United States of America and as such, the net asset values for financial reporting purposes and the returns based upon those net asset values may differ from the net asset values and returns for shareholder transactions. |
| (c) | Includes earnings credits and interest expense, if applicable, each of which is less than 0.005% or unless otherwise noted. |
| (d) | The net expenses and expenses without waivers, reimbursements and earnings credits (excluding dividend expense and interest expense for securities sold short) for Class A are 1.23% and 1.60% for the year ended June 30, 2017, 1.27% and 1.69% for the year ended June 30, 2016, 1.48% and 1.95% for the year ended June 30, 2015, 1.49% and 1.91% for the year ended June 30, 2014 and 1.48% and 1.88% for the year ended June 30, 2013; for Class C are 1.73% and 2.10% for the year ended June 30, 2017, 1.77% and 2.20% for the year ended June 30, 2016, 1.98% and 2.45% for the year ended June 30, 2015, 1.99% and 2.40% for the year ended June 30, 2014 and 2.15% and 2.38% for the year ended June 30, 2013; for Class I are 0.97% and 1.24% for the year ended June 30, 2017, 1.03% and 1.30% for the year ended June 30, 2016, 1.23% and 1.64% for the year ended June 30, 2015, 1.23% and 1.65% for the year ended June 30, 2014, 1.23% and 1.63% for the year ended June 30, 2013, respectively. |
| (e) | Reflects special dividends paid out during the period by several of the Fund’s holdings. Had the Fund not received the special dividends, the net investment income (loss) per share would have been $(0.13), $(0.19) and $(0.11) for Class A, Class C and Class I Shares, respectively, and the net investment income (loss) ratio would have been (1.38)%, (2.06)% and (1.16)% for Class A, Class C and Class I Shares, respectively. |
SEE NOTES TO FINANCIAL STATEMENTS.
| 64 | J.P. MORGAN MID CAP/MULTI-CAP FUNDS | JUNE 30, 2017 | ||||
Table of Contents
| Ratios/Supplemental data | |||||||||||||||||||||||||||||
| Ratios to average net assets | ||||||||||||||||||||||||||||||
| Net asset value, end of period | Total return (excludes sales charge) (b) | Net assets, end of period (000’s) | Net expenses (including dividend and interest expense for securities sold short) (c)(d) | Net investment income (loss) | Expenses without waivers, reimbursements and earnings credits (including dividend and interest expense for securities sold short) (d) | Portfolio turnover rate | Portfolio turnover rate (including short sales) | |||||||||||||||||||||||
| $9.97 | 0.71 | % | $ | 5,295 | 2.38 | % | (0.78 | )% | 2.75 | % | 78 | % | 229 | % | ||||||||||||||||
| 9.90 | 0.30 | 6,608 | 2.52 | (0.97 | ) | 2.94 | 111 | 258 | ||||||||||||||||||||||
| 9.87 | (0.40 | ) | 6,273 | 2.68 | (1.14 | ) | 3.15 | 74 | 204 | |||||||||||||||||||||
| 9.91 | 1.23 | 10,301 | 2.78 | (1.36 | ) | 3.20 | 106 | 227 | ||||||||||||||||||||||
| 9.79 | 1.03 | 14,101 | 3.04 | (1.13 | )(e) | 3.44 | 94 | 251 | ||||||||||||||||||||||
| 9.31 | 0.22 | 3,286 | 2.88 | (1.31 | ) | 3.25 | 78 | 229 | ||||||||||||||||||||||
| 9.29 | (0.21 | ) | 6,147 | 3.02 | (1.47 | ) | 3.45 | 111 | 258 | |||||||||||||||||||||
| 9.31 | (0.96 | ) | 6,760 | 3.18 | (1.62 | ) | 3.65 | 74 | 204 | |||||||||||||||||||||
| 9.40 | 0.75 | 8,602 | 3.28 | (1.85 | ) | 3.70 | 106 | 227 | ||||||||||||||||||||||
| 9.33 | 0.32 | 11,181 | 3.69 | (1.81 | )(e) | 3.92 | 94 | 251 | ||||||||||||||||||||||
| 10.23 | 0.99 | 115,804 | 2.12 | (0.54 | ) | 2.39 | 78 | 229 | ||||||||||||||||||||||
| 10.13 | 0.60 | 175,348 | 2.28 | (0.74 | ) | 2.55 | 111 | 258 | ||||||||||||||||||||||
| 10.07 | (0.20 | ) | 277,647 | 2.43 | (0.89 | ) | 2.84 | 74 | 204 | |||||||||||||||||||||
| 10.09 | 1.51 | 431,890 | 2.52 | (1.07 | ) | 2.94 | 106 | 227 | ||||||||||||||||||||||
| 9.94 | 1.22 | 317,974 | 2.78 | (0.90 | )(e) | 3.18 | 94 | 251 | ||||||||||||||||||||||
SEE NOTES TO FINANCIAL STATEMENTS.
| JUNE 30, 2017 | J.P. MORGAN MID CAP/MULTI-CAP FUNDS | 65 | ||||||
Table of Contents
FINANCIAL HIGHLIGHTS
FOR THE PERIODS INDICATED (continued)
| Per share operating performance |
| ||||||||||||||||||||||||||
| Investment operations | Distributions | |||||||||||||||||||||||||||
| Net asset value, beginning of period | Net investment income (loss) (b) | Net realized and unrealized gains (losses) on investments | Total from investment operations | Net investment income | Net realized gain | Total distributions | ||||||||||||||||||||||
Value Advantage Fund |
| |||||||||||||||||||||||||||
Class A | ||||||||||||||||||||||||||||
Year Ended June 30, 2017 | $ | 28.66 | $ | 0.27 | $ | 4.77 | $ | 5.04 | $ | (0.30 | ) | $ | — | $ | (0.30 | ) | ||||||||||||
Year Ended June 30, 2016 | 29.84 | 0.27 | (0.99 | ) | (0.72 | ) | (0.17 | ) | (0.29 | ) | (0.46 | ) | ||||||||||||||||
Year Ended June 30, 2015 | 29.15 | 0.19 | 1.47 | 1.66 | (0.26 | ) | (0.71 | ) | (0.97 | ) | ||||||||||||||||||
Year Ended June 30, 2014 | 24.64 | 0.34 | 5.03 | 5.37 | (0.16 | ) | (0.70 | ) | (0.86 | ) | ||||||||||||||||||
Year Ended June 30, 2013 | 19.96 | 0.22 | 4.75 | 4.97 | (0.20 | ) | (0.09 | ) | (0.29 | ) | ||||||||||||||||||
Class C | ||||||||||||||||||||||||||||
Year Ended June 30, 2017 | 28.52 | 0.11 | 4.74 | 4.85 | (0.17 | ) | — | (0.17 | ) | |||||||||||||||||||
Year Ended June 30, 2016 | 29.72 | 0.14 | (0.99 | ) | (0.85 | ) | (0.06 | ) | (0.29 | ) | (0.35 | ) | ||||||||||||||||
Year Ended June 30, 2015 | 29.08 | 0.04 | 1.47 | 1.51 | (0.16 | ) | (0.71 | ) | (0.87 | ) | ||||||||||||||||||
Year Ended June 30, 2014 | 24.61 | 0.20 | 5.02 | 5.22 | (0.05 | ) | (0.70 | ) | (0.75 | ) | ||||||||||||||||||
Year Ended June 30, 2013 | 19.91 | 0.11 | 4.74 | 4.85 | (0.06 | ) | (0.09 | ) | (0.15 | ) | ||||||||||||||||||
Class I (formerly Select Class) | ||||||||||||||||||||||||||||
Year Ended June 30, 2017 | 28.86 | 0.35 | 4.80 | 5.15 | (0.39 | ) | — | (0.39 | ) | |||||||||||||||||||
Year Ended June 30, 2016 | 29.99 | 0.33 | (0.98 | ) | (0.65 | ) | (0.19 | ) | (0.29 | ) | (0.48 | ) | ||||||||||||||||
Year Ended June 30, 2015 | 29.27 | 0.27 | 1.48 | 1.75 | (0.32 | ) | (0.71 | ) | (1.03 | ) | ||||||||||||||||||
Year Ended June 30, 2014 | 24.72 | 0.42 | 5.03 | 5.45 | (0.20 | ) | (0.70 | ) | (0.90 | ) | ||||||||||||||||||
Year Ended June 30, 2013 | 20.00 | 0.28 | 4.75 | 5.03 | (0.22 | ) | (0.09 | ) | (0.31 | ) | ||||||||||||||||||
Class L (formerly Institutional Class) | ||||||||||||||||||||||||||||
Year Ended June 30, 2017 | 28.86 | 0.41 | 4.82 | 5.23 | (0.46 | ) | — | (0.46 | ) | |||||||||||||||||||
Year Ended June 30, 2016 | 30.06 | 0.43 | (1.02 | ) | (0.59 | ) | (0.32 | ) | (0.29 | ) | (0.61 | ) | ||||||||||||||||
Year Ended June 30, 2015 | 29.31 | 0.34 | 1.50 | 1.84 | (0.38 | ) | (0.71 | ) | (1.09 | ) | ||||||||||||||||||
Year Ended June 30, 2014 | 24.74 | 0.48 | 5.04 | 5.52 | (0.25 | ) | (0.70 | ) | (0.95 | ) | ||||||||||||||||||
Year Ended June 30, 2013 | 19.99 | 0.34 | 4.75 | 5.09 | (0.25 | ) | (0.09 | ) | (0.34 | ) | ||||||||||||||||||
Class R3 | ||||||||||||||||||||||||||||
September 9, 2016 (f) through June 30, 2017 | 29.33 | 0.29 | 4.06 | 4.35 | (0.44 | ) | — | (0.44 | ) | |||||||||||||||||||
Class R4 | ||||||||||||||||||||||||||||
September 9, 2016 (f) through June 30, 2017 | 29.56 | 0.27 | 4.18 | 4.45 | (0.46 | ) | — | (0.46 | ) | |||||||||||||||||||
Class R5 | ||||||||||||||||||||||||||||
September 9, 2016 (f) through June 30, 2017 | 29.57 | 0.30 | 4.20 | 4.50 | (0.48 | ) | — | (0.48 | ) | |||||||||||||||||||
Class R6 | ||||||||||||||||||||||||||||
September 9, 2016 (f) through June 30, 2017 | 29.57 | 0.36 | 4.17 | 4.53 | (0.49 | ) | — | (0.49 | ) | |||||||||||||||||||
| (a) | Annualized for periods less than one year, unless otherwise noted. |
| (b) | Calculated based upon average shares outstanding. |
| (c) | Not annualized for periods less than one year. |
| (d) | Includes adjustments in accordance with accounting principles generally accepted in the United States of America and as such, the net asset values for financial reporting purposes and the returns based upon those net asset values may differ from the net asset values and returns for shareholder transactions. |
| (e) | Includes earnings credits and interest expense, if applicable, each of which is less than 0.005% unless otherwise noted. |
| (f) | Commencement of offering of class of shares. |
SEE NOTES TO FINANCIAL STATEMENTS.
| 66 | J.P. MORGAN MID CAP/MULTI-CAP FUNDS | JUNE 30, 2017 | ||||
Table of Contents
| Ratios/Supplemental data | |||||||||||||||||||||||||
| Ratios to average net assets (a) | ||||||||||||||||||||||||||
| Net asset value, end of period | Total return (excludes sales charge) (c)(d) | Net assets, end of period (000’s) | Net expenses (e) | Net investment income (loss) | Expenses without waivers, reimbursements and earnings credits | Portfolio turnover rate (c) | ||||||||||||||||||||
| $ | 33.40 | 17.60 | % | $ | 1,432,370 | 1.24 | % | 0.85 | % | 1.36 | % | 24 | % | |||||||||||||
| 28.66 | (2.34 | ) | 2,045,698 | 1.24 | 0.98 | 1.43 | 26 | |||||||||||||||||||
| 29.84 | 5.78 | 2,440,061 | 1.24 | 0.64 | 1.41 | 17 | ||||||||||||||||||||
| 29.15 | 22.19 | 1,701,250 | 1.24 | 1.26 | 1.33 | 36 | ||||||||||||||||||||
| 24.64 | 25.09 | 784,359 | 1.24 | 0.98 | 1.33 | 22 | ||||||||||||||||||||
| 33.20 | 17.02 | 746,521 | 1.74 | 0.34 | 1.81 | 24 | ||||||||||||||||||||
| 28.52 | (2.82 | ) | 728,800 | 1.74 | 0.49 | 1.85 | 26 | |||||||||||||||||||
| 29.72 | 5.26 | 701,023 | 1.73 | 0.14 | 1.83 | 17 | ||||||||||||||||||||
| 29.08 | 21.58 | 402,880 | 1.74 | 0.74 | 1.83 | 36 | ||||||||||||||||||||
| 24.61 | 24.45 | 212,198 | 1.74 | 0.49 | 1.83 | 22 | ||||||||||||||||||||
| 33.62 | 17.89 | 2,165,577 | 0.99 | 1.09 | 1.04 | 24 | ||||||||||||||||||||
| 28.86 | (2.10 | ) | 1,414,635 | 0.99 | 1.16 | 1.05 | 26 | |||||||||||||||||||
| 29.99 | 6.05 | 3,095,251 | 0.99 | 0.89 | 1.05 | 17 | ||||||||||||||||||||
| 29.27 | 22.49 | 2,546,808 | 0.99 | 1.53 | 1.08 | 36 | ||||||||||||||||||||
| 24.72 | 25.38 | 1,245,241 | 0.99 | 1.23 | 1.08 | 22 | ||||||||||||||||||||
| 33.63 | 18.17 | 3,643,327 | 0.75 | 1.32 | 0.87 | 24 | ||||||||||||||||||||
| 28.86 | (1.87 | ) | 5,901,818 | 0.74 | 1.50 | 0.88 | 26 | |||||||||||||||||||
| 30.06 | 6.36 | 5,058,172 | 0.74 | 1.15 | 0.90 | 17 | ||||||||||||||||||||
| 29.31 | 22.77 | 3,042,506 | 0.74 | 1.77 | 0.93 | 36 | ||||||||||||||||||||
| 24.74 | 25.73 | 1,455,125 | 0.74 | 1.50 | 0.93 | 22 | ||||||||||||||||||||
| 33.24 | 14.87 | 385 | 1.24 | 1.09 | 1.36 | 24 | ||||||||||||||||||||
| 33.55 | 15.10 | 34 | 1.00 | 1.05 | 1.08 | 24 | ||||||||||||||||||||
| 33.59 | 15.27 | 422 | 0.83 | 1.14 | 0.89 | 24 | ||||||||||||||||||||
| 33.61 | 15.35 | 3,069,390 | 0.74 | 1.39 | 0.75 | 24 | ||||||||||||||||||||
SEE NOTES TO FINANCIAL STATEMENTS.
| JUNE 30, 2017 | J.P. MORGAN MID CAP/MULTI-CAP FUNDS | 67 | ||||||
Table of Contents
AS OF JUNE 30, 2017
1. Organization
JPMorgan Trust I (“JPM I”) and JPMorgan Trust II (“JPM II”) were formed on November 12, 2004, as Delaware statutory trusts, pursuant to Declarations of Trust dated November 5, 2004 and are registered under the Investment Company Act of 1940, as amended (the “1940 Act”), as open-end management investment companies.
J.P. Morgan Mutual Fund Investment Trust (“JPMMFIT”), an open-end management investment company, was organized as a Massachusetts business trust on September 23, 1997.
J.P. Morgan Fleming Mutual Fund Group, Inc. (“JPMFMFG”, with JPM I, JPM II and JPMMFIT (collectively, the “Trusts”)), an open-end management investment company, was organized as a Maryland corporation on August 19, 1997.
The following are 6 separate funds of the Trusts (collectively, the “Funds”) covered by this report:
| Classes Offered | Trust | Diversified/Non-Diversified | ||||
| Growth Advantage Fund | Class A, Class C, Class I^, Class R2^^, Class R3^^^, Class R4^^^, Class R5 and Class R6 | JPMMFIT | Diversified | |||
| Mid Cap Equity Fund | Class A, Class C, Class I^, Class R2, Class R5 and Class R6 | JPM I | Diversified | |||
| Mid Cap Growth Fund | Class A, Class C, Class I^, Class R2, Class R3*, Class R4*, Class R5 and Class R6 | JPM II | Diversified | |||
| Mid Cap Value Fund | Class A, Class C, Class I^, Class L**, Class R2, Class R3*, Class R4*, Class R5*** and Class R6*** | JPMFMFG | Diversified | |||
| Multi-Cap Market Neutral Fund | Class A, Class C, and Class I^ | JPM II | Diversified | |||
| Value Advantage Fund | Class A, Class C, Class I^, Class L**, Class R2^^, Class R3*, Class R4*, Class R5*** and Class R6*** | JPM I | Diversified |
| ^ | Effective April 3, 2017, Select Class was renamed Class I. |
| ^^ | Class R2 Shares commenced operations on July 31, 2017 for Growth Advantage Fund and Value Advantage Fund. |
| ^^^ | Class R3 and Class R4 Shares commenced operations on May 31, 2017 for Growth Advantage Fund. |
| * | Class R3 and Class R4 Shares commenced operations on September 9, 2016 for Mid Cap Growth Fund, Mid Cap Value Fund and Value Advantage Fund. |
| ** | Effective December 1, 2016, Institutional Class was renamed Class L and is publicly offered on a limited basis. |
| *** | Class R5 and Class R6 Shares commenced operations on September 9, 2016 for Mid Cap Value Fund and Value Advantage Fund. |
The investment objective of Growth Advantage Fund and Mid Cap Equity Fund is to seek to provide long-term capital growth.
The investment objective of Mid Cap Growth Fund is to seek growth of capital.
The investment objective of Mid Cap Value Fund is to seek growth from capital appreciation.
The investment objective of Multi-Cap Market Neutral Fund is to seek long-term capital preservation and growth by using strategies designed to produce returns which have no correlation with general domestic market performance.
The investment objective of Value Advantage Fund is to seek to provide long-term total return from a combination of income and capital gains.
Effective as of the close of business on January 3, 2014, all share classes of the Mid Cap Equity Fund are publicly offered only on a limited basis. Investors are not eligible to purchase shares of the Fund unless they meet certain requirements as described in the Fund’s prospectuses.
Effective as of the close of business on February 22, 2013, all share classes of the Mid Cap Value Fund are publicly offered only on a limited basis. Investors are not eligible to purchase shares of the Fund unless they meet certain requirements as described in the Fund’s prospectuses.
Class A Shares generally provide for a front-end sales charge while Class C Shares provide for a contingent deferred sales charge (“CDSC”). No sales charges are assessed with respect to Class I, Class L, Class R2, Class R3, Class R4, Class R5 and Class R6 Shares. All classes of shares have equal rights as to earnings, assets and voting privileges, except that each class may bear different transfer agency, sub-transfer agency (through April 2, 2017), distribution and service fees and each class has exclusive voting rights with respect to its distribution plan and shareholder servicing agreements. Effective April 3, 2017, sub-transfer agency and shareholder servicing fees were consolidated into a single service fee. Certain Class A Shares, for which front-end sales charges have been waived, may be subject to a CDSC as described in the Funds’ prospectus. Beginning on November 14, 2017, Class C Shares will automatically convert to Class A Shares after ten years.
J.P. Morgan Investment Management Inc. (“JPMIM”), an indirect, wholly-owned subsidiary of JPMorgan Chase & Co. (“JPMorgan”), acts as Adviser (the “Adviser”) and Administrator (the “Administrator”) to the Funds.
2. Significant Accounting Policies
The following is a summary of significant accounting policies followed by the Funds in the preparation of their financial statements. The Funds are investment companies and, accordingly, follow the investment company accounting and reporting guidance of the Financial Accounting Standards Board Accounting Standards Codification Topic 946 — Investment Companies, which is part of U.S.
| 68 | J.P. MORGAN MID CAP/MULTI-CAP FUNDS | JUNE 30, 2017 | ||||
Table of Contents
generally accepted accounting principles (“GAAP”). The preparation of financial statements in conformity with GAAP requires management to make estimates and assumptions that affect the reported amounts of assets and liabilities and disclosure of contingent assets and liabilities at the date of the financial statements and the reported amounts of increases and decreases in net assets from operations during the reporting period. Actual results could differ from those estimates.
A. Valuation of Investments — The valuation of investments is in accordance with GAAP and the Funds’ valuation policies set forth by and under the supervision and responsibility of the Board of Trustees (the “Board”), which established the following approach to valuation, as described more fully below: (i) investments for which market quotations are readily available shall be valued at such unadjusted quoted prices and (ii) all other investments for which market quotations are not readily available shall be valued at their fair value as determined in good faith by the Board.
The Administrator has established the J.P. Morgan Investment Management Americas Valuation Committee (“AVC”) to assist the Board with the oversight and monitoring of the valuation of the Funds’ investments. The Administrator implements the valuation policies of the Funds’ investments, as directed by the Board. The AVC oversees and carries out the policies for the valuation of investments held in the Funds. This includes monitoring the appropriateness of fair values based on results of ongoing valuation oversight, including but not limited to consideration of macro or security specific events, market events and pricing vendor and broker due diligence. The Administrator is responsible for discussing and assessing the potential impacts to the fair values on an ongoing basis, and at least on a quarterly basis with the AVC and the Board.
Equities and other exchange-traded instruments are valued at the last sale price or official market closing price on the primary exchange on which the instrument is traded before the net asset values (“NAV”) of the Funds are calculated on a valuation date. Investments in open-end investment companies (the “Underlying Funds”), are valued at each Underlying Fund’s NAV per share as of the report date.
Futures are generally valued on the basis of available market quotations.
Valuations reflected in this report are as of the report date. As a result, changes in valuation due to market events and/or issuer related events after the report date and prior to issuance of the report are not reflected herein.
The various inputs that are used in determining the valuation of the Funds’ investments are summarized into the three broad levels listed below.
| • | Level 1 — Unadjusted inputs using quoted prices in active markets for identical investments. |
| • | Level 2 — Other significant observable inputs including, but not limited to, quoted prices for similar investments, inputs other than quoted prices that are observable for investments (such as interest rates, prepayment speeds, credit risk, etc.) or other market corroborated inputs. |
| • | Level 3 — Significant inputs based on the best information available in the circumstances, to the extent observable inputs are not available (including the Funds’ assumptions in determining the fair value of investments). |
A financial instrument’s level within the fair value hierarchy is based on the lowest level of any input, both individually and in the aggregate, that is significant to the fair value measurement. The inputs or methodology used for valuing instruments are not necessarily an indication of the risk associated with investing in those instruments.
The following tables represent each valuation input as presented on the Schedules of Portfolio Investments (“SOIs”) (amounts in thousands):
Growth Advantage Fund
| Level 1 Quoted prices | Level 2 Other significant observable inputs | Level 3 Significant unobservable inputs | Total | |||||||||||||
Total Investments in Securities (a) | $ | 7,153,161 | $ | — | $ | — | $ | 7,153,161 | ||||||||
|
|
|
|
|
|
|
| |||||||||
| Mid Cap Equity Fund | ||||||||||||||||
| Level 1 Quoted prices | Level 2 Other significant observable inputs | Level 3 Significant unobservable inputs | Total | |||||||||||||
Total Investments in Securities (a) | $ | 2,833,340 | $ | — | $ | — | $ | 2,833,340 | ||||||||
|
|
|
|
|
|
|
| |||||||||
| Mid Cap Growth Fund | ||||||||||||||||
| Level 1 Quoted prices | Level 2 Other significant observable inputs | Level 3 Significant unobservable inputs | Total | |||||||||||||
Total Investments in Securities (a) | $ | 3,115,434 | $ | — | $ | — | $ | 3,115,434 | ||||||||
|
|
|
|
|
|
|
| |||||||||
| Mid Cap Value Fund | ||||||||||||||||
| Level 1 Quoted prices | Level 2 Other significant observable inputs | Level 3 Significant unobservable inputs | Total | |||||||||||||
Total Investments in Securities (a) | $ | 18,383,944 | $ | — | $ | — | $ | 18,383,944 | ||||||||
|
|
|
|
|
|
|
| |||||||||
| JUNE 30, 2017 | J.P. MORGAN MID CAP/MULTI-CAP FUNDS | 69 | ||||||
Table of Contents
NOTES TO FINANCIAL STATEMENTS
AS OF JUNE 30, 2017 (continued)
| Multi-Cap Market Neutral Fund | ||||||||||||||||
| Level 1 Quoted prices | Level 2 Other significant observable inputs | Level 3 Significant unobservable inputs | Total | |||||||||||||
Total Investments in Securities (a) | $ | 124,940 | $ | — | $ | — | $ | 124,940 | ||||||||
|
|
|
|
|
|
|
| |||||||||
Total Liabilities for Securities Sold Short (a) | $ | (109,316 | ) | $ | — | $ | — | $ | (109,316 | ) | ||||||
|
|
|
|
|
|
|
| |||||||||
Appreciation in Other Financial Instruments | ||||||||||||||||
Futures Contracts | $ | 13 | $ | — | $ | — | $ | 13 | ||||||||
|
|
|
|
|
|
|
| |||||||||
| Value Advantage Fund | ||||||||||||||||
| Level 1 Quoted prices | Level 2 Other significant observable inputs | Level 3 Significant unobservable inputs | Total | |||||||||||||
Total Investments in Securities (b) | $ | 11,054,151 | $ | — | $ | — | (c) | $ | 11,054,151 | |||||||
|
|
|
|
|
|
|
| |||||||||
| (a) | All portfolio holdings designated as level 1 are disclosed individually on the SOIs. Please refer to the SOIs for industry specifics of portfolio holdings. |
| (b) | All portfolio holdings designated as level 1 and level 3 are disclosed individually on the SOIs. Level 3 consists of rights. Please refer to the SOIs for industry specifics of portfolio holdings. |
| (c) | Amount rounds to less than 500. |
There were no transfers among any levels during the year ended June 30, 2017.
B. Short Sales — Multi-Cap Market Neutral Fund engages in short sales as part of its normal investment activities. In a short sale, the Fund sells securities it does not own in anticipation of a decline in the market value of those securities. In order to deliver securities to the purchaser, the Fund borrows securities from a broker. To close out a short position, the Fund delivers the same securities to the broker.
The Fund is required to pledge cash or securities to the broker as collateral for the securities sold short. Collateral requirements are calculated daily based on the current market value of the short positions. Cash collateral deposited with the broker is recorded as Deposits at broker for securities sold short, while cash collateral deposited at the Fund’s custodian for the benefit of the broker is recorded as Restricted Cash on the Statements of Assets and Liabilities. Securities segregated as collateral are denoted on the SOIs. The Fund may receive or pay the net of the following amounts: (i) a portion of the income from the investment of cash collateral; (ii) the broker’s fee on the borrowed securities (calculated daily based upon the market value of each borrowed security and a variable rate that is dependent on availability of the security); and (iii) a financing charge for the difference between the market value of the short position and cash collateral deposited with the broker. The net amounts of income or fees are included as Interest income or Interest expense on securities sold short on the Statements of Operations.
The Fund is obligated to pay the broker dividends declared on short positions when a position is open on the record date. Dividends on short positions are reported on ex-dividend date on the Statements of Operations as Dividend expense on securities sold short.
Liabilities for securities sold short are reported at market value on the Statements of Assets and Liabilities and the change in market value is recorded as change in net unrealized appreciation (depreciation) on the Statements of Operations. Short sale transactions may result in unlimited losses as the security’s price increases and the short position loses value. There is no upward limit on the price a borrowed security could attain. The Fund is also subject to risk of loss if the broker were to fail to perform its obligations under the contractual terms.
The Fund will record a realized loss if the price of the borrowed security increases between the date of the short sale and the date on which the Fund replaces the borrowed security. The Fund will record a realized gain if the price of the borrowed security declines between those dates.
As of June 30, 2017, the Fund had outstanding short sales as listed on the SOI.
C. Futures Contracts — Multi-Cap Market Neutral Fund used index futures contracts to gain or reduce exposure to the stock market, maintain liquidity or minimize transaction costs. The Fund also bought futures contracts to invest incoming cash in the market or sold futures in response to cash outflows, thereby simulating an invested position in the underlying index while maintaining a cash balance for liquidity.
Futures contracts provide for the delayed delivery of the underlying instrument at a fixed price or are settled for a cash amount based on the change in the value of the underlying instrument at a specific date in the future. Upon entering into a futures contract, the Fund is required to deposit with the broker, cash or securities in an amount equal to a certain percentage of the contract amount, which is referred to as the initial margin deposit. Subsequent payments, referred to as variation margin, are made or received by the Fund periodically and are based on changes in the market value of open futures contracts. Changes in the market value of open futures contracts are recorded as Change in net unrealized appreciation/depreciation on the Statements of Operations. Realized gains or losses, representing the difference between the value of the contract at the time it was opened and the value at the time it was closed, are reported on the Statements of Operations at the closing or expiration of the futures contract. Securities deposited as initial margin are designated on the SOIs and cash deposited is recorded on the Statements of Assets and Liabilities. A receivable from and/or a payable to brokers for the daily variation margin is also recorded on the Statements of Assets and Liabilities.
| 70 | J.P. MORGAN MID CAP/MULTI-CAP FUNDS | JUNE 30, 2017 | ||||
Table of Contents
The use of futures contracts exposes the Fund to equity price risk. The Fund may be subject to the risk that the change in the value of the futures contract may not correlate perfectly with the underlying instrument. Use of long futures contracts subjects the Fund to risk of loss in excess of the amounts shown on the Statements of Assets and Liabilities, up to the notional amount of the futures contracts. Use of short futures contracts subjects the Fund to unlimited risk of loss. The Fund may enter into futures contracts only on exchanges or boards of trade.
The exchange or board of trade acts as the counterparty to each futures transaction; therefore, the Fund’s credit risk is limited to failure of the exchange or board of trade. Under some circumstances, futures exchanges may establish daily limits on the amount that the price of a futures contract can vary from the previous day’s settlement price, which could effectively prevent liquidation of positions.
The table below discloses the volume of the Fund’s futures contracts activity during the year ended June 30, 2017 (amounts in thousands):
| Multi-Cap Market Neutral Fund | ||||
Futures Contracts: | ||||
Average Notional Balance Long | $ | 1,807 | (a) | |
Average Notional Balance Short | 1,102 | |||
Ending Notional Balance Long | — | |||
Ending Notional Balance Short | 2,419 | |||
| (a) | For the period May 1, 2017 through May 31, 2017. |
The Fund’s futures contracts are not subject to master netting arrangements (the right to close out all transactions traded with a counterparty and net amounts owed or due across transactions).
D. Security Transactions and Investment Income — Investment transactions are accounted for on the trade date (the date the order to buy or sell is executed). Securities gains and losses are calculated on a specifically identified cost basis. Interest income is determined on the basis of coupon interest accrued using the effective interest method which adjusts for amortization of premiums and accretion of discounts. Dividend income, net of foreign taxes withheld, if any, and dividend expense on securities sold short, are recorded on the ex-dividend date or when a Fund first learns of the dividend.
To the extent such information is publicly available, the Funds record distributions received in excess of income earned from underlying investments as a reduction of cost of investments and/or realized gain. Such amounts are based on estimates if actual amounts are not available and actual amounts of income, realized gain and return of capital may differ from the estimated amounts. The Funds adjust the estimated amounts of the components of distributions (and consequently their net investment income) as necessary once the issuers provide information about the actual composition of the distributions.
E. Allocation of Income and Expenses — Expenses directly attributable to a fund are charged directly to that fund, while the expenses attributable to more than one fund of the Trusts are allocated among the respective funds. In calculating the NAV of each class, investment income, realized and unrealized gains and losses and expenses, other than class-specific expenses, are allocated daily to each class of shares based upon the proportion of net assets of each class at the beginning of each day.
Transfer agency fees are class-specific expenses and sub-transfer agency fees were class-specific expenses up through April 2, 2017. Effective April 3, 2017, the Funds ceased making direct payments to financial intermediaries for any applicable sub-transfer agency services. Payments to financial intermediaries for sub-transfer agency services are made by JPMorgan Distribution Services, Inc. from the Shareholder Servicing Fee, which has been renamed as the Service Fee. The amount of the transfer agency fees and sub-transfer agency fees charged to each class of the Funds for the year ended June 30, 2017 are as follows (amounts in thousands):
| Class A | Class C | Class I | Class L | Class R2 | Class R3 | Class R4 | Class R5 | Class R6 | Total | |||||||||||||||||||||||||||||||
Growth Advantage Fund | ||||||||||||||||||||||||||||||||||||||||
Transfer agency fees | $ | 105 | $ | 45 | $ | 37 | n/a | n/a | $ | — | $ | — | $ | 5 | $ | 21 | $ | 213 | ||||||||||||||||||||||
Sub-transfer agency fees | 1,057 | 396 | 498 | n/a | n/a | — | — | 58 | — | 2,009 | ||||||||||||||||||||||||||||||
Mid Cap Equity Fund | ||||||||||||||||||||||||||||||||||||||||
Transfer agency fees | 16 | 3 | 13 | n/a | $ | — | (a) | n/a | n/a | — | (a) | 11 | 43 | |||||||||||||||||||||||||||
Sub-transfer agency fees | 390 | 50 | 507 | n/a | 1 | n/a | n/a | 1 | — | 949 | ||||||||||||||||||||||||||||||
Mid Cap Growth Fund | ||||||||||||||||||||||||||||||||||||||||
Transfer agency fees | 337 | 12 | 32 | n/a | 11 | — | (a) | — | (a) | 5 | 33 | 430 | ||||||||||||||||||||||||||||
Sub-transfer agency fees | 700 | 79 | 715 | n/a | 48 | — | — | 170 | — | 1,712 | ||||||||||||||||||||||||||||||
Mid Cap Value Fund | ||||||||||||||||||||||||||||||||||||||||
Transfer agency fees | 146 | 24 | 41 | $ | 766 | 10 | 2 | — | (a) | 4 | 1 | 994 | ||||||||||||||||||||||||||||
Sub-transfer agency fees | 2,363 | 267 | 1,846 | 6,565 | 94 | — | (a) | — | (a) | — | — | 11,135 | ||||||||||||||||||||||||||||
Multi-Cap Market Neutral Fund | ||||||||||||||||||||||||||||||||||||||||
Transfer agency fees | 1 | 1 | 2 | n/a | n/a | n/a | n/a | n/a | n/a | 4 | ||||||||||||||||||||||||||||||
Sub-transfer agency fees | 5 | 5 | 6 | n/a | n/a | n/a | n/a | n/a | n/a | 16 | ||||||||||||||||||||||||||||||
Value Advantage Fund | ||||||||||||||||||||||||||||||||||||||||
Transfer agency fees | 93 | 51 | 30 | 60 | n/a | — | (a) | — | (a) | — | (a) | 11 | 245 | |||||||||||||||||||||||||||
Sub-transfer agency fees | 1,796 | 441 | 524 | 1,019 | n/a | — | — | — | — | 3,780 | ||||||||||||||||||||||||||||||
| (a) | Amount rounds to less than 500. |
| JUNE 30, 2017 | J.P. MORGAN MID CAP/MULTI-CAP FUNDS | 71 | ||||||
Table of Contents
NOTES TO FINANCIAL STATEMENTS
AS OF JUNE 30, 2017 (continued)
F. Federal Income Taxes — Each Fund is treated as a separate taxable entity for Federal income tax purposes. Each Fund’s policy is to comply with the provisions of the Internal Revenue Code of 1986, as amended (the “Code”), applicable to regulated investment companies and to distribute to shareholders all of its distributable net investment income and net realized capital gains on investments. Accordingly, no provision for Federal income tax is necessary. Management has reviewed the Funds’ tax positions for all open tax years and has determined that as of June 30, 2017, no liability for income tax is required in the Funds’ financial statements for net unrecognized tax benefits. However, management’s conclusions may be subject to future review based on changes in, or the interpretation of, the accounting standards or tax laws and regulations. Each of the Funds’ Federal tax returns for the prior three fiscal years remains subject to examination by the Internal Revenue Service.
G. Distributions to Shareholders — Distributions from net investment income are generally declared and paid at least annually. Distributions are declared separately for each class of each Fund. No class has preferential dividend rights; differences in per share rates are due to differences in separate class expenses. Net realized capital gains, if any, are distributed by each Fund at least annually. The amount of distributions from net investment income and net realized capital gains is determined in accordance with Federal income tax regulations, which may differ from GAAP. To the extent these “book/tax” differences are permanent in nature (i.e., that they result from other than timing of recognition — “temporary differences”), such amounts are reclassified within the capital accounts based on their Federal tax-basis treatment.
The following amounts were reclassified within the capital accounts (amounts in thousands):
| Paid-in Capital | Accumulated undistributed (distributions in excess of) net investment income | Accumulated net realized gains (losses) | ||||||||||
Growth Advantage Fund | $ | (20,689 | ) | $ | 19,294 | $ | 1,395 | |||||
Mid Cap Equity Fund | 1 | (320 | ) | 319 | ||||||||
Mid Cap Growth Fund | (9,863 | ) | 8,215 | 1,648 | ||||||||
Mid Cap Value Fund | — | (a) | — | — | (a) | |||||||
Multi-Cap Market Neutral Fund | (1,381 | ) | 1,308 | 73 | ||||||||
Value Advantage Fund | 265,353 | (2,756 | ) | (262,597 | ) | |||||||
| (a) | Amount rounds to less than 500. |
The reclassification for the Funds relate primarily to net operating losses, investments in partnerships, non-taxable dividends and adjustments to gain/loss due to redemptions in-kind.
3. Fees and Other Transactions with Affiliates
A. Investment Advisory Fee — Pursuant to Investment Advisory Agreements, J.P. Morgan Investment Management Inc. the Adviser supervises the investments of each Fund and for such services is paid a fee. The fee is accrued daily and paid monthly based on each Fund’s respective average daily net assets. The annual rate for each Fund is as follows:
Growth Advantage Fund | 0.65 | % | ||
Mid Cap Equity Fund | 0.65 | |||
Mid Cap Growth Fund | 0.65 | |||
Mid Cap Value Fund | 0.65 | |||
Multi-Cap Market Neutral Fund | 0.80 | |||
Value Advantage Fund | 0.65 |
The Adviser waived Investment Advisory fees and/or reimbursed expenses as outlined in Note 3.F.
B. Administration Fee — Pursuant to Administration Agreements, the Administrator provides certain administration services to the Funds. In consideration of these services, the Administrator receives a fee accrued daily and paid monthly at an annual rate of 0.15% of the first $25 billion of the average daily net assets of all funds in the J.P. Morgan Funds Complex covered by the Administration Agreement (excluding certain funds of funds and money market funds) and 0.075% of the average daily net assets in excess of $25 billion of all such funds. For the year ended June 30, 2017, the effective rate was 0.08% of each Fund’s average daily net assets, notwithstanding any fee waivers and/or expense reimbursements.
The Administrator waived Administration fees as outlined in Note 3.F.
JPMorgan Chase Bank, N.A. (“JPMCB”), a wholly-owned subsidiary of JPMorgan, serves as the Funds’ sub-administrator (the “Sub-administrator”). For its services as Sub-administrator, JPMCB receives a portion of the fees payable to the Administrator.
C. Distribution Fees — Pursuant to a Distribution Agreement, JPMorgan Distribution Services, Inc. (“JPMDS”), a wholly-owned subsidiary of JPMorgan, serves as the Trusts’ principal underwriter and promotes and arranges for the sale of each Fund’s shares.
The Board has adopted a Distribution Plan (the “Distribution Plan”) for Class A, Class C, Class R2 and Class R3 Shares of the Funds, as applicable, in accordance with Rule 12b-1 under the 1940 Act. Class I, Class L, Class R4, Class R5 and Class R6 Shares do not charge a distribution fee. The Dis-
| 72 | J.P. MORGAN MID CAP/MULTI-CAP FUNDS | JUNE 30, 2017 | ||||
Table of Contents
tribution Plan provides that each Fund shall pay distribution fees, including payments to JPMDS, at annual rates of the average daily net assets as shown in the table below:
| Class A | Class C | Class R2 | Class R3 | |||||||||||||
Growth Advantage Fund | 0.25 | % | 0.75 | % | n/a | 0.25 | % | |||||||||
Mid Cap Equity Fund | 0.25 | 0.75 | 0.50 | % | n/a | |||||||||||
Mid Cap Growth Fund | 0.25 | 0.75 | 0.50 | 0.25 | ||||||||||||
Mid Cap Value Fund | 0.25 | 0.75 | 0.50 | 0.25 | ||||||||||||
Multi-Cap Market Neutral Fund | 0.25 | 0.75 | n/a | n/a | ||||||||||||
Value Advantage Fund | 0.25 | 0.75 | n/a | 0.25 | ||||||||||||
In addition, JPMDS is entitled to receive the front-end sales charges from purchases of Class A Shares and the CDSC from redemptions of Class C Shares and certain Class A Shares for which front-end sales charges have been waived. For the year ended June 30, 2017, JPMDS retained the following (amounts in thousands):
| Front-End Sales Charge | CDSC | |||||||
Growth Advantage Fund | $ | 475 | $ | 5 | ||||
Mid Cap Equity Fund | 248 | 2 | ||||||
Mid Cap Growth Fund | 87 | 1 | ||||||
Mid Cap Value Fund | 45 | 1 | ||||||
Multi-Cap Market Neutral Fund | — | (a) | — | |||||
Value Advantage Fund | 330 | 6 | ||||||
| (a) | Amount rounds to less than 500. |
D. Service Fees — The Trusts, on behalf of the Funds, have entered into a Shareholder Servicing Agreement with JPMDS under which JPMDS provides certain support services to the shareholders. The Class R6 Shares do not charge a service fee. For performing these services, JPMDS receives a fee that is accrued daily and paid monthly equal to a percentage of the average daily net assets as shown in the table below:
| Class A | Class C | Class I | Class L | Class R2 | Class R3 | Class R4 | Class R5 | |||||||||||||||||||||||||
Growth Advantage Fund | 0.25 | % | 0.25 | % | 0.25 | % | n/a | n/a | 0.25 | % | 0.25 | % | 0.10 | %* | ||||||||||||||||||
Mid Cap Equity Fund | 0.25 | 0.25 | 0.25 | n/a | 0.25 | % | n/a | n/a | 0.10 | * | ||||||||||||||||||||||
Mid Cap Growth Fund | 0.25 | 0.25 | 0.25 | n/a | 0.25 | 0.25 | 0.25 | 0.10 | * | |||||||||||||||||||||||
Mid Cap Value Fund | 0.25 | 0.25 | 0.25 | 0.10 | % | 0.25 | 0.25 | 0.25 | 0.10 | * | ||||||||||||||||||||||
Multi-Cap Market Neutral Fund | 0.25 | 0.25 | 0.25 | n/a | n/a | n/a | n/a | n/a | ||||||||||||||||||||||||
Value Advantage Fund | 0.25 | 0.25 | 0.25 | 0.10 | n/a | 0.25 | 0.25 | 0.10 | * | |||||||||||||||||||||||
| * | Prior to April 3, 2017, the service fee for Class R5 Shares were 0.05%. |
JPMDS has entered into shareholder services contracts with affiliated and unaffiliated financial intermediaries who provide shareholder services and other related services to their clients or customers who invest in the Funds under which JPMDS will pay all or a portion of such fees earned to financial intermediaries for performing such services.
JPMDS waived service fees as outlined in Note 3.F.
E. Custodian and Accounting Fees — JPMCB provides portfolio custody and accounting services to the Funds. For performing these services, the Funds pay JPMCB transaction and asset-based fees that vary according to the number of transactions and positions, plus out-of-pocket expenses. The amounts paid directly to JPMCB by the Funds for custody and accounting services are included in Custodian and accounting fees on the Statements of Operations. Payments to the custodian may be reduced by credits earned by each Fund, based on uninvested cash balances held by the custodian. Such earnings credits, if any, are presented separately on the Statements of Operations.
Interest expense paid to the custodian related to cash overdrafts, if any, is included in Interest expense to affiliates on the Statements of Operations.
F. Waivers and Reimbursements — The Adviser, Administrator and/or JPMDS have contractually agreed to waive fees and/or reimburse the Funds to the extent that total annual operating expenses (excluding acquired fund fees and expenses other than certain money market fund fees as
| JUNE 30, 2017 | J.P. MORGAN MID CAP/MULTI-CAP FUNDS | 73 | ||||||
Table of Contents
NOTES TO FINANCIAL STATEMENTS
AS OF JUNE 30, 2017 (continued)
described below, dividend and interest expenses related to short sales, interest, taxes, expenses related to litigation and potential litigation and extraordinary expenses) exceed the percentages of the Funds’ respective average daily net assets as shown in the table below:
| Class A | Class C | Class I | Class L | Class R2 | Class R3 | Class R4 | Class R5 | Class R6 | ||||||||||||||||||||||||||||
Growth Advantage Fund* | 1.24 | % | 1.74 | % | 0.99 | % | n/a | n/a | 1.25 | % | 1.00 | % | 0.85 | % | 0.75 | % | ||||||||||||||||||||
Mid Cap Equity Fund | 1.25 | 1.75 | 0.90 | n/a | 1.50 | % | n/a | n/a | 0.80 | 0.75 | ||||||||||||||||||||||||||
Mid Cap Growth Fund | 1.24 | 1.74 | 0.93 | n/a | 1.49 | ** | 1.24 | % | 0.99 | 0.79 | 0.74 | |||||||||||||||||||||||||
Mid Cap Value Fund | 1.24 | 1.75 | 0.99 | 0.75 | % | 1.50 | 1.25 | 1.00 | 0.85 | 0.75 | ||||||||||||||||||||||||||
Multi-Cap Market Neutral Fund | 1.25 | 1.75 | 0.99 | n/a | n/a | n/a | n/a | n/a | n/a | |||||||||||||||||||||||||||
Value Advantage Fund | 1.24 | *** | 1.74 | *** | 0.99 | *** | 0.75 | n/a | 1.25 | 1.00 | 0.85 | 0.75 | ||||||||||||||||||||||||
| * | The contractual expense percentages in the table above are in place until at least October 31, 2018 except for Class R3 and Class R4 Shares that are in place until May 31, 2018. Prior to November 1, 2016, the contractual expense limitation for Growth Advantage Fund was 1.25%, 1.75%, 1.10%, 0.90% and 0.85%, for Class A, Class C, Class I, Class R5 and Class R6 Shares, respectively. |
| ** | The contractual expense percentage in the table above is in place until at least October 31, 2018. For Mid Cap Growth Fund Class R2 Shares, the Adviser, Administrator and/or JPMDS contractually waived fees and/or reimbursed the Fund to the extent that total annual operating expenses (excluding acquired fund fees and expenses other than certain money market fund fees as described below, dividend and interest expenses related to short sales, interest, taxes, expenses related to litigation and potential litigation and extraordinary expenses) exceeded 1.40% of the Fund’s average daily net assets during the period July 1, 2016 through October 31, 2016. During the period November 1, 2016 through December 31, 2016 the Adviser, Administrator and/or JPMDS voluntarily waived fees and/or reimbursed the Fund to the extent that total annual operating expenses for Class R2 Shares exceeded 1.40%. The Fund’s service providers are under no obligation to continue the voluntary waivers and may discontinue them at any time. |
| *** | The contractual expense percentages in the table above are in place until at least October 31, 2018. Prior to November 1, 2016, the contractual expense limitation for Value Advantage Fund was 1.25%, 1.75%, and 1.00%, for Class A, Class C and Class I Shares, respectively. |
Except as noted above, the expense limitation agreements were in effect for the year ended June 30, 2017 and the contractual expense limitation percentages in the table above are in place until at least October 31, 2017.
For the year ended June 30, 2017, the Funds’ service providers waived fees and/or reimbursed expenses for each of the Funds as follows (amounts in thousands). None of these parties expect the Funds to repay any such waived fees and reimbursed expenses in future years.
| Contractual Waivers | ||||||||||||||||||||
| Investment Advisory Fees | Administration Fees | Service Fees | Total | Contractual Reimbursements | ||||||||||||||||
Growth Advantage Fund | $ | 17 | $ | 12 | $ | 2,160 | $ | 2,189 | $ | 7 | ||||||||||
Mid Cap Equity Fund | 88 | 59 | 1,640 | 1,787 | 23 | |||||||||||||||
Mid Cap Growth Fund | 295 | 195 | 2,543 | 3,033 | 114 | |||||||||||||||
Mid Cap Value Fund | 1,575 | 1,035 | 15,940 | 18,550 | 5,540 | |||||||||||||||
Multi-Cap Market Neutral Fund | 276 | 131 | 14 | 421 | — | |||||||||||||||
Value Advantage Fund | 882 | 587 | 6,850 | 8,319 | 588 | |||||||||||||||
Additionally, the Funds may invest in one or more money market funds advised by the Adviser or its affiliates (affiliated money market funds). The Adviser, Administrator and/or Distributor, as shareholder servicing agent, have contractually agreed to waive fees and/or reimburse expenses in an amount sufficient to offset the respective net fees each collects from the affiliated money market fund on the applicable Funds’ investment in such affiliated money market fund.
The amount of waivers resulting from investments in these money market funds for the year ended June 30, 2017 was as follows (amounts in thousands):
Growth Advantage Fund | $ | 247 | ||
Mid Cap Equity Fund | 152 | |||
Mid Cap Growth Fund | 125 | |||
Mid Cap Value Fund | 1,288 | |||
Multi-Cap Market Neutral Fund | 27 | |||
Value Advantage Fund | 402 |
G. Other — Certain officers of the Trusts are affiliated with the Adviser, the Administrator and JPMDS. Such officers, with the exception of the Chief Compliance Officer, receive no compensation from the Funds for serving in their respective roles.
The Board appointed a Chief Compliance Officer to the Funds in accordance with Federal securities regulations. Each Fund, along with other affiliated funds, makes reimbursement payments, on a pro-rata basis, to the Administrator for a portion of the fees associated with the Office of the Chief Compliance Officer. Such fees are included in Trustees’ and Chief Compliance Officer’s fees on the Statements of Operations.
| 74 | J.P. MORGAN MID CAP/MULTI-CAP FUNDS | JUNE 30, 2017 | ||||
Table of Contents
The Trusts adopted a Trustee Deferred Compensation Plan (the “Plan”) which allows the Independent Trustees to defer the receipt of all or a portion of compensation related to performance of their duties as Trustees. The deferred fees are invested in various J.P. Morgan Funds until distribution in accordance with the Plan.
During the year ended June 30, 2017, Growth Advantage Fund, Mid Cap Equity Fund, Mid Cap Growth Fund, Multi-Cap Market Neutral Fund and Value Advantage Fund purchased securities from an underwriting syndicate in which the principal underwriter or members of the syndicate were affiliated with the Adviser.
The Funds may use related party broker-dealers. For the year ended June 30, 2017, the Funds incurred brokerage commissions with broker-dealers affiliated with the Adviser as follows (amounts in thousands):
Growth Advantage Fund | $ | — | (a) | |
Mid Cap Equity Fund | — | (a) | ||
Mid Cap Growth Fund | — | (a) | ||
Mid Cap Value Fund | 2 | |||
Multi-Cap Market Neutral Fund | — | (a) | ||
Value Advantage Fund | 2 |
| (a) | Amount rounds to less than 500. |
The Securities and Exchange Commission (“SEC”) has granted an exemptive order permitting the Funds to engage in principal transactions with J.P. Morgan Securities, Inc., an affiliated broker, involving taxable money market instruments, subject to certain conditions.
4. Investment Transactions
During the year ended June 30, 2017, purchases and sales of investments (excluding short-term investments and transfers in-kind) were as follows (amounts in thousands):
| Purchases (excluding U.S. Government) | Sales (excluding U.S. Government) | Securities Sold Short | Covers on Securities Sold Short | |||||||||||||
Growth Advantage Fund | $ | 2,140,445 | $ | 2,493,607 | $ | — | $ | — | ||||||||
Mid Cap Equity Fund | 959,015 | 949,951 | — | — | ||||||||||||
Mid Cap Growth Fund | 1,150,873 | 1,481,479 | — | — | ||||||||||||
Mid Cap Value Fund | 4,239,718 | 3,735,324 | — | — | ||||||||||||
Multi-Cap Market Neutral Fund | 111,822 | 202,705 | 127,833 | 216,504 | ||||||||||||
Value Advantage Fund | 2,440,060 | 2,772,718 | — | — | ||||||||||||
During the year ended June 30, 2017, there were no purchases or sales of U.S. Government securities.
5. Federal Income Tax Matters
For Federal income tax purposes, the estimated cost and unrealized appreciation (depreciation) in value of investment securities held at June 30, 2017 were as follows (amounts in thousands):
Aggregate Cost | Gross Unrealized Appreciation | Gross Unrealized Depreciation | Net Unrealized Appreciation (Depreciation) | |||||||||||||
Growth Advantage Fund | $ | 4,761,420 | $ | 2,441,059 | $ | 49,318 | $ | 2,391,741 | ||||||||
Mid Cap Equity Fund | 2,048,226 | 837,632 | 52,518 | 785,114 | ||||||||||||
Mid Cap Growth Fund | 2,424,869 | 748,948 | 58,383 | 690,565 | ||||||||||||
Mid Cap Value Fund | 12,223,368 | 6,541,794 | 381,218 | 6,160,576 | ||||||||||||
Multi-Cap Market Neutral Fund | 109,292 | 19,362 | 3,714 | 15,648 | ||||||||||||
Value Advantage Fund | 8,611,044 | 2,674,714 | 231,607 | 2,443,107 | ||||||||||||
The difference between book and tax basis appreciation (depreciation) on investments is primarily attributed to investments in partnerships and wash sale loss deferrals.
| JUNE 30, 2017 | J.P. MORGAN MID CAP/MULTI-CAP FUNDS | 75 | ||||||
Table of Contents
NOTES TO FINANCIAL STATEMENTS
AS OF JUNE 30, 2017 (continued)
The tax character of distributions paid during the year ended June 30, 2017 was as follows (amounts in thousands):
| Ordinary Income* | Net Long-Term Capital Gains | Total Distribution Paid | ||||||||||
Mid Cap Equity Fund | $ | 9,004 | $ | 78,292 | $ | 87,296 | ||||||
Mid Cap Growth Fund | — | 1,276 | 1,276 | |||||||||
Mid Cap Value Fund | 143,520 | 984,030 | 1,127,550 | |||||||||
Value Advantage Fund | 134,075 | — | 134,075 | |||||||||
| * | Short-term gains are treated as ordinary income for income tax purposes. |
The tax character of distributions paid during the year ended June 30, 2016 was as follows (amounts in thousands):
| Ordinary Income* | Net Long-Term Capital Gains | Total Distributions Paid | ||||||||||
Growth Advantage Fund | $ | — | $ | 214,315 | $ | 214,315 | ||||||
Mid Cap Equity Fund | 27,480 | 130,086 | 157,566 | |||||||||
Mid Cap Growth Fund | 6,084 | 141,429 | 147,513 | |||||||||
Mid Cap Value Fund | 128,760 | 794,705 | 923,465 | |||||||||
Value Advantage Fund | 146,612 | 69,884 | 216,496 | |||||||||
| * | Short-term gains are treated as ordinary income for income tax purposes. |
As of June 30, 2017, the estimated components of net assets (excluding paid-in-capital) on a tax basis were as follows (amounts in thousands):
| Current Distributable Ordinary Income | Current Distributable Long-Term Capital Gain | Tax Basis Capital Loss Carryover | Unrealized Appreciation (Depreciation) | |||||||||||||
Growth Advantage Fund | $ | — | $ | 90,502 | $ | — | $ | 2,391,741 | ||||||||
Mid Cap Equity Fund | 26,762 | 68,968 | — | 785,114 | ||||||||||||
Mid Cap Growth Fund | — | 109,059 | — | 690,565 | ||||||||||||
Mid Cap Value Fund | 92,730 | 293,891 | (7,367 | ) | 6,160,576 | |||||||||||
Multi-Cap Market Neutral Fund | — | — | (1,694 | ) | 9,393 | |||||||||||
Value Advantage Fund | 57,092 | 73,163 | — | 2,443,107 | ||||||||||||
For the Funds, the cumulative timing differences primarily consist of post-October capital loss deferrals, late year ordinary loss deferrals, loss deferrals on unsettled short sales, investments in partnerships and wash sale loss deferrals.
Under the Regulated Investment Company Modernization Act of 2010 (“the “Act”), net capital losses recognized by the Funds after June 30, 2011 are carried forward indefinitely, and retain their character as short-term and/or long-term losses. Prior to the Act, net capital losses incurred by the Funds were carried forward for eight years and treated as short-term losses. The Act requires that post-enactment net capital losses be used before pre-enactment net capital losses.
At June 30, 2017, the following Fund had pre-enactment net capital loss carryforwards, expiring during the years indicated, which are available to offset future realized gains (amounts in thousands):
| 2018 | ||||
Mid Cap Value Fund | $ | 7,367 | * | |
| * | Amount includes capital loss carryforwards from business combinations, which are limited in future years under internal Revenue Code Sections 381-384. |
As of June 30, 2017, the following Fund had the following post-enactment net capital loss carryforwards (amounts in thousands):
| Capital Loss Carryforward Character | ||||||||
| Short-Term | Long-Term | |||||||
Multi-Cap Market Neutral Fund | $ | 1,694 | $ | — | ||||
| 76 | J.P. MORGAN MID CAP/MULTI-CAP FUNDS | JUNE 30, 2017 | ||||
Table of Contents
During the year ended June 30, 2017, the following Funds utilized net capital loss carryforwards as follows (amounts in thousands):
Mid Cap Value Fund | $ | 7,367 | ||
Multi-Cap Market Neutral Fund | 427 | |||
Value Advantage Fund | $ | 49,224 |
Late year ordinary losses incurred after December 31 as well as net capital losses incurred after October 31 and within the taxable year are deemed to arise on the first business day of the Funds’ next taxable year. For the year ended June 30, 2017, the following Funds deferred to July 1, 2017 late year ordinary losses and post-October capital losses of (amounts in thousands):
Late Year Ordinary
| Net Capital Loss | |||||||||||
| Short-Term | Long-Term | |||||||||||
Growth Advantage Fund | $ | 9,926 | $ | 6,162 | $ | — | ||||||
Mid Cap Growth Fund | 5,192 | — | — | |||||||||
Multi-Cap Market Neutral Fund | 163 | — | — | |||||||||
6. Borrowings
The Funds rely upon an exemptive order granted by the SEC (the “Order”) permitting the establishment and operation of an Interfund Lending Facility (the “Facility”). The Facility allows the Funds to directly lend and borrow money to or from any other fund relying upon the Order at rates beneficial to both the borrowing and lending funds. Advances under the Facility are taken primarily for temporary or emergency purposes, including the meeting of redemption requests that otherwise might require the untimely disposition of securities, and are subject to each Fund’s borrowing restrictions. The Interfund loan rate is determined, as specified in the Order, by averaging the current repurchase agreement rate and the current bank loan rate. The Order was granted to JPM II and may be relied upon by the Funds because the Funds and the series of JPM II are all investment companies in the same “group of investment companies” (as defined in Section 12(d)(1)(G) of the 1940 Act).
The Trusts and JPMCB have entered into a financing arrangement. Under this arrangement, JPMCB provides an unsecured, uncommitted credit facility in the aggregate amount of $100 million to certain of the J.P. Morgan Funds, including the Funds. Advances under the arrangement are taken primarily for temporary or emergency purposes, including the meeting of redemption requests that otherwise might require the untimely disposition of securities, and are subject to each Fund’s borrowing restrictions. Interest on borrowings is payable at a rate determined by JPMCB at the time of borrowing. This agreement has been extended until November 6, 2017.
The Funds had no borrowings outstanding from another fund or from the unsecured, uncommitted credit facility during the year ended June 30, 2017.
In addition, effective August 16, 2016, the Trust along with certain other trusts (“Borrowers”) entered into a joint syndicated senior unsecured revolving credit facility totaling $1.5 billion (“Credit Facility”) with various lenders and The Bank of New York Mellon, as administrative agent for the lenders. This Credit Facility provides a source of funds to the Borrowers for temporary and emergency purposes, including the meeting of redemption requests that otherwise might require the untimely disposition of securities. Under the terms of the Credit Facility, a borrowing fund must have a minimum of $25,000,000 in adjusted net asset value and not exceed certain adjusted net asset coverage ratios prior to and during the time in which any borrowings are outstanding. If a fund does not comply with the aforementioned requirements, the Fund must remediate within three business days with respect to the $25,000,000 minimum adjusted net asset value or within one business day with respect to certain asset coverage ratios or the administrative agent at the request of, or with the consent of, the lenders may terminate the Credit Facility and declare any outstanding borrowings to be due and payable immediately.
Interest associated with any borrowing under the Credit Facility is charged to the borrowing fund at a rate of interest equal to 1.00% plus the greater of the federal funds effective rate or one month LIBOR. The annual commitment fee to maintain the Credit Facility is 0.15% and is incurred on the unused portion of the Credit Facility and is allocated to all participating funds pro rata based on their respective net assets. Effective August 15, 2017, this agreement has been amended and restated for a term of 364 days, unless extended.
The Funds did not utilize the Credit Facility during the year ended June 30, 2017.
7. Redemptions in-Kind
During the year ended June 30, 2017, certain Class L shareholders sold their shares of Value Advantage Fund. The portfolio securities were delivered primarily by means of a redemption in-kind in exchange for shares of the Fund. Cash and portfolio securities were transferred as of the close of business on the date and at the market value listed below (amounts in thousands):
| March 17, 2017 | Value | Realized Gains (Losses) | Type | |||||||||
Class L | $ | 644,712 | * | $ | 273,526 | Redemption in-kind | ||||||
| * | This amount includes cash of approximately $21,734,000 associated with the redemption in-kind. |
| JUNE 30, 2017 | J.P. MORGAN MID CAP/MULTI-CAP FUNDS | 77 | ||||||
Table of Contents
NOTES TO FINANCIAL STATEMENTS
AS OF JUNE 30, 2017 (continued)
During the year ended June 30, 2016, certain Class I shareholders sold their shares of Mid Cap Growth Fund. The portfolio securities were delivered primarily by means of a redemption in-kind in exchange for shares of the Fund. Cash and portfolio securities were transferred as of the close of business on the date and at the market value listed below (amounts in thousands):
| November 6, 2015 | Value | Realized Gains (Losses) | Type | |||||||||
Class I | $ | 602,118 | * | $ | 203,177 | Redemption in-kind | ||||||
| * | This amount includes cash of approximately $25,788,000 associated with the redemption in-kind. |
8. Risks, Concentrations and Indemnifications
In the normal course of business, the Funds enter into contracts that contain a variety of representations which provide general indemnifications. Each Fund’s maximum exposure under these arrangements is unknown. The amount of exposure would depend on future claims that may be made against each Fund that have not yet occurred. However, based on experience, the Funds expect the risk of loss to be remote.
As of June 30, 2017, the J.P. Morgan Investor Funds and JPMorgan SmartRetirement Funds, which are affiliated funds of funds, owned in the aggregate, shares representing more than 10% of the net assets of the following Funds:
| J.P. Morgan Investor Funds | JPMorgan SmartRetirement Funds | |||||||
Growth Advantage Fund | n/a | 37.7 | % | |||||
Mid Cap Equity Fund | n/a | 49.9 | ||||||
Multi-Cap Market Neutral Fund | 88.4 | % | n/a | |||||
Value Advantage Fund | n/a | 23.3 | ||||||
As of June 30, 2017, the following Funds had omnibus accounts each owning more than 10% of the Fund’s outstanding shares as follows:
| Number of Non-affiliated Omnibus Accounts | % of the Fund | |||||||
Growth Advantage Fund | 3 | 10.7 | % | |||||
Mid Cap Equity Fund | 4 | 19.8 | ||||||
Mid Cap Value Fund | 3 | 20.5 | ||||||
Value Advantage Fund | 4 | 11.5 | ||||||
Significant shareholder transactions by these shareholders may impact the Funds’ performance.
As of June 30, 2017, the Multi-Cap Market Neutral Fund pledged a significant portion of its assets for securities sold short to Citigroup Global Markets, Inc., who also held 100% of the Multi-Cap Market Neutral Fund’s cash proceeds for securities sold short.
9. Investment Company Reporting Modernization
In October 2016, the U.S. Securities and Exchange Commission adopted new rules and forms, and amendments to certain current rules and forms, to modernize the reporting and disclosure of information by registered investment companies. In part, the final rules amend Regulation S-X and will require standardized, enhanced disclosures about derivatives in investment company financial statements, as well as other amendments. The amendments to Regulation S-X will apply to Funds’ fiscal year end on or after August 1, 2017. At this time, management is currently evaluating the impact of the Regulation S-X amendments on the Funds’ financial statements and related disclosures. The adoption will have no effect on the Funds’ net assets or results of operations.
| 78 | J.P. MORGAN MID CAP/MULTI-CAP FUNDS | JUNE 30, 2017 | ||||
Table of Contents
REPORT OF INDEPENDENT REGISTERED PUBLIC ACCOUNTING FIRM
To the Board of Trustees of JP Morgan Mutual Fund Investment Trust, JPMorgan Fleming Mutual Fund Group, Inc., JPMorgan Trust I and JPMorgan Trust II and the Shareholders of JPMorgan Growth Advantage Fund, JPMorgan Mid Cap Equity Fund, JPMorgan Mid Cap Growth Fund, JPMorgan Mid Cap Value Fund, JPMorgan Multi-Cap Market Neutral Fund and JPMorgan Value Advantage Fund
In our opinion, the accompanying statements of assets and liabilities, including the schedules of portfolio investments, and the related statements of operations and of changes in net assets and the financial highlights present fairly, in all material respects, the financial position of JPMorgan Mid Cap Equity Fund and JPMorgan Value Advantage Fund (each a separate series of JPMorgan Trust I), JPMorgan Mid Cap Growth Fund and JPMorgan Multi-Cap Market Neutral Fund (each a separate series of JPMorgan Trust II), JPMorgan Growth Advantage Fund (a separate series of JPMorgan Mutual Fund Investment Trust) and JPMorgan Mid Cap Value Fund (a separate series of JPMorgan Fleming Mutual Fund Group, Inc.) (hereafter collectively referred to as the “Funds”) as of June 30, 2017, the results of each of their operations for the year then ended, the changes in each of their net assets for each of the two years in the period then ended and the financial highlights for each of the periods indicated therein, in conformity with accounting principles generally accepted in the United States of America. These financial statements and financial highlights (hereafter referred to as “financial statements”) are the responsibility of the Funds’ management. Our responsibility is to express an opinion on these financial statements based on our audits. We conducted our audits of these financial statements in accordance with the standards of the Public Company Accounting Oversight Board (United States). Those standards require that we plan and perform the audit to obtain reasonable assurance about whether the financial statements are free of material misstatement. An audit includes examining, on a test basis, evidence supporting the amounts and disclosures in the financial statements, assessing the accounting principles used and significant estimates made by management, and evaluating the overall financial statement presentation. We believe that our audits, which included confirmation of securities as of June 30, 2017 by correspondence with the transfer agent, custodian and brokers, provide a reasonable basis for our opinions.
PricewaterhouseCoopers LLP
New York, New York
August 25, 2017
| JUNE 30, 2017 | J.P. MORGAN MID CAP/MULTI-CAP FUNDS | 79 | ||||||
Table of Contents
(Unaudited)
The Funds’ Statement of Additional Information includes additional information about the Funds’ Trustees and is available, without charge, upon request by calling 1-800-480-4111 or on the J.P. Morgan Funds’ website at www.jpmorganfunds.com.
Name (Year of Birth); Positions With the Funds (1) | Principal Occupations During Past 5 Years | Number of Portfolios in Fund Complex Overseen by Trustee (2) | Other Directorships Held Outside Fund Complex During Past 5 Years | |||
Independent Trustees | ||||||
| John F. Finn (1947); Trustee of Trusts since 2005; Trustee of heritage One Group Mutual Funds since 1998. | Chairman (1985-present), Chief Executive Officer, Gardner, Inc. (supply chain management company serving industrial and consumer markets) (1974-present). | 150 | Director, Greif, Inc. (GEF) (industrial package products and services) (2007-present); Trustee, Columbus Association for the Performing Arts (1988-present); Director, Cardinal Health, Inc. (CAH) (1994-2014). | |||
| Dr. Matthew Goldstein (1941); Chairman since 2013; Trustee of Trusts since 2005; Trustee of heritage J.P. Morgan Funds since 2003. | Chancellor Emeritus, City University of New York (2015-present); Professor, City University of New York (2013-present); Chancellor, City University of New York (1999-2013); President, Adelphi University (New York) (1998-1999). | 150 | Trustee, Museum of Jewish Heritage (2011-present); Trustee, National Museum of Mathematics (present); Chair, Association of College and University Administrators (present). | |||
| Dennis P. Harrington (1950); Trustee of Trusts since 2017. | Retired; Partner, Deloitte LLP (1984-2012). | 149 | None | |||
| Frankie D. Hughes (1952); Trustee of Trusts since 2008. | President, Ashland Hughes Properties (property management) (2014-present); President and Chief Investment Officer, Hughes Capital Management, Inc. (fixed income asset management) (1993-2014). | 150 | None | |||
Raymond Kanner (1953); Trustee of the Trusts since 2017. | Retired; Managing Director & Chief Investment Officer, IBM Retirement Funds (2007-2016). | 149 | Director, Emerging Markets Growth Fund (1997-2016); Acting Executive Director, 2016-17, Committee on Investment of Employee Benefit Assets (CIEBA), 2016-17; Advisory Board Member, Betterment for Business (2016-present) (robo advisor); Advisory Board Member, Blue Star Indexes (2013-present) (index creator); Member, Russell Index Client Advisory Board (2001-2015). | |||
| Peter C. Marshall (1942); Trustee of Trusts since 2005; Trustee of heritage One Group Mutual Funds since 1985. | Self-employed business consultant (2002-present). | 150 | None | |||
| Mary E. Martinez (1960); Trustee of Trusts since 2013. | Associate, Special Properties, a Christie’s International Real Estate Affiliate (2010-present); Managing Director, Bank of America (Asset Management) (2007-2008); Chief Operating Officer, U.S. Trust Asset Management, U.S. Trust Company (asset management) (2003-2007); President, Excelsior Funds (registered investment companies) (2004-2005). | 150 | None | |||
| Marilyn McCoy* (1948); Trustee of Trusts since 2005; Trustee of heritage One Group Mutual Funds since 1999. | Vice President of Administration and Planning, Northwestern University (1985-present). | 150 | None | |||
| 80 | J.P. MORGAN MID CAP/MULTI-CAP FUNDS | JUNE 30, 2017 | ||||
Table of Contents
Name (Year of Birth); Positions With the Funds (1) | Principal Occupations During Past 5 Years | Number of Portfolios in Fund Complex Overseen by Trustee (2) | Other Directorships Held Outside Fund Complex During Past 5 Years | |||
Independent Trustees (continued) | ||||||
| Mitchell M. Merin (1953); Trustee of Trusts since 2013. | Retired; President and Chief Operating Officer, Morgan Stanley Investment Management, Member Morgan Stanley & Co. Management Committee (registered investment adviser) (1985-2005). | 150 | Director, Sun Life Financial (SLF) (2007-2013) (financial services and insurance). | |||
| Dr. Robert A. Oden, Jr. (1946); Trustee of Trusts since 2005; Trustee of heritage One Group Mutual Funds since 1997. | Retired; President, Carleton College (2002-2010); President, Kenyon College (1995-2002). | 150 | Chairman, Dartmouth-Hitchcock Medical Center (2011-present); Trustee, American Schools of Oriental Research (2011-present); Trustee, American University in Cairo (1999-2014); Trustee, American Museum of Fly Fishing (2013-present). | |||
| Marian U. Pardo** (1946); Trustee of Trusts since 2013. | Managing Director and Founder, Virtual Capital Management LLC (Investment Consulting) (2007-present); Managing Director, Credit Suisse Asset Management (portfolio manager) (2003-2006). | 150 | Member, Board of Governors, Columbus Citizens Foundation (not-for-profit supporting philanthropic and cultural programs) (2006-present). | |||
| Frederick W. Ruebeck (1939); Trustee of Trusts since 2005; Trustee of heritage One Group Mutual Funds since 1994. | Consultant (2000-present); Advisor, JP Greene & Associates, LLC (broker-dealer) (2000-2009); Chief Investment Officer, Wabash College (2004-2015); Director of Investments, Eli Lilly and Company (pharmaceuticals) (1988-1999). | 150 | Trustee, Wabash College (2000-present) | |||
| James J. Schonbachler (1943); Trustee of Trusts since 2005; Trustee of heritage J.P. Morgan Funds since 2001. | Retired; Managing Director of Bankers Trust Company (financial services) (1968-1998). | 150 | None | |||
| (1) | The Trustees serve for an indefinite term, subject to the Trusts’ current retirement policy, which is age 78 for all Trustees. |
| (2) | A Fund Complex means two or more registered investment companies that hold themselves out to investors as related companies for purposes of investment and investor services or have a common investment adviser or have an investment adviser that is an affiliated person of the investment adviser of any of the other registered investment companies. The J.P. Morgan Funds Complex for which the Board of Trustees serves currently includes twelve registered investment companies (150 funds). |
| * | Two members of the Board of Trustees of Northwestern University are executive officers of registered investment advisers (not affiliated with JPMorgan) that are under common control with sub-advisers to certain J.P. Morgan Funds. |
| ** | In connection with prior employment with JPMorgan Chase, Ms. Pardo was the recipient of non-qualified pension plan payments from JPMorgan Chase in the amount of approximately $2,055 per month, which she irrevocably waived effective January 1, 2013, and deferred compensation payments from JPMorgan Chase in the amount of approximately $7,294 per year, which ended in January 2013. In addition, Ms. Pardo receives payments from a fully-funded qualified plan, which is not an obligation of JPMorgan Chase. |
The contact address for each of the Trustees is 270 Park Avenue, New York, NY 10017.
| JUNE 30, 2017 | J.P. MORGAN MID CAP/MULTI-CAP FUNDS | 81 | ||||||
Table of Contents
(Unaudited)
Name (Year of Birth), Positions Held with the Trusts (Since) | Principal Occupations During Past 5 Years | |
| Brian S. Shlissel (1964), President and Principal Executive Officer (2016) | Managing Director and Chief Administrative Officer for J.P. Morgan pooled vehicles, J.P. Morgan Investment Management Inc. (formerly JPMorgan Funds Management, Inc.) (2014 – present); Managing Director and Head of Mutual Fund Services, Allianz Global Investors; President and Chief Executive Officer, Allianz Global Investors Mutual Funds and PIMCO Closed-End Funds (1999-2014) | |
| Laura M. Del Prato (1964), Treasurer and Principal Financial Officer (2014)* | Managing Director, J.P. Morgan Investment Management Inc. (formerly JPMorgan Funds Management, Inc.) since 2014; Partner, Cohen Fund Audit Services, Ltd. (2012-2013); Partner (2004-2012) and various other titles (1990-2004) at KPMG, LLP. | |
| Frank J. Nasta (1964), Secretary (2008) | Managing Director and Associate General Counsel, JPMorgan Chase since 2008. | |
| Stephen M. Ungerman (1953), Chief Compliance Officer (2005) | Managing Director, JPMorgan Chase & Co.; Mr. Ungerman has been with JPMorgan Chase & Co. since 2000. | |
Elizabeth A. Davin (1964), Assistant Secretary (2005)* | Executive Director and Assistant General Counsel, JPMorgan Chase since February 2012; formerly Vice President and Assistant General Counsel, JPMorgan Chase from 2005 to February 2012; Senior Counsel, JPMorgan Chase (formerly Bank One Corporation) from 2004 to 2005. | |
| Jessica K. Ditullio (1962), Assistant Secretary (2005)* | Executive Director and Assistant General Counsel, JPMorgan Chase. Ms. Ditullio has been with JPMorgan Chase (formerly Bank One Corporation) since 1990. | |
| John T. Fitzgerald (1975), Assistant Secretary (2008) | Executive Director and Assistant General Counsel, JPMorgan Chase. Mr. Fitzgerald has been with JPMorgan Chase since 2005. | |
| Carmine Lekstutis (1980), Assistant Secretary (2011) | Executive Director and Assistant General Counsel, JPMorgan Chase since February 2015; formerly Vice President and Assistant General Counsel, JPMorgan Chase from 2011 to February 2015. | |
| Gregory S. Samuels (1980), Assistant Secretary (2010) | Executive Director and Assistant General Counsel, JPMorgan Chase since 2014; formerly Vice President and Assistant General Counsel, JPMorgan Chase since 2010. | |
| Pamela L. Woodley (1971), Assistant Secretary (2012)** | Vice President and Assistant General Counsel, JPMorgan Chase since November 2004. | |
Zachary E. Vonnegut-Gabovitch (1986) Assistant Secretary (2017) | Vice President and Assistant General Counsel, JPMorgan Chase since September 2016; Associate, Morgan, Lewis & Bockius (law firm) from 2012 to 2016. | |
Michael M. D’Ambrosio (1969), Assistant Treasurer (2012) | Managing Director, J.P. Morgan Investment Management Inc. (formerly JPMorgan Funds Management, Inc.) since May 2014; formerly Executive Director, JPMorgan Funds Management, Inc. from 2012 to May 2014; prior to joining JPMorgan Chase, Mr. D’Ambrosio was a Tax Director at PricewaterhouseCoopers LLP since 2006. | |
Lauren A. Paino (1973), Assistant Treasurer (2014)** | Executive Director, J.P. Morgan Investment Management Inc. (formerly JPMorgan Funds Management, Inc.) since August 2013; formerly Director, Credit Suisse Asset Management from 2000-2013. | |
| Joseph Parascondola (1963), Assistant Treasurer (2011)** | Vice President, J.P. Morgan Investment Management Inc. (formerly JPMorgan Funds Management, Inc.) since August 2006. | |
| Matthew J. Plastina (1970), Assistant Treasurer (2011)** | Executive Director, J.P. Morgan Investment Management Inc. (formerly JPMorgan Funds Management, Inc.) since February 2016; Vice President, JPMorgan Funds Management, Inc. from 2010 to January 2016. | |
Gillian I. Sands (1969), Assistant Treasurer (2012)** | Vice President, J.P. Morgan Investment Management Inc. (formerly JPMorgan Funds Management, Inc.) since September 2012; Assistant Treasurer, Wells Fargo Funds Management (2007-2009). | |
The contact address for each of the officers, unless otherwise noted, is 270 Park Avenue, New York, NY 10017.
| * | The contact address for the officer is 1111 Polaris Parkway, Columbus, OH 43240. |
| ** | The contact address for the officer is 4 New York Plaza, New York, NY 10004. |
| 82 | J.P. MORGAN MID CAP/MULTI-CAP FUNDS | JUNE 30, 2017 | ||||
Table of Contents
SCHEDULE OF SHAREHOLDER EXPENSES
(Unaudited)
Hypothetical $1,000 Investment
As a shareholder of the Funds, you incur two types of costs: (1) transaction costs, including sales charges (loads) on purchase payments and (2) ongoing costs, including investment advisory fees, administration fees, distribution fees and other Fund expenses. The examples below are intended to help you understand your ongoing costs (in dollars) of investing in the Funds and to compare these ongoing costs with the ongoing costs of investing in other mutual funds. The examples assume that you had a $1,000 investment in each Class at the beginning of the reporting period, January 1, 2017, and continued to hold your shares at the end of the reporting period, June 30, 2017.
Actual Expenses
For each Class of each Fund in the table below, the first line provides information about actual account values and actual expenses. You may use the information in this line, together with the amount you invested, to estimate the expenses that you paid over the period. Simply divide your account value by $1,000 (for example, an $8,600 account value divided by $1,000 = 8.6), then multiply the result by the number in the first line of each Class under the heading entitled “Expenses Paid During the Period” to estimate the expenses you paid on your account during this period.
Hypothetical Example for Comparison Purposes
The second line of each Class in the table below provides information about hypothetical account values and hypothetical expenses based on the Class’ actual expense ratio and an assumed rate of return of 5% per year before expenses, which is not the Class’ actual return. The hypothetical account values and expenses may not be used to estimate the actual ending account balance or expenses you paid for the period. You may use this information to compare the ongoing costs of investing in the Class of the Fund and other funds. To do so, compare this 5% hypothetical example with the 5% hypothetical examples that appear in the shareholder reports of the other funds. Please note that the expenses shown in the table are meant to highlight your ongoing costs only and do not reflect any transaction costs, such as sales charges (loads) or redemption fees. Therefore, the second line for each Class in the table is useful in comparing ongoing costs only, and will not help you determine the relative total costs of owning different funds. In addition, if these transaction costs were included, your costs would have been higher. The examples also assume all dividends and distributions have been reinvested.
Beginning Account Value January 1, 2017 | Ending Account Value June 30, 2017 | Expenses Paid During | Annualized Expense Ratio | |||||||||||||
Growth Advantage Fund | ||||||||||||||||
Class A | ||||||||||||||||
Actual* | $ | 1,000.00 | $ | 1,183.30 | $ | 6.66 | 1.23 | % | ||||||||
Hypothetical* | 1,000.00 | 1,018.70 | 6.16 | 1.23 | ||||||||||||
Class C | ||||||||||||||||
Actual* | 1,000.00 | 1,180.10 | 9.35 | 1.73 | ||||||||||||
Hypothetical* | 1,000.00 | 1,016.22 | 8.65 | 1.73 | ||||||||||||
Class I (formerly Select Class) | ||||||||||||||||
Actual* | 1,000.00 | 1,185.80 | 4.01 | 0.74 | ||||||||||||
Hypothetical* | 1,000.00 | 1,021.12 | 3.71 | 0.74 | ||||||||||||
Class R3 | ||||||||||||||||
Actual** | 1,000.00 | 1,184.00 | 5.31 | 0.98 | ||||||||||||
Hypothetical* | 1,000.00 | 1,019.93 | 4.91 | 0.98 | ||||||||||||
Class R4 | ||||||||||||||||
Actual** | 1,000.00 | 1,006.20 | 1.03 | 1.25 | ||||||||||||
Hypothetical* | 1,000.00 | 1,018.60 | 6.26 | 1.25 | ||||||||||||
Class R5 | ||||||||||||||||
Actual* | 1,000.00 | 1,006.00 | 0.82 | 0.99 | ||||||||||||
Hypothetical* | 1,000.00 | 1,019.89 | 4.96 | 0.99 | ||||||||||||
Class R6 | ||||||||||||||||
Actual* | 1,000.00 | 1,185.20 | 4.55 | 0.84 | ||||||||||||
Hypothetical* | 1,000.00 | 1,020.63 | 4.21 | 0.84 | ||||||||||||
Mid Cap Equity Fund | ||||||||||||||||
Class A | ||||||||||||||||
Actual* | 1,000.00 | 1,106.50 | 6.48 | 1.24 | ||||||||||||
Hypothetical* | 1,000.00 | 1,018.65 | 6.21 | 1.24 | ||||||||||||
Class C | ||||||||||||||||
Actual* | 1,000.00 | 1,103.70 | 9.08 | 1.74 | ||||||||||||
Hypothetical* | 1,000.00 | 1,016.17 | 8.70 | 1.74 | ||||||||||||
| JUNE 30, 2017 | J.P. MORGAN MID CAP/MULTI-CAP FUNDS | 83 | ||||||
Table of Contents
SCHEDULE OF SHAREHOLDER EXPENSES
(Unaudited) (continued)
Hypothetical $1,000 Investment
Beginning Account Value January 1, 2017 | Ending Account Value June 30, 2017 | Expenses Paid During | Annualized Expense Ratio | |||||||||||||
Mid Cap Equity Fund (continued) | ||||||||||||||||
Class I (formerly Select Class) | ||||||||||||||||
Actual* | $ | 1,000.00 | $ | 1,108.50 | $ | 4.65 | 0.89 | % | ||||||||
Hypothetical* | 1,000.00 | 1,020.38 | 4.46 | 0.89 | ||||||||||||
Class R2 | ||||||||||||||||
Actual* | 1,000.00 | 1,105.20 | 7.78 | 1.49 | ||||||||||||
Hypothetical* | 1,000.00 | 1,017.41 | 7.45 | 1.49 | ||||||||||||
Class R5 | ||||||||||||||||
Actual* | 1,000.00 | 1,108.90 | 4.13 | 0.79 | ||||||||||||
Hypothetical* | 1,000.00 | 1,020.88 | 3.96 | 0.79 | ||||||||||||
Class R6 | ||||||||||||||||
Actual* | 1,000.00 | 1,109.30 | 3.87 | 0.74 | ||||||||||||
Hypothetical* | 1,000.00 | 1,021.12 | 3.71 | 0.74 | ||||||||||||
Mid Cap Growth Fund | ||||||||||||||||
Class A | ||||||||||||||||
Actual* | 1,000.00 | 1,154.20 | 6.57 | 1.23 | ||||||||||||
Hypothetical* | 1,000.00 | 1,018.70 | 6.16 | 1.23 | ||||||||||||
Class C | ||||||||||||||||
Actual* | 1,000.00 | 1,151.10 | 9.23 | 1.73 | ||||||||||||
Hypothetical* | 1,000.00 | 1,016.22 | 8.65 | 1.73 | ||||||||||||
Class I (formerly Select Class) | ||||||||||||||||
Actual* | 1,000.00 | 1,156.10 | 4.92 | 0.92 | ||||||||||||
Hypothetical* | 1,000.00 | 1,020.23 | 4.61 | 0.92 | ||||||||||||
Class R2 | ||||||||||||||||
Actual* | 1,000.00 | 1,153.00 | 7.69 | 1.44 | ||||||||||||
Hypothetical* | 1,000.00 | 1,017.65 | 7.20 | 1.44 | ||||||||||||
Class R3 | ||||||||||||||||
Actual* | 1,000.00 | 1,154.00 | 6.57 | 1.23 | ||||||||||||
Hypothetical* | 1,000.00 | 1,018.70 | 6.16 | 1.23 | ||||||||||||
Class R4 | ||||||||||||||||
Actual* | 1,000.00 | 1,155.70 | 5.24 | 0.98 | ||||||||||||
Hypothetical* | 1,000.00 | 1,019.93 | 4.91 | 0.98 | ||||||||||||
Class R5 | ||||||||||||||||
Actual* | 1,000.00 | 1,156.80 | 4.17 | 0.78 | ||||||||||||
Hypothetical* | 1,000.00 | 1,020.93 | 3.91 | 0.78 | ||||||||||||
Class R6 | ||||||||||||||||
Actual* | 1,000.00 | 1,157.40 | 3.90 | 0.73 | ||||||||||||
Hypothetical* | 1,000.00 | 1,021.17 | 3.66 | 0.73 | ||||||||||||
Mid Cap Value Fund | ||||||||||||||||
Class A | ||||||||||||||||
Actual* | 1,000.00 | 1,060.60 | 6.28 | 1.23 | ||||||||||||
Hypothetical* | 1,000.00 | 1,018.70 | 6.16 | 1.23 | ||||||||||||
Class C | ||||||||||||||||
Actual* | 1,000.00 | 1,058.20 | 8.88 | 1.74 | ||||||||||||
Hypothetical* | 1,000.00 | 1,016.17 | 8.70 | 1.74 | ||||||||||||
Class I (formerly Select Class) | ||||||||||||||||
Actual* | 1,000.00 | 1,062.20 | 5.01 | 0.98 | ||||||||||||
Hypothetical* | 1,000.00 | 1,019.93 | 4.91 | 0.98 | ||||||||||||
Class L (formerly Institutional Class) | ||||||||||||||||
Actual* | 1,000.00 | 1,063.20 | 3.79 | 0.74 | ||||||||||||
Hypothetical* | 1,000.00 | 1,021.12 | 3.71 | 0.74 | ||||||||||||
Class R2 | ||||||||||||||||
Actual* | 1,000.00 | 1,059.20 | 7.61 | 1.49 | ||||||||||||
Hypothetical* | 1,000.00 | 1,017.41 | 7.45 | 1.49 | ||||||||||||
| 84 | J.P. MORGAN MID CAP/MULTI-CAP FUNDS | JUNE 30, 2017 | ||||
Table of Contents
Beginning Account Value January 1, 2017 | Ending Account Value June 30, 2017 | Expenses Paid During | Annualized Expense Ratio | |||||||||||||
Mid Cap Value Fund (continued) | ||||||||||||||||
Class R3 | ||||||||||||||||
Actual* | $ | 1,000.00 | $ | 1,061.10 | $ | 6.34 | 1.24 | % | ||||||||
Hypothetical* | 1,000.00 | 1,018.65 | 6.21 | 1.24 | ||||||||||||
Class R4 | ||||||||||||||||
Actual* | 1,000.00 | 1,062.10 | 5.06 | 0.99 | ||||||||||||
Hypothetical* | 1,000.00 | 1,019.89 | 4.96 | 0.99 | ||||||||||||
Class R5 | ||||||||||||||||
Actual* | 1,000.00 | 1,062.90 | 4.30 | 0.84 | ||||||||||||
Hypothetical* | 1,000.00 | 1,020.63 | 4.21 | 0.84 | ||||||||||||
Class R6 | ||||||||||||||||
Actual* | 1,000.00 | 1,063.50 | 3.79 | 0.74 | ||||||||||||
Hypothetical* | 1,000.00 | 1,021.12 | 3.71 | 0.74 | ||||||||||||
Multi-Cap Market Neutral Fund | ||||||||||||||||
Class A | ||||||||||||||||
Actual* | 1,000.00 | 992.00 | 11.90 | 2.41 | ||||||||||||
Hypothetical* | 1,000.00 | 1,012.84 | 12.03 | 2.41 | ||||||||||||
Class C | ||||||||||||||||
Actual* | 1,000.00 | 989.40 | 14.30 | 2.90 | ||||||||||||
Hypothetical* | 1,000.00 | 1,010.41 | 14.46 | 2.90 | ||||||||||||
Class I (formerly Select Class) | ||||||||||||||||
Actual* | 1,000.00 | 993.20 | 10.53 | 2.13 | ||||||||||||
Hypothetical* | 1,000.00 | 1,014.23 | 10.64 | 2.13 | ||||||||||||
Value Advantage Fund | ||||||||||||||||
Class A | ||||||||||||||||
Actual* | 1,000.00 | 1,040.80 | 6.27 | 1.24 | ||||||||||||
Hypothetical* | 1,000.00 | 1,018.65 | 6.21 | 1.24 | ||||||||||||
Class C | ||||||||||||||||
Actual* | 1,000.00 | 1,038.20 | 8.79 | 1.74 | ||||||||||||
Hypothetical* | 1,000.00 | 1,016.17 | 8.70 | 1.74 | ||||||||||||
Class I (formerly Select Class) | ||||||||||||||||
Actual* | 1,000.00 | 1,042.20 | 4.96 | 0.98 | ||||||||||||
Hypothetical* | 1,000.00 | 1,019.93 | 4.91 | 0.98 | ||||||||||||
Class L (formerly Institutional Class) | ||||||||||||||||
Actual* | 1,000.00 | 1,043.40 | 3.80 | 0.75 | ||||||||||||
Hypothetical* | 1,000.00 | 1,021.08 | 3.76 | 0.75 | ||||||||||||
Class R3 | ||||||||||||||||
Actual* | 1,000.00 | 1,040.70 | 6.27 | 1.24 | ||||||||||||
Hypothetical* | 1,000.00 | 1,018.65 | 6.21 | 1.24 | ||||||||||||
Class R4 | ||||||||||||||||
Actual* | 1,000.00 | 1,042.20 | 5.06 | 1.00 | ||||||||||||
Hypothetical* | 1,000.00 | 1,019.84 | 5.01 | 1.00 | ||||||||||||
Class R5 | ||||||||||||||||
Actual* | 1,000.00 | 1,042.80 | 4.25 | 0.84 | ||||||||||||
Hypothetical* | 1,000.00 | 1,020.63 | 4.21 | 0.84 | ||||||||||||
Class R6 | ||||||||||||||||
Actual* | 1,000.00 | 1,043.20 | 3.75 | 0.74 | ||||||||||||
Hypothetical* | 1,000.00 | 1,021.12 | 3.71 | 0.74 | ||||||||||||
| * | Expenses are equal to each Class’ respective annualized expense ratio, multiplied by the average account value over the period, multiplied by 181/365 (to reflect the one-half year period). |
| ** | Expenses are equal to each Class’ respective annualized expense ratio, multiplied by the average account value over the period, multiplied by 30/365 (to reflect the actual period.) Commencement of operations was May 31, 2017. |
| JUNE 30, 2017 | J.P. MORGAN MID CAP/MULTI-CAP FUNDS | 85 | ||||||
Table of Contents
(Unaudited)
Certain tax information for the J.P. Morgan Funds is required to be provided to shareholders based upon the Funds’ income and distributions for the taxable year ended June 30, 2017. The information and distributions reported in this letter may differ from the information and taxable distributions reported to the shareholders for the calendar year ending December 31, 2017. The information necessary to complete your income tax returns for the calendar year ending December 31, 2017 will be provided under separate cover.
Dividends Received Deductions (DRD)
Each fund listed below had the following percentage, or maximum allowable percentage, of ordinary income distributions eligible for the 70% dividends received deductions for corporate shareholders for the fiscal year ended June 30, 2017:
| Dividends Received Deduction | ||||
Mid Cap Equity Fund | 93.74 | % | ||
Mid Cap Value Fund | 100.00 | |||
Value Advantage Fund | 100.00 | |||
Long-Term Capital Gain
Each fund listed below distributed the following amount, or maximum allowable amount, of long-term capital gain dividends for the fiscal year ended June 30, 2017 (amounts in thousands):
| Long-Term Capital Gain Distribution | ||||
Mid Cap Equity Fund | $ | 78,292 | ||
Mid Cap Growth Fund | 1,276 | |||
Mid Cap Value Fund | 984,030 | |||
Qualified Dividend Income (QDI)
Each fund listed below had the following amount, or maximum allowable amount, of ordinary income distributions treated as qualified dividends for the fiscal year ended June 30, 2017 (amounts in thousands):
| Qualified Dividend Income | ||||
Mid Cap Equity Fund | $ | 9,004 | ||
Mid Cap Value Fund | 143,519 | |||
Value Advantage Fund | 134,075 | |||
| JUNE 30, 2017 | J.P. MORGAN MID CAP/MULTI-CAP FUNDS | 86 | ||||||
Table of Contents

Rev. January 2011
| FACTS | WHAT DOES J.P. MORGAN FUNDS DO WITH YOUR PERSONAL INFORMATION? |
| Why? | Financial companies choose how they share your personal information. Federal law gives consumers the right to limit some but not all sharing. Federal law also requires us to tell you how we collect, share, and protect your personal information. Please read this notice carefully to understand what we do. |
| What? | The types of personal information we collect and share depend on the product or service you have with us. This information can include:
◾ Social Security number and account balances
◾ transaction history and account transactions
◾ checking account information and wire transfer instructions
When you are no longer our customer, we continue to share your information as described in this notice. |
| How? | All financial companies need to share customers’ personal information to run their everyday business. In the section below, we list the reasons financial companies can share their customers’ personal information; the reasons J.P. Morgan Funds chooses to share; and whether you can limit this sharing. |
| Reasons we can share your personal information | Does J.P. Morgan Funds share? | Can you limit this sharing? | ||
For our everyday business purposes — such as to process your transactions, maintain your account(s), respond to court orders and legal investigations, or report to credit bureaus | Yes | No | ||
For marketing purposes — to offer our products and services to you | Yes | No | ||
| For joint marketing with other financial companies | No | We don’t share | ||
For our affiliates’ everyday business purposes — information about your transactions and experiences | No | We don’t share | ||
For our affiliates’ everyday business purposes — information about your creditworthiness | No | We don’t share | ||
| For nonaffiliates to market to you | No | We don’t share |
| Questions? | Call 1-800-480-4111 or go to www.jpmorganfunds.com | |

Table of Contents
Page 2 |
| Who we are | ||
| Who is providing this notice? | J.P. Morgan Funds | |
| What we do | ||
| How does J.P. Morgan Funds protect my personal information? | To protect your personal information from unauthorized access and use, we use security measures that comply with federal law. These measures include computer safeguards and secured files and buildings. We authorize our employees to access your information only when they need it to do their work and we require companies that work for us to protect your information. | |
How does J.P. Morgan Funds collect my personal information? | We collect your personal information, for example, when you:
◾ open an account or provide contact information
◾ give us your account information or pay us by check
◾ make a wire transfer
We also collect your personal information from others, such as credit bureaus, affiliates and other companies. | |
| Why can’t I limit all sharing? | Federal law gives you the right to limit only
◾ sharing for affiliates’ everyday business purposes – information about your creditworthiness
◾ affiliates from using your information to market to you
◾ sharing for nonaffiliates to market to you
State laws and individual companies may give you additional rights to limit sharing. | |
| Definitions | ||
| Affiliates | Companies related by common ownership or control. They can be financial and nonfinancial companies.
◾ J.P. Morgan Funds does not share with our affiliates. | |
| Nonaffiliates | Companies not related by common ownership or control. They can be financial and nonfinancial companies.
◾ J.P. Morgan Funds does not share with nonaffiliates so they can market to you. | |
| Joint Marketing | A formal agreement between nonaffiliated financial companies that together market financial products or services to you.
◾ J.P. Morgan Funds doesn’t jointly market. | |
Table of Contents
J.P. Morgan Funds are distributed by JPMorgan Distribution Services, Inc., which is an affiliate of JPMorgan Chase & Co. Affiliates of JPMorgan Chase & Co. receive fees for providing various services to the funds.
Contact JPMorgan Distribution Services, Inc. at 1-800-480-4111 for a fund prospectus. You can also visit us at www.jpmorganfunds.com. Investors should carefully consider the investment objectives and risk as well as charges and expenses of the mutual fund before investing. The prospectus contains this and other information about the mutual fund. Read the prospectus carefully before investing.
Investors may obtain information about the Securities Investor Protection Corporation (SIPC), including the SIPC brochure by visiting www.sipc.org or by calling SIPC at 202-371-8300.
Each Fund files a complete schedule of its fund holdings for the first and third quarters of its fiscal year with the SEC on Form N-Q. The Funds’ Forms N-Q are available on the SEC’s website at http://www.sec.gov and may be reviewed and copied at the SEC’s Public Reference Room in Washington, DC. Information on the operation of the SEC’s Public Reference Room may be obtained by calling 1-800-SEC-0330. Shareholders may request the Form N-Q without charge by calling 1-800-480-4111 or by visiting the J.P. Morgan Funds’ website at www.jpmorganfunds.com.
A description of each Fund’s policies and procedures with respect to the disclosure of each Fund’s holdings is available in the prospectus and Statement of Additional Information.
A copy of proxy policies and procedures is available without charge upon request by calling 1-800-480-4111 and on the Funds’ website at www.jpmorganfunds.com. A description of such policies and procedures is on the SEC’s website at www.sec.gov. The Trustees have delegated the authority to vote proxies for securities owned by the Funds to the Adviser. A copy of the Funds’ voting record for the most recent 12-month period ended June 30 is available on the SEC’s website at www.sec.gov or at the Funds’ website at www.jpmorganfunds.com no later than August 31 of each year. The Funds’ proxy voting record will include, among other things, a brief description of the matter voted on for each fund security, and will state how each vote was cast, for example, for or against the proposal.
Table of Contents

J.P. Morgan Asset Management is the marketing name for the asset management businesses of JPMorgan Chase & Co. Those businesses include, but are not limited to, J.P. Morgan Investment Management Inc., Security Capital Research & Management Incorporated and J.P. Morgan Alternative Asset Management, Inc.
| © JPMorgan Chase & Co., 2017. All rights reserved. June 2017. | AN-MC-617 |
Table of Contents
Annual Report
J.P. Morgan Large Cap Funds
June 30, 2017
JPMorgan Disciplined Equity Fund
JPMorgan Dynamic Growth Fund
JPMorgan Equity Focus Fund
JPMorgan Equity Income Fund
JPMorgan Growth and Income Fund
JPMorgan Hedged Equity Fund
JPMorgan Large Cap Growth Fund
JPMorgan Large Cap Value Fund
JPMorgan U.S. Equity Fund

Table of Contents
| CEO’s Letter | 1 | |||
| Market Overview | 2 | |||
Fund Commentaries: | ||||
| 3 | ||||
| 5 | ||||
| 7 | ||||
| 9 | ||||
| 11 | ||||
| 13 | ||||
| 15 | ||||
| 17 | ||||
| 19 | ||||
| Schedules of Portfolio Investments | 21 | |||
| Financial Statements | 50 | |||
| Financial Highlights | 74 | |||
| Notes to Financial Statements | 92 | |||
| Report of Independent Registered Public Accounting Firm | 105 | |||
| Trustees | 106 | |||
| Officers | 108 | |||
| Schedule of Shareholder Expenses | 109 | |||
| Tax Letter | 113 | |||
| Privacy Policy — Located at the back of this Annual Report | ||||
Investments in a Fund are not deposits or obligations of, or guaranteed or endorsed by, any bank and are not insured or guaranteed by the FDIC, the Federal Reserve Board or any other government agency. You could lose money if you sell when a Fund’s share price is lower than when you invested.
Past performance is no guarantee of future performance. The general market views expressed in this report are opinions based on market and other conditions through the end of the reporting period and are subject to change without notice. These views are not intended to predict the future performance of a Fund or the securities markets. References to specific securities and their issuers are for illustrative purposes only and are not intended to be, and should not be interpreted as, recommendations to purchase or sell such securities. Such views are not meant as investment advice and may not be relied on as an indication of trading intent on behalf of any Fund.
Prospective investors should refer to the Funds’ prospectuses for a discussion of the Funds’ investment objectives, strategies and risks. Call J.P. Morgan Funds Service Center at 1-800-480-4111 for a prospectus containing more complete information about a Fund, including management fees and other expenses. Please read it carefully before investing.
Table of Contents
August 4, 2017 (Unaudited)
Dear Shareholder,
The current U.S. economic expansion entered its eighth year in 2017 and growth in developed and emerging market economies grew more synchronized even as U.S. growth showed some signs of easing. Global financial markets generally benefitted from steady economic growth amid an environment of low inflation, low volatility and rising corporate profits.
 |
“In the U.S., the continued economic expansion, muted inflation, corporate earnings growth and historically low volatility in financial markets helped to drive key equity market indexes to multiple record closing highs throughout the past twelve months.” |
While economic growth in the U.S. and China largely drove the global recovery throughout 2016, by June 2017 the world’s other leading economies had picked up sufficiently enough for the Organization for Economic Co-operation and Development to forecast global growth at 3.5% in 2017 and 3.6% in 2018.
U.S. gross domestic product (GDP) growth slowed to 1.2% in the first quarter of 2017 from 2.5% and 3.5% growth in the fourth quarter and third quarters of 2016, respectively. Meanwhile, the U.S. unemployment rate continued its downward trend throughout the past twelve months, dropping to 4.4% in June 2017 from 4.9% one year earlier. In response to these numbers, along with nascent signs of price inflation, the U.S. Federal Reserve (the “Fed”) raised interest rates in December 2016 and again in June 2017 and signaled it would raise rates once more before the end of the year. Further, Fed Chairwoman Janet Yellen indicated she was prepared to begin partially unwinding the central bank’s $4.5 trillion balance sheet in assets purchased through its quantitative easing program. An increase in consumer spending helped second-quarter 2017 GDP climb by 2.6% from a year earlier.
Notably, by mid-2017 domestic price inflation had dropped below the Fed’s target of 2% growth and wage growth was below many economists’ expectations, the latter despite an environment of essentially full employment for U.S. workers. These trends — and the Fed’s acknowledgment of them — provided some near-term uncertainty about the central bank’s commitment to tightening monetary policy.
Throughout the twelve months ended June 30, 2017, global oil prices remained a key focal point for policy makers, economists and investors. Global crude prices reached 15-month highs in October 2016 and received further support from the Organization of Petroleum Exporting Countries’ December 2016 decision to curb production. However, continued oversupply of crude and natural gas, partly due to continued U.S. production, pushed the price of a barrel of benchmark West Texas Intermediate crude oil down to $46 by the end of June 2017.
Meanwhile, the leading economies of Europe continued to strengthen from what had been an anemic expansion. Annualized GDP for the 19 core euro area nations rose 1.9% in the first quarter of 2017 and 2.1% in the second quarter. The June 2017 aggregate unemployment rate for those nations fell to 9.1%, its lowest level since March 2009. Also, in separate elections in 2017, voters in the Netherlands and France largely rejected populist campaigns espousing policies to limit free trade and immigration. The election results provided another boost to global equity prices.
In the U.S., the continued economic expansion, muted inflation, corporate earnings growth and historically low volatility in financial markets helped to drive key equity market indexes to multiple record closing highs throughout the past twelve months. U.S. investors appeared to shrug off intermittent political and policy dramas emanating from Washington, D.C. and extended the run-up in U.S. equity prices into its eighth consecutive year — one of the longest on record.
Over the twelve month period, U.S. and foreign markets largely rewarded those who remained fully invested in financial markets and we believe the fundamental virtues of patience and diversification remain essential to prudent investment strategy.
We look forward to managing your investment needs for years to come. Should you have any questions, please visit www.jpmorganfunds.com or contact the J.P. Morgan Funds Service Center at 1-800-480-4111.
Sincerely yours,

George C.W. Gatch
CEO, Global Funds Management & Institutional,
J.P. Morgan Asset Management
| JUNE 30, 2017 | J.P. MORGAN LARGE CAP FUNDS | 1 | ||||||
Table of Contents
J.P. Morgan Large Cap Funds
TWELVE MONTHS ENDED JUNE 30, 2017 (Unaudited)
Overall, U.S. equity markets provided positive returns and key stock market indexes reached multiple record highs throughout the twelve month reporting period. Steady global economic growth, continued low inflation and strong corporate earnings all served to support equity prices, both in the U.S. and elsewhere.
While U.S. equity prices rose throughout most of 2016, they experienced a sustained rally following the November 8, 2016 election amid investor expectations for increased infrastructure spending and tax cuts under the incoming Trump administration and Republican Party majorities in the U.S. Congress. Even as those expectations faded, U.S. equity prices continued to climb.
In February 2017, the Standard & Poor’s 500 Index (the “S&P 500”) reached nine new closing highs and the Dow Jones Industrial Average (the “DJIA”) closed at new highs for 12 consecutive days, matching a record set in 1987. The following month, the S&P 500 crossed 2,400 points in intraday trading for the first time and the DJIA crossed 21,000 points for the first time. While the rally in U.S. equities stalled in April 2017, record high U.S. corporate operating earnings rekindled the rise in stock prices and the S&P 500 posted seven new closing highs in May 2017 and four new closing highs in June 2017.
Importantly, U.S. financial market volatility remained historically low throughout the reporting period, with a brief spike ahead of the November 2016 election. By the end of June 2017, the CBOE Volatility Index, which measures S&P 500 options to gauge market expectations of near-term volatility, stood at roughly half of its historical average.
Overall, small cap stocks generally outperformed mid cap and large cap stocks, while growth stocks generally outperformed value stocks. For the twelve months ended June 30, 2017, the S&P 500 returned 17.90%.
| 2 | J.P. MORGAN LARGE CAP FUNDS | JUNE 30, 2017 | ||||
Table of Contents
JPMorgan Disciplined Equity Fund
FUND COMMENTARY
TWELVE MONTHS ENDED JUNE 30, 2017 (Unaudited)
| REPORTING PERIOD RETURN: | ||||
Fund (Class L Shares)*(1) | 18.86% | |||
S&P 500 Index | 17.90% | |||
Net Assets as of 6/30/2017 (In Thousands) | $7,406,533 | |||
INVESTMENT OBJECTIVE**
The JPMorgan Disciplined Equity Fund (the “Fund”) seeks to provide a consistently high total return from a broadly diversified portfolio of equity securities with risk characteristics similar to the Standard & Poor’s 500 Index (the “Benchmark”).
WHAT WERE THE MAIN DRIVERS OF THE FUND’S PERFORMANCE?
The Fund’s Class L Shares outperformed the Benchmark for the twelve months ended June 30, 2017. The Fund’s security selection in the technology and telecommunications sectors was leading contributor to performance relative to the Benchmark, while the Fund’s security selection in the pharmaceutical/medical technology and retail sectors was a leading detractor from relative performance.
Leading individual contributors to relative performance included the Fund’s overweight positions in Charter Communications Inc. and Best Buy Inc. and its underweight position in Intel Corp. Shares of Charter Communications, a provider of broadband communications services, rose late in 2016 on better-than-expected earnings and news reports that the company could be a takeover target. Shares of Best Buy, a consumer electronics retail chain, rose after the company reported better-than-expected sales growth. Shares of Intel, a semiconductor manufacturer, fell after the company reported lackluster earnings growth.
Leading individual detractors from relative performance included the Fund’s overweight positons in Bristol-Myers Squibb Co., 21st Century Fox Inc. and Accenture PLC. Shares of Bristol-Myers Squibb, a drug maker, fell after the company reduced its earnings forecast and amid investor concerns about proposed changes to federal health insurance policies. Shares of 21st Century Fox, a media and entertainment company, fell after the company reported lower-than-expected revenue and management turmoil at its U.S. news operations, as well as regulatory uncertainty about the company’s plan to acquire Sky PLC. Shares of Accenture, a provider of management consulting and outsourcing, fell in late 2016 after the company reported weak sales and profit margins.
HOW WAS THE FUND POSITIONED?
The Fund’s portfolio managers attempted to construct the portfolio so that stock selection was the principal source of
potential excess return. The Fund’s portfolio managers sought investment opportunities in companies that they believed were attractive based on valuation and strong fundamentals.
| TOP TEN HOLDINGS OF THE PORTFOLIO*** | ||||||||
| 1. | Apple, Inc. | 3.8 | % | |||||
| 2. | Microsoft Corp. | 3.3 | ||||||
| 3. | Amazon.com, Inc. | 2.0 | ||||||
| 4. | Facebook, Inc., Class A | 2.0 | ||||||
| 5. | Bank of America Corp. | 1.8 | ||||||
| 6. | Alphabet, Inc., Class A | 1.7 | ||||||
| 7. | Alphabet, Inc., Class C | 1.7 | ||||||
| 8. | Wells Fargo & Co. | 1.6 | ||||||
| 9. | UnitedHealth Group, Inc. | 1.6 | ||||||
| 10. | Citigroup, Inc. | 1.6 | ||||||
PORTFOLIO COMPOSITION BY SECTOR*** | ||||
| Information Technology | 23.0 | % | ||
| Financials | 14.3 | |||
| Health Care | 14.2 | |||
| Consumer Discretionary | 12.8 | |||
| Industrials | 9.9 | |||
| Consumer Staples | 8.6 | |||
| Energy | 5.9 | |||
| Utilities | 3.2 | |||
| Materials | 2.8 | |||
| Real Estate | 2.3 | |||
| Telecommunication Services | 1.4 | |||
| Short-Term Investments | 1.6 | |||
| * | The return shown is based on net asset values calculated for shareholder transactions and may differ from the return shown in the financial highlights, which reflects adjustments made to the net asset values in accordance with accounting principles generally accepted in the United States of America. |
| ** | The adviser seeks to achieve the Fund’s objective. There can be no guarantee it will be achieved. |
| *** | Percentages indicated are based on total investments as of June 30, 2017. The Fund’s portfolio composition is subject to change. |
| (1) | On December 1, 2016, the Fund’s Institutional Class Shares were redesignated as and renamed Class L Shares. |
| JUNE 30, 2017 | J.P. MORGAN LARGE CAP FUNDS | 3 | ||||||
Table of Contents
JPMorgan Disciplined Equity Fund
FUND COMMENTARY
TWELVE MONTHS ENDED JUNE 30, 2017 (Unaudited) (continued)
AVERAGE ANNUAL TOTAL RETURNS AS OF JUNE 30, 2017 | ||||||||||||||
| INCEPTION DATE OF CLASS | 1 YEAR | 5 YEAR | 10 YEAR | |||||||||||
CLASS A SHARES | September 28, 2001 | |||||||||||||
With Sales Charge* | 12.32 | % | 12.50 | % | 6.27 | % | ||||||||
Without Sales Charge | 18.52 | 13.72 | 6.84 | |||||||||||
CLASS I SHARES (FORMERLY SELECT CLASS SHARES) | September 10, 2001 | 18.85 | 14.00 | 7.12 | ||||||||||
CLASS L SHARES (FORMERLY INSTITUTIONAL CLASS SHARES) | January 3, 1997 | 18.86 | 14.15 | 7.27 | ||||||||||
CLASS R6 SHARES | March 24, 2003 | 19.00 | 14.27 | 7.37 | ||||||||||
| * | Sales Charge for Class A Shares is 5.25%. |
TEN YEAR PERFORMANCE (6/30/07 TO 6/30/17)
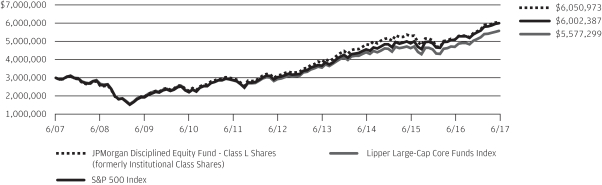
The performance quoted is past performance and is not a guarantee of future results. Mutual funds are subject to certain market risks. Investment returns and principal value of an investment will fluctuate so that an investor’s shares, when redeemed, may be worth more or less than their original cost. Current performance may be higher or lower than the performance data shown. For up-to-date month-end performance information please call 1-800-480-4111.
The graph illustrates comparative performance for $3,000,000 invested in Class L Shares of the JPMorgan Disciplined Equity Fund, the S&P 500 Index and the Lipper Large-Cap Core Funds Index from June 30, 2007 to June 30, 2017. The performance of the Fund assumes reinvestment of all dividends and capital gain distributions, if any, and does not include a sales charge. The performance of the S&P 500 Index does not reflect the deduction of expenses or a sales charge associated with a mutual fund and has been adjusted to reflect reinvestment of all dividends and capital gain distributions of the securities included in the benchmark, if applicable. The performance of the Lipper Large-Cap Core Funds Index includes expenses associated with a mutual fund, such as investment management fees. These expenses are not identical to the
expenses incurred by the Fund. The S&P 500 Index is an unmanaged index generally representative of the performance of large companies in the U.S. stock market. The Lipper Large-Cap Core Funds Index is an index based on the total returns of certain mutual funds within the Fund’s designated category as determined by Lipper, Inc. Investors cannot invest directly in an index.
Class L Shares have a $3,000,000 minimum initial investment.
Fund performance may reflect the waiver of the Fund’s fees and reimbursement of expenses for certain periods since the inception date. Without these waivers and reimbursements, performance would have been lower. Also, performance shown in this section does not reflect the deduction of taxes that a shareholder would pay on Fund distributions or redemptions of Fund shares.
The returns shown are based on net asset values calculated for shareholder transactions and may differ from the returns shown in the financial highlights, which reflect adjustments made to the net asset values in accordance with accounting principles generally accepted in the United States of America.
| 4 | J.P. MORGAN LARGE CAP FUNDS | JUNE 30, 2017 | ||||
Table of Contents
FUND COMMENTARY
TWELVE MONTHS ENDED JUNE 30, 2017 (Unaudited)
| REPORTING PERIOD RETURN: | ||||
Fund (Class I Shares)*(1) | 30.71% | |||
Russell 1000 Growth Index | 20.42% | |||
Net Assets as of 6/30/2017 (In Thousands) | $ | 321,477 | ||
INVESTMENT OBJECTIVE**
The JPMorgan Dynamic Growth Fund (the “Fund”) seeks long-term capital growth.
WHAT WERE THE MAIN DRIVERS OF THE FUND’S PERFORMANCE?
The Fund’s Class I Shares outperformed the Russell 1000 Growth Index (the “Benchmark”) for the twelve months ended June 30, 2017. The Fund’s security selection in the financials sector and its security selection and overweight position in the technology sector were leading contributors to performance relative to the Benchmark, while the Fund’s security selection in the producer durables and materials & processing sectors was a leading detractor from relative performance.
Leading individual contributors to relative performance included the Fund’s overweight positions in Charles Schwab & Co., ARM Holdings PLC and Broadcom Ltd. Shares of Charles Schwab, a discount securities brokerage, rose after the company reported better-than-expected earnings and growth in new brokerage accounts. Shares of ARM Holdings, a semiconductor manufacturer that was not held in the Benchmark, rose ahead of the company’s $32 billion acquisition by Softbank Group Corp. Shares of Broadcom, a semiconductor maker, rose after the company reported better-than-expected earnings.
Leading individual detractors from relative performance included the Fund’s underweight positions in Apple Inc. and Microsoft Corp. and its overweight position in Gilead Sciences Inc. Shares of Apple, a maker of smartphones, computers and related devices, rose after the company posted earnings growth on better-than-expected sales and pricing for its iPhones. Shares of Microsoft, a provider of software and services that was not held in the Fund, rose after reporting better-than-expected earnings. Shares of Gilead Sciences, a drug maker, fell after the company reported lower-than-expected earnings.
HOW WAS THE FUND POSITIONED?
The Fund’s portfolio managers utilized a bottom-up approach to stock selection, researching individual companies in an effort to construct portfolios of stocks that have strong fundamentals and positive price momentum. The Fund’s portfolio managers
sought to invest in companies with attractive fundamentals that, in their view, possessed the potential to significantly exceed expectations for a prolonged period of time.
| TOP TEN EQUITY HOLDINGS OF THE PORTFOLIO*** | ||||||||
| 1. | Amazon.com, Inc. | 6.8 | % | |||||
| 2. | Alphabet, Inc., Class A | 6.6 | ||||||
| 3. | Mastercard, Inc., Class A | 6.0 | ||||||
| 4. | Facebook, Inc., Class A | 5.2 | ||||||
| 5. | Charles Schwab Corp. (The) | 4.8 | ||||||
| 6. | UnitedHealth Group, Inc. | 4.0 | ||||||
| 7. | Priceline Group, Inc. (The) | 4.0 | ||||||
| 8. | Intercontinental Exchange, Inc. | 4.0 | ||||||
| 9. | Intuitive Surgical, Inc. | 3.9 | ||||||
| 10. | Home Depot, Inc. (The) | 3.7 | ||||||
PORTFOLIO COMPOSITION BY SECTOR*** | ||||
| Information Technology | 41.8 | % | ||
| Consumer Discretionary | 21.7 | |||
| Health Care | 13.1 | |||
| Financials | 8.8 | |||
| Industrials | 4.1 | |||
| Real Estate | 3.5 | |||
| Consumer Staples | 2.1 | |||
| Energy | 1.6 | |||
| Short-Term Investment | 3.3 | |||
| * | The return shown is based on net asset values calculated for shareholder transactions and may differ from the return shown in the financial highlights, which reflects adjustments made to the net asset values in accordance with accounting principles generally accepted in the United States of America. |
| ** | The adviser seeks to achieve the Fund’s objective. There can be no guarantee it will be achieved. |
| *** | Percentages indicated are based on total investments as of June 30, 2017. The Fund’s portfolio composition is subject to change. |
| (1) | On April 3, 2017, the Fund’s Select Class Shares were renamed Class I Shares. |
| JUNE 30, 2017 | J.P. MORGAN LARGE CAP FUNDS | 5 | ||||||
Table of Contents
JPMorgan Dynamic Growth Fund
FUND COMMENTARY
TWELVE MONTHS ENDED JUNE 30, 2017 (Unaudited) (continued)
AVERAGE ANNUAL TOTAL RETURNS AS OF JUNE 30, 2017 | ||||||||||||||
| INCEPTION DATE OF CLASS | 1 YEAR | 5 YEAR | | SINCE INCEPTION | | |||||||||
CLASS A SHARES | November 30, 2007 | |||||||||||||
With Sales Charge* | 23.53 | % | 14.00 | % | 7.73 | % | ||||||||
Without Sales Charge | 30.39 | 15.24 | 8.33 | |||||||||||
CLASS C SHARES | November 30, 2007 | |||||||||||||
With CDSC** | 28.75 | 14.66 | 7.79 | |||||||||||
Without CDSC | 29.75 | 14.66 | 7.79 | |||||||||||
CLASS I SHARES (FORMERLY SELECT CLASS SHARES) | November 30, 2007 | 30.71 | 15.53 | 8.60 | ||||||||||
CLASS R5 SHARES | November 30, 2007 | 30.99 | 15.75 | 8.82 | ||||||||||
| * | Sales Charge for Class A Shares is 5.25%. |
| ** | Assumes a 1% CDSC (contingent deferred sales charge) for the one year period and 0% CDSC thereafter. |
LIFE OF FUND PERFORMANCE (11/30/07 TO 6/30/17)
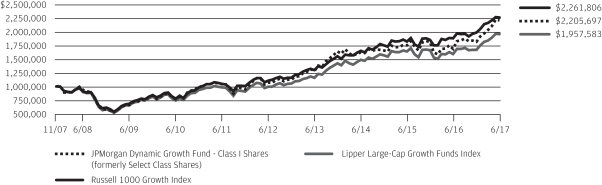
The performance quoted is past performance and is not a guarantee of future results. Mutual funds are subject to certain market risks. Investment returns and principal value of an investment will fluctuate so that an investor’s shares, when redeemed, may be worth more or less than their original cost. Current performance may be higher or lower than the performance data shown. For up-to-date, month-end performance information please call 1-800-480-4111.
The Fund commenced operations on November 30, 2007.
The graph illustrates comparative performance for $1,000,000 invested in Class I Shares of the JPMorgan Dynamic Growth Fund, the Russell 1000 Growth Index and the Lipper Large-Cap Growth Funds Index from November 30, 2007 to June 30, 2017. The performance of the Fund assumes reinvestment of all dividends and capital gain distributions, if any, and does not include a sales charge. The performance of the Russell 1000 Growth Index does not reflect the deduction of expenses or a sales charge associated with a mutual fund and has been adjusted to reflect reinvestment of all dividends and capital gain distributions of the securities included in the benchmark, if applicable. The performance of the Lipper Large-Cap Growth Funds Index includes expenses associated with a mutual fund, such as investment management fees. These expenses are not identical to the expenses incurred by the Fund. The Russell 1000 Growth Index is an unmanaged index which measures the performance of
those Russell 1000 companies with higher price-to-book ratios and higher forecasted growth values. The Lipper Large-Cap Growth Funds Index is an index based on the total returns of certain mutual funds within the Fund’s designated category as determined by Lipper, Inc. Investors cannot invest directly in an index.
Class I Shares have a $1,000,000 minimum initial investment.
Subsequent to the inception date of the Fund and through August 5, 2010, the Fund did not experience any shareholder activity. If such shareholder activity had occurred, the Fund’s performance may have been impacted.
Fund performance may reflect the waiver of the Fund’s fees and reimbursement of expenses for certain periods since the inception date. Without these waivers and reimbursements, performance would have been lower. Also, performance shown in this section does not reflect the deduction of taxes that a shareholder would pay on Fund distributions or redemptions of Fund shares.
The returns shown are based on net asset values calculated for shareholder transactions and may differ from the returns shown in the financial highlights, which reflect adjustments made to the net asset values in accordance with accounting principles generally accepted in the United States of America.
| 6 | J.P. MORGAN LARGE CAP FUNDS | JUNE 30, 2017 | ||||
Table of Contents
FUND COMMENTARY
TWELVE MONTHS ENDED JUNE 30, 2017 (Unaudited)
| REPORTING PERIOD RETURN: | ||||
Fund (Class I Shares)*(1) | 24.43% | |||
S&P 500 Index | 17.90% | |||
Net Assets as of 6/30/2017 (In Thousands) | $ | 186,844 | ||
INVESTMENT OBJECTIVE**
The JPMorgan Equity Focus Fund (the “Fund”) seeks long term capital appreciation.
WHAT WERE THE MAIN DRIVERS OF THE FUND’S PERFORMANCE?
The Fund’s Class I Shares outperformed the S&P 500 Index (the “Benchmark”) for the twelve months ended June 30, 2017. The Fund’s security selection in the energy sector and its underweight position and security selection in the utilities sector were leading contributors to performance relative to the Benchmark. The Fund’s security selection in the financials sector was a leading detractor from relative performance.
Leading individual contributors to relative performance included the Fund’s overweight positions in Priceline Group Inc., Delta Air Lines Inc. and Capital One Financial Corp. Shares of Priceline Group, an online travel booking company, rose in early 2017 after the company reported better-than-expected earnings. Shares of Delta Air Lines, an airline operator, rose after the company increased its dividend, unveiled a $5 billion stock repurchase plan and forecast growth in profit margin. Shares of Capital One Financial, a credit card and banking company, rose on investor expectations that the company will benefit from rising U.S. interest rates.
Leading individual detractors from relative performance included the Fund’s overweight positions in Gilead Sciences Inc. and Kimco Realty Corp. and its underweight position in Apple Inc. Shares of Gilead Sciences, a drug maker, fell after the company reported lower-than-expected earnings. Shares of Kimco Realty, a shopping center real estate investment trust, fell amid a broad sell-off in the retail real estate sector. Shares of Apple, a maker of smartphones, computers and related devices, rose after the company posted earnings growth on better-than-expected sales and pricing for its iPhones.
HOW WAS THE FUND POSITIONED?
The Fund’s portfolio managers employed a bottom-up fundamental approach to stock selection. As a result of this approach to stock selection, the Fund’s largest overweight positions versus the Benchmark were in the consumer discretionary and financials sectors. The Fund’s largest underweight positions
versus the Benchmark were in the consumer staples and utilities sectors.
| TOP TEN EQUITY HOLDINGS OF THE PORTFOLIO*** | ||||||||
| 1. | Alphabet, Inc., Class C | 6.0 | % | |||||
| 2. | Amazon.com, Inc. | 4.3 | ||||||
| 3. | Apple, Inc. | 4.1 | ||||||
| 4. | Facebook, Inc., Class A | 4.1 | ||||||
| 5. | UnitedHealth Group, Inc. | 4.0 | ||||||
| 6. | American International Group, Inc. | 3.8 | ||||||
| 7. | T Rowe Price Group, Inc. | 3.3 | ||||||
| 8. | DISH Network Corp., Class A | 3.2 | ||||||
| 9. | Wells Fargo & Co. | 3.2 | ||||||
| 10. | Loews Corp. | 3.1 | ||||||
PORTFOLIO COMPOSITION BY SECTOR*** | ||||
| Information Technology | 22.6 | % | ||
| Financials | 22.6 | |||
| Consumer Discretionary | 17.1 | |||
| Health Care | 9.4 | |||
| Energy | 6.8 | |||
| Industrials | 6.4 | |||
| Real Estate | 4.1 | |||
| Materials | 3.8 | |||
| Utilities | 2.2 | |||
| Consumer Staples | 1.9 | |||
| Short-Term Investment | 3.1 | |||
| * | The return shown is based on net asset values calculated for shareholder transactions and may differ from the return shown in the financial highlights, which reflects adjustments made to the net asset values in accordance with accounting principles generally accepted in the United States of America. |
| ** | The adviser seeks to achieve the Fund’s objective. There can be no guarantee it will be achieved. |
| *** | Percentages indicated are based on total investments as of June 30, 2017. The Fund’s portfolio composition is subject to change. |
| (1) | On April 3, 2017, the Fund’s Select Class Shares were renamed Class I Shares. |
| JUNE 30, 2017 | J.P. MORGAN LARGE CAP FUNDS | 7 | ||||||
Table of Contents
JPMorgan Equity Focus Fund
FUND COMMENTARY
TWELVE MONTHS ENDED JUNE 30, 2017 (Unaudited) (continued)
AVERAGE ANNUAL TOTAL RETURNS AS OF JUNE 30, 2017 | ||||||||||||||
| INCEPTION DATE OF CLASS | 1 YEAR | 5 YEAR | SINCE INCEPTION | |||||||||||
CLASS A SHARES | July 29, 2011 | |||||||||||||
With Sales Charge* | 17.59 | % | 13.32 | % | 12.11 | % | ||||||||
Without Sales Charge | 24.09 | 14.54 | 13.14 | |||||||||||
CLASS C SHARES | July 29, 2011 | |||||||||||||
With CDSC** | 22.45 | 13.96 | 12.57 | |||||||||||
Without CDSC | 23.45 | 13.96 | 12.57 | |||||||||||
CLASS I SHARES (FORMERLY SELECT CLASS SHARES) | July 29, 2011 | 24.43 | 14.83 | 13.42 | ||||||||||
| * | Sales Charge for Class A Shares is 5.25%. |
| ** | Assumes a 1% CDSC (contingent deferred sales charge) for the one year period and 0% CDSC thereafter. |
LIFE OF FUND PERFORMANCE (7/29/11 TO 6/30/17)
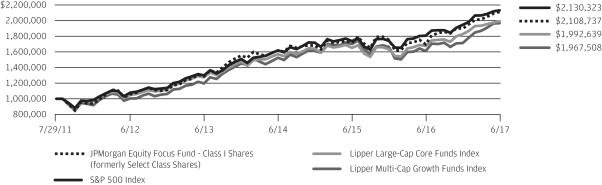
The performance quoted is past performance and is not a guarantee of future results. Mutual funds are subject to certain market risks. Investment returns and principal value of an investment will fluctuate so that an investor’s shares, when redeemed, may be worth more or less than their original cost. Current performance may be higher or lower than the performance data shown. For up-to-date, month-end performance information please call 1-800-480-4111.
The Fund commenced operations on July 29, 2011.
The graph illustrates comparative performance for $1,000,000 invested in Class I Shares of the JPMorgan Equity Focus Fund, the S&P 500 Index, the Lipper Large-Cap Core Funds Index and the Lipper Multi-Cap Growth Funds Index from July 29, 2011 to June 30, 2017. The performance of the Fund assumes reinvestment of all dividends and capital gain distributions, if any, and does not include a sales charge. The performance of the S&P 500 Index does not reflect the deduction of expenses or a sales charge associated with a mutual fund and has been adjusted to reflect reinvestment of all dividends and capital gain distributions of securities included in the benchmark, if applicable. The performance of the Lipper Large-Cap Core Funds Index and the Lipper Multi-Cap Growth Funds Index includes expenses associated with a mutual fund, such as investment management fees. These expenses are not identical to the expenses
incurred by the Fund. The S&P 500 Index is an unmanaged index generally representative of the performance of large companies in the U.S. stock market. The Lipper Large-Cap Core Funds Index and the Lipper Multi-Cap Growth Funds Index are indexes based on the total returns of certain groups of mutual funds as determined by Lipper, Inc. Investors cannot invest directly in an index.
Class I Shares have a $1,000,000 minimum initial investment.
Subsequent to the inception date of the Fund and through July 31, 2013, the Fund did not experience any shareholder activity. If such shareholder activity had occurred, the Fund’s performance may have been impacted.
Fund performance may reflect the waiver of the Fund’s fees and reimbursement of expenses for certain periods since the inception date. Without these waivers and reimbursements, performance would have been lower. Also, performance shown in this section does not reflect the deduction of taxes that a shareholder would pay on Fund distributions or redemptions of Fund shares.
The returns shown are based on net asset values calculated for shareholder transactions and may differ from the returns shown in the financial highlights, which reflect adjustments made to the net asset values in accordance with accounting principles generally accepted in the United States of America.
| 8 | J.P. MORGAN LARGE CAP FUNDS | JUNE 30, 2017 | ||||
Table of Contents
FUND COMMENTARY
TWELVE MONTHS ENDED JUNE 30, 2017 (Unaudited)
| REPORTING PERIOD RETURN: | ||||
| Fund (Class I Shares)*(1) | 14.57% | |||
Russell 1000 Value Index | 15.53% | |||
| Net Assets as of 6/30/2017 (In Thousands) | $ | 14,952,912 | ||
INVESTMENT OBJECTIVE**
The JPMorgan Equity Income Fund (the “Fund”) seeks capital appreciation and current income.
WHAT WERE THE MAIN DRIVERS OF THE FUND’S PERFORMANCE?
The Fund’s Class I Shares underperformed the Russell 1000 Value Index (the “Benchmark”) for the twelve months ended June 30, 2017. The Fund’s security selection in the financials and health care sectors was a leading detractor from performance relative to the Benchmark, while the Fund’s security selection in the industrials and information technology sectors was a leading contributor to relative performance.
Leading individual detractors from relative performance included the Fund’s overweight positions in Bristol-Myers Squibb Co., Travelers Cos. and Simon Property Group Inc. Shares of Bristol-Myers Squibb, a drug maker, fell after the company reduced its earnings forecast and amid investor concerns about proposed changes to federal health insurance policies. Shares of Travelers, a property and casualty insurer, fell after the company reported lower-than-expected earnings, largely due to storm damages incurred in the first three months of 2017. Shares of Simon Property Group, a retail property real estate investment trust, fell amid a broad sell-off in the retail real estate sector.
Leading individual contributors to relative performance included the Fund’s underweight positions in General Electric Co. and Berkshire Hathaway Inc. and its overweight position in Apple Inc. Shares of General Electric, an industrial conglomerate, fell amid investor concerns about the company’s strategic direction under a new chief executive. Shares of Berkshire Hathaway, an investment management company that was not held by the Fund, fell after the company reported lower earnings. Shares of Apple, a maker of smartphones, computers and related devices, rose after the company posted earnings growth on better-than-expected sales and pricing for its iPhones.
HOW WAS THE FUND POSITIONED?
The Fund’s portfolio managers’ focus remained on stock selection, as they believed that quality companies trading at attractive valuations have the greatest potential to outperform
in the long term. As the Fund aimed to purchase stocks with above average dividend yields, the research process was designed to identify companies with predictable and durable business models deemed capable of generating sustainable free cash flow.
| TOP TEN EQUITY HOLDINGS OF THE PORTFOLIO*** | ||||||||
| 1. | Bank of America Corp. | 3.1 | % | |||||
| 2. | Wells Fargo & Co. | 2.9 | ||||||
| 3. | Johnson & Johnson | 2.7 | ||||||
| 4. | Chevron Corp. | 2.6 | ||||||
| 5. | PNC Financial Services Group, Inc. (The) | 2.5 | ||||||
| 6. | Apple, Inc. | 2.4 | ||||||
| 7. | BlackRock, Inc. | 2.2 | ||||||
| 8. | Microsoft Corp. | 2.0 | ||||||
| 9. | Occidental Petroleum Corp. | 2.0 | ||||||
| 10. | CME Group, Inc. | 2.0 | ||||||
PORTFOLIO COMPOSITION BY SECTOR*** | ||||
| Financials | 29.7 | % | ||
| Industrials | 11.4 | |||
| Information Technology | 10.7 | |||
| Health Care | 10.7 | |||
| Energy | 9.9 | |||
| Consumer Discretionary | 7.5 | |||
| Consumer Staples | 7.5 | |||
| Utilities | 4.2 | |||
| Materials | 3.5 | |||
| Real Estate | 2.8 | |||
| Telecommunication Services | 1.3 | |||
| Short-Term Investment | 0.8 | |||
| * | The return shown is based on net asset values calculated for shareholder transactions and may differ from the return shown in the financial highlights, which reflects adjustments made to the net asset values in accordance with accounting principles generally accepted in the United States of America. |
| ** | The adviser seeks to achieve the Fund’s objective. There can be no guarantee it will be achieved. |
| *** | Percentages indicated are based on total investments as of June 30, 2017. The Fund’s portfolio composition is subject to change. |
| (1) | On April 3, 2017, the Fund’s Select Class Shares were renamed Class I Shares. |
| JUNE 30, 2017 | J.P. MORGAN LARGE CAP FUNDS | 9 | ||||||
Table of Contents
JPMorgan Equity Income Fund
FUND COMMENTARY
TWELVE MONTHS ENDED JUNE 30, 2017 (Unaudited) (continued)
AVERAGE ANNUAL TOTAL RETURNS AS OF JUNE 30, 2017 | ||||||||||||||||
| INCEPTION DATE OF CLASS | 1 YEAR | 5 YEAR | 10 YEAR | |||||||||||||
CLASS A SHARES | February 18, 1992 | |||||||||||||||
With Sales Charge* | 8.31 | % | 11.85 | % | 6.46 | % | ||||||||||
Without Sales Charge | 14.34 | 13.07 | 7.03 | |||||||||||||
CLASS C SHARES | November 4, 1997 | |||||||||||||||
With CDSC** | 12.74 | 12.51 | 6.49 | |||||||||||||
Without CDSC | 13.74 | 12.51 | 6.49 | |||||||||||||
CLASS I SHARES (FORMERLY SELECT CLASS SHARES) | July 2, 1987 | 14.57 | 13.35 | 7.33 | ||||||||||||
CLASS R2 SHARES | February 28, 2011 | 14.01 | 12.77 | 6.82 | ||||||||||||
CLASS R3 SHARES | September 9, 2016 | 14.33 | 13.07 | 7.03 | ||||||||||||
CLASS R4 SHARES | September 9, 2016 | 14.60 | 13.36 | 7.33 | ||||||||||||
CLASS R5 SHARES | February 28, 2011 | 14.84 | 13.58 | 7.46 | ||||||||||||
CLASS R6 SHARES | January 31, 2012 | 14.95 | 13.64 | 7.49 | ||||||||||||
| * | Sales Charge for Class A Shares is 5.25%. |
| ** | Assumes a 1% CDSC (contingent deferred sales charge) for the one year period and 0% CDSC thereafter. |
TEN YEAR PERFORMANCE (6/30/07 TO 6/30/17)
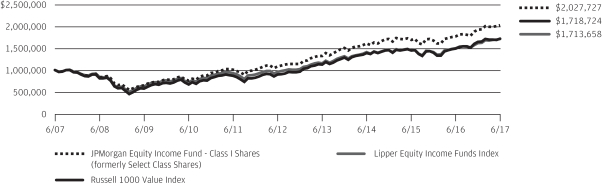
The performance quoted is past performance and is not a guarantee of future results. Mutual funds are subject to certain market risks. Investment returns and principal value of an investment will fluctuate so that an investor’s shares, when redeemed, may be worth more or less than their original cost. Current performance may be higher or lower than the performance data shown. For up-to-date month-end performance information please call 1-800-480-4111.
Returns for Class R2 Class R4, and Class R5 Shares prior to their inception dates are based on the performance of Class I Shares. With respect to Class R2 Shares, prior class performance has been adjusted to reflect the differences in expenses between classes. The actual returns for Class R4 would have been similar to those shown because Class R4 Shares had similar expenses to Class I Shares. The actual returns for Class R5 Shares would have been different than those shown because Class R5 Shares have different expenses than Class I Shares.
Returns for Class R3 Shares prior to their inception date are based on the performance of Class A Shares. The actual returns for Class R3 Shares would have been similar than those shown because Class R3 currently have the same expenses as Class A Shares.
Returns for Class R6 Shares prior to their inception date are based on the performance of Class R5 Shares and, prior to February 28, 2011, Class I Shares. The actual returns for Class R6 Shares would have been different than those shown because Class R6 Shares have different expenses than Class R5 and Class I Shares.
The graph illustrates comparative performance for $1,000,000 invested in Class I Shares of the JPMorgan Equity Income Fund, the Russell 1000 Value Index and the Lipper Equity Income Funds Index from June 30, 2007 to June 30, 2017.
The performance of the Fund assumes reinvestment of all dividends and capital gain distributions, if any, and does not include a sales charge. The performance of the Russell 1000 Value Index does not reflect the deduction of expenses or a sales charge associated with a mutual fund and has been adjusted to reflect reinvestment of all dividends and capital gain distributions of the securities included in the benchmark, if applicable. The performance of the Lipper Equity Income Funds Index includes expenses associated with a mutual fund, such as investment management fees. These expenses are not identical to the expenses incurred by the Fund. The Russell 1000 Value Index is an unmanaged index which measures the performance of those Russell 1000 companies with lower price-to-book ratios and lower forecasted growth values. The Lipper Equity Income Funds Index is an index based on the total returns of certain mutual funds within the Fund’s designated category as determined by Lipper, Inc. Investors cannot invest directly in an index.
Class I Shares have a $1,000,000 minimum initial investment.
Fund performance may reflect the waiver of the Fund’s fees and reimbursement of expenses for certain periods since the inception date. Without these waivers and reimbursements, performance would have been lower. Also, performance shown in this section does not reflect the deduction of taxes that a shareholder would pay on Fund distributions or redemptions of Fund shares.
The returns shown are based on net asset values calculated for shareholder transactions and may differ from the returns shown in the financial highlights, which reflect adjustments made to the net asset values in accordance with accounting principles generally accepted in the United States of America.
| 10 | J.P. MORGAN LARGE CAP FUNDS | JUNE 30, 2017 | ||||
Table of Contents
JPMorgan Growth and Income Fund
FUND COMMENTARY
TWELVE MONTHS ENDED JUNE 30, 2017 (Unaudited)
| REPORTING PERIOD RETURN: | ||||
Fund (Class A Shares, without a sales charge)* | 16.31% | |||
Russell 1000 Value Index | 15.53% | |||
Net Assets as of 6/30/2017 (In Thousands) | $ | 539,705 | ||
INVESTMENT OBJECTIVE**
The JPMorgan Growth and Income Fund (the “Fund”) seeks to provide capital growth over the long term and earn income from dividends.
WHAT WERE THE MAIN DRIVERS OF THE FUND’S PERFORMANCE?
The Fund’s Class A Shares, without a sales charge, outperformed the Russell 1000 Value Index (the “Benchmark”) for the twelve months ended June 30, 2017. The Fund’s security selection and overweight position in the information technology sector and its overweight position in the financials sector were leading contributors to performance relative to the Benchmark. The Fund’s security selection in the health care and consumer staples sectors was a leading detractor from relative performance.
Leading individual contributors to relative performance included the Fund’s overweight positions in Bank of America Corp., Best Buy Inc. and Harman International Industries Inc. Shares of Bank of America, a banking and financial services company, rose amid investor expectations of an improved operating environment for large banks and the company’s successful completion of the U.S. Federal Reserve’s bank “stress test.” Shares of Best Buy, a consumer electronics retail chain, rose after the company reported better-than-expected sales growth. Shares of Harman International Industries, a maker of audio systems for the consumer and commercial markets, rose on news of Samsung Electronics Co.’s acquisition of the company.
Leading individual detractors from relative performance included the Fund’s overweight positions in Bristol-Myers Squibb Co., AutoZone Inc. and L Brands Inc. Shares of Bristol-Myers Squibb, a drug maker, fell after the company reduced its earnings forecast and amid investor concerns about proposed changes to federal health insurance policies. Shares of AutoZone, auto parts retailer and distributor, fell after the company reported lower-than-expected earnings and sales. Shares of L Brands, a retailer of women’s apparel and beauty products, fell after the company reported a decline in sales.
HOW WAS THE FUND POSITIONED?
The Fund’s portfolio managers focused on stock selection and aimed to invest in undervalued companies with durable franchises, strong management and the ability to grow their intrinsic
value per share. The portfolio managers employed a bottom-up approach to security selection and fundamental research. During the reporting period, the Fund’s largest overweight position relative to the Benchmark was in the consumer discretionary sector, while its largest underweight position was in the consumer staples sector.
| TOP TEN EQUITY HOLDINGS OF THE PORTFOLIO*** | ||||||||
| 1. | Bank of America Corp. | 4.5 | % | |||||
| 2. | Microsoft Corp. | 3.2 | ||||||
| 3. | Apple, Inc. | 3.0 | ||||||
| 4. | Wells Fargo & Co. | 2.9 | ||||||
| 5. | Chevron Corp. | 2.4 | ||||||
| 6. | Honeywell International, Inc. | 2.3 | ||||||
| 7. | BlackRock, Inc. | 1.9 | ||||||
| 8. | Hartford Financial Services Group, Inc. (The) | 1.9 | ||||||
| 9. | Berkshire Hathaway, Inc., Class B | 1.9 | ||||||
| 10. | Home Depot, Inc. (The) | 1.7 | ||||||
PORTFOLIO COMPOSITION BY SECTOR*** | ||||
| Financials | 32.0 | % | ||
| Information Technology | 13.9 | |||
| Energy | 11.8 | |||
| Health Care | 11.2 | |||
| Industrials | 8.9 | |||
| Consumer Discretionary | 8.0 | |||
| Consumer Staples | 3.9 | |||
| Real Estate | 2.5 | |||
| Utilities | 2.4 | |||
| Telecommunication Services | 2.0 | |||
| Materials | 1.6 | |||
| Short-Term Investment | 1.8 | |||
| * | The return shown is based on net asset values calculated for shareholder transactions and may differ from the return shown in the financial highlights, which reflects adjustments made to the net asset values in accordance with accounting principles generally accepted in the United States of America. |
| ** | The adviser seeks to achieve the Fund’s objective. There can be no guarantee it will be achieved. |
| *** | Percentages indicated are based on total investments as of June 30, 2017. The Fund’s portfolio composition is subject to change. |
| JUNE 30, 2017 | J.P. MORGAN LARGE CAP FUNDS | 11 | ||||||
Table of Contents
JPMorgan Growth and Income Fund
FUND COMMENTARY
TWELVE MONTHS ENDED JUNE 30, 2017 (Unaudited) (continued)
AVERAGE ANNUAL TOTAL RETURNS AS OF JUNE 30, 2017 | ||||||||||||||
| INCEPTION DATE OF CLASS | 1 YEAR | 5 YEAR | 10 YEAR | |||||||||||
CLASS A SHARES | September 23, 1987 | |||||||||||||
With Sales Charge* | 10.20 | % | 12.75 | % | 5.19 | % | ||||||||
Without Sales Charge | 16.31 | 13.97 | 5.76 | |||||||||||
CLASS C SHARES | January 2, 1998 | |||||||||||||
With CDSC** | 14.74 | 13.40 | 5.23 | |||||||||||
Without CDSC | 15.74 | 13.40 | 5.23 | |||||||||||
CLASS I SHARES (FORMERLY SELECT CLASS SHARES) | January 25, 1996 | 16.62 | 14.25 | 6.05 | ||||||||||
CLASS R2 SHARES | November 2, 2015 | 16.04 | 13.88 | 5.72 | ||||||||||
CLASS R5 SHARES | November 2, 2015 | 16.85 | 14.33 | 6.09 | ||||||||||
CLASS R6 SHARES | November 2, 2015 | 16.91 | 14.35 | 6.10 | ||||||||||
| * | Sales Charge for Class A Shares is 5.25%. |
| ** | Assumes a 1% CDSC (contingent deferred sales charge) for the one year period and 0% CDSC thereafter. |
TEN YEAR PERFORMANCE (6/30/07 TO 6/30/17)
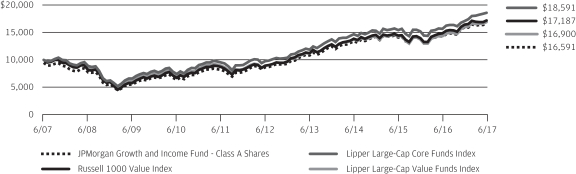
The performance quoted is past performance and is not a guarantee of future results. Mutual funds are subject to certain market risks. Investment returns and principal value of an investment will fluctuate so that an investor’s shares, when redeemed, may be worth more or less than their original cost. Current performance may be higher or lower than the performance data shown. For up-to-date month-end performance information please call 1-800-480-4111.
Returns for Class R2 Shares prior to their inception date are based on the performance of Class A Shares. The actual returns of Class R2 Shares would have been lower than those shown because Class R2 Shares have higher expenses than Class A Shares.
Returns for Class R5 and Class R6 Shares prior to their inception date are based on the performance of Class I Shares. The actual returns of Class R5 and Class R6 Shares would have been different than those shown because Class R5 and Class R6 Shares have different expenses than Class I Shares.
The graph illustrates comparative performance for $10,000 invested in Class A Shares of the JPMorgan Growth and Income Fund, the Russell 1000 Value Index, the Lipper Large-Cap Value Funds Index and the Lipper Large-Cap Core Funds Index from June 30, 2007 to June 30, 2017. The performance of the Fund assumes reinvestment of all dividends and capital gain distributions, if any, and includes a sales charge. The performance of the Russell 1000 Value Index does not reflect the deduction of expenses or a sales charge associated with a mutual
fund and has been adjusted to reflect reinvestment of all dividends and capital gain distributions of the securities included in the benchmarks, if applicable. The performance of the Lipper Large-Cap Value Funds Index and the Lipper Large-Cap Core Funds Index includes expenses associated with a mutual fund, such as investment management fees. These expenses are not identical to the expenses incurred by the Fund. The Russell 1000 Value Index is an unmanaged index, which measures the performance of those Russell 1000 companies with lower price-to-book ratios and lower forecasted growth values. The Lipper Large-Cap Value Funds Index and the Lipper Large-Cap Core Funds Index are indexes based on the total returns of certain groups of mutual funds as determined by Lipper, Inc. Investors cannot invest directly in an index.
Class A Shares have a $1,000 minimum initial investment and carry a 5.25% sales charge.
Fund performance may reflect the waiver of the Fund’s fees and reimbursement of expenses for certain periods since the inception date. Without these waivers and reimbursements, performance would have been lower. Also, performance shown in this section does not reflect the deduction of taxes that a shareholder would pay on Fund distributions or redemptions of Fund shares.
The returns shown are based on net asset values calculated for shareholder transactions and may differ from the returns shown in the financial highlights, which reflect adjustments made to the net asset values in accordance with accounting principles generally accepted in the United States of America.
| 12 | J.P. MORGAN LARGE CAP FUNDS | JUNE 30, 2017 | ||||
Table of Contents
FUND COMMENTARY
TWELVE MONTHS ENDED JUNE 30, 2017 (Unaudited)
| REPORTING PERIOD RETURN: | ||||
| Fund (Class I Shares)*(1) | 13.78% | |||
| S&P 500 Index | 17.90% | |||
| Net Assets as of 6/30/2017 (In Thousands) | $763,296 | |||
INVESTMENT OBJECTIVE**
The JPMorgan Hedged Equity Fund (the “Fund”) seeks to provide capital appreciation.
WHAT WERE THE MAIN DRIVERS OF THE FUND’S PERFORMANCE?
The Fund’s Class I Shares underperformed the Standard & Poor’s 500 Index (the “Benchmark”) for the twelve months ended June 30, 2017. The Fund’s options hedge allowed the Fund to generally perform as designed, delivering returns with less volatility than the Benchmark during the reporting period. The Fund captured 77% of the Benchmark’s total return with about 49% of the Benchmark’s volatility during the twelve month reporting period.
The Fund’s security selection in the pharmaceutical/medical technology and retail sectors was a leading detractor from performance relative to the Benchmark. The Fund’s security selection in the telecommunications and technology sectors was a leading contributor to relative performance.
Leading individual detractors from relative performance included the Fund’s overweight positons in Bristol-Myers Squibb Co. and Accenture PLC and its underweight position in Nvidia Corp. Shares of Bristol-Myers Squibb, a drug maker, fell after the company reduced its earnings forecast and investor concerns about proposed changes to federal health insurance policies. Shares of Accenture, a provider of management consulting and outsourcing, fell in late 2016 after the company reported weakness in sales and profit margins. Shares of Nvidia, a maker of computer graphics semiconductors and software, rose amid growth in its gaming and artificial intelligence segments.
Leading individual contributors to relative performance included the Fund’s overweight position in Charter Communications Inc. and its underweight positions in Intel Corp. and IBM Corp. Shares of Charter Communications, a provider of broadband communications services, rose late in 2016 on better-than-expected earnings and news reports that the company could be a takeover target. Shares of Intel, a semiconductor manufacturer, fell after the company reported lackluster earnings growth. Shares of IBM, a technology and business services company, fell after the company reported lower-than-expected earnings and investment management firm Berkshire Hathaway Inc. announced it had sold part of its stake in the company.
HOW WAS THE FUND POSITIONED?
The Fund used an enhanced index strategy that invests primarily in common stocks of large capitalization U.S. companies, while
systematically purchasing and selling exchange-traded index put options and selling exchange-traded index call options. The option overlay is known as a “Put/Spread Collar” strategy. The combination of the diversified portfolio of equity securities, downside protection from index put options and income from index call options provided the Fund with a portion of the returns associated with equity market investments, while exposing the Fund to less risk than traditional long-only equity strategies.
| TOP TEN EQUITY HOLDINGS OF THE PORTFOLIO*** | ||||||||
| 1. | Apple, Inc. | 3.7 | % | |||||
| 2. | Microsoft Corp. | 3.2 | ||||||
| 3. | Amazon.com, Inc. | 1.9 | ||||||
| 4. | Facebook, Inc., Class A | 1.9 | ||||||
| 5. | Bank of America Corp. | 1.8 | ||||||
| 6. | Alphabet, Inc., Class A | 1.7 | ||||||
| 7. | Alphabet, Inc., Class C | 1.7 | ||||||
| 8. | Wells Fargo & Co. | 1.6 | ||||||
| 9. | UnitedHealth Group, Inc. | 1.6 | ||||||
| 10. | Citigroup, Inc. | 1.5 | ||||||
PORTFOLIO COMPOSITION BY SECTOR*** | ||||
| Information Technology | 22.3 | % | ||
| Financials | 13.9 | |||
| Health Care | 13.7 | |||
| Consumer Discretionary | 12.5 | |||
| Industrials | 9.6 | |||
| Consumer Staples | 8.3 | |||
| Energy | 5.7 | |||
| Utilities | 3.0 | |||
| Materials | 2.7 | |||
| Real Estate | 2.3 | |||
| Telecommunication Services | 1.4 | |||
| Put Options | 0.9 | |||
| Short-Term Investments | 3.7 | |||
| * | The return shown is based on net asset values calculated for shareholder transactions and may differ from the return shown in the financial highlights, which reflects adjustments made to the net asset values in accordance with accounting principles generally accepted in the United States of America. |
| ** | The adviser seeks to achieve the Fund’s objective. There can be no guarantee it will be achieved. |
| *** | Percentages indicated are based on total investments as of June 30, 2017. The Fund’s portfolio composition is subject to change. |
| (1) | On April 3, 2017, the Fund’s Select Class Shares were renamed Class I Shares. |
| JUNE 30, 2017 | J.P. MORGAN LARGE CAP FUNDS | 13 | ||||||
Table of Contents
JPMorgan Hedged Equity Fund
FUND COMMENTARY
TWELVE MONTHS ENDED JUNE 30, 2017 (Unaudited) (continued)
AVERAGE ANNUAL TOTAL RETURNS AS OF JUNE 30, 2017 | ||||||||||||||
| INCEPTION DATE OF CLASS | 1 YEAR | 3 YEAR | SINCE INCEPTION | |||||||||||
CLASS A SHARES | December 13, 2013 | |||||||||||||
With Sales Charge* | 7.51 | % | 4.15 | % | 5.26 | % | ||||||||
Without Sales Charge | 13.46 | 6.03 | 6.87 | |||||||||||
CLASS C SHARES | December 13, 2013 | |||||||||||||
With CDSC** | 11.93 | 5.50 | 6.33 | |||||||||||
Without CDSC | 12.93 | 5.50 | 6.33 | |||||||||||
CLASS I SHARES (FORMERLY SELECT CLASS SHARES) | December 13, 2013 | 13.78 | 6.32 | 7.14 | ||||||||||
CLASS R5 SHARES | December 13, 2013 | 14.02 | 6.52 | 7.36 | ||||||||||
CLASS R6 SHARES | December 13, 2013 | 14.01 | 6.55 | 7.39 | ||||||||||
| * | Sales Charge for Class A Shares is 5.25%. |
| ** | Assumes a 1% CDSC (contingent deferred sales charge) for the one year period and 0% CDSC thereafter. |
LIFE OF FUND PERFORMANCE (12/13/13 TO 6/30/2017)
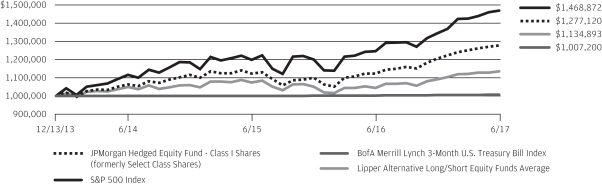
The performance quoted is past performance and is not a guarantee of future results. Mutual funds are subject to certain market risks. Investment returns and principal value of an investment will fluctuate so that an investor’s shares, when redeemed, may be worth more or less than their original cost. Current performance may be higher or lower than the performance data shown. For up-to-date month-end performance information please call 1-800-480-4111.
The Fund commenced operations on December 13, 2013.
The graph illustrates comparative performance for $1,000,000 invested in Class I Shares of the JPMorgan Hedged Equity Fund, the S&P 500 Index, the BofA Merrill Lynch 3-Month U.S. Treasury Bill Index and the Lipper Alternative Long/Short Equity Funds Average from December 13, 2013 to June 30, 2017. The performance of the Fund assumes reinvestment of all dividends and capital gain distributions, if any, and does not include a sales charge. The performance of the S&P 500 Index and the BofA Merrill Lynch 3-Month U.S. Treasury Bill Index does not reflect the deduction of expenses or a sales charge associated with a mutual fund and approximates the minimum possible dividend reinvestment of the securities included in the benchmarks, if applicable. The performance of the Lipper Alternative Long/Short Equity Funds Average includes expenses associated with a mutual fund, such as investment management fees. These expenses are not identical to the expenses charged by the Fund. The S&P 500 Index is an unmanaged index generally representative of the performance of large companies in the U.S. stock market. The BofA Merrill
Lynch 3-Month U.S. Treasury Bill Index is comprised of a single issue purchased at the beginning of the month and held for a full month. Each month the index is rebalanced and the issue selected is the outstanding Treasury Bill that matures closest to, but not beyond, 3 months from the rebalancing date. Investors cannot invest directly in an index. The Lipper Alternative Long/Short Equity Funds Average is an average based on the total returns of all mutual funds within the funds designated category as determined by Lipper, Inc.
Class I Shares have a $1,000,000 minimum initial investment.
Subsequent to the inception date of the Fund and through May 30, 2014, the Fund did not experience any shareholder activity. If such shareholder activity had occurred, the Fund’s performance may have been impacted.
Fund performance may reflect the waiver of the Fund’s fees and reimbursement of expenses for certain periods since the inception date. Without these waivers and reimbursements, performance would have been lower. Also, performance shown in this section does not reflect the deduction of taxes that a shareholder would pay on Fund distributions or redemptions of Fund shares.
The returns shown are based on net asset values calculated for shareholder transactions and may differ from the returns shown in the financial highlights, which reflect adjustments made to the net asset values in accordance with accounting principles generally accepted in the United States of America.
| 14 | J.P. MORGAN LARGE CAP FUNDS | JUNE 30, 2017 | ||||
Table of Contents
JPMorgan Large Cap Growth Fund
FUND COMMENTARY
TWELVE MONTHS ENDED JUNE 30, 2017 (Unaudited)
| REPORTING PERIOD RETURN: | ||||
| Fund (Class I Shares)*(1) | 27.65% | |||
| Russell 1000 Growth Index | 20.42% | |||
| Net Assets as of 6/30/2017 (In Thousands) | $12,276,704 | |||
INVESTMENT OBJECTIVE**
The JPMorgan Large Cap Growth Fund (the “Fund”) seeks long-term capital appreciation.
WHAT WERE THE MAIN DRIVERS OF THE FUND’S PERFORMANCE?
The Fund’s Class I Shares outperformed the Russell 1000 Growth Index (the “Benchmark”) for the twelve months ended June 30, 2017. The Fund’s security selection and overweight position in the technology sector and its security selection in the consumer discretionary sector were leading contributors to performance relative to the Benchmark. The Fund’s security selection in the materials & processing sector and its overweight position in the energy sector were leading detractors from relative performance.
Leading individual contributors to relative performance included the Fund’s overweight positions in Nvidia Corp., Intuitive Surgical Inc. and Delta Air Lines Inc. Shares of NVidia, a maker of computer graphics semiconductors and software, rose amid growth in its gaming and artificial intelligence segments. Shares of Intuitive Surgical, a maker of robotic and assisted surgery technologies, rose on better-than-expected earnings. Shares of Delta Air Lines, an airline operator, rose after the company increased its dividend, unveiled a $5 billion stock repurchase plan and forecast growth in profit margins.
Leading individual detractors from relative performance included the Fund’s underweight positions in Apple Inc. and its overweight positions in Acuity Brands Inc. and Monster Beverage Corp. Shares of Apple, a maker of smartphones, computers and related devices, rose after the company posted earnings growth on better-than-expected sales and pricing for its iPhones. Shares of Acuity Brands, a maker of lighting and building management systems, fell in the first half of the reporting period after the company reported lower-than-expected earnings. Shares of Monster Beverage, a maker of energy drinks, fell late in 2016 after the company reported lower-than-expected earnings.
HOW WAS THE FUND POSITIONED?
The Fund’s portfolio managers utilized a bottom-up approach to stock selection, rigorously researching individual companies in an effort to construct portfolios of stocks that have strong fundamentals and positive price momentum. The Fund’s portfolio managers sought to invest in companies with attractive
fundamentals that, in their view, possessed the potential to significantly exceed expectations for a prolonged period of time.
| TOP TEN EQUITY HOLDINGS OF THE PORTFOLIO*** | ||||||||
| 1. | Alphabet, Inc., Class C | 5.9 | % | |||||
| 2. | Amazon.com, Inc. | 5.5 | ||||||
| 3. | Apple, Inc. | 4.2 | ||||||
| 4. | Facebook, Inc., Class A | 3.6 | ||||||
| 5. | Mastercard, Inc., Class A | 3.6 | ||||||
| 6. | Home Depot, Inc. (The) | 3.6 | ||||||
| 7. | NVIDIA Corp. | 3.3 | ||||||
| 8. | Intuitive Surgical, Inc. | 3.3 | ||||||
| 9. | Comcast Corp., Class A | 2.8 | ||||||
| 10. | Microsoft Corp. | 2.5 | ||||||
PORTFOLIO COMPOSITION BY SECTOR*** | ||||
| Information Technology | 42.3 | % | ||
| Consumer Discretionary | 20.8 | |||
| Health Care | 12.6 | |||
| Industrials | 8.7 | |||
| Financials | 6.4 | |||
| Materials | 2.8 | |||
| Consumer Staples | 2.2 | |||
| Others (each less than 1.0%) | 1.5 | |||
| Short-Term Investment | 2.7 | |||
| * | The return shown is based on net asset values calculated for shareholder transactions and may differ from the return shown in the financial highlights, which reflects adjustments made to the net asset values in accordance with accounting principles generally accepted in the United States of America. |
| ** | The adviser seeks to achieve the Fund’s objective. There can be no guarantee it will be achieved. |
| *** | Percentages indicated are based on total investments as of June 30, 2017. The Fund’s portfolio composition is subject to change. |
| (1) | On April 3, 2017, the Fund’s Select Class Shares were renamed Class I Shares. |
| JUNE 30, 2017 | J.P. MORGAN LARGE CAP FUNDS | 15 | ||||||
Table of Contents
JPMorgan Large Cap Growth Fund
FUND COMMENTARY
TWELVE MONTHS ENDED JUNE 30, 2017 (Unaudited) (continued)
AVERAGE ANNUAL TOTAL RETURNS AS OF JUNE 30, 2017 | ||||||||||||||
| INCEPTION DATE OF CLASS | 1 YEAR | 5 YEAR | 10 YEAR | |||||||||||
CLASS A SHARES | February 22, 1994 | |||||||||||||
With Sales Charge* | 20.79 | % | 12.45 | % | 8.59 | % | ||||||||
Without Sales Charge | 27.46 | 13.67 | 9.18 | |||||||||||
CLASS C SHARES | November 4, 1997 | |||||||||||||
With CDSC** | 25.79 | 13.09 | 8.62 | |||||||||||
Without CDSC | 26.79 | 13.09 | 8.62 | |||||||||||
CLASS I SHARES (FORMERLY SELECT CLASS SHARES) | February 28, 1992 | 27.65 | 13.86 | 9.39 | ||||||||||
CLASS R2 SHARES | November 3, 2008 | 27.14 | 13.38 | 8.91 | ||||||||||
CLASS R3 SHARES | September 9, 2016 | 27.34 | 13.63 | 9.21 | ||||||||||
CLASS R4 SHARES | September 9, 2016 | 27.65 | 13.86 | 9.39 | ||||||||||
CLASS R5 SHARES | April 14, 2009 | 27.88 | 14.07 | 9.56 | ||||||||||
CLASS R6 SHARES | November 30, 2010 | 28.00 | 14.16 | 9.62 | ||||||||||
| * | Sales Charge for Class A Shares is 5.25%. |
| ** | Assumes a 1% CDSC (contingent deferred sales charge) for the one year period and 0% CDSC thereafter. |
TEN YEAR PERFORMANCE (6/30/07 TO 6/30/2017)
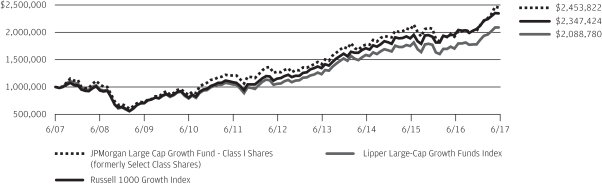
The performance quoted is past performance and is not a guarantee of future results. Mutual funds are subject to certain market risks. Investment returns and principal value of an investment will fluctuate so that an investor’s shares, when redeemed, may be worth more or less than their original cost. Current performance may be higher or lower than the performance data shown. For up-to-date month-end performance information please call 1-800-480-4111.
Returns for Class R2, Class R3, Class R4 and Class R5 Shares prior to their inception dates are based on the performance of Class I Shares. With respect to Class R2 and Class R3 Shares, prior class performance has been adjusted to reflect the differences in expenses between classes. The actual returns for Class R4 would have been similar to those shown because Class R4 Shares had similar expenses to Class I Shares. The actual returns for Class R5 Shares would have been different than those shown because Class R5 Shares have different expenses than Class I Shares.
Returns for Class R6 Shares prior to their inception date are based on the performance of Class R5 Shares and, prior to April 14, 2009, Class I Shares. The actual returns for Class R6 Shares would have been different than those shown because Class R6 Shares have different expenses than Class R5 and Class I Shares.
The graph illustrates comparative performance for $1,000,000 invested in Class I Shares of the JPMorgan Large Cap Growth Fund, the Russell 1000 Growth Index and the Lipper Large-Cap Growth Funds Index from June 30, 2007 to June 30, 2017. The performance of the Fund assumes reinvestment of all dividends and capital gain distributions, if any, and does not include a sales charge. The
performance of the Russell 1000 Growth Index does not reflect the deduction of expenses or a sales charge associated with a mutual fund and has been adjusted to reflect reinvestment of all dividends and capital gain distributions of the securities included in the benchmark, if applicable. The performance of the Lipper Large-Cap Growth Funds Index includes expenses associated with a mutual fund, such as investment management fees. These expenses are not identical to the expenses incurred by the Fund. The Russell 1000 Growth Index is an unmanaged index which measures the performance of those Russell 1000 companies with higher price-to-book ratios and higher forecasted growth values. The Lipper Large-Cap Growth Funds Index is an index based on the total returns of certain mutual funds within the Fund’s designated category as determined by Lipper, Inc. Investors cannot invest directly in an index.
Class I Shares have a $1,000,000 minimum initial investment.
Fund performance may reflect the waiver of the Fund’s fees and reimbursement of expenses for certain periods since the inception date. Without these waivers and reimbursements, performance would have been lower. Also, performance shown in this section does not reflect the deduction of taxes that a shareholder would pay on Fund distributions or redemptions of Fund shares.
The returns shown are based on net asset values calculated for shareholder transactions and may differ from the returns shown in the financial highlights, which reflect adjustments made to the net asset values in accordance with accounting principles generally accepted in the United States of America.
| 16 | J.P. MORGAN LARGE CAP FUNDS | JUNE 30, 2017 | ||||
Table of Contents
FUND COMMENTARY
TWELVE MONTHS ENDED JUNE 30, 2017 (Unaudited)
| REPORTING PERIOD RETURN: | ||||
| Fund (Class I Shares)*(1) | 28.61% | |||
| Russell 1000 Value Index | 15.53% | |||
| Net Assets as of 6/30/2017 (In Thousands) | $1,052,264 | |||
INVESTMENT OBJECTIVE**
The JPMorgan Large Cap Value Fund (the “Fund”) seeks capital appreciation with the incidental goal of achieving current income by investing primarily in equity securities.
WHAT WERE THE MAIN DRIVERS OF THE FUND’S PERFORMANCE?
The Fund’s Class I Shares outperformed the Russell 1000 Value Index (the “Benchmark”) for the twelve months ended June 30, 2017.
The Fund’s security selection and overweight positions in the consumer cyclicals and auto & transportation sectors were leading contributors to performance relative to the Benchmark. The Fund’s security selection in the pharmaceutical/medical technology sector and its underweight position in the software & services sector were leading detractors from relative performance.
Leading individual contributors to performance relative to the Benchmark included the Fund’s overweight positions in Harman International Industries Inc., Southwest Airlines Co. and Royal Caribbean Cruises Ltd. Shares of Harman International Industries, a maker of audio systems for the consumer and commercial markets, rose on news of Samsung Electronics Co.’s acquisition of the company. Shares of Southwest Airlines, an airline operator, rose after the company increased its dividend and unveiled a $2 billion share repurchase program. Shares of Royal Caribbean Cruises, rose after the company reported better-than-expected earnings and sales.
Leading individual detractors from relative performance included the Fund’s overweight positions in Macy’s Inc., Wells Fargo & Co. and Gilead Sciences Inc. Shares of Macy’s, a department store chain, fell after the company warned of lower-than-forecast gross margins. Shares of Wells Fargo, a banking and financial services company, fell amid falling mortgage revenue and higher expenses in the wake of the bank’s multi-million dollar settlement for opening fictitious or unauthorized bank accounts. Shares of Gilead Sciences, a drug maker, fell after the company reported lower-than-expected earnings.
HOW WAS THE FUND POSITIONED?
The Fund’s portfolio managers combined a bottom-up fundamental approach to security selection with a systematic valuation process. Overall, the Fund’s portfolio managers looked to
take advantage of mispriced stocks that they believed appeared attractive relative to their fair value.
| TOP TEN EQUITY HOLDINGS OF THE PORTFOLIO*** | ||||||||
| 1. | Wells Fargo & Co. | 4.6 | % | |||||
| 2. | Citigroup, Inc. | 4.4 | ||||||
| 3. | General Motors Co. | 3.6 | ||||||
| 4. | Bank of America Corp. | 3.5 | ||||||
| 5. | Pfizer, Inc. | 2.6 | ||||||
| 6. | Delta Air Lines, Inc. | 2.4 | ||||||
| 7. | Broadcom Ltd. | 2.0 | ||||||
| 8. | Royal Caribbean Cruises Ltd. | 1.9 | ||||||
| 9. | EOG Resources, Inc. | 1.9 | ||||||
| 10. | Magna International, Inc., (Canada) | 1.8 | ||||||
PORTFOLIO COMPOSITION BY SECTOR*** | ||||
| Financials | 29.6 | % | ||
| Consumer Discretionary | 18.8 | |||
| Industrials | 13.0 | |||
| Health Care | 10.0 | |||
| Energy | 9.6 | |||
| Information Technology | 5.8 | |||
| Materials | 5.5 | |||
| Consumer Staples | 4.0 | |||
| Real Estate | 1.5 | |||
| Telecommunication Services | 1.4 | |||
| Short-Term Investment | 0.8 | |||
| * | The return shown is based on net asset values calculated for shareholder transactions and may differ from the return shown in the financial highlights, which reflects adjustments made to the net asset values in accordance with accounting principles generally accepted in the United States of America. |
| ** | The adviser seeks to achieve the Fund’s objective. There can be no guarantee it will be achieved. |
| *** | Percentages indicated are based on total investments as of June 30, 2017. The Fund’s portfolio composition is subject to change. |
| (1) | On April 3, 2017, the Fund’s Select Class Shares were renamed Class I Shares. |
JUNE 30, 2017 | J.P. MORGAN LARGE CAP FUNDS | 17 | ||||||
Table of Contents
JPMorgan Large Cap Value Fund
FUND COMMENTARY
TWELVE MONTHS ENDED JUNE 30, 2017 (Unaudited) (continued)
AVERAGE ANNUAL TOTAL RETURNS AS OF JUNE 30, 2017 | ||||||||||||||
| INCEPTION DATE OF CLASS | 1 YEAR | 5 YEAR | 10 YEAR | |||||||||||
CLASS A SHARES | February 18, 1992 | |||||||||||||
With Sales Charge* | 21.76 | % | 15.29 | % | 5.45 | % | ||||||||
Without Sales Charge | 28.47 | 16.54 | 6.03 | |||||||||||
CLASS C SHARES | March 22, 1999 | |||||||||||||
With CDSC** | 26.72 | 15.94 | 5.47 | |||||||||||
Without CDSC | 27.72 | 15.94 | 5.47 | |||||||||||
CLASS I SHARES (FORMERLY SELECT CLASS SHARES) | March 1, 1991 | 28.61 | 16.72 | 6.20 | ||||||||||
CLASS R2 SHARES | November 3, 2008 | 28.03 | 16.22 | 5.73 | ||||||||||
CLASS R5 SHARES | May 15, 2006 | 28.82 | 16.95 | 6.43 | ||||||||||
CLASS R6 SHARES | November 30, 2010 | 28.90 | 17.00 | 6.46 | ||||||||||
| * | Sales Charge for Class A Shares is 5.25%. |
| ** | Assumes a 1% CDSC (contingent deferred sales charge) for the one year period and 0% CDSC thereafter. |
TEN YEAR PERFORMANCE (6/30/07 TO 6/30/17)
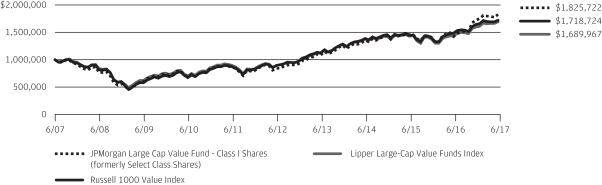
The performance quoted is past performance and is not a guarantee of future results. Mutual funds are subject to certain market risks. Investment returns and principal value of an investment will fluctuate so that an investor’s shares, when redeemed, may be worth more or less than their original cost. Current performance may be higher or lower than the performance data shown. For up-to-date month-end performance information please call 1-800-480-4111.
Returns for Class R2 Shares prior to their inception date are based on the performance of Class I Shares. Prior class performance has been adjusted to reflect the differences in expenses between classes.
Returns for Class R6 Shares prior to their inception date are based on the performance of Class R5 Shares. The actual returns for Class R6 Shares would have been different than those shown because Class R6 Shares have different expenses than Class R5 Shares.
The graph illustrates comparative performance for $1,000,000 invested in Class I Shares of the JPMorgan Large Cap Value Fund, the Russell 1000 Value Index and the Lipper Large-Cap Value Funds Index from June 30, 2007 to June 30, 2017. The performance of the Fund assumes reinvestment of all dividends and capital gain distributions if any, and does not include a sales charge. The performance of the Russell 1000 Value Index does not reflect the deduction of expenses or a sales charge associated with a mutual fund and has been
adjusted to reflect reinvestment of all dividends and capital gain distributions of the securities included in the benchmark, if applicable. The performance of the Lipper Large-Cap Value Funds Index includes expenses associated with a mutual fund, such as investment management fees. These expenses are not identical to the expenses incurred by the Fund. The Russell 1000 Value Index is an unmanaged index which measures the performance of those Russell 1000 companies with lower price-to-book ratios and lower forecasted growth values. The Lipper Large-Cap Value Funds Index is an index based on the total returns of certain mutual funds within the Fund’s designated category as determined by Lipper, Inc. Investors cannot invest directly in an index.
Class I Shares have a $1,000,000 minimum initial investment.
Fund performance may reflect the waiver of the Fund’s fees and reimbursement of expenses for certain periods since the inception date. Without these waivers and reimbursements, performance would have been lower. Also, performance shown in this section does not reflect the deduction of taxes that a shareholder would pay on Fund distributions or redemptions of Fund shares.
The returns shown are based on net asset values calculated for shareholder transactions and may differ from the returns shown in the financial highlights, which reflect adjustments made to the net asset values in accordance with accounting principles generally accepted in the United States of America.
| 18 | J.P. MORGAN LARGE CAP FUNDS | JUNE 30, 2017 | ||||
Table of Contents
FUND COMMENTARY
TWELVE MONTHS ENDED JUNE 30, 2017 (Unaudited)
| REPORTING PERIOD RETURN: | ||||
| Fund (Class L Shares)*(1) | 20.20% | |||
| S&P 500 Index | 17.90% | |||
| Net Assets as of 6/30/2017 (In Thousands) | $14,296,993 | |||
INVESTMENT OBJECTIVE**
The JPMorgan U.S. Equity Fund (the “Fund”) seeks to provide high total return from a portfolio of selected equity securities.
WHAT WERE THE MAIN DRIVERS OF THE FUND’S PERFORMANCE?
The Fund’s Class L Shares outperformed the S&P 500 Index (the “Benchmark”) for the twelve months ended June 30, 2017. The Fund’s security selection in the telecommunications and health services & systems sectors was a leading contributor to performance relative to the Benchmark, while the Fund’s security selection in the pharmaceutical/medical technology and financials sectors was a leading detractor from relative performance.
Leading individual contributors to relative performance included the Fund’s overweight positions in UnitedHealth Group Inc. and United Continental Holdings Inc. and its underweight position in Intel Corp. Shares of UnitedHealth Group Inc., a health insurance provider, rose after the company reported better-than-expected earnings and raised its revenue forecast. Shares of United Continental Holdings, an airline operator, rose on revenue growth and news that investor Warren Buffett had purchased a large stake in the company. Shares of Intel, a semiconductor manufacturer, fell after the company reported lackluster earnings growth.
Leading individual detractors from relative performance included the Fund’s overweight positions in Bristol-Myers Squibb Co., General Electric Co. and Wells Fargo & Co. Bristol-Myers Squibb, a drug maker, fell after the company reduced its earnings forecast and amid investor concerns about proposed changes to federal health insurance policies. Shares of General Electric, an industrial conglomerate, fell amid investor concerns about the company’s strategic direction under a new chief executive. Shares of Wells Fargo, a banking and financial services company, fell amid falling mortgage revenue and higher expenses in the wake of the bank’s $185 million settlement for opening unauthorized bank accounts.
HOW WAS THE FUND POSITIONED?
The Fund’s portfolio managers employed a bottom-up fundamental approach to stock selection, researching companies to determine what they believed to be their underlying value and potential for future earnings growth. As a result of this
approach to stock selection, the Fund’s largest average overweight positions relative to the Benchmark for the year ended June 30, 3017 were in the insurance and media sectors, while the Fund’s largest underweight positions were in the consumer staples and real estate investment trust sectors.
| TOP TEN EQUITY HOLDINGS OF THE PORTFOLIO*** | ||||||||
| 1. | Apple, Inc. | 4.3 | % | |||||
| 2. | Microsoft Corp. | 3.3 | ||||||
| 3. | UnitedHealth Group, Inc. | 3.1 | ||||||
| 4. | Citigroup, Inc. | 2.7 | ||||||
| 5. | Pfizer, Inc. | 2.3 | ||||||
| 6. | Alphabet, Inc., Class A | 2.3 | ||||||
| 7. | Walt Disney Co. (The) | 2.3 | ||||||
| 8. | PepsiCo, Inc. | 2.2 | ||||||
| 9. | Bank of America Corp. | 2.1 | ||||||
| 10. | Amazon.com, Inc. | 1.9 | ||||||
PORTFOLIO COMPOSITION BY SECTOR*** | ||||
| Information Technology | 23.7 | % | ||
| Financials | 15.9 | |||
| Health Care | 14.1 | |||
| Consumer Discretionary | 13.7 | |||
| Industrials | 12.5 | |||
| Consumer Staples | 6.5 | |||
| Energy | 6.3 | |||
| Utilities | 2.4 | |||
| Materials | 2.2 | |||
| Telecommunication Services | 1.1 | |||
| Real Estate | 0.6 | |||
| Short-Term Investment | 1.0 | |||
| * | The return shown is based on net asset values calculated for shareholder transactions and may differ from the return shown in the financial highlights, which reflects adjustments made to the net asset values in accordance with accounting principles generally accepted in the United States of America. |
| ** | The adviser seeks to achieve the Fund’s objective. There can be no guarantee it will be achieved. |
| *** | Percentages indicated are based on total investments as of June 30, 2017. The Fund’s portfolio composition is subject to change. |
| (1) | On December 1, 2016, the Fund’s Institutional Class Shares were redesignated as and renamed Class L Shares. |
| JUNE 30, 2017 | J.P. MORGAN LARGE CAP FUNDS | 19 | ||||||
Table of Contents
JPMorgan U.S. Equity Fund
FUND COMMENTARY
TWELVE MONTHS ENDED JUNE 30, 2017 (Unaudited) (continued)
AVERAGE ANNUAL TOTAL RETURNS AS OF JUNE 30, 2017 | ||||||||||||||
| INCEPTION DATE OF CLASS | 1 YEAR | 5 YEAR | 10 YEAR | |||||||||||
CLASS A SHARES | September 10, 2001 | |||||||||||||
With Sales Charge* | 13.59 | % | 13.61 | % | 7.20 | % | ||||||||
Without Sales Charge | 19.86 | 14.83 | 7.77 | |||||||||||
CLASS C SHARES | September 10, 2001 | |||||||||||||
With CDSC** | 18.23 | 14.24 | 7.23 | |||||||||||
Without CDSC | 19.23 | 14.24 | 7.23 | |||||||||||
CLASS I SHARES (FORMERLY SELECT CLASS SHARES) | September 10, 2001 | 20.05 | 15.04 | 8.00 | ||||||||||
CLASS L SHARES (FORMERLY INSTITUTIONAL CLASS SHARES) | September 17, 1993 | 20.20 | 15.19 | 8.15 | ||||||||||
CLASS R2 SHARES | November 3, 2008 | 19.58 | 14.54 | 7.54 | ||||||||||
CLASS R3 SHARES | September 9, 2016 | 19.80 | 14.82 | 7.77 | ||||||||||
CLASS R4 SHARES | September 9, 2016 | 20.05 | 15.04 | 8.00 | ||||||||||
CLASS R5 SHARES | May 15, 2006 | 20.33 | 15.26 | 8.20 | ||||||||||
CLASS R6 SHARES | November 30, 2010 | 20.37 | 15.32 | 8.25 | ||||||||||
| * | Sales Charge for Class A Shares is 5.25%. |
| ** | Assumes a 1% CDSC (contingent deferred sales charge) for the one year period and 0% CDSC thereafter. |
TEN YEAR PERFORMANCE (6/30/07 TO 6/30/17)
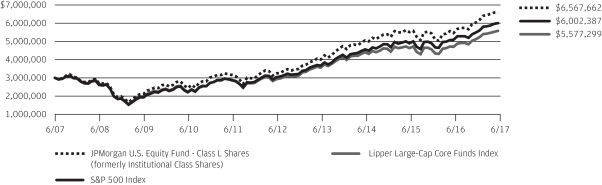
The performance quoted is past performance and is not a guarantee of future results. Mutual funds are subject to certain market risks. Investment returns and principal value of an investment will fluctuate so that an investor’s shares, when redeemed, may be worth more or less than their original cost. Current performance may be higher or lower than the performance data shown. For up-to-date month-end performance information please call 1-800-480-4111.
Returns for Class R2 Shares and Class R3 prior to their inception date are based on the performance of Class A Shares. The actual returns of Class R2 Shares and Class R3 Shares would have been lower than those shown because Class R2 Shares and Class R3 Shares have higher expenses than Class A Shares.
Returns for Class R6 Shares prior to their inception date are based on the performance of Class R5 Shares. The actual returns for Class R6 Shares would have been different than those shown because Class R6 Shares have different expenses than Class R5 Shares.
Returns for Class R4 Shares prior to their inception date are based on the performance of Class I Shares. The actual returns for Class R4 Shares would have been similar than those shown because Class R4 Shares have similar expenses than Class I Shares.
The graph illustrates comparative performance for $3,000,000 invested in Institutional Class Shares of the JPMorgan U.S. Equity Fund, the S&P 500 Index and the Lipper Large-Cap Core Funds Index from June 30, 2007 to June 30, 2017. The performance of the Fund assumes reinvestment of all dividends and
capital gain distributions, if any, and does not include a sales charge. The performance of the S&P 500 Index does not reflect the deduction of expenses or a sales charge associated with a mutual fund and has been adjusted to reflect reinvestment of all dividends and capital gain distributions of the securities included in the benchmark, if applicable. The performance of the Lipper Large-Cap Core Funds Index includes expenses associated with a mutual fund, such as investment management fees. These expenses are not identical to the expenses incurred by the Fund. The S&P 500 Index is an unmanaged index generally representative of the performance of large companies in the U.S. stock market. The Lipper Large-Cap Core Funds Index is an index based on the total returns of certain mutual funds within the Fund’s designated category as determined by Lipper, Inc. Investors cannot invest directly in an index.
Class L Shares have a $3,000,000 minimum initial investment.
Fund performance may reflect the waiver of the Fund’s fees and reimbursement of expenses for certain periods since the inception date. Without these waivers and reimbursements, performance would have been lower. Also, performance shown in this section does not reflect the deduction of taxes that a shareholder would pay on Fund distributions or redemptions of Fund shares.
The returns shown are based on net asset values calculated for shareholder transactions and may differ from the returns shown in the financial highlights, which reflect adjustments made to the net asset values in accordance with accounting principles generally accepted in the United States of America.
| 20 | J.P. MORGAN LARGE CAP FUNDS | JUNE 30, 2017 | ||||
Table of Contents
JPMorgan Disciplined Equity Fund
SCHEDULE OF PORTFOLIO INVESTMENTS
AS OF JUNE 30, 2017
(Amounts in thousands)
| SHARES | SECURITY DESCRIPTION | VALUE($) | ||||||
Common Stocks — 98.6% | ||||||||
Consumer Discretionary — 12.9% |
| |||||||
Auto Components — 0.4% |
| |||||||
| 273 | Delphi Automotive plc | 23,894 | ||||||
| 52 | Lear Corp. | 7,408 | ||||||
|
| |||||||
| 31,302 | ||||||||
|
| |||||||
Automobiles — 0.4% |
| |||||||
| 1,363 | Ford Motor Co. | 15,250 | ||||||
| 460 | General Motors Co. | 16,060 | ||||||
|
| |||||||
| 31,310 | ||||||||
|
| |||||||
Hotels, Restaurants & Leisure — 1.0% |
| |||||||
| 206 | Royal Caribbean Cruises Ltd. | 22,550 | ||||||
| 878 | Starbucks Corp. | 51,210 | ||||||
|
| |||||||
| 73,760 | ||||||||
|
| |||||||
Household Durables — 0.4% |
| |||||||
| 243 | DR Horton, Inc. | 8,386 | ||||||
| 78 | Newell Brands, Inc. | 4,172 | ||||||
| 522 | PulteGroup, Inc. | 12,797 | ||||||
| 112 | Toll Brothers, Inc. | 4,406 | ||||||
|
| |||||||
| 29,761 | ||||||||
|
| |||||||
Internet & Direct Marketing Retail — 2.0% |
| |||||||
| 150 | Amazon.com, Inc. (a) | 145,512 | ||||||
|
| |||||||
Media — 4.4% |
| |||||||
| 188 | Charter Communications, Inc., Class A (a) | 63,360 | ||||||
| 2,223 | Comcast Corp., Class A | 86,504 | ||||||
| 344 | DISH Network Corp., Class A (a) | 21,616 | ||||||
| 2,006 | Sirius XM Holdings, Inc. | 10,976 | ||||||
| 194 | Time Warner, Inc. | 19,459 | ||||||
| 2,474 | Twenty-First Century Fox, Inc., Class A | 70,127 | ||||||
| 496 | Walt Disney Co. (The) | 52,750 | ||||||
|
| |||||||
| 324,792 | ||||||||
|
| |||||||
Multiline Retail — 0.3% |
| |||||||
| 188 | Dollar General Corp. | 13,583 | ||||||
| 53 | Dollar Tree, Inc. (a) | 3,720 | ||||||
| 238 | Macy’s, Inc. | 5,522 | ||||||
|
| |||||||
| 22,825 | ||||||||
|
| |||||||
Specialty Retail — 3.8% |
| |||||||
| 11 | AutoZone, Inc. (a) | 6,275 | ||||||
| 203 | Best Buy Co., Inc. | 11,618 | ||||||
| 615 | Home Depot, Inc. (The) | 94,328 | ||||||
| 787 | Lowe’s Cos., Inc. | 61,050 | ||||||
| 110 | O’Reilly Automotive, Inc. (a) | 24,003 | ||||||
| 380 | Ross Stores, Inc. | 21,910 | ||||||
| 834 | TJX Cos., Inc. (The) | 60,192 | ||||||
|
| |||||||
| 279,376 | ||||||||
|
| |||||||
| SHARES | SECURITY DESCRIPTION | VALUE($) | ||||||
Textiles, Apparel & Luxury Goods — 0.2% |
| |||||||
| 247 | NIKE, Inc., Class B | 14,544 | ||||||
|
| |||||||
Total Consumer Discretionary | 953,182 | |||||||
|
| |||||||
Consumer Staples — 8.6% |
| |||||||
Beverages — 3.2% |
| |||||||
| 157 | Brown-Forman Corp., Class B | 7,606 | ||||||
| 445 | Coca-Cola Co. (The) | 19,953 | ||||||
| 245 | Constellation Brands, Inc., Class A | 47,391 | ||||||
| 63 | Dr Pepper Snapple Group, Inc. | 5,785 | ||||||
| 507 | Molson Coors Brewing Co., Class B | 43,795 | ||||||
| 949 | PepsiCo, Inc. | 109,586 | ||||||
|
| |||||||
| 234,116 | ||||||||
|
| |||||||
Food & Staples Retailing — 1.6% |
| |||||||
| 279 | Costco Wholesale Corp. | 44,558 | ||||||
| 323 | Kroger Co. (The) | 7,536 | ||||||
| 779 | Walgreens Boots Alliance, Inc. | 61,001 | ||||||
| 87 | Wal-Mart Stores, Inc. | 6,572 | ||||||
|
| |||||||
| 119,667 | ||||||||
|
| |||||||
Food Products — 1.0% |
| |||||||
| 95 | Archer-Daniels-Midland Co. | 3,920 | ||||||
| 21 | JM Smucker Co. (The) | 2,442 | ||||||
| 191 | Kraft Heinz Co. (The) | 16,337 | ||||||
| 1,232 | Mondelez International, Inc., Class A | 53,189 | ||||||
|
| |||||||
| 75,888 | ||||||||
|
| |||||||
Household Products — 1.3% |
| |||||||
| 310 | Kimberly-Clark Corp. | 40,033 | ||||||
| 627 | Procter & Gamble Co. (The) | 54,665 | ||||||
|
| |||||||
| 94,698 | ||||||||
|
| |||||||
Tobacco — 1.5% |
| |||||||
| 305 | Altria Group, Inc. | 22,728 | ||||||
| 786 | Philip Morris International, Inc. | 92,292 | ||||||
|
| |||||||
| 115,020 | ||||||||
|
| |||||||
Total Consumer Staples | 639,389 | |||||||
|
| |||||||
Energy — 5.9% |
| |||||||
Energy Equipment & Services — 0.5% |
| |||||||
| 311 | Halliburton Co. | 13,288 | ||||||
| 350 | Schlumberger Ltd. | 23,030 | ||||||
|
| |||||||
| 36,318 | ||||||||
|
| |||||||
Oil, Gas & Consumable Fuels — 5.4% |
| |||||||
| 437 | Anadarko Petroleum Corp. | 19,827 | ||||||
| 138 | Apache Corp. | 6,611 | ||||||
| 443 | Cabot Oil & Gas Corp. | 11,109 | ||||||
| 519 | Chevron Corp. | 54,168 | ||||||
SEE NOTES TO FINANCIAL STATEMENTS.
| JUNE 30, 2017 | J.P. MORGAN LARGE CAP FUNDS | 21 | ||||||
Table of Contents
JPMorgan Disciplined Equity Fund
SCHEDULE OF PORTFOLIO INVESTMENTS
AS OF JUNE 30, 2017 (continued)
(Amounts in thousands)
| SHARES | SECURITY DESCRIPTION | VALUE($) | ||||||
Common Stocks — continued | ||||||||
Oil, Gas & Consumable Fuels — continued |
| |||||||
| 102 | Concho Resources, Inc. (a) | 12,348 | ||||||
| 280 | Diamondback Energy, Inc. (a) | 24,907 | ||||||
| 579 | EOG Resources, Inc. | 52,414 | ||||||
| 223 | EQT Corp. | 13,087 | ||||||
| 1,189 | Exxon Mobil Corp. | 95,996 | ||||||
| 529 | Kinder Morgan, Inc. | 10,142 | ||||||
| 545 | Occidental Petroleum Corp. | 32,623 | ||||||
| 168 | Phillips 66 | 13,917 | ||||||
| 264 | Pioneer Natural Resources Co. | 42,070 | ||||||
| 159 | Valero Energy Corp. | 10,704 | ||||||
|
| |||||||
| 399,923 | ||||||||
|
| |||||||
Total Energy | 436,241 | |||||||
|
| |||||||
Financials — 14.3% |
| |||||||
Banks — 6.0% |
| |||||||
| 5,539 | Bank of America Corp. | 134,374 | ||||||
| 216 | BB&T Corp. | 9,831 | ||||||
| 1,745 | Citigroup, Inc. | 116,673 | ||||||
| 1,514 | KeyCorp | 28,367 | ||||||
| 103 | PNC Financial Services Group, Inc. (The) | 12,824 | ||||||
| 395 | Regions Financial Corp. | 5,778 | ||||||
| 37 | SVB Financial Group (a) | 6,418 | ||||||
| 2,200 | Wells Fargo & Co. | 121,919 | ||||||
| 128 | Zions Bancorp | 5,617 | ||||||
|
| |||||||
| 441,801 | ||||||||
|
| |||||||
Capital Markets — 3.4% |
| |||||||
| 54 | Ameriprise Financial, Inc. | 6,861 | ||||||
| 901 | Bank of New York Mellon Corp. (The) | 45,956 | ||||||
| 13 | BlackRock, Inc. | 5,281 | ||||||
| 1,380 | Charles Schwab Corp. (The) | 59,276 | ||||||
| 32 | Goldman Sachs Group, Inc. (The) | 7,059 | ||||||
| 514 | Intercontinental Exchange, Inc. | 33,898 | ||||||
| 1,485 | Morgan Stanley | 66,185 | ||||||
| 311 | State Street Corp. | 27,906 | ||||||
|
| |||||||
| 252,422 | ||||||||
|
| |||||||
Consumer Finance — 0.9% |
| |||||||
| 160 | American Express Co. | 13,445 | ||||||
| 350 | Capital One Financial Corp. | 28,957 | ||||||
| 384 | Discover Financial Services | 23,904 | ||||||
|
| |||||||
| 66,306 | ||||||||
|
| |||||||
Diversified Financial Services — 1.4% |
| |||||||
| 610 | Berkshire Hathaway, Inc., Class B (a) | 103,252 | ||||||
| 97 | Voya Financial, Inc. | 3,593 | ||||||
|
| |||||||
| 106,845 | ||||||||
|
| |||||||
| SHARES | SECURITY DESCRIPTION | VALUE($) | ||||||
Insurance — 2.6% |
| |||||||
| 505 | American International Group, Inc. | 31,585 | ||||||
| 475 | Arthur J Gallagher & Co. | 27,208 | ||||||
| 344 | Chubb Ltd. | 50,015 | ||||||
| 364 | Hartford Financial Services Group, Inc. (The) | 19,117 | ||||||
| 1,227 | MetLife, Inc. | 67,419 | ||||||
|
| |||||||
| 195,344 | ||||||||
|
| |||||||
Total Financials | 1,062,718 | |||||||
|
| |||||||
Health Care — 14.2% |
| |||||||
Biotechnology — 2.8% |
| |||||||
| 165 | AbbVie, Inc. | 11,928 | ||||||
| 156 | Alexion Pharmaceuticals, Inc. (a) | 18,955 | ||||||
| 22 | Amgen, Inc. | 3,789 | ||||||
| 166 | Biogen, Inc. (a) | 45,155 | ||||||
| 34 | BioMarin Pharmaceutical, Inc. (a) | 3,079 | ||||||
| 436 | Celgene Corp. (a) | 56,597 | ||||||
| 660 | Gilead Sciences, Inc. | 46,699 | ||||||
| 190 | Vertex Pharmaceuticals, Inc. (a) | 24,460 | ||||||
|
| |||||||
| 210,662 | ||||||||
|
| |||||||
Health Care Equipment & Supplies — 2.2% |
| |||||||
| 968 | Abbott Laboratories | 47,075 | ||||||
| 156 | Becton Dickinson and Co. | 30,390 | ||||||
| 1,787 | Boston Scientific Corp. (a) | 49,527 | ||||||
| 18 | Cooper Cos., Inc. (The) | 4,306 | ||||||
| 211 | Danaher Corp. | 17,781 | ||||||
| 118 | Zimmer Biomet Holdings, Inc. | 15,087 | ||||||
|
| |||||||
| 164,166 | ||||||||
|
| |||||||
Health Care Providers & Services — 2.8% |
| |||||||
| 251 | Aetna, Inc. | 38,040 | ||||||
| 89 | Cigna Corp. | 14,816 | ||||||
| 44 | HCA Healthcare, Inc. (a) | 3,811 | ||||||
| 113 | Humana, Inc. | 27,284 | ||||||
| 650 | UnitedHealth Group, Inc. | 120,557 | ||||||
|
| |||||||
| 204,508 | ||||||||
|
| |||||||
Life Sciences Tools & Services — 0.8% |
| |||||||
| 256 | Agilent Technologies, Inc. | 15,168 | ||||||
| 108 | Illumina, Inc. (a) | 18,705 | ||||||
| 132 | Thermo Fisher Scientific, Inc. | 23,030 | ||||||
|
| |||||||
| 56,903 | ||||||||
|
| |||||||
Pharmaceuticals — 5.6% |
| |||||||
| 255 | Allergan plc | 61,982 | ||||||
| 965 | Bristol-Myers Squibb Co. | 53,792 | ||||||
| 680 | Eli Lilly & Co. | 55,925 | ||||||
| 605 | Johnson & Johnson | 79,969 | ||||||
SEE NOTES TO FINANCIAL STATEMENTS.
| 22 | J.P. MORGAN LARGE CAP FUNDS | JUNE 30, 2017 | ||||
Table of Contents
| SHARES | SECURITY DESCRIPTION | VALUE($) | ||||||
Common Stocks — continued | ||||||||
Pharmaceuticals — continued |
| |||||||
| 776 | Merck & Co., Inc. | 49,703 | ||||||
| 3,360 | Pfizer, Inc. | 112,848 | ||||||
|
| |||||||
| 414,219 | ||||||||
|
| |||||||
Total Health Care | 1,050,458 | |||||||
|
| |||||||
Industrials — 10.0% |
| |||||||
Aerospace & Defense — 1.6% |
| |||||||
| 216 | General Dynamics Corp. | 42,839 | ||||||
| 38 | L3 Technologies, Inc. | 6,289 | ||||||
| 118 | Northrop Grumman Corp. | 30,395 | ||||||
| 85 | Textron, Inc. | 4,026 | ||||||
| 270 | United Technologies Corp. | 33,030 | ||||||
|
| |||||||
| 116,579 | ||||||||
|
| |||||||
Air Freight & Logistics — 0.1% |
| |||||||
| 36 | FedEx Corp. | 7,889 | ||||||
|
| |||||||
Airlines — 0.8% |
| |||||||
| 512 | Delta Air Lines, Inc. | 27,541 | ||||||
| 451 | United Continental Holdings, Inc. (a) | 33,928 | ||||||
|
| |||||||
| 61,469 | ||||||||
|
| |||||||
Building Products — 0.6% |
| |||||||
| 237 | Allegion plc | 19,223 | ||||||
| 568 | Masco Corp. | 21,692 | ||||||
|
| |||||||
| 40,915 | ||||||||
|
| |||||||
Electrical Equipment — 0.5% |
| |||||||
| 465 | Eaton Corp. plc | 36,183 | ||||||
|
| |||||||
Industrial Conglomerates — 2.6% |
| |||||||
| 3,504 | General Electric Co. | 94,630 | ||||||
| 729 | Honeywell International, Inc. | 97,128 | ||||||
|
| |||||||
| 191,758 | ||||||||
|
| |||||||
Machinery — 2.2% |
| |||||||
| 30 | Deere & Co. | 3,695 | ||||||
| 50 | Fortive Corp. | 3,155 | ||||||
| 591 | Ingersoll-Rand plc | 53,989 | ||||||
| 442 | PACCAR, Inc. | 29,214 | ||||||
| 48 | Parker-Hannifin Corp. | 7,712 | ||||||
| 125 | Snap-on, Inc. | 19,812 | ||||||
| 328 | Stanley Black & Decker, Inc. | 46,129 | ||||||
|
| |||||||
| 163,706 | ||||||||
|
| |||||||
Road & Rail — 1.6% |
| |||||||
| 93 | Canadian Pacific Railway Ltd., (Canada) | 14,974 | ||||||
| 173 | Norfolk Southern Corp. | 21,079 | ||||||
| 735 | Union Pacific Corp. | 80,026 | ||||||
|
| |||||||
| 116,079 | ||||||||
|
| |||||||
| SHARES | SECURITY DESCRIPTION | VALUE($) | ||||||
Trading Companies & Distributors — 0.0% (g) | ||||||||
| 114 | HD Supply Holdings, Inc. (a) | 3,504 | ||||||
|
| |||||||
Total Industrials | 738,082 | |||||||
|
| |||||||
Information Technology — 23.0% |
| |||||||
Communications Equipment — 0.4% |
| |||||||
| 824 | Cisco Systems, Inc. | 25,778 | ||||||
|
| |||||||
Electronic Equipment, Instruments & Components — 0.6% |
| |||||||
| 601 | TE Connectivity Ltd. | 47,308 | ||||||
|
| |||||||
Internet Software & Services — 5.4% |
| |||||||
| 139 | Alphabet, Inc., Class A (a) | 128,855 | ||||||
| 140 | Alphabet, Inc., Class C (a) | 127,667 | ||||||
| 962 | Facebook, Inc., Class A (a) | 145,269 | ||||||
|
| |||||||
| 401,791 | ||||||||
|
| |||||||
IT Services — 4.0% |
| |||||||
| 786 | Accenture plc, Class A | 97,237 | ||||||
| 69 | Automatic Data Processing, Inc. | 7,070 | ||||||
| 428 | Fidelity National Information Services, Inc. | 36,534 | ||||||
| 120 | International Business Machines Corp. | 18,475 | ||||||
| 2 | Mastercard, Inc., Class A | 218 | ||||||
| 122 | Paychex, Inc. | 6,924 | ||||||
| 147 | Vantiv, Inc., Class A (a) | 9,319 | ||||||
| 1,155 | Visa, Inc., Class A | 108,325 | ||||||
| 123 | WEX, Inc. (a) | 12,811 | ||||||
|
| |||||||
| 296,913 | ||||||||
|
| |||||||
Semiconductors & Semiconductor Equipment — 3.5% |
| |||||||
| 784 | Analog Devices, Inc. | 60,981 | ||||||
| 350 | Broadcom Ltd. | 81,596 | ||||||
| 55 | Lam Research Corp. | 7,806 | ||||||
| 233 | Microchip Technology, Inc. | 17,952 | ||||||
| 113 | NVIDIA Corp. | 16,378 | ||||||
| 983 | Texas Instruments, Inc. | 75,589 | ||||||
|
| |||||||
| 260,302 | ||||||||
|
| |||||||
Software — 4.8% |
| |||||||
| 642 | Adobe Systems, Inc. (a) | 90,751 | ||||||
| 3,571 | Microsoft Corp. | 246,147 | ||||||
| 189 | Oracle Corp. | 9,487 | ||||||
| 84 | Workday, Inc., Class A (a) | 8,126 | ||||||
|
| |||||||
| 354,511 | ||||||||
|
| |||||||
Technology Hardware, Storage & Peripherals — 4.3% |
| |||||||
| 1,980 | Apple, Inc. | 285,181 | ||||||
| 1,923 | HP, Inc. | 33,616 | ||||||
|
| |||||||
| 318,797 | ||||||||
|
| |||||||
Total Information Technology | 1,705,400 | |||||||
|
| |||||||
SEE NOTES TO FINANCIAL STATEMENTS.
| JUNE 30, 2017 | J.P. MORGAN LARGE CAP FUNDS | 23 | ||||||
Table of Contents
JPMorgan Disciplined Equity Fund
SCHEDULE OF PORTFOLIO INVESTMENTS
AS OF JUNE 30, 2017 (continued)
(Amounts in thousands, except number of Futures contracts)
| SHARES | SECURITY DESCRIPTION | VALUE($) | ||||||
Common Stocks — continued | ||||||||
Materials — 2.8% |
| |||||||
Chemicals — 2.1% |
| |||||||
| 56 | Albemarle Corp. | 5,868 | ||||||
| 83 | Celanese Corp., Series A | 7,889 | ||||||
| 394 | Dow Chemical Co. (The) | 24,845 | ||||||
| 484 | Eastman Chemical Co. | 40,626 | ||||||
| 753 | EI du Pont de Nemours & Co. | 60,778 | ||||||
| 726 | Mosaic Co. (The) | 16,582 | ||||||
|
| |||||||
| 156,588 | ||||||||
|
| |||||||
Construction Materials — 0.1% |
| |||||||
| 40 | Vulcan Materials Co. | 5,080 | ||||||
|
| |||||||
Containers & Packaging — 0.5% |
| |||||||
| 256 | Crown Holdings, Inc. (a) | 15,246 | ||||||
| 332 | WestRock Co. | 18,822 | ||||||
|
| |||||||
| 34,068 | ||||||||
|
| |||||||
Metals & Mining — 0.1% |
| |||||||
| 151 | Alcoa Corp. | 4,917 | ||||||
| 171 | Newmont Mining Corp. | 5,528 | ||||||
|
| |||||||
| 10,445 | ||||||||
|
| |||||||
Total Materials | 206,181 | |||||||
|
| |||||||
Real Estate — 2.3% |
| |||||||
Equity Real Estate Investment Trusts (REITs) — 2.3% |
| |||||||
| 159 | AvalonBay Communities, Inc. | 30,531 | ||||||
| 83 | Boston Properties, Inc. | 10,186 | ||||||
| 199 | Brixmor Property Group, Inc. | 3,562 | ||||||
| 44 | Camden Property Trust | 3,737 | ||||||
| 56 | Digital Realty Trust, Inc. | 6,280 | ||||||
| 32 | Equinix, Inc. | 13,585 | ||||||
| 142 | Extra Space Storage, Inc. | 11,068 | ||||||
| 68 | Federal Realty Investment Trust | 8,582 | ||||||
| 348 | HCP, Inc. | 11,128 | ||||||
| 274 | Kimco Realty Corp. | 5,020 | ||||||
| 64 | Omega Healthcare Investors, Inc. | 2,126 | ||||||
| 386 | Prologis, Inc. | 22,644 | ||||||
| 124 | Public Storage | 25,807 | ||||||
| 74 | Regency Centers Corp. | 4,642 | ||||||
| 154 | Vornado Realty Trust | 14,460 | ||||||
|
| |||||||
Total Real Estate | 173,358 | |||||||
|
| |||||||
Telecommunication Services — 1.4% |
| |||||||
Diversified Telecommunication Services — 1.3% |
| |||||||
| 1,460 | AT&T, Inc. | 55,100 | ||||||
| 882 | Verizon Communications, Inc. | 39,377 | ||||||
|
| |||||||
| 94,477 | ||||||||
|
| |||||||
| SHARES | SECURITY DESCRIPTION | VALUE($) | ||||||
Wireless Telecommunication Services — 0.1% |
| |||||||
| 172 | T-Mobile US, Inc. (a) | 10,427 | ||||||
|
| |||||||
Total Telecommunication Services | 104,904 | |||||||
|
| |||||||
Utilities — 3.2% |
| |||||||
Electric Utilities — 2.6% |
| |||||||
| 104 | American Electric Power Co., Inc. | 7,239 | ||||||
| 198 | Duke Energy Corp. | 16,584 | ||||||
| 458 | Edison International | 35,805 | ||||||
| 431 | NextEra Energy, Inc. | 60,461 | ||||||
| 588 | PG&E Corp. | 39,057 | ||||||
| 767 | Xcel Energy, Inc. | 35,186 | ||||||
|
| |||||||
| 194,332 | ||||||||
|
| |||||||
Multi-Utilities — 0.6% |
| |||||||
| 547 | CMS Energy Corp. | 25,288 | ||||||
| 596 | NiSource, Inc. | 15,117 | ||||||
|
| |||||||
| 40,405 | ||||||||
|
| |||||||
Total Utilities | 234,737 | |||||||
|
| |||||||
Total Common Stocks | 7,304,650 | |||||||
|
| |||||||
PRINCIPAL AMOUNT($) | ||||||||
Short-Term Investments — 1.7% | ||||||||
U.S. Treasury Obligation — 0.1% | ||||||||
| 5,322 | U.S. Treasury Bill, 0.980%, | 5,284 | ||||||
|
| |||||||
| SHARES | ||||||||
Investment Company — 1.6% | ||||||||
| 115,340 | JPMorgan U.S. Government Money Market Fund, Institutional Class Shares, 0.840% (b) (l) | 115,340 | ||||||
|
| |||||||
Total Short-Term Investments | 120,624 | |||||||
|
| |||||||
Total Investments — 100.3% | 7,425,274 | |||||||
Liabilities in Excess of | (18,741 | ) | ||||||
|
| |||||||
NET ASSETS — 100.0% | $ | 7,406,533 | ||||||
|
| |||||||
Percentages indicated are based on net assets.
SEE NOTES TO FINANCIAL STATEMENTS.
| 24 | J.P. MORGAN LARGE CAP FUNDS | JUNE 30, 2017 | ||||
Table of Contents
| Futures Contracts | ||||||||||||||||||
| NUMBER OF CONTRACTS | DESCRIPTION | EXPIRATION DATE | TRADING CURRENCY | NOTIONAL VALUE AT JUNE 30, 2017 | NET UNREALIZED APPRECIATION (DEPRECIATION) | |||||||||||||
Long Futures Outstanding | ||||||||||||||||||
| 788 | E-mini S&P 500 Index | 09/15/17 | USD | $ | 95,383 | $ | (236 | ) | ||||||||||
|
| |||||||||||||||||
SEE NOTES TO FINANCIAL STATEMENTS.
| JUNE 30, 2017 | J.P. MORGAN LARGE CAP FUNDS | 25 | ||||||
Table of Contents
JPMorgan Dynamic Growth Fund
SCHEDULE OF PORTFOLIO INVESTMENTS
AS OF JUNE 30, 2017
(Amounts in thousands)
| SHARES | SECURITY DESCRIPTION | VALUE($) | ||||||
Common Stocks — 96.8% | ||||||||
Consumer Discretionary — 21.7% |
| |||||||
Hotels, Restaurants & Leisure — 2.1% |
| |||||||
| 108 | Las Vegas Sands Corp. | 6,919 | ||||||
|
| |||||||
Internet & Direct Marketing Retail — 10.8% |
| |||||||
| 23 | Amazon.com, Inc. (a) | 21,795 | ||||||
| 7 | Priceline Group, Inc. (The) (a) | 12,888 | ||||||
|
| |||||||
| 34,683 | ||||||||
|
| |||||||
Specialty Retail — 8.8% |
| |||||||
| 77 | Home Depot, Inc. (The) | 11,804 | ||||||
| 82 | Ross Stores, Inc. | 4,734 | ||||||
| 41 | Ulta Beauty, Inc. (a) | 11,666 | ||||||
|
| |||||||
| 28,204 | ||||||||
|
| |||||||
Total Consumer Discretionary | 69,806 | |||||||
|
| |||||||
Consumer Staples — 2.1% |
| |||||||
Beverages — 2.1% |
| |||||||
| 137 | Monster Beverage Corp. (a) | 6,804 | ||||||
|
| |||||||
Energy — 1.6% |
| |||||||
Oil, Gas & Consumable Fuels — 1.6% |
| |||||||
| 32 | Pioneer Natural Resources Co. | 5,166 | ||||||
|
| |||||||
Financials — 8.8% |
| |||||||
Capital Markets — 8.8% |
| |||||||
| 359 | Charles Schwab Corp. (The) | 15,419 | ||||||
| 194 | Intercontinental Exchange, Inc. | 12,787 | ||||||
|
| |||||||
Total Financials | 28,206 | |||||||
|
| |||||||
Health Care — 13.1% |
| |||||||
Biotechnology — 3.6% |
| |||||||
| 91 | Vertex Pharmaceuticals, Inc. (a) | 11,693 | ||||||
|
| |||||||
Health Care Equipment & Supplies — 4.0% |
| |||||||
| 14 | Intuitive Surgical, Inc. (a) | 12,674 | ||||||
|
| |||||||
Health Care Providers & Services — 4.0% |
| |||||||
| 70 | UnitedHealth Group, Inc. | 12,961 | ||||||
|
| |||||||
Life Sciences Tools & Services — 1.5% |
| |||||||
| 28 | Illumina, Inc. (a) | 4,906 | ||||||
|
| |||||||
Total Health Care | 42,234 | |||||||
|
| |||||||
Industrials — 4.1% |
| |||||||
Airlines — 1.5% |
| |||||||
| 80 | Southwest Airlines Co. | 4,946 | ||||||
|
| |||||||
Electrical Equipment — 1.5% |
| |||||||
| 29 | Rockwell Automation, Inc. | 4,701 | ||||||
|
| |||||||
Trading Companies & Distributors — 1.1% |
| |||||||
| 30 | United Rentals, Inc. (a) | 3,376 | ||||||
|
| |||||||
Total Industrials | 13,023 | |||||||
|
| |||||||
| SHARES | SECURITY DESCRIPTION | VALUE($) | ||||||
Information Technology — 41.9% |
| |||||||
Internet Software & Services — 11.8% |
| |||||||
| 23 | Alphabet, Inc., Class A (a) | 21,206 | ||||||
| 111 | Facebook, Inc., Class A (a) | 16,729 | ||||||
|
| |||||||
| 37,935 | ||||||||
|
| |||||||
IT Services — 9.4% |
| |||||||
| 159 | Mastercard, Inc., Class A | 19,253 | ||||||
| 206 | PayPal Holdings, Inc. (a) | 11,032 | ||||||
|
| |||||||
| 30,285 | ||||||||
|
| |||||||
Semiconductors & Semiconductor Equipment — 8.2% |
| |||||||
| 208 | Applied Materials, Inc. | 8,609 | ||||||
| 47 | Broadcom Ltd. | 10,988 | ||||||
| 46 | NVIDIA Corp. | 6,664 | ||||||
|
| |||||||
| 26,261 | ||||||||
|
| |||||||
Software — 9.6% |
| |||||||
| 82 | Adobe Systems, Inc. (a) | 11,584 | ||||||
| 92 | Electronic Arts, Inc. (a) | 9,713 | ||||||
| 91 | ServiceNow, Inc. (a) | 9,603 | ||||||
|
| |||||||
| 30,900 | ||||||||
|
| |||||||
Technology Hardware, Storage & Peripherals — 2.9% |
| |||||||
| 64 | Apple, Inc. | 9,210 | ||||||
|
| |||||||
Total Information Technology | 134,591 | |||||||
|
| |||||||
Real Estate — 3.5% |
| |||||||
Equity Real Estate Investment Trusts (REITs) — 3.5% |
| |||||||
| 26 | Equinix, Inc. | 11,319 | ||||||
|
| |||||||
Total Common Stocks | 311,149 | |||||||
|
| |||||||
Short-Term Investment — 3.3% | ||||||||
Investment Company — 3.3% |
| |||||||
| 10,657 | JPMorgan U.S. Government Money Market Fund, Institutional Class Shares, 0.840% (b) (l) | 10,657 | ||||||
|
| |||||||
Total Investments — 100.1% | 321,806 | |||||||
Liabilities in Excess of | (329 | ) | ||||||
|
| |||||||
NET ASSETS — 100.0% | $ | 321,477 | ||||||
|
| |||||||
Percentages indicated are based on net assets.
| 26 | J.P. MORGAN LARGE CAP FUNDS | JUNE 30, 2017 | ||||
Table of Contents
JPMorgan Equity Focus Fund
SCHEDULE OF PORTFOLIO INVESTMENTS
AS OF JUNE 30, 2017
(Amounts in thousands)
| SHARES | SECURITY DESCRIPTION | VALUE($) | ||||||
Common Stocks — 96.5% | ||||||||
Consumer Discretionary — 17.0% |
| |||||||
Household Durables — 1.6% |
| |||||||
| 13 | Mohawk Industries, Inc. (a) | 3,026 | ||||||
|
| |||||||
Internet & Direct Marketing Retail — 6.9% |
| |||||||
| 8 | Amazon.com, Inc. (a) | 7,976 | ||||||
| 3 | Priceline Group, Inc. (The) (a) | 4,966 | ||||||
|
| |||||||
| 12,942 | ||||||||
|
| |||||||
Media — 3.2% |
| |||||||
| 94 | DISH Network Corp., Class A (a) | 5,908 | ||||||
|
| |||||||
Multiline Retail — 2.1% |
| |||||||
| 102 | Kohl’s Corp. | 3,936 | ||||||
|
| |||||||
Specialty Retail — 3.2% |
| |||||||
| 7 | AutoZone, Inc. (a) | 4,042 | ||||||
| 65 | Bed Bath & Beyond, Inc. | 1,965 | ||||||
|
| |||||||
| 6,007 | ||||||||
|
| |||||||
Total Consumer Discretionary | 31,819 | |||||||
|
| |||||||
Consumer Staples — 1.9% |
| |||||||
Food & Staples Retailing — 1.9% |
| |||||||
| 46 | Walgreens Boots Alliance, Inc. | 3,625 | ||||||
|
| |||||||
Energy — 6.7% |
| |||||||
Oil, Gas & Consumable Fuels — 6.7% |
| |||||||
| 29 | Concho Resources, Inc. (a) | 3,489 | ||||||
| 244 | Kinder Morgan, Inc. | 4,678 | ||||||
| 85 | Marathon Petroleum Corp. | 4,425 | ||||||
|
| |||||||
Total Energy | 12,592 | |||||||
|
| |||||||
Financials — 22.5% |
| |||||||
Banks — 3.2% |
| |||||||
| 106 | Wells Fargo & Co. | 5,900 | ||||||
|
| |||||||
Capital Markets — 7.2% |
| |||||||
| 107 | Charles Schwab Corp. (The) | 4,610 | ||||||
| 19 | S&P Global, Inc. | 2,756 | ||||||
| 82 | T Rowe Price Group, Inc. | 6,116 | ||||||
|
| |||||||
| 13,482 | ||||||||
|
| |||||||
Consumer Finance — 5.3% |
| |||||||
| 212 | Ally Financial, Inc. | 4,431 | ||||||
| 66 | Capital One Financial Corp. | 5,425 | ||||||
|
| |||||||
| 9,856 | ||||||||
|
| |||||||
Insurance — 6.8% |
| |||||||
| 113 | American International Group, Inc. | 7,034 | ||||||
| 122 | Loews Corp. | 5,712 | ||||||
|
| |||||||
| 12,746 | ||||||||
|
| |||||||
Total Financials | 41,984 | |||||||
|
| |||||||
| SHARES | SECURITY DESCRIPTION | VALUE($) | ||||||
Health Care — 9.4% |
| |||||||
Biotechnology — 1.9% |
| |||||||
| 27 | Vertex Pharmaceuticals, Inc. (a) | 3,505 | ||||||
|
| |||||||
Health Care Equipment & Supplies — 2.0% |
| |||||||
| 4 | Intuitive Surgical, Inc. (a) | 3,749 | ||||||
|
| |||||||
Health Care Providers & Services — 5.5% |
| |||||||
| 59 | Acadia Healthcare Co., Inc. (a) | 2,927 | ||||||
| 40 | UnitedHealth Group, Inc. | 7,396 | ||||||
|
| |||||||
| 10,323 | ||||||||
|
| |||||||
Total Health Care | 17,577 | |||||||
|
| |||||||
Industrials — 6.4% |
| |||||||
Airlines — 2.9% |
| |||||||
| 99 | Delta Air Lines, Inc. | 5,313 | ||||||
|
| |||||||
Commercial Services & Supplies — 1.5% |
| |||||||
| 43 | Waste Connections, Inc., (Canada) | 2,802 | ||||||
|
| |||||||
Machinery — 2.0% |
| |||||||
| 27 | Stanley Black & Decker, Inc. | 3,756 | ||||||
|
| |||||||
Total Industrials | 11,871 | |||||||
|
| |||||||
Information Technology — 22.5% |
| |||||||
Internet Software & Services — 10.1% |
| |||||||
| 12 | Alphabet, Inc., Class C (a) | 11,250 | ||||||
| 51 | Facebook, Inc., Class A (a) | 7,676 | ||||||
|
| |||||||
| 18,926 | ||||||||
|
| |||||||
IT Services — 3.0% |
| |||||||
| 46 | Mastercard, Inc., Class A | 5,626 | ||||||
|
| |||||||
Semiconductors & Semiconductor Equipment — 1.6% |
| |||||||
| 20 | NVIDIA Corp. | 2,933 | ||||||
|
| |||||||
Software — 3.7% |
| |||||||
| 45 | Electronic Arts, Inc. (a) | 4,718 | ||||||
| 20 | ServiceNow, Inc. (a) | 2,166 | ||||||
|
| |||||||
| 6,884 | ||||||||
|
| |||||||
Technology Hardware, Storage & Peripherals — 4.1% |
| |||||||
| 54 | Apple, Inc. | 7,731 | ||||||
|
| |||||||
Total Information Technology | 42,100 | |||||||
|
| |||||||
Materials — 3.8% |
| |||||||
Containers & Packaging — 3.8% |
| |||||||
| 86 | Ball Corp. | 3,636 | ||||||
| 60 | WestRock Co. | 3,377 | ||||||
|
| |||||||
Total Materials | 7,013 | |||||||
|
| |||||||
SEE NOTES TO FINANCIAL STATEMENTS.
| JUNE 30, 2017 | J.P. MORGAN LARGE CAP FUNDS | 27 | ||||||
Table of Contents
JPMorgan Equity Focus Fund
SCHEDULE OF PORTFOLIO INVESTMENTS
AS OF JUNE 30, 2017 (continued)
(Amounts in thousands)
| SHARES | SECURITY DESCRIPTION | VALUE($) | ||||||
Common Stocks — continued | ||||||||
Real Estate — 4.1% |
| |||||||
Equity Real Estate Investment Trusts (REITs) — 4.1% |
| |||||||
| 29 | Federal Realty Investment Trust | 3,705 | ||||||
| 139 | Rayonier, Inc. | 4,004 | ||||||
|
| |||||||
Total Real Estate | 7,709 | |||||||
|
| |||||||
Utilities — 2.2% |
| |||||||
Electric Utilities — 2.2% |
| |||||||
| 89 | Xcel Energy, Inc. | 4,078 | ||||||
|
| |||||||
Total Common Stocks | 180,368 | |||||||
|
| |||||||
| SHARES | SECURITY DESCRIPTION | VALUE($) | ||||||
Short-Term Investment — 3.1% | ||||||||
Investment Company — 3.1% |
| |||||||
| 5,788 | JPMorgan U.S. Government Money Market Fund, Institutional Class Shares, 0.840% (b) (l) | 5,788 | ||||||
|
| |||||||
Total Investments — 99.6% | 186,156 | |||||||
Other Assets in Excess of | 688 | |||||||
|
| |||||||
NET ASSETS — 100.0% | $ | 186,844 | ||||||
|
| |||||||
Percentages indicated are based on net assets.
SEE NOTES TO FINANCIAL STATEMENTS.
| 28 | J.P. MORGAN LARGE CAP FUNDS | JUNE 30, 2017 | ||||
Table of Contents
JPMorgan Equity Income Fund
SCHEDULE OF PORTFOLIO INVESTMENTS
AS OF JUNE 30, 2017
(Amounts in thousands)
| SHARES | SECURITY DESCRIPTION | VALUE($) | ||||||
Common Stocks — 99.1% | ||||||||
Consumer Discretionary — 7.5% |
| |||||||
Distributors — 1.2% |
| |||||||
| 1,882 | Genuine Parts Co. | 174,533 | ||||||
|
| |||||||
Hotels, Restaurants & Leisure — 0.8% |
| |||||||
| 428 | McDonald’s Corp. | 65,496 | ||||||
| 491 | Wyndham Worldwide Corp. | 49,258 | ||||||
|
| |||||||
| 114,754 | ||||||||
|
| |||||||
Media — 1.8% |
| |||||||
| 1,324 | Cinemark Holdings, Inc. | 51,448 | ||||||
| 3,120 | Comcast Corp., Class A | 121,413 | ||||||
| 1,005 | Time Warner, Inc. | 100,898 | ||||||
|
| |||||||
| 273,759 | ||||||||
|
| |||||||
Specialty Retail — 3.4% |
| |||||||
| 1,560 | Best Buy Co., Inc. | 89,439 | ||||||
| 1,778 | Home Depot, Inc. (The) | 272,816 | ||||||
| 1,582 | L Brands, Inc. | 85,227 | ||||||
| 689 | Tiffany & Co. | 64,663 | ||||||
|
| |||||||
| 512,145 | ||||||||
|
| |||||||
Textiles, Apparel & Luxury Goods — 0.3% |
| |||||||
| 878 | VF Corp. | 50,559 | ||||||
|
| |||||||
Total Consumer Discretionary | 1,125,750 | |||||||
|
| |||||||
Consumer Staples — 7.5% |
| |||||||
Beverages — 2.9% |
| |||||||
| 1,778 | Coca-Cola Co. (The) | 79,741 | ||||||
| 1,486 | Dr Pepper Snapple Group, Inc. | 135,422 | ||||||
| 1,184 | Molson Coors Brewing Co., Class B | 102,196 | ||||||
| 960 | PepsiCo, Inc. | 110,914 | ||||||
|
| |||||||
| 428,273 | ||||||||
|
| |||||||
Food Products — 1.6% |
| |||||||
| 1,262 | Kraft Heinz Co. (The) | 108,057 | ||||||
| 3,051 | Mondelez International, Inc., Class A | 131,781 | ||||||
|
| |||||||
| 239,838 | ||||||||
|
| |||||||
Household Products — 1.0% |
| |||||||
| 895 | Kimberly-Clark Corp. | 115,567 | ||||||
| 428 | Procter & Gamble Co. (The) | 37,332 | ||||||
|
| |||||||
| 152,899 | ||||||||
|
| |||||||
Tobacco — 2.0% |
| |||||||
| 2,771 | Altria Group, Inc. | 206,373 | ||||||
| 804 | Philip Morris International, Inc. | 94,413 | ||||||
|
| |||||||
| 300,786 | ||||||||
|
| |||||||
Total Consumer Staples | 1,121,796 | |||||||
|
| |||||||
| SHARES | SECURITY DESCRIPTION | VALUE($) | ||||||
Energy — 9.9% |
| |||||||
Energy Equipment & Services — 0.9% |
| |||||||
| 2,099 | Schlumberger Ltd. | 138,219 | ||||||
|
| |||||||
Oil, Gas & Consumable Fuels — 9.0% |
| |||||||
| 3,720 | Chevron Corp. | 388,091 | ||||||
| 6,426 | ConocoPhillips | 282,487 | ||||||
| 3,203 | Exxon Mobil Corp. | 258,558 | ||||||
| 5,057 | Occidental Petroleum Corp. | 302,790 | ||||||
| 1,569 | Valero Energy Corp. | 105,829 | ||||||
|
| |||||||
| 1,337,755 | ||||||||
|
| |||||||
Total Energy | 1,475,974 | |||||||
|
| |||||||
Financials — 29.7% |
| |||||||
Banks — 12.1% |
| |||||||
| 18,893 | Bank of America Corp. | 458,347 | ||||||
| 4,363 | BB&T Corp. | 198,107 | ||||||
| 918 | Cullen/Frost Bankers, Inc. | 86,207 | ||||||
| 431 | M&T Bank Corp. | 69,848 | ||||||
| 3,025 | PNC Financial Services Group, Inc. (The) | 377,775 | ||||||
| 3,417 | US Bancorp | 177,399 | ||||||
| 7,879 | Wells Fargo & Co. | 436,598 | ||||||
|
| |||||||
| 1,804,281 | ||||||||
|
| |||||||
Capital Markets — 6.9% |
| |||||||
| 503 | Ameriprise Financial, Inc. | 63,991 | ||||||
| 784 | BlackRock, Inc. | 331,214 | ||||||
| 2,411 | CME Group, Inc. | 301,980 | ||||||
| 1,613 | Northern Trust Corp. | 156,824 | ||||||
| 310 | S&P Global, Inc. | 45,286 | ||||||
| 1,775 | T Rowe Price Group, Inc. | 131,754 | ||||||
|
| |||||||
| 1,031,049 | ||||||||
|
| |||||||
Consumer Finance — 1.6% |
| |||||||
| 1,749 | Capital One Financial Corp. | 144,505 | ||||||
| 1,643 | Discover Financial Services | 102,196 | ||||||
|
| |||||||
| 246,701 | ||||||||
|
| |||||||
Insurance — 9.1% |
| |||||||
| 1,493 | Arthur J Gallagher & Co. | 85,447 | ||||||
| 915 | Chubb Ltd. | 133,095 | ||||||
| 893 | Cincinnati Financial Corp. | 64,667 | ||||||
| 4,556 | Hartford Financial Services Group, Inc. (The) | 239,493 | ||||||
| 5,056 | MetLife, Inc. | 277,783 | ||||||
| 1,574 | Progressive Corp. (The) | 69,394 | ||||||
| 1,505 | Prudential Financial, Inc. | 162,769 | ||||||
SEE NOTES TO FINANCIAL STATEMENTS.
| JUNE 30, 2017 | J.P. MORGAN LARGE CAP FUNDS | 29 | ||||||
Table of Contents
JPMorgan Equity Income Fund
SCHEDULE OF PORTFOLIO INVESTMENTS
AS OF JUNE 30, 2017 (continued)
(Amounts in thousands)
| SHARES | SECURITY DESCRIPTION | VALUE($) | ||||||
Common Stocks — continued | ||||||||
Insurance — continued | ||||||||
| 2,295 | Travelers Cos., Inc. (The) | 290,434 | ||||||
| 651 | Validus Holdings Ltd. | 33,814 | ||||||
|
| |||||||
| 1,356,896 | ||||||||
|
| |||||||
Total Financials | 4,438,927 | |||||||
|
| |||||||
Health Care — 10.7% |
| |||||||
Biotechnology — 0.6% |
| |||||||
| 404 | AbbVie, Inc. | 29,313 | ||||||
| 860 | Gilead Sciences, Inc. | 60,857 | ||||||
|
| |||||||
| 90,170 | ||||||||
|
| |||||||
Health Care Equipment & Supplies — 1.9% |
| |||||||
| 2,610 | Abbott Laboratories | 126,891 | ||||||
| 775 | Becton Dickinson and Co. | 151,266 | ||||||
|
| |||||||
| 278,157 | ||||||||
|
| |||||||
Pharmaceuticals — 8.2% |
| |||||||
| 2,410 | Bristol-Myers Squibb Co. | 134,270 | ||||||
| 1,463 | Eli Lilly & Co. | 120,398 | ||||||
| 3,049 | Johnson & Johnson | 403,417 | ||||||
| 4,536 | Merck & Co., Inc. | 290,739 | ||||||
| 8,258 | Pfizer, Inc. | 277,393 | ||||||
|
| |||||||
| 1,226,217 | ||||||||
|
| |||||||
Total Health Care | 1,594,544 | |||||||
|
| |||||||
Industrials — 11.3% |
| |||||||
Aerospace & Defense — 1.5% |
| |||||||
| 1,115 | General Dynamics Corp. | 220,804 | ||||||
|
| |||||||
Commercial Services & Supplies — 1.4% |
| |||||||
| 3,296 | Republic Services, Inc. | 210,079 | ||||||
|
| |||||||
Industrial Conglomerates — 3.1% |
| |||||||
| 694 | 3M Co. | 144,432 | ||||||
| 3,792 | General Electric Co. | 102,417 | ||||||
| 1,685 | Honeywell International, Inc. | 224,544 | ||||||
|
| |||||||
| 471,393 | ||||||||
|
| |||||||
Machinery — 3.4% |
| |||||||
| 1,680 | Dover Corp. | 134,792 | ||||||
| 1,590 | Illinois Tool Works, Inc. | 227,818 | ||||||
| 195 | Snap-on, Inc. | 30,737 | ||||||
| 814 | Stanley Black & Decker, Inc. | 114,606 | ||||||
|
| |||||||
| 507,953 | ||||||||
|
| |||||||
Road & Rail — 1.9% |
| |||||||
| 952 | Norfolk Southern Corp. | 115,884 | ||||||
| 1,586 | Union Pacific Corp. | 172,744 | ||||||
|
| |||||||
| 288,628 | ||||||||
|
| |||||||
Total Industrials | 1,698,857 | |||||||
|
| |||||||
| SHARES | SECURITY DESCRIPTION | VALUE($) | ||||||
Information Technology — 10.7% |
| |||||||
IT Services — 2.0% |
| |||||||
| 635 | Accenture plc, Class A | 78,540 | ||||||
| 824 | Automatic Data Processing, Inc. | 84,438 | ||||||
| 1,674 | Fidelity National Information Services, Inc. | 142,936 | ||||||
|
| |||||||
| 305,914 | ||||||||
|
| |||||||
Semiconductors & Semiconductor Equipment — 4.3% |
| |||||||
| 2,285 | Analog Devices, Inc. | 177,810 | ||||||
| 1,471 | KLA-Tencor Corp. | 134,576 | ||||||
| 1,804 | QUALCOMM, Inc. | 99,591 | ||||||
| 2,949 | Texas Instruments, Inc. | 226,849 | ||||||
|
| |||||||
| 638,826 | ||||||||
|
| |||||||
Software — 2.0% |
| |||||||
| 4,424 | Microsoft Corp. | 304,957 | ||||||
|
| |||||||
Technology Hardware, Storage & Peripherals — 2.4% |
| |||||||
| 2,455 | Apple, Inc. | 353,498 | ||||||
|
| |||||||
Total Information Technology | 1,603,195 | |||||||
|
| |||||||
Materials — 3.5% |
| |||||||
Chemicals — 3.3% |
| |||||||
| 209 | Air Products & Chemicals, Inc. | 29,828 | ||||||
| 1,457 | EI du Pont de Nemours & Co. | 117,593 | ||||||
| 265 | International Flavors & Fragrances, Inc. | 35,827 | ||||||
| 1,369 | PPG Industries, Inc. | 150,520 | ||||||
| 645 | Praxair, Inc. | 85,558 | ||||||
| 1,472 | RPM International, Inc. | 80,275 | ||||||
|
| |||||||
| 499,601 | ||||||||
|
| |||||||
Containers & Packaging — 0.2% |
| |||||||
| 414 | WestRock Co. | 23,440 | ||||||
|
| |||||||
Total Materials | 523,041 | |||||||
|
| |||||||
Real Estate — 2.8% |
| |||||||
Equity Real Estate Investment Trusts (REITs) — 2.8% |
| |||||||
| 376 | Alexandria Real Estate Equities, Inc. | 45,305 | ||||||
| 665 | AvalonBay Communities, Inc. | 127,846 | ||||||
| 455 | Boston Properties, Inc. | 55,968 | ||||||
| 1,691 | HCP, Inc. | 54,050 | ||||||
| 821 | Simon Property Group, Inc. | 132,779 | ||||||
|
| |||||||
Total Real Estate | 415,948 | |||||||
|
| |||||||
Telecommunication Services — 1.3% |
| |||||||
Diversified Telecommunication Services — 1.3% |
| |||||||
| 4,513 | Verizon Communications, Inc. | 201,529 | ||||||
|
| |||||||
SEE NOTES TO FINANCIAL STATEMENTS.
| 30 | J.P. MORGAN LARGE CAP FUNDS | JUNE 30, 2017 | ||||
Table of Contents
| SHARES | SECURITY DESCRIPTION | VALUE($) | ||||||
Common Stocks — continued | ||||||||
Utilities — 4.2% |
| |||||||
Electric Utilities — 2.7% |
| |||||||
| 1,699 | Edison International | 132,866 | ||||||
| 862 | NextEra Energy, Inc. | 120,731 | ||||||
| 3,127 | Xcel Energy, Inc. | 143,457 | ||||||
|
| |||||||
| 397,054 | ||||||||
|
| |||||||
Multi-Utilities — 1.5% |
| |||||||
| 2,588 | CMS Energy Corp. | 119,699 | ||||||
| 231 | DTE Energy Co. | 24,488 | ||||||
| 3,274 | NiSource, Inc. | 83,031 | ||||||
|
| |||||||
| 227,218 | ||||||||
|
| |||||||
Total Utilities | 624,272 | |||||||
|
| |||||||
Total Common Stocks | 14,823,833 | |||||||
|
| |||||||
| SHARES | SECURITY DESCRIPTION | VALUE($) | ||||||
Short-Term Investment — 0.8% | ||||||||
Investment Company — 0.8% |
| |||||||
| 112,949 | JPMorgan U.S. Government Money Market Fund, Institutional Class Shares, 0.840% (b) (l) | 112,949 | ||||||
|
| |||||||
Total Investments — 99.9% | 14,936,782 | |||||||
Other Assets in Excess of | 16,130 | |||||||
|
| |||||||
NET ASSETS — 100.0% | $ | 14,952,912 | ||||||
|
| |||||||
Percentages indicated are based on net assets.
SEE NOTES TO FINANCIAL STATEMENTS.
| JUNE 30, 2017 | J.P. MORGAN LARGE CAP FUNDS | 31 | ||||||
Table of Contents
JPMorgan Growth and Income Fund
SCHEDULE OF PORTFOLIO INVESTMENTS
AS OF JUNE 30, 2017
(Amounts in thousands)
| SHARES | SECURITY DESCRIPTION | VALUE($) | ||||||
Common Stocks — 98.2% | ||||||||
Consumer Discretionary — 8.0% | ||||||||
Distributors — 0.7% |
| |||||||
| 39 | Genuine Parts Co. | 3,590 | ||||||
|
| |||||||
Hotels, Restaurants & Leisure — 1.6% |
| |||||||
| 54 | Carnival Corp. | 3,554 | ||||||
| 47 | Royal Caribbean Cruises Ltd. | 5,079 | ||||||
|
| |||||||
| 8,633 | ||||||||
|
| |||||||
Media — 2.5% |
| |||||||
| 92 | DISH Network Corp., Class A (a) | 5,786 | ||||||
| 49 | Time Warner, Inc. | 4,900 | ||||||
| 29 | Walt Disney Co. (The) | 3,039 | ||||||
|
| |||||||
| 13,725 | ||||||||
|
| |||||||
Specialty Retail — 3.2% |
| |||||||
| 7 | AutoZone, Inc. (a) | 3,771 | ||||||
| 65 | Best Buy Co., Inc. | 3,732 | ||||||
| 60 | Home Depot, Inc. (The) | 9,158 | ||||||
| 15 | L Brands, Inc. | 814 | ||||||
|
| |||||||
| 17,475 | ||||||||
|
| |||||||
Total Consumer Discretionary | 43,423 | |||||||
|
| |||||||
Consumer Staples — 3.9% |
| |||||||
Beverages — 2.0% |
| |||||||
| 31 | Dr Pepper Snapple Group, Inc. | 2,824 | ||||||
| 58 | Molson Coors Brewing Co., Class B | 4,990 | ||||||
| 25 | PepsiCo, Inc. | 2,876 | ||||||
|
| |||||||
| 10,690 | ||||||||
|
| |||||||
Food & Staples Retailing — 0.8% |
| |||||||
| 58 | Walgreens Boots Alliance, Inc. | 4,503 | ||||||
|
| |||||||
Food Products — 0.4% |
| |||||||
| 23 | Kraft Heinz Co. (The) | 2,004 | ||||||
|
| |||||||
Household Products — 0.7% |
| |||||||
| 32 | Kimberly-Clark Corp. | 4,119 | ||||||
|
| |||||||
Total Consumer Staples | 21,316 | |||||||
|
| |||||||
Energy — 11.8% |
| |||||||
Energy Equipment & Services — 1.1% |
| |||||||
| 87 | Schlumberger Ltd. | 5,695 | ||||||
|
| |||||||
Oil, Gas & Consumable Fuels — 10.7% |
| |||||||
| 122 | Chevron Corp. | 12,771 | ||||||
| 192 | ConocoPhillips | 8,443 | ||||||
| 59 | EOG Resources, Inc. | 5,350 | ||||||
| 41 | EQT Corp. | 2,426 | ||||||
| 100 | Exxon Mobil Corp. | 8,040 | ||||||
| 147 | Occidental Petroleum Corp. | 8,813 | ||||||
| 43 | Phillips 66 | 3,572 | ||||||
| SHARES | SECURITY DESCRIPTION | VALUE($) | ||||||
Oil, Gas & Consumable Fuels — continued |
| |||||||
| 23 | Pioneer Natural Resources Co. | 3,702 | ||||||
| 71 | Valero Energy Corp. | 4,796 | ||||||
|
| |||||||
| 57,913 | ||||||||
|
| |||||||
Total Energy | 63,608 | |||||||
|
| |||||||
Financials — 32.0% |
| |||||||
Banks — 15.2% |
| |||||||
| 996 | Bank of America Corp. | 24,153 | ||||||
| 145 | BB&T Corp. | 6,562 | ||||||
| 73 | Citigroup, Inc. | 4,873 | ||||||
| 59 | Cullen/Frost Bankers, Inc. | 5,559 | ||||||
| 37 | M&T Bank Corp. | 5,944 | ||||||
| 62 | PNC Financial Services Group, Inc. (The) | 7,742 | ||||||
| 85 | SunTrust Banks, Inc. | 4,838 | ||||||
| 125 | US Bancorp | 6,469 | ||||||
| 286 | Wells Fargo & Co. | 15,842 | ||||||
|
| |||||||
| 81,982 | ||||||||
|
| |||||||
Capital Markets — 8.4% |
| |||||||
| 25 | BlackRock, Inc. | 10,433 | ||||||
| 69 | Charles Schwab Corp. (The) | 2,943 | ||||||
| 31 | Goldman Sachs Group, Inc. (The) | 6,901 | ||||||
| 38 | Intercontinental Exchange, Inc. | 2,518 | ||||||
| 195 | Invesco Ltd. | 6,844 | ||||||
| 200 | Morgan Stanley | 8,890 | ||||||
| 91 | T Rowe Price Group, Inc. | 6,761 | ||||||
|
| |||||||
| 45,290 | ||||||||
|
| |||||||
Consumer Finance — 1.7% |
| |||||||
| 61 | Capital One Financial Corp. | 4,999 | ||||||
| 66 | Discover Financial Services | 4,123 | ||||||
|
| |||||||
| 9,122 | ||||||||
|
| |||||||
Diversified Financial Services — 1.8% |
| |||||||
| 60 | Berkshire Hathaway, Inc., Class B (a) | 10,111 | ||||||
|
| |||||||
Insurance — 4.9% |
| |||||||
| 23 | Chubb Ltd. | 3,324 | ||||||
| 195 | Hartford Financial Services Group, Inc. (The) | 10,225 | ||||||
| 56 | Loews Corp. | 2,621 | ||||||
| 82 | MetLife, Inc. | 4,505 | ||||||
| 53 | Prudential Financial, Inc. | 5,732 | ||||||
|
| |||||||
| 26,407 | ||||||||
|
| |||||||
Total Financials | 172,912 | |||||||
|
| |||||||
Health Care — 11.2% |
| |||||||
Biotechnology — 1.1% |
| |||||||
| 83 | Gilead Sciences, Inc. | 5,882 | ||||||
|
| |||||||
SEE NOTES TO FINANCIAL STATEMENTS.
| 32 | J.P. MORGAN LARGE CAP FUNDS | JUNE 30, 2017 | ||||
Table of Contents
| SHARES | SECURITY DESCRIPTION | VALUE($) | ||||||
Common Stocks — continued | ||||||||
Health Care Equipment & Supplies — 1.0% |
| |||||||
| 28 | Becton Dickinson and Co. | 5,443 | ||||||
|
| |||||||
Health Care Providers & Services — 2.9% |
| |||||||
| 48 | Aetna, Inc. | 7,227 | ||||||
| 15 | Humana, Inc. | 3,585 | ||||||
| 27 | UnitedHealth Group, Inc. | 4,914 | ||||||
|
| |||||||
| 15,726 | ||||||||
|
| |||||||
Pharmaceuticals — 6.2% |
| |||||||
| 145 | Bristol-Myers Squibb Co. | 8,057 | ||||||
| 44 | Eli Lilly & Co. | 3,580 | ||||||
| 43 | Johnson & Johnson | 5,688 | ||||||
| 109 | Merck & Co., Inc. | 6,997 | ||||||
| 264 | Pfizer, Inc. | 8,858 | ||||||
|
| |||||||
| 33,180 | ||||||||
|
| |||||||
Total Health Care | 60,231 | |||||||
|
| |||||||
Industrials — 8.9% |
| |||||||
Aerospace & Defense — 1.5% |
| |||||||
| 19 | General Dynamics Corp. | 3,764 | ||||||
| 36 | United Technologies Corp. | 4,408 | ||||||
|
| |||||||
| 8,172 | ||||||||
|
| |||||||
Industrial Conglomerates — 5.4% |
| |||||||
| 41 | 3M Co. | 8,432 | ||||||
| 311 | General Electric Co. | 8,400 | ||||||
| 92 | Honeywell International, Inc. | 12,236 | ||||||
|
| |||||||
| 29,068 | ||||||||
|
| |||||||
Machinery — 0.3% |
| |||||||
| 19 | Dover Corp. | 1,500 | ||||||
|
| |||||||
Road & Rail — 0.7% |
| |||||||
| 34 | CSX Corp. | 1,861 | ||||||
| 19 | Kansas City Southern | 2,030 | ||||||
|
| |||||||
| 3,891 | ||||||||
|
| |||||||
Trading Companies & Distributors — 1.0% |
| |||||||
| 35 | Watsco, Inc. | 5,458 | ||||||
|
| |||||||
Total Industrials | 48,089 | |||||||
|
| |||||||
Information Technology — 13.9% |
| |||||||
Communications Equipment — 0.6% |
| |||||||
| 105 | Cisco Systems, Inc. | 3,299 | ||||||
|
| |||||||
Electronic Equipment, Instruments & Components — 0.5% |
| |||||||
| 32 | TE Connectivity Ltd. | 2,502 | ||||||
|
| |||||||
Internet Software & Services — 0.9% |
| |||||||
| 5 | Alphabet, Inc., Class C (a) | 4,924 | ||||||
|
| |||||||
IT Services — 0.8% |
| |||||||
| 51 | Fidelity National Information Services, Inc. | 4,338 | ||||||
|
| |||||||
| SHARES | SECURITY DESCRIPTION | VALUE($) | ||||||
Semiconductors & Semiconductor Equipment — 4.1% |
| |||||||
| 178 | Applied Materials, Inc. | 7,333 | ||||||
| 57 | KLA-Tencor Corp. | 5,189 | ||||||
| 74 | QUALCOMM, Inc. | 4,103 | ||||||
| 75 | Texas Instruments, Inc. | 5,800 | ||||||
|
| |||||||
| 22,425 | ||||||||
|
| |||||||
Software — 3.2% |
| |||||||
| 250 | Microsoft Corp. | 17,219 | ||||||
|
| |||||||
Technology Hardware, Storage & Peripherals — 3.8% |
| |||||||
| 112 | Apple, Inc. | 16,087 | ||||||
| 239 | HP, Inc. | 4,185 | ||||||
|
| |||||||
| 20,272 | ||||||||
|
| |||||||
Total Information Technology | 74,979 | |||||||
|
| |||||||
Materials — 1.6% |
| |||||||
Chemicals — 1.0% |
| |||||||
| 64 | EI du Pont de Nemours & Co. | 5,149 | ||||||
|
| |||||||
Containers & Packaging — 0.6% |
| |||||||
| 72 | Sealed Air Corp. | 3,214 | ||||||
|
| |||||||
Total Materials | 8,363 | |||||||
|
| |||||||
Real Estate — 2.5% |
| |||||||
Equity Real Estate Investment Trusts (REITs) — 2.5% |
| |||||||
| 16 | AvalonBay Communities, Inc. | 3,132 | ||||||
| 38 | Crown Castle International Corp. | 3,757 | ||||||
| 56 | Macerich Co. (The) | 3,269 | ||||||
| 22 | Simon Property Group, Inc. | 3,494 | ||||||
|
| |||||||
Total Real Estate | 13,652 | |||||||
|
| |||||||
Telecommunication Services — 2.0% |
| |||||||
Diversified Telecommunication Services — 1.4% |
| |||||||
| 172 | Verizon Communications, Inc. | 7,674 | ||||||
|
| |||||||
Wireless Telecommunication Services — 0.6% |
| |||||||
| 55 | T-Mobile US, Inc. (a) | 3,334 | ||||||
|
| |||||||
Total Telecommunication Services | 11,008 | |||||||
|
| |||||||
Utilities — 2.4% |
| |||||||
Electric Utilities — 1.8% |
| |||||||
| 38 | Edison International | 2,971 | ||||||
| 24 | NextEra Energy, Inc. | 3,307 | ||||||
| 77 | Xcel Energy, Inc. | 3,524 | ||||||
|
| |||||||
| 9,802 | ||||||||
|
| |||||||
Multi-Utilities — 0.6% |
| |||||||
| 66 | CMS Energy Corp. | 3,071 | ||||||
|
| |||||||
Total Utilities | 12,873 | |||||||
|
| |||||||
Total Common Stocks | 530,454 | |||||||
|
| |||||||
SEE NOTES TO FINANCIAL STATEMENTS.
| JUNE 30, 2017 | J.P. MORGAN LARGE CAP FUNDS | 33 | ||||||
Table of Contents
JPMorgan Growth and Income Fund
SCHEDULE OF PORTFOLIO INVESTMENTS
AS OF JUNE 30, 2017 (continued)
(Amounts in thousands)
| SHARES | SECURITY DESCRIPTION | VALUE($) | ||||||
Short-Term Investment — 1.8% | ||||||||
Investment Company — 1.8% | ||||||||
| 9,521 | JPMorgan U.S. Government Money Market Fund, Institutional Class Shares, 0.840% (b) (l) | 9,521 | ||||||
|
| |||||||
Total Investments — 100.0% | 539,975 | |||||||
Liabilities in Excess of | (270 | ) | ||||||
|
| |||||||
NET ASSETS — 100.0% | $ | 539,705 | ||||||
|
| |||||||
Percentages indicated are based on net assets.
SEE NOTES TO FINANCIAL STATEMENTS.
| 34 | J.P. MORGAN LARGE CAP FUNDS | JUNE 30, 2017 | ||||
Table of Contents
JPMorgan Hedged Equity Fund
SCHEDULE OF PORTFOLIO INVESTMENTS
AS OF JUNE 30, 2017
(Amounts in thousands)
| SHARES | SECURITY DESCRIPTION | VALUE($) | ||||||
Common Stocks — 99.5% | ||||||||
Consumer Discretionary — 13.0% |
| |||||||
Auto Components — 0.4% |
| |||||||
| 27 | Delphi Automotive plc (o) | 2,399 | ||||||
| 5 | Lear Corp. | 781 | ||||||
|
| |||||||
| 3,180 | ||||||||
|
| |||||||
Automobiles — 0.4% |
| |||||||
| 142 | Ford Motor Co. | 1,585 | ||||||
| 48 | General Motors Co. (o) | 1,671 | ||||||
|
| |||||||
| 3,256 | ||||||||
|
| |||||||
Hotels, Restaurants & Leisure — 1.0% |
| |||||||
| 21 | Royal Caribbean Cruises Ltd. | 2,334 | ||||||
| 91 | Starbucks Corp. | 5,330 | ||||||
|
| |||||||
| 7,664 | ||||||||
|
| |||||||
Household Durables — 0.4% |
| |||||||
| 25 | DR Horton, Inc. | 878 | ||||||
| 8 | Newell Brands, Inc. | 436 | ||||||
| 54 | PulteGroup, Inc. | 1,325 | ||||||
| 11 | Toll Brothers, Inc. | 448 | ||||||
|
| |||||||
| 3,087 | ||||||||
|
| |||||||
Internet & Direct Marketing Retail — 2.0% |
| |||||||
| 16 | Amazon.com, Inc. (a) (o) | 15,194 | ||||||
|
| |||||||
Media — 4.5% |
| |||||||
| 20 | Charter Communications, Inc., Class A (a) (o) | 6,705 | ||||||
| 232 | Comcast Corp., Class A (o) | 9,018 | ||||||
| 36 | DISH Network Corp., Class A (a) | 2,262 | ||||||
| 210 | Sirius XM Holdings, Inc. | 1,146 | ||||||
| 20 | Time Warner, Inc. | 2,046 | ||||||
| 258 | Twenty-First Century Fox, Inc., Class A (o) | 7,300 | ||||||
| 52 | Walt Disney Co. (The) | 5,505 | ||||||
|
| |||||||
| 33,982 | ||||||||
|
| |||||||
Multiline Retail — 0.3% |
| |||||||
| 20 | Dollar General Corp. | 1,433 | ||||||
| 6 | Dollar Tree, Inc. (a) | 391 | ||||||
| 25 | Macy’s, Inc. | 577 | ||||||
|
| |||||||
| 2,401 | ||||||||
|
| |||||||
Specialty Retail — 3.8% |
| |||||||
| 1 | AutoZone, Inc. (a) | 493 | ||||||
| 21 | Best Buy Co., Inc. | 1,209 | ||||||
| 64 | Home Depot, Inc. (The) (o) | 9,820 | ||||||
| 82 | Lowe’s Cos., Inc. | 6,345 | ||||||
| 11 | O’Reilly Automotive, Inc. (a) | 2,482 | ||||||
| 40 | Ross Stores, Inc. | 2,295 | ||||||
| 87 | TJX Cos., Inc. (The) (o) | 6,275 | ||||||
|
| |||||||
| 28,919 | ||||||||
|
| |||||||
| SHARES | SECURITY DESCRIPTION | VALUE($) | ||||||
Textiles, Apparel & Luxury Goods — 0.2% |
| |||||||
| 26 | NIKE, Inc., Class B | 1,522 | ||||||
|
| |||||||
Total Consumer Discretionary | 99,205 | |||||||
|
| |||||||
Consumer Staples — 8.7% |
| |||||||
Beverages — 3.2% |
| |||||||
| 16 | Brown-Forman Corp., Class B | 792 | ||||||
| 46 | Coca-Cola Co. (The) | 2,079 | ||||||
| 26 | Constellation Brands, Inc., Class A | 4,956 | ||||||
| 7 | Dr Pepper Snapple Group, Inc. | 613 | ||||||
| 53 | Molson Coors Brewing Co., Class B (o) | 4,568 | ||||||
| 99 | PepsiCo, Inc. (o) | 11,417 | ||||||
|
| |||||||
| 24,425 | ||||||||
|
| |||||||
Food & Staples Retailing — 1.6% |
| |||||||
| 28 | Costco Wholesale Corp. (o) | 4,502 | ||||||
| 32 | Kroger Co. (The) | 749 | ||||||
| 79 | Walgreens Boots Alliance, Inc. | 6,177 | ||||||
| 9 | Wal-Mart Stores, Inc. | 681 | ||||||
|
| |||||||
| 12,109 | ||||||||
|
| |||||||
Food Products — 1.0% |
| |||||||
| 10 | Archer-Daniels-Midland Co. (o) | 399 | ||||||
| 1 | JM Smucker Co. (The) | 167 | ||||||
| 20 | Kraft Heinz Co. (The) (o) | 1,724 | ||||||
| 128 | Mondelez International, Inc., Class A | 5,543 | ||||||
|
| |||||||
| 7,833 | ||||||||
|
| |||||||
Household Products — 1.3% |
| |||||||
| 32 | Kimberly-Clark Corp. (o) | 4,088 | ||||||
| 65 | Procter & Gamble Co. (The) | 5,661 | ||||||
|
| |||||||
| 9,749 | ||||||||
|
| |||||||
Tobacco — 1.6% |
| |||||||
| 32 | Altria Group, Inc. | 2,350 | ||||||
| 82 | Philip Morris International, Inc. (o) | 9,609 | ||||||
|
| |||||||
| 11,959 | ||||||||
|
| |||||||
Total Consumer Staples | 66,075 | |||||||
|
| |||||||
Energy — 6.0% |
| |||||||
Energy Equipment & Services — 0.5% |
| |||||||
| 32 | Halliburton Co. | 1,379 | ||||||
| 38 | Schlumberger Ltd. (o) | 2,487 | ||||||
|
| |||||||
| 3,866 | ||||||||
|
| |||||||
Oil, Gas & Consumable Fuels — 5.5% |
| |||||||
| 46 | Anadarko Petroleum Corp. | 2,075 | ||||||
| 14 | Apache Corp. | 687 | ||||||
| 46 | Cabot Oil & Gas Corp. | 1,161 | ||||||
| 54 | Chevron Corp. | 5,604 | ||||||
| 11 | Concho Resources, Inc. (a) | 1,280 | ||||||
SEE NOTES TO FINANCIAL STATEMENTS.
| JUNE 30, 2017 | J.P. MORGAN LARGE CAP FUNDS | 35 | ||||||
Table of Contents
JPMorgan Hedged Equity Fund
SCHEDULE OF PORTFOLIO INVESTMENTS
AS OF JUNE 30, 2017 (continued)
(Amounts in thousands)
| SHARES | SECURITY DESCRIPTION | VALUE($) | ||||||
Common Stocks — continued | ||||||||
Oil, Gas & Consumable Fuels — continued | ||||||||
| 29 | Diamondback Energy, Inc. (a) | 2,612 | ||||||
| 60 | EOG Resources, Inc. | 5,461 | ||||||
| 24 | EQT Corp. | 1,395 | ||||||
| 124 | Exxon Mobil Corp. (o) | 9,997 | ||||||
| 55 | Kinder Morgan, Inc. | 1,058 | ||||||
| 56 | Occidental Petroleum Corp. (o) | 3,382 | ||||||
| 18 | Phillips 66 | 1,480 | ||||||
| 27 | Pioneer Natural Resources Co. | 4,354 | ||||||
| 16 | Valero Energy Corp. | 1,109 | ||||||
|
| |||||||
| 41,655 | ||||||||
|
| |||||||
Total Energy | 45,521 | |||||||
|
| |||||||
Financials — 14.5% |
| |||||||
Banks — 6.0% |
| |||||||
| 577 | Bank of America Corp. (o) | 14,001 | ||||||
| 23 | BB&T Corp. | 1,062 | ||||||
| 182 | Citigroup, Inc. | 12,147 | ||||||
| 158 | KeyCorp | 2,957 | ||||||
| 11 | PNC Financial Services Group, Inc. (The) | 1,349 | ||||||
| 41 | Regions Financial Corp. (o) | 602 | ||||||
| 4 | SVB Financial Group (a) | 722 | ||||||
| 229 | Wells Fargo & Co. (o) | 12,707 | ||||||
| 13 | Zions Bancorp | 593 | ||||||
|
| |||||||
| 46,140 | ||||||||
|
| |||||||
Capital Markets — 3.4% |
| |||||||
| 6 | Ameriprise Financial, Inc. | 709 | ||||||
| 94 | Bank of New York Mellon Corp. (The) | 4,790 | ||||||
| 1 | BlackRock, Inc. | 429 | ||||||
| 144 | Charles Schwab Corp. (The) (o) | 6,179 | ||||||
| 3 | Goldman Sachs Group, Inc. (The) (o) | 757 | ||||||
| 53 | Intercontinental Exchange, Inc. (o) | 3,523 | ||||||
| 155 | Morgan Stanley (o) | 6,886 | ||||||
| 32 | State Street Corp. (o) | 2,834 | ||||||
|
| |||||||
| 26,107 | ||||||||
|
| |||||||
Consumer Finance — 0.9% |
| |||||||
| 17 | American Express Co. | 1,405 | ||||||
| 37 | Capital One Financial Corp. | 3,031 | ||||||
| 40 | Discover Financial Services | 2,490 | ||||||
|
| |||||||
| 6,926 | ||||||||
|
| |||||||
Diversified Financial Services — 1.5% |
| |||||||
| 63 | Berkshire Hathaway, Inc., Class B (a) (o) | 10,752 | ||||||
| 11 | Voya Financial, Inc. | 395 | ||||||
|
| |||||||
| 11,147 | ||||||||
|
| |||||||
| SHARES | SECURITY DESCRIPTION | VALUE($) | ||||||
Insurance — 2.7% |
| |||||||
| 52 | American International Group, Inc. (o) | 3,251 | ||||||
| 50 | Arthur J Gallagher & Co. | 2,840 | ||||||
| 36 | Chubb Ltd. | 5,224 | ||||||
| 38 | Hartford Financial Services Group, Inc. (The) | 1,985 | ||||||
| 128 | MetLife, Inc. (o) | 7,025 | ||||||
|
| |||||||
| 20,325 | ||||||||
|
| |||||||
Total Financials | 110,645 | |||||||
|
| |||||||
Health Care — 14.3% |
| |||||||
Biotechnology — 2.9% |
| |||||||
| 17 | AbbVie, Inc. | 1,247 | ||||||
| 16 | Alexion Pharmaceuticals, Inc. (a) | 1,989 | ||||||
| 2 | Amgen, Inc. | 413 | ||||||
| 17 | Biogen, Inc. (a) | 4,739 | ||||||
| 4 | BioMarin Pharmaceutical, Inc. (a) | 333 | ||||||
| 46 | Celgene Corp. (a) | 5,937 | ||||||
| 68 | Gilead Sciences, Inc. | 4,846 | ||||||
| 19 | Vertex Pharmaceuticals, Inc. (a) | 2,456 | ||||||
|
| |||||||
| 21,960 | ||||||||
|
| |||||||
Health Care Equipment & Supplies — 2.2% |
| |||||||
| 100 | Abbott Laboratories | 4,846 | ||||||
| 16 | Becton Dickinson and Co. | 3,127 | ||||||
| 186 | Boston Scientific Corp. (a) (o) | 5,161 | ||||||
| 1 | Cooper Cos., Inc. (The) | 274 | ||||||
| 22 | Danaher Corp. | 1,853 | ||||||
| 12 | Zimmer Biomet Holdings, Inc. | 1,592 | ||||||
|
| |||||||
| 16,853 | ||||||||
|
| |||||||
Health Care Providers & Services — 2.8% |
| |||||||
| 26 | Aetna, Inc. (o) | 3,960 | ||||||
| 9 | Cigna Corp. | 1,523 | ||||||
| 5 | HCA Healthcare, Inc. (a) | 406 | ||||||
| 11 | Humana, Inc. | 2,761 | ||||||
| 68 | UnitedHealth Group, Inc. (o) | 12,563 | ||||||
|
| |||||||
| 21,213 | ||||||||
|
| |||||||
Life Sciences Tools & Services — 0.8% |
| |||||||
| 27 | Agilent Technologies, Inc. | 1,589 | ||||||
| 11 | Illumina, Inc. (a) | 1,887 | ||||||
| 14 | Thermo Fisher Scientific, Inc. | 2,425 | ||||||
|
| |||||||
| 5,901 | ||||||||
|
| |||||||
Pharmaceuticals — 5.6% |
| |||||||
| 27 | Allergan plc (o) | 6,485 | ||||||
| 100 | Bristol-Myers Squibb Co. (o) | 5,596 | ||||||
| 71 | Eli Lilly & Co. | 5,818 | ||||||
| 63 | Johnson & Johnson (o) | 8,360 | ||||||
| 81 | Merck & Co., Inc. (o) | 5,163 | ||||||
| 350 | Pfizer, Inc. (o) | 11,760 | ||||||
|
| |||||||
| 43,182 | ||||||||
|
| |||||||
Total Health Care | 109,109 | |||||||
|
| |||||||
SEE NOTES TO FINANCIAL STATEMENTS.
| 36 | J.P. MORGAN LARGE CAP FUNDS | JUNE 30, 2017 | ||||
Table of Contents
| SHARES | SECURITY DESCRIPTION | VALUE($) | ||||||
Common Stocks — continued | ||||||||
Industrials — 10.0% |
| |||||||
Aerospace & Defense — 1.6% |
| |||||||
| 22 | General Dynamics Corp. (o) | 4,454 | ||||||
| 4 | L3 Technologies, Inc. | 633 | ||||||
| 12 | Northrop Grumman Corp. | 3,181 | ||||||
| 9 | Textron, Inc. | 420 | ||||||
| 28 | United Technologies Corp. | 3,433 | ||||||
|
| |||||||
| 12,121 | ||||||||
|
| |||||||
Air Freight & Logistics — 0.1% |
| |||||||
| 4 | FedEx Corp. | 868 | ||||||
|
| |||||||
Airlines — 0.8% |
| |||||||
| 53 | Delta Air Lines, Inc. | 2,866 | ||||||
| 47 | United Continental Holdings, Inc. (a) (o) | 3,538 | ||||||
|
| |||||||
| 6,404 | ||||||||
|
| |||||||
Building Products — 0.6% |
| |||||||
| 25 | Allegion plc | 1,996 | ||||||
| 59 | Masco Corp. | 2,268 | ||||||
|
| |||||||
| 4,264 | ||||||||
|
| |||||||
Electrical Equipment — 0.5% |
| |||||||
| 48 | Eaton Corp. plc | 3,754 | ||||||
|
| |||||||
Industrial Conglomerates — 2.6% |
| |||||||
| 365 | General Electric Co. | 9,860 | ||||||
| 76 | Honeywell International, Inc. (o) | 10,068 | ||||||
|
| |||||||
| 19,928 | ||||||||
|
| |||||||
Machinery — 2.2% |
| |||||||
| — | (h) | Cummins, Inc. (o) | 16 | |||||
| 3 | Deere & Co. | 371 | ||||||
| 6 | Fortive Corp. (o) | 350 | ||||||
| 59 | Ingersoll-Rand plc | 5,420 | ||||||
| 46 | PACCAR, Inc. (o) | 3,010 | ||||||
| 5 | Parker-Hannifin Corp. (o) | 823 | ||||||
| 13 | Snap-on, Inc. | 2,091 | ||||||
| 34 | Stanley Black & Decker, Inc. | 4,804 | ||||||
|
| |||||||
| 16,885 | ||||||||
|
| |||||||
Road & Rail — 1.6% |
| |||||||
| 9 | Canadian Pacific Railway Ltd., (Canada) | 1,464 | ||||||
| 18 | Norfolk Southern Corp. | 2,185 | ||||||
| 77 | Union Pacific Corp. (o) | 8,343 | ||||||
|
| |||||||
| 11,992 | ||||||||
|
| |||||||
Trading Companies & Distributors — 0.0% (g) | ||||||||
| 12 | HD Supply Holdings, Inc. (a) | 355 | ||||||
|
| |||||||
Total Industrials | 76,571 | |||||||
|
| |||||||
| SHARES | SECURITY DESCRIPTION | VALUE($) | ||||||
Information Technology — 23.2% |
| |||||||
Communications Equipment — 0.4% |
| |||||||
| 86 | Cisco Systems, Inc. | 2,686 | ||||||
|
| |||||||
Electronic Equipment, Instruments & Components — 0.6% |
| |||||||
| 63 | TE Connectivity Ltd. | 4,930 | ||||||
|
| |||||||
Internet Software & Services — 5.5% |
| |||||||
| 14 | Alphabet, Inc., Class A (a) (o) | 13,319 | ||||||
| 15 | Alphabet, Inc., Class C (a) (o) | 13,307 | ||||||
| 100 | Facebook, Inc., Class A (a) (o) | 15,084 | ||||||
|
| |||||||
| 41,710 | ||||||||
|
| |||||||
IT Services — 4.1% |
| |||||||
| 82 | Accenture plc, Class A (o) | 10,161 | ||||||
| 7 | Automatic Data Processing, Inc. | 744 | ||||||
| 45 | Fidelity National Information Services, Inc. | 3,816 | ||||||
| 13 | International Business Machines Corp. (o) | 1,927 | ||||||
| 13 | Paychex, Inc. | 723 | ||||||
| 15 | Vantiv, Inc., Class A (a) | 975 | ||||||
| 120 | Visa, Inc., Class A (o) | 11,254 | ||||||
| 13 | WEX, Inc. (a) | 1,343 | ||||||
|
| |||||||
| 30,943 | ||||||||
|
| |||||||
Semiconductors & Semiconductor Equipment — 3.5% |
| |||||||
| 82 | Analog Devices, Inc. (o) | 6,350 | ||||||
| 36 | Broadcom Ltd. | 8,498 | ||||||
| 6 | Lam Research Corp. | 780 | ||||||
| 24 | Microchip Technology, Inc. | 1,874 | ||||||
| 12 | NVIDIA Corp. (o) | 1,719 | ||||||
| 102 | Texas Instruments, Inc. (o) | 7,840 | ||||||
|
| |||||||
| 27,061 | ||||||||
|
| |||||||
Software — 4.8% |
| |||||||
| 67 | Adobe Systems, Inc. (a) (o) | 9,449 | ||||||
| 372 | Microsoft Corp. (o) | 25,642 | ||||||
| 20 | Oracle Corp. (o) | 981 | ||||||
| 9 | Workday, Inc., Class A (a) | 854 | ||||||
|
| |||||||
| 36,926 | ||||||||
|
| |||||||
Technology Hardware, Storage & Peripherals — 4.3% |
| |||||||
| 206 | Apple, Inc. (o) | 29,699 | ||||||
| 200 | HP, Inc. (o) | 3,502 | ||||||
|
| |||||||
| 33,201 | ||||||||
|
| |||||||
Total Information Technology | 177,457 | |||||||
|
| |||||||
Materials — 2.8% |
| |||||||
Chemicals — 2.1% |
| |||||||
| 6 | Albemarle Corp. | 602 | ||||||
| 9 | Celanese Corp., Series A | 816 | ||||||
| 41 | Dow Chemical Co. (The) | 2,582 | ||||||
SEE NOTES TO FINANCIAL STATEMENTS.
| JUNE 30, 2017 | J.P. MORGAN LARGE CAP FUNDS | 37 | ||||||
Table of Contents
JPMorgan Hedged Equity Fund
SCHEDULE OF PORTFOLIO INVESTMENTS
AS OF JUNE 30, 2017 (continued)
(Amounts in thousands, except number of Futures and Options contracts)
| SHARES | SECURITY DESCRIPTION | VALUE($) | ||||||
Common Stocks — continued | ||||||||
Chemicals — continued | ||||||||
| 51 | Eastman Chemical Co. | 4,243 | ||||||
| 78 | EI du Pont de Nemours & Co. | 6,324 | ||||||
| 76 | Mosaic Co. (The) (o) | 1,730 | ||||||
|
| |||||||
| 16,297 | ||||||||
|
| |||||||
Construction Materials — 0.1% |
| |||||||
| 4 | Vulcan Materials Co. | 532 | ||||||
|
| |||||||
Containers & Packaging — 0.5% |
| |||||||
| 26 | Crown Holdings, Inc. (a) | 1,557 | ||||||
| 35 | WestRock Co. | 1,962 | ||||||
|
| |||||||
| 3,519 | ||||||||
|
| |||||||
Metals & Mining — 0.1% |
| |||||||
| 16 | Alcoa Corp. | 510 | ||||||
| 18 | Newmont Mining Corp. | 577 | ||||||
|
| |||||||
| 1,087 | ||||||||
|
| |||||||
Total Materials | 21,435 | |||||||
|
| |||||||
Real Estate — 2.4% |
| |||||||
Equity Real Estate Investment Trusts (REITs) — 2.4% |
| |||||||
| 16 | AvalonBay Communities, Inc. | 3,163 | ||||||
| 8 | Boston Properties, Inc. | 1,009 | ||||||
| 21 | Brixmor Property Group, Inc. | 370 | ||||||
| 5 | Camden Property Trust | 385 | ||||||
| 6 | Digital Realty Trust, Inc. | 644 | ||||||
| 3 | Equinix, Inc. | 1,467 | ||||||
| 15 | Extra Space Storage, Inc. | 1,146 | ||||||
| 7 | Federal Realty Investment Trust | 910 | ||||||
| 36 | HCP, Inc. (o) | 1,165 | ||||||
| 28 | Kimco Realty Corp. | 514 | ||||||
| 7 | Omega Healthcare Investors, Inc. | 228 | ||||||
| 39 | Prologis, Inc. | 2,285 | ||||||
| 13 | Public Storage | 2,695 | ||||||
| 8 | Regency Centers Corp. | 501 | ||||||
| 16 | Vornado Realty Trust | 1,512 | ||||||
|
| |||||||
Total Real Estate | 17,994 | |||||||
|
| |||||||
Telecommunication Services — 1.4% |
| |||||||
Diversified Telecommunication Services — 1.3% |
| |||||||
| 152 | AT&T, Inc. (o) | 5,734 | ||||||
| 92 | Verizon Communications, Inc. (o) | 4,088 | ||||||
|
| |||||||
| 9,822 | ||||||||
|
| |||||||
Wireless Telecommunication Services — 0.1% |
| |||||||
| 18 | T-Mobile US, Inc. (a) (o) | 1,062 | ||||||
|
| |||||||
Total Telecommunication Services | 10,884 | |||||||
|
| |||||||
| SHARES | SECURITY DESCRIPTION | VALUE($) | ||||||
Utilities — 3.2% |
| |||||||
Electric Utilities — 2.6% |
| |||||||
| 10 | American Electric Power Co., Inc. | 716 | ||||||
| 20 | Duke Energy Corp. | 1,638 | ||||||
| 46 | Edison International | 3,632 | ||||||
| 45 | NextEra Energy, Inc. | 6,292 | ||||||
| 61 | PG&E Corp. | 4,060 | ||||||
| 80 | Xcel Energy, Inc. | 3,660 | ||||||
|
| |||||||
| 19,998 | ||||||||
|
| |||||||
Multi-Utilities — 0.6% | ||||||||
| 56 | CMS Energy Corp. | 2,609 | ||||||
| 62 | NiSource, Inc. | 1,574 | ||||||
|
| |||||||
| 4,183 | ||||||||
|
| |||||||
Total Utilities | 24,181 | |||||||
|
| |||||||
Total Common Stocks | 759,077 | |||||||
|
| |||||||
| NUMBER OF CONTRACTS | ||||||||
Options Purchased — 0.9% | ||||||||
Put Options Purchased — 0.9% |
| |||||||
| 3,173 | S&P 500 Index, expiring 09/29/17 at $2,300.00, European Style (a) | 6,981 | ||||||
|
| |||||||
| PRINCIPAL AMOUNT($) | ||||||||
Short-Term Investments — 3.8% | ||||||||
U.S. Treasury Obligation — 0.0% (g) |
| |||||||
| 165 | U.S. Treasury Bill, 0.984%, | 164 | ||||||
|
| |||||||
| SHARES | ||||||||
Investment Company — 3.8% |
| |||||||
| 28,836 | JPMorgan U.S. Government Money Market Fund, Institutional Class Shares, 0.840% (b) (l) | 28,836 | ||||||
|
| |||||||
Total Short-Term Investments | 29,000 | |||||||
|
| |||||||
Total Investments — 104.2% | 795,058 | |||||||
Liabilities in Excess of | (31,762 | ) | ||||||
|
| |||||||
NET ASSETS — 100.0% | $ | 763,296 | ||||||
|
| |||||||
Percentages indicated are based on net assets.
SEE NOTES TO FINANCIAL STATEMENTS.
| 38 | J.P. MORGAN LARGE CAP FUNDS | JUNE 30, 2017 | ||||
Table of Contents
| Futures Contracts | ||||||||||||||||||||
| NUMBER OF CONTRACTS | DESCRIPTION | EXPIRATION DATE | TRADING CURRENCY | NOTIONAL VALUE AT JUNE 30, 2017 | NET UNREALIZED APPRECIATION (DEPRECIATION) | |||||||||||||||
Long Futures Outstanding |
| |||||||||||||||||||
| 94 | E-mini S&P 500 Index | 09/15/17 | USD | $ | 11,378 | $ | (11 | ) | ||||||||||||
|
| |||||||||||||||||||
OPTIONS WRITTEN
| Call Option Written | ||||||||||||||||
| DESCRIPTION | EXERCISE PRICE | EXPIRATION DATE | NUMBER OF CONTRACTS | VALUE | ||||||||||||
S&P 500 Index, European Style (Premiums received of $4,845) | $ | 2,495.000 | 09/29/17 | 3,173 | $ | (4,886 | ) | |||||||||
|
| |||||||||||||||
| Put Option Written | ||||||||||||||||
| DESCRIPTION | EXERCISE PRICE | EXPIRATION DATE | NUMBER OF CONTRACTS | VALUE | ||||||||||||
S&P 500 Index, European Style (Premiums received of $1,165) | $ | 1,950.000 | 09/29/17 | 3,173 | $ | (1,174 | ) | |||||||||
|
| |||||||||||||||
SEE NOTES TO FINANCIAL STATEMENTS.
| JUNE 30, 2017 | J.P. MORGAN LARGE CAP FUNDS | 39 | ||||||
Table of Contents
JPMorgan Large Cap Growth Fund
SCHEDULE OF PORTFOLIO INVESTMENTS
AS OF JUNE 30, 2017
(Amounts in thousands)
| SHARES | SECURITY DESCRIPTION | VALUE($) | ||||||
Common Stocks — 97.7% | ||||||||
Consumer Discretionary — 20.9% |
| |||||||
Automobiles — 0.7% |
| |||||||
| 243 | Tesla, Inc. (a) | 87,980 | ||||||
|
| |||||||
Hotels, Restaurants & Leisure — 0.9% |
| |||||||
| 1,281 | Las Vegas Sands Corp. | 81,849 | ||||||
| 556 | Starbucks Corp. | 32,437 | ||||||
|
| |||||||
| 114,286 | ||||||||
|
| |||||||
Household Durables — 0.9% |
| |||||||
| 2,014 | Newell Brands, Inc. | 108,007 | ||||||
|
| |||||||
Internet & Direct Marketing Retail — 8.6% |
| |||||||
| 702 | Amazon.com, Inc. (a) | 679,672 | ||||||
| 923 | Netflix, Inc. (a) | 137,950 | ||||||
| 128 | Priceline Group, Inc. (The) (a) | 238,865 | ||||||
|
| |||||||
| 1,056,487 | ||||||||
|
| |||||||
Media — 2.8% |
| |||||||
| 8,852 | Comcast Corp., Class A | 344,531 | ||||||
|
| |||||||
Specialty Retail — 7.0% |
| |||||||
| 2,876 | Home Depot, Inc. (The) | 441,240 | ||||||
| 1,848 | Ross Stores, Inc. | 106,662 | ||||||
| 1,080 | Ulta Beauty, Inc. (a) | 310,183 | ||||||
|
| |||||||
| 858,085 | ||||||||
|
| |||||||
Total Consumer Discretionary | 2,569,376 | |||||||
|
| |||||||
Consumer Staples — 2.3% |
| |||||||
Beverages — 2.3% |
| |||||||
| 625 | Constellation Brands, Inc., Class A | 121,004 | ||||||
| 3,091 | Monster Beverage Corp. (a) | 153,566 | ||||||
|
| |||||||
Total Consumer Staples | 274,570 | |||||||
|
| |||||||
Energy — 0.8% |
| |||||||
Oil, Gas & Consumable Fuels — 0.8% |
| |||||||
| 613 | Pioneer Natural Resources Co. | 97,759 | ||||||
|
| |||||||
Financials — 6.5% |
| |||||||
Banks — 0.5% |
| |||||||
| 306 | SVB Financial Group (a) | 53,756 | ||||||
|
| |||||||
Capital Markets — 6.0% |
| |||||||
| 7,139 | Charles Schwab Corp. (The) | 306,704 | ||||||
| 2,572 | Intercontinental Exchange, Inc. | 169,527 | ||||||
| 2,179 | Morgan Stanley | 97,083 | ||||||
| 1,145 | S&P Global, Inc. | 167,217 | ||||||
|
| |||||||
| 740,531 | ||||||||
|
| |||||||
Total Financials | 794,287 | |||||||
|
| |||||||
Health Care — 12.6% |
| |||||||
Biotechnology — 2.3% |
| |||||||
| 549 | Incyte Corp. (a) | 69,137 | ||||||
| SHARES | SECURITY DESCRIPTION | VALUE($) | ||||||
Biotechnology — continued |
| |||||||
| 115 | Regeneron Pharmaceuticals, Inc. (a) | 56,334 | ||||||
| 1,208 | Vertex Pharmaceuticals, Inc. (a) | 155,714 | ||||||
|
| |||||||
| 281,185 | ||||||||
|
| |||||||
Health Care Equipment & Supplies — 6.5% | ||||||||
| 988 | Becton Dickinson and Co. | 192,710 | ||||||
| 4,898 | Boston Scientific Corp. (a) | 135,759 | ||||||
| 821 | DexCom, Inc. (a) | 60,078 | ||||||
| 436 | Intuitive Surgical, Inc. (a) | 407,821 | ||||||
|
| |||||||
| 796,368 | ||||||||
|
| |||||||
Health Care Providers & Services — 2.3% |
| |||||||
| 254 | Humana, Inc. | 61,142 | ||||||
| 1,183 | UnitedHealth Group, Inc. | 219,389 | ||||||
|
| |||||||
| 280,531 | ||||||||
|
| |||||||
Life Sciences Tools & Services — 1.5% |
| |||||||
| 457 | Illumina, Inc. (a) | 79,264 | ||||||
| 627 | Thermo Fisher Scientific, Inc. | 109,333 | ||||||
|
| |||||||
| 188,597 | ||||||||
|
| |||||||
Total Health Care | 1,546,681 | |||||||
|
| |||||||
Industrials — 8.7% |
| |||||||
Aerospace & Defense — 0.8% |
| |||||||
| 377 | Northrop Grumman Corp. | 96,882 | ||||||
|
| |||||||
Airlines — 3.7% |
| |||||||
| 5,431 | Delta Air Lines, Inc. | 291,841 | ||||||
| 2,576 | Southwest Airlines Co. | 160,060 | ||||||
|
| |||||||
| 451,901 | ||||||||
|
| |||||||
Electrical Equipment — 1.1% |
| |||||||
| 388 | Acuity Brands, Inc. | 78,933 | ||||||
| 378 | Rockwell Automation, Inc. | 61,205 | ||||||
|
| |||||||
| 140,138 | ||||||||
|
| |||||||
Industrial Conglomerates — 2.6% |
| |||||||
| 1,286 | Honeywell International, Inc. | 171,358 | ||||||
| 656 | Roper Technologies, Inc. | 151,791 | ||||||
|
| |||||||
| 323,149 | ||||||||
|
| |||||||
Trading Companies & Distributors — 0.5% |
| |||||||
| 519 | United Rentals, Inc. (a) | 58,463 | ||||||
|
| |||||||
Total Industrials | 1,070,533 | |||||||
|
| |||||||
Information Technology — 42.4% |
| |||||||
Electronic Equipment, Instruments & Components — 0.4% |
| |||||||
| 620 | Amphenol Corp., Class A | 45,768 | ||||||
|
| |||||||
Internet Software & Services — 11.1% |
| |||||||
| 796 | Alphabet, Inc., Class C (a) | 723,769 | ||||||
| 2,970 | Facebook, Inc., Class A (a) | 448,395 | ||||||
SEE NOTES TO FINANCIAL STATEMENTS.
| 40 | J.P. MORGAN LARGE CAP FUNDS | JUNE 30, 2017 | ||||
Table of Contents
| SHARES | SECURITY DESCRIPTION | VALUE($) | ||||||
Common Stocks — continued | ||||||||
Internet Software & Services — continued |
| |||||||
| 549 | MercadoLibre, Inc., (Argentina) | 137,733 | ||||||
| 621 | VeriSign, Inc. (a) | 57,710 | ||||||
|
| |||||||
| 1,367,607 | ||||||||
|
| |||||||
IT Services — 8.1% |
| |||||||
| 3,675 | Mastercard, Inc., Class A | 446,268 | ||||||
| 2,964 | PayPal Holdings, Inc. (a) | 159,073 | ||||||
| 2,364 | Vantiv, Inc., Class A (a) | 149,748 | ||||||
| 2,548 | Visa, Inc., Class A | 238,989 | ||||||
|
| |||||||
| 994,078 | ||||||||
|
| |||||||
Semiconductors & Semiconductor Equipment — 7.3% |
| |||||||
| 4,423 | Applied Materials, Inc. | 182,710 | ||||||
| 1,322 | Broadcom Ltd. | 308,162 | ||||||
| 2,849 | NVIDIA Corp. | 411,794 | ||||||
|
| |||||||
| 902,666 | ||||||||
|
| |||||||
Software — 11.3% |
| |||||||
| 4,845 | Activision Blizzard, Inc. | 278,938 | ||||||
| 1,972 | Adobe Systems, Inc. (a) | 278,920 | ||||||
| 1,974 | Electronic Arts, Inc. (a) | 208,649 | ||||||
| 4,502 | Microsoft Corp. | 310,316 | ||||||
| 910 | salesforce.com, Inc. (a) | 78,780 | ||||||
| 1,801 | ServiceNow, Inc. (a) | 190,896 | ||||||
| 2,030 | Snap, Inc., Class A (a) | 36,071 | ||||||
|
| |||||||
| 1,382,570 | ||||||||
|
| |||||||
Technology Hardware, Storage & Peripherals — 4.2% |
| |||||||
| 3,584 | Apple, Inc. | 516,137 | ||||||
|
| |||||||
Total Information Technology | 5,208,826 | |||||||
|
| |||||||
Materials — 2.8% |
| |||||||
Chemicals — 2.2% |
| |||||||
| 1,117 | Ecolab, Inc. | 148,335 | ||||||
| 353 | Sherwin-Williams Co. (The) | 124,029 | ||||||
|
| |||||||
| 272,364 | ||||||||
|
| |||||||
Construction Materials — 0.6% |
| |||||||
| 582 | Vulcan Materials Co. | 73,715 | ||||||
|
| |||||||
Total Materials | 346,079 | |||||||
|
| |||||||
Real Estate — 0.7% |
| |||||||
Equity Real Estate Investment Trusts (REITs) — 0.7% |
| |||||||
| 208 | Equinix, Inc. | 89,394 | ||||||
|
| |||||||
Total Common Stocks | 11,997,505 | |||||||
|
| |||||||
| SHARES | SECURITY DESCRIPTION | VALUE($) | ||||||
Short-Term Investment — 2.7% | ||||||||
Investment Company — 2.7% |
| |||||||
| 328,600 | JPMorgan U.S. Government Money Market Fund, Institutional Class Shares, 0.840% (b) (l) | 328,600 | ||||||
|
| |||||||
Total Investments — 100.4% | 12,326,105 | |||||||
Liabilities in Excess of | (49,401 | ) | ||||||
|
| |||||||
NET ASSETS — 100.0% | $ | 12,276,704 | ||||||
|
| |||||||
Percentages indicated are based on net assets.
SEE NOTES TO FINANCIAL STATEMENTS.
| JUNE 30, 2017 | J.P. MORGAN LARGE CAP FUNDS | 41 | ||||||
Table of Contents
JPMorgan Large Cap Value Fund
SCHEDULE OF PORTFOLIO INVESTMENTS
AS OF JUNE 30, 2017
(Amounts in thousands)
| SHARES | SECURITY DESCRIPTION | VALUE($) | ||||||
Common Stocks — 98.6% | ||||||||
Consumer Discretionary — 18.6% |
| |||||||
Auto Components — 2.8% |
| |||||||
| 117 | Delphi Automotive plc | 10,229 | ||||||
| 417 | Magna International, Inc., (Canada) | 19,324 | ||||||
|
| |||||||
| 29,553 | ||||||||
|
| |||||||
Automobiles — 4.5% |
| |||||||
| 927 | Ford Motor Co. | 10,374 | ||||||
| 1,065 | General Motors Co. | 37,215 | ||||||
|
| |||||||
| 47,589 | ||||||||
|
| |||||||
Hotels, Restaurants & Leisure — 3.6% |
| |||||||
| 391 | Arcos Dorados Holdings, Inc., (Uruguay), Class A (a) | 2,911 | ||||||
| 126 | Bloomin’ Brands, Inc. | 2,669 | ||||||
| 142 | Carnival Corp. | 9,311 | ||||||
| 182 | Royal Caribbean Cruises Ltd. | 19,836 | ||||||
| 93 | Yum China Holdings, Inc. (a) | 3,663 | ||||||
|
| |||||||
| 38,390 | ||||||||
|
| |||||||
Household Durables — 3.3% |
| |||||||
| 127 | CalAtlantic Group, Inc. | 4,489 | ||||||
| 505 | DR Horton, Inc. | 17,448 | ||||||
| 336 | Toll Brothers, Inc. | 13,283 | ||||||
|
| |||||||
| 35,220 | ||||||||
|
| |||||||
Leisure Products — 1.3% |
| |||||||
| 214 | Brunswick Corp. | 13,399 | ||||||
|
| |||||||
Media — 1.5% |
| |||||||
| 253 | DISH Network Corp., Class A (a) | 15,899 | ||||||
|
| |||||||
Multiline Retail — 0.5% |
| |||||||
| 69 | Dollar Tree, Inc. (a) | 4,811 | ||||||
|
| |||||||
Specialty Retail — 1.1% |
| |||||||
| 7 | AutoZone, Inc. (a) | 3,936 | ||||||
| 56 | Murphy USA, Inc. (a) | 4,143 | ||||||
| 44 | TJX Cos., Inc. (The) | 3,175 | ||||||
|
| |||||||
| 11,254 | ||||||||
|
| |||||||
Total Consumer Discretionary | 196,115 | |||||||
|
| |||||||
Consumer Staples — 4.0% |
| |||||||
Beverages — 1.2% |
| |||||||
| 142 | Molson Coors Brewing Co., Class B | 12,234 | ||||||
|
| |||||||
Food & Staples Retailing — 1.4% |
| |||||||
| 126 | Kroger Co. (The) | 2,943 | ||||||
| 155 | Walgreens Boots Alliance, Inc. | 12,130 | ||||||
|
| |||||||
| 15,073 | ||||||||
|
| |||||||
Tobacco — 1.4% |
| |||||||
| 126 | Philip Morris International, Inc. | 14,764 | ||||||
|
| |||||||
Total Consumer Staples | 42,071 | |||||||
|
| |||||||
| SHARES | SECURITY DESCRIPTION | VALUE($) | ||||||
Energy — 9.5% |
| |||||||
Energy Equipment & Services — 0.7% |
| |||||||
| 123 | Ensco plc, Class A | 636 | ||||||
| 173 | Halliburton Co. | 7,402 | ||||||
|
| |||||||
| 8,038 | ||||||||
|
| |||||||
Oil, Gas & Consumable Fuels — 8.8% |
| |||||||
| 107 | Anadarko Petroleum Corp. | 4,869 | ||||||
| 153 | Diamondback Energy, Inc. (a) | 13,588 | ||||||
| 219 | EOG Resources, Inc. | 19,806 | ||||||
| 257 | Kinder Morgan, Inc. | 4,924 | ||||||
| 107 | Marathon Petroleum Corp. | 5,573 | ||||||
| 193 | Occidental Petroleum Corp. | 11,537 | ||||||
| 32 | Phillips 66 | 2,621 | ||||||
| 117 | Pioneer Natural Resources Co. | 18,607 | ||||||
| 165 | Suncor Energy, Inc., (Canada) | 4,815 | ||||||
| 90 | Valero Energy Corp. | 6,038 | ||||||
|
| |||||||
| 92,378 | ||||||||
|
| |||||||
Total Energy | 100,416 | |||||||
|
| |||||||
Financials — 29.5% |
| |||||||
Banks — 16.8% |
| |||||||
| 1,495 | Bank of America Corp. | 36,262 | ||||||
| 269 | BB&T Corp. | 12,215 | ||||||
| 683 | Citigroup, Inc. | 45,701 | ||||||
| 524 | Huntington Bancshares, Inc. | 7,087 | ||||||
| 44 | IBERIABANK Corp. | 3,553 | ||||||
| 864 | KeyCorp | 16,190 | ||||||
| 139 | SunTrust Banks, Inc. | 7,901 | ||||||
| 866 | Wells Fargo & Co. | 48,010 | ||||||
|
| |||||||
| 176,919 | ||||||||
|
| |||||||
Capital Markets — 6.1% |
| |||||||
| 107 | Bank of New York Mellon Corp. (The) | 5,464 | ||||||
| 424 | Charles Schwab Corp. (The) | 18,232 | ||||||
| 58 | Goldman Sachs Group, Inc. (The) | 12,870 | ||||||
| 231 | Morgan Stanley | 10,294 | ||||||
| 199 | State Street Corp. | 17,829 | ||||||
|
| |||||||
| 64,689 | ||||||||
|
| |||||||
Consumer Finance — 2.2% |
| |||||||
| 151 | Ally Financial, Inc. | 3,160 | ||||||
| 120 | Capital One Financial Corp. | 9,873 | ||||||
| 111 | LendingClub Corp. (a) | 610 | ||||||
| 307 | Synchrony Financial | 9,143 | ||||||
|
| |||||||
| 22,786 | ||||||||
|
| |||||||
SEE NOTES TO FINANCIAL STATEMENTS.
| 42 | J.P. MORGAN LARGE CAP FUNDS | JUNE 30, 2017 | ||||
Table of Contents
| SHARES | SECURITY DESCRIPTION | VALUE($) | ||||||
Common Stocks — continued | ||||||||
Diversified Financial Services — 1.4% |
| |||||||
| 60 | Berkshire Hathaway, Inc., Class B (a) | 10,112 | ||||||
| 113 | Voya Financial, Inc. | 4,183 | ||||||
|
| |||||||
| 14,295 | ||||||||
|
| |||||||
Insurance — 3.0% |
| |||||||
| 36 | Chubb Ltd. | 5,190 | ||||||
| 150 | Lincoln National Corp. | 10,137 | ||||||
| 289 | MetLife, Inc. | 15,852 | ||||||
|
| |||||||
| 31,179 | ||||||||
|
| |||||||
Total Financials | 309,868 | |||||||
|
| |||||||
Health Care — 9.9% |
| |||||||
Biotechnology — 1.7% |
| |||||||
| 20 | Biogen, Inc. (a) | 5,291 | ||||||
| 187 | Gilead Sciences, Inc. | 13,215 | ||||||
|
| |||||||
| 18,506 | ||||||||
|
| |||||||
Health Care Equipment & Supplies — 1.0% |
| |||||||
| 114 | Boston Scientific Corp. (a) | 3,157 | ||||||
| 60 | Zimmer Biomet Holdings, Inc. | 7,704 | ||||||
|
| |||||||
| 10,861 | ||||||||
|
| |||||||
Health Care Providers & Services — 1.7% |
| |||||||
| 15 | Cigna Corp. | 2,461 | ||||||
| 81 | UnitedHealth Group, Inc. | 15,056 | ||||||
|
| |||||||
| 17,517 | ||||||||
|
| |||||||
Pharmaceuticals — 5.5% |
| |||||||
| 76 | Allergan plc | 18,475 | ||||||
| 74 | Bristol-Myers Squibb Co. | 4,129 | ||||||
| 121 | Merck & Co., Inc. | 7,729 | ||||||
| 815 | Pfizer, Inc. | 27,366 | ||||||
|
| |||||||
| 57,699 | ||||||||
|
| |||||||
Total Health Care | 104,583 | |||||||
|
| |||||||
Industrials — 12.9% |
| |||||||
Aerospace & Defense — 1.2% |
| |||||||
| 249 | Embraer SA, (Brazil), ADR | 4,538 | ||||||
| 181 | Textron, Inc. | 8,506 | ||||||
|
| |||||||
| 13,044 | ||||||||
|
| |||||||
Airlines — 5.8% |
| |||||||
| 69 | Alaska Air Group, Inc. | 6,194 | ||||||
| 126 | American Airlines Group, Inc. | 6,345 | ||||||
| 460 | Delta Air Lines, Inc. | 24,720 | ||||||
| 265 | JetBlue Airways Corp. (a) | 6,059 | ||||||
| 92 | Spirit Airlines, Inc. (a) | 4,752 | ||||||
| 175 | United Continental Holdings, Inc. (a) | 13,173 | ||||||
|
| |||||||
| 61,243 | ||||||||
|
| |||||||
| SHARES | SECURITY DESCRIPTION | VALUE($) | ||||||
Building Products — 0.7% |
| |||||||
| 160 | Johnson Controls International plc | 6,933 | ||||||
|
| |||||||
Industrial Conglomerates — 1.6% |
| |||||||
| 624 | General Electric Co. | 16,854 | ||||||
|
| |||||||
Machinery — 0.9% |
| |||||||
| 61 | Ingersoll-Rand plc | 5,566 | ||||||
| 26 | Snap-on, Inc. | 4,155 | ||||||
|
| |||||||
| 9,721 | ||||||||
|
| |||||||
Road & Rail — 2.5% |
| |||||||
| 52 | Canadian Pacific Railway Ltd., (Canada) | 8,378 | ||||||
| 161 | Union Pacific Corp. | 17,491 | ||||||
|
| |||||||
| 25,869 | ||||||||
|
| |||||||
Trading Companies & Distributors — 0.2% |
| |||||||
| 133 | NOW, Inc. (a) | 2,134 | ||||||
|
| |||||||
Total Industrials | 135,798 | |||||||
|
| |||||||
Information Technology — 5.8% |
| |||||||
Communications Equipment — 0.4% |
| |||||||
| 115 | CommScope Holding Co., Inc. (a) | 4,362 | ||||||
|
| |||||||
Electronic Equipment, Instruments & Components — 0.4% |
| |||||||
| 54 | TE Connectivity Ltd. | 4,217 | ||||||
|
| |||||||
Internet Software & Services — 0.5% |
| |||||||
| 149 | eBay, Inc. (a) | 5,217 | ||||||
|
| |||||||
IT Services — 2.0% |
| |||||||
| 63 | Accenture plc, Class A | 7,742 | ||||||
| 25 | FleetCor Technologies, Inc. (a) | 3,620 | ||||||
| 61 | International Business Machines Corp. | 9,415 | ||||||
|
| |||||||
| 20,777 | ||||||||
|
| |||||||
Semiconductors & Semiconductor Equipment — 2.1% |
| |||||||
| 88 | Broadcom Ltd. | 20,427 | ||||||
| 25 | Texas Instruments, Inc. | 1,947 | ||||||
|
| |||||||
| 22,374 | ||||||||
|
| |||||||
Software — 0.4% |
| |||||||
| 58 | Microsoft Corp. | 3,977 | ||||||
|
| |||||||
Total Information Technology | 60,924 | |||||||
|
| |||||||
Materials — 5.5% |
| |||||||
Chemicals — 3.6% |
| |||||||
| 47 | Celanese Corp., Series A | 4,472 | ||||||
| 89 | Dow Chemical Co. (The) | 5,613 | ||||||
| 153 | Eastman Chemical Co. | 12,842 | ||||||
| 90 | EI du Pont de Nemours & Co. | 7,264 | ||||||
| 151 | Mosaic Co. (The) | 3,452 | ||||||
| 146 | Olin Corp. | 4,421 | ||||||
|
| |||||||
| 38,064 | ||||||||
|
| |||||||
SEE NOTES TO FINANCIAL STATEMENTS.
| JUNE 30, 2017 | J.P. MORGAN LARGE CAP FUNDS | 43 | ||||||
Table of Contents
JPMorgan Large Cap Value Fund
SCHEDULE OF PORTFOLIO INVESTMENTS
AS OF JUNE 30, 2017 (continued)
(Amounts in thousands)
| SHARES | SECURITY DESCRIPTION | VALUE($) | ||||||
Common Stocks — continued | ||||||||
Metals & Mining — 1.9% |
| |||||||
| 577 | AK Steel Holding Corp. (a) | 3,794 | ||||||
| 178 | Alcoa Corp. | 5,795 | ||||||
| 106 | Newmont Mining Corp. | 3,433 | ||||||
| 87 | Reliance Steel & Aluminum Co. | 6,298 | ||||||
|
| |||||||
| 19,320 | ||||||||
|
| |||||||
Total Materials | 57,384 | |||||||
|
| |||||||
Real Estate — 1.5% |
| |||||||
Equity Real Estate Investment Trusts (REITs) — 1.5% |
| |||||||
| 130 | Acadia Realty Trust | 3,606 | ||||||
| 28 | Federal Realty Investment Trust | 3,589 | ||||||
| 168 | Kimco Realty Corp. | 3,079 | ||||||
| 25 | Public Storage | 5,151 | ||||||
|
| |||||||
Total Real Estate | 15,425 | |||||||
|
| |||||||
Telecommunication Services — 1.4% |
| |||||||
Diversified Telecommunication Services — 0.8% |
| |||||||
| 212 | AT&T, Inc. | 7,984 | ||||||
|
| |||||||
Wireless Telecommunication Services — 0.6% |
| |||||||
| 107 | T-Mobile US, Inc. (a) | 6,510 | ||||||
|
| |||||||
Total Telecommunication Services | 14,494 | |||||||
|
| |||||||
Total Common Stocks | 1,037,078 | |||||||
|
| |||||||
| NUMBER OF WARRANTS | SECURITY DESCRIPTION | VALUE($) | ||||||
Warrant — 0.0% (g) | ||||||||
Financials — 0.0% (g) |
| |||||||
Consumer Finance — 0.0% (g) |
| |||||||
| 36 | Emergent Capital, Inc., expiring | — | (h) | |||||
|
| |||||||
| SHARES | ||||||||
Short-Term Investment — 0.8% | ||||||||
Investment Company — 0.8% |
| |||||||
| 8,631 | JPMorgan U.S. Government Money Market Fund, Institutional Class Shares, 0.840% (b) (l) | 8,631 | ||||||
|
| |||||||
Total Investments — 99.4% | 1,045,709 | |||||||
Other Assets in Excess of | 6,555 | |||||||
|
| |||||||
NET ASSETS — 100.0% | $ | 1,052,264 | ||||||
|
| |||||||
Percentages indicated are based on net assets.
SEE NOTES TO FINANCIAL STATEMENTS.
| 44 | J.P. MORGAN LARGE CAP FUNDS | JUNE 30, 2017 | ||||
Table of Contents
JPMorgan U.S. Equity Fund
SCHEDULE OF PORTFOLIO INVESTMENTS
AS OF JUNE 30, 2017
(Amounts in thousands)
| SHARES | SECURITY DESCRIPTION | VALUE($) | ||||||
Common Stocks — 98.8% | ||||||||
Consumer Discretionary — 13.7% |
| |||||||
Auto Components — 0.2% |
| |||||||
| 274 | Delphi Automotive plc | 24,051 | ||||||
|
| |||||||
Automobiles — 0.4% |
| |||||||
| 2,696 | Ford Motor Co. | 30,165 | ||||||
| 846 | General Motors Co. | 29,554 | ||||||
|
| |||||||
| 59,719 | ||||||||
|
| |||||||
Hotels, Restaurants & Leisure — 1.2% |
| |||||||
| 353 | Royal Caribbean Cruises Ltd. | 38,584 | ||||||
| 2,352 | Starbucks Corp. | 137,130 | ||||||
|
| |||||||
| 175,714 | ||||||||
|
| |||||||
Household Durables — 0.6% |
| |||||||
| 267 | Mohawk Industries, Inc. (a) | 64,411 | ||||||
| 621 | PulteGroup, Inc. | 15,228 | ||||||
| 233 | Toll Brothers, Inc. | 9,205 | ||||||
|
| |||||||
| 88,844 | ||||||||
|
| |||||||
Internet & Direct Marketing Retail — 1.9% |
| |||||||
| 281 | Amazon.com, Inc. (a) | 271,693 | ||||||
|
| |||||||
Media — 5.0% |
| |||||||
| 409 | Charter Communications, Inc., Class A (a) | 137,726 | ||||||
| 2,207 | Comcast Corp., Class A | 85,911 | ||||||
| 1,489 | DISH Network Corp., Class A (a) | 93,457 | ||||||
| 2,100 | Twenty-First Century Fox, Inc., Class A | 59,512 | ||||||
| 312 | Twenty-First Century Fox, Inc., Class B | 8,695 | ||||||
| 3,068 | Walt Disney Co. (The) | 325,926 | ||||||
|
| |||||||
| 711,227 | ||||||||
|
| |||||||
Specialty Retail — 3.9% |
| |||||||
| 60 | AutoZone, Inc. (a) | 34,154 | ||||||
| 1,544 | Home Depot, Inc. (The) | 236,798 | ||||||
| 981 | Lowe’s Cos., Inc. | 76,063 | ||||||
| 288 | O’Reilly Automotive, Inc. (a) | 62,906 | ||||||
| 1,987 | TJX Cos., Inc. (The) | 143,403 | ||||||
|
| |||||||
| 553,324 | ||||||||
|
| |||||||
Textiles, Apparel & Luxury Goods — 0.5% |
| |||||||
| 1,252 | NIKE, Inc., Class B | 73,861 | ||||||
|
| |||||||
Total Consumer Discretionary | 1,958,433 | |||||||
|
| |||||||
Consumer Staples — 6.5% |
| |||||||
Beverages — 3.4% |
| |||||||
| 277 | Constellation Brands, Inc., Class A | 53,620 | ||||||
| 1,524 | Molson Coors Brewing Co., Class B | 131,620 | ||||||
| 2,670 | PepsiCo, Inc. | 308,358 | ||||||
|
| |||||||
| 493,598 | ||||||||
|
| |||||||
| SHARES | SECURITY DESCRIPTION | VALUE($) | ||||||
Food & Staples Retailing — 0.8% |
| |||||||
| 1,596 | Kroger Co. (The) | 37,221 | ||||||
| 937 | Walgreens Boots Alliance, Inc. | 73,342 | ||||||
|
| |||||||
| 110,563 | ||||||||
|
| |||||||
Food Products — 1.4% |
| |||||||
| 223 | Kraft Heinz Co. (The) | 19,131 | ||||||
| 4,056 | Mondelez International, Inc., Class A | 175,176 | ||||||
|
| |||||||
| 194,307 | ||||||||
|
| |||||||
Personal Products — 0.2% |
| |||||||
| 269 | Estee Lauder Cos., Inc. (The), Class A | 25,860 | ||||||
|
| |||||||
Tobacco — 0.7% |
| |||||||
| 895 | Philip Morris International, Inc. | 105,155 | ||||||
|
| |||||||
Total Consumer Staples | 929,483 | |||||||
|
| |||||||
Energy — 6.3% |
| |||||||
Oil, Gas & Consumable Fuels — 6.3% |
| |||||||
| 497 | Anadarko Petroleum Corp. | 22,521 | ||||||
| 884 | Apache Corp. | 42,386 | ||||||
| 441 | Chevron Corp. | 46,012 | ||||||
| 881 | Concho Resources, Inc. (a) | 107,114 | ||||||
| 962 | Diamondback Energy, Inc. (a) | 85,465 | ||||||
| 2,758 | EOG Resources, Inc. | 249,638 | ||||||
| 691 | EQT Corp. | 40,487 | ||||||
| 1,684 | Occidental Petroleum Corp. | 100,806 | ||||||
| 562 | Parsley Energy, Inc., Class A (a) | 15,606 | ||||||
| 213 | Phillips 66 | 17,587 | ||||||
| 1,103 | Pioneer Natural Resources Co. | 176,026 | ||||||
|
| |||||||
Total Energy | 903,648 | |||||||
|
| |||||||
Financials — 15.8% |
| |||||||
Banks — 7.8% |
| |||||||
| 12,453 | Bank of America Corp. | 302,116 | ||||||
| 5,801 | Citigroup, Inc. | 387,991 | ||||||
| 69 | First Republic Bank | 6,944 | ||||||
| 2,694 | Huntington Bancshares, Inc. | 36,425 | ||||||
| 6,500 | KeyCorp | 121,804 | ||||||
| 299 | Regions Financial Corp. | 4,383 | ||||||
| 1,237 | SunTrust Banks, Inc. | 70,184 | ||||||
| 158 | SVB Financial Group (a) | 27,727 | ||||||
| 2,868 | Wells Fargo & Co. | 158,935 | ||||||
|
| |||||||
| 1,116,509 | ||||||||
|
| |||||||
Capital Markets — 3.1% |
| |||||||
| 433 | Ameriprise Financial, Inc. | 55,163 | ||||||
| 862 | Bank of New York Mellon Corp. (The) | 43,988 | ||||||
| 26 | BlackRock, Inc. | 10,861 | ||||||
SEE NOTES TO FINANCIAL STATEMENTS.
| JUNE 30, 2017 | J.P. MORGAN LARGE CAP FUNDS | 45 | ||||||
Table of Contents
JPMorgan U.S. Equity Fund
SCHEDULE OF PORTFOLIO INVESTMENTS
AS OF JUNE 30, 2017 (continued)
(Amounts in thousands)
| SHARES | SECURITY DESCRIPTION | VALUE($) | ||||||
Common Stocks — continued | ||||||||
Capital Markets — continued |
| |||||||
| 1,383 | Charles Schwab Corp. (The) | 59,411 | ||||||
| 83 | Goldman Sachs Group, Inc. (The) | 18,423 | ||||||
| 1,010 | Intercontinental Exchange, Inc. | 66,598 | ||||||
| 4,371 | Morgan Stanley | 194,762 | ||||||
|
| |||||||
| 449,206 | ||||||||
|
| |||||||
Consumer Finance — 0.5% |
| |||||||
| 765 | Capital One Financial Corp. | 63,228 | ||||||
| 401 | Synchrony Financial | 11,965 | ||||||
|
| |||||||
| 75,193 | ||||||||
|
| |||||||
Diversified Financial Services — 0.1% |
| |||||||
| 491 | Voya Financial, Inc. | 18,106 | ||||||
|
| |||||||
Insurance — 4.3% |
| |||||||
| 2,310 | American International Group, Inc. | 144,392 | ||||||
| 994 | Arthur J Gallagher & Co. | 56,923 | ||||||
| 1,341 | Chubb Ltd. | 194,974 | ||||||
| 1,429 | Hartford Financial Services Group, Inc. (The) | 75,147 | ||||||
| 338 | Lincoln National Corp. | 22,861 | ||||||
| 1,329 | MetLife, Inc. | 72,994 | ||||||
| 368 | Prudential Financial, Inc. | 39,841 | ||||||
|
| |||||||
| 607,132 | ||||||||
|
| |||||||
Total Financials | 2,266,146 | |||||||
|
| |||||||
Health Care — 14.1% |
| |||||||
Biotechnology — 1.6% |
| |||||||
| 165 | Biogen, Inc. (a) | 44,774 | ||||||
| 108 | BioMarin Pharmaceutical, Inc. (a) | 9,814 | ||||||
| 531 | Celgene Corp. (a) | 69,003 | ||||||
| 160 | Gilead Sciences, Inc. | 11,304 | ||||||
| 165 | Incyte Corp. (a) | 20,731 | ||||||
| 579 | Vertex Pharmaceuticals, Inc. (a) | 74,580 | ||||||
|
| |||||||
| 230,206 | ||||||||
|
| |||||||
Health Care Equipment & Supplies — 1.8% |
| |||||||
| 516 | Abbott Laboratories | 25,079 | ||||||
| 7,097 | Boston Scientific Corp. (a) | 196,728 | ||||||
| 217 | Zimmer Biomet Holdings, Inc. | 27,850 | ||||||
|
| |||||||
| 249,657 | ||||||||
|
| |||||||
Health Care Providers & Services — 3.7% |
| |||||||
| 155 | Aetna, Inc. | 23,483 | ||||||
| 125 | Cigna Corp. | 20,908 | ||||||
| 199 | Humana, Inc. | 47,832 | ||||||
| 2,376 | UnitedHealth Group, Inc. | 440,634 | ||||||
|
| |||||||
| 532,857 | ||||||||
|
| |||||||
| SHARES | SECURITY DESCRIPTION | VALUE($) | ||||||
Life Sciences Tools & Services — 0.9% |
| |||||||
| 2,028 | Agilent Technologies, Inc. | 120,298 | ||||||
|
| |||||||
Pharmaceuticals — 6.1% |
| |||||||
| 626 | Allergan plc | 152,053 | ||||||
| 1,495 | Bristol-Myers Squibb Co. | 83,274 | ||||||
| 2,137 | Eli Lilly & Co. | 175,864 | ||||||
| 2,060 | Merck & Co., Inc. | 132,000 | ||||||
| 9,937 | Pfizer, Inc. | 333,797 | ||||||
|
| |||||||
| 876,988 | ||||||||
|
| |||||||
Total Health Care | 2,010,006 | |||||||
|
| |||||||
Industrials — 12.5% |
| |||||||
Aerospace & Defense — 2.4% |
| |||||||
| 864 | General Dynamics Corp. | 171,191 | ||||||
| 253 | L3 Technologies, Inc. | 42,282 | ||||||
| 519 | Northrop Grumman Corp. | 133,263 | ||||||
|
| |||||||
| 346,736 | ||||||||
|
| |||||||
Airlines — 1.2% |
| |||||||
| 1,264 | Delta Air Lines, Inc. | 67,907 | ||||||
| 1,364 | United Continental Holdings, Inc. (a) | 102,674 | ||||||
|
| |||||||
| 170,581 | ||||||||
|
| |||||||
Building Products — 0.6% |
| |||||||
| 535 | Allegion plc | 43,412 | ||||||
| 1,043 | Masco Corp. | 39,867 | ||||||
|
| |||||||
| 83,279 | ||||||||
|
| |||||||
Commercial Services & Supplies — 0.0% (g) | ||||||||
| 92 | Waste Connections, Inc., (Canada) | 5,905 | ||||||
|
| |||||||
Electrical Equipment — 0.5% |
| |||||||
| 876 | Eaton Corp. plc | 68,207 | ||||||
|
| |||||||
Industrial Conglomerates — 2.6% |
| |||||||
| 9,655 | General Electric Co. | 260,787 | ||||||
| 860 | Honeywell International, Inc. | 114,579 | ||||||
|
| |||||||
| 375,366 | ||||||||
|
| |||||||
Machinery — 3.1% |
| |||||||
| 516 | Deere & Co. | 63,778 | ||||||
| 1,914 | Ingersoll-Rand plc | 174,951 | ||||||
| 344 | PACCAR, Inc. | 22,704 | ||||||
| 1,240 | Stanley Black & Decker, Inc. | 174,478 | ||||||
|
| |||||||
| 435,911 | ||||||||
|
| |||||||
Road & Rail — 2.0% |
| |||||||
| 176 | Canadian Pacific Railway Ltd., (Canada) | 28,312 | ||||||
| 910 | Norfolk Southern Corp. | 110,722 | ||||||
| 1,384 | Union Pacific Corp. | 150,699 | ||||||
|
| |||||||
| 289,733 | ||||||||
|
| |||||||
SEE NOTES TO FINANCIAL STATEMENTS.
| 46 | J.P. MORGAN LARGE CAP FUNDS | JUNE 30, 2017 | ||||
Table of Contents
| SHARES | SECURITY DESCRIPTION | VALUE($) | ||||||
Common Stocks — continued | ||||||||
Trading Companies & Distributors — 0.1% |
| |||||||
| 264 | HD Supply Holdings, Inc. (a) | 8,097 | ||||||
|
| |||||||
Total Industrials | 1,783,815 | |||||||
|
| |||||||
Information Technology — 23.7% |
| |||||||
Electronic Equipment, Instruments & |
| |||||||
| 37 | TE Connectivity Ltd. | 2,873 | ||||||
|
| |||||||
Internet Software & Services — 5.8% |
| |||||||
| 356 | Alphabet, Inc., Class A (a) | 330,640 | ||||||
| 259 | Alphabet, Inc., Class C (a) | 235,361 | ||||||
| 1,705 | Facebook, Inc., Class A (a) | 257,460 | ||||||
|
| |||||||
| 823,461 | ||||||||
|
| |||||||
IT Services — 4.2% |
| |||||||
| 1,908 | Accenture plc, Class A | 235,949 | ||||||
| 258 | Fidelity National Information Services, Inc. | 21,991 | ||||||
| 199 | International Business Machines Corp. | 30,609 | ||||||
| 224 | Mastercard, Inc., Class A | 27,178 | ||||||
| 2,795 | Visa, Inc., Class A | 262,105 | ||||||
| 263 | WEX, Inc. (a) | 27,441 | ||||||
|
| |||||||
| 605,273 | ||||||||
|
| |||||||
Semiconductors & Semiconductor Equipment — 5.1% |
| |||||||
| 1,813 | Analog Devices, Inc. | 141,040 | ||||||
| 993 | Broadcom Ltd. | 231,349 | ||||||
| 1,109 | Microchip Technology, Inc. | 85,583 | ||||||
| 173 | NVIDIA Corp. | 25,065 | ||||||
| 3,246 | Texas Instruments, Inc. | 249,722 | ||||||
|
| |||||||
| 732,759 | ||||||||
|
| |||||||
Software — 4.3% |
| |||||||
| 885 | Adobe Systems, Inc. (a) | 125,136 | ||||||
| 6,857 | Microsoft Corp. | 472,641 | ||||||
| 187 | Workday, Inc., Class A (a) | 18,160 | ||||||
|
| |||||||
| 615,937 | ||||||||
|
| |||||||
Technology Hardware, Storage & Peripherals — 4.3% |
| |||||||
| 4,217 | Apple, Inc. | 607,338 | ||||||
| 113 | Hewlett Packard Enterprise Co. | 1,882 | ||||||
|
| |||||||
| 609,220 | ||||||||
|
| |||||||
Total Information Technology | 3,389,523 | |||||||
|
| |||||||
Materials — 2.2% |
| |||||||
Chemicals — 1.3% |
| |||||||
| 229 | Celanese Corp., Series A | 21,766 | ||||||
| 287 | Dow Chemical Co. (The) | 18,098 | ||||||
| 511 | Eastman Chemical Co. | 42,894 | ||||||
| 1,051 | EI du Pont de Nemours & Co. | 84,802 | ||||||
| 368 | Mosaic Co. (The) | 8,405 | ||||||
|
| |||||||
| 175,965 | ||||||||
|
| |||||||
| SHARES | SECURITY DESCRIPTION | VALUE($) | ||||||
Construction Materials — 0.4% |
| |||||||
| 19 | Martin Marietta Materials, Inc. | 4,168 | ||||||
| 450 | Vulcan Materials Co. | 56,985 | ||||||
|
| |||||||
| 61,153 | ||||||||
|
| |||||||
Containers & Packaging — 0.4% |
| |||||||
| 201 | Crown Holdings, Inc. (a) | 11,998 | ||||||
| 792 | WestRock Co. | 44,851 | ||||||
|
| |||||||
| 56,849 | ||||||||
|
| |||||||
Metals & Mining — 0.1% |
| |||||||
| 492 | Alcoa Corp. | 16,055 | ||||||
|
| |||||||
Total Materials | 310,022 | |||||||
|
| |||||||
Real Estate — 0.6% |
| |||||||
Equity Real Estate Investment Trusts (REITs) — 0.6% |
| |||||||
| 88 | AvalonBay Communities, Inc. | 16,969 | ||||||
| 753 | Prologis, Inc. | 44,159 | ||||||
| 45 | Public Storage | 9,400 | ||||||
| 184 | Vornado Realty Trust | 17,313 | ||||||
|
| |||||||
Total Real Estate | 87,841 | |||||||
|
| |||||||
Telecommunication Services — 1.0% |
| |||||||
Diversified Telecommunication Services — 0.9% |
| |||||||
| 2,024 | AT&T, Inc. | 76,359 | ||||||
| 1,235 | Verizon Communications, Inc. | 55,165 | ||||||
|
| |||||||
| 131,524 | ||||||||
|
| |||||||
Wireless Telecommunication Services — 0.1% |
| |||||||
| 324 | T-Mobile US, Inc. (a) | 19,659 | ||||||
|
| |||||||
Total Telecommunication Services | 151,183 | |||||||
|
| |||||||
Utilities — 2.4% |
| |||||||
Electric Utilities — 2.2% |
| |||||||
| 762 | Edison International | 59,586 | ||||||
| 871 | NextEra Energy, Inc. | 122,114 | ||||||
| 802 | PG&E Corp. | 53,243 | ||||||
| 1,614 | Xcel Energy, Inc. | 74,037 | ||||||
|
| |||||||
| 308,980 | ||||||||
|
| |||||||
Multi-Utilities — 0.2% |
| |||||||
| 420 | CMS Energy Corp. | 19,423 | ||||||
| 537 | NiSource, Inc. | 13,624 | ||||||
|
| |||||||
| 33,047 | ||||||||
|
| |||||||
Total Utilities | 342,027 | |||||||
|
| |||||||
Total Common Stocks | 14,132,127 | |||||||
|
| |||||||
SEE NOTES TO FINANCIAL STATEMENTS.
| JUNE 30, 2017 | J.P. MORGAN LARGE CAP FUNDS | 47 | ||||||
Table of Contents
JPMorgan U.S. Equity Fund
SCHEDULE OF PORTFOLIO INVESTMENTS
AS OF JUNE 30, 2017 (continued)
(Amounts in thousand, except number of Futures contracts) )
| NUMBER OF WARRANTS | SECURITY DESCRIPTION | VALUE($) | ||||||
Warrant — 0.0% (g) | ||||||||
Financials — 0.0% (g) |
| |||||||
Consumer Finance — 0.0% (g) |
| |||||||
| 24 | Emergent Capital, Inc., expiring | — | (h) | |||||
|
| |||||||
| SHARES | SECURITY DESCRIPTION | VALUE($) | ||||||
Short-Term Investment — 1.0% | ||||||||
Investment Company — 1.0% |
| |||||||
| 137,056 | JPMorgan U.S. Government Money Market Fund, Institutional Class Shares, 0.840% (b) (l) | 137,056 | ||||||
|
| |||||||
Total Investments — 99.8% | 14,269,183 | |||||||
Other Assets in Excess of | 27,810 | |||||||
|
| |||||||
NET ASSETS — 100.0% | $ | 14,296,993 | ||||||
|
| |||||||
Percentages indicated are based on net assets.
| Futures Contracts | ||||||||||||||||||||
| NUMBER OF CONTRACTS | DESCRIPTION | EXPIRATION DATE | TRADING CURRENCY | NOTIONAL VALUE AT JUNE 30, 2017 | NET UNREALIZED APPRECIATION (DEPRECIATION) | |||||||||||||||
Long Futures Outstanding | ||||||||||||||||||||
| 678 | E-mini S&P 500 Index | 09/15/17 | USD | $ | 82,069 | $ | (253 | ) | ||||||||||||
|
| |||||||||||||||||||
SEE NOTES TO FINANCIAL STATEMENTS.
| 48 | J.P. MORGAN LARGE CAP FUNDS | JUNE 30, 2017 | ||||
Table of Contents
J.P. Morgan Large Cap Funds
NOTES TO SCHEDULES OF PORTFOLIO INVESTMENTS
AS OF JUNE 30, 2017
| ADR | — American Depositary Receipt | |
| USD | — United States Dollar | |
| (a) | — Non-income producing security. | |
| (b) | — Investment in affiliate. Money market fund is registered under the Investment Company Act of 1940, as amended, and advised by J.P. Morgan Investment Management Inc. | |
| (g) | — Amount rounds to less than 0.05%. | |
| (h) | — Amount rounds to less than 500. | |
| (k) | — All or a portion of this security is deposited with the broker as initial margin for future contracts. | |
| (l) | — The rate shown is the current yield as of June 30, 2017. | |
| (n) | — The rate shown is the effective yield as of June 30, 2017. | |
| (o) | — All or a portion of the security is segregated for options written. |
SEE NOTES TO FINANCIAL STATEMENTS.
| JUNE 30, 2017 | J.P. MORGAN LARGE CAP FUNDS | 49 | ||||||
Table of Contents
STATEMENTS OF ASSETS AND LIABILITIES
AS OF JUNE 30, 2017
(Amounts in thousands, except per share amounts)
| Disciplined Equity Fund | Dynamic Growth Fund | Equity Focus Fund | ||||||||||
ASSETS: | ||||||||||||
Investments in non-affiliates, at value | $ | 7,309,934 | $ | 311,149 | $ | 180,368 | ||||||
Investments in affiliates, at value | 115,340 | 10,657 | 5,788 | |||||||||
|
|
|
|
|
| |||||||
Total investment securities, at value | 7,425,274 | 321,806 | 186,156 | |||||||||
Cash | — | 3 | — | |||||||||
Receivables: | ||||||||||||
Investment securities sold | 26,834 | — | 1,324 | |||||||||
Fund shares sold | 5,692 | 108 | 263 | |||||||||
Dividends from non-affiliates | 6,849 | — | 51 | |||||||||
Dividends from affiliates | 71 | 3 | 6 | |||||||||
Variation margin on futures contracts | 36 | — | — | |||||||||
|
|
|
|
|
| |||||||
Total Assets | 7,464,756 | 321,920 | 187,800 | |||||||||
|
|
|
|
|
| |||||||
LIABILITIES: | ||||||||||||
Payables: | ||||||||||||
Due to custodian | — | (a) | — | — | ||||||||
Investment securities purchased | 25,993 | — | 745 | |||||||||
Fund shares redeemed | 30,096 | 183 | 77 | |||||||||
Accrued liabilities: | ||||||||||||
Investment advisory fees | 1,167 | 145 | 75 | |||||||||
Administration fees | 268 | 11 | 1 | |||||||||
Distribution fees | 88 | 20 | 3 | |||||||||
Service fees | 125 | 34 | 33 | |||||||||
Custodian and accounting fees | 21 | 2 | 3 | |||||||||
Trustees’ and Chief Compliance Officer’s fees | 35 | — | — | |||||||||
Other | 430 | 48 | 19 | |||||||||
|
|
|
|
|
| |||||||
Total Liabilities | 58,223 | 443 | 956 | |||||||||
|
|
|
|
|
| |||||||
Net Assets | $ | 7,406,533 | $ | 321,477 | $ | 186,844 | ||||||
|
|
|
|
|
| |||||||
| (a) | Amount rounds to less than 500. |
SEE NOTES TO FINANCIAL STATEMENTS.
| 50 | J.P. MORGAN LARGE CAP FUNDS | JUNE 30, 2017 | ||||
Table of Contents
| Disciplined Equity Fund | Dynamic Growth Fund | Equity Focus Fund | ||||||||||
NET ASSETS: | ||||||||||||
Paid-in-Capital | $ | 6,073,539 | $ | 180,250 | $ | 147,877 | ||||||
Accumulated undistributed (distributions in excess of) net investment income | (62 | ) | 143 | 135 | ||||||||
Accumulated net realized gains (losses) | (310,109 | ) | 24,106 | 8,573 | ||||||||
Net unrealized appreciation (depreciation) | 1,643,165 | 116,978 | 30,259 | |||||||||
|
|
|
|
|
| |||||||
Total Net Assets | $ | 7,406,533 | $ | 321,477 | $ | 186,844 | ||||||
|
|
|
|
|
| |||||||
Net Assets: | ||||||||||||
Class A | $ | 422,719 | $ | 57,378 | $ | 3,362 | ||||||
Class C | — | 13,532 | 3,331 | |||||||||
Class I (formerly Select Class) | 285,141 | 60,616 | 180,151 | |||||||||
Class L (formerly Institutional Class) | 835,535 | — | — | |||||||||
Class R5 | — | 189,951 | — | |||||||||
Class R6 | 5,863,138 | — | — | |||||||||
|
|
|
|
|
| |||||||
Total | $ | 7,406,533 | $ | 321,477 | $ | 186,844 | ||||||
|
|
|
|
|
| |||||||
Outstanding units of beneficial interest (shares) | ||||||||||||
($0.0001 par value; unlimited number of shares authorized): | ||||||||||||
Class A | 16,641 | 1,846 | 116 | |||||||||
Class C | — | 457 | 118 | |||||||||
Class I (formerly Select Class) | 11,130 | 1,903 | 6,140 | |||||||||
Class L (formerly Institutional Class) | 32,663 | — | — | |||||||||
Class R5 | — | 5,848 | — | |||||||||
Class R6 | 229,149 | — | — | |||||||||
Net Asset Value (a): | ||||||||||||
Class A — Redemption price per share | $ | 25.40 | $ | 31.08 | $ | 29.09 | ||||||
Class C — Offering price per share (b) | — | 29.59 | 28.28 | |||||||||
Class I (formerly Select Class) — Offering and redemption price per share | 25.62 | 31.86 | 29.34 | |||||||||
Class L (formerly Institutional Class) — Offering and redemption price per share | 25.58 | — | — | |||||||||
Class R5 — Offering and redemption price per share | — | 32.48 | — | |||||||||
Class R6 — Offering and redemption price per share | 25.59 | — | — | |||||||||
Class A maximum sales charge | 5.25 | % | 5.25 | % | 5.25 | % | ||||||
Class A maximum public offering price per share | $ | 26.81 | $ | 32.80 | $ | 30.70 | ||||||
|
|
|
|
|
| |||||||
Cost of investments in non-affiliates | $ | 5,666,533 | $ | 194,171 | $ | 150,109 | ||||||
Cost of investments in affiliates | 115,340 | 10,657 | 5,788 | |||||||||
| (a) | Per share amounts may not recalculate due to rounding of net assets and/or shares outstanding. |
| (b) | Redemption price for Class C Shares varies based upon length of time the shares are held. |
SEE NOTES TO FINANCIAL STATEMENTS.
| JUNE 30, 2017 | J.P. MORGAN LARGE CAP FUNDS | 51 | ||||||
Table of Contents
STATEMENTS OF ASSETS AND LIABILITIES
AS OF JUNE 30, 2017 (continued)
(Amounts in thousands, except per share amounts)
| Equity Income Fund | Growth and Income Fund | Hedged Equity Fund | ||||||||||
ASSETS: | ||||||||||||
Investments in non-affiliates, at value | $ | 14,823,833 | $ | 530,454 | $ | 766,222 | ||||||
Investments in affiliates, at value | 112,949 | 9,521 | 28,836 | |||||||||
|
|
|
|
|
| |||||||
Total investment securities, at value | 14,936,782 | 539,975 | 795,058 | |||||||||
Cash | — | — | (a) | 78 | ||||||||
Deposits at broker for futures contracts | — | — | 670 | |||||||||
Receivables: | ||||||||||||
Investment securities sold | — | — | 7,587 | |||||||||
Fund shares sold | 79,814 | 230 | 4,211 | |||||||||
Dividends from non-affiliates | 26,564 | 612 | 662 | |||||||||
Dividends from affiliates | 173 | 3 | 11 | |||||||||
Variation margin on futures contracts | — | — | 29 | |||||||||
|
|
|
|
|
| |||||||
Total Assets | 15,043,333 | 540,820 | 808,306 | |||||||||
|
|
|
|
|
| |||||||
LIABILITIES: | ||||||||||||
Payables: | ||||||||||||
Due to custodian | 2 | — | — | |||||||||
Investment securities purchased | 661 | — | 37,521 | |||||||||
Fund shares redeemed | 78,314 | 524 | 1,018 | |||||||||
Outstanding options written, at fair value | — | — | 6,060 | |||||||||
Accrued liabilities: | ||||||||||||
Investment advisory fees | 4,857 | 178 | 145 | |||||||||
Administration fees | 998 | 36 | 48 | |||||||||
Distribution fees | 1,566 | 110 | 43 | |||||||||
Service fees | 2,930 | 109 | 126 | |||||||||
Custodian and accounting fees | 31 | 3 | 5 | |||||||||
Trustees’ and Chief Compliance Officer’s fees | — | (a) | — | (a) | 1 | |||||||
Other | 1,062 | 155 | 43 | |||||||||
|
|
|
|
|
| |||||||
Total Liabilities | 90,421 | 1,115 | 45,010 | |||||||||
|
|
|
|
|
| |||||||
Net Assets | $ | 14,952,912 | $ | 539,705 | $ | 763,296 | ||||||
|
|
|
|
|
| |||||||
| (a) | Amount rounds to less than 500. |
SEE NOTES TO FINANCIAL STATEMENTS.
| 52 | J.P. MORGAN LARGE CAP FUNDS | JUNE 30, 2017 | ||||
Table of Contents
| Equity Income Fund | Growth and Income Fund | Hedged Equity Fund | ||||||||||
NET ASSETS: | ||||||||||||
Paid-in-Capital | $ | 11,438,540 | $ | 351,700 | $ | 716,692 | ||||||
Accumulated undistributed (distributions in excess of) net investment income | (82 | ) | 107 | 32 | ||||||||
Accumulated net realized gains (losses) | 40,805 | 7,979 | (29,022 | ) | ||||||||
Net unrealized appreciation (depreciation) | 3,473,649 | 179,919 | 75,594 | |||||||||
|
|
|
|
|
| |||||||
Total Net Assets | $ | 14,952,912 | $ | 539,705 | $ | 763,296 | ||||||
|
|
|
|
|
| |||||||
Net Assets: | ||||||||||||
Class A | $ | 3,176,361 | $ | 445,078 | $ | 133,789 | ||||||
Class C | 1,385,115 | 28,290 | 29,168 | |||||||||
Class I (formerly Select Class) | 6,542,906 | 64,148 | 597,013 | |||||||||
Class R2 | 87,437 | 23 | — | |||||||||
Class R3 | 25,209 | — | — | |||||||||
Class R4 | 1,340 | — | — | |||||||||
Class R5 | 912,746 | 37 | 37 | |||||||||
Class R6 | 2,821,798 | 2,129 | 3,289 | |||||||||
|
|
|
|
|
| |||||||
Total | $ | 14,952,912 | $ | 539,705 | $ | 763,296 | ||||||
|
|
|
|
|
| |||||||
Outstanding units of beneficial interest (shares) | ||||||||||||
($0.0001 par value; unlimited number of shares authorized): | ||||||||||||
Class A | 202,679 | 9,499 | 7,336 | |||||||||
Class C | 89,885 | 665 | 1,606 | |||||||||
Class I (formerly Select Class) | 410,871 | 1,304 | 32,671 | |||||||||
Class R2 | 5,599 | 1 | — | |||||||||
Class R3 | 1,610 | — | — | |||||||||
Class R4 | 84 | — | — | |||||||||
Class R5 | 57,283 | 1 | 2 | |||||||||
Class R6 | 177,199 | 43 | 180 | |||||||||
Net Asset Value (a): | ||||||||||||
Class A — Redemption price per share | $ | 15.67 | $ | 46.85 | $ | 18.24 | ||||||
Class C — Offering price per share (b) | 15.41 | 42.54 | 18.16 | |||||||||
Class I (formerly Select Class) — Offering and redemption price per share | 15.92 | 49.21 | 18.27 | |||||||||
Class R2 — Offering and redemption price per share | 15.62 | 47.06 | — | |||||||||
Class R3 — Offering and redemption price per share | 15.66 | — | — | |||||||||
Class R4 — Offering and redemption price per share | 15.92 | — | — | |||||||||
Class R5 — Offering and redemption price per share | 15.93 | 49.50 | 18.30 | |||||||||
Class R6 — Offering and redemption price per share | 15.92 | 49.50 | 18.29 | |||||||||
Class A maximum sales charge | 5.25 | % | 5.25 | % | 5.25 | % | ||||||
Class A maximum public offering price per share | $ | 16.54 | $ | 49.45 | $ | 19.25 | ||||||
|
|
|
|
|
| |||||||
Cost of investments in non-affiliates | $ | 11,350,184 | $ | 350,535 | $ | 690,567 | ||||||
Cost of investments in affiliates | 112,949 | 9,521 | 28,836 | |||||||||
Premiums received from options written | — | — | 6,010 | |||||||||
| (a) | Per share amounts may not recalculate due to rounding of net assets and/or shares outstanding. |
| (b) | Redemption price for Class C Shares varies based upon length of time the shares are held. |
SEE NOTES TO FINANCIAL STATEMENTS.
| JUNE 30, 2017 | J.P. MORGAN LARGE CAP FUNDS | 53 | ||||||
Table of Contents
STATEMENTS OF ASSETS AND LIABILITIES
AS OF JUNE 30, 2017 (continued)
(Amounts in thousands, except per share amounts)
| Large Cap Growth Fund | Large Cap Value Fund | U.S. Equity Fund | ||||||||||
ASSETS: | ||||||||||||
Investments in non-affiliates, at value | $ | 11,997,505 | $ | 1,037,078 | $ | 14,132,127 | ||||||
Investments in affiliates, at value | 328,600 | 8,631 | 137,056 | |||||||||
|
|
|
|
|
| |||||||
Total investment securities, at value | 12,326,105 | 1,045,709 | 14,269,183 | |||||||||
Cash | — | 13 | — | (a) | ||||||||
Deposits at broker for futures contracts | — | — | 3,200 | |||||||||
Receivables: | ||||||||||||
Investment securities sold | — | 23,622 | 267,722 | |||||||||
Fund shares sold | 10,162 | 2,257 | 19,535 | |||||||||
Dividends from non-affiliates | 2,185 | 932 | 11,127 | |||||||||
Dividends from affiliates | 75 | 5 | 89 | |||||||||
Variation margin on futures contracts | — | — | 8 | |||||||||
|
|
|
|
|
| |||||||
Total Assets | 12,338,527 | 1,072,538 | 14,570,864 | |||||||||
|
|
|
|
|
| |||||||
LIABILITIES: | ||||||||||||
Payables: | ||||||||||||
Due to custodian | 55 | — | — | |||||||||
Investment securities purchased | — | 17,624 | 238,656 | |||||||||
Fund shares redeemed | 50,989 | 2,054 | 26,886 | |||||||||
Accrued liabilities: | ||||||||||||
Investment advisory fees | 5,154 | 323 | 4,670 | |||||||||
Administration fees | 837 | 58 | 953 | |||||||||
Distribution fees | 899 | 76 | 598 | |||||||||
Service fees | 1,922 | 52 | 911 | |||||||||
Custodian and accounting fees | 29 | 4 | 33 | |||||||||
Trustees’ and Chief Compliance Officer’s fees | — | — | 64 | |||||||||
Other | 1,938 | 83 | 1,100 | |||||||||
|
|
|
|
|
| |||||||
Total Liabilities | 61,823 | 20,274 | 273,871 | |||||||||
|
|
|
|
|
| |||||||
Net Assets | $ | 12,276,704 | $ | 1,052,264 | $ | 14,296,993 | ||||||
|
|
|
|
|
| |||||||
| (a) | Amount rounds to less than 500. |
SEE NOTES TO FINANCIAL STATEMENTS.
| 54 | J.P. MORGAN LARGE CAP FUNDS | JUNE 30, 2017 | ||||
Table of Contents
| Large Cap Growth Fund | Large Cap Value Fund | U.S. Equity Fund | ||||||||||
NET ASSETS: | ||||||||||||
Paid-in-Capital | $ | 5,931,041 | $ | 840,344 | $ | 9,899,640 | ||||||
Accumulated undistributed (distributions in excess of) net investment income | (164 | ) | 374 | 6,113 | ||||||||
Accumulated net realized gains (losses) | 1,231,178 | 79,146 | 518,183 | |||||||||
Net unrealized appreciation (depreciation) | 5,114,649 | 132,400 | 3,873,057 | |||||||||
|
|
|
|
|
| |||||||
Total Net Assets | $ | 12,276,704 | $ | 1,052,264 | $ | 14,296,993 | ||||||
|
|
|
|
|
| |||||||
Net Assets: | ||||||||||||
Class A | $ | 2,462,957 | $ | 215,017 | $ | 1,371,821 | ||||||
Class C | 487,702 | 48,028 | 318,369 | |||||||||
Class I (formerly Select Class) | 4,771,428 | 161,494 | 1,287,300 | |||||||||
Class L (formerly Institutional Class) | — | — | 3,391,256 | |||||||||
Class R2 | 147,902 | 6,775 | 260,589 | |||||||||
Class R3 | 992 | — | 25,050 | |||||||||
Class R4 | 440 | — | 1,030 | |||||||||
Class R5 | 799,190 | 10,218 | 890,105 | |||||||||
Class R6 | 3,606,093 | 610,732 | 6,751,473 | |||||||||
|
|
|
|
|
| |||||||
Total | $ | 12,276,704 | $ | 1,052,264 | $ | 14,296,993 | ||||||
|
|
|
|
|
| |||||||
Outstanding units of beneficial interest (shares) | ||||||||||||
($0.0001 par value; unlimited number of shares authorized): | ||||||||||||
Class A | 64,432 | 13,889 | 86,836 | |||||||||
Class C | 15,263 | 3,216 | 20,709 | |||||||||
Class I (formerly Select Class) | 124,030 | 10,595 | 81,318 | |||||||||
Class L (formerly Institutional Class) | — | — | 214,025 | |||||||||
Class R2 | 3,962 | 440 | 16,621 | |||||||||
Class R3 | 26 | — | 1,590 | |||||||||
Class R4 | 11 | — | 65 | |||||||||
Class R5 | 20,474 | 665 | 56,151 | |||||||||
Class R6 | 91,931 | 39,957 | 425,307 | |||||||||
Net Asset Value (a): | ||||||||||||
Class A — Redemption price per share | $ | 38.23 | $ | 15.48 | $ | 15.80 | ||||||
Class C — Offering price per share (b) | 31.95 | 14.93 | 15.37 | |||||||||
Class I (formerly Select Class) — Offering and redemption price per share | 38.47 | 15.24 | 15.83 | |||||||||
Class L (formerly Institutional Class) — Offering and redemption price per share | — | — | 15.85 | |||||||||
Class R2 — Offering and redemption price per share | 37.33 | 15.39 | 15.68 | |||||||||
Class R3 — Offering and redemption price per share | 38.39 | — | 15.76 | |||||||||
Class R4 — Offering and redemption price per share | 38.47 | — | 15.82 | |||||||||
Class R5 — Offering and redemption price per share | 39.04 | 15.37 | 15.85 | |||||||||
Class R6 — Offering and redemption price per share | 39.23 | 15.28 | 15.87 | |||||||||
Class A maximum sales charge | 5.25 | % | 5.25 | % | 5.25 | % | ||||||
Class A maximum public offering price per share | $ | 40.35 | $ | 16.34 | $ | 16.68 | ||||||
|
|
|
|
|
| |||||||
Cost of investments in non-affiliates | $ | 6,882,856 | $ | 904,678 | $ | 10,258,817 | ||||||
Cost of investments in affiliates | 328,600 | 8,631 | 137,056 | |||||||||
| (a) | Per share amounts may not recalculate due to rounding of net assets and/or shares outstanding. |
| (b) | Redemption price for Class C Shares varies based upon length of time the shares are held. |
SEE NOTES TO FINANCIAL STATEMENTS.
| JUNE 30, 2017 | J.P. MORGAN LARGE CAP FUNDS | 55 | ||||||
Table of Contents
STATEMENTS OF OPERATIONS
FOR THE YEAR ENDED JUNE 30, 2017
(Amounts in thousands)
| Disciplined Equity Fund | Dynamic Growth Fund | Equity Focus Fund | ||||||||||
INVESTMENT INCOME: | ||||||||||||
Interest income from non-affiliates | $ | 44 | $ | — | $ | — | ||||||
Interest income from affiliates | 1 | 1 | 1 | |||||||||
Dividend income from non-affiliates | 141,734 | 3,278 | 1,703 | |||||||||
Dividend income from affiliates | 445 | 27 | 27 | |||||||||
|
|
|
|
|
| |||||||
Total investment income | 142,224 | 3,306 | 1,731 | |||||||||
|
|
|
|
|
| |||||||
EXPENSES: | ||||||||||||
Investment advisory fees | 18,932 | 2,051 | 923 | |||||||||
Administration fees | 6,194 | 280 | 123 | |||||||||
Distribution fees: | ||||||||||||
Class A | 1,150 | 132 | 6 | |||||||||
Class C | — | 95 | 16 | |||||||||
Service fees: | ||||||||||||
Class A | 1,150 | 132 | 6 | |||||||||
Class C | — | 32 | 6 | |||||||||
Class I (formerly Select Class) | 652 | 133 | 363 | |||||||||
Class L (formerly Institutional Class) | 821 | — | — | |||||||||
Class R5 | — | 137 | — | |||||||||
Custodian and accounting fees | 224 | 31 | 24 | |||||||||
Interest expense to affiliates | — | — | (a) | — | (a) | |||||||
Professional fees | 132 | 54 | 45 | |||||||||
Trustees’ and Chief Compliance Officer’s fees | 60 | 26 | 26 | |||||||||
Printing and mailing costs | 251 | 35 | 14 | |||||||||
Registration and filing fees | 69 | 64 | 62 | |||||||||
Transfer agency fees (See Note 2.E.) | 107 | 9 | 4 | |||||||||
Sub-transfer agency fees (See Note 2.E.) | 1,095 | 103 | 48 | |||||||||
Other | 135 | 11 | 9 | |||||||||
|
|
|
|
|
| |||||||
Total expenses | 30,972 | 3,325 | 1,675 | |||||||||
|
|
|
|
|
| |||||||
Less fees waived | (6,302 | ) | (429 | ) | (265 | ) | ||||||
Less expense reimbursements | (184 | ) | — | — | ||||||||
|
|
|
|
|
| |||||||
Net expenses | 24,486 | 2,896 | 1,410 | |||||||||
|
|
|
|
|
| |||||||
Net investment income (loss) | 117,738 | 410 | 321 | |||||||||
|
|
|
|
|
| |||||||
REALIZED/UNREALIZED GAINS (LOSSES): | ||||||||||||
Net realized gain (loss) on transactions from: | ||||||||||||
Investments in non-affiliates | 316,135 | 45,001 | 11,379 | |||||||||
Futures | 19,812 | — | — | |||||||||
|
|
|
|
|
| |||||||
Net realized gain (loss) | 335,947 | 45,001 | 11,379 | |||||||||
|
|
|
|
|
| |||||||
Change in net unrealized appreciation/depreciation on: | ||||||||||||
Investments in non-affiliates | 876,474 | 47,260 | 20,067 | |||||||||
Futures | (1,688 | ) | — | — | ||||||||
|
|
|
|
|
| |||||||
Change in net unrealized appreciation/depreciation | 874,786 | 47,260 | 20,067 | |||||||||
|
|
|
|
|
| |||||||
Net realized/unrealized gains (losses) | 1,210,733 | 92,261 | 31,446 | |||||||||
|
|
|
|
|
| |||||||
Change in net assets resulting from operations | $ | 1,328,471 | $ | 92,671 | $ | 31,767 | ||||||
|
|
|
|
|
| |||||||
| (a) | Amount rounds to less than 500. |
SEE NOTES TO FINANCIAL STATEMENTS.
| 56 | J.P. MORGAN LARGE CAP FUNDS | JUNE 30, 2017 | ||||
Table of Contents
| Equity Income Fund | Growth and Income Fund | Hedged Equity Fund | ||||||||||
INVESTMENT INCOME: | ||||||||||||
Interest income from non-affiliates | $ | — | $ | — | $ | 2 | ||||||
Interest income from affiliates | 31 | — | 5 | |||||||||
Dividend income from non-affiliates | 358,010 | 11,882 | 7,488 | |||||||||
Dividend income from affiliates | 1,489 | 41 | 55 | |||||||||
Foreign taxes withheld | 82 | 2 | — | |||||||||
|
|
|
|
|
| |||||||
Total investment income | 359,612 | 11,925 | 7,550 | |||||||||
|
|
|
|
|
| |||||||
EXPENSES: | ||||||||||||
Investment advisory fees | 54,673 | 2,080 | 993 | |||||||||
Administration fees | 11,178 | 425 | 325 | |||||||||
Distribution fees: | ||||||||||||
Class A | 8,543 | 1,104 | 219 | |||||||||
Class C | 10,345 | 207 | 111 | |||||||||
Class R2 | 420 | — | (a) | — | ||||||||
Class R3 (b) | 10 | — | — | |||||||||
Service fees: | ||||||||||||
Class A | 8,543 | 1,104 | 219 | |||||||||
Class C | 3,448 | 69 | 37 | |||||||||
Class I (formerly Select Class) | 13,798 | 124 | 736 | |||||||||
Class R2 | 210 | — | (a) | — | ||||||||
Class R3 (b) | 10 | — | — | |||||||||
Class R4 (b) | — | (a) | — | — | ||||||||
Class R5 | 568 | — | (a) | — | (a) | |||||||
Custodian and accounting fees | 387 | 37 | 66 | |||||||||
Interest expense to affiliates | — | — | — | (a) | ||||||||
Professional fees | 190 | 48 | 75 | |||||||||
Trustees’ and Chief Compliance Officer’s fees | 48 | 26 | 27 | |||||||||
Printing and mailing costs | 1,259 | 53 | 31 | |||||||||
Registration and filing fees | 379 | 83 | 122 | |||||||||
Transfer agency fees (See Note 2.E.) | 534 | 198 | 13 | |||||||||
Sub-transfer agency fees (See Note 2.E.) | 5,834 | 141 | 193 | |||||||||
Other | 237 | 15 | 12 | |||||||||
|
|
|
|
|
| |||||||
Total expenses | 120,614 | 5,714 | 3,179 | |||||||||
|
|
|
|
|
| |||||||
Less fees waived | (2,457 | ) | (320 | ) | (489 | ) | ||||||
Less expense reimbursements | (99 | ) | — | (a) | — | (a) | ||||||
|
|
|
|
|
| |||||||
Net expenses | 118,058 | 5,394 | 2,690 | |||||||||
|
|
|
|
|
| |||||||
Net investment income (loss) | 241,554 | 6,531 | 4,860 | |||||||||
|
|
|
|
|
| |||||||
REALIZED/UNREALIZED GAINS (LOSSES): | ||||||||||||
Net realized gain (loss) on transactions from: | ||||||||||||
Investments in non-affiliates | 138,214 | 21,022 | (15,652 | ) | ||||||||
Futures | — | — | 983 | |||||||||
Options written | — | — | 4,680 | |||||||||
|
|
|
|
|
| |||||||
Net realized gain (loss) | 138,214 | 21,022 | (9,989 | ) | ||||||||
|
|
|
|
|
| |||||||
Change in net unrealized appreciation/depreciation on: | ||||||||||||
Investments in non-affiliates | 1,463,818 | 49,974 | 53,258 | |||||||||
Futures | — | — | (33 | ) | ||||||||
Options Written | — | — | (14 | ) | ||||||||
|
|
|
|
|
| |||||||
Change in net unrealized appreciation/depreciation | 1,463,818 | 49,974 | 53,211 | |||||||||
|
|
|
|
|
| |||||||
Net realized/unrealized gains (losses) | 1,602,032 | 70,996 | 43,222 | |||||||||
|
|
|
|
|
| |||||||
Change in net assets resulting from operations | $ | 1,843,586 | $ | 77,527 | $ | 48,082 | ||||||
|
|
|
|
|
| |||||||
| (a) | Amount rounds to less than 500. |
| (b) | Commencement of offering of class of shares effective September 9, 2016 for Equity Income Fund. |
SEE NOTES TO FINANCIAL STATEMENTS.
| JUNE 30, 2017 | J.P. MORGAN LARGE CAP FUNDS | 57 | ||||||
Table of Contents
STATEMENTS OF OPERATIONS
FOR THE YEAR ENDED JUNE 30, 2017 (continued)
(Amounts in thousands)
Large Cap | Large Cap Value Fund | U.S. Equity Fund | ||||||||||
INVESTMENT INCOME: | ||||||||||||
Interest income from affiliates | $ | 11 | $ | 4 | $ | 10 | ||||||
Dividend income from non-affiliates | 108,210 | 16,738 | 218,803 | |||||||||
Dividend income from affiliates | 484 | 71 | 699 | |||||||||
|
|
|
|
|
| |||||||
Total investment income | 108,705 | 16,813 | 219,512 | |||||||||
|
|
|
|
|
| |||||||
EXPENSES: | ||||||||||||
Investment advisory fees | 63,701 | 3,471 | 52,042 | |||||||||
Administration fees | 10,421 | 710 | 10,641 | |||||||||
Distribution fees: | ||||||||||||
Class A | 8,652 | 378 | 3,593 | |||||||||
Class C | 3,877 | 216 | 2,373 | |||||||||
Class R2 | 887 | 23 | 1,117 | |||||||||
Class R3 (a) | — | (b) | — | 7 | ||||||||
Service fees: | ||||||||||||
Class A | 8,652 | 378 | 3,593 | |||||||||
Class C | 1,292 | 72 | 791 | |||||||||
Class I (formerly Select Class) | 10,298 | 176 | 2,858 | |||||||||
Class L (formerly Institutional Class) | — | — | 3,365 | |||||||||
Class R2 | 443 | 12 | 559 | |||||||||
Class R3 (a) | 1 | — | 7 | |||||||||
Class R4 (a) | — | (b) | — | — | (b) | |||||||
Class R5 | 615 | 4 | 550 | |||||||||
Custodian and accounting fees | 315 | 49 | 415 | |||||||||
Interest expense to affiliates | 1 | — | (b) | — | ||||||||
Professional fees | 322 | 55 | 329 | |||||||||
Trustees’ and Chief Compliance Officer’s fees | 43 | 27 | 97 | |||||||||
Printing and mailing costs | 1,134 | 53 | 1,025 | |||||||||
Registration and filing fees | 365 | 119 | 155 | |||||||||
Transfer agency fees (See Note 2.E.) | 597 | 59 | 359 | |||||||||
Sub-transfer agency fees (See Note 2.E.) | 8,039 | 87 | 5,080 | |||||||||
Other | 259 | 12 | 237 | |||||||||
|
|
|
|
|
| |||||||
Total expenses | 119,914 | 5,901 | 89,193 | |||||||||
|
|
|
|
|
| |||||||
Less fees waived | (8,539 | ) | (329 | ) | (6,236 | ) | ||||||
Less expense reimbursements | (38 | ) | (1 | ) | (88 | ) | ||||||
|
|
|
|
|
| |||||||
Net expenses | 111,337 | 5,571 | 82,869 | |||||||||
|
|
|
|
|
| |||||||
Net investment income (loss) | (2,632 | ) | 11,242 | 136,643 | ||||||||
|
|
|
|
|
| |||||||
REALIZED/UNREALIZED GAINS (LOSSES): | ||||||||||||
Net realized gain (loss) on transactions from: | ||||||||||||
Investments in non-affiliates | 2,090,043 | 104,157 | 1,261,249 | |||||||||
Futures | — | — | 12,803 | |||||||||
|
|
|
|
|
| |||||||
Net realized gain (loss) | 2,090,043 | 104,157 | 1,274,052 | |||||||||
|
|
|
|
|
| |||||||
Change in net unrealized appreciation/depreciation on: | ||||||||||||
Investments in non-affiliates | 995,654 | 88,765 | 951,199 | |||||||||
Futures | — | — | (1,361 | ) | ||||||||
|
|
|
|
|
| |||||||
Change in net unrealized appreciation/depreciation | 995,654 | 88,765 | 949,838 | |||||||||
|
|
|
|
|
| |||||||
Net realized/unrealized gains (losses) | 3,085,697 | 192,922 | 2,223,890 | |||||||||
|
|
|
|
|
| |||||||
Change in net assets resulting from operations | $ | 3,083,065 | $ | 204,164 | $ | 2,360,533 | ||||||
|
|
|
|
|
| |||||||
| (a) | Commencement of offering of class of shares effective September 9, 2016 for Large Cap Growth Fund and U.S. Equity Fund. |
| (b) | Amount rounds to less than 500. |
SEE NOTES TO FINANCIAL STATEMENTS.
| 58 | J.P. MORGAN LARGE CAP FUNDS | JUNE 30, 2017 | ||||
Table of Contents
STATEMENTS OF CHANGES IN NET ASSETS
FOR THE PERIODS INDICATED
(Amounts in thousands)
| Disciplined Equity Fund | Dynamic Growth Fund | |||||||||||||||
| Year Ended June 30, 2017 | Year Ended June 30, 2016 | Year Ended June 30, 2017 | Year Ended June 30, 2016 | |||||||||||||
CHANGE IN NET ASSETS RESULTING FROM OPERATIONS: | ||||||||||||||||
Net investment income (loss) | $ | 117,738 | $ | 131,676 | $ | 410 | $ | (821 | ) | |||||||
Net realized gain (loss) | 335,947 | (592,021 | ) | 45,001 | (9,188 | ) | ||||||||||
Change in net unrealized appreciation/depreciation | 874,786 | 151,690 | 47,260 | (1,272 | ) | |||||||||||
|
|
|
|
|
|
|
| |||||||||
Change in net assets resulting from operations | 1,328,471 | (308,655 | ) | 92,671 | (11,281 | ) | ||||||||||
|
|
|
|
|
|
|
| |||||||||
DISTRIBUTIONS TO SHAREHOLDERS: | ||||||||||||||||
Class A | ||||||||||||||||
From net investment income | (6,106 | ) | (5,440 | ) | — | — | ||||||||||
From net realized gains | — | (25,328 | ) | (609 | ) | (551 | ) | |||||||||
Return of Capital | (379 | ) | — | — | — | |||||||||||
Class C | ||||||||||||||||
From net realized gains | — | — | (157 | ) | (123 | ) | ||||||||||
Class I (formerly Select Class) | ||||||||||||||||
From net investment income | (4,149 | ) | (3,481 | ) | — | — | ||||||||||
From net realized gains | — | (12,537 | ) | (644 | ) | (615 | ) | |||||||||
Return of Capital | (215 | ) | — | — | — | |||||||||||
Class L (formerly Institutional Class) | ||||||||||||||||
From net investment income | (13,394 | ) | (11,148 | ) | — | — | ||||||||||
From net realized gains | — | (34,112 | ) | — | — | |||||||||||
Return of Capital | (677 | ) | — | — | — | |||||||||||
Class R5 | ||||||||||||||||
From net realized gains | — | — | (2,695 | ) | (2,408 | ) | ||||||||||
Class R6 | ||||||||||||||||
From net investment income | (105,888 | ) | (97,120 | ) | — | — | ||||||||||
From net realized gains | — | (271,746 | ) | — | — | |||||||||||
Return of Capital | (4,975 | ) | — | — | — | |||||||||||
|
|
|
|
|
|
|
| |||||||||
Total distributions to shareholders | (135,783 | ) | (460,912 | ) | (4,105 | ) | (3,697 | ) | ||||||||
|
|
|
|
|
|
|
| |||||||||
CAPITAL TRANSACTIONS: | ||||||||||||||||
Change in net assets resulting from capital transactions | (2,007,733 | ) | 1,244,730 | (96,496 | ) | 7,189 | ||||||||||
|
|
|
|
|
|
|
| |||||||||
NET ASSETS: | ||||||||||||||||
Change in net assets | (815,045 | ) | 475,163 | (7,930 | ) | (7,789 | ) | |||||||||
Beginning of period | 8,221,578 | 7,746,415 | 329,407 | 337,196 | ||||||||||||
|
|
|
|
|
|
|
| |||||||||
End of period | $ | 7,406,533 | $ | 8,221,578 | $ | 321,477 | $ | 329,407 | ||||||||
|
|
|
|
|
|
|
| |||||||||
Accumulated undistributed (distributions in excess of) net investment income | $ | (62 | ) | $ | 14,017 | $ | 143 | $ | (147 | ) | ||||||
|
|
|
|
|
|
|
| |||||||||
SEE NOTES TO FINANCIAL STATEMENTS.
| JUNE 30, 2017 | J.P. MORGAN LARGE CAP FUNDS | 59 | ||||||
Table of Contents
STATEMENTS OF CHANGES IN NET ASSETS
FOR THE PERIODS INDICATED (continued)
(Amounts in thousands)
| Equity Focus Fund | Equity Income Fund | |||||||||||||||
| Year Ended June 30, 2017 | Year Ended June 30, 2016 | Year Ended June 30, 2017 | Year Ended June 30, 2016 | |||||||||||||
CHANGE IN NET ASSETS RESULTING FROM OPERATIONS: | ||||||||||||||||
Net investment income (loss) | $ | 321 | $ | 242 | $ | 241,554 | $ | 209,897 | ||||||||
Net realized gain (loss) | 11,379 | (650 | ) | 138,214 | 15,204 | |||||||||||
Change in net unrealized appreciation/depreciation | 20,067 | 2,777 | 1,463,818 | 316,575 | ||||||||||||
|
|
|
|
|
|
|
| |||||||||
Change in net assets resulting from operations | 31,767 | 2,369 | 1,843,586 | 541,676 | ||||||||||||
|
|
|
|
|
|
|
| |||||||||
DISTRIBUTIONS TO SHAREHOLDERS: | ||||||||||||||||
Class A | ||||||||||||||||
From net investment income | (1 | ) | — | (a) | (55,085 | )�� | (56,754 | ) | ||||||||
From net realized gains | (25 | ) | (47 | ) | (21,407 | ) | (23,970 | ) | ||||||||
Class C | ||||||||||||||||
From net investment income | — | — | (17,029 | ) | (17,909 | ) | ||||||||||
From net realized gains | (19 | ) | (26 | ) | (8,532 | ) | (9,204 | ) | ||||||||
Class I (formerly Select Class) | ||||||||||||||||
From net investment income | (370 | ) | (122 | ) | (100,491 | ) | (89,550 | ) | ||||||||
From net realized gains | (1,646 | ) | (2,128 | ) | (31,653 | ) | (33,863 | ) | ||||||||
Class R2 | ||||||||||||||||
From net investment income | — | — | (1,197 | ) | (1,091 | ) | ||||||||||
From net realized gains | — | — | (512 | ) | (494 | ) | ||||||||||
Class R3 (b) | ||||||||||||||||
From net investment income | — | — | (81 | ) | — | |||||||||||
From net realized gains | — | — | — | (a) | — | |||||||||||
Class R4 (b) | ||||||||||||||||
From net investment income | — | — | (5 | ) | — | |||||||||||
From net realized gains | — | — | — | (a) | — | |||||||||||
Class R5 | ||||||||||||||||
From net investment income | — | — | (18,214 | ) | (12,835 | ) | ||||||||||
From net realized gains | — | — | (5,543 | ) | (4,311 | ) | ||||||||||
Class R6 | ||||||||||||||||
From net investment income | — | — | (49,266 | ) | (31,307 | ) | ||||||||||
From net realized gains | — | — | (13,934 | ) | (9,593 | ) | ||||||||||
|
|
|
|
|
|
|
| |||||||||
Total distributions to shareholders | (2,061 | ) | (2,323 | ) | (322,949 | ) | (290,881 | ) | ||||||||
|
|
|
|
|
|
|
| |||||||||
CAPITAL TRANSACTIONS: | ||||||||||||||||
Change in net assets resulting from capital transactions | 17,649 | 55,939 | 1,365,954 | 1,562,346 | ||||||||||||
|
|
|
|
|
|
|
| |||||||||
NET ASSETS: | ||||||||||||||||
Change in net assets | 47,355 | 55,985 | 2,886,591 | 1,813,141 | ||||||||||||
Beginning of period | 139,489 | 83,504 | 12,066,321 | 10,253,180 | ||||||||||||
|
|
|
|
|
|
|
| |||||||||
End of period | $ | 186,844 | $ | 139,489 | $ | 14,952,912 | $ | 12,066,321 | ||||||||
|
|
|
|
|
|
|
| |||||||||
Accumulated undistributed (distributions in excess of) net investment income | $ | 135 | $ | 185 | $ | (82 | ) | $ | 1,930 | |||||||
|
|
|
|
|
|
|
| |||||||||
| (a) | Amount rounds to less than 500. |
| (b) | Commencement of offering of class of shares effective September 9, 2016 for Equity Income Fund. |
SEE NOTES TO FINANCIAL STATEMENTS.
| 60 | J.P. MORGAN LARGE CAP FUNDS | JUNE 30, 2017 | ||||
Table of Contents
| Growth and Income Fund | Hedged Equity Fund | |||||||||||||||
| Year Ended June 30, 2017 | Year Ended June 30, 2016 | Year Ended June 30, 2017 | Year Ended June 30, 2016 | |||||||||||||
CHANGE IN NET ASSETS RESULTING FROM OPERATIONS: | ||||||||||||||||
Net investment income (loss) | $ | 6,531 | $ | 6,656 | $ | 4,860 | $ | 3,505 | ||||||||
Net realized gain (loss) | 21,022 | 20,039 | (9,989 | ) | (16,722 | ) | ||||||||||
Change in net unrealized appreciation/depreciation | 49,974 | (21,834 | ) | 53,211 | 14,782 | |||||||||||
|
|
|
|
|
|
|
| |||||||||
Change in net assets resulting from operations | 77,527 | 4,861 | 48,082 | 1,565 | ||||||||||||
|
|
|
|
|
|
|
| |||||||||
DISTRIBUTIONS TO SHAREHOLDERS: | ||||||||||||||||
Class A | ||||||||||||||||
From net investment income | (5,553 | ) | (5,532 | ) | (966 | ) | (801 | ) | ||||||||
From net realized gains | (21,085 | ) | (23,586 | ) | — | — | ||||||||||
Class C | ||||||||||||||||
From net investment income | (261 | ) | (248 | ) | (102 | ) | (53 | ) | ||||||||
From net realized gains | (1,409 | ) | (1,528 | ) | — | — | ||||||||||
Class I (formerly Select Class) | ||||||||||||||||
From net investment income | (757 | ) | (547 | ) | (4,137 | ) | (2,096 | ) | ||||||||
From net realized gains | (2,037 | ) | (1,738 | ) | — | — | ||||||||||
Class R2 | ||||||||||||||||
From net investment income | — | (a) | — | (a) | — | — | ||||||||||
From net realized gains | (1 | ) | (1 | ) | — | — | ||||||||||
Class R5 | ||||||||||||||||
From net investment income | — | (a) | — | (a) | — | (a) | — | (a) | ||||||||
From net realized gains | (1 | ) | (1 | ) | — | — | ||||||||||
Class R6 | ||||||||||||||||
From net investment income | (24 | ) | — | (a) | (12 | ) | (1 | ) | ||||||||
From net realized gains | (1 | ) | (1 | ) | — | — | ||||||||||
|
|
|
|
|
|
|
| |||||||||
Total distributions to shareholders | (31,129 | ) | (33,182 | ) | (5,217 | ) | (2,951 | ) | ||||||||
|
|
|
|
|
|
|
| |||||||||
CAPITAL TRANSACTIONS: | ||||||||||||||||
Change in net assets resulting from capital transactions | 5,487 | 20,822 | 480,228 | 38,895 | ||||||||||||
|
|
|
|
|
|
|
| |||||||||
NET ASSETS: | ||||||||||||||||
Change in net assets | 51,885 | (7,499 | ) | 523,093 | 37,509 | |||||||||||
Beginning of period | 487,820 | 495,319 | 240,203 | 202,694 | ||||||||||||
|
|
|
|
|
|
|
| |||||||||
End of period | $ | 539,705 | $ | 487,820 | $ | 763,296 | $ | 240,203 | ||||||||
|
|
|
|
|
|
|
| |||||||||
Accumulated undistributed (distributions in excess of) net investment income | $ | 107 | $ | 251 | $ | 32 | $ | 476 | ||||||||
|
|
|
|
|
|
|
| |||||||||
| (a) | Amount rounds to less than 500. |
SEE NOTES TO FINANCIAL STATEMENTS.
| JUNE 30, 2017 | J.P. MORGAN LARGE CAP FUNDS | 61 | ||||||
Table of Contents
STATEMENTS OF CHANGES IN NET ASSETS
FOR THE PERIODS INDICATED (continued)
(Amounts in thousands)
| Large Cap Growth Fund | Large Cap Value Fund | |||||||||||||||
| Year Ended June 30, 2017 | Year Ended June 30, 2016 | Year Ended June 30, 2017 | Year Ended June 30, 2016 | |||||||||||||
CHANGE IN NET ASSETS RESULTING FROM OPERATIONS: | ||||||||||||||||
Net investment income (loss) | $ | (2,632 | ) | $ | (2,568 | ) | $ | 11,242 | $ | 11,011 | ||||||
Net realized gain (loss) | 2,090,043 | 607,808 | 104,157 | 38,905 | ||||||||||||
Change in net unrealized appreciation/depreciation | 995,654 | (1,558,068 | ) | 88,765 | (67,018 | ) | ||||||||||
|
|
|
|
|
|
|
| |||||||||
Change in net assets resulting from operations | 3,083,065 | (952,828 | ) | 204,164 | (17,102 | ) | ||||||||||
|
|
|
|
|
|
|
| |||||||||
DISTRIBUTIONS TO SHAREHOLDERS: | ||||||||||||||||
Class A | ||||||||||||||||
From net investment income | — | — | (1,507 | ) | (1,101 | ) | ||||||||||
From net realized gains | (325,496 | ) | (204,092 | ) | (5,231 | ) | (10,979 | ) | ||||||||
Class C | ||||||||||||||||
From net investment income | — | — | (170 | ) | (116 | ) | ||||||||||
From net realized gains | (53,436 | ) | (31,708 | ) | (1,032 | ) | (1,856 | ) | ||||||||
Class I (formerly Select Class) | ||||||||||||||||
From net investment income | — | — | (950 | ) | (1,784 | ) | ||||||||||
From net realized gains | (328,427 | ) | (220,849 | ) | (1,643 | ) | (2,301 | ) | ||||||||
Class R2 | ||||||||||||||||
From net investment income | — | — | (33 | ) | (29 | ) | ||||||||||
From net realized gains | (15,873 | ) | (9,889 | ) | (201 | ) | (358 | ) | ||||||||
Class R3 (a) | ||||||||||||||||
From net realized gains | (2 | ) | — | — | — | |||||||||||
Class R4 (a) | ||||||||||||||||
From net realized gains | (2 | ) | — | — | — | |||||||||||
Class R5 | ||||||||||||||||
From net investment income | — | — | (98 | ) | (36 | ) | ||||||||||
From net realized gains | (98,724 | ) | (55,775 | ) | (290 | ) | (267 | ) | ||||||||
Class R6 | ||||||||||||||||
From net investment income | — | — | (8,323 | ) | (7,550 | ) | ||||||||||
From net realized gains | (289,943 | ) | (163,685 | ) | (26,620 | ) | (71,699 | ) | ||||||||
|
|
|
|
|
|
|
| |||||||||
Total distributions to shareholders | (1,111,903 | ) | (685,998 | ) | (46,098 | ) | (98,076 | ) | ||||||||
|
|
|
|
|
|
|
| |||||||||
CAPITAL TRANSACTIONS: | ||||||||||||||||
Change in net assets resulting from capital transactions | (3,398,594 | ) | (300,688 | ) | 184,252 | 73,776 | ||||||||||
|
|
|
|
|
|
|
| |||||||||
NET ASSETS: | ||||||||||||||||
Change in net assets | (1,427,432 | ) | (1,939,514 | ) | 342,318 | (41,402 | ) | |||||||||
Beginning of period | 13,704,136 | 15,643,650 | 709,946 | 751,348 | ||||||||||||
|
|
|
|
|
|
|
| |||||||||
End of period | $ | 12,276,704 | $ | 13,704,136 | $ | 1,052,264 | $ | 709,946 | ||||||||
|
|
|
|
|
|
|
| |||||||||
Accumulated undistributed (distributions in excess of) net investment income | $ | (164 | ) | $ | (159 | ) | $ | 374 | $ | 258 | ||||||
|
|
|
|
|
|
|
| |||||||||
| (a) | Commencement of offering of class of shares effective September 9, 2016 for Large Cap Growth Fund. |
SEE NOTES TO FINANCIAL STATEMENTS.
| 62 | J.P. MORGAN LARGE CAP FUNDS | JUNE 30, 2017 | ||||
Table of Contents
STATEMENTS OF CHANGES IN NET ASSETS
FOR THE PERIODS INDICATED (continued)
(Amounts in thousands)
| U.S. Equity Fund | ||||||||
| Year Ended June 30, 2017 | Year Ended June 30, 2016 | |||||||
CHANGE IN NET ASSETS RESULTING FROM OPERATIONS: | ||||||||
Net investment income (loss) | $ | 136,643 | $ | 143,232 | ||||
Net realized gain (loss) | 1,274,052 | 83,639 | ||||||
Change in net unrealized appreciation/depreciation | 949,838 | (349,454 | ) | |||||
|
|
|
| |||||
Change in net assets resulting from operations | 2,360,533 | (122,583 | ) | |||||
|
|
|
| |||||
DISTRIBUTIONS TO SHAREHOLDERS: | ||||||||
Class A | ||||||||
From net investment income | (10,446 | ) | (10,975 | ) | ||||
From net realized gains | (51,421 | ) | (69,017 | ) | ||||
Class C | ||||||||
From net investment income | (888 | ) | (885 | ) | ||||
From net realized gains | (11,601 | ) | (13,589 | ) | ||||
Class I (formerly Select Class) | ||||||||
From net investment income | (10,661 | ) | (12,647 | ) | ||||
From net realized gains | (39,119 | ) | (52,720 | ) | ||||
Class L (formerly Institutional Class) | ||||||||
From net investment income | (35,018 | ) | (46,200 | ) | ||||
From net realized gains | (116,356 | ) | (229,612 | ) | ||||
Class R2 | ||||||||
From net investment income | (1,117 | ) | (1,056 | ) | ||||
From net realized gains | (7,793 | ) | (9,319 | ) | ||||
Class R3 (a) | ||||||||
From net investment income | (52 | ) | — | |||||
From net realized gains | (1 | ) | — | |||||
Class R4 (a) | ||||||||
From net investment income | (2 | ) | — | |||||
From net realized gains | (1 | ) | — | |||||
Class R5 | ||||||||
From net investment income | (9,792 | ) | (9,323 | ) | ||||
From net realized gains | (30,659 | ) | (44,668 | ) | ||||
Class R6 | ||||||||
From net investment income | (66,331 | ) | (50,265 | ) | ||||
From net realized gains | (182,725 | ) | (215,169 | ) | ||||
|
|
|
| |||||
Total distributions to shareholders | (573,983 | ) | (765,445 | ) | ||||
|
|
|
| |||||
CAPITAL TRANSACTIONS: |
| |||||||
Change in net assets resulting from capital transactions | 127,956 | 658,512 | ||||||
|
|
|
| |||||
NET ASSETS: |
| |||||||
Change in net assets | 1,914,506 | (229,516 | ) | |||||
Beginning of period | 12,382,487 | 12,612,003 | ||||||
|
|
|
| |||||
End of period | $ | 14,296,993 | $ | 12,382,487 | ||||
|
|
|
| |||||
Accumulated undistributed (distributions in excess of) net investment income | $ | 6,113 | $ | 7,505 | ||||
|
|
|
| |||||
| (a) | Commencement of offering of class of shares effective September 9, 2016. |
SEE NOTES TO FINANCIAL STATEMENTS.
| JUNE 30, 2017 | J.P. MORGAN LARGE CAP FUNDS | 63 | ||||||
Table of Contents
STATEMENTS OF CHANGES IN NET ASSETS
FOR THE PERIODS INDICATED (continued)
(Amounts in thousands)
| Disciplined Equity Fund | Dynamic Growth Fund | |||||||||||||||
| Year Ended June 30, 2017 | Year Ended June 30, 2016 | Year Ended June 30, 2017 | Year Ended June 30, 2016 | |||||||||||||
CAPITAL TRANSACTIONS: | ||||||||||||||||
Class A | ||||||||||||||||
Proceeds from shares issued | $ | 94,963 | $ | 313,069 | $ | 14,963 | $ | 28,692 | ||||||||
Distributions reinvested | 6,471 | 30,719 | 604 | 538 | ||||||||||||
Cost of shares redeemed | (249,037 | ) | (274,502 | ) | (25,052 | ) | (12,209 | ) | ||||||||
|
|
|
|
|
|
|
| |||||||||
Change in net assets resulting from Class A capital transactions | $ | (147,603 | ) | $ | 69,286 | $ | (9,485 | ) | $ | 17,021 | ||||||
|
|
|
|
|
|
|
| |||||||||
Class C | ||||||||||||||||
Proceeds from shares issued | $ | — | $ | — | $ | 3,462 | $ | 7,392 | ||||||||
Distributions reinvested | — | — | 140 | 101 | ||||||||||||
Cost of shares redeemed | — | — | (5,320 | ) | (3,617 | ) | ||||||||||
|
|
|
|
|
|
|
| |||||||||
Change in net assets resulting from Class C capital transactions | $ | — | $ | — | $ | (1,718 | ) | $ | 3,876 | |||||||
|
|
|
|
|
|
|
| |||||||||
Class I (formerly Select Class) | ||||||||||||||||
Proceeds from shares issued | $ | 74,063 | $ | 117,175 | $ | 50,137 | $ | 41,622 | ||||||||
Distributions reinvested | 3,996 | 15,046 | 450 | 177 | ||||||||||||
Cost of shares redeemed | (93,896 | ) | (105,038 | ) | (40,693 | ) | (303,448 | ) | ||||||||
|
|
|
|
|
|
|
| |||||||||
Change in net assets resulting from Class I capital transactions | $ | (15,837 | ) | $ | 27,183 | $ | 9,894 | $ | (261,649 | ) | ||||||
|
|
|
|
|
|
|
| |||||||||
Class L (formerly Institutional Class) | ||||||||||||||||
Proceeds from shares issued | $ | 142,337 | $ | 276,620 | $ | — | $ | — | ||||||||
Distributions reinvested | 11,155 | 34,689 | — | — | ||||||||||||
Cost of shares redeemed | (270,260 | ) | (208,445 | ) | — | — | ||||||||||
|
|
|
|
|
|
|
| |||||||||
Change in net assets resulting from Class L capital transactions | $ | (116,768 | ) | $ | 102,864 | $ | — | $ | — | |||||||
|
|
|
|
|
|
|
| |||||||||
Class R5 | ||||||||||||||||
Proceeds from shares issued | $ | — | $ | — | $ | — | (a) | $ | 258,080 | |||||||
Distributions reinvested | — | — | 2,695 | 2,408 | ||||||||||||
Cost of shares redeemed | — | — | (97,882 | ) | (12,547 | ) | ||||||||||
|
|
|
|
|
|
|
| |||||||||
Change in net assets resulting from Class R5 capital transactions | $ | — | $ | — | $ | (95,187 | ) | $ | 247,941 | |||||||
|
|
|
|
|
|
|
| |||||||||
Class R6 | ||||||||||||||||
Proceeds from shares issued | $ | 709,194 | $ | 2,058,427 | $ | — | $ | — | ||||||||
Distributions reinvested | 110,853 | 368,866 | — | — | ||||||||||||
Cost of shares redeemed | (2,547,572 | ) | (1,381,896 | ) | — | — | ||||||||||
|
|
|
|
|
|
|
| |||||||||
Change in net assets resulting from Class R6 capital transactions | $ | (1,727,525 | ) | $ | 1,045,397 | $ | — | $ | — | |||||||
|
|
|
|
|
|
|
| |||||||||
Total change in net assets resulting from capital transactions | $ | (2,007,733 | ) | $ | 1,244,730 | $ | (96,496 | ) | $ | 7,189 | ||||||
|
|
|
|
|
|
|
| |||||||||
| (a) | Amount rounds to less than 500. |
SEE NOTES TO FINANCIAL STATEMENTS.
| 64 | J.P. MORGAN LARGE CAP FUNDS | JUNE 30, 2017 | ||||
Table of Contents
| Disciplined Equity Fund | Dynamic Growth Fund | |||||||||||||||
| Year Ended June 30, 2017 | Year Ended June 30, 2016 | Year Ended June 30, 2017 | Year Ended June 30, 2016 | |||||||||||||
SHARE TRANSACTIONS: | ||||||||||||||||
Class A | ||||||||||||||||
Issued | 4,005 | 13,968 | 532 | 1,144 | ||||||||||||
Reinvested | 270 | 1,433 | 23 | 21 | ||||||||||||
Redeemed | (10,536 | ) | (12,641 | ) | (919 | ) | (500 | ) | ||||||||
|
|
|
|
|
|
|
| |||||||||
Change in Class A Shares | (6,261 | ) | 2,760 | (364 | ) | 665 | ||||||||||
|
|
|
|
|
|
|
| |||||||||
Class C | ||||||||||||||||
Issued | — | — | 131 | 309 | ||||||||||||
Reinvested | — | — | 5 | 4 | ||||||||||||
Redeemed | — | — | (202 | ) | (155 | ) | ||||||||||
|
|
|
|
|
|
|
| |||||||||
Change in Class C Shares | — | — | (66 | ) | 158 | |||||||||||
|
|
|
|
|
|
|
| |||||||||
Class I (formerly Select Class) | ||||||||||||||||
Issued | 3,033 | 5,191 | 1,795 | 1,705 | ||||||||||||
Reinvested | 164 | 696 | 17 | 7 | ||||||||||||
Redeemed | (3,949 | ) | (4,782 | ) | (1,425 | ) | (11,388 | ) | ||||||||
|
|
|
|
|
|
|
| |||||||||
Change in Class I Shares | (752 | ) | 1,105 | 387 | (9,676 | ) | ||||||||||
|
|
|
|
|
|
|
| |||||||||
Class L (formerly Institutional Class) | ||||||||||||||||
Issued | 5,950 | 12,447 | — | — | ||||||||||||
Reinvested | 460 | 1,607 | — | — | ||||||||||||
Redeemed | (11,410 | ) | (9,387 | ) | — | — | ||||||||||
|
|
|
|
|
|
|
| |||||||||
Change in Class L Shares | (5,000 | ) | 4,667 | — | — | |||||||||||
|
|
|
|
|
|
|
| |||||||||
Class R5 | ||||||||||||||||
Issued | — | — | — | 9,397 | ||||||||||||
Reinvested | — | — | 99 | 91 | ||||||||||||
Redeemed | — | — | (3,281 | ) | (460 | ) | ||||||||||
|
|
|
|
|
|
|
| |||||||||
Change in Class R5 Shares | — | — | (3,182 | ) | 9,028 | |||||||||||
|
|
|
|
|
|
|
| |||||||||
Class R6 | ||||||||||||||||
Issued | 30,002 | 92,272 | — | — | ||||||||||||
Reinvested | 4,586 | 17,086 | — | — | ||||||||||||
Redeemed | (108,600 | ) | (63,085 | ) | — | — | ||||||||||
|
|
|
|
|
|
|
| |||||||||
Change in Class R6 Shares | (74,012 | ) | 46,273 | — | — | |||||||||||
|
|
|
|
|
|
|
| |||||||||
SEE NOTES TO FINANCIAL STATEMENTS.
| JUNE 30, 2017 | J.P. MORGAN LARGE CAP FUNDS | 65 | ||||||
Table of Contents
STATEMENTS OF CHANGES IN NET ASSETS
FOR THE PERIODS INDICATED (continued)
(Amounts in thousands)
| Equity Focus Fund | Equity Income Fund | |||||||||||||||
| Year Ended June 30, 2017 | Year Ended June 30, 2016 | Year Ended June 30, 2017 | Year Ended June 30, 2016 | |||||||||||||
CAPITAL TRANSACTIONS: | ||||||||||||||||
Class A | ||||||||||||||||
Proceeds from shares issued | $ | 2,075 | $ | 1,283 | $ | 894,583 | $ | 1,145,689 | ||||||||
Distributions reinvested | 26 | 47 | 72,244 | 76,806 | ||||||||||||
Cost of shares redeemed | (1,176 | ) | (756 | ) | (1,551,451 | ) | (929,480 | ) | ||||||||
|
|
|
|
|
|
|
| |||||||||
Change in net assets resulting from Class A capital transactions | $ | 925 | $ | 574 | $ | (584,624 | ) | $ | 293,015 | |||||||
|
|
|
|
|
|
|
| |||||||||
Class C | ||||||||||||||||
Proceeds from shares issued | $ | 2,311 | $ | 770 | $ | 285,012 | $ | 342,449 | ||||||||
Distributions reinvested | 19 | 26 | 21,767 | 22,526 | ||||||||||||
Cost of shares redeemed | (668 | ) | (358 | ) | (377,726 | ) | (243,691 | ) | ||||||||
|
|
|
|
|
|
|
| |||||||||
Change in net assets resulting from Class C capital transactions | $ | 1,662 | $ | 438 | $ | (70,947 | ) | $ | 121,284 | |||||||
|
|
|
|
|
|
|
| |||||||||
Class I (formerly Select Class) | ||||||||||||||||
Proceeds from shares issued | $ | 77,581 | $ | 84,242 | $ | 2,752,194 | $ | 1,604,186 | ||||||||
Distributions reinvested | 500 | 118 | 91,463 | 80,801 | ||||||||||||
Cost of shares redeemed | (63,019 | ) | (29,433 | ) | (1,583,974 | ) | (1,736,883 | ) | ||||||||
|
|
|
|
|
|
|
| |||||||||
Change in net assets resulting from Class I capital transactions | $ | 15,062 | $ | 54,927 | $ | 1,259,683 | $ | (51,896 | ) | |||||||
|
|
|
|
|
|
|
| |||||||||
Class R2 | ||||||||||||||||
Proceeds from shares issued | $ | — | $ | — | $ | 25,628 | $ | 33,036 | ||||||||
Distributions reinvested | — | — | 1,465 | 1,417 | ||||||||||||
Cost of shares redeemed | — | — | (26,181 | ) | (15,534 | ) | ||||||||||
|
|
|
|
|
|
|
| |||||||||
Change in net assets resulting from Class R2 capital transactions | $ | — | $ | — | $ | 912 | $ | 18,919 | ||||||||
|
|
|
|
|
|
|
| |||||||||
Class R3 (a) | ||||||||||||||||
Proceeds from shares issued | $ | — | $ | — | $ | 25,864 | $ | — | ||||||||
Distributions reinvested | — | — | 81 | — | ||||||||||||
Cost of shares redeemed | — | — | (1,061 | ) | — | |||||||||||
|
|
|
|
|
|
|
| |||||||||
Change in net assets resulting from Class R3 capital transactions | $ | — | $ | — | $ | 24,884 | $ | — | ||||||||
|
|
|
|
|
|
|
| |||||||||
Class R4 (a) | ||||||||||||||||
Proceeds from shares issued | $ | — | $ | — | $ | 1,348 | $ | — | ||||||||
Distributions reinvested | — | — | 5 | — | ||||||||||||
Cost of shares redeemed | — | — | (22 | ) | — | |||||||||||
|
|
|
|
|
|
|
| |||||||||
Change in net assets resulting from Class R4 capital transactions | $ | — | $ | — | $ | 1,331 | $ | — | ||||||||
|
|
|
|
|
|
|
| |||||||||
Class R5 | ||||||||||||||||
Proceeds from shares issued | $ | — | $ | — | $ | 335,193 | $ | 412,223 | ||||||||
Distributions reinvested | — | — | 20,248 | 13,452 | ||||||||||||
Cost of shares redeemed | — | — | (265,692 | ) | (240,758 | ) | ||||||||||
|
|
|
|
|
|
|
| |||||||||
Change in net assets resulting from Class R5 capital transactions | $ | — | $ | — | $ | 89,749 | $ | 184,917 | ||||||||
|
|
|
|
|
|
|
| |||||||||
Class R6 | ||||||||||||||||
Proceeds from shares issued | $ | — | $ | — | $ | 944,610 | $ | 1,204,396 | ||||||||
Distributions reinvested | — | — | 58,534 | 37,570 | ||||||||||||
Cost of shares redeemed | — | — | (358,178 | ) | (245,859 | ) | ||||||||||
|
|
|
|
|
|
|
| |||||||||
Change in net assets resulting from Class R6 capital transactions | $ | — | $ | — | $ | 644,966 | $ | 996,107 | ||||||||
|
|
|
|
|
|
|
| |||||||||
Total change in net assets resulting from capital transactions | $ | 17,649 | $ | 55,939 | $ | 1,365,954 | $ | 1,562,346 | ||||||||
|
|
|
|
|
|
|
| |||||||||
| (a) | Commencement of offering of class of shares effective September 9, 2016 for Equity Income Fund. |
SEE NOTES TO FINANCIAL STATEMENTS.
| 66 | J.P. MORGAN LARGE CAP FUNDS | JUNE 30, 2017 | ||||
Table of Contents
| Equity Focus Fund | Equity Income Fund | |||||||||||||||
| Year Ended June 30, 2017 | Year Ended June 30, 2016 | Year Ended June 30, 2017 | Year Ended June 30, 2016 | |||||||||||||
SHARE TRANSACTIONS: | ||||||||||||||||
Class A | ||||||||||||||||
Issued | 77 | 53 | 60,548 | 85,185 | ||||||||||||
Reinvested | 1 | 2 | 4,819 | 5,747 | ||||||||||||
Redeemed | (44 | ) | (32 | ) | (103,227 | ) | (69,349 | ) | ||||||||
|
|
|
|
|
|
|
| |||||||||
Change in Class A Shares | 34 | 23 | (37,860 | ) | 21,583 | |||||||||||
|
|
|
|
|
|
|
| |||||||||
Class C | ||||||||||||||||
Issued | 87 | 33 | 19,503 | 25,820 | ||||||||||||
Reinvested | 1 | 1 | 1,474 | 1,712 | ||||||||||||
Redeemed | (25 | ) | (15 | ) | (25,612 | ) | (18,409 | ) | ||||||||
|
|
|
|
|
|
|
| |||||||||
Change in Class C Shares | 63 | 19 | (4,635 | ) | 9,123 | |||||||||||
|
|
|
|
|
|
|
| |||||||||
Class I (formerly Select Class) | �� | |||||||||||||||
Issued | 2,794 | 3,648 | 180,530 | 117,769 | ||||||||||||
Reinvested | 18 | 5 | 5,980 | 5,955 | ||||||||||||
Redeemed | (2,369 | ) | (1,210 | ) | (104,537 | ) | (126,901 | ) | ||||||||
|
|
|
|
|
|
|
| |||||||||
Change in Class I Shares | 443 | 2,443 | 81,973 | (3,177 | ) | |||||||||||
|
|
|
|
|
|
|
| |||||||||
Class R2 | ||||||||||||||||
Issued | — | — | 1,732 | 2,472 | ||||||||||||
Reinvested | — | — | 98 | 106 | ||||||||||||
Redeemed | — | — | (1,759 | ) | (1,164 | ) | ||||||||||
|
|
|
|
|
|
|
| |||||||||
Change in Class R2 Shares | — | — | 71 | 1,414 | ||||||||||||
|
|
|
|
|
|
|
| |||||||||
Class R3 (a) | ||||||||||||||||
Issued | — | — | 1,673 | — | ||||||||||||
Reinvested | — | — | 5 | — | ||||||||||||
Redeemed | — | — | (68) | — | ||||||||||||
|
|
|
|
|
|
|
| |||||||||
Change in Class R3 Shares | — | — | 1,610 | — | ||||||||||||
|
|
|
|
|
|
|
| |||||||||
Class R4 (a) | ||||||||||||||||
Issued | — | — | 85 | — | ||||||||||||
Reinvested | — | — | — | (b) | — | |||||||||||
Redeemed | — | — | (1 | ) | — | |||||||||||
|
|
|
|
|
|
|
| |||||||||
Change in Class R4 Shares | — | — | 84 | — | ||||||||||||
|
|
|
|
|
|
|
| |||||||||
Class R5 | ||||||||||||||||
Issued | — | — | 22,474 | 30,176 | ||||||||||||
Reinvested | — | — | 1,327 | 990 | ||||||||||||
Redeemed | — | — | (17,279 | ) | (17,661 | ) | ||||||||||
|
|
|
|
|
|
|
| |||||||||
Change in Class R5 Shares | — | — | 6,522 | 13,505 | ||||||||||||
|
|
|
|
|
|
|
| |||||||||
Class R6 | ||||||||||||||||
Issued | — | — | 62,362 | 88,149 | ||||||||||||
Reinvested | — | — | 3,831 | 2,760 | ||||||||||||
Redeemed | — | — | (23,492 | ) | (18,113 | ) | ||||||||||
|
|
|
|
|
|
|
| |||||||||
Change in Class R6 Shares | — | — | 42,701 | 72,796 | ||||||||||||
|
|
|
|
|
|
|
| |||||||||
| (a) | Commencement of offering of class of shares effective September 9, 2016 for Equity Income Fund. |
| (b) | Amount rounds to less than 500. |
SEE NOTES TO FINANCIAL STATEMENTS.
| JUNE 30, 2017 | J.P. MORGAN LARGE CAP FUNDS | 67 | ||||||
Table of Contents
STATEMENTS OF CHANGES IN NET ASSETS
FOR THE PERIODS INDICATED (continued)
(Amounts in thousands)
| Growth and Income Fund | Hedged Equity Fund | |||||||||||||||
| Year Ended June 30, 2017 | Year Ended June 30, 2016 | Year Ended June 30, 2017 | Year Ended June 30, 2016 | |||||||||||||
CAPITAL TRANSACTIONS: | ||||||||||||||||
Class A | ||||||||||||||||
Proceeds from shares issued | $ | 26,975 | $ | 60,769 | $ | 108,278 | $ | 53,101 | ||||||||
Distributions reinvested | 25,772 | 28,009 | 963 | 801 | ||||||||||||
Cost of shares redeemed | (69,807 | ) | (76,067 | ) | (56,579 | ) | (74,383 | ) | ||||||||
|
|
|
|
|
|
|
| |||||||||
Change in net assets resulting from Class A capital transactions | $ | (17,060 | ) | $ | 12,711 | $ | 52,662 | $ | (20,481 | ) | ||||||
|
|
|
|
|
|
|
| |||||||||
Class C | ||||||||||||||||
Proceeds from shares issued | $ | 7,478 | $ | 6,659 | $ | 21,214 | $ | 7,643 | ||||||||
Distributions reinvested | 1,487 | 1,582 | 102 | 52 | ||||||||||||
Cost of shares redeemed | (8,463 | ) | (5,693 | ) | (3,586 | ) | (1,302 | ) | ||||||||
|
|
|
|
|
|
|
| |||||||||
Change in net assets resulting from Class C capital transactions | $ | 502 | $ | 2,548 | $ | 17,730 | $ | 6,393 | ||||||||
|
|
|
|
|
|
|
| |||||||||
Class I (formerly Select Class) | ||||||||||||||||
Proceeds from shares issued | $ | 29,950 | $ | 15,091 | $ | 479,420 | $ | 166,370 | ||||||||
Distributions reinvested | 2,468 | 1,957 | 4,026 | 2,047 | ||||||||||||
Cost of shares redeemed | (12,449 | ) | (11,548 | ) | (76,819 | ) | (114,645 | ) | ||||||||
|
|
|
|
|
|
|
| |||||||||
Change in net assets resulting from Class I capital transactions | $ | 19,969 | $ | 5,500 | $ | 406,627 | $ | 53,772 | ||||||||
|
|
|
|
|
|
|
| |||||||||
Class R2 | ||||||||||||||||
Proceeds from shares issued | $ | — | (a) | $ | 20 | $ | — | $ | — | |||||||
Distributions reinvested | 1 | 1 | — | — | ||||||||||||
|
|
|
|
|
|
|
| |||||||||
Change in net assets resulting from Class R2 capital transactions | $ | 1 | $ | 21 | $ | — | $ | — | ||||||||
|
|
|
|
|
|
|
| |||||||||
Class R5 | ||||||||||||||||
Proceeds from shares issued | $ | 13 | $ | 20 | $ | 11 | $ | 7 | ||||||||
Distributions reinvested | 1 | 1 | — | (a) | — | (a) | ||||||||||
Cost of shares redeemed | (1 | ) | — | (2 | ) | (426 | ) | |||||||||
|
|
|
|
|
|
|
| |||||||||
Change in net assets resulting from Class R5 capital transactions | $ | 13 | $ | 21 | $ | 9 | $ | (419 | ) | |||||||
|
|
|
|
|
|
|
| |||||||||
Class R6 | ||||||||||||||||
Proceeds from shares issued | $ | 2,071 | $ | 20 | $ | 3,711 | $ | 53 | ||||||||
Distributions reinvested | 25 | 1 | 12 | 1 | ||||||||||||
Cost of shares redeemed | (34 | ) | — | (523 | ) | (424 | ) | |||||||||
|
|
|
|
|
|
|
| |||||||||
Change in net assets resulting from Class R6 capital transactions | $ | 2,062 | $ | 21 | $ | 3,200 | $ | (370 | ) | |||||||
|
|
|
|
|
|
|
| |||||||||
Total change in net assets resulting from capital transactions | $ | 5,487 | $ | 20,822 | $ | 480,228 | $ | 38,895 | ||||||||
|
|
|
|
|
|
|
| |||||||||
| (a) | Amount rounds to less than 500. |
SEE NOTES TO FINANCIAL STATEMENTS.
| 68 | J.P. MORGAN LARGE CAP FUNDS | JUNE 30, 2017 | ||||
Table of Contents
| Growth and Income Fund | Hedged Equity Fund | |||||||||||||||
| Year Ended June 30, 2017 | Year Ended June 30, 2016 | Year Ended June 30, 2017 | Year Ended June 30, 2016 | |||||||||||||
SHARE TRANSACTIONS: | ||||||||||||||||
Class A | ||||||||||||||||
Issued | 593 | 1,429 | 6,104 | 3,349 | ||||||||||||
Reinvested | 563 | 676 | 55 | 51 | ||||||||||||
Redeemed | (1,532 | ) | (1,790 | ) | (3,224 | ) | (4,647 | ) | ||||||||
|
|
|
|
|
|
|
| |||||||||
Change in Class A Shares | (376 | ) | 315 | 2,935 | (1,247 | ) | ||||||||||
|
|
|
|
|
|
|
| |||||||||
Class C | ||||||||||||||||
Issued | 180 | 170 | 1,195 | 482 | ||||||||||||
Reinvested | 36 | 42 | 6 | 3 | ||||||||||||
Redeemed | (205 | ) | (147 | ) | (205 | ) | (82 | ) | ||||||||
|
|
|
|
|
|
|
| |||||||||
Change in Class C Shares | 11 | 65 | 996 | 403 | ||||||||||||
|
|
|
|
|
|
|
| |||||||||
Class I (formerly Select Class) | ||||||||||||||||
Issued | 619 | 345 | 27,070 | 10,436 | ||||||||||||
Reinvested | 51 | 45 | 227 | 130 | ||||||||||||
Redeemed | (261 | ) | (256 | ) | (4,393 | ) | (7,186 | ) | ||||||||
|
|
|
|
|
|
|
| |||||||||
Change in Class I Shares | 409 | 134 | 22,904 | 3,380 | ||||||||||||
|
|
|
|
|
|
|
| |||||||||
Class R2 | ||||||||||||||||
Issued | — | 1 | — | — | ||||||||||||
Reinvested | — | (a) | — | (a) | — | — | ||||||||||
Redeemed | — | — | — | — | ||||||||||||
|
|
|
|
|
|
|
| |||||||||
Change in Class R2 Shares | — | (a) | 1 | — | — | |||||||||||
|
|
|
|
|
|
|
| |||||||||
Class R5 | ||||||||||||||||
Issued | 1 | — | (a) | 1 | — | (a) | ||||||||||
Reinvested | — | (a) | — | (a) | — | (a) | — | (a) | ||||||||
Redeemed | — | (a) | — | — | (a) | (26 | ) | |||||||||
|
|
|
|
|
|
|
| |||||||||
Change in Class R5 Shares | 1 | — | (a) | 1 | (26 | ) | ||||||||||
|
|
|
|
|
|
|
| |||||||||
Class R6 | ||||||||||||||||
Issued | 43 | — | (a) | 203 | 4 | |||||||||||
Reinvested | 1 | — | (a) | 1 | — | (a) | ||||||||||
Redeemed | (1 | ) | — | (29 | ) | (26 | ) | |||||||||
|
|
|
|
|
|
|
| |||||||||
Change in Class R6 Shares | 43 | — | (a) | 175 | (22 | ) | ||||||||||
|
|
|
|
|
|
|
| |||||||||
| (a) | Amount rounds to less than 500. |
SEE NOTES TO FINANCIAL STATEMENTS.
| JUNE 30, 2017 | J.P. MORGAN LARGE CAP FUNDS | 69 | ||||||
Table of Contents
STATEMENTS OF CHANGES IN NET ASSETS
FOR THE PERIODS INDICATED (continued)
(Amounts in thousands)
| Large Cap Growth Fund | Large Cap Value Fund | |||||||||||||||
| Year Ended June 30, 2017 | Year Ended June 30, 2016 | Year Ended June 30, 2017 | Year Ended June 30, 2016 | |||||||||||||
CAPITAL TRANSACTIONS: | ||||||||||||||||
Class A | ||||||||||||||||
Proceeds from shares issued | $ | 643,833 | $ | 1,281,024 | $ | 168,247 | $ | 24,457 | ||||||||
Distributions reinvested | 303,623 | 190,608 | 6,462 | 11,625 | ||||||||||||
Cost of shares redeemed | (3,220,124 | ) | (1,392,513 | ) | (78,987 | ) | (17,824 | ) | ||||||||
|
|
|
|
|
|
|
| |||||||||
Change in net assets resulting from Class A capital transactions | $ | (2,272,668 | ) | $ | 79,119 | $ | 95,722 | $ | 18,258 | |||||||
|
|
|
|
|
|
|
| |||||||||
Class C | ||||||||||||||||
Proceeds from shares issued | $ | 42,768 | $ | 142,471 | $ | 33,013 | $ | 7,145 | ||||||||
Distributions reinvested | 38,865 | 22,387 | 1,034 | 1,705 | ||||||||||||
Cost of shares redeemed | (220,512 | ) | (130,104 | ) | (7,339 | ) | (3,753 | ) | ||||||||
|
|
|
|
|
|
|
| |||||||||
Change in net assets resulting from Class C capital transactions | $ | (138,879 | ) | $ | 34,754 | $ | 26,708 | $ | 5,097 | |||||||
|
|
|
|
|
|
|
| |||||||||
Class I (formerly Select Class) | ||||||||||||||||
Proceeds from shares issued | $ | 1,980,767 | $ | 1,153,454 | $ | 161,424 | $ | 24,717 | ||||||||
Distributions reinvested | 250,389 | 160,552 | 2,254 | 3,536 | ||||||||||||
Cost of shares redeemed | (2,307,254 | ) | (2,160,320 | ) | (32,884 | ) | (636,434 | ) | ||||||||
|
|
|
|
|
|
|
| |||||||||
Change in net assets resulting from Class I capital transactions | $ | (76,098 | ) | $ | (846,314 | ) | $ | 130,794 | $ | (608,181 | ) | |||||
|
|
|
|
|
|
|
| |||||||||
Class R2 | ||||||||||||||||
Proceeds from shares issued | $ | 52,791 | $ | 67,268 | $ | 3,523 | $ | 3,183 | ||||||||
Distributions reinvested | 11,527 | 7,704 | 138 | 237 | ||||||||||||
Cost of shares redeemed | (135,753 | ) | (100,569 | ) | (1,186 | ) | (608 | ) | ||||||||
|
|
|
|
|
|
|
| |||||||||
Change in net assets resulting from Class R2 capital transactions | $ | (71,435 | ) | $ | (25,597 | ) | $ | 2,475 | $ | 2,812 | ||||||
|
|
|
|
|
|
|
| |||||||||
Class R3 (a) | ||||||||||||||||
Proceeds from shares issued | $ | 977 | $ | — | $ | — | $ | — | ||||||||
Distributions reinvested | 2 | — | — | — | ||||||||||||
Cost of shares redeemed | (43 | ) | — | — | — | |||||||||||
|
|
|
|
|
|
|
| |||||||||
Change in net assets resulting from Class R3 capital transactions | $ | 936 | $ | — | $ | — | $ | — | ||||||||
|
|
|
|
|
|
|
| |||||||||
Class R4 (a) | ||||||||||||||||
Proceeds from shares issued | $ | 429 | $ | — | $ | — | $ | — | ||||||||
Distributions reinvested | 2 | — | — | — | ||||||||||||
Cost of shares redeemed | — | (b) | — | — | — | |||||||||||
|
|
|
|
|
|
|
| |||||||||
Change in net assets resulting from Class R4 capital transactions | $ | 431 | $ | — | $ | — | $ | — | ||||||||
|
|
|
|
|
|
|
| |||||||||
Class R5 | ||||||||||||||||
Proceeds from shares issued | $ | 143,031 | $ | 514,798 | $ | 6,133 | $ | 3,673 | ||||||||
Distributions reinvested | 94,629 | 52,449 | 376 | 160 | ||||||||||||
Cost of shares redeemed | (790,295 | ) | (607,179 | ) | (1,640 | ) | (3,493 | ) | ||||||||
|
|
|
|
|
|
|
| |||||||||
Change in net assets resulting from Class R5 capital transactions | $ | (552,635 | ) | $ | (39,932 | ) | $ | 4,869 | $ | 340 | ||||||
|
|
|
|
|
|
|
| |||||||||
Class R6 | ||||||||||||||||
Proceeds from shares issued | $ | 678,429 | $ | 1,387,654 | $ | 31,638 | $ | 617,794 | ||||||||
Distributions reinvested | 283,753 | 156,166 | 34,941 | 79,246 | ||||||||||||
Cost of shares redeemed | (1,250,428 | ) | (1,046,538 | ) | (142,895 | ) | (41,590 | ) | ||||||||
|
|
|
|
|
|
|
| |||||||||
Change in net assets resulting from Class R6 capital transactions | $ | (288,246 | ) | $ | 497,282 | $ | (76,316 | ) | $ | 655,450 | ||||||
|
|
|
|
|
|
|
| |||||||||
Total change in net assets resulting from capital transactions | $ | (3,398,594 | ) | $ | (300,688 | ) | $ | 184,252 | $ | 73,776 | ||||||
|
|
|
|
|
|
|
| |||||||||
| (a) | Commencement of offering of class of shares effective September 9, 2016 for Large Cap Growth Fund. |
| (b) | Amount rounds to less than 500. |
SEE NOTES TO FINANCIAL STATEMENTS.
| 70 | J.P. MORGAN LARGE CAP FUNDS | JUNE 30, 2017 | ||||
Table of Contents
| Large Cap Growth Fund | Large Cap Value Fund | |||||||||||||||
| Year Ended June 30, 2017 | Year Ended June 30, 2016 | Year Ended June 30, 2017 | Year Ended June 30, 2016 | |||||||||||||
SHARE TRANSACTIONS: | ||||||||||||||||
Class A | ||||||||||||||||
Issued | 18,686 | 37,172 | 11,164 | 1,832 | ||||||||||||
Reinvested | 9,494 | 5,482 | 436 | 924 | ||||||||||||
Redeemed | (92,834 | ) | (40,416 | ) | (5,292 | ) | (1,372 | ) | ||||||||
|
|
|
|
|
|
|
| |||||||||
Change in Class A Shares | (64,654 | ) | 2,238 | 6,308 | 1,384 | |||||||||||
|
|
|
|
|
|
|
| |||||||||
Class C | ||||||||||||||||
Issued | 1,492 | 4,722 | 2,276 | 563 | ||||||||||||
Reinvested | 1,450 | 751 | 72 | 140 | ||||||||||||
Redeemed | (7,549 | ) | (4,450 | ) | (518 | ) | (297 | ) | ||||||||
|
|
|
|
|
|
|
| |||||||||
Change in Class C Shares | (4,607 | ) | 1,023 | 1,830 | 406 | |||||||||||
|
|
|
|
|
|
|
| |||||||||
Class I (formerly Select Class) | ||||||||||||||||
Issued | 56,465 | 33,270 | 10,803 | 1,852 | ||||||||||||
Reinvested | 7,786 | 4,602 | 153 | 277 | ||||||||||||
Redeemed | (66,016 | ) | (61,477 | ) | (2,226 | ) | (43,139 | ) | ||||||||
|
|
|
|
|
|
|
| |||||||||
Change in Class I Shares | (1,765 | ) | (23,605 | ) | 8,730 | (41,010 | ) | |||||||||
|
|
|
|
|
|
|
| |||||||||
Class R2 | ||||||||||||||||
Issued | 1,560 | 1,959 | 240 | 228 | ||||||||||||
Reinvested | 368 | 226 | 9 | 19 | ||||||||||||
Redeemed | (3,925 | ) | (2,918 | ) | (83 | ) | (45 | ) | ||||||||
|
|
|
|
|
|
|
| |||||||||
Change in Class R2 Shares | (1,997 | ) | (733 | ) | 166 | 202 | ||||||||||
|
|
|
|
|
|
|
| |||||||||
Class R3 (a) | ||||||||||||||||
Issued | 27 | — | — | — | ||||||||||||
Reinvested | — | (b) | — | — | — | |||||||||||
Redeemed | (1 | ) | — | — | — | |||||||||||
|
|
|
|
|
|
|
| |||||||||
Change in Class R3 Shares | 26 | — | — | — | ||||||||||||
|
|
|
|
|
|
|
| |||||||||
Class R4 (a) | ||||||||||||||||
Issued | 11 | — | — | — | ||||||||||||
Reinvested | — | (b) | — | — | — | |||||||||||
Redeemed | — | (b) | — | — | — | |||||||||||
|
|
|
|
|
|
|
| |||||||||
Change in Class R4 Shares | 11 | — | — | — | ||||||||||||
|
|
|
|
|
|
|
| |||||||||
Class R5 | ||||||||||||||||
Issued | 4,034 | 14,389 | 422 | 285 | ||||||||||||
Reinvested | 2,903 | 1,488 | 26 | 13 | ||||||||||||
Redeemed | (22,615 | ) | (17,156 | ) | (112 | ) | (267 | ) | ||||||||
| �� |
|
|
|
|
|
|
|
| ||||||||
Change in Class R5 Shares | (15,678 | ) | (1,279 | ) | 336 | 31 | ||||||||||
|
|
|
|
|
|
|
| |||||||||
Class R6 | ||||||||||||||||
Issued | 19,262 | 38,341 | 2,234 | 41,745 | ||||||||||||
Reinvested | 8,668 | 4,416 | 2,394 | 6,381 | ||||||||||||
Redeemed | (35,193 | ) | (29,799 | ) | (9,711 | ) | (3,365 | ) | ||||||||
|
|
|
|
|
|
|
| |||||||||
Change in Class R6 Shares | (7,263 | ) | 12,958 | (5,083 | ) | 44,761 | ||||||||||
|
|
|
|
|
|
|
| |||||||||
| (a) | Commencement of offering of class of shares effective September 9, 2016 for Large Cap Growth Fund. |
| (b) | Amount rounds to less than 500. |
SEE NOTES TO FINANCIAL STATEMENTS.
| JUNE 30, 2017 | J.P. MORGAN LARGE CAP FUNDS | 71 | ||||||
Table of Contents
STATEMENTS OF CHANGES IN NET ASSETS
FOR THE PERIODS INDICATED (continued)
(Amounts in thousands)
| U.S. Equity Fund | ||||||||
| Year Ended June 30, 2017 | Year Ended June 30, 2016 | |||||||
CAPITAL TRANSACTIONS: | ||||||||
Class A | ||||||||
Proceeds from shares issued | $ | 312,657 | $ | 469,469 | ||||
Distributions reinvested | 55,357 | 70,720 | ||||||
Cost of shares redeemed | (642,220 | ) | (397,193 | ) | ||||
|
|
|
| |||||
Change in net assets resulting from Class A capital transactions | $ | (274,206 | ) | $ | 142,996 | |||
|
|
|
| |||||
Class C | ||||||||
Proceeds from shares issued | $ | 72,492 | $ | 102,150 | ||||
Distributions reinvested | 11,726 | 13,355 | ||||||
Cost of shares redeemed | (103,605 | ) | (56,529 | ) | ||||
|
|
|
| |||||
Change in net assets resulting from Class C capital transactions | $ | (19,387 | ) | $ | 58,976 | |||
|
|
|
| |||||
Class I (formerly Select Class) | ||||||||
Proceeds from shares issued | $ | 400,093 | $ | 368,200 | ||||
Distributions reinvested | 44,148 | 57,766 | ||||||
Cost of shares redeemed | (376,782 | ) | (1,677,242 | ) | ||||
|
|
|
| |||||
Change in net assets resulting from Class I capital transactions | $ | 67,459 | $ | (1,251,276 | ) | |||
|
|
|
| |||||
Class L (formerly Institutional Class) | ||||||||
Proceeds from shares issued | $ | 711,757 | $ | 985,884 | ||||
Distributions reinvested | 128,744 | 243,871 | ||||||
Cost of shares redeemed | (1,626,435 | ) | (2,103,943 | ) | ||||
|
|
|
| |||||
Change in net assets resulting from Class L capital transactions | $ | (785,934 | ) | $ | (874,188 | ) | ||
|
|
|
| |||||
Class R2 | ||||||||
Proceeds from shares issued | $ | 74,181 | $ | 72,587 | ||||
Distributions reinvested | 8,162 | 9,669 | ||||||
Cost of shares redeemed | (57,260 | ) | (42,951 | ) | ||||
|
|
|
| |||||
Change in net assets resulting from Class R2 capital transactions | $ | 25,083 | $ | 39,305 | ||||
|
|
|
| |||||
Class R3 (a) | ||||||||
Proceeds from shares issued | $ | 25,371 | $ | — | ||||
Distributions reinvested | 52 | — | ||||||
Cost of shares redeemed | (546 | ) | — | |||||
|
|
|
| |||||
Change in net assets resulting from Class R3 capital transactions | $ | 24,877 | $ | — | ||||
|
|
|
| |||||
Class R4 (a) | ||||||||
Proceeds from shares issued | $ | 1,027 | $ | — | ||||
Distributions reinvested | 3 | — | ||||||
Cost of shares redeemed | — | (b) | — | |||||
|
|
|
| |||||
Change in net assets resulting from Class R4 capital transactions | $ | 1,030 | $ | — | ||||
|
|
|
| |||||
Class R5 | ||||||||
Proceeds from shares issued | $ | 135,617 | $ | 610,125 | ||||
Distributions reinvested | 36,284 | 48,938 | ||||||
Cost of shares redeemed | (313,018 | ) | (195,954 | ) | ||||
|
|
|
| |||||
Change in net assets resulting from Class R5 capital transactions | $ | (141,117 | ) | $ | 463,109 | |||
|
|
|
| |||||
Class R6 | ||||||||
Proceeds from shares issued | $ | 1,524,765 | $ | 2,370,357 | ||||
Distributions reinvested | 247,230 | 263,145 | ||||||
Cost of shares redeemed | (541,844 | ) | (553,912 | ) | ||||
|
|
|
| |||||
Change in net assets resulting from Class R6 capital transactions | $ | 1,230,151 | $ | 2,079,590 | ||||
|
|
|
| |||||
Total change in net assets resulting from capital transactions | $ | 127,956 | $ | 658,512 | ||||
|
|
|
| |||||
| (a) | Commencement of offering of class of shares effective September 9, 2016. |
| (b) | Amount rounds to less than 500. |
SEE NOTES TO FINANCIAL STATEMENTS.
| 72 | J.P. MORGAN LARGE CAP FUNDS | JUNE 30, 2017 | ||||
Table of Contents
| U.S. Equity Fund | ||||||||
| Year Ended June 30, 2017 | Year Ended June 30, 2016 | |||||||
SHARE TRANSACTIONS: |
| |||||||
Class A |
| |||||||
Issued | 20,933 | 33,923 | ||||||
Reinvested | 3,752 | 5,214 | ||||||
Redeemed | (43,000 | ) | (28,824 | ) | ||||
|
|
|
| |||||
Change in Class A Shares | (18,315 | ) | 10,313 | |||||
|
|
|
| |||||
Class C |
| |||||||
Issued | 4,975 | 7,574 | ||||||
Reinvested | 820 | 1,010 | ||||||
Redeemed | (7,063 | ) | (4,215 | ) | ||||
|
|
|
| |||||
Change in Class C Shares | (1,268 | ) | 4,369 | |||||
|
|
|
| |||||
Class I (formerly Select Class) |
| |||||||
Issued | 26,126 | 26,575 | ||||||
Reinvested | 2,981 | 4,256 | ||||||
Redeemed | (25,112 | ) | (114,285 | ) | ||||
|
|
|
| |||||
Change in Class I Shares | 3,995 | (83,454 | ) | |||||
|
|
|
| |||||
Class L (formerly Institutional Class) |
| |||||||
Issued | 47,022 | 71,431 | ||||||
Reinvested | 8,680 | 17,924 | ||||||
Redeemed | (110,101 | ) | (154,416 | ) | ||||
|
|
|
| |||||
Change in Class L Shares | (54,399 | ) | (65,061 | ) | ||||
|
|
|
| |||||
Class R2 |
| |||||||
Issued | 4,921 | 5,242 | ||||||
Reinvested | 558 | 718 | ||||||
Redeemed | (3,877 | ) | (3,104 | ) | ||||
|
|
|
| |||||
Change in Class R2 Shares | 1,602 | 2,856 | ||||||
|
|
|
| |||||
Class R3 (a) |
| |||||||
Issued | 1,621 | — | ||||||
Reinvested | 3 | — | ||||||
Redeemed | (34 | ) | — | |||||
|
|
|
| |||||
Change in Class R3 Shares | 1,590 | — | ||||||
|
|
|
| |||||
Class R4 (a) |
| |||||||
Issued | 65 | — | ||||||
Reinvested | — | (b) | — | |||||
Redeemed | — | (b) | — | |||||
|
|
|
| |||||
Change in Class R4 Shares | 65 | — | ||||||
|
|
|
| |||||
Class R5 |
| |||||||
Issued | 9,015 | 42,836 | ||||||
Reinvested | 2,445 | 3,593 | ||||||
Redeemed | (21,230 | ) | (14,029 | ) | ||||
|
|
|
| |||||
Change in Class R5 Shares | (9,770 | ) | 32,400 | |||||
|
|
|
| |||||
Class R6 |
| |||||||
Issued | 100,747 | 164,015 | ||||||
Reinvested | 16,605 | 19,299 | ||||||
Redeemed | (36,062 | ) | (40,193 | ) | ||||
|
|
|
| |||||
Change in Class R6 Shares | 81,290 | 143,121 | ||||||
|
|
|
| |||||
| (a) | Commencement of offering of class of shares effective September 9, 2016. |
| (b) | Amount rounds to less than 500. |
SEE NOTES TO FINANCIAL STATEMENTS.
| JUNE 30, 2017 | J.P. MORGAN LARGE CAP FUNDS | 73 | ||||||
Table of Contents
FOR THE PERIODS INDICATED
| Per share operating performance |
| |||||||||||||||||||||||||||||||
| Investment operations | Distributions | |||||||||||||||||||||||||||||||
| Net asset value, beginning of period | Net investment income (loss) (a) | Net realized and unrealized gains (losses) on investments | Total from investment operations | Net investment income | Net realized gain | Return of Capital | Total distributions | |||||||||||||||||||||||||
Disciplined Equity Fund | ||||||||||||||||||||||||||||||||
Class A | ||||||||||||||||||||||||||||||||
Year Ended June 30, 2017 | $ | 21.74 | $ | 0.28 | $ | 3.72 | $ | 4.00 | $ | (0.32 | ) | $ | — | $ | (0.02 | ) | $ | (0.34 | ) | |||||||||||||
Year Ended June 30, 2016 | 23.99 | 0.26 | (1.32 | ) | (1.06 | ) | (0.22 | ) | (0.97 | ) | — | (1.19 | ) | |||||||||||||||||||
Year Ended June 30, 2015 | 23.73 | 0.20 | 1.85 | 2.05 | (0.19 | ) | (1.60 | ) | — | (1.79 | ) | |||||||||||||||||||||
Year Ended June 30, 2014 | 20.27 | 0.23 | 4.79 | 5.02 | (0.21 | ) | (1.35 | ) | — | (1.56 | ) | |||||||||||||||||||||
Year Ended June 30, 2013 | 17.42 | 0.20 | 3.56 | 3.76 | (0.23 | ) | (0.68 | ) | — | (0.91 | ) | |||||||||||||||||||||
Class I (formerly Select Class) | ||||||||||||||||||||||||||||||||
Year Ended June 30, 2017 | 21.92 | 0.35 | 3.76 | 4.11 | (0.39 | ) | — | (0.02 | ) | (0.41 | ) | |||||||||||||||||||||
Year Ended June 30, 2016 | 24.18 | 0.32 | (1.34 | ) | (1.02 | ) | (0.27 | ) | (0.97 | ) | — | (1.24 | ) | |||||||||||||||||||
Year Ended June 30, 2015 | 23.88 | 0.26 | 1.87 | 2.13 | (0.23 | ) | (1.60 | ) | — | (1.83 | ) | |||||||||||||||||||||
Year Ended June 30, 2014 | 20.39 | 0.28 | 4.82 | 5.10 | (0.26 | ) | (1.35 | ) | — | (1.61 | ) | |||||||||||||||||||||
Year Ended June 30, 2013 | 17.51 | 0.27 | 3.56 | 3.83 | (0.27 | ) | (0.68 | ) | — | (0.95 | ) | |||||||||||||||||||||
Class L (formerly Institutional Class) |
| |||||||||||||||||||||||||||||||
Year Ended June 30, 2017 | 21.89 | 0.35 | 3.75 | 4.10 | (0.39 | ) | — | (0.02 | ) | (0.41 | ) | |||||||||||||||||||||
Year Ended June 30, 2016 | 24.15 | 0.35 | (1.33 | ) | (0.98 | ) | (0.31 | ) | (0.97 | ) | — | (1.28 | ) | |||||||||||||||||||
Year Ended June 30, 2015 | 23.85 | 0.29 | 1.89 | 2.18 | (0.28 | ) | (1.60 | ) | — | (1.88 | ) | |||||||||||||||||||||
Year Ended June 30, 2014 | 20.36 | 0.32 | 4.81 | 5.13 | (0.29 | ) | (1.35 | ) | — | (1.64 | ) | |||||||||||||||||||||
Year Ended June 30, 2013 | 17.48 | 0.30 | 3.55 | 3.85 | (0.29 | ) | (0.68 | ) | — | (0.97 | ) | |||||||||||||||||||||
Class R6 | ||||||||||||||||||||||||||||||||
Year Ended June 30, 2017 | 21.90 | 0.38 | 3.75 | 4.13 | (0.42 | ) | — | (0.02 | ) | (0.44 | ) | |||||||||||||||||||||
Year Ended June 30, 2016 | 24.16 | 0.37 | (1.33 | ) | (0.96 | ) | (0.33 | ) | (0.97 | ) | — | (1.30 | ) | |||||||||||||||||||
Year Ended June 30, 2015 | 23.85 | 0.32 | 1.89 | 2.21 | (0.30 | ) | (1.60 | ) | — | (1.90 | ) | |||||||||||||||||||||
Year Ended June 30, 2014 | 20.36 | 0.34 | 4.81 | 5.15 | (0.31 | ) | (1.35 | ) | — | (1.66 | ) | |||||||||||||||||||||
Year Ended June 30, 2013 | 17.48 | 0.32 | 3.55 | 3.87 | (0.31 | ) | (0.68 | ) | — | (0.99 | ) | |||||||||||||||||||||
| (a) | Calculated based upon average shares outstanding. |
| (b) | Includes adjustments in accordance with accounting principles generally accepted in the United States of America and as such, the net asset values for financial reporting purposes and the returns based upon those net asset values may differ from the net asset values and returns for shareholder transactions. |
| (c) | Includes earnings credits and interest expense, if applicable, each of which is less than 0.005% unless otherwise noted. |
SEE NOTES TO FINANCIAL STATEMENTS.
| 74 | J.P. MORGAN LARGE CAP FUNDS | JUNE 30, 2017 | ||||
Table of Contents
| Ratios/Supplemental data | |||||||||||||||||||||||||
| Ratios to average net assets | ||||||||||||||||||||||||||
| Net asset value, end of period | Total return (excludes sales charge) (b) | Net assets, end of period (000’s) | Net expenses (c) | Net investment income (loss) | Expenses without waivers, reimbursements and earnings credits | Portfolio turnover rate | ||||||||||||||||||||
| $ | 25.40 | 18.52 | % | $ | 422,719 | 0.69 | % | 1.19 | % | 0.96 | % | 40 | % | |||||||||||||
| 21.74 | (4.30 | ) | 497,934 | 0.85 | 1.20 | 1.02 | 122 | |||||||||||||||||||
| 23.99 | 9.04 | 483,296 | 0.85 | 0.84 | 0.97 | 144 | ||||||||||||||||||||
| 23.73 | 25.73 | 206,635 | 0.85 | 1.02 | 0.86 | 113 | ||||||||||||||||||||
| 20.27 | 22.33 | 103,755 | 0.85 | 1.04 | 0.87 | 178 | ||||||||||||||||||||
| 25.62 | 18.85 | 285,141 | 0.43 | 1.45 | 0.69 | 40 | ||||||||||||||||||||
| 21.92 | (4.08 | ) | 260,494 | 0.60 | 1.45 | 0.69 | 122 | |||||||||||||||||||
| 24.18 | 9.34 | 260,618 | 0.60 | 1.09 | 0.64 | 144 | ||||||||||||||||||||
| 23.88 | 26.00 | 82,899 | 0.59 | 1.28 | 0.61 | 113 | ||||||||||||||||||||
| 20.39 | 22.61 | 40,522 | 0.60 | 1.40 | 0.62 | 178 | ||||||||||||||||||||
| 25.58 | 18.86 | 835,535 | 0.40 | 1.47 | 0.49 | 40 | ||||||||||||||||||||
| 21.89 | (3.94 | ) | 824,559 | 0.45 | 1.59 | 0.50 | 122 | |||||||||||||||||||
| 24.15 | 9.53 | 796,919 | 0.45 | 1.21 | 0.51 | 144 | ||||||||||||||||||||
| 23.85 | 26.20 | 389,507 | 0.45 | 1.42 | 0.46 | 113 | ||||||||||||||||||||
| 20.36 | 22.79 | 221,638 | 0.45 | 1.57 | 0.47 | 178 | ||||||||||||||||||||
| 25.59 | 19.00 | 5,863,138 | 0.28 | 1.60 | 0.34 | 40 | ||||||||||||||||||||
| 21.90 | (3.83 | ) | 6,638,591 | 0.34 | 1.69 | 0.35 | 122 | |||||||||||||||||||
| 24.16 | 9.67 | 6,205,582 | 0.35 | 1.33 | 0.36 | 144 | ||||||||||||||||||||
| 23.85 | 26.31 | 3,598,945 | 0.35 | 1.52 | 0.36 | 113 | ||||||||||||||||||||
| 20.36 | 22.90 | 1,460,937 | 0.35 | 1.67 | 0.37 | 178 | ||||||||||||||||||||
SEE NOTES TO FINANCIAL STATEMENTS.
| JUNE 30, 2017 | J.P. MORGAN LARGE CAP FUNDS | 75 | ||||||
Table of Contents
FINANCIAL HIGHLIGHTS
FOR THE PERIODS INDICATED (continued)
| Per share operating performance | ||||||||||||||||||||
| Investment operations | Distributions | |||||||||||||||||||
| Net asset value, beginning of period | Net investment income (loss) (a) | Net realized and unrealized gains (losses) on investments | Total from investment operations | Net realized gain | ||||||||||||||||
Dynamic Growth Fund | ||||||||||||||||||||
Class A | ||||||||||||||||||||
Year Ended June 30, 2017 | $ | 24.13 | $ | (0.05 | ) | $ | 7.32 | $ | 7.27 | $ | (0.32 | ) | ||||||||
Year Ended June 30, 2016 | 25.34 | (0.12 | ) | (0.82 | ) | (0.94 | ) | (0.27 | ) | |||||||||||
Year Ended June 30, 2015 | 23.95 | (0.14 | ) | 1.90 | 1.76 | (0.37 | ) | |||||||||||||
Year Ended June 30, 2014 | 18.94 | (0.07 | )(d)(e) | 5.08 | 5.01 | — | ||||||||||||||
Year Ended June 30, 2013 | 15.89 | (0.05 | )(f) | 3.10 | 3.05 | — | ||||||||||||||
Class C | ||||||||||||||||||||
Year Ended June 30, 2017 | 23.10 | (0.19 | ) | 7.00 | 6.81 | (0.32 | ) | |||||||||||||
Year Ended June 30, 2016 | 24.39 | (0.24 | ) | (0.78 | ) | (1.02 | ) | (0.27 | ) | |||||||||||
Year Ended June 30, 2015 | 23.19 | (0.26 | ) | 1.83 | 1.57 | (0.37 | ) | |||||||||||||
Year Ended June 30, 2014 | 18.43 | (0.20 | )(d)(e) | 4.96 | 4.76 | — | ||||||||||||||
Year Ended June 30, 2013 | 15.54 | (0.14 | )(f) | 3.03 | 2.89 | — | ||||||||||||||
Class I (formerly Select Class) | ||||||||||||||||||||
Year Ended June 30, 2017 | 24.66 | 0.02 | 7.50 | 7.52 | (0.32 | ) | ||||||||||||||
Year Ended June 30, 2016 | 25.83 | (0.10 | ) | (0.80 | ) | (0.90 | ) | (0.27 | ) | |||||||||||
Year Ended June 30, 2015 | 24.34 | (0.08 | ) | 1.94 | 1.86 | (0.37 | ) | |||||||||||||
Year Ended June 30, 2014 | 19.20 | (0.08 | )(d)(e) | 5.22 | 5.14 | — | ||||||||||||||
Year Ended June 30, 2013 | 16.07 | (0.03 | )(f) | 3.16 | 3.13 | — | ||||||||||||||
Class R5 | ||||||||||||||||||||
Year Ended June 30, 2017 | 25.09 | 0.07 | 7.64 | 7.71 | (0.32 | ) | ||||||||||||||
Year Ended June 30, 2016 | 26.22 | 0.01 | (0.87 | ) | (0.86 | ) | (0.27 | ) | ||||||||||||
Year Ended June 30, 2015 | 24.65 | (0.04 | ) | 1.98 | 1.94 | (0.37 | ) | |||||||||||||
Year Ended June 30, 2014 | 19.42 | (0.04 | )(d)(e) | 5.27 | 5.23 | — | ||||||||||||||
Year Ended June 30, 2013 | 16.22 | 0.03 | (f) | 3.17 | 3.20 | — | ||||||||||||||
| (a) | Calculated based upon average shares outstanding. |
| (b) | Includes adjustments in accordance with accounting principles generally accepted in the United States of America and as such, the net asset values for financial reporting purposes and the returns based upon those net asset values may differ from the net asset values and returns for shareholder transactions. |
| (c) | Includes earnings credits and interest expense, if applicable, each of which is less than 0.005% unless otherwise noted. |
| (d) | Reflects special dividends paid out during the period by several of the Fund’s holdings. Had the Fund not received the special dividends, the net investment income (loss) per share would have been $(0.08), $(0.21), $(0.09) and $(0.05) for Class A, Class C, Class I and Class R5 Shares, respectively, and the net investment income (loss) ratio would have been (0.35)%, (0.92)%, (0.40)% and (0.23)% for Class A, Class C, Class I and Class R5 shares, respectively. These amounts have been revised to correct a calculation error in the previously issued June 30, 2014 financial highlights’ footnote disclosure. These revisions are not considered material to the previously issued financial statements. |
| (e) | Net investment income (loss) may appear disproportionate among classes due to the timing of recognition of income and changes in the relative size of the classes. |
| (f) | Reflects special dividends paid out during the period by several of the Fund’s holdings. Had the Fund not received the special dividends, the net investment income (loss) per share would have been $(0.10), $(0.19), $(0.08) and $(0.03) for Class A, Class C, Class I and Class R5 Shares, respectively, and the net investment income (loss) ratio would have been (0.60)%, (1.10)%, (0.45)% and (0.15)% for Class A, Class C, Class I and Class R5 Shares, respectively. |
SEE NOTES TO FINANCIAL STATEMENTS.
| 76 | J.P. MORGAN LARGE CAP FUNDS | JUNE 30, 2017 | ||||
Table of Contents
| Ratios/Supplemental data | |||||||||||||||||||||||||
| Ratios to average net assets | ||||||||||||||||||||||||||
| Net asset value, end of period | Total return (excludes sales charge) (b) | Net assets, end of period (000’s) | Net expenses (c) | Net investment income (loss) | Expenses without waivers, reimbursements and earnings credits | Portfolio turnover rate | ||||||||||||||||||||
| $ | 31.08 | 30.39 | % | $ | 57,378 | 1.16 | % | (0.20 | )% | 1.38 | % | 40 | % | |||||||||||||
| 24.13 | (3.77 | ) | 53,334 | 1.19 | (0.50 | ) | 1.43 | 61 | ||||||||||||||||||
| 25.34 | 7.46 | 39,153 | 1.20 | (0.57 | ) | 1.43 | 74 | |||||||||||||||||||
| 23.95 | 26.45 | 16,996 | 1.24 | (0.30 | )(d)(e) | 1.25 | 55 | |||||||||||||||||||
| 18.94 | 19.19 | 126 | 1.25 | (0.30 | )(f) | 1.42 | 82 | |||||||||||||||||||
| 29.59 | 29.75 | 13,532 | 1.66 | (0.71 | ) | 1.83 | 40 | |||||||||||||||||||
| 23.10 | (4.24 | ) | 12,077 | 1.69 | (0.99 | ) | 1.86 | 61 | ||||||||||||||||||
| 24.39 | 6.88 | 8,894 | 1.71 | (1.08 | ) | 1.88 | 74 | |||||||||||||||||||
| 23.19 | 25.83 | 4,416 | 1.74 | (0.86 | )(d)(e) | 1.75 | 55 | |||||||||||||||||||
| 18.43 | 18.60 | 123 | 1.74 | (0.80 | )(f) | 1.92 | 82 | |||||||||||||||||||
| 31.86 | 30.75 | 60,616 | 0.91 | 0.07 | 1.05 | 40 | ||||||||||||||||||||
| 24.66 | (3.54 | ) | 37,396 | 0.94 | (0.37 | ) | 1.00 | 61 | ||||||||||||||||||
| 25.83 | 7.76 | 289,100 | 0.96 | (0.34 | ) | 1.01 | 74 | |||||||||||||||||||
| 24.34 | 26.77 | 261,308 | 1.00 | (0.35 | )(d)(e) | 1.04 | 55 | |||||||||||||||||||
| 19.20 | 19.48 | 101,999 | 1.00 | (0.16 | )(f) | 1.14 | 82 | |||||||||||||||||||
| 32.48 | 30.99 | 189,951 | 0.71 | 0.25 | 0.81 | 40 | ||||||||||||||||||||
| 25.09 | (3.33 | ) | 226,600 | 0.74 | 0.03 | 0.79 | 61 | |||||||||||||||||||
| 26.22 | 7.99 | 49 | 0.76 | (0.14 | ) | 0.90 | 74 | |||||||||||||||||||
| 24.65 | 26.93 | 45 | 0.80 | (0.17 | )(d)(e) | 0.84 | 55 | |||||||||||||||||||
| 19.42 | 19.73 | 32 | 0.80 | 0.15 | (f) | 0.97 | 82 | |||||||||||||||||||
SEE NOTES TO FINANCIAL STATEMENTS.
| JUNE 30, 2017 | J.P. MORGAN LARGE CAP FUNDS | 77 | ||||||
Table of Contents
FINANCIAL HIGHLIGHTS
FOR THE PERIODS INDICATED (continued)
| Per share operating performance | |||||||||||||||||||||||||||
| Investment operations | Distributions | |||||||||||||||||||||||||||
| Net asset value, beginning of period | Net investment income (loss) | Net realized and unrealized gains (losses) on investments | Total from investment operations | Net investment income | Net realized gain | Total distributions | ||||||||||||||||||||||
Equity Focus Fund | ||||||||||||||||||||||||||||
Class A | ||||||||||||||||||||||||||||
Year Ended June 30, 2017 | $ | 23.73 | $ | (0.01 | )(c) | $ | 5.70 | $ | 5.69 | $ | (0.01 | ) | $ | (0.32 | ) | $ | (0.33 | ) | ||||||||||
Year Ended June 30, 2016 | 24.78 | (0.01 | )(c) | (0.38 | )(d) | (0.39 | ) | — | (e) | (0.66 | ) | (0.66 | ) | |||||||||||||||
Year Ended June 30, 2015 | 23.56 | (0.02 | )(c) | 1.42 | 1.40 | (0.02 | ) | (0.16 | ) | (0.18 | ) | |||||||||||||||||
Year Ended June 30, 2014 | 19.18 | (0.02 | )(c) | 4.86 | 4.84 | — | (0.46 | ) | (0.46 | ) | ||||||||||||||||||
Year Ended June 30, 2013 | 15.79 | (0.02 | ) | 3.41 | 3.39 | — | — | — | ||||||||||||||||||||
Class C | ||||||||||||||||||||||||||||
Year Ended June 30, 2017 | 23.18 | (0.14 | )(c) | 5.56 | 5.42 | — | (0.32 | ) | (0.32 | ) | ||||||||||||||||||
Year Ended June 30, 2016 | 24.34 | (0.13 | )(c) | (0.37 | )(d) | (0.50 | ) | — | (0.66 | ) | (0.66 | ) | ||||||||||||||||
Year Ended June 30, 2015 | 23.24 | (0.13 | )(c) | 1.39 | 1.26 | — | (0.16 | ) | (0.16 | ) | ||||||||||||||||||
Year Ended June 30, 2014 | 19.01 | (0.15 | )(c) | 4.84 | 4.69 | — | (0.46 | ) | (0.46 | ) | ||||||||||||||||||
Year Ended June 30, 2013 | 15.73 | (0.11 | ) | 3.39 | 3.28 | — | — | — | ||||||||||||||||||||
Class I (formerly Select Class) | ||||||||||||||||||||||||||||
Year Ended June 30, 2017 | 23.92 | 0.06 | (c) | 5.75 | 5.81 | (0.07 | ) | (0.32 | ) | (0.39 | ) | |||||||||||||||||
Year Ended June 30, 2016 | 24.95 | 0.06 | (c) | (0.39 | )(d) | (0.33 | ) | (0.04 | ) | (0.66 | ) | (0.70 | ) | |||||||||||||||
Year Ended June 30, 2015 | 23.67 | 0.04 | (c) | 1.44 | 1.48 | (0.04 | ) | (0.16 | ) | (0.20 | ) | |||||||||||||||||
Year Ended June 30, 2014 | 19.22 | 0.04 | (c) | 4.87 | 4.91 | — | (e) | (0.46 | ) | (0.46 | ) | |||||||||||||||||
Year Ended June 30, 2013 | 15.81 | 0.02 | 3.42 | 3.44 | (0.03 | ) | — | (0.03 | ) | |||||||||||||||||||
| (a) | Includes adjustments in accordance with accounting principles generally accepted in the United States of America and as such, the net asset values for financial reporting purposes and the returns based upon those net asset values may differ from the net asset values and returns for shareholder transactions. |
| (b) | Includes earnings credits and interest expense, if applicable, each of which is less than 0.005% unless otherwise noted. |
| (c) | Calculated based upon average shares outstanding. |
| (d) | Calculation of the net realized and unrealized gains (losses) per share do not correlate with the Fund’s net realized and unrealized gains (losses) presented on the Statement of Changes in Net Assets due to the timing of capital transactions in relation to the fluctuating market values of the Fund’s investments. |
| (e) | Amount rounds to less than $0.005. |
| (f) | Certain non-recurring expenses incurred by the Fund were not annualized for the year ended June 30, 2013. |
SEE NOTES TO FINANCIAL STATEMENTS.
| 78 | J.P. MORGAN LARGE CAP FUNDS | JUNE 30, 2017 | ||||
Table of Contents
| Ratios/Supplemental data | |||||||||||||||||||||||||
| Ratios to average net assets | ||||||||||||||||||||||||||
| Net asset value, end of period | Total return (excludes sales charge) (a) | Net assets, end of period (000’s) | Net expenses (b) | Net investment income (loss) | Expenses without waivers, reimbursements and earnings credits | Portfolio turnover rate | ||||||||||||||||||||
| $ | 29.09 | 24.09 | % | $ | 3,362 | 1.17 | % | (0.02 | )% | 1.37 | % | 84 | % | |||||||||||||
| 23.73 | (1.60 | ) | 1,937 | 1.24 | (0.03 | ) | 1.55 | 45 | ||||||||||||||||||
| 24.78 | 5.98 | 1,452 | 1.24 | (0.07 | ) | 1.42 | 52 | |||||||||||||||||||
| 23.56 | 25.43 | 423 | 1.24 | (0.10 | ) | 2.11 | 76 | |||||||||||||||||||
| 19.18 | 21.47 | 64 | 1.25 | (f) | (0.13 | )(f) | 3.75 | (f) | 61 | |||||||||||||||||
| 28.28 | 23.49 | 3,331 | 1.66 | (0.51 | ) | 1.86 | 84 | |||||||||||||||||||
| 23.18 | (2.10 | ) | 1,268 | 1.74 | (0.54 | ) | 1.96 | 45 | ||||||||||||||||||
| 24.34 | 5.44 | 873 | 1.74 | (0.54 | ) | 1.93 | 52 | |||||||||||||||||||
| 23.24 | 24.86 | 133 | 1.74 | (0.67 | ) | 2.82 | 76 | |||||||||||||||||||
| 19.01 | 20.85 | 63 | 1.75 | (f) | (0.63 | )(f) | 4.25 | (f) | 61 | |||||||||||||||||
| 29.34 | 24.43 | 180,151 | 0.92 | 0.23 | 1.10 | 84 | ||||||||||||||||||||
| 23.92 | (1.37 | ) | 136,284 | 0.99 | 0.24 | 1.11 | 45 | |||||||||||||||||||
| 24.95 | 6.26 | 81,179 | 0.99 | 0.15 | 1.12 | 52 | ||||||||||||||||||||
| 23.67 | 25.75 | 72,064 | 0.99 | 0.19 | 1.51 | 76 | ||||||||||||||||||||
| 19.22 | 21.77 | 3,730 | 1.00 | (f) | 0.12 | (f) | 3.51 | (f) | 61 | |||||||||||||||||
SEE NOTES TO FINANCIAL STATEMENTS.
| JUNE 30, 2017 | J.P. MORGAN LARGE CAP FUNDS | 79 | ||||||
Table of Contents
FINANCIAL HIGHLIGHTS
FOR THE PERIODS INDICATED (continued)
| Per share operating performance | ||||||||||||||||||||||||||||
| Investment operations | Distributions | |||||||||||||||||||||||||||
| Net asset value, beginning of period | Net investment income (loss) | Net realized and unrealized gains (losses) on investments | Total from investment operations | Net investment income | Net realized gain | Total distributions | ||||||||||||||||||||||
Equity Income Fund | ||||||||||||||||||||||||||||
Class A | ||||||||||||||||||||||||||||
Year Ended June 30, 2017 | $ | 14.01 | $ | 0.24 | (e) | $ | 1.75 | $ | 1.99 | $ | (0.24 | ) | $ | (0.09 | ) | $ | (0.33 | ) | ||||||||||
Year Ended June 30, 2016 | 13.77 | 0.25 | (e) | 0.35 | 0.60 | (0.25 | ) | (0.11 | ) | (0.36 | ) | |||||||||||||||||
Year Ended June 30, 2015 | 13.66 | 0.25 | 0.39 | 0.64 | (0.25 | ) | (0.28 | ) | (0.53 | ) | ||||||||||||||||||
Year Ended June 30, 2014 | 11.62 | 0.21 | (e) | 2.26 | 2.47 | (0.21 | ) | (0.22 | ) | (0.43 | ) | |||||||||||||||||
Year Ended June 30, 2013 | 9.84 | 0.24 | (e)(f) | 1.84 | 2.08 | (0.23 | ) | (0.07 | ) | (0.30 | ) | |||||||||||||||||
Class C | ||||||||||||||||||||||||||||
Year Ended June 30, 2017 | 13.80 | 0.16 | (e) | 1.72 | 1.88 | (0.18 | ) | (0.09 | ) | (0.27 | ) | |||||||||||||||||
Year Ended June 30, 2016 | 13.58 | 0.18 | (e) | 0.35 | 0.53 | (0.20 | ) | (0.11 | ) | (0.31 | ) | |||||||||||||||||
Year Ended June 30, 2015 | 13.49 | 0.18 | 0.38 | 0.56 | (0.19 | ) | (0.28 | ) | (0.47 | ) | ||||||||||||||||||
Year Ended June 30, 2014 | 11.49 | 0.15 | (e) | 2.23 | 2.38 | (0.16 | ) | (0.22 | ) | (0.38 | ) | |||||||||||||||||
Year Ended June 30, 2013 | 9.74 | 0.18 | (e)(f) | 1.83 | 2.01 | (0.19 | ) | (0.07 | ) | (0.26 | ) | |||||||||||||||||
Class I (formerly Select Class) | ||||||||||||||||||||||||||||
Year Ended June 30, 2017 | 14.23 | 0.28 | (e) | 1.77 | 2.05 | (0.27 | ) | (0.09 | ) | (0.36 | ) | |||||||||||||||||
Year Ended June 30, 2016 | 13.97 | 0.28 | (e) | 0.37 | 0.65 | (0.28 | ) | (0.11 | ) | (0.39 | ) | |||||||||||||||||
Year Ended June 30, 2015 | 13.85 | 0.29 | 0.40 | 0.69 | (0.29 | ) | (0.28 | ) | (0.57 | ) | ||||||||||||||||||
Year Ended June 30, 2014 | 11.77 | 0.25 | (e) | 2.29 | 2.54 | (0.24 | ) | (0.22 | ) | (0.46 | ) | |||||||||||||||||
Year Ended June 30, 2013 | 9.96 | 0.27 | (e)(f) | 1.86 | 2.13 | (0.25 | ) | (0.07 | ) | (0.32 | ) | |||||||||||||||||
Class R2 | ||||||||||||||||||||||||||||
Year Ended June 30, 2017 | 13.97 | 0.20 | (e) | 1.75 | 1.95 | (0.21 | ) | (0.09 | ) | (0.30 | ) | |||||||||||||||||
Year Ended June 30, 2016 | 13.74 | 0.21 | (e) | 0.35 | 0.56 | (0.22 | ) | (0.11 | ) | (0.33 | ) | |||||||||||||||||
Year Ended June 30, 2015 | 13.64 | 0.22 | 0.39 | 0.61 | (0.23 | ) | (0.28 | ) | (0.51 | ) | ||||||||||||||||||
Year Ended June 30, 2014 | 11.61 | 0.18 | (e) | 2.25 | 2.43 | (0.18 | ) | (0.22 | ) | (0.40 | ) | |||||||||||||||||
Year Ended June 30, 2013 | 9.84 | 0.21 | (e)(f) | 1.84 | 2.05 | (0.21 | ) | (0.07 | ) | (0.28 | ) | |||||||||||||||||
Class R3 | ||||||||||||||||||||||||||||
September 9, 2016 (g) through June 30, 2017 | 14.06 | 0.19 | (e) | 1.71 | 1.90 | (0.21 | ) | (0.09 | ) | (0.30 | ) | |||||||||||||||||
Class R4 | ||||||||||||||||||||||||||||
September 9, 2016 (g) through June 30, 2017 | 14.28 | 0.29 | (e) | 1.67 | 1.96 | (0.23 | ) | (0.09 | ) | (0.32 | ) | |||||||||||||||||
Class R5 | ||||||||||||||||||||||||||||
Year Ended June 30, 2017 | 14.23 | 0.31 | (e) | 1.78 | 2.09 | (0.30 | ) | (0.09 | ) | (0.39 | ) | |||||||||||||||||
Year Ended June 30, 2016 | 13.98 | 0.31 | (e) | 0.35 | 0.66 | (0.30 | ) | (0.11 | ) | (0.41 | ) | |||||||||||||||||
Year Ended June 30, 2015 | 13.85 | 0.31 | 0.41 | 0.72 | (0.31 | ) | (0.28 | ) | (0.59 | ) | ||||||||||||||||||
Year Ended June 30, 2014 | 11.78 | 0.27 | (e) | 2.29 | 2.56 | (0.27 | ) | (0.22 | ) | (0.49 | ) | |||||||||||||||||
Year Ended June 30, 2013 | 9.96 | 0.29 | (e)(f) | 1.87 | 2.16 | (0.27 | ) | (0.07 | ) | (0.34 | ) | |||||||||||||||||
Class R6 | ||||||||||||||||||||||||||||
Year Ended June 30, 2017 | 14.22 | 0.32 | (e) | 1.78 | 2.10 | (0.31 | ) | (0.09 | ) | (0.40 | ) | |||||||||||||||||
Year Ended June 30, 2016 | 13.97 | 0.33 | (e) | 0.34 | 0.67 | (0.31 | ) | (0.11 | ) | (0.42 | ) | |||||||||||||||||
Year Ended June 30, 2015 | 13.84 | 0.33 | 0.40 | 0.73 | (0.32 | ) | (0.28 | ) | (0.60 | ) | ||||||||||||||||||
Year Ended June 30, 2014 | 11.77 | 0.28 | (e) | 2.28 | 2.56 | (0.27 | ) | (0.22 | ) | (0.49 | ) | |||||||||||||||||
Year Ended June 30, 2013 | 9.96 | 0.29 | (e)(f) | 1.87 | 2.16 | (0.28 | ) | (0.07 | ) | (0.35 | ) | |||||||||||||||||
| (a) | Annualized for periods less than one year, unless otherwise noted. |
| (b) | Not annualized for periods less than one year. |
| (c) | Includes adjustments in accordance with accounting principles generally accepted in the United States of America and as such, the net asset values for financial reporting purposes and the returns based upon those net asset values may differ from the net asset values and returns for shareholder transactions. |
| (d) | Includes earnings credits and interest expense, if applicable, each of which is less than 0.005% unless otherwise noted. |
| (e) | Calculated based upon average shares outstanding. |
| (f) | Reflects special dividends paid out during the period by several of the Fund’s holdings. Had the Fund not received the special dividends, the net investment income (loss) per share would have been $0.21, $0.16, $0.24, $0.18, $0.27 and $0.26 for Class A, Class C, Class I, Class R2, Class R5 and Class R6 Shares, respectively, and the net investment income (loss) ratio would have been 1.97%, 1.46%, 2.23%, 1.67%, 2.44% and 2.38% for Class A, Class C, Class I, Class R2, Class R5 and Class R6 Shares, respectively. |
| (g) | Commencement of offering of class of shares. |
SEE NOTES TO FINANCIAL STATEMENTS.
| 80 | J.P. MORGAN LARGE CAP FUNDS | JUNE 30, 2017 | ||||
Table of Contents
| Ratios/Supplemental data | |||||||||||||||||||||||||
| Ratios to average net assets (a) | ||||||||||||||||||||||||||
| Net asset value, end of period | Total return (excludes sales charge) (b)(c) | Net assets, end of period (000’s) | Net expenses (d) | Net investment income (loss) | Expenses without waivers, reimbursements and earnings credits | Portfolio turnover rate (b) | ||||||||||||||||||||
| $ | 15.67 | 14.34 | % | $ | 3,176,361 | 1.04 | % | 1.59 | % | 1.08 | % | 14 | % | |||||||||||||
| 14.01 | 4.45 | 3,370,383 | 1.04 | 1.83 | 1.11 | 20 | ||||||||||||||||||||
| 13.77 | 4.71 | 3,014,937 | 1.04 | 1.83 | 1.09 | 22 | ||||||||||||||||||||
| 13.66 | 21.60 | 2,360,750 | 1.04 | 1.68 | 1.06 | 20 | ||||||||||||||||||||
| 11.62 | 21.53 | 1,285,400 | 1.03 | 2.22 | (f) | 1.08 | 34 | |||||||||||||||||||
| 15.41 | 13.74 | 1,385,115 | 1.54 | 1.09 | 1.55 | 14 | ||||||||||||||||||||
| 13.80 | 4.01 | 1,304,007 | 1.54 | 1.33 | 1.58 | 20 | ||||||||||||||||||||
| 13.58 | 4.18 | 1,160,002 | 1.54 | 1.32 | 1.56 | 22 | ||||||||||||||||||||
| 13.49 | 20.95 | 805,494 | 1.54 | 1.19 | 1.56 | 20 | ||||||||||||||||||||
| 11.49 | 20.94 | 407,911 | 1.53 | 1.71 | (f) | 1.58 | 34 | |||||||||||||||||||
| 15.92 | 14.57 | 6,542,906 | 0.78 | 1.84 | 0.79 | 14 | ||||||||||||||||||||
| 14.23 | 4.75 | 4,679,200 | 0.79 | 2.07 | 0.81 | 20 | ||||||||||||||||||||
| 13.97 | 4.96 | 4,639,250 | 0.79 | 2.08 | 0.80 | 22 | ||||||||||||||||||||
| 13.85 | 21.94 | 3,467,542 | 0.79 | 1.92 | 0.81 | 20 | ||||||||||||||||||||
| 11.77 | 21.84 | 2,337,565 | 0.78 | 2.48 | (f) | 0.83 | 34 | |||||||||||||||||||
| 15.62 | 14.08 | 87,437 | 1.29 | 1.34 | 1.39 | 14 | ||||||||||||||||||||
| 13.97 | 4.20 | 77,230 | 1.29 | 1.59 | 1.45 | 20 | ||||||||||||||||||||
| 13.74 | 4.44 | 56,522 | 1.29 | 1.59 | 1.39 | 22 | ||||||||||||||||||||
| 13.64 | 21.27 | 28,733 | 1.29 | 1.44 | 1.31 | 20 | ||||||||||||||||||||
| 11.61 | 21.21 | 13,347 | 1.28 | 1.92 | (f) | 1.34 | 34 | |||||||||||||||||||
| 15.66 | 13.62 | 25,209 | 1.03 | 1.55 | 1.05 | 14 | ||||||||||||||||||||
| 15.92 | 13.85 | 1,340 | 0.78 | 2.28 | 0.83 | 14 | ||||||||||||||||||||
| 15.93 | 14.84 | 912,746 | 0.58 | 2.05 | 0.63 | 14 | ||||||||||||||||||||
| 14.23 | 4.89 | 722,424 | 0.59 | 2.28 | 0.64 | 20 | ||||||||||||||||||||
| 13.98 | 5.23 | 520,660 | 0.59 | 2.27 | 0.63 | 22 | ||||||||||||||||||||
| 13.85 | 22.06 | 307,700 | 0.59 | 2.11 | 0.61 | 20 | ||||||||||||||||||||
| 11.78 | 22.17 | 227,442 | 0.58 | 2.69 | (f) | 0.63 | 34 | |||||||||||||||||||
| 15.92 | 14.95 | 2,821,798 | 0.50 | 2.13 | 0.50 | 14 | ||||||||||||||||||||
| 14.22 | 4.98 | 1,913,077 | 0.50 | 2.43 | 0.50 | 20 | ||||||||||||||||||||
| 13.97 | 5.31 | 861,809 | 0.51 | 2.35 | 0.51 | 22 | ||||||||||||||||||||
| 13.84 | 22.14 | 551,378 | 0.54 | 2.20 | 0.56 | 20 | ||||||||||||||||||||
| 11.77 | 22.12 | 233,034 | 0.53 | 2.63 | (f) | 0.59 | 34 | |||||||||||||||||||
SEE NOTES TO FINANCIAL STATEMENTS.
| JUNE 30, 2017 | J.P. MORGAN LARGE CAP FUNDS | 81 | ||||||
Table of Contents
FINANCIAL HIGHLIGHTS
FOR THE PERIODS INDICATED (continued)
| Per share operating performance | ||||||||||||||||||||||||||||
| Investment operations | Distributions | |||||||||||||||||||||||||||
| Net asset value, beginning of period | Net investment income (loss) (b) | Net realized and unrealized gains (losses) on investments | Total from investment operations | Net investment income | Net realized gain | Total distributions | ||||||||||||||||||||||
Growth and Income Fund | ||||||||||||||||||||||||||||
Class A | ||||||||||||||||||||||||||||
Year Ended June 30, 2017 | $ | 42.75 | $ | 0.57 | $ | 6.31 | $ | 6.88 | $ | (0.57 | ) | $ | (2.21 | ) | $ | (2.78 | ) | |||||||||||
Year Ended June 30, 2016 | 45.46 | 0.59 | (0.27 | ) | 0.32 | (0.55 | ) | (2.48 | ) | (3.03 | ) | |||||||||||||||||
Year Ended June 30, 2015 | 44.70 | 0.59 | 1.72 | 2.31 | (0.56 | ) | (0.99 | ) | (1.55 | ) | ||||||||||||||||||
Year Ended June 30, 2014 | 36.53 | 0.47 | 8.17 | 8.64 | (0.47 | ) | — | (0.47 | ) | |||||||||||||||||||
Year Ended June 30, 2013 | 29.43 | 0.40 | 7.11 | 7.51 | (0.41 | ) | — | (0.41 | ) | |||||||||||||||||||
Class C | ||||||||||||||||||||||||||||
Year Ended June 30, 2017 | 39.07 | 0.31 | 5.76 | 6.07 | (0.39 | ) | (2.21 | ) | (2.60 | ) | ||||||||||||||||||
Year Ended June 30, 2016 | 41.83 | 0.35 | (0.25 | ) | 0.10 | (0.38 | ) | (2.48 | ) | (2.86 | ) | |||||||||||||||||
Year Ended June 30, 2015 | 41.31 | 0.32 | 1.59 | 1.91 | (0.40 | ) | (0.99 | ) | (1.39 | ) | ||||||||||||||||||
Year Ended June 30, 2014 | 33.83 | 0.25 | 7.55 | 7.80 | (0.32 | ) | — | (0.32 | ) | |||||||||||||||||||
Year Ended June 30, 2013 | 27.32 | 0.22 | 6.59 | 6.81 | (0.30 | ) | — | (0.30 | ) | |||||||||||||||||||
Class I (formerly Select Class) | ||||||||||||||||||||||||||||
Year Ended June 30, 2017 | 44.77 | 0.72 | 6.62 | 7.34 | (0.69 | ) | (2.21 | ) | (2.90 | ) | ||||||||||||||||||
Year Ended June 30, 2016 | 47.45 | 0.73 | (0.27 | ) | 0.46 | (0.66 | ) | (2.48 | ) | (3.14 | ) | |||||||||||||||||
Year Ended June 30, 2015 | 46.58 | 0.73 | 1.79 | 2.52 | (0.66 | ) | (0.99 | ) | (1.65 | ) | ||||||||||||||||||
Year Ended June 30, 2014 | 38.03 | 0.58 | 8.52 | 9.10 | (0.55 | ) | — | (0.55 | ) | |||||||||||||||||||
Year Ended June 30, 2013 | 30.63 | 0.51 | 7.40 | 7.91 | (0.51 | ) | — | (0.51 | ) | |||||||||||||||||||
Class R2 | ||||||||||||||||||||||||||||
Year Ended June 30, 2017 | 42.94 | 0.46 | 6.33 | 6.79 | (0.46 | ) | (2.21 | ) | (2.67 | ) | ||||||||||||||||||
November 2, 2015 (f) through June 30, 2016 | 45.92 | 0.40 | (0.70 | ) | (0.30 | ) | (0.20 | ) | (2.48 | ) | (2.68 | ) | ||||||||||||||||
Class R5 | ||||||||||||||||||||||||||||
Year Ended June 30, 2017 | 45.01 | 0.83 | 6.65 | 7.48 | (0.78 | ) | (2.21 | ) | (2.99 | ) | ||||||||||||||||||
November 2, 2015 (f) through June 30, 2016 | 47.95 | 0.62 | (0.73 | ) | (0.11 | ) | (0.35 | ) | (2.48 | ) | (2.83 | ) | ||||||||||||||||
Class R6 | ||||||||||||||||||||||||||||
Year Ended June 30, 2017 | 45.01 | 0.81 | 6.69 | 7.50 | (0.80 | ) | (2.21 | ) | (3.01 | ) | ||||||||||||||||||
November 2, 2015 (f) through June 30, 2016 | 47.95 | 0.63 | (0.72 | ) | (0.09 | ) | (0.37 | ) | (2.48 | ) | (2.85 | ) | ||||||||||||||||
| (a) | Annualized for periods less than one year, unless otherwise noted. |
| (b) | Calculated based upon average shares outstanding. |
| (c) | Not annualized for periods less than one year. |
| (d) | Includes adjustments in accordance with accounting principles generally accepted in the United States of America and as such, the net asset values for financial reporting purposes and the returns based upon those net asset values may differ from the net asset values and returns for shareholder transactions. |
| (e) | Includes earnings credits and interest expense, if applicable, each of which is less than 0.005% unless otherwise noted. |
| (f) | Commencement of offering of class of shares. |
SEE NOTES TO FINANCIAL STATEMENTS.
| 82 | J.P. MORGAN LARGE CAP FUNDS | JUNE 30, 2017 | ||||
Table of Contents
| Ratios/Supplemental data | |||||||||||||||||||||||||
| Ratios to average net assets (a) | ||||||||||||||||||||||||||
| Net asset value, end of period | Total return (excludes sales charge) (c)(d) | Net assets, end of period (000’s) | Net expenses (e) | Net investment income (loss) | Expenses without waivers, reimbursements and earnings credits | Portfolio turnover rate (c) | ||||||||||||||||||||
| $ | 46.85 | 16.34 | % | $ | 445,078 | 1.03 | % | 1.26 | % | 1.10 | % | 28 | % | |||||||||||||
| 42.75 | 1.02 | 422,151 | 1.06 | 1.38 | 1.13 | 39 | ||||||||||||||||||||
| 45.46 | 5.24 | 434,573 | 1.10 | 1.30 | 1.10 | 39 | ||||||||||||||||||||
| 44.70 | 23.74 | 419,465 | 1.13 | 1.16 | 1.15 | 42 | ||||||||||||||||||||
| 36.53 | 25.65 | 356,127 | 1.15 | 1.23 | 1.16 | 35 | ||||||||||||||||||||
| 42.54 | 15.76 | 28,290 | 1.53 | 0.76 | 1.59 | 28 | ||||||||||||||||||||
| 39.07 | 0.54 | 25,541 | 1.56 | 0.89 | 1.62 | 39 | ||||||||||||||||||||
| 41.83 | 4.68 | 24,647 | 1.62 | 0.77 | 1.63 | 39 | ||||||||||||||||||||
| 41.31 | 23.12 | 14,619 | 1.64 | 0.66 | 1.65 | 42 | ||||||||||||||||||||
| 33.83 | 25.02 | 7,769 | 1.65 | 0.72 | 1.65 | 35 | ||||||||||||||||||||
| 49.21 | 16.64 | 64,148 | 0.78 | 1.50 | 0.83 | 28 | ||||||||||||||||||||
| 44.77 | 1.28 | 40,068 | 0.81 | 1.64 | 0.86 | 39 | ||||||||||||||||||||
| 47.45 | 5.48 | 36,099 | 0.88 | 1.53 | 0.88 | 39 | ||||||||||||||||||||
| 46.58 | 24.05 | 27,124 | 0.89 | 1.39 | 0.90 | 42 | ||||||||||||||||||||
| 38.03 | 25.97 | 28,339 | 0.88 | 1.45 | 0.90 | 35 | ||||||||||||||||||||
| 47.06 | 16.04 | 23 | 1.28 | 1.01 | 2.06 | 28 | ||||||||||||||||||||
| 42.94 | (0.40 | ) | 20 | 1.28 | 1.44 | 3.72 | 39 | |||||||||||||||||||
| 49.50 | 16.88 | 37 | 0.59 | 1.72 | 1.23 | 28 | ||||||||||||||||||||
| 45.01 | 0.05 | 20 | 0.59 | 2.14 | 3.02 | 39 | ||||||||||||||||||||
| 49.50 | 16.94 | 2,129 | 0.53 | 1.66 | 0.55 | 28 | ||||||||||||||||||||
| 45.01 | 0.08 | 20 | 0.53 | 2.19 | 2.96 | 39 | ||||||||||||||||||||
SEE NOTES TO FINANCIAL STATEMENTS.
| JUNE 30, 2017 | J.P. MORGAN LARGE CAP FUNDS | 83 | ||||||
Table of Contents
FINANCIAL HIGHLIGHTS
FOR THE PERIODS INDICATED (continued)
| Per share operating performance | ||||||||||||||||||||||||||||
| Investment operations | Distributions | |||||||||||||||||||||||||||
| Net asset value, beginning of period | Net investment income (loss) | Net realized and unrealized gains (losses) on investments | Total from investment operations | Net investment income | Return of capital | Total distributions | ||||||||||||||||||||||
Hedged Equity Fund | ||||||||||||||||||||||||||||
Class A | ||||||||||||||||||||||||||||
Year Ended June 30, 2017 | $ | 16.23 | $ | 0.19 | (e) | $ | 2.01 | $ | 2.20 | $ | (0.19 | ) | $ | — | $ | (0.19 | ) | |||||||||||
Year Ended June 30, 2016 | 16.47 | 0.20 | (e) | (0.28 | ) | (0.08 | ) | (0.16 | ) | — | (0.16 | ) | ||||||||||||||||
Year Ended June 30, 2015 | 15.74 | 0.19 | (e) | 0.67 | 0.86 | (0.13 | ) | — | (0.13 | ) | ||||||||||||||||||
December 13, 2013 (g) through June 30, 2014 | 15.00 | 0.07 | 0.84 | 0.91 | (0.07 | ) | (0.10 | ) | (0.17 | ) | ||||||||||||||||||
Class C | ||||||||||||||||||||||||||||
Year Ended June 30, 2017 | 16.17 | 0.10 | (e) | 2.01 | 2.11 | (0.12 | ) | — | (0.12 | ) | ||||||||||||||||||
Year Ended June 30, 2016 | 16.43 | 0.13 | (e) | (0.29 | ) | (0.16 | ) | (0.10 | ) | — | (0.10 | ) | ||||||||||||||||
Year Ended June 30, 2015 | 15.76 | 0.10 | (e) | 0.67 | 0.77 | (0.10 | ) | — | (0.10 | ) | ||||||||||||||||||
December 13, 2013 (g) through June 30, 2014 | 15.00 | 0.05 | 0.83 | 0.88 | (0.02 | ) | (0.10 | ) | (0.12 | ) | ||||||||||||||||||
Class I (formerly Select Class) | ||||||||||||||||||||||||||||
Year Ended June 30, 2017 | 16.26 | 0.23 | (e) | 2.01 | 2.24 | (0.23 | ) | — | (0.23 | ) | ||||||||||||||||||
Year Ended June 30, 2016 | 16.50 | 0.25 | (e) | (0.28 | ) | (0.03 | ) | (0.21 | ) | — | (0.21 | ) | ||||||||||||||||
Year Ended June 30, 2015 | 15.76 | 0.23 | (e) | 0.66 | 0.89 | (0.15 | ) | — | (0.15 | ) | ||||||||||||||||||
December 13, 2013 (g) through June 30, 2014 | 15.00 | 0.10 | 0.84 | 0.94 | (0.08 | ) | (0.10 | ) | (0.18 | ) | ||||||||||||||||||
Class R5 | ||||||||||||||||||||||||||||
Year Ended June 30, 2017 | 16.28 | 0.26 | (e) | 2.02 | 2.28 | (0.26 | ) | — | (0.26 | ) | ||||||||||||||||||
Year Ended June 30, 2016 | 16.51 | 0.24 | (e) | (0.24 | ) | — | (h) | (0.23 | ) | — | (0.23 | ) | ||||||||||||||||
Year Ended June 30, 2015 | 15.76 | 0.26 | (e) | 0.66 | 0.92 | (0.17 | ) | — | (0.17 | ) | ||||||||||||||||||
December 13, 2013 (g) through June 30, 2014 | 15.00 | 0.13 | 0.82 | 0.95 | (0.09 | ) | (0.10 | ) | (0.19 | ) | ||||||||||||||||||
Class R6 | ||||||||||||||||||||||||||||
Year Ended June 30, 2017 | 16.28 | 0.25 | (e) | 2.03 | 2.28 | (0.27 | ) | — | (0.27 | ) | ||||||||||||||||||
Year Ended June 30, 2016 | 16.52 | 0.27 | (e) | (0.27 | ) | — | (h) | (0.24 | ) | — | (0.24 | ) | ||||||||||||||||
Year Ended June 30, 2015 | 15.76 | 0.27 | (e) | 0.67 | 0.94 | (0.18 | ) | — | (0.18 | ) | ||||||||||||||||||
December 13, 2013 (g) through June 30, 2014 | 15.00 | 0.13 | 0.83 | 0.96 | (0.10 | ) | (0.10 | ) | (0.20 | ) | ||||||||||||||||||
| (a) | Annualized for periods less than one year, unless otherwise noted. |
| (b) | Not annualized for periods less than one year. |
| (c) | Includes adjustments in accordance with accounting principles generally accepted in the United States of America and as such, the net asset values for financial reporting purposes and the returns based upon those net asset values may differ from the net asset values and returns for shareholder transactions. |
| (d) | Includes earnings credits and interest expense, if applicable, each of which is less than 0.005% unless otherwise noted. |
| (e) | Calculated based upon average shares outstanding. |
| (f) | Certain non-recurring expenses incurred by the Fund were not annualized for the year ended June 30, 2015 and for the period ended June 30, 2014. |
| (g) | Commencement of operations. |
| (h) | Amount rounds to less than $0.005. |
SEE NOTES TO FINANCIAL STATEMENTS.
| 84 | J.P. MORGAN LARGE CAP FUNDS | JUNE 30, 2017 | ||||
Table of Contents
| Ratios/Supplemental data | |||||||||||||||||||||||||
| Ratios to average net assets (a) | ||||||||||||||||||||||||||
| Net asset value, end of period | Total return (excludes sales charge) (b)(c) | Net assets, end of period (000’s) | Net expenses (d) | Net investment income (loss) | Expenses without waivers, reimbursements and earnings credits | Portfolio turnover rate (b) | ||||||||||||||||||||
| $ | 18.24 | 13.60 | % | $ | 133,789 | 0.84 | % | 1.06 | % | 1.05 | % | 31 | % | |||||||||||||
| 16.23 | (0.43 | ) | 71,417 | 0.85 | 1.27 | 1.11 | 57 | |||||||||||||||||||
| 16.47 | 5.45 | 93,007 | 0.85 | (f) | 1.14 | (f) | 1.21 | (f) | 42 | |||||||||||||||||
| 15.74 | 6.11 | 569 | 0.85 | (f) | 0.96 | (f) | 16.65 | (f) | 36 | |||||||||||||||||
| 18.16 | 13.07 | 29,168 | 1.34 | 0.55 | 1.45 | 31 | ||||||||||||||||||||
| 16.17 | (0.95 | ) | 9,867 | 1.35 | 0.80 | 1.52 | 57 | |||||||||||||||||||
| 16.43 | 4.85 | 3,405 | 1.35 | (f) | 0.59 | (f) | 1.65 | (f) | 42 | |||||||||||||||||
| 15.76 | 5.87 | 53 | 1.35 | (f) | 0.56 | (f) | 10.04 | (f) | 36 | |||||||||||||||||
| 18.27 | 13.86 | 597,013 | 0.59 | 1.30 | 0.69 | 31 | ||||||||||||||||||||
| 16.26 | (0.17 | ) | 158,820 | 0.60 | 1.54 | 0.74 | 57 | |||||||||||||||||||
| 16.50 | 5.66 | 105,397 | 0.60 | (f) | 1.39 | (f) | 0.91 | (f) | 42 | |||||||||||||||||
| 15.76 | 6.28 | 4,307 | 0.60 | (f) | 1.30 | (f) | 9.91 | (f) | 36 | |||||||||||||||||
| 18.30 | 14.10 | 37 | 0.40 | 1.51 | 1.08 | 31 | ||||||||||||||||||||
| 16.28 | 0.07 | 25 | 0.40 | 1.49 | 2.16 | 57 | ||||||||||||||||||||
| 16.51 | 5.86 | 442 | 0.40 | (f) | 1.58 | (f) | 0.82 | (f) | 42 | |||||||||||||||||
| 15.76 | 6.37 | 53 | 0.40 | (f) | 1.51 | (f) | 9.10 | (f) | 36 | |||||||||||||||||
| 18.29 | 14.09 | 3,289 | 0.34 | 1.41 | 0.42 | 31 | ||||||||||||||||||||
| 16.28 | 0.07 | 74 | 0.35 | 1.66 | 1.40 | 57 | ||||||||||||||||||||
| 16.52 | 5.96 | 443 | 0.35 | (f) | 1.63 | (f) | 0.77 | (f) | 42 | |||||||||||||||||
| 15.76 | 6.39 | 53 | 0.35 | (f) | 1.56 | (f) | 9.05 | (f) | 36 | |||||||||||||||||
SEE NOTES TO FINANCIAL STATEMENTS.
| JUNE 30, 2017 | J.P. MORGAN LARGE CAP FUNDS | 85 | ||||||
Table of Contents
FINANCIAL HIGHLIGHTS
FOR THE PERIODS INDICATED (continued)
| Per share operating performance | ||||||||||||||||||||||||||||
| Investment operations | Distributions | |||||||||||||||||||||||||||
| Net asset value, beginning of period | Net investment income (loss) (b) | Net realized and unrealized gains (losses) on investments | Total from investment operations | Net investment income | Net realized gain | Total distributions | ||||||||||||||||||||||
Large Cap Growth Fund | ||||||||||||||||||||||||||||
Class A | ||||||||||||||||||||||||||||
Year Ended June 30, 2017 | $ | 32.93 | $ | (0.07 | ) | $ | 8.51 | $ | 8.44 | $ | — | $ | (3.14 | ) | $ | (3.14 | ) | |||||||||||
Year Ended June 30, 2016 | 36.82 | (0.06 | ) | (2.23 | ) | (2.29 | ) | — | (1.60 | ) | (1.60 | ) | ||||||||||||||||
Year Ended June 30, 2015 | 32.49 | (0.10 | ) | 5.05 | 4.95 | — | (0.62 | ) | (0.62 | ) | ||||||||||||||||||
Year Ended June 30, 2014 | 26.01 | (0.10 | ) | 6.58 | 6.48 | — | — | — | ||||||||||||||||||||
Year Ended June 30, 2013 | 23.64 | 0.08 | (f) | 2.37 | 2.45 | (0.08 | ) | — | (0.08 | ) | ||||||||||||||||||
Class C | ||||||||||||||||||||||||||||
Year Ended June 30, 2017 | 28.15 | (0.20 | ) | 7.14 | 6.94 | — | (3.14 | ) | (3.14 | ) | ||||||||||||||||||
Year Ended June 30, 2016 | 31.86 | (0.20 | ) | (1.91 | ) | (2.11 | ) | — | (1.60 | ) | (1.60 | ) | ||||||||||||||||
Year Ended June 30, 2015 | 28.33 | (0.24 | ) | 4.39 | 4.15 | — | (0.62 | ) | (0.62 | ) | ||||||||||||||||||
Year Ended June 30, 2014 | 22.79 | (0.22 | ) | 5.76 | 5.54 | — | — | — | ||||||||||||||||||||
Year Ended June 30, 2013 | 20.79 | (0.04 | )(f) | 2.07 | 2.03 | (0.03 | ) | — | (0.03 | ) | ||||||||||||||||||
Class I (formerly Select Class) | ||||||||||||||||||||||||||||
Year Ended June 30, 2017 | 33.08 | (0.02 | ) | 8.55 | 8.53 | — | (3.14 | ) | (3.14 | ) | ||||||||||||||||||
Year Ended June 30, 2016 | 36.92 | (0.01 | ) | (2.23 | ) | (2.24 | ) | — | (1.60 | ) | (1.60 | ) | ||||||||||||||||
Year Ended June 30, 2015 | 32.52 | (0.04 | ) | 5.06 | 5.02 | — | (0.62 | ) | (0.62 | ) | ||||||||||||||||||
Year Ended June 30, 2014 | 25.99 | (0.05 | ) | 6.58 | 6.53 | — | — | — | ||||||||||||||||||||
Year Ended June 30, 2013 | 23.61 | 0.12 | (f) | 2.37 | 2.49 | (0.11 | ) | — | (0.11 | ) | ||||||||||||||||||
Class R2 | ||||||||||||||||||||||||||||
Year Ended June 30, 2017 | 32.31 | (0.16 | ) | 8.32 | 8.16 | — | (3.14 | ) | (3.14 | ) | ||||||||||||||||||
Year Ended June 30, 2016 | 36.24 | (0.15 | ) | (2.18 | ) | (2.33 | ) | — | (1.60 | ) | (1.60 | ) | ||||||||||||||||
Year Ended June 30, 2015 | 32.07 | (0.18 | ) | 4.97 | 4.79 | — | (0.62 | ) | (0.62 | ) | ||||||||||||||||||
Year Ended June 30, 2014 | 25.74 | (0.18 | ) | 6.51 | 6.33 | — | — | — | ||||||||||||||||||||
Year Ended June 30, 2013 | 23.44 | 0.01 | (f) | 2.36 | 2.37 | (0.07 | ) | — | (0.07 | ) | ||||||||||||||||||
Class R3 | ||||||||||||||||||||||||||||
September 9, 2016 (g) through June 30, 2017 | 33.97 | (0.06 | ) | 7.62 | 7.56 | — | (3.14 | ) | (3.14 | ) | ||||||||||||||||||
Class R4 | ||||||||||||||||||||||||||||
September 9, 2016 (g) through June 30, 2017 | 33.97 | 0.04 | 7.60 | 7.64 | — | (3.14 | ) | (3.14 | ) | |||||||||||||||||||
Class R5 | ||||||||||||||||||||||||||||
Year Ended June 30, 2017 | 33.46 | 0.05 | 8.67 | 8.72 | — | (3.14 | ) | (3.14 | ) | |||||||||||||||||||
Year Ended June 30, 2016 | 37.25 | 0.06 | (2.25 | ) | (2.19 | ) | — | (1.60 | ) | (1.60 | ) | |||||||||||||||||
Year Ended June 30, 2015 | 32.75 | 0.03 | 5.09 | 5.12 | — | (0.62 | ) | (0.62 | ) | |||||||||||||||||||
Year Ended June 30, 2014 | 26.12 | 0.01 | 6.62 | 6.63 | — | — | — | |||||||||||||||||||||
Year Ended June 30, 2013 | 23.74 | 0.17 | (f) | 2.38 | 2.55 | (0.17 | ) | — | (0.17 | ) | ||||||||||||||||||
Class R6 | ||||||||||||||||||||||||||||
Year Ended June 30, 2017 | 33.58 | 0.09 | 8.70 | 8.79 | — | (3.14 | ) | (3.14 | ) | |||||||||||||||||||
Year Ended June 30, 2016 | 37.34 | 0.10 | (2.26 | ) | (2.16 | ) | — | (1.60 | ) | (1.60 | ) | |||||||||||||||||
Year Ended June 30, 2015 | 32.80 | 0.06 | 5.10 | 5.16 | — | (0.62 | ) | (0.62 | ) | |||||||||||||||||||
Year Ended June 30, 2014 | 26.15 | 0.02 | 6.63 | 6.65 | — | — | — | |||||||||||||||||||||
Year Ended June 30, 2013 | 23.76 | 0.18 | (f) | 2.39 | 2.57 | (0.18 | ) | — | (0.18 | ) | ||||||||||||||||||
| (a) | Annualized for periods less than one year, unless otherwise noted. |
| (b) | Calculated based upon average shares outstanding. |
| (c) | Not annualized for periods less than one year. |
| (d) | Includes adjustments in accordance with accounting principles generally accepted in the United States of America and as such, the net asset values for financial reporting purposes and the returns based upon those net asset values may differ from the net asset values and returns for shareholder transactions. |
| (e) | Includes earnings credits and interest expense, if applicable, each of which is less than 0.005% unless otherwise noted. |
| (f) | Reflects special dividends paid out during the period by several of the Fund’s holdings. Had the Fund not received the special dividends, the net investment income (loss) per share would have been $0.02, $(0.09), $0.07, $(0.04), $0.12 and $0.13 for Class A, Class C, Class I, Class R2, Class R5 and Class R6 Shares, respectively, and the net investment income (loss) ratio would have been 0.08%, (0.42)%, 0.28%, (0.17)%, 0.47% and 0.50% for Class A, Class C, Class I, Class R2, Class R5 and Class R6 Shares, respectively. |
| (g) | Commencement of offering of class of shares. |
SEE NOTES TO FINANCIAL STATEMENTS.
| 86 | J.P. MORGAN LARGE CAP FUNDS | JUNE 30, 2017 | ||||
Table of Contents
| Ratios/Supplemental data | |||||||||||||||||||||||||
| Ratios to average net assets (a) | ||||||||||||||||||||||||||
| Net asset value, end of period | Total return (excludes sales charge) (c)(d) | Net assets, end of period (000’s) | Net expenses (e) | Net investment income (loss) | Expenses without waivers, reimbursements and earnings credits | Portfolio turnover rate (c) | ||||||||||||||||||||
| $ | 38.23 | 27.50 | % | $ | 2,462,957 | 1.05 | % | (0.19 | )% | 1.25 | % | 22 | % | |||||||||||||
| 32.93 | (6.45 | ) | 4,251,242 | 1.04 | (0.17 | ) | 1.27 | 43 | ||||||||||||||||||
| 36.82 | 15.40 | 4,670,460 | 1.06 | (0.28 | ) | 1.21 | 19 | |||||||||||||||||||
| 32.49 | 24.91 | 5,044,428 | 1.10 | (0.34 | ) | 1.19 | 39 | |||||||||||||||||||
| 26.01 | 10.40 | 2,824,115 | 1.09 | 0.30 | (f) | 1.19 | 47 | |||||||||||||||||||
| 31.95 | 26.79 | 487,702 | 1.55 | (0.69 | ) | 1.67 | 22 | |||||||||||||||||||
| 28.15 | (6.90 | ) | 559,238 | 1.55 | (0.67 | ) | 1.69 | 43 | ||||||||||||||||||
| 31.86 | 14.83 | 600,404 | 1.56 | (0.78 | ) | 1.68 | 19 | |||||||||||||||||||
| 28.33 | 24.31 | 523,972 | 1.59 | (0.85 | ) | 1.69 | 39 | |||||||||||||||||||
| 22.79 | 9.80 | 396,862 | 1.59 | (0.20 | )(f) | 1.69 | 47 | |||||||||||||||||||
| 38.47 | 27.65 | 4,771,428 | 0.89 | (0.05 | ) | 0.90 | 22 | |||||||||||||||||||
| 33.08 | (6.29 | ) | 4,161,010 | 0.89 | (0.04 | ) | 0.93 | 43 | ||||||||||||||||||
| 36.92 | 15.60 | 5,515,626 | 0.90 | (0.12 | ) | 0.92 | 19 | |||||||||||||||||||
| 32.52 | 25.13 | 5,037,737 | 0.93 | (0.18 | ) | 0.94 | 39 | |||||||||||||||||||
| 25.99 | 10.58 | 4,811,907 | 0.91 | 0.50 | (f) | 0.94 | 47 | |||||||||||||||||||
| 37.33 | 27.14 | 147,902 | 1.31 | (0.46 | ) | 1.47 | 22 | |||||||||||||||||||
| 32.31 | (6.67 | ) | 192,560 | 1.30 | (0.43 | ) | 1.55 | 43 | ||||||||||||||||||
| 36.24 | 15.10 | 242,550 | 1.31 | (0.53 | ) | 1.49 | 19 | |||||||||||||||||||
| 32.07 | 24.59 | 222,421 | 1.35 | (0.60 | ) | 1.44 | 39 | |||||||||||||||||||
| 25.74 | 10.12 | 191,876 | 1.34 | 0.05 | (f) | 1.45 | 47 | |||||||||||||||||||
| 38.39 | 24.05 | 992 | 1.12 | (0.20 | ) | 1.20 | 22 | |||||||||||||||||||
| 38.47 | 24.31 | 440 | 0.89 | 0.12 | 1.07 | 22 | ||||||||||||||||||||
| 39.04 | 27.92 | 799,190 | 0.70 | 0.15 | 0.72 | 22 | ||||||||||||||||||||
| 33.46 | (6.10 | ) | 1,209,521 | 0.69 | 0.17 | 0.73 | 43 | |||||||||||||||||||
| 37.25 | 15.80 | 1,394,419 | 0.70 | 0.08 | 0.74 | 19 | ||||||||||||||||||||
| 32.75 | 25.38 | 1,400,112 | 0.73 | 0.02 | 0.74 | 39 | ||||||||||||||||||||
| 26.12 | 10.78 | 1,158,856 | 0.71 | 0.69 | (f) | 0.75 | 47 | |||||||||||||||||||
| 39.23 | 28.03 | 3,606,093 | 0.60 | 0.25 | 0.60 | 22 | ||||||||||||||||||||
| 33.58 | (6.00 | ) | 3,330,565 | 0.60 | 0.28 | 0.60 | 43 | |||||||||||||||||||
| 37.34 | 15.90 | 3,220,191 | 0.62 | 0.17 | 0.62 | 19 | ||||||||||||||||||||
| 32.80 | 25.43 | 2,709,590 | 0.68 | 0.07 | 0.69 | 39 | ||||||||||||||||||||
| 26.15 | 10.87 | 2,170,011 | 0.67 | 0.72 | (f) | 0.70 | 47 | |||||||||||||||||||
SEE NOTES TO FINANCIAL STATEMENTS.
| JUNE 30, 2017 | J.P. MORGAN LARGE CAP FUNDS | 87 | ||||||
Table of Contents
FINANCIAL HIGHLIGHTS
FOR THE PERIODS INDICATED (continued)
| Per share operating performance | ||||||||||||||||||||||||||||
| Investment operations | Distributions | |||||||||||||||||||||||||||
| Net asset value, beginning of period | Net investment income (loss) (a) | Net realized and unrealized gains (losses) on investments | Total from investment operations | Net investment income | Net realized gain | Total distributions | ||||||||||||||||||||||
Large Cap Value Fund | ||||||||||||||||||||||||||||
Class A | ||||||||||||||||||||||||||||
Year Ended June 30, 2017 | $ | 12.71 | $ | 0.15 | $ | 3.42 | $ | 3.57 | $ | (0.14 | ) | $ | (0.66 | ) | $ | (0.80 | ) | |||||||||||
Year Ended June 30, 2016 | 15.02 | 0.17 | (0.59 | ) | (0.42 | ) | (0.16 | ) | (1.73 | ) | (1.89 | ) | ||||||||||||||||
Year Ended June 30, 2015 | 16.63 | 0.17 | 0.94 | 1.11 | (0.17 | ) | (2.55 | ) | (2.72 | ) | ||||||||||||||||||
Year Ended June 30, 2014 | 13.99 | 0.17 | 3.16 | 3.33 | (0.18 | ) | (0.51 | ) | (0.69 | ) | ||||||||||||||||||
Year Ended June 30, 2013 | 11.02 | 0.14 | 2.97 | 3.11 | (0.14 | ) | — | (0.14 | ) | |||||||||||||||||||
Class C | ||||||||||||||||||||||||||||
Year Ended June 30, 2017 | 12.30 | 0.07 | 3.30 | 3.37 | (0.08 | ) | (0.66 | ) | (0.74 | ) | ||||||||||||||||||
Year Ended June 30, 2016 | 14.60 | 0.10 | (0.58 | ) | (0.48 | ) | (0.09 | ) | (1.73 | ) | (1.82 | ) | ||||||||||||||||
Year Ended June 30, 2015 | 16.25 | 0.08 | 0.92 | 1.00 | (0.10 | ) | (2.55 | ) | (2.65 | ) | ||||||||||||||||||
Year Ended June 30, 2014 | 13.70 | 0.09 | 3.08 | 3.17 | (0.11 | ) | (0.51 | ) | (0.62 | ) | ||||||||||||||||||
Year Ended June 30, 2013 | 10.80 | 0.08 | 2.91 | 2.99 | (0.09 | ) | — | (0.09 | ) | |||||||||||||||||||
Class I (formerly Select Class) | ||||||||||||||||||||||||||||
Year Ended June 30, 2017 | 12.53 | 0.17 | 3.37 | 3.54 | (0.17 | ) | (0.66 | ) | (0.83 | ) | ||||||||||||||||||
Year Ended June 30, 2016 | 14.79 | 0.15 | (0.54 | ) | (0.39 | ) | (0.14 | ) | (1.73 | ) | (1.87 | ) | ||||||||||||||||
Year Ended June 30, 2015 | 16.42 | 0.19 | 0.92 | 1.11 | (0.19 | ) | (2.55 | ) | (2.74 | ) | ||||||||||||||||||
Year Ended June 30, 2014 | 13.82 | 0.19 | 3.11 | 3.30 | (0.19 | ) | (0.51 | ) | (0.70 | ) | ||||||||||||||||||
Year Ended June 30, 2013 | 10.88 | 0.16 | 2.94 | 3.10 | (0.16 | ) | — | (0.16 | ) | |||||||||||||||||||
Class R2 | ||||||||||||||||||||||||||||
Year Ended June 30, 2017 | 12.64 | 0.10 | 3.41 | 3.51 | (0.10 | ) | (0.66 | ) | (0.76 | ) | ||||||||||||||||||
Year Ended June 30, 2016 | 14.96 | 0.14 | (0.60 | ) | (0.46 | ) | (0.13 | ) | (1.73 | ) | (1.86 | ) | ||||||||||||||||
Year Ended June 30, 2015 | 16.58 | 0.13 | 0.94 | 1.07 | (0.14 | ) | (2.55 | ) | (2.69 | ) | ||||||||||||||||||
Year Ended June 30, 2014 | 13.95 | 0.13 | 3.14 | 3.27 | (0.13 | ) | (0.51 | ) | (0.64 | ) | ||||||||||||||||||
Year Ended June 30, 2013 | 10.99 | 0.11 | 2.96 | 3.07 | (0.11 | ) | — | (0.11 | ) | |||||||||||||||||||
Class R5 | ||||||||||||||||||||||||||||
Year Ended June 30, 2017 | 12.63 | 0.20 | 3.39 | 3.59 | (0.19 | ) | (0.66 | ) | (0.85 | ) | ||||||||||||||||||
Year Ended June 30, 2016 | 14.93 | 0.21 | (0.58 | ) | (0.37 | ) | (0.20 | ) | (1.73 | ) | (1.93 | ) | ||||||||||||||||
Year Ended June 30, 2015 | 16.54 | 0.22 | 0.94 | 1.16 | (0.22 | ) | (2.55 | ) | (2.77 | ) | ||||||||||||||||||
Year Ended June 30, 2014 | 13.92 | 0.19 | 3.16 | 3.35 | (0.22 | ) | (0.51 | ) | (0.73 | ) | ||||||||||||||||||
Year Ended June 30, 2013 | 10.92 | 0.17 | 2.98 | 3.15 | (0.15 | ) | — | (0.15 | ) | |||||||||||||||||||
Class R6 | ||||||||||||||||||||||||||||
Year Ended June 30, 2017 | 12.56 | 0.20 | 3.38 | 3.58 | (0.20 | ) | (0.66 | ) | (0.86 | ) | ||||||||||||||||||
Year Ended June 30, 2016 | 14.86 | 0.24 | (0.60 | ) | (0.36 | ) | (0.21 | ) | (1.73 | ) | (1.94 | ) | ||||||||||||||||
Year Ended June 30, 2015 | 16.48 | 0.25 | 0.91 | 1.16 | (0.23 | ) | (2.55 | ) | (2.78 | ) | ||||||||||||||||||
Year Ended June 30, 2014 | 13.87 | 0.22 | 3.13 | 3.35 | (0.23 | ) | (0.51 | ) | (0.74 | ) | ||||||||||||||||||
Year Ended June 30, 2013 | 10.92 | 0.20 | 2.94 | 3.14 | (0.19 | ) | — | (0.19 | ) | |||||||||||||||||||
| (a) | Calculated based upon average shares outstanding. |
| (b) | Includes adjustments in accordance with accounting principles generally accepted in the United States of America and as such, the net asset values for financial reporting purposes and the returns based upon those net asset values may differ from the net asset values and returns for shareholder transactions. |
| (c) | Includes earnings credits and interest expense, if applicable, each of which is less than 0.005% unless otherwise noted. |
SEE NOTES TO FINANCIAL STATEMENTS.
| 88 | J.P. MORGAN LARGE CAP FUNDS | JUNE 30, 2017 | ||||
Table of Contents
| Ratios/Supplemental data | |||||||||||||||||||||||||
| Ratios to average net assets | ||||||||||||||||||||||||||
| Net asset value, end of period | Total return (excludes sales charge) (b) | Net assets, end of period (000’s) | Net expenses (c) | Net investment income (loss) | Expenses without waivers, reimbursements and earnings credits | Portfolio turnover rate | ||||||||||||||||||||
| $ | 15.48 | 28.47 | % | $ | 215,017 | 0.92 | % | 1.01 | % | 1.08 | % | 145 | % | |||||||||||||
| 12.71 | (2.51 | ) | 96,373 | 0.93 | 1.27 | 1.12 | 219 | |||||||||||||||||||
| 15.02 | 7.44 | 93,078 | 0.93 | 1.07 | 1.05 | 143 | ||||||||||||||||||||
| 16.63 | 24.46 | 92,161 | 0.93 | 1.11 | 1.06 | 168 | ||||||||||||||||||||
| 13.99 | 28.38 | 35,030 | 0.94 | 1.11 | 1.04 | 119 | ||||||||||||||||||||
| 14.93 | 27.72 | 48,028 | 1.44 | 0.50 | 1.57 | 145 | ||||||||||||||||||||
| 12.30 | (2.98 | ) | 17,041 | 1.45 | 0.75 | 1.62 | 219 | |||||||||||||||||||
| 14.60 | 6.88 | 14,307 | 1.45 | 0.55 | 1.55 | 143 | ||||||||||||||||||||
| 16.25 | 23.78 | 11,646 | 1.44 | 0.59 | 1.56 | 168 | ||||||||||||||||||||
| 13.70 | 27.77 | 4,890 | 1.44 | 0.62 | 1.54 | 119 | ||||||||||||||||||||
| 15.24 | 28.61 | 161,494 | 0.79 | 1.15 | 0.80 | 145 | ||||||||||||||||||||
| 12.53 | (2.34 | ) | 23,373 | 0.77 | 1.07 | 0.77 | 219 | |||||||||||||||||||
| 14.79 | 7.56 | 634,301 | 0.77 | 1.22 | 0.77 | 143 | ||||||||||||||||||||
| 16.42 | 24.62 | 662,936 | 0.79 | 1.24 | 0.80 | 168 | ||||||||||||||||||||
| 13.82 | 28.65 | 591,749 | 0.78 | 1.27 | 0.79 | 119 | ||||||||||||||||||||
| 15.39 | 28.11 | 6,775 | 1.23 | 0.71 | 1.43 | 145 | ||||||||||||||||||||
| 12.64 | (2.78 | ) | 3,462 | 1.20 | 1.05 | 1.57 | 219 | |||||||||||||||||||
| 14.96 | 7.21 | 1,074 | 1.20 | 0.82 | 1.40 | 143 | ||||||||||||||||||||
| 16.58 | 24.07 | 455 | 1.20 | 0.83 | 1.30 | 168 | ||||||||||||||||||||
| 13.95 | 28.10 | 378 | 1.20 | 0.87 | 1.29 | 119 | ||||||||||||||||||||
| 15.37 | 28.82 | 10,218 | 0.59 | 1.35 | 0.62 | 145 | ||||||||||||||||||||
| 12.63 | (2.15 | ) | 4,155 | 0.59 | 1.52 | 0.60 | 219 | |||||||||||||||||||
| 14.93 | 7.83 | 4,443 | 0.58 | 1.41 | 0.59 | 143 | ||||||||||||||||||||
| 16.54 | 24.81 | 4,433 | 0.57 | 1.30 | 0.59 | 168 | ||||||||||||||||||||
| 13.92 | 28.96 | 19,410 | 0.59 | 1.48 | 0.60 | 119 | ||||||||||||||||||||
| 15.28 | 28.90 | 610,732 | 0.51 | 1.43 | 0.52 | 145 | ||||||||||||||||||||
| 12.56 | (2.06 | ) | 565,542 | 0.51 | 1.90 | 0.52 | 219 | |||||||||||||||||||
| 14.86 | 7.85 | 4,145 | 0.53 | 1.54 | 0.53 | 143 | ||||||||||||||||||||
| 16.48 | 24.89 | 50,923 | 0.54 | 1.48 | 0.55 | 168 | ||||||||||||||||||||
| 13.87 | 28.94 | 43,781 | 0.53 | 1.52 | 0.54 | 119 | ||||||||||||||||||||
SEE NOTES TO FINANCIAL STATEMENTS.
| JUNE 30, 2017 | J.P. MORGAN LARGE CAP FUNDS | 89 | ||||||
Table of Contents
FINANCIAL HIGHLIGHTS
FOR THE PERIODS INDICATED (continued)
| Per share operating performance | ||||||||||||||||||||||||||||
| Investment operations | Distributions | |||||||||||||||||||||||||||
| Net asset value, beginning of period | Net investment income (loss) | Net realized and unrealized gains (losses) on investments | Total from investment operations | Net investment income | Net realized gain | Total distributions | ||||||||||||||||||||||
U.S. Equity Fund | ||||||||||||||||||||||||||||
Class A | ||||||||||||||||||||||||||||
Year Ended June 30, 2017 | $ | 13.76 | $ | 0.11 | (e) | $ | 2.57 | $ | 2.68 | $ | (0.11 | ) | $ | (0.53 | ) | $ | (0.64 | ) | ||||||||||
Year Ended June 30, 2016 | 14.75 | 0.12 | (e) | (0.30 | ) | (0.18 | ) | (0.11 | ) | (0.70 | ) | (0.81 | ) | |||||||||||||||
Year Ended June 30, 2015 | 14.92 | 0.13 | 1.10 | 1.23 | (0.13 | ) | (1.27 | ) | (1.40 | ) | ||||||||||||||||||
Year Ended June 30, 2014 | 12.80 | 0.11 | (e) | 3.09 | 3.20 | (0.11 | ) | (0.97 | ) | (1.08 | ) | |||||||||||||||||
Year Ended June 30, 2013 | 10.73 | 0.13 | (e) | 2.31 | 2.44 | (0.13 | ) | (0.24 | ) | (0.37 | ) | |||||||||||||||||
Class C | ||||||||||||||||||||||||||||
Year Ended June 30, 2017 | 13.41 | 0.04 | (e) | 2.49 | 2.53 | (0.04 | ) | (0.53 | ) | (0.57 | ) | |||||||||||||||||
Year Ended June 30, 2016 | 14.40 | 0.05 | (e) | (0.30 | ) | (0.25 | ) | (0.04 | ) | (0.70 | ) | (0.74 | ) | |||||||||||||||
Year Ended June 30, 2015 | 14.61 | 0.07 | 1.06 | 1.13 | (0.07 | ) | (1.27 | ) | (1.34 | ) | ||||||||||||||||||
Year Ended June 30, 2014 | 12.56 | 0.04 | (e) | 3.03 | 3.07 | (0.05 | ) | (0.97 | ) | (1.02 | ) | |||||||||||||||||
Year Ended June 30, 2013 | 10.55 | 0.06 | (e) | 2.26 | 2.32 | (0.07 | ) | (0.24 | ) | (0.31 | ) | |||||||||||||||||
Class I (formerly Select Class) | ||||||||||||||||||||||||||||
Year Ended June 30, 2017 | 13.79 | 0.14 | (e) | 2.57 | 2.71 | (0.14 | ) | (0.53 | ) | (0.67 | ) | |||||||||||||||||
Year Ended June 30, 2016 | 14.78 | 0.13 | (e) | (0.29 | ) | (0.16 | ) | (0.13 | ) | (0.70 | ) | (0.83 | ) | |||||||||||||||
Year Ended June 30, 2015 | 14.94 | 0.16 | 1.11 | 1.27 | (0.16 | ) | (1.27 | ) | (1.43 | ) | ||||||||||||||||||
Year Ended June 30, 2014 | 12.80 | 0.13 | (e) | 3.10 | 3.23 | (0.12 | ) | (0.97 | ) | (1.09 | ) | |||||||||||||||||
Year Ended June 30, 2013 | 10.74 | 0.15 | (e) | 2.30 | 2.45 | (0.15 | ) | (0.24 | ) | (0.39 | ) | |||||||||||||||||
Class L (formerly Institutional Class) | ||||||||||||||||||||||||||||
Year Ended June 30, 2017 | 13.80 | 0.16 | (e) | 2.58 | 2.74 | (0.16 | ) | (0.53 | ) | (0.69 | ) | |||||||||||||||||
Year Ended June 30, 2016 | 14.79 | 0.16 | (e) | (0.30 | ) | (0.14 | ) | (0.15 | ) | (0.70 | ) | (0.85 | ) | |||||||||||||||
Year Ended June 30, 2015 | 14.96 | 0.19 | 1.09 | 1.28 | (0.18 | ) | (1.27 | ) | (1.45 | ) | ||||||||||||||||||
Year Ended June 30, 2014 | 12.82 | 0.16 | (e) | 3.10 | 3.26 | (0.15 | ) | (0.97 | ) | (1.12 | ) | |||||||||||||||||
Year Ended June 30, 2013 | 10.75 | 0.16 | (e) | 2.31 | 2.47 | (0.16 | ) | (0.24 | ) | (0.40 | ) | |||||||||||||||||
Class R2 | ||||||||||||||||||||||||||||
Year Ended June 30, 2017 | 13.66 | 0.07 | (e) | 2.55 | 2.62 | (0.07 | ) | (0.53 | ) | (0.60 | ) | |||||||||||||||||
Year Ended June 30, 2016 | 14.66 | 0.08 | (e) | (0.31 | ) | �� | (0.23 | ) | (0.07 | ) | (0.70 | ) | (0.77 | ) | ||||||||||||||
Year Ended June 30, 2015 | 14.84 | 0.10 | 1.09 | 1.19 | (0.10 | ) | (1.27 | ) | (1.37 | ) | ||||||||||||||||||
Year Ended June 30, 2014 | 12.74 | 0.07 | (e) | 3.08 | 3.15 | (0.08 | ) | (0.97 | ) | (1.05 | ) | |||||||||||||||||
Year Ended June 30, 2013 | 10.69 | 0.10 | (e) | 2.29 | 2.39 | (0.10 | ) | (0.24 | ) | (0.34 | ) | |||||||||||||||||
Class R3 | ||||||||||||||||||||||||||||
September 9, 2016(f) through June 30, 2017 | 14.11 | 0.08 | (e) | 2.24 | 2.32 | (0.14 | ) | (0.53 | ) | (0.67 | ) | |||||||||||||||||
Class R4 | ||||||||||||||||||||||||||||
September 9, 2016(f) through June 30, 2017 | 14.15 | 0.13 | (e) | 2.22 | 2.35 | (0.15 | ) | (0.53 | ) | (0.68 | ) | |||||||||||||||||
Class R5 | ||||||||||||||||||||||||||||
Year Ended June 30, 2017 | 13.81 | 0.17 | (e) | 2.57 | 2.74 | (0.17 | ) | (0.53 | ) | (0.70 | ) | |||||||||||||||||
Year Ended June 30, 2016 | 14.80 | 0.18 | (e) | (0.31 | ) | (0.13 | ) | (0.16 | ) | (0.70 | ) | (0.86 | ) | |||||||||||||||
Year Ended June 30, 2015 | 14.96 | 0.19 | 1.11 | 1.30 | (0.19 | ) | (1.27 | ) | (1.46 | ) | ||||||||||||||||||
Year Ended June 30, 2014 | 12.82 | 0.16 | (e) | 3.11 | 3.27 | (0.16 | ) | (0.97 | ) | (1.13 | ) | |||||||||||||||||
Year Ended June 30, 2013 | 10.75 | 0.17 | (e) | 2.31 | 2.48 | (0.17 | ) | (0.24 | ) | (0.41 | ) | |||||||||||||||||
Class R6 | ||||||||||||||||||||||||||||
Year Ended June 30, 2017 | 13.82 | 0.18 | (e) | 2.58 | 2.76 | (0.18 | ) | (0.53 | ) | (0.71 | ) | |||||||||||||||||
Year Ended June 30, 2016 | 14.82 | 0.18 | (e) | (0.31 | ) | (0.13 | ) | (0.17 | ) | (0.70 | ) | (0.87 | ) | |||||||||||||||
Year Ended June 30, 2015 | 14.98 | 0.20 | 1.10 | 1.30 | (0.19 | ) | (1.27 | ) | (1.46 | ) | ||||||||||||||||||
Year Ended June 30, 2014 | 12.83 | 0.17 | (e) | 3.11 | 3.28 | (0.16 | ) | (0.97 | ) | (1.13 | ) | |||||||||||||||||
Year Ended June 30, 2013 | 10.76 | 0.17 | (e) | 2.31 | 2.48 | (0.17 | ) | (0.24 | ) | (0.41 | ) | |||||||||||||||||
| (a) | Annualized for periods less than one year, unless otherwise noted. |
| (b) | Not annualized for periods less than one year. |
| (c) | Includes adjustments in accordance with accounting principles generally accepted in the United States of America and as such, the net asset values for financial reporting purposes and the returns based upon those net asset values may differ from the net asset values and returns for shareholder transactions. |
| (d) | Includes earnings credits and interest expense, if applicable, each of which is less than 0.005% unless otherwise noted. |
| (e) | Calculated based upon average shares outstanding. |
| (f) | Commencement of offering of class of shares. |
SEE NOTES TO FINANCIAL STATEMENTS.
| 90 | J.P. MORGAN LARGE CAP FUNDS | JUNE 30, 2017 | ||||
Table of Contents
| Ratios/Supplemental data | |||||||||||||||||||||||||
| Ratios to average net assets (a) | ||||||||||||||||||||||||||
| Net asset value, end of period | Total return (excludes sales charge) (b)(c) | Net assets, end of period (000’s) | Net expenses (d) | Net investment income (loss) | Expenses without waivers, reimbursements and earnings credits | Portfolio turnover rate (b) | ||||||||||||||||||||
| $ | 15.80 | 19.86 | % | $ | 1,371,821 | 0.94 | % | 0.75 | % | 1.10 | % | 86 | % | |||||||||||||
| 13.76 | (1.15 | ) | 1,446,878 | 0.94 | 0.85 | 1.14 | 83 | |||||||||||||||||||
| 14.75 | 8.70 | 1,399,208 | 0.95 | 0.92 | 1.10 | 79 | ||||||||||||||||||||
| 14.92 | 25.90 | 1,172,752 | 0.97 | 0.77 | 1.05 | 73 | ||||||||||||||||||||
| 12.80 | 23.14 | 874,571 | 0.97 | 1.06 | 1.06 | 88 | ||||||||||||||||||||
| 15.37 | 19.23 | 318,369 | 1.44 | 0.25 | 1.55 | 86 | ||||||||||||||||||||
| 13.41 | (1.66 | ) | 294,744 | 1.44 | 0.35 | 1.59 | 83 | |||||||||||||||||||
| 14.40 | 8.15 | 253,608 | 1.45 | 0.41 | 1.57 | 79 | ||||||||||||||||||||
| 14.61 | 25.30 | 175,265 | 1.47 | 0.28 | 1.55 | 73 | ||||||||||||||||||||
| 12.56 | 22.43 | 110,837 | 1.46 | 0.56 | 1.56 | 88 | ||||||||||||||||||||
| 15.83 | 20.05 | 1,287,300 | 0.76 | 0.93 | 0.81 | 86 | ||||||||||||||||||||
| 13.79 | (1.00 | ) | 1,066,145 | 0.76 | 0.94 | 0.81 | 83 | |||||||||||||||||||
| 14.78 | 8.92 | 2,375,538 | 0.77 | 1.08 | 0.79 | 79 | ||||||||||||||||||||
| 14.94 | 26.21 | 2,288,734 | 0.79 | 0.94 | 0.80 | 73 | ||||||||||||||||||||
| 12.80 | 23.22 | 3,874,926 | 0.79 | 1.24 | 0.81 | 88 | ||||||||||||||||||||
| 15.85 | 20.27 | 3,391,256 | 0.61 | 1.07 | 0.67 | 86 | ||||||||||||||||||||
| 13.80 | (0.83 | ) | 3,704,104 | 0.61 | 1.18 | 0.68 | 83 | |||||||||||||||||||
| 14.79 | 9.01 | 4,932,896 | 0.62 | 1.25 | 0.66 | 79 | ||||||||||||||||||||
| 14.96 | 26.41 | 4,178,050 | 0.64 | 1.12 | 0.65 | 73 | ||||||||||||||||||||
| 12.82 | 23.48 | 1,214,707 | 0.64 | 1.36 | 0.67 | 88 | ||||||||||||||||||||
| 15.68 | 19.58 | 260,589 | 1.20 | 0.48 | 1.40 | 86 | ||||||||||||||||||||
| 13.66 | (1.47 | ) | 205,224 | 1.19 | 0.60 | 1.48 | 83 | |||||||||||||||||||
| 14.66 | 8.45 | 178,272 | 1.20 | 0.67 | 1.41 | 79 | ||||||||||||||||||||
| 14.84 | 25.61 | 126,549 | 1.22 | 0.53 | 1.30 | 73 | ||||||||||||||||||||
| 12.74 | 22.81 | 72,664 | 1.22 | 0.81 | 1.31 | 88 | ||||||||||||||||||||
| 15.76 | 16.83 | 25,050 | 1.00 | 0.67 | 1.03 | 86 | ||||||||||||||||||||
| 15.82 | 16.99 | 1,030 | 0.75 | 1.03 | 0.81 | 86 | ||||||||||||||||||||
| 15.85 | 20.24 | 890,105 | 0.56 | 1.12 | 0.62 | 86 | ||||||||||||||||||||
| 13.81 | (0.77 | ) | 910,033 | 0.56 | 1.27 | 0.63 | 83 | |||||||||||||||||||
| 14.80 | 9.13 | 496,102 | 0.57 | 1.30 | 0.62 | 79 | ||||||||||||||||||||
| 14.96 | 26.45 | 441,628 | 0.59 | 1.16 | 0.60 | 73 | ||||||||||||||||||||
| 12.82 | 23.52 | 455,939 | 0.59 | 1.45 | 0.61 | 88 | ||||||||||||||||||||
| 15.87 | 20.37 | 6,751,473 | 0.50 | 1.19 | 0.50 | 86 | ||||||||||||||||||||
| 13.82 | (0.78 | ) | 4,755,359 | 0.50 | 1.33 | 0.50 | 83 | |||||||||||||||||||
| 14.82 | 9.17 | 2,976,379 | 0.51 | 1.35 | 0.52 | 79 | ||||||||||||||||||||
| 14.98 | 26.57 | 2,392,416 | 0.54 | 1.21 | 0.55 | 73 | ||||||||||||||||||||
| 12.83 | 23.56 | 1,379,173 | 0.54 | 1.47 | 0.56 | 88 | ||||||||||||||||||||
SEE NOTES TO FINANCIAL STATEMENTS.
| JUNE 30, 2017 | J.P. MORGAN LARGE CAP FUNDS | 91 | ||||||
Table of Contents
AS OF JUNE 30, 2017
1. Organization
JPMorgan Trust I (“JPM I”) and JPMorgan Trust II (“JPM II”) (collectively, the “Trusts”) were formed on November 12, 2004, as Delaware statutory trusts, pursuant to Declarations of Trust dated November 5, 2004 and are registered under the Investment Company Act of 1940, as amended (the “1940 Act”), as open-end management investment companies.
The following are 9 separate funds of the Trusts (collectively, the “Funds”) covered by this report:
| Classes Offered | Trust | Diversified/Non-Diversified | ||||
| Disciplined Equity Fund | Class A, Class I^, Class L^^ and Class R6 | JPM I | Diversified | |||
| Dynamic Growth Fund | Class A, Class C, Class I^ and Class R5 | JPM I | Non-Diversified | |||
| Equity Focus Fund | Class A, Class C and Class I^ | JPM I | Non-Diversified | |||
| Equity Income Fund | Class A, Class C, Class I^, Class R2, Class R3*, Class R4*, Class R5 and Class R6 | JPM II | Diversified | |||
| Growth and Income Fund | Class A, Class C, Class I^, Class R2, Class R3**, Class R4**, Class R5 and Class R6 | JPM I | Diversified | |||
| Hedged Equity Fund | Class A, Class C, Class I^, Class R5 and Class R6 | JPM I | Diversified | |||
| Large Cap Growth Fund | Class A, Class C, Class I^, Class R2, Class R3*, Class R4*, Class R5 and Class R6 | JPM II | Diversified | |||
| Large Cap Value Fund | Class A, Class C, Class I^, Class R2, Class R5 and Class R6 | JPM II | Diversified | |||
| U.S. Equity Fund | Class A, Class C, Class I^, Class L^^, Class R2, Class R3*, Class R4*, Class R5 and Class R6 | JPM I | Diversified |
| ^ | Effective April 3, 2017, Select Class was renamed Class I. |
| ^^ | Effective December 1, 2016, Institutional Class was renamed Class L and is publicly offered on a limited basis for Disciplined Equity Fund and U.S. Equity Fund. |
| * | Class R3 and Class R4 commenced operations on September 9, 2016 for Equity Income Fund, Large Cap Growth Fund and U.S. Equity Fund. |
| ** | Class R3 and Class R4 commenced operations on July 31, 2017 for Growth and Income Fund. |
The investment objective of Disciplined Equity Fund is to seek to provide a consistently high total return from a broadly diversified portfolio of equity securities with risk characteristics similar to the Standard and Poor’s 500 Composite Stock Price Index.
The investment objective of Dynamic Growth Fund is to seek long-term capital growth.
The investment objective of Equity Focus Fund and Large Cap Growth Fund is to seek long-term capital appreciation.
The investment objective of Equity Income Fund is to seek capital appreciation and current income.
The investment objective of Growth and Income Fund is to seek to provide capital growth over the long-term and to earn income from dividends.
The investment objective of Hedged Equity Fund is to seek to provide capital appreciation.
The investment objective of Large Cap Value Fund is to seek capital appreciation with the incidental goal of achieving current income by investing primarily in equity securities.
The investment objective of U.S. Equity Fund is to seek to provide high total return from a portfolio of selected equity securities.
Class A Shares generally provide for a front-end sales charge while Class C Shares provide for a contingent deferred sales charge (“CDSC”). No sales charges are assessed with respect to Class I, Class L, Class R2, Class R3, Class R4, Class R5 and Class R6 Shares. All classes of shares have equal rights as to earnings, assets and voting privileges, except that each class may bear different transfer agency, sub-transfer agency (through April 2, 2017), distribution and service fees and each class has exclusive voting rights with respect to its distribution plan and shareholder servicing agreements. Effective April 3, 2017 sub-transfer agency and shareholder servicing fees were consolidated into a single service fee. Certain Class A Shares, for which front-end sales charges have been waived, may be subject to a CDSC as described in the Funds’ prospectus. Beginning on November 14, 2017, Class C Shares will automatically convert to Class A Shares after ten years.
J.P. Morgan Investment Management Inc. (“JPMIM”) an indirect, wholly-owned subsidiary of JPMorgan Chase & Co. (“JPMorgan”) acts as Adviser (the “Adviser”) and Administrator (the “Administrator”) to the Funds.
2. Significant Accounting Policies
The following is a summary of significant accounting policies followed by the Funds in the preparation of their financial statements. The Funds are investment companies and, accordingly, follow the investment company accounting and reporting guidance of the Financial Accounting Standards Board Accounting Standards Codification Topic 946 — Investment Companies, which is part of U.S. generally accepted accounting principles (“GAAP”). The preparation of financial statements in conformity with GAAP requires management to make estimates and assumptions that affect the reported amounts of assets and liabilities and disclosure of contingent assets and liabilities at the date of the financial statements and the reported amounts of increases and decreases in net assets from operations during the reporting period. Actual results could differ from those estimates.
A. Valuation of Investments — The valuation of investments is in accordance with GAAP and the Funds’ valuation policies set forth by and under the supervision and responsibility of the Board of Trustees (the “Board”), which established the following approach to valuation, as described more fully below: (i) investments for which market quotations are readily available shall be valued at such unadjusted quoted prices and (ii) all other investments for which market quotations are not readily available shall be valued at their fair value as determined in good faith by the Board.
| 92 | J.P. MORGAN LARGE CAP FUNDS | JUNE 30, 2017 | ||||
Table of Contents
The Administrator has established the J.P. Morgan Investment Management Americas Valuation Committee (“AVC”) to assist the Board with the oversight and monitoring of the valuation of the Funds’ investments. The Administrator implements the valuation policies of the Funds’ investments, as directed by the Board. The AVC oversees and carries out the policies for the valuation of investments held in the Funds. This includes monitoring the appropriateness of fair values based on results of ongoing valuation oversight, including but not limited to consideration of macro or security specific events, market events and pricing vendor and broker due diligence. The Administrator is responsible for discussing and assessing the potential impacts to the fair values on an ongoing basis, and at least on a quarterly basis with the AVC and the Board.
Equities and other exchange-traded instruments are valued at the last sale price or official market closing price on the primary exchange on which the instrument is traded before the net asset values (“NAV”) of the Funds are calculated on a valuation date. Investments in open-end investment companies (the “Underlying Funds”) are valued at each Underlying Fund’s NAV per share as of the report date.
A market-based approach is primarily used to value the Funds’ investments. Investments for which market quotations are not readily available are fair valued by approved affiliated and unaffiliated pricing vendors or third party broker-dealers (collectively referred to as “Pricing Services”) or may be internally fair valued using methods set forth by the valuation policies approved by the Board. This may include related or comparable assets or liabilities, recent transactions, market multiples, book values, and other relevant information for the investment to determine the fair value of the investment. An income-based valuation approach may be used in which the anticipated future cash flows of the investment are discounted to calculate the fair value. Discounts may also be applied due to the nature or duration of any restrictions on the disposition of the investments. Valuations may be based upon current market prices of securities that are comparable in coupon, rating, maturity and industry. It is possible that the estimated values may differ significantly from the values that would have been used, had a ready market for the investments existed, and such differences could be material.
Fixed income instruments are valued based on prices received from Pricing Services. The Pricing Services use multiple valuation techniques to determine the valuation of fixed income instruments. In instances where sufficient market activity exists, the Pricing Services may utilize a market-based approach through which trades or quotes from market makers are used to determine the valuation of these instruments. In instances where sufficient market activity may not exist, the Pricing Services also utilize proprietary valuation models which may consider market transactions in comparable securities and the various relationships between securities in determining fair value and/or market characteristics in order to estimate the relevant cash flows, which are then discounted to calculate the fair values.
Futures and options are generally valued on the basis of available market quotations.
Valuations reflected in this report are as of the report date. As a result, changes in valuation due to market events and/or issuer related events after the report date and prior to issuance of the report are not reflected herein.
The various inputs that are used in determining the valuation of the Funds’ investments are summarized into the three broad levels listed below.
| • | Level 1 — Unadjusted inputs using quoted prices in active markets for identical investments. |
| • | Level 2 — Other significant observable inputs including, but not limited to, quoted prices for similar investments, inputs other than quoted prices that are observable for investments (such as interest rates, prepayment speeds, credit risk, etc.) or other market corroborated inputs. |
| • | Level 3 — Significant inputs based on the best information available in the circumstances, to the extent observable inputs are not available (including the Funds’ assumptions in determining the fair value of investments). |
A financial instrument’s level within the fair value hierarchy is based on the lowest level of any input, both individually and in the aggregate, that is significant to the fair value measurement. The inputs or methodology used for valuing instruments are not necessarily an indication of the risk associated with investing in those instruments.
The following tables represent each valuation input as presented on the Schedules of Portfolio Investments (“SOIs”) (amounts in thousands):
Disciplined Equity Fund
| Level 1 Quoted prices | Level 2 observable inputs | Level 3 unobservable inputs | Total | |||||||||||||
Total Investments in Securities (a) | $ | 7,419,990 | $ | 5,284 | $ | — | $ | 7,425,274 | ||||||||
|
|
|
|
|
|
|
| |||||||||
Depreciation in Other Financial Instruments | ||||||||||||||||
Futures Contracts | $ | (236 | ) | $ | — | $ | — | $ | (236 | ) | ||||||
|
|
|
|
|
|
|
| |||||||||
| Dynamic Growth Fund | ||||||||||||||||
| Level 1 Quoted prices | Level 2 observable inputs | Level 3 unobservable inputs | Total | |||||||||||||
Total Investments in Securities (b) | $ | 321,806 | $ | — | $ | — | $ | 321,806 | ||||||||
|
|
|
|
|
|
|
| |||||||||
| JUNE 30, 2017 | J.P. MORGAN LARGE CAP FUNDS | 93 | ||||||
Table of Contents
NOTES TO FINANCIAL STATEMENTS
AS OF JUNE 30, 2017 (continued)
| Equity Focus Fund | ||||||||||||||||
| Level 1 Quoted prices | Level 2 observable inputs | Level 3 unobservable inputs | Total | |||||||||||||
Total Investments in Securities (b) | $ | 186,156 | $ | — | $ | — | $ | 186,156 | ||||||||
|
|
|
|
|
|
|
| |||||||||
| Equity Income Fund | ||||||||||||||||
| Level 1 Quoted prices | Level 2 observable inputs | Level 3 unobservable inputs | Total | |||||||||||||
Total Investments in Securities (b) | $ | 14,936,782 | $ | — | $ | — | $ | 14,936,782 | ||||||||
|
|
|
|
|
|
|
| |||||||||
| Growth and Income Fund | ||||||||||||||||
| Level 1 Quoted prices | Level 2 observable inputs | Level 3 unobservable inputs | Total | |||||||||||||
Total Investments in Securities (b) | $ | 539,975 | $ | — | $ | — | $ | 539,975 | ||||||||
|
|
|
|
|
|
|
| |||||||||
| Hedged Equity Fund | ||||||||||||||||
| Level 1 Quoted prices | Level 2 observable inputs | Level 3 unobservable inputs | Total | |||||||||||||
Total Investments in Securities (a) | $ | 794,894 | $ | 164 | $ | — | $ | 795,058 | ||||||||
|
|
|
|
|
|
|
| |||||||||
Depreciation in Other Financial Instruments | ||||||||||||||||
Futures Contracts | $ | (11 | ) | $ | — | $ | — | $ | (11 | ) | ||||||
Options Written | ||||||||||||||||
Call Option Written | (4,886 | ) | — | — | (4,886 | ) | ||||||||||
Put Option Written | (1,174 | ) | — | — | (1,174 | ) | ||||||||||
|
|
|
|
|
|
|
| |||||||||
Total Depreciation in Other Financial Instruments | $ | (6,071 | ) | $ | — | $ | — | $ | (6,071 | ) | ||||||
|
|
|
|
|
|
|
| |||||||||
| Large Cap Growth Fund | ||||||||||||||||
| Level 1 Quoted prices | Level 2 observable inputs | Level 3 unobservable inputs | Total | |||||||||||||
Total Investments in Securities (b) | $ | 12,326,105 | $ | — | $ | — | $ | 12,326,105 | ||||||||
|
|
|
|
|
|
|
| |||||||||
| Large Cap Value Fund | ||||||||||||||||
| Level 1 Quoted prices | Level 2 observable inputs | Level 3 unobservable inputs | Total | |||||||||||||
Total Investments in Securities (c) | $ | 1,045,709 | $ | — | $ | — | (d) | $ | 1,045,709 | |||||||
|
|
|
|
|
|
|
| |||||||||
| U.S. Equity Fund | ||||||||||||||||
| Level 1 Quoted prices | Level 2 observable inputs | Level 3 unobservable inputs | Total | |||||||||||||
Total Investments in Securities (c) | $ | 14,269,183 | $ | — | $ | — | (d) | $ | 14,269,183 | |||||||
|
|
|
|
|
|
|
| |||||||||
Depreciation in Other Financial Instruments | ||||||||||||||||
Futures Contracts | $ | (253 | ) | $ | — | $ | — | $ | (253 | ) | ||||||
|
|
|
|
|
|
|
| |||||||||
| (a) | All portfolio holdings designated as level 1 and level 2 are disclosed individually on the SOIs. Level 2 consists of U.S. Treasury Bill that is held as initial margin for futures contracts. Please refer to the SOIs for asset class specifics of portfolio holdings. |
| 94 | J.P. MORGAN LARGE CAP FUNDS | JUNE 30, 2017 | ||||
Table of Contents
| (b) | All portfolio holdings designated as level 1 are disclosed individually on the SOIs. Please refer to the SOIs for industry specifics of portfolio holdings. |
| (c) | All portfolio holdings designated as Level 1 and Level 3 are disclosed individually on the SOIs. Level 3 consists of a warrant. Please refer to the SOIs for industry specifics of portfolio holdings. |
| (d) | Amount rounds to less than 500. |
There were no transfers among any levels during the year ended June 30, 2017.
B. Futures Contracts — Disciplined Equity Fund, Hedged Equity Fund and U.S. Equity Fund used index futures contracts to gain or reduce exposure to the stock market, maintain liquidity or minimize transaction costs. The Funds also bought futures contracts to invest incoming cash in the market or sold futures in response to cash outflows, thereby simulating an invested position in the underlying index while maintaining a cash balance for liquidity.
Futures contracts provide for the delayed delivery of the underlying instrument at a fixed price or are settled for a cash amount based on the change in the value of the underlying instrument at a specific date in the future. Upon entering into a futures contract, the Funds are required to deposit with the broker, cash or securities in an amount equal to a certain percentage of the contract amount, which is referred to as the initial margin deposit. Subsequent payments, referred to as variation margin, are made or received by the Funds periodically and are based on changes in the market value of open futures contracts. Changes in the market value of open futures contracts are recorded as Change in net unrealized appreciation/depreciation on the Statements of Operations. Realized gains or losses, representing the difference between the value of the contract at the time it was opened and the value at the time it was closed, are reported on the Statements of Operations at the closing or expiration of the futures contract. Securities deposited as initial margin are designated on the SOIs and cash deposited is recorded on the Statements of Assets and Liabilities. A receivable from and/or a payable to brokers for the daily variation margin is also recorded on the Statements of Assets and Liabilities.
The use of futures contracts exposes the Funds to equity price risk. The Funds may be subject to the risk that the change in the value of the futures contract may not correlate perfectly with the underlying instrument. Use of long futures contracts subjects the Funds to risk of loss in excess of the amounts shown on the Statements of Assets and Liabilities, up to the notional amount of the futures contracts. Use of short futures contracts subjects the Funds to unlimited risk of loss. The Funds may enter into futures contracts only on exchanges or boards of trade. The exchange or board of trade acts as the counterparty to each futures transaction; therefore, the Funds’ credit risk is limited to failure of the exchange or board of trade. Under some circumstances, futures exchanges may establish daily limits on the amount that the price of a futures contract can vary from the previous day’s settlement price, which could effectively prevent liquidation of positions.
The table below discloses the volume of the Funds’ futures contracts activity during the year ended June 30, 2017 (amounts in thousands):
| Disciplined Equity Fund | Hedged Equity Fund | U.S. Equity Fund | ||||||||||
Futures Contracts: | ||||||||||||
Average Notional Balance Long | $ | 108,304 | $ | 7,173 | $ | 84,561 | ||||||
Ending Notional Balance Long | 95,383 | 11,378 | 82,069 | |||||||||
The Funds’ futures contracts are not subject to master netting arrangements (the right to close out all transactions traded with a counterparty and net amounts owed or due across transactions).
C. Options — Hedged Equity Fund purchased and sold (“wrote”) put and call options on indices to manage and hedge equity risk within its portfolio. A purchaser of a put option has the right, but not the obligation, to sell the underlying instrument at an agreed upon price (“strike price”) to the option seller. A purchaser of a call option has the right, but not the obligation, to purchase the underlying instrument at the strike price from the option seller.
Options Purchased — Premiums paid by the Fund for options purchased are included on the Statements of Assets and Liabilities as an investment. The option is adjusted daily to reflect the current market value of the option and the change is recorded as Change in net unrealized appreciation/depreciation of Investments in non-affiliates on the Statements of Operations. If the option is allowed to expire, the Fund will lose the entire premium it paid and record a loss for the premium amount. Premiums paid for options purchased which are exercised or closed are added to the amounts paid or offset against the proceeds on the underlying investment transaction to determine the realized gain (loss) or cost basis of the underlying investment.
Options Written — Premiums received by the Fund for options written are included on the Statements of Assets and Liabilities as a liability. The amount of the liability is adjusted daily to reflect the current market value of the option written and the change in market value is recorded as change in net unrealized appreciation/depreciation. Premiums received from options written that expire are treated as realized gains. If a written option is closed, the Fund records a realized gain or loss on options written based on whether the cost of the closing transaction exceeds the premium received. If a call option is exercised by the option buyer, the premium received by the Fund is added to the proceeds from the sale of the underlying security to the option buyer and compared to the cost of the closing transaction to determine whether there has been a realized gain or loss. If a put option is exercised by an option buyer, the premium received by the option seller reduces the cost basis of the purchased security.
The Fund pledges collateral to the counterparty in the form of securities for options written. Securities designated as collateral are denoted on the SOI.
| JUNE 30, 2017 | J.P. MORGAN LARGE CAP FUNDS | 95 | ||||||
Table of Contents
NOTES TO FINANCIAL STATEMENTS
AS OF JUNE 30, 2017 (continued)
Written uncovered call options subject the Fund to unlimited risk of loss. Written covered call options limit the upside potential of a security above the strike price. Written put options subject the Fund to risk of loss if the value of the security declines below the exercise price minus the put premium.
The Fund is not subject to credit risk on options written as the counterparty has already performed its obligation by paying the premium at the inception of the contract.
Transactions in options written during the year ended June 30, 2017 were as follows (amounts in thousands except for number of contracts):
| Options | ||||||||
| Number of Contracts | Premiums Received | |||||||
Hedged Equity Fund | ||||||||
Options outstanding at June 30, 2016 | 2,282 | $ | 3,838 | |||||
Options written | 21,455 | 22,669 | ||||||
Options expired | (10,950 | ) | (7,016 | ) | ||||
Options closed | (6,441 | ) | (13,481 | ) | ||||
|
|
|
| |||||
Options outstanding at June 30, 2017 | 6,346 | $ | 6,010 | |||||
|
|
|
| |||||
The Fund’s exchange-traded options contracts are not subject to master netting arrangements (the right to close out all transactions traded with a counterparty and net amounts owed or due across transactions).
The Fund may be required to post or receive collateral for over the counter options.
The table below discloses the volume of the Fund’s’ options contracts activity during the year ended June 30, 2017:
Exchange-Traded Options: | ||||
Average Number of Contracts Purchased | 1,765 | |||
Average Number of Contracts Written | 3,531 | |||
Ending Number of Contracts Purchased | 3,173 | |||
Ending Number of Contracts Written | 6,346 |
D. Security Transactions and Investment Income — Investment transactions are accounted for on the trade date (the date the order to buy or sell is executed). Securities gains and losses are calculated on a specifically identified cost basis. Interest income is determined on the basis of coupon interest accrued using the effective interest method which adjusts for amortization of premiums and accretion of discounts. Dividend income net of foreign taxes withheld, if any, is recorded on the ex-dividend date or when a Fund first learns of the dividend.
To the extent such information is publicly available, the Funds record distributions received in excess of income earned from underlying investments as a reduction of cost of investments and/or realized gain. Such amounts are based on estimates if actual amounts are not available and actual amounts of income, realized gain and return of capital may differ from the estimated amounts. The Funds adjust the estimated amounts of the components of distributions (and consequently their net investment income) as necessary once the issuers provide information about the actual composition of the distributions.
E. Allocation of Income and Expenses — Expenses directly attributable to a fund are charged directly to that fund, while the expenses attributable to more than one fund of the Trusts are allocated among the respective funds. In calculating the NAV of each class, investment income, realized and unrealized gains and losses and expenses, other than class-specific expenses, are allocated daily to each class of shares based upon the proportion of net assets of each class at the beginning of each day.
Transfer agency fees are class-specific expenses and sub-transfer agency fees were class-specific expenses up through April 2, 2017. Effective April 3, 2017, the Funds ceased making direct payments to financial intermediaries for any applicable sub-transfer agency services. Payments to financial intermediaries for sub-transfer agency services are made by JPMorgan Distribution Services, Inc. from the Shareholder Servicing Fee, which has been renamed as the Service Fee. The amount of the transfer agency fees and sub-transfer agency fees charged to each class of the Funds for the year ended June 30, 2017 are as follows (amounts in thousands):
| Class A | Class C | Class I | Class L | Class R2 | Class R3 | Class R4 | Class R5 | Class R6 | Total | |||||||||||||||||||||||||||||||
Disciplined Equity Fund | ||||||||||||||||||||||||||||||||||||||||
Transfer agency fees | $ | 31 | n/a | $ | 9 | $ | 14 | n/a | n/a | n/a | n/a | $ | 53 | $ | 107 | |||||||||||||||||||||||||
Sub-transfer agency fees | 499 | n/a | 259 | 337 | n/a | n/a | n/a | n/a | — | 1,095 | ||||||||||||||||||||||||||||||
Dynamic Growth Fund | ||||||||||||||||||||||||||||||||||||||||
Transfer agency fees | 4 | $ | 1 | 4 | n/a | n/a | n/a | n/a | $ | — | n/a | 9 | ||||||||||||||||||||||||||||
Sub-transfer agency fees | 69 | 9 | 25 | n/a | n/a | n/a | n/a | — | n/a | 103 | ||||||||||||||||||||||||||||||
Equity Focus Fund | ||||||||||||||||||||||||||||||||||||||||
Transfer agency fees | 1 | — | (a) | 3 | n/a | n/a | n/a | n/a | n/a | n/a | 4 | |||||||||||||||||||||||||||||
Sub-transfer agency fees | 1 | 1 | 46 | n/a | n/a | n/a | n/a | n/a | n/a | 48 | ||||||||||||||||||||||||||||||
| 96 | J.P. MORGAN LARGE CAP FUNDS | JUNE 30, 2017 | ||||
Table of Contents
| Class A | Class C | Class I | Class L | Class R2 | Class R3 | Class R4 | Class R5 | Class R6 | Total | |||||||||||||||||||||||||||||||
Equity Income Fund | ||||||||||||||||||||||||||||||||||||||||
Transfer agency fees | $ | 332 | $ | 70 | $ | 66 | n/a | $ | 13 | $ | 2 | $ | — | (a) | $ | 14 | $ | 37 | $ | 534 | ||||||||||||||||||||
Sub-transfer agency fees | 2,475 | 677 | 2,004 | n/a | 106 | — | (a) | — | 572 | — | 5,834 | |||||||||||||||||||||||||||||
Growth and Income Fund | ||||||||||||||||||||||||||||||||||||||||
Transfer agency fees | 188 | 4 | 6 | n/a | — | (a) | n/a | n/a | — | (a) | — | (a) | 198 | |||||||||||||||||||||||||||
Sub-transfer agency fees | 110 | 12 | 19 | n/a | — | n/a | n/a | — | (a) | — | 141 | |||||||||||||||||||||||||||||
Hedged Equity Fund | ||||||||||||||||||||||||||||||||||||||||
Transfer agency fees | 2 | 2 | 9 | n/a | n/a | n/a | n/a | — | (a) | — | (a) | 13 | ||||||||||||||||||||||||||||
Sub-transfer agency fees | 110 | 4 | 79 | n/a | n/a | n/a | n/a | — | (a) | — | 193 | |||||||||||||||||||||||||||||
Large Cap Growth Fund | ||||||||||||||||||||||||||||||||||||||||
Transfer agency fees | 431 | 28 | 59 | n/a | 13 | — | (a) | — | (a) | 20 | 46 | 597 | ||||||||||||||||||||||||||||
Sub-transfer agency fees | 4,683 | 333 | 2,175 | n/a | 202 | — | — | 646 | — | 8,039 | ||||||||||||||||||||||||||||||
Large Cap Value Fund | ||||||||||||||||||||||||||||||||||||||||
Transfer agency fees | 49 | 5 | 2 | n/a | 2 | n/a | n/a | 1 | — | 59 | ||||||||||||||||||||||||||||||
Sub-transfer agency fees | 48 | 11 | 20 | n/a | 6 | n/a | n/a | 2 | — | 87 | ||||||||||||||||||||||||||||||
U.S. Equity Fund | ||||||||||||||||||||||||||||||||||||||||
Transfer agency fees | 111 | 17 | 33 | $ | 134 | 6 | — | (a) | — | (a) | 12 | 46 | 359 | |||||||||||||||||||||||||||
Sub-transfer agency fees | 1,351 | 157 | 639 | 2,130 | 326 | 1 | — | 476 | — | 5,080 | ||||||||||||||||||||||||||||||
| (a) | Amount rounds to less than 500. |
F. Federal Income Taxes — Each Fund is treated as a separate taxable entity for Federal income tax purposes. Each Fund’s policy is to comply with the provisions of the Internal Revenue Code of 1986, as amended (the “Code”), applicable to regulated investment companies and to distribute to shareholders all of its distributable net investment income and net realized capital gains on investments. Accordingly, no provision for Federal income tax is necessary. Management has reviewed the Funds’ tax positions for all open tax years and has determined that as of June 30, 2017, no liability for income tax is required in the Funds’ financial statements for net unrecognized tax benefits. However, management’s conclusions may be subject to future review based on changes in, or the interpretation of, the accounting standards or tax laws and regulations. Each of the Funds’ Federal tax returns for the prior three fiscal years, or since inception if shorter, remains subject to examination by the Internal Revenue Service.
G. Foreign Taxes — The Funds may be subject to foreign taxes on income, gains on investments or currency purchases/repatriation, a portion of which may be recoverable. The Funds will accrue such taxes and recoveries as applicable, based upon their current interpretation of tax rules and regulations that exist in the markets in which they invest.
H. Distributions to Shareholders — Distributions from net investment income are generally declared and paid quarterly, except for Dynamic Growth Fund, Large Cap Growth Fund and Equity Focus Fund, for which distributions are generally declared and paid annually, and Equity Income Fund, for which distributions are generally declared and paid monthly. Distributions are declared separately for each class. No class has preferential dividend rights; differences in per share rates are due to differences in separate class expenses. Net realized capital gains, if any, are distributed by each Fund at least annually. The amount of distributions from net investment income and net realized capital gains is determined in accordance with Federal income tax regulations, which may differ from GAAP. To the extent these “book/tax” differences are permanent in nature (i.e., that they result from other than timing of recognition — “temporary differences”), such amounts are reclassified within the capital accounts based on their Federal tax-basis treatment.
The following amounts were reclassified within the capital accounts (amounts in thousands):
Paid-in-Capital | Accumulated undistributed (distributions in excess of) net investment income | Accumulated net realized gains (losses) | ||||||||||
Disciplined Equity Fund | $ | — | $ | (2,280 | ) | $ | 2,280 | |||||
Dynamic Growth Fund | 3,146 | (120 | ) | (3,026 | ) | |||||||
Equity Income Fund | — | (a) | (2,198 | ) | 2,198 | |||||||
Growth and Income Fund | — | (a) | (80 | ) | 80 | |||||||
Hedged Equity Fund | — | (a) | (87 | ) | 87 | |||||||
Large Cap Growth Fund | 276,198 | 2,627 | (278,825 | ) | ||||||||
Large Cap Value Fund | — | (a) | (45 | ) | 45 | |||||||
U.S. Equity Fund | — | (a) | (3,728 | ) | 3,728 | |||||||
| (a) | Amount rounds to less than 500. |
The reclassifications for the Funds relate primarily to tax equalization and non-taxable dividends.
| JUNE 30, 2017 | J.P. MORGAN LARGE CAP FUNDS | 97 | ||||||
Table of Contents
NOTES TO FINANCIAL STATEMENTS
AS OF JUNE 30, 2017 (continued)
3. Fees and Other Transactions with Affiliates
A. Investment Advisory Fee — Pursuant to an Investment Advisory Agreement, the Adviser supervises the investments of each Fund and for such services is paid a fee. The fee is accrued daily and paid monthly based on each Fund’s average daily net assets. The annual rate for each Fund is as follows:
Disciplined Equity Fund | 0.25 | % | ||
Dynamic Growth Fund | 0.60 | |||
Equity Focus Fund | 0.60 | * | ||
Equity Income Fund | 0.40 | |||
Growth and Income Fund | 0.40 | |||
Hedged Equity Fund | 0.25 | |||
Large Cap Growth Fund | 0.50 | |||
Large Cap Value Fund | 0.40 | |||
U.S. Equity Fund | 0.40 |
| * | Prior to November 1, 2016, the investment advisory fee was 0.65% for the Equity Focus Fund. |
The Adviser waived Investment Advisory fees and/or reimbursed expenses as outlined in Note 3.F.
B. Administration Fee — Pursuant to an Administration Agreement, the Administrator provides certain administration services to the Funds. In consideration of these services, the Administrator receives a fee accrued daily and paid monthly at an annual rate of 0.15% of the first $25 billion of the average daily net assets of all funds in the J.P. Morgan Funds Complex covered by the Administration Agreements (excluding certain funds of funds and money market funds) and 0.075% of the average daily net assets in excess of $25 billion of all such funds. For the year ended June 30, 2017, the effective annualized rate was 0.08% of each Fund’s average daily net assets, notwithstanding any fee waivers and/or expense reimbursements.
The Administrator waived Administration fees as outlined in Note 3.F.
JPMorgan Chase Bank, N.A. (“JPMCB”), a wholly-owned subsidiary of JPMorgan, serves as the Funds’ sub-administrator (the “Sub-administrator”). For its services as Sub-administrator, JPMCB receives a portion of the fees payable to the Administrator.
C. Distribution Fees — Pursuant to a Distribution Agreement, JPMorgan Distribution Services, Inc. (“JPMDS”), a wholly-owned subsidiary of JPMorgan, serves as the Trusts’ principal underwriter and promotes and arranges for the sale of each Fund’s shares.
The Board has adopted a Distribution Plan (the “Distribution Plan”) for Class A, Class C, Class R2 and Class R3 Shares of the Funds, as applicable, in accordance with Rule 12b-1 under the 1940 Act. The Class I, Class L, Class R4, Class R5 and Class R6 do not charge a distribution fee. The Distribution Plan provides that each Fund shall pay distribution fees, including payments to JPMDS, at annual rates of the average daily net assets as shown in the table below:
| Class A | Class C | Class R2 | Class R3 | |||||||||||||
Disciplined Equity Fund | 0.25 | % | n/a | n/a | n/a | |||||||||||
Dynamic Growth Fund | 0.25 | 0.75 | % | n/a | n/a | |||||||||||
Equity Focus Fund | 0.25 | 0.75 | n/a | n/a | ||||||||||||
Equity Income Fund | 0.25 | 0.75 | 0.50 | % | 0.25 | % | ||||||||||
Growth and Income Fund | 0.25 | 0.75 | 0.50 | n/a | ||||||||||||
Hedged Equity Fund | 0.25 | 0.75 | n/a | n/a | ||||||||||||
Large Cap Growth Fund | 0.25 | 0.75 | 0.50 | 0.25 | ||||||||||||
Large Cap Value Fund | 0.25 | 0.75 | 0.50 | n/a | ||||||||||||
U.S. Equity Fund | 0.25 | 0.75 | 0.50 | 0.25 | ||||||||||||
In addition, JPMDS is entitled to receive the front-end sales charges from purchases of Class A Shares and the CDSC from redemptions of Class C Shares and certain Class A Shares for which front-end sales charges have been waived. For the year ended June 30, 2017, JPMDS retained the following (amounts in thousands):
| Front-End Sales Charge | CDSC | |||||||
Disciplined Equity Fund | $ | 10 | $ | — | ||||
Dynamic Growth Fund | 25 | — | (a) | |||||
Equity Focus Fund | 4 | — | ||||||
Equity Income Fund | 780 | 5 | ||||||
Growth and Income Fund | 30 | — | (a) | |||||
Hedged Equity Fund | 32 | — | (a) | |||||
Large Cap Growth Fund | 166 | 5 | ||||||
Large Cap Value Fund | 37 | — | (a) | |||||
U.S. Equity Fund | 146 | 3 | ||||||
| (a) | Amount rounds to less than 500. |
| 98 | J.P. MORGAN LARGE CAP FUNDS | JUNE 30, 2017 | ||||
Table of Contents
D. Service Fees — The Trusts, on behalf of the Funds, have entered into Shareholder Servicing Agreements with JPMDS under which JPMDS provides certain support services to the shareholders. The Class R6 Shares do not charge a service fee. For performing these services, JPMDS receives a fee that is accrued daily and paid monthly equal to a percentage of the average daily net assets as shown in the table below:
| Class A | Class C | Class I | Class L | Class R2 | Class R3 | Class R4 | Class R5* | |||||||||||||||||||||||||
Disciplined Equity Fund | 0.25 | % | n/a | 0.25 | % | 0.10 | % | n/a | n/a | n/a | n/a | |||||||||||||||||||||
Dynamic Growth Fund | 0.25 | 0.25 | % | 0.25 | n/a | n/a | n/a | n/a | 0.10 | % | ||||||||||||||||||||||
Equity Focus Fund | 0.25 | 0.25 | 0.25 | n/a | n/a | n/a | n/a | n/a | ||||||||||||||||||||||||
Equity Income Fund | 0.25 | 0.25 | 0.25 | n/a | 0.25 | % | 0.25 | % | 0.25 | % | 0.10 | |||||||||||||||||||||
Growth and Income Fund | 0.25 | 0.25 | 0.25 | n/a | 0.25 | n/a | n/a | 0.10 | ||||||||||||||||||||||||
Hedged Equity Fund | 0.25 | 0.25 | 0.25 | n/a | n/a | n/a | n/a | 0.10 | ||||||||||||||||||||||||
Large Cap Growth Fund | 0.25 | 0.25 | 0.25 | n/a | 0.25 | 0.25 | 0.25 | 0.10 | ||||||||||||||||||||||||
Large Cap Value Fund | 0.25 | 0.25 | 0.25 | n/a | 0.25 | n/a | n/a | 0.10 | ||||||||||||||||||||||||
U.S. Equity Fund | 0.25 | 0.25 | 0.25 | 0.10 | 0.25 | 0.25 | 0.25 | 0.10 | ||||||||||||||||||||||||
| * | Prior to April 3, 2017, the service fee for Class R5 Shares was 0.05%. |
JPMDS has entered into shareholder services contracts with affiliated and unaffiliated financial intermediaries who provide shareholder services and other related services to their clients or customers who invest in the Funds under which JPMDS will pay all or a portion of such fees earned to financial intermediaries for performing such services.
JPMDS waived service fees as outlined in Note 3.F.
E. Custodian and Accounting Fees — JPMCB provides portfolio custody and accounting services to the Funds. For performing these services, the Funds pay JPMCB transaction and asset-based fees that vary according to the number of transactions and positions, plus out-of-pocket expenses. The amounts paid directly to JPMCB by the Funds for custody and accounting services are included in Custodian and accounting fees on the Statements of Operations. Payments to the custodian may be reduced by credits earned by each Fund, based on uninvested cash balances held by the custodian. Such earnings credits, if any, are presented separately on the Statements of Operations.
Interest expense paid to the custodian related to cash overdrafts, if any, is included in Interest expense to affiliates on the Statements of Operations.
F. Waivers and Reimbursements — The Adviser, Administrator and/or JPMDS have contractually agreed to waive fees and/or reimburse the Funds to the extent that total annual operating expenses (excluding acquired fund fees and expenses other than certain money market fund fees as described below, dividend and interest expenses related to short sales, interest, taxes, expenses related to litigation and potential litigation and extraordinary expenses) exceed the percentages of the Funds’ respective average daily net assets as shown in the table below:
| Class A | Class C | Class I | Class L | Class R2 | Class R3 | Class R4 | Class R5 | Class R6 | ||||||||||||||||||||||||||||
Disciplined Equity Fund* | 0.60 | % | n/a | 0.35 | % | 0.45 | % | n/a | n/a | n/a | n/a | 0.25 | % | |||||||||||||||||||||||
Dynamic Growth Fund** | 1.15 | 1.65 | % | 0.90 | n/a | n/a | n/a | n/a | 0.70 | % | n/a | |||||||||||||||||||||||||
Equity Focus Fund*** | 1.15 | 1.65 | 0.90 | n/a | n/a | n/a | n/a | n/a | n/a | |||||||||||||||||||||||||||
Equity Income Fund | 1.04 | 1.54 | 0.79 | n/a | 1.29 | % | 1.04 | % | 0.79 | % | 0.59 | 0.54 | ||||||||||||||||||||||||
Growth and Income Fund | 1.04 | 1.54 | 0.79 | n/a | 1.29 | n/a | n/a | 0.59 | 0.54 | |||||||||||||||||||||||||||
Hedged Equity Fund | 0.85 | 1.35 | 0.60 | n/a | n/a | n/a | n/a | 0.40 | 0.35 | |||||||||||||||||||||||||||
Large Cap Growth Fund | 1.05 | 1.55 | 0.90 | n/a | 1.40 | **** | 1.15 | 0.90 | 0.70 | 0.65 | ||||||||||||||||||||||||||
Large Cap Value Fund | 0.93 | 1.45 | 0.80 | n/a | 1.30 | **** | n/a | n/a | 0.60 | 0.55 | ||||||||||||||||||||||||||
U.S. Equity Fund | 0.94 | 1.44 | 0.76 | 0.61 | 1.26 | **** | 1.01 | 0.76 | 0.56 | 0.51 | ||||||||||||||||||||||||||
| * | Prior to November 1, 2016, the contractual expense limitation for Disciplined Equity Fund was 0.85%, 0.60%, 0.45% and 0.35% for Class A, Class I, Class L and Class R6 Shares respectively. The contractual expense limitation percentages in the table above are in place until at least October 31, 2018. |
| ** | Prior to November 1, 2016, the contractual expense limitation for Dynamic Growth Fund was 1.19%, 1.69%, 0.94% and 0.74% for Class A, Class C, Class I and Class R5 Shares respectively. The contractual expense limitation percentages in the table above are in place until at least October 31, 2018. |
| *** | Prior to November 1, 2016, the contractual expense limitation for Equity Focus Fund was 1.25%, 1.75% and 1.00% for Class A, Class C and Class I Shares respectively. The contractual expense limitation percentages in the table above are in place until at least October 31, 2018. |
| **** | The contractual expense percentages in the table above are in place until at least October 31, 2018. For Class R2 Shares of Large Cap Growth Fund, Large Cap Value Fund and U.S. Equity Fund, the Adviser, Administrator and/or JPMDS contractually waived fees and/or reimbursed the Funds to the extent that total annual operating expenses (excluding acquired fund fees and expenses other than certain money market fund fees as described below, dividend and interest expenses related to short sales, interest, taxes, expenses related to litigation and potential litigation and extraordinary expenses) exceeded 1.30%, 1.20% and 1.19% of the Fund’s average daily net assets, respectively during the period July 1, 2016 through October 31, 2016. During the period November 1, 2016 through December 31, 2016, the Adviser, Administrator and/or JPMDS voluntarily waived fees and/or reimbursed the Funds to the extent that total annual operating expenses for Class R2 Shares of these Funds exceeded 1.30%, 1.20% and 1.19%, respectively. The Funds’ service providers are under no obligation to continue the voluntary waivers and may discontinue them at any time. |
| JUNE 30, 2017 | J.P. MORGAN LARGE CAP FUNDS | 99 | ||||||
Table of Contents
NOTES TO FINANCIAL STATEMENTS
AS OF JUNE 30, 2017 (continued)
Except as noted above, the expense limitation agreements were in effect for the year ended June 30, 2017 and the contractual expense limitation percentages in the table above are in place until at least October 31, 2017.
For the year ended June 30, 2017, the Funds’ service providers waived fees and/or reimbursed expenses for each of the Funds as follows (amounts in thousands). None of these parties expect the Funds to repay any such waived fees and reimbursed expenses in future years.
| Contractual Waivers | ||||||||||||||||||||
| Investment Advisory Fees | Administration Fees | Service Fees | Total | Contractual Reimbursements | ||||||||||||||||
Disciplined Equity Fund | $ | 2,802 | $ | 1,867 | $ | 1,459 | $ | 6,128 | $ | 184 | ||||||||||
Dynamic Growth Fund | 172 | 114 | 135 | 421 | — | |||||||||||||||
Equity Focus Fund | 151 | 83 | 22 | 256 | — | |||||||||||||||
Equity Income Fund | 14 | — | 1,844 | 1,858 | 99 | |||||||||||||||
Growth and Income Fund | 55 | 37 | 210 | 302 | — | (a) | ||||||||||||||
Hedged Equity Fund | 191 | 127 | 154 | 472 | — | (a) | ||||||||||||||
Large Cap Growth Fund | 17 | — | 8,307 | 8,324 | 38 | |||||||||||||||
Large Cap Value Fund | 17 | 11 | 270 | 298 | 1 | |||||||||||||||
U.S. Equity Fund | 15 | — | 5,944 | 5,959 | 88 | |||||||||||||||
| (a) | Amount rounds to less than 500. |
Additionally, the Funds may invest in one or more money market funds advised by the Adviser or its affiliates (affiliated money market funds). The Adviser, Administrator and/or JPMDS, as shareholder servicing agent, have contractually agreed to waive fees and/or reimburse expenses in an amount sufficient to offset the respective net fees each collects from the affiliated money market fund on the applicable Funds’ investment in such affiliated money market fund.
The amounts of waivers resulting from investments in these money market funds for the year ended June 30, 2017 were as follows (amounts in thousands):
Disciplined Equity Fund | $ | 174 | ||
Dynamic Growth Fund | 8 | |||
Equity Focus Fund | 9 | |||
Equity Income Fund | 599 | |||
Growth and Income Fund | 18 | |||
Hedged Equity Fund | 17 | |||
Large Cap Growth Fund | 215 | |||
Large Cap Value Fund | 31 | |||
U.S. Equity Fund | 277 |
G. Other — Certain officers of the Trusts are affiliated with the Adviser, the Administrator and JPMDS. Such officers, with the exception of the Chief Compliance Officer, receive no compensation from the Funds for serving in their respective roles.
The Board appointed a Chief Compliance Officer to the Funds in accordance with Federal securities regulations. Each Fund, along with other affiliated funds, makes reimbursement payments, on a pro-rata basis, to the Administrator for a portion of the fees associated with the Office of the Chief Compliance Officer. Such fees are included in Trustees’ and Chief Compliance Officer’s fees on the Statements of Operations.
The Trusts adopted a Trustee Deferred Compensation Plan (the “Plan”) which allows the Independent Trustees to defer the receipt of all or a portion of compensation related to performance of their duties as Trustees. The deferred fees are invested in various J.P. Morgan Funds until distribution in accordance with the Plan.
During the year ended June 30, 2017, Disciplined Equity Fund, Dynamic Growth Fund, Hedged Equity Fund, Large Cap Growth Fund and U.S. Equity Fund purchased securities from an underwriting syndicate in which the principal underwriter or members of the syndicate were affiliated with the Adviser.
The Funds may use related party broker-dealers. For the year ended June 30, 2017, the Funds incurred brokerage commissions with broker dealers affiliated with the Adviser as follows (amounts in thousands):
Disciplined Equity Fund | $ | — | (a) | |
Dynamic Growth Fund | — | (a) | ||
Equity Focus Fund | — | (a) | ||
Equity Income Fund | 1 | |||
Hedged Equity Fund | — | (a) | ||
Large Cap Growth Fund | 1 | |||
Large Cap Value Fund | — | (a) | ||
U.S. Equity Fund | 1 |
| (a) | Amount rounds to less than 500. |
| 100 | J.P. MORGAN LARGE CAP FUNDS | JUNE 30, 2017 | ||||
Table of Contents
The Securities and Exchange Commission (“SEC”) has granted an exemptive order permitting the Funds to engage in principal transactions with J.P. Morgan Securities, Inc., an affiliated broker, involving taxable money market instruments, subject to certain conditions.
4. Investment Transactions
During the year ended June 30, 2017, purchases and sales of investments (excluding short-term investments) were as follows (amounts in thousands):
| Purchases (excluding U.S. Government) | Sales (excluding U.S. Government) | |||||||
Disciplined Equity Fund | $ | 3,000,839 | $ | 4,991,048 | ||||
Dynamic Growth Fund | 131,509 | 230,486 | ||||||
Equity Focus Fund | 135,930 | 121,576 | ||||||
Equity Income Fund | 3,539,089 | 1,817,890 | ||||||
Growth and Income Fund | 143,552 | 162,462 | ||||||
Hedged Equity Fund | 589,104 | 123,554 | ||||||
Large Cap Growth Fund | 2,733,803 | 7,324,313 | ||||||
Large Cap Value Fund | 1,393,044 | 1,239,301 | ||||||
U.S. Equity Fund | 11,008,183 | 11,299,738 | ||||||
During the year ended June 30, 2017, there were no purchases or sales of U.S. Government securities.
5. Federal Income Tax Matters
For Federal income tax purposes, the estimated cost and unrealized appreciation (depreciation) in value of investment securities held at June 30, 2017 were as follows (amounts in thousands):
Aggregate Cost | Gross Unrealized Appreciation | Gross Unrealized Depreciation | Net Unrealized Appreciation (Depreciation) | |||||||||||||
Disciplined Equity Fund | $ | 5,873,906 | $ | 1,675,055 | $ | 123,687 | $ | 1,551,368 | ||||||||
Dynamic Growth Fund | 206,713 | 115,410 | 317 | 115,093 | ||||||||||||
Equity Focus Fund | 156,488 | 32,981 | 3,313 | 29,668 | ||||||||||||
Equity Income Fund | 11,486,323 | 3,749,265 | 298,806 | 3,450,459 | ||||||||||||
Growth and Income Fund | 362,024 | 188,320 | 10,369 | 177,951 | ||||||||||||
Hedged Equity Fund | 726,062 | 81,939 | 12,943 | 68,996 | ||||||||||||
Large Cap Growth Fund | 7,217,319 | 5,140,791 | 32,005 | 5,108,786 | ||||||||||||
Large Cap Value Fund | 924,512 | 139,289 | 18,092 | 121,197 | ||||||||||||
U.S. Equity Fund | 10,663,720 | 3,737,217 | 131,754 | 3,605,463 | ||||||||||||
The difference between book and tax basis appreciation (depreciation) on investments is primarily attributed to wash sale loss deferrals and non-taxable dividends.
The tax character of distributions paid during the year ended June 30, 2017 was as follows (amounts in thousands):
Ordinary Income* | Net Long-Term Capital Gains | Return of Capital | Total Distribution Paid | |||||||||||||
Disciplined Equity Fund | $ | 129,537 | $ | — | $ | 6,246 | $ | 135,783 | ||||||||
Dynamic Growth Fund | — | 4,105 | — | 4,105 | ||||||||||||
Equity Focus Fund | 848 | 1,213 | — | 2,061 | ||||||||||||
Equity Income Fund | 256,770 | 66,179 | — | 322,949 | ||||||||||||
Growth and Income Fund | 7,975 | 23,154 | — | 31,129 | ||||||||||||
Hedged Equity Fund | 5,217 | — | — | 5,217 | ||||||||||||
Large Cap Growth Fund | — | 1,111,903 | — | 1,111,903 | ||||||||||||
Large Cap Value Fund | 19,124 | 26,974 | — | 46,098 | ||||||||||||
U.S. Equity Fund | 134,307 | 439,676 | — | 573,983 | ||||||||||||
| * | Short-term gains are treated as ordinary income for income tax purposes. |
| JUNE 30, 2017 | J.P. MORGAN LARGE CAP FUNDS | 101 | ||||||
Table of Contents
NOTES TO FINANCIAL STATEMENTS
AS OF JUNE 30, 2017 (continued)
The tax character of distributions paid during the year ended June 30, 2016 was as follows (amounts in thousands):
| Ordinary Income* | Net Long-Term Capital Gains | Total Distributions Paid | ||||||||||
Disciplined Equity Fund | $ | 306,286 | $ | 154,626 | $ | 460,912 | ||||||
Dynamic Growth Fund | — | 3,697 | 3,697 | |||||||||
Equity Focus Fund | 772 | 1,551 | 2,323 | |||||||||
Equity Income Fund | 209,446 | 81,435 | 290,881 | |||||||||
Growth and Income Fund | 8,227 | 24,955 | 33,182 | |||||||||
Hedged Equity Fund | 2,951 | — | 2,951 | |||||||||
Large Cap Growth Fund | — | 685,998 | 685,998 | |||||||||
Large Cap Value Fund | 32,026 | 66,050 | 98,076 | |||||||||
U.S. Equity Fund | 216,055 | 549,390 | 765,445 | |||||||||
| * | Short-term gains are treated as ordinary income for income tax purposes. |
As of June 30, 2017, the estimated components of net assets (excluding paid-in-capital) on a tax basis were as follows (amounts in thousands):
Current Distributable Ordinary Income | Current Distributable Long-Term Capital Gain | Tax Basis Capital Loss Carryover | Unrealized Appreciation (Depreciation) | |||||||||||||||||
Disciplined Equity Fund | $ | — | $ | — | $ | (218,314 | ) | $ | 1,551,368 | |||||||||||
Dynamic Growth Fund | 309 | 25,990 | — | 115,093 | ||||||||||||||||
Equity Focus Fund | 2,756 | 6,552 | — | 29,668 | ||||||||||||||||
Equity Income Fund | 24,865 | 39,130 | — | 3,450,459 | ||||||||||||||||
Growth and Income Fund | 857 | 9,239 | — | 177,951 | ||||||||||||||||
Hedged Equity Fund | 37 | — | (12,203 | ) | 68,996 | |||||||||||||||
Large Cap Growth Fund | 82,304 | 1,154,741 | — | 5,108,786 | ||||||||||||||||
Large Cap Value Fund | 70,286 | 20,469 | — | 121,197 | ||||||||||||||||
U.S. Equity Fund | 75,575 | 716,473 | — | 3,605,463 | ||||||||||||||||
For the Funds, the cumulative timing differences primarily consist of post-October capital loss deferrals, wash sale loss deferrals and non-taxable dividends.
Under the Regulated Investment Company Modernization Act of 2010 (the “Act”), net capital losses recognized by the Funds after June 30, 2011 are carried forward indefinitely, and retain their character as short-term and/or long-term losses. Prior to the Act, net capital losses incurred by the Funds were carried forward for eight years and treated as short-term losses. The Act requires that post-enactment net capital losses be used before pre-enactment net capital losses.
As of June 30, 2017, the following Funds had post-enactment net capital loss carryforwards (amounts in thousands):
| Post-enactment Net Capital Loss | ||||||||
| Short-Term | Long-Term | |||||||
Disciplined Equity Fund | $ | 218,314 | $ | — | ||||
Hedged Equity Fund | 4,412 | 7,791 | ||||||
During the year ended June 30, 2017, the following Fund utilized post-enactment capital loss carryforwards as follows (amount in thousands):
Hedged Equity Fund | $ | 992 |
During the year ended June 30, 2017, the following Fund utilized pre-enactment capital loss carryforwards as follows (amount in thousands):
Large Cap Value Fund | $ | 1,637 |
Late year ordinary losses incurred after December 31 as well as net capital losses after October 31 and within the taxable year are deemed to arise on the first business day of the Funds’ next taxable year. For the year ended June 30, 2017, the following Funds deferred to July 1, 2017 net capital losses and late year ordinary losses of (amounts in thousands):
| Net Capital Loss | ||||||||||||
| Short-Term | Long-Term | Late Year Ordinary Loss | ||||||||||
Dynamic Growth Fund | $ | — | $ | — | $ | 157 | ||||||
Hedged Equity Fund | 3,511 | 6,707 | — | |||||||||
| 102 | J.P. MORGAN LARGE CAP FUNDS | JUNE 30, 2017 | ||||
Table of Contents
6. Borrowings
The Funds rely upon an exemptive order granted by the SEC (the “Order”) permitting the establishment and operation of an Interfund Lending Facility (the “Facility”). The Facility allows the Funds to directly lend and borrow money to or from any other fund relying upon the Order at rates beneficial to both the borrowing and lending funds. Advances under the Facility are taken primarily for temporary or emergency purposes, including the meeting of redemption requests that otherwise might require the untimely disposition of securities, and are subject to each Fund’s borrowing restrictions. The Interfund loan rate is determined, as specified in the Order, by averaging the current repurchase agreement rate and the current bank loan rate. The Order was granted to JPM II and may be relied upon by the Funds because the Funds and the series of JPM II are all investment companies in the same “group of investment companies” (as defined in Section 12(d)(1)(G) of the 1940 Act).
The Trusts and JPMCB have entered into a financing arrangement. Under this arrangement, JPMCB provides an unsecured, uncommitted credit facility in the aggregate amount of $100 million to certain of the J.P. Morgan Funds, including the Funds. Advances under the arrangement are taken primarily for temporary or emergency purposes, including the meeting of redemption requests that otherwise might require the untimely disposition of securities, and are subject to each Fund’s borrowing restrictions. Interest on borrowings is payable at a rate determined by JPMCB at the time of borrowing. This agreement has been extended until November 6, 2017.
The Funds had no borrowings outstanding from another fund or from the unsecured, uncommitted credit facility during the year ended June 30, 2017. Average borrowings from the Facility for the year ended June 30, 2017, were as follows (amounts in thousands).
| Average Borrowings | Average Interest Rate Paid | Number of Days Outstanding | Interest Paid | |||||||||||||
Dynamic Growth Fund | $ | 2,947 | 1.21 | % | 1 | $ | — | (a) | ||||||||
Large Cap Growth Fund | 11,849 | 1.15 | 5 | 1 | ||||||||||||
| (a) | Amount rounds to less than 500. |
Interest expense paid as a result of borrowings from another fund or from the unsecured, uncommitted credit facility is included in Interest expense to affiliates on the Statements of Operations.
In addition, effective August 16, 2016, the Trust along with certain other trusts (“Borrowers”) entered into a joint syndicated senior unsecured revolving credit facility totaling $1.5 billion (“Credit Facility”) with various lenders and The Bank of New York Mellon, as administrative agent for the lenders. This Credit Facility provides a source of funds to the Borrowers for temporary and emergency purposes, including the meeting of redemption requests that otherwise might require the untimely disposition of securities. Under the terms of the Credit Facility, a borrowing fund must have a minimum of $25,000,000 in adjusted net asset value and not exceed certain adjusted net asset coverage ratios prior to and during the time in which any borrowings are outstanding. If a fund does not comply with the aforementioned requirements, the fund must remediate within three business days with respect to the $25,000,000 minimum adjusted net asset value or within one business day with respect to certain asset coverage ratios or the administrative agent at the request of, or with the consent of, the lenders may terminate the Credit Facility and declare any outstanding borrowings to be due and payable immediately.
Interest associated with any borrowing under the Credit Facility is charged to the borrowing fund at a rate of interest equal to 1.00% plus the greater of the federal funds effective rate or one month LIBOR. The annual commitment fee to maintain the Credit Facility is 0.15% and is incurred on the unused portion of the Credit Facility and is allocated to all participating funds pro rata based on their respective net assets. Effective August 15, 2017, this agreement has been amended and restated for a term of 364 days, unless extended.
The Funds had no borrowings outstanding from the Credit Facility at June 30, 2017. Average borrowings from the Credit Facility for, or at any time during the year ended June 30, 2017, were as follows (amounts in thousands):
Average Borrowings | Average Interest Rate Paid | Number of Days Outstanding | Interest Paid | |||||||||||||
Equity Focus Fund | $ | 500 | 1.53 | % | 1 | $ | — | (a) | ||||||||
| (a) | Amount rounds to less than 500. |
7. Risks, Concentrations and Indemnifications
In the normal course of business, the Funds enter into contracts that contain a variety of representations which provide general indemnifications. Each Fund’s maximum exposure under these arrangements is unknown. The amount of exposure would depend on future claims that may be made against each Fund that have not yet occurred. However, based on experience, the Funds expect the risk of loss to be remote.
| JUNE 30, 2017 | J.P. MORGAN LARGE CAP FUNDS | 103 | ||||||
Table of Contents
NOTES TO FINANCIAL STATEMENTS
AS OF JUNE 30, 2017 (continued)
As of June 30, 2017, J.P. Morgan Access Funds, Investor Funds and JPMorgan SmartRetirement Funds, which are affiliated funds of funds, owned in the aggregate shares representing more than 10% of the net assets of the following Funds:
| J.P. Morgan Access Funds | J.P. Morgan Investor Funds | JPMorgan SmartRetirement Funds | ||||||||||
Disciplined Equity Fund | n/a | n/a | 62.8 | % | ||||||||
Dynamic Growth Fund | n/a | 59.1 | % | n/a | ||||||||
Equity Focus Fund | 14.9 | % | n/a | n/a | ||||||||
Large Cap Value Fund | n/a | 55.9 | n/a | |||||||||
U.S. Equity Fund | n/a | n/a | 23.8 | |||||||||
As of June 30, 2017, the Funds had omnibus accounts which owned more than 10% of the Funds’ outstanding shares as follows:
| Number of Affiliated Omnibus Accounts | % of the Fund | Number of Non-Affiliated Omnibus Accounts | % of the Fund | |||||||||||||
Dynamic Growth Fund | — | — | 3 | 18.7 | % | |||||||||||
Equity Focus Fund | 4 | 80.6 | — | — | ||||||||||||
Growth and Income Fund | 2 | 22.2 | — | — | ||||||||||||
Hedged Equity Fund | — | — | 7 | 56.2 | ||||||||||||
Large Cap Growth Fund | — | — | 3 | 10.2 | ||||||||||||
U.S. Equity Fund | 3 | 12.6 | — | — | ||||||||||||
Significant shareholder transactions by these shareholders may impact the Funds’ performance.
8. Investment Company Reporting Modernization
In October 2016, the U.S. Securities and Exchange Commission adopted new rules and forms, and amendments to certain current rules and forms, to modernize the reporting and disclosure of information by registered investment companies. In part, the final rules amend Regulation S-X and will require standardized, enhanced disclosures about derivatives in investment company financial statements, as well as other amendments. The amendments to Regulation S-X will apply to Funds’ fiscal year ends on or after August 1, 2017. At this time, management is currently evaluating
the impact of the Regulation S-X amendments on the Funds’ financial statements and related disclosures. The adoption will have no effect on the Funds’ net assets or results of operations.
9. Business Combinations
On June 21, 2017, the Boards of the JPM I and JPM II approved the reorganization of the Dynamic Growth Fund, a fund of JPM I, into the Large Cap Growth Fund, a fund of JPM II. Completion of the reorganization is subject to a number of conditions, including approval by the shareholders of the Dynamic Growth Fund. This approval will be sought at a shareholder meeting expected to be held on October 10, 2017. If approved by shareholders, the reorganization is expected to occur on or about October 27, 2017.
| 104 | J.P. MORGAN LARGE CAP FUNDS | JUNE 30, 2017 | ||||
Table of Contents
REPORT OF INDEPENDENT REGISTERED PUBLIC ACCOUNTING FIRM
To the Board of Trustees of JPMorgan Trust I and JPMorgan Trust II and the Shareholders of JPMorgan Disciplined Equity Fund, JPMorgan Dynamic Growth Fund, JPMorgan Equity Focus Fund, JPMorgan Equity Income Fund, JPMorgan Growth and Income Fund, JPMorgan Hedged Equity Fund, JPMorgan Large Cap Growth Fund, JPMorgan Large Cap Value Fund and JPMorgan U.S. Equity Fund
In our opinion, the accompanying statements of assets and liabilities, including the schedules of portfolio investments, and the related statements of operations and of changes in net assets and the financial highlights present fairly, in all material respects, the financial position of JPMorgan Disciplined Equity Fund, JPMorgan Dynamic Growth Fund, JPMorgan Equity Focus Fund, JPMorgan Growth and Income Fund, JPMorgan Hedged Equity Fund and JPMorgan U.S. Equity Fund (each a separate series of JPMorgan Trust I) and JPMorgan Equity Income Fund, JPMorgan Large Cap Growth Fund and JPMorgan Large Cap Value Fund (each a separate series of JPMorgan Trust II) (hereafter collectively referred to as the “Funds”) as of June 30, 2017, the results of each of their operations for the year then ended, the changes in each of their net assets for each of the two years in the period then ended and the financial highlights for each of the periods indicated therein, in conformity with accounting principles generally accepted in the United States of America. These financial statements and financial highlights (hereafter referred to as “financial statements”) are the responsibility of the Funds’ management. Our responsibility is to express an opinion on these financial statements based on our audits. We conducted our audits of these financial statements in accordance with the standards of the Public Company Accounting Oversight Board (United States). Those standards require that we plan and perform the audit to obtain reasonable assurance about whether the financial statements are free of material misstatement. An audit includes examining, on a test basis, evidence supporting the amounts and disclosures in the financial statements, assessing the accounting principles used and significant estimates made by management, and evaluating the overall financial statement presentation. We believe that our audits, which included confirmation of securities as of June 30, 2017 by correspondence with the transfer agent, custodian and brokers, provide a reasonable basis for our opinions.
PricewaterhouseCoopers LLP
New York, New York
August 25, 2017
| JUNE 30, 2017 | J.P. MORGAN LARGE CAP FUNDS | 105 | ||||||
Table of Contents
(Unaudited)
The Funds’ Statement of Additional Information includes additional information about the Funds’ Trustees and is available, without charge, upon request by calling 1-800-480-4111 or on the J.P. Morgan Funds’ website at www.jpmorganfunds.com.
Name (Year of Birth); Positions With the Funds (1) | Principal Occupations During Past 5 Years | Number of Portfolios in Fund Complex Overseen by Trustee (2) | Other Directorships Held Outside Fund Complex During Past 5 Years | |||
Independent Trustees | ||||||
| John F. Finn (1947); Trustee of Trusts since 2005; Trustee of heritage One Group Mutual Funds since 1998. | Chairman (1985-present), Chief Executive Officer, Gardner, Inc. (supply chain management company serving industrial and consumer markets) (1974-present). | 150 | Director, Greif, Inc. (GEF) (industrial package products and services) (2007-present); Trustee, Columbus Association for the Performing Arts (1988-present); Director, Cardinal Health, Inc. (CAH) (1994-2014). | |||
| Dr. Matthew Goldstein (1941); Chairman since 2013; Trustee of Trusts since 2005; Trustee of heritage J.P. Morgan Funds since 2003. | Chancellor Emeritus, City University of New York (2015-present); Professor, City University of New York (2013-present); Chancellor, City University of New York (1999-2013); President, Adelphi University (New York) (1998-1999). | 150 | Trustee, Museum of Jewish Heritage (2011-present); Trustee, National Museum of Mathematics (present); Chair, Association of College and University Administrators (present). | |||
| Dennis P. Harrington (1950); Trustee of Trusts since 2017. | Retired; Partner, Deloitte LLP (1984-2012). | 149 | None | |||
| Frankie D. Hughes (1952); Trustee of Trusts since 2008. | President, Ashland Hughes Properties (property management) (2014-present); President and Chief Investment Officer, Hughes Capital Management, Inc. (fixed income asset management) (1993-2014). | 150 | None | |||
Raymond Kanner (1953); Trustee of the Trusts since 2017. | Retired; Managing Director & Chief Investment Officer, IBM Retirement Funds (2007-2016). | 149 | Director, Emerging Markets Growth Fund (1997-2016); Acting Executive Director, 2016-17, Committee on Investment of Employee Benefit Assets (CIEBA), 2016-17; Advisory Board Member, Betterment for Business (2016-present) (robo advisor); Advisory Board Member, Blue Star Indexes (2013-present) (index creator); Member, Russell Index Client Advisory Board (2001-2015). | |||
| Peter C. Marshall (1942); Trustee of Trusts since 2005; Trustee of heritage One Group Mutual Funds since 1985. | Self-employed business consultant (2002-present). | 150 | None | |||
| Mary E. Martinez (1960); Trustee of Trusts since 2013. | Associate, Special Properties, a Christie’s International Real Estate Affiliate (2010-present); Managing Director, Bank of America (Asset Management) (2007-2008); Chief Operating Officer, U.S. Trust Asset Management, U.S. Trust Company (asset management) (2003-2007); President, Excelsior Funds (registered investment companies) (2004-2005). | 150 | None | |||
| Marilyn McCoy* (1948); Trustee of Trusts since 2005; Trustee of heritage One Group Mutual Funds since 1999. | Vice President of Administration and Planning, Northwestern University (1985-present). | 150 | None | |||
| 106 | J.P. MORGAN LARGE CAP FUNDS | JUNE 30, 2017 | ||||
Table of Contents
Name (Year of Birth); Positions With the Funds (1) | Principal Occupations During Past 5 Years | Number of Portfolios in Fund Complex Overseen by Trustee (2) | Other Directorships Held Outside Fund Complex During Past 5 Years | |||
Independent Trustees (continued) | ||||||
| Mitchell M. Merin (1953); Trustee of Trusts since 2013. | Retired; President and Chief Operating Officer, Morgan Stanley Investment Management, Member Morgan Stanley & Co. Management Committee (registered investment adviser) (1985-2005). | 150 | Director, Sun Life Financial (SLF) (2007-2013) (financial services and insurance). | |||
| Dr. Robert A. Oden, Jr. (1946); Trustee of Trusts since 2005; Trustee of heritage One Group Mutual Funds since 1997. | Retired; President, Carleton College (2002-2010); President, Kenyon College (1995-2002). | 150 | Chairman, Dartmouth-Hitchcock Medical Center (2011-present); Trustee, American Schools of Oriental Research (2011-present); Trustee, American University in Cairo (1999-2014); Trustee, American Museum of Fly Fishing (2013-present). | |||
| Marian U. Pardo** (1946); Trustee of Trusts since 2013. | Managing Director and Founder, Virtual Capital Management LLC (Investment Consulting) (2007-present); Managing Director, Credit Suisse Asset Management (portfolio manager) (2003-2006). | 150 | Member, Board of Governors, Columbus Citizens Foundation (not-for-profit supporting philanthropic and cultural programs) (2006-present). | |||
| Frederick W. Ruebeck (1939); Trustee of Trusts since 2005; Trustee of heritage One Group Mutual Funds since 1994. | Consultant (2000-present); Advisor, JP Greene & Associates, LLC (broker-dealer) (2000-2009); Chief Investment Officer, Wabash College (2004-2015); Director of Investments, Eli Lilly and Company (pharmaceuticals) (1988-1999). | 150 | Trustee, Wabash College (2000-present)._ | |||
| James J. Schonbachler (1943); Trustee of Trusts since 2005; Trustee of heritage J.P. Morgan Funds since 2001. | Retired; Managing Director of Bankers Trust Company (financial services) (1968-1998). | 150 | None | |||
| (1) | The Trustees serve for an indefinite term, subject to the Trusts’ current retirement policy, which is age 78 for all Trustees. |
| (2) | A Fund Complex means two or more registered investment companies that hold themselves out to investors as related companies for purposes of investment and investor services or have a common investment adviser or have an investment adviser that is an affiliated person of the investment adviser of any of the other registered investment companies. The J.P. Morgan Funds Complex for which the Board of Trustees serves currently includes twelve registered investment companies (150 funds). |
| * | Two members of the Board of Trustees of Northwestern University are executive officers of registered investment advisers (not affiliated with JPMorgan) that are under common control with sub-advisers to certain J.P. Morgan Funds. |
| ** | In connection with prior employment with JPMorgan Chase, Ms. Pardo was the recipient of non-qualified pension plan payments from JPMorgan Chase in the amount of approximately $2,055 per month, which she irrevocably waived effective January 1, 2013, and deferred compensation payments from JPMorgan Chase in the amount of approximately $7,294 per year, which ended in January 2013. In addition, Ms. Pardo receives payments from a fully-funded qualified plan, which is not an obligation of JPMorgan Chase. |
The contact address for each of the Trustees is 270 Park Avenue, New York, NY 10017.
| JUNE 30, 2017 | J.P. MORGAN LARGE CAP FUNDS | 107 | ||||||
Table of Contents
(Unaudited)
Name (Year of Birth), Positions Held with the Trusts (Since) | Principal Occupations During Past 5 Years | |
| Brian S. Shlissel (1964), President and Principal Executive Officer (2016) | Managing Director and Chief Administrative Officer for J.P. Morgan pooled vehicles, J.P. Morgan Investment Management Inc. (formerly JPMorgan Funds Management, Inc.) (2014 – present); Managing Director and Head of Mutual Fund Services, Allianz Global Investors; President and Chief Executive Officer, Allianz Global Investors Mutual Funds and PIMCO Closed-End Funds (1999-2014) | |
| Laura M. Del Prato (1964), Treasurer and Principal Financial Officer (2014)* | Managing Director, J.P. Morgan Investment Management Inc. (formerly JPMorgan Funds Management, Inc.) since 2014; Partner, Cohen Fund Audit Services, Ltd. (2012-2013); Partner (2004-2012) and various other titles (1990-2004) at KPMG, LLP. | |
| Frank J. Nasta (1964), Secretary (2008) | Managing Director and Associate General Counsel, JPMorgan Chase since 2008. | |
| Stephen M. Ungerman (1953), Chief Compliance Officer (2005) | Managing Director, JPMorgan Chase & Co.; Mr. Ungerman has been with JPMorgan Chase & Co. since 2000. | |
Elizabeth A. Davin (1964), Assistant Secretary (2005)* | Executive Director and Assistant General Counsel, JPMorgan Chase since February 2012; formerly Vice President and Assistant General Counsel, JPMorgan Chase from 2005 to February 2012; Senior Counsel, JPMorgan Chase (formerly Bank One Corporation) from 2004 to 2005. | |
| Jessica K. Ditullio (1962), Assistant Secretary (2005)* | Executive Director and Assistant General Counsel, JPMorgan Chase. Ms. Ditullio has been with JPMorgan Chase (formerly Bank One Corporation) since 1990. | |
| John T. Fitzgerald (1975), Assistant Secretary (2008) | Executive Director and Assistant General Counsel, JPMorgan Chase. Mr. Fitzgerald has been with JPMorgan Chase since 2005. | |
| Carmine Lekstutis (1980), Assistant Secretary (2011) | Executive Director and Assistant General Counsel, JPMorgan Chase since February 2015; formerly Vice President and Assistant General Counsel, JPMorgan Chase from 2011 to February 2015. | |
| Gregory S. Samuels (1980), Assistant Secretary (2010) | Executive Director and Assistant General Counsel, JPMorgan Chase since 2014; formerly Vice President and Assistant General Counsel, JPMorgan Chase since 2010. | |
| Pamela L. Woodley (1971), Assistant Secretary (2012)** | Vice President and Assistant General Counsel, JPMorgan Chase since November 2004. | |
Zachary E. Vonnegut-Gabovitch (1986) Assistant Secretary (2017) | Vice President and Assistant General Counsel, JPMorgan Chase since September 2016; Associate, Morgan, Lewis & Bockius (law firm) from 2012 to 2016. | |
Michael M. D’Ambrosio (1969), Assistant Treasurer (2012) | Managing Director, J.P. Morgan Investment Management Inc. (formerly JPMorgan Funds Management, Inc.) since May 2014; formerly Executive Director, JPMorgan Funds Management, Inc. from 2012 to May 2014; prior to joining JPMorgan Chase, Mr. D’Ambrosio was a Tax Director at PricewaterhouseCoopers LLP since 2006. | |
Lauren A. Paino (1973), Assistant Treasurer (2014)** | Executive Director, J.P. Morgan Investment Management Inc. (formerly JPMorgan Funds Management, Inc.) since August 2013; formerly Director, Credit Suisse Asset Management from 2000-2013. | |
| Joseph Parascondola (1963), Assistant Treasurer (2011)** | Vice President, J.P. Morgan Investment Management Inc. (formerly JPMorgan Funds Management, Inc.) since August 2006. | |
| Matthew J. Plastina (1970), Assistant Treasurer (2011)** | Executive Director, J.P. Morgan Investment Management Inc. (formerly JPMorgan Funds Management, Inc.) since February 2016; Vice President, JPMorgan Funds Management, Inc. from 2010 to January 2016. | |
Gillian I. Sands (1969), Assistant Treasurer (2012)** | Vice President, J.P. Morgan Investment Management Inc. (formerly JPMorgan Funds Management, Inc.) since September 2012; Assistant Treasurer, Wells Fargo Funds Management (2007-2009). | |
The contact address for each of the officers, unless otherwise noted, is 270 Park Avenue, New York, NY 10017.
| * | The contact address for the officer is 1111 Polaris Parkway, Columbus, OH 43240. |
| ** | The contact address for the officer is 4 New York Plaza, New York, NY 10004. |
| 108 | J.P. MORGAN LARGE CAP FUNDS | JUNE 30, 2017 | ||||
Table of Contents
SCHEDULE OF SHAREHOLDER EXPENSES
(Unaudited)
Hypothetical $1,000 Investment
As a shareholder of the Funds, you incur two types of costs: (1) transaction costs, including sales charges (loads) on purchase payments and (2) ongoing costs, including investment advisory fees, administration fees, distribution fees and other Fund expenses. The examples below are intended to help you understand your ongoing costs (in dollars) of investing in the Funds and to compare these ongoing costs with the ongoing costs of investing in other mutual funds. The examples assume that you had a $1,000 investment in each Class at the beginning of the reporting period, January 1, 2017 and continued to hold your shares at the end of the reporting period, June 30, 2017.
Actual Expenses
For each Class of each Fund in the table below, the first line provides information about actual account values and actual expenses. You may use the information in this line, together with the amount you invested, to estimate the expenses that you paid over the period. Simply divide your account value by $1,000 (for example, an $8,600 account value divided by $1,000 = 8.6), then multiply the result by the number in the first line of each Class under the heading entitled “Expenses Paid During the Period” to estimate the expenses you paid on your account during this period.
Hypothetical Example for Comparison Purposes
The second line of each Class in the table below provides information about hypothetical account values and hypothetical expenses based on the Class’ actual expense ratio and an assumed rate of return of 5% per year before expenses, which is not the Class’ actual return. The hypothetical account values and expenses may not be used to estimate the actual ending account balance or expenses you paid for the period. You may use this information to compare the ongoing costs of investing in the Class of the Fund and other funds. To do so, compare this 5% hypothetical example with the 5% hypothetical examples that appear in the shareholder reports of the other funds. Please note that the expenses shown in the table are meant to highlight your ongoing costs only and do not reflect any transaction costs, such as sales charges (loads) or redemption fees. Therefore, the second line for each Class in the table is useful in comparing ongoing costs only, and will not help you determine the relative total costs of owning different funds. In addition, if these transaction costs were included, your costs would have been higher. The examples also assume all dividends and distributions have been reinvested.
| Beginning Account Value January 1, 2017 | Ending Account Value June 30, 2017 | Expenses Paid During the Period* | Annualized Expense Ratio | |||||||||||||
Disciplined Equity Fund | ||||||||||||||||
Class A | ||||||||||||||||
Actual | $ | 1,000.00 | $ | 1,090.00 | $ | 3.11 | 0.60 | % | ||||||||
Hypothetical | 1,000.00 | 1,021.82 | 3.01 | 0.60 | ||||||||||||
Class I (formerly Select Class) | ||||||||||||||||
Actual | 1,000.00 | 1,091.40 | 1.81 | 0.35 | ||||||||||||
Hypothetical | 1,000.00 | 1,023.06 | 1.76 | 0.35 | ||||||||||||
Class L (formerly Institutional Class) | ||||||||||||||||
Actual | 1,000.00 | 1,091.40 | 1.97 | 0.38 | ||||||||||||
Hypothetical | 1,000.00 | 1,022.91 | 1.91 | 0.38 | ||||||||||||
Class R6 | ||||||||||||||||
Actual | 1,000.00 | 1,092.00 | 1.30 | 0.25 | ||||||||||||
Hypothetical | 1,000.00 | 1,023.55 | 1.25 | 0.25 | ||||||||||||
Dynamic Growth Fund | ||||||||||||||||
Class A | ||||||||||||||||
Actual | 1,000.00 | 1,211.70 | 6.31 | 1.15 | ||||||||||||
Hypothetical | 1,000.00 | 1,019.09 | 5.76 | 1.15 | ||||||||||||
Class C | ||||||||||||||||
Actual | 1,000.00 | 1,208.70 | 9.04 | 1.65 | ||||||||||||
Hypothetical | 1,000.00 | 1,016.61 | 8.25 | 1.65 | ||||||||||||
Class I (formerly Select Class) | ||||||||||||||||
Actual | 1,000.00 | 1,213.30 | 4.94 | 0.90 | ||||||||||||
Hypothetical | 1,000.00 | 1,020.33 | 4.51 | 0.90 | ||||||||||||
Class R5 | ||||||||||||||||
Actual | 1,000.00 | 1,214.20 | 3.84 | 0.70 | ||||||||||||
Hypothetical | 1,000.00 | 1,021.32 | 3.51 | 0.70 | ||||||||||||
| JUNE 30, 2017 | J.P. MORGAN LARGE CAP FUNDS | 109 | ||||||
Table of Contents
SCHEDULE OF SHAREHOLDER EXPENSES
(Unaudited) (continued)
Hypothetical $1,000 Investment
| Beginning Account Value January 1, 2017 | Ending Account Value June 30, 2017 | Expenses Paid During the Period* | Annualized Expense Ratio | |||||||||||||
Equity Focus Fund | ||||||||||||||||
Class A | ||||||||||||||||
Actual | $ | 1,000.00 | $ | 1,109.00 | $ | 5.96 | 1.14 | % | ||||||||
Hypothetical | 1,000.00 | 1,019.14 | 5.71 | 1.14 | ||||||||||||
Class C | ||||||||||||||||
Actual | 1,000.00 | 1,106.40 | 8.57 | 1.64 | ||||||||||||
Hypothetical | 1,000.00 | 1,016.66 | 8.20 | 1.64 | ||||||||||||
Class I (formerly Select Class) | ||||||||||||||||
Actual | 1,000.00 | 1,110.50 | 4.66 | 0.89 | ||||||||||||
Hypothetical | 1,000.00 | 1,020.38 | 4.46 | 0.89 | ||||||||||||
Equity Income Fund | ||||||||||||||||
Class A | ||||||||||||||||
Actual | 1,000.00 | 1,054.80 | 5.30 | 1.04 | ||||||||||||
Hypothetical | 1,000.00 | 1,019.64 | 5.21 | 1.04 | ||||||||||||
Class C | ||||||||||||||||
Actual | 1,000.00 | 1,052.20 | 7.84 | 1.54 | ||||||||||||
Hypothetical | 1,000.00 | 1,017.16 | 7.70 | 1.54 | ||||||||||||
Class I (formerly Select Class) | ||||||||||||||||
Actual | 1,000.00 | 1,056.40 | 3.98 | 0.78 | ||||||||||||
Hypothetical | 1,000.00 | 1,020.93 | 3.91 | 0.78 | ||||||||||||
Class R2 | ||||||||||||||||
Actual | 1,000.00 | 1,053.90 | 6.57 | 1.29 | ||||||||||||
Hypothetical | 1,000.00 | 1,018.40 | 6.46 | 1.29 | ||||||||||||
Class R3 | ||||||||||||||||
Actual | 1,000.00 | 1,055.20 | 5.25 | 1.03 | ||||||||||||
Hypothetical | 1,000.00 | 1,019.69 | 5.16 | 1.03 | ||||||||||||
Class R4 | ||||||||||||||||
Actual | 1,000.00 | 1,056.50 | 3.98 | 0.78 | ||||||||||||
Hypothetical | 1,000.00 | 1,020.93 | 3.91 | 0.78 | ||||||||||||
Class R5 | ||||||||||||||||
Actual | 1,000.00 | 1,057.20 | 3.01 | 0.59 | ||||||||||||
Hypothetical | 1,000.00 | 1,021.87 | 2.96 | 0.59 | ||||||||||||
Class R6 | ||||||||||||||||
Actual | 1,000.00 | 1,057.60 | 2.55 | 0.50 | ||||||||||||
Hypothetical | 1,000.00 | 1,022.32 | 2.51 | 0.50 | ||||||||||||
Growth and Income Fund | ||||||||||||||||
Class A | ||||||||||||||||
Actual | 1,000.00 | 1,041.50 | 5.21 | 1.03 | ||||||||||||
Hypothetical | 1,000.00 | 1,019.69 | 5.16 | 1.03 | ||||||||||||
Class C | ||||||||||||||||
Actual | 1,000.00 | 1,039.00 | 7.74 | 1.53 | ||||||||||||
Hypothetical | 1,000.00 | 1,017.21 | 7.65 | 1.53 | ||||||||||||
Class I (formerly Select Class) | ||||||||||||||||
Actual | 1,000.00 | 1,043.00 | 3.95 | 0.78 | ||||||||||||
Hypothetical | 1,000.00 | 1,020.93 | 3.91 | 0.78 | ||||||||||||
Class R2 | ||||||||||||||||
Actual | 1,000.00 | 1,040.10 | 6.47 | 1.28 | ||||||||||||
Hypothetical | 1,000.00 | 1,018.45 | 6.41 | 1.28 | ||||||||||||
Class R5 | ||||||||||||||||
Actual | 1,000.00 | 1,043.90 | 2.94 | 0.58 | ||||||||||||
Hypothetical | 1,000.00 | 1,021.92 | 2.91 | 0.58 | ||||||||||||
Class R6 | ||||||||||||||||
Actual | 1,000.00 | 1,044.10 | 2.69 | 0.53 | ||||||||||||
Hypothetical | 1,000.00 | 1,022.17 | 2.66 | 0.53 | ||||||||||||
| 110 | J.P. MORGAN LARGE CAP FUNDS | JUNE 30, 2017 | ||||
Table of Contents
| Beginning Account Value January 1, 2017 | Ending Account Value June 30, 2017 | Expenses Paid During the Period* | Annualized Expense Ratio | |||||||||||||
Hedged Equity Fund | ||||||||||||||||
Class A | ||||||||||||||||
Actual | $ | 1,000.00 | $ | 1,059.10 | $ | 4.29 | 0.84 | % | ||||||||
Hypothetical | 1,000.00 | 1,020.63 | 4.21 | 0.84 | ||||||||||||
Class C | ||||||||||||||||
Actual | 1,000.00 | 1,056.40 | 6.83 | 1.34 | ||||||||||||
Hypothetical | 1,000.00 | 1,018.15 | 6.71 | 1.34 | ||||||||||||
Class I (formerly Select Class) | ||||||||||||||||
Actual | 1,000.00 | 1,059.70 | 3.01 | 0.59 | ||||||||||||
Hypothetical | 1,000.00 | 1,021.87 | 2.96 | 0.59 | ||||||||||||
Class R5 | ||||||||||||||||
Actual | 1,000.00 | 1,061.00 | 2.04 | 0.40 | ||||||||||||
Hypothetical | 1,000.00 | 1,022.81 | 2.01 | 0.40 | ||||||||||||
Class R6 | ||||||||||||||||
Actual | 1,000.00 | 1,060.70 | 1.74 | 0.34 | ||||||||||||
Hypothetical | 1,000.00 | 1,023.11 | 1.71 | 0.34 | ||||||||||||
Large Cap Growth Fund | ||||||||||||||||
Class A | ||||||||||||||||
Actual | 1,000.00 | 1,209.80 | 5.75 | 1.05 | ||||||||||||
Hypothetical | 1,000.00 | 1,019.59 | 5.26 | 1.05 | ||||||||||||
Class C | ||||||||||||||||
Actual | 1,000.00 | 1,206.60 | 8.48 | 1.55 | ||||||||||||
Hypothetical | 1,000.00 | 1,017.11 | 7.75 | 1.55 | ||||||||||||
Class I (formerly Select Class) | ||||||||||||||||
Actual | 1,000.00 | 1,211.20 | 4.88 | 0.89 | ||||||||||||
Hypothetical | 1,000.00 | 1,020.38 | 4.46 | 0.89 | ||||||||||||
Class R2 | ||||||||||||||||
Actual | 1,000.00 | 1,208.10 | 7.28 | 1.33 | ||||||||||||
Hypothetical | 1,000.00 | 1,018.20 | 6.66 | 1.33 | ||||||||||||
Class R3 | ||||||||||||||||
Actual | 1,000.00 | 1,209.10 | 6.19 | 1.13 | ||||||||||||
Hypothetical | 1,000.00 | 1,019.19 | 5.66 | 1.13 | ||||||||||||
Class R4 | ||||||||||||||||
Actual | 1,000.00 | 1,210.90 | 4.93 | 0.90 | ||||||||||||
Hypothetical | 1,000.00 | 1,020.33 | 4.51 | 0.90 | ||||||||||||
Class R5 | ||||||||||||||||
Actual | 1,000.00 | 1,212.00 | 3.78 | 0.69 | ||||||||||||
Hypothetical | 1,000.00 | 1,021.37 | 3.46 | 0.69 | ||||||||||||
Class R6 | ||||||||||||||||
Actual | 1,000.00 | 1,212.70 | 3.29 | 0.60 | ||||||||||||
Hypothetical | 1,000.00 | 1,021.82 | 3.01 | 0.60 | ||||||||||||
Large Cap Value Fund | ||||||||||||||||
Class A | ||||||||||||||||
Actual | 1,000.00 | 1,060.80 | 4.75 | 0.93 | ||||||||||||
Hypothetical | 1,000.00 | 1,020.18 | 4.66 | 0.93 | ||||||||||||
Class C | ||||||||||||||||
Actual | 1,000.00 | 1,058.00 | 7.40 | 1.45 | ||||||||||||
Hypothetical | 1,000.00 | 1,017.60 | 7.25 | 1.45 | ||||||||||||
Class I (formerly Select Class) | ||||||||||||||||
Actual | 1,000.00 | 1,061.40 | 4.04 | 0.79 | ||||||||||||
Hypothetical | 1,000.00 | 1,020.88 | 3.96 | 0.79 | ||||||||||||
Class R2 | ||||||||||||||||
Actual | 1,000.00 | 1,058.90 | 6.38 | 1.25 | ||||||||||||
Hypothetical | 1,000.00 | 1,018.60 | 6.26 | 1.25 | ||||||||||||
Class R5 | ||||||||||||||||
Actual | 1,000.00 | 1,062.30 | 3.07 | 0.60 | ||||||||||||
Hypothetical | 1,000.00 | 1,021.82 | 3.01 | 0.60 | ||||||||||||
Class R6 | ||||||||||||||||
Actual | 1,000.00 | 1,062.30 | 2.61 | 0.51 | ||||||||||||
Hypothetical | 1,000.00 | 1,022.27 | 2.56 | 0.51 | ||||||||||||
| JUNE 30, 2017 | J.P. MORGAN LARGE CAP FUNDS | 111 | ||||||
Table of Contents
SCHEDULE OF SHAREHOLDER EXPENSES
(Unaudited) (continued)
Hypothetical $1,000 Investment
| Beginning Account Value January 1, 2017 | Ending Account Value June 30, 2017 | Expenses Paid During the Period* | Annualized Expense Ratio | |||||||||||||
U.S. Equity Fund | ||||||||||||||||
Class A | ||||||||||||||||
Actual | $ | 1,000.00 | $ | 1,088.70 | $ | 4.87 | 0.94 | % | ||||||||
Hypothetical | 1,000.00 | 1,020.13 | 4.71 | 0.94 | ||||||||||||
Class C | ||||||||||||||||
Actual | 1,000.00 | 1,085.00 | 7.44 | 1.44 | ||||||||||||
Hypothetical | 1,000.00 | 1,017.65 | 7.20 | 1.44 | ||||||||||||
Class I (formerly Select Class) | ||||||||||||||||
Actual | 1,000.00 | 1,088.90 | 3.88 | 0.75 | ||||||||||||
Hypothetical | 1,000.00 | 1,021.08 | 3.76 | 0.75 | ||||||||||||
Class L (formerly Institutional Class) | ||||||||||||||||
Actual | 1,000.00 | 1,090.20 | 3.11 | 0.60 | ||||||||||||
Hypothetical | 1,000.00 | 1,021.82 | 3.01 | 0.60 | ||||||||||||
Class R2 | ||||||||||||||||
Actual | 1,000.00 | 1,086.60 | 6.31 | 1.22 | ||||||||||||
Hypothetical | 1,000.00 | 1,018.74 | 6.11 | 1.22 | ||||||||||||
Class R3 | ||||||||||||||||
Actual | 1,000.00 | 1,088.10 | 5.18 | 1.00 | ||||||||||||
Hypothetical | 1,000.00 | 1,019.84 | 5.01 | 1.00 | ||||||||||||
Class R4 | ||||||||||||||||
Actual | 1,000.00 | 1,089.10 | 3.88 | 0.75 | ||||||||||||
Hypothetical | 1,000.00 | 1,021.08 | 3.76 | 0.75 | ||||||||||||
Class R5 | ||||||||||||||||
Actual | 1,000.00 | 1,090.50 | 2.90 | 0.56 | ||||||||||||
Hypothetical | 1,000.00 | 1,022.02 | 2.81 | 0.56 | ||||||||||||
Class R6 | ||||||||||||||||
Actual | 1,000.00 | 1,090.70 | 2.59 | 0.50 | ||||||||||||
Hypothetical | 1,000.00 | 1,022.32 | 2.51 | 0.50 | ||||||||||||
| * | Expenses are equal to each Class’ respective annualized expense ratio, multiplied by the average account value over the period, multiplied by 181/365 (to reflect the one-half year period). |
| 112 | J.P. MORGAN LARGE CAP FUNDS | JUNE 30, 2017 | ||||
Table of Contents
(Unaudited)
Certain tax information for the J.P. Morgan Funds is required to be provided to shareholders based upon the Funds’ income and distributions for the taxable year ended June 30, 2017. The information and distributions reported in this letter may differ from the information and taxable distributions reported to the shareholders for the calendar year ending December 31, 2017. The information necessary to complete your income tax returns for the calendar year ending December 31, 2017 will be provided under separate cover.
Dividends Received Deductions (DRD)
Each fund listed below had the following percentage, or maximum allowable percentage, of ordinary income distributions eligible for the 70% dividends received deductions for corporate shareholders for the fiscal year ended June 30, 2017:
Dividends Received Deduction | ||||
Disciplined Equity Fund | 100.00 | % | ||
Equity Focus Fund | 53.43 | |||
Equity Income Fund | 100.00 | |||
Growth and Income Fund | 100.00 | |||
Hedged Equity Fund | 100.00 | |||
Large Cap Value Fund | 15.90 | |||
U.S. Equity Fund | 97.65 | |||
Long-Term Capital Gain
Each fund listed below distributed the following amount, or maximum allowable amount, of long-term capital gain dividends for the fiscal year ended June 30, 2017 (amounts in thousands):
Long-Term Capital Gain Distribution | ||||
Dynamic Growth Fund | $ | 7,251 | ||
Equity Focus Fund | 1,213 | |||
Equity Income Fund | 66,179 | |||
Growth and Income Fund | 23,154 | |||
Large Cap Growth Fund | 1,379,032 | |||
Large Cap Value Fund | 26,974 | |||
U.S. Equity Fund | 439,676 | |||
Qualified Dividend Income (QDI)
Each fund listed below had the following amount, or maximum allowable amount, of ordinary income distributions treated as qualified dividends for the fiscal year ended June 30, 2017 (amounts in thousands):
Qualified Dividend Income | ||||
Disciplined Equity Fund | $ | 129,537 | ||
Equity Focus Fund | 848 | |||
Equity Income Fund | 256,770 | |||
Growth and Income Fund | 7,975 | |||
Hedged Equity Fund | 5,217 | |||
Large Cap Value Fund | 16,890 | |||
U.S. Equity Fund | 134,307 | |||
| JUNE 30, 2017 | J.P. MORGAN LARGE CAP FUNDS | 113 | ||||||
Table of Contents

Rev. January 2011
| FACTS | WHAT DOES J.P. MORGAN FUNDS DO WITH YOUR PERSONAL INFORMATION? |
| Why? | Financial companies choose how they share your personal information. Federal law gives consumers the right to limit some but not all sharing. Federal law also requires us to tell you how we collect, share, and protect your personal information. Please read this notice carefully to understand what we do. |
| What? | The types of personal information we collect and share depend on the product or service you have with us. This information can include:
◾Social Security number and account balances
◾transaction history and account transactions
◾checking account information and wire transfer instructions
When you are no longer our customer, we continue to share your information as described in this notice. |
| How? | All financial companies need to share customers’ personal information to run their everyday business. In the section below, we list the reasons financial companies can share their customers’ personal information; the reasons J.P. Morgan Funds chooses to share; and whether you can limit this sharing. |
| Reasons we can share your personal information | Does J.P. Morgan Funds share? | Can you limit this sharing? | ||
For our everyday business purposes — such as to process your transactions, maintain your account(s), respond to court orders and legal investigations, or report to credit bureaus | Yes | No | ||
For marketing purposes — to offer our products and services to you | Yes | No | ||
| For joint marketing with other financial companies | No | We don’t share | ||
For our affiliates’ everyday business purposes — information about your transactions and experiences | No | We don’t share | ||
For our affiliates’ everyday business purposes — information about your creditworthiness | No | We don’t share | ||
| For nonaffiliates to market to you | No | We don’t share |
| Questions? | Call 1-800-480-4111 or go to www.jpmorganfunds.com | |

Table of Contents
Page 2 |
| Who we are | ||
| Who is providing this notice? | J.P. Morgan Funds | |
| What we do | ||
| How does J.P. Morgan Funds protect my personal information? | To protect your personal information from unauthorized access and use, we use security measures that comply with federal law. These measures include computer safeguards and secured files and buildings. We authorize our employees to access your information only when they need it to do their work and we require companies that work for us to protect your information. | |
How does J.P. Morgan Funds collect my personal information? | We collect your personal information, for example, when you:
◾open an account or provide contact information
◾give us your account information or pay us by check
◾make a wire transfer
We also collect your personal information from others, such as credit bureaus, affiliates and other companies. | |
| Why can’t I limit all sharing? | Federal law gives you the right to limit only
◾sharing for affiliates’ everyday business purposes – information about your creditworthiness
◾affiliates from using your information to market to you
◾sharing for nonaffiliates to market to you
State laws and individual companies may give you additional rights to limit sharing. | |
| Definitions | ||
| Affiliates | Companies related by common ownership or control. They can be financial and nonfinancial companies.
◾J.P. Morgan Funds does not share with our affiliates. | |
| Nonaffiliates | Companies not related by common ownership or control. They can be financial and nonfinancial companies.
◾J.P. Morgan Funds does not share with nonaffiliates so they can market to you. | |
| Joint Marketing | A formal agreement between nonaffiliated financial companies that together market financial products or services to you.
◾J.P. Morgan Funds doesn’t jointly market. | |
Table of Contents
J.P. Morgan Funds are distributed by JPMorgan Distribution Services, Inc., which is an affiliate of JPMorgan Chase & Co. Affiliates of JPMorgan Chase & Co. receive fees for providing various services to the funds.
Contact JPMorgan Distribution Services, Inc. at 1-800-480-4111 for a fund prospectus. You can also visit us at www.jpmorganfunds.com. Investors should carefully consider the investment objectives and risk as well as charges and expenses of the mutual fund before investing. The prospectus contains this and other information about the mutual fund. Read the prospectus carefully before investing.
Investors may obtain information about the Securities Investor Protection Corporation (SIPC), including the SIPC brochure by visiting www.sipc.org or by calling SIPC at 202-371-8300.
Each Fund files a complete schedule of its fund holdings for the first and third quarters of its fiscal year with the SEC on Form N-Q. The Funds’ Forms N-Q are available on the SEC’s website at http://www.sec.gov and may be reviewed and copied at the SEC’s Public Reference Room in Washington, DC. Information on the operation of the SEC’s Public Reference Room may be obtained by calling 1-800-SEC-0330. Shareholders may request the Form N-Q without charge by calling 1-800-480-4111 or by visiting the J.P. Morgan Funds’ website at www.jpmorganfunds.com.
A description of each Fund’s policies and procedures with respect to the disclosure of each Fund’s holdings is available in the prospectus and Statement of Additional Information.
A copy of proxy policies and procedures is available without charge upon request by calling 1-800-480-4111 and on the Funds’ website at www.jpmorganfunds.com. A description of such policies and procedures is on the SEC’s website at www.sec.gov. The Trustees have delegated the authority to vote proxies for securities owned by the Funds to the Adviser. A copy of the Funds’ voting record for the most recent 12-month period ended June 30 is available on the SEC’s website at www.sec.gov or at the Funds’ website at www.jpmorganfunds.com no later than August 31 of each year. The Funds’ proxy voting record will include, among other things, a brief description of the matter voted on for each fund security, and will state how each vote was cast, for example, for or against the proposal.
Table of Contents

J.P. Morgan Asset Management is the marketing name for the asset management businesses of JPMorgan Chase & Co. Those businesses include, but are not limited to, J.P. Morgan Investment Management Inc., Security Capital Research & Management Incorporated and J.P. Morgan Alternative Asset Management, Inc.
| © JPMorgan Chase & Co., 2017. All rights reserved. June 2017. | AN-LCE-617 |
Table of Contents
Annual Report
J.P. Morgan Equity Funds
June 30, 2017
JPMorgan Equity Index Fund
JPMorgan Market Expansion Enhanced Index Fund

Table of Contents
| CEO’s Letter | 1 | |||
| Market Overview | 2 | |||
| 3 | ||||
| 5 | ||||
| Schedules of Portfolio Investments | 8 | |||
| Financial Statements | 26 | |||
| Financial Highlights | 32 | |||
| Notes to Financial Statements | 36 | |||
| Report of Independent Registered Public Accounting Firm | 44 | |||
| Trustees | 45 | |||
| Officers | 47 | |||
| Schedule of Shareholder Expenses | 48 | |||
| Tax Letter | 49 | |||
| Privacy Policy — Located at the back of this Annual Report | ||||
Investments in a Fund are not deposits or obligations of, or guaranteed or endorsed by, any bank and are not insured or guaranteed by the FDIC, the Federal Reserve Board or any other government agency. You could lose money if you sell when a Fund’s share price is lower than when you invested.
Past performance is no guarantee of future performance. The general market views expressed in this report are opinions based on market and other conditions through the end of the reporting period and are subject to change without notice. These views are not intended to predict the future performance of a Fund or the securities markets. References to specific securities and their issuers are for illustrative purposes only and are not intended to be, and should not be interpreted as, recommendations to purchase or sell such securities. Such views are not meant as investment advice and may not be relied on as an indication of trading intent on behalf of any Fund.
Prospective investors should refer to the Funds’ prospectuses for a discussion of the Funds’ investment objectives, strategies and risks. Call J.P. Morgan Funds Service Center at 1-800-480-4111 for a prospectus containing more complete information about a Fund, including management fees and other expenses. Please read it carefully before investing.
Table of Contents
August 4, 2017 (Unaudited)
Dear Shareholder,
The current U.S. economic expansion entered its eighth year in 2017 and growth in developed and emerging market economies grew more synchronized even as U.S. growth showed some signs of easing. Global financial markets generally benefitted from steady economic growth amid an environment of low inflation, low volatility and rising corporate profits.
 |
“In the U.S., the continued economic expansion, muted inflation, corporate earnings growth and historically low volatility in financial markets helped to drive key equity market indexes to multiple record closing highs throughout the past twelve months.” |
While economic growth in the U.S. and China largely drove the global recovery throughout 2016, by June 2017 the world’s other leading economies had picked up sufficiently enough for the Organization for Economic Co-operation and Development to forecast global growth at 3.5% in 2017 and 3.6% in 2018.
U.S. gross domestic product (GDP) growth slowed to 1.2% in the first quarter of 2017 from 2.5% and 3.5% growth in the fourth quarter and third quarters of 2016, respectively. Meanwhile, the U.S. unemployment rate continued its downward trend throughout the past twelve months, dropping to 4.4% in June 2017 from 4.9% one year earlier. In response to these numbers, along with nascent signs of price inflation, the U.S. Federal Reserve (the “Fed”) raised interest rates in December 2016 and again in June 2017 and signaled it would raise rates once more before the end of the year. Further, Fed Chairwoman Janet Yellen indicated she was prepared to begin partially unwinding the central bank’s $4.5 trillion balance sheet in assets purchased through its quantitative easing program. An increase in consumer spending helped second-quarter 2017 GDP climb by 2.6% from a year earlier.
Notably, by mid-2017 domestic price inflation had dropped below the Fed’s target of 2% growth and wage growth was below many economists’ expectations, the latter despite an environment of essentially full employment for U.S. workers. These trends — and the Fed’s acknowledgment of them — provided some near-term uncertainty about the central bank’s commitment to tightening monetary policy.
Throughout the twelve months ended June 30, 2017, global oil prices remained a key focal point for policy makers, economists and investors. Global crude prices reached 15-month highs in October 2016 and received further support from the Organization of Petroleum Exporting Countries’ December 2016 decision to curb production. However, continued oversupply of crude and natural gas, partly due to continued U.S. production, pushed the price of a barrel of benchmark West Texas Intermediate crude oil down to $46 by the end of June 2017.
Meanwhile, the leading economies of Europe continued to strengthen from what had been an anemic expansion. Annualized GDP for the 19 core euro area nations rose 1.9% in the first quarter of 2017 and 2.1% in the second quarter. The June 2017 aggregate unemployment rate for those nations fell to 9.1%, its lowest level since March 2009. Also, in separate elections in 2017, voters in the Netherlands and France largely rejected populist campaigns espousing policies to limit free trade and immigration. The election results provided another boost to global equity prices.
In the U.S., the continued economic expansion, muted inflation, corporate earnings growth and historically low volatility in financial markets helped to drive key equity market indexes to multiple record closing highs throughout the past twelve months. U.S. investors appeared to shrug off intermittent political and policy dramas emanating from Washington, D.C. and extended the run-up in U.S. equity prices into its eighth consecutive year — one of the longest on record.
Over the twelve month period, U.S. and foreign markets largely rewarded those who remained fully invested in financial markets and we believe the fundamental virtues of patience and diversification remain essential to prudent investment strategy.
We look forward to managing your investment needs for years to come. Should you have any questions, please visit www.jpmorganfunds.com or contact the J.P. Morgan Funds Service Center at 1-800-480-4111.
Sincerely yours,

George C.W. Gatch
CEO, Global Funds Management & Institutional,
J.P. Morgan Asset Management
| JUNE 30, 2017 | J.P. MORGAN EQUITY FUNDS | 1 | ||||||
Table of Contents
J.P. Morgan Index Funds
TWELVE MONTHS ENDED JUNE 30, 2017 (Unaudited)
Overall, U.S. equity markets provided positive returns and key stock market indexes reached multiple record highs throughout the twelve month reporting period. Steady global economic growth, continued low inflation and strong corporate earnings all served to support equity prices, both in the U.S. and elsewhere.
While U.S. equity prices rose throughout most of 2016, they experienced a sustained rally following the November 8, 2016 election amid investor expectations for increased infrastructure spending and tax cuts under the incoming Trump administration and Republican Party majorities in the U.S. Congress. Even as those expectations faded somewhat, U.S. equity prices continued to climb.
In February 2017, the Standard & Poor’s 500 Index (the “S&P 500”) reached nine new closing highs and the Dow Jones Industrial Average (the “DJIA”) closed at new highs for 12 consecutive days, matching a record set in 1987. The following month, the S&P 500 crossed 2,400 points in intraday trading for the first time and the DJIA crossed 21,000 points for the first time. While the rally in U.S. equities stalled in April 2017, record high U.S. corporate operating earnings rekindled the rise in stock prices and the S&P 500 posted seven new closing highs in May 2017 and four new closing highs in June 2017.
Importantly, U.S. financial market volatility remained historically low throughout the reporting period, with a brief spike ahead of the November 2016 election. By the end of June 2017, the CBOE Volatility Index, which measures options on the S&P 500 to gauge market expectations of near-term volatility stood at roughly half of its historical average.
Overall, small cap stocks generally outperformed mid cap and large cap stocks, while growth stocks generally outperformed value stocks. For the twelve months ended June 30, 2017, the S&P 500 returned 17.90%.
| 2 | J.P. MORGAN EQUITY FUNDS | JUNE 30, 2017 | ||||
Table of Contents
TWELVE MONTHS ENDED JUNE 30, 2017 (Unaudited)
| REPORTING PERIOD RETURN: | ||||
Fund (Class I Shares)1* | 17.62% | |||
S&P 500 Index** | 17.90% | |||
Net Assets as of 6/30/2017 (In Thousands) | $ | 1,749,430 | ||
INVESTMENT OBJECTIVE***
The JPMorgan Equity Index Fund (the “Fund”) seeks investment results that correspond to the aggregate price and dividend performance of securities in the Standard & Poor’s 500 Index (S&P 500) (the “Benchmark”).
WHAT WERE THE MAIN DRIVERS OF THE FUND’S PERFORMANCE?
The Fund’s Class I Shares performed largely in line with the Benchmark for the twelve months ended June 30, 2017, before considering the effect of Fund fees and expenses. This was consistent with its indexing strategy and investment objective, as the Fund looks to generate returns that are comparable to those of the Benchmark.
Overall, U.S. equity markets provided positive returns and key stock market indexes reached multiple record highs throughout the twelve month reporting period. Steady global economic growth, continued low inflation and strong corporate earnings all served to support equity prices, both in the U.S. and elsewhere.
During the reporting period, the information technology and financials sectors were the largest contributors to the performance of the Fund and the Benchmark, while the telecommunications and energy sectors were the largest detractors from performance.
HOW WAS THE FUND POSITIONED?
Regardless of the market outlook, the Fund was managed in strict conformity with a full index replication strategy and aimed to hold the same stocks in nearly the same proportions as those found in the Benchmark.
| TOP TEN EQUITY HOLDINGS OF THE PORTFOLIO**** | ||||||||
| 1. | Apple, Inc. | 3.6 | % | |||||
| 2. | Microsoft Corp. | 2.6 | ||||||
| 3. | Amazon.com, Inc. | 1.8 | ||||||
| 4. | Facebook, Inc., Class A | 1.7 | ||||||
| 5. | Johnson & Johnson | 1.7 | ||||||
| 6. | Exxon Mobil Corp. | 1.6 | ||||||
| 7. | JPMorgan Chase & Co. | 1.6 | ||||||
| 8. | Berkshire Hathaway, Inc., Class B | 1.5 | ||||||
| 9. | Alphabet, Inc., Class A | 1.3 | ||||||
| 10. | Alphabet, Inc., Class C | 1.3 | ||||||
PORTFOLIO COMPOSITION BY SECTOR**** | ||||
| Information Technology | 22.2 | % | ||
| Financials | 14.5 | |||
| Health Care | 14.5 | |||
| Consumer Discretionary | 12.2 | |||
| Industrials | 10.2 | |||
| Consumer Staples | 9.0 | |||
| Energy | 6.0 | |||
| Utilities | 3.2 | |||
| Real Estate | 2.9 | |||
| Materials | 2.8 | |||
| Telecommunication Services | 2.1 | |||
| Short-Term Investment | 0.4 | |||
| 1 | On April 3, 2017, the Fund’s Select Class Shares were renamed Class I Shares. |
| * | The return shown is based on net asset values calculated for shareholder transactions and may differ from the return shown in the financial highlights, which reflects adjustments made to the net asset values in accordance with accounting principles generally accepted in the United States of America. |
| ** | “S&P 500 Index” is a registered service mark of Standard & Poor’s Corporation, which does not sponsor and is in no way affiliated with the Fund. |
| *** | The adviser seeks to achieve the Fund’s objective. There can be no guarantee it will be achieved. |
| **** | Percentages indicated are based on total investments as of June 30, 2017. The Fund’s portfolio composition is subject to change. |
| JUNE 30, 2017 | J.P. MORGAN EQUITY FUNDS | 3 | ||||||
Table of Contents
JPMorgan Equity Index Fund
FUND COMMENTARY
TWELVE MONTHS ENDED JUNE 30, 2017 (Unaudited) (continued)
AVERAGE ANNUAL TOTAL RETURNS AS OF JUNE 30, 2017 | ||||||||||||||
| INCEPTION DATE OF CLASS | 1 YEAR | 5 YEAR | 10 YEAR | |||||||||||
CLASS A SHARES | February 18, 1992 | |||||||||||||
With Sales Charge* | 11.16 | % | 12.87 | % | 6.15 | % | ||||||||
Without Sales Charge | 17.32 | 14.10 | 6.73 | |||||||||||
CLASS C SHARES | November 4, 1997 | |||||||||||||
With CDSC** | 15.57 | 13.26 | 5.94 | |||||||||||
Without CDSC | 16.57 | 13.26 | 5.94 | |||||||||||
CLASS I SHARES (FORMERLY SELECT CLASS SHARES) | July 2, 1991 | 17.62 | 14.38 | 6.99 | ||||||||||
CLASS R6 SHARES | September 1, 2016 | 17.79 | 14.41 | 7.01 | ||||||||||
| * | Sales Charge for Class A Shares is 5.25%. |
| ** | Assumes a 1% CDSC (contingent deferred sales charge) for the one year period and 0% CDSC thereafter. |
TEN YEAR PERFORMANCE (6/30/07 TO 6/30/17)
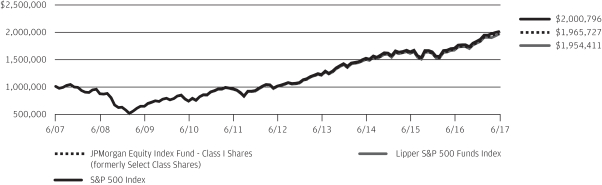
The performance quoted is past performance and is not a guarantee of future results. Mutual funds are subject to certain market risks. Investment returns and principal value of an investment will fluctuate so that an investor’s shares, when redeemed, may be worth more or less than their original cost. Current performance may be higher or lower than the performance data shown. For up-to-date month-end performance information please call 1-800-480-4111.
Returns for Class R6 Shares prior to their inception date are based on the performance of Class I Shares. The actual returns for Class R6 Shares would have been different than those shown because Class R6 Shares have different expenses than Class I Shares.
The graph illustrates comparative performance for $1,000,000 invested in Class I Shares of the JPMorgan Equity Index Fund, the S&P 500 Index and the Lipper S&P 500 Funds Index from June 30, 2007 to June 30, 2017. The performance of the Fund assumes reinvestment of all dividends and capital gain distributions, if any, and does not include a sales charge. The performance of the S&P 500 Index does not reflect the deduction of expenses or a sales charge associated with a mutual fund and has been adjusted to reflect reinvestment of all dividends and capital gain distributions of the securities
included in the benchmark, if applicable. The performance of the Lipper S&P 500 Funds Index includes expenses associated with a mutual fund, such as investment management fees. These expenses are not identical to the expenses incurred by the Fund. The S&P 500 Index is an unmanaged index generally representative of the performance of large companies in the U.S. stock market. The Lipper S&P 500 Funds Index is an index based on the total returns of certain mutual funds within the Fund’s designated category as determined by Lipper, Inc. Investors cannot invest directly in an index.
Class I Shares have a $1,000,000 minimum initial investment.
Fund performance may reflect the waiver of the Fund’s fees and reimbursement of expenses for certain periods since the inception date. Without these waivers and reimbursements, performance would have been lower. Also, performance shown in this section does not reflect the deduction of taxes that a shareholder would pay on Fund distributions or redemptions of Fund shares.
The returns shown are based on net asset values calculated for shareholder transactions and may differ from the returns shown in the financial highlights, which reflect adjustments made to the net asset values in accordance with accounting principles generally accepted in the United States of America.
| 4 | J.P. MORGAN EQUITY FUNDS | JUNE 30, 2017 | ||||
Table of Contents
JPMorgan Market Expansion Enhanced Index Fund
FUND COMMENTARY
TWELVE MONTHS ENDED JUNE 30, 2017 (Unaudited)
| REPORTING PERIOD RETURN: | ||||
Fund (Class I Shares)1* | 19.66% | |||
S&P 1000 Index** | 19.73% | |||
Net Assets as of 6/30/2017 (In Thousands) | $ | 1,011,148 | ||
INVESTMENT OBJECTIVE***
The JPMorgan Market Expansion Enhanced Index Fund (the “Fund”) seeks to provide investment results that correspond to or incrementally exceed the total return performance of an index that tracks the performance of the small- and mid-capitalization equity markets.
WHAT WERE THE MAIN DRIVERS OF THE FUND’S PERFORMANCE?
The Fund’s Class I Shares underperformed the Standard & Poor’s 1000 Index (the “Benchmark”) for the twelve months ended June 30, 2017. The Fund’s security selection in the health care and industrial sectors was a leading detractor from performance relative to the Benchmark. The Fund’s security selection in the information technology and financials sectors was a leading contributor to relative performance.
Leading individual detractors from relative performance included the Fund’s underweight position in United States Steel Co. and its overweight positions in Essendant Inc. and Geo Group Inc. Shares of U.S. Steel, a steelmaker, rose in early 2017 amid investor expectations of U.S. tariffs on steel imports. Shares of Essendant, an office products distributor, fell after the company reported a drop in revenue and earnings. Shares of Geo Group, a prison real estate investment trust, fell after the company announced its $360 million acquisition of Community Education Centers.
Leading individual contributors to relative performance included the Fund’s overweight positions in Brink’s Co., Take-Two Interactive Software Inc. and Dana Inc. Shares of Brink’s, a security and logistics company, rose after the
company increased its quarterly dividend by 50% and unveiled a $200 million share repurchase plan. Shares of Take-Two Interactive Software, a maker of computer and video games, rose on better-than-expected earnings. Shares of Dana, an automotive parts supplier, rose after reporting better-than-expected earnings and growth in revenue and cash flow.
HOW WAS THE FUND POSITIONED?
The Fund seeks to track the sector and industry weights within the Benchmark. Because the Fund uses an enhanced index strategy, not all of the stocks in the Benchmark are held by the Fund, and the Fund’s position in an individual stock may be overweight or underweight as compared to the Benchmark. Looking at valuation and momentum, the Fund’s portfolio managers overweighted what they believed were attractively priced stocks with improving momentum and underweighted what they believed were expensive stocks with deteriorating momentum, based on their bottom-up approach to stock selection.
| TOP TEN EQUITY HOLDINGS OF THE PORTFOLIO**** | ||||||||
| 1. | Arrow Electronics, Inc. | 0.7 | % | |||||
| 2. | UGI Corp. | 0.7 | ||||||
| 3. | East West Bancorp, Inc. | 0.7 | ||||||
| 4. | WellCare Health Plans, Inc. | 0.7 | ||||||
| 5. | United Therapeutics Corp. | 0.7 | ||||||
| 6. | Ingredion, Inc. | 0.7 | ||||||
| 7. | Broadridge Financial Solutions, Inc. | 0.7 | ||||||
| 8. | Atmos Energy Corp. | 0.7 | ||||||
| 9. | Huntington Ingalls Industries, Inc. | 0.7 | ||||||
| 10. | Take-Two Interactive Software, Inc. | 0.7 | ||||||
JUNE 30, 2017 | J.P. MORGAN EQUITY FUNDS | 5 | ||||||
Table of Contents
JPMorgan Market Expansion Enhanced Index Fund
FUND COMMENTARY
TWELVE MONTHS ENDED JUNE 30, 2017 (Unaudited) (continued)
PORTFOLIO COMPOSITION BY SECTOR**** | ||||
| Information Technology | 16.9 | % | ||
| Industrials | 16.1 | |||
| Financials | 15.9 | |||
| Consumer Discretionary | 11.3 | |||
| Health Care | 10.9 | |||
| Real Estate | 8.2 | |||
| Materials | 7.4 | |||
| Utilities | 4.6 | |||
| Consumer Staples | 3.2 | |||
| Energy | 2.8 | |||
| Telecommunication Services | 0.4 | |||
| Short-Term Investment | 2.3 | |||
| 1 | On April 3, 2017, the Fund’s Select Class Shares were renamed Class I Shares. |
| * | The return shown is based on net asset values calculated for shareholder transactions and may differ from the return shown in the financial highlights, which reflects adjustments made to the net asset values in accordance with accounting principles generally accepted in the United States of America. |
| ** | “S&P 1000 Index” is a registered service mark of Standard & Poor’s Corporation, which does not sponsor and is in no way affiliated with the Fund. |
| *** | The adviser seeks to achieve the Fund’s objective. There can be no guarantee it will be achieved. |
| **** | Percentages indicated are based on total investments as of June 30, 2017. The Fund’s portfolio composition is subject to change. |
| 6 | J.P. MORGAN EQUITY FUNDS | JUNE 30, 2017 | ||||
Table of Contents
AVERAGE ANNUAL TOTAL RETURNS AS OF JUNE 30, 2017 | ||||||||||||||
| INCEPTION DATE OF CLASS | 1 YEAR | 5 YEAR | 10 YEAR | |||||||||||
CLASS A SHARES | July 31, 1998 | |||||||||||||
With Sales Charge* | 13.10 | % | 13.78 | % | 7.19 | % | ||||||||
Without Sales Charge | 19.37 | 15.01 | 7.76 | |||||||||||
CLASS C SHARES | March 22, 1999 | |||||||||||||
With CDSC** | 17.58 | 14.24 | 7.02 | |||||||||||
Without CDSC | 18.58 | 14.24 | 7.02 | |||||||||||
CLASS I SHARES (FORMERLY SELECT CLASS SHARES) | July 31, 1998 | 19.66 | 15.32 | 8.04 | ||||||||||
CLASS R2 SHARES | November 3, 2008 | 19.06 | 14.76 | 7.44 | ||||||||||
| * | Sales Charge for Class A Shares is 5.25%. |
| ** | Assumes a 1% CDSC (contingent deferred sales charge) for the one year period and 0% CDSC thereafter. |
TEN YEAR PERFORMANCE (6/30/07 TO 6/30/17)
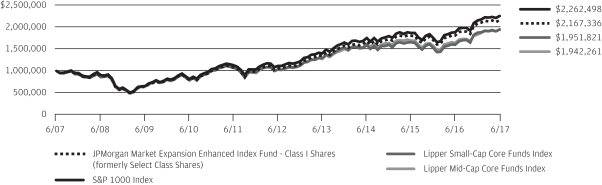
The performance quoted is past performance and is not a guarantee of future results. Mutual funds are subject to certain market risks. Investment returns and principal value of an investment will fluctuate so that an investor’s shares, when redeemed, may be worth more or less than their original cost. Current performance may be higher or lower than the performance data shown. For up-to-date month-end performance information please call 1-800-480-4111.
Returns for Class R2 Shares prior to their inception date are based on the performance of Class I Shares. All prior class performance for Class R2 Shares has been adjusted to reflect the differences in expenses between classes.
The graph illustrates comparative performance for $1,000,000 invested in Class I Shares of the JPMorgan Market Expansion Enhanced Index Fund, the S&P 1000 Index, the Lipper Small-Cap Core Funds Index and the Lipper Mid-Cap Core Funds Index from June 30, 2007 to June 30, 2017. The performance of the Fund assumes reinvestment of all dividends and capital gain distributions, if any, and does not include a sales charge. The performance of the S&P 1000 Index does not reflect the deduction of expenses or a sales charge associated with a mutual fund and has been adjusted to reflect reinvestment of all dividends and capital gain distributions of the securities included in the benchmark, if applicable. The performance of the Lipper Small-Cap Core Funds Index and
the Lipper Mid-Cap Core Funds Index includes expenses associated with a mutual fund, such as investment management fees. These expenses are not identical to the expenses incurred by the Fund. The S&P 1000 Index is an unmanaged index generally representative of the performance of the small and mid-size companies in the U.S. stock market. The Lipper Small-Cap Core Funds Index and the Lipper Mid-Cap Core Funds Index are indices based on total returns of certain mutual funds within the small cap and mid cap categories as determined by Lipper, Inc. Investors cannot invest directly in an index.
Class I Shares have a $1,000,000 minimum initial investment.
Fund performance may reflect the waiver of the Fund’s fees and reimbursement of expenses for certain periods since the inception date. Without these waivers and reimbursements, performance would have been lower. Also, performance shown in this section does not reflect the deduction of taxes that a shareholder would pay on Fund distributions or redemptions of Fund shares.
The returns shown are based on net asset values calculated for shareholder transactions and may differ from the returns shown in the financial highlights, which reflect adjustments made to the net asset values in accordance with accounting principles generally accepted in the United States of America.
| JUNE 30, 2017 | J.P. MORGAN EQUITY FUNDS | 7 | ||||||
Table of Contents
JPMorgan Equity Index Fund
SCHEDULE OF PORTFOLIO INVESTMENTS
AS OF JUNE 30, 2017
(Amounts in thousands)
| SHARES | SECURITY DESCRIPTION | VALUE($) | ||||||
Common Stocks — 99.7% | ||||||||
| Consumer Discretionary — 12.2% | ||||||||
Auto Components — 0.2% |
| |||||||
| 17 | BorgWarner, Inc. | 710 | ||||||
| 23 | Delphi Automotive plc | 1,973 | ||||||
| 21 | Goodyear Tire & Rubber Co. (The) | 739 | ||||||
|
| |||||||
| 3,422 | ||||||||
|
| |||||||
Automobiles — 0.5% |
| |||||||
| 329 | Ford Motor Co. | 3,677 | ||||||
| 115 | General Motors Co. | 4,030 | ||||||
| 15 | Harley-Davidson, Inc. | 794 | ||||||
|
| |||||||
| 8,501 | ||||||||
|
| |||||||
Distributors — 0.1% |
| |||||||
| 12 | Genuine Parts Co. | 1,149 | ||||||
| 26 | LKQ Corp. (a) | 853 | ||||||
|
| |||||||
| 2,002 | ||||||||
|
| |||||||
Diversified Consumer Services — 0.0% (g) | ||||||||
| 17 | H&R Block, Inc. | 538 | ||||||
|
| |||||||
Hotels, Restaurants & Leisure — 1.8% |
| |||||||
| 35 | Carnival Corp. | 2,306 | ||||||
| 2 | Chipotle Mexican Grill, Inc. (a) | 1,002 | ||||||
| 10 | Darden Restaurants, Inc. | 945 | ||||||
| 17 | Hilton Worldwide Holdings, Inc. | 1,065 | ||||||
| 26 | Marriott International, Inc., Class A | 2,618 | ||||||
| 68 | McDonald’s Corp. | 10,487 | ||||||
| 14 | Royal Caribbean Cruises Ltd. | 1,539 | ||||||
| 122 | Starbucks Corp. | 7,094 | ||||||
| 9 | Wyndham Worldwide Corp. | 880 | ||||||
| 7 | Wynn Resorts Ltd. | 899 | ||||||
| 28 | Yum Brands, Inc. | 2,050 | ||||||
|
| |||||||
| 30,885 | ||||||||
|
| |||||||
Household Durables — 0.5% |
| |||||||
| 29 | DR Horton, Inc. | 993 | ||||||
| 10 | Garmin Ltd. | 492 | ||||||
| 11 | Leggett & Platt, Inc. | 584 | ||||||
| 17 | Lennar Corp., Class A | 910 | ||||||
| 5 | Mohawk Industries, Inc. (a) | 1,283 | ||||||
| 41 | Newell Brands, Inc. | 2,176 | ||||||
| 24 | PulteGroup, Inc. | 585 | ||||||
| 6 | Whirlpool Corp. | 1,191 | ||||||
|
| |||||||
| 8,214 | ||||||||
|
| |||||||
Internet & Direct Marketing Retail — 2.7% |
| |||||||
| 33 | Amazon.com, Inc. (a) | 32,261 | ||||||
| 10 | Expedia, Inc. | 1,521 | ||||||
| 36 | Netflix, Inc. (a) | 5,410 | ||||||
| SHARES | SECURITY DESCRIPTION | VALUE($) | ||||||
Internet & Direct Marketing Retail — continued |
| |||||||
| 4 | Priceline Group, Inc. (The) (a) | 7,727 | ||||||
| 9 | TripAdvisor, Inc. (a) | 354 | ||||||
|
| |||||||
| 47,273 | ||||||||
|
| |||||||
Leisure Products — 0.1% |
| |||||||
| 9 | Hasbro, Inc. | 1,054 | ||||||
| 29 | Mattel, Inc. | 619 | ||||||
|
| |||||||
| 1,673 | ||||||||
|
| |||||||
Media — 3.0% |
| |||||||
| 31 | CBS Corp. (Non-Voting), Class B | 1,974 | ||||||
| 18 | Charter Communications, Inc., Class A (a) | 6,104 | ||||||
| 398 | Comcast Corp., Class A | 15,474 | ||||||
| 13 | Discovery Communications, Inc., Class A (a) | 334 | ||||||
| 18 | Discovery Communications, Inc., Class C (a) | 446 | ||||||
| 19 | DISH Network Corp., Class A (a) | 1,199 | ||||||
| 33 | Interpublic Group of Cos., Inc. (The) | 817 | ||||||
| 32 | News Corp., Class A | 440 | ||||||
| 10 | News Corp., Class B | 142 | ||||||
| 20 | Omnicom Group, Inc. | 1,621 | ||||||
| 8 | Scripps Networks Interactive, Inc., Class A | 550 | ||||||
| 65 | Time Warner, Inc. | 6,542 | ||||||
| 88 | Twenty-First Century Fox, Inc., Class A | 2,505 | ||||||
| 41 | Twenty-First Century Fox, Inc., Class B | 1,140 | ||||||
| 30 | Viacom, Inc., Class B | 994 | ||||||
| 122 | Walt Disney Co. (The) | 12,985 | ||||||
|
| |||||||
| 53,267 | ||||||||
|
| |||||||
Multiline Retail — 0.4% |
| |||||||
| 21 | Dollar General Corp. | 1,528 | ||||||
| 20 | Dollar Tree, Inc. (a) | 1,390 | ||||||
| 14 | Kohl’s Corp. | 554 | ||||||
| 26 | Macy’s, Inc. | 594 | ||||||
| 9 | Nordstrom, Inc. | 447 | ||||||
| 46 | Target Corp. | 2,424 | ||||||
|
| |||||||
| 6,937 | ||||||||
|
| |||||||
Specialty Retail — 2.2% |
| |||||||
| 6 | Advance Auto Parts, Inc. | 723 | ||||||
| 6 | AutoNation, Inc. (a) | 233 | ||||||
| 2 | AutoZone, Inc. (a) | 1,350 | ||||||
| 12 | Bed Bath & Beyond, Inc. | 371 | ||||||
| 22 | Best Buy Co., Inc. | 1,278 | ||||||
| 16 | CarMax, Inc. (a) | 981 | ||||||
| 11 | Foot Locker, Inc. | 543 | ||||||
| 18 | Gap, Inc. (The) | 407 | ||||||
| 100 | Home Depot, Inc. (The) | 15,407 | ||||||
SEE NOTES TO FINANCIAL STATEMENTS.
| 8 | J.P. MORGAN EQUITY FUNDS | JUNE 30, 2017 | ||||
Table of Contents
| SHARES | SECURITY DESCRIPTION | VALUE($) | ||||||
| Common Stocks — continued | ||||||||
Specialty Retail — continued | ||||||||
| 20 | L Brands, Inc. | 1,091 | ||||||
| 72 | Lowe’s Cos., Inc. | 5,589 | ||||||
| 8 | O’Reilly Automotive, Inc. (a) | 1,672 | ||||||
| 33 | Ross Stores, Inc. | 1,901 | ||||||
| 6 | Signet Jewelers Ltd. | 363 | ||||||
| 55 | Staples, Inc. | 553 | ||||||
| 9 | Tiffany & Co. | 845 | ||||||
| 54 | TJX Cos., Inc. (The) | 3,900 | ||||||
| 11 | Tractor Supply Co. | 586 | ||||||
| 5 | Ulta Beauty, Inc. (a) | 1,408 | ||||||
|
| |||||||
| 39,201 | ||||||||
|
| |||||||
Textiles, Apparel & Luxury Goods — 0.7% |
| |||||||
| 24 | Coach, Inc. | 1,118 | ||||||
| 31 | Hanesbrands, Inc. | 708 | ||||||
| 13 | Michael Kors Holdings Ltd. (a) | 475 | ||||||
| 111 | NIKE, Inc., Class B | 6,568 | ||||||
| 7 | PVH Corp. | 750 | ||||||
| 5 | Ralph Lauren Corp. | 342 | ||||||
| 16 | Under Armour, Inc., Class A (a) | 338 | ||||||
| 15 | Under Armour, Inc., Class C (a) | 312 | ||||||
| 27 | VF Corp. | 1,550 | ||||||
|
| |||||||
| 12,161 | ||||||||
|
| |||||||
Total Consumer Discretionary | 214,074 | |||||||
|
| |||||||
Consumer Staples — 9.0% |
| |||||||
Beverages — 2.1% |
| |||||||
| 15 | Brown-Forman Corp., Class B | 722 | ||||||
| 323 | Coca-Cola Co. (The) | 14,488 | ||||||
| 14 | Constellation Brands, Inc., Class A | 2,790 | ||||||
| 15 | Dr Pepper Snapple Group, Inc. | 1,407 | ||||||
| 16 | Molson Coors Brewing Co., Class B | 1,339 | ||||||
| 34 | Monster Beverage Corp. (a) | 1,683 | ||||||
| 120 | PepsiCo, Inc. | 13,860 | ||||||
|
| |||||||
| 36,289 | ||||||||
|
| |||||||
Food & Staples Retailing — 1.9% |
| |||||||
| 37 | Costco Wholesale Corp. | 5,893 | ||||||
| 86 | CVS Health Corp. | 6,886 | ||||||
| 77 | Kroger Co. (The) | 1,788 | ||||||
| 41 | Sysco Corp. | 2,082 | ||||||
| 72 | Walgreens Boots Alliance, Inc. | 5,618 | ||||||
| 124 | Wal-Mart Stores, Inc. | 9,391 | ||||||
| 27 | Whole Foods Market, Inc. | 1,131 | ||||||
|
| |||||||
| 32,789 | ||||||||
|
| |||||||
| SHARES | SECURITY DESCRIPTION | VALUE($) | ||||||
Food Products — 1.4% |
| |||||||
| 48 | Archer-Daniels-Midland Co. | 1,984 | ||||||
| 16 | Campbell Soup Co. | 840 | ||||||
| 34 | Conagra Brands, Inc. | 1,214 | ||||||
| 48 | General Mills, Inc. | 2,682 | ||||||
| 12 | Hershey Co. (The) | 1,263 | ||||||
| 23 | Hormel Foods Corp. | 773 | ||||||
| 10 | JM Smucker Co. (The) | 1,157 | ||||||
| 21 | Kellogg Co. | 1,472 | ||||||
| 50 | Kraft Heinz Co. (The) | 4,293 | ||||||
| 10 | McCormick & Co., Inc. (Non-Voting) | 928 | ||||||
| 127 | Mondelez International, Inc., Class A | 5,505 | ||||||
| 24 | Tyson Foods, Inc., Class A | 1,516 | ||||||
|
| |||||||
| 23,627 | ||||||||
|
| |||||||
Household Products — 1.7% |
| |||||||
| 21 | Church & Dwight Co., Inc. | 1,086 | ||||||
| 11 | Clorox Co. (The) | 1,442 | ||||||
| 74 | Colgate-Palmolive Co. | 5,501 | ||||||
| 30 | Kimberly-Clark Corp. | 3,850 | ||||||
| 215 | Procter & Gamble Co. (The) | 18,725 | ||||||
|
| |||||||
| 30,604 | ||||||||
|
| |||||||
Personal Products — 0.1% |
| |||||||
| 40 | Coty, Inc., Class A | 742 | ||||||
| 19 | Estee Lauder Cos., Inc. (The), Class A | 1,805 | ||||||
|
| |||||||
| 2,547 | ||||||||
|
| |||||||
Tobacco — 1.8% |
| |||||||
| 162 | Altria Group, Inc. | 12,085 | ||||||
| 130 | Philip Morris International, Inc. | 15,324 | ||||||
| 70 | Reynolds American, Inc. | 4,521 | ||||||
|
| |||||||
| 31,930 | ||||||||
|
| |||||||
Total Consumer Staples | 157,786 | |||||||
|
| |||||||
Energy — 6.0% |
| |||||||
Energy Equipment & Services — 0.9% |
| |||||||
| 36 | Baker Hughes, Inc. | 1,948 | ||||||
| 73 | Halliburton Co. | 3,114 | ||||||
| 9 | Helmerich & Payne, Inc. | 495 | ||||||
| 32 | National Oilwell Varco, Inc. | 1,052 | ||||||
| 117 | Schlumberger Ltd. | 7,686 | ||||||
| 39 | TechnipFMC plc, (United Kingdom) (a) | 1,066 | ||||||
| 33 | Transocean Ltd. (a) | 270 | ||||||
|
| |||||||
| 15,631 | ||||||||
|
| |||||||
Oil, Gas & Consumable Fuels — 5.1% |
| |||||||
| 47 | Anadarko Petroleum Corp. | 2,134 | ||||||
SEE NOTES TO FINANCIAL STATEMENTS.
| JUNE 30, 2017 | J.P. MORGAN EQUITY FUNDS | 9 | ||||||
Table of Contents
JPMorgan Equity Index Fund
SCHEDULE OF PORTFOLIO INVESTMENTS
AS OF JUNE 30, 2017 (continued)
(Amounts in thousands)
| SHARES | SECURITY DESCRIPTION | VALUE($) | ||||||
| Common Stocks — continued | ||||||||
Oil, Gas & Consumable Fuels — continued | ||||||||
| 32 | Apache Corp. | 1,532 | ||||||
| 39 | Cabot Oil & Gas Corp. | 981 | ||||||
| 64 | Chesapeake Energy Corp. (a) | 319 | ||||||
| 159 | Chevron Corp. | 16,605 | ||||||
| 8 | Cimarex Energy Co. | 751 | ||||||
| 12 | Concho Resources, Inc. (a) | 1,513 | ||||||
| 104 | ConocoPhillips | 4,569 | ||||||
| 44 | Devon Energy Corp. | 1,412 | ||||||
| 48 | EOG Resources, Inc. | 4,390 | ||||||
| 15 | EQT Corp. | 853 | ||||||
| 356 | Exxon Mobil Corp. | 28,737 | ||||||
| 23 | Hess Corp. | 996 | ||||||
| 161 | Kinder Morgan, Inc. | 3,090 | ||||||
| 71 | Marathon Oil Corp. | 846 | ||||||
| 44 | Marathon Petroleum Corp. | 2,280 | ||||||
| 14 | Murphy Oil Corp. | 348 | ||||||
| 17 | Newfield Exploration Co. (a) | 476 | ||||||
| 38 | Noble Energy, Inc. | 1,082 | ||||||
| 64 | Occidental Petroleum Corp. | 3,846 | ||||||
| 32 | ONEOK, Inc. | 1,663 | ||||||
| 37 | Phillips 66 | 3,047 | ||||||
| 14 | Pioneer Natural Resources Co. | 2,280 | ||||||
| 16 | Range Resources Corp. | 365 | ||||||
| 13 | Tesoro Corp. | 1,188 | ||||||
| 38 | Valero Energy Corp. | 2,535 | ||||||
| 69 | Williams Cos., Inc. (The) | 2,102 | ||||||
|
| |||||||
| 89,940 | ||||||||
|
| |||||||
Total Energy | 105,571 | |||||||
|
| |||||||
Financials — 14.5% |
| |||||||
Banks — 6.5% |
| |||||||
| 836 | Bank of America Corp. | 20,282 | ||||||
| 68 | BB&T Corp. | 3,095 | ||||||
| 231 | Citigroup, Inc. | 15,469 | ||||||
| 43 | Citizens Financial Group, Inc. | 1,518 | ||||||
| 15 | Comerica, Inc. | 1,089 | ||||||
| 63 | Fifth Third Bancorp | 1,636 | ||||||
| 91 | Huntington Bancshares, Inc. | 1,235 | ||||||
| 298 | JPMorgan Chase & Co. (q) | 27,280 | ||||||
| 92 | KeyCorp | 1,726 | ||||||
| 13 | M&T Bank Corp. | 2,093 | ||||||
| 29 | People’s United Financial, Inc. | 511 | ||||||
| 41 | PNC Financial Services Group, Inc. (The) | 5,077 | ||||||
| 101 | Regions Financial Corp. | 1,478 | ||||||
| 41 | SunTrust Banks, Inc. | 2,304 | ||||||
| 133 | US Bancorp | 6,910 | ||||||
| SHARES | SECURITY DESCRIPTION | VALUE($) | ||||||
Banks — continued | ||||||||
| 378 | Wells Fargo & Co. | 20,936 | ||||||
| 17 | Zions Bancorp | 747 | ||||||
|
| |||||||
| 113,386 | ||||||||
|
| |||||||
Capital Markets — 2.9% |
| |||||||
| 5 | Affiliated Managers Group, Inc. | 789 | ||||||
| 13 | Ameriprise Financial, Inc. | 1,630 | ||||||
| 87 | Bank of New York Mellon Corp. (The) | 4,457 | ||||||
| 10 | BlackRock, Inc. | 4,303 | ||||||
| 8 | CBOE Holdings, Inc. | 705 | ||||||
| 102 | Charles Schwab Corp. (The) | 4,391 | ||||||
| 29 | CME Group, Inc. | 3,575 | ||||||
| 23 | E*TRADE Financial Corp. (a) | 878 | ||||||
| 29 | Franklin Resources, Inc. | 1,288 | ||||||
| 31 | Goldman Sachs Group, Inc. (The) | 6,824 | ||||||
| 50 | Intercontinental Exchange, Inc. | 3,279 | ||||||
| 34 | Invesco Ltd. | 1,203 | ||||||
| 14 | Moody’s Corp. | 1,701 | ||||||
| 120 | Morgan Stanley | 5,332 | ||||||
| 10 | Nasdaq, Inc. | 684 | ||||||
| 18 | Northern Trust Corp. | 1,763 | ||||||
| 11 | Raymond James Financial, Inc. | 864 | ||||||
| 22 | S&P Global, Inc. | 3,162 | ||||||
| 30 | State Street Corp. | 2,666 | ||||||
| 20 | T Rowe Price Group, Inc. | 1,504 | ||||||
|
| |||||||
| 50,998 | ||||||||
|
| |||||||
Consumer Finance — 0.7% |
| |||||||
| 63 | American Express Co. | 5,313 | ||||||
| 41 | Capital One Financial Corp. | 3,352 | ||||||
| 32 | Discover Financial Services | 1,986 | ||||||
| 24 | Navient Corp. | 399 | ||||||
| 65 | Synchrony Financial | 1,930 | ||||||
|
| |||||||
| 12,980 | ||||||||
|
| |||||||
Diversified Financial Services — 1.6% |
| |||||||
| 160 | Berkshire Hathaway, Inc., Class B (a) | 27,027 | ||||||
| 27 | Leucadia National Corp. | 712 | ||||||
|
| |||||||
| 27,739 | ||||||||
|
| |||||||
Insurance — 2.8% |
| |||||||
| 33 | Aflac, Inc. | 2,590 | ||||||
| 31 | Allstate Corp. (The) | 2,708 | ||||||
| 74 | American International Group, Inc. | 4,619 | ||||||
| 22 | Aon plc | 2,927 | ||||||
| 15 | Arthur J Gallagher & Co. | 863 | ||||||
| 5 | Assurant, Inc. | 477 | ||||||
| 39 | Chubb Ltd. | 5,703 | ||||||
SEE NOTES TO FINANCIAL STATEMENTS.
| 10 | J.P. MORGAN EQUITY FUNDS | JUNE 30, 2017 | ||||
Table of Contents
| SHARES | SECURITY DESCRIPTION | VALUE($) | ||||||
Common Stocks — continued | ||||||||
Insurance — continued | ||||||||
| 13 | Cincinnati Financial Corp. | 912 | ||||||
| 3 | Everest Re Group Ltd. | 879 | ||||||
| 31 | Hartford Financial Services Group, Inc. (The) | 1,622 | ||||||
| 19 | Lincoln National Corp. | 1,273 | ||||||
| 23 | Loews Corp. | 1,086 | ||||||
| 43 | Marsh & McLennan Cos., Inc. | 3,375 | ||||||
| 91 | MetLife, Inc. | 4,987 | ||||||
| 23 | Principal Financial Group, Inc. | 1,443 | ||||||
| 49 | Progressive Corp. (The) | 2,152 | ||||||
| 36 | Prudential Financial, Inc. | 3,897 | ||||||
| 9 | Torchmark Corp. | 699 | ||||||
| 23 | Travelers Cos., Inc. (The) | 2,970 | ||||||
| 19 | Unum Group | 894 | ||||||
| 11 | Willis Towers Watson plc | 1,554 | ||||||
| 22 | XL Group Ltd., (Bermuda) | 962 | ||||||
|
| |||||||
| 48,592 | ||||||||
|
| |||||||
Total Financials | 253,695 | |||||||
|
| |||||||
Health Care — 14.5% |
| |||||||
Biotechnology — 3.0% |
| |||||||
| 134 | AbbVie, Inc. | 9,695 | ||||||
| 19 | Alexion Pharmaceuticals, Inc. (a) | 2,295 | ||||||
| 62 | Amgen, Inc. | 10,647 | ||||||
| 18 | Biogen, Inc. (a) | 4,870 | ||||||
| 66 | Celgene Corp. (a) | 8,519 | ||||||
| 110 | Gilead Sciences, Inc. | 7,770 | ||||||
| 14 | Incyte Corp. (a) | 1,798 | ||||||
| 6 | Regeneron Pharmaceuticals, Inc. (a) | 3,144 | ||||||
| 21 | Vertex Pharmaceuticals, Inc. (a) | 2,697 | ||||||
|
| |||||||
| 51,435 | ||||||||
|
| |||||||
Health Care Equipment & Supplies — 2.9% |
| |||||||
| 146 | Abbott Laboratories | 7,086 | ||||||
| 6 | Align Technology, Inc. (a) | 952 | ||||||
| 41 | Baxter International, Inc. | 2,481 | ||||||
| 19 | Becton Dickinson and Co. | 3,727 | ||||||
| 115 | Boston Scientific Corp. (a) | 3,189 | ||||||
| 4 | Cooper Cos., Inc. (The) | 983 | ||||||
| 6 | CR Bard, Inc. | 1,923 | ||||||
| 51 | Danaher Corp. | 4,330 | ||||||
| 19 | DENTSPLY SIRONA, Inc. | 1,249 | ||||||
| 18 | Edwards Lifesciences Corp. (a) | 2,084 | ||||||
| 24 | Hologic, Inc. (a) | 1,068 | ||||||
| 7 | IDEXX Laboratories, Inc. (a) | 1,195 | ||||||
| 3 | Intuitive Surgical, Inc. (a) | 2,894 | ||||||
| 115 | Medtronic plc | 10,206 | ||||||
| SHARES | SECURITY DESCRIPTION | VALUE($) | ||||||
Health Care Equipment & Supplies — continued |
| |||||||
| 26 | Stryker Corp. | 3,616 | ||||||
| 8 | Varian Medical Systems, Inc. (a) | 797 | ||||||
| 17 | Zimmer Biomet Holdings, Inc. | 2,171 | ||||||
|
| |||||||
| 49,951 | ||||||||
|
| |||||||
Health Care Providers & Services — 2.8% |
| |||||||
| 28 | Aetna, Inc. | 4,231 | ||||||
| 14 | AmerisourceBergen Corp. | 1,318 | ||||||
| 22 | Anthem, Inc. | 4,188 | ||||||
| 27 | Cardinal Health, Inc. | 2,068 | ||||||
| 14 | Centene Corp. (a) | 1,156 | ||||||
| 22 | Cigna Corp. | 3,600 | ||||||
| 13 | DaVita, Inc. (a) | 847 | ||||||
| 10 | Envision Healthcare Corp. (a) | 618 | ||||||
| 50 | Express Scripts Holding Co. (a) | 3,183 | ||||||
| 24 | HCA Healthcare, Inc. (a) | 2,096 | ||||||
| 7 | Henry Schein, Inc. (a) | 1,220 | ||||||
| 12 | Humana, Inc. | 2,917 | ||||||
| 9 | Laboratory Corp. of America Holdings (a) | 1,325 | ||||||
| 18 | McKesson Corp. | 2,915 | ||||||
| 7 | Patterson Cos., Inc. | 322 | ||||||
| 11 | Quest Diagnostics, Inc. | 1,278 | ||||||
| 81 | UnitedHealth Group, Inc. | 15,011 | ||||||
| 8 | Universal Health Services, Inc., Class B | 917 | ||||||
|
| |||||||
| 49,210 | ||||||||
|
| |||||||
Health Care Technology — 0.1% |
| |||||||
| 25 | Cerner Corp. (a) | 1,642 | ||||||
|
| |||||||
Life Sciences Tools & Services — 0.7% |
| |||||||
| 27 | Agilent Technologies, Inc. | 1,606 | ||||||
| 12 | Illumina, Inc. (a) | 2,129 | ||||||
| 2 | Mettler-Toledo International, Inc. (a) | 1,276 | ||||||
| 9 | PerkinElmer, Inc. | 630 | ||||||
| 33 | Thermo Fisher Scientific, Inc. | 5,734 | ||||||
| 7 | Waters Corp. (a) | 1,236 | ||||||
|
| |||||||
| 12,611 | ||||||||
|
| |||||||
Pharmaceuticals — 5.0% |
| |||||||
| 28 | Allergan plc | 6,859 | ||||||
| 138 | Bristol-Myers Squibb Co. | 7,712 | ||||||
| 82 | Eli Lilly & Co. | 6,713 | ||||||
| 226 | Johnson & Johnson | 29,938 | ||||||
| 8 | Mallinckrodt plc (a) | 373 | ||||||
| 230 | Merck & Co., Inc. | 14,727 | ||||||
| 39 | Mylan NV (a) | 1,503 | ||||||
| 12 | Perrigo Co. plc | 910 | ||||||
| 501 | Pfizer, Inc. | 16,840 | ||||||
SEE NOTES TO FINANCIAL STATEMENTS.
| JUNE 30, 2017 | J.P. MORGAN EQUITY FUNDS | 11 | ||||||
Table of Contents
JPMorgan Equity Index Fund
SCHEDULE OF PORTFOLIO INVESTMENTS
AS OF JUNE 30, 2017 (continued)
(Amounts in thousands)
| SHARES | SECURITY DESCRIPTION | VALUE($) | ||||||
Common Stocks — continued | ||||||||
Pharmaceuticals — continued | ||||||||
| 41 | Zoetis, Inc. | 2,572 | ||||||
|
| |||||||
| 88,147 | ||||||||
|
| |||||||
Total Health Care | 252,996 | |||||||
|
| |||||||
Industrials — 10.3% |
| |||||||
Aerospace & Defense — 2.3% |
| |||||||
| 37 | Arconic, Inc. | 839 | ||||||
| 47 | Boeing Co. (The) | 9,325 | ||||||
| 24 | General Dynamics Corp. | 4,720 | ||||||
| 7 | L3 Technologies, Inc. | 1,093 | ||||||
| 21 | Lockheed Martin Corp. | 5,805 | ||||||
| 15 | Northrop Grumman Corp. | 3,765 | ||||||
| 24 | Raytheon Co. | 3,949 | ||||||
| 14 | Rockwell Collins, Inc. | 1,433 | ||||||
| 22 | Textron, Inc. | 1,059 | ||||||
| 4 | TransDigm Group, Inc. | 1,105 | ||||||
| 63 | United Technologies Corp. | 7,644 | ||||||
|
| |||||||
| 40,737 | ||||||||
|
| |||||||
Air Freight & Logistics — 0.7% |
| |||||||
| 12 | CH Robinson Worldwide, Inc. | 813 | ||||||
| 15 | Expeditors International of Washington, Inc. | 855 | ||||||
| 21 | FedEx Corp. | 4,491 | ||||||
| 58 | United Parcel Service, Inc., Class B | 6,399 | ||||||
|
| |||||||
| 12,558 | ||||||||
|
| |||||||
Airlines — 0.7% |
| |||||||
| 10 | Alaska Air Group, Inc. | 932 | ||||||
| 41 | American Airlines Group, Inc. | 2,082 | ||||||
| 62 | Delta Air Lines, Inc. | 3,323 | ||||||
| 51 | Southwest Airlines Co. | 3,157 | ||||||
| 24 | United Continental Holdings, Inc. (a) | 1,781 | ||||||
|
| |||||||
| 11,275 | ||||||||
|
| |||||||
Building Products — 0.3% |
| |||||||
| 8 | Allegion plc | 650 | ||||||
| 13 | Fortune Brands Home & Security, Inc. | 843 | ||||||
| 79 | Johnson Controls International plc | 3,417 | ||||||
| 27 | Masco Corp. | 1,026 | ||||||
|
| |||||||
| 5,936 | ||||||||
|
| |||||||
Commercial Services & Supplies — 0.3% |
| |||||||
| 7 | Cintas Corp. | 914 | ||||||
| 19 | Republic Services, Inc. | 1,231 | ||||||
| 7 | Stericycle, Inc. (a) | 547 | ||||||
| 34 | Waste Management, Inc. | 2,505 | ||||||
|
| |||||||
| 5,197 | ||||||||
|
| |||||||
| SHARES | SECURITY DESCRIPTION | VALUE($) | ||||||
Construction & Engineering — 0.1% |
| |||||||
| 12 | Fluor Corp. | 538 | ||||||
| 10 | Jacobs Engineering Group, Inc. | 550 | ||||||
| 12 | Quanta Services, Inc. (a) | 409 | ||||||
|
| |||||||
| 1,497 | ||||||||
|
| |||||||
Electrical Equipment — 0.6% |
| |||||||
| 4 | Acuity Brands, Inc. | 753 | ||||||
| 19 | AMETEK, Inc. | 1,171 | ||||||
| 38 | Eaton Corp. plc | 2,925 | ||||||
| 54 | Emerson Electric Co. | 3,228 | ||||||
| 11 | Rockwell Automation, Inc. | 1,753 | ||||||
|
| |||||||
| 9,830 | ||||||||
|
| |||||||
Industrial Conglomerates — 2.3% |
| |||||||
| 50 | 3M Co. | 10,452 | ||||||
| 732 | General Electric Co. (k) | 19,761 | ||||||
| 64 | Honeywell International, Inc. | 8,536 | ||||||
| 9 | Roper Technologies, Inc. | 1,984 | ||||||
|
| |||||||
| 40,733 | ||||||||
|
| |||||||
Machinery — 1.6% |
| |||||||
| 49 | Caterpillar, Inc. | 5,319 | ||||||
| 13 | Cummins, Inc. | 2,106 | ||||||
| 25 | Deere & Co. | 3,055 | ||||||
| 13 | Dover Corp. | 1,049 | ||||||
| 11 | Flowserve Corp. | 509 | ||||||
| 25 | Fortive Corp. | 1,605 | ||||||
| 26 | Illinois Tool Works, Inc. | 3,741 | ||||||
| 22 | Ingersoll-Rand plc | 1,966 | ||||||
| 30 | PACCAR, Inc. | 1,949 | ||||||
| 11 | Parker-Hannifin Corp. | 1,788 | ||||||
| 14 | Pentair plc, (United Kingdom) | 937 | ||||||
| 5 | Snap-on, Inc. | 769 | ||||||
| 13 | Stanley Black & Decker, Inc. | 1,809 | ||||||
| 15 | Xylem, Inc. | 837 | ||||||
|
| |||||||
| 27,439 | ||||||||
|
| |||||||
Professional Services — 0.3% |
| |||||||
| 10 | Equifax, Inc. | 1,388 | ||||||
| 27 | IHS Markit Ltd. (a) | 1,174 | ||||||
| 28 | Nielsen Holdings plc | 1,091 | ||||||
| 11 | Robert Half International, Inc. | 512 | ||||||
| 13 | Verisk Analytics, Inc. (a) | 1,090 | ||||||
|
| |||||||
| 5,255 | ||||||||
|
| |||||||
Road & Rail — 0.9% |
| |||||||
| 78 | CSX Corp. | 4,229 | ||||||
| 7 | JB Hunt Transport Services, Inc. | 659 | ||||||
SEE NOTES TO FINANCIAL STATEMENTS.
| 12 | J.P. MORGAN EQUITY FUNDS | JUNE 30, 2017 | ||||
Table of Contents
| SHARES | SECURITY DESCRIPTION | VALUE($) | ||||||
Common Stocks — continued | ||||||||
Road & Rail — continued | ||||||||
| 9 | Kansas City Southern | 932 | ||||||
| 24 | Norfolk Southern Corp. | 2,963 | ||||||
| 68 | Union Pacific Corp. | 7,388 | ||||||
|
| |||||||
| 16,171 | ||||||||
|
| |||||||
Trading Companies & Distributors — 0.2% |
| |||||||
| 24 | Fastenal Co. | 1,058 | ||||||
| 7 | United Rentals, Inc. (a) | 800 | ||||||
| 5 | WW Grainger, Inc. | 815 | ||||||
|
| |||||||
| 2,673 | ||||||||
|
| |||||||
Total Industrials | 179,301 | |||||||
|
| |||||||
Information Technology — 22.2% |
| |||||||
Communications Equipment — 1.0% |
| |||||||
| 420 | Cisco Systems, Inc. | 13,148 | ||||||
| 5 | F5 Networks, Inc. (a) | 690 | ||||||
| 10 | Harris Corp. | 1,117 | ||||||
| 32 | Juniper Networks, Inc. | 895 | ||||||
| 14 | Motorola Solutions, Inc. | 1,191 | ||||||
|
| |||||||
| 17,041 | ||||||||
|
| |||||||
Electronic Equipment, Instruments & Components — 0.4% |
| |||||||
| 26 | Amphenol Corp., Class A | 1,895 | ||||||
| 77 | Corning, Inc. | 2,323 | ||||||
| 11 | FLIR Systems, Inc. | 397 | ||||||
| 30 | TE Connectivity Ltd. | 2,347 | ||||||
|
| |||||||
| 6,962 | ||||||||
|
| |||||||
Internet Software & Services — 4.6% |
| |||||||
| 15 | Akamai Technologies, Inc. (a) | 723 | ||||||
| 25 | Alphabet, Inc., Class A (a) | 23,246 | ||||||
| 25 | Alphabet, Inc., Class C (a) | 22,780 | ||||||
| 85 | eBay, Inc. (a) | 2,953 | ||||||
| 199 | Facebook, Inc., Class A (a) | 29,981 | ||||||
| 7 | VeriSign, Inc. (a) | 690 | ||||||
|
| |||||||
| 80,373 | ||||||||
|
| |||||||
IT Services — 3.8% |
| |||||||
| 52 | Accenture plc, Class A | 6,443 | ||||||
| 5 | Alliance Data Systems Corp. | 1,201 | ||||||
| 38 | Automatic Data Processing, Inc. | 3,851 | ||||||
| 49 | Cognizant Technology Solutions Corp., Class A | 3,286 | ||||||
| 12 | CSRA, Inc. | 388 | ||||||
| 24 | DXC Technology Co. | 1,826 | ||||||
| 28 | Fidelity National Information Services, Inc. | 2,372 | ||||||
| 18 | Fiserv, Inc. (a) | 2,183 | ||||||
| 8 | Gartner, Inc. (a) | 938 | ||||||
| 13 | Global Payments, Inc. | 1,157 | ||||||
| SHARES | SECURITY DESCRIPTION | VALUE($) | ||||||
IT Services — continued | ||||||||
| 72 | International Business Machines Corp. | 11,049 | ||||||
| 79 | Mastercard, Inc., Class A | 9,570 | ||||||
| 27 | Paychex, Inc. | 1,529 | ||||||
| 94 | PayPal Holdings, Inc. (a) | 5,037 | ||||||
| 14 | Total System Services, Inc. | 810 | ||||||
| 155 | Visa, Inc., Class A | 14,545 | ||||||
| 40 | Western Union Co. (The) | 754 | ||||||
|
| |||||||
| 66,939 | ||||||||
|
| |||||||
Semiconductors & Semiconductor Equipment — 3.4% |
| |||||||
| 65 | Advanced Micro Devices, Inc. (a) | 812 | ||||||
| 31 | Analog Devices, Inc. | 2,399 | ||||||
| 90 | Applied Materials, Inc. | 3,729 | ||||||
| 34 | Broadcom Ltd. | 7,858 | ||||||
| 396 | Intel Corp. | 13,348 | ||||||
| 13 | KLA-Tencor Corp. | 1,205 | ||||||
| 14 | Lam Research Corp. | 1,917 | ||||||
| 19 | Microchip Technology, Inc. | 1,487 | ||||||
| 87 | Micron Technology, Inc. (a) | 2,609 | ||||||
| 50 | NVIDIA Corp. | 7,226 | ||||||
| 11 | Qorvo, Inc. (a) | 676 | ||||||
| 124 | QUALCOMM, Inc. | 6,854 | ||||||
| 16 | Skyworks Solutions, Inc. | 1,488 | ||||||
| 84 | Texas Instruments, Inc. | 6,439 | ||||||
| 21 | Xilinx, Inc. | 1,340 | ||||||
|
| |||||||
| 59,387 | ||||||||
|
| |||||||
Software — 4.9% |
| |||||||
| 58 | Activision Blizzard, Inc. | 3,353 | ||||||
| 42 | Adobe Systems, Inc. (a) | 5,878 | ||||||
| 7 | ANSYS, Inc. (a) | 874 | ||||||
| 16 | Autodesk, Inc. (a) | 1,643 | ||||||
| 26 | CA, Inc. | 907 | ||||||
| 13 | Citrix Systems, Inc. (a) | 1,011 | ||||||
| 26 | Electronic Arts, Inc. (a) | 2,753 | ||||||
| 20 | Intuit, Inc. | 2,716 | ||||||
| 649 | Microsoft Corp. | 44,707 | ||||||
| 252 | Oracle Corp. | 12,652 | ||||||
| 15 | Red Hat, Inc. (a) | 1,430 | ||||||
| 56 | salesforce.com, Inc. (a) | 4,865 | ||||||
| 51 | Symantec Corp. | 1,444 | ||||||
| 13 | Synopsys, Inc. (a) | 920 | ||||||
|
| |||||||
| 85,153 | ||||||||
|
| |||||||
Technology Hardware, Storage & Peripherals — 4.1% |
| |||||||
| 438 | Apple, Inc. | 63,082 | ||||||
| 140 | Hewlett Packard Enterprise Co. | 2,320 | ||||||
SEE NOTES TO FINANCIAL STATEMENTS.
| JUNE 30, 2017 | J.P. MORGAN EQUITY FUNDS | 13 | ||||||
Table of Contents
JPMorgan Equity Index Fund
SCHEDULE OF PORTFOLIO INVESTMENTS
AS OF JUNE 30, 2017 (continued)
(Amounts in thousands, except number of Futures contracts)
| SHARES | SECURITY DESCRIPTION | VALUE($) | ||||||
Common Stocks — continued | ||||||||
Technology Hardware, Storage & Peripherals — continued |
| |||||||
| 141 | HP, Inc. | 2,472 | ||||||
| 23 | NetApp, Inc. | 912 | ||||||
| 25 | Seagate Technology plc | 967 | ||||||
| 24 | Western Digital Corp. | 2,168 | ||||||
| 18 | Xerox Corp. | 514 | ||||||
|
| |||||||
| 72,435 | ||||||||
|
| |||||||
Total Information Technology | 388,290 | |||||||
|
| |||||||
Materials — 2.8% |
| |||||||
Chemicals — 2.1% |
| |||||||
| 18 | Air Products & Chemicals, Inc. | 2,617 | ||||||
| 9 | Albemarle Corp. | 982 | ||||||
| 20 | CF Industries Holdings, Inc. | 547 | ||||||
| 94 | Dow Chemical Co. (The) | 5,955 | ||||||
| 12 | Eastman Chemical Co. | 1,029 | ||||||
| 22 | Ecolab, Inc. | 2,911 | ||||||
| 73 | EI du Pont de Nemours & Co. | 5,879 | ||||||
| 11 | FMC Corp. | 822 | ||||||
| 7 | International Flavors & Fragrances, Inc. | 895 | ||||||
| 28 | LyondellBasell Industries NV, Class A | 2,342 | ||||||
| 37 | Monsanto Co. | 4,363 | ||||||
| 29 | Mosaic Co. (The) | 673 | ||||||
| 22 | PPG Industries, Inc. | 2,367 | ||||||
| 24 | Praxair, Inc. | 3,183 | ||||||
| 7 | Sherwin-Williams Co. (The) | 2,389 | ||||||
|
| |||||||
| 36,954 | ||||||||
|
| |||||||
Construction Materials — 0.1% |
| |||||||
| 5 | Martin Marietta Materials, Inc. | 1,171 | ||||||
| 11 | Vulcan Materials Co. | 1,406 | ||||||
|
| |||||||
| 2,577 | ||||||||
|
| |||||||
Containers & Packaging — 0.3% |
| |||||||
| 7 | Avery Dennison Corp. | 657 | ||||||
| 29 | Ball Corp. | 1,242 | ||||||
| 35 | International Paper Co. | 1,964 | ||||||
| 16 | Sealed Air Corp. | 736 | ||||||
| 21 | WestRock Co. | 1,195 | ||||||
|
| |||||||
| 5,794 | ||||||||
|
| |||||||
Metals & Mining — 0.3% |
| |||||||
| 112 | Freeport-McMoRan, Inc. (a) | 1,343 | ||||||
| 45 | Newmont Mining Corp. | 1,451 | ||||||
| 27 | Nucor Corp. | 1,551 | ||||||
|
| |||||||
| 4,345 | ||||||||
|
| |||||||
Total Materials | 49,670 | |||||||
|
| |||||||
| SHARES | SECURITY DESCRIPTION | VALUE($) | ||||||
Real Estate — 2.9% |
| |||||||
Equity Real Estate Investment Trusts (REITs) — 2.9% |
| |||||||
| 8 | Alexandria Real Estate Equities, Inc. | 922 | ||||||
| 36 | American Tower Corp. | 4,724 | ||||||
| 13 | Apartment Investment & Management Co., Class A | 567 | ||||||
| 12 | AvalonBay Communities, Inc. | 2,224 | ||||||
| 13 | Boston Properties, Inc. | 1,590 | ||||||
| 31 | Crown Castle International Corp. | 3,081 | ||||||
| 13 | Digital Realty Trust, Inc. | 1,516 | ||||||
| 7 | Equinix, Inc. | 2,809 | ||||||
| 31 | Equity Residential | 2,030 | ||||||
| 6 | Essex Property Trust, Inc. | 1,418 | ||||||
| 11 | Extra Space Storage, Inc. | 825 | ||||||
| 6 | Federal Realty Investment Trust | 767 | ||||||
| 49 | GGP, Inc. | 1,154 | ||||||
| 39 | HCP, Inc. | 1,258 | ||||||
| 62 | Host Hotels & Resorts, Inc. | 1,135 | ||||||
| 21 | Iron Mountain, Inc. | 709 | ||||||
| 36 | Kimco Realty Corp. | 656 | ||||||
| 10 | Macerich Co. (The) | 581 | ||||||
| 10 | Mid-America Apartment Communities, Inc. | 1,006 | ||||||
| 45 | Prologis, Inc. | 2,612 | ||||||
| 13 | Public Storage | 2,619 | ||||||
| 23 | Realty Income Corp. | 1,266 | ||||||
| 12 | Regency Centers Corp. | 770 | ||||||
| 26 | Simon Property Group, Inc. | 4,243 | ||||||
| 9 | SL Green Realty Corp. | 905 | ||||||
| 22 | UDR, Inc. | 875 | ||||||
| 30 | Ventas, Inc. | 2,071 | ||||||
| 14 | Vornado Realty Trust | 1,359 | ||||||
| 31 | Welltower, Inc. | 2,303 | ||||||
| 63 | Weyerhaeuser Co. | 2,114 | ||||||
|
| |||||||
| 50,109 | ||||||||
|
| |||||||
Real Estate Management & Development — 0.0% (g) |
| |||||||
| 25 | CBRE Group, Inc., Class A (a) | 920 | ||||||
|
| |||||||
Total Real Estate | 51,029 | |||||||
|
| |||||||
Telecommunication Services — 2.1% |
| |||||||
Diversified Telecommunication Services — 2.1% |
| |||||||
| 516 | AT&T, Inc. | 19,487 | ||||||
| 46 | CenturyLink, Inc. | 1,101 | ||||||
| 25 | Level 3 Communications, Inc. (a) | 1,459 | ||||||
| 343 | Verizon Communications, Inc. | 15,305 | ||||||
|
| |||||||
Total Telecommunication Services | 37,352 | |||||||
|
| |||||||
SEE NOTES TO FINANCIAL STATEMENTS.
| 14 | J.P. MORGAN EQUITY FUNDS | JUNE 30, 2017 | ||||
Table of Contents
| SHARES | SECURITY DESCRIPTION | VALUE($) | ||||||
Common Stocks — continued | ||||||||
Utilities — 3.2% |
| |||||||
Electric Utilities — 2.0% |
| |||||||
| 19 | Alliant Energy Corp. | 769 | ||||||
| 41 | American Electric Power Co., Inc. | 2,870 | ||||||
| 59 | Duke Energy Corp. | 4,915 | ||||||
| 27 | Edison International | 2,140 | ||||||
| 15 | Entergy Corp. | 1,157 | ||||||
| 27 | Eversource Energy | 1,616 | ||||||
| 78 | Exelon Corp. | 2,806 | ||||||
| 37 | FirstEnergy Corp. | 1,087 | ||||||
| 39 | NextEra Energy, Inc. | 5,511 | ||||||
| 43 | PG&E Corp. | 2,847 | ||||||
| 9 | Pinnacle West Capital Corp. | 798 | ||||||
| 57 | PPL Corp. | 2,219 | ||||||
| 84 | Southern Co. (The) | 4,001 | ||||||
| 43 | Xcel Energy, Inc. | 1,957 | ||||||
|
| |||||||
| 34,693 | ||||||||
|
| |||||||
Independent Power and Renewable Electricity |
| |||||||
| 55 | AES Corp. | 616 | ||||||
| 27 | NRG Energy, Inc. | 458 | ||||||
|
| |||||||
| 1,074 | ||||||||
|
| |||||||
Multi-Utilities — 1.0% |
| |||||||
| 20 | Ameren Corp. | 1,114 | ||||||
| 36 | CenterPoint Energy, Inc. | 991 | ||||||
| 24 | CMS Energy Corp. | 1,090 | ||||||
| 26 | Consolidated Edison, Inc. | 2,074 | ||||||
| 53 | Dominion Energy, Inc. | 4,049 | ||||||
| 15 | DTE Energy Co. | 1,594 | ||||||
| 27 | NiSource, Inc. | 689 | ||||||
| 42 | Public Service Enterprise Group, Inc. | 1,828 | ||||||
| 12 | SCANA Corp. | 805 | ||||||
| SHARES | SECURITY DESCRIPTION | VALUE($) | ||||||
Multi-Utilities — continued |
| |||||||
| 21 | Sempra Energy | 2,376 | ||||||
| 27 | WEC Energy Group, Inc. | 1,627 | ||||||
|
| |||||||
| 18,237 | ||||||||
|
| |||||||
Water Utilities — 0.1% |
| |||||||
| 15 | American Water Works Co., Inc. | 1,167 | ||||||
|
| |||||||
Total Utilities | 55,171 | |||||||
|
| |||||||
Total Common Stocks | 1,744,935 | |||||||
|
| |||||||
| NUMBER OF RIGHTS | ||||||||
Rights — 0.0% (g) | ||||||||
Consumer Staples — 0.0% (g) | ||||||||
Food & Staples Retailing — 0.0% (g) | ||||||||
| 25 | Safeway, Inc. Casa Ley CVR, expiring 01/30/18 (a) | 1 | ||||||
| 25 | Safeway, Inc. PDC CVR (a) | 1 | ||||||
|
| |||||||
Total Rights | 2 | |||||||
|
| |||||||
| SHARES | ||||||||
Short-Term Investment — 0.4% | ||||||||
Investment Company — 0.4% | ||||||||
| 6,258 | JPMorgan U.S. Government Money Market Fund, Institutional Class Shares, 0.840% (b) (l) | 6,258 | ||||||
|
| |||||||
Total Investments — 100.1% | 1,751,195 | |||||||
Liabilities in Excess of | (1,765 | ) | ||||||
|
| |||||||
NET ASSETS — 100.0% | $ | 1,749,430 | ||||||
|
| |||||||
Percentages indicated are based on net assets.
| Futures Contracts | ||||||||||||||||||||||
| NUMBER OF CONTRACTS | DESCRIPTION | EXPIRATION DATE | TRADING CURRENCY | NOTIONAL VALUE AT JUNE 30, 2017 | NET UNREALIZED APPRECIATION (DEPRECIATION) | |||||||||||||||||
| Long Futures Outstanding | ||||||||||||||||||||||
| 62 | E-mini S&P 500 Index | 09/15/17 | USD | $ | 7,505 | $ | (21 | ) | ||||||||||||||
|
| |||||||||||||||||||||
SEE NOTES TO FINANCIAL STATEMENTS.
| JUNE 30, 2017 | J.P. MORGAN EQUITY FUNDS | 15 | ||||||
Table of Contents
JPMorgan Market Expansion Enhanced Index Fund
SCHEDULE OF PORTFOLIO INVESTMENTS
AS OF JUNE 30, 2017
(Amounts in thousands)
| SHARES | SECURITY DESCRIPTION | VALUE($) | ||||||
| Common Stocks — 98.9% | ||||||||
Consumer Discretionary — 11.5% |
| |||||||
Auto Components — 1.1% |
| |||||||
| 33 | American Axle & Manufacturing Holdings, Inc. (a) | 520 | ||||||
| 32 | Cooper-Standard Holdings, Inc. (a) | 3,258 | ||||||
| 205 | Dana, Inc. | 4,569 | ||||||
| 22 | LCI Industries | 2,273 | ||||||
| 11 | Standard Motor Products, Inc. | 595 | ||||||
| 9 | Superior Industries International, Inc. | 191 | ||||||
|
| |||||||
| 11,406 | ||||||||
|
| |||||||
Automobiles — 0.3% |
| |||||||
| 28 | Thor Industries, Inc. | 2,878 | ||||||
| 13 | Winnebago Industries, Inc. | 445 | ||||||
|
| |||||||
| 3,323 | ||||||||
|
| |||||||
Distributors — 0.0% (g) | ||||||||
| 7 | Core-Mark Holding Co., Inc. | 222 | ||||||
|
| |||||||
Diversified Consumer Services — 0.4% |
| |||||||
| 24 | Adtalem Global Education, Inc. | 918 | ||||||
| 6 | Capella Education Co. | 528 | ||||||
| 2 | Graham Holdings Co., Class B | 1,139 | ||||||
| 6 | Sotheby’s (a) | 333 | ||||||
| 5 | Strayer Education, Inc. | 429 | ||||||
|
| |||||||
| 3,347 | ||||||||
|
| |||||||
Hotels, Restaurants & Leisure — 2.0% |
| |||||||
| 9 | BJ’s Restaurants, Inc. (a) | 335 | ||||||
| 8 | Bob Evans Farms, Inc. | 539 | ||||||
| 65 | Brinker International, Inc. | 2,468 | ||||||
| 8 | Buffalo Wild Wings, Inc. (a) | 1,026 | ||||||
| 35 | Cheesecake Factory, Inc. (The) | 1,771 | ||||||
| 12 | Cracker Barrel Old Country Store, Inc. | 2,044 | ||||||
| 7 | DineEquity, Inc. | 326 | ||||||
| 20 | Domino’s Pizza, Inc. | 4,273 | ||||||
| 15 | Jack in the Box, Inc. | 1,458 | ||||||
| 9 | Panera Bread Co., Class A (a) | 2,895 | ||||||
| 10 | Papa John’s International, Inc. | 703 | ||||||
| 12 | Ruth’s Hospitality Group, Inc. | 259 | ||||||
| 19 | Scientific Games Corp., Class A (a) | 498 | ||||||
| 25 | Texas Roadhouse, Inc. | 1,256 | ||||||
| 23 | Wendy’s Co. (The) | 349 | ||||||
|
| |||||||
| 20,200 | ||||||||
|
| |||||||
Household Durables — 2.2% |
| |||||||
| 27 | Helen of Troy Ltd. (a) | 2,511 | ||||||
| 171 | KB Home | 4,096 | ||||||
| 97 | La-Z-Boy, Inc. | 3,146 | ||||||
| 2 | NVR, Inc. (a) | 3,830 | ||||||
| SHARES | SECURITY DESCRIPTION | VALUE($) | ||||||
Household Durables — continued |
| |||||||
| 5 | Tempur Sealy International, Inc. (a) | 246 | ||||||
| 131 | Toll Brothers, Inc. | 5,180 | ||||||
| 38 | TopBuild Corp. (a) | 2,038 | ||||||
| 21 | Tupperware Brands Corp. | 1,479 | ||||||
|
| |||||||
| 22,526 | ||||||||
|
| |||||||
Internet & Direct Marketing Retail — 0.1% |
| |||||||
| 8 | FTD Cos., Inc. (a) | 162 | ||||||
| 13 | HSN, Inc. | 402 | ||||||
| 10 | Nutrisystem, Inc. | 505 | ||||||
|
| |||||||
| 1,069 | ||||||||
|
| |||||||
Leisure Products — 0.7% |
| |||||||
| 38 | Brunswick Corp. | 2,384 | ||||||
| 243 | Callaway Golf Co. | 3,109 | ||||||
| 9 | Polaris Industries, Inc. | 791 | ||||||
| 25 | Vista Outdoor, Inc. (a) | 563 | ||||||
|
| |||||||
| 6,847 | ||||||||
|
| |||||||
Media — 1.2% |
| |||||||
| 35 | AMC Networks, Inc., Class A (a) | 1,875 | ||||||
| 2 | Cable One, Inc. | 1,457 | ||||||
| 30 | Cinemark Holdings, Inc. | 1,169 | ||||||
| 49 | Gannett Co., Inc. | 428 | ||||||
| 37 | John Wiley & Sons, Inc., Class A | 1,947 | ||||||
| 93 | Live Nation Entertainment, Inc. (a) | 3,247 | ||||||
| 15 | Meredith Corp. | 877 | ||||||
| 11 | Scholastic Corp. | 475 | ||||||
| 43 | Time, Inc. | 621 | ||||||
|
| |||||||
| 12,096 | ||||||||
|
| |||||||
Multiline Retail — 0.2% |
| |||||||
| 24 | Big Lots, Inc. | 1,141 | ||||||
| 129 | JC Penney Co., Inc. (a) | 600 | ||||||
|
| |||||||
| 1,741 | ||||||||
|
| |||||||
Specialty Retail — 2.4% |
| |||||||
| 115 | Aaron’s, Inc. | 4,479 | ||||||
| 69 | American Eagle Outfitters, Inc. | 827 | ||||||
| 49 | Caleres, Inc. | 1,370 | ||||||
| 31 | Cato Corp. (The), Class A | 538 | ||||||
| 89 | Chico’s FAS, Inc. | 835 | ||||||
| 32 | Children’s Place, Inc. (The) | 3,240 | ||||||
| 43 | Dick’s Sporting Goods, Inc. | 1,709 | ||||||
| 30 | Express, Inc. (a) | 205 | ||||||
| 21 | Finish Line, Inc. (The), Class A | 293 | ||||||
| 14 | Francesca’s Holdings Corp. (a) | 153 | ||||||
| 43 | GameStop Corp., Class A | 933 | ||||||
SEE NOTES TO FINANCIAL STATEMENTS.
| 16 | J.P. MORGAN EQUITY FUNDS | JUNE 30, 2017 | ||||
Table of Contents
| SHARES | SECURITY DESCRIPTION | VALUE($) | ||||||
Common Stocks — continued | ||||||||
Specialty Retail — continued |
| |||||||
| 39 | Group 1 Automotive, Inc. | 2,485 | ||||||
| 7 | Haverty Furniture Cos., Inc. | 177 | ||||||
| 24 | Lithia Motors, Inc., Class A | 2,226 | ||||||
| 15 | Murphy USA, Inc. (a) | 1,104 | ||||||
| 445 | Office Depot, Inc. | 2,508 | ||||||
| 21 | Select Comfort Corp. (a) | 738 | ||||||
| 45 | Tailored Brands, Inc. | 498 | ||||||
|
| |||||||
| 24,318 | ||||||||
|
| |||||||
Textiles, Apparel & Luxury Goods — 0.9% |
| |||||||
| 29 | Carter’s, Inc. | 2,588 | ||||||
| 11 | Deckers Outdoor Corp. (a) | 771 | ||||||
| 20 | Iconix Brand Group, Inc. (a) | 140 | ||||||
| 39 | Kate Spade & Co. (a) | 727 | ||||||
| 6 | Oxford Industries, Inc. | 350 | ||||||
| 41 | Perry Ellis International, Inc. (a) | 806 | ||||||
| 58 | Skechers USA, Inc., Class A (a) | 1,698 | ||||||
| 23 | Steven Madden Ltd. (a) | 932 | ||||||
| 36 | Wolverine World Wide, Inc. | 1,017 | ||||||
|
| |||||||
| 9,029 | ||||||||
|
| |||||||
Total Consumer Discretionary | 116,124 | |||||||
|
| |||||||
Consumer Staples — 3.2% |
| |||||||
Food & Staples Retailing — 0.4% |
| |||||||
| 7 | Casey’s General Stores, Inc. | 735 | ||||||
| 70 | SpartanNash Co. | 1,816 | ||||||
| 9 | Sprouts Farmers Market, Inc. (a) | 193 | ||||||
| 189 | SUPERVALU, Inc. (a) | 621 | ||||||
| 22 | United Natural Foods, Inc. (a) | 811 | ||||||
|
| |||||||
| 4,176 | ||||||||
|
| |||||||
Food Products — 2.2% |
| |||||||
| 28 | B&G Foods, Inc. | 985 | ||||||
| 66 | Darling Ingredients, Inc. (a) | 1,045 | ||||||
| 144 | Dean Foods Co. | 2,450 | ||||||
| 75 | Flowers Foods, Inc. | 1,305 | ||||||
| 29 | Hain Celestial Group, Inc. (The) (a) | 1,117 | ||||||
| 59 | Ingredion, Inc. | 7,053 | ||||||
| 6 | J&J Snack Foods Corp. | 752 | ||||||
| 57 | Lamb Weston Holdings, Inc. | 2,493 | ||||||
| 47 | Post Holdings, Inc. (a) | 3,681 | ||||||
| 8 | Sanderson Farms, Inc. | 939 | ||||||
| 13 | Seneca Foods Corp., Class A (a) | 393 | ||||||
|
| |||||||
| 22,213 | ||||||||
|
| |||||||
Household Products — 0.4% |
| |||||||
| 17 | Central Garden & Pet Co. (a) | 534 | ||||||
| 85 | Central Garden & Pet Co., Class A (a) | 2,549 | ||||||
| SHARES | SECURITY DESCRIPTION | VALUE($) | ||||||
Household Products — continued |
| |||||||
| 26 | Energizer Holdings, Inc. | 1,240 | ||||||
|
| |||||||
| 4,323 | ||||||||
|
| |||||||
Personal Products — 0.1% |
| |||||||
| 196 | Avon Products, Inc. (a) | 744 | ||||||
| 6 | Medifast, Inc. | 230 | ||||||
|
| |||||||
| 974 | ||||||||
|
| |||||||
Tobacco — 0.1% |
| |||||||
| 9 | Universal Corp. | 582 | ||||||
|
| |||||||
Total Consumer Staples | 32,268 | |||||||
|
| |||||||
Energy — 2.8% |
| |||||||
Energy Equipment & Services — 1.1% |
| |||||||
| 148 | Archrock, Inc. | 1,690 | ||||||
| 115 | Ensco plc, Class A | 595 | ||||||
| 39 | Exterran Corp. (a) | 1,032 | ||||||
| 46 | Gulf Island Fabrication, Inc. | 533 | ||||||
| 36 | Helix Energy Solutions Group, Inc. (a) | 206 | ||||||
| 226 | McDermott International, Inc. (a) | 1,619 | ||||||
| 39 | Newpark Resources, Inc. (a) | 286 | ||||||
| 98 | Noble Corp. plc | 356 | ||||||
| 19 | Oil States International, Inc. (a) | 518 | ||||||
| 61 | Patterson-UTI Energy, Inc. | 1,237 | ||||||
| 31 | Pioneer Energy Services Corp. (a) | 64 | ||||||
| 50 | Rowan Cos. plc, Class A (a) | 515 | ||||||
| 67 | Superior Energy Services, Inc. (a) | 695 | ||||||
| 24 | Unit Corp. (a) | 442 | ||||||
| 32 | US Silica Holdings, Inc. | 1,125 | ||||||
|
| |||||||
| 10,913 | ||||||||
|
| |||||||
Oil, Gas & Consumable Fuels — 1.7% |
| |||||||
| 18 | Bill Barrett Corp. (a) | 56 | ||||||
| 5 | Contango Oil & Gas Co. (a) | 36 | ||||||
| 152 | Denbury Resources, Inc. (a) | 233 | ||||||
| 40 | Energen Corp. (a) | 1,955 | ||||||
| 15 | Green Plains, Inc. | 317 | ||||||
| 64 | Gulfport Energy Corp. (a) | 938 | ||||||
| 131 | HollyFrontier Corp. | 3,587 | ||||||
| 44 | PBF Energy, Inc., Class A | 988 | ||||||
| 24 | PDC Energy, Inc. (a) | 1,030 | ||||||
| 101 | QEP Resources, Inc. (a) | 1,018 | ||||||
| 3 | REX American Resources Corp. (a) | 280 | ||||||
| 42 | SM Energy Co. | 686 | ||||||
| 213 | Southwestern Energy Co. (a) | 1,293 | ||||||
| 73 | SRC Energy, Inc. (a) | 492 | ||||||
| 63 | World Fuel Services Corp. | 2,421 | ||||||
SEE NOTES TO FINANCIAL STATEMENTS.
| JUNE 30, 2017 | J.P. MORGAN EQUITY FUNDS | 17 | ||||||
Table of Contents
JPMorgan Market Expansion Enhanced Index Fund
SCHEDULE OF PORTFOLIO INVESTMENTS
AS OF JUNE 30, 2017 (continued)
(Amounts in thousands)
| SHARES | SECURITY DESCRIPTION | VALUE($) | ||||||
Common Stocks — continued | ||||||||
Oil, Gas & Consumable Fuels — continued |
| |||||||
| 220 | WPX Energy, Inc. (a) | 2,125 | ||||||
|
| |||||||
| 17,455 | ||||||||
|
| |||||||
Total Energy | 28,368 | |||||||
|
| |||||||
Financials — 16.1% |
| |||||||
Banks — 8.1% |
| |||||||
| 14 | Ameris Bancorp | 651 | ||||||
| 133 | Associated Banc-Corp. | 3,364 | ||||||
| 45 | BancorpSouth, Inc. | 1,371 | ||||||
| 27 | Bank of Hawaii Corp. | 2,251 | ||||||
| 23 | Bank of the Ozarks, Inc. | 1,070 | ||||||
| 7 | Banner Corp. | 392 | ||||||
| 32 | Boston Private Financial Holdings, Inc. | 491 | ||||||
| 30 | Brookline Bancorp, Inc. | 441 | ||||||
| 33 | Cathay General Bancorp | 1,257 | ||||||
| 26 | Columbia Banking System, Inc. | 1,042 | ||||||
| 2 | Commerce Bancshares, Inc. | 119 | ||||||
| 14 | Community Bank System, Inc. | 773 | ||||||
| 24 | Cullen/Frost Bankers, Inc. | 2,282 | ||||||
| 126 | East West Bancorp, Inc. | 7,407 | ||||||
| 21 | First Financial Bancorp | 571 | ||||||
| 84 | First Horizon National Corp. | 1,460 | ||||||
| 154 | First Midwest Bancorp, Inc. | 3,583 | ||||||
| 86 | Fulton Financial Corp. | 1,627 | ||||||
| 90 | Hancock Holding Co. | 4,405 | ||||||
| 58 | Hanmi Financial Corp. | 1,658 | ||||||
| 35 | Home BancShares, Inc. | 867 | ||||||
| 48 | Hope Bancorp, Inc. | 887 | ||||||
| 12 | Independent Bank Corp. | 812 | ||||||
| 16 | LegacyTexas Financial Group, Inc. | 591 | ||||||
| 23 | MB Financial, Inc. | 993 | ||||||
| 14 | NBT Bancorp, Inc. | 529 | ||||||
| 97 | PacWest Bancorp | 4,512 | ||||||
| 14 | Pinnacle Financial Partners, Inc. | 876 | ||||||
| 18 | Signature Bank (a) | 2,641 | ||||||
| 13 | Simmons First National Corp., Class A | 704 | ||||||
| 176 | Sterling Bancorp | 4,080 | ||||||
| 25 | SVB Financial Group (a) | 4,307 | ||||||
| 128 | Synovus Financial Corp. | 5,654 | ||||||
| 247 | TCF Financial Corp. | 3,929 | ||||||
| 54 | Texas Capital Bancshares, Inc. (a) | 4,164 | ||||||
| 27 | Trustmark Corp. | 859 | ||||||
| 15 | UMB Financial Corp. | 1,153 | ||||||
| 124 | Umpqua Holdings Corp. | 2,284 | ||||||
| 142 | United Community Banks, Inc. | 3,961 | ||||||
| 22 | Wintrust Financial Corp. | 1,699 | ||||||
|
| |||||||
| 81,717 | ||||||||
|
| |||||||
| SHARES | SECURITY DESCRIPTION | VALUE($) | ||||||
Capital Markets — 2.4% |
| |||||||
| 11 | Donnelley Financial Solutions, Inc. (a) | 252 | ||||||
| 38 | Eaton Vance Corp. | 1,803 | ||||||
| 45 | Evercore Partners, Inc., Class A | 3,152 | ||||||
| 17 | FactSet Research Systems, Inc. | 2,792 | ||||||
| 7 | INTL. FCStone, Inc. (a) | 264 | ||||||
| 40 | Investment Technology Group, Inc. | 858 | ||||||
| 26 | Janus Henderson Group plc, (United Kingdom) (a) | 870 | ||||||
| 37 | Legg Mason, Inc. | 1,404 | ||||||
| 15 | MarketAxess Holdings, Inc. | 2,936 | ||||||
| 39 | MSCI, Inc. | 4,037 | ||||||
| 6 | Piper Jaffray Cos. | 360 | ||||||
| 65 | SEI Investments Co. | 3,477 | ||||||
| 59 | Stifel Financial Corp. (a) | 2,696 | ||||||
|
| |||||||
| 24,901 | ||||||||
|
| |||||||
Consumer Finance — 0.8% |
| |||||||
| 47 | FirstCash, Inc. | 2,711 | ||||||
| 86 | Green Dot Corp., Class A (a) | 3,298 | ||||||
| 184 | SLM Corp. (a) | 2,112 | ||||||
|
| |||||||
| 8,121 | ||||||||
|
| |||||||
Insurance — 3.8% |
| |||||||
| 6 | Alleghany Corp. (a) | 3,368 | ||||||
| 59 | American Financial Group, Inc. | 5,840 | ||||||
| 66 | Aspen Insurance Holdings Ltd., (Bermuda) | 3,287 | ||||||
| 37 | Brown & Brown, Inc. | 1,573 | ||||||
| 73 | CNO Financial Group, Inc. | 1,520 | ||||||
| 45 | First American Financial Corp. | 2,020 | ||||||
| 55 | Hanover Insurance Group, Inc. (The) | 4,886 | ||||||
| 28 | Maiden Holdings Ltd. | 315 | ||||||
| 6 | Navigators Group, Inc. (The) | 318 | ||||||
| 211 | Old Republic International Corp. | 4,117 | ||||||
| 52 | Reinsurance Group of America, Inc. | 6,664 | ||||||
| 6 | Safety Insurance Group, Inc. | 376 | ||||||
| 22 | Selective Insurance Group, Inc. | 1,120 | ||||||
| 9 | United Fire Group, Inc. | 405 | ||||||
| 12 | Universal Insurance Holdings, Inc. | 307 | ||||||
| 37 | WR Berkley Corp. | 2,544 | ||||||
|
| |||||||
| 38,660 | ||||||||
|
| |||||||
Office — 0.6% |
| |||||||
| 75 | Douglas Emmett, Inc. | 2,866 | ||||||
| 38 | Kilroy Realty Corp. | 2,882 | ||||||
|
| |||||||
| 5,748 | ||||||||
|
| |||||||
SEE NOTES TO FINANCIAL STATEMENTS.
| 18 | J.P. MORGAN EQUITY FUNDS | JUNE 30, 2017 | ||||
Table of Contents
| SHARES | SECURITY DESCRIPTION | VALUE($) | ||||||
Common Stocks — continued | ||||||||
Thrifts & Mortgage Finance — 0.4% |
| |||||||
| 18 | BofI Holding, Inc. (a) | 422 | ||||||
| 31 | Dime Community Bancshares, Inc. | 608 | ||||||
| 34 | New York Community Bancorp, Inc. | 452 | ||||||
| 22 | Provident Financial Services, Inc. | 548 | ||||||
| 179 | TrustCo Bank Corp. | 1,387 | ||||||
| 12 | Walker & Dunlop, Inc. (a) | 591 | ||||||
|
| |||||||
| 4,008 | ||||||||
|
| |||||||
Total Financials | 163,155 | |||||||
|
| |||||||
Health Care — 11.0% |
| |||||||
Biotechnology — 1.6% |
| |||||||
| 58 | Acorda Therapeutics, Inc. (a) | 1,141 | ||||||
| 47 | AMAG Pharmaceuticals, Inc. (a) | 868 | ||||||
| 46 | Bioverativ, Inc. (a) | 2,780 | ||||||
| 7 | Emergent BioSolutions, Inc. (a) | 248 | ||||||
| 228 | Momenta Pharmaceuticals, Inc. (a) | 3,846 | ||||||
| 55 | United Therapeutics Corp. (a) | 7,093 | ||||||
|
| |||||||
| 15,976 | ||||||||
|
| |||||||
Health Care Equipment & Supplies — 4.0% |
| |||||||
| 7 | ABIOMED, Inc. (a) | 1,060 | ||||||
| 32 | Align Technology, Inc. (a) | 4,789 | ||||||
| 44 | AngioDynamics, Inc. (a) | 720 | ||||||
| 11 | CryoLife, Inc. (a) | 215 | ||||||
| 23 | Haemonetics Corp. (a) | 892 | ||||||
| 67 | Halyard Health, Inc. (a) | 2,628 | ||||||
| 67 | Hill-Rom Holdings, Inc. | 5,350 | ||||||
| 3 | Inogen, Inc. (a) | 248 | ||||||
| 64 | Integer Holdings Corp. (a) | 2,772 | ||||||
| 144 | Invacare Corp. | 1,896 | ||||||
| 19 | LivaNova plc (a) | 1,145 | ||||||
| 47 | Masimo Corp. (a) | 4,249 | ||||||
| 14 | Natus Medical, Inc. (a) | 537 | ||||||
| 20 | NuVasive, Inc. (a) | 1,569 | ||||||
| 24 | OraSure Technologies, Inc. (a) | 406 | ||||||
| 58 | ResMed, Inc. | 4,493 | ||||||
| 37 | STERIS plc | 2,983 | ||||||
| 18 | Teleflex, Inc. | 3,698 | ||||||
| 16 | Varex Imaging Corp. (a) | 548 | ||||||
| 3 | West Pharmaceutical Services, Inc. | 312 | ||||||
|
| |||||||
| 40,510 | ||||||||
|
| |||||||
Health Care Providers & Services — 3.3% |
| |||||||
| 20 | AMN Healthcare Services, Inc. (a) | 799 | ||||||
| 13 | BioTelemetry, Inc. (a) | 431 | ||||||
| 46 | Community Health Systems, Inc. (a) | 457 | ||||||
| 38 | HealthSouth Corp. | 1,815 | ||||||
| SHARES | SECURITY DESCRIPTION | VALUE($) | ||||||
Health Care Providers & Services — continued |
| |||||||
| 31 | Kindred Healthcare, Inc. | 358 | ||||||
| 18 | LifePoint Health, Inc. (a) | 1,182 | ||||||
| 40 | Magellan Health, Inc. (a) | 2,906 | ||||||
| 38 | MEDNAX, Inc. (a) | 2,281 | ||||||
| 38 | Molina Healthcare, Inc. (a) | 2,615 | ||||||
| 98 | Owens & Minor, Inc. | 3,161 | ||||||
| 63 | PharMerica Corp. (a) | 1,651 | ||||||
| 154 | Select Medical Holdings Corp. (a) | 2,370 | ||||||
| 67 | VCA, Inc. (a) | 6,191 | ||||||
| 41 | WellCare Health Plans, Inc. (a) | 7,362 | ||||||
|
| |||||||
| 33,579 | ||||||||
|
| |||||||
Health Care Technology — 0.3% |
| |||||||
| 174 | Allscripts Healthcare Solutions, Inc. (a) | 2,220 | ||||||
| 37 | HMS Holdings Corp. (a) | 692 | ||||||
| 22 | Quality Systems, Inc. (a) | 372 | ||||||
|
| |||||||
| 3,284 | ||||||||
|
| |||||||
Life Sciences Tools & Services — 0.8% |
| |||||||
| 12 | Albany Molecular Research, Inc. (a) | 249 | ||||||
| 9 | Bio-Rad Laboratories, Inc., Class A (a) | 1,991 | ||||||
| 13 | Cambrex Corp. (a) | 783 | ||||||
| 23 | Charles River Laboratories International, Inc. (a) | 2,327 | ||||||
| 15 | Luminex Corp. | 317 | ||||||
| 23 | PAREXEL International Corp. (a) | 2,028 | ||||||
|
| |||||||
| 7,695 | ||||||||
|
| |||||||
Pharmaceuticals — 1.0% |
| |||||||
| 82 | Amphastar Pharmaceuticals, Inc. (a) | 1,456 | ||||||
| 53 | Catalent, Inc. (a) | 1,860 | ||||||
| 20 | Depomed, Inc. (a) | 211 | ||||||
| 224 | Impax Laboratories, Inc. (a) | 3,608 | ||||||
| 61 | Medicines Co. (The) (a) | 2,307 | ||||||
| 20 | Prestige Brands Holdings, Inc. (a) | 1,071 | ||||||
|
| |||||||
| 10,513 | ||||||||
|
| |||||||
Total Health Care | 111,557 | |||||||
|
| |||||||
Industrials — 16.3% |
| |||||||
Aerospace & Defense — 1.4% |
| |||||||
| 26 | Aerojet Rocketdyne Holdings, Inc. (a) | 535 | ||||||
| 18 | Curtiss-Wright Corp. | 1,670 | ||||||
| 8 | Engility Holdings, Inc. (a) | 226 | ||||||
| 37 | Huntington Ingalls Industries, Inc. | 6,936 | ||||||
| 24 | Moog, Inc., Class A (a) | 1,727 | ||||||
| 25 | Orbital ATK, Inc. | 2,459 | ||||||
| 19 | Triumph Group, Inc. | 610 | ||||||
|
| |||||||
| 14,163 | ||||||||
|
| |||||||
SEE NOTES TO FINANCIAL STATEMENTS.
| JUNE 30, 2017 | J.P. MORGAN EQUITY FUNDS | 19 | ||||||
Table of Contents
JPMorgan Market Expansion Enhanced Index Fund
SCHEDULE OF PORTFOLIO INVESTMENTS
AS OF JUNE 30, 2017 (continued)
(Amounts in thousands)
| SHARES | SECURITY DESCRIPTION | VALUE($) | ||||||
Common Stocks — continued | ||||||||
Air Freight & Logistics — 0.3% |
| |||||||
| 74 | Hub Group, Inc., Class A (a) | 2,855 | ||||||
|
| |||||||
Airlines — 0.7% |
| |||||||
| 5 | Allegiant Travel Co. | 732 | ||||||
| 23 | Hawaiian Holdings, Inc. (a) | 1,061 | ||||||
| 178 | JetBlue Airways Corp. (a) | 4,053 | ||||||
| 32 | SkyWest, Inc. | 1,109 | ||||||
|
| |||||||
| 6,955 | ||||||||
|
| |||||||
Building Products — 1.3% |
| |||||||
| 6 | American Woodmark Corp. (a) | 573 | ||||||
| 104 | AO Smith Corp. | 5,870 | ||||||
| 13 | Gibraltar Industries, Inc. (a) | 470 | ||||||
| 22 | Lennox International, Inc. | 3,959 | ||||||
| 28 | Universal Forest Products, Inc. | 2,435 | ||||||
|
| |||||||
| 13,307 | ||||||||
|
| |||||||
Commercial Services & Supplies — 2.2% |
| |||||||
| 23 | ABM Industries, Inc. | 963 | ||||||
| 63 | Brink’s Co. (The) | 4,234 | ||||||
| 82 | Copart, Inc. (a) | 2,600 | ||||||
| 85 | Essendant, Inc. | 1,264 | ||||||
| 24 | Herman Miller, Inc. | 735 | ||||||
| 17 | HNI Corp. | 685 | ||||||
| 27 | Interface, Inc. | 532 | ||||||
| 88 | LSC Communications, Inc. | 1,879 | ||||||
| 14 | Matthews International Corp., Class A | 827 | ||||||
| 13 | MSA Safety, Inc. | 1,031 | ||||||
| 75 | Pitney Bowes, Inc. | 1,135 | ||||||
| 80 | RR Donnelley & Sons Co. | 1,008 | ||||||
| 71 | Tetra Tech, Inc. | 3,266 | ||||||
| 51 | Viad Corp. | 2,417 | ||||||
|
| |||||||
| 22,576 | ||||||||
|
| |||||||
Construction & Engineering — 1.8% |
| |||||||
| 126 | AECOM (a) | 4,073 | ||||||
| 92 | Aegion Corp. (a) | 2,022 | ||||||
| 15 | Comfort Systems USA, Inc. | 543 | ||||||
| 13 | Dycom Industries, Inc. (a) | 1,173 | ||||||
| 57 | EMCOR Group, Inc. | 3,731 | ||||||
| 165 | KBR, Inc. | 2,513 | ||||||
| 76 | MYR Group, Inc. (a) | 2,357 | ||||||
| 10 | Orion Group Holdings, Inc. (a) | 77 | ||||||
| 9 | Valmont Industries, Inc. | 1,361 | ||||||
|
| |||||||
| 17,850 | ||||||||
|
| |||||||
Electrical Equipment — 1.3% |
| |||||||
| 59 | EnerSys | 4,283 | ||||||
| 123 | General Cable Corp. | 2,013 | ||||||
| SHARES | SECURITY DESCRIPTION | VALUE($) | ||||||
Electrical Equipment — continued |
| |||||||
| 22 | Hubbell, Inc. | 2,454 | ||||||
| 5 | Powell Industries, Inc. | 154 | ||||||
| 56 | Regal Beloit Corp. | 4,554 | ||||||
|
| |||||||
| 13,458 | ||||||||
|
| |||||||
Industrial Conglomerates — 0.3% |
| |||||||
| 27 | Carlisle Cos., Inc. | 2,598 | ||||||
| 14 | Raven Industries, Inc. | 456 | ||||||
|
| |||||||
| 3,054 | ||||||||
|
| |||||||
Machinery — 4.0% |
| |||||||
| 34 | AGCO Corp. | 2,259 | ||||||
| 4 | Alamo Group, Inc. | 318 | ||||||
| 75 | Barnes Group, Inc. | 4,402 | ||||||
| 17 | Briggs & Stratton Corp. | 412 | ||||||
| 64 | Crane Co. | 5,106 | ||||||
| 25 | Federal Signal Corp. | 427 | ||||||
| 60 | Greenbrier Cos., Inc. (The) | 2,766 | ||||||
| 36 | Harsco Corp. (a) | 576 | ||||||
| 26 | IDEX Corp. | 2,916 | ||||||
| 85 | ITT, Inc. | 3,404 | ||||||
| 31 | Kennametal, Inc. | 1,175 | ||||||
| 11 | Lincoln Electric Holdings, Inc. | 1,050 | ||||||
| 6 | Lydall, Inc. (a) | 331 | ||||||
| 23 | Mueller Industries, Inc. | 713 | ||||||
| 31 | Oshkosh Corp. | 2,128 | ||||||
| 15 | SPX Corp. (a) | 390 | ||||||
| 16 | SPX FLOW, Inc. (a) | 597 | ||||||
| 5 | Standex International Corp. | 481 | ||||||
| 76 | Terex Corp. | 2,849 | ||||||
| 32 | Timken Co. (The) | 1,492 | ||||||
| 45 | Toro Co. (The) | 3,125 | ||||||
| 63 | Trinity Industries, Inc. | 1,754 | ||||||
| 23 | Wabash National Corp. | 510 | ||||||
| 8 | Wabtec Corp. | 762 | ||||||
| 4 | Watts Water Technologies, Inc., Class A | 284 | ||||||
|
| |||||||
| 40,227 | ||||||||
|
| |||||||
Professional Services — 1.7% |
| |||||||
| 19 | FTI Consulting, Inc. (a) | 660 | ||||||
| 86 | Heidrick & Struggles International, Inc. | 1,877 | ||||||
| 40 | Insperity, Inc. | 2,840 | ||||||
| 13 | Kelly Services, Inc., Class A | 296 | ||||||
| 58 | ManpowerGroup, Inc. | 6,463 | ||||||
| 20 | Navigant Consulting, Inc. (a) | 393 | ||||||
| 21 | On Assignment, Inc. (a) | 1,137 | ||||||
| 50 | Resources Connection, Inc. | 680 | ||||||
SEE NOTES TO FINANCIAL STATEMENTS.
| 20 | J.P. MORGAN EQUITY FUNDS | JUNE 30, 2017 | ||||
Table of Contents
| SHARES | SECURITY DESCRIPTION | VALUE($) | ||||||
| Common Stocks — continued | ||||||||
Professional Services — continued |
| |||||||
| 94 | TrueBlue, Inc. (a) | 2,485 | ||||||
| 6 | WageWorks, Inc. (a) | 410 | ||||||
|
| |||||||
| 17,241 | ||||||||
|
| |||||||
Road & Rail — 0.5% |
| |||||||
| 80 | ArcBest Corp. | 1,650 | ||||||
| 34 | Landstar System, Inc. | 2,899 | ||||||
| 9 | Saia, Inc. (a) | 472 | ||||||
|
| |||||||
| 5,021 | ||||||||
|
| |||||||
Trading Companies & Distributors — 0.8% |
| |||||||
| 17 | Applied Industrial Technologies, Inc. | 992 | ||||||
| 5 | DXP Enterprises, Inc. (a) | 186 | ||||||
| 20 | MSC Industrial Direct Co., Inc., Class A | 1,677 | ||||||
| 152 | NOW, Inc. (a) | 2,450 | ||||||
| 29 | Veritiv Corp. (a) | 1,305 | ||||||
| 10 | Watsco, Inc. | 1,619 | ||||||
|
| |||||||
| 8,229 | ||||||||
|
| |||||||
Total Industrials | 164,936 | |||||||
|
| |||||||
Information Technology — 17.1% |
| |||||||
Communications Equipment — 0.7% |
| |||||||
| 72 | ARRIS International plc (a) | 2,009 | ||||||
| 48 | Ciena Corp. (a) | 1,201 | ||||||
| 57 | Digi International, Inc. (a) | 583 | ||||||
| 14 | InterDigital, Inc. | 1,051 | ||||||
| 10 | NETGEAR, Inc. (a) | 411 | ||||||
| 18 | Plantronics, Inc. | 926 | ||||||
| 101 | Viavi Solutions, Inc. (a) | 1,068 | ||||||
|
| |||||||
| 7,249 | ||||||||
|
| |||||||
Electronic Equipment, Instruments & Components — 5.8% |
| |||||||
| 43 | Anixter International, Inc. (a) | 3,386 | ||||||
| 97 | Arrow Electronics, Inc. (a) | 7,587 | ||||||
| 120 | Avnet, Inc. | 4,679 | ||||||
| 31 | Bel Fuse, Inc., Class B | 766 | ||||||
| 17 | Belden, Inc. | 1,246 | ||||||
| 100 | Benchmark Electronics, Inc. (a) | 3,221 | ||||||
| 10 | Coherent, Inc. (a) | 2,181 | ||||||
| 5 | ePlus, Inc. (a) | 393 | ||||||
| 29 | Insight Enterprises, Inc. (a) | 1,168 | ||||||
| 16 | Itron, Inc. (a) | 1,084 | ||||||
| 159 | Jabil, Inc. | 4,653 | ||||||
| 114 | Keysight Technologies, Inc. (a) | 4,454 | ||||||
| 9 | Littelfuse, Inc. | 1,453 | ||||||
| 69 | Methode Electronics, Inc. | 2,853 | ||||||
| 58 | Plexus Corp. (a) | 3,028 | ||||||
| SHARES | SECURITY DESCRIPTION | VALUE($) | ||||||
Electronic Equipment, Instruments & Components — continued |
| |||||||
| 7 | Rogers Corp. (a) | 706 | ||||||
| 63 | Sanmina Corp. (a) | 2,408 | ||||||
| 5 | ScanSource, Inc. (a) | 201 | ||||||
| 10 | SYNNEX Corp. | 1,152 | ||||||
| 40 | Tech Data Corp. (a) | 4,070 | ||||||
| 85 | Trimble, Inc. (a) | 3,023 | ||||||
| 88 | TTM Technologies, Inc. (a) | 1,531 | ||||||
| 57 | Vishay Intertechnology, Inc. | 944 | ||||||
| 22 | Zebra Technologies Corp., Class A (a) | 2,201 | ||||||
|
| |||||||
| 58,388 | ||||||||
|
| |||||||
Internet Software & Services — 0.8% |
| |||||||
| 17 | Blucora, Inc. (a) | 362 | ||||||
| 18 | comScore, Inc. (a) | 467 | ||||||
| 21 | j2 Global, Inc. | 1,744 | ||||||
| 19 | LogMeIn, Inc. | 2,027 | ||||||
| 23 | NIC, Inc. | 438 | ||||||
| 57 | QuinStreet, Inc. (a) | 236 | ||||||
| 6 | Stamps.com, Inc. (a) | 976 | ||||||
| 35 | WebMD Health Corp. (a) | 2,059 | ||||||
|
| |||||||
| 8,309 | ||||||||
|
| |||||||
IT Services — 3.2% |
| |||||||
| 93 | Broadridge Financial Solutions, Inc. | 7,004 | ||||||
| 28 | CACI International, Inc., Class A (a) | 3,503 | ||||||
| 19 | Cardtronics plc, Class A (a) | 624 | ||||||
| 39 | Convergys Corp. | 929 | ||||||
| 36 | CoreLogic, Inc. (a) | 1,553 | ||||||
| 37 | CSG Systems International, Inc. | 1,510 | ||||||
| 70 | DST Systems, Inc. | 4,307 | ||||||
| 39 | ExlService Holdings, Inc. (a) | 2,188 | ||||||
| 97 | Leidos Holdings, Inc. | 4,998 | ||||||
| 10 | ManTech International Corp., Class A | 405 | ||||||
| 22 | NeuStar, Inc., Class A (a) | 727 | ||||||
| 13 | Perficient, Inc. (a) | 235 | ||||||
| 19 | Science Applications International Corp. | 1,333 | ||||||
| 85 | Sykes Enterprises, Inc. (a) | 2,859 | ||||||
|
| |||||||
| 32,175 | ||||||||
|
| |||||||
Semiconductors & Semiconductor Equipment — 2.4% |
| |||||||
| 9 | Advanced Energy Industries, Inc. (a) | 588 | ||||||
| 9 | Cabot Microelectronics Corp. | 697 | ||||||
| 26 | Cirrus Logic, Inc. (a) | 1,620 | ||||||
| 70 | Cohu, Inc. | 1,100 | ||||||
| 8 | Cree, Inc. (a) | 185 | ||||||
| 27 | First Solar, Inc. (a) | 1,061 | ||||||
| 57 | Integrated Device Technology, Inc. (a) | 1,473 | ||||||
SEE NOTES TO FINANCIAL STATEMENTS.
| JUNE 30, 2017 | J.P. MORGAN EQUITY FUNDS | 21 | ||||||
Table of Contents
JPMorgan Market Expansion Enhanced Index Fund
SCHEDULE OF PORTFOLIO INVESTMENTS
AS OF JUNE 30, 2017 (continued)
(Amounts in thousands)
| SHARES | SECURITY DESCRIPTION | VALUE($) | ||||||
| Common Stocks — continued | ||||||||
Semiconductors & Semiconductor Equipment — continued |
| |||||||
| 206 | Kulicke & Soffa Industries, Inc., (Singapore) (a) | 3,919 | ||||||
| 55 | Microsemi Corp. (a) | 2,574 | ||||||
| 4 | MKS Instruments, Inc. | 261 | ||||||
| 46 | Nanometrics, Inc. (a) | 1,174 | ||||||
| 80 | Rudolph Technologies, Inc. (a) | 1,830 | ||||||
| 39 | Semtech Corp. (a) | 1,409 | ||||||
| 15 | Synaptics, Inc. (a) | 760 | ||||||
| 185 | Teradyne, Inc. | 5,553 | ||||||
| 3 | Veeco Instruments, Inc. (a) | 80 | ||||||
|
| |||||||
| 24,284 | ||||||||
|
| |||||||
Software — 3.7% |
| |||||||
| 34 | 8x8, Inc. (a) | 498 | ||||||
| 51 | ACI Worldwide, Inc. (a) | 1,130 | ||||||
| 24 | ANSYS, Inc. (a) | 2,884 | ||||||
| 15 | Bottomline Technologies de, Inc. (a) | 383 | ||||||
| 157 | Cadence Design Systems, Inc. (a) | 5,269 | ||||||
| 32 | CDK Global, Inc. | 1,998 | ||||||
| 39 | CommVault Systems, Inc. (a) | 2,207 | ||||||
| 15 | Fair Isaac Corp. | 2,043 | ||||||
| 70 | Fortinet, Inc. (a) | 2,609 | ||||||
| 30 | Manhattan Associates, Inc. (a) | 1,422 | ||||||
| 16 | MicroStrategy, Inc., Class A (a) | 3,115 | ||||||
| 84 | Progress Software Corp. | 2,610 | ||||||
| 46 | PTC, Inc. (a) | 2,525 | ||||||
| 10 | Qualys, Inc. (a) | 396 | ||||||
| 16 | Synchronoss Technologies, Inc. (a) | 257 | ||||||
| 94 | Take-Two Interactive Software, Inc. (a) | 6,881 | ||||||
| 82 | TiVo Corp. | 1,526 | ||||||
|
| |||||||
| 37,753 | ||||||||
|
| |||||||
Technology Hardware, Storage & Peripherals — 0.5% |
| |||||||
| 116 | NCR Corp. (a) | 4,742 | ||||||
|
| |||||||
Total Information Technology | 172,900 | |||||||
|
| |||||||
Materials — 7.5% |
| |||||||
Chemicals — 3.4% |
| |||||||
| 74 | A Schulman, Inc. | 2,360 | ||||||
| 11 | AdvanSix, Inc. (a) | 344 | ||||||
| 12 | American Vanguard Corp. | 212 | ||||||
| 14 | Ashland Global Holdings, Inc. | 915 | ||||||
| 52 | Cabot Corp. | 2,797 | ||||||
| 90 | Chemours Co. (The) | 3,417 | ||||||
| 45 | FutureFuel Corp. | 676 | ||||||
| 4 | Hawkins, Inc. | 195 | ||||||
| 21 | HB Fuller Co. | 1,073 | ||||||
| 25 | Ingevity Corp. (a) | 1,435 | ||||||
| SHARES | SECURITY DESCRIPTION | VALUE($) | ||||||
Chemicals — continued |
| |||||||
| 49 | Innophos Holdings, Inc. | 2,148 | ||||||
| 44 | Innospec, Inc. | 2,864 | ||||||
| 47 | Koppers Holdings, Inc. (a) | 1,699 | ||||||
| 16 | Minerals Technologies, Inc. | 1,160 | ||||||
| 70 | Olin Corp. | 2,133 | ||||||
| 35 | PolyOne Corp. | 1,367 | ||||||
| 17 | Rayonier Advanced Materials, Inc. | 261 | ||||||
| 73 | RPM International, Inc. | 4,009 | ||||||
| 18 | Scotts Miracle-Gro Co. (The) | 1,601 | ||||||
| 37 | Stepan Co. | 3,196 | ||||||
| 38 | Valvoline, Inc. | 904 | ||||||
|
| |||||||
| 34,766 | ||||||||
|
| |||||||
Construction Materials — 0.2% |
| |||||||
| 20 | Eagle Materials, Inc. | 1,839 | ||||||
| 5 | US Concrete, Inc. (a) | 416 | ||||||
|
| |||||||
| 2,255 | ||||||||
|
| |||||||
Containers & Packaging — 1.5% |
| |||||||
| 7 | AptarGroup, Inc. | 643 | ||||||
| 10 | Bemis Co., Inc. | 481 | ||||||
| 48 | Greif, Inc., Class A | 2,666 | ||||||
| 88 | Owens-Illinois, Inc. (a) | 2,093 | ||||||
| 60 | Packaging Corp. of America | 6,678 | ||||||
| 32 | Silgan Holdings, Inc. | 1,017 | ||||||
| 25 | Sonoco Products Co. | 1,296 | ||||||
|
| |||||||
| 14,874 | ||||||||
|
| |||||||
Metals & Mining — 1.7% |
| |||||||
| 137 | AK Steel Holding Corp. (a) | 898 | ||||||
| 8 | Carpenter Technology Corp. | 292 | ||||||
| 100 | Commercial Metals Co. | 1,942 | ||||||
| 8 | Kaiser Aluminum Corp. | 669 | ||||||
| 55 | Reliance Steel & Aluminum Co. | 4,018 | ||||||
| 9 | Royal Gold, Inc. | 688 | ||||||
| 129 | Steel Dynamics, Inc. | 4,625 | ||||||
| 28 | SunCoke Energy, Inc. (a) | 307 | ||||||
| 99 | United States Steel Corp. | 2,183 | ||||||
| 20 | Worthington Industries, Inc. | 981 | ||||||
|
| |||||||
| 16,603 | ||||||||
|
| |||||||
Paper & Forest Products — 0.7% |
| |||||||
| 52 | Boise Cascade Co. (a) | 1,581 | ||||||
| 13 | Domtar Corp. | 490 | ||||||
| 19 | KapStone Paper and Packaging Corp. | 386 | ||||||
| 105 | Louisiana-Pacific Corp. (a) | 2,522 | ||||||
| 64 | Schweitzer-Mauduit International, Inc. | 2,388 | ||||||
|
| |||||||
| 7,367 | ||||||||
|
| |||||||
Total Materials | 75,865 | |||||||
|
| |||||||
SEE NOTES TO FINANCIAL STATEMENTS.
| 22 | J.P. MORGAN EQUITY FUNDS | JUNE 30, 2017 | ||||
Table of Contents
| SHARES | SECURITY DESCRIPTION | VALUE($) | ||||||
| Common Stocks — continued | ||||||||
Real Estate — 8.3% |
| |||||||
Equity Real Estate Investment Trusts (REITs) — 7.5% |
| |||||||
| 15 | American Assets Trust, Inc. | 571 | ||||||
| 87 | American Campus Communities, Inc. | 4,132 | ||||||
| 60 | Armada Hoffler Properties, Inc. | 783 | ||||||
| 37 | Camden Property Trust | 3,126 | ||||||
| 60 | Care Capital Properties, Inc. | 1,597 | ||||||
| 21 | Chesapeake Lodging Trust | 521 | ||||||
| 51 | CoreCivic, Inc. | 1,409 | ||||||
| 15 | CoreSite Realty Corp. | 1,512 | ||||||
| 113 | Corporate Office Properties Trust | 3,971 | ||||||
| 114 | Cousins Properties, Inc. | 1,002 | ||||||
| 33 | CyrusOne, Inc. | 1,862 | ||||||
| 28 | DCT Industrial Trust, Inc. | 1,480 | ||||||
| 178 | DiamondRock Hospitality Co. | 1,949 | ||||||
| 128 | Duke Realty Corp. | 3,566 | ||||||
| 19 | EPR Properties | 1,367 | ||||||
| 48 | First Industrial Realty Trust, Inc. | 1,365 | ||||||
| 29 | Franklin Street Properties Corp. | 323 | ||||||
| 132 | GEO Group, Inc. (The) | 3,908 | ||||||
| 11 | Getty Realty Corp. | 270 | ||||||
| 16 | Government Properties Income Trust | 285 | ||||||
| 24 | Healthcare Realty Trust, Inc. | 803 | ||||||
| 76 | Highwoods Properties, Inc. | 3,829 | ||||||
| 145 | Hospitality Properties Trust | 4,219 | ||||||
| 85 | Kite Realty Group Trust | 1,604 | ||||||
| 46 | Liberty Property Trust | 1,880 | ||||||
| 12 | Life Storage, Inc. | 925 | ||||||
| 108 | Mack-Cali Realty Corp. | 2,936 | ||||||
| 78 | Medical Properties Trust, Inc. | 1,000 | ||||||
| 16 | Potlatch Corp. | 736 | ||||||
| 31 | PS Business Parks, Inc. | 4,059 | ||||||
| 134 | Rayonier, Inc. | 3,841 | ||||||
| 40 | Retail Opportunity Investments Corp. | 762 | ||||||
| 5 | Saul Centers, Inc. | 277 | ||||||
| 181 | Senior Housing Properties Trust | 3,710 | ||||||
| 233 | Summit Hotel Properties, Inc. | 4,340 | ||||||
| 19 | Tanger Factory Outlet Centers, Inc. | 491 | ||||||
| 8 | Taubman Centers, Inc. | 499 | ||||||
| 102 | Uniti Group, Inc. | 2,554 | ||||||
| 203 | Washington Prime Group, Inc. | 1,702 | ||||||
| 19 | Weingarten Realty Investors | 565 | ||||||
|
| |||||||
| 75,731 | ||||||||
|
| |||||||
Real Estate Management & Development — 0.8% |
| |||||||
| 19 | Alexander & Baldwin, Inc. | 796 | ||||||
| 13 | Forestar Group, Inc. (a) | 221 | ||||||
| SHARES | SECURITY DESCRIPTION | VALUE($) | ||||||
Real Estate Management & Development — continued |
| |||||||
| 46 | HFF, Inc., Class A | 1,591 | ||||||
| 38 | Jones Lang LaSalle, Inc. | 4,705 | ||||||
| 7 | RE/MAX Holdings, Inc., Class A | 398 | ||||||
|
| |||||||
| 7,711 | ||||||||
|
| |||||||
Total Real Estate | 83,442 | |||||||
|
| |||||||
Telecommunication Services — 0.4% |
| |||||||
Diversified Telecommunication Services — 0.0% (g) | ||||||||
| 4 | ATN International, Inc. | 301 | ||||||
|
| |||||||
Wireless Telecommunication Services — 0.4% |
| |||||||
| 37 | Spok Holdings, Inc. | 655 | ||||||
| 110 | Telephone & Data Systems, Inc. | 3,050 | ||||||
|
| |||||||
| 3,705 | ||||||||
|
| |||||||
Total Telecommunication Services | 4,006 | |||||||
|
| |||||||
Utilities — 4.7% |
| |||||||
Electric Utilities — 1.9% |
| |||||||
| 31 | ALLETE, Inc. | 2,251 | ||||||
| 34 | El Paso Electric Co. | 1,778 | ||||||
| 122 | Great Plains Energy, Inc. | 3,569 | ||||||
| 80 | Hawaiian Electric Industries, Inc. | 2,587 | ||||||
| 36 | IDACORP, Inc. | 3,078 | ||||||
| 157 | OGE Energy Corp. | 5,452 | ||||||
| 11 | Westar Energy, Inc. | 583 | ||||||
|
| |||||||
| 19,298 | ||||||||
|
| |||||||
Gas Utilities — 1.8% |
| |||||||
| 84 | Atmos Energy Corp. | 6,965 | ||||||
| 18 | National Fuel Gas Co. | 996 | ||||||
| 5 | New Jersey Resources Corp. | 196 | ||||||
| 21 | Southwest Gas Holdings, Inc. | 1,516 | ||||||
| 3 | Spire, Inc. | 174 | ||||||
| 153 | UGI Corp. | 7,420 | ||||||
| 4 | WGL Holdings, Inc. | 300 | ||||||
|
| |||||||
| 17,567 | ||||||||
|
| |||||||
Multi-Utilities — 0.9% |
| |||||||
| 37 | Avista Corp. | 1,555 | ||||||
| 83 | MDU Resources Group, Inc. | 2,167 | ||||||
| 18 | NorthWestern Corp. | 1,119 | ||||||
| 77 | Vectren Corp. | 4,522 | ||||||
|
| |||||||
| 9,363 | ||||||||
|
| |||||||
Water Utilities — 0.1% |
| |||||||
| 16 | American States Water Co. | 742 | ||||||
|
| |||||||
Total Utilities | 46,970 | |||||||
|
| |||||||
Total Common Stocks | 999,591 | |||||||
|
| |||||||
SEE NOTES TO FINANCIAL STATEMENTS.
| JUNE 30, 2017 | J.P. MORGAN EQUITY FUNDS | 23 | ||||||
Table of Contents
JPMorgan Market Expansion Enhanced Index Fund
SCHEDULE OF PORTFOLIO INVESTMENTS
AS OF JUNE 30, 2017 (continued)
(Amounts in thousands, except number of Futures contracts)
| NUMBER OF RIGHTS | SECURITY DESCRIPTION | VALUE($) | ||||||
| Rights — 0.0% (g) | ||||||||
Information Technology — 0.0% (g) | ||||||||
Electronic Equipment, Instruments & Components — 0.0% (g) |
| |||||||
| 18 | Gerber Scientific, Inc. (a) | — | (h) | |||||
|
| |||||||
| SHARES | ||||||||
Short-Term Investment — 2.3% | ||||||||
Investment Company — 2.3% | ||||||||
| 23,239 | JPMorgan U.S. Government Money Market Fund, Institutional Class Shares, 0.840% (b) (l) | 23,239 | ||||||
|
| |||||||
Total Investments — 101.2% | 1,022,830 | |||||||
Liabilities in Excess of | (11,682 | ) | ||||||
|
| |||||||
NET ASSETS — 100.0% | $ | 1,011,148 | ||||||
|
| |||||||
Percentages indicated are based on net assets.
| Futures Contracts | ||||||||||||||||||||||
| NUMBER OF CONTRACTS | DESCRIPTION | EXPIRATION DATE | TRADING CURRENCY | NOTIONAL JUNE 30, 2017 | NET UNREALIZED APPRECIATION (DEPRECIATION) | |||||||||||||||||
Long Futures Outstanding |
| |||||||||||||||||||||
| 50 | E-mini Russell 2000 | 09/15/17 | USD | $ | 3,536 | $ | (5 | ) | ||||||||||||||
| 62 | E-mini S&P MidCap 400 | 09/15/17 | USD | 10,826 | (53 | ) | ||||||||||||||||
|
| |||||||||||||||||||||
| $ | (58 | ) | ||||||||||||||||||||
|
| |||||||||||||||||||||
SEE NOTES TO FINANCIAL STATEMENTS.
| 24 | J.P. MORGAN EQUITY FUNDS | JUNE 30, 2017 | ||||
Table of Contents
J.P. Morgan Equity Funds
NOTES TO SCHEDULES OF PORTFOLIO INVESTMENTS
AS OF JUNE 30, 2017
| CVR | — Contingent Value Rights | |
| PDC | — Property Development Center | |
| USD | — United States Dollar | |
| (a) | — Non-income producing security. | |
| (b) | — Investment in affiliate. Money market fund is registered under the Investment Company Act of 1940, as amended, and advised by J.P. Morgan Investment Management Inc. |
| (g) | — Amount rounds to less than 0.05%. | |
| (h) | — Amount rounds to less than 500. | |
| (k) | — All or portion of this security is deposited with the broker as initial margin for future contracts. | |
| (l) | — The rate shown is the current yield as of June 30, 2017. | |
| (q) | — Investment in affiliate which is a security in the Fund’s index. |
SEE NOTES TO FINANCIAL STATEMENTS.
| JUNE 30, 2017 | J.P. MORGAN EQUITY FUNDS | 25 | ||||||
Table of Contents
STATEMENTS OF ASSETS AND LIABILITIES
AS OF JUNE 30, 2017
(Amounts in thousands, except per share amounts)
| Equity Index Fund | Market Expansion Enhanced Index Fund | |||||||
ASSETS: | ||||||||
Investments in non-affiliates, at value | $ | 1,717,657 | $ | 999,591 | ||||
Investments in affiliates, at value | 33,538 | 23,239 | ||||||
|
|
|
| |||||
Total investment securities, at value | 1,751,195 | 1,022,830 | ||||||
Cash | 4 | — | (a) | |||||
Deposits at broker for futures contracts | — | 1,127 | ||||||
Receivables: | ||||||||
Investment securities sold | — | 5,846 | ||||||
Fund shares sold | 1,677 | 1,157 | ||||||
Dividends from non-affiliates | 1,742 | 890 | ||||||
Dividends from affiliates | 6 | 16 | ||||||
Variation margin on futures contracts | 3 | 4 | ||||||
Due from adviser | 5 | — | ||||||
|
|
|
| |||||
Total Assets | 1,754,632 | 1,031,870 | ||||||
|
|
|
| |||||
LIABILITIES: | ||||||||
Payables: | ||||||||
Investment securities purchased | 738 | 11,303 | ||||||
Fund shares redeemed | 3,865 | 9,045 | ||||||
Accrued liabilities: | ||||||||
Investment advisory fees | — | 14 | ||||||
Distribution fees | 176 | 66 | ||||||
Service fees | 188 | 191 | ||||||
Custodian and accounting fees | 11 | 11 | ||||||
Trustees’ and Chief Compliance Officer’s fees | — | — | (a) | |||||
Other | 224 | 92 | ||||||
|
|
|
| |||||
Total Liabilities | 5,202 | 20,722 | ||||||
|
|
|
| |||||
Net Assets | $ | 1,749,430 | $ | 1,011,148 | ||||
|
|
|
| |||||
| (a) | Amount rounds to less than 500. |
SEE NOTES TO FINANCIAL STATEMENTS.
| 26 | J.P. MORGAN EQUITY FUNDS | JUNE 30, 2017 | ||||
Table of Contents
| Equity Index Fund | Market Expansion Enhanced Index Fund | |||||||
NET ASSETS: | ||||||||
Paid-in-Capital | $ | 559,446 | $ | 636,765 | ||||
Accumulated undistributed (distributions in excess of) net investment income | 848 | 2,811 | ||||||
Accumulated net realized gains (losses) | (13,078 | ) | 61,937 | |||||
Net unrealized appreciation (depreciation) | 1,202,214 | 309,635 | ||||||
|
|
|
| |||||
Total Net Assets | $ | 1,749,430 | $ | 1,011,148 | ||||
|
|
|
| |||||
Net Assets: | ||||||||
Class A | $ | 580,645 | $ | 162,853 | ||||
Class C | 89,681 | 37,529 | ||||||
Class I (formerly Select Class) | 740,340 | 788,063 | ||||||
Class R2 | — | 22,703 | ||||||
Class R6 | 338,764 | — | ||||||
|
|
|
| |||||
Total | $ | 1,749,430 | $ | 1,011,148 | ||||
|
|
|
| |||||
Outstanding units of beneficial interest (shares) | ||||||||
($0.0001 par value; unlimited number of shares authorized): | ||||||||
Class A | 15,523 | 14,133 | ||||||
Class C | 2,419 | 3,809 | ||||||
Class I (formerly Select Class) | 19,772 | 67,607 | ||||||
Class R2 | — | 1,998 | ||||||
Class R6 | 9,048 | — | ||||||
Net Asset Value (a): | ||||||||
Class A — Redemption price per share | $ | 37.41 | $ | 11.52 | ||||
Class C — Offering price per share (b) | 37.08 | 9.85 | ||||||
Class I (formerly Select Class) — Offering and redemption price per share | 37.44 | 11.66 | ||||||
Class R2 — Offering and redemption price per share | — | 11.36 | ||||||
Class R6 — Offering and redemption price per share | 37.44 | — | ||||||
Class A maximum sales charge | 5.25 | % | 5.25 | % | ||||
Class A maximum public offering price per share | $ | 39.48 | $ | 12.16 | ||||
|
|
|
| |||||
Cost of investments in non-affiliates | $ | 535,733 | $ | 689,898 | ||||
Cost of investments in affiliates | 13,227 | 23,239 | ||||||
| (a) | Per share amounts may not recalculate due to rounding of net assets and/or shares outstanding. |
| (b) | Redemption price for Class C Shares varies based upon length of time the shares are held. |
SEE NOTES TO FINANCIAL STATEMENTS.
| JUNE 30, 2017 | J.P. MORGAN EQUITY FUNDS | 27 | ||||||
Table of Contents
STATEMENTS OF OPERATIONS
FOR THE YEAR ENDED JUNE 30, 2017
(Amounts in thousands)
Equity Index Fund | Market Expansion Enhanced Index Fund | |||||||
INVESTMENT INCOME: | ||||||||
Interest income from non-affiliates | $ | — | $ | — | (a) | |||
Interest income from affiliates | 2 | 3 | ||||||
Dividend income from non-affiliates | 34,205 | 14,849 | ||||||
Dividend income from affiliates | 620 | 112 | ||||||
|
|
|
| |||||
Total investment income | 34,827 | 14,964 | ||||||
|
|
|
| |||||
EXPENSES: | ||||||||
Investment advisory fees | 1,207 | 2,490 | ||||||
Administration fees | 1,349 | 815 | ||||||
Distribution fees: | ||||||||
Class A | 1,479 | 315 | ||||||
Class C | 683 | 236 | ||||||
Class R2 | — | 77 | ||||||
Service fees: | ||||||||
Class A | 1,479 | 315 | ||||||
Class C | 227 | 79 | ||||||
Class I (formerly Select Class) | 1,981 | 2,058 | ||||||
Class R2 | — | 38 | ||||||
Custodian and accounting fees | 86 | 36 | ||||||
Interest expense to affiliates | 5 | — | ||||||
Professional fees | 60 | 54 | ||||||
Trustees’ and Chief Compliance Officer’s fees | 29 | 28 | ||||||
Printing and mailing costs | 116 | 68 | ||||||
Registration and filing fees | 86 | 79 | ||||||
Transfer agency fees (See Note 2.E.) | 275 | 54 | ||||||
Sub-transfer agency fees (See Note 2.E.) | 546 | 199 | ||||||
Other | 33 | 22 | ||||||
|
|
|
| |||||
Total expenses | 9,641 | 6,963 | ||||||
|
|
|
| |||||
Less fees waived | (4,285 | ) | (2,580 | ) | ||||
Less expense reimbursements | (29 | ) | (7 | ) | ||||
|
|
|
| |||||
Net expenses | 5,327 | 4,376 | ||||||
|
|
|
| |||||
Net investment income (loss) | 29,500 | 10,588 | ||||||
|
|
|
| |||||
REALIZED/UNREALIZED GAINS (LOSSES): | ||||||||
Net realized gain (loss) on transactions from: | ||||||||
Investments in non-affiliates | 56,330 | 78,101 | ||||||
Investments in affiliates | 1,081 | — | ||||||
Futures | 890 | 5,209 | ||||||
|
|
|
| |||||
Net realized gain (loss) | 58,301 | 83,310 | ||||||
|
|
|
| |||||
Change in net unrealized appreciation/depreciation on: | ||||||||
Investments in non-affiliates | 179,590 | 83,276 | ||||||
Investments in affiliates | 8,168 | — | ||||||
Futures | (120 | ) | (267 | ) | ||||
|
|
|
| |||||
Change in net unrealized appreciation/depreciation | 187,638 | 83,009 | ||||||
|
|
|
| |||||
Net realized/unrealized gains (losses) | 245,939 | 166,319 | ||||||
|
|
|
| |||||
Change in net assets resulting from operations | $ | 275,439 | $ | 176,907 | ||||
|
|
|
| |||||
| (a) | Amount rounds to less than 500. |
SEE NOTES TO FINANCIAL STATEMENTS.
| 28 | J.P. MORGAN EQUITY FUNDS | JUNE 30, 2017 | ||||
Table of Contents
STATEMENTS OF CHANGES IN NET ASSETS
FOR THE PERIODS INDICATED
(Amounts in thousands)
| Equity Index Fund | Market Expansion Enhanced Index Fund | |||||||||||||||
| Year Ended June 30, 2017 | Year Ended June 30, 2016 | Year Ended June 30, 2017 | Year Ended June 30, 2016 | |||||||||||||
CHANGE IN NET ASSETS RESULTING FROM OPERATIONS: | ||||||||||||||||
Net investment income (loss) | $ | 29,500 | $ | 32,669 | $ | 10,588 | $ | 11,007 | ||||||||
Net realized gain (loss) | 58,301 | 264,487 | 83,310 | 98,721 | ||||||||||||
Change in net unrealized appreciation/depreciation | 187,638 | (252,514 | ) | 83,009 | (139,614 | ) | ||||||||||
|
|
|
|
|
|
|
| |||||||||
Change in net assets resulting from operations | 275,439 | 44,642 | 176,907 | (29,886 | ) | |||||||||||
|
|
|
|
|
|
|
| |||||||||
DISTRIBUTIONS TO SHAREHOLDERS: | ||||||||||||||||
Class A | ||||||||||||||||
From net investment income | (9,630 | ) | (11,254 | ) | (747 | ) | (779 | ) | ||||||||
From net realized gains | (50,124 | ) | (93,301 | ) | (9,476 | ) | (17,264 | ) | ||||||||
Class C | ||||||||||||||||
From net investment income | (901 | ) | (998 | ) | (129 | ) | (66 | ) | ||||||||
From net realized gains | (7,682 | ) | (13,966 | ) | (3,120 | ) | (4,521 | ) | ||||||||
Class I (formerly Select Class) | ||||||||||||||||
From net investment income | (14,603 | ) | (18,999 | ) | (7,073 | ) | (9,512 | ) | ||||||||
From net realized gains | (65,912 | ) | (137,624 | ) | (74,429 | ) | (180,035 | ) | ||||||||
Class R2 | ||||||||||||||||
From net investment income | — | — | (77 | ) | (62 | ) | ||||||||||
From net realized gains | — | — | (1,167 | ) | (1,808 | ) | ||||||||||
Class R6 (a) | ||||||||||||||||
From net investment income | (4,127 | ) | — | — | — | |||||||||||
From net realized gains | (20,272 | ) | — | — | — | |||||||||||
|
|
|
|
|
|
|
| |||||||||
Total distributions to shareholders | (173,251 | ) | (276,142 | ) | (96,218 | ) | (214,047 | ) | ||||||||
|
|
|
|
|
|
|
| |||||||||
CAPITAL TRANSACTIONS: | ||||||||||||||||
Change in net assets resulting from capital transactions | 139,860 | (154,024 | ) | (4,899 | ) | (168,034 | ) | |||||||||
|
|
|
|
|
|
|
| |||||||||
NET ASSETS: | ||||||||||||||||
Change in net assets | 242,048 | (385,524 | ) | 75,790 | (411,967 | ) | ||||||||||
Beginning of period | 1,507,382 | 1,892,906 | 935,358 | 1,347,325 | ||||||||||||
|
|
|
|
|
|
|
| |||||||||
End of period | $ | 1,749,430 | $ | 1,507,382 | $ | 1,011,148 | $ | 935,358 | ||||||||
|
|
|
|
|
|
|
| |||||||||
Accumulated undistributed (distributions in excess of) net investment income | $ | 848 | $ | 1,108 | $ | 2,811 | $ | 462 | ||||||||
|
|
|
|
|
|
|
| |||||||||
| (a) | Commencement of offering of class of shares effective September 1, 2016 for Equity Index Fund. |
SEE NOTES TO FINANCIAL STATEMENTS.
| JUNE 30, 2017 | J.P. MORGAN EQUITY FUNDS | 29 | ||||||
Table of Contents
STATEMENTS OF CHANGES IN NET ASSETS
FOR THE PERIODS INDICATED (continued)
(Amounts in thousands)
| Equity Index Fund | Market Expansion Enhanced Index Fund | |||||||||||||||
| Year Ended June 30, 2017 | Year Ended June 30, 2016 | Year Ended June 30, 2017 | Year Ended June 30, 2016 | |||||||||||||
CAPITAL TRANSACTIONS: | ||||||||||||||||
Class A | ||||||||||||||||
Proceeds from shares issued | $ | 87,696 | $ | 104,909 | $ | 104,426 | $ | 22,263 | ||||||||
Distributions reinvested | 59,202 | 103,545 | 9,108 | 14,941 | ||||||||||||
Cost of shares redeemed | (200,298 | ) | (214,499 | ) | (59,090 | ) | (29,714 | ) | ||||||||
|
|
|
|
|
|
|
| |||||||||
Change in net assets resulting from Class A capital transactions | $ | (53,400 | ) | $ | (6,045 | ) | $ | 54,444 | $ | 7,490 | ||||||
|
|
|
|
|
|
|
| |||||||||
Class C | ||||||||||||||||
Proceeds from shares issued | $ | 24,354 | $ | 29,257 | $ | 20,627 | $ | 7,199 | ||||||||
Distributions reinvested | 6,658 | 11,459 | 2,957 | 3,945 | ||||||||||||
Cost of shares redeemed | (35,729 | ) | (28,073 | ) | (12,094 | ) | (5,823 | ) | ||||||||
|
|
|
|
|
|
|
| |||||||||
Change in net assets resulting from Class C capital transactions | $ | (4,717 | ) | $ | 12,643 | $ | 11,490 | $ | 5,321 | |||||||
|
|
|
|
|
|
|
| |||||||||
Class I (formerly Select Class) | ||||||||||||||||
Proceeds from shares issued | $ | 212,874 | $ | 185,825 | $ | 169,115 | $ | 104,489 | ||||||||
Distributions reinvested | 67,647 | 127,967 | 72,072 | 122,247 | ||||||||||||
Cost of shares redeemed | (408,621 | ) | (474,414 | ) | (322,041 | ) | (411,024 | ) | ||||||||
|
|
|
|
|
|
|
| |||||||||
Change in net assets resulting from Class I capital transactions | $ | (128,100 | ) | $ | (160,622 | ) | $ | (80,854 | ) | $ | (184,288 | ) | ||||
|
|
|
|
|
|
|
| |||||||||
Class R2 | ||||||||||||||||
Proceeds from shares issued | $ | — | $ | — | $ | 13,272 | $ | 5,044 | ||||||||
Distributions reinvested | — | — | 1,031 | 1,499 | ||||||||||||
Cost of shares redeemed | — | — | (4,282 | ) | (3,100 | ) | ||||||||||
|
|
|
|
|
|
|
| |||||||||
Change in net assets resulting from Class R2 capital transactions | $ | — | $ | — | $ | 10,021 | $ | 3,443 | ||||||||
|
|
|
|
|
|
|
| |||||||||
Class R6 (a) | ||||||||||||||||
Proceeds from shares issued | $ | 327,166 | $ | — | $ | — | $ | — | ||||||||
Distributions reinvested | 22,758 | — | — | — | ||||||||||||
Cost of shares redeemed | (23,847 | ) | — | — | — | |||||||||||
|
|
|
|
|
|
|
| |||||||||
Change in net assets resulting from Class R6 capital transactions | $ | 326,077 | $ | — | $ | — | $ | — | ||||||||
|
|
|
|
|
|
|
| |||||||||
Total change in net assets resulting from capital transactions | $ | 139,860 | $ | (154,024 | ) | $ | (4,899 | ) | $ | (168,034 | ) | |||||
|
|
|
|
|
|
|
| |||||||||
| (a) | Commencement of offering of class of shares effective September 1, 2016, for Equity Index Fund. |
SEE NOTES TO FINANCIAL STATEMENTS.
| 30 | J.P. MORGAN EQUITY FUNDS | JUNE 30, 2017 | ||||
Table of Contents
| Equity Index Fund | Market Expansion Enhanced Index Fund | |||||||||||||||
| Year Ended June 30, 2017 | Year Ended June 30, 2016 | Year Ended June 30, 2017 | Year Ended June 30, 2016 | |||||||||||||
SHARE TRANSACTIONS: | ||||||||||||||||
Class A | ||||||||||||||||
Issued | 2,404 | 2,869 | 9,202 | 2,064 | ||||||||||||
Reinvested | 1,686 | 3,030 | 816 | 1,486 | ||||||||||||
Redeemed | (5,502 | ) | (5,724 | ) | (5,223 | ) | (2,695 | ) | ||||||||
|
|
|
|
|
|
|
| |||||||||
Change in Class A Shares | (1,412 | ) | 175 | 4,795 | 855 | |||||||||||
|
|
|
|
|
|
|
| |||||||||
Class C | ||||||||||||||||
Issued | 677 | 809 | 2,113 | 746 | ||||||||||||
Reinvested | 192 | 339 | 310 | 451 | ||||||||||||
Redeemed | (990 | ) | (782 | ) | (1,241 | ) | (610 | ) | ||||||||
|
|
|
|
|
|
|
| |||||||||
Change in Class C Shares | (121 | ) | 366 | 1,182 | 587 | |||||||||||
|
|
|
|
|
|
|
| |||||||||
Class I (formerly Select Class) | ||||||||||||||||
Issued | 5,859 | 5,129 | 14,770 | 9,599 | ||||||||||||
Reinvested | 1,922 | 3,737 | 6,391 | 12,030 | ||||||||||||
Redeemed | (11,165 | ) | (12,808 | ) | (27,991 | ) | (39,168 | ) | ||||||||
|
|
|
|
|
|
|
| |||||||||
Change in Class I Shares | (3,384 | ) | (3,942 | ) | (6,830 | ) | (17,539 | ) | ||||||||
|
|
|
|
|
|
|
| |||||||||
Class R2 | ||||||||||||||||
Issued | — | — | 1,192 | 457 | ||||||||||||
Reinvested | — | — | 93 | 151 | ||||||||||||
Redeemed | — | — | (383 | ) | (285 | ) | ||||||||||
|
|
|
|
|
|
|
| |||||||||
Change in Class R2 Shares | — | — | 902 | 323 | ||||||||||||
|
|
|
|
|
|
|
| |||||||||
Class R6 (a) | ||||||||||||||||
Issued | 9,051 | — | — | — | ||||||||||||
Reinvested | 646 | — | — | — | ||||||||||||
Redeemed | (649 | ) | — | — | — | |||||||||||
|
|
|
|
|
|
|
| |||||||||
Change in Class R6 Shares | 9,048 | — | — | — | ||||||||||||
|
|
|
|
|
|
|
| |||||||||
| (a) | Commencement of offering of class of shares effective September 1, 2016, for Equity Index Fund. |
SEE NOTES TO FINANCIAL STATEMENTS.
| JUNE 30, 2017 | J.P. MORGAN EQUITY FUNDS | 31 | ||||||
Table of Contents
FOR THE PERIODS INDICATED
| Per share operating performance | ||||||||||||||||||||||||||||
| Investment operations | Distributions | |||||||||||||||||||||||||||
| Net asset value, beginning of period | Net investment income (loss) (b) | Net realized and unrealized gains (losses) on investments | Total from investment operations | Net investment income | Net realized gain | Total distributions | ||||||||||||||||||||||
Equity Index Fund | ||||||||||||||||||||||||||||
Class A | ||||||||||||||||||||||||||||
Year Ended June 30, 2017 | $ | 35.36 | $ | 0.61 | $ | 5.22 | $ | 5.83 | $ | (0.59 | ) | $ | (3.19 | ) | $ | (3.78 | ) | |||||||||||
Year Ended June 30, 2016 | 41.12 | 0.71 | 0.38 | 1.09 | (0.67 | ) | (6.18 | ) | (6.85 | ) | ||||||||||||||||||
Year Ended June 30, 2015 | 41.94 | 0.68 | 2.11 | 2.79 | (0.66 | ) | (2.95 | ) | (3.61 | ) | ||||||||||||||||||
Year Ended June 30, 2014 | 36.43 | 0.64 | 7.78 | 8.42 | (0.63 | ) | (2.28 | ) | (2.91 | ) | ||||||||||||||||||
Year Ended June 30, 2013 | 30.92 | 0.63 | 5.52 | 6.15 | (0.64 | ) | — | (0.64 | ) | |||||||||||||||||||
Class C | ||||||||||||||||||||||||||||
Year Ended June 30, 2017 | 35.09 | 0.36 | 5.18 | 5.54 | (0.36 | ) | (3.19 | ) | (3.55 | ) | ||||||||||||||||||
Year Ended June 30, 2016 | 40.86 | 0.43 | 0.38 | 0.81 | (0.40 | ) | (6.18 | ) | (6.58 | ) | ||||||||||||||||||
Year Ended June 30, 2015 | 41.72 | 0.37 | 2.09 | 2.46 | (0.37 | ) | (2.95 | ) | (3.32 | ) | ||||||||||||||||||
Year Ended June 30, 2014 | 36.28 | 0.35 | 7.73 | 8.08 | (0.36 | ) | (2.28 | ) | (2.64 | ) | ||||||||||||||||||
Year Ended June 30, 2013 | 30.81 | 0.37 | 5.50 | 5.87 | (0.40 | ) | — | (0.40 | ) | |||||||||||||||||||
Class I (formerly Select Class) | ||||||||||||||||||||||||||||
Year Ended June 30, 2017 | 35.39 | 0.70 | 5.22 | 5.92 | (0.68 | ) | (3.19 | ) | (3.87 | ) | ||||||||||||||||||
Year Ended June 30, 2016 | 41.14 | 0.81 | 0.38 | 1.19 | (0.76 | ) | (6.18 | ) | (6.94 | ) | ||||||||||||||||||
Year Ended June 30, 2015 | 41.96 | 0.79 | 2.10 | 2.89 | (0.76 | ) | (2.95 | ) | (3.71 | ) | ||||||||||||||||||
Year Ended June 30, 2014 | 36.44 | 0.74 | 7.79 | 8.53 | (0.73 | ) | (2.28 | ) | (3.01 | ) | ||||||||||||||||||
Year Ended June 30, 2013 | 30.92 | 0.71 | 5.53 | 6.24 | (0.72 | ) | — | (0.72 | ) | |||||||||||||||||||
Class R6 | ||||||||||||||||||||||||||||
September 1, 2016 (f) through June 30, 2017 | 36.73 | 0.58 | 4.05 | 4.63 | (0.73 | ) | (3.19 | ) | (3.92 | ) | ||||||||||||||||||
| (a) | Annualized for periods less than one year, unless otherwise noted. |
| (b) | Calculated based upon average shares outstanding. |
| (c) | Not annualized for periods less than one year. |
| (d) | Includes adjustments in accordance with accounting principles generally accepted in the United States of America and as such, the net asset values for financial reporting purposes and the returns based upon those net asset values may differ from the net asset values and returns for shareholder transactions. |
| (e) | Includes earnings credits and interest expense, if applicable, each of which is less than 0.005% unless otherwise noted. |
| (f) | Commencement of offering of class of shares. |
SEE NOTES TO FINANCIAL STATEMENTS.
| 32 | J.P. MORGAN EQUITY FUNDS | JUNE 30, 2017 | ||||
Table of Contents
| Ratios/Supplemental data | |||||||||||||||||||||||||
| Ratios to average net assets (a) | ||||||||||||||||||||||||||
| Net asset value, end of period | Total return (excludes sales charge) (c)(d) | Net assets, end of period (000’s) | Net expenses (e) | Net investment income (loss) | Expenses without waivers, reimbursements and earnings credits | Portfolio turnover rate (c) | ||||||||||||||||||||
| $ | 37.41 | 17.35 | % | $ | 580,645 | 0.45 | % | 1.67 | % | 0.76 | % | 21 | % | |||||||||||||
| 35.36 | 3.53 | 598,815 | 0.45 | 1.93 | 0.94 | 4 | ||||||||||||||||||||
| 41.12 | 6.94 | 689,107 | 0.45 | 1.63 | 0.92 | 5 | ||||||||||||||||||||
| 41.94 | 23.95 | 694,974 | 0.45 | 1.63 | 0.91 | 5 | ||||||||||||||||||||
| 36.43 | 20.04 | 585,946 | 0.45 | 1.86 | 0.94 | 4 | ||||||||||||||||||||
| 37.08 | 16.57 | 89,681 | 1.11 | 1.01 | 1.23 | 21 | ||||||||||||||||||||
| 35.09 | 2.76 | 89,104 | 1.20 | 1.19 | 1.43 | 4 | ||||||||||||||||||||
| 40.86 | 6.15 | 88,842 | 1.20 | 0.88 | 1.41 | 5 | ||||||||||||||||||||
| 41.72 | 23.01 | 77,644 | 1.20 | 0.88 | 1.41 | 5 | ||||||||||||||||||||
| 36.28 | 19.16 | 58,831 | 1.20 | 1.10 | 1.45 | 4 | ||||||||||||||||||||
| 37.44 | 17.62 | 740,340 | 0.20 | 1.93 | 0.48 | 21 | ||||||||||||||||||||
| 35.39 | 3.81 | 819,463 | 0.20 | 2.17 | 0.67 | 4 | ||||||||||||||||||||
| 41.14 | 7.19 | 1,114,957 | 0.20 | 1.88 | 0.66 | 5 | ||||||||||||||||||||
| 41.96 | 24.27 | 1,120,177 | 0.20 | 1.89 | 0.66 | 5 | ||||||||||||||||||||
| 36.44 | 20.35 | 1,087,877 | 0.20 | 2.11 | 0.69 | 4 | ||||||||||||||||||||
| 37.44 | 13.49 | 338,764 | 0.04 | 5 | 1.93 | 0.15 | 21 | |||||||||||||||||||
SEE NOTES TO FINANCIAL STATEMENTS.
| JUNE 30, 2017 | J.P. MORGAN EQUITY FUNDS | 33 | ||||||
Table of Contents
FINANCIAL HIGHLIGHTS
FOR THE PERIODS INDICATED
| Per share operating performance | ||||||||||||||||||||||||||||
| Investment operations | Distributions | |||||||||||||||||||||||||||
| Net asset value, beginning of period | Net investment income (loss) (a) | Net realized (losses) on | Total from investment operations | Net investment income | Net realized gain | Total distributions | ||||||||||||||||||||||
Market Expansion Enhanced Index Fund | ||||||||||||||||||||||||||||
Class A | ||||||||||||||||||||||||||||
Year Ended June 30, 2017 | $ | 10.64 | $ | 0.10 | $ | 1.92 | $ | 2.02 | $ | (0.08 | ) | $ | (1.06 | ) | $ | (1.14 | ) | |||||||||||
Year Ended June 30, 2016 | 12.98 | 0.09 | (0.21 | ) | (0.12 | ) | (0.08 | ) | (2.14 | ) | (2.22 | ) | ||||||||||||||||
Year Ended June 30, 2015 | 13.85 | 0.10 | 0.72 | 0.82 | (0.10 | ) | (1.59 | ) | (1.69 | ) | ||||||||||||||||||
Year Ended June 30, 2014 | 12.17 | 0.09 | (d) | 2.81 | 2.90 | (0.08 | ) | (1.14 | ) | (1.22 | ) | |||||||||||||||||
Year Ended June 30, 2013 | 10.32 | 0.11 | (e) | 2.45 | 2.56 | (0.11 | ) | (0.60 | ) | (0.71 | ) | |||||||||||||||||
Class C | ||||||||||||||||||||||||||||
Year Ended June 30, 2017 | 9.27 | 0.03 | 1.65 | 1.68 | (0.04 | ) | (1.06 | ) | (1.10 | ) | ||||||||||||||||||
Year Ended June 30, 2016 | 11.62 | 0.01 | (0.19 | ) | (0.18 | ) | (0.03 | ) | (2.14 | ) | (2.17 | ) | ||||||||||||||||
Year Ended June 30, 2015 | 12.58 | 0.01 | 0.65 | 0.66 | (0.03 | ) | (1.59 | ) | (1.62 | ) | ||||||||||||||||||
Year Ended June 30, 2014 | 11.18 | — | (d)(f) | 2.56 | 2.56 | (0.02 | ) | (1.14 | ) | (1.16 | ) | |||||||||||||||||
Year Ended June 30, 2013 | 9.55 | 0.03 | (e) | 2.25 | 2.28 | (0.05 | ) | (0.60 | ) | (0.65 | ) | |||||||||||||||||
Class I (formerly Select Class) | ||||||||||||||||||||||||||||
Year Ended June 30, 2017 | 10.75 | 0.13 | 1.94 | 2.07 | (0.10 | ) | (1.06 | ) | (1.16 | ) | ||||||||||||||||||
Year Ended June 30, 2016 | 13.09 | 0.12 | (0.21 | ) | (0.09 | ) | (0.11 | ) | (2.14 | ) | (2.25 | ) | ||||||||||||||||
Year Ended June 30, 2015 | 13.94 | 0.13 | 0.74 | 0.87 | (0.13 | ) | (1.59 | ) | (1.72 | ) | ||||||||||||||||||
Year Ended June 30, 2014 | 12.24 | 0.12 | (d) | 2.83 | 2.95 | (0.11 | ) | (1.14 | ) | (1.25 | ) | |||||||||||||||||
Year Ended June 30, 2013 | 10.37 | 0.14 | (e) | 2.46 | 2.60 | (0.13 | ) | (0.60 | ) | (0.73 | ) | |||||||||||||||||
Class R2 | ||||||||||||||||||||||||||||
Year Ended June 30, 2017 | 10.52 | 0.07 | 1.89 | 1.96 | (0.06 | ) | (1.06 | ) | (1.12 | ) | ||||||||||||||||||
Year Ended June 30, 2016 | 12.87 | 0.07 | (0.22 | ) | (0.15 | ) | (0.06 | ) | (2.14 | ) | (2.20 | ) | ||||||||||||||||
Year Ended June 30, 2015 | 13.74 | 0.07 | 0.72 | 0.79 | (0.07 | ) | (1.59 | ) | (1.66 | ) | ||||||||||||||||||
Year Ended June 30, 2014 | 12.09 | 0.06 | (d) | 2.78 | 2.84 | (0.05 | ) | (1.14 | ) | (1.19 | ) | |||||||||||||||||
Year Ended June 30, 2013 | 10.25 | 0.08 | (e) | 2.44 | 2.52 | (0.08 | ) | (0.60 | ) | (0.68 | ) | |||||||||||||||||
| (a) | Calculated based upon average shares outstanding. |
| (b) | Includes adjustments in accordance with accounting principles generally accepted in the United States of America and as such, the net asset values for financial reporting purposes and the returns based upon those net asset values may differ from the net asset values and returns for shareholder transactions. |
| (c) | Includes earnings credits and interest expense, if applicable, each of which is less than 0.005% unless otherwise noted. |
| (d) | Reflects special dividends paid out during the period by several of the Fund’s holdings. Had the Fund not received the special dividends, the net investment income (loss) per share remained the same for Class A, Class C, Class I and Class R2 Shares and the net investment income (loss) ratio would have been 0.65%, (0.03)%, 0.90% and 0.42% for Class A, Class C, Class I and Class R2 Shares respectively. |
| (e) | Reflects special dividends paid out during the period by several of the Fund’s holdings. Had the Fund not received the special dividends, the net investment income (loss) per share would have been $0.09, $0.01, $0.12 and $0.06 for Class A, Class C, Class I and Class R2 Shares, respectively, and the net investment income (loss) ratio would have been 0.82%, 0.13%, 1.07% and 0.58% for Class A, Class C, Class I and Class R2 Shares, respectively. |
| (f) | Amount rounds to less than 0.005. |
| (g) | Amount rounds to less than 0.005%. |
SEE NOTES TO FINANCIAL STATEMENTS.
| 34 | J.P. MORGAN EQUITY FUNDS | JUNE 30, 2017 | ||||
Table of Contents
| Ratios/Supplemental data | |||||||||||||||||||||||||
| Ratios to average net assets | ||||||||||||||||||||||||||
| Net asset value, end of period | Total return (excludes sales charge) (b) | Net assets, period (000’s) | Net expenses (c) | Net income | Expenses without waivers, reimbursements and earnings credits | Portfolio turnover rate | ||||||||||||||||||||
| $ | 11.52 | 19.37 | % | $ | 162,853 | 0.62 | % | 0.87 | % | 0.93 | % | 30 | % | |||||||||||||
| 10.64 | 0.22 | 99,397 | 0.69 | 0.81 | 0.98 | 39 | ||||||||||||||||||||
| 12.98 | 6.90 | 110,138 | 0.68 | 0.75 | 0.92 | 39 | ||||||||||||||||||||
| 13.85 | 24.96 | 116,727 | 0.69 | 0.68 | (d) | 0.87 | 25 | |||||||||||||||||||
| 12.17 | 25.91 | 84,296 | 0.69 | 0.95 | (e) | 0.88 | 51 | |||||||||||||||||||
| 9.85 | 18.58 | 37,529 | 1.17 | 0.32 | 1.44 | 30 | ||||||||||||||||||||
| 9.27 | (0.43 | ) | 24,343 | 1.39 | 0.12 | 1.52 | 39 | |||||||||||||||||||
| 11.62 | 6.25 | 23,705 | 1.38 | 0.06 | 1.44 | 39 | ||||||||||||||||||||
| 12.58 | 24.03 | 23,248 | 1.37 | 0.00 | (d)(g) | 1.37 | 25 | |||||||||||||||||||
| 11.18 | 25.07 | 16,636 | 1.37 | 0.27 | (e) | 1.38 | 51 | |||||||||||||||||||
| 11.66 | 19.66 | 788,063 | 0.38 | 1.13 | 0.62 | 30 | ||||||||||||||||||||
| 10.75 | 0.47 | 800,082 | 0.44 | 1.04 | 0.63 | 39 | ||||||||||||||||||||
| 13.09 | 7.26 | 1,203,536 | 0.43 | 1.00 | 0.62 | 39 | ||||||||||||||||||||
| 13.94 | 25.26 | 1,413,937 | 0.44 | 0.92 | (d) | 0.62 | 25 | |||||||||||||||||||
| 12.24 | 26.26 | 1,296,602 | 0.44 | 1.21 | (e) | 0.63 | 51 | |||||||||||||||||||
| 11.36 | 19.06 | 22,703 | 0.85 | 0.63 | 1.29 | 30 | ||||||||||||||||||||
| 10.52 | (0.05 | ) | 11,536 | 0.92 | 0.60 | 1.40 | 39 | |||||||||||||||||||
| 12.87 | 6.75 | 9,946 | 0.91 | 0.53 | 1.26 | 39 | ||||||||||||||||||||
| 13.74 | 24.60 | 8,821 | 0.92 | 0.45 | (d) | 1.12 | 25 | |||||||||||||||||||
| 12.09 | 25.72 | 6,985 | 0.93 | 0.72 | (e) | 1.13 | 51 | |||||||||||||||||||
SEE NOTES TO FINANCIAL STATEMENTS.
| JUNE 30, 2017 | J.P. MORGAN EQUITY FUNDS | 35 | ||||||
Table of Contents
AS OF JUNE 30, 2017
1. Organization
JPMorgan Trust II (“JPM II” or the “Trust”) was formed on November 12, 2004, as a Delaware statutory trust, pursuant to a Declaration of Trust dated November 5, 2004 and is registered under the Investment Company Act of 1940, as amended (the “1940 Act”), as an open-end management investment company.
The following are 2 separate funds of the Trust (collectively, the “Funds”) covered by this report:
| Classes Offered | Diversified/Non-Diversified | |||
| Equity Index Fund | Class A, Class C, Class I* and Class R6** | Diversified | ||
| Market Expansion Enhanced Index Fund | Class A, Class C, Class I*, and Class R2 | Diversified |
| * | Effective April 3, 2017, Select Class was renamed Class I. |
| ** | Class R6 Shares of the Equity Index Fund commenced operations on September 1, 2016. |
The investment objective of the Equity Index Fund is to seek investment results that correspond to the aggregate price and dividend performance of securities in the Standard & Poor’s 500 Composite Stock Price Index (“S&P 500 Index”).
The investment objective of the Market Expansion Enhanced Index Fund is to seek to provide investment results that correspond to or incrementally exceed the total return performance of an index that tracks the performance of the small- and mid-capitalization equity markets.
Class A Shares generally provide for a front-end sales charge while Class C Shares provide for a contingent deferred sales charge (“CDSC”). No sales charges are assessed with respect to Class I, Class R2 and Class R6 Shares. All classes of shares have equal rights as to earnings, assets and voting privileges, except that each class may bear different transfer agency, sub-transfer agency (through April 2, 2017), distribution and service fees and each class has exclusive voting rights with respect to its distribution plan and shareholder servicing agreements. Effective April 3, 2017 sub-transfer agency and shareholder servicing fees were consolidated into a single service fee. Certain Class A Shares, for which front-end sales charges have been waived, may be subject to a CDSC as described in the Funds’ prospectus. Beginning on November 14, 2017, Class C Shares will automatically convert to Class A Shares after ten years.
J.P. Morgan Investment Management Inc. (“JPMIM”), an indirect, wholly-owned subsidiary of JPMorgan Chase & Co. (“JPMorgan”), acts as Adviser (the “Adviser”) and Administrator (the “Administrator”) to the Funds.
2. Significant Accounting Policies
The following is a summary of significant accounting policies followed by the Funds in the preparation of their financial statements. The Funds are investment companies and, accordingly, follow the investment company accounting and reporting guidance of the Financial Accounting Standards Board Accounting Standards Codification Topic 946 — Investment Companies, which is part of U.S. generally accepted accounting principles (“GAAP”). The preparation of financial statements in conformity with GAAP requires management to make estimates and assumptions that affect the reported amounts of assets and liabilities and disclosure of contingent assets and liabilities at the date of the financial statements and the reported amounts of increases and decreases in net assets from operations during the reporting period. Actual results could differ from those estimates.
A. Valuation of Investments — The valuation of investments is in accordance with GAAP and the Funds’ valuation policies set forth by and under the supervision and responsibility of the Board of Trustees (the “Board”), which established the following approach to valuation, as described more fully below: (i) investments for which market quotations are readily available shall be valued at such unadjusted quoted prices and (ii) all other investments for which market quotations are not readily available shall be valued at their fair value as determined in good faith by the Board.
The Administrator has established the J.P. Morgan Investment Management Americas Valuation Committee (“AVC”) to assist the Board with the oversight and monitoring of the valuation of the Funds’ investments. The Administrator implements the valuation policies of the Funds’ investments, as directed by the Board. The AVC oversees and carries out the policies for the valuation of investments held in the Funds. This includes monitoring the appropriateness of fair values based on results of ongoing valuation oversight, including but not limited to consideration of macro or security specific events, market events and pricing vendor and broker due diligence. The Administrator is responsible for discussing and assessing the potential impacts to the fair values on an ongoing basis, and at least on a quarterly basis with the AVC and the Board.
A market-based approach is primarily used to value the Funds’ investments. Investments for which market quotations are not readily available are fair valued by approved affiliated and unaffiliated pricing vendors or third party broker-dealers (collectively referred to as “Pricing Services”) or may be internally fair valued using methods set forth by the valuation policies approved by the Board. This may include related or comparable assets or liabilities, recent transactions, market multiples, book values, and other relevant information for the investment to determine the fair value of the investment. An income-based valuation approach may be used in which the anticipated future cash flows of the investment are discounted to calculate the fair value. Discounts may also be applied due to the nature or duration of any restrictions on the disposition of the investments. Valuations may be based upon current market prices of securities that are comparable in coupon, rating, maturity and industry. It is possible that the estimated values may differ significantly from the values that would have been used, had a ready market for the investments existed, and such differences could be material.
| 36 | J.P. MORGAN EQUITY FUNDS | JUNE 30, 2017 | ||||
Table of Contents
Equities and other exchange-traded instruments are valued at the last sale price or official market closing price on the primary exchange on which the instrument is traded before the net asset values (“NAV”) of the Funds are calculated on a valuation date. Investments in open-end investment companies (the “Underlying Funds”) are valued at each Underlying Fund’s NAV per share as of the report date.
Futures are generally valued on the basis of available market quotations.
Valuations reflected in this report are as of the report date. As a result, changes in valuation due to market events and/or issuer related events after the report date and prior to issuance of the report are not reflected herein.
The various inputs that are used in determining the valuation of the Funds’ investments are summarized into the three broad levels listed below.
| • | Level 1 — Unadjusted inputs using quoted prices in active markets for identical investments. |
| • | Level 2 — Other significant observable inputs including, but not limited to, quoted prices for similar investments, inputs other than quoted prices that are observable for investments (such as interest rates, prepayment speeds, credit risk, etc.) or other market corroborated inputs. |
| • | Level 3 — Significant inputs based on the best information available in the circumstances, to the extent observable inputs are not available (including the Funds’ assumptions in determining the fair value of investments). |
A financial instrument’s level within the fair value hierarchy is based on the lowest level of any input, both individually and in the aggregate, that is significant to the fair value measurement. The inputs or methodology used for valuing instruments are not necessarily an indication of the risk associated with investing in those instruments.
The following tables represent each valuation input as presented on the Schedules of Portfolio Investments (“SOIs”) (amounts in thousands):
Equity Index Fund
| Level 1 Quoted prices | Level 2 observable inputs | Level 3 unobservable inputs | Total | |||||||||||||
Total Investments in Securities (a) | $ | 1,751,193 | $ | — | $ | 2 | $ | 1,751,195 | ||||||||
|
|
|
|
|
|
|
| |||||||||
Depreciation in Other Financial Instruments | ||||||||||||||||
Futures Contracts | $ | (21 | ) | $ | — | $ | — | $ | (21 | ) | ||||||
|
|
|
|
|
|
|
| |||||||||
Market Expansion Enhanced Index Fund
| Level 1 Quoted prices | Level 2 observable inputs | Level 3 unobservable inputs | Total | |||||||||||||
Total Investments in Securities (a) | $ | 1,022,830 | $ | — | $ | — | (b) | $ | 1,022,830 | |||||||
|
|
|
|
|
|
|
| |||||||||
Depreciation in Other Financial Instruments | ||||||||||||||||
Futures Contracts | $ | (58 | ) | $ | — | $ | — | $ | (58 | ) | ||||||
|
|
|
|
|
|
|
| |||||||||
| (a) | All portfolio holdings designated as level 1 and level 3 are disclosed individually on the SOIs. Level 3 consists of rights. Please refer to the SOIs for industry specifics of portfolio holdings. |
| (b) | Amount rounds to less than 500. |
There were no transfers among any levels during the year ended June 30, 2017.
B. Futures Contracts — The Funds used index futures contracts to gain or reduce exposure to their respective indices, maintain liquidity or minimize transaction costs. The Funds also bought futures contracts to invest incoming cash in the market or sold futures in response to cash outflows, thereby simulating an invested position in the underlying index while maintaining a cash balance for liquidity.
Futures contracts provide for the delayed delivery of the underlying instrument at a fixed price or are settled for a cash amount based on the change in the value of the underlying instrument at a specific date in the future. Upon entering into a futures contract, the Funds are required to deposit with the broker, cash or securities in an amount equal to a certain percentage of the contract amount, which is referred to as the initial margin deposit. Subsequent payments, referred to as variation margin, are made or received by the Funds periodically and are based on changes in the market value of open futures contracts. Changes in the market value of open futures contracts are recorded as change in net unrealized appreciation/depreciation on the Statements of Operations. Realized gains or losses, representing the difference between the value of the contract at the time it was opened and the value at the time it was closed, are reported on the Statements of Operations at the closing or expiration of the futures contract. Securities deposited as initial margin are designated on the SOIs and cash deposited is recorded on the Statements of Assets and Liabilities. A receivable from and/or a payable to brokers for the daily variation margin is also recorded on the Statements of Assets and Liabilities.
The use of futures contracts exposes the Funds to equity price risk. The Funds may be subject to the risk that the change in the value of the futures contract may not correlate perfectly with the underlying instrument. Use of long futures contracts subjects the Funds to risk of loss in excess of the
| JUNE 30, 2017 | J.P. MORGAN EQUITY FUNDS | 37 | ||||||
Table of Contents
NOTES TO FINANCIAL STATEMENTS
AS OF JUNE 30, 2017 (continued)
amounts shown on the Statements of Assets and Liabilities, up to the notional amount of the futures contracts. Use of short futures contracts subjects the Funds to unlimited risk of loss. The Funds may enter into futures contracts only on exchanges or boards of trade. The exchange or board of trade acts as the counterparty to each futures transaction; therefore, the Funds’ credit risk is limited to failure of the exchange or board of trade. Under some circumstances, futures exchanges may establish daily limits on the amount that the price of a futures contract can vary from the previous day’s settlement price, which could effectively prevent liquidation of positions.
The table below discloses the volume of the Funds’ futures contracts activity during the year ended June 30, 2017 (amounts in thousands):
Equity Index Fund | Market Expansion Enhanced Index Fund | |||||||
Futures Contracts — Equity | ||||||||
Average Notional Balance Long | $ | 8,709 | $ | 20,811 | ||||
Ending Notional Balance Long | 7,505 | 14,362 | ||||||
The Funds’ futures contracts are not subject to master netting arrangements (the right to close out all transactions traded with a counterparty and net amounts owed or due across transactions).
C. Investment Transactions with Affiliates — An issuer which is under common control with a fund may be considered an affiliate. For the purposes of the financial statements, the Funds assume the issuers listed in the tables below to be affiliated issuers. Underlying Funds’ distributions may be reinvested into the Underlying Funds. Reinvestment amounts are included in the purchase cost amounts in the table below (amounts in thousands).
| For the year ended June 30, 2017 | ||||||||||||||||||||||||||||
| Affiliate | Value at June 30, 2016 | Purchase Cost | Sales Proceeds | Realized Gain/(Loss) | Dividend Income | Shares at June 30, 2017 | Value at June 30, 2017 | |||||||||||||||||||||
Equity Index Fund | ||||||||||||||||||||||||||||
JPMorgan Chase & Co. (common stock)* | $ | 18,728 | $ | 4,129 | $ | 4,826 | $ | 1,081 | $ | 580 | 298 | $ | 27,280 | |||||||||||||||
JPMorgan Liquid Assets Money Market Fund, Institutional Class Shares | 11,729 | 22,125 | 33,854 | — | 3 | — | — | |||||||||||||||||||||
JPMorgan U.S. Government Money Market Fund, Institutional Class Shares | — | 455,159 | 448,901 | — | 37 | 6,258 | 6,258 | |||||||||||||||||||||
|
|
|
|
|
|
|
| |||||||||||||||||||||
| $ | 30,457 | $ | 1,081 | $ | 620 | $ | 33,538 | |||||||||||||||||||||
|
|
|
|
|
|
|
| |||||||||||||||||||||
| * | Investment in affiliate which is a security in the Fund’s Index. |
| For the year ended June 30, 2017 | ||||||||||||||||||||||||||||
| Affiliate | Value at June 30, 2016 | Purchase Cost | Sales Proceeds | Realized Gain/(Loss) | Dividend Income | Shares at June 30, 2017 | Value at June 30, 2017 | |||||||||||||||||||||
Market Expansion Enhanced Index Fund | ||||||||||||||||||||||||||||
JPMorgan Liquid Assets Money Market Fund, Institutional Class Shares | $ | 18,310 | $ | 13,653 | $ | 31,963 | $ | — | $ | 8 | — | $ | — | |||||||||||||||
JPMorgan U.S. Government Money Market Fund, Institutional Class Shares | — | 252,384 | 229,145 | — | 104 | 23,239 | 23,239 | |||||||||||||||||||||
|
|
|
|
|
|
|
| |||||||||||||||||||||
| $ | 18,310 | $ | — | $ | 112 | $ | 23,239 | |||||||||||||||||||||
|
|
|
|
|
|
|
| |||||||||||||||||||||
D. Security Transactions and Investment Income — Investment transactions are accounted for on the trade date (the date the order to buy or sell is executed). Securities gains and losses are calculated on a specifically identified cost basis. Interest income is determined on the basis of coupon interest accrued using the effective interest method which adjusts for amortization of premiums and accretion of discounts. Dividend income, net of foreign taxes withheld, if any, is recorded on the ex-dividend date or when a Fund first learns of the dividend.
To the extent such information is publicly available, the Funds record distributions received in excess of income earned from underlying investments as a reduction of cost of investments and/or realized gain. Such amounts are based on estimates if actual amounts are not available and actual amounts of income, realized gain and return of capital may differ from the estimated amounts. The Funds adjust the estimated amounts of the components of distributions (and consequently their net investment income) as necessary once the issuers provide information about the actual composition of the distributions.
E. Allocation of Income and Expenses — Expenses directly attributable to a fund are charged directly to that fund, while the expenses attributable to more than one fund of the Trust are allocated among the respective funds. In calculating the NAV of each class, investment income, realized and
| 38 | J.P. MORGAN EQUITY FUNDS | JUNE 30, 2017 | ||||
Table of Contents
unrealized gains and losses and expenses, other than class specific expenses, are allocated daily to each class of shares based upon the proportion of net assets of each class at the beginning of each day.
Transfer agency fees are class-specific expenses and sub-transfer agency fees were class-specific expenses up through April 2, 2017. Effective April 3, 2017, the Funds ceased making direct payments to financial intermediaries for any applicable sub-transfer agency services. Payments to financial intermediaries for sub-transfer agency services are made by JPMorgan Distribution Services, Inc. from the Shareholder Servicing Fee, which has been renamed as the Service Fee.
The amount of the transfer agency fees and sub-transfer agency fees charged to each class of the Funds for the year ended June 30, 2017 are as follows (amounts in thousands):
| Class A | Class C | Class I | Class R2 | Class R6 | Total | |||||||||||||||||||
Equity Index Fund | ||||||||||||||||||||||||
Transfer agency fees | $ | 248 | $ | 7 | $ | 17 | n/a | $ | 3 | $ | 275 | |||||||||||||
Sub-transfer agency fees | 187 | 41 | 318 | n/a | — | 546 | ||||||||||||||||||
Market Expansion Enhanced Index Fund | ||||||||||||||||||||||||
Transfer agency fees | 24 | 7 | 12 | $ | 11 | n/a | 54 | |||||||||||||||||
Sub-transfer agency fees | 63 | 19 | 101 | 16 | n/a | 199 | ||||||||||||||||||
F. Federal Income Taxes — Each Fund is treated as a separate taxable entity for Federal income tax purposes. Each Fund’s policy is to comply with the provisions of the Internal Revenue Code of 1986, as amended (the “Code”), applicable to regulated investment companies and to distribute to shareholders all of its distributable net investment income and net realized capital gains on investments. Accordingly, no provision for Federal income tax is necessary. Management has reviewed the Funds’ tax positions for all open tax years and has determined that as of June 30, 2017, no liability for income tax is required in the Funds’ financial statements for net unrecognized tax benefits. However, management’s conclusions may be subject to future review based on changes in, or the interpretation of, the accounting standards or tax laws and regulations. Each of the Funds’ Federal tax returns for the prior three fiscal years remains subject to examination by the Internal Revenue Service.
G. Distributions to Shareholders — Distributions from net investment income are generally declared and paid quarterly and are declared separately for each class. No class has preferential dividend rights; differences in per share rates are due to differences in separate class expenses. Net realized capital gains, if any, are distributed by each Fund at least annually. The amount of distributions from net investment income and net realized capital gains is determined in accordance with Federal income tax regulations, which may differ from GAAP. To the extent these “book/tax” differences are permanent in nature (i.e., that they result from other than timing of recognition — “temporary differences”), such amounts are reclassified within the capital accounts based on their Federal tax-basis treatment.
The following amounts were reclassified within the capital accounts (amounts in thousands):
| Paid-in-Capital | Accumulated undistributed (distributions in excess of) net investment income | Accumulated net realized gains (losses) | ||||||||||
Equity Index Fund | $ | — | $ | (499 | ) | $ | 499 | |||||
Market Expansion Enhanced Index Fund | — | (213 | ) | 213 | ||||||||
The reclassifications for the Funds relate primarily to non-taxable dividends.
3. Fees and Other Transactions with Affiliates
A. Investment Advisory Fee — Pursuant to an Investment Advisory Agreement, the Adviser supervises the investments of each Fund and for such services is paid a fee. The fee is accrued daily and paid monthly at an annual rate of 0.04% of the Equity Index Fund’s average daily net assets and 0.25% of the Market Expansion Enhanced Index Fund’s average daily net assets.
The Adviser waived Investment Advisory fees and/or reimbursed expenses as outlined in Note 3.F.
Prior to September 1, 2016, the fee for Equity Index Fund was 0.25% of the Fund’s average daily net assets.
B. Administration Fee — Pursuant to an Administration Agreement, the Administrator provides certain administration services to the Funds. In consideration of these services, the Administrator receives a fee accrued daily and paid monthly at an annual rate of 0.15% of the first $25 billion of the average daily net assets of all funds in the J.P. Morgan Funds Complex covered by the Administration Agreement (excluding certain funds of funds and money market funds) and 0.075% of the average daily net assets in excess of $25 billion of all such funds. For the year ended June 30, 2017, the effective annualized rate was 0.08% of each Fund’s average daily net assets, notwithstanding any fee waivers and/or expense reimbursements.
| JUNE 30, 2017 | J.P. MORGAN EQUITY FUNDS | 39 | ||||||
Table of Contents
NOTES TO FINANCIAL STATEMENTS
AS OF JUNE 30, 2017 (continued)
The Administrator waived Administration fees as outlined in Note 3.F.
JPMorgan Chase Bank, N.A. (“JPMCB”), a wholly-owned subsidiary of JPMorgan, serves as the Funds’ sub-administrator (the “Sub-administrator”). For its services as Sub-administrator, JPMCB receives a portion of the fees payable to the Administrator.
C. Distribution Fees — Pursuant to a Distribution Agreement, JPMorgan Distribution Services, Inc. (“JPMDS”), a wholly-owned subsidiary of JPMorgan, serves as the Trust’s principal underwriter and promotes and arranges for the sale of each Fund’s shares.
The Board has adopted a Distribution Plan (the “Distribution Plan”) for Class A, Class C and Class R2 Shares of the Funds, as applicable, in accordance with Rule 12b-1 under the 1940 Act. The Class I and Class R6 Shares do not charge a distribution fee. The Distribution Plan provides that each Fund shall pay distribution fees, including payments to JPMDS, at annual rates of the average daily net assets as shown in the table below:
| Class A | Class C | Class R2 | ||||||||
Equity Index Fund | 0.25% | 0.75 | % | n/a | ||||||
Market Expansion Enhanced Index Fund | 0.25 | 0.75 | 0.50 | % | ||||||
In addition, JPMDS is entitled to receive the front-end sales charges from purchases of Class A Shares and the CDSC from redemptions of Class C Shares and certain Class A Shares for which front-end sales charges have been waived. For the year ended June 30, 2017, JPMDS retained the following amounts (amounts in thousands):
| Front-End Sales Charge | CDSC | |||||||
Equity Index Fund | $41 | $ | 1 | |||||
Market Expansion Enhanced Index Fund | 37 | — | (a) | |||||
| (a) | Amount rounds to less than 500. |
D. Service Fees — The Trust, on behalf of the Funds, has entered into Shareholder Servicing Agreements with JPMDS under which JPMDS provides certain support services to the shareholders. The Class R6 Shares do not charge a service fee. For performing these services, JPMDS receives a fee that is accrued daily and paid monthly equal to an annual rate of 0.25% of the average daily net assets of each share class.
JPMDS has entered into shareholder services contracts with affiliated and unaffiliated financial intermediaries who provide shareholder services and other related services to their clients or customers who invest in the Funds under which JPMDS will pay all or a portion of such fees earned to financial intermediaries for performing such services.
JPMDS waived service fees as outlined in Note 3.F.
E. Custodian and Accounting Fees — JPMCB provides portfolio custody and accounting services to the Funds. For performing these services, the Funds pay JPMCB transaction and asset-based fees that vary according to the number of transactions and positions, plus out-of-pocket expenses. The amounts paid directly to JPMCB by the Funds for custody and accounting services are included in Custodian and accounting fees on the Statements of Operations. Payments to the custodian may be reduced by credits earned by each Fund, based on uninvested cash balances held by the custodian. Such earnings credits, if any, are presented separately on the Statements of Operations.
Interest expense paid to the custodian related to cash overdrafts, if any, is included in Interest expense to affiliates on the Statements of Operations.
F. Waivers and Reimbursements — The Adviser, Administrator and/or JPMDS have contractually agreed to waive fees and/or reimburse the Funds to the extent that total annual operating expenses (excluding acquired fund fees and expenses other than certain money market fund fees as described below, dividend and interest expenses related to short sales, interest, taxes, expenses related to litigation and potential litigation and extraordinary expenses) exceed the percentages of the Funds’ respective average daily net assets as shown in the table below:
| Class A | Class C | Class I | Class R2 | Class R6 | ||||||||||||||||
Equity Index Fund | 0.45 | % | 1.20 | % | 0.20 | % | n/a | 0.045 | % | |||||||||||
Market Expansion Enhanced Index Fund* | 0.60 | 1.10 | 0.35 | 0.83 | % | n/a | ||||||||||||||
| * | Prior to November 1, 2016, the contractual expense limitations for the Market Expansion Enhanced Index Fund were 0.69%, 1.39%, 0.44% and 0.92% for Class A, Class C, Class I and Class R2 Shares, respectively. |
Except as noted above, the expense limitation agreements were in effect for the year ended June 30, 2017 and are in place until at least October 31, 2017 for Equity Index Fund and at least October 31, 2018 for Market Expansion Enhanced Index Fund.
| 40 | J.P. MORGAN EQUITY FUNDS | JUNE 30, 2017 | ||||
Table of Contents
For the year ended June 30, 2017, the Funds’ service providers waived fees and/or reimbursed expenses for each of the Funds as follows (amounts in thousands). None of these parties expect the Funds to repay any such waived fees and reimbursed expenses in future years.
| Contractual Waivers | ||||||||||||||||||||
| Investment Advisory Fees | Administration Fees | Service Fees | Total | Contractual Reimbursements | ||||||||||||||||
Equity Index Fund | $ | 915 | $ | 1,072 | $ | 2,282 | $ | 4,269 | $ | 29 | ||||||||||
Market Expansion Enhanced Index Fund | 1,444 | 673 | 420 | 2,537 | 7 | |||||||||||||||
Additionally, the Funds may invest in one or more money market funds advised by the Adviser or its affiliates (affiliated money market funds). The Adviser, Administrator and/or JPMDS, as shareholder servicing agent, have contractually agreed to waive fees and/or reimburse expenses in an amount sufficient to offset the respective net fees each collects from the affiliated money market fund on the respective Funds’ investment in such affiliated money market fund.
The amount of waivers resulting from investments in these money market funds for the year ended June 30, 2017 was as follows (amounts in thousands):
Equity Index Fund | $ | 16 | ||
Market Expansion Enhanced Index Fund | 43 |
G. Other — Certain officers of the Trust are affiliated with the Adviser, the Administrator and JPMDS. Such officers, with the exception of the Chief Compliance Officer, receive no compensation from the Funds for serving in their respective roles.
The Board appointed a Chief Compliance Officer to the Funds in accordance with Federal securities regulations. Each Fund, along with other affiliated funds, makes reimbursement payments, on a pro-rata basis, to the Administrator for a portion of the fees associated with the Office of the Chief Compliance Officer. Such fees are included in Trustees’ and Chief Compliance Officer’s fees on the Statements of Operations.
The Trust adopted a Trustee Deferred Compensation Plan (the “Plan”) which allows the Independent Trustees to defer the receipt of all or a portion of compensation related to performance of their duties as Trustees. The deferred fees are invested in various J. P. Morgan Funds until distribution in accordance with the Plan.
The Funds may use related party broker-dealers. For the year ended June 30, 2017, the Funds did not incur any brokerage commissions with broker-dealers affiliated with the Adviser.
The Securities and Exchange Commission (“SEC”) has granted an exemptive order permitting the Funds to engage in principal transactions with J.P. Morgan Securities, Inc., an affiliated broker, involving taxable money market instruments, subject to certain conditions.
4. Investment Transactions
During the year ended June 30, 2017, purchases and sales of investments (excluding short-term investments) were as follows (amounts in thousands):
Purchases (excluding | Sales (excluding | |||||||
Equity Index Fund | $ | 348,301 | $ | 347,109 | ||||
Market Expansion Enhanced Index Fund | 287,545 | 362,807 | ||||||
During the year ended June 30, 2017, there were no purchases or sales of U.S. Government securities.
5. Federal Income Tax Matters
For Federal income tax purposes, the estimated cost and unrealized appreciation (depreciation) in value of investment securities held at June 30, 2017 were as follows (amounts in thousands):
Aggregate Cost | Gross Unrealized Appreciation | Gross Unrealized Depreciation | Net Unrealized Appreciation (Depreciation) | |||||||||||||
Equity Index Fund | $ | 581,958 | $ | 1,181,932 | $ | 12,695 | $ | 1,169,237 | ||||||||
Market Expansion Enhanced Index Fund | 717,932 | 335,856 | 30,958 | 304,898 | ||||||||||||
The difference between book and tax basis appreciation (depreciation) on investments is primarily attributed to non-taxable dividends and wash sale loss deferrals.
| JUNE 30, 2017 | J.P. MORGAN EQUITY FUNDS | 41 | ||||||
Table of Contents
NOTES TO FINANCIAL STATEMENTS
AS OF JUNE 30, 2017 (continued)
The tax character of distributions paid during the fiscal year ended June 30, 2017 was as follows (amounts in thousands):
Ordinary Income* | Net Long-Term Capital Gains | Total Distributions Paid | ||||||||||
Equity Index Fund | $ | 30,154 | $ | 143,097 | $ | 173,251 | ||||||
Market Expansion Enhanced Index Fund | 8,026 | 88,192 | 96,218 | |||||||||
| * | Short-term gains are treated as ordinary income for income tax purposes. |
The tax character of distributions paid during the fiscal year ended June 30, 2016 was as follows (amounts in thousands):
Ordinary Income* | Net Long-Term Capital Gains | Total Distributions Paid | ||||||||||
Equity Index Fund | $ | 31,553 | $ | 244,589 | $ | 276,142 | ||||||
Market Expansion Enhanced Index Fund | 10,904 | 203,143 | 214,047 | |||||||||
| * | Short-term gains are treated as ordinary income for income tax purposes. |
As of June 30, 2017, the estimated components of net assets (excluding paid-in-capital) on a tax basis were as follows (amounts in thousands):
Current Distributable Ordinary Income | Current Distributable Long-Term Capital Gain or (Tax Basis Capital Loss Carryover) | Unrealized Appreciation (Depreciation) | ||||||||||
Equity Index Fund | $ | 16,546 | $ | 4,269 | $ | 1,169,237 | ||||||
Market Expansion Enhanced Index Fund | 3,094 | 66,430 | 304,898 | |||||||||
The cumulative timing differences primarily consist of wash sale loss deferrals and non-taxable dividends.
As of June 30, 2017, the Funds did not have any net capital loss carryforwards.
6. Borrowings
The Funds rely upon an exemptive order granted by the SEC (the “Order”) permitting the establishment and operation of an Interfund Lending Facility (the “Facility”). The Facility allows the Funds to directly lend and borrow money to or from any other fund relying upon the Order at rates beneficial to both the borrowing and lending funds. Advances under the Facility are taken primarily for temporary or emergency purposes, including the meeting of redemption requests that otherwise might require the untimely disposition of securities, and are subject to each Fund’s borrowing restrictions. The Interfund loan rate is determined, as specified in the Order, by averaging the current repurchase agreement rate and the current bank loan rate. The Order was granted to JPM II and may be relied upon by the Funds because the Funds and the series of JPMorgan Trust II are all investment companies in the same “group of investment companies” (as defined in Section 12(d)(1)(G) of the 1940 Act).
The Trust and JPMCB have entered into a financing arrangement. Under this arrangement, JPMCB provides an unsecured, uncommitted credit facility in the aggregate amount of $100 million to certain of the J.P. Morgan Funds, including the Funds. Advances under the arrangement are taken primarily for temporary or emergency purposes, including the meeting of redemption requests that otherwise might require the untimely disposition of securities, and are subject to each Fund’s borrowing restrictions. Interest on borrowings is payable at a rate determined by JPMCB at the time of borrowing. This agreement has been extended until November 6, 2017.
The Funds had no borrowings outstanding from another fund or from the unsecured, uncommitted credit facility at June 30, 2017. Average borrowings from the Facility for the year ended June 30, 2017, were as follows (amounts in thousands):
Average Borrowings | Average Paid | Number of Days | Interest Paid | |||||||||||||
Equity Index Fund | $ | 35,166 | 1.61 | % | 3 | $ | 5 | |||||||||
In addition, effective August 16, 2016, the Trust along with certain other trusts (“Borrowers”) entered into a joint syndicated senior unsecured revolving credit facility totaling $1.5 billion (“Credit Facility”) with various lenders and The Bank of New York Mellon, as administrative agent for the lenders. This Credit Facility provides a source of funds to the Borrowers for temporary and emergency purposes, including the meeting of redemption requests that otherwise might require the untimely disposition of securities. Under the terms of the Credit Facility, a borrowing fund must have a minimum of $25,000,000 in adjusted net asset value and not exceed certain adjusted net asset coverage ratios prior to and during the time in which any borrowings are outstanding. If a fund does not comply with the aforementioned requirements, the fund must remediate within three business days with respect to the $25,000,000 minimum adjusted net asset value or within one business day with respect to certain asset coverage ratios or
| 42 | J.P. MORGAN EQUITY FUNDS | JUNE 30, 2017 | ||||
Table of Contents
the administrative agent at the request of, or with the consent of, the lenders may terminate the Credit Facility and declare any outstanding borrowings to be due and payable immediately.
Interest associated with any borrowing under the Credit Facility is charged to the borrowing fund at a rate of interest equal to 1.00% plus the greater of the federal funds effective rate or one month LIBOR. The annual commitment fee to maintain the Credit Facility is 0.15% and is incurred on the unused portion of the Credit Facility and is allocated to all participating funds pro rata based on their respective net assets. Effective August 15, 2017, this agreement has been amended and restated for a term of 364 days, unless extended.
The Funds had no borrowings outstanding from the Credit Facility at June 30, 2017. Average borrowings from the Credit Facility for, or at any time during the year ended June 30, 2017, were as follows (amounts in thousands):
| Average Borrowings | Average Paid | Number of Days Outstanding | Interest Paid | |||||||||||||
Equity Index Fund | $ | 7,000 | 1.77 | % | 3 | $ | 1 | |||||||||
7. Risks, Concentrations and Indemnifications
In the normal course of business, the Funds enter into contracts that contain a variety of representations which provide general indemnifications. Each Fund’s maximum exposure under these arrangements is unknown. The amount of exposure would depend on future claims that may be made against each Fund that have not yet occurred. However, based on experience, the Funds expect the risk of loss to be remote.
As of June 30, 2017, the Equity Index Fund had three affiliated omnibus accounts, which owned 14.2% of the Fund’s outstanding shares.
As of June 30, 2017, the J.P. Morgan Investor Funds, which are affiliated funds of funds, owned in the aggregate shares representing 46.4% of the net assets of Market Expansion Enhanced Index Fund.
Significant shareholder transactions by these shareholders may impact each Fund’s performance.
Because the Funds may invest a portion of their assets in REITs, the Funds may be subject to certain risks similar to those associated with direct investments in real estate. REITs may be affected by changes in the value of their underlying properties and by defaults by tenants. REITs depend generally on their ability to generate cash flow to make distributions to shareholders, and certain REITs have self-liquidation provisions by which mortgages held may be paid in full and distributions of capital returns may be made at any time.
Derivatives may be riskier than other types of investments because they may be more sensitive to changes in economic and market conditions and could result in losses that significantly exceed the Funds’ original investment. Derivatives also expose the Funds to counterparty risk (the risk that the derivative counterparty will not fulfill its contractual obligations), including credit risk of the derivative counterparty.
8. Investment Company Reporting Modernization
In October 2016, the U.S. Securities and Exchange Commission adopted new rules and forms, and amendments to certain current rules and forms, to modernize the reporting and disclosure of information by registered investment companies. In part, the final rules amend Regulation S-X and will require standardized, enhanced disclosures about derivatives in investment company financial statements, as well as other amendments. The amendments to Regulation S-X will apply to Funds’ fiscal year ends on or after August 1, 2017. At this time, management is currently evaluating the impact of the Regulation S-X amendments on the Funds’ financial statements and related disclosures. The adoption will have no effect on the Funds’ net assets or results of operations.
| JUNE 30, 2017 | J.P. MORGAN EQUITY FUNDS | 43 | ||||||
Table of Contents
REPORT OF INDEPENDENT REGISTERED PUBLIC ACCOUNTING FIRM
To the Board of Trustees of JPMorgan Trust II and the Shareholders of JPMorgan Equity Index Fund and JPMorgan Market Expansion Enhanced Index Fund
In our opinion, the accompanying statements of assets and liabilities, including the schedules of portfolio investments, and the related statements of operations and of changes in net assets and the financial highlights present fairly, in all material respects, the financial position of JPMorgan Equity Index Fund and JPMorgan Market Expansion Enhanced Index Fund (each a separate series of JPMorgan Trust II) (hereafter collectively referred to as the “Funds”) as of June 30, 2017, the results of each of their operations for the year then ended, the changes in each of their net assets for each of the two years in the period then ended and the financial highlights for each of the periods indicated therein, in conformity with accounting principles generally accepted in the United States of America. These financial statements and financial highlights (hereafter referred to as “financial statements”) are the responsibility of the Funds’ management. Our responsibility is to express an opinion on these financial statements based on our audits. We conducted our audits of these financial statements in accordance with the standards of the Public Company Accounting Oversight Board (United States). Those standards require that we plan and perform the audit to obtain reasonable assurance about whether the financial statements are free of material misstatement. An audit includes examining, on a test basis, evidence supporting the amounts and disclosures in the financial statements, assessing the accounting principles used and significant estimates made by management, and evaluating the overall financial statement presentation. We believe that our audits, which included confirmation of securities as of June 30, 2017 by correspondence with the transfer agent, custodian and brokers, provide a reasonable basis for our opinions.
PricewaterhouseCoopers LLP
New York, New York
August 25, 2017
| 44 | J.P. MORGAN EQUITY FUNDS | JUNE 30, 2017 | ||||
Table of Contents
(Unaudited)
The Funds’ Statement of Additional Information includes additional information about the Funds’ Trustees and is available, without charge, upon request by calling 1-800-480-4111 or on the J.P. Morgan Funds’ website at www.jpmorganfunds.com.
Name (Year of Birth); Positions With the Funds (1) | Principal Occupations During Past 5 Years | Number of Portfolios in Fund Complex Overseen by Trustee (2) | Other Directorships Held Outside Fund Complex During Past 5 Years | |||
Independent Trustees | ||||||
| John F. Finn (1947); Trustee of Trust since 2005; Trustee of heritage One Group Mutual Funds since 1998. | Chairman (1985-present), Chief Executive Officer, Gardner, Inc. (supply chain management company serving industrial and consumer markets) (1974-present). | 150 | Director, Greif, Inc. (GEF) (industrial package products and services) (2007-present); Trustee, Columbus Association for the Performing Arts (1988-present); Director, Cardinal Health, Inc. (CAH) (1994-2014). | |||
| Dr. Matthew Goldstein (1941); Chairman since 2013; Trustee of Trust since 2005; Trustee of heritage J.P. Morgan Funds since 2003. | Chancellor Emeritus, City University of New York (2015-present); Professor, City University of New York (2013-present); Chancellor, City University of New York (1999-2013); President, Adelphi University (New York) (1998-1999). | 150 | Trustee, Museum of Jewish Heritage (2011-present) Trustee, National Museum of Mathematics (present); Chair, Association of College and University Administrators (present). | |||
| Dennis P. Harrington (1950); Trustee of Trust since 2017. | Retired; Partner, Deloitte LLP (1984-2012). | 149 | None | |||
| Frankie D. Hughes (1952); Trustee of Trust since 2008. | President, Ashland Hughes Properties (property management) (2014-present); President and Chief Investment Officer, Hughes Capital Management, Inc. (fixed income asset management) (1993-2014). | 150 | None | |||
Raymond Kanner (1953); Trustee of the Trusts since 2017. | Retired; Managing Director & Chief Investment Officer, IBM Retirement Funds (2007-2016). | 149 | Director, Emerging Markets Growth Fund (1997-2016); Acting Executive Director, Committee on Investment of Employee Benefit Assets (CIEBA), 2016-17; Advisory Board Member, Betterment for Business (2016-present) (robo advisor); Advisory Board Member, Blue Star Indexes (2013-present) (index creator); Member, Russell Index Client Advisory Board (2001-2015). | |||
| Peter C. Marshall (1942); Trustee of Trust since 2005; Trustee of heritage One Group Mutual Funds since 1985. | Self-employed business consultant (2002-present). | 150 | None | |||
| Mary E. Martinez (1960); Trustee of Trust since 2013. | Associate, Special Properties, a Christie’s International Real Estate Affiliate (2010-present); Managing Director, Bank of America (Asset Management) (2007-2008); Chief Operating Officer, U.S. Trust Asset Management, U.S. Trust Company (asset management) (2003-2007); President, Excelsior Funds (registered investment companies) (2004-2005). | 150 | None | |||
| Marilyn McCoy* (1948); Trustee of Trust since 2005; Trustee of heritage One Group Mutual Funds since 1999. | Vice President of Administration and Planning, Northwestern University (1985-present). | 150 | None | |||
| JUNE 30, 2017 | J.P. MORGAN EQUITY FUNDS | 45 | ||||||
Table of Contents
TRUSTEES
(Unaudited) (continued)
Name (Year of Birth); Positions With the Funds (1) | Principal Occupations During Past 5 Years | Number of Portfolios in Fund Complex Overseen by Trustee (2) | Other Directorships Held Outside Fund Complex During Past 5 Years | |||
Independent Trustees (continued) | ||||||
| Mitchell M. Merin (1953); Trustee of Trust since 2013. | Retired; President and Chief Operating Officer, Morgan Stanley Investment Management, Member Morgan Stanley & Co. Management Committee (registered investment adviser) (1985-2005). | 150 | Director, Sun Life Financial (SLF) (2007-2013) (financial services and insurance). | |||
| Dr. Robert A. Oden, Jr. (1946); Trustee of Trust since 2005; Trustee of heritage One Group Mutual Funds since 1997. | Retired; President, Carleton College (2002-2010); President, Kenyon College (1995-2002). | 150 | Chairman, Dartmouth-Hitchcock Medical Center (2011-present); Trustee, American Schools of Oriental Research (2011-present); Trustee, American University in Cairo (1999-2014); Trustee, American Museum of Fly Fishing (2013-present). | |||
| Marian U. Pardo** (1946); Trustee of Trust since 2013. | Managing Director and Founder, Virtual Capital Management LLC (Investment Consulting) (2007-present); Managing Director, Credit Suisse Asset Management (portfolio manager) (2003-2006). | 150 | Member, Board of Governors, Columbus Citizens Foundation (not-for-profit supporting philanthropic and cultural programs) (2006-present). | |||
| Frederick W. Ruebeck (1939); Trustee of Trust since 2005; Trustee of heritage One Group Mutual Funds since 1994. | Consultant (2000-present); Advisor, JP Greene & Associates, LLC (broker-dealer) (2000-2009); Chief Investment Officer, Wabash College (2004-2015); Director of Investments, Eli Lilly and Company (pharmaceuticals) (1988-1999). | 150 | Trustee, Wabash College (2000-present). | |||
| James J. Schonbachler (1943); Trustee of Trust since 2005; Trustee of heritage J.P. Morgan Funds since 2001. | Retired; Managing Director of Bankers Trust Company (financial services) (1968-1998). | 150 | None | |||
| (1) | The Trustees serve for an indefinite term, subject to the Trust’s current retirement policy, which is age 78 for all Trustees. |
| (2) | A Fund Complex means two or more registered investment companies that hold themselves out to investors as related companies for purposes of investment and investor services or have a common investment adviser or have an investment adviser that is an affiliated person of the investment adviser of any of the other registered investment companies. The J.P. Morgan Funds Complex for which the Board of Trustees serves currently includes twelve registered investment companies (150 funds). |
| * | Two members of the Board of Trustees of Northwestern University are executive officers of registered investment advisers (not affiliated with JPMorgan) that are under common control with sub-advisers to certain J.P. Morgan Funds. |
| ** | In connection with prior employment with JPMorgan Chase, Ms. Pardo was the recipient of non-qualified pension plan payments from JPMorgan Chase in the amount of approximately $2,055 per month, which she irrevocably waived effective January 1, 2013, and deferred compensation payments from JPMorgan Chase in the amount of approximately $7,294 per year, which ended in January 2013. In addition, Ms. Pardo receives payments from a fully-funded qualified plan, which is not an obligation of JPMorgan Chase. |
The contact address for each of the Trustees is 270 Park Avenue, New York, NY 10017.
| 46 | J.P. MORGAN EQUITY FUNDS | JUNE 30, 2017 | ||||
Table of Contents
(Unaudited)
Name (Year of Birth), Positions Held with the Trust (Since) | Principal Occupations During Past 5 Years | |
| Brian S. Shlissel (1964), President and Principal Executive Officer (2016) | Managing Director and Chief Administrative Officer for J.P. Morgan pooled vehicles, J.P. Morgan Investment Management Inc. (formerly JPMorgan Funds Management, Inc.) (2014 – present); Managing Director and Head of Mutual Fund Services, Allianz Global Investors; President and Chief Executive Officer, Allianz Global Investors Mutual Funds and PIMCO Closed-End Funds (1999-2014) | |
| Laura M. Del Prato (1964), Treasurer and Principal Financial Officer (2014)* | Managing Director, J.P. Morgan Investment Management Inc. (formerly JPMorgan Funds Management, Inc.) since 2014; Partner, Cohen Fund Audit Services, Ltd. (2012-2013); Partner (2004-2012) and various other titles (1990-2004) at KPMG, LLP. | |
| Frank J. Nasta (1964), Secretary (2008) | Managing Director and Associate General Counsel, JPMorgan Chase since 2008. | |
| Stephen M. Ungerman (1953), Chief Compliance Officer (2005) | Managing Director, JPMorgan Chase & Co.; Mr. Ungerman has been with JPMorgan Chase & Co. since 2000. | |
Elizabeth A. Davin (1964), Assistant Secretary (2005)* | Executive Director and Assistant General Counsel, JPMorgan Chase since February 2012; formerly Vice President and Assistant General Counsel, JPMorgan Chase from 2005 to February 2012; Senior Counsel, JPMorgan Chase (formerly Bank One Corporation) from 2004 to 2005. | |
| Jessica K. Ditullio (1962), Assistant Secretary (2005)* | Executive Director and Assistant General Counsel, JPMorgan Chase. Ms. Ditullio has been with JPMorgan Chase (formerly Bank One Corporation) since 1990. | |
| John T. Fitzgerald (1975), Assistant Secretary (2008) | Executive Director and Assistant General Counsel, JPMorgan Chase. Mr. Fitzgerald has been with JPMorgan Chase since 2005. | |
| Carmine Lekstutis (1980), Assistant Secretary (2011) | Executive Director and Assistant General Counsel, JPMorgan Chase since February 2015; formerly Vice President and Assistant General Counsel, JPMorgan Chase from 2011 to February 2015. | |
| Gregory S. Samuels (1980), Assistant Secretary (2010) | Executive Director and Assistant General Counsel, JPMorgan Chase since 2014; formerly Vice President and Assistant General Counsel, JPMorgan Chase since 2010. | |
| Pamela L. Woodley (1971), Assistant Secretary (2012)** | Vice President and Assistant General Counsel, JPMorgan Chase since November 2004. | |
Zachary E. Vonnegut-Gabovitch (1986) Assistant Secretary (2017) | Vice President and Assistant General Counsel, JPMorgan Chase since September 2016; Associate, Morgan, Lewis & Bockius (law firm) from 2012 to 2016. | |
Michael M. D’Ambrosio (1969), Assistant Treasurer (2012) | Managing Director, J.P. Morgan Investment Management Inc. (formerly JPMorgan Funds Management, Inc.) since May 2014; formerly Executive Director, JPMorgan Funds Management, Inc. from 2012 to May 2014; prior to joining JPMorgan Chase, Mr. D’Ambrosio was a Tax Director at PricewaterhouseCoopers LLP since 2006. | |
Lauren A. Paino (1973), Assistant Treasurer (2014)** | Executive Director, J.P. Morgan Investment Management Inc. (formerly JPMorgan Funds Management, Inc.) since August 2013; formerly Director, Credit Suisse Asset Management from 2000-2013. | |
| Joseph Parascondola (1963), Assistant Treasurer (2011)** | Vice President, J.P. Morgan Investment Management Inc. (formerly JPMorgan Funds Management, Inc.) since August 2006. | |
| Matthew J. Plastina (1970), Assistant Treasurer (2011)** | Executive Director, J.P. Morgan Investment Management Inc. (formerly JPMorgan Funds Management, Inc.) since February 2016; Vice President, JPMorgan Funds Management, Inc. from 2010 to January 2016. | |
Gillian I. Sands (1969), Assistant Treasurer (2012)** | Vice President, J.P. Morgan Investment Management Inc. (formerly JPMorgan Funds Management, Inc.) since September 2012; Assistant Treasurer, Wells Fargo Funds Management (2007-2009). | |
The contact address for each of the officers, unless otherwise noted, is 270 Park Avenue, New York, NY 10017.
| * | The contact address for the officer is 1111 Polaris Parkway, Columbus, OH 43240. |
| ** | The contact address for the officer is 4 New York Plaza, New York, NY 10004. |
| JUNE 30, 2017 | J.P. MORGAN EQUITY FUNDS | 47 | ||||||
Table of Contents
SCHEDULE OF SHAREHOLDER EXPENSES
(Unaudited)
Hypothetical $1,000 Investment
As a shareholder of the Funds, you incur two types of costs: (1) transaction costs, including sales charges (loads) on purchase payments and (2) ongoing costs, including investment advisory fees, administration fees, distribution fees and other Fund expenses. The examples below are intended to help you understand your ongoing costs (in dollars) of investing in the Funds and to compare these ongoing costs with the ongoing costs of investing in other mutual funds. The examples assume that you had a $1,000 investment in each Class at the beginning of the reporting period, January 1, 2017, and continued to hold your shares at the end of the reporting period, June 30, 2017.
Actual Expenses
For each Class of each Fund in the table below, the first line provides information about actual account values and actual expenses. You may use the information in this line, together with the amount you invested, to estimate the expenses that you paid over the period. Simply divide your account value by $1,000 (for example, an $8,600 account value divided by $1,000 = 8.6), then multiply the result by the number in the first line of each Class under the heading entitled “Expenses Paid During the Period” to estimate the expenses you paid on your account during this period.
Hypothetical Example for Comparison Purposes
The second line of each Class in the table below provides information about hypothetical account values and hypothetical expenses based on the Class’ actual expense ratio and an assumed rate of return of 5% per year before expenses, which is not the Class’ actual return. The hypothetical account values and expenses may not be used to estimate the actual ending account balance or expenses you paid for the period. You may use this information to compare the ongoing costs of investing in the Class of the Funds and other funds. To do so, compare this 5% hypothetical example with the 5% hypothetical examples that appear in the shareholder reports of the other funds. Please note that the expenses shown in the table are meant to highlight your ongoing costs only and do not reflect any transaction costs, such as sales charges (loads) or redemption fees. Therefore, the second line for each Class in the table is useful in comparing ongoing costs only, and will not help you determine the relative total costs of owning different funds. In addition, if these transaction costs were included, your costs would have been higher. The examples also assume all dividends and distributions have been reinvested.
| Beginning Account Value January 1, 2017 | Ending Account Value June 30, 2017 | Expenses Paid During the Period* | Annualized Expense Ratio | |||||||||||||
Equity Index Fund | ||||||||||||||||
Class A | ||||||||||||||||
Actual | $ | 1,000.00 | $ | 1,090.90 | $ | 2.33 | 0.45 | % | ||||||||
Hypothetical | 1,000.00 | 1,022.56 | 2.26 | 0.45 | ||||||||||||
Class C | ||||||||||||||||
Actual | 1,000.00 | 1,087.50 | 5.59 | 1.08 | ||||||||||||
Hypothetical | 1,000.00 | 1,019.44 | 5.41 | 1.08 | ||||||||||||
Class I (formerly Select Class) | ||||||||||||||||
Actual | 1,000.00 | 1,092.20 | 1.04 | 0.20 | ||||||||||||
Hypothetical | 1,000.00 | 1,023.80 | 1.00 | 0.20 | ||||||||||||
Class R6 | ||||||||||||||||
Actual | 1,000.00 | 1,093.00 | 0.26 | 0.04 | 5 | |||||||||||
Hypothetical | 1,000.00 | 1,024.55 | 0.25 | 0.04 | 5 | |||||||||||
Market Expansion Enhanced Index Fund | ||||||||||||||||
Class A | ||||||||||||||||
Actual | 1,000.00 | 1,038.70 | 2.98 | 0.59 | ||||||||||||
Hypothetical | 1,000.00 | 1,021.87 | 2.96 | 0.59 | ||||||||||||
Class C | ||||||||||||||||
Actual | 1,000.00 | 1,036.80 | 5.50 | 1.09 | ||||||||||||
Hypothetical | 1,000.00 | 1,019.39 | 5.46 | 1.09 | ||||||||||||
Class I (formerly Select Class) | ||||||||||||||||
Actual | 1,000.00 | 1,040.50 | 1.72 | 0.34 | ||||||||||||
Hypothetical | 1,000.00 | 1,023.11 | 1.71 | 0.34 | ||||||||||||
Class R2 | ||||||||||||||||
Actual | 1,000.00 | 1,038.10 | 4.14 | 0.82 | ||||||||||||
Hypothetical | 1,000.00 | 1,020.73 | 4.11 | 0.82 | ||||||||||||
| * | Expenses are equal to each Class’ respective annualized expense ratio, multiplied by the average account value over the period, multiplied by 181/365 (to reflect the one-half year period). |
| 48 | J.P. MORGAN EQUITY FUNDS | JUNE 30, 2017 | ||||
Table of Contents
(Unaudited)
Certain tax information for the J.P. Morgan Funds is required to be provided to shareholders based upon the Funds’ income and distributions for the taxable year ended June 30, 2017. The information and distributions reported in this letter may differ from the information and taxable distributions reported to the shareholders for the calendar year ending December 31, 2017. The information necessary to complete your income tax returns for the calendar year ending December 31, 2017 will be provided under separate cover.
Dividends Received Deductions (DRD)
Each fund listed below had the following percentage, or maximum allowable percentage, of ordinary income distributions eligible for the 70% dividends received deductions for corporate shareholders for the fiscal year ended June 30, 2017:
| Dividends Received Deduction | ||||
Equity Index Fund | 76.93% | |||
Market Expansion Enhanced Index Fund | 100.00 | |||
Long-Term Capital Gain
Each Fund listed below distributed the following amount, or maximum allowable amount, of long-term capital gain dividends for the fiscal year ended June 30, 2017 (amounts in thousands):
| Long-Term Capital Gain Distribution | ||||
Equity Index Fund | $ | 143,097 | ||
Market Expansion Enhanced Index Fund | 88,192 | |||
Qualified Dividend Income (QDI)
The Fund listed below had the following amount, or maximum allowable amount, of ordinary income distributions treated as qualified dividends for the fiscal year ended June 30, 2017 (amounts in thousands):
| Qualified Dividend Income | ||||
Equity Index Fund | $ | 30,155 | ||
Market Expansion Enhanced Index Fund | 8,026 | |||
| JUNE 30, 2017 | J.P. MORGAN EQUITY FUNDS | 49 | ||||||
Table of Contents

Rev. January 2011
| FACTS | WHAT DOES J.P. MORGAN FUNDS DO WITH YOUR PERSONAL INFORMATION? |
| Why? | Financial companies choose how they share your personal information. Federal law gives consumers the right to limit some but not all sharing. Federal law also requires us to tell you how we collect, share, and protect your personal information. Please read this notice carefully to understand what we do. |
| What? | The types of personal information we collect and share depend on the product or service you have with us. This information can include:
◾ Social Security number and account balances
◾ transaction history and account transactions
◾ checking account information and wire transfer instructions
When you are no longer our customer, we continue to share your information as described in this notice. |
| How? | All financial companies need to share customers’ personal information to run their everyday business. In the section below, we list the reasons financial companies can share their customers’ personal information; the reasons J.P. Morgan Funds chooses to share; and whether you can limit this sharing. |
| Reasons we can share your personal information | Does J.P. Morgan Funds share? | Can you limit this sharing? | ||
For our everyday business purposes — such as to process your transactions, maintain your account(s), respond to court orders and legal investigations, or report to credit bureaus | Yes | No | ||
For marketing purposes — to offer our products and services to you | Yes | No | ||
| For joint marketing with other financial companies | No | We don’t share | ||
For our affiliates’ everyday business purposes — information about your transactions and experiences | No | We don’t share | ||
For our affiliates’ everyday business purposes — information about your creditworthiness | No | We don’t share | ||
| For nonaffiliates to market to you | No | We don’t share |
| Questions? | Call 1-800-480-4111 or go to www.jpmorganfunds.com | |

Table of Contents
Page 2 |
| Who we are | ||
| Who is providing this notice? | J.P. Morgan Funds | |
| What we do | ||
| How does J.P. Morgan Funds protect my personal information? | To protect your personal information from unauthorized access and use, we use security measures that comply with federal law. These measures include computer safeguards and secured files and buildings. We authorize our employees to access your information only when they need it to do their work and we require companies that work for us to protect your information. | |
How does J.P. Morgan Funds collect my personal information? | We collect your personal information, for example, when you:
◾ open an account or provide contact information
◾ give us your account information or pay us by check
◾ make a wire transfer
We also collect your personal information from others, such as credit bureaus, affiliates and other companies. | |
| Why can’t I limit all sharing? | Federal law gives you the right to limit only
◾ sharing for affiliates’ everyday business purposes – information about your creditworthiness
◾ affiliates from using your information to market to you
◾ sharing for nonaffiliates to market to you
State laws and individual companies may give you additional rights to limit sharing. | |
| Definitions | ||
| Affiliates | Companies related by common ownership or control. They can be financial and nonfinancial companies.
◾ J.P. Morgan Funds does not share with our affiliates. | |
| Nonaffiliates | Companies not related by common ownership or control. They can be financial and nonfinancial companies.
◾ J.P. Morgan Funds does not share with nonaffiliates so they can market to you. | |
| Joint Marketing | A formal agreement between nonaffiliated financial companies that together market financial products or services to you.
◾ J.P. Morgan Funds doesn’t jointly market. | |
Table of Contents
J.P. Morgan Funds are distributed by JPMorgan Distribution Services, Inc., which is an affiliate of JPMorgan Chase & Co. Affiliates of JPMorgan Chase & Co. receive fees for providing various services to the funds.
Contact JPMorgan Distribution Services, Inc. at 1-800-480-4111 for a fund prospectus. You can also visit us at www.jpmorganfunds.com. Investors should carefully consider the investment objectives and risk as well as charges and expenses of the mutual fund before investing. The prospectus contains this and other information about the mutual fund. Read the prospectus carefully before investing.
Investors may obtain information about the Securities Investor Protection Corporation (SIPC), including the SIPC brochure by visiting www.sipc.org or by calling SIPC at 202-371-8300.
Each Fund files a complete schedule of its fund holdings for the first and third quarters of its fiscal year with the SEC on Form N-Q. The Funds’ Forms N-Q are available on the SEC’s website at http://www.sec.gov and may be reviewed and copied at the SEC’s Public Reference Room in Washington, DC. Information on the operation of the SEC’s Public Reference Room may be obtained by calling 1-800-SEC-0330. Shareholders may request the Form N-Q without charge by calling 1-800-480-4111 or by visiting the J.P. Morgan Funds’ website at www.jpmorganfunds.com.
A description of each Fund’s policies and procedures with respect to the disclosure of each Fund’s holdings is available in the prospectus and Statement of Additional Information.
A copy of proxy policies and procedures is available without charge upon request by calling 1-800-480-4111 and on the Funds’ website at www.jpmorganfunds.com. A description of such policies and procedures is on the SEC’s website at www.sec.gov. The Trustees have delegated the authority to vote proxies for securities owned by the Funds to the Adviser. A copy of the Funds’ voting record for the most recent 12-month period ended June 30 is available on the SEC’s website at www.sec.gov or at the Funds’ website at www.jpmorganfunds.com no later than August 31 of each year. The Funds’ proxy voting record will include, among other things, a brief description of the matter voted on for each fund security, and will state how each vote was cast, for example, for or against the proposal.
Table of Contents

J.P. Morgan Asset Management is the marketing name for the asset management businesses of JPMorgan Chase & Co. Those businesses include, but are not limited to, J.P. Morgan Investment Management Inc., Security Capital Research & Management Incorporated and J.P. Morgan Alternative Asset Management, Inc.
| © JPMorgan Chase & Co., 2017. All rights reserved. June 2017. | AN-INDEX-617 |
Table of Contents
Annual Report
J.P. Morgan Investor Funds
June 30, 2017
JPMorgan Investor Balanced Fund
JPMorgan Investor Conservative Growth Fund
JPMorgan Investor Growth Fund
JPMorgan Investor Growth & Income Fund

Table of Contents
Investments in a Fund are not deposits or obligations of, or guaranteed or endorsed by, any bank and are not insured or guaranteed by the FDIC, the Federal Reserve Board or any other government agency. You could lose money if you sell when a Fund’s share price is lower than when you invested.
Past performance is no guarantee of future performance. The general market views expressed in this report are opinions based on market and other conditions through the end of the reporting period and are subject to change without notice. These views are not intended to predict the future performance of a Fund or the securities markets. References to specific securities and their issuers are for illustrative purposes only and are not intended to be, and should not be interpreted as, recommendations to purchase or sell such securities. Such views are not meant as investment advice and may not be relied on as an indication of trading intent on behalf of any Fund.
Prospective investors should refer to the Funds’ prospectuses for a discussion of the Funds’ investment objectives, strategies and risks. Call J.P. Morgan Funds Service Center at 1-800-480-4111 for a prospectus containing more complete information about a Fund, including management fees and other expenses. Please read it carefully before investing.
Table of Contents
August 4, 2017 (Unaudited)
Dear Shareholder,
The current U.S. economic expansion entered its eighth year in 2017 and growth in developed and emerging market economies grew more synchronized even as U.S. growth showed some signs of easing. Global financial markets generally benefitted from steady economic growth amid an environment of low inflation, low volatility and rising corporate profits.
 |
“In the U.S., the continued economic expansion, muted inflation, corporate earnings growth and historically low volatility in financial markets helped to drive key equity market indexes to multiple record closing highs throughout the past twelve months.” |
While economic growth in the U.S. and China largely drove the global recovery throughout 2016, by June 2017 the world’s other leading economies had picked up sufficiently enough for the Organization for Economic Co-operation and Development to forecast global growth at 3.5% in 2017 and 3.6% in 2018.
U.S. gross domestic product (GDP) growth slowed to 1.2% in the first quarter of 2017 from 2.5% and 3.5% growth in the fourth quarter and third quarters of 2016, respectively. Meanwhile, the U.S. unemployment rate continued its downward trend throughout the past twelve months, dropping to 4.4% in June 2017 from 4.9% one year earlier. In response to these numbers, along with nascent signs of price inflation, the U.S. Federal Reserve (the “Fed”) raised interest rates in December 2016 and again in June 2017 and signaled it would raise rates once more before the end of the year. Further, Fed Chairwoman Janet Yellen indicated she was prepared to begin partially unwinding the central bank’s $4.5 trillion balance sheet in assets purchased through its quantitative easing program. An increase in consumer spending helped second-quarter 2017 GDP climb by 2.6% from a year earlier.
Notably, by mid-2017 domestic price inflation had dropped below the Fed’s target of 2% growth and wage growth was below many economists’ expectations, the latter despite an environment of essentially full employment for U.S. workers. These trends — and the Fed’s acknowledgment of them — provided some near-term uncertainty about the central bank’s commitment to tightening monetary policy.
Throughout the twelve months ended June 30, 2017, global oil prices remained a key focal point for policy makers, economists and investors. Global crude prices reached 15-month highs in October 2016 and received further support from the Organization of Petroleum Exporting Countries’ December 2016 decision to curb production. However, continued oversupply of crude and natural gas, partly due to continued U.S. production, pushed the price of a barrel of benchmark West Texas Intermediate crude oil down to $46 by the end of June 2017.
Meanwhile, the leading economies of Europe continued to strengthen from what had been an anemic expansion. Annualized GDP for the 19 core euro area nations rose 1.9% in the first quarter of 2017 and 2.1% in the second quarter. The June 2017 aggregate unemployment rate for those nations fell to 9.1%, its lowest level since March 2009. Also, in separate elections in 2017, voters in the Netherlands and France largely rejected populist campaigns espousing policies to limit free trade and immigration. The election results provided another boost to global equity prices.
In the U.S., the continued economic expansion, muted inflation, corporate earnings growth and historically low volatility in financial markets helped to drive key equity market indexes to multiple record closing highs throughout the past twelve months. U.S. investors appeared to shrug off intermittent political and policy dramas emanating from Washington, D.C. and extended the run-up in U.S. equity prices into its eighth consecutive year — one of the longest on record.
Over the twelve month period, U.S. and foreign markets largely rewarded those who remained fully invested in financial markets and we believe the fundamental virtues of patience and diversification remain essential to prudent investment strategy.
We look forward to managing your investment needs for years to come. Should you have any questions, please visit www.jpmorganfunds.com or contact the J.P. Morgan Funds Service Center at 1-800-480-4111.
Sincerely yours,

George C.W. Gatch
CEO, Global Funds Management & Institutional,
J.P. Morgan Asset Management
| JUNE 30, 2017 | J.P. MORGAN INVESTOR FUNDS | 1 | ||||||
Table of Contents
J.P. Morgan Investor Funds
TWELVE MONTHS ENDED JUNE 30, 2017 (Unaudited)
Fund | Fund Return (With sales charge)* | Fund Return (Without sales charge)* | Bloomberg Barclays U.S. Intermediate Aggregate Index Return (formerly Barclays U.S. Intermediate Aggregate Index) (Broad-Based Fixed Income Benchmark) | Russell 3000 Index Return (Broad-Based Equity Benchmark) | Composite Benchmark Return | Fund Net Assets as of June 30, 2017 (in thousands) | ||||||||||||||||||
JPMorgan Investor Balanced Fund, Class A | 6.06% | 11.09% | (0.16 | )% | 18.51% | 8.87% | ** | $ | 4,972,116 | |||||||||||||||
JPMorgan Investor Conservative Growth Fund, Class A | 2.13% | 6.92% | (0.16 | )% | 18.51% | 5.19% | *** | $ | 3,790,678 | |||||||||||||||
JPMorgan Investor Growth Fund, Class A | 13.82% | 19.19% | (0.16 | )% | 18.51% | 16.53% | **** | $ | 2,558,086 | |||||||||||||||
JPMorgan Investor Growth & Income Fund, Class A | 9.68% | 14.82% | (0.16 | )% | 18.51% | 12.65% | ***** | $ | 2,972,592 | |||||||||||||||
Portfolio Composition by Asset Class******
Investor Balanced Fund | ||||
Fixed Income | 44.3 | % | ||
U.S. Equity | 35.1 | |||
International Equity | 15.8 | |||
Alternative Assets | 3.9 | |||
Short-Term Investment | 0.9 | |||
Investor Conservative Growth Fund | ||||
Fixed Income | 64.0 | % | ||
U.S. Equity | 21.2 | |||
International Equity | 9.5 | |||
Alternative Assets | 4.4 | |||
Short-Term Investment | 0.9 | |||
Investor Growth Fund | ||||
U.S. Equity | 62.9 | % | ||
International Equity | 25.0 | |||
Fixed Income | 9.7 | |||
Alternative Assets | 1.4 | |||
Short-Term Investment | 1.0 | |||
Investor Growth & Income Fund | ||||
U.S. Equity | 48.6 | % | ||
Fixed Income | 28.0 | |||
International Equity | 19.2 | |||
Alternative Assets | 3.4 | |||
Short-Term Investment | 0.8 | |||
| * | The return shown is based on net asset values calculated for shareholder transactions and may differ from the return shown in the financial highlights, which reflects adjustments made to the net asset values in accordance with accounting principles generally accepted in the United States of America. |
| ** | The Composite Benchmark is comprised of unmanaged indices that correspond to the Investor Balanced Fund’s model allocation and consists of the Bloomberg Barclays U.S. Intermediate Aggregate Index (50%) and the Russell 3000 Index (50%). |
| *** | The Composite Benchmark is comprised of unmanaged indices that correspond to the Investor Conservative Growth Fund’s model allocation and consists of the Bloomberg Barclays U.S. Intermediate Aggregate Index (70%) and the Russell 3000 Index (30%). |
| **** | The Composite Benchmark is comprised of unmanaged indices that correspond to the Investor Growth Fund’s model allocation and consists of the Russell 3000 Index (90%) and the Bloomberg Barclays U.S. Intermediate Aggregate Index (10%). |
| ***** | The Composite Benchmark is comprised of unmanaged indices that correspond to the Investor Growth & Income Fund’s model allocation and consists of the Russell 3000 Index (70%) and the Bloomberg Barclays U.S. Intermediate Aggregate Index (30%). |
| ****** | Percentages indicated are based on total investments as of June 30, 2017. The Funds’ portfolio composition is subject to change. |
| 2 | J.P. MORGAN INVESTOR FUNDS | JUNE 30, 2017 | ||||
Table of Contents
J.P. Morgan Investor Funds
TWELVE MONTHS ENDED JUNE 30, 2017 (Unaudited)
INVESTMENT OBJECTIVES*
The JPMorgan Investor Balanced Fund seeks high total return consistent with the preservation of capital by investing primarily in a diversified group of mutual funds within the same group of investment companies that invest primarily in equity and fixed income securities.
The JPMorgan Investor Conservative Growth Fund seeks income and capital appreciation by investing primarily in a diversified group of mutual funds within the same group of investment companies that invest primarily in fixed income and equity securities.
The JPMorgan Investor Growth Fund seeks long-term capital appreciation by investing primarily in a diversified group of mutual funds within the same group of investment companies that invest primarily in equity securities.
The JPMorgan Investor Growth & Income Fund seeks long-term capital appreciation and growth of income by investing primarily in a diversified group of mutual funds within the same group of investment companies that invest primarily in equity securities.
HOW DID THE MARKET PERFORM?
Overall, U.S. equity markets provided positive returns and key stock market indexes reached multiple record highs throughout the twelve month reporting period. Steady global economic growth, continued low inflation and strong corporate earnings all served to support equity prices, both in the U.S. and elsewhere. Emerging market equities generally outperformed developed market equities during the reporting period.
While emerging market bonds and high-yield U.S. bonds (also known as “junk bonds”) generally provided positive returns, investment grade corporate bonds and U.S. Treasury bonds underperformed equity securities amid investor expectations for rising interest rates in the U.S.
Notably, U.S. financial market volatility remained low throughout the reporting period, with a brief spike ahead of the November 2016 election. By the end of June 2017, the CBOE Volatility Index averaged 10.5 points, which was about half of its historical average.
WHAT WERE THE MAIN DRIVERS OF THE FUNDS’ PERFORMANCE?
In accordance with their model allocations, each of the JPMorgan Investor Funds (the “Investor Funds”) allocated its assets among fixed income, equity and alternative investments. For the twelve months ended June 30, 2017, each of the Investor
Funds outperformed the Bloomberg Barclays U.S. Intermediate Aggregate Index, the Investor Funds’ broad-based fixed income benchmark.
The JPMorgan Investor Growth Fund outperformed the Russell 3000 Index, the Investor Funds’ broad-based equity benchmark, mainly due to the performance of growth stocks during the reporting period. The remaining three Investor Funds underperformed the broad-based equity benchmark, mostly due to their positions in core bond securities, which were not held in the Russell 3000 Index and generally underperformed other asset classes.
Each Investor Fund’s performance is also compared to composite benchmarks, which are constructed of different percentages of the Investor Funds’ broad-based fixed income and equity benchmarks. These composite benchmarks correspond to each Investor Fund’s target allocation.
All four Investor Funds outperformed their respective composite benchmarks, mainly due to equity manager performance and to the Funds’ exposure to U.S. high yield debt that was not held in the composite benchmarks.
HOW WERE THE FUNDS POSITIONED?
Each Investor Fund invested in underlying JPMorgan Funds (“underlying funds”). The underlying funds invest in fixed income securities, equities and other alternative fixed income and equity strategies, such as below investment-grade, high-yield bonds, commodities, equity long/short and market-neutral strategies. Among equities, the underlying funds in which the Investor Funds invested were allocated among large-cap, mid-cap, small-cap, and international stocks. The Investor Funds’ portfolio managers made investments for each Investor Fund based on an evaluation of three components: underlying fund selection, tactical asset allocation and strategic asset allocation. The portfolio managers determined the strategic weight for each asset class in the Investor Funds by making investments that they believed would perform well over the long term, and maintained a level of volatility similar to that of each Investor Fund’s composite benchmark.
During the reporting period, the Investor Funds’ portfolio managers – through their investments in underlying funds – decreased their allocation to high-yield debt and continued to reduce their allocation to U.S. equity, particularly large cap stocks, amid rising equity prices. The managers increased their exposure to international equity as a result of an improved global earnings environment.
| * | The adviser seeks to achieve each Fund’s objective. There can be no guarantee it will be achieved. |
| JUNE 30, 2017 | J.P. MORGAN INVESTOR FUNDS | 3 | ||||||
Table of Contents
JPMorgan Investor Balanced Fund
FUND COMMENTARY
TWELVE MONTHS ENDED JUNE 30, 2017 (Unaudited)
AVERAGE ANNUAL TOTAL RETURNS AS OF JUNE 30, 2017 | ||||||||||||||||
| INCEPTION DATE OF CLASS | 1 YEAR | 5 YEAR | 10 YEAR | |||||||||||||
CLASS A SHARES | December 10, 1996 | |||||||||||||||
With Sales Charge* | 6.06 | % | 6.52 | % | 4.74 | % | ||||||||||
Without Sales Charge | 11.09 | 7.51 | 5.22 | |||||||||||||
CLASS C SHARES | July 1, 1997 | |||||||||||||||
With CDSC** | 9.40 | 6.92 | 4.65 | |||||||||||||
Without CDSC | 10.40 | 6.92 | 4.65 | |||||||||||||
CLASS I SHARES (FORMERLY SELECT CLASS SHARES) | December 10, 1996 | 11.36 | 7.76 | 5.48 | ||||||||||||
CLASS T SHARES | June 6, 2017 | |||||||||||||||
With Sales Charge*** | 8.23 | 6.88 | 4.89 | |||||||||||||
Without Sales Charge | 11.03 | 7.42 | 5.16 | |||||||||||||
| * | Sales Charge for Class A Shares is 4.50%. |
| ** | Assumes a 1% CDSC (contingent deferred sales charge) for the one year period and 0% CDSC thereafter. |
| *** | Sales Charge for Class T Shares is 2.50%. |
TEN YEAR PERFORMANCE (6/30/07 TO 6/30/17)
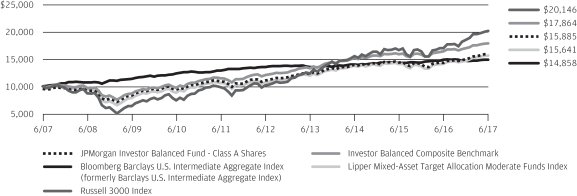
The performance quoted is past performance and is not a guarantee of future results. Mutual funds are subject to certain market risks. Investment returns and principal value of an investment will fluctuate so that an investor’s shares, when redeemed, may be worth more or less than their original cost. Current performance may be higher or lower than the performance data shown. For up-to-date month-end performance information please call 1-800-480-4111.
Returns for Class T Shares prior to its inception date are based on the performance of Class A Shares. The actual returns for Class T Shares would have been different than those shown because Class T Shares have different expenses than Class A Shares.
The graph illustrates comparative performance for $10,000 invested in Class A Shares of the JPMorgan Investor Balanced Fund, the Bloomberg Barclays U.S. Intermediate Aggregate Index, the Russell 3000 Index, the Investor Balanced Composite Benchmark and the Lipper Mixed-Asset Target Allocation Moderate Funds Index from June 30, 2007 to June 30, 2017. The performance of the Fund assumes reinvestment of all dividends and capital gain distributions, if any, and includes a sales charge. The performance of the broad-based securities indices and the Investor Balanced Composite Benchmark does not reflect the deduction of expenses or a sales charge associated with a mutual fund and has been adjusted to reflect reinvestment of all dividends and capital gain distributions of the securities included in the benchmark, if applicable. The performance of the Lipper Mixed-Asset Target Allocation Moderate Funds Index, which is not a broad-based securities index, includes expenses associated with a mutual fund, such as investment management fees. These expenses are not identical to the
expenses incurred by the Fund. The Bloomberg Barclays U.S. Intermediate Aggregate Index is an unmanaged index comprised of U.S. Government, mortgage, corporate, and asset-backed securities with maturities of one to 10 years. The Russell 3000 Index is an unmanaged index which measures the performance of the 3,000 largest U.S. companies based on total market capitalization, which represents approximately 98% of the investable U.S. equity market. The Investor Balanced Composite Benchmark is comprised of unmanaged indices that correspond to the Fund’s model allocation and consists of the Bloomberg Barclays U.S. Intermediate Aggregate Index (50%) and the Russell 3000 Index (50%). The Lipper Mixed-Asset Target Allocation Moderate Funds Index consists of funds that by portfolio practice maintain a mix of between 40% to 60% equity securities, with the remainder invested in bonds, cash and cash equivalents. Investors cannot invest directly in an index.
Class A Shares have a $500 minimum initial investment and carry a 4.50% sales charge.
Fund performance may reflect the waiver of the Fund’s fees and reimbursement of expenses for certain periods since the inception date. Without these waivers and reimbursements, performance would have been lower. Also, performance shown in this section does not reflect the deduction of taxes that a shareholder would pay on Fund distributions or redemptions of Fund shares.
The returns shown are based on net asset values calculated for shareholder transactions and may differ from the returns shown in the financial highlights, which reflect adjustments made to the net asset values in accordance with accounting principles generally accepted in the United States of America.
| 4 | J.P. MORGAN INVESTOR FUNDS | JUNE 30, 2017 | ||||
Table of Contents
JPMorgan Investor Conservative Growth Fund
FUND COMMENTARY
TWELVE MONTHS ENDED JUNE 30, 2017 (Unaudited)
AVERAGE ANNUAL TOTAL RETURNS AS OF JUNE 30, 2017 | ||||||||||||||||
| INCEPTION DATE OF CLASS | 1 YEAR | 5 YEAR | 10 YEAR | |||||||||||||
CLASS A SHARES | December 10, 1996 | |||||||||||||||
With Sales Charge* | 2.13 | % | 4.30 | % | 4.12 | % | ||||||||||
Without Sales Charge | 6.92 | 5.26 | 4.60 | |||||||||||||
CLASS C SHARES | July 1, 1997 | |||||||||||||||
With CDSC** | 5.40 | 4.72 | 4.04 | |||||||||||||
Without CDSC | 6.40 | 4.72 | 4.04 | |||||||||||||
CLASS I SHARES (FORMERLY SELECT CLASS SHARES) | December 10, 1996 | 7.22 | 5.52 | 4.86 | ||||||||||||
CLASS T SHARES | June 6, 2017 | |||||||||||||||
With Sales Charge*** | 4.23 | 4.67 | 4.29 | |||||||||||||
Without Sales Charge | 6.93 | 5.19 | 4.56 | |||||||||||||
| * | Sales Charge for Class A Shares is 4.50%. |
| ** | Assumes a 1% CDSC (contingent deferred sales charge) for the one year period and 0% CDSC thereafter. |
| *** | Sales Charge for Class T Shares is 2.50%. |
TEN YEAR PERFORMANCE (6/30/07 TO 6/30/17)
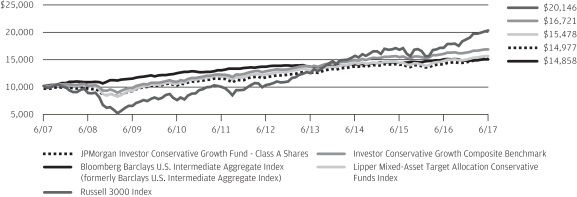
The performance quoted is past performance and is not a guarantee of future results. Mutual funds are subject to certain market risks. Investment returns and principal value of an investment will fluctuate so that an investor’s shares, when redeemed, may be worth more or less than their original cost. Current performance may be higher or lower than the performance data shown. For up-to-date month-end performance information please call 1-800-480-4111.
Returns for Class T Shares prior to its inception date are based on the performance of Class A Shares. The actual returns for Class T Shares would have been different than those shown because Class T Shares have different expenses than Class A Shares.
The graph illustrates comparative performance for $10,000 invested in Class A Shares of the JPMorgan Investor Conservative Growth Fund, the Bloomberg Barclays U.S. Intermediate Aggregate Index, the Russell 3000 Index, the Investor Conservative Growth Composite Benchmark, and the Lipper Mixed-Asset Target Allocation Conservative Funds Index from June 30, 2007 to June 30, 2017. The performance of the Fund assumes reinvestment of all dividends and capital gain distributions, if any, and includes a sales charge. The performance of the broad-based securities indices and the Investor Conservative Growth Composite Benchmark does not reflect the deduction of expenses or a sales charge associated with a mutual fund and has been adjusted to reflect reinvestment of all dividends and capital gain distributions of the securities included in the benchmark, if applicable. The performance of the Lipper Mixed-Asset Target Allocation Conservative Funds Index, which is not a broad-based securities index, includes expenses associated with a mutual fund, such as investment management fees. These expenses are not identical to the
expenses incurred by the Fund. The Bloomberg Barclays U.S. Intermediate Aggregate Index is an unmanaged index comprised of U.S. Government, mortgage, corporate, and asset-backed securities with maturities of one to 10 years. The Russell 3000 Index is an unmanaged index which measures the performance of the 3,000 largest U.S. companies based on total market capitalization, which represents approximately 98% of the investable U.S. equity market. The Investor Conservative Growth Composite Benchmark is comprised of unmanaged indices that correspond to the Fund’s model allocation and consists of the Bloomberg Barclays U.S. Intermediate Aggregate Index (70%) and the Russell 3000 Index (30%). The Lipper Mixed-Asset Target Allocation Conservative Funds Index consists of funds that by portfolio practice maintain a mix of between 20% to 40% equity securities, with the remainder invested in bonds, cash and cash equivalents. Investors cannot invest directly in an index.
Class A Shares have a $500 minimum initial investment and carry a 4.50% sales charge.
Fund performance may reflect the waiver of the Fund’s fees and reimbursement of expenses for certain periods since the inception date. Without these waivers and reimbursements, performance would have been lower. Also, performance shown in this section does not reflect the deduction of taxes that a shareholder would pay on Fund distributions or redemptions of Fund shares.
The returns shown are based on net asset values calculated for shareholder transactions and may differ from the returns shown in the financial highlights, which reflect adjustments made to the net asset values in accordance with accounting principles generally accepted in the United States of America.
| JUNE 30, 2017 | J.P. MORGAN INVESTOR FUNDS | 5 | ||||||
Table of Contents
JPMorgan Investor Growth Fund
FUND COMMENTARY
TWELVE MONTHS ENDED JUNE 30, 2017 (Unaudited)
AVERAGE ANNUAL TOTAL RETURNS AS OF JUNE 30, 2017 | ||||||||||||||
| INCEPTION DATE OF CLASS | 1 YEAR | 5 YEAR | 10 YEAR | |||||||||||
CLASS A SHARES | December 10, 1996 | |||||||||||||
With Sales Charge* | 13.82 | % | 10.82 | % | 5.30 | % | ||||||||
Without Sales Charge | 19.19 | 11.84 | 5.79 | |||||||||||
CLASS C SHARES | July 1, 1997 | |||||||||||||
With CDSC** | 17.47 | 11.24 | 5.19 | |||||||||||
Without CDSC | 18.47 | 11.24 | 5.19 | |||||||||||
CLASS I SHARES (FORMERLY SELECT CLASS SHARES) | December 10, 1996 | 19.46 | 12.14 | 6.05 | ||||||||||
CLASS T SHARES | June 6, 2017 | |||||||||||||
With Sales Charge*** | 16.20 | 11.19 | 5.47 | |||||||||||
Without Sales Charge | 19.16 | 11.76 | 5.74 | |||||||||||
| * | Sales Charge for Class A Shares is 4.50%. |
| ** | Assumes a 1% CDSC (contingent deferred sales charge) for the one year period and 0% CDSC thereafter. |
| *** | Sales Charge for Class T Shares is 2.50%. |
TEN YEAR PERFORMANCE (6/30/07 TO 6/30/17)
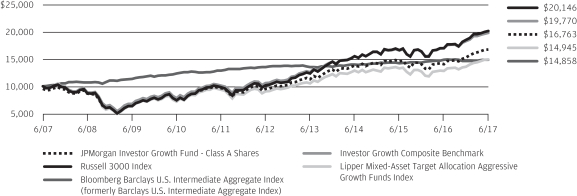
The performance quoted is past performance and is not a guarantee of future results. Mutual funds are subject to certain market risks. Investment returns and principal value of an investment will fluctuate so that an investor’s shares, when redeemed, may be worth more or less than their original cost. Current performance may be higher or lower than the performance data shown. For up-to-date month-end performance information please call 1-800-480-4111.
Returns for Class T Shares prior to its inception date are based on the performance of Class A Shares. The actual returns for Class T Shares would have been different than those shown because Class T Shares have different expenses than Class A Shares.
The graph illustrates comparative performance for $10,000 invested in Class A Shares of the JPMorgan Investor Growth Fund, the Russell 3000 Index, the Bloomberg Barclays U.S. Intermediate Aggregate Index, the Investor Growth Composite Benchmark and the Lipper Mixed-Asset Target Allocation Aggressive Growth Funds Index from June 30, 2007 to June 30, 2017. The performance of the Fund assumes reinvestment of all dividends and capital gain distributions, if any, and includes a sales charge. The performance of the broad-based securities indices and the Investor Growth Composite Benchmark does not reflect the deduction of expenses or a sales charge associated with a mutual fund and has been adjusted to reflect reinvestment of all dividends and capital gain distributions of the securities included in the benchmark, if applicable. The performance of the Lipper Mixed-Asset Target Allocation Aggressive Growth Funds Index, which is not a broad-based securities index, includes expenses associated with a mutual fund, such as investment management fees. These expenses are not identical to the expenses incurred by the Fund. The Russell
3000 Index is an unmanaged index which measures the performance of the 3,000 largest U.S. companies based on total market capitalization, which represents approximately 98% of the investable U.S. equity market. The Bloomberg Barclays U.S. Intermediate Aggregate Index is an unmanaged index comprised of U.S. Government, mortgage, corporate, and asset-backed securities with maturities of one to 10 years. The Investor Growth Composite Benchmark is comprised of unmanaged indices that correspond to the Fund’s model allocation and consists of the Russell 3000 Index (90%) and the Bloomberg Barclays U.S. Intermediate Aggregate Index (10%). The Lipper Mixed-Asset Target Allocation Aggressive Growth Funds Index consists of funds that invest in a variety of market capitalization ranges without concentrating 75% of their equity assets in any one market capitalization range over an extended period of time. Investors cannot invest directly in an index.
Class A Shares have a $500 minimum initial investment and carry a 4.50% sales charge.
Fund performance may reflect the waiver of the Fund’s fees and reimbursement of expenses for certain periods since the inception date. Without these waivers and reimbursements, performance would have been lower. Also, performance shown in this section does not reflect the deduction of taxes that a shareholder would pay on Fund distributions or redemptions of Fund shares.
The returns shown are based on net asset values calculated for shareholder transactions and may differ from the returns shown in the financial highlights, which reflect adjustments made to the net asset values in accordance with accounting principles generally accepted in the United States of America.
| 6 | J.P. MORGAN INVESTOR FUNDS | JUNE 30, 2017 | ||||
Table of Contents
JPMorgan Investor Growth & Income Fund
FUND COMMENTARY
TWELVE MONTHS ENDED JUNE 30, 2017 (Unaudited)
AVERAGE ANNUAL TOTAL RETURNS AS OF JUNE 30, 2017 | ||||||||||||||||
| INCEPTION DATE OF CLASS | 1 YEAR | 5 YEAR | 10 YEAR | |||||||||||||
CLASS A SHARES | December 10, 1996 | |||||||||||||||
With Sales Charge* | 9.68 | % | 8.31 | % | 4.91 | % | ||||||||||
Without Sales Charge | 14.82 | 9.31 | 5.40 | |||||||||||||
CLASS C SHARES | July 1, 1997 | |||||||||||||||
With CDSC** | 13.17 | 8.74 | 4.82 | |||||||||||||
Without CDSC | 14.17 | 8.74 | 4.82 | |||||||||||||
CLASS I SHARES (FORMERLY SELECT CLASS SHARES) | December 10, 1996 | 15.07 | 9.60 | 5.66 | ||||||||||||
CLASS T SHARES | June 6, 2017 | |||||||||||||||
With Sales Charge*** | 11.94 | 8.68 | 5.07 | |||||||||||||
Without Sales Charge | 14.78 | 9.23 | 5.34 | |||||||||||||
| * | Sales Charge for Class A Shares is 4.50%. |
| ** | Assumes a 1% CDSC (contingent deferred sales charge) for the one year period and 0% CDSC thereafter. |
| *** | Sales Charge for Class T Shares is 2.50%. |
TEN YEAR PERFORMANCE (6/30/07 TO 6/30/17)
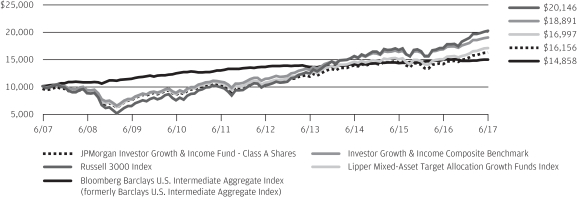
The performance quoted is past performance and is not a guarantee of future results. Mutual funds are subject to certain market risks. Investment returns and principal value of an investment will fluctuate so that an investor’s shares, when redeemed, may be worth more or less than their original cost. Current performance may be higher or lower than the performance data shown. For up-to-date month-end performance information please call 1-800-480-4111.
Returns for Class T Shares prior to its inception date are based on the performance of Class A Shares. The actual returns for Class T Shares would have been different than those shown because Class T Shares have different expenses than Class A Shares.
The graph illustrates comparative performance for $10,000 invested in Class A Shares of the JPMorgan Investor Growth & Income Fund, the Russell 3000 Index, the Bloomberg Barclays U.S. Intermediate Aggregate Index, the Investor Growth & Income Composite Benchmark and the Lipper Mixed-Asset Target Allocation Growth Funds Index from June 30, 2007 to June 30, 2017. The performance of the Fund assumes reinvestment of all dividends and capital gain distributions, if any, and includes a sales charge. The performance of the broad-based securities indices and the Investor Growth & Income Composite Benchmark does not reflect the deduction of expenses or a sales charge associated with a mutual fund and has been adjusted to reflect reinvestment of all dividends and capital gain distributions of the securities included in the benchmark, if applicable. The performance of the Lipper Mixed-Asset Target Allocation Growth Funds Index, which is not a broad-based securities index, includes expenses associated with a mutual fund, such as investment management fees. These expenses are not
identical to the expenses incurred by the Fund. The Russell 3000 Index is an unmanaged index which measures the performance of the 3,000 largest U.S. companies based on total market capitalization, which represents approximately 98% of the investable U.S. equity market. The Bloomberg Barclays U.S. Intermediate Aggregate Index is an unmanaged index comprised of U.S. Government, mortgage, corporate, and asset-backed securities with maturities of one to 10 years. The Investor Growth & Income Composite Benchmark is comprised of unmanaged indices that correspond to the Fund’s model allocation and consists of the Russell 3000 Index (70%) and the Bloomberg Barclays U.S. Intermediate Aggregate Index (30%). The Lipper Mixed-Asset Target Allocation Growth Funds Index consists of funds that by portfolio practice maintain a mix of between 60% to 80% equity securities, with the remainder invested in bonds, cash and cash equivalents. Investors cannot invest directly in an index.
Class A Shares have a $500 minimum initial investment and carry a 4.50% sales charge.
Fund performance may reflect the waiver of the Fund’s fees and reimbursement of expenses for certain periods since the inception date. Without these waivers and reimbursements, performance would have been lower. Also, performance shown in this section does not reflect the deduction of taxes that a shareholder would pay on Fund distributions or redemptions of Fund shares.
The returns shown are based on net asset values calculated for shareholder transactions and may differ from the returns shown in the financial highlights, which reflect adjustments made to the net asset values in accordance with accounting principles generally accepted in the United States of America.
| JUNE 30, 2017 | J.P. MORGAN INVESTOR FUNDS | 7 | ||||||
Table of Contents
JPMorgan Investor Balanced Fund
SCHEDULE OF PORTFOLIO INVESTMENTS
AS OF JUNE 30, 2017
(Amounts in thousands)
| SHARES | SECURITY DESCRIPTION | VALUE($) | ||||||
Investment Companies — 98.9% (b) | ||||||||
Alternative Assets — 3.8% |
| |||||||
| 4,850 | JPMorgan Multi-Cap Market Neutral Fund, Class I Shares (a) | 49,614 | ||||||
| 3,257 | JPMorgan Research Market Neutral Fund, Class L Shares (a) | 49,629 | ||||||
| 5,983 | JPMorgan Systematic Alpha Fund, Class R6 Shares | 91,901 | ||||||
|
| |||||||
Total Alternative Assets | 191,144 | |||||||
|
| |||||||
Fixed Income — 44.2% |
| |||||||
| 74,324 | JPMorgan Core Bond Fund, Class R6 Shares | 864,389 | ||||||
| 60,477 | JPMorgan Core Plus Bond Fund, Class R6 Shares | 500,148 | ||||||
| 6,049 | JPMorgan Emerging Markets Debt Fund, Class R6 Shares | 49,783 | ||||||
| 17,299 | JPMorgan Floating Rate Income Fund, Class R6 Shares | 162,788 | ||||||
| 26,885 | JPMorgan High Yield Fund, Class R6 Shares | 200,025 | ||||||
| 7,551 | JPMorgan Inflation Managed Bond Fund, Class R6 Shares | 77,323 | ||||||
| 20,504 | JPMorgan Limited Duration Bond Fund, Class R6 Shares | 205,654 | ||||||
| 8,273 | JPMorgan Strategic Income Opportunities Fund, Class R5 Shares | 96,465 | ||||||
| 4,284 | JPMorgan Unconstrained Debt Fund, Class R6 Shares | 42,843 | ||||||
|
| |||||||
Total Fixed Income | 2,199,418 | |||||||
|
| |||||||
International Equity — 15.8% |
| |||||||
| 4,852 | JPMorgan Emerging Economies Fund, Class R6 Shares | 64,143 | ||||||
| 2,524 | JPMorgan Emerging Markets Equity Fund, Class R6 Shares | 65,093 | ||||||
| 7,936 | JPMorgan Global Research Enhanced Index Fund, Class I Shares | 164,433 | ||||||
| 5,132 | JPMorgan International Equity Fund, Class R6 Shares | 85,137 | ||||||
| 15,442 | JPMorgan International Research Enhanced Equity Fund, Class I Shares | 275,639 | ||||||
| 4,600 | JPMorgan Intrepid European Fund, Class L Shares | 119,913 | ||||||
| 700 | JPMorgan Latin America Fund, Class R6 Shares | 10,122 | ||||||
|
| |||||||
Total International Equity | 784,480 | |||||||
|
| |||||||
| SHARES | SECURITY DESCRIPTION | VALUE($) | ||||||
U.S. Equity — 35.1% |
| |||||||
| 3,039 | JPMorgan Dynamic Growth Fund, Class R5 Shares (a) | 98,716 | ||||||
| 5,812 | JPMorgan Equity Income Fund, Class R6 Shares | 92,523 | ||||||
| 8,582 | JPMorgan Intrepid America Fund, Class R6 Shares | 337,614 | ||||||
| 3,474 | JPMorgan Intrepid Growth Fund, Class R6 Shares | 169,306 | ||||||
| 4,167 | JPMorgan Intrepid Mid Cap Fund, Class R6 Shares | 96,886 | ||||||
| 1,668 | JPMorgan Large Cap Growth Fund, Class R6 Shares (a) | 65,438 | ||||||
| 8,412 | JPMorgan Large Cap Value Fund, Class R6 Shares | 128,533 | ||||||
| 13,635 | JPMorgan Market Expansion Enhanced Index Fund, Class I Shares | 158,985 | ||||||
| 728 | JPMorgan Small Cap Value Fund, Class R6 Shares | 22,448 | ||||||
| 30,316 | JPMorgan U.S. Equity Fund, Class R6 Shares | 481,111 | ||||||
| 2,758 | JPMorgan Value Advantage Fund, Class R6 Shares | 92,691 | ||||||
|
| |||||||
Total U.S. Equity | 1,744,251 | |||||||
|
| |||||||
Total Investment Companies | 4,919,293 | |||||||
|
| |||||||
Short-Term Investment — 0.9% | ||||||||
Investment Company — 0.9% |
| |||||||
| 44,804 | JPMorgan U.S. Government Money Market Fund, Institutional Class, 0.840% (b) (l) | 44,804 | ||||||
|
| |||||||
Total Investments — 99.8% | 4,964,097 | |||||||
Other Assets in Excess of | 8,019 | |||||||
|
| |||||||
NET ASSETS — 100.0% | $ | 4,972,116 | ||||||
|
| |||||||
Percentages indicated are based on net assets.
SEE NOTES TO FINANCIAL STATEMENTS.
| 8 | J.P. MORGAN INVESTOR FUNDS | JUNE 30, 2017 | ||||
Table of Contents
JPMorgan Investor Conservative Growth Fund
SCHEDULE OF PORTFOLIO INVESTMENTS
AS OF JUNE 30, 2017
(Amounts in thousands)
| SHARES | SECURITY DESCRIPTION | VALUE($) | ||||||
Investment Companies — 99.0% (b) | ||||||||
Alternative Assets — 4.4% |
| |||||||
| 3,741 | JPMorgan Multi-Cap Market Neutral Fund, Class I Shares (a) | 38,275 | ||||||
| 2,494 | JPMorgan Research Market Neutral Fund, Class L Shares (a) | 38,011 | ||||||
| 5,971 | JPMorgan Systematic Alpha Fund, Class R6 Shares | 91,720 | ||||||
|
| |||||||
Total Alternative Assets | 168,006 | |||||||
|
| |||||||
Fixed Income — 63.9% |
| |||||||
| 88,715 | JPMorgan Core Bond Fund, Class R6 Shares | 1,031,757 | ||||||
| 58,943 | JPMorgan Core Plus Bond Fund, Class R6 Shares | 487,454 | ||||||
| 4,622 | JPMorgan Emerging Markets Debt Fund, Class R6 Shares | 38,039 | ||||||
| 15,211 | JPMorgan Floating Rate Income Fund, Class R6 Shares | 143,137 | ||||||
| 3,751 | JPMorgan Government Bond Fund, Class R6 Shares | 39,574 | ||||||
| 16,081 | JPMorgan High Yield Fund, Class R6 Shares | 119,641 | ||||||
| 7,410 | JPMorgan Income Fund, Class R6 Shares | 70,397 | ||||||
| 6,965 | JPMorgan Inflation Managed Bond Fund, Class R6 Shares | 71,322 | ||||||
| 31,245 | JPMorgan Limited Duration Bond Fund, Class R6 Shares | 313,389 | ||||||
| 6,157 | JPMorgan Strategic Income Opportunities Fund, Class R5 Shares | 71,794 | ||||||
| 3,588 | JPMorgan Unconstrained Debt Fund, Class R6 Shares | 35,884 | ||||||
|
| |||||||
Total Fixed Income | 2,422,388 | |||||||
|
| |||||||
International Equity — 9.5% |
| |||||||
| 2,878 | JPMorgan Emerging Economies Fund, Class R6 Shares | 38,041 | ||||||
| 1,475 | JPMorgan Emerging Markets Equity Fund, Class R6 Shares | 38,035 | ||||||
| 2,211 | JPMorgan Global Research Enhanced Index Fund, Class I Shares | 45,813 | ||||||
| 2,687 | JPMorgan International Equity Fund, Class R6 Shares | 44,583 | ||||||
| 8,067 | JPMorgan International Research Enhanced Equity Fund, Class I Shares | 143,997 | ||||||
| 1,900 | JPMorgan Intrepid European Fund, Class L Shares | 49,537 | ||||||
|
| |||||||
Total International Equity | 360,006 | |||||||
|
| |||||||
| SHARES | SECURITY DESCRIPTION | VALUE($) | ||||||
U.S. Equity — 21.2% | ||||||||
| 1,368 | JPMorgan Dynamic Growth Fund, Class R5 Shares (a) | 44,445 | ||||||
| 4,310 | JPMorgan Equity Income Fund, Class R6 Shares | 68,607 | ||||||
| 5,166 | JPMorgan Intrepid America Fund, Class R6 Shares | 203,213 | ||||||
| 2,033 | JPMorgan Intrepid Growth Fund, Class R6 Shares | 99,108 | ||||||
| 1,638 | JPMorgan Large Cap Value Fund, Class R6 Shares | 25,031 | ||||||
| 4,220 | JPMorgan Market Expansion Enhanced Index Fund, Class I Shares | 49,201 | ||||||
| 1,192 | JPMorgan Mid Cap Growth Fund, Class R6 Shares (a) | 38,378 | ||||||
| 797 | JPMorgan Small Cap Value Fund, Class R6 Shares | 24,562 | ||||||
| 11,600 | JPMorgan U.S. Equity Fund, Class R6 Shares | 184,085 | ||||||
| 1,931 | JPMorgan Value Advantage Fund, Class R6 Shares | 64,890 | ||||||
|
| |||||||
Total U.S. Equity | 801,520 | |||||||
|
| |||||||
Total Investment Companies | 3,751,920 | |||||||
|
| |||||||
Short-Term Investment — 0.9% | ||||||||
Investment Company — 0.9% |
| |||||||
| 34,329 | JPMorgan U.S. Government Money Market Fund, Institutional Class, 0.840% (b) (l) | 34,329 | ||||||
|
| |||||||
Total Investments — 99.9% | 3,786,249 | |||||||
Other Assets in Excess of | 4,429 | |||||||
|
| |||||||
NET ASSETS — 100.0% | $ | 3,790,678 | ||||||
|
| |||||||
Percentages indicated are based on net assets.
SEE NOTES TO FINANCIAL STATEMENTS.
| JUNE 30, 2017 | J.P. MORGAN INVESTOR FUNDS | 9 | ||||||
Table of Contents
JPMorgan Investor Growth Fund
SCHEDULE OF PORTFOLIO INVESTMENTS
AS OF JUNE 30, 2017
(Amounts in thousands)
| SHARES | SECURITY DESCRIPTION | VALUE($) | ||||||
Investment Companies — 98.9% (b) | ||||||||
Alternative Assets — 1.4% | ||||||||
| 1,131 | JPMorgan Commodities Strategy Fund, Class R6 Shares (a) | 9,819 | ||||||
| 1,680 | JPMorgan Systematic Alpha Fund, Class R6 Shares | 25,805 | ||||||
|
| |||||||
Total Alternative Assets | 35,624 | |||||||
|
| |||||||
Fixed Income — 9.6% |
| |||||||
| 9,827 | JPMorgan Core Bond Fund, Class R6 Shares | 114,284 | ||||||
| 3,408 | JPMorgan Core Plus Bond Fund, Class R6 Shares | 28,184 | ||||||
| 1,560 | JPMorgan Emerging Markets Debt Fund, Class R6 Shares | 12,842 | ||||||
| 2,299 | JPMorgan Floating Rate Income Fund, Class R6 Shares | 21,633 | ||||||
| 9,449 | JPMorgan High Yield Fund, Class R6 Shares | 70,302 | ||||||
| 8 | JPMorgan Inflation Managed Bond Fund, Class R6 Shares | 83 | ||||||
|
| |||||||
Total Fixed Income | 247,328 | |||||||
|
| |||||||
International Equity — 25.0% |
| |||||||
| 3,732 | JPMorgan Emerging Economies Fund, Class R6 Shares | 49,335 | ||||||
| 1,935 | JPMorgan Emerging Markets Equity Fund, Class R6 Shares | 49,903 | ||||||
| 3,494 | JPMorgan Global Research Enhanced Index Fund, Class I Shares | 72,386 | ||||||
| 6,958 | JPMorgan International Equity Fund, Class R6 Shares | 115,430 | ||||||
| 10,106 | JPMorgan International Research Enhanced Equity Fund, Class I Shares | 180,397 | ||||||
| 3,877 | JPMorgan International Unconstrained Equity Fund, Class R6 Shares | 76,454 | ||||||
| 3,318 | JPMorgan Intrepid European Fund, Class L Shares | 86,498 | ||||||
| 692 | JPMorgan Latin America Fund, Class R6 Shares | 10,006 | ||||||
|
| |||||||
Total International Equity | 640,409 | |||||||
|
| |||||||
| SHARES | SECURITY DESCRIPTION | VALUE($) | ||||||
U.S. Equity — 62.9% |
| |||||||
| 549 | JPMorgan Dynamic Growth Fund, Class R5 Shares (a) | 17,839 | ||||||
| 2,898 | JPMorgan Equity Income Fund, Class R6 Shares | 46,135 | ||||||
| 7,639 | JPMorgan Intrepid America Fund, Class R6 Shares | 300,516 | ||||||
| 2,614 | JPMorgan Intrepid Growth Fund, Class R6 Shares | 127,427 | ||||||
| 1,938 | JPMorgan Intrepid Mid Cap Fund, Class R6 Shares | 45,064 | ||||||
| 5,073 | JPMorgan Large Cap Growth Fund, Class R6 Shares (a) | 199,016 | ||||||
| 16,867 | JPMorgan Large Cap Value Fund, Class R6 Shares | 257,728 | ||||||
| 12,299 | JPMorgan Market Expansion Enhanced Index Fund, Class I Shares | 143,402 | ||||||
| 1,041 | JPMorgan Mid Cap Growth Fund, Class R6 Shares (a) | 33,536 | ||||||
| 1,077 | JPMorgan Small Cap Value Fund, Class R6 Shares | 33,213 | ||||||
| 22,517 | JPMorgan U.S. Equity Fund, Class R6 Shares | 357,350 | ||||||
| 1,414 | JPMorgan Value Advantage Fund, Class R6 Shares | 47,527 | ||||||
|
| |||||||
Total U.S. Equity | 1,608,753 | |||||||
|
| |||||||
Total Investment Companies | 2,532,114 | |||||||
|
| |||||||
Short-Term Investment — 1.0% | ||||||||
Investment Company — 1.0% |
| |||||||
| 24,595 | JPMorgan U.S. Government Money Market Fund, Institutional Class, 0.840% (b) (l) | 24,595 | ||||||
|
| |||||||
Total Investments — 99.9% | 2,556,709 | |||||||
Other Assets in Excess of | 1,377 | |||||||
|
| |||||||
NET ASSETS — 100.0% | $ | 2,558,086 | ||||||
|
| |||||||
Percentages indicated are based on net assets.
SEE NOTES TO FINANCIAL STATEMENTS.
| 10 | J.P. MORGAN INVESTOR FUNDS | JUNE 30, 2017 | ||||
Table of Contents
JPMorgan Investor Growth & Income Fund
SCHEDULE OF PORTFOLIO INVESTMENTS
AS OF JUNE 30, 2017
(Amounts in thousands)
| SHARES | SECURITY DESCRIPTION | VALUE($) | ||||||
Investment Companies — 99.0% (b) | ||||||||
Alternative Assets — 3.4% |
| |||||||
| 1,054 | JPMorgan Commodities Strategy Fund, Class R6 Shares (a) | 9,152 | ||||||
| 2,165 | JPMorgan Multi-Cap Market Neutral Fund, Class I Shares (a) | 22,149 | ||||||
| 1,472 | JPMorgan Research Market Neutral Fund, Class L Shares (a) | 22,440 | ||||||
| 3,072 | JPMorgan Systematic Alpha Fund, Class R6 Shares | 47,180 | ||||||
|
| |||||||
Total Alternative Assets | 100,921 | |||||||
|
| |||||||
Fixed Income — 28.0% |
| |||||||
| 26,807 | JPMorgan Core Bond Fund, Class R6 Shares | 311,768 | ||||||
| 22,637 | JPMorgan Core Plus Bond Fund, Class R6 Shares | 187,208 | ||||||
| 1,815 | JPMorgan Emerging Markets Debt Fund, Class R6 Shares | 14,941 | ||||||
| 10,382 | JPMorgan Floating Rate Income Fund, Class R6 Shares | 97,698 | ||||||
| 16,090 | JPMorgan High Yield Fund, Class R6 Shares | 119,711 | ||||||
| 3,978 | JPMorgan Inflation Managed Bond Fund, Class R6 Shares | 40,738 | ||||||
| 3,085 | JPMorgan Limited Duration Bond Fund, Class R6 Shares | 30,939 | ||||||
| 2,416 | JPMorgan Strategic Income Opportunities Fund, Class R5 Shares | 28,170 | ||||||
|
| |||||||
Total Fixed Income | 831,173 | |||||||
|
| |||||||
International Equity — 19.2% |
| |||||||
| 3,550 | JPMorgan Emerging Economies Fund, Class R6 Shares | 46,927 | ||||||
| 1,840 | JPMorgan Emerging Markets Equity Fund, Class R6 Shares | 47,446 | ||||||
| 5,028 | JPMorgan Global Research Enhanced Index Fund, Class I Shares | 104,179 | ||||||
| 4,860 | JPMorgan International Equity Fund, Class R6 Shares | 80,630 | ||||||
| 8,824 | JPMorgan International Research Enhanced Equity Fund, Class I Shares | 157,511 | ||||||
| 1,710 | JPMorgan International Unconstrained Equity Fund, Class R6 Shares | 33,729 | ||||||
| 3,512 | JPMorgan Intrepid European Fund, Class L Shares | 91,556 | ||||||
| 553 | JPMorgan Latin America Fund, Class R6 Shares | 7,995 | ||||||
|
| |||||||
Total International Equity | 569,973 | |||||||
|
| |||||||
| SHARES | SECURITY DESCRIPTION | VALUE($) | ||||||
U.S. Equity — 48.4% |
| |||||||
| 890 | JPMorgan Dynamic Growth Fund, Class R5 Shares (a) | 28,903 | ||||||
| 3,471 | JPMorgan Equity Income Fund, Class R6 Shares | 55,256 | ||||||
| 8,189 | JPMorgan Intrepid America Fund, Class R6 Shares | 322,151 | ||||||
| 1,987 | JPMorgan Intrepid Growth Fund, Class R6 Shares | 96,834 | ||||||
| 1,319 | JPMorgan Intrepid Mid Cap Fund, Class R6 Shares | 30,658 | ||||||
| 4,133 | JPMorgan Large Cap Growth Fund, Class R6 Shares (a) | 162,136 | ||||||
| 11,480 | JPMorgan Large Cap Value Fund, Class R6 Shares | 175,420 | ||||||
| 10,026 | JPMorgan Market Expansion Enhanced Index Fund, Class I Shares | 116,903 | ||||||
| 954 | JPMorgan Mid Cap Growth Fund, Class R6 Shares (a) | 30,734 | ||||||
| 1,232 | JPMorgan Small Cap Value Fund, Class R6 Shares | 37,972 | ||||||
| 20,677 | JPMorgan U.S. Equity Fund, Class R6 Shares | 328,150 | ||||||
| 1,637 | JPMorgan Value Advantage Fund, Class R6 Shares | 55,015 | ||||||
|
| |||||||
Total U.S. Equity | 1,440,132 | |||||||
|
| |||||||
Total Investment Companies | 2,942,199 | |||||||
|
| |||||||
Short-Term Investment — 0.8% | ||||||||
Investment Company — 0.8% |
| |||||||
| 24,385 | JPMorgan U.S. Government Money Market Fund, Institutional Class, 0.840% (b) (l) | 24,385 | ||||||
|
| |||||||
Total Investments — 99.8% | 2,966,584 | |||||||
Other Assets in Excess of | 6,008 | |||||||
|
| |||||||
NET ASSETS — 100.0% | $ | 2,972,592 | ||||||
|
| |||||||
Percentages indicated are based on net assets.
SEE NOTES TO FINANCIAL STATEMENTS.
| JUNE 30, 2017 | J.P. MORGAN INVESTOR FUNDS | 11 | ||||||
Table of Contents
J.P. Morgan Investor Funds
NOTES TO SCHEDULES OF PORTFOLIO INVESTMENTS
AS OF JUNE 30, 2017
| (a) | — Non-income producing security. | |
| (b) | — Investment in affiliate. Fund is registered under the Investment Company Act of 1940, as amended, and advised by J.P. Morgan Investment Management Inc. | |
| (l) | — The rate shown is the current yield as of June 30, 2017. |
Detailed information about investment portfolios of the underlying funds can be found in shareholder reports filed with the Securities and Exchange Commission (SEC) by each such underlying fund semi-annually on Form N-CSR and in certified portfolio holdings filed quarterly on Form N-Q, and are available for download from both the SEC’s as well as each respective underlying fund’s website. Detailed information about underlying J.P.Morgan Funds can also be found at www.jpmorganfunds.com or by calling 1-800-480-4111.
SEE NOTES TO FINANCIAL STATEMENTS.
| 12 | J.P. MORGAN INVESTOR FUNDS | JUNE 30, 2017 | ||||
Table of Contents
THIS PAGE IS INTENTIONALLY LEFT BLANK
| JUNE 30, 2017 | J.P. MORGAN INVESTOR FUNDS | 13 | ||||||
Table of Contents
STATEMENTS OF ASSETS AND LIABILITIES
AS OF JUNE 30, 2017
(Amounts in thousands, except per share amounts)
Investor Fund | Investor Conservative Growth Fund | Investor Growth Fund | Investor Growth & Income Fund | |||||||||||||
ASSETS: |
| |||||||||||||||
Investments in affiliates, at value | $ | 4,964,097 | $ | 3,786,249 | $ | 2,556,709 | $ | 2,966,584 | ||||||||
Receivables: | ||||||||||||||||
Investment securities sold | 14,446 | 11,020 | 3,583 | 10,423 | ||||||||||||
Fund shares sold | 2,258 | 1,038 | 1,353 | 1,200 | ||||||||||||
Dividends from affiliates | 29 | 231 | 16 | 17 | ||||||||||||
|
|
|
|
|
|
|
| |||||||||
Total Assets | 4,980,830 | 3,798,538 | 2,561,661 | 2,978,224 | ||||||||||||
|
|
|
|
|
|
|
| |||||||||
LIABILITIES: |
| |||||||||||||||
Payables: | ||||||||||||||||
Due to custodian | — | 209 | — | — | ||||||||||||
Distributions | 1,294 | 114 | 240 | 430 | ||||||||||||
Fund shares redeemed | 4,586 | 4,994 | 1,907 | 3,546 | ||||||||||||
Accrued liabilities: | ||||||||||||||||
Investment advisory fees | 115 | 41 | 65 | 76 | ||||||||||||
Administration fees | 231 | 153 | 138 | 155 | ||||||||||||
Distribution fees | 1,385 | 1,417 | 573 | 730 | ||||||||||||
Service fees | 620 | 575 | 325 | 368 | ||||||||||||
Custodian and accounting fees | 2 | 2 | 2 | 2 | ||||||||||||
Transfer agency fees | 111 | 63 | 196 | 144 | ||||||||||||
Other | 370 | 292 | 129 | 181 | ||||||||||||
|
|
|
|
|
|
|
| |||||||||
Total Liabilities | 8,714 | 7,860 | 3,575 | 5,632 | ||||||||||||
|
|
|
|
|
|
|
| |||||||||
Net Assets | $ | 4,972,116 | $ | 3,790,678 | $ | 2,558,086 | $ | 2,972,592 | ||||||||
|
|
|
|
|
|
|
| |||||||||
SEE NOTES TO FINANCIAL STATEMENTS.
| 14 | J.P. MORGAN INVESTOR FUNDS | JUNE 30, 2017 | ||||
Table of Contents
Investor Fund | Investor Conservative Growth Fund | Investor Growth Fund | Investor Growth & Income Fund | |||||||||||||
NET ASSETS: |
| |||||||||||||||
Paid-in-Capital | $ | 3,981,825 | $ | 3,281,091 | $ | 1,753,921 | $ | 2,205,688 | ||||||||
Accumulated undistributed (distributions in excess of) net investment income | 338 | 673 | 94 | 148 | ||||||||||||
Accumulated net realized gains (losses) | 86,716 | 64,614 | 71,216 | 27,949 | ||||||||||||
Net unrealized appreciation (depreciation) | 903,237 | 444,300 | 732,855 | 738,807 | ||||||||||||
|
|
|
|
|
|
|
| |||||||||
Total Net Assets | $ | 4,972,116 | $ | 3,790,678 | $ | 2,558,086 | $ | 2,972,592 | ||||||||
|
|
|
|
|
|
|
| |||||||||
Net Assets: |
| |||||||||||||||
Class A | $ | 3,430,816 | $ | 2,081,812 | $ | 1,937,119 | $ | 2,348,659 | ||||||||
Class C | 1,071,522 | 1,573,159 | 274,389 | 385,447 | ||||||||||||
Class I (formerly Select Class) | 469,758 | 135,687 | 346,558 | 238,466 | ||||||||||||
Class T | 20 | 20 | 20 | 20 | ||||||||||||
|
|
|
|
|
|
|
| |||||||||
Total | $ | 4,972,116 | $ | 3,790,678 | $ | 2,558,086 | $ | 2,972,592 | ||||||||
|
|
|
|
|
|
|
| |||||||||
Outstanding units of beneficial interest (shares) ($0.0001 par value; unlimited number of shares authorized): | ||||||||||||||||
Class A | 223,276 | 162,601 | 95,059 | 135,226 | ||||||||||||
Class C | 70,765 | 123,411 | 14,288 | 22,794 | ||||||||||||
Class I (formerly Select Class) | 30,522 | 10,540 | 16,684 | 13,935 | ||||||||||||
Class T | 1 | 2 | 1 | 1 | ||||||||||||
Net Asset Value (a): | ||||||||||||||||
Class A — Redemption price per share | $ | 15.37 | $ | 12.80 | $ | 20.38 | $ | 17.37 | ||||||||
Class C — Offering price per share (b) | 15.14 | 12.75 | 19.20 | 16.91 | ||||||||||||
Class I (formerly Select Class) — Offering and redemption price per share | 15.39 | 12.87 | 20.77 | 17.11 | ||||||||||||
Class T — Redemption price per share | 15.35 | 12.80 | 20.36 | 17.35 | ||||||||||||
Class A maximum sales charge | 4.50 | % | 4.50 | % | 4.50 | % | 4.50 | % | ||||||||
Class A maximum public offering price per share | $ | 16.09 | $ | 13.40 | $ | 21.34 | $ | 18.19 | ||||||||
|
|
|
|
|
|
|
| |||||||||
Class T maximum sales charge | 2.50 | % | 2.50 | % | 2.50 | % | 2.50 | % | ||||||||
Class T maximum public offering price per share | $ | 15.74 | $ | 13.13 | $ | 20.88 | $ | 17.79 | ||||||||
Cost of investments in affiliates | 4,060,860 | 3,341,949 | 1,823,854 | 2,227,777 | ||||||||||||
| (a) | Per share amounts may not recalculate due to rounding of net assets and/or shares outstanding. |
| (b) | Redemption price for Class C Shares varies based upon length of time the shares are held. |
SEE NOTES TO FINANCIAL STATEMENTS.
| JUNE 30, 2017 | J.P. MORGAN INVESTOR FUNDS | 15 | ||||||
Table of Contents
STATEMENTS OF OPERATIONS
FOR THE YEAR ENDED JUNE 30, 2017
(Amounts in thousands)
| Investor Balanced Fund | Investor Conservative Growth Fund | Investor Growth Fund | Investor Growth & Income Fund | |||||||||||||
INVESTMENT INCOME: |
| |||||||||||||||
Interest income from affiliates | $ | 4 | $ | 4 | $ | 2 | $ | 2 | ||||||||
Dividend income from affiliates | 110,058 | 96,113 | 36,986 | 56,991 | ||||||||||||
|
|
|
|
|
|
|
| |||||||||
Total investment income | 110,062 | 96,117 | 36,988 | 56,993 | ||||||||||||
|
|
|
|
|
|
|
| |||||||||
EXPENSES: |
| |||||||||||||||
Investment advisory fees | 2,654 | 2,068 | 1,274 | 1,563 | ||||||||||||
Administration fees | 3,026 | 2,440 | 1,650 | 1,936 | ||||||||||||
Distribution fees: | ||||||||||||||||
Class A | 9,334 | 5,787 | 4,891 | 6,205 | ||||||||||||
Class C | 8,507 | 12,625 | 2,097 | 3,084 | ||||||||||||
Class T | — | (a) | — | (a) | — | (a) | — | (a) | ||||||||
Service fees: | ||||||||||||||||
Class A | 9,334 | 5,787 | 4,891 | 6,205 | ||||||||||||
Class C | 2,836 | 4,208 | 699 | 1,028 | ||||||||||||
Class I (formerly Select Class) | 1,100 | 345 | 780 | 580 | ||||||||||||
Class T | — | (a) | — | (a) | — | (a) | — | (a) | ||||||||
Custodian and accounting fees | 22 | 15 | 20 | 21 | ||||||||||||
Professional fees | 80 | 64 | 52 | 56 | ||||||||||||
Trustees’ and Chief Compliance Officer’s fees | 37 | 36 | 32 | 34 | ||||||||||||
Printing and mailing costs | 460 | 357 | 239 | 282 | ||||||||||||
Registration and filing fees | 114 | 115 | 67 | 60 | ||||||||||||
Transfer agency fees (See Note 2.D.) | 435 | 244 | 684 | 534 | ||||||||||||
Sub-transfer agency fees (See Note 2.D.) | 1,112 | 834 | 819 | 844 | ||||||||||||
Other | 83 | 70 | 46 | 57 | ||||||||||||
|
|
|
|
|
|
|
| |||||||||
Total expenses | 39,134 | 34,995 | 18,241 | 22,489 | ||||||||||||
|
|
|
|
|
|
|
| |||||||||
Less fees waived | (6,160 | ) | (4,137 | ) | (4,198 | ) | (4,487 | ) | ||||||||
|
|
|
|
|
|
|
| |||||||||
Net expenses | 32,974 | 30,858 | 14,043 | 18,002 | ||||||||||||
|
|
|
|
|
|
|
| |||||||||
Net investment income (loss) | 77,088 | 65,259 | 22,945 | 38,991 | ||||||||||||
|
|
|
|
|
|
|
| |||||||||
REALIZED/UNREALIZED GAINS (LOSSES): | ||||||||||||||||
Net realized gain (loss) on investments in affiliates | 118,754 | 76,964 | 86,139 | 79,831 | ||||||||||||
Distributions of capital gains received from investment company affiliates | 64,589 | 24,878 | 65,108 | 59,914 | ||||||||||||
Change in net unrealized appreciation/depreciation of investments in affiliates | 294,383 | 100,710 | 271,856 | 253,578 | ||||||||||||
|
|
|
|
|
|
|
| |||||||||
Net realized/unrealized gains (losses) | 477,726 | 202,552 | 423,103 | 393,323 | ||||||||||||
|
|
|
|
|
|
|
| |||||||||
Change in net assets resulting from operations | $ | 554,814 | $ | 267,811 | $ | 446,048 | $ | 432,314 | ||||||||
|
|
|
|
|
|
|
| |||||||||
| (a) | Amount rounds to less than 500. |
SEE NOTES TO FINANCIAL STATEMENTS.
| 16 | J.P. MORGAN INVESTOR FUNDS | JUNE 30, 2017 | ||||
Table of Contents
STATEMENTS OF CHANGES IN NET ASSETS
FOR THE PERIODS INDICATED
(Amounts in thousands)
| Investor Balanced Fund | Investor Conservative Growth Fund | |||||||||||||||
Year Ended June 30, 2017 | Year Ended June 30, 2016 | Year Ended June 30, 2017 | Year Ended June 30, 2016 | |||||||||||||
CHANGE IN NET ASSETS RESULTING FROM | ||||||||||||||||
Net investment income (loss) | $ | 77,088 | $ | 78,989 | $ | 65,259 | $ | 66,695 | ||||||||
Net realized gain (loss) on investments in affiliates | 118,754 | (34,987 | ) | 76,964 | (4,763 | ) | ||||||||||
Distributions of capital gains received from investment company affiliates | 64,589 | 138,678 | 24,878 | 59,009 | ||||||||||||
Change in net unrealized appreciation/depreciation of investments in affiliates | 294,383 | (220,812 | ) | 100,710 | (94,409 | ) | ||||||||||
|
|
|
|
|
|
|
| |||||||||
Change in net assets resulting from operations | 554,814 | (38,132 | ) | 267,811 | 26,532 | |||||||||||
|
|
|
|
|
|
|
| |||||||||
DISTRIBUTIONS TO SHAREHOLDERS: | ||||||||||||||||
Class A | ||||||||||||||||
From net investment income | (58,955 | ) | (66,366 | ) | (41,832 | ) | (44,516 | ) | ||||||||
From net realized gains | (72,170 | ) | (121,890 | ) | (32,302 | ) | (58,389 | ) | ||||||||
Class C | ||||||||||||||||
From net investment income | (11,734 | ) | (14,208 | ) | (20,489 | ) | (23,185 | ) | ||||||||
From net realized gains | (22,004 | ) | (38,413 | ) | (23,339 | ) | (43,262 | ) | ||||||||
Class I (formerly Select Class) | ||||||||||||||||
From net investment income | (8,127 | ) | (7,936 | ) | (2,798 | ) | (2,667 | ) | ||||||||
From net realized gains | (8,132 | ) | (12,696 | ) | (1,870 | ) | (3,008 | ) | ||||||||
Class T (a) | ||||||||||||||||
From net investment income | — | (b) | — | — | (b) | — | ||||||||||
|
|
|
|
|
|
|
| |||||||||
Total distributions to shareholders | (181,122 | ) | (261,509 | ) | (122,630 | ) | (175,027 | ) | ||||||||
|
|
|
|
|
|
|
| |||||||||
CAPITAL TRANSACTIONS: | ||||||||||||||||
Change in net assets resulting from capital transactions | (802,511 | ) | 133,100 | (642,559 | ) | (79,747 | ) | |||||||||
|
|
|
|
|
|
|
| |||||||||
NET ASSETS: | ||||||||||||||||
Change in net assets | (428,819 | ) | (166,541 | ) | (497,378 | ) | (228,242 | ) | ||||||||
Beginning of period | 5,400,935 | 5,567,476 | 4,288,056 | 4,516,298 | ||||||||||||
|
|
|
|
|
|
|
| |||||||||
End of period | $ | 4,972,116 | $ | 5,400,935 | $ | 3,790,678 | $ | 4,288,056 | ||||||||
|
|
|
|
|
|
|
| |||||||||
Accumulated undistributed (distributions in | $ | 338 | $ | 298 | $ | 673 | $ | (143 | ) | |||||||
|
|
|
|
|
|
|
| |||||||||
| (a) | Commencement of offering of class of shares effective June 6, 2017. |
| (b) | Amount rounds to less than 500. |
SEE NOTES TO FINANCIAL STATEMENTS.
| JUNE 30, 2017 | J.P. MORGAN INVESTOR FUNDS | 17 | ||||||
Table of Contents
STATEMENTS OF CHANGES IN NET ASSETS
FOR THE PERIODS INDICATED (continued)
(Amounts in thousands)
| Investor Growth Fund | Investor Growth & Income Fund | |||||||||||||||
Year Ended June 30, 2017 | Year Ended June 30, 2016 | Year Ended June 30, 2017 | Year Ended June 30, 2016 | |||||||||||||
CHANGE IN NET ASSETS RESULTING FROM | ||||||||||||||||
Net investment income (loss) | $ | 22,945 | $ | 22,146 | $ | 38,991 | $ | 40,813 | ||||||||
Net realized gain (loss) on investments in affiliates | 86,139 | (3,929 | ) | 79,831 | (15,996 | ) | ||||||||||
Distributions of capital gains received from investment company affiliates | 65,108 | 113,224 | 59,914 | 108,419 | ||||||||||||
Change in net unrealized appreciation/depreciation of investments in affiliates | 271,856 | (223,185 | ) | 253,578 | (207,721 | ) | ||||||||||
|
|
|
|
|
|
|
| |||||||||
Change in net assets resulting from operations | 446,048 | (91,744 | ) | 432,314 | (74,485 | ) | ||||||||||
|
|
|
|
|
|
|
| |||||||||
DISTRIBUTIONS TO SHAREHOLDERS: | ||||||||||||||||
Class A | ||||||||||||||||
From net investment income | (19,734 | ) | (24,859 | ) | (33,847 | ) | (39,844 | ) | ||||||||
From net realized gains | (84,422 | ) | (94,493 | ) | (72,446 | ) | (94,772 | ) | ||||||||
Class C | ||||||||||||||||
From net investment income | (2,132 | ) | (2,839 | ) | (3,437 | ) | (4,619 | ) | ||||||||
From net realized gains | (12,736 | ) | (14,281 | ) | (12,299 | ) | (16,453 | ) | ||||||||
Class I (formerly Select Class) | ||||||||||||||||
From net investment income | (3,798 | ) | (4,447 | ) | (3,737 | ) | (4,452 | ) | ||||||||
From net realized gains | (12,791 | ) | (14,030 | ) | (6,488 | ) | (9,016 | ) | ||||||||
Class T (a) | ||||||||||||||||
From net investment income | — | (b) | — | — | (b) | — | ||||||||||
|
|
|
|
|
|
|
| |||||||||
Total distributions to shareholders | (135,613 | ) | (154,949 | ) | (132,254 | ) | (169,156 | ) | ||||||||
|
|
|
|
|
|
|
| |||||||||
CAPITAL TRANSACTIONS: | ||||||||||||||||
Change in net assets resulting from capital transactions | (199,280 | ) | 170,465 | (469,431 | ) | 51,972 | ||||||||||
|
|
|
|
|
|
|
| |||||||||
NET ASSETS: | ||||||||||||||||
Change in net assets | 111,155 | (76,228 | ) | (169,371 | ) | (191,669 | ) | |||||||||
Beginning of period | 2,446,931 | 2,523,159 | 3,141,963 | 3,333,632 | ||||||||||||
|
|
|
|
|
|
|
| |||||||||
End of period | $ | 2,558,086 | $ | 2,446,931 | $ | 2,972,592 | $ | 3,141,963 | ||||||||
|
|
|
|
|
|
|
| |||||||||
Accumulated undistributed (distributions in | $ | 94 | $ | 64 | $ | 148 | $ | 126 | ||||||||
|
|
|
|
|
|
|
| |||||||||
| (a) | Commencement of offering of class of shares effective June 6, 2017. |
| (b) | Amount rounds to less than 500. |
SEE NOTES TO FINANCIAL STATEMENTS.
| 18 | J.P. MORGAN INVESTOR FUNDS | JUNE 30, 2017 | ||||
Table of Contents
| Investor Balanced Fund | Investor Conservative Growth Fund | |||||||||||||||
Year Ended June 30, 2017 | Year Ended June 30, 2016 | Year Ended June 30, 2017 | Year Ended June 30, 2016 | |||||||||||||
CAPITAL TRANSACTIONS: | ||||||||||||||||
Class A | ||||||||||||||||
Proceeds from shares issued | $ | 264,924 | $ | 521,159 | $ | 183,110 | $ | 334,682 | ||||||||
Distributions reinvested | 130,712 | 187,721 | 73,917 | 102,662 | ||||||||||||
Cost of shares redeemed | (1,064,306 | ) | (679,873 | ) | (667,980 | ) | (496,753 | ) | ||||||||
|
|
|
|
|
|
|
| |||||||||
Change in net assets resulting from Class A capital transactions | $ | (668,670 | ) | $ | 29,007 | $ | (410,953 | ) | $ | (59,409 | ) | |||||
|
|
|
|
|
|
|
| |||||||||
Class C | ||||||||||||||||
Proceeds from shares issued | $ | 160,661 | $ | 265,536 | $ | 224,466 | $ | 376,818 | ||||||||
Distributions reinvested | 33,495 | 52,283 | 43,662 | 66,197 | ||||||||||||
Cost of shares redeemed | (357,777 | ) | (291,673 | ) | (494,659 | ) | (472,504 | ) | ||||||||
|
|
|
|
|
|
|
| |||||||||
Change in net assets resulting from Class C capital transactions | $ | (163,621 | ) | $ | 26,146 | $ | (226,531 | ) | $ | (29,489 | ) | |||||
|
|
|
|
|
|
|
| |||||||||
Class I (formerly Select Class) | ||||||||||||||||
Proceeds from shares issued | $ | 148,958 | $ | 153,889 | $ | 42,413 | $ | 43,901 | ||||||||
Distributions reinvested | 3,446 | 4,656 | 2,200 | 2,793 | ||||||||||||
Cost of shares redeemed | (122,644 | ) | (80,598 | ) | (49,708 | ) | (37,543 | ) | ||||||||
|
|
|
|
|
|
|
| |||||||||
Change in net assets resulting from Class I capital transactions | $ | 29,760 | $ | 77,947 | $ | (5,095 | ) | $ | 9,151 | |||||||
|
|
|
|
|
|
|
| |||||||||
Class T (a) | ||||||||||||||||
Proceeds from shares issued | $ | 20 | $ | — | $ | 20 | $ | — | ||||||||
Distributions reinvested | — | (b) | — | — | (b) | — | ||||||||||
|
|
|
|
|
|
|
| |||||||||
Change in net assets resulting from Class T capital transactions | $ | 20 | $ | — | $ | 20 | $ | — | ||||||||
|
|
|
|
|
|
|
| |||||||||
Total change in net assets resulting from capital transactions | $ | (802,511 | ) | $ | 133,100 | $ | (642,559 | ) | $ | (79,747 | ) | |||||
|
|
|
|
|
|
|
| |||||||||
| (a) | Commencement of offering of class of shares effective June 6, 2017. |
| (b) | Amounts rounds to less than 500. |
SEE NOTES TO FINANCIAL STATEMENTS.
| JUNE 30, 2017 | J.P. MORGAN INVESTOR FUNDS | 19 | ||||||
Table of Contents
STATEMENTS OF CHANGES IN NET ASSETS
FOR THE PERIODS INDICATED (continued)
(Amounts in thousands)
| Investor Balanced Fund | Investor Conservative Growth Fund | |||||||||||||||
| Year Ended June 30, 2017 | Year Ended June 30, 2016 | Year Ended June 30, 2017 | Year Ended June 30, 2016 | |||||||||||||
SHARE TRANSACTIONS: |
| |||||||||||||||
Class A |
| |||||||||||||||
Issued | 17,833 | 36,108 | 14,566 | 27,128 | ||||||||||||
Reinvested | 8,886 | 13,251 | 5,932 | 8,416 | ||||||||||||
Redeemed | (71,214 | ) | (47,331 | ) | (53,038 | ) | (40,276 | ) | ||||||||
|
|
|
|
|
|
|
| |||||||||
Change in Class A Shares | (44,495 | ) | 2,028 | (32,540 | ) | (4,732 | ) | |||||||||
|
|
|
|
|
|
|
| |||||||||
Class C |
| |||||||||||||||
Issued | 10,952 | 18,572 | 17,927 | 30,610 | ||||||||||||
Reinvested | 2,317 | 3,748 | 3,527 | 5,462 | ||||||||||||
Redeemed | (24,334 | ) | (20,642 | ) | (39,493 | ) | (38,552 | ) | ||||||||
|
|
|
|
|
|
|
| |||||||||
Change in Class C Shares | (11,065 | ) | 1,678 | (18,039 | ) | (2,480 | ) | |||||||||
|
|
|
|
|
|
|
| |||||||||
Class I (formerly Select Class) |
| |||||||||||||||
Issued | 9,958 | 10,448 | 3,352 | 3,548 | ||||||||||||
Reinvested | 233 | 328 | 175 | 228 | ||||||||||||
Redeemed | (8,157 | ) | (5,624 | ) | (3,922 | ) | (3,004 | ) | ||||||||
|
|
|
|
|
|
|
| |||||||||
Change in Class I Shares | 2,034 | 5,152 | (395 | ) | 772 | |||||||||||
|
|
|
|
|
|
|
| |||||||||
Class T (a) |
| |||||||||||||||
Issued | 1 | — | 2 | — | ||||||||||||
Reinvested | — | (b) | — | — | (b) | — | ||||||||||
|
|
|
|
|
|
|
| |||||||||
Change in Class T Shares | 1 | — | 2 | — | ||||||||||||
|
|
|
|
|
|
|
| |||||||||
| (a) | Commencement of offering of class of shares effective June 6, 2017. |
| (b) | Amount rounds to less than 500. |
SEE NOTES TO FINANCIAL STATEMENTS.
| 20 | J.P. MORGAN INVESTOR FUNDS | JUNE 30, 2017 | ||||
Table of Contents
| Investor Growth Fund | Investor Growth & Income Fund | |||||||||||||||
Year Ended June 30, 2017 | Year Ended June 30, 2016 | Year Ended June 30, 2017 | Year Ended June 30, 2016 | |||||||||||||
CAPITAL TRANSACTIONS: | ||||||||||||||||
Class A | ||||||||||||||||
Proceeds from shares issued | $ | 122,390 | $ | 209,821 | $ | 135,891 | $ | 250,438 | ||||||||
Distributions reinvested | 103,579 | 118,749 | 105,860 | 134,109 | ||||||||||||
Cost of shares redeemed | (421,646 | ) | (240,399 | ) | (620,548 | ) | (362,157 | ) | ||||||||
|
|
|
|
|
|
|
| |||||||||
Change in net assets resulting from Class A capital transactions | $ | (195,677 | ) | $ | 88,171 | $ | (378,797 | ) | $ | 22,390 | ||||||
|
|
|
|
|
|
|
| |||||||||
Class C | ||||||||||||||||
Proceeds from shares issued | $ | 44,771 | $ | 69,494 | $ | 58,135 | $ | 94,978 | ||||||||
Distributions reinvested | 14,448 | 16,602 | 15,258 | 20,410 | ||||||||||||
Cost of shares redeemed | (87,416 | ) | (56,521 | ) | (141,358 | ) | (98,007 | ) | ||||||||
|
|
|
|
|
|
|
| |||||||||
Change in net assets resulting from Class C capital transactions | $ | (28,197 | ) | $ | 29,575 | $ | (67,965 | ) | $ | 17,381 | ||||||
|
|
|
|
|
|
|
| |||||||||
Class I (formerly Select Class) | ||||||||||||||||
Proceeds from shares issued | $ | 105,940 | $ | 111,442 | $ | 61,573 | $ | 55,582 | ||||||||
Distributions reinvested | 4,159 | 3,969 | 2,743 | 4,742 | ||||||||||||
Cost of shares redeemed | (85,525 | ) | (62,692 | ) | (87,005 | ) | (48,123 | ) | ||||||||
|
|
|
|
|
|
|
| |||||||||
Change in net assets resulting from Class I capital transactions | $ | 24,574 | $ | 52,719 | $ | (22,689 | ) | $ | 12,201 | |||||||
|
|
|
|
|
|
|
| |||||||||
Class T (a) | ||||||||||||||||
Proceeds from shares issued | $ | 20 | $ | — | $ | 20 | $ | — | ||||||||
Distributions reinvested | — | (b) | — | — | (b) | — | ||||||||||
|
|
|
|
|
|
|
| |||||||||
Change in net assets resulting from Class T capital transactions | $ | 20 | $ | — | $ | 20 | $ | — | ||||||||
|
|
|
|
|
|
|
| |||||||||
Total change in net assets resulting from capital transactions | $ | (199,280 | ) | $ | 170,465 | $ | (469,431 | ) | $ | 51,972 | ||||||
|
|
|
|
|
|
|
| |||||||||
| (a) | Commencement of offering of class of shares effective June 6, 2017. |
| (b) | Amount rounds to less than 500. |
SEE NOTES TO FINANCIAL STATEMENTS.
| JUNE 30, 2017 | J.P. MORGAN INVESTOR FUNDS | 21 | ||||||
Table of Contents
STATEMENTS OF CHANGES IN NET ASSETS
FOR THE PERIODS INDICATED (continued)
(Amounts in thousands)
| Investor Growth Fund | Investor Growth & Income Fund | |||||||||||||||
| Year Ended June 30, 2017 | Year Ended June 30, 2016 | Year Ended June 30, 2017 | Year Ended June 30, 2016 | |||||||||||||
SHARE TRANSACTIONS: |
| |||||||||||||||
Class A |
| |||||||||||||||
Issued | 6,334 | 11,358 | 8,160 | 15,592 | ||||||||||||
Reinvested | 5,503 | 6,595 | 6,465 | 8,537 | ||||||||||||
Redeemed | (21,701 | ) | (13,034 | ) | (37,043 | ) | (22,696 | ) | ||||||||
|
|
|
|
|
|
|
| |||||||||
Change in Class A Shares | (9,864 | ) | 4,919 | (22,418 | ) | 1,433 | ||||||||||
|
|
|
|
|
|
|
| |||||||||
Class C |
| |||||||||||||||
Issued | 2,452 | 3,961 | 3,584 | 6,045 | ||||||||||||
Reinvested | 814 | 972 | 961 | 1,335 | ||||||||||||
Redeemed | (4,765 | ) | (3,257 | ) | (8,678 | ) | (6,328 | ) | ||||||||
|
|
|
|
|
|
|
| |||||||||
Change in Class C Shares | (1,499 | ) | 1,676 | (4,133 | ) | 1,052 | ||||||||||
|
|
|
|
|
|
|
| |||||||||
Class I (formerly Select Class) |
| |||||||||||||||
Issued | 5,355 | 5,783 | 3,738 | 3,529 | ||||||||||||
Reinvested | 216 | 217 | 169 | 306 | ||||||||||||
Redeemed | (4,322 | ) | (3,386 | ) | (5,287 | ) | (3,063 | ) | ||||||||
|
|
|
|
|
|
|
| |||||||||
Change in Class I Shares | 1,249 | 2,614 | (1,380 | ) | 772 | |||||||||||
|
|
|
|
|
|
|
| |||||||||
Class T (a) |
| |||||||||||||||
Issued | 1 | — | 1 | — | ||||||||||||
Reinvested | — | (b) | — | — | (b) | — | ||||||||||
|
|
|
|
|
|
|
| |||||||||
Change in Class T Shares | 1 | — | 1 | — | ||||||||||||
|
|
|
|
|
|
|
| |||||||||
| (a) | Commencement of offering of class of shares effective June 6, 2017. |
| (b) | Amount rounds to less than 500. |
SEE NOTES TO FINANCIAL STATEMENTS.
| 22 | J.P. MORGAN INVESTOR FUNDS | JUNE 30, 2017 | ||||
Table of Contents
THIS PAGE IS INTENTIONALLY LEFT BLANK
| JUNE 30, 2017 | J.P. MORGAN INVESTOR FUNDS | 23 | ||||||
Table of Contents
FOR THE PERIODS INDICATED
| Per share operating performance | ||||||||||||||||||||||||||||||||
| Investment operations | Distributions | |||||||||||||||||||||||||||||||
| Net asset value, beginning of period | Net investment income (loss) (b) | Net realized and unrealized gains (losses) on investments | Total from investment operations | Net investment income | Net realized gain | Total distributions | Net asset value, end of period | |||||||||||||||||||||||||
Investor Balanced Fund | ||||||||||||||||||||||||||||||||
Class A | ||||||||||||||||||||||||||||||||
Year Ended June 30, 2017 | $ | 14.33 | $ | 0.23 | (g) | $ | 1.33 | $ | 1.56 | $ | (0.24 | ) | $ | (0.28 | ) | $ | (0.52 | ) | $ | 15.37 | ||||||||||||
Year Ended June 30, 2016 | 15.12 | 0.22 | (g) | (0.29 | ) | (0.07 | ) | (0.25 | ) | (0.47 | ) | (0.72 | ) | 14.33 | ||||||||||||||||||
Year Ended June 30, 2015 | 15.25 | 0.19 | 0.24 | 0.43 | (0.28 | ) | (0.28 | ) | (0.56 | ) | 15.12 | |||||||||||||||||||||
Year Ended June 30, 2014 | 13.61 | 0.17 | (g) | 1.74 | 1.91 | (0.23 | ) | (0.04 | ) | (0.27 | ) | 15.25 | ||||||||||||||||||||
Year Ended June 30, 2013 | 12.53 | 0.20 | (g) | 1.11 | 1.31 | (0.23 | ) | — | (0.23 | ) | 13.61 | |||||||||||||||||||||
Class C | ||||||||||||||||||||||||||||||||
Year Ended June 30, 2017 | 14.13 | 0.14 | (g) | 1.30 | 1.44 | (0.15 | ) | (0.28 | ) | (0.43 | ) | 15.14 | ||||||||||||||||||||
Year Ended June 30, 2016 | 14.92 | 0.14 | (g) | (0.29 | ) | (0.15 | ) | (0.17 | ) | (0.47 | ) | (0.64 | ) | 14.13 | ||||||||||||||||||
Year Ended June 30, 2015 | 15.05 | 0.13 | 0.23 | 0.36 | (0.21 | ) | (0.28 | ) | (0.49 | ) | 14.92 | |||||||||||||||||||||
Year Ended June 30, 2014 | 13.44 | 0.09 | (g) | 1.71 | 1.80 | (0.15 | ) | (0.04 | ) | (0.19 | ) | 15.05 | ||||||||||||||||||||
Year Ended June 30, 2013 | 12.39 | 0.13 | (g) | 1.09 | 1.22 | (0.17 | ) | — | (0.17 | ) | 13.44 | |||||||||||||||||||||
Class I (formerly Select Class) | ||||||||||||||||||||||||||||||||
Year Ended June 30, 2017 | 14.35 | 0.27 | (g) | 1.33 | 1.60 | (0.28 | ) | (0.28 | ) | (0.56 | ) | 15.39 | ||||||||||||||||||||
Year Ended June 30, 2016 | 15.14 | 0.26 | (g) | (0.30 | ) | (0.04 | ) | (0.28 | ) | (0.47 | ) | (0.75 | ) | 14.35 | ||||||||||||||||||
Year Ended June 30, 2015 | 15.27 | 0.24 | 0.23 | 0.47 | (0.32 | ) | (0.28 | ) | (0.60 | ) | 15.14 | |||||||||||||||||||||
Year Ended June 30, 2014 | 13.62 | 0.20 | (g) | 1.75 | 1.95 | (0.26 | ) | (0.04 | ) | (0.30 | ) | 15.27 | ||||||||||||||||||||
Year Ended June 30, 2013 | 12.55 | 0.23 | (g) | 1.10 | 1.33 | (0.26 | ) | — | (0.26 | ) | 13.62 | |||||||||||||||||||||
Class T | ||||||||||||||||||||||||||||||||
June 6, 2017 (h) through June 30, 2017 | 15.45 | 0.02 | (g) | (0.07 | ) | (0.05 | ) | (0.05 | ) | — | (0.05 | ) | 15.35 | |||||||||||||||||||
| (a) | Annualized for periods less than one year, unless otherwise noted. |
| (b) | Net investment income (loss) is affected by timing of distributions from Underlying Funds. |
| (c) | Not annualized for periods less than one year. |
| (d) | Includes adjustments in accordance with accounting principles generally accepted in the United States of America and as such, the net asset values for financial reporting purposes and the returns based upon those net asset values may differ from the net asset values and returns for shareholder transactions. |
| (e) | Does not include expenses of Underlying Funds. |
| (f) | Includes earnings credits and interest expense, if applicable, each of which is less than 0.005% unless otherwise noted. |
| (g) | Calculated based upon average shares outstanding. |
| (h) | Commencement of offering of class of shares. |
SEE NOTES TO FINANCIAL STATEMENTS.
| 24 | J.P. MORGAN INVESTOR FUNDS | JUNE 30, 2017 | ||||
Table of Contents
| Ratios/Supplemental data | ||||||||||||||||||||||
| Ratios to average net assets (a) | ||||||||||||||||||||||
| Total return (excludes sales charge) (c)(d) | Net assets, end of period (000's) | Net expenses (e)(f) | Net investment income (loss) (b) | Expenses without | Portfolio turnover rate (c) | |||||||||||||||||
| 11.09 | % | $ | 3,430,816 | 0.52 | % | 1.55 | % | 0.65 | % | 4 | % | |||||||||||
| (0.40 | ) | 3,836,242 | 0.46 | 1.55 | 0.67 | 12 | ||||||||||||||||
| 2.89 | 4,018,244 | 0.34 | 1.26 | 0.66 | 10 | |||||||||||||||||
| 14.12 | 3,749,519 | 0.41 | 1.16 | 0.67 | 12 | |||||||||||||||||
| 10.54 | 2,797,749 | 0.50 | 1.51 | 0.69 | 19 | |||||||||||||||||
| 10.40 | 1,071,522 | 1.09 | 0.97 | 1.15 | 4 | |||||||||||||||||
| (0.95 | ) | 1,155,896 | 1.01 | 1.00 | 1.16 | 12 | ||||||||||||||||
| 2.45 | 1,195,830 | 0.80 | 0.81 | 1.16 | 10 | |||||||||||||||||
| 13.50 | 995,919 | 0.97 | 0.61 | 1.17 | 12 | |||||||||||||||||
| 9.89 | 564,358 | 1.01 | 0.99 | 1.19 | 19 | |||||||||||||||||
| 11.36 | 469,758 | 0.27 | 1.80 | 0.38 | 4 | |||||||||||||||||
| (0.15 | ) | 408,797 | 0.20 | 1.83 | 0.39 | 12 | ||||||||||||||||
| 3.15 | 353,402 | 0.08 | 1.51 | 0.40 | 10 | |||||||||||||||||
| 14.45 | 329,525 | 0.16 | 1.39 | 0.42 | 12 | |||||||||||||||||
| 10.71 | 293,756 | 0.25 | 1.75 | 0.44 | 19 | |||||||||||||||||
| (0.30 | ) | 20 | 0.52 | 1.80 | 0.65 | 4 | ||||||||||||||||
SEE NOTES TO FINANCIAL STATEMENTS.
| JUNE 30, 2017 | J.P. MORGAN INVESTOR FUNDS | 25 | ||||||
Table of Contents
FINANCIAL HIGHLIGHTS
FOR THE PERIODS INDICATED
| Per share operating performance | ||||||||||||||||||||||||||||||||
| Investment operations | Distributions | |||||||||||||||||||||||||||||||
| Net asset value, beginning of period | Net investment income (loss) (b) | Net realized and unrealized gains (losses) on investments | Total from investment operations | Net investment income | Net realized gain | Total distributions | Net asset value, end of period | |||||||||||||||||||||||||
Investor Conservative Growth Fund | ||||||||||||||||||||||||||||||||
Class A | ||||||||||||||||||||||||||||||||
Year Ended June 30, 2017 | $ | 12.36 | $ | 0.23 | (g) | $ | 0.61 | $ | 0.84 | $ | (0.23 | ) | $ | (0.17 | ) | $ | (0.40 | ) | $ | 12.80 | ||||||||||||
Year Ended June 30, 2016 | 12.78 | 0.22 | (g) | (0.11 | ) | 0.11 | (0.23 | ) | (0.30 | ) | (0.53 | ) | 12.36 | |||||||||||||||||||
Year Ended June 30, 2015 | 13.00 | 0.19 | 0.05 | 0.24 | (0.22 | ) | (0.24 | ) | (0.46 | ) | 12.78 | |||||||||||||||||||||
Year Ended June 30, 2014 | 12.01 | 0.18 | (g) | 1.02 | 1.20 | (0.21 | ) | — | (0.21 | ) | 13.00 | |||||||||||||||||||||
Year Ended June 30, 2013 | 11.46 | 0.19 | (g) | 0.58 | 0.77 | (0.22 | ) | — | (0.22 | ) | 12.01 | |||||||||||||||||||||
Class C | ||||||||||||||||||||||||||||||||
Year Ended June 30, 2017 | 12.30 | 0.15 | (g) | 0.62 | 0.77 | (0.15 | ) | (0.17 | ) | (0.32 | ) | 12.75 | ||||||||||||||||||||
Year Ended June 30, 2016 | 12.73 | 0.15 | (g) | (0.12 | ) | 0.03 | (0.16 | ) | (0.30 | ) | (0.46 | ) | 12.30 | |||||||||||||||||||
Year Ended June 30, 2015 | 12.95 | 0.13 | 0.06 | 0.19 | (0.17 | ) | (0.24 | ) | (0.41 | ) | 12.73 | |||||||||||||||||||||
Year Ended June 30, 2014 | 11.97 | 0.11 | (g) | 1.01 | 1.12 | (0.14 | ) | — | (0.14 | ) | 12.95 | |||||||||||||||||||||
Year Ended June 30, 2013 | 11.42 | 0.13 | (g) | 0.58 | 0.71 | (0.16 | ) | — | (0.16 | ) | 11.97 | |||||||||||||||||||||
Class I (formerly Select Class) | ||||||||||||||||||||||||||||||||
Year Ended June 30, 2017 | 12.42 | 0.26 | (g) | 0.62 | 0.88 | (0.26 | ) | (0.17 | ) | (0.43 | ) | 12.87 | ||||||||||||||||||||
Year Ended June 30, 2016 | 12.84 | 0.25 | (g) | (0.11 | ) | 0.14 | (0.26 | ) | (0.30 | ) | (0.56 | ) | 12.42 | |||||||||||||||||||
Year Ended June 30, 2015 | 13.06 | 0.22 | 0.06 | 0.28 | (0.26 | ) | (0.24 | ) | (0.50 | ) | 12.84 | |||||||||||||||||||||
Year Ended June 30, 2014 | 12.06 | 0.21 | (g) | 1.03 | 1.24 | (0.24 | ) | — | (0.24 | ) | 13.06 | |||||||||||||||||||||
Year Ended June 30, 2013 | 11.51 | 0.22 | (g) | 0.58 | 0.80 | (0.25 | ) | — | (0.25 | ) | 12.06 | |||||||||||||||||||||
Class T | ||||||||||||||||||||||||||||||||
June 6, 2017 (h) through June 30, 2017 | 12.85 | 0.02 | (g) | (0.05 | ) | (0.03 | ) | (0.02 | ) | — | (0.02 | ) | 12.80 | |||||||||||||||||||
| (a) | Annualized for periods less than one year, unless otherwise noted. |
| (b) | Net investment income (loss) is affected by timing of distributions from Underlying Funds. |
| (c) | Not annualized for periods less than one year. |
| (d) | Includes adjustments in accordance with accounting principles generally accepted in the United States of America and as such, the net asset values for financial reporting purposes and the returns based upon those net asset values may differ from the net asset values and returns for shareholder transactions. |
| (e) | Does not include expenses of Underlying Funds. |
| (f) | Includes earnings credits and interest expense, if applicable, each of which is less than 0.005% unless otherwise noted. |
| (g) | Calculated based upon average shares outstanding. |
| (h) | Commencement of offering of class of shares. |
SEE NOTES TO FINANCIAL STATEMENTS.
| 26 | J.P. MORGAN INVESTOR FUNDS | JUNE 30, 2017 | ||||
Table of Contents
| Ratios/Supplemental data | ||||||||||||||||||||||
| Ratios to average net assets (a) | ||||||||||||||||||||||
| Total return (excludes sales charge) (c)(d) | Net assets, end of period (000's) | Net expenses (e)(f) | Net investment income (loss) (b) | Expenses without | Portfolio turnover rate (c) | |||||||||||||||||
| 6.92 | % | $ | 2,081,812 | 0.52 | % | 1.80 | % | 0.65 | % | 6 | % | |||||||||||
| 0.97 | 2,411,763 | 0.46 | 1.76 | 0.66 | 12 | |||||||||||||||||
| 1.89 | 2,554,155 | 0.34 | 1.46 | 0.66 | 11 | |||||||||||||||||
| 10.05 | 2,516,247 | 0.41 | 1.41 | 0.66 | 20 | |||||||||||||||||
| 6.76 | 2,220,725 | 0.50 | 1.63 | 0.68 | 14 | |||||||||||||||||
| 6.40 | 1,573,159 | 1.10 | 1.22 | 1.15 | 6 | |||||||||||||||||
| 0.34 | 1,740,461 | 1.01 | 1.21 | 1.16 | 12 | |||||||||||||||||
| 1.44 | 1,831,636 | 0.79 | 1.02 | 1.16 | 11 | |||||||||||||||||
| 9.42 | 1,580,447 | 0.97 | 0.87 | 1.16 | 20 | |||||||||||||||||
| 6.27 | 1,142,903 | 1.01 | 1.12 | 1.18 | 14 | |||||||||||||||||
| 7.22 | 135,687 | 0.27 | 2.05 | 0.40 | 6 | |||||||||||||||||
| 1.22 | 135,832 | 0.21 | 2.02 | 0.41 | 12 | |||||||||||||||||
| 2.13 | 130,507 | 0.09 | 1.71 | 0.40 | 11 | |||||||||||||||||
| 10.35 | 119,664 | 0.16 | 1.66 | 0.41 | 20 | |||||||||||||||||
| 6.97 | 112,843 | 0.25 | 1.87 | 0.43 | 14 | |||||||||||||||||
| (0.26 | ) | 20 | 0.51 | 2.22 | 0.68 | 6 | ||||||||||||||||
SEE NOTES TO FINANCIAL STATEMENTS.
| JUNE 30, 2017 | J.P. MORGAN INVESTOR FUNDS | 27 | ||||||
Table of Contents
FINANCIAL HIGHLIGHTS
FOR THE PERIODS INDICATED
| Per share operating performance | ||||||||||||||||||||||||||||||||
| Investment operations | Distributions | |||||||||||||||||||||||||||||||
| Net asset value, beginning of period | Net investment income (loss) (b)(c) | Net realized and unrealized gains (losses) on investments | Total from investment operations | Net investment income | Net realized gain | Total distributions | Net asset value, end of period | |||||||||||||||||||||||||
Investor Growth Fund | ||||||||||||||||||||||||||||||||
Class A | ||||||||||||||||||||||||||||||||
Year Ended June 30, 2017 | $ | 18.04 | $ | 0.18 | $ | 3.19 | $ | 3.37 | $ | (0.19 | ) | $ | (0.84 | ) | $ | (1.03 | ) | $ | 20.38 | |||||||||||||
Year Ended June 30, 2016 | 19.95 | 0.17 | (0.89 | ) | (0.72 | ) | (0.24 | ) | (0.95 | ) | (1.19 | ) | 18.04 | |||||||||||||||||||
Year Ended June 30, 2015 | 19.59 | 0.15 | 0.91 | 1.06 | (0.39 | ) | (0.31 | ) | (0.70 | ) | 19.95 | |||||||||||||||||||||
Year Ended June 30, 2014 | 16.25 | 0.11 | 3.45 | 3.56 | (0.22 | ) | — | (0.22 | ) | 19.59 | ||||||||||||||||||||||
Year Ended June 30, 2013 | 13.88 | 0.14 | 2.38 | 2.52 | (0.15 | ) | — | (0.15 | ) | 16.25 | ||||||||||||||||||||||
Class C | ||||||||||||||||||||||||||||||||
Year Ended June 30, 2017 | 17.10 | 0.06 | 3.01 | 3.07 | (0.13 | ) | (0.84 | ) | (0.97 | ) | 19.20 | |||||||||||||||||||||
Year Ended June 30, 2016 | 19.01 | 0.07 | (0.85 | ) | (0.78 | ) | (0.18 | ) | (0.95 | ) | (1.13 | ) | 17.10 | |||||||||||||||||||
Year Ended June 30, 2015 | 18.75 | 0.05 | 0.87 | 0.92 | (0.35 | ) | (0.31 | ) | (0.66 | ) | 19.01 | |||||||||||||||||||||
Year Ended June 30, 2014 | 15.60 | 0.01 | 3.30 | 3.31 | (0.16 | ) | — | (0.16 | ) | 18.75 | ||||||||||||||||||||||
Year Ended June 30, 2013 | 13.34 | 0.05 | 2.30 | 2.35 | (0.09 | ) | — | (0.09 | ) | 15.60 | ||||||||||||||||||||||
Class I (formerly Select Class) | ||||||||||||||||||||||||||||||||
Year Ended June 30, 2017 | 18.37 | 0.23 | 3.25 | 3.48 | (0.24 | ) | (0.84 | ) | (1.08 | ) | 20.77 | |||||||||||||||||||||
Year Ended June 30, 2016 | 20.29 | 0.23 | (0.91 | ) | (0.68 | ) | (0.29 | ) | (0.95 | ) | (1.24 | ) | 18.37 | |||||||||||||||||||
Year Ended June 30, 2015 | 19.91 | 0.20 | 0.93 | 1.13 | (0.44 | ) | (0.31 | ) | (0.75 | ) | 20.29 | |||||||||||||||||||||
Year Ended June 30, 2014 | 16.51 | 0.16 | 3.50 | 3.66 | (0.26 | ) | — | (0.26 | ) | 19.91 | ||||||||||||||||||||||
Year Ended June 30, 2013 | 14.09 | 0.17 | 2.44 | 2.61 | (0.19 | ) | — | (0.19 | ) | 16.51 | ||||||||||||||||||||||
Class T | ||||||||||||||||||||||||||||||||
June 6, 2017 (h) through June 30, 2017 | 20.43 | 0.01 | (0.06 | ) | (0.05 | ) | (0.02 | ) | — | (0.02 | ) | 20.36 | ||||||||||||||||||||
| (a) | Annualized for periods less than one year, unless otherwise noted. |
| (b) | Calculated based upon average shares outstanding. |
| (c) | Net investment income (loss) is affected by timing of distributions from Underlying Funds. |
| (d) | Not annualized for periods less than one year. |
| (e) | Includes adjustments in accordance with accounting principles generally accepted in the United States of America and as such, the net asset values for financial reporting purposes and the returns based upon those net asset values may differ from the net asset values and returns for shareholder transactions. |
| (f) | Does not include expenses of Underlying Funds. |
| (g) | Includes earnings credits and interest expense, if applicable, each of which is less than 0.005% unless otherwise noted. |
| (h) | Commencement of offering of class of shares. |
SEE NOTES TO FINANCIAL STATEMENTS.
| 28 | J.P. MORGAN INVESTOR FUNDS | JUNE 30, 2017 | ||||
Table of Contents
| Ratios/Supplemental data | ||||||||||||||||||||||
| Ratios to average net assets (a) | ||||||||||||||||||||||
| Total return (excludes sales charge) (d)(e) | Net assets, (000's) | Net expenses (f)(g) | Net investment income (loss) (c) | Expenses without | Portfolio turnover rate (d) | |||||||||||||||||
| 19.19 | % | $ | 1,937,119 | 0.52 | % | 0.93 | % | 0.70 | % | 8 | % | |||||||||||
| (3.54 | ) | 1,893,308 | 0.47 | 0.93 | 0.72 | 8 | ||||||||||||||||
| 5.51 | 1,994,792 | 0.38 | 0.74 | 0.71 | 10 | |||||||||||||||||
| 21.95 | 1,791,194 | 0.41 | 0.59 | 0.71 | 8 | |||||||||||||||||
| 18.28 | 1,344,928 | 0.49 | 0.89 | 0.76 | 15 | |||||||||||||||||
| 18.47 | 274,389 | 1.09 | 0.35 | 1.19 | 8 | |||||||||||||||||
| (4.05 | ) | 270,007 | 1.02 | 0.39 | 1.21 | 8 | ||||||||||||||||
| 4.97 | 268,270 | 0.85 | 0.26 | 1.21 | 10 | |||||||||||||||||
| 21.30 | 226,430 | 0.95 | 0.05 | 1.21 | 8 | |||||||||||||||||
| 17.69 | 157,546 | 1.04 | 0.34 | 1.25 | 15 | |||||||||||||||||
| 19.46 | 346,558 | 0.27 | 1.17 | 0.39 | 8 | |||||||||||||||||
| (3.28 | ) | 283,616 | 0.20 | 1.21 | 0.40 | 8 | ||||||||||||||||
| 5.80 | 260,097 | 0.10 | 1.01 | 0.42 | 10 | |||||||||||||||||
| 22.25 | 182,413 | 0.16 | 0.85 | 0.46 | 8 | |||||||||||||||||
| 18.64 | 123,906 | 0.24 | 1.13 | 0.51 | 15 | |||||||||||||||||
| (0.24 | ) | 20 | 0.51 | 1.11 | 0.64 | 8 | ||||||||||||||||
SEE NOTES TO FINANCIAL STATEMENTS.
| JUNE 30, 2017 | J.P. MORGAN INVESTOR FUNDS | 29 | ||||||
Table of Contents
FINANCIAL HIGHLIGHTS
FOR THE PERIODS INDICATED
| Per share operating performance | ||||||||||||||||||||||||||||||||
| Investment operations | Distributions | |||||||||||||||||||||||||||||||
| Net asset value, beginning of period | Net investment income (loss) (b)(c) | Net realized and unrealized gains (losses) on investments | Total from investment operations | Net investment income | Net realized gain | Total distributions | Net asset value, end of period | |||||||||||||||||||||||||
Investor Growth & Income Fund | ||||||||||||||||||||||||||||||||
Class A | ||||||||||||||||||||||||||||||||
Year Ended June 30, 2017 | $ | 15.79 | $ | 0.22 | $ | 2.07 | $ | 2.29 | $ | (0.23 | ) | $ | (0.48 | ) | $ | (0.71 | ) | $ | 17.37 | |||||||||||||
Year Ended June 30, 2016 | 17.02 | 0.21 | (0.58 | ) | (0.37 | ) | (0.25 | ) | (0.61 | ) | (0.86 | ) | 15.79 | |||||||||||||||||||
Year Ended June 30, 2015 | 17.11 | 0.19 | 0.44 | 0.63 | (0.33 | ) | (0.39 | ) | (0.72 | ) | 17.02 | |||||||||||||||||||||
Year Ended June 30, 2014 | 14.78 | 0.16 | 2.40 | 2.56 | (0.23 | ) | — | (0.23 | ) | 17.11 | ||||||||||||||||||||||
Year Ended June 30, 2013 | 13.17 | 0.18 | 1.64 | 1.82 | (0.21 | ) | — | (0.21 | ) | 14.78 | ||||||||||||||||||||||
Class C | ||||||||||||||||||||||||||||||||
Year Ended June 30, 2017 | 15.39 | 0.12 | 2.01 | 2.13 | (0.13 | ) | (0.48 | ) | (0.61 | ) | 16.91 | |||||||||||||||||||||
Year Ended June 30, 2016 | 16.62 | 0.12 | (0.57 | ) | (0.45 | ) | (0.17 | ) | (0.61 | ) | (0.78 | ) | 15.39 | |||||||||||||||||||
Year Ended June 30, 2015 | 16.72 | 0.11 | 0.44 | 0.55 | (0.26 | ) | (0.39 | ) | (0.65 | ) | 16.62 | |||||||||||||||||||||
Year Ended June 30, 2014 | 14.46 | 0.07 | 2.34 | 2.41 | (0.15 | ) | — | (0.15 | ) | 16.72 | ||||||||||||||||||||||
Year Ended June 30, 2013 | 12.89 | 0.10 | 1.61 | 1.71 | (0.14 | ) | — | (0.14 | ) | 14.46 | ||||||||||||||||||||||
Class I (formerly Select Class) | ||||||||||||||||||||||||||||||||
Year Ended June 30, 2017 | 15.57 | 0.25 | 2.04 | 2.29 | (0.27 | ) | (0.48 | ) | (0.75 | ) | 17.11 | |||||||||||||||||||||
Year Ended June 30, 2016 | 16.80 | 0.25 | (0.58 | ) | (0.33 | ) | (0.29 | ) | (0.61 | ) | (0.90 | ) | 15.57 | |||||||||||||||||||
Year Ended June 30, 2015 | 16.89 | 0.23 | 0.44 | 0.67 | (0.37 | ) | (0.39 | ) | (0.76 | ) | 16.80 | |||||||||||||||||||||
Year Ended June 30, 2014 | 14.59 | 0.19 | 2.38 | 2.57 | (0.27 | ) | — | (0.27 | ) | 16.89 | ||||||||||||||||||||||
Year Ended June 30, 2013 | 13.00 | 0.21 | 1.63 | 1.84 | (0.25 | ) | — | (0.25 | ) | 14.59 | ||||||||||||||||||||||
Class T | ||||||||||||||||||||||||||||||||
June 6, 2017 (h) through June 30, 2017 | 17.44 | 0.02 | (0.07 | ) | (0.05 | ) | (0.04 | ) | — | (0.04 | ) | 17.35 | ||||||||||||||||||||
| (a) | Annualized for periods less than one year, unless otherwise noted. |
| (b) | Net investment income (loss) is affected by timing of distributions from Underlying Funds. |
| (c) | Calculated based upon average shares outstanding. |
| (d) | Not annualized for periods less than one year. |
| (e) | Includes adjustments in accordance with accounting principles generally accepted in the United States of America and as such, the net asset values for financial reporting purposes and the returns based upon those net asset values may differ from the net asset values and returns for shareholder transactions. |
| (f) | Does not include expenses of Underlying Funds. |
| (g) | Includes earnings credits and interest expense, if applicable, each of which is less than 0.005% unless otherwise noted. |
| (h) | Commencement of offering of class of shares. |
SEE NOTES TO FINANCIAL STATEMENTS.
| 30 | J.P. MORGAN INVESTOR FUNDS | JUNE 30, 2017 | ||||
Table of Contents
| Ratios/Supplemental data | ||||||||||||||||||||||
| Ratios to average net assets (a) | ||||||||||||||||||||||
| Total return (excludes sales charge) (d)(e) | Net assets, end of period (000's) | Net expenses (f)(g) | Net investment income (loss) (b) | Expenses without | Portfolio turnover rate (d) | |||||||||||||||||
| 14.82 | % | $ | 2,348,659 | 0.52 | % | 1.30 | % | 0.67 | % | 7 | % | |||||||||||
| (2.06 | ) | 2,489,097 | 0.46 | 1.33 | 0.69 | 13 | ||||||||||||||||
| 3.78 | 2,659,305 | 0.36 | 1.11 | 0.69 | 9 | |||||||||||||||||
| 17.40 | 2,432,024 | 0.41 | 0.96 | 0.68 | 10 | |||||||||||||||||
| 13.91 | 1,812,603 | 0.49 | 1.29 | 0.72 | 20 | |||||||||||||||||
| 14.17 | 385,447 | 1.10 | 0.73 | 1.17 | 7 | |||||||||||||||||
| (2.63 | ) | 414,439 | 1.02 | 0.79 | 1.19 | 13 | ||||||||||||||||
| 3.37 | 430,037 | 0.82 | 0.65 | 1.19 | 9 | |||||||||||||||||
| 16.72 | 358,544 | 0.96 | 0.42 | 1.18 | 10 | |||||||||||||||||
| 13.34 | 225,157 | 1.02 | 0.76 | 1.21 | 20 | |||||||||||||||||
| 15.07 | 238,466 | 0.27 | 1.53 | 0.39 | 7 | |||||||||||||||||
| (1.82 | ) | 238,427 | 0.20 | 1.60 | 0.40 | 13 | ||||||||||||||||
| 4.11 | 244,290 | 0.09 | 1.38 | 0.41 | 9 | |||||||||||||||||
| 17.71 | 208,836 | 0.16 | 1.21 | 0.44 | 10 | |||||||||||||||||
| 14.22 | 156,714 | 0.24 | 1.53 | 0.47 | 20 | |||||||||||||||||
| (0.27 | ) | 20 | 0.51 | 1.51 | 0.64 | 7 | ||||||||||||||||
SEE NOTES TO FINANCIAL STATEMENTS.
| JUNE 30, 2017 | J.P. MORGAN INVESTOR FUNDS | 31 | ||||||
Table of Contents
AS OF JUNE 30, 2017
1. Organization
JPMorgan Trust II (“JPM II” or the “Trust”) was formed on November 12, 2004, as a Delaware statutory trust, pursuant to a Declaration of Trust dated November 5, 2004 and is registered under the Investment Company Act of 1940, as amended (the “1940 Act”), as an open-end management investment company.
The following are 4 separate funds of the Trust (collectively, the “Funds”) covered by this report:
| Classes Offered | Diversified/Non-Diversified | |||
| Investor Balanced Fund | Class A, Class C, Class I* and Class T** | Diversified | ||
| Investor Conservative Growth Fund | Class A, Class C, Class I* and Class T** | Diversified | ||
| Investor Growth Fund | Class A, Class C, Class I* and Class T** | Diversified | ||
| Investor Growth & Income Fund | Class A, Class C, Class I* and Class T** | Diversified |
| * | Effective April 3, 2017, Select Class was renamed Class I. |
| ** | Class T commenced operations on June 6, 2017. |
The investment objective of the Investor Balanced Fund is to seek high total return consistent with the preservation of capital by investing primarily in a diversified group of mutual funds within the same group of investment companies that invest primarily in equity and fixed income securities.
The investment objective of the Investor Conservative Growth Fund is to seek income and capital appreciation by investing primarily in a diversified group of mutual funds within the same group of investment companies that invest primarily in fixed income and equity securities.
The investment objective of the Investor Growth Fund is to seek long-term capital appreciation by investing primarily in a diversified group of mutual funds within the same group of investment companies that invest primarily in equity securities.
The investment objective of the Investor Growth & Income Fund is to seek long-term capital appreciation and growth of income by investing primarily in a diversified group of mutual funds within the same group of investment companies that invest primarily in equity securities.
Class A and Class T Shares generally provide for a front-end sales charge while Class C Shares provide for a contingent deferred sales charge (“CDSC”). No sales charges are assessed with respect to Class I Shares. All classes of shares have equal rights as to earnings, assets and voting privileges, except that each class may bear different transfer agency, sub-transfer agency (through April 2, 2017), distribution and shareholder servicing fees and each class has exclusive voting rights with respect to its distribution plan and shareholder servicing agreements. Effective April 3, 2017 sub-transfer agency and shareholder servicing fees were consolidated into a single service fee. Certain Class A Shares, for which front-end sales charges have been waived, may be subject to a CDSC as described in the Funds’ prospectus. Beginning on November 14, 2017, Class C Shares will automatically convert to Class A Shares after ten years.
J.P. Morgan Investment Management Inc. (“JPMIM”), an indirect, wholly-owned subsidiary of JPMorgan Chase & Co. (“JPMorgan”), acts as Adviser (the “Adviser”) and Administrator (the “Administrator”) to the Funds.
2. Significant Accounting Policies
The following is a summary of significant accounting policies followed by the Funds in the preparation of their financial statements. The Funds are investment companies and, accordingly, follow the investment company accounting and reporting guidance of the Financial Accounting Standards Board Accounting Standards Codification Topic 946 — Investment Companies, which is part of U.S. generally accepted accounting principles (“GAAP”). The preparation of financial statements in conformity with GAAP requires management to make estimates and assumptions that affect the reported amounts of assets and liabilities and disclosure of contingent assets and liabilities at the date of the financial statements and the reported amounts of increases and decreases in net assets from operations during the reporting period. Actual results could differ from those estimates.
A. Valuation of Investments — The valuation of investments is in accordance with GAAP and the Funds’ valuation policies set forth by and under the supervision and responsibility of the Board of Trustees (the “Board”), which established the following approach to valuation, as described more fully below: (i) investments for which market quotations are readily available shall be valued at such unadjusted quoted prices and (ii) all other investments for which market quotations are not readily available shall be valued at their fair value as determined in good faith by the Board.
The Administrator has established the J.P. Morgan Investment Management Americas Valuation Committee (“AVC”) to assist the Board with the oversight and monitoring of the valuation of the Funds’ investments. The Administrator implements the valuation policies of the Funds’ investments, as directed by the Board. The AVC oversees and carries out the policies for the valuation of investments held in the Funds. This includes monitoring the appropriateness of fair values based on results of ongoing valuation oversight, including but not limited to consideration of macro or security specific events, market events and pricing vendor and broker due diligence. The Administrator is responsible for discussing and assessing the potential impacts to the fair values on an ongoing basis, and at least on a quarterly basis with the AVC and the Board.
Investments in open-end investment companies (the “Underlying Funds”) are valued at each Underlying Fund’s net asset value per share (“NAV”) as of the report date.
Valuations reflected in this report are as of the report date. As a result, changes in valuation due to market events and/or issuer related events after the report date and prior to issuance of the report are not reflected herein.
| 32 | J.P. MORGAN INVESTOR FUNDS | JUNE 30, 2017 | ||||
Table of Contents
The various inputs that are used in determining the valuation of the Funds’ investments are summarized into the three broad levels listed below.
| • | Level 1 — Unadjusted inputs using quoted prices in active markets for identical investments. |
| • | Level 2 — Other significant observable inputs including, but not limited to, quoted prices for similar investments, inputs other than quoted prices that are observable for investments (such as interest rates, prepayment speeds, credit risk, etc.) or other market corroborated inputs. |
| • | Level 3 — Significant inputs based on the best information available in the circumstances, to the extent observable inputs are not available (including the Funds’ assumptions in determining the fair value of investments). |
A financial instrument’s level within the fair value hierarchy is based on the lowest level of any input, both individually and in the aggregate, that is significant to the fair value measurement. The inputs or methodology used for valuing instruments are not necessarily an indication of the risk associated with investing in those instruments.
The following table represents each valuation input as presented on the Schedules of Portfolio Investments (“SOIs”) (amounts in thousands):
Level 1 Quoted prices | Level 2 Other significant | Level 3 Significant | Total | |||||||||||||
Investor Balanced Fund | ||||||||||||||||
Total Investments in Securities (a) | $ | 4,964,097 | $ | — | $ | — | $ | 4,964,097 | ||||||||
|
|
|
|
|
|
|
| |||||||||
Investor Conservative Growth Fund | ||||||||||||||||
Total Investments in Securities (a) | $ | 3,786,249 | $ | — | $ | — | $ | 3,786,249 | ||||||||
|
|
|
|
|
|
|
| |||||||||
Investor Growth Fund | ||||||||||||||||
Total Investments in Securities (a) | $ | 2,556,709 | $ | — | $ | — | $ | 2,556,709 | ||||||||
|
|
|
|
|
|
|
| |||||||||
Investor Growth & Income Fund | ||||||||||||||||
Total Investments in Securities (a) | $ | 2,966,584 | $ | — | $ | — | $ | 2,966,584 | ||||||||
|
|
|
|
|
|
|
| |||||||||
| (a) | All portfolio holdings designated as level 1 are disclosed individually on the SOIs. Please refer to the SOIs for asset class specifics of portfolio holdings. |
There were no transfers among any levels during the year ended June 30, 2017.
B. Investment Transactions with Affiliates — The Funds invested in Underlying Funds advised by Adviser. An issuer which is under common control with a fund may be considered an affiliate. For the purposes of the financial statements, the Funds assume the issuers listed in the table below to be affiliated issuers. Underlying Funds’ distributions may be reinvested into the Underlying Funds. Reinvestment amounts are included in the purchase cost amounts in the table below. Included in the purchases and sales amounts in the table below are exchanges between certain share classes of the Underlying Funds. Such exchanges are not treated as purchases and sales for the purpose of recognizing realized gains (losses) or portfolio turnover. Included in the realized gain (loss) amounts in the tables below are distributions of realized capital gains, if any, received from the Underlying Funds (amounts in thousands):
| For the year ended June 30, 2017 | ||||||||||||||||||||||||||||
| Affiliate | Value at June 30, 2016 | Purchase Cost | Sales Proceeds | Realized Gain/(Loss) | Dividend Income | Shares at June 30, 2017 | Value at June 30, 2017 | |||||||||||||||||||||
Investor Balanced Fund | ||||||||||||||||||||||||||||
JPMorgan Commodities Strategy Fund, Class R6 Shares | $ | 6,200 | $ | — | $ | 6,207 | $ | (2,848 | ) | $ | — | — | $ | — | ||||||||||||||
JPMorgan Core Bond Fund, Class R6 Shares | 938,847 | 41,953 | 86,533 | 2,021 | 25,035 | 74,324 | 864,389 | |||||||||||||||||||||
JPMorgan Core Plus Bond Fund, Class R6 Shares | 546,164 | 14,786 | 53,047 | (711 | ) | 14,786 | 60,477 | 500,148 | ||||||||||||||||||||
JPMorgan Dynamic Growth Fund, Class R5 Shares | 110,509 | 1,324 | 42,076 | 11,164 | — | 3,039 | 98,716 | |||||||||||||||||||||
JPMorgan Emerging Economies Fund, Class R6 Shares | 54,574 | 914 | 4,226 | (399 | ) | 914 | 4,852 | 64,143 | ||||||||||||||||||||
JPMorgan Emerging Markets Debt Fund, Class R6 Shares | 56,669 | 2,781 | 9,948 | 94 | 2,781 | 6,049 | 49,783 | |||||||||||||||||||||
JPMorgan Emerging Markets Equity Fund, Class R6 Shares | 55,746 | 491 | 4,772 | 182 | 491 | 2,524 | 65,093 | |||||||||||||||||||||
JPMorgan Equity Income Fund, Class R6 Shares | 87,879 | 2,467 | 8,283 | 1,557 | 1,915 | 5,812 | 92,523 | |||||||||||||||||||||
JPMorgan Floating Rate Income Fund, Class R6 Shares | 180,386 | 7,350 | 28,476 | (2,153 | ) | 7,350 | 17,299 | 162,788 | ||||||||||||||||||||
JPMorgan Global Research Enhanced Index Fund, Class I Shares | 176,802 | 4,038 | 43,603 | 4,425 | 4,038 | 7,936 | 164,433 | |||||||||||||||||||||
JPMorgan Government Bond Fund, Select Class Shares | 12,611 | 25 | 11,862 | — | 25 | — | — | |||||||||||||||||||||
JPMorgan Government Bond Fund, Class R6 Shares | — | 12,044 | 12,281 | 280 | 139 | — | — | |||||||||||||||||||||
JPMorgan High Yield Fund, Class R6 Shares | 271,608 | 14,031 | 97,360 | (3,617 | ) | 14,031 | 26,885 | 200,025 | ||||||||||||||||||||
JPMorgan Inflation Managed Bond Fund, Class R6 Shares | 79,493 | 3,267 | 4,608 | (178 | ) | 1,674 | 7,551 | 77,323 | ||||||||||||||||||||
JPMorgan International Equity Fund, Class R6 Shares | 91,267 | 623 | 24,575 | (1,329 | ) | 623 | 5,132 | 85,137 | ||||||||||||||||||||
| JUNE 30, 2017 | J.P. MORGAN INVESTOR FUNDS | 33 | ||||||
Table of Contents
NOTES TO FINANCIAL STATEMENTS
AS OF JUNE 30, 2017 (continued)
| For the year ended June 30, 2017 | ||||||||||||||||||||||||||||
| Affiliate | Value at June 30, 2016 | Purchase Cost | Sales Proceeds | Realized Gain/(Loss) | Dividend Income | Shares at June 30, 2017 | Value at June 30, 2017 | |||||||||||||||||||||
JPMorgan International Research Enhanced Equity Fund, Class I Shares | $ | 259,490 | $ | 6,852 | $ | 38,481 | $ | (9,277 | ) | $ | 6,852 | 15,442 | $ | 275,639 | ||||||||||||||
JPMorgan Intrepid America Fund, Class R6 Shares | 309,701 | 15,700 | 25,519 | 12,338 | 4,512 | 8,582 | 337,614 | |||||||||||||||||||||
JPMorgan Intrepid European Fund, Class L Shares | 100,729 | 2,542 | 3,054 | (207 | ) | 2,542 | 4,600 | 119,913 | ||||||||||||||||||||
JPMorgan Intrepid Growth Fund, Class R6 Shares | 160,300 | 4,565 | 27,615 | 13,611 | 1,904 | 3,474 | 169,306 | |||||||||||||||||||||
JPMorgan Intrepid Mid Cap Fund, Class R6 Shares | 122,104 | 754 | 42,265 | 7,469 | 730 | 4,167 | 96,886 | |||||||||||||||||||||
JPMorgan Large Cap Growth Fund, Class R6 Shares | 57,760 | 8,878 | 11,545 | 5,947 | — | 1,668 | 65,438 | |||||||||||||||||||||
JPMorgan Large Cap Value Fund, Class R6 Shares | 133,167 | 7,630 | 39,716 | 13,331 | 1,835 | 8,412 | 128,533 | |||||||||||||||||||||
JPMorgan Latin America Fund, Class R6 Shares | 17,757 | 238 | 9,735 | (3,444 | ) | 238 | 700 | 10,122 | ||||||||||||||||||||
JPMorgan Limited Duration Bond Fund, Class R6 Shares | 216,563 | 3,151 | 14,052 | (33 | ) | 3,151 | 20,504 | 205,654 | ||||||||||||||||||||
JPMorgan Liquid Assets Money Market Fund, Institutional Class Shares | 43,539 | 67,642 | 111,181 | — | 21 | — | — | |||||||||||||||||||||
JPMorgan Market Expansion Enhanced Index Fund, Class I Shares | 207,074 | 19,551 | 85,338 | 18,187 | 1,704 | 13,635 | 158,985 | |||||||||||||||||||||
JPMorgan Mid Cap Growth Fund, Class R6 Shares | 4,612 | 2 | 5,111 | 1,111 | — | — | — | |||||||||||||||||||||
JPMorgan Multi-Cap Market Neutral Fund, Class I Shares | 68,256 | — | 19,560 | 862 | — | 4,850 | 49,614 | |||||||||||||||||||||
JPMorgan Research Market Neutral Fund, Class L Shares | 85,390 | — | 39,966 | (1,974 | ) | — | 3,257 | 49,629 | ||||||||||||||||||||
JPMorgan Small Cap Value Fund, Class R6 Shares | 18,771 | 180 | — | 14 | 166 | 728 | 22,448 | |||||||||||||||||||||
JPMorgan Strategic Income Opportunities Fund, Class R5 Shares | 88,278 | 7,769 | 1,997 | (48 | ) | 4,060 | 8,273 | 96,465 | ||||||||||||||||||||
JPMorgan Systematic Alpha Fund, Class R6 Shares | 89,078 | 381 | — | 170 | 211 | 5,983 | 91,901 | |||||||||||||||||||||
JPMorgan U.S. Dynamic Plus Fund, Class I Shares | 41,714 | — | 43,857 | 12,793 | — | — | — | |||||||||||||||||||||
JPMorgan U.S. Equity Fund, Class R6 Shares | 432,819 | 21,793 | 38,136 | 19,976 | 5,463 | 30,316 | 481,111 | |||||||||||||||||||||
JPMorgan U.S. Government Money Market Fund, Institutional Class Shares | — | 664,760 | 619,956 | — | 201 | 44,804 | 44,804 | |||||||||||||||||||||
JPMorgan U.S. Large Cap Core Plus Fund, Class R5 Shares | 165,163 | 5,966 | 189,786 | 82,056 | 638 | — | — | |||||||||||||||||||||
JPMorgan Unconstrained Debt Fund, Class R6 Shares | 19,002 | 23,409 | — | — | 679 | 4,284 | 42,843 | |||||||||||||||||||||
JPMorgan Value Advantage Fund, Class R6 Shares | — | 78,233 | 17,066 | 1,973 | 1,349 | 2,758 | 92,691 | |||||||||||||||||||||
JPMorgan Value Advantage Fund, Institutional Class Shares | 93,526 | — | 76,885 | — | — | — | — | |||||||||||||||||||||
|
|
|
|
|
|
|
| |||||||||||||||||||||
Total | $ | 5,403,548 | $ | 183,343 | $ | 110,058 | $ | 4,964,097 | ||||||||||||||||||||
|
|
|
|
|
|
|
| |||||||||||||||||||||
| For the year ended June 30, 2017 | ||||||||||||||||||||||||||||
| Affiliate | Value at June 30, 2016 | Purchase Cost | Sales Proceeds | Realized Gain/(Loss) | Dividend Income | Shares at June 30, 2017 | Value at June 30, 2017 | |||||||||||||||||||||
Investor Conservative Growth Fund | ||||||||||||||||||||||||||||
JPMorgan Commodities Strategy Fund, Class R6 Shares | $ | 5,157 | $ | — | $ | 5,180 | $ | (2,344 | ) | $ | — | — | $ | — | ||||||||||||||
JPMorgan Core Bond Fund, Class R6 Shares | 1,153,962 | 34,399 | 120,293 | 2,526 | 30,249 | 88,715 | 1,031,757 | |||||||||||||||||||||
JPMorgan Core Plus Bond Fund, Class R6 Shares | 562,340 | 14,960 | 81,536 | (951 | ) | 14,960 | 58,943 | 487,454 | ||||||||||||||||||||
JPMorgan Dynamic Growth Fund, Class R5 Shares | 46,874 | 573 | 15,750 | 3,730 | — | 1,368 | 44,445 | |||||||||||||||||||||
JPMorgan Emerging Economies Fund, Class R6 Shares | 24,918 | 8,214 | 1,639 | (140 | ) | 415 | 2,878 | 38,041 | ||||||||||||||||||||
JPMorgan Emerging Markets Debt Fund, Class R6 Shares | 40,915 | 2,092 | 5,138 | 10 | 2,092 | 4,622 | 38,039 | |||||||||||||||||||||
JPMorgan Emerging Markets Equity Fund, Class R6 Shares | 26,155 | 5,569 | 864 | 11 | 232 | 1,475 | 38,035 | |||||||||||||||||||||
JPMorgan Equity Income Fund, Class R6 Shares | 70,211 | 1,962 | 11,958 | 3,356 | 1,513 | 4,310 | 68,607 | |||||||||||||||||||||
JPMorgan Floating Rate Income Fund, Class R6 Shares | 164,685 | 7,062 | 31,997 | (2,299 | ) | 7,062 | 15,211 | 143,137 | ||||||||||||||||||||
JPMorgan Global Research Enhanced Index Fund, Class I Shares | 48,469 | 1,130 | 11,285 | 1,395 | 1,130 | 2,211 | 45,813 | |||||||||||||||||||||
JPMorgan Government Bond Fund, Class R6 Shares | — | 40,611 | 1,973 | 39 | 807 | 3,751 | 39,574 | |||||||||||||||||||||
JPMorgan Government Bond Fund, Select Class Shares | 34,923 | 70 | 32,711 | — | 70 | — | — | |||||||||||||||||||||
JPMorgan High Yield Fund, Class R6 Shares | 236,495 | 11,960 | 139,297 | (161 | ) | 11,960 | 16,081 | 119,641 | ||||||||||||||||||||
JPMorgan Income Fund, Class R6 Shares | — | 70,377 | — | — | 377 | 7,410 | 70,397 | |||||||||||||||||||||
JPMorgan Inflation Managed Bond Fund, Class R6 Shares | 99,359 | 1,850 | 29,045 | (659 | ) | 1,850 | 6,965 | 71,322 | ||||||||||||||||||||
JPMorgan International Equity Fund, Class R6 Shares | 42,123 | 295 | 6,358 | (533 | ) | 295 | 2,687 | 44,583 | ||||||||||||||||||||
JPMorgan International Research Enhanced Equity Fund, Class I Shares | 145,828 | 3,746 | 31,404 | (7,091 | ) | 3,746 | 8,067 | 143,997 | ||||||||||||||||||||
| 34 | J.P. MORGAN INVESTOR FUNDS | JUNE 30, 2017 | ||||
Table of Contents
| For the year ended June 30, 2017 | ||||||||||||||||||||||||||||
| Affiliate | Value at June 30, 2016 | Purchase Cost | Sales Proceeds | Realized Gain/(Loss) | Dividend Income | Shares at June 30, 2017 | Value at June 30, 2017 | |||||||||||||||||||||
JPMorgan Intrepid America Fund, Class R6 Shares | $ | 182,553 | $ | 22,624 | $ | 24,063 | $ | 10,336 | $ | 2,546 | 5,166 | $ | 203,213 | |||||||||||||||
JPMorgan Intrepid European Fund, Class L Shares | 46,091 | 1,163 | 6,135 | (1,120 | ) | 1,163 | 1,900 | 49,537 | ||||||||||||||||||||
JPMorgan Intrepid Growth Fund, Class R6 Shares | 101,993 | 1,160 | 23,561 | 11,649 | 1,160 | 2,033 | 99,108 | |||||||||||||||||||||
JPMorgan Intrepid Mid Cap Fund, Class R6 Shares | 50,538 | 312 | 57,192 | 21,957 | 302 | — | — | |||||||||||||||||||||
JPMorgan Large Cap Value Fund, Class R6 Shares | 19,358 | 2,967 | 1,548 | 1,023 | 323 | 1,638 | 25,031 | |||||||||||||||||||||
JPMorgan Latin America Fund, Class R6 Shares | 11,426 | 162 | 12,229 | (4,070 | ) | 162 | — | — | ||||||||||||||||||||
JPMorgan Limited Duration Bond Fund, Class R6 Shares | 345,089 | 4,920 | 36,560 | (70 | ) | 4,920 | 31,245 | 313,389 | ||||||||||||||||||||
JPMorgan Liquid Assets Money Market Fund, Institutional Class Shares | 38,258 | 51,935 | 90,193 | — | 18 | — | — | |||||||||||||||||||||
JPMorgan Market Expansion Enhanced Index Fund, Class I Shares | 60,194 | 6,112 | 22,326 | 5,425 | 524 | 4,220 | 49,201 | |||||||||||||||||||||
JPMorgan Mid Cap Growth Fund, Class R6 Shares | 38,493 | 17 | 7,796 | 1,098 | — | 1,192 | 38,378 | |||||||||||||||||||||
JPMorgan Multi-Cap Market Neutral Fund, Class I Shares | 60,135 | — | 22,627 | 1,186 | — | 3,741 | 38,275 | |||||||||||||||||||||
JPMorgan Research Market Neutral Fund, Class L Shares | 67,488 | — | 32,630 | (1,705 | ) | — | 2,494 | 38,011 | ||||||||||||||||||||
JPMorgan Small Cap Value Fund, Class R6 Shares | 32,495 | 241 | 13,825 | 772 | 223 | 797 | 24,562 | |||||||||||||||||||||
JPMorgan Strategic Income Opportunities Fund, Class R5 Shares | 97,157 | 3,757 | 31,744 | (796 | ) | 3,757 | 6,157 | 71,794 | ||||||||||||||||||||
JPMorgan Systematic Alpha Fund, Class R6 Shares | 82,983 | 8,558 | 2,105 | 153 | 191 | 5,971 | 91,720 | |||||||||||||||||||||
JPMorgan U.S. Dynamic Plus Fund, Class I Shares | 20,696 | — | 22,141 | 8,005 | — | — | — | |||||||||||||||||||||
JPMorgan U.S. Equity Fund, Class R6 Shares | 178,973 | 8,258 | 28,454 | 13,268 | 2,099 | 11,600 | 184,085 | |||||||||||||||||||||
JPMorgan U.S. Government Money Market Fund, Institutional Class Shares | — | 556,316 | 521,987 | — | 155 | 34,329 | 34,329 | |||||||||||||||||||||
JPMorgan U.S. Large Cap Core Plus Fund, Class R5 Shares | 69,024 | 2,006 | 78,511 | 36,320 | 219 | — | — | |||||||||||||||||||||
JPMorgan Unconstrained Debt Fund, Class R6 Shares | 17,575 | 17,923 | — | — | (a) | 622 | 3,588 | 35,884 | ||||||||||||||||||||
JPMorgan Value Advantage Fund, Class R6 Shares | — | 45,735 | 13,826 | 1,522 | 971 | 1,931 | 64,890 | |||||||||||||||||||||
JPMorgan Value Advantage Fund, Institutional Class Shares | 67,250 | — | 44,763 | — | — | — | — | |||||||||||||||||||||
|
|
|
|
|
|
|
| |||||||||||||||||||||
Total | $ | 4,290,183 | $ | 101,842 | $ | 96,113 | $ | 3,786,249 | ||||||||||||||||||||
|
|
|
|
|
|
|
| |||||||||||||||||||||
| For the year ended June 30, 2017 | ||||||||||||||||||||||||||||
| Affiliate | Value at June 30, 2016 | Purchase Cost | Sales Proceeds | Realized Gain/(Loss) | Dividend Income | Shares at June 30, 2017 | Value at June 30, 2017 | |||||||||||||||||||||
Investor Growth Fund | ||||||||||||||||||||||||||||
JPMorgan Commodities Strategy Fund, Class R6 Shares | $ | 7,169 | $ | 3,369 | $ | — | $ | — | $ | — | 1,131 | $ | 9,819 | |||||||||||||||
JPMorgan Core Bond Fund, Class R6 Shares | 81,438 | 36,752 | 1,534 | 278 | 2,636 | 9,827 | 114,284 | |||||||||||||||||||||
JPMorgan Core Plus Bond Fund, Class R6 Shares | 28,568 | 790 | 764 | (16 | ) | 790 | 3,408 | 28,184 | ||||||||||||||||||||
JPMorgan Dynamic Growth Fund, Class R5 Shares | 24,640 | 295 | 13,312 | 3,166 | — | 549 | 17,839 | |||||||||||||||||||||
JPMorgan Emerging Economies Fund, Class R6 Shares | 42,824 | 725 | 4,132 | (634 | ) | 725 | 3,732 | 49,335 | ||||||||||||||||||||
JPMorgan Emerging Markets Debt Fund, Class R6 Shares | 11,118 | 1,922 | 255 | (8 | ) | 610 | 1,560 | 12,842 | ||||||||||||||||||||
JPMorgan Emerging Markets Equity Fund, Class R6 Shares | 44,876 | 395 | 5,945 | (159 | ) | 395 | 1,935 | 49,903 | ||||||||||||||||||||
JPMorgan Equity Income Fund, Class R6 Shares | 37,598 | 3,974 | — | 241 | 858 | 2,898 | 46,135 | |||||||||||||||||||||
JPMorgan Floating Rate Income Fund, Class R6 Shares | 21,553 | 944 | 1,290 | (55 | ) | 944 | 2,299 | 21,633 | ||||||||||||||||||||
JPMorgan Global Research Enhanced Index Fund, Class I Shares | 64,521 | 2,558 | 5,166 | 386 | 1,505 | 3,494 | 72,386 | |||||||||||||||||||||
JPMorgan High Yield Fund, Class R6 Shares | 80,953 | 4,586 | 18,840 | 598 | 4,586 | 9,449 | 70,302 | |||||||||||||||||||||
JPMorgan Inflation Managed Bond Fund, Class R6 Shares | 11,421 | 122 | 11,445 | 201 | 122 | 8 | 83 | |||||||||||||||||||||
JPMorgan International Equity Fund, Class R6 Shares | 98,774 | 1,559 | 6,741 | (80 | ) | 775 | 6,958 | 115,430 | ||||||||||||||||||||
JPMorgan International Research Enhanced Equity Fund, Class I Shares | 129,244 | 25,738 | 2,064 | (524 | ) | 3,413 | 10,106 | 180,397 | ||||||||||||||||||||
JPMorgan International Unconstrained Equity Fund, Class R6 Shares | 51,818 | 13,885 | — | — | (a) | 1,319 | 3,877 | 76,454 | ||||||||||||||||||||
JPMorgan Intrepid America Fund, Class R6 Shares | 266,407 | 11,486 | 10,522 | 8,026 | 3,965 | 7,639 | 300,516 | |||||||||||||||||||||
JPMorgan Intrepid European Fund, Class L Shares | 65,631 | 8,172 | 779 | (53 | ) | 1,656 | 3,318 | 86,498 | ||||||||||||||||||||
JPMorgan Intrepid Growth Fund, Class R6 Shares | 124,488 | 1,454 | 22,783 | 12,408 | 1,454 | 2,614 | 127,427 | |||||||||||||||||||||
JPMorgan Intrepid Mid Cap Fund, Class R6 Shares | 82,866 | 512 | 48,979 | 12,231 | 496 | 1,938 | 45,064 | |||||||||||||||||||||
| JUNE 30, 2017 | J.P. MORGAN INVESTOR FUNDS | 35 | ||||||
Table of Contents
NOTES TO FINANCIAL STATEMENTS
AS OF JUNE 30, 2017 (continued)
| For the year ended June 30, 2017 | ||||||||||||||||||||||||||||
| Affiliate | Value at June 30, 2016 | Purchase Cost | Sales Proceeds | Realized Gain/ (Loss) | Dividend Income | Shares at June 30, 2017 | Value at June 30, 2017 | |||||||||||||||||||||
JPMorgan Large Cap Growth Fund, Class R6 Shares | $ | 182,188 | $ | 16,554 | $ | 31,499 | $ | 21,852 | $ | — | 5,073 | $ | 199,016 | |||||||||||||||
JPMorgan Large Cap Value Fund, Class R6 Shares | 233,933 | 15,009 | 40,950 | 12,334 | 3,501 | 16,867 | 257,728 | |||||||||||||||||||||
JPMorgan Latin America Fund, Class R6 Shares | 10,654 | 2,356 | 4,295 | (1,685 | ) | 153 | 692 | 10,006 | ||||||||||||||||||||
JPMorgan Liquid Assets Money Market Fund, Institutional Class Shares | 24,355 | 26,089 | 50,444 | — | 10 | — | — | |||||||||||||||||||||
JPMorgan Market Expansion Enhanced Index Fund, Class I Shares | 144,700 | 14,669 | 28,052 | 11,648 | 1,278 | 12,299 | 143,402 | |||||||||||||||||||||
JPMorgan Mid Cap Growth Fund, Class R6 Shares | 30,919 | 2,604 | 5,978 | 271 | — | 1,041 | 33,536 | |||||||||||||||||||||
JPMorgan Multi-Cap Market Neutral Fund, Class I Shares | 5,895 | — | 6,049 | 410 | — | — | — | |||||||||||||||||||||
JPMorgan Research Market Neutral Fund, Class L Shares | 6,185 | — | 6,393 | (1 | ) | — | — | — | ||||||||||||||||||||
JPMorgan Small Cap Value Fund, Class R6 Shares | 45,661 | 2,961 | 22,679 | 11,865 | 304 | 1,077 | 33,213 | |||||||||||||||||||||
JPMorgan Strategic Income Opportunities Fund, Class R5 Shares | 4,771 | 132 | 5,052 | (30 | ) | 132 | — | — | ||||||||||||||||||||
JPMorgan Systematic Alpha Fund, Class R6 Shares | 21,225 | 3,999 | — | 41 | 50 | 1,680 | 25,805 | |||||||||||||||||||||
JPMorgan U.S. Dynamic Plus Fund, Class I Shares | 21,943 | — | 22,637 | 5,725 | — | — | — | |||||||||||||||||||||
JPMorgan U.S. Equity Fund, Class R6 Shares | 308,126 | 15,787 | 13,122 | 12,718 | 3,978 | 22,517 | 357,350 | |||||||||||||||||||||
JPMorgan U.S. Government Money Market Fund, Institutional Class Shares | — | 254,604 | 230,009 | — | 104 | 24,595 | 24,595 | |||||||||||||||||||||
JPMorgan U.S. Large Cap Core Plus Fund, Class R5 Shares | 87,118 | 3,788 | 101,634 | 40,189 | 413 | — | — | |||||||||||||||||||||
JPMorgan Unconstrained Debt Fund, Class R6 Shares | 4,006 | 115 | 4,101 | (208 | ) | 115 | — | — | ||||||||||||||||||||
JPMorgan Value Advantage Fund, Class R6 Shares | — | 31,249 | 1,552 | 112 | 699 | 1,414 | 47,527 | |||||||||||||||||||||
JPMorgan Value Advantage Fund, Institutional Class Shares | 41,521 | — | 30,550 | — | — | — | — | |||||||||||||||||||||
|
|
|
|
|
|
|
| |||||||||||||||||||||
Total | $ | 2,449,107 | $ | 151,247 | $ | 36,986 | $ | 2,556,709 | ||||||||||||||||||||
|
|
|
|
|
|
|
| |||||||||||||||||||||
| For the year ended June 30, 2017 | ||||||||||||||||||||||||||||
| Affiliate | Value at June 30, 2016 | Purchase Cost | Sales Proceeds | Realized Gain/ (Loss) | Dividend Income | Shares at June 30, 2017 | Value at June 30, 2017 | |||||||||||||||||||||
Investor Growth & Income Fund | ||||||||||||||||||||||||||||
JPMorgan Commodities Strategy Fund, Class R6 Shares | $ | 10,475 | $ | 2,205 | $ | 2,770 | $ | (1,530 | ) | $ | — | 1,054 | $ | 9,152 | ||||||||||||||
JPMorgan Core Bond Fund, Class R6 Shares | 292,649 | 39,974 | 11,676 | 775 | 8,263 | 26,807 | 311,768 | |||||||||||||||||||||
JPMorgan Core Plus Bond Fund, Class R6 Shares | 201,262 | 9,582 | 20,784 | (324 | ) | 5,451 | 22,637 | 187,208 | ||||||||||||||||||||
JPMorgan Dynamic Growth Fund, Class R5 Shares | 44,525 | 503 | 26,744 | 6,629 | — | 890 | 28,903 | |||||||||||||||||||||
JPMorgan Emerging Economies Fund, Class R6 Shares | 46,267 | 725 | 10,126 | (1,448 | ) | 725 | 3,550 | 46,927 | ||||||||||||||||||||
JPMorgan Emerging Markets Debt Fund, Class R6 Shares | 18,372 | 855 | 4,385 | 55 | 855 | 1,815 | 14,941 | |||||||||||||||||||||
JPMorgan Emerging Markets Equity Fund, Class R6 Shares | 43,901 | 370 | 6,970 | (21 | ) | 369 | 1,840 | 47,446 | ||||||||||||||||||||
JPMorgan Equity Income Fund, Class R6 Shares | 51,155 | 1,430 | 3,402 | 636 | 1,111 | 3,471 | 55,256 | |||||||||||||||||||||
JPMorgan Floating Rate Income Fund, Class R6 Shares | 116,720 | 4,911 | 26,314 | (1,863 | ) | 4,911 | 10,382 | 97,698 | ||||||||||||||||||||
JPMorgan Global Research Enhanced Index Fund, Class I Shares | 113,931 | 2,586 | 29,679 | 2,823 | 2,586 | 5,028 | 104,179 | |||||||||||||||||||||
JPMorgan Government Bond Fund, Class R6 Shares | — | 11,865 | 11,282 | (543 | ) | 153 | — | — | ||||||||||||||||||||
JPMorgan Government Bond Fund, Select Class Shares | 11,627 | 23 | 11,672 | — | 23 | — | — | |||||||||||||||||||||
JPMorgan High Yield Fund, Class R6 Shares | 153,834 | 7,987 | 48,725 | (1,459 | ) | 7,987 | 16,090 | 119,711 | ||||||||||||||||||||
JPMorgan Inflation Managed Bond Fund, Class R6 Shares | 40,274 | 2,433 | 1,537 | (72 | ) | 856 | 3,978 | 40,738 | ||||||||||||||||||||
JPMorgan International Equity Fund, Class R6 Shares | 103,204 | 639 | 42,390 | (1,927 | ) | 639 | 4,860 | 80,630 | ||||||||||||||||||||
JPMorgan International Research Enhanced Equity Fund, Class I Shares | 144,143 | 3,806 | 17,159 | (6,043 | ) | 3,806 | 8,824 | 157,511 | ||||||||||||||||||||
JPMorgan International Unconstrained Equity Fund, Class R6 Shares | 10,786 | 19,028 | — | — | 526 | 1,710 | 33,729 | |||||||||||||||||||||
JPMorgan Intrepid America Fund, Class R6 Shares | 298,418 | 16,346 | 29,179 | 12,278 | 4,340 | 8,189 | 322,151 | |||||||||||||||||||||
JPMorgan Intrepid European Fund, Class L Shares | 77,853 | 1,965 | 3,136 | (603 | ) | 1,965 | 3,512 | 91,556 | ||||||||||||||||||||
JPMorgan Intrepid Growth Fund, Class R6 Shares | 94,346 | 2,687 | 18,666 | 9,384 | 1,102 | 1,987 | 96,834 | |||||||||||||||||||||
JPMorgan Intrepid Mid Cap Fund, Class R6 Shares | 49,102 | 303 | 25,310 | 4,580 | 294 | 1,319 | 30,658 | |||||||||||||||||||||
JPMorgan Large Cap Growth Fund, Class R6 Shares | 163,865 | 14,734 | 43,410 | 23,143 | — | 4,133 | 162,136 | |||||||||||||||||||||
JPMorgan Large Cap Value Fund, Class R6 Shares | 174,743 | 10,535 | 46,913 | 13,380 | 2,484 | 11,480 | 175,420 | |||||||||||||||||||||
JPMorgan Latin America Fund, Class R6 Shares | 8,737 | 4,086 | 6,002 | (1,874 | ) | 86 | 553 | 7,995 | ||||||||||||||||||||
| 36 | J.P. MORGAN INVESTOR FUNDS | JUNE 30, 2017 | ||||
Table of Contents
| For the year ended June 30, 2017 | ||||||||||||||||||||||||||||
| Affiliate | Value at June 30, 2016 | Purchase Cost | Sales Proceeds | Realized Gain/ (Loss) | Dividend Income | Shares at June 30, 2017 | Value at June 30, 2017 | |||||||||||||||||||||
JPMorgan Limited Duration Bond Fund, Class R6 Shares | $ | 23,785 | $ | 10,512 | $ | 3,379 | $ | (1 | ) | $ | 405 | 3,085 | $ | 30,939 | ||||||||||||||
JPMorgan Liquid Assets Money Market Fund, Institutional Class Shares | 27,170 | 51,340 | 78,510 | — | 12 | — | — | |||||||||||||||||||||
JPMorgan Market Expansion Enhanced Index Fund, Class I Shares | 130,847 | 13,557 | 38,793 | 14,558 | 1,168 | 10,026 | 116,903 | |||||||||||||||||||||
JPMorgan Mid Cap Growth Fund, Class R6 Shares | 27,325 | 2,527 | 4,612 | 311 | — | 954 | 30,734 | |||||||||||||||||||||
JPMorgan Multi-Cap Market Neutral Fund, Class I Shares | 32,110 | — | 10,354 | 417 | — | 2,165 | 22,149 | |||||||||||||||||||||
JPMorgan Research Market Neutral Fund, Class L Shares | 37,009 | — | 16,312 | (619 | ) | — | 1,472 | 22,440 | ||||||||||||||||||||
JPMorgan Small Cap Value Fund, Class R6 Shares | 45,192 | 1,929 | 16,806 | 3,683 | 315 | 1,232 | 37,972 | |||||||||||||||||||||
JPMorgan Strategic Income Opportunities Fund, Class R5 Shares | 22,696 | 4,863 | — | — | 1,091 | 2,416 | 28,170 | |||||||||||||||||||||
JPMorgan Systematic Alpha Fund, Class R6 Shares | 45,731 | 195 | — | 87 | 108 | 3,072 | 47,180 | |||||||||||||||||||||
JPMorgan U.S. Dynamic Plus Fund, Class I Shares | 29,546 | — | 30,561 | 7,928 | — | — | — | |||||||||||||||||||||
JPMorgan U.S. Equity Fund, Class R6 Shares | 294,894 | 14,813 | 25,690 | 13,225 | 3,727 | 20,677 | 328,150 | |||||||||||||||||||||
JPMorgan U.S. Government Money Market Fund, Institutional Class Shares | — | 405,865 | 381,480 | — | 118 | 24,385 | 24,385 | |||||||||||||||||||||
JPMorgan U.S. Large Cap Core Plus Fund, Class R5 Shares | 91,877 | 3,717 | 105,793 | 43,753 | 391 | — | — | |||||||||||||||||||||
JPMorgan Unconstrained Debt Fund, Class R6 Shares | 11,095 | 319 | 11,399 | (509 | ) | 319 | — | — | ||||||||||||||||||||
JPMorgan Value Advantage Fund, Class R6 Shares | — | 40,790 | 9,358 | 936 | 805 | 1,637 | 55,015 | |||||||||||||||||||||
JPMorgan Value Advantage Fund, Institutional Class Shares | 54,967 | — | 39,985 | — | — | — | — | |||||||||||||||||||||
|
|
|
|
|
|
|
| |||||||||||||||||||||
Total | $ | 3,144,433 | $ | 139,745 | $ | 56,991 | $ | 2,966,584 | ||||||||||||||||||||
|
|
|
|
|
|
|
| |||||||||||||||||||||
| (a) | Amount rounds to less than 500. |
C. Security Transactions and Investment Income — Investment transactions are accounted for on the trade date (the date the order to buy or sell is executed). Securities gains and losses are calculated on a specifically identified cost basis. Distributions of net investment income and realized capital gains from the Underlying Funds are recorded on the ex-dividend date.
D. Allocation of Income and Expenses — Expenses directly attributable to a fund are charged directly to that fund, while the expenses attributable to more than one fund of the Trust are allocated among the respective funds. In calculating the NAV of each class, investment income, realized and unrealized gains and losses and expenses, other than class specific expenses, are allocated daily to each class of shares based upon the proportion of net assets of each class at the beginning of each day.
Transfer agency fees are class-specific expenses and sub-transfer agency fees were class-specific expenses up through April 2, 2017. Effective April 3, 2017, the Funds ceased making direct payments to financial intermediaries for any applicable sub-transfer agency services. Payments to financial intermediaries for sub-transfer agency services are made by JPMorgan Distribution Services, Inc. from the Shareholder Servicing Fee, which has been renamed as the Service Fee. The amount of the transfer agency fees and sub-transfer agency fees charged to each class of the Funds for the year ended June 30, 2017 are as follows (amounts in thousands):
| Class A | Class C | Class I | Class T | Total | ||||||||||||||||
Investor Balanced Fund | ||||||||||||||||||||
Transfer agency fees | $ | 371 | $ | 50 | $ | 14 | $ | — | $ | 435 | ||||||||||
Sub-transfer agency fees | 823 | 263 | 26 | — | 1,112 | |||||||||||||||
Investor Conservative Growth Fund | ||||||||||||||||||||
Transfer agency fees | 183 | 45 | 16 | — | 244 | |||||||||||||||
Sub-transfer agency fees | 491 | 323 | 20 | — | 834 | |||||||||||||||
Investor Growth Fund | ||||||||||||||||||||
Transfer agency fees | 619 | 46 | 19 | — | 684 | |||||||||||||||
Sub-transfer agency fees | 688 | 114 | 17 | — | 819 | |||||||||||||||
Investor Growth & Income Fund | ||||||||||||||||||||
Transfer agency fees | 487 | 36 | 11 | — | 534 | |||||||||||||||
Sub-transfer agency fees | 696 | 128 | 20 | — | 844 | |||||||||||||||
The Funds invest in other J.P. Morgan Funds and, as a result, bear a portion of the expenses incurred by the Underlying Funds. These expenses are not reflected in the expenses shown on the Statements of Operations and are not included in the ratios to average net assets shown on the Financial Highlights. Certain expenses of Underlying Funds are waived as described in Note 3.F.
E. Federal Income Taxes — Each Fund is treated as a separate taxable entity for Federal income tax purposes. Each Fund’s policy is to comply with the provisions of the Internal Revenue Code of 1986, as amended (the “Code”), applicable to regulated investment companies and to distribute to
| JUNE 30, 2017 | J.P. MORGAN INVESTOR FUNDS | 37 | ||||||
Table of Contents
NOTES TO FINANCIAL STATEMENTS
AS OF JUNE 30, 2017 (continued)
shareholders all of its distributable net investment income and net realized capital gains on investments. Accordingly, no provision for Federal income tax is necessary. Management has reviewed the Funds’ tax positions for all open tax years and has determined that as of June 30, 2017, no liability for income tax is required in the Funds’ financial statements for net unrecognized tax benefits. However, management’s conclusions may be subject to future review based on changes in, or the interpretation of, the accounting standards or tax laws and regulations. Each of the Funds’ Federal tax returns for the prior three fiscal years remains subject to examination by the Internal Revenue Service.
F. Distributions to Shareholders — Distributions from net investment income are generally declared and paid quarterly, except for distributions from the Investor Conservative Growth Fund, for which distributions are generally declared and paid monthly. Distributions are declared separately for each class. No class has preferential dividend rights; differences in per share rates are due to differences in separate class expenses. Net realized capital gains, if any, are distributed by each Fund at least annually. The amount of distributions from net investment income and net realized capital gains is determined in accordance with Federal income tax regulations, which may differ from GAAP. To the extent these “book/tax” differences are permanent in nature (i.e., that they result from other than timing of recognition — “temporary differences”), such amounts are reclassified within the capital accounts based on their Federal tax-basis treatment.
The following amounts were reclassified within the capital accounts (amounts in thousands):
| Paid-in-Capital | Accumulated undistributed (distributions in excess of) net investment income | Accumulated net realized gains (losses) | ||||||||||
Investor Balanced Fund | $ | — | $ | 1,768 | $ | (1,768 | ) | |||||
Investor Conservative Growth Fund | — | 676 | (676 | ) | ||||||||
Investor Growth Fund | — | 2,749 | (2,749 | ) | ||||||||
Investor Growth & Income Fund | — | 2,052 | (2,052 | ) | ||||||||
The reclassifications for the Funds relate primarily to investments in regulated investment companies.
3. Fees and Other Transactions with Affiliates
A. Investment Advisory Fee — Pursuant to an Investment Advisory Agreement, the Adviser supervises the investments of each Fund and for such services is paid a fee. The fee is accrued daily and paid monthly at an annual rate of 0.05% of each Fund’s average daily net assets.
The Adviser waived Investment Advisory fees and/or reimbursed expenses as outlined in Note 3.F.
B. Administration Fee — Pursuant to an Administration Agreement, the Administrator provides certain administration services to the Funds. In consideration of these services, the Administrator receives a fee accrued daily and paid monthly at an annual rate of 0.10% of the first $500 million of the average daily net assets, 0.075% of the average daily net assets between $500 million and $1 billion of such funds and 0.05% of the average daily net assets in excess of $1 billion of such funds. For the year ended June 30, 2017, the effective rate was 0.06% of each Fund’s average daily net assets, notwithstanding any fee waivers and/or expense reimbursements.
The Administrator waived Administration fees as outlined in Note 3.F.
JPMorgan Chase Bank, N.A. (“JPMCB”), a wholly-owned subsidiary of JPMorgan, serves as the Funds’ sub-administrator (the “Sub-administrator”). For its services as Sub-administrator, JPMCB receives a portion of the fees payable to the Administrator.
C. Distribution Fees — Pursuant to a Distribution Agreement, JPMorgan Distribution Services, Inc. (“JPMDS”), a wholly-owned subsidiary of JPMorgan, serves as the Trust’s principal underwriter and promotes and arranges for the sale of each Fund’s shares.
The Board has adopted a Distribution Plan (the “Distribution Plan”) for Class A, Class C and Class T Shares of the Funds in accordance with Rule 12b-1 under the 1940 Act. Class I Shares do not charge distribution fees. The Distribution Plan provides that each Fund shall pay distribution fees, including payments to JPMDS, at annual rates of the average daily net assets as shown in the table below:
| Class A | Class C | Class T | ||||||
| 0.25% | 0.75% | 0.25 | % | |||||
In addition, JPMDS is entitled to receive the front-end sales charges from purchases of Class A and Class T Shares and the CDSC from redemptions of Class C Shares and certain Class A and Class T Shares for which front-end sales charges have been waived. For the year ended June 30, 2017, JPMDS retained the following amounts (in thousands):
| Front-End Sales Charge | CDSC | |||||||
Investor Balanced Fund | $ | 736 | $ | 4 | ||||
Investor Conservative Growth Fund | 435 | 3 | ||||||
Investor Growth Fund | 341 | 2 | ||||||
Investor Growth & Income Fund | 380 | 3 | ||||||
| 38 | J.P. MORGAN INVESTOR FUNDS | JUNE 30, 2017 | ||||
Table of Contents
D. Service Fees — The Trust, on behalf of the Funds, has entered into a Shareholder Servicing Agreement with JPMDS under which JPMDS provides certain support services to the shareholders. For performing these services, JPMDS receives a fee that is accrued daily and paid monthly at an annual rate of 0.25% of the Funds’ average daily net assets.
JPMDS has entered into shareholder services contracts with affiliated and unaffiliated financial intermediaries who provide shareholder services and other related services to their clients or customers who invest in the Funds under which JPMDS will pay all or a portion of such fees earned to financial intermediaries for performing such services.
JPMDS waived service fees as outlined in Note 3.F.
E. Custodian and Accounting Fees — JPMCB provides portfolio custody and accounting services to the Funds. For performing these services, the Funds pay JPMCB transaction and asset-based fees that vary according to the number of transactions and positions, plus out-of-pocket expenses. The amounts paid directly to JPMCB by the Funds for custody and accounting services are included in Custodian and accounting fees on the Statements of Operations. Payments to the custodian may be reduced by credits earned by each Fund, based on uninvested cash balances held by the custodian. Such earnings credits, if any, are presented separately on the Statements of Operations.
Interest expense paid to the custodian related to cash overdrafts, if any, is included in Interest expense to affiliates on the Statements of Operations.
F. Waivers and Reimbursements — The Adviser, Administrator and/or JPMDS have contractually agreed to waive fees and/or reimburse the Funds to the extent that total annual operating expenses (excluding acquired fund fees and expenses other than certain money market fund fees as described below, dividend and interest expenses related to short sales, interest, taxes, expenses related to litigation and potential litigation and extraordinary expenses) exceed the percentages of the Funds’ respective average daily net assets as shown in the table below:
| Class A | Class C | Class I | Class T | |||||||||||||
Investor Balanced Fund | 0.52 | % | 1.10 | % | 0.27 | % | 0.52 | %* | ||||||||
Investor Conservative Growth Fund | 0.52 | 1.10 | 0.27 | 0.52 | * | |||||||||||
Investor Growth Fund | 0.52 | 1.10 | 0.27 | 0.52 | * | |||||||||||
Investor Growth & Income Fund | 0.52 | 1.10 | 0.27 | 0.52 | * | |||||||||||
| * | The contractual expense percentages in the table above are in place until at least February 28, 2018. |
Except as noted above, the contractual expense limitation percentages are in place until at least October 31, 2017.
The Underlying Funds may impose separate advisory and service fees. To avoid charging a service fee at an effective rate above 0.25% of the Funds’ net assets, JPMDS will waive service fees with respect to the Funds in an amount equal to the weighted average pro-rata amount of service fees charged by the Underlying Funds. This waiver may be in addition to any waivers required to meet the Funds’ contractual expense limitations, but will not exceed the Funds’ service fees.
For the year ended June 30, 2017, the Funds’ service providers waived fees and/or reimbursed expenses for each of the Funds as follows (amounts in thousands). None of these parties expect the Funds to repay any such waived fees and reimbursed expenses in future years.
| Contractual Waivers | ||||||||||||||||
| Investment Advisory Fees | Administration Fees | Service Fees | Total | |||||||||||||
Investor Balanced Fund | $ | 394 | $ | 259 | $ | 5,419 | $ | 6,072 | ||||||||
Investor Conservative Growth Fund | 582 | 384 | 3,103 | 4,069 | ||||||||||||
Investor Growth Fund | 786 | 522 | 2,846 | 4,154 | ||||||||||||
Investor Growth & Income Fund | 565 | 374 | 3,497 | 4,436 | ||||||||||||
Additionally, the Funds may invest in one or more money market funds advised by the Adviser or its affiliates (affiliated money market funds). The Adviser, Administrator and/or JPMDS, as shareholder servicing agent, have contractually agreed to waive fees and/or reimburse expenses in an amount sufficient to offset the respective net fees each collects from the affiliated money market fund on the applicable Funds’ investment in such affiliated money market fund.
The amounts of these waivers resulting from investments in these money market funds for the year ended June 30, 2017 were as follows (amounts in thousands):
Investor Balanced Fund | $ | 88 | ||
Investor Conservative Growth Fund | 68 | |||
Investor Growth Fund | 44 | |||
Investor Growth & Income Fund | 51 |
G. Other — Certain officers of the Trust are affiliated with the Adviser, the Administrator and JPMDS. Such officers, with the exception of the Chief Compliance Officer, receive no compensation from the Funds for serving in their respective roles.
| JUNE 30, 2017 | J.P. MORGAN INVESTOR FUNDS | 39 | ||||||
Table of Contents
NOTES TO FINANCIAL STATEMENTS
AS OF JUNE 30, 2017 (continued)
The Board appointed a Chief Compliance Officer to the Funds in accordance with Federal securities regulations. Each Fund, along with other affiliated funds, makes reimbursement payments, on a pro-rata basis, to the Administrator for a portion of the fees associated with the Office of the Chief Compliance Officer. Such fees are included in Trustees’ and Chief Compliance Officer’s fees on the Statements of Operations.
The Trust adopted a Trustee Deferred Compensation Plan (the “Plan”) which allows the Independent Trustees to defer the receipt of all or a portion of compensation related to performance of their duties as Trustees. The deferred fees are invested in various J.P. Morgan Funds until distribution in accordance with the Plan.
4. Investment Transactions
During the year ended June 30, 2017, purchases and sales of investments (excluding short-term investments) were as follows (amounts in thousands):
| Purchases (excluding U.S. Government) | Sales (excluding U.S. Government) | |||||||
Investor Balanced Fund | $ | 224,942 | $ | 1,078,794 | ||||
Investor Conservative Growth Fund | 253,311 | 930,988 | ||||||
Investor Growth Fund | 197,910 | 448,543 | ||||||
Investor Growth & Income Fund | 201,140 | 709,612 | ||||||
During the year ended June 30, 2017, there were no purchases or sales of U.S. Government securities.
5. Federal Income Tax Matters
For Federal income tax purposes, the estimated cost and unrealized appreciation (depreciation) in value of investment securities held at June 30, 2017 were as follows (amounts in thousands):
| Aggregate Cost | Gross Unrealized Appreciation | Gross Unrealized Depreciation | Net Unrealized Appreciation (Depreciation) | |||||||||||||
Investor Balanced Fund | $ | 4,140,521 | $ | 847,410 | $ | 23,834 | $ | 823,576 | ||||||||
Investor Conservative Growth Fund | 3,366,016 | 437,940 | 17,707 | 420,233 | ||||||||||||
Investor Growth Fund | 1,887,779 | 684,074 | 15,144 | 668,930 | ||||||||||||
Investor Growth & Income Fund | 2,324,968 | 661,489 | 19,873 | 641,616 | ||||||||||||
The difference between book and tax basis appreciation (depreciation) on investments is primarily attributed to wash sale loss deferrals.
The tax character of distributions paid during the year ended June 30, 2017 was as follows (amounts in thousands):
| Ordinary Income* | Net Long-Term Capital Gains | Total Distribution Paid | ||||||||||
Investor Balanced Fund | $ | 79,573 | $ | 101,549 | $ | 181,122 | ||||||
Investor Conservative Growth Fund | 66,391 | 56,239 | 122,630 | |||||||||
Investor Growth Fund | 25,664 | 109,949 | 135,613 | |||||||||
Investor Growth & Income Fund | 41,702 | 90,552 | 132,254 | |||||||||
| * | Short-term gains are treated as ordinary income for income tax purposes. |
The tax character of distributions paid during the year ended June 30, 2016 was as follows (amounts in thousands):
| Ordinary Income* | Net Long-Term Capital Gains | Total Distributions Paid | ||||||||||
Investor Balanced Fund | $ | 96,760 | $ | 164,749 | $ | 261,509 | ||||||
Investor Conservative Growth Fund | 74,620 | 100,407 | 175,027 | |||||||||
Investor Growth Fund | 34,112 | 120,837 | 154,949 | |||||||||
Investor Growth & Income Fund | 53,000 | 116,156 | 169,156 | |||||||||
| * | Short-term gains are treated as ordinary income for income tax purposes. |
| 40 | J.P. MORGAN INVESTOR FUNDS | JUNE 30, 2017 | ||||
Table of Contents
As of June 30, 2017, the estimated components of net assets (excluding paid-in-capital) on a tax basis were as follows (amounts in thousands):
| Current Distributable Ordinary Income | Current Distributable Long-Term Capital Gain or (Tax Basis Capital Loss Carryover) | Unrealized Appreciation (Depreciation) | ||||||||||
Investor Balanced Fund | $ | 1,729 | $ | 166,375 | $ | 823,576 | ||||||
Investor Conservative Growth Fund | 854 | 88,682 | 420,233 | |||||||||
Investor Growth Fund | 3,638 | 131,892 | 668,930 | |||||||||
Investor Growth & Income Fund | 5,689 | 120,105 | 641,616 | |||||||||
The cumulative timing differences primarily consist of wash sale loss deferrals.
As of June 30, 2017, the Funds did not have any net capital loss carryforwards.
6. Borrowings
The Funds rely upon an exemptive order granted by the Securities and Exchange Commission (the “Order”) permitting the establishment and operation of an Interfund Lending Facility (the “Facility”). The Facility allows the Funds to directly lend and borrow money to or from any other fund relying upon the Order at rates beneficial to both the borrowing and lending funds. Advances under the Facility are taken primarily for temporary or emergency purposes, including the meeting of redemption requests that otherwise might require the untimely disposition of securities, and are subject to each Fund’s borrowing restrictions. The Interfund loan rate is determined, as specified in the Order, by averaging the current repurchase agreement rate and the current bank loan rate. The Order was granted to JPMorgan Trust II and may be relied upon by the Funds because the Funds and the series of JPMorgan Trust II are all investment companies in the same “group of investment companies” (as defined in Section 12(d)(1)(G) of the 1940 Act).
The Trust and JPMCB have entered into a financing arrangement. Under this arrangement, JPMCB provides an unsecured, uncommitted credit facility in the aggregate amount of $100 million to certain of the J.P. Morgan Funds, including the Funds. Advances under the arrangement are taken primarily for temporary or emergency purposes, including the meeting of redemption requests that otherwise might require the untimely disposition of securities, and are subject to each Fund’s borrowing restrictions. Interest on borrowings is payable at a rate determined by JPMCB at the time of borrowing. This agreement has been extended until November 6, 2017.
The Funds had no borrowings outstanding from another fund or from the unsecured, uncommitted credit facility during the year ended June 30, 2017.
In addition, effective August 16, 2016, the Trust along with certain other trusts (“Borrowers”) entered into a joint syndicated senior unsecured revolving credit facility totaling $1.5 billion (“Credit Facility”) with various lenders and The Bank of New York Mellon, as administrative agent for the lenders. This Credit Facility provides a source of funds to the Borrowers for temporary and emergency purposes, including the meeting of redemption requests that otherwise might require the untimely disposition of securities. Under the terms of the Credit Facility, a borrowing fund must have a minimum of $25,000,000 in adjusted net asset value and not exceed certain adjusted net asset coverage ratios prior to and during the time in which any borrowings are outstanding. If a fund does not comply with the aforementioned requirements, the fund must remediate within three business days with respect to the $25,000,000 minimum adjusted net asset value or within one business day with respect to certain asset coverage ratios or the administrative agent at the request of, or with the consent of, the lenders may terminate the Credit Facility and declare any outstanding borrowings to be due and payable immediately.
Interest associated with any borrowing under the Credit Facility is charged to the borrowing fund at a rate of interest equal to 1.00% plus the greater of the federal funds effective rate or one month LIBOR. The annual commitment fee to maintain the Credit Facility is 0.15% and is incurred on the unused portion of the Credit Facility and is allocated to all participating funds pro rata based on their respective net assets. Effective August 15, 2017, this agreement has been amended and restated for a term of 364 days, unless extended. The Funds did not utilize the Credit Facility during the year ended June 30, 2017.
7. Risks, Concentrations and Indemnifications
In the normal course of business, the Funds enter into contracts that contain a variety of representations which provide general indemnifications. Each Fund’s maximum exposure under these arrangements is unknown. The amount of exposure would depend on future claims that may be made against each Fund that have not yet occurred. However, based on experience, the Funds expect the risk of loss to be remote.
As of June 30, 2017, the Funds each had two affiliated omnibus accounts, which owned more than 10% of each Fund’s outstanding shares as follows:
| % of the Fund | ||||
Investor Balanced Fund | 76.7 | % | ||
Investor Conservative Growth Fund | 85.7 | |||
Investor Growth Fund | 60.4 | |||
Investor Growth & Income Fund | 70.6 | |||
Significant shareholder transactions by these shareholders may impact the Funds’ performance.
| JUNE 30, 2017 | J.P. MORGAN INVESTOR FUNDS | 41 | ||||||
Table of Contents
NOTES TO FINANCIAL STATEMENTS
AS OF JUNE 30, 2017 (continued)
As of June 30, 2017, the Funds owned, in the aggregate, shares representing more than 10% of the net assets of the following Underlying Funds:
| % of Net Assets | ||||
JPMorgan Multi-Cap Market Neutral Fund | 88.4 | % | ||
JPMorgan Systematic Alpha Fund | 69.1 | |||
JPMorgan Income Fund | 65.0 | |||
JPMorgan Latin America Fund | 60.7 | |||
JPMorgan Dynamic Growth Fund | 59.1 | |||
JPMorgan Large Cap Value Fund | 55.9 | |||
JPMorgan Limited Duration Bond Fund | 50.8 | |||
JPMorgan International Unconstrained Equity Fund | 49.7 | |||
JPMorgan Research Market Neutral Fund | 49.6 | |||
JPMorgan Intrepid Growth Fund | 48.4 | |||
JPMorgan Market Expansion Enhanced Index Fund | 46.4 | |||
JPMorgan International Research Enhanced Equity Fund | 41.4 | |||
JPMorgan Intrepid European Fund | 39.0 | |||
JPMorgan Intrepid America Fund | 28.5 | |||
JPMorgan Intrepid Mid Cap Fund | 19.4 | |||
JPMorgan Floating Rate Income Fund | 17.8 | |||
JPMorgan Inflation Managed Bond Fund | 13.0 | |||
JPMorgan Core Plus Bond Fund | 12.9 | |||
JPMorgan Commodities Strategy Fund | 12.3 | |||
JPMorgan Emerging Economies Fund | 10.1 | |||
Because of the Funds’ investments in Underlying Funds, the Funds indirectly pay a portion of the expenses incurred by the Underlying Funds. As a result, the cost of investing in the Funds may be higher than the cost of investing in a mutual fund that invests directly in individual securities and financial instruments. The Funds are also subject to certain risks related to the Underlying Funds’ investments in securities and financial instruments such as fixed income securities, including high yield, asset-backed and mortgage-related securities, equity securities, foreign and emerging markets securities, commodities and real estate securities. These securities are subject to risks specific to their structure, sector or market.
In addition, the Underlying Funds may use derivative instruments in connection with their individual investment strategies including futures, forward foreign currency exchange contracts, options, swaps and other derivatives, which are also subject to specific risks related to their structure, sector or market and may be riskier than investments in other types of securities. Specific risks and concentrations present in the Underlying Funds are disclosed within their individual financial statements and registration statements, as appropriate.
8. Investment Company Reporting Modernization
In October 2016, the U.S. Securities and Exchange Commission adopted new rules and forms, and amendments to certain current rules and forms, to modernize the reporting and disclosure of information by registered investment companies. In part, the final rules amend Regulation S-X and will require standardized, enhanced disclosures about derivatives in investment company financial statements, as well as other amendments. The amendments to Regulation S-X will apply to Funds’ fiscal year ends on or after August 1, 2017. At this time, management is currently evaluating the impact of the Regulation S-X amendments on the Funds’ financial statements and related disclosures. The adoption will have no effect on the Funds’ net assets or results of operations.
| 42 | J.P. MORGAN INVESTOR FUNDS | JUNE 30, 2017 | ||||
Table of Contents
REPORT OF INDEPENDENT REGISTERED PUBLIC ACCOUNTING FIRM
To the Board of Trustees of JPMorgan Trust II and the Shareholders of JPMorgan Investor Balanced Fund, JPMorgan Investor Conservative Growth Fund, JPMorgan Investor Growth Fund and JPMorgan Investor Growth & Income Fund
In our opinion, the accompanying statements of assets and liabilities, including the schedules of portfolio investments, and the related statements of operations and of changes in net assets and the financial highlights present fairly, in all material respects, the financial position of JPMorgan Investor Balanced Fund, JPMorgan Investor Conservative Growth Fund, JPMorgan Investor Growth Fund and JPMorgan Investor Growth & Income Fund (each a separate series of JPMorgan Trust II) (hereafter collectively referred to as the “Funds”) as of June 30, 2017, the results of each of their operations for the year then ended, the changes in each of their net assets for each of the two years in the period then ended and the financial highlights for each of the periods indicated therein, in conformity with accounting principles generally accepted in the United States of America. These financial statements and financial highlights (hereafter referred to as “financial statements”) are the responsibility of the Funds’ management. Our responsibility is to express an opinion on these financial statements based on our audits. We conducted our audits of these financial statements in accordance with the standards of the Public Company Accounting Oversight Board (United States). Those standards require that we plan and perform the audit to obtain reasonable assurance about whether the financial statements are free of material misstatement. An audit includes examining, on a test basis, evidence supporting the amounts and disclosures in the financial statements, assessing the accounting principles used and significant estimates made by management, and evaluating the overall financial statement presentation. We believe that our audits, which included confirmation of securities as of June 30, 2017 by correspondence with the transfer agent and custodian, provide a reasonable basis for our opinions.
PricewaterhouseCoopers LLP
New York, New York
August 25, 2017
| JUNE 30, 2017 | J.P. MORGAN INVESTOR FUNDS | 43 | ||||||
Table of Contents
(Unaudited)
The Funds’ Statement of Additional Information includes additional information about the Funds’ Trustees and is available, without charge, upon request by calling 1-800-480-4111 or on the J.P. Morgan Funds’ website at www.jpmorganfunds.com.
Name (Year of Birth); Positions With the Funds (1) | Principal Occupations During Past 5 Years | Number of Portfolios in Fund Complex Overseen by Trustee (2) | Other Directorships Held Outside Fund Complex During Past 5 Years | |||
Independent Trustees | ||||||
| John F. Finn (1947); Trustee of Trust since 2005; Trustee of heritage One Group Mutual Funds since 1998. | Chairman (1985-present), Chief Executive Officer, Gardner, Inc. (supply chain management company serving industrial and consumer markets) (1974-present). | 150 | Director, Greif, Inc. (GEF) (industrial package products and services) (2007-present); Trustee, Columbus Association for the Performing Arts (1988-present); Director, Cardinal Health, Inc. (CAH) (1994-2014). | |||
| Dr. Matthew Goldstein (1941); Chairman since 2013; Trustee of Trust since 2005; Trustee of heritage J.P. Morgan Funds since 2003. | Chancellor Emeritus, City University of New York (2015-present); Professor, City University of New York (2013-present); Chancellor, City University of New York (1999-2013); President, Adelphi University (New York) (1998-1999). | 150 | Trustee, Museum of Jewish Heritage (2011-present) Trustee, National Museum of Mathematics (present); Chair, Association of College and University Administrators (present). | |||
| Dennis P. Harrington (1950); Trustee of Trust since 2017. | Retired; Partner, Deloitte LLP (1984-2012). | 149 | None | |||
| Frankie D. Hughes (1952); Trustee of Trust since 2008. | President, Ashland Hughes Properties (property management) (2014-present); President and Chief Investment Officer, Hughes Capital Management, Inc. (fixed income asset management) (1993-2014). | 150 | None | |||
Raymond Kanner (1953); Trustee of the Trusts since 2017. | Retired; Managing Director & Chief Investment Officer, IBM Retirement Funds (2007-2016). | 149 | Director, Emerging Markets Growth Fund (1997-2016); Acting Executive Director, Committee on Investment of Employee Benefit Assets (CIEBA), 2016-17; Advisory Board Member, Betterment for Business (2016-present) (robo advisor); Advisory Board Member, Blue Star Indexes (2013-present) (index creator); Member, Russell Index Client Advisory Board (2001-2015). | |||
| Peter C. Marshall (1942); Trustee of Trust since 2005; Trustee of heritage One Group Mutual Funds since 1985. | Self-employed business consultant (2002-present). | 150 | None | |||
| Mary E. Martinez (1960); Trustee of Trust since 2013. | Associate, Special Properties, a Christie’s International Real Estate Affiliate (2010-present); Managing Director, Bank of America (Asset Management) (2007-2008); Chief Operating Officer, U.S. Trust Asset Management, U.S. Trust Company (asset management) (2003-2007); President, Excelsior Funds (registered investment companies) (2004-2005). | 150 | None | |||
| Marilyn McCoy* (1948); Trustee of Trust since 2005; Trustee of heritage One Group Mutual Funds since 1999. | Vice President of Administration and Planning, Northwestern University (1985-present). | 150 | None | |||
| 44 | J.P. MORGAN INVESTOR FUNDS | JUNE 30, 2017 | ||||
Table of Contents
Name (Year of Birth); Positions With the Funds (1) | Principal Occupations During Past 5 Years | Number of Portfolios in Fund Complex Overseen by Trustee (2) | Other Directorships Held Outside Fund Complex During Past 5 Years | |||
Independent Trustees (continued) | ||||||
| Mitchell M. Merin (1953); Trustee of Trust since 2013. | Retired; President and Chief Operating Officer, Morgan Stanley Investment Management, Member Morgan Stanley & Co. Management Committee (registered investment adviser) (1985-2005). | 150 | Director, Sun Life Financial (SLF) (2007-2013) (financial services and insurance). | |||
| Dr. Robert A. Oden, Jr. (1946); Trustee of Trust since 2005; Trustee of heritage One Group Mutual Funds since 1997. | Retired; President, Carleton College (2002-2010); President, Kenyon College (1995-2002). | 150 | Chairman, Dartmouth-Hitchcock Medical Center (2011-present); Trustee, American Schools of Oriental Research (2011-present); Trustee, American University in Cairo (1999-2014); Trustee, American Museum of Fly Fishing (2013-present). | |||
| Marian U. Pardo** (1946); Trustee of Trust since 2013. | Managing Director and Founder, Virtual Capital Management LLC (Investment Consulting) (2007-present); Managing Director, Credit Suisse Asset Management (portfolio manager) (2003-2006). | 150 | Member, Board of Governors, Columbus Citizens Foundation (not-for-profit supporting philanthropic and cultural programs) (2006-present). | |||
| Frederick W. Ruebeck (1939); Trustee of Trust since 2005; Trustee of heritage One Group Mutual Funds since 1994. | Consultant (2000-present); Advisor, JP Greene & Associates, LLC (broker-dealer) (2000-2009); Chief Investment Officer, Wabash College (2004-2015); Director of Investments, Eli Lilly and Company (pharmaceuticals) (1988-1999). | 150 | Trustee, Wabash College (2000-present). | |||
| James J. Schonbachler (1943); Trustee of Trust since 2005; Trustee of heritage J.P. Morgan Funds since 2001. | Retired; Managing Director of Bankers Trust Company (financial services) (1968-1998). | 150 | None | |||
| (1) | The Trustees serve for an indefinite term, subject to the Trust’s current retirement policy, which is age 78 for all Trustees. |
| (2) | A Fund Complex means two or more registered investment companies that hold themselves out to investors as related companies for purposes of investment and investor services or have a common investment adviser or have an investment adviser that is an affiliated person of the investment adviser of any of the other registered investment companies. The J.P. Morgan Funds Complex for which the Board of Trustees serves currently includes twelve registered investment companies (150 funds). |
| * | Two members of the Board of Trustees of Northwestern University are executive officers of registered investment advisers (not affiliated with JPMorgan) that are under common control with sub-advisers to certain J.P. Morgan Funds. |
| ** | In connection with prior employment with JPMorgan Chase, Ms. Pardo was the recipient of non-qualified pension plan payments from JPMorgan Chase in the amount of approximately $2,055 per month, which she irrevocably waived effective January 1, 2013, and deferred compensation payments from JPMorgan Chase in the amount of approximately $7,294 per year, which ended in January 2013. In addition, Ms. Pardo receives payments from a fully-funded qualified plan, which is not an obligation of JPMorgan Chase. |
The contact address for each of the Trustees is 270 Park Avenue, New York, NY 10017.
| JUNE 30, 2017 | J.P. MORGAN INVESTOR FUNDS | 45 | ||||||
Table of Contents
(Unaudited)
Name (Year of Birth), Positions Held with the Trust (Since) | Principal Occupations During Past 5 Years | |
| Brian S. Shlissel (1964), President and Principal Executive Officer (2016) | Managing Director and Chief Administrative Officer for J.P. Morgan pooled vehicles, J.P. Morgan Investment Management Inc. (formerly JPMorgan Funds Management, Inc.) (2014 – present); Managing Director and Head of Mutual Fund Services, Allianz Global Investors; President and Chief Executive Officer, Allianz Global Investors Mutual Funds and PIMCO Closed-End Funds (1999-2014) | |
| Laura M. Del Prato (1964), Treasurer and Principal Financial Officer (2014)* | Managing Director, J.P. Morgan Investment Management Inc. (formerly JPMorgan Funds Management, Inc.) since 2014; Partner, Cohen Fund Audit Services, Ltd. (2012-2013); Partner (2004-2012) and various other titles (1990-2004) at KPMG, LLP. | |
| Frank J. Nasta (1964), Secretary (2008) | Managing Director and Associate General Counsel, JPMorgan Chase since 2008. | |
| Stephen M. Ungerman (1953), Chief Compliance Officer (2005) | Managing Director, JPMorgan Chase & Co.; Mr. Ungerman has been with JPMorgan Chase & Co. since 2000. | |
Elizabeth A. Davin (1964), Assistant Secretary (2005)* | Executive Director and Assistant General Counsel, JPMorgan Chase since February 2012; formerly Vice President and Assistant General Counsel, JPMorgan Chase from 2005 to February 2012; Senior Counsel, JPMorgan Chase (formerly Bank One Corporation) from 2004 to 2005. | |
| Jessica K. Ditullio (1962), Assistant Secretary (2005)* | Executive Director and Assistant General Counsel, JPMorgan Chase. Ms. Ditullio has been with JPMorgan Chase (formerly Bank One Corporation) since 1990. | |
| John T. Fitzgerald (1975), Assistant Secretary (2008) | Executive Director and Assistant General Counsel, JPMorgan Chase. Mr. Fitzgerald has been with JPMorgan Chase since 2005. | |
| Carmine Lekstutis (1980), Assistant Secretary (2011) | Executive Director and Assistant General Counsel, JPMorgan Chase since February 2015; formerly Vice President and Assistant General Counsel, JPMorgan Chase from 2011 to February 2015. | |
| Gregory S. Samuels (1980), Assistant Secretary (2010) | Executive Director and Assistant General Counsel, JPMorgan Chase since 2014; formerly Vice President and Assistant General Counsel, JPMorgan Chase since 2010. | |
| Pamela L. Woodley (1971), Assistant Secretary (2012)** | Vice President and Assistant General Counsel, JPMorgan Chase since November 2004. | |
Zachary E. Vonnegut-Gabovitch (1986) Assistant Secretary (2017) | Vice President and Assistant General Counsel, JPMorgan Chase since September 2016; Associate, Morgan, Lewis & Bockius (law firm) from 2012 to 2016. | |
Michael M. D’Ambrosio (1969), Assistant Treasurer (2012) | Managing Director, J.P. Morgan Investment Management Inc. (formerly JPMorgan Funds Management, Inc.) since May 2014; formerly Executive Director, JPMorgan Funds Management, Inc. from 2012 to May 2014; prior to joining JPMorgan Chase, Mr. D’Ambrosio was a Tax Director at PricewaterhouseCoopers LLP since 2006. | |
Lauren A. Paino (1973), Assistant Treasurer (2014)** | Executive Director, J.P. Morgan Investment Management Inc. (formerly JPMorgan Funds Management, Inc.) since August 2013; formerly Director, Credit Suisse Asset Management from 2000-2013. | |
| Joseph Parascondola (1963), Assistant Treasurer (2011)** | Vice President, J.P. Morgan Investment Management Inc. (formerly JPMorgan Funds Management, Inc.) since August 2006. | |
| Matthew J. Plastina (1970), Assistant Treasurer (2011)** | Executive Director, J.P. Morgan Investment Management Inc. (formerly JPMorgan Funds Management, Inc.) since February 2016; Vice President, JPMorgan Funds Management, Inc. from 2010 to January 2016. | |
Gillian I. Sands (1969), Assistant Treasurer (2012)** | Vice President, J.P. Morgan Investment Management Inc. (formerly JPMorgan Funds Management, Inc.) since September 2012; Assistant Treasurer, Wells Fargo Funds Management (2007-2009). | |
The contact address for each of the officers, unless otherwise noted, is 270 Park Avenue, New York, NY 10017.
| * | The contact address for the officer is 1111 Polaris Parkway, Columbus, OH 43240. |
| ** | The contact address for the officer is 4 New York Plaza, New York, NY 10004. |
| 46 | J.P. MORGAN INVESTOR FUNDS | JUNE 30, 2017 | ||||
Table of Contents
SCHEDULE OF SHAREHOLDER EXPENSES
(Unaudited)
Hypothetical $1,000 Investment
As a shareholder of the Funds, you incur two types of costs: (1) transaction costs, including sales charges (loads) on purchase payments and (2) ongoing costs, including investment advisory fees, administration fees, distribution fees and other Fund expenses. The examples below are intended to help you understand your ongoing costs (in dollars) of investing in the Funds (not including expenses of the Underlying Funds) and to compare these ongoing costs with the ongoing costs of investing in other mutual funds. The examples assume that you had a $1,000 investment in each Class at the beginning of the reporting period, January 1, 2017 and continued to hold your shares at the end of the reporting period, June 30, 2017.
Actual Expenses
For each Class of each Fund in the table below, the first line provides information about actual account values and actual expenses. You may use the information in this line, together with the amount you invested, to estimate the expenses that you paid over the period. Simply divide your account value by $1,000 (for example, an $8,600 account value divided by $1,000 = 8.6), then multiply the result by the number in the first line of each Class under the heading entitled “Expenses Paid During the Period” to estimate the expenses you paid on your account during this period.
Hypothetical Example for Comparison Purposes
The second line of each Class in the table below provides information about hypothetical account values and hypothetical expenses based on the Class’ actual expense ratio and an assumed rate of return of 5% per year before expenses, which is not the Class’ actual return. The hypothetical account values and expenses may not be used to estimate the actual ending account balance or expenses you paid for the period. You may use this information to compare the ongoing costs of investing in the Class of the Funds and other funds. To do so, compare this 5% hypothetical example with the 5% hypothetical examples that appear in the shareholder reports of the other funds. Please note that the expenses shown in the table are meant to highlight your ongoing costs only and do not reflect any transaction costs, such as sales charges (loads) or redemption fees, and expenses of the Underlying Funds. Therefore, the second line for each Class in the table is useful in comparing ongoing costs only, and will not help you determine the relative total costs of owning different funds. In addition, if these transaction costs were included, your costs would have been higher. The examples also assume all dividends and distributions have been reinvested.
| Beginning Account Value January 1, 2017 | Ending Account Value June 30, 2017 | Expenses Paid During the Period | Annualized Expense Ratio | |||||||||||||
Investor Balanced Fund | ||||||||||||||||
Class A | ||||||||||||||||
Actual* | $ | 1,000.00 | $ | 1,063.30 | $ | 2.66 | 0.52 | % | ||||||||
Hypothetical* | 1,000.00 | 1,022.22 | 2.61 | 0.52 | ||||||||||||
Class C | ||||||||||||||||
Actual* | 1,000.00 | 1,059.80 | 5.57 | 1.09 | ||||||||||||
Hypothetical* | 1,000.00 | 1,019.39 | 5.46 | 1.09 | ||||||||||||
Class I (formerly Select Class) | ||||||||||||||||
Actual* | 1,000.00 | 1,063.80 | 1.38 | 0.27 | ||||||||||||
Hypothetical* | 1,000.00 | 1,023.46 | 1.35 | 0.27 | ||||||||||||
Class T | ||||||||||||||||
Actual** | 1,000.00 | 997.00 | 0.34 | 0.52 | ||||||||||||
Hypothetical* | 1,000.00 | 1,022.22 | 2.61 | 0.52 | ||||||||||||
Investor Conservative Growth Fund | ||||||||||||||||
Class A | ||||||||||||||||
Actual* | 1,000.00 | 1,045.60 | 2.64 | 0.52 | ||||||||||||
Hypothetical* | 1,000.00 | 1,022.22 | 2.61 | 0.52 | ||||||||||||
Class C | ||||||||||||||||
Actual* | 1,000.00 | 1,042.80 | 5.57 | 1.10 | ||||||||||||
Hypothetical* | 1,000.00 | 1,019.34 | 5.51 | 1.10 | ||||||||||||
Class I (formerly Select Class) | ||||||||||||||||
Actual* | 1,000.00 | 1,046.60 | 1.37 | 0.27 | ||||||||||||
Hypothetical* | 1,000.00 | 1,023.46 | 1.35 | 0.27 | ||||||||||||
Class T | ||||||||||||||||
Actual** | 1,000.00 | 997.40 | 0.33 | 0.51 | ||||||||||||
Hypothetical* | 1,000.00 | 1,022.27 | 2.56 | 0.51 | ||||||||||||
| JUNE 30, 2017 | J.P. MORGAN INVESTOR FUNDS | 47 | ||||||
Table of Contents
SCHEDULE OF SHAREHOLDER EXPENSES
(Unaudited) (continued)
Hypothetical $1,000 Investment
| Beginning Account Value January 1, 2017 | Ending Account Value June 30, 2017 | Expenses Paid During the Period | Annualized Expense Ratio | |||||||||||||
Investor Growth Fund | ||||||||||||||||
Class A | ||||||||||||||||
Actual* | $ | 1,000.00 | $ | 1,097.00 | $ | 2.70 | 0.52 | % | ||||||||
Hypothetical* | 1,000.00 | 1,022.22 | 2.61 | 0.52 | ||||||||||||
Class C | ||||||||||||||||
Actual* | 1,000.00 | 1,093.40 | 5.66 | 1.09 | ||||||||||||
Hypothetical* | 1,000.00 | 1,019.39 | 5.46 | 1.09 | ||||||||||||
Class I (formerly Select Class) | ||||||||||||||||
Actual* | 1,000.00 | 1,098.10 | 1.40 | 0.27 | ||||||||||||
Hypothetical* | 1,000.00 | 1,023.46 | 1.35 | 0.27 | ||||||||||||
Class T | ||||||||||||||||
Actual** | 1,000.00 | 997.60 | 0.33 | 0.51 | ||||||||||||
Hypothetical* | 1,000.00 | 1,022.27 | 2.56 | 0.51 | ||||||||||||
Investor Growth & Income Fund | ||||||||||||||||
Class A | ||||||||||||||||
Actual* | 1,000.00 | 1,077.80 | 2.68 | 0.52 | ||||||||||||
Hypothetical* | 1,000.00 | 1,022.22 | 2.61 | 0.52 | ||||||||||||
Class C | ||||||||||||||||
Actual* | 1,000.00 | 1,074.20 | 5.61 | 1.09 | ||||||||||||
Hypothetical* | 1,000.00 | 1,019.39 | 5.46 | 1.09 | ||||||||||||
Class I (formerly Select Class) | ||||||||||||||||
Actual* | 1,000.00 | 1,078.40 | 1.39 | 0.27 | ||||||||||||
Hypothetical* | 1,000.00 | 1,023.46 | 1.35 | 0.27 | ||||||||||||
Class T | ||||||||||||||||
Actual** | 1,000.00 | 997.30 | 0.33 | 0.51 | ||||||||||||
Hypothetical* | 1,000.00 | 1,022.27 | 2.56 | 0.51 | ||||||||||||
| * | Expenses are equal to each Class’ respective annualized expense ratio, multiplied by the average account value over the period, multiplied by 181/365 (to reflect the one-half year period). |
| ** | Expenses are equal to each Class’ respective annualized expense ratio, multiplied by the average account value over the period, multiplied by 24/365 (to reflect the actual period). Commencement of operations was June 6, 2017. |
| 48 | J.P. MORGAN INVESTOR FUNDS | JUNE 30, 2017 | ||||
Table of Contents
(Unaudited)
Certain tax information for the J.P. Morgan Funds is required to be provided to shareholders based upon the Funds’ income and distributions for the taxable year ended June 30, 2017. The information and distributions reported in this letter may differ from the information and taxable distributions reported to the shareholders for the calendar year ending December 31, 2017. The information necessary to complete your income tax returns for the calendar year ending December 31, 2017 will be provided under separate cover.
Dividends Received Deductions (DRD)
Each fund listed below had the following percentage, or maximum allowable percentage, of ordinary income distributions eligible for the 70% dividends received deductions for corporate shareholders for the fiscal year ended June 30, 2017:
| Dividends Received Deductions | ||||
Investor Balanced Fund | 29.15 | % | ||
Investor Conservative Growth Fund | 16.74 | |||
Investor Growth Fund | 66.64 | |||
Investor Growth & Income Fund | 40.96 | |||
Long-Term Capital Gain
Each fund listed below distributed the following amount, or maximum allowable amount, of long-term capital gain dividends for the fiscal year ended June 30, 2017 (amounts in thousands):
| Long-Term Capital Gain Distribution | ||||
Investor Balanced Fund | $ | 101,549 | ||
Investor Conservative Growth Fund | 56,239 | |||
Investor Growth Fund | 109,949 | |||
Investor Growth & Income Fund | 90,552 | |||
Qualified Dividend Income (QDI)
Each fund listed below had the following amount, or maximum allowable amount, of ordinary income distributions treated as qualified dividends for the fiscal year ended June 30, 2017 (amounts in thousands):
| Qualified Dividend Income | ||||
Investor Balanced Fund | $ | 65,680 | ||
Investor Conservative Growth Fund | 36,587 | |||
Investor Growth Fund | 25,664 | |||
Investor Growth & Income Fund | 41,702 | |||
Foreign Source Income and Foreign Tax Credit Pass Through
For the fiscal year ended June 30, 2017, the Funds intend to elect to pass through to shareholders taxes paid to foreign countries. Gross income and foreign tax expenses cannot be quantified until Underlying Funds complete reporting for the calendar year in progress. Amounts for the fiscal year ended June 30, 2017 will be disclosed in the semiannual report for the period ended December 31, 2017.
| JUNE 30, 2017 | J.P. MORGAN INVESTOR FUNDS | 49 | ||||||
Table of Contents

Rev. January 2011
| FACTS | WHAT DOES J.P. MORGAN FUNDS DO WITH YOUR PERSONAL INFORMATION? |
| Why? | Financial companies choose how they share your personal information. Federal law gives consumers the right to limit some but not all sharing. Federal law also requires us to tell you how we collect, share, and protect your personal information. Please read this notice carefully to understand what we do. |
| What? | The types of personal information we collect and share depend on the product or service you have with us. This information can include:
◾ Social Security number and account balances
◾ transaction history and account transactions
◾ checking account information and wire transfer instructions
When you are no longer our customer, we continue to share your information as described in this notice. |
| How? | All financial companies need to share customers’ personal information to run their everyday business. In the section below, we list the reasons financial companies can share their customers’ personal information; the reasons J.P. Morgan Funds chooses to share; and whether you can limit this sharing. |
| Reasons we can share your personal information | Does J.P. Morgan Funds share? | Can you limit this sharing? | ||
For our everyday business purposes — such as to process your transactions, maintain your account(s), respond to court orders and legal investigations, or report to credit bureaus | Yes | No | ||
For marketing purposes — to offer our products and services to you | Yes | No | ||
| For joint marketing with other financial companies | No | We don’t share | ||
For our affiliates’ everyday business purposes — information about your transactions and experiences | No | We don’t share | ||
For our affiliates’ everyday business purposes — information about your creditworthiness | No | We don’t share | ||
| For nonaffiliates to market to you | No | We don’t share |
| Questions? | Call 1-800-480-4111 or go to www.jpmorganfunds.com | |

Table of Contents
Page 2 |
| Who we are | ||
| Who is providing this notice? | J.P. Morgan Funds | |
| What we do | ||
| How does J.P. Morgan Funds protect my personal information? | To protect your personal information from unauthorized access and use, we use security measures that comply with federal law. These measures include computer safeguards and secured files and buildings. We authorize our employees to access your information only when they need it to do their work and we require companies that work for us to protect your information. | |
How does J.P. Morgan Funds collect my personal information? | We collect your personal information, for example, when you:
◾ open an account or provide contact information
◾ give us your account information or pay us by check
◾ make a wire transfer
We also collect your personal information from others, such as credit bureaus, affiliates and other companies. | |
| Why can’t I limit all sharing? | Federal law gives you the right to limit only
◾ sharing for affiliates’ everyday business purposes – information about your creditworthiness
◾ affiliates from using your information to market to you
◾ sharing for nonaffiliates to market to you
State laws and individual companies may give you additional rights to limit sharing. | |
| Definitions | ||
| Affiliates | Companies related by common ownership or control. They can be financial and nonfinancial companies.
◾ J.P. Morgan Funds does not share with our affiliates. | |
| Nonaffiliates | Companies not related by common ownership or control. They can be financial and nonfinancial companies.
◾ J.P. Morgan Funds does not share with nonaffiliates so they can market to you. | |
| Joint Marketing | A formal agreement between nonaffiliated financial companies that together market financial products or services to you.
◾ J.P. Morgan Funds doesn’t jointly market. | |
Table of Contents
J.P. Morgan Funds are distributed by JPMorgan Distribution Services, Inc., which is an affiliate of JPMorgan Chase & Co. Affiliates of JPMorgan Chase & Co. receive fees for providing various services to the funds.
Contact JPMorgan Distribution Services, Inc. at 1-800-480-4111 for a fund prospectus. You can also visit us at www.jpmorganfunds.com. Investors should carefully consider the investment objectives and risk as well as charges and expenses of the mutual fund before investing. The prospectus contains this and other information about the mutual fund. Read the prospectus carefully before investing.
Investors may obtain information about the Securities Investor Protection Corporation (SIPC), including the SIPC brochure by visiting www.sipc.org or by calling SIPC at 202-371-8300.
Each Fund files a complete schedule of its fund holdings for the first and third quarters of its fiscal year with the SEC on Form N-Q. The Funds’ Forms N-Q are available on the SEC’s website at http://www.sec.gov and may be reviewed and copied at the SEC’s Public Reference Room in Washington, DC. Information on the operation of the SEC’s Public Reference Room may be obtained by calling 1-800-SEC-0330. Shareholders may request the Form N-Q without charge by calling 1-800-480-4111 or by visiting the J.P. Morgan Funds’ website at www.jpmorganfunds.com.
A description of each Fund’s policies and procedures with respect to the disclosure of each Fund’s holdings is available in the prospectus and Statement of Additional Information.
A copy of proxy policies and procedures is available without charge upon request by calling 1-800-480-4111 and on the Funds’ website at www.jpmorganfunds.com. A description of such policies and procedures is on the SEC’s website at www.sec.gov. The Trustees have delegated the authority to vote proxies for securities owned by the Funds to the Adviser. A copy of the Funds’ voting record for the most recent 12-month period ended June 30 is available on the SEC’s website at www.sec.gov or at the Funds’ website at www.jpmorganfunds.com no later than August 31 of each year. The Funds’ proxy voting record will include, among other things, a brief description of the matter voted on for each fund security, and will state how each vote was cast, for example, for or against the proposal.
Table of Contents

J.P. Morgan Asset Management is the marketing name for the asset management businesses of JPMorgan Chase & Co. Those businesses include, but are not limited to, J.P. Morgan Investment Management Inc., Security Capital Research & Management Incorporated and J.P. Morgan Alternative Asset Management, Inc.
| © JPMorgan Chase & Co., 2017. All rights reserved. June 2017. | AN-INV-617 |
Table of Contents
Annual Report
J.P. Morgan Intrepid Funds
June 30, 2017
JPMorgan Intrepid America Fund
JPMorgan Intrepid Growth Fund
JPMorgan Intrepid Mid Cap Fund
JPMorgan Intrepid Sustainable Equity Fund
(formerly known as JPMorgan Intrepid Advantage Fund)
JPMorgan Intrepid Value Fund
 |
Table of Contents
| CEO’s Letter | 1 | |||
| Market Overview | 2 | |||
Fund Commentaries: | ||||
| 3 | ||||
| 5 | ||||
| 7 | ||||
| 9 | ||||
| 11 | ||||
| Schedules of Portfolio Investments | 13 | |||
| Financial Statements | 30 | |||
| Financial Highlights | 46 | |||
| Notes to Financial Statements | 56 | |||
| Report of Independent Registered Public Accounting Firm | 66 | |||
| Trustees | 67 | |||
| Officers | 69 | |||
| Schedule of Shareholder Expenses | 70 | |||
| Tax Letter | 73 | |||
| Privacy Policy — Located at the back of this Annual Report | ||||
Investments in a Fund are not deposits or obligations of, or guaranteed or endorsed by, any bank and are not insured or guaranteed by the FDIC, the Federal Reserve Board or any other government agency. You could lose money if you sell when a Fund’s share price is lower than when you invested.
Past performance is no guarantee of future performance. The general market views expressed in this report are opinions based on market and other conditions through the end of the reporting period and are subject to change without notice. These views are not intended to predict the future performance of a Fund or the securities markets. References to specific securities and their issuers are for illustrative purposes only and are not intended to be, and should not be interpreted as, recommendations to purchase or sell such securities. Such views are not meant as investment advice and may not be relied on as an indication of trading intent on behalf of any Fund.
Prospective investors should refer to the Funds’ prospectuses for a discussion of the Funds’ investment objectives, strategies and risks. Call J.P. Morgan Funds Service Center at 1–800–480–4111 for a prospectus containing more complete information about a Fund, including management fees and other expenses. Please read it carefully before investing.
Table of Contents
August 4, 2017 (Unaudited)
Dear Shareholder,
The current U.S. economic expansion entered its eighth year in 2017 and growth in developed and emerging market economies grew more synchronized even as U.S. growth showed some signs of easing. Global financial markets generally benefitted from steady economic growth amid an environment of low inflation, low volatility and rising corporate profits.
 |
“In the U.S., the continued economic expansion, muted inflation, corporate earnings growth and historically low volatility in financial markets helped to drive key equity market indexes to multiple record closing highs throughout the past twelve months.” |
While economic growth in the U.S. and China largely drove the global recovery throughout 2016, by June 2017 the world’s other leading economies had picked up sufficiently enough for the Organization for Economic Co-operation and Development to forecast global growth at 3.5% in 2017 and 3.6% in 2018.
U.S. gross domestic product (GDP) growth slowed to 1.2% in the first quarter of 2017 from 2.5% and 3.5% growth in the fourth quarter and third quarters of 2016, respectively. Meanwhile, the U.S. unemployment rate continued its downward trend throughout the past twelve months, dropping to 4.4% in June 2017 from 4.9% one year earlier. In response to these numbers, along with nascent signs of price inflation, the U.S. Federal Reserve (the “Fed”) raised interest rates in December 2016 and again in June 2017 and signaled it would raise rates once more before the end of the year. Further, Fed Chairwoman Janet Yellen indicated she was prepared to begin partially unwinding the central bank’s $4.5 trillion balance sheet in assets purchased through its quantitative easing program. An increase in consumer spending helped second-quarter 2017 GDP climb by 2.6% from a year earlier.
Notably, by mid-2017 domestic price inflation had dropped below the Fed’s target of 2% growth and wage growth was below many economists’ expectations, the latter despite an environment of essentially full employment for U.S. workers. These trends — and the Fed’s acknowledgment of them — provided some near-term uncertainty about the central bank’s commitment to tightening monetary policy.
Throughout the twelve months ended June 30, 2017, global oil prices remained a key focal point for policy makers, economists and investors. Global crude prices reached 15-month highs in October 2016 and received further support from the Organization of Petroleum Exporting Countries’ December 2016 decision to curb production. However, continued oversupply of crude and natural gas, partly due to continued U.S. production, pushed the price of a barrel of benchmark West Texas Intermediate crude oil down to $46 by the end of June 2017.
Meanwhile, the leading economies of Europe continued to strengthen from what had been an anemic expansion. Annualized GDP for the 19 core euro area nations rose 1.9% in the first quarter of 2017 and 2.1% in the second quarter. The June 2017 aggregate unemployment rate for those nations fell to 9.1%, its lowest level since March 2009. Also, in separate elections in 2017, voters in the Netherlands and France largely rejected populist campaigns espousing policies to limit free trade and immigration. The election results provided another boost to global equity prices.
In the U.S., the continued economic expansion, muted inflation, corporate earnings growth and historically low volatility in financial markets helped to drive key equity market indexes to multiple record closing highs throughout the past twelve months. U.S. investors appeared to shrug off intermittent political and policy dramas emanating from Washington, D.C. and extended the run-up in U.S. equity prices into its eighth consecutive year — one of the longest on record.
Over the twelve month period, U.S. and foreign markets largely rewarded those who remained fully invested in financial markets and we believe the fundamental virtues of patience and diversification remain essential to prudent investment strategy.
We look forward to managing your investment needs for years to come. Should you have any questions, please visit www.jpmorganfunds.com or contact the J.P. Morgan Funds Service Center at 1-800-480-4111.
Sincerely yours,

George C.W. Gatch
CEO, Global Funds Management & Institutional,
J.P. Morgan Asset Management
| JUNE 30, 2017 | J.P. MORGAN INTREPID FUNDS | 1 | ||||||
Table of Contents
J.P. Morgan Intrepid Funds
TWELVE MONTHS ENDED JUNE 30, 2017 (Unaudited)
Overall, U.S. equity markets provided positive returns and key stock market indexes reached multiple record highs throughout the twelve month reporting period. Steady global economic growth, continued low inflation and strong corporate earnings all served to support equity prices, both in the U.S. and elsewhere.
While U.S. equity prices rose throughout most of 2016, they experienced a sustained rally following the November 8, 2016 election amid investor expectations for increased infrastructure spending and tax cuts under the incoming Trump administration and Republican Party majorities in the U.S. Congress. Even as those expectations faded, U.S. equity prices continued to climb.
In February 2017, the Standard & Poor’s 500 Index (the “S&P 500”) reached nine new closing highs and the Dow Jones Industrial Average (the “DJIA”) closed at new highs for 12 consecutive days, matching a record set in 1987. The following month, the S&P 500 crossed 2,400 points in intraday trading for the first time and the DJIA crossed 21,000 points for the first time. While the rally in U.S. equities stalled in April 2017, record high U.S. corporate operating earnings rekindled the rise in stock prices and the S&P 500 posted seven new closing highs in May 2017 and four new closing highs in June 2017.
Importantly, U.S. financial market volatility remained historically low throughout the reporting period, with a brief spike ahead of the November 2016 election. By the end of June 2017, the CBOE Volatility Index, which measures options on the S&P 500 to gauge market expectations of near-term volatility, stood at roughly half of its historical average.
Overall, small cap stocks generally outperformed mid cap and large cap stocks, while growth stocks generally outperformed value stocks. For the twelve months ended June 30, 2017, the S&P 500 returned 17.90%.
Intrepid Investment Philosophy and Process
The JPMorgan Behavioral Finance Team employs a philosophy that is rooted in behavioral finance, a field of study that emphasizes the importance of human psychology in financial markets. Behavioral finance examines how investor behavior can be affected by emotional biases and reactions. The field theorizes that inefficiencies arise in the stock market because investors are consistently irrational in making many investment decisions.
The Team aims to capitalize on these market inefficiencies by targeting high quality, attractively valued stocks of companies that it believes have positive momentum characteristics, and looks to sell these stocks when they no longer exhibit these criteria. A disciplined quantitative ranking methodology is utilized to identify attractive stocks in each sector, a process that is combined with qualitative research and value-added trading.
The Intrepid Sustainable Equity Fund (formerly Intrepid Advantage Fund) also incorporates environmental, social and corporate governance (ESG) practices into its investment process. In managing the Fund, the adviser identifies companies that, in the adviser’s opinion, generally approach ESG practices in a thoughtful manner while also having attractive value, quality and momentum characteristics. The Fund seeks to invest in companies that, on a combined basis, appear attractive when considering all of these financial and sustainability characteristics.
During the reporting period, the Funds were managed and positioned in accordance with these investment philosophies and processes.
| 2 | J.P. MORGAN INTREPID FUNDS | JUNE 30, 2017 | ||||
Table of Contents
JPMorgan Intrepid America Fund
FUND COMMENTARY
TWELVE MONTHS ENDED JUNE 30, 2017 (Unaudited)
REPORTING PERIOD RETURN: | ||||||
| Fund (Class I Shares)*(1) | 16.58% | |||||
| S&P 500 Index | 17.90% | |||||
| Net Assets as of 6/30/2017 (In Thousands) | $ | 4,082,857 | ||||
INVESTMENT OBJECTIVE**
The JPMorgan Intrepid America Fund (the “Fund”) seeks to provide long-term capital growth.
WHAT WERE THE MAIN DRIVERS OF THE FUND’S PERFORMANCE?
The Fund’s Class I Shares underperformed the Standard & Poor’s 500 Index (the “Benchmark”) for the twelve months ended June 30, 2017. The Fund’s security selection in the consumer discretionary and consumer staples sectors was a leading detractor from performance relative to the Benchmark, while the Fund’s security selection in the industrials and real estate sectors was a leading contributor to relative performance.
Leading individual detractors from the Fund’s relative performance included its overweight positions in Ross Stores Inc., Express Scripts Holding Co. and Gilead Sciences Inc. Shares of Ross Stores, a discount apparel and housewares chain, fell amid investor concerns about negative trends among retailers. Shares of Express Scripts, a pharmacy benefits manager, fell amid investor expectations that health insurer Anthem Inc., would not renew its contract with the company. Shares of Gilead Sciences, a drug maker, fell after the company reported lower-than-expected earnings.
Leading individual contributors to the Fund’s relative performance included its overweight positions in Valero Energy Corp. and WellCare Health Plans Inc., and its underweight position in General Electric Co. Shares of Valero, a petroleum refineries operator, rose on increased U.S. demand for gasoline and as investors sought energy sector companies that are less sensitive to changes in global oil prices. Shares of WellCare Health Plans, a provider of U.S. government sponsored health care services, rose after the company reported better-than-expected earnings and revenue. Shares of General Electric, an industrial conglomerate not held in the Fund, fell amid investor concerns about the company’s strategic direction under a new chief executive.
| TOP TEN EQUITY HOLDINGS OF THE PORTFOLIO*** | ||||||||
| 1. | Microsoft Corp. | 3.6 | % | |||||
| 2. | Apple, Inc. | 3.4 | ||||||
| 3. | Bank of America Corp. | 2.8 | ||||||
| 4. | Boeing Co. (The) | 2.5 | ||||||
| 5. | AT&T, Inc. | 2.4 | ||||||
| 6. | Wal-Mart Stores, Inc. | 2.3 | ||||||
| 7. | Citigroup, Inc. | 2.2 | ||||||
| 8. | Applied Materials, Inc. | 2.1 | ||||||
| 9. | Gilead Sciences, Inc. | 2.1 | ||||||
| 10. | eBay, Inc. | 2.0 | ||||||
PORTFOLIO COMPOSITION BY SECTOR*** | ||||
| Information Technology | 22.5 | % | ||
| Financials | 14.8 | |||
| Health Care | 14.5 | |||
| Industrials | 11.0 | |||
| Consumer Discretionary | 10.1 | |||
| Consumer Staples | 9.3 | |||
| Energy | 5.6 | |||
| Utilities | 3.3 | |||
| Telecommunication Services | 2.4 | |||
| Real Estate | 2.3 | |||
| Materials | 2.2 | |||
| Short-Term Investment | 2.0 | |||
| * | The return shown is based on net asset values calculated for shareholder transactions and may differ from the return shown in the financial highlights, which reflects adjustments made to the net asset values in accordance with accounting principles generally accepted in the United States of America. |
| ** | The adviser seeks to achieve the Fund’s objective. There can be no guarantee it will be achieved. |
| *** | Percentages indicated are based on total investments as of June 30, 2017. The Fund’s portfolio composition is subject to change. |
| (1) | On April 3, 2017, the Fund’s Select Class Shares were renamed Class I Shares. |
| JUNE 30, 2017 | J.P. MORGAN INTREPID FUNDS | 3 | ||||||
Table of Contents
JPMorgan Intrepid America Fund
FUND COMMENTARY
TWELVE MONTHS ENDED JUNE 30, 2017 (Unaudited) (continued)
AVERAGE ANNUAL TOTAL RETURNS AS OF JUNE 30, 2017 | ||||||||||||||
| INCEPTION DATE OF CLASS | 1 YEAR | 5 YEAR | 10 YEAR | |||||||||||
CLASS A SHARES | February 19, 2005 | |||||||||||||
With Sales Charge* | 10.13 | % | 12.55 | % | 5.51 | % | ||||||||
Without Sales Charge | 16.24 | 13.77 | 6.08 | |||||||||||
CLASS C SHARES | February 19, 2005 | |||||||||||||
With CDSC** | 14.69 | 13.21 | 5.56 | |||||||||||
Without CDSC | 15.69 | 13.21 | 5.56 | |||||||||||
CLASS I SHARES (FORMERLY SELECT CLASS SHARES) | February 28, 2003 | 16.58 | 14.09 | 6.36 | ||||||||||
CLASS R2 SHARES | November 3, 2008 | 15.95 | 13.49 | 5.86 | ||||||||||
CLASS R5 SHARES | May 15, 2006 | 16.75 | 14.30 | 6.57 | ||||||||||
CLASS R6 SHARES | November 2, 2015 | 16.91 | 14.34 | 6.59 | ||||||||||
| * | Sales Charge for Class A Shares is 5.25%. |
| ** | Assumes a 1% CDSC (contingent deferred sales charge) for the one year period and 0% CDSC thereafter. |
TEN YEAR PERFORMANCE (6/30/07 TO 6/30/17)
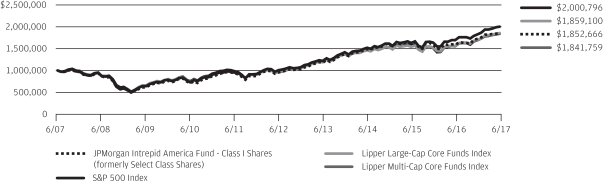
The performance quoted is past performance and is not a guarantee of future results. Mutual funds are subject to certain market risks. Investment returns and principal value of an investment will fluctuate so that an investor’s shares, when redeemed, may be worth more or less than their original cost. Current performance may be higher or lower than the performance data shown. For up-to-date month-end performance information please call 1-800-480-4111.
Returns for Class R2 Shares prior to their inception date are based on the performance of Class A Shares. The actual returns for Class R2 Shares would have been lower than those shown because Class R2 Shares have higher expenses than Class A Shares.
Returns for Class R6 Shares prior to their inception date are based on the performance of Class R5 Shares. The actual returns for Class R6 Shares would have been different than those shown because Class R6 Shares have different expenses than Class R5 Shares.
The graph illustrates comparative performance for $1,000,000 invested in Class I Shares of the JPMorgan Intrepid America Fund, the S&P 500 Index, the Lipper Large-Cap Core Funds Index and the Lipper Multi-Cap Core Funds Index from June 30, 2007 to June 30, 2017. The performance of the Fund assumes reinvestment of all dividends and capital gain distributions, if any, and does not include a sales charge. The performance of the S&P 500 Index does not reflect the deduction of expenses or a sales charge associated with a mutual fund and
has been adjusted to reflect reinvestment of all dividends and capital gain distributions of the securities included in the benchmark, if applicable. The performance of the Lipper Large-Cap Core Funds Index and the Lipper Multi-Cap Core Funds Index includes expenses associated with a mutual fund, such as investment management fees. These expenses are not identical to the expenses incurred by the Fund. The S&P 500 Index is an unmanaged index generally representative of the performance of large companies in the U.S. stock market. The Lipper Large-Cap Core Funds Index and the Lipper Multi-Cap Core Funds Index are indexes based on the total returns of certain mutual funds within the Fund’s designated category as determined by Lipper, Inc. Investors cannot invest directly in an index.
Class I Shares have a $1,000,000 minimum initial investment.
Fund performance may reflect the waiver of the Fund’s fees and reimbursement of expenses for certain periods since the inception date. Without these waivers and reimbursements, performance would have been lower. Also, performance shown in this section does not reflect the deduction of taxes that a shareholder would pay on Fund distributions or redemptions of Fund shares.
The returns shown are based on net asset values calculated for shareholder transactions and may differ from the returns shown in the financial highlights, which reflect adjustments made to the net asset values in accordance with accounting principles generally accepted in the United States of America.
| 4 | J.P. MORGAN INTREPID FUNDS | JUNE 30, 2017 | ||||
Table of Contents
FUND COMMENTARY
TWELVE MONTHS ENDED JUNE 30, 2017 (Unaudited)
| REPORTING PERIOD RETURN: | ||||
| Fund (Class I Shares)*(1) | 21.40% | |||
| Russell 1000 Growth Index | 20.42% | |||
| Net Assets as of 6/30/2017 (In Thousands) | $ | 1,019,123 | ||
INVESTMENT OBJECTIVE**
The JPMorgan Intrepid Growth Fund (the “Fund”) seeks to provide long-term capital growth.
WHAT WERE THE MAIN DRIVERS OF THE FUND’S PERFORMANCE?
The Fund’s Class I Shares outperformed the Russell 1000 Growth Index (the “Benchmark”) for the twelve months ended June 30, 2017. The Fund’s security selection in the industrials and health care sectors was a leading contributor to performance relative to the Benchmark, while the Fund’s security selection in the consumer discretionary and consumer staples sectors was a leading detractor from relative performance.
Leading individual contributors to relative performance included the Fund’s underweight position in Bristol-Myers Squibb Co. and its overweight positions in United Continental Holdings Inc. and WellCare Health Plans Inc. Shares of Bristol-Myers Squibb, a drug maker that was not held in the Fund, fell after the company reduced its earnings forecast and amid investor concerns about proposed changes to federal health insurance policies. Shares of United Continental Holdings, an airline operator not held in the Benchmark, rose on revenue growth and news that investor Warren Buffett had purchased a large stake in the company. Shares of WellCare Health Plans, a provider of U.S. government sponsored health care services, rose after the company reported better-than-expected earnings and revenue.
Leading individual detractors from relative performance included the Fund’s overweight positions in Gilead Sciences Inc. and its underweight positions in Amazon.com Inc. and Apple Inc. Shares of Gilead Sciences, a drug maker, fell after the company reported lower-than-expected earnings. Shares of Amazon.com, an online shopping retailer, rose after the company reported earnings growth and strong demand for its online services. Shares of Apple, a maker of smartphones, computers and related devices, rose after the company posted earnings growth on better-than-expected sales and pricing for its iPhones.
| TOP TEN EQUITY HOLDINGS OF THE PORTFOLIO*** | ||||||||
| 1. | Apple, Inc. | 5.9 | % | |||||
| 2. | Microsoft Corp. | 4.9 | ||||||
| 3. | Visa, Inc., Class A | 3.1 | ||||||
| 4. | Boeing Co. (The) | 2.8 | ||||||
| 5. | Home Depot, Inc. (The) | 2.8 | ||||||
| 6. | Amgen, Inc. | 2.4 | ||||||
| 7. | Applied Materials, Inc. | 2.3 | ||||||
| 8. | eBay, Inc. | 2.1 | ||||||
| 9. | Amazon.com, Inc. | 2.1 | ||||||
| 10. | Gilead Sciences, Inc. | 2.1 | ||||||
PORTFOLIO COMPOSITION BY SECTOR*** | ||||
| Information Technology | 35.6 | % | ||
| Consumer Discretionary | 18.5 | |||
| Health Care | 14.5 | |||
| Industrials | 11.6 | |||
| Consumer Staples | 7.4 | |||
| Materials | 3.4 | |||
| Financials | 2.5 | |||
| Real Estate | 2.4 | |||
| Others (each less than 1.0%) | 1.3 | |||
| Short-Term Investment | 2.8 | |||
| * | The return shown is based on net asset values calculated for shareholder transactions and may differ from the return shown in the financial highlights, which reflects adjustments made to the net asset values in accordance with accounting principles generally accepted in the United States of America. |
| ** | The adviser seeks to achieve the Fund’s objective. There can be no guarantee it will be achieved. |
| *** | Percentages indicated are based on total investments as of June 30, 2017. The Fund’s portfolio composition is subject to change. |
| (1) | On April 3, 2017, the Fund’s Select Class Shares were renamed Class I Shares. |
| JUNE 30, 2017 | J.P. MORGAN INTREPID FUNDS | 5 | ||||||
Table of Contents
JPMorgan Intrepid Growth Fund
FUND COMMENTARY
TWELVE MONTHS ENDED JUNE 30, 2017 (Unaudited) (continued)
AVERAGE ANNUAL TOTAL RETURNS AS OF JUNE 30, 2017 | ||||||||||||||
| INCEPTION DATE OF CLASS | 1 YEAR | 5 YEAR | 10 YEAR | |||||||||||
CLASS A SHARES | February 19, 2005 | |||||||||||||
With Sales Charge* | 14.73 | % | 13.62 | % | 7.22 | % | ||||||||
Without Sales Charge | 21.09 | 14.86 | 7.80 | |||||||||||
CLASS C SHARES | February 19, 2005 | |||||||||||||
With CDSC** | 19.49 | 14.29 | 7.27 | |||||||||||
Without CDSC | 20.49 | 14.29 | 7.27 | |||||||||||
CLASS I SHARES (FORMERLY SELECT CLASS SHARES) | February 28, 2003 | 21.40 | 15.14 | 8.07 | ||||||||||
CLASS R2 SHARES | November 3, 2008 | 20.82 | 14.57 | 7.57 | ||||||||||
CLASS R5 SHARES | May 15, 2006 | 21.65 | 15.37 | 8.29 | ||||||||||
CLASS R6 SHARES | November 2, 2015 | 21.70 | 15.39 | 8.30 | ||||||||||
| * | Sales Charge for Class A Shares is 5.25%. |
| ** | Assumes a 1% CDSC (contingent deferred sales charge) for the one year period and 0% CDSC thereafter. |
TEN YEAR PERFORMANCE (6/30/07 TO 6/30/17)
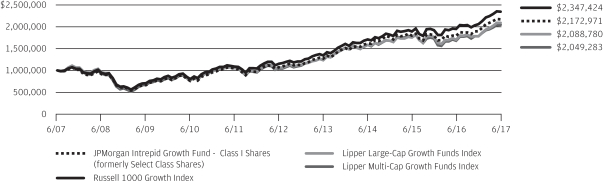
The performance quoted is past performance and is not a guarantee of future results. Mutual funds are subject to certain market risks. Investment returns and principal value of an investment will fluctuate so that an investor’s shares, when redeemed, may be worth more or less than their original cost. Current performance may be higher or lower than the performance data shown. For up-to-date month-end performance information please call 1-800-480-4111.
Returns for Class R2 Shares prior to their inception date are based on the performance of Class A Shares. The actual returns for Class R2 Shares would have been lower than those shown because Class R2 Shares have higher expenses than Class A Shares.
Returns for Class R6 Shares prior to their inception date are based on the performance of Class R5 Shares. The actual returns for Class R6 Shares would have been different than those shown because Class R6 Shares have different expenses than Class R5 Shares.
The graph illustrates comparative performance for $1,000,000 invested in Class I Shares of the JPMorgan Intrepid Growth Fund, the Russell 1000 Growth Index, the Lipper Large-Cap Growth Funds Index and the Lipper Multi-Cap Growth Funds Index from June 30, 2007 to June 30, 2017. The performance of the Fund assumes reinvestment of all dividends and capital gain distributions, if any, and does not include a sales charge. The performance of the Russell 1000 Growth Index does not reflect the deduction of expenses or a sales charge asso-
ciated with a mutual fund and has been adjusted to reflect reinvestment of all dividends and capital gain distributions of the securities included in the benchmark, if applicable. The performance of the Lipper Large-Cap Growth Funds Index and the Lipper Multi-Cap Growth Funds Index includes expenses associated with a mutual fund, such as investment management fees. These expenses are not identical to the expenses incurred by the Fund. The Russell 1000 Growth Index is an unmanaged index which measures the performance of those Russell 1000 companies with higher price-to-book ratios and higher forecasted growth values. The Lipper Large-Cap Growth Funds Index and the Lipper Multi-Cap Growth Funds Index are indexes based on the total returns of certain mutual funds within the Fund’s designated category as determined by Lipper, Inc. Investors cannot invest directly in an index.
Class I Shares have a $1,000,000 minimum initial investment.
Fund performance may reflect the waiver of the Fund’s fees and reimbursement of expenses for certain periods since the inception date. Without these waivers and reimbursements, performance would have been lower. Also, performance shown in this section does not reflect the deduction of taxes that a shareholder would pay on Fund distributions or redemptions of Fund shares.
The returns shown are based on net asset values calculated for shareholder transactions and may differ from the returns shown in the financial highlights, which reflect adjustments made to the net asset values in accordance with accounting principles generally accepted in the United States of America.
| 6 | J.P. MORGAN INTREPID FUNDS | JUNE 30, 2017 | ||||
Table of Contents
JPMorgan Intrepid Mid Cap Fund
FUND COMMENTARY
TWELVE MONTHS ENDED JUNE 30, 2017 (Unaudited)
| REPORTING PERIOD RETURN: | ||||
| Fund (Class I Shares)*(1) | 14.23% | |||
| Russell Midcap Index | 16.48% | |||
| Net Assets as of 6/30/2017 (In Thousands) | $ | 889,739 | ||
INVESTMENT OBJECTIVE**
The JPMorgan Intrepid Mid Cap Fund (the “Fund”) seeks long-term capital growth by investing primarily in equity securities of companies with intermediate capitalizations.
WHAT WERE THE MAIN DRIVERS OF THE FUND’S PERFORMANCE?
The Fund’s Class I Shares underperformed the Russell Midcap Index (the “Benchmark”) for the twelve months ended June 30, 2017. The Fund’s security selection in the real estate and industrial sectors was a leading detractor from performance relative to the Benchmark. The Fund’s security selection in the consumer discretionary and materials sectors was a leading positive contributor to relative performance.
Leading individual detractors from relative performance included the Fund’s overweight positions in CoreCivic Inc. and Wesco International Inc. and its underweight position in NVidia Corp. Shares of CoreCivic, a real estate investment trust operator of prisons and related facilities, fell after the company reported lower-than-expected revenue. Shares of Wesco International, a distributor or electrical, industrial and communications products, fell after the company reported a decline in sales. Shares of Nvidia, a maker of computer graphics semiconductors and software, rose amid growth in its gaming and artificial intelligence segments.
Leading individual contributors to relative performance included the Fund’s overweight positions in Best Buy Inc., International Game Technology PLC and IAC/InterActiveCorp. Shares of Best Buy, a consumer electronics chain, rose on better-than-expected earnings and sales. Shares of International Gaming Technology, a maker of casino gaming devices, rose after the company reported revenue growth from North American lottery operations. Shares of IAC/InterActiveCorp, a media and internet services company, rose after the company reported better-than-expected revenue.
| TOP TEN EQUITY HOLDINGS OF THE PORTFOLIO*** | ||||||||
| 1. | ManpowerGroup, Inc. | 2.2 | % | |||||
| 2. | United Continental Holdings, Inc. | 2.1 | ||||||
| 3. | Best Buy Co., Inc. | 2.0 | ||||||
| 4. | Marvell Technology Group Ltd., (Bermuda) | 1.9 | ||||||
| 5. | NRG Energy, Inc. | 1.9 | ||||||
| 6. | Equinix, Inc. | 1.9 | ||||||
| 7. | Huntington Ingalls Industries, Inc. | 1.8 | ||||||
| 8. | Western Digital Corp. | 1.6 | ||||||
| 9. | Tyson Foods, Inc., Class A | 1.6 | ||||||
| 10. | Xerox Corp. | 1.6 | ||||||
PORTFOLIO COMPOSITION BY SECTOR*** | ||||
| Information Technology | 15.3 | % | ||
| Industrials | 14.8 | |||
| Financials | 13.8 | |||
| Consumer Discretionary | 10.8 | |||
| Health Care | 10.7 | |||
| Real Estate | 9.9 | |||
| Energy | 6.1 | |||
| Utilities | 5.9 | |||
| Consumer Staples | 5.9 | |||
| Materials | 5.3 | |||
| Telecommunication Services | 0.6 | |||
| Short-Term Investment | 0.9 | |||
| * | The return shown is based on net asset values calculated for shareholder transactions and may differ from the return shown in the financial highlights, which reflects adjustments made to the net asset values in accordance with accounting principles generally accepted in the United States of America. |
| ** | The adviser seeks to achieve the Fund’s objective. There can be no guarantee it will be achieved. |
| *** | Percentages indicated are based on total investments as of June 30, 2017. The Fund’s portfolio composition is subject to change. |
| (1) | On April 3, 2017, the Fund’s Select Class Shares were renamed Class I Shares. |
| JUNE 30, 2017 | J.P. MORGAN INTREPID FUNDS | 7 | ||||||
Table of Contents
JPMorgan Intrepid Mid Cap Fund
FUND COMMENTARY
TWELVE MONTHS ENDED JUNE 30, 2017 (Unaudited) (continued)
AVERAGE ANNUAL TOTAL RETURNS AS OF JUNE 30, 2017 | ||||||||||||||
| INCEPTION DATE OF CLASS | 1 YEAR | 5 YEAR | 10 YEAR | |||||||||||
CLASS A SHARES | May 1, 1992 | |||||||||||||
With Sales Charge* | 7.93 | % | 12.85 | % | 5.81 | % | ||||||||
Without Sales Charge | 13.91 | 14.07 | 6.39 | |||||||||||
CLASS C SHARES | March 22, 1999 | |||||||||||||
With CDSC** | 12.20 | 13.35 | 5.71 | |||||||||||
Without CDSC | 13.20 | 13.35 | 5.71 | |||||||||||
CLASS I SHARES (FORMERLY SELECT CLASS SHARES) | June 1, 1991 | 14.23 | 14.36 | 6.65 | ||||||||||
CLASS R3 SHARES | September 9, 2016 | 13.87 | 14.06 | 6.38 | ||||||||||
CLASS R4 SHARES | September 9, 2016 | 14.19 | 14.35 | 6.64 | ||||||||||
CLASS R6 SHARES | November 2, 2015 | 14.52 | 14.46 | 6.69 | ||||||||||
| * | Sales Charge for Class A Shares is 5.25%. |
| ** | Assumes a 1% CDSC (contingent deferred sales charge) for the one year period and 0% CDSC thereafter. |
TEN YEAR PERFORMANCE (6/30/07 TO 6/30/17)
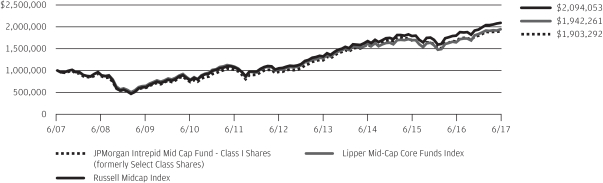
The performance quoted is past performance and is not a guarantee of future results. Mutual funds are subject to certain market risks. Investment returns and principal value of an investment will fluctuate so that an investor’s shares, when redeemed, may be worth more or less than their original cost. Current performance may be higher or lower than the performance data shown. For up-to-date month-end performance information please call 1-800-480-4111.
Returns for Class R3 Shares prior to their inception date are based on the performance of Class A Shares. Returns for Class R4 Shares prior to their inception date are based on the performance of Class I Shares. The actual returns for Class R3 Shares and Class R4 Shares would have been similar to those shown because Class R3 Shares and Class R4 Shares have similar expenses as Class A and Class I Shares, respectively.
Returns for Class R6 Shares prior to their inception date are based on the performance of Class I Shares. The actual returns for Class R6 Shares would have been different than those shown because Class R6 Shares have different expenses than Class I Shares.
The graph illustrates comparative performance for $1,000,000 invested in Class I Shares of the JPMorgan Intrepid Mid Cap Fund, the Russell Midcap Index and the Lipper Mid-Cap Core Funds Index from June 30, 2007 to June 30, 2017. The performance of the Fund assumes reinvestment of all dividends and capital gain distributions, if any, and does not include a sales charge. The performance
of the Russell Midcap Index does not reflect the deduction of expenses or a sales charge associated with a mutual fund and has been adjusted to reflect reinvestment of all dividends and capital gain distributions of the securities included in the benchmark, if applicable. The performance of the Lipper Mid-Cap Core Funds Index includes expenses associated with a mutual fund, such as investment management fees. These expenses are not identical to the expenses incurred by the Fund. The Russell Midcap Index is
an unmanaged index which measures the performance of the 800 smallest companies of the Russell 1000 Index. The Lipper Mid-Cap Core Funds Index is an index based on the total returns of certain mutual funds within the Fund’s designated category as determined by Lipper, Inc. Investors cannot invest directly in an index.
Class I Shares have a $1,000,000 minimum initial investment.
Fund performance may reflect the waiver of the Fund’s fees and reimbursement of expenses for certain periods since the inception date. Without these waivers and reimbursements, performance would have been lower. Also, performance shown in this section does not reflect the deduction of taxes that a shareholder would pay on Fund distributions or redemptions of Fund shares.
The returns shown are based on net asset values calculated for shareholder transactions and may differ from the returns shown in the financial highlights, which reflect adjustments made to the net asset values in accordance with accounting principles generally accepted in the United States of America.
| 8 | J.P. MORGAN INTREPID FUNDS | JUNE 30, 2017 | ||||
Table of Contents
JPMorgan Intrepid Sustainable Equity Fund(1)
(formerly known as JPMorgan Intrepid Advantage Fund)
FUND COMMENTARY
TWELVE MONTHS ENDED JUNE 30, 2017 (Unaudited)
| REPORTING PERIOD RETURN: | ||||
| Fund (Class I Shares)*(2) | 19.95% | |||
| S&P 500 Index(3) | 17.90% | |||
| Russell 3000 Index | 18.51% | |||
| Net Assets as of 6/30/2017 (In Thousands) | $ | 18,044 | ||
INVESTMENT OBJECTIVE**
The JPMorgan Intrepid Sustainable Equity Fund (the “Fund”) seeks to provide long-term capital appreciation.
WHAT WERE THE MAIN DRIVERS OF THE FUND’S PERFORMANCE?
The Fund’s Class I Shares outperformed the Standard & Poor’s 500 Index (the “Benchmark”) for the twelve months ended June 30, 2017. The Fund’s security selection and overweight position in the information technology sector and its security selection in the industrials sector were leading contributors to performance relative to the Benchmark. The Fund’s security selection and overweight positions in both the health care and telecommunication services sectors were leading detractors from relative performance.
For the twelve month reporting period, the Fund also outperformed the Russell 3000 Index, which was the Fund’s primary benchmark until November 1, 2016. The outperformance was largely due to the Fund’s security selection in the information technology and energy sectors and its underweight position in the real estate sector.
Leading individual contributors to performance relative to the Benchmark included the Fund’s underweight position in General Electric Co. and its overweight positions in Citigroup Inc. and Humana Inc. Shares of General Electric, an industrial conglomerate not held in the Fund, fell amid investor concerns about the company’s strategic direction under a new chief executive. Shares of Citigroup Inc., a financial services and banking company, rose after the company announced it would double its quarterly dividend following its successful passage of the U.S. Federal Reserve’s “stress test” of leading banks. Shares of Humana, a health insurer, rose after the company reported better-than-expected earnings and revenue.
Leading individual detractors from performance relative to the Benchmark included the Fund’s overweight positions in Gilead Sciences Inc., Travelers Cos. and Molson Coors Brewing Co.
Shares of Gilead Sciences, a drug maker, fell after the company reported lower-than-expected earnings. Shares of Travelers, a property and casualty insurer, fell after the company reported lower-than-expected earnings, largely due to storm damages incurred in the first three months of 2017. Shares of Molson Coors Brewing, a beer and beverage maker, fell after the company posted lower-than-expected earnings.
| TOP TEN EQUITY HOLDINGS OF THE PORTFOLIO*** | ||||||||
| 1. | Apple, Inc. | 5.5 | % | |||||
| 2. | Microsoft Corp. | 4.8 | ||||||
| 3. | Citigroup, Inc. | 4.0 | ||||||
| 4. | PepsiCo, Inc. | 2.6 | ||||||
| 5. | Humana, Inc. | 2.4 | ||||||
| 6. | Gilead Sciences, Inc. | 2.2 | ||||||
| 7. | Oracle Corp. | 2.2 | ||||||
| 8. | Bank of America Corp. | 2.2 | ||||||
| 9. | PNC Financial Services Group, Inc. (The) | 2.1 | ||||||
| 10. | Verizon Communications, Inc. | 2.1 | ||||||
PORTFOLIO COMPOSITION BY SECTOR*** | ||||
| Information Technology | 26.1 | % | ||
| Financials | 15.4 | |||
| Health Care | 14.6 | |||
| Consumer Discretionary | 11.1 | |||
| Industrials | 10.0 | |||
| Consumer Staples | 7.8 | |||
| Energy | 5.7 | |||
| Utilities | 3.0 | |||
| Telecommunication Services | 3.0 | |||
| Materials | 1.5 | |||
| Real Estate | 0.8 | |||
| Short-Term Investment | 1.0 | |||
| * | The return shown is based on net asset values calculated for shareholder transactions and may differ from the return shown in the financial highlights, which reflects adjustments made to the net asset values in accordance with accounting principles generally accepted in the United States of America. |
| ** | The adviser seeks to achieve the Fund’s objective. There can be no guarantee it will be achieved. |
| *** | Percentages indicated are based on total investments as of June 30, 2017. The Fund’s portfolio composition is subject to change. |
| (1) | On November 1, 2016, the Fund incorporated environmental, social and corporate governance (ESG) practices into its investment process. On March 31, 2017, the Fund was re-named the JPMorgan Intrepid Sustainable Equity Fund from the previous JPMorgan Intrepid Advantage Fund. Under the revised name and strategy, the adviser identifies companies that, in the adviser’s opinion, generally approach ESG practices in a thoughtful manner while also having attractive value, quality and momentum characteristics. |
| (2) | On April 3, 2017, the Fund’s Select Class Shares were renamed Class I Shares. |
| (3) | On November 1, 2016, the Fund adopted the Standard & Poor’s 500 Index as its primary benchmark because the adviser believes that the Benchmark is a more appropriate comparison in light of the Fund’s new investment strategies. |
| JUNE 30, 2017 | J.P. MORGAN INTREPID FUNDS | 9 | ||||||
Table of Contents
JPMorgan Intrepid Sustainable Equity Fund
(formerly known as JPMorgan Intrepid Advantage Fund)
FUND COMMENTARY
TWELVE MONTHS ENDED JUNE 30, 2017 (Unaudited) (continued)
AVERAGE ANNUAL TOTAL RETURNS AS OF JUNE 30, 2017 | ||||||||||||||||
| INCEPTION DATE OF CLASS | 1 YEAR | 5 YEAR | 10 YEAR | |||||||||||||
CLASS A SHARES | February 19, 2005 | |||||||||||||||
With Sales Charge* | 13.35 | % | 13.15 | % | 5.25 | % | ||||||||||
Without Sales Charge | 19.64 | 14.38 | 5.82 | |||||||||||||
CLASS C SHARES | February 19, 2005 | |||||||||||||||
With CDSC** | 18.02 | 13.81 | 5.29 | |||||||||||||
Without CDSC | 19.02 | 13.81 | 5.29 | |||||||||||||
CLASS I SHARES (FORMERLY SELECT CLASS SHARES) | February 28, 2003 | 19.95 | 14.66 | 6.09 | ||||||||||||
| * | Sales Charge for Class A Shares is 5.25%. |
| ** | Assumes a 1% CDSC (contingent deferred sales charge) for the one year period and 0% CDSC thereafter. |
TEN YEAR PERFORMANCE (6/30/07 TO 6/30/17)
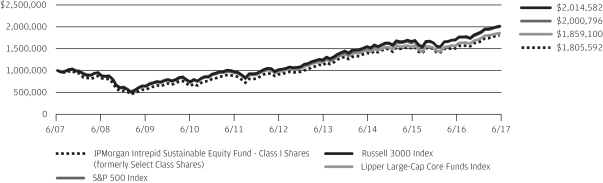
The performance quoted is past performance and is not a guarantee of future results. Mutual funds are subject to certain market risks. Investment returns and principal value of an investment will fluctuate so that an investor’s shares, when redeemed, may be worth more or less than their original cost. Current performance may be higher or lower than the performance data shown. For up-to-date month-end performance information please call 1-800-480-4111.
The graph illustrates comparative performance for $1,000,000 invested in Class I Shares of the JPMorgan Intrepid Sustainable Equity Fund, the S&P 500 Index, the Russell 3000 Index and the Lipper Large-Cap Core Funds Index from June 30, 2007 to June 30, 2017. The performance of the Fund assumes reinvestment of all dividends and capital gain distributions, if any, and does not include a sales charge. The performance of the S&P 500 Index and the Russell 3000 Index does not reflect the deduction of expenses or a sales charge associated with a mutual fund and has been adjusted to reflect reinvestment of all dividends and capital gain distributions of the securities included in the benchmark, if applicable. The performance of the Lipper Large-Cap Core Funds Index includes expenses associated with a mutual fund, such as investment management fees. These expenses are not identical to the expenses incurred by the Fund. The S&P 500 Index is an unmanaged index generally representative of the performance of large companies in the U.S. stock market. The Russell 3000 Index is an unmanaged index which measures the performance of the 3,000 largest U.S. companies based on total market capitalization, which represents approximately 98% of the investable U.S. equity market.
The Lipper Large-Cap Core Funds Index is an index based on the total returns of certain mutual funds within the Fund’s designated category as determined by Lipper, Inc. Investors cannot invest directly in an index.
Class I Shares have a $1,000,000 minimum initial investment.
Fund performance may reflect the waiver of the Fund’s fees and reimbursement of expenses for certain periods since the inception date. Without these waivers and reimbursements, performance would have been lower. Also, performance shown in this section does not reflect the deduction of taxes that a shareholder would pay on Fund distributions or redemptions of Fund shares.
Effective November 1, 2016, the Fund changed its investment strategies. Although past performance is not necessarily an indication of how the Fund will perform in the future, in view of these changes, the Fund’s performance record prior to this date might be less relevant for investors considering whether to purchase shares of the Fund. Also on November 1, 2016, the Fund’s index changed from the Russell 3000 Index to the S&P 500 Index to reflect the change in the Fund’s investment strategies.
The returns shown are based on net asset values calculated for shareholder transactions and may differ from the returns shown in the financial highlights, which reflect adjustments made to the net asset values in accordance with accounting principles generally accepted in the United States of America.
| 10 | J.P. MORGAN INTREPID FUNDS | JUNE 30, 2017 | ||||
Table of Contents
FUND COMMENTARY
TWELVE MONTHS ENDED JUNE 30, 2017 (Unaudited)
REPORTING PERIOD RETURN: | ||||
| Fund (Class I Shares)*(1) | 16.72% | |||
| Russell 1000 Value Index | 15.53% | |||
| Net Assets as of 6/30/2017 (In Thousands) | $ | 1,232,844 | ||
INVESTMENT OBJECTIVE**
The JPMorgan Intrepid Value Fund (the “Fund”) seeks to provide long-term capital appreciation.
WHAT WERE THE MAIN DRIVERS OF THE FUND’S PERFORMANCE?
The Fund’s Class I Shares outperformed the Russell 1000 Value Index (the “Benchmark”) for the twelve months ended June 30, 2017. The Fund’s security selection in the industrials and financials sectors was a leading contributor to performance relative to the Benchmark, while the Fund’s security selection in the consumer staples and health care sectors was a leading detractor from relative performance.
Leading individual contributors to relative performance included the Fund’s underweight positions in General Electric Co. and Berkshire Hathaway Inc. and its overweight position in
Valero Energy Corp. Shares of General Electric, an industrial conglomerate not held in the Fund, fell amid investor concerns about the company’s strategic direction under a new chief executive. Shares of Berkshire Hathaway, an investment management company that was not held by the Fund, fell after the company reported lower earnings. Shares of Valero, a petroleum refineries operator, rose on increased U.S. demand for gasoline and as investors sought energy sector companies that are less sensitive to changes in global oil prices.
Leading individual detractors from relative performance included the Fund’s overweight positions in Gilead Sciences Inc. and Express Scripts Inc. and its underweight position in J.P. Morgan Chase & Co. Shares of Gilead Sciences, a drug maker, fell after the company reported lower-than-expected earnings. Shares of Express Scripts, a pharmacy benefits manager, fell amid investor expectations that health insurer Anthem Inc. would not renew its contract with the company. Shares of J.P. Morgan Chase, a banking and financial services company that that the Fund is prohibited from holding because of its affiliation with the Fund’s adviser, rose on better-than-expected earnings.
| TOP TEN EQUITY HOLDINGS OF THE PORTFOLIO*** | ||||||||
| 1. | Bank of America Corp. | 4.0 | % | |||||
| 2. | Citigroup, Inc. | 3.5 | ||||||
| 3. | PNC Financial Services Group, Inc. (The) | 2.6 | ||||||
| 4. | Valero Energy Corp. | 2.2 | ||||||
| 5. | Boeing Co. (The) | 1.9 | ||||||
| 6. | HP, Inc. | 1.9 | ||||||
| 7. | Allergan plc | 1.8 | ||||||
| 8. | Gilead Sciences, Inc. | 1.8 | ||||||
| 9. | Amgen, Inc. | 1.8 | ||||||
| 10. | Wal-Mart Stores, Inc. | 1.8 | ||||||
PORTFOLIO COMPOSITION BY SECTOR*** | ||||
| Financials | 27.4 | % | ||
| Health Care | 13.6 | |||
| Energy | 9.8 | |||
| Industrials | 9.2 | |||
| Consumer Staples | 8.6 | |||
| Information Technology | 8.3 | |||
| Consumer Discretionary | 7.9 | |||
| Utilities | 6.3 | |||
| Real Estate | 2.9 | |||
| Materials | 2.7 | |||
| Telecommunication Services | 1.1 | |||
| Short-Term Investment | 2.2 | |||
| * | The return shown is based on net asset values calculated for shareholder transactions and may differ from the return shown in the financial highlights, which reflects adjustments made to the net asset values in accordance with accounting principles generally accepted in the United States of America. |
| ** | The adviser seeks to achieve the Fund’s objective. There can be no guarantee it will be achieved. |
| *** | Percentages indicated are based on total investments as of June 30, 2017. The Fund’s portfolio composition is subject to change. |
| (1) | On April 3, 2017, the Fund’s Select Class Shares were renamed Class I Shares. |
| JUNE 30, 2017 | J.P. MORGAN INTREPID FUNDS | 11 | ||||||
Table of Contents
JPMorgan Intrepid Value Fund
FUND COMMENTARY
TWELVE MONTHS ENDED JUNE 30, 2017 (Unaudited) (continued)
AVERAGE ANNUAL TOTAL RETURNS AS OF JUNE 30, 2017 | ||||||||||||||
| INCEPTION DATE OF CLASS | 1 YEAR | 5 YEAR | 10 YEAR | |||||||||||
CLASS A SHARES | February 19, 2005 | |||||||||||||
With Sales Charge* | 10.43 | % | 11.52 | % | 4.40 | % | ||||||||
Without Sales Charge | 16.55 | 12.73 | 4.97 | |||||||||||
CLASS C SHARES | February 19, 2005 | |||||||||||||
With CDSC** | 14.97 | 12.17 | 4.44 | |||||||||||
Without CDSC | 15.97 | 12.17 | 4.44 | |||||||||||
CLASS I SHARES (FORMERLY SELECT CLASS SHARES) | February 28, 2003 | 16.72 | 12.90 | 5.16 | ||||||||||
CLASS R2 SHARES | November 3, 2008 | 16.20 | 12.44 | 4.74 | ||||||||||
CLASS R5 SHARES | May 15, 2006 | 16.94 | 13.12 | 5.37 | ||||||||||
CLASS R6 SHARES | November 30, 2010 | 17.03 | 13.18 | 5.40 | ||||||||||
| * | Sales Charge for Class A Shares is 5.25%. |
| ** | Assumes a 1% CDSC (contingent deferred sales charge) for the one year period and 0% CDSC thereafter. |
TEN YEAR PERFORMANCE (6/30/07 TO 6/30/17)
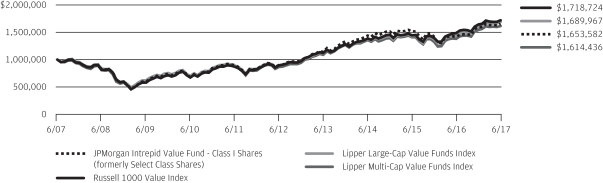
The performance quoted is past performance and is not a guarantee of future results. Mutual funds are subject to certain market risks. Investment returns and principal value of an investment will fluctuate so that an investor’s shares, when redeemed, may be worth more or less than their original cost. Current performance may be higher or lower than the performance data shown. For up-to-date month-end performance information please call 1-800-480-4111.
Returns for Class R2 Shares prior to their inception date are based on the performance of Class A Shares. The actual returns for Class R2 Shares would have been lower than those shown because Class R2 Shares have higher expenses than Class A Shares.
Returns for Class R6 Shares prior to their inception date are based on the performance of Class R5 Shares. The actual returns for Class R6 Shares would have been different than those shown because Class R6 Shares have different expenses than Class R5 Shares.
The graph illustrates comparative performance for $1,000,000 invested in Class I Shares of the JPMorgan Intrepid Value Fund, the Russell 1000 Value Index, the Lipper Large-Cap Value Funds Index and the Lipper Multi-Cap Value Funds Index from June 30, 2007 to June 30, 2017. The performance of the Fund assumes reinvestment of all dividends and capital gain distributions, if any, and does not include a sales charge. The performance of the Russell 1000 Value Index does not reflect the deduction of expenses or a sales charge associated
with a mutual fund and has been adjusted to reflect reinvestment of all dividends and capital gain distributions of the securities included in the benchmark, if applicable. The performance of the Lipper Large-Cap Value Funds Index and the Lipper Multi-Cap Value Funds Index includes expenses associated with a mutual fund, such as investment management fees. These expenses are not identical to the expenses incurred by the Fund. The Russell 1000 Value Index is an unmanaged index which measures the performance of those Russell 1000 companies with lower price-to-book ratios and lower forecasted growth values. Lipper Large-Cap Value Funds Index and the Lipper Multi-Cap Value Funds Index are indexes based on the total returns of certain mutual funds within the Fund’s designated category as determined by Lipper, Inc. Investors cannot invest directly in an index.
Class I Shares have a $1,000,000 minimum initial investment.
Fund performance may reflect the waiver of the Fund’s fees and reimbursement of expenses for certain periods since the inception date. Without these waivers and reimbursements, performance would have been lower. Also, performance shown in this section does not reflect the deduction of taxes that a shareholder would pay on Fund distributions or redemptions of Fund shares.
The returns shown are based on net asset values calculated for shareholder transactions and may differ from the returns shown in the financial highlights, which reflect adjustments made to the net asset values in accordance with accounting principles generally accepted in the United States of America.
| 12 | J.P. MORGAN INTREPID FUNDS | JUNE 30, 2017 | ||||
Table of Contents
JPMorgan Intrepid America Fund
SCHEDULE OF PORTFOLIO INVESTMENTS
AS OF JUNE 30, 2017
(Amounts in thousands)
| SHARES | SECURITY DESCRIPTION | VALUE($) | ||||||
Common Stocks — 98.5% | ||||||||
Consumer Discretionary — 10.2% | ||||||||
Automobiles — 0.6% |
| |||||||
| 698 | General Motors Co. | 24,374 | ||||||
|
| |||||||
Hotels, Restaurants & Leisure — 1.8% |
| |||||||
| 281 | Dunkin’ Brands Group, Inc. | 15,472 | ||||||
| 1,148 | International Game Technology plc | 21,016 | ||||||
| 543 | Restaurant Brands International, Inc., (Canada) | 33,984 | ||||||
|
| |||||||
| 70,472 | ||||||||
|
| |||||||
Household Durables — 0.4% |
| |||||||
| 499 | DR Horton, Inc. | 17,261 | ||||||
|
| |||||||
Internet & Direct Marketing Retail — 0.9% |
| |||||||
| 30 | Amazon.com, Inc. (a) | 29,137 | ||||||
| 55 | Expedia, Inc. | 8,118 | ||||||
|
| |||||||
| 37,255 | ||||||||
|
| |||||||
Media — 2.0% |
| |||||||
| 475 | CBS Corp. (Non-Voting), Class B | 30,295 | ||||||
| 538 | Comcast Corp., Class A | 20,943 | ||||||
| 127 | DISH Network Corp., Class A (a) | 7,952 | ||||||
| 219 | Walt Disney Co. (The) | 23,311 | ||||||
|
| |||||||
| 82,501 | ||||||||
|
| |||||||
Specialty Retail — 3.9% |
| |||||||
| 496 | Best Buy Co., Inc. | 28,424 | ||||||
| 312 | Burlington Stores, Inc. (a) | 28,710 | ||||||
| 182 | Home Depot, Inc. (The) | 27,934 | ||||||
| 1,078 | Ross Stores, Inc. | 62,244 | ||||||
| 135 | Tiffany & Co. | 12,626 | ||||||
|
| |||||||
| 159,938 | ||||||||
|
| |||||||
Textiles, Apparel & Luxury Goods — 0.6% |
| |||||||
| 199 | PVH Corp. | 22,820 | ||||||
|
| |||||||
Total Consumer Discretionary | 414,621 | |||||||
|
| |||||||
Consumer Staples — 9.3% |
| |||||||
Beverages — 1.1% |
| |||||||
| 144 | Molson Coors Brewing Co., Class B | 12,407 | ||||||
| 268 | PepsiCo, Inc. | 30,998 | ||||||
|
| |||||||
| 43,405 | ||||||||
|
| |||||||
Food & Staples Retailing — 2.4% |
| |||||||
| 1,275 | Wal-Mart Stores, Inc. | 96,484 | ||||||
|
| |||||||
Food Products — 4.2% |
| |||||||
| 389 | Bunge Ltd. | 28,982 | ||||||
| 817 | Conagra Brands, Inc. | 29,202 | ||||||
| 225 | Ingredion, Inc. | 26,798 | ||||||
| 170 | JM Smucker Co. (The) | 20,057 | ||||||
| SHARES | SECURITY DESCRIPTION | VALUE($) | ||||||
Food Products — continued |
| |||||||
| 1,101 | Pilgrim’s Pride Corp. (a) | 24,136 | ||||||
| 689 | Tyson Foods, Inc., Class A | 43,165 | ||||||
|
| |||||||
| 172,340 | ||||||||
|
| |||||||
Household Products — 0.8% |
| |||||||
| 520 | Energizer Holdings, Inc. | 24,990 | ||||||
| 87 | Procter & Gamble Co. (The) | 7,617 | ||||||
|
| |||||||
| 32,607 | ||||||||
|
| |||||||
Personal Products — 0.8% |
| |||||||
| 560 | Nu Skin Enterprises, Inc., Class A | 35,190 | ||||||
|
| |||||||
Total Consumer Staples | 380,026 | |||||||
|
| |||||||
Energy — 5.6% |
| |||||||
Energy Equipment & Services — 2.9% |
| |||||||
| 663 | Baker Hughes, Inc. | 36,129 | ||||||
| 1,562 | Halliburton Co. | 66,722 | ||||||
| 560 | TechnipFMC plc, (United Kingdom) (a) | 15,240 | ||||||
|
| |||||||
| 118,091 | ||||||||
|
| |||||||
Oil, Gas & Consumable Fuels — 2.7% |
| |||||||
| 73 | Cimarex Energy Co. | 6,891 | ||||||
| 478 | EOG Resources, Inc. | 43,223 | ||||||
| 158 | Tesoro Corp. | 14,752 | ||||||
| 703 | Valero Energy Corp. | 47,431 | ||||||
|
| |||||||
| 112,297 | ||||||||
|
| |||||||
Total Energy | 230,388 | |||||||
|
| |||||||
Financials — 14.9% |
| |||||||
Banks — 6.2% |
| |||||||
| 4,697 | Bank of America Corp. | 113,942 | ||||||
| 1,333 | Citigroup, Inc. | 89,165 | ||||||
| 238 | Comerica, Inc. | 17,409 | ||||||
| 170 | PNC Financial Services Group, Inc. (The) | 21,178 | ||||||
| 851 | Regions Financial Corp. | 12,460 | ||||||
|
| |||||||
| 254,154 | ||||||||
|
| |||||||
Capital Markets — 2.2% |
| |||||||
| 24 | Ameriprise Financial, Inc. | 3,093 | ||||||
| 49 | Goldman Sachs Group, Inc. (The) | 10,962 | ||||||
| 1,293 | Morgan Stanley | 57,620 | ||||||
| 156 | MSCI, Inc. | 16,077 | ||||||
|
| |||||||
| 87,752 | ||||||||
|
| |||||||
Consumer Finance — 1.5% |
| |||||||
| 945 | Discover Financial Services | 58,744 | ||||||
| 194 | Navient Corp. | 3,232 | ||||||
|
| |||||||
| 61,976 | ||||||||
|
| |||||||
SEE NOTES TO FINANCIAL STATEMENTS.
| JUNE 30, 2017 | J.P. MORGAN INTREPID FUNDS | 13 | ||||||
Table of Contents
JPMorgan Intrepid America Fund
SCHEDULE OF PORTFOLIO INVESTMENTS
AS OF JUNE 30, 2017 (continued)
(Amounts in thousands, except number of Futures contracts)
| SHARES | SECURITY DESCRIPTION | VALUE($) | ||||||
Common Stocks — continued | ||||||||
Insurance — 4.2% | ||||||||
| 49 | Allstate Corp. (The) | 4,289 | ||||||
| 63 | American International Group, Inc. | 3,964 | ||||||
| 355 | Arch Capital Group Ltd. (a) | 33,127 | ||||||
| 228 | Assured Guaranty Ltd. | 9,525 | ||||||
| 131 | Everest Re Group Ltd. | 33,300 | ||||||
| 283 | Lincoln National Corp. | 19,145 | ||||||
| 181 | Prudential Financial, Inc. | 19,617 | ||||||
| 211 | RenaissanceRe Holdings Ltd., (Bermuda) | 29,326 | ||||||
| 171 | Validus Holdings Ltd. | 8,887 | ||||||
| 11 | White Mountains Insurance Group Ltd. | 9,642 | ||||||
|
| |||||||
| 170,822 | ||||||||
|
| |||||||
Mortgage Real Estate Investment Trusts (REITs) — 0.8% |
| |||||||
| 427 | Chimera Investment Corp. | 7,953 | ||||||
| 2,581 | Two Harbors Investment Corp. | 25,575 | ||||||
|
| |||||||
| 33,528 | ||||||||
|
| |||||||
Total Financials | 608,232 | |||||||
|
| |||||||
Health Care — 14.5% |
| |||||||
Biotechnology — 3.2% |
| |||||||
| 268 | Amgen, Inc. | 46,089 | ||||||
| 1,196 | Gilead Sciences, Inc. | 84,632 | ||||||
|
| |||||||
| 130,721 | ||||||||
|
| |||||||
Health Care Equipment & Supplies — 3.3% |
| |||||||
| 1,033 | Baxter International, Inc. | 62,544 | ||||||
| 559 | Hologic, Inc. (a) | 25,385 | ||||||
| 211 | IDEXX Laboratories, Inc. (a) | 34,011 | ||||||
| 139 | Masimo Corp. (a) | 12,647 | ||||||
|
| |||||||
| 134,587 | ||||||||
|
| |||||||
Health Care Providers & Services — 6.9% |
| |||||||
| 163 | Aetna, Inc. | 24,672 | ||||||
| 318 | Anthem, Inc. | 59,901 | ||||||
| 361 | Express Scripts Holding Co. (a) | 23,046 | ||||||
| 253 | Humana, Inc. | 60,877 | ||||||
| 108 | McKesson Corp. | 17,836 | ||||||
| 171 | Quest Diagnostics, Inc. | 18,964 | ||||||
| 223 | UnitedHealth Group, Inc. | 41,386 | ||||||
| 197 | WellCare Health Plans, Inc. (a) | 35,318 | ||||||
|
| |||||||
| 282,000 | ||||||||
|
| |||||||
Pharmaceuticals — 1.1% |
| |||||||
| 118 | Allergan plc | 28,563 | ||||||
| 282 | Merck & Co., Inc. | 18,042 | ||||||
|
| |||||||
| 46,605 | ||||||||
|
| |||||||
Total Health Care | 593,913 | |||||||
|
| |||||||
| SHARES | SECURITY DESCRIPTION | VALUE($) | ||||||
Industrials — 11.0% |
| |||||||
Aerospace & Defense — 3.1% |
| |||||||
| 514 | Boeing Co. (The) | 101,722 | ||||||
| 301 | Curtiss-Wright Corp. | 27,589 | ||||||
|
| |||||||
| 129,311 | ||||||||
|
| |||||||
Airlines — 2.8% |
| |||||||
| 48 | Alaska Air Group, Inc. | 4,282 | ||||||
| 307 | Copa Holdings SA, (Panama), Class A | 35,907 | ||||||
| 624 | Delta Air Lines, Inc. | 33,531 | ||||||
| 67 | Southwest Airlines Co. | 4,157 | ||||||
| 490 | United Continental Holdings, Inc. (a) | 36,850 | ||||||
|
| |||||||
| 114,727 | ||||||||
|
| |||||||
Electrical Equipment — 0.8% |
| |||||||
| 13 | EnerSys | 973 | ||||||
| 204 | Rockwell Automation, Inc. | 33,056 | ||||||
|
| |||||||
| 34,029 | ||||||||
|
| |||||||
Machinery — 2.8% |
| |||||||
| 205 | Cummins, Inc. | 33,239 | ||||||
| 371 | Deere & Co. | 45,827 | ||||||
| 213 | Parker-Hannifin Corp. | 34,074 | ||||||
|
| |||||||
| 113,140 | ||||||||
|
| |||||||
Professional Services — 0.9% |
| |||||||
| 320 | ManpowerGroup, Inc. | 35,728 | ||||||
|
| |||||||
Trading Companies & Distributors — 0.6% |
| |||||||
| 210 | United Rentals, Inc. (a) | 23,646 | ||||||
|
| |||||||
Total Industrials | 450,581 | |||||||
|
| |||||||
Information Technology — 22.7% |
| |||||||
Internet Software & Services — 3.2% |
| |||||||
| 22 | Alphabet, Inc., Class A (a) | 20,081 | ||||||
| 29 | Alphabet, Inc., Class C (a) | 26,081 | ||||||
| 2,345 | eBay, Inc. (a) | 81,873 | ||||||
| 26 | VeriSign, Inc. (a) | 2,426 | ||||||
|
| |||||||
| 130,461 | ||||||||
|
| |||||||
IT Services — 2.8% |
| |||||||
| 432 | DXC Technology Co. | 33,163 | ||||||
| 148 | International Business Machines Corp. | 22,705 | ||||||
| 610 | Visa, Inc., Class A | 57,215 | ||||||
|
| |||||||
| 113,083 | ||||||||
|
| |||||||
Semiconductors & Semiconductor Equipment — 3.2% |
| |||||||
| 2,120 | Applied Materials, Inc. | 87,569 | ||||||
| 205 | Lam Research Corp. | 29,007 | ||||||
SEE NOTES TO FINANCIAL STATEMENTS.
| 14 | J.P. MORGAN INTREPID FUNDS | JUNE 30, 2017 | ||||
Table of Contents
| SHARES | SECURITY DESCRIPTION | VALUE($) | ||||||
Common Stocks — continued | ||||||||
Semiconductors & Semiconductor Equipment — continued |
| |||||||
| 201 | Maxim Integrated Products, Inc. | 9,003 | ||||||
| 206 | Teradyne, Inc. | 6,183 | ||||||
|
| |||||||
| 131,762 | ||||||||
|
| |||||||
Software — 7.6% |
| |||||||
| 2,145 | Microsoft Corp. | 147,855 | ||||||
| 905 | Oracle Corp. | 45,387 | ||||||
| 915 | Symantec Corp. | 25,837 | ||||||
| 144 | Take-Two Interactive Software, Inc. (a) | 10,552 | ||||||
| 916 | VMware, Inc., Class A (a) | 80,042 | ||||||
|
| |||||||
| 309,673 | ||||||||
|
| |||||||
Technology Hardware, Storage & Peripherals — 5.9% |
| |||||||
| 964 | Apple, Inc. | 138,850 | ||||||
| 4,612 | HP, Inc. | 80,620 | ||||||
| 410 | NCR Corp. (a) | 16,748 | ||||||
| 96 | Seagate Technology plc | 3,720 | ||||||
|
| |||||||
| 239,938 | ||||||||
|
| |||||||
Total Information Technology | 924,917 | |||||||
|
| |||||||
Materials — 2.3% |
| |||||||
Chemicals — 0.8% |
| |||||||
| 1,175 | Huntsman Corp. | 30,354 | ||||||
|
| |||||||
Containers & Packaging — 0.1% |
| |||||||
| 95 | Berry Global Group, Inc. (a) | 5,428 | ||||||
|
| |||||||
Metals & Mining — 1.4% |
| |||||||
| 665 | Newmont Mining Corp. | 21,543 | ||||||
| 77 | Nucor Corp. | 4,433 | ||||||
| 846 | Steel Dynamics, Inc. | 30,309 | ||||||
|
| |||||||
| 56,285 | ||||||||
|
| |||||||
Total Materials | 92,067 | |||||||
|
| |||||||
Real Estate — 2.3% |
| |||||||
Equity Real Estate Investment Trusts (REITs) — 2.3% |
| |||||||
| 608 | American Tower Corp. | 80,490 | ||||||
| 286 | Equity Commonwealth (a) | 9,050 | ||||||
| SHARES | SECURITY DESCRIPTION | VALUE($) | ||||||
Equity Real Estate Investment Trusts (REITs) — continued |
| |||||||
| 77 | Prologis, Inc. | 4,510 | ||||||
|
| |||||||
Total Real Estate | 94,050 | |||||||
|
| |||||||
Telecommunication Services — 2.4% |
| |||||||
Diversified Telecommunication Services — 2.4% |
| |||||||
| 2,578 | AT&T, Inc. | 97,275 | ||||||
|
| |||||||
Utilities — 3.3% |
| |||||||
Electric Utilities — 1.2% |
| |||||||
| 447 | Edison International | 34,935 | ||||||
| 92 | NextEra Energy, Inc. | 12,892 | ||||||
|
| |||||||
| 47,827 | ||||||||
|
| |||||||
Gas Utilities — 0.6% |
| |||||||
| 555 | UGI Corp. | 26,848 | ||||||
|
| |||||||
Independent Power and Renewable Electricity |
| |||||||
| 2,673 | AES Corp. | 29,702 | ||||||
|
| |||||||
Multi-Utilities — 0.8% |
| |||||||
| 1,171 | CenterPoint Energy, Inc. | 32,051 | ||||||
|
| |||||||
Total Utilities | 136,428 | |||||||
|
| |||||||
Total Common Stocks | 4,022,498 | |||||||
|
| |||||||
Short-Term Investment — 2.0% | ||||||||
Investment Company — 2.0% |
| |||||||
| 80,269 | JPMorgan U.S. Government Money Market Fund, Institutional Class Shares, 0.840% (b) (l) | 80,269 | ||||||
|
| |||||||
Total Investments — 100.5% | 4,102,767 | |||||||
Liabilities in Excess of | (19,910 | ) | ||||||
|
| |||||||
NET ASSETS — 100.0% | $ | 4,082,857 | ||||||
|
| |||||||
Percentages indicated are based on net assets.
| Futures Contracts | ||||||||||||||||||||
| NUMBER OF CONTRACTS | DESCRIPTION | EXPIRATION DATE | TRADING CURRENCY | NOTIONAL JUNE 30, 2017 | NET UNREALIZED APPRECIATION (DEPRECIATION) | |||||||||||||||
Long Futures Outstanding |
| |||||||||||||||||||
| 150 | E-mini S&P 500 Index | 09/15/17 | USD | $ | 18,157 | $ | (47 | ) | ||||||||||||
|
| |||||||||||||||||||
SEE NOTES TO FINANCIAL STATEMENTS.
| JUNE 30, 2017 | J.P. MORGAN INTREPID FUNDS | 15 | ||||||
Table of Contents
JPMorgan Intrepid Growth Fund
SCHEDULE OF PORTFOLIO INVESTMENTS
AS OF JUNE 30, 2017
(Amounts in thousands)
| SHARES | SECURITY DESCRIPTION | VALUE($) | ||||||
Common Stocks — 97.6% | ||||||||
Consumer Discretionary — 18.6% |
| |||||||
Auto Components — 0.4% |
| |||||||
| 31 | Lear Corp. | 4,362 | ||||||
|
| |||||||
Automobiles — 0.2% |
| |||||||
| 55 | General Motors Co. | 1,935 | ||||||
|
| |||||||
Hotels, Restaurants & Leisure — 3.4% |
| |||||||
| 143 | Dunkin’ Brands Group, Inc. | 7,899 | ||||||
| 48 | Hilton Worldwide Holdings, Inc. | 2,938 | ||||||
| 204 | International Game Technology plc | 3,733 | ||||||
| 40 | McDonald’s Corp. | 6,172 | ||||||
| 149 | Restaurant Brands International, Inc., (Canada) | 9,305 | ||||||
| 285 | Wendy’s Co. (The) | 4,416 | ||||||
|
| |||||||
| 34,463 | ||||||||
|
| |||||||
Household Durables — 1.3% |
| |||||||
| 134 | DR Horton, Inc. | 4,643 | ||||||
| 4 | NVR, Inc. (a) | 8,678 | ||||||
|
| |||||||
| 13,321 | ||||||||
|
| |||||||
Internet & Direct Marketing Retail — 3.3% |
| |||||||
| 22 | Amazon.com, Inc. (a) | 21,393 | ||||||
| 13 | Expedia, Inc. | 1,996 | ||||||
| 6 | Priceline Group, Inc. (The) (a) | 10,288 | ||||||
|
| |||||||
| 33,677 | ||||||||
|
| |||||||
Media — 4.3% |
| |||||||
| 132 | CBS Corp. (Non-Voting), Class B | 8,432 | ||||||
| 176 | Comcast Corp., Class A | 6,861 | ||||||
| 136 | DISH Network Corp., Class A (a) | 8,541 | ||||||
| 215 | Live Nation Entertainment, Inc. (a) | 7,486 | ||||||
| 57 | Omnicom Group, Inc. | 4,717 | ||||||
| 1,407 | Sirius XM Holdings, Inc. | 7,696 | ||||||
|
| |||||||
| 43,733 | ||||||||
|
| |||||||
Specialty Retail — 5.1% |
| |||||||
| 117 | Best Buy Co., Inc. | 6,731 | ||||||
| 90 | Burlington Stores, Inc. (a) | 8,288 | ||||||
| 187 | Home Depot, Inc. (The) | 28,670 | ||||||
| 139 | Ross Stores, Inc. | 8,048 | ||||||
|
| |||||||
| 51,737 | ||||||||
|
| |||||||
Textiles, Apparel & Luxury Goods — 0.6% |
| |||||||
| 56 | PVH Corp. | 6,400 | ||||||
|
| |||||||
Total Consumer Discretionary | 189,628 | |||||||
|
| |||||||
Consumer Staples — 7.5% |
| |||||||
Beverages — 1.3% |
| |||||||
| 17 | Molson Coors Brewing Co., Class B | 1,442 | ||||||
| SHARES | SECURITY DESCRIPTION | VALUE($) | ||||||
Beverages — continued |
| |||||||
| 104 | PepsiCo, Inc. | 11,965 | ||||||
|
| |||||||
| 13,407 | ||||||||
|
| |||||||
Food & Staples Retailing — 1.6% |
| |||||||
| 57 | Walgreens Boots Alliance, Inc. | 4,456 | ||||||
| 160 | Wal-Mart Stores, Inc. | 12,109 | ||||||
|
| |||||||
| 16,565 | ||||||||
|
| |||||||
Food Products — 3.8% |
| |||||||
| 48 | Bunge Ltd. | 3,558 | ||||||
| 207 | Conagra Brands, Inc. | 7,399 | ||||||
| 310 | Pilgrim’s Pride Corp. (a) | 6,793 | ||||||
| 123 | Pinnacle Foods, Inc. | 7,318 | ||||||
| 221 | Tyson Foods, Inc., Class A | 13,860 | ||||||
|
| |||||||
| 38,928 | ||||||||
|
| |||||||
Personal Products — 0.8% |
| |||||||
| 118 | Nu Skin Enterprises, Inc., Class A | 7,396 | ||||||
|
| |||||||
Total Consumer Staples | 76,296 | |||||||
|
| |||||||
Energy — 0.2% |
| |||||||
Energy Equipment & Services — 0.2% |
| |||||||
| 38 | Baker Hughes, Inc. | 2,093 | ||||||
|
| |||||||
Financials — 2.5% |
| |||||||
Capital Markets — 1.1% |
| |||||||
| 8 | MarketAxess Holdings, Inc. | 1,629 | ||||||
| 44 | Morgan Stanley | 1,969 | ||||||
| 79 | MSCI, Inc. | 8,085 | ||||||
|
| |||||||
| 11,683 | ||||||||
|
| |||||||
Insurance — 1.4% |
| |||||||
| 85 | Assured Guaranty Ltd. | 3,535 | ||||||
| 29 | Everest Re Group Ltd. | 7,256 | ||||||
| 32 | Lincoln National Corp. | 2,190 | ||||||
| 12 | Prudential Financial, Inc. | �� | 1,254 | |||||
|
| |||||||
| 14,235 | ||||||||
|
| |||||||
Total Financials | 25,918 | |||||||
|
| |||||||
Health Care — 14.5% |
| |||||||
Biotechnology — 5.2% |
| |||||||
| 58 | AbbVie, Inc. | 4,198 | ||||||
| 142 | Amgen, Inc. | 24,405 | ||||||
| 114 | Exelixis, Inc. (a) | 2,803 | ||||||
| 299 | Gilead Sciences, Inc. | 21,185 | ||||||
|
| |||||||
| 52,591 | ||||||||
|
| |||||||
SEE NOTES TO FINANCIAL STATEMENTS.
| 16 | J.P. MORGAN INTREPID FUNDS | JUNE 30, 2017 | ||||
Table of Contents
| SHARES | SECURITY DESCRIPTION | VALUE($) | ||||||
Common Stocks — continued | ||||||||
Health Care Equipment & Supplies — 4.0% |
| |||||||
| 57 | Align Technology, Inc. (a) | 8,527 | ||||||
| 173 | Baxter International, Inc. | 10,480 | ||||||
| 180 | Hologic, Inc. (a) | 8,173 | ||||||
| 52 | IDEXX Laboratories, Inc. (a) | 8,458 | ||||||
| 55 | Masimo Corp. (a) | 4,978 | ||||||
|
| |||||||
| 40,616 | ||||||||
|
| |||||||
Health Care Providers & Services — 5.1% |
| |||||||
| 104 | Aetna, Inc. | 15,820 | ||||||
| 73 | Anthem, Inc. | 13,809 | ||||||
| 12 | Cigna Corp. | 1,942 | ||||||
| 51 | Humana, Inc. | 12,271 | ||||||
| 48 | WellCare Health Plans, Inc. (a) | 8,637 | ||||||
|
| |||||||
| 52,479 | ||||||||
|
| |||||||
Health Care Technology — 0.2% |
| |||||||
| 39 | Veeva Systems, Inc., Class A (a) | 2,373 | ||||||
|
| |||||||
Total Health Care | 148,059 | |||||||
|
| |||||||
Industrials — 11.7% |
| |||||||
Aerospace & Defense — 2.9% |
| |||||||
| 147 | Boeing Co. (The) | 29,109 | ||||||
|
| |||||||
Airlines — 2.9% |
| |||||||
| 63 | Copa Holdings SA, (Panama), Class A | 7,418 | ||||||
| 187 | Delta Air Lines, Inc. | 10,039 | ||||||
| 49 | Southwest Airlines Co. | 3,014 | ||||||
| 121 | United Continental Holdings, Inc. (a) | 9,067 | ||||||
|
| |||||||
| 29,538 | ||||||||
|
| |||||||
Electrical Equipment — 0.9% |
| |||||||
| 15 | EnerSys | 1,058 | ||||||
| 50 | Rockwell Automation, Inc. | 8,131 | ||||||
|
| |||||||
| 9,189 | ||||||||
|
| |||||||
Machinery — 3.4% |
| |||||||
| 209 | Allison Transmission Holdings, Inc. | 7,839 | ||||||
| 110 | Deere & Co. | 13,632 | ||||||
| 57 | Lincoln Electric Holdings, Inc. | 5,231 | ||||||
| 50 | Parker-Hannifin Corp. | 7,991 | ||||||
|
| |||||||
| 34,693 | ||||||||
|
| |||||||
Professional Services — 0.9% |
| |||||||
| 80 | ManpowerGroup, Inc. | 8,898 | ||||||
|
| |||||||
Trading Companies & Distributors ��� 0.7% |
| |||||||
| 68 | United Rentals, Inc. (a) | 7,687 | ||||||
|
| |||||||
Total Industrials | 119,114 | |||||||
|
| |||||||
| SHARES | SECURITY DESCRIPTION | VALUE($) | ||||||
Information Technology — 35.8% |
| |||||||
Internet Software & Services — 7.8% |
| |||||||
| 18 | Alphabet, Inc., Class A (a) | 16,734 | ||||||
| 18 | Alphabet, Inc., Class C (a) | 15,994 | ||||||
| 628 | eBay, Inc. (a) | 21,940 | ||||||
| 68 | Facebook, Inc., Class A (a) | 10,237 | ||||||
| 32 | IAC/InterActiveCorp (a) | 3,335 | ||||||
| 35 | LogMeIn, Inc. | 3,684 | ||||||
| 87 | VeriSign, Inc. (a) | 8,050 | ||||||
|
| |||||||
| 79,974 | ||||||||
|
| |||||||
IT Services — 4.0% |
| |||||||
| 107 | DXC Technology Co. | 8,209 | ||||||
| 2 | Mastercard, Inc., Class A | 243 | ||||||
| 340 | Visa, Inc., Class A | 31,904 | ||||||
|
| |||||||
| 40,356 | ||||||||
|
| |||||||
Semiconductors & Semiconductor Equipment — 4.1% |
| |||||||
| 573 | Applied Materials, Inc. | 23,675 | ||||||
| 57 | Lam Research Corp. | 8,033 | ||||||
| 36 | Maxim Integrated Products, Inc. | 1,630 | ||||||
| 29 | Skyworks Solutions, Inc. | 2,821 | ||||||
| 184 | Teradyne, Inc. | 5,510 | ||||||
|
| |||||||
| 41,669 | ||||||||
|
| |||||||
Software — 12.1% |
| |||||||
| 83 | Adobe Systems, Inc. (a) | 11,740 | ||||||
| 41 | Aspen Technology, Inc. (a) | 2,260 | ||||||
| 37 | Autodesk, Inc. (a) | 3,700 | ||||||
| 87 | Citrix Systems, Inc. (a) | 6,884 | ||||||
| 729 | Microsoft Corp. | 50,260 | ||||||
| 174 | Oracle Corp. | 8,734 | ||||||
| 92 | Symantec Corp. | 2,585 | ||||||
| 115 | Synopsys, Inc. (a) | 8,409 | ||||||
| 113 | Take-Two Interactive Software, Inc. (a) | 8,263 | ||||||
| 234 | VMware, Inc., Class A (a) | 20,441 | ||||||
|
| |||||||
| 123,276 | ||||||||
|
| |||||||
Technology Hardware, Storage & Peripherals — 7.8% |
| |||||||
| 416 | Apple, Inc. | 59,976 | ||||||
| 761 | HP, Inc. | 13,299 | ||||||
| 148 | NCR Corp. (a) | 6,032 | ||||||
|
| |||||||
| 79,307 | ||||||||
|
| |||||||
Total Information Technology | 364,582 | |||||||
|
| |||||||
Materials — 3.4% |
| |||||||
Chemicals — 1.5% |
| |||||||
| 23 | Albemarle Corp. | 2,396 | ||||||
SEE NOTES TO FINANCIAL STATEMENTS.
| JUNE 30, 2017 | J.P. MORGAN INTREPID FUNDS | 17 | ||||||
Table of Contents
JPMorgan Intrepid Growth Fund
SCHEDULE OF PORTFOLIO INVESTMENTS
AS OF JUNE 30, 2017 (continued)
(Amounts in thousands, except number of Futures contracts)
| SHARES | SECURITY DESCRIPTION | VALUE($) | ||||||
Common Stocks — continued | ||||||||
Chemicals — continued |
| |||||||
| 121 | Chemours Co. (The) | 4,600 | ||||||
| 333 | Huntsman Corp. | 8,599 | ||||||
|
| |||||||
| 15,595 | ||||||||
|
| |||||||
Construction Materials — 0.1% |
| |||||||
| 15 | Eagle Materials, Inc. | 1,340 | ||||||
|
| |||||||
Containers & Packaging — 0.8% |
| |||||||
| 140 | Berry Global Group, Inc. (a) | 7,970 | ||||||
|
| |||||||
Metals & Mining — 1.0% |
| |||||||
| 65 | Newmont Mining Corp. | 2,112 | ||||||
| 210 | Steel Dynamics, Inc. | 7,506 | ||||||
|
| |||||||
| 9,618 | ||||||||
|
| |||||||
Total Materials | 34,523 | |||||||
|
| |||||||
Real Estate — 2.3% |
| |||||||
Equity Real Estate Investment Trusts (REITs) — 2.3% |
| |||||||
| 85 | American Homes 4 Rent, Class A | 1,921 | ||||||
| 115 | American Tower Corp. | 15,151 | ||||||
| 107 | Equity Commonwealth (a) | 3,372 | ||||||
| 124 | GEO Group, Inc. (The) | 3,669 | ||||||
|
| |||||||
Total Real Estate | 24,113 | |||||||
|
| |||||||
Telecommunication Services — 0.7% |
| |||||||
Diversified Telecommunication Services — 0.4% |
| |||||||
| 111 | AT&T, Inc. | 4,189 | ||||||
|
| |||||||
| SHARES | SECURITY DESCRIPTION | VALUE($) | ||||||
Wireless Telecommunication Services — 0.3% |
| |||||||
| 52 | T-Mobile US, Inc. (a) | 3,165 | ||||||
|
| |||||||
Total Telecommunication Services | 7,354 | |||||||
|
| |||||||
Utilities — 0.4% |
| |||||||
Independent Power and Renewable Electricity |
| |||||||
| 340 | AES Corp. | 3,778 | ||||||
|
| |||||||
Total Common Stocks | 995,458 | |||||||
|
| |||||||
Short-Term Investment — 2.9% | ||||||||
Investment Company — 2.9% |
| |||||||
| 29,184 | JPMorgan U.S. Government Money Market Fund, Institutional Class Shares, 0.840% (b) (l) | 29,184 | ||||||
|
| |||||||
Total Investments — 100.5% | 1,024,642 | |||||||
Liabilities in Excess of | (5,519 | ) | ||||||
|
| |||||||
NET ASSETS — 100.0% | $ | 1,019,123 | ||||||
|
| |||||||
Percentages indicated are based on net assets.
| Futures Contracts | ||||||||||||||||||||
| NUMBER OF CONTRACTS | DESCRIPTION | EXPIRATION DATE | TRADING CURRENCY | NOTIONAL VALUE AT JUNE 30, 2017 | NET UNREALIZED APPRECIATION (DEPRECIATION) | |||||||||||||||
Long Futures Outstanding |
| |||||||||||||||||||
| 188 | E-mini S&P 500 Index | 09/15/17 | USD | $ | 22,756 | $ | (72 | ) | ||||||||||||
|
| |||||||||||||||||||
SEE NOTES TO FINANCIAL STATEMENTS.
| 18 | J.P. MORGAN INTREPID FUNDS | JUNE 30, 2017 | ||||
Table of Contents
JPMorgan Intrepid Mid Cap Fund
SCHEDULE OF PORTFOLIO INVESTMENTS
AS OF JUNE 30, 2017
(Amounts in thousands)
| SHARES | SECURITY DESCRIPTION | VALUE($) | ||||||
Common Stocks — 99.4% | ||||||||
Consumer Discretionary — 10.9% | ||||||||
Auto Components — 1.0% | ||||||||
| 89 | Visteon Corp. (a) | 9,032 | ||||||
|
| |||||||
Hotels, Restaurants & Leisure — 2.5% | ||||||||
| 28 | Darden Restaurants, Inc. | 2,532 | ||||||
| 22 | Royal Caribbean Cruises Ltd. | 2,447 | ||||||
| 23 | Vail Resorts, Inc. | 4,665 | ||||||
| 26 | Wyndham Worldwide Corp. | 2,621 | ||||||
| 250 | Yum China Holdings, Inc. (a) | 9,869 | ||||||
|
| |||||||
| 22,134 | ||||||||
|
| |||||||
Household Durables — 0.8% | ||||||||
| 175 | DR Horton, Inc. | 6,046 | ||||||
| — | (h) | NVR, Inc. (a) | 1,085 | |||||
|
| |||||||
| 7,131 | ||||||||
|
| |||||||
Leisure Products — 0.7% | ||||||||
| 57 | Hasbro, Inc. | 6,334 | ||||||
|
| |||||||
Media — 1.7% | ||||||||
| — | (h) | Cable One, Inc. | 284 | |||||
| 155 | Liberty Media Corp.-Liberty SiriusXM, Class A (a) | 6,520 | ||||||
| 89 | TEGNA, Inc. | 1,285 | ||||||
| 195 | Viacom, Inc., Class B | 6,556 | ||||||
|
| |||||||
| 14,645 | ||||||||
|
| |||||||
Specialty Retail — 3.1% | ||||||||
| 317 | Best Buy Co., Inc. | 18,191 | ||||||
| 90 | Tiffany & Co. | 8,467 | ||||||
| 3 | Ulta Beauty, Inc. (a) | 833 | ||||||
|
| |||||||
| 27,491 | ||||||||
|
| |||||||
Textiles, Apparel & Luxury Goods — 1.1% | ||||||||
| 86 | PVH Corp. | 9,859 | ||||||
|
| |||||||
Total Consumer Discretionary | 96,626 | |||||||
|
| |||||||
Consumer Staples — 5.9% | ||||||||
Food & Staples Retailing — 1.0% |
| |||||||
| 290 | Rite Aid Corp. (a) | 855 | ||||||
| 131 | Sysco Corp. | 6,568 | ||||||
| 62 | US Foods Holding Corp. (a) | 1,699 | ||||||
|
| |||||||
| 9,122 | ||||||||
|
| |||||||
Food Products — 4.5% | ||||||||
| 77 | Bunge Ltd. | 5,737 | ||||||
| 98 | Ingredion, Inc. | 11,718 | ||||||
| 354 | Pilgrim’s Pride Corp. (a) | 7,757 | ||||||
| 233 | Tyson Foods, Inc., Class A | 14,568 | ||||||
|
| |||||||
| 39,780 | ||||||||
|
| |||||||
| SHARES | SECURITY DESCRIPTION | VALUE($) | ||||||
Personal Products — 0.4% | ||||||||
| 25 | Herbalife Ltd. (a) | 1,812 | ||||||
| 34 | Nu Skin Enterprises, Inc., Class A | 2,130 | ||||||
|
| |||||||
| 3,942 | ||||||||
|
| |||||||
Total Consumer Staples | 52,844 | |||||||
|
| |||||||
Energy — 6.2% | ||||||||
Energy Equipment & Services — 1.1% | ||||||||
| 172 | Baker Hughes, Inc. | 9,392 | ||||||
|
| |||||||
Oil, Gas & Consumable Fuels — 5.1% | ||||||||
| 306 | Cabot Oil & Gas Corp. | 7,669 | ||||||
| 47 | Cimarex Energy Co. | 4,461 | ||||||
| 82 | Devon Energy Corp. | 2,609 | ||||||
| 413 | Marathon Oil Corp. | 4,893 | ||||||
| 90 | Marathon Petroleum Corp. | 4,710 | ||||||
| 42 | Murphy Oil Corp. | 1,082 | ||||||
| 6 | Noble Energy, Inc. | 175 | ||||||
| 21 | ONEOK, Inc. | 1,085 | ||||||
| 51 | PBF Energy, Inc., Class A | 1,128 | ||||||
| 209 | QEP Resources, Inc. (a) | 2,110 | ||||||
| 18 | Rice Energy, Inc. (a) | 482 | ||||||
| 46 | Tesoro Corp. | 4,277 | ||||||
| 26 | Valero Energy Corp. | 1,761 | ||||||
| 66 | Williams Cos., Inc. (The) | 2,011 | ||||||
| 145 | World Fuel Services Corp. | 5,587 | ||||||
| 149 | WPX Energy, Inc. (a) | 1,436 | ||||||
|
| |||||||
| 45,476 | ||||||||
|
| |||||||
Total Energy | 54,868 | |||||||
|
| |||||||
Financials — 13.8% | ||||||||
Apartments — 0.2% | ||||||||
| 19 | Sun Communities, Inc. | 1,675 | ||||||
|
| |||||||
Banks — 4.2% | ||||||||
| 31 | Citizens Financial Group, Inc. | 1,113 | ||||||
| 48 | East West Bancorp, Inc. | 2,783 | ||||||
| 195 | KeyCorp | 3,656 | ||||||
| 291 | Popular, Inc., (Puerto Rico) | 12,133 | ||||||
| 258 | Regions Financial Corp. | 3,773 | ||||||
| 18 | SVB Financial Group (a) | 3,217 | ||||||
| 184 | Synovus Financial Corp. | 8,149 | ||||||
| 51 | Zions Bancorp | 2,239 | ||||||
|
| |||||||
| 37,063 | ||||||||
|
| |||||||
Capital Markets — 3.4% | ||||||||
| 65 | BGC Partners, Inc., Class A | 824 | ||||||
| 29 | Intercontinental Exchange, Inc. | 1,879 | ||||||
| 15 | Lazard Ltd., Class A | 695 | ||||||
SEE NOTES TO FINANCIAL STATEMENTS.
| JUNE 30, 2017 | J.P. MORGAN INTREPID FUNDS | 19 | ||||||
Table of Contents
JPMorgan Intrepid Mid Cap Fund
SCHEDULE OF PORTFOLIO INVESTMENTS
AS OF JUNE 30, 2017 (continued)
(Amounts in thousands)
| SHARES | SECURITY DESCRIPTION | VALUE($) | ||||||
Common Stocks — continued | ||||||||
Capital Markets — continued | ||||||||
| 138 | LPL Financial Holdings, Inc. | 5,853 | ||||||
| 10 | MarketAxess Holdings, Inc. | 1,971 | ||||||
| 132 | MSCI, Inc. | 13,636 | ||||||
| 71 | Raymond James Financial, Inc. | 5,719 | ||||||
|
| |||||||
| 30,577 | ||||||||
|
| |||||||
Consumer Finance — 1.1% | ||||||||
| 107 | Discover Financial Services | 6,648 | ||||||
| 109 | Synchrony Financial | 3,248 | ||||||
|
| |||||||
| 9,896 | ||||||||
|
| |||||||
Diversified Financial Services — 0.1% | ||||||||
| 36 | Voya Financial, Inc. | 1,332 | ||||||
|
| |||||||
Insurance — 4.6% | ||||||||
| 54 | Allied World Assurance Co. Holdings AG | 2,851 | ||||||
| 55 | American Financial Group, Inc. | 5,465 | ||||||
| 4 | American National Insurance Co. | 478 | ||||||
| 17 | Aon plc | 2,260 | ||||||
| 13 | Arch Capital Group Ltd. (a) | 1,199 | ||||||
| 26 | Aspen Insurance Holdings Ltd., (Bermuda) | 1,311 | ||||||
| 26 | Assurant, Inc. | 2,732 | ||||||
| 39 | Assured Guaranty Ltd. | 1,640 | ||||||
| 9 | Everest Re Group Ltd. | 2,368 | ||||||
| 12 | First American Financial Corp. | 550 | ||||||
| 65 | FNF Group | 2,894 | ||||||
| 57 | Hanover Insurance Group, Inc. (The) | 5,061 | ||||||
| 36 | Hartford Financial Services Group, Inc. (The) | 1,882 | ||||||
| 25 | Lincoln National Corp. | 1,656 | ||||||
| 33 | Principal Financial Group, Inc. | 2,082 | ||||||
| 20 | Progressive Corp. (The) | 895 | ||||||
| 17 | Torchmark Corp. | 1,264 | ||||||
| 68 | Unum Group | 3,157 | ||||||
| 17 | Validus Holdings Ltd. | 857 | ||||||
|
| |||||||
| 40,602 | ||||||||
|
| |||||||
Mortgage Real Estate Investment Trusts (REITs) — 0.1% |
| |||||||
| 44 | AGNC Investment Corp. | 928 | ||||||
| 9 | Chimera Investment Corp. | 162 | ||||||
|
| |||||||
| 1,090 | ||||||||
|
| |||||||
Office — 0.1% | ||||||||
| 25 | Douglas Emmett, Inc. | 940 | ||||||
|
| |||||||
Total Financials | 123,175 | |||||||
|
| |||||||
Health Care — 10.7% | ||||||||
Biotechnology — 2.2% | ||||||||
| 75 | ACADIA Pharmaceuticals, Inc. (a) | 2,089 | ||||||
| 49 | Alnylam Pharmaceuticals, Inc. (a) | 3,892 | ||||||
| SHARES | SECURITY DESCRIPTION | VALUE($) | ||||||
Biotechnology — continued | ||||||||
| 15 | BioMarin Pharmaceutical, Inc. (a) | 1,335 | ||||||
| 35 | Incyte Corp. (a) | 4,369 | ||||||
| 18 | Intercept Pharmaceuticals, Inc. (a) | 2,179 | ||||||
| 98 | Juno Therapeutics, Inc. (a) | 2,929 | ||||||
| 18 | TESARO, Inc. (a) | 2,504 | ||||||
|
| |||||||
| 19,297 | ||||||||
|
| |||||||
Health Care Equipment & Supplies — 4.0% | ||||||||
| 146 | Hill-Rom Holdings, Inc. | 11,599 | ||||||
| 236 | Hologic, Inc. (a) | 10,701 | ||||||
| 102 | Zimmer Biomet Holdings, Inc. | 13,032 | ||||||
|
| |||||||
| 35,332 | ||||||||
|
| |||||||
Health Care Providers & Services — 3.6% | ||||||||
| 146 | AmerisourceBergen Corp. | 13,801 | ||||||
| 27 | Centene Corp. (a) | 2,149 | ||||||
| 291 | Premier, Inc., Class A (a) | 10,458 | ||||||
| 34 | WellCare Health Plans, Inc. (a) | 6,033 | ||||||
|
| |||||||
| 32,441 | ||||||||
|
| |||||||
Pharmaceuticals — 0.9% | ||||||||
| 65 | Mallinckrodt plc (a) | 2,926 | ||||||
| 63 | Mylan NV (a) | 2,462 | ||||||
| 40 | Perrigo Co. plc | 2,998 | ||||||
|
| |||||||
| 8,386 | ||||||||
|
| |||||||
Total Health Care | 95,456 | |||||||
|
| |||||||
Industrials — 14.8% | ||||||||
Aerospace & Defense — 3.7% | ||||||||
| 133 | HEICO Corp., Class A | 8,259 | ||||||
| 85 | Huntington Ingalls Industries, Inc. | 15,733 | ||||||
| 30 | L3 Technologies, Inc. | 4,929 | ||||||
| 2 | Northrop Grumman Corp. | 616 | ||||||
| 59 | Spirit AeroSystems Holdings, Inc., Class A | 3,436 | ||||||
|
| |||||||
| 32,973 | ||||||||
|
| |||||||
Airlines — 2.1% | ||||||||
| 250 | United Continental Holdings, Inc. (a) | 18,813 | ||||||
|
| |||||||
Building Products — 0.8% | ||||||||
| 77 | Fortune Brands Home & Security, Inc. | 5,010 | ||||||
| 28 | Owens Corning | 1,854 | ||||||
|
| |||||||
| 6,864 | ||||||||
|
| |||||||
Commercial Services & Supplies — 0.3% | ||||||||
| 33 | Stericycle, Inc. (a) | 2,534 | ||||||
|
| |||||||
Construction & Engineering — 0.5% | ||||||||
| 25 | Fluor Corp. | 1,154 | ||||||
| 64 | Jacobs Engineering Group, Inc. | 3,497 | ||||||
|
| |||||||
| 4,651 | ||||||||
|
| |||||||
SEE NOTES TO FINANCIAL STATEMENTS.
| 20 | J.P. MORGAN INTREPID FUNDS | JUNE 30, 2017 | ||||
Table of Contents
| SHARES | SECURITY DESCRIPTION | VALUE($) | ||||||
Common Stocks — continued | ||||||||
Electrical Equipment — 0.6% | ||||||||
| 61 | Regal Beloit Corp. | 4,958 | ||||||
|
| |||||||
Machinery — 3.6% | ||||||||
| 116 | Crane Co. | 9,168 | ||||||
| 152 | Gardner Denver Holdings, Inc. (a) | 3,291 | ||||||
| 124 | Ingersoll-Rand plc | 11,332 | ||||||
| 53 | Parker-Hannifin Corp. | 8,527 | ||||||
|
| |||||||
| 32,318 | ||||||||
|
| |||||||
Professional Services — 2.8% | ||||||||
| 173 | ManpowerGroup, Inc. | 19,360 | ||||||
| 133 | TransUnion (a) | 5,756 | ||||||
|
| |||||||
| 25,116 | ||||||||
|
| |||||||
Road & Rail — 0.1% | ||||||||
| 14 | Landstar System, Inc. | 1,224 | ||||||
|
| |||||||
Trading Companies & Distributors — 0.3% | ||||||||
| 39 | WESCO International, Inc. (a) | 2,229 | ||||||
|
| |||||||
Total Industrials | 131,680 | |||||||
|
| |||||||
Information Technology — 15.3% | ||||||||
Communications Equipment — 1.0% | ||||||||
| 236 | ARRIS International plc (a) | 6,604 | ||||||
| 17 | F5 Networks, Inc. (a) | 2,160 | ||||||
|
| |||||||
| 8,764 | ||||||||
|
| |||||||
Electronic Equipment, Instruments & Components — 0.9% |
| |||||||
| 118 | Avnet, Inc. | 4,596 | ||||||
| 93 | FLIR Systems, Inc. | 3,206 | ||||||
|
| |||||||
| 7,802 | ||||||||
|
| |||||||
Internet Software & Services — 0.6% | ||||||||
| 36 | IAC/InterActiveCorp (a) | 3,665 | ||||||
| 165 | Pandora Media, Inc. (a) | 1,475 | ||||||
|
| |||||||
| 5,140 | ||||||||
|
| |||||||
IT Services — 4.4% | ||||||||
| 177 | DXC Technology Co. | 13,595 | ||||||
| 43 | Fidelity National Information Services, Inc. | 3,698 | ||||||
| 41 | Leidos Holdings, Inc. | 2,124 | ||||||
| 87 | Square, Inc., Class A (a) | 2,039 | ||||||
| 93 | Total System Services, Inc. | 5,406 | ||||||
| 196 | Vantiv, Inc., Class A (a) | 12,427 | ||||||
|
| |||||||
| 39,289 | ||||||||
|
| |||||||
Semiconductors & Semiconductor Equipment — 2.7% |
| |||||||
| 13 | KLA-Tencor Corp. | 1,226 | ||||||
| 19 | Lam Research Corp. | 2,715 | ||||||
| 1,048 | Marvell Technology Group Ltd., (Bermuda) | 17,313 | ||||||
| SHARES | SECURITY DESCRIPTION | VALUE($) | ||||||
Semiconductors & Semiconductor Equipment — continued |
| |||||||
| 165 | ON Semiconductor Corp. (a) | 2,319 | ||||||
| 6 | Skyworks Solutions, Inc. | 557 | ||||||
|
| |||||||
| 24,130 | ||||||||
|
| |||||||
Software — 2.1% | ||||||||
| 56 | Activision Blizzard, Inc. | 3,241 | ||||||
| 72 | Citrix Systems, Inc. (a) | 5,730 | ||||||
| 451 | Nuance Communications, Inc. (a) | 7,843 | ||||||
| 559 | Zynga, Inc., Class A (a) | 2,036 | ||||||
|
| |||||||
| 18,850 | ||||||||
|
| |||||||
Technology Hardware, Storage & Peripherals — 3.6% |
| |||||||
| 86 | NCR Corp. (a) | 3,512 | ||||||
| 165 | Western Digital Corp. | 14,619 | ||||||
| 497 | Xerox Corp. | 14,280 | ||||||
|
| |||||||
| 32,411 | ||||||||
|
| |||||||
Total Information Technology | 136,386 | |||||||
|
| |||||||
Materials — 5.3% | ||||||||
Chemicals — 1.9% | ||||||||
| 226 | Cabot Corp. | 12,064 | ||||||
| 186 | Huntsman Corp. | 4,804 | ||||||
|
| |||||||
| 16,868 | ||||||||
|
| |||||||
Containers & Packaging — 1.9% | ||||||||
| 41 | Avery Dennison Corp. | 3,632 | ||||||
| 183 | Berry Global Group, Inc. (a) | 10,404 | ||||||
| 54 | International Paper Co. | 3,080 | ||||||
|
| |||||||
| 17,116 | ||||||||
|
| |||||||
Metals & Mining — 1.5% | ||||||||
| 25 | Newmont Mining Corp. | 823 | ||||||
| 15 | Reliance Steel & Aluminum Co. | 1,078 | ||||||
| 309 | Steel Dynamics, Inc. | 11,065 | ||||||
|
| |||||||
| 12,966 | ||||||||
|
| |||||||
Total Materials | 46,950 | |||||||
|
| |||||||
Real Estate — 9.9% | ||||||||
Equity Real Estate Investment Trusts (REITs) — 9.9% |
| |||||||
| 49 | American Campus Communities, Inc. | 2,308 | ||||||
| 239 | American Homes 4 Rent, Class A | 5,390 | ||||||
| 11 | Apartment Investment & Management Co., Class A | 460 | ||||||
| 429 | Apple Hospitality REIT, Inc. | 8,028 | ||||||
| 7 | Boston Properties, Inc. | 824 | ||||||
| 86 | Brixmor Property Group, Inc. | 1,541 | ||||||
| 210 | CoreCivic, Inc. | 5,778 | ||||||
| 134 | Corporate Office Properties Trust | 4,687 | ||||||
| 15 | Crown Castle International Corp. | 1,513 | ||||||
SEE NOTES TO FINANCIAL STATEMENTS.
| JUNE 30, 2017 | J.P. MORGAN INTREPID FUNDS | 21 | ||||||
Table of Contents
JPMorgan Intrepid Mid Cap Fund
SCHEDULE OF PORTFOLIO INVESTMENTS
AS OF JUNE 30, 2017 (continued)
(Amounts in thousands, except number of Futures contracts)
| SHARES | SECURITY DESCRIPTION | VALUE($) | ||||||
Common Stocks — continued | ||||||||
Equity Real Estate Investment Trusts (REITs) — continued |
| |||||||
| 44 | CyrusOne, Inc. | 2,447 | ||||||
| 21 | Digital Realty Trust, Inc. | 2,383 | ||||||
| 39 | Equinix, Inc. | 16,738 | ||||||
| 193 | Equity Commonwealth (a) | 6,113 | ||||||
| 37 | Equity LifeStyle Properties, Inc. | 3,151 | ||||||
| 35 | Liberty Property Trust | 1,405 | ||||||
| 42 | Mid-America Apartment Communities, Inc. | 4,465 | ||||||
| 95 | Outfront Media, Inc. | 2,201 | ||||||
| 107 | Prologis, Inc. | 6,298 | ||||||
| 34 | Regency Centers Corp. | 2,142 | ||||||
| 113 | Retail Properties of America, Inc., Class A | 1,374 | ||||||
| 22 | SBA Communications Corp. (a) | 3,022 | ||||||
| 3 | SL Green Realty Corp. | 265 | ||||||
| 59 | Spirit Realty Capital, Inc. | 439 | ||||||
| 9 | Taubman Centers, Inc. | 518 | ||||||
| 2 | Ventas, Inc. | 151 | ||||||
| 138 | Weyerhaeuser Co. | 4,606 | ||||||
|
| |||||||
Total Real Estate | 88,247 | |||||||
|
| |||||||
Telecommunication Services — 0.6% | ||||||||
Diversified Telecommunication Services — 0.4% |
| |||||||
| 156 | CenturyLink, Inc. | 3,730 | ||||||
|
| |||||||
Wireless Telecommunication Services — 0.2% | ||||||||
| 50 | Telephone & Data Systems, Inc. | 1,388 | ||||||
|
| |||||||
Total Telecommunication Services | 5,118 | |||||||
|
| |||||||
Utilities — 6.0% | ||||||||
Electric Utilities — 1.6% | ||||||||
| 57 | Alliant Energy Corp. | 2,306 | ||||||
| 87 | Edison International | 6,763 | ||||||
| 110 | FirstEnergy Corp. | 3,205 | ||||||
| 50 | Great Plains Energy, Inc. | 1,455 | ||||||
| 6 | Pinnacle West Capital Corp. | 494 | ||||||
|
| |||||||
| 14,223 | ||||||||
|
| |||||||
Gas Utilities — 1.1% | ||||||||
| 25 | National Fuel Gas Co. | 1,407 | ||||||
| 177 | UGI Corp. | 8,552 | ||||||
|
| |||||||
| 9,959 | ||||||||
|
| |||||||
| SHARES | SECURITY DESCRIPTION | VALUE($) | ||||||
Independent Power and Renewable Electricity Producers — 1.9% |
| |||||||
| 995 | NRG Energy, Inc. | 17,136 | ||||||
|
| |||||||
Multi-Utilities — 1.4% | ||||||||
| 35 | Ameren Corp. | 1,935 | ||||||
| 92 | CenterPoint Energy, Inc. | 2,524 | ||||||
| 87 | CMS Energy Corp. | 4,001 | ||||||
| 23 | Consolidated Edison, Inc. | 1,875 | ||||||
| 14 | DTE Energy Co. | 1,502 | ||||||
|
| |||||||
| 11,837 | ||||||||
|
| |||||||
Total Utilities | 53,155 | |||||||
|
| |||||||
Total Common Stocks | 884,505 | |||||||
|
| |||||||
| NUMBER OF RIGHTS | ||||||||
Rights — 0.0% (g) | ||||||||
Consumer Staples — 0.0% (g) | ||||||||
Food & Staples Retailing — 0.0% (g) | ||||||||
| 121 | Safeway, Inc. Casa Ley CVR | 8 | ||||||
| 121 | Safeway, Inc. PDC CVR (a) | 4 | ||||||
|
| |||||||
Total Rights | 12 | |||||||
|
| |||||||
| SHARES | ||||||||
Short-Term Investment — 0.9% | ||||||||
Investment Company — 0.9% | ||||||||
| 7,698 | JPMorgan U.S. Government Money Market Fund, Institutional Class Shares, | 7,698 | ||||||
|
| |||||||
Total Investments — 100.3% | 892,215 | |||||||
Liabilities in Excess of | (2,476 | ) | ||||||
|
| |||||||
NET ASSETS — 100.0% | $ | 889,739 | ||||||
|
| |||||||
Percentages indicated are based on net assets.
| Futures Contracts | ||||||||||||||||||||
| NUMBER OF CONTRACTS | DESCRIPTION | EXPIRATION DATE | TRADING CURRENCY | NOTIONAL VALUE AT JUNE 30, 2017 | NET UNREALIZED APPRECIATION (DEPRECIATION) | |||||||||||||||
Long Futures Outstanding | ||||||||||||||||||||
| 19 | E-mini S&P MidCap 400 | 09/15/17 | USD | $ | 3,318 | $ | 14 | |||||||||||||
|
| |||||||||||||||||||
SEE NOTES TO FINANCIAL STATEMENTS.
| 22 | J.P. MORGAN INTREPID FUNDS | JUNE 30, 2017 | ||||
Table of Contents
JPMorgan Intrepid Sustainable Equity Fund
(formerly known as JPMorgan Intrepid Advantage Fund)
SCHEDULE OF PORTFOLIO INVESTMENTS
AS OF JUNE 30, 2017
(Amounts in thousands)
| SHARES | SECURITY DESCRIPTION | VALUE($) | ||||||
Common Stocks — 99.1% | ||||||||
Consumer Discretionary — 11.1% | ||||||||
Hotels, Restaurants & Leisure — 2.1% |
| |||||||
| 2 | Dunkin’ Brands Group, Inc. | 136 | ||||||
| 4 | Restaurant Brands International, Inc., (Canada) | 244 | ||||||
|
| |||||||
| 380 | ||||||||
|
| |||||||
Media — 4.1% | ||||||||
| 37 | Sirius XM Holdings, Inc. | 205 | ||||||
| 3 | Time Warner, Inc. | 276 | ||||||
| 2 | Walt Disney Co. (The) | 260 | ||||||
|
| |||||||
| 741 | ||||||||
|
| |||||||
Specialty Retail — 3.4% | ||||||||
| 2 | Home Depot, Inc. (The) | 288 | ||||||
| 4 | Lowe’s Cos., Inc. | 331 | ||||||
|
| |||||||
| 619 | ||||||||
|
| |||||||
Textiles, Apparel & Luxury Goods — 1.5% | ||||||||
| 2 | PVH Corp. | 272 | ||||||
|
| |||||||
Total Consumer Discretionary | 2,012 | |||||||
|
| |||||||
Consumer Staples — 7.8% | ||||||||
Beverages — 5.0% | ||||||||
| 3 | Dr Pepper Snapple Group, Inc. | 241 | ||||||
| 2 | Molson Coors Brewing Co., Class B | 201 | ||||||
| 4 | PepsiCo, Inc. | 468 | ||||||
|
| |||||||
| 910 | ||||||||
|
| |||||||
Food & Staples Retailing — 2.0% | ||||||||
| 5 | Walgreens Boots Alliance, Inc. | 358 | ||||||
|
| |||||||
Food Products — 0.8% | ||||||||
| 1 | Ingredion, Inc. | 143 | ||||||
|
| |||||||
Total Consumer Staples | 1,411 | |||||||
|
| |||||||
Energy — 5.7% | ||||||||
Energy Equipment & Services — 3.9% | ||||||||
| 5 | Baker Hughes, Inc. | 255 | ||||||
| 3 | Schlumberger Ltd. | 209 | ||||||
| 9 | TechnipFMC plc, (United Kingdom) (a) | 242 | ||||||
|
| |||||||
| 706 | ||||||||
|
| |||||||
Oil, Gas & Consumable Fuels — 1.8% | ||||||||
| 3 | Apache Corp. | 141 | ||||||
| 3 | Valero Energy Corp. | 176 | ||||||
|
| |||||||
| 317 | ||||||||
|
| |||||||
Total Energy | 1,023 | |||||||
|
| |||||||
Financials — 15.4% | ||||||||
Banks — 8.2% | ||||||||
| 16 | Bank of America Corp. | 391 | ||||||
| 11 | Citigroup, Inc. | 716 | ||||||
| SHARES | SECURITY DESCRIPTION | VALUE($) | ||||||
Banks — continued |
| |||||||
| 3 | PNC Financial Services Group, Inc. (The) | 381 | ||||||
|
| |||||||
| 1,488 | ||||||||
|
| |||||||
Capital Markets — 2.7% | ||||||||
| 6 | Bank of New York Mellon Corp. (The) | 281 | ||||||
| 1 | MSCI, Inc. | 103 | ||||||
| 1 | S&P Global, Inc. | 102 | ||||||
|
| |||||||
| 486 | ||||||||
|
| |||||||
Consumer Finance — 0.7% | ||||||||
| 2 | Discover Financial Services | 118 | ||||||
|
| |||||||
Insurance — 3.8% | ||||||||
| 3 | Allstate Corp. (The) | 223 | ||||||
| 4 | Hartford Financial Services Group, Inc. (The) | 203 | ||||||
| 2 | Travelers Cos., Inc. (The) | 256 | ||||||
|
| |||||||
| 682 | ||||||||
|
| |||||||
Total Financials | 2,774 | |||||||
|
| |||||||
Health Care — 14.6% | ||||||||
Biotechnology — 6.9% | ||||||||
| 2 | Amgen, Inc. | 336 | ||||||
| 1 | Biogen, Inc. (a) | 258 | ||||||
| — | (h) | Bioverativ, Inc. (a) | 19 | |||||
| 2 | Celgene Corp. (a) | 230 | ||||||
| 6 | Gilead Sciences, Inc. | 393 | ||||||
|
| |||||||
| 1,236 | ||||||||
|
| |||||||
Health Care Equipment & Supplies — 0.9% | ||||||||
| 1 | Becton Dickinson and Co. | 171 | ||||||
|
| |||||||
Health Care Providers & Services — 5.5% | ||||||||
| 3 | Aetna, Inc. | 380 | ||||||
| 1 | Cigna Corp. | 180 | ||||||
| 2 | Humana, Inc. | 427 | ||||||
|
| |||||||
| 987 | ||||||||
|
| |||||||
Life Sciences Tools & Services — 0.6% | ||||||||
| 1 | Waters Corp. (a) | 115 | ||||||
|
| |||||||
Pharmaceuticals — 0.7% | ||||||||
| 2 | Merck & Co., Inc. | 131 | ||||||
|
| |||||||
Total Health Care | 2,640 | |||||||
|
| |||||||
Industrials — 10.1% | ||||||||
Aerospace & Defense — 4.1% |
| |||||||
| 2 | Curtiss-Wright Corp. | 211 | ||||||
| 2 | Raytheon Co. | 299 | ||||||
| 2 | United Technologies Corp. | 226 | ||||||
|
| |||||||
| 736 | ||||||||
|
| |||||||
SEE NOTES TO FINANCIAL STATEMENTS.
| JUNE 30, 2017 | J.P. MORGAN INTREPID FUNDS | 23 | ||||||
Table of Contents
JPMorgan Intrepid Sustainable Equity Fund
(formerly known as JPMorgan Intrepid Advantage Fund)
SCHEDULE OF PORTFOLIO INVESTMENTS
AS OF JUNE 30, 2017 (continued)
(Amounts in thousands)
| SHARES | SECURITY DESCRIPTION | VALUE($) | ||||||
Common Stocks — continued | ||||||||
Airlines — 1.4% |
| |||||||
| 4 | Southwest Airlines Co. | 252 | ||||||
|
| |||||||
Commercial Services & Supplies — 0.6% |
| |||||||
| 7 | Pitney Bowes, Inc. | 103 | ||||||
|
| |||||||
Machinery — 3.0% |
| |||||||
| 2 | Parker-Hannifin Corp. | 351 | ||||||
| 4 | Xylem, Inc. | 194 | ||||||
|
| |||||||
| 545 | ||||||||
|
| |||||||
Professional Services — 1.0% |
| |||||||
| 2 | ManpowerGroup, Inc. | 179 | ||||||
|
| |||||||
Total Industrials | 1,815 | |||||||
|
| |||||||
Information Technology — 26.1% |
| |||||||
Communications Equipment — 1.5% |
| |||||||
| 9 | Cisco Systems, Inc. | 274 | ||||||
|
| |||||||
Internet Software & Services — 2.2% |
| |||||||
| — | (h) | Alphabet, Inc., Class A (a) | 195 | |||||
| — | (h) | Alphabet, Inc., Class C (a) | 205 | |||||
|
| |||||||
| 400 | ||||||||
|
| |||||||
IT Services — 3.6% |
| |||||||
| 1 | Accenture plc, Class A | 133 | ||||||
| 1 | DXC Technology Co. | 61 | ||||||
| 1 | Mastercard, Inc., Class A | 170 | ||||||
| 3 | Visa, Inc., Class A | 276 | ||||||
|
| |||||||
| 640 | ||||||||
|
| |||||||
Semiconductors & Semiconductor Equipment — 2.0% |
| |||||||
| 2 | Lam Research Corp. | 233 | ||||||
| 2 | QUALCOMM, Inc. | 130 | ||||||
|
| |||||||
| 363 | ||||||||
|
| |||||||
Software — 9.8% |
| |||||||
| 3 | Autodesk, Inc. (a) | 295 | ||||||
| 13 | Microsoft Corp. | 874 | ||||||
| 8 | Oracle Corp. | 392 | ||||||
| 8 | Symantec Corp. | 214 | ||||||
|
| |||||||
| 1,775 | ||||||||
|
| |||||||
Technology Hardware, Storage & Peripherals — 7.0% |
| |||||||
| 7 | Apple, Inc. | 1,001 | ||||||
| 9 | Hewlett Packard Enterprise Co. | 153 | ||||||
| 6 | HP, Inc. | 102 | ||||||
|
| |||||||
| 1,256 | ||||||||
|
| |||||||
Total Information Technology | 4,708 | |||||||
|
| |||||||
| SHARES | SECURITY DESCRIPTION | VALUE($) | ||||||
Materials — 1.5% |
| |||||||
Chemicals — 1.5% |
| |||||||
| 2 | EI du Pont de Nemours & Co. | 143 | ||||||
| 1 | International Flavors & Fragrances, Inc. | 125 | ||||||
|
| |||||||
Total Materials | 268 | |||||||
|
| |||||||
Real Estate — 0.8% |
| |||||||
Equity Real Estate Investment Trusts (REITs) — 0.8% |
| |||||||
| 2 | Prologis, Inc. | 141 | ||||||
|
| |||||||
Telecommunication Services — 3.0% |
| |||||||
Diversified Telecommunication Services — 3.0% |
| |||||||
| 7 | CenturyLink, Inc. | 159 | ||||||
| 9 | Verizon Communications, Inc. | 381 | ||||||
|
| |||||||
Total Telecommunication Services | 540 | |||||||
|
| |||||||
Utilities — 3.0% |
| |||||||
Electric Utilities — 3.0% |
| |||||||
| 4 | Eversource Energy | 240 | ||||||
| 2 | NextEra Energy, Inc. | 217 | ||||||
| 2 | Portland General Electric Co. | 87 | ||||||
|
| |||||||
Total Utilities | 544 | |||||||
|
| |||||||
Total Common Stocks | 17,876 | |||||||
|
| |||||||
Short-Term Investment — 1.0% | ||||||||
Investment Company — 1.0% |
| |||||||
| 184 | JPMorgan U.S. Government Money Market Fund, Institutional Class Shares, | 184 | ||||||
|
| |||||||
Total Investments — 100.1% | 18,060 | |||||||
Liabilities in Excess of | (16 | ) | ||||||
|
| |||||||
NET ASSETS — 100.0% | $ | 18,044 | ||||||
|
| |||||||
Percentages indicated are based on net assets.
SEE NOTES TO FINANCIAL STATEMENTS.
| 24 | J.P. MORGAN INTREPID FUNDS | JUNE 30, 2017 | ||||
Table of Contents
JPMorgan Intrepid Value Fund
SCHEDULE OF PORTFOLIO INVESTMENTS
AS OF JUNE 30, 2017
(Amounts in thousands)
| SHARES | SECURITY DESCRIPTION | VALUE($) | ||||||
Common Stocks — 98.0% | ||||||||
Consumer Discretionary — 7.9% | ||||||||
Automobiles — 1.1% | ||||||||
| 375 | General Motors Co. | 13,085 | ||||||
|
| |||||||
Hotels, Restaurants & Leisure — 0.5% | ||||||||
| 96 | Restaurant Brands International, Inc., (Canada) | 5,991 | ||||||
|
| |||||||
Household Durables — 0.8% | ||||||||
| 244 | Toll Brothers, Inc. | 9,628 | ||||||
|
| |||||||
Media — 3.4% | ||||||||
| 54 | CBS Corp. (Non-Voting), Class B | 3,444 | ||||||
| 382 | Comcast Corp., Class A | 14,868 | ||||||
| 1,914 | Sirius XM Holdings, Inc. | 10,469 | ||||||
| 129 | Walt Disney Co. (The) | 13,706 | ||||||
|
| |||||||
| 42,487 | ||||||||
|
| |||||||
Specialty Retail — 1.7% | ||||||||
| 177 | Best Buy Co., Inc. | 10,142 | ||||||
| 77 | Burlington Stores, Inc. (a) | 7,037 | ||||||
| 412 | Staples, Inc. | 4,149 | ||||||
|
| |||||||
| 21,328 | ||||||||
|
| |||||||
Textiles, Apparel & Luxury Goods — 0.4% | ||||||||
| 29 | Michael Kors Holdings Ltd. (a) | 1,040 | ||||||
| 40 | PVH Corp. | 4,546 | ||||||
|
| |||||||
| 5,586 | ||||||||
|
| |||||||
Total Consumer Discretionary | 98,105 | |||||||
|
| |||||||
Consumer Staples — 8.7% | ||||||||
Food & Staples Retailing — 2.6% | ||||||||
| 147 | Sysco Corp. | 7,378 | ||||||
| 31 | Walgreens Boots Alliance, Inc. | 2,420 | ||||||
| 286 | Wal-Mart Stores, Inc. | 21,660 | ||||||
|
| |||||||
| 31,458 | ||||||||
|
| |||||||
Food Products — 3.9% | ||||||||
| 209 | Archer-Daniels-Midland Co. | 8,632 | ||||||
| 124 | Bunge Ltd. | 9,273 | ||||||
| 248 | Conagra Brands, Inc. | 8,861 | ||||||
| 381 | Pilgrim’s Pride Corp. (a) | 8,360 | ||||||
| 217 | Tyson Foods, Inc., Class A | 13,560 | ||||||
|
| |||||||
| 48,686 | ||||||||
|
| |||||||
Household Products — 1.4% | ||||||||
| 185 | Energizer Holdings, Inc. | 8,898 | ||||||
| 91 | Procter & Gamble Co. (The) | 7,905 | ||||||
|
| |||||||
| 16,803 | ||||||||
|
| |||||||
| SHARES | SECURITY DESCRIPTION | VALUE($) | ||||||
Personal Products — 0.8% | ||||||||
| 157 | Nu Skin Enterprises, Inc., Class A | 9,859 | ||||||
|
| |||||||
Total Consumer Staples | 106,806 | |||||||
|
| |||||||
Energy — 9.9% | ||||||||
Energy Equipment & Services — 3.1% | ||||||||
| 235 | Baker Hughes, Inc. | 12,826 | ||||||
| 39 | Dril-Quip, Inc. (a) | 1,884 | ||||||
| 379 | Halliburton Co. | 16,191 | ||||||
| 271 | TechnipFMC plc, (United Kingdom) (a) | 7,374 | ||||||
|
| |||||||
| 38,275 | ||||||||
|
| |||||||
Oil, Gas & Consumable Fuels — 6.8% | ||||||||
| 38 | Apache Corp. | 1,836 | ||||||
| 43 | Chevron Corp. | 4,533 | ||||||
| 50 | ConocoPhillips | 2,198 | ||||||
| 248 | Devon Energy Corp. | 7,935 | ||||||
| 194 | EOG Resources, Inc. | 17,588 | ||||||
| 72 | Exxon Mobil Corp. | 5,772 | ||||||
| 156 | Marathon Petroleum Corp. | 8,137 | ||||||
| 10 | Occidental Petroleum Corp. | 599 | ||||||
| 77 | Tesoro Corp. | 7,198 | ||||||
| 407 | Valero Energy Corp. | 27,477 | ||||||
|
| |||||||
| 83,273 | ||||||||
|
| |||||||
Total Energy | 121,548 | |||||||
|
| |||||||
Financials — 27.4% | ||||||||
Banks — 12.3% | ||||||||
| 2,059 | Bank of America Corp. | 49,962 | ||||||
| 656 | Citigroup, Inc. | 43,886 | ||||||
| 17 | Comerica, Inc. | 1,223 | ||||||
| 253 | PNC Financial Services Group, Inc. (The) | 31,576 | ||||||
| 219 | Popular, Inc., (Puerto Rico) | 9,114 | ||||||
| 468 | Regions Financial Corp. | 6,853 | ||||||
| 215 | Synovus Financial Corp. | 9,498 | ||||||
|
| |||||||
| 152,112 | ||||||||
|
| |||||||
Capital Markets — 3.7% | ||||||||
| 73 | Ameriprise Financial, Inc. | 9,254 | ||||||
| 66 | Goldman Sachs Group, Inc. (The) | 14,723 | ||||||
| 268 | Morgan Stanley | 11,938 | ||||||
| 95 | MSCI, Inc. | 9,825 | ||||||
|
| |||||||
| 45,740 | ||||||||
|
| |||||||
Consumer Finance — 1.9% | ||||||||
| 14 | Capital One Financial Corp. | 1,115 | ||||||
| 295 | Discover Financial Services | 18,340 | ||||||
| 260 | Navient Corp. | 4,332 | ||||||
|
| |||||||
| 23,787 | ||||||||
|
| |||||||
SEE NOTES TO FINANCIAL STATEMENTS.
| JUNE 30, 2017 | J.P. MORGAN INTREPID FUNDS | 25 | ||||||
Table of Contents
JPMorgan Intrepid Value Fund
SCHEDULE OF PORTFOLIO INVESTMENTS
AS OF JUNE 30, 2017 (continued)
(Amounts in thousands, except number of Futures contracts)
| SHARES | SECURITY DESCRIPTION | VALUE($) | ||||||
Common Stocks — continued | ||||||||
Insurance — 7.6% | ||||||||
| 197 | American International Group, Inc. | 12,329 | ||||||
| 89 | Arch Capital Group Ltd. (a) | 8,256 | ||||||
| 230 | Assured Guaranty Ltd. | 9,579 | ||||||
| 136 | Axis Capital Holdings Ltd. | 8,774 | ||||||
| 42 | Everest Re Group Ltd. | 10,693 | ||||||
| 132 | Lincoln National Corp. | 8,948 | ||||||
| 71 | Prudential Financial, Inc. | 7,667 | ||||||
| 74 | RenaissanceRe Holdings Ltd., (Bermuda) | 10,276 | ||||||
| 116 | Torchmark Corp. | 8,905 | ||||||
| 9 | White Mountains Insurance Group Ltd. | 7,644 | ||||||
|
| |||||||
| 93,071 | ||||||||
|
| |||||||
Mortgage Real Estate Investment Trusts (REITs) — 1.9% |
| |||||||
| 175 | AGNC Investment Corp. | 3,715 | ||||||
| 541 | Chimera Investment Corp. | 10,079 | ||||||
| 1,003 | Two Harbors Investment Corp. | 9,942 | ||||||
|
| |||||||
| 23,736 | ||||||||
|
| |||||||
Total Financials | 338,446 | |||||||
|
| |||||||
Health Care — 13.6% |
| |||||||
Biotechnology — 3.6% |
| |||||||
| 127 | Amgen, Inc. | 21,804 | ||||||
| 311 | Gilead Sciences, Inc. | 22,041 | ||||||
|
| |||||||
| 43,845 | ||||||||
|
| |||||||
Health Care Equipment & Supplies — 0.8% |
| |||||||
| 78 | Baxter International, Inc. | 4,692 | ||||||
| 119 | Hologic, Inc. (a) | 5,418 | ||||||
|
| |||||||
| 10,110 | ||||||||
|
| |||||||
Health Care Providers & Services — 6.1% |
| |||||||
| 52 | Aetna, Inc. | 7,956 | ||||||
| 23 | Anthem, Inc. | 4,327 | ||||||
| 36 | DaVita, Inc. (a) | 2,344 | ||||||
| 82 | Express Scripts Holding Co. (a) | 5,254 | ||||||
| 77 | Humana, Inc. | 18,576 | ||||||
| 34 | McKesson Corp. | 5,512 | ||||||
| 57 | Quest Diagnostics, Inc. | 6,381 | ||||||
| 78 | UnitedHealth Group, Inc. | 14,426 | ||||||
| 58 | WellCare Health Plans, Inc. (a) | 10,450 | ||||||
|
| |||||||
| 75,226 | ||||||||
|
| |||||||
Pharmaceuticals — 3.1% |
| |||||||
| 91 | Allergan plc | 22,049 | ||||||
| 491 | Pfizer, Inc. | 16,500 | ||||||
|
| |||||||
| 38,549 | ||||||||
|
| |||||||
Total Health Care | 167,730 | |||||||
|
| |||||||
| SHARES | SECURITY DESCRIPTION | VALUE($) | ||||||
Industrials — 9.3% |
| |||||||
Aerospace & Defense — 2.6% |
| |||||||
| 119 | Boeing Co. (The) | 23,492 | ||||||
| 98 | Curtiss-Wright Corp. | 8,958 | ||||||
|
| |||||||
| 32,450 | ||||||||
|
| |||||||
Airlines — 2.2% |
| |||||||
| 289 | Delta Air Lines, Inc. | 15,536 | ||||||
| 149 | United Continental Holdings, Inc. (a) | 11,228 | ||||||
|
| |||||||
| 26,764 | ||||||||
|
| |||||||
Construction & Engineering — 0.2% |
| |||||||
| 40 | Jacobs Engineering Group, Inc. | 2,186 | ||||||
|
| |||||||
Electrical Equipment — 1.0% |
| |||||||
| 23 | EnerSys | 1,652 | ||||||
| 62 | Rockwell Automation, Inc. | 10,041 | ||||||
|
| |||||||
| 11,693 | ||||||||
|
| |||||||
Machinery — 1.9% |
| |||||||
| 104 | Allison Transmission Holdings, Inc. | 3,890 | ||||||
| 55 | Cummins, Inc. | 8,906 | ||||||
| 66 | Parker-Hannifin Corp. | 10,612 | ||||||
|
| |||||||
| 23,408 | ||||||||
|
| |||||||
Professional Services — 0.7% |
| |||||||
| 79 | ManpowerGroup, Inc. | 8,798 | ||||||
|
| |||||||
Trading Companies & Distributors — 0.7% |
| |||||||
| 79 | United Rentals, Inc. (a) | 8,893 | ||||||
|
| |||||||
Total Industrials | 114,192 | |||||||
|
| |||||||
Information Technology — 8.3% |
| |||||||
Internet Software & Services — 1.6% |
| |||||||
| 552 | eBay, Inc. (a) | 19,290 | ||||||
|
| |||||||
IT Services — 0.4% |
| |||||||
| 46 | DXC Technology Co. | 3,506 | ||||||
| 55 | Western Union Co. (The) | 1,042 | ||||||
|
| |||||||
| 4,548 | ||||||||
|
| |||||||
Semiconductors & Semiconductor Equipment — 2.3% |
| |||||||
| 512 | Applied Materials, Inc. | 21,142 | ||||||
| 35 | QUALCOMM, Inc. | 1,916 | ||||||
| 18 | Skyworks Solutions, Inc. | 1,766 | ||||||
| 110 | Teradyne, Inc. | 3,294 | ||||||
|
| |||||||
| 28,118 | ||||||||
|
| |||||||
Software — 0.9% |
| |||||||
| 89 | Microsoft Corp. | 6,135 | ||||||
| 65 | VMware, Inc., Class A (a) | 5,674 | ||||||
|
| |||||||
| 11,809 | ||||||||
|
| |||||||
SEE NOTES TO FINANCIAL STATEMENTS.
| 26 | J.P. MORGAN INTREPID FUNDS | JUNE 30, 2017 | ||||
Table of Contents
| SHARES | SECURITY DESCRIPTION | VALUE($) | ||||||
Common Stocks — continued | ||||||||
Technology Hardware, Storage & Peripherals — 3.1% |
| |||||||
| 40 | Apple, Inc. | 5,718 | ||||||
| 1,323 | HP, Inc. | 23,124 | ||||||
| 239 | NetApp, Inc. | 9,580 | ||||||
|
| |||||||
| 38,422 | ||||||||
|
| |||||||
Total Information Technology | 102,187 | |||||||
|
| |||||||
Materials — 2.7% |
| |||||||
Chemicals — 1.1% |
| |||||||
| 44 | Cabot Corp. | 2,335 | ||||||
| 431 | Huntsman Corp. | 11,124 | ||||||
|
| |||||||
| 13,459 | ||||||||
|
| |||||||
Containers & Packaging — 0.7% |
| |||||||
| 77 | Packaging Corp. of America | 8,599 | ||||||
|
| |||||||
Metals & Mining — 0.9% |
| |||||||
| 54 | Newmont Mining Corp. | 1,742 | ||||||
| 264 | Steel Dynamics, Inc. | 9,465 | ||||||
|
| |||||||
| 11,207 | ||||||||
|
| |||||||
Total Materials | 33,265 | |||||||
|
| |||||||
Real Estate — 2.9% |
| |||||||
Equity Real Estate Investment Trusts (REITs) — 2.9% |
| |||||||
| 507 | Brandywine Realty Trust | 8,890 | ||||||
| 298 | Equity Commonwealth (a) | 9,401 | ||||||
| 153 | GEO Group, Inc. (The) | 4,536 | ||||||
| 128 | Hospitality Properties Trust | 3,737 | ||||||
| 424 | Piedmont Office Realty Trust, Inc., Class A | 8,927 | ||||||
|
| |||||||
Total Real Estate | 35,491 | |||||||
|
| |||||||
Telecommunication Services — 1.1% |
| |||||||
Diversified Telecommunication Services — 1.1% |
| |||||||
| 300 | AT&T, Inc. | 11,312 | ||||||
| 48 | Verizon Communications, Inc. | 2,157 | ||||||
|
| |||||||
Total Telecommunication Services | 13,469 | |||||||
|
| |||||||
| SHARES | SECURITY DESCRIPTION | VALUE($) | ||||||
Utilities — 6.2% |
| |||||||
Electric Utilities — 3.1% |
| |||||||
| 123 | Edison International | 9,618 | ||||||
| 226 | Exelon Corp. | 8,148 | ||||||
| 79 | NextEra Energy, Inc. | 11,028 | ||||||
| 221 | Portland General Electric Co. | 10,079 | ||||||
|
| |||||||
| 38,873 | ||||||||
|
| |||||||
Gas Utilities — 0.9% |
| |||||||
| 219 | UGI Corp. | 10,624 | ||||||
|
| |||||||
Independent Power and Renewable Electricity |
| |||||||
| 869 | AES Corp. | 9,649 | ||||||
|
| |||||||
Multi-Utilities — 1.4% |
| |||||||
| 377 | CenterPoint Energy, Inc. | 10,333 | ||||||
| 293 | MDU Resources Group, Inc. | 7,682 | ||||||
|
| |||||||
| 18,015 | ||||||||
|
| |||||||
Total Utilities | 77,161 | |||||||
|
| |||||||
Total Common Stocks | 1,208,400 | |||||||
|
| |||||||
Short-Term Investment — 2.2% | ||||||||
Investment Company — 2.2% |
| |||||||
| 27,377 | JPMorgan U.S. Government Money Market Fund, Institutional Class Shares, 0.840% (b) (l) | 27,377 | ||||||
|
| |||||||
Total Investments — 100.2% | 1,235,777 | |||||||
Liabilities in Excess of | (2,933 | ) | ||||||
|
| |||||||
NET ASSETS — 100.0% | $ | 1,232,844 | ||||||
|
| |||||||
Percentages indicated are based on net assets.
| Futures Contracts | ||||||||||||||||||||
| NUMBER OF CONTRACTS | DESCRIPTION | EXPIRATION DATE | TRADING CURRENCY | NOTIONAL JUNE 30, 2017 | NET UNREALIZED APPRECIATION (DEPRECIATION) | |||||||||||||||
Long Futures Outstanding |
| |||||||||||||||||||
| 104 | E-mini S&P 500 Index | 09/15/17 | USD | $ | 12,589 | $ | (48 | ) | ||||||||||||
|
| |||||||||||||||||||
SEE NOTES TO FINANCIAL STATEMENTS.
| JUNE 30, 2017 | J.P. MORGAN INTREPID FUNDS | 27 | ||||||
Table of Contents
J.P. Morgan Intrepid Funds
NOTES TO SCHEDULES OF PORTFOLIO INVESTMENTS
AS OF JUNE 30, 2017
| CVR | — Contingent Value Rights | |
| PDC | — Property Development Center | |
| USD | — United States Dollar | |
| (a) | — Non-income producing security. | |
| (b) | — Investment in affiliate. Money market fund is registered under the Investment Company Act of 1940, as amended, and advised by J.P. Morgan Investment Management Inc. | |
| (g) | — Amount rounds to less than 0.05%. | |
| (h) | — Amount rounds to less than 500. | |
| (l) | — The rate shown is the current yield as of June 30, 2017. | |
SEE NOTES TO FINANCIAL STATEMENTS.
| 28 | J.P. MORGAN INTREPID FUNDS | JUNE 30, 2017 | ||||
Table of Contents
THIS PAGE IS INTENTIONALLY LEFT BLANK
| JUNE 30, 2017 | J.P. MORGAN INTREPID FUNDS | 29 | ||||||
Table of Contents
STATEMENTS OF ASSETS AND LIABILITIES
AS OF JUNE 30, 2017
(Amounts in thousands, except per share amounts)
Intrepid Fund | Intrepid Fund | Intrepid Mid Cap Fund | ||||||||||
ASSETS: |
| |||||||||||
Investments in non-affiliates, at value | $ | 4,022,498 | $ | 995,458 | $ | 884,517 | ||||||
Investments in affiliates, at value | 80,269 | 29,184 | 7,698 | |||||||||
|
|
|
|
|
| |||||||
Total investment securities, at value | 4,102,767 | 1,024,642 | 892,215 | |||||||||
Cash | — | 1 | — | (a) | ||||||||
Deposits at broker for futures contracts | 6,610 | 1,675 | 433 | |||||||||
Receivables: | ||||||||||||
Investment securities sold | 7,562 | 20,121 | 4,802 | |||||||||
Fund shares sold | 137 | 947 | 670 | |||||||||
Dividends from non-affiliates | 3,900 | 527 | 1,284 | |||||||||
Dividends from affiliates | 44 | 9 | 9 | |||||||||
Variation margin on futures contracts | 8 | 8 | 3 | |||||||||
|
|
|
|
|
| |||||||
Total Assets | 4,121,028 | 1,047,930 | 899,416 | |||||||||
|
|
|
|
|
| |||||||
LIABILITIES: | ||||||||||||
Payables: | ||||||||||||
Investment securities purchased | 13,709 | 26,972 | 7,679 | |||||||||
Fund shares redeemed | 22,666 | 1,290 | 1,201 | |||||||||
Accrued liabilities: | ||||||||||||
Investment advisory fees | 1,323 | 329 | 419 | |||||||||
Administration fees | 273 | 9 | 20 | |||||||||
Distribution fees | 18 | 48 | 117 | |||||||||
Service fees | 71 | 73 | 142 | |||||||||
Custodian and accounting fees | 14 | 4 | 7 | |||||||||
Trustees’ and Chief Compliance Officer’s fees | 3 | — | — | |||||||||
Audit fees | 19 | 19 | 20 | |||||||||
Legal fees | 2 | 1 | — | |||||||||
Registration fees | 21 | 19 | — | |||||||||
Other | 52 | 43 | 72 | |||||||||
|
|
|
|
|
| |||||||
Total Liabilities | 38,171 | 28,807 | 9,677 | |||||||||
|
|
|
|
|
| |||||||
Net Assets | $ | 4,082,857 | $ | 1,019,123 | $ | 889,739 | ||||||
|
|
|
|
|
| |||||||
| (a) | Amount rounds to less than 500. |
SEE NOTES TO FINANCIAL STATEMENTS.
| 30 | J.P. MORGAN INTREPID FUNDS | JUNE 30, 2017 | ||||
Table of Contents
Intrepid Fund | Intrepid Fund | Intrepid Mid Cap | ||||||||||
NET ASSETS: |
| |||||||||||
Paid-in-Capital | $ | 3,068,461 | $ | 794,916 | $ | 663,664 | ||||||
Accumulated undistributed (distributions in excess of) net investment income | 23,487 | 4,113 | 1,455 | |||||||||
Accumulated net realized gains (losses) | 324,698 | (55,830 | ) | 42,460 | ||||||||
Net unrealized appreciation (depreciation) | 666,211 | 275,924 | 182,160 | |||||||||
|
|
|
|
|
| |||||||
Total Net Assets | $ | 4,082,857 | $ | 1,019,123 | $ | 889,739 | ||||||
|
|
|
|
|
| |||||||
Net Assets: | ||||||||||||
Class A | $ | 49,774 | $ | 90,633 | $ | 304,927 | ||||||
Class C | 10,306 | 42,811 | 81,761 | |||||||||
Class I (formerly Select Class) | 215,888 | 183,265 | 310,316 | |||||||||
Class R2 | 3,394 | 5,277 | — | |||||||||
Class R3 | — | — | 8,854 | |||||||||
Class R4 | — | — | 22 | |||||||||
Class R5 | 4,681 | 192,164 | — | |||||||||
Class R6 | 3,798,814 | 504,973 | 183,859 | |||||||||
|
|
|
|
|
| |||||||
Total | $ | 4,082,857 | $ | 1,019,123 | $ | 889,739 | ||||||
|
|
|
|
|
| |||||||
Outstanding units of beneficial interest (shares) | ||||||||||||
($0.0001 par value; unlimited number of shares authorized): | ||||||||||||
Class A | 1,275 | 1,865 | 13,792 | |||||||||
Class C | 267 | 897 | 4,325 | |||||||||
Class I (formerly Select Class) | 5,415 | 3,715 | 13,364 | |||||||||
Class R2 | 89 | 111 | — | |||||||||
Class R3 | — | — | 401 | |||||||||
Class R4 | — | — | 1 | |||||||||
Class R5 | 117 | 3,941 | — | |||||||||
Class R6 | 96,568 | 10,359 | 7,909 | |||||||||
Net Asset Value (a): | ||||||||||||
Class A — Redemption price per share | $ | 39.06 | $ | 48.60 | $ | 22.11 | ||||||
Class C — Offering price per share (b) | 38.59 | 47.72 | 18.90 | |||||||||
Class I (formerly Select Class) — Offering and redemption price per share | 39.87 | 49.34 | 23.22 | |||||||||
Class R2 — Offering and redemption price per share | 38.18 | 47.66 | — | |||||||||
Class R3 — Offering and redemption price per share | — | — | 22.08 | |||||||||
Class R4 — Offering and redemption price per share | — | — | 23.20 | |||||||||
Class R5 — Offering and redemption price per share | 39.91 | 48.76 | — | |||||||||
Class R6 — Offering and redemption price per share | 39.34 | 48.74 | 23.25 | |||||||||
Class A maximum sales charge | 5.25 | % | 5.25 | % | 5.25 | % | ||||||
Class A maximum public offering price per share | $ | 41.22 | $ | 51.29 | $ | 23.34 | ||||||
|
|
|
|
|
| |||||||
Cost of investments in non-affiliates | $ | 3,356,240 | $ | 719,462 | $ | 702,371 | ||||||
Cost of investments in affiliates | 80,269 | 29,184 | 7,698 | |||||||||
| (a) | Per share amounts may not recalculate due to rounding of net assets and/or shares outstanding. |
| (b) | Redemption price for Class C Shares varies based upon length of time the shares are held. |
SEE NOTES TO FINANCIAL STATEMENTS.
| JUNE 30, 2017 | J.P. MORGAN INTREPID FUNDS | 31 | ||||||
Table of Contents
STATEMENTS OF ASSETS AND LIABILITIES
AS OF JUNE 30, 2017 (continued)
(Amounts in thousands, except per share amounts)
Intrepid Equity Fund | Intrepid Value Fund | |||||||
ASSETS: |
| |||||||
Investments in non-affiliates, at value | $ | 17,876 | $ | 1,208,400 | ||||
Investments in affiliates, at value | 184 | 27,377 | ||||||
|
|
|
| |||||
Total investment securities, at value | 18,060 | 1,235,777 | ||||||
Deposits at broker for futures contracts | — | 595 | ||||||
Receivables: | ||||||||
Investment securities sold | — | 3,373 | ||||||
Fund shares sold | 1 | 889 | ||||||
Dividends from non-affiliates | 12 | 1,616 | ||||||
Dividends from affiliates | — | (a) | 17 | |||||
Variation margin on futures contracts | — | 5 | ||||||
Due from adviser | 11 | — | ||||||
|
|
|
| |||||
Total Assets | 18,084 | 1,242,272 | ||||||
|
|
|
| |||||
LIABILITIES: | ||||||||
Payables: | ||||||||
Due to custodian | — | 1 | ||||||
Investment securities purchased | — | 5,374 | ||||||
Fund shares redeemed | 1 | 2,953 | ||||||
Accrued liabilities: | ||||||||
Investment advisory fees | — | 342 | ||||||
Administration fees | — | 43 | ||||||
Distribution fees | 5 | 50 | ||||||
Service fees | — | (a) | 202 | |||||
Custodian and accounting fees | 3 | 8 | ||||||
Audit fees | 19 | 18 | ||||||
Legal fees | 3 | 1 | ||||||
Registration fees | 6 | 31 | ||||||
Other | 3 | 405 | ||||||
|
|
|
| |||||
Total Liabilities | 40 | 9,428 | ||||||
|
|
|
| |||||
Net Assets | $ | 18,044 | $ | 1,232,844 | ||||
|
|
|
| |||||
| (a) | Amount rounds to less than 500. |
SEE NOTES TO FINANCIAL STATEMENTS.
| 32 | J.P. MORGAN INTREPID FUNDS | JUNE 30, 2017 | ||||
Table of Contents
Intrepid Equity Fund | Intrepid Value Fund | |||||||
NET ASSETS: | ||||||||
Paid-in-Capital | $ | 13,012 | $ | 937,166 | ||||
Accumulated undistributed (distributions in excess of) net investment income | 57 | 985 | ||||||
Accumulated net realized gains (losses) | 538 | 89,206 | ||||||
Net unrealized appreciation (depreciation) | 4,437 | 205,487 | ||||||
|
|
|
| |||||
Total Net Assets | $ | 18,044 | $ | 1,232,844 | ||||
|
|
|
| |||||
Net Assets: | ||||||||
Class A | $ | 7,943 | $ | 95,891 | ||||
Class C | 5,063 | 35,999 | ||||||
Class I (formerly Select Class) | 5,038 | 886,602 | ||||||
Class R2 | — | 19,693 | ||||||
Class R5 | — | 86,134 | ||||||
Class R6 | — | 108,525 | ||||||
|
|
|
| |||||
Total | $ | 18,044 | $ | 1,232,844 | ||||
|
|
|
| |||||
Outstanding units of beneficial interest (shares) | ||||||||
($0.0001 par value; unlimited number of shares authorized): | ||||||||
Class A | 202 | 2,698 | ||||||
Class C | 132 | 1,024 | ||||||
Class I (formerly Select Class) | 127 | 24,843 | ||||||
Class R2 | — | 558 | ||||||
Class R5 | — | 2,408 | ||||||
Class R6 | — | 3,033 | ||||||
Net Asset Value (a): | ||||||||
Class A — Redemption price per share | $ | 39.35 | $ | 35.54 | ||||
Class C — Offering price per share (b) | 38.51 | 35.14 | ||||||
Class I (formerly Select Class) — Offering and redemption price per share | 39.59 | 35.69 | ||||||
Class R2 — Offering and redemption price per share | — | 35.33 | ||||||
Class R5 — Offering and redemption price per share | — | 35.78 | ||||||
Class R6 — Offering and redemption price per share | — | 35.78 | ||||||
Class A maximum sales charge | 5.25 | % | 5.25 | % | ||||
Class A maximum public offering price per share | $ | 41.53 | $ | 37.51 | ||||
|
|
|
| |||||
Cost of investments in non-affiliates | $ | 13,439 | $ | 1,002,865 | ||||
Cost of investments in affiliates | 184 | 27,377 | ||||||
| (a) | Per share amounts may not recalculate due to rounding of net assets and/or shares outstanding. |
| (b) | Redemption price for Class C Shares varies based upon length of time the shares are held. |
SEE NOTES TO FINANCIAL STATEMENTS.
| JUNE 30, 2017 | J.P. MORGAN INTREPID FUNDS | 33 | ||||||
Table of Contents
STATEMENTS OF OPERATIONS
FOR THE YEAR ENDED JUNE 30, 2017
(Amounts in thousands)
Intrepid America Fund | Intrepid Growth Fund | Intrepid Mid Cap Fund | ||||||||||
INVESTMENT INCOME: |
| |||||||||||
Interest income from affiliates | $ | — | (a) | $ | — | (a) | $ | 1 | ||||
Dividend income from non-affiliates | 69,240 | 14,127 | 15,165 | |||||||||
Dividend income from affiliates | 428 | 89 | 85 | |||||||||
|
|
|
|
|
| |||||||
Total investment income | 69,668 | 14,216 | 15,251 | |||||||||
|
|
|
|
|
| |||||||
EXPENSES: | ||||||||||||
Investment advisory fees | 15,533 | 4,995 | 6,454 | |||||||||
Administration fees | 3,176 | 817 | 812 | |||||||||
Distribution fees: | ||||||||||||
Class A | 138 | 227 | 820 | |||||||||
Class C | 86 | 348 | 677 | |||||||||
Class R2 | 19 | 25 | — | |||||||||
Class R3 (b) | — | — | 8 | |||||||||
Service fees: | ||||||||||||
Class A | 138 | 227 | 820 | |||||||||
Class C | 29 | 116 | 226 | |||||||||
Class I (formerly Select Class) | 559 | 417 | 735 | |||||||||
Class R2 | 9 | 12 | — | |||||||||
Class R3 (b) | — | — | 7 | |||||||||
Class R4 (b) | — | — | — | (a) | ||||||||
Class R5 | 3 | 117 | — | |||||||||
Custodian and accounting fees | 127 | 45 | 54 | |||||||||
Professional fees | 78 | 53 | 61 | |||||||||
Trustees’ and Chief Compliance Officer’s fees | 27 | 27 | 27 | |||||||||
Printing and mailing costs | 55 | 32 | 84 | |||||||||
Registration and filing fees | 84 | 83 | 91 | |||||||||
Transfer agency fees (See Note 2.D.) | 36 | 27 | 71 | |||||||||
Sub-transfer agency fees (See Note 2.D.) | 107 | 265 | 674 | |||||||||
Other | 78 | 25 | 24 | |||||||||
|
|
|
|
|
| |||||||
Total expenses | 20,282 | 7,858 | 11,645 | |||||||||
|
|
|
|
|
| |||||||
Less fees waived | (206 | ) | (2,093 | ) | (1,842 | ) | ||||||
Less expense reimbursements | — | (a) | (44 | ) | (1 | ) | ||||||
|
|
|
|
|
| |||||||
Net expenses | 20,076 | 5,721 | 9,802 | |||||||||
|
|
|
|
|
| |||||||
Net investment income (loss) | 49,592 | 8,495 | 5,449 | |||||||||
|
|
|
|
|
| |||||||
REALIZED/UNREALIZED GAINS (LOSSES): | ||||||||||||
Net realized gain (loss) on transactions from: | ||||||||||||
Investments in non-affiliates | 372,249 | 90,708 | 63,240 | |||||||||
Futures | 12,045 | 3,558 | 4,599 | |||||||||
|
|
|
|
|
| |||||||
Net realized gain (loss) | 384,294 | 94,266 | 67,839 | |||||||||
|
|
|
|
|
| |||||||
Change in net unrealized appreciation/depreciation on: | ||||||||||||
Investments in non-affiliates | 170,442 | 94,529 | 61,614 | |||||||||
Futures | (1,200 | ) | (620 | ) | (204 | ) | ||||||
|
|
|
|
|
| |||||||
Change in net unrealized appreciation/depreciation | 169,242 | 93,909 | 61,410 | |||||||||
|
|
|
|
|
| |||||||
Net realized/unrealized gains (losses) | 553,536 | 188,175 | 129,249 | |||||||||
|
|
|
|
|
| |||||||
Change in net assets resulting from operations | $ | 603,128 | $ | 196,670 | $ | 134,698 | ||||||
|
|
|
|
|
| |||||||
| (a) | Amount rounds to less than 500. |
| (b) | Commencement of offering of class of shares effective September 9, 2016 for Intrepid Mid Cap Fund. |
SEE NOTES TO FINANCIAL STATEMENTS.
| 34 | J.P. MORGAN INTREPID FUNDS | JUNE 30, 2017 | ||||
Table of Contents
Intrepid Sustainable Equity Fund | Intrepid Value Fund | |||||||
INVESTMENT INCOME: |
| |||||||
Interest income from affiliates | $ | — | (a) | $ | 2 | |||
Dividend income from non-affiliates | 341 | 29,519 | ||||||
Dividend income from affiliates | 1 | 105 | ||||||
|
|
|
| |||||
Total investment income | 342 | 29,626 | ||||||
|
|
|
| |||||
EXPENSES: | ||||||||
Investment advisory fees | 100 | 5,296 | ||||||
Administration fees | 15 | 1,083 | ||||||
Distribution fees: | ||||||||
Class A | 20 | 332 | ||||||
Class C | 42 | 300 | ||||||
Class R2 | — | 95 | ||||||
Service fees: | ||||||||
Class A | 20 | 332 | ||||||
Class C | 14 | 100 | ||||||
Class I (formerly Select Class) | 11 | 2,350 | ||||||
Class R2 | — | 48 | ||||||
Class R5 | — | 57 | ||||||
Custodian and accounting fees | 29 | 64 | ||||||
Professional fees | 73 | 58 | ||||||
Trustees’ and Chief Compliance Officer’s fees | 25 | 28 | ||||||
Printing and mailing costs | 17 | 180 | ||||||
Registration and filing fees | 50 | 94 | ||||||
Transfer agency fees (See Note 2.D.) | 3 | 135 | ||||||
Sub-transfer agency fees (See Note 2.D.) | 8 | 1,488 | ||||||
Other | 5 | 32 | ||||||
|
|
|
| |||||
Total expenses | 432 | 12,072 | ||||||
|
|
|
| |||||
Less fees waived | (154 | ) | (2,925 | ) | ||||
Less expense reimbursements | (65 | ) | (82 | ) | ||||
|
|
|
| |||||
Net expenses | 213 | 9,065 | ||||||
|
|
|
| |||||
Net investment income (loss) | 129 | 20,561 | ||||||
|
|
|
| |||||
REALIZED/UNREALIZED GAINS (LOSSES): | ||||||||
Net realized gain (loss) on transactions from: | ||||||||
Investments in non-affiliates | 2,415 | 151,147 | ||||||
Futures | — | 3,786 | ||||||
|
|
|
| |||||
Net realized gain (loss) | 2,415 | 154,933 | ||||||
|
|
|
| |||||
Change in net unrealized appreciation/depreciation on: | ||||||||
Investments in non-affiliates | 662 | 22,604 | ||||||
Futures | — | (885 | ) | |||||
|
|
|
| |||||
Change in net unrealized appreciation/depreciation | 662 | 21,719 | ||||||
|
|
|
| |||||
Net realized/unrealized gains (losses) | 3,077 | 176,652 | ||||||
|
|
|
| |||||
Change in net assets resulting from operations | $ | 3,206 | $ | 197,213 | ||||
|
|
|
| |||||
| (a) | Amount rounds to less than 500. |
SEE NOTES TO FINANCIAL STATEMENTS.
| JUNE 30, 2017 | J.P. MORGAN INTREPID FUNDS | 35 | ||||||
Table of Contents
STATEMENTS OF CHANGES IN NET ASSETS
FOR THE PERIODS INDICATED
(Amounts in thousands)
| Intrepid America Fund | Intrepid Growth Fund | |||||||||||||||
| Year Ended June 30, 2017 | Year Ended June 30, 2016 | Year Ended June 30, 2017 | Year Ended June 30, 2016 | |||||||||||||
CHANGE IN NET ASSETS RESULTING FROM OPERATIONS: | ||||||||||||||||
Net investment income (loss) | $ | 49,592 | $ | 53,527 | $ | 8,495 | $ | 10,143 | ||||||||
Net realized gain (loss) | 384,294 | 91,191 | 94,266 | 16,899 | ||||||||||||
Change in net unrealized appreciation/depreciation | 169,242 | (204,081 | ) | 93,909 | (34,556 | ) | ||||||||||
|
|
|
|
|
|
|
| |||||||||
Change in net assets resulting from operations | 603,128 | (59,363 | ) | 196,670 | (7,514 | ) | ||||||||||
|
|
|
|
|
|
|
| |||||||||
DISTRIBUTIONS TO SHAREHOLDERS: | ||||||||||||||||
Class A | ||||||||||||||||
From net investment income | (398 | ) | (997 | ) | (532 | ) | (645 | ) | ||||||||
From net realized gains | (1,471 | ) | (7,771 | ) | — | — | ||||||||||
Class C | ||||||||||||||||
From net investment income | (34 | ) | (59 | ) | (40 | ) | (111 | ) | ||||||||
From net realized gains | (311 | ) | (875 | ) | — | — | ||||||||||
Class I (formerly Select Class) | ||||||||||||||||
From net investment income | (2,317 | ) | (411 | ) | (1,415 | ) | (70 | ) | ||||||||
From net realized gains | (5,697 | ) | (16,260 | ) | — | — | ||||||||||
Class R2 | ||||||||||||||||
From net investment income | (20 | ) | (39 | ) | (27 | ) | (19 | ) | ||||||||
From net realized gains | (104 | ) | (263 | ) | — | — | ||||||||||
Class R5 | ||||||||||||||||
From net investment income | (49 | ) | — | (1,807 | ) | (2,127 | ) | |||||||||
From net realized gains | (100 | ) | (200 | ) | — | — | ||||||||||
Class R6 (a) | ||||||||||||||||
From net investment income | (49,652 | ) | (47,617 | ) | (5,624 | ) | (6,464 | ) | ||||||||
From net realized gains | (94,209 | ) | (196,504 | ) | — | — | ||||||||||
|
|
|
|
|
|
|
| |||||||||
Total distributions to shareholders | (154,362 | ) | (270,996 | ) | (9,445 | ) | (9,436 | ) | ||||||||
|
|
|
|
|
|
|
| |||||||||
CAPITAL TRANSACTIONS: | ||||||||||||||||
Change in net assets resulting from capital transactions | (32,461 | ) | 287,274 | (156,325 | ) | (49,656 | ) | |||||||||
|
|
|
|
|
|
|
| |||||||||
NET ASSETS: | ||||||||||||||||
Change in net assets | 416,305 | (43,085 | ) | 30,900 | (66,606 | ) | ||||||||||
Beginning of period | 3,666,552 | 3,709,637 | 988,223 | 1,054,829 | ||||||||||||
|
|
|
|
|
|
|
| |||||||||
End of period | $ | 4,082,857 | $ | 3,666,552 | $ | 1,019,123 | $ | 988,223 | ||||||||
|
|
|
|
|
|
|
| |||||||||
Accumulated undistributed (distributions in excess of) net investment income | $ | 23,487 | $ | 27,056 | $ | 4,113 | $ | 5,195 | ||||||||
|
|
|
|
|
|
|
| |||||||||
| (a) | Commencement of offering of class of shares effective November 2, 2015. |
SEE NOTES TO FINANCIAL STATEMENTS.
| 36 | J.P. MORGAN INTREPID FUNDS | JUNE 30, 2017 | ||||
Table of Contents
| Intrepid Mid Cap Fund | Intrepid Sustainable Equity Fund | |||||||||||||||
| Year Ended June 30, 2017 | Year Ended June 30, 2016 | Year Ended June 30, 2017 | Year Ended June 30, 2016 | |||||||||||||
CHANGE IN NET ASSETS RESULTING FROM OPERATIONS: | ||||||||||||||||
Net investment income (loss) | $ | 5,449 | $ | 8,266 | $ | 129 | $ | 359 | ||||||||
Net realized gain (loss) | 67,839 | (18,817 | ) | 2,415 | 176 | |||||||||||
Change in net unrealized appreciation/depreciation | 61,410 | (2,106 | ) | 662 | (801 | ) | ||||||||||
|
|
|
|
|
|
|
| |||||||||
Change in net assets resulting from operations | 134,698 | (12,657 | ) | 3,206 | (266 | ) | ||||||||||
|
|
|
|
|
|
|
| |||||||||
DISTRIBUTIONS TO SHAREHOLDERS: | ||||||||||||||||
Class A | ||||||||||||||||
From net investment income | (1,163 | ) | (2,230 | ) | (79 | ) | (166 | ) | ||||||||
From net realized gains | (64 | ) | (27,036 | ) | — | — | ||||||||||
Class C | ||||||||||||||||
From net investment income | (111 | ) | (410 | ) | (21 | ) | (82 | ) | ||||||||
From net realized gains | (20 | ) | (7,872 | ) | — | — | ||||||||||
Class I (formerly Select Class) | ||||||||||||||||
From net investment income | (1,250 | ) | (2,298 | ) | (47 | ) | (80 | ) | ||||||||
From net realized gains | (51 | ) | (19,338 | ) | — | — | ||||||||||
Class R3 (a) | ||||||||||||||||
From net investment income | — | (b) | — | — | — | |||||||||||
From net realized gains | — | (b) | — | — | — | |||||||||||
Class R4 (a) | ||||||||||||||||
From net investment income | — | (b) | — | — | — | |||||||||||
From net realized gains | — | (b) | — | — | — | |||||||||||
Class R6 (c) | ||||||||||||||||
From net investment income | (1,834 | ) | (2,290 | ) | — | — | ||||||||||
From net realized gains | (59 | ) | (17,654 | ) | — | — | ||||||||||
|
|
|
|
|
|
|
| |||||||||
Total distributions to shareholders | (4,552 | ) | (79,128 | ) | (147 | ) | (328 | ) | ||||||||
|
|
|
|
|
|
|
| |||||||||
CAPITAL TRANSACTIONS: | ||||||||||||||||
Change in net assets resulting from capital transactions | (205,002 | ) | 80,831 | (4,054 | ) | (3,007 | ) | |||||||||
|
|
|
|
|
|
|
| |||||||||
NET ASSETS: | ||||||||||||||||
Change in net assets | (74,856 | ) | (10,954 | ) | (995 | ) | (3,601 | ) | ||||||||
Beginning of period | 964,595 | 975,549 | 19,039 | 22,640 | ||||||||||||
|
|
|
|
|
|
|
| |||||||||
End of period | $ | 889,739 | $ | 964,595 | $ | 18,044 | $ | 19,039 | ||||||||
|
|
|
|
|
|
|
| |||||||||
Accumulated undistributed (distributions in excess of) net investment income | $ | 1,455 | $ | 1,098 | $ | 57 | $ | 79 | ||||||||
|
|
|
|
|
|
|
| |||||||||
| (a) | Commencement of offering of class of shares effective September 9, 2016 for Intrepid Mid Cap Fund. |
| (b) | Amount rounds to less than 500. |
| (c) | Commencement of offering of class of shares effective November 2, 2015 for Intrepid Mid Cap Fund. |
SEE NOTES TO FINANCIAL STATEMENTS.
| JUNE 30, 2017 | J.P. MORGAN INTREPID FUNDS | 37 | ||||||
Table of Contents
STATEMENTS OF CHANGES IN NET ASSETS
FOR THE PERIODS INDICATED (continued)
(Amounts in thousands)
| Intrepid Value Fund | ||||||||
| Year Ended June 30, 2017 | Year Ended June 30, 2016 | |||||||
CHANGE IN NET ASSETS RESULTING FROM OPERATIONS: |
| |||||||
Net investment income (loss) | $ | 20,561 | $ | 30,165 | ||||
Net realized gain (loss) | 154,933 | 3,533 | ||||||
Change in net unrealized appreciation/depreciation | 21,719 | (156,331 | ) | |||||
|
|
|
| |||||
Change in net assets resulting from operations | 197,213 | (122,633 | ) | |||||
|
|
|
| |||||
DISTRIBUTIONS TO SHAREHOLDERS: | ||||||||
Class A | ||||||||
From net investment income | (1,822 | ) | (3,919 | ) | ||||
From net realized gains | (976 | ) | (12,129 | ) | ||||
Class C | ||||||||
From net investment income | (427 | ) | (481 | ) | ||||
From net realized gains | (328 | ) | (2,317 | ) | ||||
Class I (formerly Select Class) | ||||||||
From net investment income | (14,704 | ) | (20,675 | ) | ||||
From net realized gains | (6,865 | ) | (58,980 | ) | ||||
Class R2 | ||||||||
From net investment income | (251 | ) | (209 | ) | ||||
From net realized gains | (158 | ) | (725 | ) | ||||
Class R5 | ||||||||
From net investment income | (1,707 | ) | (1,649 | ) | ||||
From net realized gains | (727 | ) | (4,135 | ) | ||||
Class R6 | ||||||||
From net investment income | (1,965 | ) | (1,457 | ) | ||||
From net realized gains | (845 | ) | (3,575 | ) | ||||
|
|
|
| |||||
Total distributions to shareholders | (30,775 | ) | (110,251 | ) | ||||
|
|
|
| |||||
CAPITAL TRANSACTIONS: | ||||||||
Change in net assets resulting from capital transactions | (630,829 | ) | 142,336 | |||||
|
|
|
| |||||
NET ASSETS: | ||||||||
Change in net assets | (464,391 | ) | (90,548 | ) | ||||
Beginning of period | 1,697,235 | 1,787,783 | ||||||
|
|
|
| |||||
End of period | $ | 1,232,844 | $ | 1,697,235 | ||||
|
|
|
| |||||
Accumulated undistributed (distributions in excess of) net investment income | $ | 985 | $ | 1,489 | ||||
|
|
|
| |||||
SEE NOTES TO FINANCIAL STATEMENTS.
| 38 | J.P. MORGAN INTREPID FUNDS | JUNE 30, 2017 | ||||
Table of Contents
| Intrepid America Fund | Intrepid Growth Fund | |||||||||||||||
| Year Ended June 30, 2017 | Year Ended June 30, 2016 | Year Ended June 30, 2017 | Year Ended June 30, 2016 | |||||||||||||
CAPITAL TRANSACTIONS: | ||||||||||||||||
Class A | ||||||||||||||||
Proceeds from shares issued | $ | 5,999 | $ | 43,942 | $ | 27,666 | $ | 29,744 | ||||||||
Distributions reinvested | 1,826 | 8,675 | 357 | 464 | ||||||||||||
Cost of shares redeemed | (21,894 | ) | (162,708 | ) | (45,136 | ) | (44,544 | ) | ||||||||
|
|
|
|
|
|
|
| |||||||||
Change in net assets resulting from Class A capital transactions | $ | (14,069 | ) | $ | (110,091 | ) | $ | (17,113 | ) | $ | (14,336 | ) | ||||
|
|
|
|
|
|
|
| |||||||||
Class C | ||||||||||||||||
Proceeds from shares issued | $ | 430 | $ | 1,939 | $ | 4,411 | $ | 10,146 | ||||||||
Distributions reinvested | 319 | 840 | 29 | 81 | ||||||||||||
Cost of shares redeemed | (4,382 | ) | (3,804 | ) | (18,954 | ) | (9,970 | ) | ||||||||
|
|
|
|
|
|
|
| |||||||||
Change in net assets resulting from Class C capital transactions | $ | (3,633 | ) | $ | (1,025 | ) | $ | (14,514 | ) | $ | 257 | |||||
|
|
|
|
|
|
|
| |||||||||
Class I (formerly Select Class) | ||||||||||||||||
Proceeds from shares issued | $ | 34,005 | $ | 122,319 | $ | 46,031 | $ | 78,959 | ||||||||
Distributions reinvested | 1,830 | 3,411 | 1,050 | 46 | ||||||||||||
Cost of shares redeemed | (93,190 | ) | (1,375,409 | ) | (46,388 | ) | (650,874 | ) | ||||||||
|
|
|
|
|
|
|
| |||||||||
Change in net assets resulting from Class I capital transactions | $ | (57,355 | ) | $ | (1,249,679 | ) | $ | 693 | $ | (571,869 | ) | |||||
|
|
|
|
|
|
|
| |||||||||
Class R2 | ||||||||||||||||
Proceeds from shares issued | $ | 786 | $ | 3,181 | $ | 1,831 | $ | 3,918 | ||||||||
Distributions reinvested | 61 | 206 | 6 | 7 | ||||||||||||
Cost of shares redeemed | (2,478 | ) | (1,407 | ) | (1,672 | ) | (949 | ) | ||||||||
|
|
|
|
|
|
|
| |||||||||
Change in net assets resulting from Class R2 capital transactions | $ | (1,631 | ) | $ | 1,980 | $ | 165 | $ | 2,976 | |||||||
|
|
|
|
|
|
|
| |||||||||
Class R5 | ||||||||||||||||
Proceeds from shares issued | $ | 1,408 | $ | 147,210 | $ | 26,918 | $ | 54,598 | ||||||||
Distributions reinvested | 80 | 98 | 1,528 | 1,858 | ||||||||||||
Cost of shares redeemed | (1,205 | ) | (2,206,178 | ) | (75,964 | ) | (38,491 | ) | ||||||||
|
|
|
|
|
|
|
| |||||||||
Change in net assets resulting from Class R5 capital transactions | $ | 283 | $ | (2,058,870 | ) | $ | (47,518 | ) | $ | 17,965 | ||||||
|
|
|
|
|
|
|
| |||||||||
Class R6 (a) | ||||||||||||||||
Proceeds from shares issued | $ | 168,666 | $ | 3,744,275 | $ | 17,417 | $ | 605,936 | ||||||||
Distributions reinvested | 143,577 | 244,121 | 5,624 | 6,464 | ||||||||||||
Cost of shares redeemed | (268,299 | ) | (283,437 | ) | (101,079 | ) | (97,049 | ) | ||||||||
|
|
|
|
|
|
|
| |||||||||
Change in net assets resulting from Class R6 capital transactions | $ | 43,944 | $ | 3,704,959 | $ | (78,038 | ) | $ | 515,351 | |||||||
|
|
|
|
|
|
|
| |||||||||
Total change in net assets resulting from capital transactions | $ | (32,461 | ) | $ | 287,274 | $ | (156,325 | ) | $ | (49,656 | ) | |||||
|
|
|
|
|
|
|
| |||||||||
| (a) | Commencement of offering of class of shares effective November 2, 2015. |
SEE NOTES TO FINANCIAL STATEMENTS.
| JUNE 30, 2017 | J.P. MORGAN INTREPID FUNDS | 39 | ||||||
Table of Contents
STATEMENTS OF CHANGES IN NET ASSETS
FOR THE PERIODS INDICATED (continued)
(Amounts in thousands)
| Intrepid America Fund | Intrepid Growth Fund | |||||||||||||||
| Year Ended June 30, 2017 | Year Ended June 30, 2016 | Year Ended June 30, 2017 | Year Ended June 30, 2016 | |||||||||||||
SHARE TRANSACTIONS: | ||||||||||||||||
Class A | �� | |||||||||||||||
Issued | 163 | 1,229 | 630 | 737 | ||||||||||||
Reinvested | 49 | 249 | 8 | 12 | ||||||||||||
Redeemed | (586 | ) | (4,667 | ) | (1,016 | ) | (1,106 | ) | ||||||||
|
|
|
|
|
|
|
| |||||||||
Change in Class A Shares | (374 | ) | (3,189 | ) | (378 | ) | (357 | ) | ||||||||
|
|
|
|
|
|
|
| |||||||||
Class C | ||||||||||||||||
Issued | 11 | 56 | 101 | 257 | ||||||||||||
Reinvested | 9 | 24 | 1 | 2 | ||||||||||||
Redeemed | (120 | ) | (110 | ) | (434 | ) | (255 | ) | ||||||||
|
|
|
|
|
|
|
| |||||||||
Change in Class C Shares | (100 | ) | (30 | ) | (332 | ) | 4 | |||||||||
|
|
|
|
|
|
|
| |||||||||
Class I (formerly Select Class) | ||||||||||||||||
Issued | 897 | 3,461 | 1,020 | 1,966 | ||||||||||||
Reinvested | 48 | 97 | 24 | 1 | ||||||||||||
Redeemed | (2,482 | ) | (35,374 | ) | (1,023 | ) | (15,436 | ) | ||||||||
|
|
|
|
|
|
|
| |||||||||
Change in Class I Shares | (1,537 | ) | (31,816 | ) | 21 | (13,469 | ) | |||||||||
|
|
|
|
|
|
|
| |||||||||
Class R2 | ||||||||||||||||
Issued | 21 | 91 | 43 | 100 | ||||||||||||
Reinvested | 2 | 6 | — | (a) | — | (a) | ||||||||||
Redeemed | (69 | ) | (40 | ) | (38 | ) | (24 | ) | ||||||||
|
|
|
|
|
|
|
| |||||||||
Change in Class R2 Shares | (46 | ) | 57 | 5 | 76 | |||||||||||
|
|
|
|
|
|
|
| |||||||||
Class R5 | ||||||||||||||||
Issued | 37 | 3,900 | 602 | 1,371 | ||||||||||||
Reinvested | 2 | 3 | 35 | 46 | ||||||||||||
Redeemed | (32 | ) | (56,255 | ) | (1,762 | ) | (959 | ) | ||||||||
|
|
|
|
|
|
|
| |||||||||
Change in Class R5 Shares | 7 | (52,352 | ) | (1,125 | ) | 458 | ||||||||||
|
|
|
|
|
|
|
| |||||||||
Class R6 (b) | ||||||||||||||||
Issued | 4,471 | 96,721 | 367 | 14,369 | ||||||||||||
Reinvested | 3,844 | 6,953 | 129 | 160 | ||||||||||||
Redeemed | (7,129 | ) | (8,292 | ) | (2,190 | ) | (2,476 | ) | ||||||||
|
|
|
|
|
|
|
| |||||||||
Change in Class R6 Shares | 1,186 | 95,382 | (1,694 | ) | 12,053 | |||||||||||
|
|
|
|
|
|
|
| |||||||||
| (a) | Amount rounds to less than 500. |
| (b) | Commencement of offering of class of shares effective November 2, 2015. |
SEE NOTES TO FINANCIAL STATEMENTS.
| 40 | J.P. MORGAN INTREPID FUNDS | JUNE 30, 2017 | ||||
Table of Contents
| Intrepid Mid Cap Fund | Intrepid Sustainable Equity Fund | |||||||||||||||
| Year Ended June 30, 2017 | Year Ended June 30, 2016 | Year Ended June 30, 2017 | Year Ended June 30, 2016 | |||||||||||||
CAPITAL TRANSACTIONS: | ||||||||||||||||
Class A | ||||||||||||||||
Proceeds from shares issued | $ | 81,290 | $ | 115,229 | $ | 997 | $ | 1,458 | ||||||||
Distributions reinvested | 1,110 | 26,642 | 79 | 166 | ||||||||||||
Cost of shares redeemed | (131,036 | ) | (168,582 | ) | (3,288 | ) | (3,513 | ) | ||||||||
|
|
|
|
|
|
|
| |||||||||
Change in net assets resulting from Class A capital transactions | $ | (48,636 | ) | $ | (26,711 | ) | $ | (2,212 | ) | $ | (1,889 | ) | ||||
|
|
|
|
|
|
|
| |||||||||
Class C | ||||||||||||||||
Proceeds from shares issued | $ | 14,601 | $ | 27,150 | $ | 287 | $ | 513 | ||||||||
Distributions reinvested | 103 | 7,265 | 21 | 77 | ||||||||||||
Cost of shares redeemed | (33,172 | ) | (22,253 | ) | (2,328 | ) | (1,144 | ) | ||||||||
|
|
|
|
|
|
|
| |||||||||
Change in net assets resulting from Class C capital transactions | $ | (18,468 | ) | $ | 12,162 | $ | (2,020 | ) | $ | (554 | ) | |||||
|
|
|
|
|
|
|
| |||||||||
Class I (formerly Select Class) | ||||||||||||||||
Proceeds from shares issued | $ | 143,668 | $ | 146,281 | $ | 1,296 | $ | 391 | ||||||||
Distributions reinvested | 1,101 | 17,565 | 31 | 50 | ||||||||||||
Cost of shares redeemed | (130,084 | ) | (384,961 | ) | (1,149 | ) | (1,005 | ) | ||||||||
|
|
|
|
|
|
|
| |||||||||
Change in net assets resulting from Class I capital transactions | $ | 14,685 | $ | (221,115 | ) | $ | 178 | $ | (564 | ) | ||||||
|
|
|
|
|
|
|
| |||||||||
Class R3 (a) | ||||||||||||||||
Proceeds from shares issued | $ | 9,663 | $ | — | $ | — | $ | — | ||||||||
Distributions reinvested | — | (b) | — | — | — | |||||||||||
Cost of shares redeemed | (869 | ) | — | — | — | |||||||||||
|
|
|
|
|
|
|
| |||||||||
Change in net assets resulting from Class R3 capital transactions | $ | 8,794 | $ | — | $ | — | $ | — | ||||||||
|
|
|
|
|
|
|
| |||||||||
Class R4 (a) | ||||||||||||||||
Proceeds from shares issued | $ | 20 | $ | — | $ | — | $ | — | ||||||||
Distributions reinvested | — | (b) | — | — | — | |||||||||||
|
|
|
|
|
|
|
| |||||||||
Change in net assets resulting from Class R4 capital transactions | $ | 20 | $ | — | $ | — | $ | — | ||||||||
|
|
|
|
|
|
|
| |||||||||
Class R6 (c) | ||||||||||||||||
Proceeds from shares issued | $ | 12,224 | $ | 296,563 | $ | — | $ | — | ||||||||
Distributions reinvested | 1,889 | 19,944 | — | — | ||||||||||||
Cost of shares redeemed | (175,510 | ) | (12 | ) | — | — | ||||||||||
|
|
|
|
|
|
|
| |||||||||
Change in net assets resulting from Class R6 capital transactions | $ | (161,397 | ) | $ | 316,495 | $ | — | $ | — | |||||||
|
|
|
|
|
|
|
| |||||||||
Total change in net assets resulting from capital transactions | $ | (205,002 | ) | $ | 80,831 | $ | (4,054 | ) | $ | (3,007 | ) | |||||
|
|
|
|
|
|
|
| |||||||||
| (a) | Commencement of offering of class of shares effective September 9, 2016 for Intrepid Mid Cap Fund. |
| (b) | Amount rounds to less than 500. |
| (c) | Commencement of offering of class of shares effective November 2, 2015 for Intrepid Mid Cap Fund. |
SEE NOTES TO FINANCIAL STATEMENTS.
| JUNE 30, 2017 | J.P. MORGAN INTREPID FUNDS | 41 | ||||||
Table of Contents
STATEMENTS OF CHANGES IN NET ASSETS
FOR THE PERIODS INDICATED (continued)
(Amounts in thousands)
| Intrepid Mid Cap Fund | Intrepid Sustainable Equity Fund | |||||||||||||||
| Year Ended June 30, 2017 | Year Ended June 30, 2016 | Year Ended June 30, 2017 | Year Ended June 30, 2016 | |||||||||||||
SHARE TRANSACTIONS: |
| |||||||||||||||
Class A |
| |||||||||||||||
Issued | 3,903 | 5,728 | 27 | 45 | ||||||||||||
Reinvested | 53 | 1,439 | 2 | 5 | ||||||||||||
Redeemed | (6,167 | ) | (8,481 | ) | (91 | ) | (107 | ) | ||||||||
|
|
|
|
|
|
|
| |||||||||
Change in Class A Shares | (2,211 | ) | (1,314 | ) | (62 | ) | (57 | ) | ||||||||
|
|
|
|
|
|
|
| |||||||||
Class C | ||||||||||||||||
Issued | 814 | 1,614 | 8 | 16 | ||||||||||||
Reinvested | 6 | 457 | 1 | 2 | ||||||||||||
Redeemed | (1,823 | ) | (1,316 | ) | (66 | ) | (36 | ) | ||||||||
|
|
|
|
|
|
|
| |||||||||
Change in Class C Shares | (1,003 | ) | 755 | (57 | ) | (18 | ) | |||||||||
|
|
|
|
|
|
|
| |||||||||
Class I (formerly Select Class) | ||||||||||||||||
Issued | 6,474 | 7,038 | 34 | 11 | ||||||||||||
Reinvested | 50 | 904 | 1 | 2 | ||||||||||||
Redeemed | (5,834 | ) | (17,691 | ) | (32 | ) | (30 | ) | ||||||||
|
|
|
|
|
|
|
| |||||||||
Change in Class I Shares | 690 | (9,749 | ) | 3 | (17 | ) | ||||||||||
|
|
|
|
|
|
|
| |||||||||
Class R3 (a) | ||||||||||||||||
Issued | 441 | — | — | — | ||||||||||||
Reinvested | — | (b) | — | — | — | |||||||||||
Redeemed | (40 | ) | — | — | — | |||||||||||
|
|
|
|
|
|
|
| |||||||||
Change in Class R3 Shares | 401 | — | — | — | ||||||||||||
|
|
|
|
|
|
|
| |||||||||
Class R4 (a) | ||||||||||||||||
Issued | 1 | — | — | — | ||||||||||||
Reinvested | — | (b) | — | — | — | |||||||||||
|
|
|
|
|
|
|
| |||||||||
Change in Class R4 Shares | 1 | — | — | — | ||||||||||||
|
|
|
|
|
|
|
| |||||||||
Class R6 (c) | ||||||||||||||||
Issued | 548 | 13,904 | — | — | ||||||||||||
Reinvested | 87 | 1,028 | — | — | ||||||||||||
Redeemed | (7,657 | ) | (1 | ) | — | — | ||||||||||
|
|
|
|
|
|
|
| |||||||||
Change in Class R6 Shares | (7,022 | ) | 14,931 | — | — | |||||||||||
|
|
|
|
|
|
|
| |||||||||
| (a) | Commencement of offering of class of shares effective September 9, 2016, for Intrepid Mid Cap Fund. |
| (b) | Amount rounds to less than 500. |
| (c) | Commencement of offering of class of shares effective November 2, 2015, for Intrepid Mid Cap Fund. |
SEE NOTES TO FINANCIAL STATEMENTS.
| 42 | J.P. MORGAN INTREPID FUNDS | JUNE 30, 2017 | ||||
Table of Contents
| Intrepid Value Fund | ||||||||
| Year Ended June 30, 2017 | Year Ended June 30, 2016 | |||||||
CAPITAL TRANSACTIONS: | ||||||||
Class A | ||||||||
Proceeds from shares issued | $ | 20,073 | $ | 166,519 | ||||
Distributions reinvested | 2,584 | 15,365 | ||||||
Cost of shares redeemed | (186,659 | ) | (80,574 | ) | ||||
|
|
|
| |||||
Change in net assets resulting from Class A capital transactions | $ | (164,002 | ) | $ | 101,310 | |||
|
|
|
| |||||
Class C | ||||||||
Proceeds from shares issued | $ | 1,926 | $ | 6,903 | ||||
Distributions reinvested | 698 | 2,515 | ||||||
Cost of shares redeemed | (14,665 | ) | (13,246 | ) | ||||
|
|
|
| |||||
Change in net assets resulting from Class C capital transactions | $ | (12,041 | ) | $ | (3,828 | ) | ||
|
|
|
| |||||
Class I (formerly Select Class) | ||||||||
Proceeds from shares issued | $ | 206,583 | $ | 308,972 | ||||
Distributions reinvested | 19,832 | 73,614 | ||||||
Cost of shares redeemed | (678,570 | ) | (411,786 | ) | ||||
|
|
|
| |||||
Change in net assets resulting from Class I capital transactions | $ | (452,155 | ) | $ | (29,200 | ) | ||
|
|
|
| |||||
Class R2 | ||||||||
Proceeds from shares issued | $ | 6,817 | $ | 11,058 | ||||
Distributions reinvested | 347 | 803 | ||||||
Cost of shares redeemed | (7,671 | ) | (6,453 | ) | ||||
|
|
|
| |||||
Change in net assets resulting from Class R2 capital transactions | $ | (507 | ) | $ | 5,408 | |||
|
|
|
| |||||
Class R5 | ||||||||
Proceeds from shares issued | $ | 14,877 | $ | 28,926 | ||||
Distributions reinvested | 2,434 | 5,784 | ||||||
Cost of shares redeemed | (28,444 | ) | (21,596 | ) | ||||
|
|
|
| |||||
Change in net assets resulting from Class R5 capital transactions | $ | (11,133 | ) | $ | 13,114 | |||
|
|
|
| |||||
Class R6 | ||||||||
Proceeds from shares issued | $ | 34,643 | $ | 71,117 | ||||
Distributions reinvested | 2,810 | 5,032 | ||||||
Cost of shares redeemed | (28,444 | ) | (20,617 | ) | ||||
|
|
|
| |||||
Change in net assets resulting from Class R6 capital transactions | $ | 9,009 | $ | 55,532 | ||||
|
|
|
| |||||
Total change in net assets resulting from capital transactions | $ | (630,829 | ) | $ | 142,336 | |||
|
|
|
| |||||
SEE NOTES TO FINANCIAL STATEMENTS.
| JUNE 30, 2017 | J.P. MORGAN INTREPID FUNDS | 43 | ||||||
Table of Contents
STATEMENTS OF CHANGES IN NET ASSETS
FOR THE PERIODS INDICATED (continued)
(Amounts in thousands)
| Intrepid Value Fund | ||||||||
| Year Ended June 30, 2017 | Year Ended June 30, 2016 | |||||||
SHARE TRANSACTIONS: | ||||||||
Class A | ||||||||
Issued | 602 | 4,888 | ||||||
Reinvested | 76 | 492 | ||||||
Redeemed | (5,697 | ) | (2,519 | ) | ||||
|
|
|
| |||||
Change in Class A Shares | (5,019 | ) | 2,861 | |||||
|
|
|
| |||||
Class C | ||||||||
Issued | 57 | 214 | ||||||
Reinvested | 21 | 82 | ||||||
Redeemed | (440 | ) | (424 | ) | ||||
|
|
|
| |||||
Change in Class C Shares | (362 | ) | (128 | ) | ||||
|
|
|
| |||||
Class I (formerly Select Class) | ||||||||
Issued | 6,068 | 9,586 | ||||||
Reinvested | 576 | 2,349 | ||||||
Redeemed | (20,858 | ) | (12,663 | ) | ||||
|
|
|
| |||||
Change in Class I Shares | (14,214 | ) | (728 | ) | ||||
|
|
|
| |||||
Class R2 | ||||||||
Issued | 203 | 348 | ||||||
Reinvested | 10 | 26 | ||||||
Redeemed | (226 | ) | (204 | ) | ||||
|
|
|
| |||||
Change in Class R2 Shares | (13 | ) | 170 | |||||
|
|
|
| |||||
Class R5 | ||||||||
Issued | 438 | 885 | ||||||
Reinvested | 71 | 184 | ||||||
Redeemed | (826 | ) | (681 | ) | ||||
|
|
|
| |||||
Change in Class R5 Shares | (317 | ) | 388 | |||||
|
|
|
| |||||
Class R6 | ||||||||
Issued | 1,044 | 2,159 | ||||||
Reinvested | 81 | 160 | ||||||
Redeemed | (837 | ) | (661 | ) | ||||
|
|
|
| |||||
Change in Class R6 Shares | 288 | 1,658 | ||||||
|
|
|
| |||||
SEE NOTES TO FINANCIAL STATEMENTS.
| 44 | J.P. MORGAN INTREPID FUNDS | JUNE 30, 2017 | ||||
Table of Contents
THIS PAGE IS INTENTIONALLY LEFT BLANK
| JUNE 30, 2017 | J.P. MORGAN INTREPID FUNDS | 45 | ||||||
Table of Contents
FOR THE PERIODS INDICATED
| Per share operating performance | ||||||||||||||||||||||||||||
| Investment operations | Distributions | |||||||||||||||||||||||||||
| Net asset value, beginning of period | Net investment income (loss) (b) | Net realized and unrealized gains (losses) on investments | Total from investment operations | Net investment income | Net realized gain | Total distributions | ||||||||||||||||||||||
Intrepid America Fund | ||||||||||||||||||||||||||||
Class A | ||||||||||||||||||||||||||||
Year Ended June 30, 2017 | $ | 34.75 | $ | 0.28 | $ | 5.30 | $ | 5.58 | $ | (0.27 | ) | $ | (1.00 | ) | $ | (1.27 | ) | |||||||||||
Year Ended June 30, 2016 | 38.08 | 0.34 | (1.15 | ) | (0.81 | ) | (0.27 | ) | (2.25 | ) | (2.52 | ) | ||||||||||||||||
Year Ended June 30, 2015 | 37.28 | 0.44 | 2.57 | 3.01 | (0.38 | ) | (1.83 | ) | (2.21 | ) | ||||||||||||||||||
Year Ended June 30, 2014 | 29.76 | 0.30 | 7.49 | 7.79 | (0.27 | ) | — | (0.27 | ) | |||||||||||||||||||
Year Ended June 30, 2013 | 24.68 | 0.34 | 5.15 | 5.49 | (0.41 | ) | — | (0.41 | ) | |||||||||||||||||||
Class C | ||||||||||||||||||||||||||||
Year Ended June 30, 2017 | 34.37 | 0.09 | 5.24 | 5.33 | (0.11 | ) | (1.00 | ) | (1.11 | ) | ||||||||||||||||||
Year Ended June 30, 2016 | 37.74 | 0.18 | (1.15 | ) | (0.97 | ) | (0.15 | ) | (2.25 | ) | (2.40 | ) | ||||||||||||||||
Year Ended June 30, 2015 | 36.99 | 0.22 | 2.57 | 2.79 | (0.21 | ) | (1.83 | ) | (2.04 | ) | ||||||||||||||||||
Year Ended June 30, 2014 | 29.53 | 0.13 | 7.42 | 7.55 | (0.09 | ) | — | (0.09 | ) | |||||||||||||||||||
Year Ended June 30, 2013 | 24.48 | 0.20 | 5.12 | 5.32 | (0.27 | ) | — | (0.27 | ) | |||||||||||||||||||
Class I (formerly Select Class) | ||||||||||||||||||||||||||||
Year Ended June 30, 2017 | 35.48 | 0.39 | 5.41 | 5.80 | (0.41 | ) | (1.00 | ) | (1.41 | ) | ||||||||||||||||||
Year Ended June 30, 2016 | 38.49 | 0.39 | (1.09 | ) | (0.70 | ) | (0.06 | ) | (2.25 | ) | (2.31 | ) | ||||||||||||||||
Year Ended June 30, 2015 | 37.61 | 0.53 | 2.61 | 3.14 | (0.43 | ) | (1.83 | ) | (2.26 | ) | ||||||||||||||||||
Year Ended June 30, 2014 | 30.00 | 0.38 | 7.56 | 7.94 | (0.33 | ) | — | (0.33 | ) | |||||||||||||||||||
Year Ended June 30, 2013 | 24.88 | 0.41 | 5.20 | 5.61 | (0.49 | ) | — | (0.49 | ) | |||||||||||||||||||
Class R2 | ||||||||||||||||||||||||||||
Year Ended June 30, 2017 | 34.01 | 0.19 | 5.17 | 5.36 | (0.19 | ) | (1.00 | ) | (1.19 | ) | ||||||||||||||||||
Year Ended June 30, 2016 | 37.45 | 0.27 | (1.15 | ) | (0.88 | ) | (0.31 | ) | (2.25 | ) | (2.56 | ) | ||||||||||||||||
Year Ended June 30, 2015 | 36.82 | 0.33 | 2.55 | 2.88 | (0.42 | ) | (1.83 | ) | (2.25 | ) | ||||||||||||||||||
Year Ended June 30, 2014 | 29.43 | 0.21 | 7.40 | 7.61 | (0.22 | ) | — | (0.22 | ) | |||||||||||||||||||
Year Ended June 30, 2013 | 24.43 | 0.26 | 5.11 | 5.37 | (0.37 | ) | — | (0.37 | ) | |||||||||||||||||||
Class R5 | ||||||||||||||||||||||||||||
Year Ended June 30, 2017 | 35.53 | 0.46 | 5.40 | 5.86 | (0.48 | ) | (1.00 | ) | (1.48 | ) | ||||||||||||||||||
Year Ended June 30, 2016 | 38.41 | 0.41 | (1.04 | ) | (0.63 | ) | — | (2.25 | ) | (2.25 | ) | |||||||||||||||||
Year Ended June 30, 2015 | 37.54 | 0.60 | 2.61 | 3.21 | (0.51 | ) | (1.83 | ) | (2.34 | ) | ||||||||||||||||||
Year Ended June 30, 2014 | 29.94 | 0.46 | 7.54 | 8.00 | (0.40 | ) | — | (0.40 | ) | |||||||||||||||||||
Year Ended June 30, 2013 | 24.84 | 0.46 | 5.19 | 5.65 | (0.55 | ) | — | (0.55 | ) | |||||||||||||||||||
Class R6 | ||||||||||||||||||||||||||||
Year Ended June 30, 2017 | 35.03 | 0.49 | 5.33 | 5.82 | (0.51 | ) | (1.00 | ) | (1.51 | ) | ||||||||||||||||||
November 2, 2015 (f) through June 30, 2016 | 39.15 | 0.41 | (1.77 | ) | (1.36 | ) | (0.51 | ) | (2.25 | ) | (2.76 | ) | ||||||||||||||||
| (a) | Annualized for periods less than one year, unless otherwise noted. |
| (b) | Calculated based upon average shares outstanding. |
| (c) | Not annualized for periods less than one year. |
| (d) | Includes adjustments in accordance with accounting principles generally accepted in the United States of America and as such, the net asset values for financial reporting purposes and the returns based upon those net asset values may differ from the net asset values and returns for shareholder transactions. |
| (e) | Includes earnings credits and interest expense, if applicable, each of which is less than 0.005% unless otherwise noted. |
| (f) | Commencement of offering of class of shares. |
SEE NOTES TO FINANCIAL STATEMENTS.
| 46 | J.P. MORGAN INTREPID FUNDS | JUNE 30, 2017 | ||||
Table of Contents
| Ratios/Supplemental data | |||||||||||||||||||||||||
| Ratios to average net assets (a) | ||||||||||||||||||||||||||
| Net asset value, end of period | Total return (excludes sales charge) (c)(d) | Net assets, end of period (000’s) | Net expenses (e) | Net investment income (loss) | Expenses without waivers, reimbursements and earnings credits | Portfolio turnover rate (c) | ||||||||||||||||||||
| $ | 39.06 | 16.27 | % | $ | 49,774 | 1.03 | % | 0.76 | % | 1.08 | % | 95 | % | |||||||||||||
| 34.75 | (2.08 | ) | 57,303 | 1.04 | 0.96 | 1.15 | 70 | |||||||||||||||||||
| 38.08 | 8.27 | 184,225 | 1.03 | 1.16 | 1.11 | 49 | ||||||||||||||||||||
| 37.28 | 26.26 | 97,155 | 1.04 | 0.90 | 1.05 | 67 | ||||||||||||||||||||
| 29.76 | 22.48 | 87,954 | 1.24 | 1.25 | 1.26 | 68 | ||||||||||||||||||||
| 38.59 | 15.69 | 10,306 | 1.53 | 0.25 | 1.57 | 95 | ||||||||||||||||||||
| 34.37 | (2.55 | ) | 12,599 | 1.54 | 0.50 | 1.62 | 70 | |||||||||||||||||||
| 37.74 | 7.72 | 14,978 | 1.53 | 0.58 | 1.56 | 49 | ||||||||||||||||||||
| 36.99 | 25.62 | 8,774 | 1.54 | 0.39 | 1.55 | 67 | ||||||||||||||||||||
| 29.53 | 21.90 | 7,336 | 1.74 | 0.75 | 1.76 | 68 | ||||||||||||||||||||
| 39.87 | 16.58 | 215,888 | 0.76 | 1.03 | 0.77 | 95 | ||||||||||||||||||||
| 35.48 | (1.77 | ) | 246,679 | 0.74 | 1.04 | 0.75 | 70 | |||||||||||||||||||
| 38.49 | 8.56 | 1,492,209 | 0.75 | 1.37 | 0.76 | 49 | ||||||||||||||||||||
| 37.61 | 26.56 | 1,514,180 | 0.79 | 1.14 | 0.80 | 67 | ||||||||||||||||||||
| 30.00 | 22.83 | 1,391,748 | 0.99 | 1.50 | 1.02 | 68 | ||||||||||||||||||||
| 38.18 | 15.98 | 3,394 | 1.27 | 0.52 | 1.41 | 95 | ||||||||||||||||||||
| 34.01 | (2.30 | ) | 4,584 | 1.29 | 0.78 | 1.46 | 70 | |||||||||||||||||||
| 37.45 | 8.01 | 2,923 | 1.28 | 0.88 | 1.35 | 49 | ||||||||||||||||||||
| 36.82 | 25.93 | 166 | 1.29 | 0.64 | 1.30 | 67 | ||||||||||||||||||||
| 29.43 | 22.20 | 170 | 1.49 | 0.96 | 1.51 | 68 | ||||||||||||||||||||
| 39.91 | 16.75 | 4,681 | 0.59 | 1.20 | 0.63 | 95 | ||||||||||||||||||||
| 35.53 | (1.57 | ) | 3,920 | 0.54 | 1.08 | 0.55 | 70 | |||||||||||||||||||
| 38.41 | 8.76 | 2,015,302 | 0.55 | 1.56 | 0.55 | 49 | ||||||||||||||||||||
| 37.54 | 26.84 | 1,363,358 | 0.58 | 1.35 | 0.59 | 67 | ||||||||||||||||||||
| 29.94 | 23.05 | 710,586 | 0.79 | 1.66 | 0.82 | 68 | ||||||||||||||||||||
| 39.34 | 16.91 | 3,798,814 | 0.49 | 1.30 | 0.49 | 95 | ||||||||||||||||||||
| 35.03 | (3.39 | ) | 3,341,467 | 0.49 | 1.78 | 0.50 | 70 | |||||||||||||||||||
SEE NOTES TO FINANCIAL STATEMENTS.
| JUNE 30, 2017 | J.P. MORGAN INTREPID FUNDS | 47 | ||||||
Table of Contents
FINANCIAL HIGHLIGHTS
FOR THE PERIODS INDICATED (continued)
| Per share operating performance | ||||||||||||||||||||
| Investment operations | Distributions | |||||||||||||||||||
| Net asset value, beginning of period | Net investment income (loss) (b) | Net realized and unrealized gains (losses) on investments | Total from investment operations | Net investment income | ||||||||||||||||
Intrepid Growth Fund | ||||||||||||||||||||
Class A | ||||||||||||||||||||
Year Ended June 30, 2017 | $ | 40.37 | $ | 0.22 | $ | 8.27 | $ | 8.49 | $ | (0.26 | ) | |||||||||
Year Ended June 30, 2016 | 40.99 | 0.27 | (0.63 | ) | (0.36 | ) | (0.26 | ) | ||||||||||||
Year Ended June 30, 2015 | 37.05 | 0.25 | 3.88 | 4.13 | (0.19 | ) | ||||||||||||||
Year Ended June 30, 2014 | 29.36 | 0.18 | (f) | 7.64 | 7.82 | (0.13 | ) | |||||||||||||
Year Ended June 30, 2013 | 25.00 | 0.21 | 4.34 | 4.55 | (0.19 | ) | ||||||||||||||
Class C | ||||||||||||||||||||
Year Ended June 30, 2017 | 39.63 | — | (g) | 8.13 | 8.13 | (0.04 | ) | |||||||||||||
Year Ended June 30, 2016 | 40.26 | 0.07 | (0.61 | ) | (0.54 | ) | (0.09 | ) | ||||||||||||
Year Ended June 30, 2015 | 36.45 | 0.05 | 3.81 | 3.86 | (0.05 | ) | ||||||||||||||
Year Ended June 30, 2014 | 28.93 | 0.01 | (f) | 7.52 | 7.53 | (0.01 | ) | |||||||||||||
Year Ended June 30, 2013 | 24.64 | 0.07 | 4.27 | 4.34 | (0.05 | ) | ||||||||||||||
Class I (formerly Select Class) | ||||||||||||||||||||
Year Ended June 30, 2017 | 40.99 | 0.34 | 8.40 | 8.74 | (0.39 | ) | ||||||||||||||
Year Ended June 30, 2016 | 41.27 | 0.29 | (0.55 | ) | (0.26 | ) | (0.02 | ) | ||||||||||||
Year Ended June 30, 2015 | 37.23 | 0.32 | 3.93 | 4.25 | (0.21 | ) | ||||||||||||||
Year Ended June 30, 2014 | 29.52 | 0.26 | (f) | 7.69 | 7.95 | (0.24 | ) | |||||||||||||
Year Ended June 30, 2013 | 25.15 | 0.28 | 4.35 | 4.63 | (0.26 | ) | ||||||||||||||
Class R2 | ||||||||||||||||||||
Year Ended June 30, 2017 | 39.66 | 0.11 | 8.12 | 8.23 | (0.23 | ) | ||||||||||||||
Year Ended June 30, 2016 | 40.39 | 0.19 | (0.63 | ) | (0.44 | ) | (0.29 | ) | ||||||||||||
Year Ended June 30, 2015 | 36.49 | 0.12 | 3.85 | 3.97 | (0.07 | ) | ||||||||||||||
Year Ended June 30, 2014 | 28.91 | 0.09 | (f) | 7.54 | 7.63 | (0.05 | ) | |||||||||||||
Year Ended June 30, 2013 | 24.72 | 0.13 | 4.27 | 4.40 | (0.21 | ) | ||||||||||||||
Class R5 | ||||||||||||||||||||
Year Ended June 30, 2017 | 40.51 | 0.42 | 8.29 | 8.71 | (0.46 | ) | ||||||||||||||
Year Ended June 30, 2016 | 41.12 | 0.45 | (0.62 | ) | (0.17 | ) | (0.44 | ) | ||||||||||||
Year Ended June 30, 2015 | 37.09 | 0.41 | 3.91 | 4.32 | (0.29 | ) | ||||||||||||||
Year Ended June 30, 2014 | 29.41 | 0.33 | (f) | 7.65 | 7.98 | (0.30 | ) | |||||||||||||
Year Ended June 30, 2013 | 25.05 | 0.33 | 4.34 | 4.67 | (0.31 | ) | ||||||||||||||
Class R6 | ||||||||||||||||||||
Year Ended June 30, 2017 | 40.50 | 0.44 | 8.29 | 8.73 | (0.49 | ) | ||||||||||||||
November 2, 2015 (i) through June 30, 2016 | 42.20 | 0.36 | (1.60 | ) | (1.24 | ) | (0.46 | ) | ||||||||||||
| (a) | Annualized for periods less than one year, unless otherwise noted. |
| (b) | Calculated based upon average shares outstanding. |
| (c) | Not annualized for periods less than one year. |
| (d) | Includes adjustments in accordance with accounting principles generally accepted in the United States of America and as such, the net asset values for financial reporting purposes and the returns based upon those net asset values may differ from the net asset values and returns for shareholder transactions. |
| (e) | Includes earnings credits and interest expense, if applicable, each of which is less than 0.005% unless otherwise noted. |
| (f) | Reflects special dividends paid out during the period by several of the Fund’s holdings. Had the Fund not received the special dividends, the net investment income (loss) per share would have been $0.17, $0.00, $0.26, $0.09 and $0.32 for Class A, Class C, Class I, Class R2 and Class R5 Shares, respectively, and the net investment income (loss) ratio would have been 0.51%, 0.01%, 0.76%, 0.26% and 0.96% for Class A, Class C, Class I, Class R2 and Class R5 Shares, respectively. |
| (g) | Amount rounds to less than 0.005. |
| (h) | Amount rounds to less than 0.005%. |
| (i) | Commencement of offering of class of shares. |
SEE NOTES TO FINANCIAL STATEMENTS.
| 48 | J.P. MORGAN INTREPID FUNDS | JUNE 30, 2017 | ||||
Table of Contents
| Ratios/Supplemental data | |||||||||||||||||||||||||
| Ratios to average net assets (a) | ||||||||||||||||||||||||||
| Net asset value, end of period | Total return (excludes sales charge) (c)(d) | Net assets, end of period (000’s) | Net expenses (e) | Net investment income (loss) | Expenses without waivers, reimbursements and earnings credits | Portfolio turnover rate (c) | ||||||||||||||||||||
| $ | 48.60 | 21.12 | % | $ | 90,633 | 0.92 | % | 0.50 | % | 1.20 | % | 68 | % | |||||||||||||
| 40.37 | (0.88 | ) | 90,529 | 0.93 | 0.66 | 1.23 | 70 | |||||||||||||||||||
| 40.99 | 11.16 | 106,573 | 0.96 | 0.62 | 1.16 | 64 | ||||||||||||||||||||
| 37.05 | 26.68 | 33,563 | 1.16 | 0.54 | (f) | 1.17 | 67 | |||||||||||||||||||
| 29.36 | 18.27 | 33,582 | 1.24 | 0.76 | 1.30 | 67 | ||||||||||||||||||||
| 47.72 | 20.52 | 42,811 | 1.41 | 0.00 | (h) | 1.67 | 68 | |||||||||||||||||||
| 39.63 | (1.35 | ) | 48,717 | 1.42 | 0.19 | 1.71 | 70 | |||||||||||||||||||
| 40.26 | 10.60 | 49,309 | 1.46 | 0.12 | 1.66 | 64 | ||||||||||||||||||||
| 36.45 | 26.05 | 19,566 | 1.65 | 0.03 | (f) | 1.67 | 67 | |||||||||||||||||||
| 28.93 | 17.66 | 15,462 | 1.74 | 0.26 | 1.79 | 67 | ||||||||||||||||||||
| 49.34 | 21.43 | 183,265 | 0.68 | 0.75 | 0.89 | 68 | ||||||||||||||||||||
| 40.99 | (0.63 | ) | 151,419 | 0.68 | 0.70 | 0.88 | 70 | |||||||||||||||||||
| 41.27 | 11.43 | 708,276 | 0.74 | 0.80 | 0.87 | 64 | ||||||||||||||||||||
| 37.23 | 27.00 | 597,963 | 0.91 | 0.79 | (f) | 0.92 | 67 | |||||||||||||||||||
| 29.52 | 18.52 | 538,378 | 0.99 | 1.02 | 1.05 | 67 | ||||||||||||||||||||
| 47.66 | 20.82 | 5,277 | 1.17 | 0.26 | 1.68 | 68 | ||||||||||||||||||||
| 39.66 | (1.10 | ) | 4,207 | 1.17 | 0.50 | 1.76 | 70 | |||||||||||||||||||
| 40.39 | 10.87 | 1,205 | 1.22 | 0.31 | 1.45 | 64 | ||||||||||||||||||||
| 36.49 | 26.41 | 601 | 1.41 | 0.28 | (f) | 1.42 | 67 | |||||||||||||||||||
| 28.91 | 17.90 | 603 | 1.49 | 0.49 | 1.54 | 67 | ||||||||||||||||||||
| 48.76 | 21.65 | 192,164 | 0.48 | 0.94 | 0.72 | 68 | ||||||||||||||||||||
| 40.51 | (0.42 | ) | 205,213 | 0.47 | 1.13 | 0.74 | 70 | |||||||||||||||||||
| 41.12 | 11.66 | 189,466 | 0.54 | 1.02 | 0.70 | 64 | ||||||||||||||||||||
| 37.09 | 27.23 | 124,489 | 0.71 | 0.98 | (f) | 0.72 | 67 | |||||||||||||||||||
| 29.41 | 18.79 | 105,839 | 0.79 | 1.21 | 0.85 | 67 | ||||||||||||||||||||
| 48.74 | 21.70 | 504,973 | 0.43 | 0.99 | 0.61 | 68 | ||||||||||||||||||||
| 40.50 | (2.94 | ) | 488,138 | 0.42 | 1.38 | 0.61 | 70 | |||||||||||||||||||
SEE NOTES TO FINANCIAL STATEMENTS.
| JUNE 30, 2017 | J.P. MORGAN INTREPID FUNDS | 49 | ||||||
Table of Contents
FINANCIAL HIGHLIGHTS
FOR THE PERIODS INDICATED (continued)
| Per share operating performance | ||||||||||||||||||||||||||||
| Investment operations | Distributions | |||||||||||||||||||||||||||
| Net asset value, beginning of period | Net investment income (loss) (b) | Net realized and unrealized gains (losses) on investments | Total from investment operations | Net investment income | Net realized gain | Total distributions | ||||||||||||||||||||||
Intrepid Mid Cap Fund | ||||||||||||||||||||||||||||
Class A | ||||||||||||||||||||||||||||
Year Ended June 30, 2017 | $ | 19.48 | $ | 0.08 | $ | 2.62 | $ | 2.70 | $ | (0.07 | ) | $ | — | (f) | $ | (0.07 | ) | |||||||||||
Year Ended June 30, 2016 | 21.82 | 0.15 | (0.64 | ) | (0.49 | ) | (0.13 | ) | (1.72 | ) | (1.85 | ) | ||||||||||||||||
Year Ended June 30, 2015 | 24.11 | 0.08 | 1.18 | 1.26 | (0.09 | ) | (3.46 | ) | (3.55 | ) | ||||||||||||||||||
Year Ended June 30, 2014 | 18.79 | 0.08 | (g) | 5.41 | 5.49 | (0.07 | ) | (0.10 | ) | (0.17 | ) | |||||||||||||||||
Year Ended June 30, 2013 | 14.99 | 0.13 | (h) | 3.80 | 3.93 | (0.13 | ) | — | (0.13 | ) | ||||||||||||||||||
Class C | ||||||||||||||||||||||||||||
Year Ended June 30, 2017 | 16.72 | (0.04 | ) | 2.24 | 2.20 | (0.02 | ) | — | (f) | (0.02 | ) | |||||||||||||||||
Year Ended June 30, 2016 | 19.07 | 0.03 | (0.58 | ) | (0.55 | ) | (0.08 | ) | (1.72 | ) | (1.80 | ) | ||||||||||||||||
Year Ended June 30, 2015 | 21.56 | (0.06 | ) | 1.06 | 1.00 | (0.03 | ) | (3.46 | ) | (3.49 | ) | |||||||||||||||||
Year Ended June 30, 2014 | 16.87 | (0.05 | )(g) | 4.84 | 4.79 | — | (0.10 | ) | (0.10 | ) | ||||||||||||||||||
Year Ended June 30, 2013 | 13.48 | 0.02 | (h) | 3.41 | 3.43 | (0.04 | ) | — | (0.04 | ) | ||||||||||||||||||
Class I (formerly Select Class) | ||||||||||||||||||||||||||||
Year Ended June 30, 2017 | 20.43 | 0.14 | 2.75 | 2.89 | (0.10 | ) | — | (f) | (0.10 | ) | ||||||||||||||||||
Year Ended June 30, 2016 | 22.77 | 0.19 | (0.64 | ) | (0.45 | ) | (0.17 | ) | (1.72 | ) | (1.89 | ) | ||||||||||||||||
Year Ended June 30, 2015 | 24.97 | 0.14 | 1.24 | 1.38 | (0.12 | ) | (3.46 | ) | (3.58 | ) | ||||||||||||||||||
Year Ended June 30, 2014 | 19.45 | 0.14 | (g) | 5.60 | 5.74 | (0.12 | ) | (0.10 | ) | (0.22 | ) | |||||||||||||||||
Year Ended June 30, 2013 | 15.51 | 0.18 | (h) | 3.93 | 4.11 | (0.17 | ) | — | (0.17 | ) | ||||||||||||||||||
Class R3 | ||||||||||||||||||||||||||||
September 9, 2016 (i) through June 30, 2017 | 19.97 | 0.11 | 2.09 | 2.20 | (0.09 | ) | — | (f) | (0.09 | ) | ||||||||||||||||||
Class R4 | ||||||||||||||||||||||||||||
September 9, 2016 (i) through June 30, 2017 | 20.95 | 0.12 | 2.24 | 2.36 | (0.11 | ) | — | (f) | (0.11 | ) | ||||||||||||||||||
Class R6 | ||||||||||||||||||||||||||||
Year Ended June 30, 2017 | 20.42 | 0.19 | 2.76 | 2.95 | (0.12 | ) | — | (f) | (0.12 | ) | ||||||||||||||||||
November 2, 2015 (i) through June 30, 2016 | 22.41 | 0.20 | (0.29 | ) | (0.09 | ) | (0.18 | ) | (1.72 | ) | (1.90 | ) | ||||||||||||||||
| (a) | Annualized for periods less than one year, unless otherwise noted. |
| (b) | Calculated based upon average shares outstanding. |
| (c) | Not annualized for periods less than one year. |
| (d) | Includes adjustments in accordance with accounting principles generally accepted in the United States of America and as such, the net asset values for financial reporting purposes and the returns based upon those net asset values may differ from the net asset values and returns for shareholder transactions. |
| (e) | Includes earnings credits and interest expense, if applicable, each of which is less than 0.005% unless otherwise noted. |
| (f) | Amount rounds to less than 0.005. |
| (g) | Reflects special dividends paid out during the period by several of the Fund’s holdings. Had the Fund not received the special dividends, the net investment income (loss) per share would have been $0.04, $(0.08) and $0.10 for Class A, Class C and Class I Shares, respectively, and the net investment income (loss) ratio would have been 0.20%, (0.42)% and 0.45% for Class A, Class C, and Class I Shares, respectively. |
| (h) | Reflects a special dividend paid out during the period by one of the Fund’s holdings. Had the Fund not received the special dividend, the net investment income (loss) per share would have been $0.08, $(0.03) and $0.13 for Class A, Class C and Class I Shares, respectively, and the net investment income (loss) ratio would have been 0.47%, (0.17)% and 0.72% for Class A, Class C and Class I Shares, respectively. |
| (i) | Commencement of offering of class of shares. |
SEE NOTES TO FINANCIAL STATEMENTS.
| 50 | J.P. MORGAN INTREPID FUNDS | JUNE 30, 2017 | ||||
Table of Contents
| Ratios/Supplemental data | |||||||||||||||||||||||||
| Ratios to average net assets (a) | ||||||||||||||||||||||||||
| Net asset value, end of period | Total return (excludes sales charge) (c)(d) | Net assets, end of period (000’s) | Net expenses (e) | Net investment income (loss) | Expenses without waivers, reimbursements and earnings credits | Portfolio turnover rate (c) | ||||||||||||||||||||
| $ | 22.11 | 13.91 | % | $ | 304,927 | 1.14 | % | 0.40 | % | 1.38 | % | 70 | % | |||||||||||||
| 19.48 | (1.71 | ) | 311,724 | 1.15 | 0.77 | 1.44 | 78 | |||||||||||||||||||
| 21.82 | 5.64 | 377,893 | 1.14 | 0.33 | 1.37 | 66 | ||||||||||||||||||||
| 24.11 | 29.30 | 193,342 | 1.16 | 0.38 | (g) | 1.32 | 64 | |||||||||||||||||||
| 18.79 | 26.30 | 144,405 | 1.23 | 0.78 | (h) | 1.38 | 52 | |||||||||||||||||||
| 18.90 | 13.20 | 81,761 | 1.74 | (0.21 | ) | 1.87 | 70 | |||||||||||||||||||
| 16.72 | (2.35 | ) | 89,071 | 1.79 | 0.15 | 1.96 | 78 | |||||||||||||||||||
| 19.07 | 5.02 | 87,191 | 1.78 | (0.31 | ) | 1.87 | 66 | |||||||||||||||||||
| 21.56 | 28.43 | 49,796 | 1.79 | (0.25 | )(g) | 1.82 | 64 | |||||||||||||||||||
| 16.87 | 25.51 | 36,073 | 1.87 | 0.13 | (h) | 1.88 | 52 | |||||||||||||||||||
| 23.22 | 14.17 | 310,316 | 0.89 | 0.65 | 1.11 | 70 | ||||||||||||||||||||
| 20.43 | (1.48 | ) | 258,866 | 0.90 | 0.93 | 1.13 | 78 | |||||||||||||||||||
| 22.77 | 5.97 | 510,465 | 0.89 | 0.58 | 1.07 | 66 | ||||||||||||||||||||
| 24.97 | 29.61 | 348,077 | 0.91 | 0.62 | (g) | 1.08 | 64 | |||||||||||||||||||
| 19.45 | 26.60 | 327,834 | 0.98 | 1.03 | (h) | 1.13 | 52 | |||||||||||||||||||
| 22.08 | 11.07 | 8,854 | 1.15 | 0.64 | 1.34 | 70 | ||||||||||||||||||||
| 23.20 | 11.30 | 22 | 0.90 | 0.67 | 1.11 | 70 | ||||||||||||||||||||
| 23.25 | 14.52 | 183,859 | 0.65 | 0.86 | 0.77 | 70 | ||||||||||||||||||||
| 20.42 | 0.12 | 304,934 | 0.65 | 1.53 | 0.78 | 78 | ||||||||||||||||||||
SEE NOTES TO FINANCIAL STATEMENTS.
| JUNE 30, 2017 | J.P. MORGAN INTREPID FUNDS | 51 | ||||||
Table of Contents
FINANCIAL HIGHLIGHTS
FOR THE PERIODS INDICATED (continued)
| Per share operating performance | ||||||||||||||||||||
| Investment operations | Distributions | |||||||||||||||||||
| Net asset value, beginning of period | Net investment income (loss) (a) | Net realized and unrealized gains (losses) on investments | Total from investment operations | Net investment income | ||||||||||||||||
Intrepid Sustainable Equity Fund | ||||||||||||||||||||
Class A | ||||||||||||||||||||
Year Ended June 30, 2017 | $ | 33.20 | $ | 0.29 | $ | 6.20 | $ | 6.49 | $ | (0.34 | ) | |||||||||
Year Ended June 30, 2016 | 34.01 | 0.62 | (d) | (0.87 | )(d) | (0.25 | ) | (0.56 | ) | |||||||||||
Year Ended June 30, 2015 | 31.93 | 0.28 | 2.02 | 2.30 | (0.22 | ) | ||||||||||||||
Year Ended June 30, 2014 | 25.54 | 0.20 | 6.37 | 6.57 | (0.18 | ) | ||||||||||||||
Year Ended June 30, 2013 | 21.13 | 0.21 | (e) | 4.44 | 4.65 | (0.24 | ) | |||||||||||||
Class C | ||||||||||||||||||||
Year Ended June 30, 2017 | 32.48 | 0.11 | 6.06 | 6.17 | (0.14 | ) | ||||||||||||||
Year Ended June 30, 2016 | 33.29 | 0.44 | (d) | (0.85 | )(d) | (0.41 | ) | (0.40 | ) | |||||||||||
Year Ended June 30, 2015 | 31.38 | 0.12 | 1.98 | 2.10 | (0.19 | ) | ||||||||||||||
Year Ended June 30, 2014 | 25.14 | 0.05 | 6.26 | 6.31 | (0.07 | ) | ||||||||||||||
Year Ended June 30, 2013 | 20.81 | 0.10 | (e) | 4.37 | 4.47 | (0.14 | ) | |||||||||||||
Class I (formerly Select Class) | ||||||||||||||||||||
Year Ended June 30, 2017 | 33.40 | 0.38 | 6.25 | 6.63 | (0.44 | ) | ||||||||||||||
Year Ended June 30, 2016 | 34.22 | 0.68 | (d) | (0.86 | )(d) | (0.18 | ) | (0.64 | ) | |||||||||||
Year Ended June 30, 2015 | 32.07 | 0.37 | 2.04 | 2.41 | (0.26 | ) | ||||||||||||||
Year Ended June 30, 2014 | 25.65 | 0.28 | 6.39 | 6.67 | (0.25 | ) | ||||||||||||||
Year Ended June 30, 2013 | 21.21 | 0.28 | (e) | 4.45 | 4.73 | (0.29 | ) | |||||||||||||
| (a) | Calculated based upon average shares outstanding. |
| (b) | Includes adjustments in accordance with accounting principles generally accepted in the United States of America and as such, the net asset values for financial reporting purposes and the returns based upon those net asset values may differ from the net asset values and returns for shareholder transactions. |
| (c) | Includes earnings credits and interest expense, if applicable, each of which is less than 0.005% unless otherwise noted. |
| (d) | The amount reflects an out of period adjustment related to a corporate action involving two of the Fund’s holdings. Had the Fund not recorded the out of period adjustment, the net investment income (loss) per share would have been $0.33, $0.15 and $0.38, for Class A, Class C and Class I Shares, respectively, the net realized and unrealized gains (losses) on investment per share would have been $(0.58), $(0.56) and $(0.56) for Class A, Class C and Class I Shares, respectively, and the net investment income (loss) ratio would have been 0.99%, 0.47% and 1.14% for Class A, Class C and Class I Shares, respectively. |
| (e) | Reflects special dividends paid out during the period by several of the Fund’s holdings. Had the Fund not received the special dividends, the net investment income (loss) per share would have been $0.17, $0.06 and $0.23 for Class A, Class C and Class I Shares, respectively, and the net investment income (loss) ratio would have been 0.73%, 0.24% and 1.00% for Class A, Class C and Class I Shares, respectively. |
SEE NOTES TO FINANCIAL STATEMENTS.
| 52 | J.P. MORGAN INTREPID FUNDS | JUNE 30, 2017 | ||||
Table of Contents
| Ratios/Supplemental data | |||||||||||||||||||||||||
| Ratios to average net assets | ||||||||||||||||||||||||||
| Net asset value, end of period | Total return (excludes sales charge) (b) | Net assets, end of period (000’s) | Net expenses (c) | Net investment income (loss) | Expenses without waivers, reimbursements and earnings credits | Portfolio turnover rate | ||||||||||||||||||||
| $ | 39.35 | 19.64 | % | $ | 7,943 | 1.08 | % | 0.80 | % | 2.29 | % | 53 | % | |||||||||||||
| 33.20 | (0.72 | ) | 8,760 | 1.15 | 1.90 | (d) | 1.95 | 31 | ||||||||||||||||||
| 34.01 | 7.22 | 10,933 | 1.15 | 0.85 | 1.87 | 35 | ||||||||||||||||||||
| 31.93 | 25.78 | 9,466 | 1.17 | 0.68 | 2.19 | 49 | ||||||||||||||||||||
| 25.54 | 22.15 | 8,765 | 1.25 | 0.92 | (e) | 2.40 | 82 | |||||||||||||||||||
| 38.51 | 19.02 | 5,063 | 1.58 | 0.30 | 2.79 | 53 | ||||||||||||||||||||
| 32.48 | (1.21 | ) | 6,131 | 1.65 | 1.38 | (d) | 2.46 | 31 | ||||||||||||||||||
| 33.29 | 6.71 | 6,874 | 1.65 | 0.36 | 2.36 | 35 | ||||||||||||||||||||
| 31.38 | 25.13 | 3,709 | 1.66 | 0.19 | 2.66 | 49 | ||||||||||||||||||||
| 25.14 | 21.55 | 2,294 | 1.75 | 0.43 | (e) | 2.91 | 82 | |||||||||||||||||||
| 39.59 | 19.95 | 5,038 | 0.83 | 1.04 | 2.03 | 53 | ||||||||||||||||||||
| 33.40 | (0.48 | ) | 4,148 | 0.90 | 2.05 | (d) | 1.65 | 31 | ||||||||||||||||||
| 34.22 | 7.51 | 4,833 | 0.90 | 1.10 | 1.59 | 35 | ||||||||||||||||||||
| 32.07 | 26.10 | 3,438 | 0.91 | 0.95 | 1.90 | 49 | ||||||||||||||||||||
| 25.65 | 22.46 | 1,516 | 1.00 | 1.19 | (e) | 2.16 | 82 | |||||||||||||||||||
SEE NOTES TO FINANCIAL STATEMENTS.
| JUNE 30, 2017 | J.P. MORGAN INTREPID FUNDS | 53 | ||||||
Table of Contents
FINANCIAL HIGHLIGHTS
FOR THE PERIODS INDICATED (continued)
| Per share operating performance | ||||||||||||||||||||||||||||
| Investment operations | Distributions | |||||||||||||||||||||||||||
| Net asset value, beginning of period | Net investment income (loss) (a) | Net realized and unrealized gains (losses) on investments | Total from investment operations | Net investment income | Net realized gain | Total distributions | ||||||||||||||||||||||
Intrepid Value Fund | ||||||||||||||||||||||||||||
Class A | ||||||||||||||||||||||||||||
Year Ended June 30, 2017 | $ | 31.20 | $ | 0.47 | $ | 4.66 | $ | 5.13 | $ | (0.52 | ) | $ | (0.27 | ) | $ | (0.79 | ) | |||||||||||
Year Ended June 30, 2016 | 35.66 | 0.53 | (2.95 | ) | (2.42 | ) | (0.49 | ) | (1.55 | ) | (2.04 | ) | ||||||||||||||||
Year Ended June 30, 2015 | 37.13 | 0.46 | 1.38 | 1.84 | (0.44 | ) | (2.87 | ) | (3.31 | ) | ||||||||||||||||||
Year Ended June 30, 2014 | 29.76 | 0.40 | 7.36 | 7.76 | (0.39 | ) | — | (0.39 | ) | |||||||||||||||||||
Year Ended June 30, 2013 | 23.99 | 0.42 | 5.79 | 6.21 | (0.44 | ) | — | (0.44 | ) | |||||||||||||||||||
Class C | ||||||||||||||||||||||||||||
Year Ended June 30, 2017 | 30.87 | 0.30 | 4.60 | 4.90 | (0.36 | ) | (0.27 | ) | (0.63 | ) | ||||||||||||||||||
Year Ended June 30, 2016 | 35.29 | 0.36 | (2.91 | ) | (2.55 | ) | (0.32 | ) | (1.55 | ) | (1.87 | ) | ||||||||||||||||
Year Ended June 30, 2015 | 36.80 | 0.27 | 1.37 | 1.64 | (0.28 | ) | (2.87 | ) | (3.15 | ) | ||||||||||||||||||
Year Ended June 30, 2014 | 29.52 | 0.23 | 7.28 | 7.51 | (0.23 | ) | — | (0.23 | ) | |||||||||||||||||||
Year Ended June 30, 2013 | 23.80 | 0.29 | 5.74 | 6.03 | (0.31 | ) | — | (0.31 | ) | |||||||||||||||||||
Class I (formerly Select Class) | ||||||||||||||||||||||||||||
Year Ended June 30, 2017 | 31.34 | 0.53 | 4.67 | 5.20 | (0.58 | ) | (0.27 | ) | (0.85 | ) | ||||||||||||||||||
Year Ended June 30, 2016 | 35.80 | 0.57 | (2.95 | ) | (2.38 | ) | (0.53 | ) | (1.55 | ) | (2.08 | ) | ||||||||||||||||
Year Ended June 30, 2015 | 37.25 | 0.51 | 1.40 | 1.91 | (0.49 | ) | (2.87 | ) | (3.36 | ) | ||||||||||||||||||
Year Ended June 30, 2014 | 29.85 | 0.45 | 7.38 | 7.83 | (0.43 | ) | — | (0.43 | ) | |||||||||||||||||||
Year Ended June 30, 2013 | 24.06 | 0.46 | 5.81 | 6.27 | (0.48 | ) | — | (0.48 | ) | |||||||||||||||||||
Class R2 | ||||||||||||||||||||||||||||
Year Ended June 30, 2017 | 31.04 | 0.38 | 4.62 | 5.00 | (0.44 | ) | (0.27 | ) | (0.71 | ) | ||||||||||||||||||
Year Ended June 30, 2016 | 35.48 | 0.44 | (2.92 | ) | (2.48 | ) | (0.41 | ) | (1.55 | ) | (1.96 | ) | ||||||||||||||||
Year Ended June 30, 2015 | 37.02 | 0.35 | 1.40 | 1.75 | (0.42 | ) | (2.87 | ) | (3.29 | ) | ||||||||||||||||||
Year Ended June 30, 2014 | 29.69 | 0.31 | 7.33 | 7.64 | (0.31 | ) | — | (0.31 | ) | |||||||||||||||||||
Year Ended June 30, 2013 | 23.95 | 0.30 | 5.83 | 6.13 | (0.39 | ) | — | (0.39 | ) | |||||||||||||||||||
Class R5 | ||||||||||||||||||||||||||||
Year Ended June 30, 2017 | 31.42 | 0.59 | 4.69 | 5.28 | (0.65 | ) | (0.27 | ) | (0.92 | ) | ||||||||||||||||||
Year Ended June 30, 2016 | 35.88 | 0.64 | (2.95 | ) | (2.31 | ) | (0.60 | ) | (1.55 | ) | (2.15 | ) | ||||||||||||||||
Year Ended June 30, 2015 | 37.33 | 0.59 | 1.39 | 1.98 | (0.56 | ) | (2.87 | ) | (3.43 | ) | ||||||||||||||||||
Year Ended June 30, 2014 | 29.91 | 0.52 | 7.40 | 7.92 | (0.50 | ) | — | (0.50 | ) | |||||||||||||||||||
Year Ended June 30, 2013 | 24.10 | 0.52 | 5.82 | 6.34 | (0.53 | ) | — | �� | (0.53 | ) | ||||||||||||||||||
Class R6 | ||||||||||||||||||||||||||||
Year Ended June 30, 2017 | 31.42 | 0.61 | 4.69 | 5.30 | (0.67 | ) | (0.27 | ) | (0.94 | ) | ||||||||||||||||||
Year Ended June 30, 2016 | 35.89 | 0.66 | (2.97 | ) | (2.31 | ) | (0.61 | ) | (1.55 | ) | (2.16 | ) | ||||||||||||||||
Year Ended June 30, 2015 | 37.33 | 0.61 | 1.39 | 2.00 | (0.57 | ) | (2.87 | ) | (3.44 | ) | ||||||||||||||||||
Year Ended June 30, 2014 | 29.91 | 0.47 | 7.46 | 7.93 | (0.51 | ) | — | (0.51 | ) | |||||||||||||||||||
Year Ended June 30, 2013 | 24.10 | 0.53 | 5.83 | 6.36 | (0.55 | ) | — | (0.55 | ) | |||||||||||||||||||
| (a) | Calculated based upon average shares outstanding. |
| (b) | Includes adjustments in accordance with accounting principles generally accepted in the United States of America and as such, the net asset values for financial reporting purposes and the returns based upon those net asset values may differ from the net asset values and returns for shareholder transactions. |
| (c) | Includes earnings credits and interest expense, if applicable, each of which is less than 0.005% unless otherwise noted. |
SEE NOTES TO FINANCIAL STATEMENTS.
| 54 | J.P. MORGAN INTREPID FUNDS | JUNE 30, 2017 | ||||
Table of Contents
| Ratios/Supplemental data | |||||||||||||||||||||||||
| Ratios to average net assets | ||||||||||||||||||||||||||
| Net asset value, end of period | Total return (excludes sales charge) (b) | Net assets, end of period (000’s) | Net expenses (c) | Net investment income (loss) | Expenses | Portfolio turnover rate | ||||||||||||||||||||
| $ | 35.54 | 16.55 | % | $ | 95,891 | 0.83 | % | 1.41 | % | 1.16 | % | 81 | % | |||||||||||||
| 31.20 | (6.70 | ) | 240,808 | 0.83 | 1.64 | 1.18 | 66 | |||||||||||||||||||
| 35.66 | 5.24 | 173,149 | 0.86 | 1.26 | 1.13 | 52 | ||||||||||||||||||||
| 37.13 | 26.17 | 114,036 | 0.94 | 1.19 | 1.17 | 49 | ||||||||||||||||||||
| 29.76 | 26.07 | 71,116 | 0.94 | 1.57 | 1.38 | 48 | ||||||||||||||||||||
| 35.14 | 15.97 | 35,999 | 1.32 | 0.89 | 1.59 | 81 | ||||||||||||||||||||
| 30.87 | (7.16 | ) | 42,788 | 1.33 | 1.12 | 1.62 | 66 | |||||||||||||||||||
| 35.29 | 4.72 | 53,413 | 1.36 | 0.76 | 1.62 | 52 | ||||||||||||||||||||
| 36.80 | 25.50 | 35,963 | 1.44 | 0.69 | 1.67 | 49 | ||||||||||||||||||||
| 29.52 | 25.48 | 25,538 | 1.44 | 1.07 | 1.88 | 48 | ||||||||||||||||||||
| 35.69 | 16.72 | 886,602 | 0.68 | 1.56 | 0.90 | 81 | ||||||||||||||||||||
| 31.34 | (6.56 | ) | 1,224,039 | 0.68 | 1.77 | 0.91 | 66 | |||||||||||||||||||
| 35.80 | 5.41 | 1,424,101 | 0.71 | 1.39 | 0.90 | 52 | ||||||||||||||||||||
| 37.25 | 26.35 | 1,214,765 | 0.79 | 1.34 | 0.92 | 49 | ||||||||||||||||||||
| 29.85 | 26.26 | 926,972 | 0.79 | 1.71 | 1.12 | 48 | ||||||||||||||||||||
| 35.33 | 16.24 | 19,693 | 1.10 | 1.12 | 1.59 | 81 | ||||||||||||||||||||
| 31.04 | (6.91 | ) | 17,721 | 1.08 | 1.39 | 1.75 | 66 | |||||||||||||||||||
| 35.48 | 4.98 | 14,237 | 1.09 | 0.97 | 1.43 | 52 | ||||||||||||||||||||
| 37.02 | 25.82 | 1,346 | 1.19 | 0.92 | 1.42 | 49 | ||||||||||||||||||||
| 29.69 | 25.74 | 934 | 1.19 | 1.06 | 1.56 | 48 | ||||||||||||||||||||
| 35.78 | 16.97 | 86,134 | 0.48 | 1.73 | 0.61 | 81 | ||||||||||||||||||||
| 31.42 | (6.35 | ) | 85,624 | 0.48 | 1.98 | 0.61 | 66 | |||||||||||||||||||
| 35.88 | 5.60 | 83,859 | 0.51 | 1.59 | 0.63 | 52 | ||||||||||||||||||||
| 37.33 | 26.60 | 80,008 | 0.59 | 1.53 | 0.72 | 49 | ||||||||||||||||||||
| 29.91 | 26.53 | 62,685 | 0.59 | 1.92 | 0.93 | 48 | ||||||||||||||||||||
| 35.78 | 17.03 | 108,525 | 0.43 | 1.79 | 0.52 | 81 | ||||||||||||||||||||
| 31.42 | (6.33 | ) | 86,255 | 0.43 | 2.07 | 0.51 | 66 | |||||||||||||||||||
| 35.89 | 5.67 | 39,024 | 0.46 | 1.65 | 0.55 | 52 | ||||||||||||||||||||
| 37.33 | 26.66 | 19,495 | 0.54 | 1.41 | 0.67 | 49 | ||||||||||||||||||||
| 29.91 | 26.59 | 10,875 | 0.54 | 1.99 | 0.91 | 48 | ||||||||||||||||||||
SEE NOTES TO FINANCIAL STATEMENTS.
| JUNE 30, 2017 | J.P. MORGAN INTREPID FUNDS | 55 | ||||||
Table of Contents
AS OF JUNE 30, 2017
1. Organization
JPMorgan Trust I (“JPM I”) and JPMorgan Trust II (“JPM II”) (the “Trusts”) were formed on November 12, 2004, as Delaware statutory trusts, pursuant to Declarations of Trust dated November 5, 2004 and are registered under the Investment Company Act of 1940, as amended (the “1940 Act”), as open-end management investment companies.
The following are 5 separate funds of the Trusts (collectively, the “Funds”) covered by this report:
| Classes Offered | Trust | Diversified/Non-Diversified | ||||
| Intrepid America Fund | Class A, Class C, Class I*, Class R2, Class R5 and Class R6 | JPM I | Diversified | |||
| Intrepid Growth Fund | Class A, Class C, Class I*, Class R2, Class R5 and Class R6 | JPM I | Diversified | |||
| Intrepid Mid Cap Fund | Class A, Class C, Class I*, Class R3**, Class R4** and Class R6 | JPM II | Diversified | |||
| Intrepid Sustainable Equity Fund^ | Class A, Class C and Class I* | JPM I | Diversified | |||
| Intrepid Value Fund | Class A, Class C, Class I*, Class R2, Class R5 and Class R6 | JPM I | Diversified |
| * | Effective April 3, 2017, Select Class was renamed Class I. |
| ** | Class R3 and Class R4 Shares commenced operations on September 9, 2016 for Intrepid Mid Cap Fund. |
| ^ | Effective March 31, 2017, Intrepid Advantage Fund changed its name to Intrepid Sustainable Equity Fund. |
The investment objective of both the Intrepid Sustainable Equity Fund and the Intrepid Value Fund is to seek to provide long-term capital appreciation.
The investment objective of both the Intrepid America Fund and the Intrepid Growth Fund is to seek to provide long-term capital growth.
The investment objective of the Intrepid Mid Cap Fund is to seek long-term capital growth by investing primarily in equity securities of companies with intermediate capitalizations.
Class A Shares generally provide for a front-end sales charge while Class C Shares provide for a contingent deferred sales charge (“CDSC”). No sales charges are assessed with respect to Class I, Class R2, Class R3, Class R4, Class R5 and Class R6 Shares. All classes of shares have equal rights as to earnings, assets and voting privileges, except that each class may bear different transfer agency, sub-transfer agency (through April 2, 2017), distribution and service fees and each class has exclusive voting rights with respect to its distribution plan and shareholder servicing agreements. Effective April 3, 2017, sub-transfer agency and shareholder servicing fees were consolidated into a single service fee. Certain Class A Shares, for which front-end sales charges have been waived, may be subject to a CDSC as described in the Funds’ prospectus. Beginning on November 14, 2017, Class C Shares will automatically convert to Class A Shares after ten years.
J.P. Morgan Investment Management Inc. (“JPMIM”), an indirect, wholly-owned subsidiary of JPMorgan Chase & Co. (“JPMorgan”), acts as Adviser (the “Adviser”) and Administrator (the “Administrator”) to the Funds.
2. Significant Accounting Policies
The following is a summary of significant accounting policies followed by the Funds in the preparation of their financial statements. The Funds are investment companies and, accordingly, follow the investment company accounting and reporting guidance of the Financial Accounting Standards Board Accounting Standards Codification Topic 946 — Investment Companies, which is part of U.S. generally accepted accounting principles (“GAAP”). The preparation of financial statements in conformity with GAAP requires management to make estimates and assumptions that affect the reported amounts of assets and liabilities and disclosure of contingent assets and liabilities at the date of the financial statements and the reported amounts of increases and decreases in net assets from operations during the reporting period. Actual results could differ from those estimates.
A. Valuation of Investments — The valuation of investments is in accordance with GAAP and the Funds’ valuation policies set forth by and under the supervision and responsibility of the Board of Trustees (the “Board”), which established the following approach to valuation, as described more fully below: (i) investments for which market quotations are readily available shall be valued at such unadjusted quoted prices and (ii) all other investments for which market quotations are not readily available shall be valued at their fair value as determined in good faith by the Board.
The Administrator has established the J.P. Morgan Investment Management Americas Valuation Committee (“AVC”) to assist the Board with the oversight and monitoring of the valuation of the Funds’ investments. The Administrator implements the valuation policies of the Funds’ investments, as directed by the Board. The AVC oversees and carries out the policies for the valuation of investments held in the Funds. This includes monitoring the appropriateness of fair values based on results of ongoing valuation oversight, including but not limited to consideration of macro or security specific events, market events and pricing vendor and broker due diligence. The Administrator is responsible for discussing and assessing the potential impacts to the fair values on an ongoing basis, and at least on a quarterly basis with the AVC and the Board.
A market-based approach is primarily used to value the Funds’ investments. Investments for which market quotations are not readily available are fair valued by approved affiliated and unaffiliated pricing vendors or third party broker-dealers (collectively referred to as “Pricing Services”) or may be internally fair valued using methods set forth by the valuation policies approved by the Board. This may include related or comparable assets or liabilities, recent transactions, market multiples, book values, and other relevant information for the investment to determine the fair value of the investment. An income-based valuation approach may be used in which the anticipated future cash flows of the investment are discounted to calculate the fair value. Discounts may also be applied due to the nature or duration of any restrictions on the disposition of the investments. Valuations
| 56 | J.P. MORGAN INTREPID FUNDS | JUNE 30, 2017 | ||||
Table of Contents
may be based upon current market prices of securities that are comparable in coupon, rating, maturity and industry. It is possible that the estimated values may differ significantly from the values that would have been used, had a ready market for the investments existed, and such differences could be material.
Equities and other exchange-traded instruments are valued at the last sale price or official market closing price on the primary exchange on which the instrument is traded before the net asset values (“NAV”) of the Funds are calculated on a valuation date. Investments in open-end investment companies (the “Underlying Funds”) are valued at each Underlying Fund’s NAV per share as of the report date.
Futures are generally valued on the basis of available market quotations.
Valuations reflected in this report are as of the report date. As a result, changes in valuation due to market events and/or issuer related events after the report date and prior to issuance of the report are not reflected herein.
The various inputs that are used in determining the valuation of the Funds’ investments are summarized into the three broad levels listed below.
| • | Level 1 — Unadjusted inputs using quoted prices in active markets for identical investments. |
| • | Level 2 — Other significant observable inputs including, but not limited to, quoted prices for similar investments, inputs other than quoted prices that are observable for investments (such as interest rates, prepayment speeds, credit risk, etc.) or other market corroborated inputs. |
| • | Level 3 — Significant inputs based on the best information available in the circumstances, to the extent observable inputs are not available (including the Funds’ assumptions in determining the fair value of investments). |
A financial instrument’s level within the fair value hierarchy is based on the lowest level of any input, both individually and in the aggregate, that is significant to the fair value measurement. The inputs or methodology used for valuing instruments are not necessarily an indication of the risk associated with investing in those instruments.
The following tables represent each valuation input as presented on the Schedules of Portfolio Investments (“SOIs”) (amounts in thousands):
Intrepid America Fund
| Level 1 Quoted prices | Level 2 Other significant observable inputs | Level 3 Significant unobservable inputs | Total | |||||||||||||
Total Investments in Securities (a) | $ | 4,102,767 | $ | — | $ | — | $ | 4,102,767 | ||||||||
|
|
|
|
|
|
|
| |||||||||
Depreciation in Other Financial Instruments | ||||||||||||||||
Futures Contracts | $ | (47 | ) | $ | — | $ | — | $ | (47 | ) | ||||||
|
|
|
|
|
|
|
| |||||||||
| Intrepid Growth Fund | ||||||||||||||||
| Level 1 Quoted prices | Level 2 Other significant observable inputs | Level 3 Significant unobservable inputs | Total | |||||||||||||
Total Investments in Securities (a) | $ | 1,024,642 | $ | — | $ | — | $ | 1,024,642 | ||||||||
|
|
|
|
|
|
|
| |||||||||
Depreciation in Other Financial Instruments | ||||||||||||||||
Futures Contracts | $ | (72 | ) | $ | — | $ | — | $ | (72 | ) | ||||||
|
|
|
|
|
|
|
| |||||||||
| Intrepid Mid Cap Fund | ||||||||||||||||
| Level 1 Quoted prices | Level 2 Other significant observable inputs | Level 3 Significant unobservable inputs | Total | |||||||||||||
Total Investments in Securities (b) | $ | 892,203 | $ | — | $ | 12 | $ | 892,215 | ||||||||
|
|
|
|
|
|
|
| |||||||||
Appreciation in Other Financial Instruments | ||||||||||||||||
Futures Contracts | $ | 14 | $ | — | $ | — | $ | 14 | ||||||||
|
|
|
|
|
|
|
| |||||||||
| Intrepid Sustainable Equity Fund | ||||||||||||||||
Level 1 Quoted prices | Level 2 Other significant observable inputs | Level 3 Significant unobservable inputs | Total | |||||||||||||
Total Investments in Securities (a) | $ | 18,060 | $ | — | $ | — | $ | 18,060 | ||||||||
|
|
|
|
|
|
|
| |||||||||
| JUNE 30, 2017 | J.P. MORGAN INTREPID FUNDS | 57 | ||||||
Table of Contents
NOTES TO FINANCIAL STATEMENTS
AS OF JUNE 30, 2017 (continued)
| Intrepid Value Fund | ||||||||||||||||
| Level 1 Quoted prices | Level 2 Other significant observable inputs | Level 3 Significant unobservable inputs | Total | |||||||||||||
Total Investments in Securities (a) | $ | 1,235,777 | $ | — | $ | — | $ | 1,235,777 | ||||||||
|
|
|
|
|
|
|
| |||||||||
Depreciation in Other Financial Instruments | ||||||||||||||||
Futures Contracts | $ | (48 | ) | $ | — | $ | — | $ | (48 | ) | ||||||
|
|
|
|
|
|
|
| |||||||||
| (a) | All portfolio holdings designated as level 1 are disclosed individually on the SOIs. Please refer to the SOIs for industry specifics of portfolio holdings. |
| (b) | All portfolio holdings designated as level 1 are disclosed individually on the SOIs. Level 3 consists of rights. Please refer to the SOIs for industry specifics of portfolio holdings. |
There were no transfers among any levels during the year ended June 30, 2017.
B. Futures Contracts — Intrepid America Fund, Intrepid Growth Fund, Intrepid Mid Cap Fund and Intrepid Value Fund used index futures contracts to gain or reduce exposure to the stock market, maintain liquidity or minimize transaction costs. The Funds also bought futures contracts to invest incoming cash in the market or sold futures in response to cash outflows, thereby simulating an invested position in the underlying index while maintaining a cash balance for liquidity.
Futures contracts provide for the delayed delivery of the underlying instrument at a fixed price or are settled for a cash amount based on the change in the value of the underlying instrument at a specific date in the future. Upon entering into a futures contract, the Funds are required to deposit with the broker, cash or securities in an amount equal to a certain percentage of the contract amount, which is referred to as the initial margin deposit. Subsequent payments, referred to as variation margin, are made or received by the Funds periodically and are based on changes in the market value of open futures contracts. Changes in the market value of open futures contracts are recorded as change in net unrealized appreciation/depreciation on the Statements of Operations. Realized gains or losses, representing the difference between the value of the contract at the time it was opened and the value at the time it was closed, are reported on the Statements of Operations at the closing or expiration of the futures contract. Securities deposited as initial margin are designated on the SOIs and cash deposited is recorded on the Statements of Assets and Liabilities. A receivable from and/or a payable to brokers for the daily variation margin is also recorded on the Statements of Assets and Liabilities.
The use of futures contracts exposes the Funds to equity price risk. The Funds may be subject to the risk that the change in the value of the futures contract may not correlate perfectly with the underlying instrument. Use of long futures contracts subjects the Funds to risk of loss in excess of the amounts shown on the Statements of Assets and Liabilities, up to the notional amount of the futures contracts. Use of short futures contracts subjects the Funds to unlimited risk of loss. The Funds may enter into futures contracts only on exchanges or boards of trade. The exchange or board of trade acts as the counterparty to each futures transaction; therefore, the Funds’ credit risk is limited to failure of the exchange or board of trade. Under some circumstances, futures exchanges may establish daily limits on the amount that the price of a futures contract can vary from the previous day’s settlement price, which could effectively prevent liquidation of positions.
The table below discloses the volume of the Funds’ futures contracts activity during the year ended June 30, 2017 (amounts in thousands):
| Intrepid America Fund | Intrepid Growth Fund | Intrepid Mid Cap Fund | Intrepid Value Fund | |||||||||||||
Futures Contracts: | ||||||||||||||||
Average Notional Balance Long | $ | 69,844 | $ | 20,475 | $ | 17,637 | $ | 23,496 | ||||||||
Ending Notional Balance Long | 18,157 | 22,756 | 3,318 | 12,589 | ||||||||||||
The Funds’ futures contracts are not subject to master netting agreements (the right to close out all transactions traded with a counterparty and net amounts owed or due across transactions).
C. Security Transactions and Investment Income — Investment transactions are accounted for on the trade date (the date the order to buy or sell is executed). Securities gains and losses are calculated on a specifically identified cost basis. Interest income is determined on the basis of coupon interest accrued using the effective interest method which adjusts for amortization of premiums and accretion of discounts. Dividend income, net of foreign taxes withheld, if any, is recorded on the ex-dividend date or when a Fund first learns of the dividend.
To the extent such information is publicly available, the Funds record distributions received in excess of income earned from underlying investments as a reduction of cost of investments and/or realized gain. Such amounts are based on estimates if actual amounts are not available and actual amounts of income, realized gain and return of capital may differ from the estimated amounts. The Funds adjust the estimated amounts of the components of distributions (and consequently their net investment income) as necessary once the issuers provide information about the actual composition of the distributions.
D. Allocation of Income and Expenses — Expenses directly attributable to a fund are charged directly to that fund, while the expenses attributable to more than one fund of the Trusts are allocated among the respective funds. In calculating the NAV of each class, investment income, realized and unrealized gains and losses and expenses, other than class-specific expenses, are allocated daily to each class of shares based upon the proportion of net assets of each class at the beginning of each day.
| 58 | J.P. MORGAN INTREPID FUNDS | JUNE 30, 2017 | ||||
Table of Contents
Transfer agency fees are class-specific expenses and sub-transfer agency fees were class-specific expenses up through April 2, 2017. Effective April 3, 2017, the Funds ceased making direct payments to financial intermediaries for any applicable sub-transfer agency services. Payments to financial intermediaries for sub-transfer agency services are made by JPMorgan Distribution Services, Inc. from the Shareholder Servicing Fee, which has been renamed as the Service Fee. The amount of the transfer agency fees and sub-transfer agency fees charged to each class of the Funds for the year ended June 30, 2017 are as follows (amounts in thousands):
| Class A | Class C | Class I | Class R2 | Class R3 | Class R4 | Class R5 | Class R6 | Total | ||||||||||||||||||||||||||||
Intrepid America Fund | ||||||||||||||||||||||||||||||||||||
Transfer agency fees | $ | 6 | $ | 2 | $ | 3 | $ | — | (a) | n/a | n/a | — | $ | 25 | $ | 36 | ||||||||||||||||||||
Sub-transfer agency fees | 40 | 8 | 50 | 6 | n/a | n/a | $ | 3 | — | 107 | ||||||||||||||||||||||||||
Intrepid Growth Fund | ||||||||||||||||||||||||||||||||||||
Transfer agency fees | 14 | 2 | 5 | 1 | n/a | n/a | 2 | 3 | 27 | |||||||||||||||||||||||||||
Sub-transfer agency fees | 67 | 27 | 57 | 16 | n/a | n/a | 98 | — | 265 | |||||||||||||||||||||||||||
Intrepid Mid Cap Fund | ||||||||||||||||||||||||||||||||||||
Transfer agency fees | 49 | 7 | 12 | n/a | $ | 2 | $ | — | (a) | n/a | 1 | 71 | ||||||||||||||||||||||||
Sub-transfer agency fees | 334 | 85 | 255 | n/a | — | (a) | — | n/a | n/a | 674 | ||||||||||||||||||||||||||
Intrepid Sustainable Equity Fund | ||||||||||||||||||||||||||||||||||||
Transfer agency fees | 1 | 1 | 1 | n/a | n/a | n/a | n/a | n/a | 3 | |||||||||||||||||||||||||||
Sub-transfer agency fees | 4 | 3 | 1 | n/a | n/a | n/a | n/a | n/a | 8 | |||||||||||||||||||||||||||
Intrepid Value Fund | ||||||||||||||||||||||||||||||||||||
Transfer agency fees | 80 | 3 | 12 | 36 | n/a | n/a | 2 | 2 | 135 | |||||||||||||||||||||||||||
Sub-transfer agency fees | 120 | 28 | 1,288 | 26 | n/a | n/a | 26 | — | 1,488 | |||||||||||||||||||||||||||
| (a) | Amount rounds to less than 500. |
E. Federal Income Taxes — Each Fund is treated as a separate taxable entity for Federal income tax purposes. Each Fund’s policy is to comply with the provisions of the Internal Revenue Code of 1986, as amended (the “Code”), applicable to regulated investment companies and to distribute to shareholders all of its distributable net investment income and net realized capital gains on investments. Accordingly, no provision for Federal income tax is necessary. Management has reviewed the Funds’ tax positions for all open tax years and has determined that as of June 30, 2017, no liability for income tax is required in the Funds’ financial statements for net unrecognized tax benefits. However, management’s conclusions may be subject to future review based on changes in, or the interpretation of, the accounting standards or tax laws and regulations. Each of the Funds’ Federal tax returns for the prior three fiscal years remains subject to examination by the Internal Revenue Service.
F. Distributions to Shareholders — Distributions from net investment income are generally declared and paid at least annually, except for the Intrepid Value Fund, for which distributions are generally declared and paid at least quarterly. Distributions are declared separately for each class. No class has preferential dividend rights; differences in per share rates are due to differences in separate class expenses. Net realized capital gains, if any, are distributed by each Fund at least annually. The amount of distributions from net investment income and net realized capital gains is determined in accordance with Federal income tax regulations, which may differ from GAAP. To the extent these “book/tax” differences are permanent in nature (i.e., that they result from other than timing of recognition — “temporary differences”), such amounts are reclassified within the capital accounts based on their Federal tax-basis treatment.
The following amounts were reclassified within the capital accounts (amounts in thousands):
| Paid-in-Capital | Accumulated undistributed (distributions in excess of) net investment income | Accumulated net realized gains (losses) | ||||||||||
Intrepid America Fund | $ | — | $ | (691 | ) | $ | 691 | |||||
Intrepid Growth Fund | — | (132 | ) | 132 | ||||||||
Intrepid Mid Cap Fund | — | (734 | ) | 734 | ||||||||
Intrepid Sustainable Equity Fund | — | (4 | ) | 4 | ||||||||
Intrepid Value Fund | 12,500 | (189 | ) | (12,311 | ) | |||||||
The reclassifications for the Funds relate primarily to non-taxable dividends and tax equalization.
| JUNE 30, 2017 | J.P. MORGAN INTREPID FUNDS | 59 | ||||||
Table of Contents
NOTES TO FINANCIAL STATEMENTS
AS OF JUNE 30, 2017 (continued)
3. Fees and Other Transactions with Affiliates
A. Investment Advisory Fee — Pursuant to an Investment Advisory Agreement, the Adviser supervises the investments of each Fund and for such services is paid a fee. The fee is accrued daily and paid monthly based on each Fund’s respective average daily net assets. The annual rate for each Fund is as follows:
Intrepid America Fund | 0.40 | % | ||
Intrepid Growth Fund | 0.50 | |||
Intrepid Mid Cap Fund | 0.65 | |||
Intrepid Sustainable Equity Fund * | 0.50 | |||
Intrepid Value Fund | 0.40 |
| * | Prior to November 1, 2016, the investment advisory fee for Intrepid Sustainable Equity Fund was 0.65%. |
The Adviser waived Investment Advisory fees and/or reimbursed expenses as outlined in Note 3.F.
B. Administration Fee — Pursuant to an Administration Agreement, the Administrator provides certain administration services to the Funds. In consideration of these services, the Administrator receives a fee accrued daily and paid monthly at an annual rate of 0.15% of the first $25 billion of the average daily net assets of all funds in the J.P. Morgan Funds Complex covered by the Administration Agreement (excluding certain funds of funds and money market funds) and 0.075% of the average daily net assets in excess of $25 billion of all such funds. For the year ended June 30, 2017, the effective annualized rate was 0.08% of each Fund’s average daily net assets, notwithstanding any fee waivers and/or expense reimbursements.
The Administrator waived Administration fees as outlined in Note 3.F.
JPMorgan Chase Bank, N.A. (“JPMCB”), a wholly-owned subsidiary of JPMorgan, serves as the Funds’ sub-administrator (the “Sub-administrator”). For its services as Sub-administrator, JPMCB receives a portion of the fees payable to the Administrator.
C. Distribution Fees — Pursuant to a Distribution Agreement, JPMorgan Distribution Services, Inc. (“JPMDS”), a wholly-owned subsidiary of JPMorgan, serves as the Trusts’ principal underwriter and promotes and arranges for the sale of each Fund’s shares.
The Board has adopted a Distribution Plan (the “Distribution Plan”) for Class A, Class C, Class R2 and Class R3 Shares of the Funds, as applicable, in accordance with Rule 12b-1 under the 1940 Act. Class I, Class R4, Class R5 and Class R6 Shares do not charge a distribution fee. The Distribution Plan provides that each Fund shall pay distribution fees, including payments to JPMDS, at annual rates of the average daily net assets as shown in the table below:
| Class A | Class C | Class R2 | Class R3 | |||||||||||||
Intrepid America Fund | 0.25 | % | 0.75 | % | 0.50 | % | n/a | |||||||||
Intrepid Growth Fund | 0.25 | 0.75 | 0.50 | n/a | ||||||||||||
Intrepid Mid Cap Fund | 0.25 | 0.75 | n/a | 0.25 | % | |||||||||||
Intrepid Sustainable Equity Fund | 0.25 | 0.75 | n/a | n/a | ||||||||||||
Intrepid Value Fund | 0.25 | 0.75 | 0.50 | n/a | ||||||||||||
In addition, JPMDS is entitled to receive the front-end sales charges from purchases of Class A Shares and the CDSC from redemptions of Class C Shares and certain Class A Shares for which front-end sales charges have been waived. For the year ended June 30, 2017, JPMDS retained the following (amounts in thousands):
| Front-End Sales Charge | CDSC | |||||||
Intrepid America Fund | $ | 2 | $ | — | (a) | |||
Intrepid Growth Fund | 13 | 1 | ||||||
Intrepid Mid Cap Fund | 23 | 2 | ||||||
Intrepid Sustainable Equity Fund | 2 | — | (a) | |||||
Intrepid Value Fund | 5 | 1 | ||||||
| (a) | Amount rounds to less than 500. |
| 60 | J.P. MORGAN INTREPID FUNDS | JUNE 30, 2017 | ||||
Table of Contents
D. Service Fees — The Trusts, on behalf of the Funds, have entered into Shareholder Servicing Agreements with JPMDS under which JPMDS provides certain support services to the shareholders. The Class R6 Shares do not charge a service fee. For performing these services, JPMDS receives a fee that is accrued daily and paid monthly equal to a percentage of the average daily net assets as shown in the table below:
| Class A | Class C | Class I | Class R2 | Class R3 | Class R4 | Class R5 | ||||||||||||||||||||||
Intrepid America Fund | 0.25 | % | 0.25 | % | 0.25 | % | 0.25 | % | n/a | n/a | 0.10 | %* | ||||||||||||||||
Intrepid Growth Fund | 0.25 | 0.25 | 0.25 | 0.25 | n/a | n/a | 0.10 | * | ||||||||||||||||||||
Intrepid Mid Cap Fund | 0.25 | 0.25 | 0.25 | n/a | 0.25 | % | 0.25 | % | n/a | |||||||||||||||||||
Intrepid Sustainable Equity Fund | 0.25 | 0.25 | 0.25 | n/a | n/a | n/a | n/a | |||||||||||||||||||||
Intrepid Value Fund | 0.25 | 0.25 | 0.25 | 0.25 | n/a | n/a | 0.10 | * | ||||||||||||||||||||
| * | Prior to April 3, 2017, the service fees for Intrepid America Fund, Intrepid Growth Fund and Intrepid Value Fund was 0.05%. |
JPMDS has entered into shareholder services contracts with affiliated and unaffiliated financial intermediaries who provide shareholder services and other related services to their clients or customers who invest in the Funds under which JPMDS will pay all or a portion of such fees earned to financial intermediaries for performing such services.
JPMDS waived Service fees as outlined in Note 3.F.
E. Custodian and Accounting Fees — JPMCB provides portfolio custody and accounting services to the Funds. For performing these services, the Funds pay JPMCB transaction and asset-based fees that vary according to the number of transactions and positions, plus out-of-pocket expenses. The amounts paid directly to JPMCB by the Funds for custody and accounting services are included in Custodian and accounting fees on the Statements of Operations. Payments to the custodian may be reduced by credits earned by each Fund, based on uninvested cash balances held by the custodian. Such earnings credits, if any, are presented separately on the Statements of Operations.
Interest expense paid to the custodian related to cash overdrafts, if any, is included in Interest expense to affiliates on the Statements of Operations.
F. Waivers and Reimbursements — The Adviser, Administrator and/or JPMDS have contractually agreed to waive fees and/or reimburse the Funds to the extent that total annual operating expenses (excluding acquired fund fees and expenses other than certain money market fund fees as described below, dividend and interest expenses related to short sales, interest, taxes, expenses related to litigation and potential litigation and extraordinary expenses) exceed the percentages of the Funds’ respective average daily net assets as shown in the table below:
| Class A | Class C | Class I | Class R2** | Class R3 | Class R4 | Class R5 | Class R6 | |||||||||||||||||||||||||
Intrepid America Fund | 1.04 | % | 1.54 | % | 0.80 | 1.30 | % | n/a | n/a | 0.60 | % | 0.55 | % | |||||||||||||||||||
Intrepid Growth Fund | 0.93 | 1.42 | 0.68 | 1.18 | n/a | n/a | 0.48 | 0.43 | ||||||||||||||||||||||||
Intrepid Mid Cap Fund | 1.15 | 1.79 | 0.90 | n/a | 1.15 | % | 0.90 | % | n/a | 0.65 | ||||||||||||||||||||||
Intrepid Sustainable Equity Fund* | 1.05 | 1.55 | 0.80 | n/a | n/a | n/a | n/a | n/a | ||||||||||||||||||||||||
Intrepid Value Fund | 0.83 | 1.33 | 0.68 | 1.18 | n/a | n/a | 0.48 | 0.43 | ||||||||||||||||||||||||
| * | Prior to November 1, 2016, the contractual expense limitations for Intrepid Sustainable Equity Fund were 1.15%, 1.65% and 0.90% for Class A, Class C and Class I Shares, respectively. |
| ** | For Class R2 Shares of Intrepid America Fund, Intrepid Growth Fund and Intrepid Value Fund, the Adviser, Administrator and/or JPMDS contractually waived fees and/or reimbursed the Funds to the extent that total annual operating expenses (excluding acquired fund fees and expenses other than certain money market fund fees as described below, dividend and interest expenses related to short sales, interest, taxes, expenses related to litigation and potential litigation and extraordinary expenses) exceeded 1.29%, 1.17% and 1.08% of the Fund’s average daily net assets, respectively during the period July 1, 2016 through October 31, 2016. The contractual expense percentages in the table above are in place from November 1, 2016 until at least October 31, 2018. During the period November 1, 2016 through June 30, 2017, the Adviser, Administrator and/or JPMDS voluntarily waived fees and/or reimbursed the Funds to the extent that total annual operating expenses for Class R2 Shares exceeded 1.29%, 1.17% and 1.08%, respectively. The Funds’ service providers are under no obligation to continue the voluntary waivers and may discontinue them at any time. |
Except as noted above, the expense limitation agreements were in effect for the year ended June 30, 2017 and are in place until at least October 31, 2017.
| JUNE 30, 2017 | J.P. MORGAN INTREPID FUNDS | 61 | ||||||
Table of Contents
NOTES TO FINANCIAL STATEMENTS
AS OF JUNE 30, 2017 (continued)
For the year ended June 30, 2017, the Funds’ service providers waived fees and/or reimbursed expenses for each of the Funds as follows (amounts in thousands). None of these parties expect the Funds to repay any such waived fees and reimbursed expenses in future years.
| Contractual Waivers | ||||||||||||||||||||
| Investment Advisory Fees | Administration Fees | Service Fess | Total | Contractual Reimbursements | ||||||||||||||||
Intrepid America Fund | $ | — | $ | — | $ | 31 | $ | 31 | $ | — | (a) | |||||||||
Intrepid Growth Fund | 1,073 | 715 | 271 | 2,059 | 44 | |||||||||||||||
Intrepid Mid Cap Fund | 693 | 461 | 652 | 1,806 | 1 | |||||||||||||||
Intrepid Sustainable Equity Fund | 100 | 15 | 39 | 154 | 65 | |||||||||||||||
Intrepid Value Fund | 699 | 466 | 1,717 | 2,882 | 82 | |||||||||||||||
| (a) | Amount rounds to less than 500. |
Additionally, the Funds may invest in one or more money market funds advised by the Adviser or its affiliates (affiliated money market funds). The Adviser, Administrator and/or JPMDS, as shareholder servicing agent, have contractually agreed to waive fees and/or reimburse expenses in an amount sufficient to offset the respective net fees each collects from the affiliated money market fund on the applicable Funds’ investment in such affiliated money market fund.
The amounts of waivers resulting from investments in these money market funds for the year ended June 30, 2017 were as follows (amounts in thousands):
Intrepid America Fund | $ | 175 | ||
Intrepid Growth Fund | 34 | |||
Intrepid Mid Cap Fund | 36 | |||
Intrepid Sustainable Equity Fund | — | (a) | ||
Intrepid Value Fund | 43 |
| (a) | Amount rounds to less than 500. |
G. Other — Certain officers of the Trusts are affiliated with the Adviser, the Administrator and JPMDS. Such officers, with the exception of the Chief Compliance Officer, receive no compensation from the Funds for serving in their respective roles.
The Board appointed a Chief Compliance Officer to the Funds in accordance with Federal securities regulations. Each Fund, along with other affiliated funds, makes reimbursement payments, on a pro-rata basis, to the Administrator for a portion of the fees associated with the Office of the Chief Compliance Officer. Such fees are included in Trustees’ and Chief Compliance Officer’s fees on the Statements of Operations.
The Trusts adopted a Trustee Deferred Compensation Plan (the “Plan”) which allows the Independent Trustees to defer the receipt of all or a portion of compensation related to performance of their duties as Trustees. The deferred fees are invested in various J.P. Morgan Funds until distribution in accordance with the Plan.
During the year ended June 30, 2017, Intrepid America Fund, Intrepid Growth Fund and Intrepid Mid Cap Fund purchased securities from an underwriting syndicate in which the principal underwriter or members of the syndicate were affiliated with the Adviser.
The Funds may use related party broker-dealers. For the year ended June 30, 2017, the Funds incurred brokerage commissions with broker-dealers affiliated with the Adviser as follows (amounts in thousands):
Intrepid America Fund | $ | 2 | ||
Intrepid Growth Fund | — | (a) | ||
Intrepid Mid Cap Fund | — | (a) |
| (a) | Amount rounds to less than 500. |
The Securities and Exchange Commission (“SEC”) has granted an exemptive order permitting the Funds to engage in principal transactions with J.P. Morgan Securities, Inc., an affiliated broker, involving taxable money market instruments, subject to certain conditions.
| 62 | J.P. MORGAN INTREPID FUNDS | JUNE 30, 2017 | ||||
Table of Contents
4. Investment Transactions
During the year ended June 30, 2017, purchases and sales of investments (excluding short-term investments) were as follows (amounts in thousands):
| Purchases (excluding U.S. Government) | Sales (excluding U.S. Government) | |||||||
Intrepid America Fund | $ | 3,615,560 | $ | 3,711,054 | ||||
Intrepid Growth Fund | 661,401 | 812,289 | ||||||
Intrepid Mid Cap Fund | 675,311 | 859,467 | ||||||
Intrepid Sustainable Equity Fund | 9,609 | 13,483 | ||||||
Intrepid Value Fund | 1,048,631 | 1,662,182 | ||||||
During the year ended June 30, 2017, there were no purchases or sales of U.S. Government securities.
5. Federal Income Tax Matters
For Federal income tax purposes, the estimated cost and unrealized appreciation (depreciation) in value of investment securities held at June 30, 2017 were as follows (amounts in thousands):
Aggregate Cost | Gross Unrealized Appreciation | Gross Unrealized Depreciation | Net Unrealized Appreciation (Depreciation) | |||||||||||||
Intrepid America Fund | $ | 3,448,102 | $ | 771,505 | $ | 116,840 | $ | 654,665 | ||||||||
Intrepid Growth Fund | 752,020 | 281,960 | 9,338 | 272,622 | ||||||||||||
Intrepid Mid Cap Fund | 713,900 | 202,390 | 24,075 | 178,315 | ||||||||||||
Intrepid Sustainable Equity Fund | 13,669 | 4,712 | 321 | 4,391 | ||||||||||||
Intrepid Value Fund | 1,043,858 | 222,585 | 30,666 | 191,919 | ||||||||||||
The difference between book and tax basis appreciation (depreciation) on investments is primarily attributed wash sale loss deferrals.
The tax character of distributions paid during the fiscal year ended June 30, 2017 was as follows (amounts in thousands):
Ordinary Income* | Net Long-Term Capital Gains | Total Distribution Paid | ||||||||||
Intrepid America Fund | $ | 52,470 | $ | 101,892 | $ | 154,362 | ||||||
Intrepid Growth Fund | 9,445 | — | 9,445 | |||||||||
Intrepid Mid Cap Fund | 4,358 | 194 | 4,552 | |||||||||
Intrepid Sustainable Equity Fund | 147 | — | 147 | |||||||||
Intrepid Value Fund | 20,876 | 9,899 | 30,775 | |||||||||
| * | Short-term gains are treated as ordinary income for income tax purposes. |
The tax character of distributions paid during the fiscal year ended June 30, 2016 was as follows (amounts in thousands):
| Ordinary Income* | Net Long-Term Capital Gains | Total Distributions Paid | ||||||||||
Intrepid America Fund | $ | 49,123 | $ | 221,873 | $ | 270,996 | ||||||
Intrepid Growth Fund | 9,436 | — | 9,436 | |||||||||
Intrepid Mid Cap Fund | 19,785 | 59,343 | 79,128 | |||||||||
Intrepid Sustainable Equity Fund | 328 | — | 328 | |||||||||
Intrepid Value Fund | 34,523 | 75,728 | 110,251 | |||||||||
| * | Short-term gains are treated as ordinary income for income tax purposes. |
| JUNE 30, 2017 | J.P. MORGAN INTREPID FUNDS | 63 | ||||||
Table of Contents
NOTES TO FINANCIAL STATEMENTS
AS OF JUNE 30, 2017 (continued)
As of June 30, 2017, the estimated components of net assets (excluding paid-in-capital) on a tax basis were as follows (amounts in thousands):
Current Distributable Ordinary Income | Current Distributable Long-Term Capital Gain or | Unrealized Appreciation (Depreciation) | ||||||||||
Intrepid America Fund | $ | 86,216 | $ | 273,616 | $ | 654,665 | ||||||
Intrepid Growth Fund | 4,149 | (52,534 | ) | 272,622 | ||||||||
Intrepid Mid Cap Fund | 1,484 | 46,307 | 178,315 | |||||||||
Intrepid Sustainable Equity Fund | 62 | 589 | 4,391 | |||||||||
Intrepid Value Fund | 1,010 | 102,775 | 191,919 | |||||||||
For the Funds, the cumulative timing differences primarily consist of wash sale loss deferrals.
As of June 30, 2017, the Funds had the following pre-enactment net capital loss carryforwards, expiring during the years indicated, which are available to offset future realized gains (amounts in thousands):
| 2018 | Total | |||||||
Intrepid Growth Fund | $ | 52,534 | $ | 52,534 | ||||
During the year ended June 30, 2017, the Funds utilized capital loss carryforwards as follows (amounts in thousands):
Intrepid Growth Fund | $ | 69,736 | ||
Intrepid Sustainable Equity Fund | 1,831 |
Under the Regulated Investment Company Modernization Act of 2010 (the “Act”), net capital losses recognized by the Funds after June 30, 2011 are carried forward indefinitely, and retain their character as short-term and/or long-term losses. Prior to the Act, net capital losses incurred by the Funds were carried forward for eight years and treated as short-term losses. The Act requires that post-enactment net capital losses be used before pre-enactment net capital losses.
6. Borrowings
The Funds rely upon an exemptive order granted by the SEC (the “Order”) permitting the establishment and operation of an Interfund Lending Facility (the “Facility”). The Facility allows the Funds to directly lend and borrow money to or from any other fund relying upon the Order at rates beneficial to both the borrowing and lending funds. Advances under the Facility are taken primarily for temporary or emergency purposes, including the meeting of redemption requests that otherwise might require the untimely disposition of securities, and are subject to each Fund’s borrowing restrictions. The Interfund loan rate is determined, as specified in the Order, by averaging the current repurchase agreement rate and the current bank loan rate. The Order was granted to JPM II and may be relied upon by the Funds because the Funds and the series of JPMorgan Trust II are all investment companies in the same “group of investment companies” (as defined in Section 12(d)(1)(G) of the 1940 Act).
The Trusts and JPMCB have entered into a financing arrangement. Under this arrangement, JPMCB provides an unsecured, uncommitted credit facility in the aggregate amount of $100 million to certain of the J.P. Morgan Funds, including the Funds. Advances under the arrangement are taken primarily for temporary or emergency purposes, including the meeting of redemption requests that otherwise might require the untimely disposition of securities, and are subject to each Fund’s borrowing restrictions. Interest on borrowings is payable at a rate determined by JPMCB at the time of borrowing. This agreement has been extended until November 6, 2017.
The Funds had no borrowings outstanding from another fund or from the unsecured, uncommitted credit facility during the year ended June 30, 2017.
In addition, effective August 16, 2016, the Trust along with certain other trusts (“Borrowers”) entered into a joint syndicated senior unsecured revolving credit facility totaling $1.5 billion (“Credit Facility”) with various lenders and The Bank of New York Mellon, as administrative agent for the lenders. This Credit Facility provides a source of funds to the Borrowers for temporary and emergency purposes, including the meeting of redemption requests that otherwise might require the untimely disposition of securities. Under the terms of the Credit Facility, a borrowing fund must have a minimum of $25,000,000 in adjusted net asset value and not exceed certain adjusted net asset coverage ratios prior to and during the time in which any borrowings are outstanding. If a fund does not comply with the aforementioned requirements, the fund must remediate within three business days with respect to the $25,000,000 minimum adjusted net asset value or within one business day with respect to certain asset coverage ratios or the administrative agent at the request of, or with the consent of, the lenders may terminate the Credit Facility and declare any outstanding borrowings to be due and payable immediately.
| 64 | J.P. MORGAN INTREPID FUNDS | JUNE 30, 2017 | ||||
Table of Contents
Interest associated with any borrowing under the Credit Facility is charged to the borrowing fund at a rate of interest equal to 1.00% plus the greater of the federal funds effective rate or one month LIBOR. The annual commitment fee to maintain the Credit Facility is 0.15% and is incurred on the unused portion of the Credit Facility and is allocated to all participating funds pro rata based on their respective net assets. Effective August 15, 2017, this agreement has been amended and restated for a term of 364 days, unless extended. The Funds did not utilize the Credit Facility during the year ended June 30, 2017.
7. Risks, Concentrations and Indemnifications
In the normal course of business, the Funds enter into contracts that contain a variety of representations which provide general indemnifications. Each Fund’s maximum exposure under these arrangements is unknown. The amount of exposure would depend on future claims that may be made against each Fund that have not yet occurred. However, based on experience, the Funds expect the risk of loss to be remote.
As of June 30, 2017, the Funds had omnibus accounts which owned more than 10% of the Fund’s outstanding shares as follows:
| Number of Affiliated Omnibus Accounts | % of the Fund | Number of Non-Affiliated Omnibus Accounts | % of the Fund | |||||||||||||
Intrepid Mid Cap Fund | 2 | 12.9 | % | — | — | |||||||||||
Intrepid Sustainable Equity Fund | — | — | 3 | 22.7 | % | |||||||||||
Intrepid Value Fund | — | — | 5 | 60.0 | ||||||||||||
As of June 30, 2017, J.P. Morgan Investor Funds and JPMorgan SmartRetirement Funds, which are affiliated funds of funds, owned in the aggregate, shares representing more than 10% of the net assets of the Funds as follows:
| JPMorgan Investor Funds | JPMorgan SmartRetirement Funds | |||||||
Intrepid America Fund | 28.5 | % | 63.7 | % | ||||
Intrepid Growth Fund | 48.4 | — | ||||||
Intrepid Mid Cap Fund | 19.4 | — | ||||||
Significant shareholder transactions by these shareholders may impact the Funds’ performance.
8. Investment Company Reporting Modernization
In October 2016, the U.S. Securities and Exchange Commission adopted new rules and forms, and amendments to certain current rules and forms, to modernize the reporting and disclosure of information by registered investment companies. In part, the final rules amend Regulation S-X and will require standardized, enhanced disclosures about derivatives in investment company financial statements, as well as other amendments. The amendments to Regulation S-X will apply to Funds’ fiscal year ends on or after August 1, 2017. At this time, management is currently evaluating the impact of the regulation S-X amendments on the Funds’ financial statements and related disclosures. The adoption will have no effect on the Funds’ net assets or results of operations.
| JUNE 30, 2017 | J.P. MORGAN INTREPID FUNDS | 65 | ||||||
Table of Contents
REPORT OF INDEPENDENT REGISTERED PUBLIC ACCOUNTING FIRM
To the Board of Trustees of JPMorgan Trust I and JPMorgan Trust II and the Shareholders of JPMorgan Intrepid America Fund, JPMorgan Intrepid Growth Fund, JPMorgan Intrepid Mid Cap Fund, JPMorgan Intrepid Sustainable Equity Fund (formerly JPMorgan Intrepid Advantage Fund) and JPMorgan Intrepid Value Fund
In our opinion, the accompanying statements of assets and liabilities, including the schedules of portfolio investments, and the related statements of operations and of changes in net assets and the financial highlights present fairly, in all material respects, the financial position of JPMorgan Intrepid America Fund, JPMorgan Intrepid Growth Fund, JPMorgan Intrepid Sustainable Equity Fund (formerly JPMorgan Intrepid Advantage Fund) and JPMorgan Intrepid Value Fund (each a separate series of JPMorgan Trust I) and JPMorgan Intrepid Mid Cap Fund (a separate series of JPMorgan Trust II) (hereafter collectively referred to as the “Funds”) as of June 30, 2017, the results of each of their operations for the year then ended, the changes in each of their net assets for each of the two years in the period then ended and the financial highlights for each of the periods indicated therein, in conformity with accounting principles generally accepted in the United States of America. These financial statements and financial highlights (hereafter referred to as “financial statements”) are the responsibility of the Funds’ management. Our responsibility is to express an opinion on these financial statements based on our audits. We conducted our audits of these financial statements in accordance with the standards of the Public Company Accounting Oversight Board (United States). Those standards require that we plan and perform the audit to obtain reasonable assurance about whether the financial statements are free of material misstatement. An audit includes examining, on a test basis, evidence supporting the amounts and disclosures in the financial statements, assessing the accounting principles used and significant estimates made by management, and evaluating the overall financial statement presentation. We believe that our audits, which included confirmation of securities as of June 30, 2017 by correspondence with the transfer agent, custodian and brokers, provide a reasonable basis for our opinions.
PricewaterhouseCoopers LLP
New York, New York
August 25, 2017
| 66 | J.P. MORGAN INTREPID FUNDS | JUNE 30, 2017 | ||||
Table of Contents
(Unaudited)
The Funds’ Statement of Additional Information includes additional information about the Funds’ Trustees and is available, without charge, upon request by calling 1-800-480-4111 or on the J.P. Morgan Funds’ website at www.jpmorganfunds.com.
Name (Year of Birth); Positions With the Funds (1) | Principal Occupations During Past 5 Years | Number of Portfolios in Fund Complex Overseen by Trustee (2) | Other Directorships Held Outside Fund Complex During Past 5 Years | |||
Independent Trustees | ||||||
| John F. Finn (1947); Trustee of Trusts since 2005; Trustee of heritage One Group Mutual Funds since 1998. | Chairman (1985-present), Chief Executive Officer, Gardner, Inc. (supply chain management company serving industrial and consumer markets) (1974-present). | 150 | Director, Greif, Inc. (GEF) (industrial package products and services) (2007-present); Trustee, Columbus Association for the Performing Arts (1988-present); Director, Cardinal Health, Inc. (CAH) (1994-2014). | |||
| Dr. Matthew Goldstein (1941); Chairman since 2013; Trustee of Trusts since 2005; Trustee of heritage J.P. Morgan Funds since 2003. | Chancellor Emeritus, City University of New York (2015-present); Professor, City University of New York (2013-present); Chancellor, City University of New York (1999-2013); President, Adelphi University (New York) (1998-1999). | 150 | Trustee, Museum of Jewish Heritage (2011-present); Trustee, National Museum of Mathematics (present); Chair, Association of College and University Administrators (present). | |||
| Dennis P. Harrington (1950); Trustee of Trusts since 2017. | Retired; Partner, Deloitte LLP (1984-2012). | 149 | None | |||
| Frankie D. Hughes (1952); Trustee of Trusts since 2008. | President, Ashland Hughes Properties (property management) (2014-present); President and Chief Investment Officer, Hughes Capital Management, Inc. (fixed income asset management) (1993-2014). | 150 | None | |||
Raymond Kanner (1953); Trustee of the Trusts since 2017. | Retired; Managing Director & Chief Investment Officer, IBM Retirement Funds (2007-2016). | 149 | Director, Emerging Markets Growth Fund (1997-2016); Acting Executive Director, Committee on Investment of Employee Benefit Assets (CIEBA), 2016-17; Advisory Board Member, Betterment for Business (2016-present) (robo advisor); Advisory Board Member, Blue Star Indexes (2013-present) (index creator); Member, Russell Index Client Advisory Board (2001-2015). | |||
| Peter C. Marshall (1942); Trustee of Trusts since 2005; Trustee of heritage One Group Mutual Funds since 1985. | Self-employed business consultant (2002-present). | 150 | None | |||
| Mary E. Martinez (1960); Trustee of Trusts since 2013. | Associate, Special Properties, a Christie’s International Real Estate Affiliate (2010-present); Managing Director, Bank of America (Asset Management) (2007-2008); Chief Operating Officer, U.S. Trust Asset Management, U.S. Trust Company (asset management) (2003-2007); President, Excelsior Funds (registered investment companies) (2004-2005). | 150 | None | |||
| Marilyn McCoy* (1948); Trustee of Trusts since 2005; Trustee of heritage One Group Mutual Funds since 1999. | Vice President of Administration and Planning, Northwestern University (1985-present). | 150 | None | |||
| JUNE 30, 2017 | J.P. MORGAN INTREPID FUNDS | 67 | ||||||
Table of Contents
TRUSTEES
(Unaudited) (continued)
Name (Year of Birth); Positions With the Funds (1) | Principal Occupations During Past 5 Years | Number of Portfolios in Fund Complex Overseen by Trustee (2) | Other Directorships Held Outside Fund Complex During Past 5 Years | |||
Independent Trustees (continued) | ||||||
| Mitchell M. Merin (1953); Trustee of Trusts since 2013. | Retired; President and Chief Operating Officer, Morgan Stanley Investment Management, Member Morgan Stanley & Co. Management Committee (registered investment adviser) (1985-2005). | 150 | Director, Sun Life Financial (SLF) (2007-2013) (financial services and insurance). | |||
| Dr. Robert A. Oden, Jr. (1946); Trustee of Trusts since 2005; Trustee of heritage One Group Mutual Funds since 1997. | Retired; President, Carleton College (2002-2010); President, Kenyon College (1995-2002). | 150 | Chairman, Dartmouth-Hitchcock Medical Center (2011-present); Trustee, American Schools of Oriental Research (2011-present); Trustee, American University in Cairo (1999-2014); Trustee, American Museum of Fly Fishing (2013-present). | |||
| Marian U. Pardo** (1946); Trustee of Trusts since 2013. | Managing Director and Founder, Virtual Capital Management LLC (Investment Consulting) (2007-present); Managing Director, Credit Suisse Asset Management (portfolio manager) (2003-2006). | 150 | Member, Board of Governors, Columbus Citizens Foundation (not-for-profit supporting philanthropic and cultural programs) (2006-present). | |||
| Frederick W. Ruebeck (1939); Trustee of Trusts since 2005; Trustee of heritage One Group Mutual Funds since 1994. | Consultant (2000-present); Advisor, JP Greene & Associates, LLC (broker-dealer) (2000-2009); Chief Investment Officer, Wabash College (2004-2015); Director of Investments, Eli Lilly and Company (pharmaceuticals) (1988-1999). | 150 | Trustee, Wabash College (2000-present). | |||
| James J. Schonbachler (1943); Trustee of Trusts since 2005; Trustee of heritage J.P. Morgan Funds since 2001. | Retired; Managing Director of Bankers Trust Company (financial services) (1968-1998). | 150 | None | |||
| (1) | The Trustees serve for an indefinite term, subject to the Trusts’ current retirement policy, which is age 78 for all Trustees. |
| (2) | A Fund Complex means two or more registered investment companies that hold themselves out to investors as related companies for purposes of investment and investor services or have a common investment adviser or have an investment adviser that is an affiliated person of the investment adviser of any of the other registered investment companies. The J.P. Morgan Funds Complex for which the Board of Trustees serves currently includes twelve registered investment companies (150 funds). |
| * | Two members of the Board of Trustees of Northwestern University are executive officers of registered investment advisers (not affiliated with JPMorgan) that are under common control with sub-advisers to certain J.P. Morgan Funds. |
| ** | In connection with prior employment with JPMorgan Chase, Ms. Pardo was the recipient of non-qualified pension plan payments from JPMorgan Chase in the amount of approximately $2,055 per month, which she irrevocably waived effective January 1, 2013, and deferred compensation payments from JPMorgan Chase in the amount of approximately $7,294 per year, which ended in January 2013. In addition, Ms. Pardo receives payments from a fully-funded qualified plan, which is not an obligation of JPMorgan Chase. |
The contact address for each of the Trustees is 270 Park Avenue, New York, NY 10017.
| 68 | J.P. MORGAN INTREPID FUNDS | JUNE 30, 2017 | ||||
Table of Contents
(Unaudited)
Name (Year of Birth), Positions Held with the Trusts (Since) | Principal Occupations During Past 5 Years | |
| Brian S. Shlissel (1964), President and Principal Executive Officer (2016) | Managing Director and Chief Administrative Officer for J.P. Morgan pooled vehicles, J.P. Morgan Investment Management Inc. (formerly JPMorgan Funds Management, Inc.) (2014 – present); Managing Director and Head of Mutual Fund Services, Allianz Global Investors; President and Chief Executive Officer, Allianz Global Investors Mutual Funds and PIMCO Closed-End Funds (1999-2014) | |
| Laura M. Del Prato (1964), Treasurer and Principal Financial Officer (2014)* | Managing Director, J.P. Morgan Investment Management Inc. (formerly JPMorgan Funds Management, Inc.) since 2014; Partner, Cohen Fund Audit Services, Ltd. (2012-2013); Partner (2004-2012) and various other titles (1990-2004) at KPMG, LLP. | |
| Frank J. Nasta (1964), Secretary (2008) | Managing Director and Associate General Counsel, JPMorgan Chase since 2008. | |
| Stephen M. Ungerman (1953), Chief Compliance Officer (2005) | Managing Director, JPMorgan Chase & Co.; Mr. Ungerman has been with JPMorgan Chase & Co. since 2000. | |
Elizabeth A. Davin (1964), Assistant Secretary (2005)* | Executive Director and Assistant General Counsel, JPMorgan Chase since February 2012; formerly Vice President and Assistant General Counsel, JPMorgan Chase from 2005 to February 2012; Senior Counsel, JPMorgan Chase (formerly Bank One Corporation) from 2004 to 2005. | |
| Jessica K. Ditullio (1962), Assistant Secretary (2005)* | Executive Director and Assistant General Counsel, JPMorgan Chase. Ms. Ditullio has been with JPMorgan Chase (formerly Bank One Corporation) since 1990. | |
| John T. Fitzgerald (1975), Assistant Secretary (2008) | Executive Director and Assistant General Counsel, JPMorgan Chase. Mr. Fitzgerald has been with JPMorgan Chase since 2005. | |
| Carmine Lekstutis (1980), Assistant Secretary (2011) | Executive Director and Assistant General Counsel, JPMorgan Chase since February 2015; formerly Vice President and Assistant General Counsel, JPMorgan Chase from 2011 to February 2015. | |
| Gregory S. Samuels (1980), Assistant Secretary (2010) | Executive Director and Assistant General Counsel, JPMorgan Chase since 2014; formerly Vice President and Assistant General Counsel, JPMorgan Chase since 2010. | |
| Pamela L. Woodley (1971), Assistant Secretary (2012)** | Vice President and Assistant General Counsel, JPMorgan Chase since November 2004. | |
Zachary E. Vonnegut-Gabovitch (1986) Assistant Secretary (2017) | Vice President and Assistant General Counsel, JPMorgan Chase since September 2016; Associate, Morgan, Lewis & Bockius (law firm) from 2012 to 2016. | |
Michael M. D’Ambrosio (1969), Assistant Treasurer (2012) | Managing Director, J.P. Morgan Investment Management Inc. (formerly JPMorgan Funds Management, Inc.) since May 2014; formerly Executive Director, JPMorgan Funds Management, Inc. from 2012 to May 2014; prior to joining JPMorgan Chase, Mr. D’Ambrosio was a Tax Director at PricewaterhouseCoopers LLP since 2006. | |
Lauren A. Paino (1973), Assistant Treasurer (2014)** | Executive Director, J.P. Morgan Investment Management Inc. (formerly JPMorgan Funds Management, Inc.) since August 2013; formerly Director, Credit Suisse Asset Management from 2000-2013. | |
| Joseph Parascondola (1963), Assistant Treasurer (2011)** | Vice President, J.P. Morgan Investment Management Inc. (formerly JPMorgan Funds Management, Inc.) since August 2006. | |
| Matthew J. Plastina (1970), Assistant Treasurer (2011)** | Executive Director, J.P. Morgan Investment Management Inc. (formerly JPMorgan Funds Management, Inc.) since February 2016; Vice President, JPMorgan Funds Management, Inc. from 2010 to January 2016. | |
Gillian I. Sands (1969), Assistant Treasurer (2012)** | Vice President, J.P. Morgan Investment Management Inc. (formerly JPMorgan Funds Management, Inc.) since September 2012; Assistant Treasurer, Wells Fargo Funds Management (2007-2009). | |
The contact address for each of the officers, unless otherwise noted, is 270 Park Avenue, New York, NY 10017.
| * | The contact address for the officer is 1111 Polaris Parkway, Columbus, OH 43240. |
| ** | The contact address for the officer is 4 New York Plaza, New York, NY 10004. |
| JUNE 30, 2017 | J.P. MORGAN INTREPID FUNDS | 69 | ||||||
Table of Contents
SCHEDULE OF SHAREHOLDER EXPENSES
(Unaudited)
Hypothetical $1,000 Investment
As a shareholder of the Funds, you incur two types of costs: (1) transaction costs, including sales charges (loads) on purchase payments and (2) ongoing costs, including investment advisory fees, administration fees, distribution fees and other Fund expenses. The examples below are intended to help you understand your ongoing costs (in dollars) of investing in the Funds and to compare these ongoing costs with the ongoing costs of investing in other mutual funds. The examples assume that you had a $1,000 investment in each Class at the beginning of the reporting period, January 1, 2017, and continued to hold your shares at the end of the reporting period, June 30, 2017.
Actual Expenses
For each Class of each Fund in the table below, the first line provides information about actual account values and actual expenses. You may use the information in this line, together with the amount you invested, to estimate the expenses that you paid over the period. Simply divide your account value by $1,000 (for example, an $8,600 account value divided by $1,000 = 8.6), then multiply the result by the number in the first line of each Class under the heading entitled “Expenses Paid During the Period” to estimate the expenses you paid on your account during this period.
Hypothetical Example for Comparison Purposes
The second line of each Class in the table below provides information about hypothetical account values and hypothetical expenses based on the Class’ actual expense ratio and an assumed rate of return of 5% per year before expenses, which is not the Class’ actual return. The hypothetical account values and expenses may not be used to estimate the actual ending account balance or expenses you paid for the period. You may use this information to compare the ongoing costs of investing in the Class of the Fund and other funds. To do so, compare this 5% hypothetical example with the 5% hypothetical examples that appear in the shareholder reports of the other funds. Please note that the expenses shown in the table are meant to highlight your ongoing costs only and do not reflect any transaction costs, such as sales charges (loads) or redemption fees. Therefore, the second line for each Class in the table is useful in comparing ongoing costs only, and will not help you determine the relative total costs of owning different funds. In addition, if these transaction costs were included, your costs would have been higher. The examples also assume all dividends and distributions have been reinvested.
| Beginning Account Value January 1, 2017 | Ending Account Value June 30, 2017 | Expenses Paid During the Period* | Annualized Expense Ratio | |||||||||||||
Intrepid America Fund | ||||||||||||||||
Class A | ||||||||||||||||
Actual | $ | 1,000.00 | $ | 1,073.70 | $ | 5.35 | 1.04 | % | ||||||||
Hypothetical | 1,000.00 | 1,019.64 | 5.21 | 1.04 | ||||||||||||
Class C | ||||||||||||||||
Actual | 1,000.00 | 1,071.10 | 7.91 | 1.54 | ||||||||||||
Hypothetical | 1,000.00 | 1,017.16 | 7.70 | 1.54 | ||||||||||||
Class I (formerly Select Class) | ||||||||||||||||
Actual | 1,000.00 | 1,075.20 | 3.96 | 0.77 | ||||||||||||
Hypothetical | 1,000.00 | 1,020.98 | 3.86 | 0.77 | ||||||||||||
Class R2 | ||||||||||||||||
Actual | 1,000.00 | 1,072.20 | 6.53 | 1.27 | ||||||||||||
Hypothetical | 1,000.00 | 1,018.50 | 6.36 | 1.27 | ||||||||||||
Class R5 | ||||||||||||||||
Actual | 1,000.00 | 1,076.00 | 3.04 | 0.59 | ||||||||||||
Hypothetical | 1,000.00 | 1,021.87 | 2.96 | 0.59 | ||||||||||||
Class R6 | ||||||||||||||||
Actual | 1,000.00 | 1,076.60 | 2.52 | 0.49 | ||||||||||||
Hypothetical | 1,000.00 | 1,022.36 | 2.46 | 0.49 | ||||||||||||
Intrepid Growth Fund | ||||||||||||||||
Class A | ||||||||||||||||
Actual | 1,000.00 | 1,139.80 | 4.88 | 0.92 | ||||||||||||
Hypothetical | 1,000.00 | 1,020.23 | 4.61 | 0.92 | ||||||||||||
Class C | ||||||||||||||||
Actual | 1,000.00 | 1,137.00 | 7.47 | 1.41 | ||||||||||||
Hypothetical | 1,000.00 | 1,017.80 | 7.05 | 1.41 | ||||||||||||
Class I (formerly Select Class) | ||||||||||||||||
Actual | 1,000.00 | 1,141.30 | 3.61 | 0.68 | ||||||||||||
Hypothetical | 1,000.00 | 1,021.42 | 3.41 | 0.68 | ||||||||||||
| 70 | J.P. MORGAN INTREPID FUNDS | JUNE 30, 2017 | ||||
Table of Contents
| Beginning Account Value January 1, 2017 | Ending Account Value June 30, 2017 | Expenses Paid During the Period* | Annualized Expense Ratio | |||||||||||||
Intrepid Growth Fund (continued) | ||||||||||||||||
Class R2 | ||||||||||||||||
Actual | $ | 1,000.00 | $ | 1,138.30 | $ | 6.20 | 1.17 | % | ||||||||
Hypothetical | 1,000.00 | 1,018.99 | 5.86 | 1.17 | ||||||||||||
Class R5 | ||||||||||||||||
Actual | 1,000.00 | 1,142.20 | 2.55 | 0.48 | ||||||||||||
Hypothetical | 1,000.00 | 1,022.41 | 2.41 | 0.48 | ||||||||||||
Class R6 | ||||||||||||||||
Actual | 1,000.00 | 1,142.50 | 2.28 | 0.43 | ||||||||||||
Hypothetical | 1,000.00 | 1,022.66 | 2.16 | 0.43 | ||||||||||||
Intrepid Mid Cap Fund | ||||||||||||||||
Class A | ||||||||||||||||
Actual | 1,000.00 | 1,058.90 | 5.87 | 1.15 | ||||||||||||
Hypothetical | 1,000.00 | 1,019.09 | 5.76 | 1.15 | ||||||||||||
Class C | ||||||||||||||||
Actual | 1,000.00 | 1,055.90 | 8.72 | 1.71 | ||||||||||||
Hypothetical | 1,000.00 | 1,016.31 | 8.55 | 1.71 | ||||||||||||
Class I (formerly Select Class) | ||||||||||||||||
Actual | 1,000.00 | 1,060.30 | 4.60 | 0.90 | ||||||||||||
Hypothetical | 1,000.00 | 1,020.33 | 4.51 | 0.90 | ||||||||||||
Class R3 | ||||||||||||||||
Actual | 1,000.00 | 1,059.00 | 5.87 | 1.15 | ||||||||||||
Hypothetical | 1,000.00 | 1,019.09 | 5.76 | 1.15 | ||||||||||||
Class R4 | ||||||||||||||||
Actual | 1,000.00 | 1,060.30 | 4.60 | 0.90 | ||||||||||||
Hypothetical | 1,000.00 | 1,020.33 | 4.51 | 0.90 | ||||||||||||
Class R6 | ||||||||||||||||
Actual | 1,000.00 | 1,062.10 | 3.32 | 0.65 | ||||||||||||
Hypothetical | 1,000.00 | 1,021.57 | 3.26 | 0.65 | ||||||||||||
Intrepid Sustainable Equity Fund | ||||||||||||||||
Class A | ||||||||||||||||
Actual | 1,000.00 | 1,095.20 | 5.45 | 1.05 | ||||||||||||
Hypothetical | 1,000.00 | 1,019.59 | 5.26 | 1.05 | ||||||||||||
Class C | ||||||||||||||||
Actual | 1,000.00 | 1,092.50 | 8.04 | 1.55 | ||||||||||||
Hypothetical | 1,000.00 | 1,017.11 | 7.75 | 1.55 | ||||||||||||
Class I (formerly Select Class) | ||||||||||||||||
Actual | 1,000.00 | 1,096.70 | 4.16 | 0.80 | ||||||||||||
Hypothetical | 1,000.00 | 1,020.83 | 4.01 | 0.80 | ||||||||||||
Intrepid Value Fund | ||||||||||||||||
Class A | ||||||||||||||||
Actual | 1,000.00 | 1,036.30 | 4.19 | 0.83 | ||||||||||||
Hypothetical | 1,000.00 | 1,020.68 | 4.16 | 0.83 | ||||||||||||
Class C | ||||||||||||||||
Actual | 1,000.00 | 1,033.60 | 6.71 | 1.33 | ||||||||||||
Hypothetical | 1,000.00 | 1,018.20 | 6.66 | 1.33 | ||||||||||||
Class I (formerly Select Class) | ||||||||||||||||
Actual | 1,000.00 | 1,037.10 | 3.43 | 0.68 | ||||||||||||
Hypothetical | 1,000.00 | 1,021.42 | 3.41 | 0.68 | ||||||||||||
Class R2 | ||||||||||||||||
Actual | 1,000.00 | 1,034.80 | 5.70 | 1.13 | ||||||||||||
Hypothetical | 1,000.00 | 1,019.19 | 5.66 | 1.13 | ||||||||||||
| JUNE 30, 2017 | J.P. MORGAN INTREPID FUNDS | 71 | ||||||
Table of Contents
SCHEDULE OF SHAREHOLDER EXPENSES
(Unaudited) (continued)
Hypothetical $1,000 Investment
| Beginning Account Value January 1, 2017 | Ending Account Value June 30, 2017 | Expenses Paid During the Period* | Annualized Expense Ratio | |||||||||||||
Intrepid Value Fund (continued) | ||||||||||||||||
Class R5 | ||||||||||||||||
Actual | $ | 1,000.00 | $ | 1,038.30 | $ | 2.43 | 0.48 | % | ||||||||
Hypothetical | 1,000.00 | 1,022.41 | 2.41 | 0.48 | ||||||||||||
Class R6 | ||||||||||||||||
Actual | 1,000.00 | 1,038.20 | 2.17 | 0.43 | ||||||||||||
Hypothetical | 1,000.00 | 1,022.66 | 2.16 | 0.43 | ||||||||||||
| * | Expenses are equal to each Class’ respective annualized expense ratio, multiplied by the average account value over the period, multiplied by 181/365 (to reflect the one-half year period). |
| 72 | J.P. MORGAN INTREPID FUNDS | JUNE 30, 2017 | ||||
Table of Contents
(Unaudited)
Certain tax information for the J.P. Morgan Funds is required to be provided to shareholders based upon the Funds’ income and distributions for the taxable year ended June 30, 2017. The information and distributions reported in this letter may differ from the information and taxable distributions reported to the shareholders for the calendar year ending December 31, 2017. The information necessary to complete your income tax returns for the calendar year ending December 31, 2017 will be provided under separate cover.
Dividends Received Deductions (DRD)
Each fund listed below had the following percentage, or maximum allowable percentage, of ordinary income distributions eligible for the 70% dividends received deductions for corporate shareholders for the fiscal year ended June 30, 2017:
| Dividends Received Deduction | ||||
Intrepid America Fund | 58.98 | % | ||
Intrepid Growth Fund | 100.00 | |||
Intrepid Mid Cap Fund | 100.00 | |||
Intrepid Sustainable Equity Fund | 100.00 | |||
Intrepid Value Fund | 100.00 | |||
Long Term Capital Gain
Each fund listed below distributed the following amount, or maximum allowable amount, of long-term capital gain dividends for the fiscal year ended June 30, 2017 (amounts in thousands):
| Long-Term Capital Gain Distribution | ||||
Intrepid America Fund | $ | 101,892 | ||
Intrepid Mid Cap Fund | 194 | |||
Intrepid Value Fund | 22,399 | |||
Qualified Dividend Income (QDI)
Each fund listed below had the following amount, or maximum allowable amount, of ordinary income distributions treated as qualified dividends for the fiscal year ended June 30, 2017 (amounts in thousands):
| Qualified Dividend Income | ||||
Intrepid America Fund | $ | 52,470 | ||
Intrepid Growth Fund | 9,445 | |||
Intrepid Mid Cap Fund | 4,358 | |||
Intrepid Sustainable Equity Fund | 147 | |||
Intrepid Value Fund | 20,876 | |||
| JUNE 30, 2017 | J.P. MORGAN INTREPID FUNDS | 73 | ||||||
Table of Contents

Rev. January 2011
| FACTS | WHAT DOES J.P. MORGAN FUNDS DO WITH YOUR PERSONAL INFORMATION? |
| Why? | Financial companies choose how they share your personal information. Federal law gives consumers the right to limit some but not all sharing. Federal law also requires us to tell you how we collect, share, and protect your personal information. Please read this notice carefully to understand what we do. |
| What? | The types of personal information we collect and share depend on the product or service you have with us. This information can include:
◾ Social Security number and account balances
◾ transaction history and account transactions
◾ checking account information and wire transfer instructions
When you are no longer our customer, we continue to share your information as described in this notice. |
| How? | All financial companies need to share customers’ personal information to run their everyday business. In the section below, we list the reasons financial companies can share their customers’ personal information; the reasons J.P. Morgan Funds chooses to share; and whether you can limit this sharing. |
| Reasons we can share your personal information | Does J.P. Morgan Funds share? | Can you limit this sharing? | ||
For our everyday business purposes — such as to process your transactions, maintain your account(s), respond to court orders and legal investigations, or report to credit bureaus | Yes | No | ||
For marketing purposes — to offer our products and services to you | Yes | No | ||
| For joint marketing with other financial companies | No | We don’t share | ||
For our affiliates’ everyday business purposes — information about your transactions and experiences | No | We don’t share | ||
For our affiliates’ everyday business purposes — information about your creditworthiness | No | We don’t share | ||
| For nonaffiliates to market to you | No | We don’t share |
| Questions? | Call 1-800-480-4111 or go to www.jpmorganfunds.com | |

Table of Contents
Page 2 |
| Who we are | ||
| Who is providing this notice? | J.P. Morgan Funds | |
| What we do | ||
| How does J.P. Morgan Funds protect my personal information? | To protect your personal information from unauthorized access and use, we use security measures that comply with federal law. These measures include computer safeguards and secured files and buildings. We authorize our employees to access your information only when they need it to do their work and we require companies that work for us to protect your information. | |
How does J.P. Morgan Funds collect my personal information? | We collect your personal information, for example, when you:
◾ open an account or provide contact information
◾ give us your account information or pay us by check
◾ make a wire transfer
We also collect your personal information from others, such as credit bureaus, affiliates and other companies. | |
| Why can’t I limit all sharing? | Federal law gives you the right to limit only
◾ sharing for affiliates’ everyday business purposes – information about your creditworthiness
◾ affiliates from using your information to market to you
◾ sharing for nonaffiliates to market to you
State laws and individual companies may give you additional rights to limit sharing. | |
| Definitions | ||
| Affiliates | Companies related by common ownership or control. They can be financial and nonfinancial companies.
◾ J.P. Morgan Funds does not share with our affiliates. | |
| Nonaffiliates | Companies not related by common ownership or control. They can be financial and nonfinancial companies.
◾ J.P. Morgan Funds does not share with nonaffiliates so they can market to you. | |
| Joint Marketing | A formal agreement between nonaffiliated financial companies that together market financial products or services to you.
◾ J.P. Morgan Funds doesn’t jointly market. | |
Table of Contents
J.P. Morgan Funds are distributed by JPMorgan Distribution Services, Inc., which is an affiliate of JPMorgan Chase & Co. Affiliates of JPMorgan Chase & Co. receive fees for providing various services to the funds.
Contact JPMorgan Distribution Services, Inc. at 1-800-480-4111 for a fund prospectus. You can also visit us at www.jpmorganfunds.com. Investors should carefully consider the investment objectives and risk as well as charges and expenses of the mutual fund before investing. The prospectus contains this and other information about the mutual fund. Read the prospectus carefully before investing.
Investors may obtain information about the Securities Investor Protection Corporation (SIPC), including the SIPC brochure by visiting www.sipc.org or by calling SIPC at 202-371-8300.
Each Fund files a complete schedule of its fund holdings for the first and third quarters of its fiscal year with the SEC on Form N-Q. The Funds’ Forms N-Q are available on the SEC’s website at http://www.sec.gov and may be reviewed and copied at the SEC’s Public Reference Room in Washington, DC. Information on the operation of the SEC’s Public Reference Room may be obtained by calling 1-800-SEC-0330. Shareholders may request the Form N-Q without charge by calling 1-800-480-4111 or by visiting the J.P. Morgan Funds’ website at www.jpmorganfunds.com.
A description of each Fund’s policies and procedures with respect to the disclosure of each Fund’s holdings is available in the prospectus and Statement of Additional Information.
A copy of proxy policies and procedures is available without charge upon request by calling 1-800-480-4111 and on the Funds’ website at www.jpmorganfunds.com. A description of such policies and procedures is on the SEC’s website at www.sec.gov. The Trustees have delegated the authority to vote proxies for securities owned by the Funds to the Adviser. A copy of the Funds’ voting record for the most recent 12-month period ended June 30 is available on the SEC’s website at www.sec.gov or at the Funds’ website at www.jpmorganfunds.com no later than August 31 of each year. The Funds’ proxy voting record will include, among other things, a brief description of the matter voted on for each fund security, and will state how each vote was cast, for example, for or against the proposal.
Table of Contents

J.P. Morgan Asset Management is the marketing name for the asset management businesses of JPMorgan Chase & Co. Those businesses include, but are not limited to, J.P. Morgan Investment Management Inc., Security Capital Research & Management Incorporated and J.P. Morgan Alternative Asset Management, Inc.
| © JPMorgan Chase & Co., 2017. All rights reserved. June 2017. | AN-INT-617 |
Table of Contents
ITEM 2. CODE OF ETHICS.
Disclose whether, as of the end of the period covered by the report, the registrant has adopted a code of ethics that applies to the registrant’s principal executive officer, principal financial officer, principal accounting officer or controller, or persons performing similar functions, regardless of whether these individuals are employed by the registrant or a third party. If the registrant has not adopted such a code of ethics, explain why it has not done so.
The registrant must briefly describe the nature of any amendment, during the period covered by the report, to a provision of its code of ethics that applies to the registrant’s principal executive officer, principal financial officer, principal accounting officer or controller, or persons performing similar functions, regardless of whether these individuals are employed by the registrant or a third party, and that relates to any element of the code of ethics definition enumerated in paragraph (b) of this Item. The registrant must file a copy of any such amendment as an exhibit pursuant to Item 12(a)(1), unless the registrant has elected to satisfy paragraph (f) of this Item by positing its code of ethics on its website pursuant to paragraph (f)(2) of this Item, or by undertaking to provide its code of ethics to any person without charge, upon request, pursuant to paragraph (f)(3) of this Item.
If the registrant has, during the period covered by the report, granted a waiver, including an implicit waiver, from a provision of the code of ethics that applies to the registrant’s principal executive officer, principal financial officer, principal accounting officer or controller, or persons performing similar functions, regardless of whether these individuals are employed by the registrant or third party, that relates to one or more items set forth in paragraph (b) of this Item, the registrant must briefly describe the nature of the waiver, the name of the person to whom the waiver was granted, and the date of the waiver.
The Registrant has adopted a code of ethics that applies to the Registrant’s principal executive officer and principal financial officer. There were no amendments to the code of ethics or waivers granted with respect to the code of ethics in the period covered by the report.
ITEM 3. AUDIT COMMITTEE FINANCIAL EXPERT.
(a) (1) Disclose that the registrant’s board of directors has determined that the registrant either:
(i) Has at least one audit committee financial expert serving on its audit committee; or
(ii) Does not have an audit committee financial expert serving on its audit committee.
The Registrant’s Board of Trustees has determined that the Registrant has at least one audit committee financial expert serving on its audit committee. The Securities and Exchange Commission has stated that the designation or identification of a person as an audit committee financial expert pursuant to this Item 3 of Form N-CSR does not impose on such person any duties, obligations or liabilities that are greater than the duties, obligations and liabilities imposed on such person as a member of the Audit Committee and the Board of Trustees in the absence of such designation or identification.
(2) If the registrant provides the disclosure required by paragraph (a)(1)(i) of this Item, it must disclose the name of the audit committee financial expert and whether that person is “independent.” In order to be considered “independent” for purposes of this Item, a member of an audit committee may not, other than in his or her capacity as a member of the audit committee, the board of directors, or any other board committee:
(i) Accept directly or indirectly any consulting, advisory, or other compensatory fee from the issuer; or
(ii) Be an “interested person” of the investment company as defined in Section 2(a)(19) of the Act (15 U.S.C. 80a-2(a)(19)).
The audit committee financial expert is James Schonbachler. He is not an “interested person” of the Registrant and is also “independent” as defined by the U.S. Securities and Exchange Commission for purposes of audit committee financial expert determinations.
(3) If the registrant provides the disclosure required by paragraph (a)(1)(ii) of this Item, it must explain why it does not have an audit committee financial expert.
Not applicable.
Table of Contents
ITEM 4. PRINCIPAL ACCOUNTANT FEES AND SERVICES.
(a) Disclose, under the caption Audit Fees, the aggregate fees billed for each of the last two fiscal years for professional services rendered by the principal accountant for the audit of the registrant’s annual financial statements or services that are normally provided by the accountant in connection with statutory and regulatory filings or engagements for those fiscal years.
AUDIT FEES
2017 – $411,344
2016 – $404,260
(b) Disclose, under the caption Audit-Related Fees, the aggregate fees billed in each of the last two fiscal years for assurance and related services by the principal accountant that are reasonably related to the performance of the audit of the registrant’s financial statements and are not reported under paragraph (a) of this Item. Registrants shall describe the nature of the services comprising the fees disclosed under this category.
AUDIT-RELATED FEES
2017 – $57,800
2016 – $56,400
Audit-related fees consists of semi-annual financial statement reviews and security count procedures performed as required under Rule 17f-2 of the Investment Company Act of 1940 during the Registrant’s fiscal year.
(c) Disclose, under the caption Tax Fees, the aggregate fees billed in each of the last two fiscal years for professional services rendered by the principal accountant for tax compliance, tax advice, and tax planning. Registrants shall describe the nature of the services comprising the fees disclosed under this category.
TAX FEES
2017 – $151,461
2016 – $148,190
The tax fees consist of fees billed in connection with preparing the federal regulated investment company income tax returns for the Registrant for the tax years ended June 30, 2017 and 2016, respectively.
For the last fiscal year, no tax fees were required to be approved pursuant to paragraph (c)(7)(ii) of Rule 2-01 of Regulation S-X.
(d) Disclose, under the caption All Other Fees, the aggregate fees billed in each of the last two fiscal years for products and services provided by the principal accountant, other than the services reported in paragraphs (a) through (c) of this Item. Registrants shall describe the nature of the services comprising the fees disclosed under this category.
ALL OTHER FEES
2017 – Not applicable
2016 – Not applicable
(e) (1) Disclose the audit committee’s pre-approval policies and procedures described in paragraph (c)(7) of Rule 2-01 of Regulation S-X.
Pursuant to the Registrant’s Audit Committee Charter and written policies and procedures for the pre-approval of audit and non-audit services (the “Pre-approval Policy”), the Audit Committee pre-approves all audit and non-audit services performed by the Registrant’s independent public registered accounting firm for the Registrant. In addition, the Audit Committee pre-approves the auditor’s engagement for non-audit services with the Registrant’s investment adviser (not including a sub-adviser whose role is primarily portfolio management and is sub-contracted or overseen by another investment adviser) and any Service Affiliate in accordance with paragraph (c)(7)(ii) of Rule 2-01 of Regulation S-X, if the engagement relates directly to the operations and financial reporting of the Registrant. Proposed services may be pre-approved either 1) without consideration of specific case-by-case services or 2) require the specific pre-approval of the Audit Committee. Therefore, initially the Pre-approval Policy listed a number of audit and non-audit services that have been approved by the Audit Committee, or which were not subject to pre-approval under the transition provisions of Sarbanes-Oxley Act of 2002 (the “Pre-approval List”). The Audit Committee annually reviews and pre-approves the services included on the Pre-approval List that may be provided by the independent public registered accounting firm without obtaining additional specific pre-approval of individual services from the Audit Committee. The Audit Committee adds to, or subtracts from, the list of general pre-approved services from time to time, based on subsequent determinations. All other audit and non-audit services not on the Pre-approval List must be specifically pre-approved by the Audit Committee.
Table of Contents
One or more members of the Audit Committee may be appointed as the Committee’s delegate for the purposes of considering whether to approve such services. Any pre-approvals granted by the delegate will be reported, for informational purposes only, to the Audit Committee at its next scheduled meeting. The Audit Committee’s responsibilities to pre-approve services performed by the independent public registered accounting firm are not delegated to management.
(2) Disclose the percentage of services described in each of paragraphs (b) through (d) of this Item that were approved by the audit committee pursuant to paragraph (c)(7)(i)(C) of Rule 2-01 of Regulation S-X.
2017 – 0.0%
2016 – 0.0%
(f) If greater than 50 percent, disclose the percentage of hours expended on the principal accountant’s engagement to audit the registrant’s financial statements for the most recent fiscal year that were attributed to work performed by persons other than the principal accountant’s full-time, permanent employees.
Not applicable – Less than 50%.
(g) Disclose the aggregate non-audit fees billed by the registrant’s accountant for services rendered to the registrant, and rendered to the registrant’s investment adviser (not including any sub-adviser whose role is primarily portfolio management and is subcontracted with or overseen by another investment adviser), and any entity controlling, controlled by, or under common control with the adviser that provides ongoing services to the registrant for each of the last two fiscal years of the registrant.
The aggregate non-audit fees billed by the independent registered public accounting firm for services rendered to the Registrant, and rendered to Service Affiliates, for the last two calendar year ends were:
2016 – $28.5 million
2015 – $29.4 million
(h) Disclose whether the registrant’s audit committee of the board of directors has considered whether the provision of non-audit services that were rendered to the registrant’s investment adviser (not including any subadviser whose role is primarily portfolio management and is subcontracted with or overseen by another investment adviser), and any entity controlling, controlled by, or under common control with the investment adviser that provides ongoing services to the registrant that were not pre-approved pursuant to paragraph (c)(7)(ii) of Rule 2-01 of Regulation S-X is compatible with maintaining the principal accountant’s independence.
The Registrant’s Audit Committee has considered whether the provision of the non-audit services that were rendered to Service Affiliates that were not pre-approved (not requiring pre-approval) is compatible with maintaining the independent public registered accounting firm’s independence. All services provided by the independent public registered accounting firm to the Registrant or to Service Affiliates that were required to be pre-approved were pre-approved as required.
ITEM 5. AUDIT COMMITTEE OF LISTED REGISTRANTS.
(a) If the registrant is a listed issuer as defined in Rule 10A-3 under the Exchange Act (17CFR 240.10A-3), state whether or not the registrant has a separately-designated standing audit committee established in accordance with Section 3(a)(58)(A) of the Exchange Act (15 U.S.C. 78c(a)(58)(A)). If the registrant has such a committee, however designated, identify each committee member. If the entire board of directors is acting as the registrant’s audit committee as specified in Section 3(a)(58)(B) of the Exchange Act (15 U.S.C. 78c(a)(58)(B)), so state.
(b) If applicable, provide the disclosure required by Rule 10A-3(d) under the Exchange Act (17CFR 240.10A-3(d)) regarding an exemption from the listing standards for all audit committees.
Not applicable.
Table of Contents
ITEM 6. SCHEDULE OF INVESTMENTS.
File Schedule I – Investments in securities of unaffiliated issuers as of the close of the reporting period as set forth in Section 210.12-12 of Regulation S-X, unless the schedule is included as part of the report to shareholders filed under Item 1 of this Form.
Included in Item 1.
ITEM 7. DISCLOSURE OF PROXY VOTING POLICIES AND PROCEDURES FOR CLOSED-END MANAGEMENT INVESTMENT COMPANIES.
A closed-end management investment company that is filing an annual report on this Form N-CSR must, unless it invests exclusively in non-voting securities, describe the policies and procedures that it uses to determine how to vote proxies relating to portfolio securities, including the procedures that the company uses when a vote presents a conflict between the interests of its shareholders, on the one hand, and those of the company’s investment adviser; principal underwriter; or any affiliated person (as defined in Section 2(a)(3) of the Investment Company Act of 1940 (15 U.S.C. 80a-2(a)(3)) and the rules thereunder) of the company, its investment adviser, or its principal underwriter, on the other. Include any policies and procedures of the company’s investment adviser, or any other third party, that the company uses, or that are used on the company’s behalf, to determine how to vote proxies relating to portfolio securities.
Not applicable.
ITEM 8. PORTFOLIO MANAGERS OF CLOSED-END MANAGEMENT INVESTMENT COMPANIES.
Not applicable.
ITEM 9. PURCHASE OF EQUITY SECURITIES BY CLOSED-END MANAGEMENT INVESTMENT COMPANY AND AFFILIATED PURCHASERS.
(a) If the registrant is a closed-end management investment company, provide the information specified in paragraph (b) of this Item with respect to any purchase made by or on behalf of the registrant or any “affiliated purchaser,” as defined in Rule 10b-18(a)(3) under the Exchange Act (17 CFR 240.10b-18(a)(3)), of shares or other units of any class of the registrant’s equity securities that is registered by the registrant pursuant to Section 12 of the Exchange Act (15 U.S.C. 781).
Not applicable.
ITEM 10. SUBMISSION OF MATTERS TO A VOTE OF SECURITY HOLDERS.
Describe any material changes to the procedures by which shareholders may recommend nominees to the registrant’s board of directors, where those changes were implemented after the registrant last provided disclosure in response to the requirements of Item 7(d)(2)(ii)(G) of Schedule 14A (17 CFR 240.14a-101), or this Item.
No material changes to report.
ITEM 11. CONTROLS AND PROCEDURES.
(a) Disclose the conclusions of the registrant’s principal executive and principal financial officers, or persons performing similar functions, regarding the effectiveness of the registrant’s disclosure controls and procedures (as defined in Rule 30a-3(c) under the Act (17 CFR 270.30a-3(c))) as of a date within 90 days of the filing date of the report that includes the disclosure required by this paragraph, based on the evaluation of these controls and procedures required by Rule 30a-3(b) under the Act (17 CFR 270.30a-3(b)) and Rules 13a-15(b) or 15d-15(b) under the Exchange Act (17 CFR 240.13a-15(b) or 240.15d-15(b)).
The Registrant’s principal executive and principal financial officers have concluded, based on their evaluation of the Registrant’s disclosure controls and procedures as of a date within 90 days of the filing date of this report, that the Registrant’s disclosure controls and procedures are reasonably designed to ensure that information required to be disclosed by the Registrant on Form N-CSR is recorded, processed, summarized and reported within the required time periods and that information required to be disclosed by the Registrant in the reports that it files or submits on Form N-CSR is accumulated and communicated to the Registrant’s management, including its principal executive and principal financial officers, as appropriate to allow timely decisions regarding required disclosure.
Table of Contents
(b) Disclose any change in the registrant’s internal control over financial reporting (as defined in Rule 30a-3(d) under the Act (17 CFR 270.30a-3(d)) that occurred during the registrant’s second fiscal quarter of the period covered by this report that has materially affected, or is reasonably likely to materially affect, the registrant’s internal control over financial reporting.
There were no changes in the Registrant’s internal control over financial reporting that occurred during the last fiscal quarter covered by this report that have materially affected, or are reasonably likely to materially affect, the Registrant’s internal control over financial reporting.
ITEM 12. EXHIBITS.
(a) File the exhibits listed below as part of this Form. Letter or number the exhibits in the sequence indicated.
(a)(1) Any code of ethics, or amendment thereto, that is the subject of the disclosure required by Item 2, to the extent that the registrant intends to satisfy the Item 2 requirements through filing of an exhibit.
Code of Ethics applicable to its Principal Executive and Principal Financial Officers pursuant to Section 406 of the Sarbanes-Oxley Act of 2002 attached hereto.
(a)(2) A separate certification for each principal executive officer and principal financial officer of the registrant as required by Rule 30a-2(a) under the Act (17 CFR 270.30a-2).
Certifications pursuant to Rule 30a-2(a) under the Investment Company Act of 1940 are attached hereto.
(a)(3) Any written solicitation to purchase securities under Rule 23c-1 under the Act (17 CFR 270.23c-1) sent or given during the period covered by the report by or on behalf of the registrant to 10 or more persons.
Not applicable.
(b) A separate or combined certification for each principal executive officer and principal officer of the registrant as required by Rule 30a-2(b) under the Act of 1940.
Certifications pursuant to Rule 30a-2(b) under the Investment Company Act of 1940 are attached hereto.
Table of Contents
SIGNATURES
Pursuant to the requirements of the Securities Exchange Act of 1934 and the Investment Company Act of 1940, the registrant has duly caused this report to be signed on its behalf by the undersigned, thereunto duly authorized.
| JPMorgan Trust II | ||
| By: | /s/ Brian S. Shlissel | |
| Brian S. Shlissel | ||
| President and Principal Executive Officer | ||
| September 1, 2017 | ||
Pursuant to the requirements of the Securities Exchange Act of 1934 and the Investment Company Act of 1940, this report has been signed below by the following persons on behalf of the registrant and in the capacities and on the dates indicated.
| By: | /s/ Brian S. Shlissel | |
| Brian S. Shlissel | ||
| President and Principal Executive Officer | ||
| September 1, 2017 | ||
| By: | /s/ Laura M. Del Prato | |
| Laura M. Del Prato | ||
| Treasurer and Principal Financial Officer | ||
| September 1, 2017 | ||