Table of Contents
UNITED STATES
SECURITIES AND EXCHANGE COMMISSION
Washington, D.C. 20549
FORM N-CSR
CERTIFIED SHAREHOLDER REPORT OF REGISTERED
MANAGEMENT INVESTMENT COMPANIES
Investment Company Act file number: 811-04236
JPMorgan Trust II
(Exact name of registrant as specified in charter)
270 Park Avenue
New York, NY 10017
(Address of principal executive offices) (Zip code)
Frank J. Nasta
270 Park Avenue
New York, NY 10017
(Name and Address of Agent for Service)
Registrant’s telephone number, including area code: (800) 480-4111
Date of fiscal year end: October 31
Date of reporting period: November 1, 2016 through October 31, 2017
Form N-CSR is to be used by management investment companies to file reports with the Commission not later than 10 days after the transmission to stockholders of any report that is required to be transmitted to stockholders under Rule 30e-1 under the Investment Company Act of 1940 (17 CFR 270.30e-1). The Commission may use the information provided on Form N-CSR in its regulatory, disclosure review, inspection, and policymaking roles.
A registrant is required to disclose the information specified by Form N-CSR, and the Commission will make this information public. A registrant is not required to respond to the collection of information contained in Form N-CSR unless the Form displays a currently valid Office of Management and Budget (“OMB”) control number. Please direct comments concerning the accuracy of the information collection burden estimate and any suggestions for reducing the burden to Secretary, Securities and Exchange Commission, 450 Fifth Street, NW, Washington, DC 20549-0609. The OMB has reviewed this collection of information under the clearance requirements of 44 U.S.C. Section 3507.
Table of Contents
| ITEM 1. | REPORTS TO STOCKHOLDERS. |
The following is a copy of the report transmitted to shareholders pursuant to Rule 30e-1 under the Investment Company Act of 1940 (17 CFR 270.30e-1).
Table of Contents
Annual Report
J.P. Morgan International Equity Funds
October 31, 2017
JPMorgan Emerging Economies Fund
JPMorgan Emerging Markets Equity Fund
JPMorgan Global Research Enhanced Index Fund
JPMorgan Global Unconstrained Equity Fund
JPMorgan International Equity Fund
JPMorgan International Equity Income Fund
JPMorgan International Research Enhanced Equity Fund
JPMorgan International Unconstrained Equity Fund
JPMorgan International Value Fund
JPMorgan Intrepid International Fund

Table of Contents
Investments in a Fund are not deposits or obligations of, or guaranteed or endorsed by, any bank and are not insured or guaranteed by the FDIC, the Federal Reserve Board or any other government agency. You could lose money if you sell when a Fund’s share price is lower than when you invested.
Past performance is no guarantee of future performance. The general market views expressed in this report are opinions based on market and other conditions through the end of the reporting period and are subject to change without notice. These views are not intended to predict the future performance of a Fund or the securities markets. References to specific securities and their issuers are for illustrative purposes only and are not intended to be, and should not be interpreted as, recommendations to purchase or sell such securities. Such views are not meant as investment advice and may not be relied on as an indication of trading intent on behalf of any Fund.
Prospective investors should refer to the Funds’ prospectuses for a discussion of the Funds’ investment objectives, strategies and risks. Call J.P. Morgan Funds Service Center at 1-800-480-4111 for a prospectus containing more complete information about a Fund, including management fees and other expenses. Please read it carefully before investing.
Table of Contents
December 8, 2017 (Unaudited)
Dear Shareholder,
Global economic growth accelerated through the twelve months ended October 31, 2017, generally driving both asset prices and corporate profits to higher ground. Overall, financial markets provided positive returns and investor sentiment appeared to be largely immune to both intermittent and ongoing geo-political tensions.
 |
“Globally, improvement in business and consumer confidence underpinned increases in business investment, trade and industrial output during the reporting period.” — George C.W. Gatch |
Economic data in the U.S., the European Union (EU) and the U.K. were sufficiently strong enough that each of their respective central banks began to move away from monetary stimulus and toward more normalized monetary policies. During the reporting period, the U.S. Federal Reserve raised interest rates three times and began to unwind its balance sheet of assets purchased under its Quantitative Easing program. In October 2017, the European Central Bank announced it would cut its own asset purchasing program by half to 30 billion euros a month, starting in January 2018. Subsequent to the end of the reporting period, the Bank of England raised its benchmark interest rate for the first time in a decade.
Meanwhile, global demand for goods and services, combined with historically low interest rates and stable oil prices drove robust growth in corporate earnings, particularly in the U.S., Europe and Asia.
In the U.S., third quarter 2017 gross domestic product (GDP) rose by 3.3%, the largest increase in two years. Meanwhile, the U.S. unemployment rate fell to 4.1% from 4.8% during the twelve month reporting period. Corporate earnings surged higher in the second half of the reporting period and business investment in new equipment and facilities grew amid a weakening U.S. dollar and synchronized global economic growth. U.S. consumer confidence stood at its highest level in nearly 17 years at the end of October 2017.
While powerful hurricanes struck Texas, Florida and then Puerto Rico late in the reporting period, economic data showed little lasting impact on the broader U.S. economy. Similarly, while geo-political events led to brief spikes in financial market volatility — in early November 2016 at the election victory of President Donald Trump and in late August 2017 amid rising military tensions between the U.S. and North Korea — there appeared to be little long-term effect on asset prices. Throughout the reporting period, leading equity market indexes reached fresh highs and for the twelve months ended
October 31, 2017, the Standard & Poor’s 500 Index returned 23.6%.
In the EU, business and consumer sentiment in October 2017 reached their highest levels since early 2001. Corporate profits rose on improving global demand and unemployment across the EU fell to 8.8% in October 2017, its lowest level since early 2009. GDP rose to 2.6% in the third quarter of 2017 from 1.9% in the fourth quarter of 2016. Despite a range of political uncertainties across Europe — including the U.K.’s planned exit from EU, a Catalan separatist movement in Spain and a challenge to EU legal and immigration policies from populist political parties in Poland, Hungary and Austria — for the twelve month reporting period, the MSCI Europe, Australasia and Far East Index (net of foreign withholding taxes) returned 24.0%.
The economies of most emerging market nations continued to expand with the rest of the global economy and emerging market equities generally outperformed equities in the U.S. and other developed markets. Global economic growth led to accelerated export growth in China during the reporting period, which allowed policymakers to reduce their reliance on debt financing and fixed asset investment. China’s GDP growth remained at 6.9% for the first half of 2017 and slowed to 6.8% in the third quarter of 2017 amid government efforts to curb financial speculation in the domestic real estate market and reduce corporate borrowing. For the twelve month reporting period, the MSCI Emerging Markets Index (net of foreign withholding taxes) returned 26.9%.
Globally, improvement in business and consumer confidence underpinned increases in business investment, trade and industrial output during the reporting period. By October 2017, the International Monetary Fund lifted its forecast for global economic growth by 0.1% to 3.6% for the full year 2017 and 3.7% for 2018. Amid the global economic expansion, there remain challenges as investors adapt to changes in central bank policies and face geo-political events. Against this backdrop, we believe the best-positioned investors are those who remain fully invested, properly diversified and patient.
We look forward to managing your investment needs for years to come. Should you have any questions, please visit www.jpmorganfunds.com or contact the J.P. Morgan Funds Service Center at 1-800-480-4111.
Sincerely yours,

George C.W. Gatch
CEO, Global Funds Management
J.P. Morgan Asset Management
| OCTOBER 31, 2017 | J.P. MORGAN INTERNATIONAL EQUITY FUNDS | 1 | ||||||
Table of Contents
J.P. Morgan International Equity Funds
TWELVE MONTHS ENDED OCTOBER 31, 2017 (Unaudited)
Global financial markets overall provided positive returns during the reporting period, with emerging market equities outperforming equities in the U.S. and other developed markets. The world’s leading economies continued to expand throughout the first ten months of 2017, lifting corporate profits and capital investment as well as business and consumer sentiment. Low interest rates generally weighed on developed market bond prices, while investors’ search for higher yields helped push prices higher for emerging market bonds.
Synchronized global growth and industrial demand helped to lift commodities prices, particularly for copper and other metals, toward the end of the reporting period. While global oil prices declined in the early part of the reporting period, prices for benchmark Brent crude oil remained above $50 dollars a barrel through October 2017.
In the U.S., equities prices reached record highs throughout the twelve month reporting period and the Standard & Poor’s 500 Index hit fresh highs in 11 of the 22 trading days in October 2017.
In Europe, financial markets continued to benefit from global growth, low interest rates and stimulus from the European Central Bank. Demand from China and other emerging market nations helped to lift exports from Germany and other leading European Union (EU) economies. While the U.K.’s impending exit from the EU and a separatist movement in Spain’s Catalan region remained worrisome for politicians and economists, financial markets appeared to be largely unaffected. Japan’s equities market was a leading performer during the final months of the reporting period amid an improving economy and an election that handed Prime Minister Shinzo Abe’s Liberal Democratic Party a parliamentary majority.
In China, government efforts to curb speculation in its financial markets helped to keep market volatility in check, while economic indicators showed continued strong growth. Global economic growth and low interest rates continued to benefit both equities and bonds in emerging market nations.
For the twelve months ended October 31, 2017, the MSCI Europe Australasia and Far East Index (net of foreign withholding taxes) returned 24.01% and the MSCI Emerging Markets Index (net of foreign withholding taxes) returned 26.91%.
| 2 | J.P. MORGAN INTERNATIONAL EQUITY FUNDS | OCTOBER 31, 2017 | ||||
Table of Contents
JPMorgan Emerging Economies Fund
TWELVE MONTHS ENDED OCTOBER 31, 2017 (Unaudited)
| REPORTING PERIOD RETURN: | ||||
| Fund (Class I Shares)1,* | 29.61% | |||
| Morgan Stanley Capital International (“MSCI”) Emerging Markets Index (net of foreign withholding taxes) | 26.45% | |||
| Net Assets as of 10/31/2017 (In Thousands) | $2,037,695 | |||
INVESTMENT OBJECTIVE**
The JPMorgan Emerging Economies Fund (the “Fund”) seeks long-term capital growth.
WHAT WERE THE MAIN DRIVERS OF THE FUND’S PERFORMANCE?
The Fund’s Class I Shares outperformed the MSCI Emerging Markets Index (net of foreign withholding taxes) (the “Benchmark”) for the twelve months ended October 31, 2017.
The Fund’s security selection in the materials and energy sectors was a leading contributor to performance relative to the Benchmark. The Fund’s security selection and overweight position in the utilities sector and its security selection in the real estate sector were leading detractors from relative performance.
Leading individual contributors to relative performance included the Fund’s overweight positions in Geely Automobile Holdings Ltd., BYD Electronic (International) Co. and AAC Technologies Holdings Inc. Shares of Geely Automobile Holdings, the Chinese parent company of Volvo Car Group, rose amid sales and earnings growth during the reporting period. Shares of BYD Electronic, a Chinese maker of smartphone handsets that was not held in the Benchmark, rose after the company reported earnings and sales growth for the first half of its fiscal year. Shares of AAC Technologies Holdings, a Chinese maker of acoustical components for consumer electronics, rose on expectations for continued growth in smartphone sales.
Leading individual detractors from relative performance included the Fund’s underweight positions in Samsung Electronics Co., Tencent Holdings Ltd. and Alibaba Group Holding
Ltd. Shares of Samsung Electronics, a South Korean consumer electronics manufacturer, rose amid continued earnings growth during the reporting period. Shares of Tencent Holdings, a Chinese Internet services company, rose as the company reported better-than-expected earnings during the reporting period. Shares of Alibaba Group Holding, an Internet shopping provider, rose amid continued growth in the company’s sales and earnings.
HOW WAS THE FUND POSITIONED?
The Fund’s portfolio managers used a combination of top-down and bottom-up research, seeking what they believed to be attractively priced countries, sectors and securities with positive catalysts. As a result of this process, the Fund’s largest average country exposures during the twelve months ended October 31, 2017, were to China, South Korea and Taiwan and its smallest average country exposures were to Chile, Singapore and Luxembourg. From a sector perspective, the Fund’s largest average weightings were in the financials, information technology and materials sectors, while its smallest average weightings were in the telecommunication services, health care and real estate sectors.
| 1 | On April 3, 2017, the Fund’s Select Class Shares were renamed Class I Shares. |
| * | The return shown is based on net asset values calculated for shareholder transactions and may differ from the return shown in the financial highlights, which reflects adjustments made to the net asset values in accordance with accounting principles generally accepted in the United States of America. |
| ** | The adviser seeks to achieve the Fund’s objective. There can be no guarantee it will be achieved. |
| OCTOBER 31, 2017 | J.P. MORGAN INTERNATIONAL EQUITY FUNDS | 3 | ||||||
Table of Contents
JPMorgan Emerging Economies Fund
FUND COMMENTARY
TWELVE MONTHS ENDED OCTOBER 31, 2017 (Unaudited) (continued)
| TOP TEN EQUITY HOLDINGS OF THE PORTFOLIO*** | ||||||||
| 1. | Tencent Holdings Ltd. (China) | 2.5 | % | |||||
| 2. | Samsung Electronics Co. Ltd. (South Korea) | 2.4 | ||||||
| 3. | Industrial & Commercial Bank of China Ltd., Class H (China) | 2.2 | ||||||
| 4. | Alibaba Group Holding Ltd., ADR (China) | 2.1 | ||||||
| 5. | Itau Unibanco Holding SA, ADR (Brazil) | 1.6 | ||||||
| 6. | NetEase, Inc., ADR (China) | 1.5 | ||||||
| 7. | China Construction Bank Corp., Class H (China) | 1.4 | ||||||
| 8. | Hon Hai Precision Industry Co. Ltd. (Taiwan) | 1.3 | ||||||
| 9. | Ping An Insurance Group Co. of China Ltd., Class H (China) | 1.3 | ||||||
| 10. | Largan Precision Co. Ltd. (Taiwan) | 1.3 | ||||||
PORTFOLIO COMPOSITION BY COUNTRY*** | ||||
| China | 22.8 | % | ||
| South Korea | 17.4 | |||
| Taiwan | 11.5 | |||
| Brazil | 8.9 | |||
| Russia | 7.5 | |||
| Turkey | 4.8 | |||
| Thailand | 4.0 | |||
| Hong Kong | 3.3 | |||
| Malaysia | 2.6 | |||
| India | 2.5 | |||
| Poland | 2.0 | |||
| Hungary | 1.5 | |||
| South Africa | 1.5 | |||
| Panama | 1.3 | |||
| Indonesia | 1.2 | |||
| Others (each less than 1.0%) | 3.1 | |||
| Short-Term Investment | 4.1 | |||
| *** | Percentages indicated are based on total investments as of October 31, 2017. The Fund’s portfolio composition is subject to change. |
| 4 | J.P. MORGAN INTERNATIONAL EQUITY FUNDS | OCTOBER 31, 2017 | ||||
Table of Contents
AVERAGE ANNUAL TOTAL RETURNS AS OF OCTOBER 31, 2017 | ||||||||||||||
| INCEPTION DATE OF CLASS | 1 YEAR | 5 YEAR | SINCE INCEPTION | |||||||||||
CLASS A SHARES | February 28, 2008 | |||||||||||||
With Sales Charge* | 22.49 | % | 2.81 | % | 0.67 | % | ||||||||
Without Sales Charge | 29.28 | 3.92 | 1.23 | |||||||||||
CLASS C SHARES | February 28, 2008 | |||||||||||||
With CDSC** | 27.62 | 3.41 | 0.72 | |||||||||||
Without CDSC | 28.62 | 3.41 | 0.72 | |||||||||||
CLASS I SHARES (FORMERLY SELECT CLASS SHARES) | February 28, 2008 | 29.61 | 4.19 | 1.48 | ||||||||||
CLASS R5 SHARES | February 28, 2008 | 29.89 | 4.40 | 1.68 | ||||||||||
CLASS R6 SHARES | September 1, 2015 | 29.87 | 4.42 | 1.70 | ||||||||||
| * | Sales Charge for Class A Shares is 5.25%. |
| ** | Assumes a 1% CDSC (contingent deferred sales charge) for the one year period and 0% CDSC thereafter. |
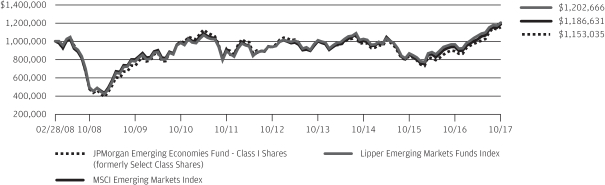
LIFE OF FUND PERFORMANCE (2/28/08 TO 10/31/17)
The performance quoted is past performance and is not a guarantee of future results. Mutual funds are subject to certain market risks. Investment returns and principal value of an investment will fluctuate so that an investor’s shares, when redeemed, may be worth more or less than their original cost. Current performance may be higher or lower than the performance data shown. For up-to-date month-end performance information please call 1-800-480-4111.
The Fund commenced operations on February 28, 2008.
Returns for Class R6 Shares prior to its inception date are based on the performance of Class R5 Shares. The actual returns for Class R6 Shares would have been different than those shown because Class R6 Shares have different expenses than Class R5 Shares.
The graph illustrates comparative performance for $1,000,000 invested in Class I Shares of the JPMorgan Emerging Economies Fund, the MSCI Emerging Markets Index and the Lipper Emerging Markets Funds Index from February 28, 2008 to October 31, 2017. The performance of the Fund assumes reinvestment of all dividends and capital gain distributions, if any, and does not include a sales charge. The performance of the MSCI Emerging Markets Index does not reflect the deduction of expenses or a sales charge associated with a mutual fund and approximates the minimum possible dividend reinvestment of the securities included in the benchmark, if applicable. The dividend is reinvested after deduction of withholding tax, applying the maximum rate to non-resident individual investors who do not benefit from double taxation treaties. The performance of the Lipper Emerging Markets Funds Index includes expenses
associated with a mutual fund, such as investment management fees. These expenses are not identical to the expenses incurred by the Fund. The MSCI Emerging Markets Index is a free float-adjusted market capitalization weighted index that is designed to measure the equity market performance of emerging markets. The Lipper Emerging Markets Funds Index is an index based on the total returns of certain mutual funds within the Fund’s designated category as determined by Lipper, Inc. Investors cannot invest directly in an index.
Class I Shares have a $1,000,000 minimum initial investment.
Fund performance may reflect the waiver of the Fund’s fees and reimbursement of expenses for certain periods since the inception date. Without these waivers and reimbursements, performance would have been lower. Also, performance shown in this section does not reflect the deduction of taxes that a shareholder would pay on Fund distributions or redemptions of Fund shares.
International investing involves a greater degree of risk and increased volatility. Changes in currency exchange rates and differences in accounting and taxation policies outside the United States can raise or lower returns. Also, some overseas markets may not be as politically and economically stable as the U.S. and other nations.
The returns shown are based on net asset values calculated for shareholder transactions and may differ from the returns shown in the financial highlights, which reflect adjustments made to the net asset values in accordance with accounting principles generally accepted in the United States of America.
| OCTOBER 31, 2017 | J.P. MORGAN INTERNATIONAL EQUITY FUNDS | 5 | ||||||
Table of Contents
JPMorgan Emerging Markets Equity Fund
FUND COMMENTARY
TWELVE MONTHS ENDED OCTOBER 31, 2017 (Unaudited)
| REPORTING PERIOD RETURN: | ||||
| Fund (Class L Shares)1,* | 27.68% | |||
| Morgan Stanley Capital International (“MSCI”) Emerging Markets Index (net of foreign withholding taxes) | 26.45% | |||
| Net Assets as of 10/31/2017 (In Thousands) | $4,447,888 | |||
INVESTMENT OBJECTIVE**
The JPMorgan Emerging Markets Equity Fund (the “Fund”) seeks to provide high total return.
WHAT WERE THE MAIN DRIVERS OF THE FUND’S PERFORMANCE?
The Fund’s Class L Shares outperformed the MSCI Emerging Markets Index (net of foreign withholding taxes) (the “Benchmark”) for the twelve months ended October 31, 2017.
By sector, the Fund’s security selection in the financials sector and its underweight position in the telecommunication services sector, where the Fund had no holdings, were leading contributors to performance relative to the Benchmark. The Fund’s security selection in the materials and information technology sectors was a leading detractor from relative performance.
By country, the Fund’s security selection in China and its underweight position in Mexico were leading contributors to relative performance, while the Fund’s security selection and overweight positions in South Africa and India were leading detractors from relative performance.
Leading individual contributors to relative performance included the Fund’s overweight positions in Tencent Holdings Inc. and Sberbank of Russia OJSC, and its underweight position in China Mobile Ltd. Shares of Tencent Holdings, a Chinese Internet services company, rose as the company reported better-than-expected earnings during the reporting period. Shares of Sberbank, a Russian bank, rose along with a general rebound in Russian equities during the reporting period. Shares of China Mobile, a telecommunications provider not held in the Fund, fell amid investor expectations for weaker earnings.
Leading individual detractors from relative performance included the Fund’s overweight positions in Magnit PJSC and Woolworths Holdings Ltd., and its underweight position in Samsung Electronics Co. Shares of Magnit, a Russian operator of retail stores, fell on weak sales growth. Shares of Woolworths Holdings, a South African supermarket chain, fell after the company reported a decline in earnings for its latest fiscal year. Shares of Samsung Electronics, a South Korean consumer electronics manufacturer, rose after the company reported strong earnings growth.
HOW WAS THE FUND POSITIONED?
The Fund’s portfolio managers employed an active strategy in which portfolio construction was focused on the highest-conviction ideas found at the security level. The Fund’s portfolio managers used bottom-up fundamental research to determine the Fund’s security weightings, researching companies in an attempt to determine their underlying value and potential for future earnings growth. As a result of this process, the Fund’s largest average sector positions during the reporting period were in the financials, information technology and consumer discretionary sectors, while the Fund’s smallest average sector positions were in the utilities, materials and health care sectors. The Fund’s largest average country positions were in China, India and South Africa and its smallest average positions were in Spain, Turkey and Papua New Guinea.
| 1 | Effective December 1, 2016, the Fund’s Institutional Class Shares were renamed Class L Shares. |
| * | The return shown is based on net asset values calculated for shareholder transactions and may differ from the return shown in the financial highlights, which reflects adjustments made to the net asset values in accordance with accounting principles generally accepted in the United States of America. |
| ** | The adviser seeks to achieve the Fund’s objective. There can be no guarantee it will be achieved. |
| 6 | J.P. MORGAN INTERNATIONAL EQUITY FUNDS | OCTOBER 31, 2017 | ||||
Table of Contents
| TOP TEN EQUITY HOLDINGS OF THE PORTFOLIO*** | ||||||||
| 1. | Tencent Holdings Ltd. (China) | 6.6 | % | |||||
| 2. | Alibaba Group Holding Ltd., ADR (China) | 5.3 | ||||||
| 3. | Taiwan Semiconductor Manufacturing Co. Ltd., ADR (Taiwan) | 4.2 | ||||||
| 4. | Samsung Electronics Co. Ltd. (South Korea) | 4.0 | ||||||
| 5. | AIA Group Ltd. (Hong Kong) | 3.7 | ||||||
| 6. | Housing Development Finance Corp. Ltd. (India) | 3.5 | ||||||
| 7. | Ping An Insurance Group Co. of China Ltd., Class H (China) | 3.4 | ||||||
| 8. | Sberbank of Russia PJSC (Russia) | 2.7 | ||||||
| 9. | Tata Consultancy Services Ltd. (India) | 2.3 | ||||||
| 10. | Bid Corp. Ltd. (South Africa) | 2.2 | ||||||
PORTFOLIO COMPOSITION BY COUNTRY*** | ||||
China | 26.0 | % | ||
India | 16.3 | |||
Brazil | 10.4 | |||
Taiwan | 7.6 | |||
Hong Kong | 6.3 | |||
South Africa | 6.2 | |||
South Korea | 5.4 | |||
Russia | 4.1 | |||
United States | 2.9 | |||
Indonesia | 2.8 | |||
Mexico | 2.2 | |||
Peru | 1.5 | |||
Argentina | 1.4 | |||
Panama | 1.1 | |||
Others (each less than 1.0%) | 2.9 | |||
Short-Term Investment | 2.9 | |||
| *** | Percentages indicated are based on total investments as of October 31, 2017. The Fund’s portfolio composition is subject to change. |
| OCTOBER 31, 2017 | J.P. MORGAN INTERNATIONAL EQUITY FUNDS | 7 | ||||||
Table of Contents
JPMorgan Emerging Markets Equity Fund
FUND COMMENTARY
TWELVE MONTHS ENDED OCTOBER 31, 2017 (Unaudited) (continued)
AVERAGE ANNUAL TOTAL RETURNS AS OF OCTOBER 31, 2017 | ||||||||||||||
| INCEPTION DATE OF CLASS | 1 YEAR | 5 YEAR | 10 YEAR | |||||||||||
CLASS A SHARES | September 28, 2001 | |||||||||||||
With Sales Charge* | 20.53 | % | 4.04 | % | 0.52 | % | ||||||||
Without Sales Charge | 27.22 | 5.17 | 1.06 | |||||||||||
CLASS C SHARES | February 28, 2006 | |||||||||||||
With CDSC** | 25.58 | 4.65 | 0.56 | |||||||||||
Without CDSC | 26.58 | 4.65 | 0.56 | |||||||||||
CLASS I SHARES (FORMERLY SELECT CLASS SHARES) | September 10, 2001 | 27.49 | 5.43 | 1.32 | ||||||||||
CLASS L SHARES (FORMERLY INSTITUTIONAL CLASS SHARES) | November 15, 1993 | 27.68 | 5.59 | 1.47 | ||||||||||
CLASS R2 SHARES | July 31, 2017 | 26.94 | 5.09 | 1.02 | ||||||||||
CLASS R3 SHARES | July 31, 2017 | 27.22 | 5.17 | 1.06 | ||||||||||
CLASS R4 SHARES | July 31, 2017 | 27.49 | 5.43 | 1.32 | ||||||||||
CLASS R5 SHARES | September 9, 2016 | 27.72 | 5.60 | 1.48 | ||||||||||
CLASS R6 SHARES | December 23, 2013 | 27.82 | 5.67 | 1.51 | ||||||||||
| * | Sales Charge for Class A Shares is 5.25%. |
| ** | Assumes a 1% CDSC (contingent deferred sales charge) for the one year period and 0% CDSC thereafter. |
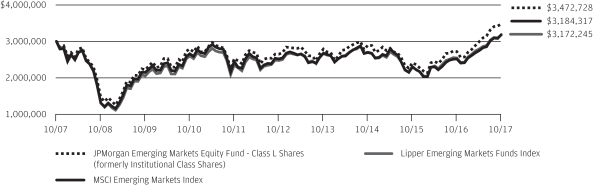
TEN YEAR PERFORMANCE (10/31/07 TO 10/31/17)
The performance quoted is past performance and is not a guarantee of future results. Mutual funds are subject to certain market risks. Investment returns and principal value of an investment will fluctuate so that an investor’s shares, when redeemed, may be worth more or less than their original cost. Current performance may be higher or lower than the performance data shown. For up-to-date month-end performance information please call 1-800-480-4111.
Returns for Class R6 Shares prior to its inception date are based on the performance of Class L Shares. The actual returns of R6 Shares would have been different than those shown because R6 Shares have different expenses than Class L Shares.
Returns for Class R5 Shares prior to its inception date are based on the performance of Class L Shares. The actual returns of Class R5 Shares would have been different than those shown because Class R5 Shares have different expenses than Class L Shares.
Returns shown for Class R2 and Class R3 prior to their inception are based on the performance of Class A Shares. The actual returns of Class R2 and Class R3 Shares would have been lower than those shown because Class R2 and Class R3 Shares have higher expenses than Class A Shares.
Returns for Class R4 Shares prior to its inception date are based on the performance of Class I Shares. The actual returns of Class R4 Shares would have been lower than those shown because Class R4 Shares have higher expenses than Class I Shares.
The graph illustrates comparative performance for $3,000,000 invested in Class L Shares of the JPMorgan Emerging Markets Equity Fund, the MSCI Emerging Markets Index and the Lipper Emerging Markets Funds Index from October 31, 2007 to October 31, 2017. The performance of the Fund assumes reinvestment of all dividends and capital gain distributions, if any, and does not include a sales charge. The performance of the MSCI Emerging Markets Index does not reflect the deduction of expenses or a sales charge associated with a mutual fund and approximates the minimum possible dividend reinvestment of the securities included in the benchmark, if applicable. The dividend is reinvested after deduction of withholding tax, applying the maximum rate to non-resident individual investors who do not benefit from double taxation treaties. The performance of the Lipper Emerging Markets Funds Index includes expenses associated with a mutual fund, such as investment management fees. These expenses are not identical to the expenses incurred by the Fund. The MSCI Emerging Markets Index is a free float-adjusted market capitalization weighted index that is designed to measure the equity market performance of emerging markets. The Lipper Emerging Markets Funds Index is an index based on the
| 8 | J.P. MORGAN INTERNATIONAL EQUITY FUNDS | OCTOBER 31, 2017 | ||||
Table of Contents
total returns of certain mutual funds within the Fund’s designated category, as determined by Lipper, Inc. Investors cannot invest directly in an index.
Class L Shares have a $3,000,000 minimum initial investment.
Fund performance may reflect the waiver of the Fund’s fees and reimbursement of expenses for certain periods since the inception date. Without these waivers and reimbursements, performance would have been lower. Also, performance shown in this section does not reflect the deduction of taxes that a shareholder would pay on Fund distributions or redemptions of Fund shares.
International investing involves a greater degree of risk and increased volatility. Changes in currency exchange rates and differences in accounting and taxation policies outside the U.S. can raise or lower returns. Also, some overseas markets may not be as politically and economically stable as the United States and other nations.
The returns shown are based on net asset values calculated for shareholder transactions and may differ from the returns shown in the financial highlights, which reflect adjustments made to the net asset values in accordance with accounting principles generally accepted in the United States of America.
| OCTOBER 31, 2017 | J.P. MORGAN INTERNATIONAL EQUITY FUNDS | 9 | ||||||
Table of Contents
JPMorgan Global Research Enhanced Index Fund
FUND COMMENTARY
TWELVE MONTHS ENDED OCTOBER 31, 2017 (Unaudited)
| REPORTING PERIOD RETURN: | ||||
| Fund (Class I Shares)1,* | 23.29% | |||
| Morgan Stanley Capital International (“MSCI”) World Index (net of foreign withholding taxes) | 22.77% | |||
| Net Assets as of 10/31/2017 (In Thousands) | $ | 8,663,460 | ||
INVESTMENT OBJECTIVE**
The JPMorgan Global Research Enhanced Index Fund (the “Fund”) seeks to provide long-term capital appreciation.
WHAT WERE THE MAIN DRIVERS OF THE FUND’S PERFORMANCE?
The Fund’s Class I Shares outperformed the MSCI World Index (net of foreign withholding taxes) (the “Benchmark”) for the twelve months ended October 31, 2017.
By sector, the Fund’s security selection in the banks-finance sector and in the technology - semiconductors sector was a leading contributor to performance relative to the Benchmark, while the Fund’s security selection in the retail and industrial cyclical sectors was a leading detractor from relative performance. By region, the Fund’s security selection in Europe and North America was the leading contributor to relative performance, while the Fund’s security selection in Japan and in the Pacific, excluding Japan, were the smallest contributors to relative performance.
Due to the Fund holding a relatively large number of securities during the period, the impact of individual holdings on the Fund’s relative performance tended to be small.
HOW WAS THE FUND POSITIONED?
The Fund sought to outperform the Benchmark over time, while seeking to achieve sector, geographic and risk characteristics similar to that of the Benchmark. Using the fundamental equity insights generated by JPMorgan’s team of analysts, the Fund’s portfolio managers took marginally overweight positions in securities that they considered undervalued, while being marginally underweight in or not holding securities in the Benchmark that they considered overvalued.
| TOP TEN EQUITY HOLDINGS OF THE PORTFOLIO*** | ||||||||
| 1. | Apple, Inc. (United States) | 2.4 | % | |||||
| 2. | Microsoft Corp. (United States) | 1.9 | ||||||
| 3. | Amazon.com, Inc. (United States) | 1.4 | ||||||
| 4. | Facebook, Inc., Class A (United States) | 1.3 | ||||||
| 5. | Alphabet, Inc., Class C (United States) | 1.0 | ||||||
| 6. | Bank of America Corp. (United States) | 1.0 | ||||||
| 7. | Alphabet, Inc., Class A (United States) | 0.9 | ||||||
| 8. | UnitedHealth Group, Inc. (United States) | 0.8 | ||||||
| 9. | Citigroup, Inc. (United States) | 0.8 | ||||||
| 10. | Visa, Inc., Class A (United States) | 0.8 | ||||||
PORTFOLIO COMPOSITION BY COUNTRY*** | ||||
| United States | 58.9 | % | ||
| Japan | 8.8 | |||
| United Kingdom | 5.7 | |||
| France | 4.3 | |||
| Germany | 3.5 | |||
| Canada | 3.3 | |||
| Switzerland | 2.8 | |||
| Australia | 2.5 | |||
| Netherlands | 2.3 | |||
| Spain | 1.4 | |||
| Hong Kong | 1.2 | |||
| Others (each less than 1.0%) | 4.1 | |||
| Short-Term Investment | 1.2 | |||
| 1 | On April 3, 2017, the Fund’s Select Class Shares were renamed Class I Shares. |
| 2 | MSCI World Index is a registered service mark of Morgan Stanley Capital International, which does not sponsor and is in no way affiliated with the Fund. |
| * | The return shown is based on net asset values calculated for shareholder transactions and may differ from the return shown in the financial highlights, which reflects adjustments made to the net asset values in accordance with accounting principles generally accepted in the United States of America. |
| ** | The adviser seeks to achieve the Fund’s objective. There can be no guarantee it will be achieved. |
| *** | Percentages indicated are based on total investments as of October 31, 2017. The Fund’s portfolio composition is subject to change. |
| 10 | J.P. MORGAN INTERNATIONAL EQUITY FUNDS | OCTOBER 31, 2017 | ||||
Table of Contents
AVERAGE ANNUAL TOTAL RETURNS AS OF OCTOBER 31, 2017 | ||||||||||||||||
| INCEPTION DATE OF CLASS | 1 YEAR | 3 YEAR | SINCE INCEPTION | |||||||||||||
CLASS I SHARES (FORMERLY SELECT CLASS SHARES) | February 28, 2013 | 23.29 | % | 8.09 | % | 10.73 | % | |||||||||
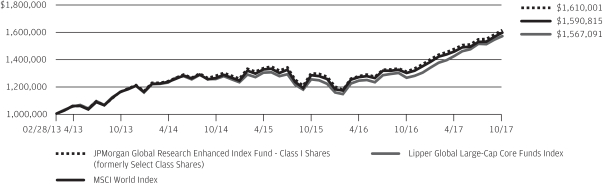
LIFE OF FUND PERFORMANCE (2/28/13 TO 10/31/17)
The performance quoted is past performance and is not a guarantee of future results. Mutual funds are subject to certain market risks. Investment returns and principal value of an investment will fluctuate so that an investor’s shares, when redeemed, may be worth more or less than their original cost. Current performance may be higher or lower than the performance data shown. For up-to-date, month-end performance information please call 1-800-480-4111.
The Fund commenced operations on February 28, 2013.
The graph illustrates comparative performance for $1,000,000 invested in Class I Shares of the JPMorgan Global Research Enhanced Index Fund, the MSCI World Index and the Lipper Global Large-Cap Core Funds Index from February 28, 2013 to October 31, 2017. The performance of the Fund assumes reinvestment of all dividends and capital gain distributions, if any, and does not include a sales charge. The performance of the MSCI World Index does not reflect the deduction of expenses or a sales charge associated with a mutual fund and has been adjusted to reflect reinvestment of all dividends and capital gain distributions of the securities included in the benchmark, if applicable. The performance of the Lipper Global Large-Cap Core Funds Index includes expenses associated with a mutual fund, such as investment management fees. These expenses are not identical to the expenses incurred by the Fund. The MSCI World Index is a free float-adjusted market capitalization weighted index that is designed to measure the equity market performance of developed markets. The Lipper Global Large-Cap Core Funds Index is an index based on the total returns of certain mutuals funds within the Fund’s designated category, as determined by Lipper, Inc. Investors cannot invest directly in an index.
Class I Shares have a $1,000,000 minimum initial investment.
Fund performance may reflect the waiver of the Fund’s fees and reimbursement of expenses for certain periods since the inception date. Without these waivers and reimbursements, performance would have been lower. Also,
performance shown in this section does not reflect the deduction of taxes that a shareholder would pay on Fund distributions or redemptions of Fund shares.
International investing involves a greater degree of risk and increased volatility. Changes in currency exchange rates and differences in accounting and taxation policies outside the U.S. can raise or lower returns. Also, some overseas markets may not be as politically and economically stable as the United States and other nations.
The returns shown are based on net asset values calculated for shareholder transactions and may differ from the returns shown in the financial highlights, which reflect adjustments made to the net asset values in accordance with accounting principles generally accepted in the United States of America.
The MSCI information may only be used for your internal use, may not be reproduced or redisseminated in any form and may not be used as a basis for or a component of any financial instruments or products or indices. None of the MSCI information is intended to constitute investment advice or a recommendation to make (or refrain from making) any kind of investment decision and may not be relied on as such. Historical data and analysis should not be taken as an indication or guarantee of any future performance analysis, forecast or prediction. The MSCI information is provided on an “as is” basis and the user of this information assumes the entire risk of any use made of this information. MSCI, each of its affiliates and each other person involved in or related to compiling, computing or creating any MSCI information (collectively, the “MSCI Parties”) expressly disclaims all warranties (including, without limitation, any warranties of originality, accuracy, completeness, timeliness, non-infringement, merchantability and fitness for a particular purpose) with respect to this information. Without limiting any of the foregoing, in no event shall any MSCI Party have any liability for any direct, indirect, special, incidental, punitive, consequential (including, without limitation, lost profits) or any other damages. (www.msci.com)
| OCTOBER 31, 2017 | J.P. MORGAN INTERNATIONAL EQUITY FUNDS | 11 | ||||||
Table of Contents
JPMorgan Global Unconstrained Equity Fund
FUND COMMENTARY
TWELVE MONTHS ENDED OCTOBER 31, 2017 (Unaudited)
| REPORTING PERIOD RETURN: | ||||
| Fund (Class I Shares)1,* | 21.88% | |||
| Morgan Stanley Capital International (“MSCI”) All Country World Index (net of foreign withholding taxes) | 23.20% | |||
| Net Assets as of 10/31/2017 (In Thousands) | $3,549 | |||
INVESTMENT OBJECTIVE**
The JPMorgan Global Unconstrained Equity Fund (the “Fund”) seeks to provide long-term capital appreciation.
WHAT WERE THE MAIN DRIVERS OF THE FUND’S PERFORMANCE?
The Fund’s Class I Shares underperformed the MSCI All Country World Index (net of foreign withholding taxes) (the “Benchmark”) for the twelve months ended October 31, 2017.
By sector, the Fund’s security selection in the health care and consumer staples sectors was a leading detractor from performance relative to the Benchmark, while the Fund’s security selection in the financials and industrials sectors was a leading positive contributor to performance.
By region, the Fund’s security selection in the U.K. and Europe was a leading detractor from performance relative to the Benchmark, while the Fund’s security selection in North America and Japan was a leading contributor to relative performance.
Leading individual detractors from the Fund’s relative performance included its overweight positions in Teva Pharmaceutical Industries Ltd., Kroger Co. and Molson Coors Brewing Co. Shares of Teva Pharmaceutical Industries, a maker of generic drugs, fell late in the reporting period after losing a drug patent lawsuit to rival Mylan NV. Shares of Kroger, a supermarket chain, fell after the company reported a decline in profit for the second quarter of 2017. Shares of Molson Coors Brewing, a beer and beverages company, fell after the company reported a decline in sales and lower-than-expected earnings for the second quarter of 2017.
Leading individual contributors to the Fund’s relative performance included its overweight positions in Time Inc., Citigroup Inc. and Harman International Industries Inc. Shares of Time, a media company that was not held in the Benchmark, rose on investor expectations of a takeover offer and the company’s efforts to restructure its business model. Shares of Citigroup, a banking and financial services company, rose on better-than-expected earnings and overall gains in the financials sector. Shares of Harman International, an auto parts manufacturer, rose ahead of its takeover by Samsung Electronics Co.
HOW WAS THE FUND POSITIONED?
The Fund’s portfolio managers and analyst team conducted bottom-up fundamental research to construct a global portfolio of what they believed were undervalued companies, characterized
by sustainability of earnings, strong free cash flow and the ability to increase earnings faster than their sector peers.
| TOP TEN EQUITY HOLDINGS OF THE PORTFOLIO*** | ||||||||
| 1. | Alphabet, Inc., Class C (United States) | 5.1 | % | |||||
| 2. | Citigroup, Inc. (United States) | 3.4 | ||||||
| 3. | Vodafone Group plc (United Kingdom) | 3.2 | ||||||
| 4. | Pioneer Natural Resources Co. (United States) | 3.1 | ||||||
| 5. | Comcast Corp., Class A (United States) | 3.1 | ||||||
| 6. | Apple, Inc. (United States) | 2.9 | ||||||
| 7. | Schneider Electric SE (France) | 2.7 | ||||||
| 8. | UnitedHealth Group, Inc. (United States) | 2.7 | ||||||
| 9. | FANUC Corp. (Japan) | 2.7 | ||||||
| 10. | Novartis AG (Registered) (Switzerland) | 2.6 | ||||||
PORTFOLIO COMPOSITION BY COUNTRY*** | ||||
| United States | 47.8 | % | ||
| China | 8.1 | |||
| Japan | 8.1 | |||
| United Kingdom | 7.2 | |||
| France | 6.0 | |||
| Switzerland | 4.7 | |||
| South Africa | 2.3 | |||
| Hong Kong | 2.3 | |||
| Germany | 2.3 | |||
| India | 2.1 | |||
| Singapore | 2.1 | |||
| Netherlands | 2.0 | |||
| Austria | 1.8 | |||
| Canada | 1.1 | |||
| Luxembourg | 1.1 | |||
| Italy | 1.0 | |||
| 1 | On April 3, 2017, the Fund’s Select Class Shares were renamed Class I Shares. |
| * | The return shown is based on net asset values calculated for shareholder transactions and may differ from the return shown in the financial highlights, which reflects adjustments made to the net asset values in accordance with accounting principles generally accepted in the United States of America. |
| ** | The adviser seeks to achieve the Fund’s objective. There can be no guarantee it will be achieved. |
| *** | Percentages indicated are based on total investments as of October 31, 2017. The Fund’s portfolio composition is subject to change. |
| 12 | J.P. MORGAN INTERNATIONAL EQUITY FUNDS | OCTOBER 31, 2017 | ||||
Table of Contents
AVERAGE ANNUAL TOTAL RETURNS AS OF OCTOBER 31, 2017 | ||||||||||||||||
| INCEPTION DATE OF CLASS | 1 YEAR | 5 YEAR | SINCE INCEPTION | |||||||||||||
CLASS A SHARES | November 30, 2011 | |||||||||||||||
With Sales Charge* | 15.03 | % | 9.34 | % | 9.85 | % | ||||||||||
Without Sales Charge | 21.39 | 10.53 | 10.85 | |||||||||||||
CLASS C SHARES | November 30, 2011 | |||||||||||||||
With CDSC** | 19.76 | 9.97 | 10.30 | |||||||||||||
Without CDSC | 20.76 | 9.97 | 10.30 | |||||||||||||
CLASS I SHARES (FORMERLY SELECT CLASS SHARES) | November 30, 2011 | 21.88 | 10.88 | 11.19 | ||||||||||||
CLASS R2 SHARES | November 30, 2011 | 21.15 | 10.26 | 10.58 | ||||||||||||
CLASS R5 SHARES | November 30, 2011 | 21.91 | 11.03 | 11.35 | ||||||||||||
CLASS R6 SHARES | November 30, 2011 | 21.99 | 11.08 | 11.41 | ||||||||||||
| * | Sales Charge for Class A Shares is 5.25%. |
| ** | Assumes a 1% CDSC (contingent deferred sales charge) for the one year period and 0% CDSC thereafter. |
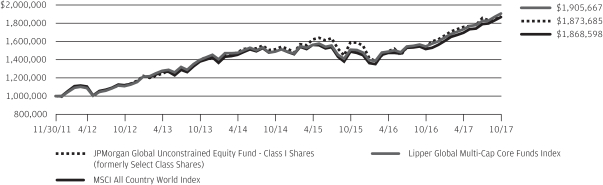
LIFE OF FUND PERFORMANCE (11/30/11 TO 10/31/17)
The performance quoted is past performance and is not a guarantee of future results. Mutual funds are subject to certain market risks. Investment returns and principal value of an investment will fluctuate so that an investor’s shares, when redeemed, may be worth more or less than their original cost. Current performance may be higher or lower than the performance data shown. For up-to-date month-end performance information please call 1-800-480-4111.
The Fund commenced operations on November 30, 2011.
The graph illustrates comparative performance for $1,000,000 invested in Class I Shares of the JPMorgan Global Unconstrained Equity Fund, the MSCI All Country World Index and the Lipper Global Multi-Cap Core Funds Index from November 30, 2011 to October 31, 2017. The performance of the Fund assumes reinvestment of all dividends and capital gain distributions, if any, and does not include a sales charge. The performance of the MSCI All Country World Index does not reflect the deduction of expenses or a sales charge associated with a mutual fund and approximates the minimum possible dividend reinvestment of the securities included in the benchmark, if applicable. The dividend is reinvested after deduction of withholding tax, applying the maximum rate to non-resident institutional investors who do not benefit from double taxation treaties. The MSCI All Country World Index is a free float-adjusted market capitalization weighted index that is designed to measure the equity market performance of developed and emerging markets. The Lipper Global Multi-Cap Core Funds Index is an index based on the total returns of certain mutual funds
within the Fund’s designated category, as determined by Lipper, Inc. Investors cannot invest directly in an index.
Class I Shares have a $1,000,000 minimum initial investment.
Subsequent to the inception date of the Fund and through January 5, 2015, the Fund did not experience any shareholder activity. If such shareholder activity had occurred, the Fund’s performance may have been impacted.
Fund performance may reflect the waiver of the Fund’s fees and reimbursement of expenses for certain periods since the inception date. Without these waivers and reimbursements, performance would have been lower. Also, performance shown in this section does not reflect the deduction of taxes that a shareholder would pay on Fund distributions or redemptions of Fund shares.
International investing involves a greater degree of risk and increased volatility. Changes in currency exchange rates and differences in accounting and taxation policies outside the U.S. can raise or lower returns. Also, some overseas markets may not be as politically and economically stable as the U.S. and other nations.
The returns shown are based on net asset values calculated for shareholder transactions and may differ from the returns shown in the financial highlights, which reflect adjustments made to the net asset values in accordance with accounting principles generally accepted in the United States of America.
| OCTOBER 31, 2017 | J.P. MORGAN INTERNATIONAL EQUITY FUNDS | 13 | ||||||
Table of Contents
JPMorgan International Equity Fund
FUND COMMENTARY
TWELVE MONTHS ENDED OCTOBER 31, 2017 (Unaudited)
| REPORTING PERIOD RETURN: | ||||
| Fund (Class I Shares)1,* | 25.69% | |||
| Morgan Stanley Capital International (“MSCI”) Europe, Australasia and Far East (“EAFE”) Index (net of foreign withholding taxes) | 23.44% | |||
| Net Assets as of 10/31/2017 (In Thousands) | $ | 4,007,091 | ||
INVESTMENT OBJECTIVE**
The JPMorgan International Equity Fund (the “Fund”) seeks total return from long-term capital growth and income. Total return consists of capital growth and current income.
WHAT WERE THE MAIN DRIVERS OF THE FUND’S PERFORMANCE?
The Fund’s Class I Shares outperformed the MSCI EAFE Index (net of foreign withholding taxes) (the “Benchmark”) for the twelve months ended October 31, 2017.
By sector, the Fund’s security selection and overweight position in the information technology sector and its security selection in the financials sector were leading contributors to performance relative to the Benchmark. The Fund’s security selection in the health care and energy sectors was a leading detractor from relative performance.
By region, the Fund’s overweight position in emerging markets and its security selection in the U.K. contributed to performance relative to the Benchmark, while the Fund’s underweight position in Europe, excluding the U.K., detracted from relative performance.
Leading individual contributors to the Fund’s relative performance included the Fund’s overweight positions in Samsung Electronics Co., Tokyo Electron Ltd. and Prudential PLC. Shares of Samsung Electronics, a South Korean consumer electronics manufacturer not held in the Benchmark, rose as the company continued to report strong earnings growth during the reporting period. Shares of Tokyo Electron, a Japanese maker of semiconductor and electronics manufacturing equipment, rose amid increased demand for its products. Shares of Prudential, a U.K. insurance and financial services company, rose after the company reported better-than-expected results from its U.S. and Asia businesses.
Leading individual detractors from the Fund’s relative performance included its overweight positions in Japan Tobacco Inc., Teva Pharmaceutical Industries Ltd. and TechnipFMC PLC. Shares of Japan Tobacco, a maker of tobacco products, fell amid investor concerns about the company’s domestic sales volume and competition for its next-generation products. Shares of Teva Pharmaceutical Industries, a maker of generic drugs, fell late in the reporting period after losing a drug patent lawsuit to rival Mylan NV. Shares of TechnipFMC, a U.K. oilfield services and engineering company not held in the Benchmark, fell amid overall weakness in the oil exploration sector.
HOW WAS THE FUND POSITIONED?
The Fund’s portfolio managers continued to focus on security selection to build a portfolio of international equities. They used bottom-up fundamental research to identify what they believed were attractively priced securities of companies with solid financial
positions that possessed the potential to increase their earnings faster than their industry peers.
| TOP TEN EQUITY HOLDINGS OF THE PORTFOLIO*** | ||||||||
| 1. | Royal Dutch Shell plc, Class A (Netherlands) | 2.4 | % | |||||
| 2. | Unilever plc (United Kingdom) | 2.2 | ||||||
| 3. | Samsung Electronics Co. Ltd., GDR (South Korea) | 2.1 | ||||||
| 4. | Prudential plc (United Kingdom) | 2.1 | ||||||
| 5. | SAP SE (Germany) | 2.0 | ||||||
| 6. | Novartis AG (Registered) (Switzerland) | 1.9 | ||||||
| 7. | BNP Paribas SA (France) | 1.8 | ||||||
| 8. | Allianz SE (Registered) (Germany) | 1.7 | ||||||
| 9. | Sumitomo Mitsui Financial Group, Inc. (Japan) | 1.7 | ||||||
| 10. | British American Tobacco plc (United Kingdom) | 1.6 | ||||||
PORTFOLIO COMPOSITION BY COUNTRY*** | ||||
Japan | 20.1 | % | ||
United Kingdom | 15.7 | |||
France | 13.3 | |||
Switzerland | 10.5 | |||
Germany | 9.9 | |||
Netherlands | 6.3 | |||
Hong Kong | 4.5 | |||
China | 3.5 | |||
South Korea | 2.7 | |||
Spain | 1.5 | |||
Sweden | 1.5 | |||
Belgium | 1.2 | |||
Singapore | 1.2 | |||
Australia | 1.2 | |||
Denmark | 1.2 | |||
India | 1.1 | |||
Taiwan | 1.1 | |||
South Africa | 1.0 | |||
Others (each less than 1.0%) | 1.9 | |||
Short-Term Investment | 0.6 | |||
| 1 | On April 3, 2017, the Fund’s Select Class Shares were renamed Class I Shares. |
| * | The return shown is based on net asset values calculated for shareholder transactions and may differ from the return shown in the financial highlights, which reflects adjustments made to the net asset values in accordance with accounting principles generally accepted in the United States of America. |
| ** | The adviser seeks to achieve the Fund’s objective. There can be no guarantee it will be achieved. |
| *** | Percentages indicated are based on total investments as of October 31, 2017. The Fund’s portfolio composition is subject to change. |
| 14 | J.P. MORGAN INTERNATIONAL EQUITY FUNDS | OCTOBER 31, 2017 | ||||
Table of Contents
AVERAGE ANNUAL TOTAL RETURNS AS OF OCTOBER 31, 2017 | ||||||||||||||
| INCEPTION DATE OF CLASS | 1 YEAR | 5 YEAR | 10 YEAR | |||||||||||
CLASS A SHARES | February 28, 2002 | |||||||||||||
With Sales Charge* | 18.84 | % | 6.26 | % | 0.95 | % | ||||||||
Without Sales Charge | 25.43 | 7.41 | 1.49 | |||||||||||
CLASS C SHARES | January 31, 2003 | |||||||||||||
With CDSC** | 23.79 | 6.87 | 0.97 | |||||||||||
Without CDSC | 24.79 | 6.87 | 0.97 | |||||||||||
CLASS I SHARES (FORMERLY SELECT CLASS SHARES) | January 1, 1997 | 25.69 | 7.69 | 1.74 | ||||||||||
CLASS R2 SHARES | November 3, 2008 | 25.12 | 7.14 | 1.25 | ||||||||||
CLASS R5 SHARES | May 15, 2006 | 25.88 | 7.89 | 1.94 | ||||||||||
CLASS R6 SHARES | November 30, 2010 | 26.04 | 7.94 | 1.97 | ||||||||||
| * | Sales Charge for Class A Shares is 5.25%. |
| ** | Assumes a 1% CDSC (contingent deferred sales charge) for the one year period and 0% CDSC thereafter. |
TEN YEAR PERFORMANCE (10/31/07 TO 10/31/17)
The performance quoted is past performance and is not a guarantee of future results. Mutual funds are subject to certain market risks. Investment returns and principal value of an investment will fluctuate so that an investor’s shares, when redeemed, may be worth more or less than their original cost. Current performance may be higher or lower than the performance data shown. For up-to-date month-end performance information please call 1-800-480-4111.
Returns for Class R2 Shares prior to its inception date are based on the performance of Class A Shares. The actual returns of R2 Shares would have been lower than those shown because R2 Shares have higher expenses than Class A Shares.
Returns for Class R6 Shares prior to its inception date are based on the performance of Class R5 Shares. The actual returns of Class R6 Shares would have been different than those shown because Class R6 Shares have different expenses than Class R5 Shares.
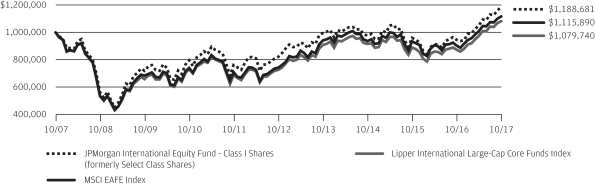
The graph illustrates comparative performance for $1,000,000 invested in Class I Shares of the JPMorgan International Equity Fund, the MSCI EAFE Index and the Lipper International Large-Cap Core Funds Index from October 31, 2007 to October 31, 2017. The performance of the Fund assumes reinvestment of all dividends and capital gain distributions, if any, and does not include a sales charge. The performance of the MSCI EAFE Index does not reflect the deduction of expenses or a sales charge associated with a mutual fund and approximates the minimum possible dividend reinvestment of the securities included in the benchmark, if applicable. The dividend is reinvested after deduction of withholding tax, applying the maximum rate to non-resident institutional investors who do not benefit from double taxation treaties. The performance of the
Lipper International Large-Cap Core Funds Index includes expenses associated with a mutual fund, such as investment management fees. These expenses are not identical to the expenses incurred by the Fund. The MSCI EAFE Index is a free float-adjusted market capitalization weighted index that is designed to measure the equity market performance of developed markets, excluding the U.S. and Canada. The Lipper International Large-Cap Core Funds Index is an index based on the total returns of certain mutual funds within the Fund’s designated category, as determined by Lipper, Inc. Investors cannot invest directly in an index.
Class I Shares have a $1,000,000 minimum initial investment.
Fund performance may reflect the waiver of the Fund’s fees and reimbursement of expenses for certain periods since the inception date. Without these waivers and reimbursements, performance would have been lower. Also, performance shown in this section does not reflect the deduction of taxes that a shareholder would pay on Fund distributions or redemptions of Fund shares.
International investing involves a greater degree of risk and increased volatility. Changes in currency exchange rates and differences in accounting and taxation policies outside the U.S. can raise or lower returns. Also, some overseas markets may not be as politically and economically stable as the United States and other nations.
The returns shown are based on net asset values calculated for shareholder transactions and may differ from the returns shown in the financial highlights, which reflect adjustments made to the net asset values in accordance with accounting principles generally accepted in the United States of America.
| OCTOBER 31, 2017 | J.P. MORGAN INTERNATIONAL EQUITY FUNDS | 15 | ||||||
Table of Contents
JPMorgan International Equity Income Fund
FUND COMMENTARY
TWELVE MONTHS ENDED OCTOBER 31, 2017 (Unaudited)
| REPORTING PERIOD RETURN: | ||||
| Fund (Class I Shares)1,* | 18.65% | |||
| Morgan Stanley Capital International (“MSCI”) Europe, Australasia and Far East (“EAFE”) Index (net of foreign withholding taxes) | 23.44% | |||
| Net Assets as of 10/31/2017 (In Thousands) | $ | 200,456 | ||
INVESTMENT OBJECTIVE
The JPMorgan International Equity Income Fund (the “Fund”) seeks to provide both current income and long-term capital appreciation.
WHAT WERE THE MAIN DRIVERS OF THE FUND’S PERFORMANCE?
The Fund’s Class I Shares underperformed the MSCI EAFE Index (net of foreign withholding taxes) (the “Benchmark”) for the twelve months ended October 31, 2017.
By sector, the Fund’s security selection in the consumer non-durables sector and its security selection and overweight position in the media sector were leading detractors from performance relative to the Benchmark. The Fund’s overweight position in the technology-semiconductors sector and its security selection and overweight position in the industrial cyclical sector were leading positive contributors to relative performance.
By region, the Fund’s underweight position and security selection in Europe, excluding the U.K., and its overweight position and security selection in the U.K. were leading detractors from relative performance, while the Fund’s underweight allocation the Pacific region, excluding Japan, and its security selection in North America, where the Benchmark had no exposure, made positive contributions to relative performance.
Leading individual detractors from relative performance included the Fund’s overweight positions in Royal Ahold Delhaize NV, Daiwa Securities Group Inc. and GlaxoSmithKline PLC. Shares of Royal Ahold Delhaize, a Netherlands grocery chain, fell after the company reported a decline in earnings during the reporting period. Shares of Daiwa Securities Group, a Japanese financial services company, fell amid investor expectations for low returns in Japanese financial markets.
Shares of GlaxoSmithKline, a U.K. pharmaceuticals company, fell amid investor concerns that Britain’s exit from the European Union would raise the company’s costs of doing business.
Leading individual contributors to relative performance included the Fund’s underweight positions in NXP Semiconductors N.V. and Toyota Motor Corp. and its overweight position in Michelin SCA. Shares of NXP Semiconductors, a Dutch computer chip maker that was not held in the Fund, fell amid uncertainty about its planned acquisition by Qualcomm Inc. Shares of Toyota, a Japanese automaker, fell amid a slowdown in U.S. auto sales and ongoing litigation related to passenger air bags. Shares of Michelin, a French maker of automotive tires and maps and guides, rose amid investor expectations for increased auto sales.
HOW THE FUND WAS MANAGED?
The Fund’s portfolio managers employed a bottom-up fundamental approach to security selection, rigorously researching companies in an attempt to determine their underlying value and potential for future growth. The Fund’s portfolio managers looked for dividend yielding equity securities that they believed were undervalued and possessed the long-term earnings power and strong cash flow generation that would enable them to grow their dividends.
| 1 | On April 3, 2017, the Fund’s Select Class Shares were renamed Class I Shares. |
| * | The return shown is based on net asset values calculated for shareholder transactions and may differ from the return shown in the financial highlights, which reflects adjustments made to the net asset values in accordance with accounting principles generally accepted in the United States of America. |
| ** | The adviser seeks to achieve the Fund’s objective. There can be no guarantee it will be achieved. |
| 16 | J.P. MORGAN INTERNATIONAL EQUITY FUNDS | OCTOBER 31, 2017 | ||||
Table of Contents
| TOP TEN EQUITY HOLDINGS OF THE PORTFOLIO*** | ||||||||
| 1. | HSBC Holdings plc, ADR (United Kingdom) | 2.9 | % | |||||
| 2. | British American Tobacco plc (United Kingdom) | 2.6 | ||||||
| 3. | Samsung Electronics Co. Ltd. (South Korea) | 2.2 | ||||||
| 4. | Bridgestone Corp. (Japan) | 2.1 | ||||||
| 5. | Mitsubishi UFJ Financial Group, Inc., ADR (Japan) | 2.1 | ||||||
| 6. | Vinci SA (France) | 2.1 | ||||||
| 7. | UPM-Kymmene OYJ (Finland) | 2.1 | ||||||
| 8. | NN Group NV (Netherlands) | 2.1 | ||||||
| 9. | Ferguson plc (Switzerland) | 2.1 | ||||||
| 10. | Allianz SE (Registered) (Germany) | 2.1 | ||||||
PORTFOLIO COMPOSITION BY COUNTRY*** | ||||
| United Kingdom | 22.0 | % | ||
| Japan | 10.5 | |||
| Germany | 10.1 | |||
| France | 9.7 | |||
| Switzerland | 8.9 | |||
| Netherlands | 7.7 | |||
| Russia | 3.2 | |||
| Finland | 3.1 | |||
| Norway | 2.8 | |||
| Italy | 2.6 | |||
| South Korea | 2.2 | |||
| Spain | 2.1 | |||
| Denmark | 1.8 | |||
| China | 1.6 | |||
| Taiwan | 1.3 | |||
| New Zealand | 1.1 | |||
| United States | 1.0 | |||
| Canada | 1.0 | |||
| Singapore | 1.0 | |||
| Hong Kong | 1.0 | |||
| Others (each less than 1.0%) | 4.2 | |||
| Short-Term Investment | 1.1 | |||
| *** | Percentages indicated are based on total investments as of October 31, 2017. The Fund’s portfolio composition is subject to change. |
| OCTOBER 31, 2017 | J.P. MORGAN INTERNATIONAL EQUITY FUNDS | 17 | ||||||
Table of Contents
JPMorgan International Equity Income Fund
FUND COMMENTARY
TWELVE MONTHS ENDED OCTOBER 31, 2017 (Unaudited) (continued)
AVERAGE ANNUAL TOTAL RETURNS AS OF OCTOBER 31, 2017 | ||||||||||||||
| INCEPTION DATE OF CLASS | 1 YEAR | 5 YEAR | SINCE INCEPTION | |||||||||||
CLASS A SHARES | February 28, 2011 | |||||||||||||
With Sales Charge* | 12.01 | % | 6.29 | % | 4.61 | % | ||||||||
Without Sales Charge | 18.24 | 7.44 | 5.45 | |||||||||||
CLASS C SHARES | February 28, 2011 | |||||||||||||
With CDSC** | 16.64 | 6.89 | 4.92 | |||||||||||
Without CDSC | 17.64 | 6.89 | 4.92 | |||||||||||
CLASS I SHARES (FORMERLY SELECT CLASS SHARES) | February 28, 2011 | 18.65 | 7.76 | 5.75 | ||||||||||
CLASS R2 SHARES | February 28, 2011 | 17.99 | 7.17 | 5.19 | ||||||||||
CLASS R5 SHARES | February 28, 2011 | 18.74 | 7.91 | 5.92 | ||||||||||
CLASS R6 SHARES | January 30, 2015 | 18.81 | 7.93 | 5.93 | ||||||||||
| * | Sales Charge for Class A Shares is 5.25%. |
| ** | Assumes a 1% CDSC (contingent deferred sales charge) for the one year period and 0% CDSC thereafter. |
LIFE OF FUND PERFORMANCE (2/28/11 TO 10/31/17)
The performance quoted is past performance and is not a guarantee of future results. Mutual funds are subject to certain market risks. Investment returns and principal value of an investment will fluctuate so that an investor’s shares, when redeemed, may be worth more or less than their original cost. Current performance may be higher or lower than the performance data shown. For up-to-date, month-end performance information please call 1-800-480-4111.
The Fund commenced operations on February 28, 2011.
Returns for Class R6 Shares prior to its inception date are based on the performance of Class R5 Shares. The actual returns for Class R6 Shares would have been different than those shown because Class R6 Shares have different expenses than Class R5 Shares.
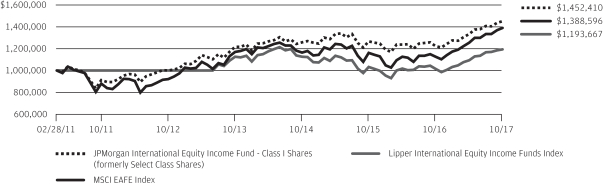
The graph illustrates comparative performance for $1,000,000 invested in Class I Shares of the JPMorgan International Equity Income Fund, the MSCI EAFE Index and the Lipper International Equity Income Funds Index from February 28, 2011 to October 31, 2017. Return information prior to July 31, 2013 for the Lipper International Equity Income Funds Index is not provided by Lipper, Inc. The performance of the Fund assumes reinvestment of all dividends and capital gain distributions, if any, and does not include a sales charge. The performance of the MSCI EAFE Index does not reflect the deduction of expenses or a sales charge associated with a mutual fund and approximates the minimum possible dividend reinvestment of the securities included in the benchmarks, if applicable. The dividend is reinvested after deduction of withholding tax, applying the maximum rate to non-resident institutional investors who do not benefit from double taxation treaties. The performance of the Lipper International Equity Income Funds Index includes expenses associated with a mutual
fund, such as investment management fees. These expenses are not identical to the expenses incurred by the Fund. The MSCI EAFE Index is a free float-adjusted market capitalization weighted index that is designed to measure the equity market performance of developed markets, excluding the U.S. and Canada. The Lipper International Equity Income Funds Index is an index based on the total returns of certain mutual funds within the Fund’s designated category as determined by Lipper, Inc. Investors cannot invest directly in an index.
Class I Shares have a $1,000,000 minimum initial investment.
Fund performance may reflect the waiver of the Fund’s fees and reimbursement of expenses for certain periods since the inception date. Without these waivers and reimbursements, performance would have been lower. Also, performance shown in this section does not reflect the deduction of taxes that a shareholder would pay on Fund distributions or redemptions of Fund shares.
International investing involves a greater degree of risk and increased volatility. Changes in currency exchange rates and differences in accounting and taxation policies outside the United States can raise or lower returns. Also, some overseas markets may not be as politically and economically stable as the United States and other nations.
The returns shown are based on net asset values calculated for shareholder transactions and may differ from the returns shown in the financial highlights, which reflect adjustments made to the net asset values in accordance with accounting principles generally accepted in the United States of America.
The MSCI information may only be used for your internal use, may not be reproduced or redisseminated in any form and may not be used as a basis for or a component of any financial instruments or products or indices. None of the
| 18 | J.P. MORGAN INTERNATIONAL EQUITY FUNDS | OCTOBER 31, 2017 | ||||
Table of Contents
MSCI information is intended to constitute investment advice or a recommendation to make (or refrain from making) any kind of investment decision and may not be relied on as such. Historical data and analysis should not be taken as an indication or guarantee of any future performance analysis, forecast or prediction. The MSCI information is provided on an “as is” basis and the user of this information assumes the entire risk of any use made of this information. MSCI, each of its affiliates and each other person involved in or related to compiling, computing or creating any MSCI information (collectively,
the “MSCI Parties”) expressly disclaims all warranties (including, without limitation, any warranties of originality, accuracy, completeness, timeliness, non-infringement, merchantability and fitness for a particular purpose) with respect to this information. Without limiting any of the foregoing, in no event shall any MSCI Party have any liability for any direct, indirect, special, incidental, punitive, consequential (including, without limitation, lost profits) or any other damages. (www.msci.com)
| OCTOBER 31, 2017 | J.P. MORGAN INTERNATIONAL EQUITY FUNDS | 19 | ||||||
Table of Contents
JPMorgan International Research Enhanced Equity Fund
FUND COMMENTARY
TWELVE MONTHS ENDED OCTOBER 31, 2017 (Unaudited)
| REPORTING PERIOD RETURN: | ||||
| Fund (Class I Shares)1,* | 23.71% | |||
| Morgan Stanley Capital International (“MSCI”) Europe, Australasia and Far East (“EAFE”) Index (net of foreign withholding taxes) | 23.44% | |||
| Net Assets as of 10/31/2017 (In Thousands) | $ | 5,038,702 | ||
INVESTMENT OBJECTIVE**
The JPMorgan International Research Enhanced Equity Fund (the “Fund”) seeks to provide long-term capital appreciation.
WHAT WERE THE MAIN DRIVERS OF THE FUND’S PERFORMANCE?
The Fund’s Class I Shares outperformed the MSCI EAFE Index (net of foreign withholding taxes) (the “Benchmark”) for the twelve months ended October 31, 2017.
By sector, the Fund’s security selection in the banks and industrial cyclical sectors was a leading positive contributor to performance relative to the Benchmark, while the Fund’s security selection in the automobiles and health care sectors was a leading detractor from relative performance.
Each of the Fund’s regional allocations made a positive contribution to relative performance. The Fund’s security selection in Europe was a leading contributor to relative performance, while the Fund’s security selection in Japan, was the smallest contributor to relative performance.
Due to the Fund holding a relatively large number of securities during the period, the impact of individual holdings on the Fund’s relative performance tended to be small.
HOW WAS THE FUND POSITIONED?
The Fund sought to outperform the Benchmark over time, while seeking to achieve sector, geographic and risk characteristics similar to that of the Benchmark. Using the fundamental equity insights generated by analysts, the Fund’s portfolio managers took a marginally overweight position in securities included within the universe of the Benchmark that they considered undervalued, while marginally underweighting or not holding securities in the Benchmark that they considered overvalued.
| TOP TEN EQUITY HOLDINGS OF THE PORTFOLIO*** | ||||||||
| 1. | Nestle SA (Registered) (Switzerland) | 2.1 | % | |||||
| 2. | HSBC Holdings plc (United Kingdom) | 1.5 | ||||||
| 3. | British American Tobacco plc (United Kingdom) | 1.5 | ||||||
| 4. | Roche Holding AG (Switzerland) | 1.5 | ||||||
| 5. | Toyota Motor Corp. (Japan) | 1.5 | ||||||
| 6. | SAP SE (Germany) | 1.3 | ||||||
| 7. | TOTAL SA (France) | 1.3 | ||||||
| 8. | Royal Dutch Shell plc, Class B (Netherlands) | 1.3 | ||||||
| 9. | Air Liquide SA (France) | 1.2 | ||||||
| 10. | Anheuser-Busch InBev SA/NV (Belgium) | 1.2 | ||||||
PORTFOLIO COMPOSITION BY COUNTRY*** | ||||
Japan | 21.6 | % | ||
United Kingdom | 15.8 | |||
France | 11.3 | |||
Germany | 10.3 | |||
Switzerland | 9.4 | |||
Netherlands | 5.3 | |||
Australia | 4.7 | |||
Italy | 2.9 | |||
Spain | 2.4 | |||
Hong Kong | 2.2 | |||
Finland | 1.8 | |||
Denmark | 1.3 | |||
Belgium | 1.2 | |||
Others (each less than 1.0%) | 4.8 | |||
Short-Term Investment | 5.0 | |||
| 1 | On April 3, 2017, the Fund’s Select Class Shares were renamed Class I Shares. |
| * | The return shown is based on net asset values calculated for shareholder transactions and may differ from the return shown in the financial highlights, which reflects adjustments made to the net asset values in accordance with accounting principles generally accepted in the United States of America. |
| ** | The adviser seeks to achieve the Fund’s objective. There can be no guarantee it will be achieved. |
| *** | Percentages indicated are based on total investments as of October 31, 2017. The Fund’s portfolio composition is subject to change. |
| 20 | J.P. MORGAN INTERNATIONAL EQUITY FUNDS | OCTOBER 31, 2017 | ||||
Table of Contents
AVERAGE ANNUAL TOTAL RETURNS AS OF OCTOBER 31, 2017 | ||||||||||||||
| INCEPTION DATE OF CLASS | 1 YEAR | 5 YEAR | 10 YEAR | |||||||||||
CLASS A SHARES | April 23, 1993 | |||||||||||||
With Sales Charge* | 16.94 | % | 7.23 | % | (0.21 | )% | ||||||||
Without Sales Charge | 23.41 | 8.40 | 0.33 | |||||||||||
CLASS I SHARES (FORMERLY SELECT CLASS SHARES) | October 28, 1992 | 23.71 | 8.68 | 0.58 | ||||||||||
| * | Sales Charge for Class A Shares is 5.25%. |
TEN YEAR PERFORMANCE (10/31/07 TO 10/31/17)
The performance quoted is past performance and is not a guarantee of future results. Mutual funds are subject to certain market risks. Investment returns and principal value of an investment will fluctuate so that an investor’s shares, when redeemed, may be worth more or less than their original cost. Current performance may be higher or lower than the performance data shown. For up-to-date month-end performance information please call 1-800-480-4111.
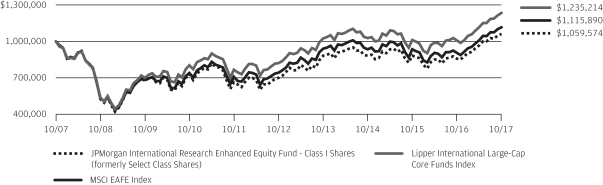
The graph illustrates comparative performance for $1,000,000 invested in Class I Shares of the JPMorgan International Research Enhanced Equity Fund, the MSCI EAFE Index and the Lipper International Large-Cap Core Funds Index from October 31, 2007 to October 31, 2017. The performance of the Fund assumes reinvestment of all dividends and capital gain distributions, if any, and does not include a sales charge. The performance of the MSCI EAFE Index does not reflect the deduction of expenses or a sales charge associated with a mutual fund and approximates the minimum possible dividend reinvestment of the securities included in the benchmark, if applicable. The dividend is reinvested after deduction of withholding tax, applying the maximum rate to non-resident institutional investors who do not benefit from double taxation treaties. The performance of the Lipper International Large-Cap Core Funds Index includes expenses associated with a mutual fund, such as investment management fees. These expenses are not identical to the expenses incurred by the Fund. The MSCI EAFE Index is a free float-adjusted market capitalization weighted index that is designed to measure the equity market performance of developed markets, excluding the U.S. and Canada. The Lipper International Large-Cap Core Funds Index is an index based on the total returns of certain mutual funds within the Fund’s designated category as determined by Lipper, Inc. Investors cannot invest directly in an index.
Class I Shares have a $1,000,000 minimum initial investment.
Fund performance may reflect the waiver of the Fund’s fees and reimbursement of expenses for certain periods since the inception date. Without these
waivers and reimbursements, performance would have been lower. Also, performance shown in this section does not reflect the deduction of taxes that a shareholder would pay on Fund distributions or redemptions of Fund shares.
International investing involves a greater degree of risk and increased volatility. Changes in currency exchange rates and differences in accounting and taxation policies outside of the U.S. can raise or lower returns. Also, some overseas markets may not be as politically and economically stable as the United States and other nations.
The returns shown are based on net asset values calculated for shareholder transactions and may differ from the returns shown in the financial highlights, which reflect adjustments made to the net asset values in accordance with accounting principles generally accepted in the United States of America.
The MSCI information may only be used for your internal use, may not be reproduced or redisseminated in any form and may not be used as a basis for or a component of any financial instruments or products or indices. None of the MSCI information is intended to constitute investment advice or a recommendation to make (or refrain from making) any kind of investment decision and may not be relied on as such. Historical data and analysis should not be taken as an indication or guarantee of any future performance analysis, forecast or prediction. The MSCI information is provided on an “as is” basis and the user of this information assumes the entire risk of any use made of this information. MSCI, each of its affiliates and each other person involved in or related to compiling, computing or creating any MSCI information (collectively, the “MSCI Parties”) expressly disclaims all warranties (including, without limitation, any warranties of originality, accuracy, completeness, timeliness, non-infringement, merchantability and fitness for a particular purpose) with respect to this information. Without limiting any of the foregoing, in no event shall any MSCI Party have any liability for any direct, indirect, special, incidental, punitive, consequential (including, without limitation, lost profits) or any other damages. (www.msci.com)
| OCTOBER 31, 2017 | J.P. MORGAN INTERNATIONAL EQUITY FUNDS | 21 | ||||||
Table of Contents
JPMorgan International Unconstrained Equity Fund
FUND COMMENTARY
TWELVE MONTHS ENDED OCTOBER 31, 2017 (Unaudited)
| REPORTING PERIOD RETURN: | ||||
| Fund (Class I Shares)1,* | 25.60% | |||
| Morgan Stanley Capital International (“MSCI”) All Country World Index, Ex-U.S. (net of foreign withholding taxes) | 23.64% | |||
| Net Assets as of 10/31/2017 (In Thousands) | $ | 357,629 | ||
INVESTMENT OBJECTIVE**
The JPMorgan International Unconstrained Equity Fund (the “Fund”) seeks to provide long-term capital appreciation.
WHAT WERE THE MAIN DRIVERS OF THE FUND’S PERFORMANCE?
The Fund’s Class I Shares outperformed the MSCI All Country World Index, ex-U.S. (net of foreign withholding taxes) (the “Benchmark”) for the twelve months ended October 31, 2017.
By sector, the Fund’s security selection in the consumer discretionary and materials sectors was a leading contributor to performance relative to the Benchmark, while the Fund’s security selection in the energy and health care sectors was a leading detractor from relative performance.
By region, the Fund’s security selection in Emerging Markets and its security selection and overweight position in Europe, excluding the U.K., were leading contributors to performance relative to the Benchmark. The Fund’s security selection in Canada detracted from relative performance.
Leading individual contributors to the relative performance included the Fund’s overweight positions in Actelion Ltd., Nokia Oyj and NN Group N.V. Shares of Actelion, a Swiss drug maker, rose in advance of its $30 billion acquisition by Johnson & Johnson. Shares of Nokia, a Finnish provider of mobile technology services, rose after the company reported earnings growth in the second quarter of 2017. Shares of NN Group, a Dutch life insurance company, rose after the company reported better than expected earnings during the reporting period.
Leading individual detractors from the Fund’s relative performance included its overweight positions in Teva Pharmaceutical Industries Ltd., Alimentation Couche-Tard Inc. and TechnipFMC PLC. Shares of Teva Pharmaceutical Industries, a maker of generic drugs, fell late in the reporting period after the company lost a drug patent lawsuit to rival Mylan NV. Shares of Alimentation Couche-Tard, a Canadian operator of convenience stores, fell ahead of its planned acquisition of CST Brands Inc. Shares of TechnipFMC, a U.K. oilfield services and engineering company not held in the Benchmark, fell amid overall weakness in the oil exploration sector.
HOW WAS THE FUND POSITIONED?
By harnessing their team’s global sector specialists, the Fund’s portfolio managers sought to build a high-conviction, benchmark-agnostic portfolio of growth, value and unique companies, whose future prospects, the managers believed, were under-appreciated by the market and thus possessed the potential to deliver higher-than-expected earnings that could have a positive effect on the share price.
| 1 | On April 3, 2017, the Fund’s Select Class Shares were renamed Class I Shares. |
| * | The return shown is based on net asset values calculated for shareholder transactions and may differ from the return shown in the financial highlights, which reflects adjustments made to the net asset values in accordance with accounting principles generally accepted in the United States of America. |
| ** | The adviser seeks to achieve the Fund’s objective. There can be no guarantee it will be achieved. |
| 22 | J.P. MORGAN INTERNATIONAL EQUITY FUNDS | OCTOBER 31, 2017 | ||||
Table of Contents
| TOP TEN EQUITY HOLDINGS OF THE PORTFOLIO*** | ||||||||
| 1. | Ping An Insurance Group Co. of China Ltd., Class H (China) | 4.2 | % | |||||
| 2. | Unilever NV, CVA (United Kingdom) | 3.1 | ||||||
| 3. | AIA Group Ltd. (Hong Kong) | 3.0 | ||||||
| 4. | Samsung Electronics Co. Ltd., GDR (South Korea) | 2.9 | ||||||
| 5. | Continental AG (Germany) | 2.9 | ||||||
| 6. | Linde AG (Germany) | 2.9 | ||||||
| 7. | Bayer AG (Registered) (Germany) | 2.7 | ||||||
| 8. | HDFC Bank Ltd., ADR (India) | 2.7 | ||||||
| 9. | Shin-Etsu Chemical Co. Ltd. (Japan) | 2.6 | ||||||
| 10. | British American Tobacco plc (United Kingdom) | 2.5 | ||||||
PORTFOLIO COMPOSITION BY COUNTRY*** | ||||
United Kingdom | 15.7 | % | ||
Japan | 11.8 | |||
Germany | 10.8 | |||
China | 10.4 | |||
Netherlands | 8.8 | |||
Switzerland | 8.1 | |||
Hong Kong | 6.7 | |||
South Korea | 4.9 | |||
Canada | 2.9 | |||
India | 2.6 | |||
Spain | 2.2 | |||
France | 2.0 | |||
Indonesia | 2.0 | |||
South Africa | 2.0 | |||
Italy | 1.9 | |||
Finland | 1.7 | |||
Denmark | 1.4 | |||
Short-Term Investment | 4.1 | |||
| *** | Percentages indicated are based on total investments as of October 31, 2017. The Fund’s portfolio composition is subject to change. |
| OCTOBER 31, 2017 | J.P. MORGAN INTERNATIONAL EQUITY FUNDS | 23 | ||||||
Table of Contents
JPMorgan International Unconstrained Equity Fund
FUND COMMENTARY
TWELVE MONTHS ENDED OCTOBER 31, 2017 (Unaudited) (continued)
AVERAGE ANNUAL TOTAL RETURNS AS OF OCTOBER 31, 2017 | ||||||||||||||||
| INCEPTION DATE OF CLASS | 1 YEAR | 5 YEAR | SINCE INCEPTION | |||||||||||||
CLASS A SHARES | November 30, 2011 | |||||||||||||||
With Sales Charge* | 18.56 | % | 7.41 | % | 8.79 | % | ||||||||||
Without Sales Charge | 25.16 | 8.57 | 9.79 | |||||||||||||
CLASS C SHARES | November 30, 2011 | |||||||||||||||
With CDSC** | 23.51 | 8.02 | 9.23 | |||||||||||||
Without CDSC | 24.51 | 8.02 | 9.23 | |||||||||||||
CLASS I SHARES (FORMERLY SELECT CLASS SHARES) | November 30, 2011 | 25.60 | 8.90 | 10.11 | ||||||||||||
CLASS R2 SHARES | November 30, 2011 | 24.85 | 8.30 | 9.51 | ||||||||||||
CLASS R5 SHARES | November 30, 2011 | 25.67 | 9.05 | 10.27 | ||||||||||||
CLASS R6 SHARES | November 30, 2011 | 25.72 | 9.11 | 10.33 | ||||||||||||
| * | Sales Charge for Class A Shares is 5.25%. |
| ** | Assumes a 1% CDSC (contingent deferred sales charge) for the one year period and 0% CDSC thereafter. |
LIFE OF FUND PERFORMANCE (11/30/11 TO 10/31/17)
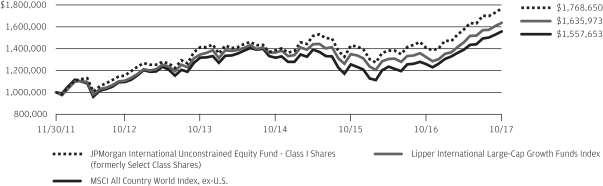
The performance quoted is past performance and is not a guarantee of future results. Mutual funds are subject to certain market risks. Investment returns and principal value of an investment will fluctuate so that an investor’s shares, when redeemed, may be worth more or less than their original cost. Current performance may be higher or lower than the performance data shown. For up-to-date, month-end performance information please call 1-800-480-4111.
The Fund commenced operations on November 30, 2011.
The graph illustrates comparative performance for $1,000,000 invested in Class I Shares of the JPMorgan International Unconstrained Equity Fund, the MSCI All Country World Index, ex-U.S. and the Lipper International Large-Cap Growth Funds Index from November 30, 2011 to October 31, 2017. The performance of the Fund assumes reinvestment of all dividends and capital gain distributions, if any, and does not include a sales charge. The performance of the MSCI All Country World Index, ex-U.S. does not reflect the deduction of expenses or a sales charge associated with a mutual fund and approximates the minimum possible dividend reinvestment of the securities included in the benchmark, if applicable. The dividend is reinvested after deduction of withholding tax, applying the maximum rate to non-resident institutional investors who do not benefit from double taxation treaties. The performance of the Lipper International Large-Cap Growth Funds Index includes expenses associated with a mutual fund, such as investment management fees. These expenses are not identical to the expenses incurred by the Fund. The MSCI All Country World Index, ex-U.S. is a free float-adjusted market capitalization weighted index that is designed to measure the equity market performance of developed and
emerging markets, excluding the United States. The Lipper International Large-Cap Growth Funds Index is an index based on the total returns of certain mutual funds within the Fund’s designated category, as determined by Lipper, Inc. Investors cannot invest directly in an index.
Class I Shares have a $1,000,000 minimum initial investment.
Subsequent to the inception date of the Fund and through May 30, 2013, the Fund did not experience any shareholder activity. If such shareholder activity had occurred, the Fund’s performance may have been impacted.
Fund performance may reflect the waiver of the Fund’s fees and reimbursement of expenses for certain periods since the inception date. Without these waivers and reimbursements, performance would have been lower. Also, performance shown in this section does not reflect the deduction of taxes that a shareholder would pay on Fund distributions or redemptions of Fund shares.
International investing involves a greater degree of risk and increased volatility. Changes in currency exchange rates and differences in accounting and taxation policies outside the U.S. can raise or lower returns. Also, some overseas markets may not be as politically and economically stable as the United States and other nations.
The returns shown are based on net asset values calculated for shareholder transactions and may differ from the returns shown in the financial highlights, which reflect adjustments made to the net asset values in accordance with accounting principles generally accepted in the United States of America.
| 24 | J.P. MORGAN INTERNATIONAL EQUITY FUNDS | OCTOBER 31, 2017 | ||||
Table of Contents
JPMorgan International Value Fund
FUND COMMENTARY
TWELVE MONTHS ENDED OCTOBER 31, 2017 (Unaudited)
| REPORTING PERIOD RETURN: | ||||
| Fund (Class L Shares)1,* | 23.88% | |||
| Morgan Stanley Capital International (“MSCI”) Europe, Australasia and Far East (“EAFE”) Value Index (net of foreign withholding taxes) | 23.21% | |||
| Net Assets as of 10/31/2017 (In Thousands) | $ | 793,787 | ||
INVESTMENT OBJECTIVE**
The JPMorgan International Value Fund (the “Fund”) seeks to provide high total return from a portfolio of foreign company equity securities.
WHAT WERE THE MAIN DRIVERS OF THE FUND’S PERFORMANCE?
The Fund’s Class L Shares outperformed the MSCI EAFE Value Index (net of foreign withholding taxes) (the “Benchmark”) for the twelve months ended October 31, 2017.
By sector, the Fund’s security selection in the insurance and banks sectors was a leading contributor to performance relative to the Benchmark, while the Fund’s security selection in the health care and energy sectors was a leading detractor from relative performance.
By region, the Fund’s security selection in Europe and the U.K. was a leading contributor to relative performance, while the Fund’s security selection in North America detracted from relative performance.
Leading individual contributors to relative performance included the Fund’s positions in ASR Nederland NV, Airbus SE and Prudential PLC, none of which were held in the Benchmark. Shares of ASR Nederland, a Dutch insurance company, rose on news reports that rival Aegon NV sought to acquire the company. Shares of Airbus, a maker of commercial aircraft and military hardware, rose amid strong demand for new aircraft and better-than-expected earnings during the reporting period. Shares of Prudential, a U.K. financial services company, rose amid continued growth in earnings and expansion into China.
Leading individual detractors from relative performance included the Fund’s overweight positions in Teva Pharmaceutical Industries Ltd., Shire PLC and TechnipFMC PLC. Shares of Teva Pharmaceutical Industries, a maker of generic drugs, fell late in the reporting period after losing a drug patent lawsuit to rival Mylan NV. Shares of Shire, a pharmaceutical company based in Ireland, fell after the company reduced its sales forecast. Shares of TechnipFMC, a U.K. oilfield services and engineering company not held in the Benchmark, fell amid overall weakness in the oil exploration sector.
HOW WAS THE FUND POSITIONED?
The Fund’s portfolio managers employed a bottom-up fundamental approach to security selection, seeking to identify what they believed were the most attractive value investment opportunities within each sector. The Fund’s portfolio managers looked for securities that they believed possessed an attractive valuation signal (as measured by a proprietary dividend discount model) and a timely catalyst that would enable the securities to realize their inherent value. In addition, the Fund employed futures and currency forwards to help manage cash flows and currency exposure.
| 1 | Effective December 1, 2016, the Fund’s Institutional Class Shares were renamed Class L Shares. |
| * | The return shown is based on net asset values calculated for shareholder transactions and may differ from the return shown in the financial highlights, which reflects adjustments made to the net asset values in accordance with accounting principles generally accepted in the United States of America. |
| ** | The adviser seeks to achieve the Fund’s objective. There can be no guarantee it will be achieved. |
| OCTOBER 31, 2017 | J.P. MORGAN INTERNATIONAL EQUITY FUNDS | 25 | ||||||
Table of Contents
JPMorgan International Value Fund
FUND COMMENTARY
TWELVE MONTHS ENDED OCTOBER 31, 2017 (Unaudited) (continued)
| TOP TEN HOLDINGS OF THE PORTFOLIO*** | ||||||||
| 1. | Royal Dutch Shell plc, Class A (Netherlands) | 4.4 | % | |||||
| 2. | TOTAL SA (France) | 3.4 | ||||||
| 3. | Mitsubishi UFJ Financial Group, Inc. (Japan) | 2.8 | ||||||
| 4. | Australia & New Zealand Banking Group Ltd. (Australia) | 2.4 | ||||||
| 5. | AXA SA (France) | 2.3 | ||||||
| 6. | BNP Paribas SA (France) | 2.1 | ||||||
| 7. | Siemens AG (Registered) (Germany) | 2.1 | ||||||
| 8. | Air Liquide SA (France) | 2.0 | ||||||
| 9. | Honda Motor Co. Ltd. (Japan) | 2.0 | ||||||
| 10. | Enel SpA (Italy) | 2.0 | ||||||
PORTFOLIO COMPOSITION BY COUNTRY*** | ||||
Japan | 22.5 | % | ||
France | 15.9 | |||
United Kingdom | 11.2 | |||
Switzerland | 8.4 | |||
Germany | 7.7 | |||
Netherlands | 7.5 | |||
Italy | 3.6 | |||
Australia | 3.3 | |||
Spain | 3.0 | |||
Belgium | 2.3 | |||
Luxembourg | 1.4 | |||
United States | 1.4 | |||
Canada | 1.4 | |||
Singapore | 1.4 | |||
Austria | 1.3 | |||
Finland | 1.3 | |||
Norway | 1.0 | |||
South Korea | 1.0 | |||
Others (each less than 1.0%) | 3.4 | |||
Short-Term Investment | 1.0 | |||
| *** | Percentages indicated are based on total investments as of October 31, 2017. The Fund’s portfolio composition is subject to change. |
| 26 | J.P. MORGAN INTERNATIONAL EQUITY FUNDS | OCTOBER 31, 2017 | ||||
Table of Contents
AVERAGE ANNUAL TOTAL RETURNS AS OF OCTOBER 31, 2017 | ||||||||||||||
| INCEPTION DATE OF CLASS | 1 YEAR | 5 YEAR | 10 YEAR | |||||||||||
CLASS A SHARES | September 28, 2001 | |||||||||||||
With Sales Charge* | 16.80 | % | 5.07 | % | (1.01 | )% | ||||||||
Without Sales Charge | �� | 23.30 | 6.20 | (0.47 | ) | |||||||||
CLASS C SHARES | July 11, 2006 | |||||||||||||
With CDSC** | 21.67 | 5.68 | (0.97 | ) | ||||||||||
Without CDSC | 22.67 | 5.68 | (0.97 | ) | ||||||||||
CLASS I SHARES (FORMERLY SELECT CLASS SHARES) | September 10, 2001 | 23.66 | 6.51 | (0.21 | ) | |||||||||
CLASS L SHARES (FORMERLY INSTITUTIONAL CLASS SHARES) | November 4, 1993 | 23.88 | 6.65 | (0.06 | ) | |||||||||
CLASS R2 SHARES | November 3, 2008 | 23.02 | 5.96 | (0.69 | ) | |||||||||
CLASS R5 SHARES | September 9, 2016 | 23.81 | 6.66 | (0.06 | ) | |||||||||
CLASS R6 SHARES | November 30, 2010 | 23.99 | 6.80 | 0.02 | ||||||||||
| * | Sales Charge for Class A Shares is 5.25%. |
| ** | Assumes a 1% CDSC (contingent deferred sales charge) for the one year period and 0% CDSC thereafter. |
TEN YEAR PERFORMANCE (10/31/07 TO 10/31/17)
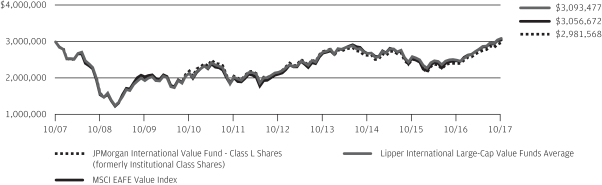
The performance quoted is past performance and is not a guarantee of future results. Mutual funds are subject to certain market risks. Investment returns and principal value of an investment will fluctuate so that an investor’s shares, when redeemed, may be worth more or less than their original cost. Current performance may be higher or lower than the performance data shown. For up-to-date month-end performance information please call 1-800-480-4111.
Returns for Class R2 Shares prior to its inception date are based on the performance of Class A Shares. The actual returns of R2 Shares would have been lower than those shown because R2 Shares have higher expenses than Class A Shares.
Returns for Class R5 Shares prior to its inception date are based on the performance of Class L Shares. The actual returns of Class R5 shares would have been different than those shown because Class R5 Shares have different expenses than Class L Shares.
Returns for Class R6 Shares prior to its inception date are based on the performance of Class L Shares. The actual returns of Class R6 Shares would have been different than those shown because Class R6 Shares have different expenses than Class L Shares.
The graph illustrates comparative performance for $3,000,000 invested in Class L Shares of the JPMorgan International Value Fund, the MSCI EAFE Value Index and the Lipper International Large-Cap Value Funds Average from October 31, 2007 to October 31, 2017. The performance of the Fund assumes reinvestment of all dividends and capital gain distributions, if any, and does not include a sales charge. The performance of the MSCI EAFE Value Index does not reflect the deduction of expenses or a sales charge associated with a mutual fund and approximates the minimum possible dividend reinvestment of the securities included in the
benchmark, if applicable. The dividend is reinvested after deduction of withholding tax, applying the maximum rate to non-resident institutional investors who do not benefit from double taxation treaties. The performance of the Lipper International Large-Cap Value Funds Average includes expenses associated with a mutual fund, such as investment management fees. These expenses are not identical to the expenses incurred by the Fund. The MSCI EAFE Value Index is a free float-adjusted market capitalization weighted index that is designed to measure the performance of value-oriented stocks in the world’s equity markets, excluding the U.S. and Canada. Investors cannot invest directly in an index. The Lipper International Large-Cap Value Funds Average is an average based on the total returns of all mutual funds within the Fund’s designated category as determined by Lipper, Inc.
Class L Shares have a $3,000,000 minimum initial investment.
Fund performance may reflect the waiver of the Fund’s fees and reimbursement of expenses for certain periods since the inception date. Without these waivers and reimbursements, performance would have been lower. Also, performance shown in this section does not reflect the deduction of taxes that a shareholder would pay on Fund distributions or redemptions of Fund shares.
International investing involves a greater degree of risk and increased volatility. Changes in currency exchange rates and differences in accounting and taxation policies outside the U.S. can raise or lower returns. Also, some overseas markets may not be as politically and economically stable as the United States and other nations.
The returns shown are based on net asset values calculated for shareholder transactions and may differ from the returns shown in the financial highlights, which reflect adjustments made to the net asset values in accordance with accounting principles generally accepted in the United States of America.
| OCTOBER 31, 2017 | J.P. MORGAN INTERNATIONAL EQUITY FUNDS | 27 | ||||||
Table of Contents
JPMorgan Intrepid International Fund
FUND COMMENTARY
TWELVE MONTHS ENDED OCTOBER 31, 2017 (Unaudited)
| REPORTING PERIOD RETURN: | ||||
| Fund (Class A Shares, without a sales charge)* | 22.98% | |||
| Morgan Stanley Capital International (“MSCI”) Europe, Australasia and Far East (“EAFE”) Index (net of foreign withholding taxes) | 23.44% | |||
| Net Assets as of 10/31/2017 (In Thousands) | $ | 3,155,609 | ||
INVESTMENT OBJECTIVE**
The JPMorgan Intrepid International Fund (the “Fund”) seeks to maximize long-term capital growth by investing primarily in equity securities in developed markets outside the U.S.
WHAT WERE THE MAIN DRIVERS OF THE FUND’S PERFORMANCE?
The Fund’s Class A Shares, without a sales charge, underperformed the MSCI EAFE Index (net of foreign withholding taxes) (the “Benchmark”) for the twelve months ended October 31, 2017. The Fund’s portfolio managers attempted to construct the Fund so that security selection and style factors (i.e., growth, value and quality characteristics) would be the primary drivers of returns.
The Fund’s security selection in the consumer discretionary sector and its underweight position in the energy sector were leading detractors from performance relative to the Benchmark, while the Fund’s security selection in the financials and utilities sectors was a leading contributor to relative performance.
The Fund targeted investments in companies that exhibited specific growth, value and quality characteristics during the period. Due to the relatively large number of securities held in the Fund during the reporting period, the impact of individual holdings on the Fund’s relative performance tended to be small.
HOW WAS THE FUND POSITIONED?
The Fund’s portfolio managers believe that attractively valued, high quality securities with positive momentum have the potential to outperform the market. During the reporting period, the Fund’s portfolio managers invested in securities that they believed were attractive based on their proprietary multifactor model.
| TOP TEN EQUITY HOLDINGS OF THE PORTFOLIO*** | ||||||||
| 1. | Novartis AG (Registered) (Switzerland) | 1.9 | % | |||||
| 2. | Unilever NV, CVA (United Kingdom) | 1.8 | ||||||
| 3. | Nestle SA (Registered) (Switzerland) | 1.7 | ||||||
| 4. | Allianz SE (Registered) (Germany) | 1.5 | ||||||
| 5. | Roche Holding AG (Switzerland) | 1.4 | ||||||
| 6. | Sanofi (France) | 1.4 | ||||||
| 7. | ING Groep NV (Netherlands) | 1.2 | ||||||
| 8. | Lloyds Banking Group plc (United Kingdom) | 1.2 | ||||||
| 9. | Enel SpA (Italy) | 1.1 | ||||||
| 10. | ABB Ltd. (Registered) (Switzerland) | 1.0 | ||||||
PORTFOLIO COMPOSITION BY COUNTRY*** | ||||
Japan | 23.2 | % | ||
United Kingdom | 14.1 | |||
Switzerland | 10.5 | |||
France | 10.1 | |||
Germany | 6.7 | |||
Australia | 6.5 | |||
Netherlands | 5.3 | |||
Denmark | 4.0 | |||
Sweden | 3.5 | |||
Singapore | 2.1 | |||
Spain | 2.0 | |||
Hong Kong | 1.4 | |||
Belgium | 1.4 | |||
Austria | 1.2 | |||
Italy | 1.1 | |||
| Others (each less than 1.0%) | 5.2 | |||
Short-Term Investment | 1.7 | |||
| * | The return shown is based on net asset values calculated for shareholder transactions and may differ from the return shown in the financial highlights, which reflects adjustments made to the net asset values in accordance with accounting principles generally accepted in the United States of America. |
| ** | The adviser seeks to achieve the Fund’s objective. There can be no guarantee it will be achieved. |
| *** | Percentages indicated are based on total investments as of October 31, 2017. The Fund’s portfolio composition is subject to change. |
| 28 | J.P. MORGAN INTERNATIONAL EQUITY FUNDS | OCTOBER 31, 2017 | ||||
Table of Contents
AVERAGE ANNUAL TOTAL RETURNS AS OF OCTOBER 31, 2017 | ||||||||||||||
| INCEPTION DATE OF CLASS | 1 YEAR | 5 YEAR | 10 YEAR | |||||||||||
CLASS A SHARES | April 30, 2001 | |||||||||||||
With Sales Charge* | 16.53 | % | 7.38 | % | (0.37 | )% | ||||||||
Without Sales Charge | 22.98 | 8.54 | 0.17 | |||||||||||
CLASS C SHARES | February 28, 2006 | |||||||||||||
With CDSC** | 21.35 | 7.99 | (0.33 | ) | ||||||||||
Without CDSC | 22.35 | 7.99 | (0.33 | ) | ||||||||||
CLASS I SHARES (FORMERLY SELECT CLASS SHARES) | February 28, 2006 | 23.39 | 8.86 | 0.45 | ||||||||||
CLASS R2 SHARES | November 3, 2008 | 22.70 | 8.27 | (0.05 | ) | |||||||||
CLASS R6 SHARES | May 29, 2015 | 23.59 | 9.09 | 0.68 | ||||||||||
| * | Sales Charge for Class A Shares is 5.25%. |
| ** | Assumes a 1% CDSC (contingent deferred sales charge) for the one year period and 0% CDSC thereafter. |
TEN YEAR PERFORMANCE (10/31/07 TO 10/31/17)
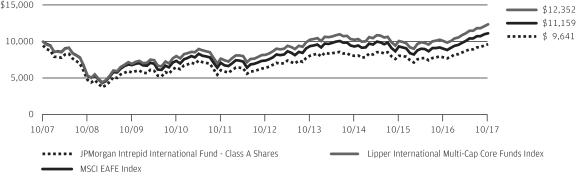
The performance quoted is past performance and is not a guarantee of future results. Mutual funds are subject to certain market risks. Investment returns and principal value of an investment will fluctuate so that an investor’s shares, when redeemed, may be worth more or less than their original cost. Current performance may be higher or lower than the performance data shown. For up-to-date month-end performance information please call 1-800-480-4111.
Returns for Class R2 Shares prior to its inception date are based on the performance of Class A Shares. The actual returns for Class R2 Shares would have been lower than those shown because Class R2 Shares have higher expenses than Class A Shares.
Returns for Class R6 Shares prior to its inception date are based on the performance of the now liquidated Institutional Class Shares. The actual returns of R6 Shares would have been different than those shown because R6 Shares have different expenses than Institutional Class Shares.
The graph illustrates comparative performance for $10,000 invested in Class A Shares of the JPMorgan Intrepid International Fund, the MSCI EAFE Index and the Lipper International Multi-Cap Core Funds Index from October 31, 2007 to October 31, 2017. The performance of the Fund assumes reinvestment of all dividends and capital gain distributions, if any, and does not include a sales charge. The performance of the MSCI EAFE Index does not reflect the deduction of expenses or a sales charge associated with a mutual fund and approximates the minimum possible dividend reinvestment of the securities included in the benchmark, if applicable. The dividend is reinvested after deduction of withholding tax, applying the maximum rate to non-resident institutional investors who do not benefit from double taxation
treaties. The performance of the Lipper International Multi-Cap Core Funds Index includes expenses associated with a mutual fund, such as investment management fees. These expenses are not identical to the expenses incurred by the Fund. The MSCI EAFE Index is a free float-adjusted market capitalization weighted index that is designed to measure the equity market performance of developed markets, excluding the U.S. and Canada. The Lipper International Multi-Cap Core Funds Index is an index based on the total returns of certain mutual funds within the Fund’s designated category, as determined by Lipper, Inc. Investors cannot invest directly in an index.
Class A Shares have a $1,000 minimum initial investment.
Fund performance may reflect the waiver of the Fund’s fees and reimbursement of expenses for certain periods since the inception date. Without these waivers and reimbursements, performance would have been lower. Also, performance shown in this section does not reflect the deduction of taxes that a shareholder would pay on Fund distributions or redemptions of Fund shares.
International investing involves a greater degree of risk and increased volatility. Changes in currency exchange rates and differences in accounting and taxation policies outside the U.S. can raise or lower returns. Also, some overseas markets may not be as politically and economically stable as the United States and other nations.
The returns shown are based on net asset values calculated for shareholder transactions and may differ from the returns shown in the financial highlights, which reflect adjustments made to the net asset values in accordance with accounting principles generally accepted in the United States of America.
| OCTOBER 31, 2017 | J.P. MORGAN INTERNATIONAL EQUITY FUNDS | 29 | ||||||
Table of Contents
JPMorgan Emerging Economies Fund
SCHEDULE OF PORTFOLIO INVESTMENTS
AS OF OCTOBER 31, 2017
(Amounts in thousands)
| SHARES | SECURITY DESCRIPTION | VALUE($) | ||||||
Common Stocks — 95.9% | ||||||||
Argentina — 0.7% | ||||||||
| 60 | Banco Macro SA, ADR | 7,615 | ||||||
| 190 | Telecom Argentina SA, ADR (a) | 6,181 | ||||||
|
| |||||||
| 13,796 | ||||||||
|
| |||||||
Brazil — 8.9% | ||||||||
| 1,638 | Banco Bradesco SA, ADR | 17,313 | ||||||
| 2,204 | Banco do Brasil SA | 23,298 | ||||||
| 585 | Braskem SA (Preference), Class A (a) | 9,291 | ||||||
| 226 | Cia de Saneamento de Minas Gerais-COPASA | 2,751 | ||||||
| 2,348 | Cia de Saneamento do Parana (Preference) | 7,787 | ||||||
| 1,609 | EDP — Energias do Brasil SA (a) | 7,173 | ||||||
| 378 | Fibria Celulose SA | 6,040 | ||||||
| 2,577 | Itau Unibanco Holding SA, ADR | 33,015 | ||||||
| 3,403 | Kroton Educacional SA | 18,873 | ||||||
| 279 | M Dias Branco SA (a) | 4,128 | ||||||
| 248 | Magazine Luiza SA | 4,844 | ||||||
| 4,007 | Metalurgica Gerdau SA (Preference) (a) | 6,247 | ||||||
| 2,061 | MRV Engenharia e Participacoes SA | 7,983 | ||||||
| 938 | Suzano Papel e Celulose SA (Preference), Class A | 5,809 | ||||||
| 710 | Transmissora Alianca de Energia Eletrica SA | 4,463 | ||||||
| 2,235 | Vale SA, ADR | 21,877 | ||||||
|
| |||||||
| 180,892 | ||||||||
|
| |||||||
China — 22.8% | ||||||||
| 1,223 | AAC Technologies Holdings, Inc. | 22,426 | ||||||
| 6,656 | Air China Ltd., Class H | 6,347 | ||||||
| 237 | Alibaba Group Holding Ltd., ADR (a) | 43,741 | ||||||
| 2,699 | Anhui Conch Cement Co. Ltd., Class H | 11,560 | ||||||
| 38,510 | Bank of China Ltd., Class H | 19,246 | ||||||
| 4,378 | Electronic International Co. Ltd. | 11,870 | ||||||
| 31,280 | China Construction Bank Corp., Class H | 27,955 | ||||||
| 6,430 | China Merchants Bank Co. Ltd., Class H | 24,553 | ||||||
| 2,726 | China Overseas Land & Investment Ltd. | 8,851 | ||||||
| 16,030 | China Power International Development Ltd. | 5,096 | ||||||
| 5,404 | Geely Automobile Holdings Ltd. | 16,757 | ||||||
| 9,874 | Guangzhou Automobile Group Co. Ltd., Class H | 24,555 | ||||||
| 11,074 | Huadian Power International Corp. Ltd., Class H | 4,601 | ||||||
| 14,084 | Huaneng Power International, Inc., Class H | 9,419 | ||||||
| 57,285 | Industrial & Commercial Bank of China Ltd., Class H | 45,573 | ||||||
| 112 | NetEase, Inc., ADR | 31,540 | ||||||
| 2,384 | Nexteer Automotive Group Ltd. (a) | 4,669 | ||||||
| 9,550 | PICC Property & Casualty Co. Ltd., Class H | 18,952 | ||||||
| 2,978 | Ping An Insurance Group Co. of China Ltd., Class H | 26,170 | ||||||
| 6,426 | Qingdao Haier Co. Ltd., Class A | 16,784 | ||||||
| SHARES | SECURITY DESCRIPTION | VALUE($) | ||||||
China — continued | ||||||||
| 5,348 | Shenzhen Expressway Co. Ltd., Class H | 5,470 | ||||||
| 1,118 | Tencent Holdings Ltd. | 50,235 | ||||||
| 9,620 | Xinyi Solar Holdings Ltd. | 3,332 | ||||||
| 124 | Yirendai Ltd., ADR | 5,372 | ||||||
| 112 | YY, Inc., ADR (a) | 10,084 | ||||||
| 4,492 | Zhejiang Expressway Co. Ltd., Class H | 5,555 | ||||||
| 1,818 | Zhongsheng Group Holdings Ltd. | 3,736 | ||||||
|
| |||||||
| 464,449 | ||||||||
|
| |||||||
Hong Kong — 3.3% | ||||||||
| 3,010 | Haier Electronics Group Co. Ltd. (a) | 7,937 | ||||||
| 1,996 | Kingboard Chemical Holdings Ltd. | 11,844 | ||||||
| 3,742 | Kingboard Laminates Holdings Ltd. | 6,288 | ||||||
| 5,573 | Lee & Man Paper Manufacturing Ltd. | 6,808 | ||||||
| 5,230 | Nine Dragons Paper Holdings Ltd. | 9,613 | ||||||
| 18,925 | WH Group Ltd., Reg. S (e) | 19,178 | ||||||
| 5,596 | Xinyi Glass Holdings Ltd. | 5,423 | ||||||
|
| |||||||
| 67,091 | ||||||||
|
| |||||||
Hungary — 1.5% | ||||||||
| 922 | MOL Hungarian Oil & Gas plc | 11,044 | ||||||
| 485 | OTP Bank plc | 19,546 | ||||||
|
| |||||||
| 30,590 | ||||||||
|
| |||||||
India — 2.5% | ||||||||
| 1,441 | HCL Technologies Ltd. | 19,039 | ||||||
| 1,218 | Hindustan Petroleum Corp. Ltd. | 8,411 | ||||||
| 2,666 | Rural Electrification Corp. Ltd. | 7,137 | ||||||
| 3,350 | Vedanta Ltd. | 17,196 | ||||||
|
| |||||||
| 51,783 | ||||||||
|
| |||||||
Indonesia — 1.2% | ||||||||
| 17,953 | Bank Negara Indonesia Persero Tbk. PT | 10,064 | ||||||
| 12,975 | Bank Rakyat Indonesia Persero Tbk. PT | 14,928 | ||||||
|
| |||||||
| 24,992 | ||||||||
|
| |||||||
Luxembourg — 0.3% | ||||||||
| 213 | Ternium SA, ADR | 6,606 | ||||||
|
| |||||||
Malaysia — 2.6% | ||||||||
| 12,441 | AirAsia Bhd. | 9,818 | ||||||
| 8,217 | CIMB Group Holdings Bhd. | 11,918 | ||||||
| 2,625 | Genting Bhd. | 5,611 | ||||||
| 5,782 | Malayan Banking Bhd. | 12,633 | ||||||
| 3,660 | Tenaga Nasional Bhd. | 12,966 | ||||||
|
| |||||||
| 52,946 | ||||||||
|
| |||||||
Mexico — 0.3% | ||||||||
| 1,064 | Grupo Financiero Banorte SAB de CV, Class O | 6,302 | ||||||
|
| |||||||
SEE NOTES TO FINANCIAL STATEMENTS.
| 30 | J.P. MORGAN INTERNATIONAL EQUITY FUNDS | OCTOBER 31, 2017 | ||||
Table of Contents
| SHARES | SECURITY DESCRIPTION | VALUE($) | ||||||
Common Stocks — continued | ||||||||
Panama — 1.3% | ||||||||
| 207 | Copa Holdings SA, Class A | 25,459 | ||||||
|
| |||||||
Poland — 2.0% | ||||||||
| 146 | Jastrzebska Spolka Weglowa SA (a) | 3,926 | ||||||
| 313 | KGHM Polska Miedz SA | 10,570 | ||||||
| 551 | Polski Koncern Naftowy ORLEN SA | 19,488 | ||||||
| 4,160 | Polskie Gornictwo Naftowe i Gazownictwo SA | 7,645 | ||||||
|
| |||||||
| 41,629 | ||||||||
|
| |||||||
Qatar — 0.3% | ||||||||
| 203 | Qatar National Bank QPSC | 6,782 | ||||||
|
| |||||||
Russia — 7.5% | ||||||||
| 1,592 | Aeroflot PJSC | 4,900 | ||||||
| 11,486 | Alrosa PJSC | 14,763 | ||||||
| 941 | Evraz plc | 3,608 | ||||||
| 10,213 | Magnitogorsk Iron & Steel Works PJSC | 7,710 | ||||||
| 1,059 | MMC Norilsk Nickel PJSC, ADR | 19,482 | ||||||
| 1,846 | Mobile TeleSystems PJSC, ADR | 19,590 | ||||||
| 164 | Ros Agro plc, Reg. S, GDR | 1,967 | ||||||
| 324,010 | RusHydro PJSC | 4,526 | ||||||
| 1,776 | Sberbank of Russia PJSC, ADR | 25,487 | ||||||
| 888 | Severstal PJSC, Reg. S, GDR | 13,539 | ||||||
| 20,045 | Surgutneftegas OJSC (Preference) | 9,935 | ||||||
| 279 | Tatneft PJSC, ADR | 12,550 | ||||||
| 6,697 | United Co. RUSAL plc | 4,323 | ||||||
| 238 | X5 Retail Group NV, Reg. S, GDR (a) | 9,780 | ||||||
|
| |||||||
| 152,160 | ||||||||
|
| |||||||
Singapore — 0.6% | ||||||||
| 8,860 | IGG, Inc. | 11,895 | ||||||
|
| |||||||
South Africa — 1.5% | ||||||||
| 264 | Kumba Iron Ore Ltd. | 5,078 | ||||||
| 337 | Nedbank Group Ltd. | 4,936 | ||||||
| 1,746 | Standard Bank Group Ltd. | 20,271 | ||||||
|
| |||||||
| 30,285 | ||||||||
|
| |||||||
South Korea — 17.4% | ||||||||
| 532 | Hana Financial Group, Inc. | 22,787 | ||||||
| 114 | Hyosung Corp. | 13,666 | ||||||
| 231 | Hyundai Engineering & Construction Co. Ltd. | 7,798 | ||||||
| 238 | Hyundai Marine & Fire Insurance Co. Ltd. | 9,652 | ||||||
| 1,103 | Industrial Bank of Korea | 15,116 | ||||||
| 465 | Korea Electric Power Corp. | 16,298 | ||||||
| 257 | KT&G Corp. | 24,343 | ||||||
| 65 | LG Chem Ltd. | 23,317 | ||||||
| 597 | LG Uplus Corp. | 6,856 | ||||||
| 53 | NCSoft Corp. | 20,022 | ||||||
| SHARES | SECURITY DESCRIPTION | VALUE($) | ||||||
South Korea — continued | ||||||||
| 67 | POSCO | 19,565 | ||||||
| 20 | Samsung Electronics Co. Ltd. | 48,646 | ||||||
| 21 | Samsung SDI Co. Ltd. | 3,882 | ||||||
| 171 | Seoul Semiconductor Co. Ltd. | 4,188 | ||||||
| 146 | SFA Engineering Corp. | 5,314 | ||||||
| 463 | Shinhan Financial Group Co. Ltd. | 20,787 | ||||||
| 329 | SK Hynix, Inc. | 24,242 | ||||||
| 135 | SK Innovation Co. Ltd. | 24,684 | ||||||
| 165 | S-Oil Corp. | 18,951 | ||||||
| 137 | TES Co. Ltd. | 4,252 | ||||||
| 1,356 | Woori Bank | 19,848 | ||||||
|
| |||||||
| 354,214 | ||||||||
|
| |||||||
Taiwan — 11.5% | ||||||||
| 5,134 | Accton Technology Corp. | 16,554 | ||||||
| 1,462 | Catcher Technology Co. Ltd. | 15,560 | ||||||
| 34,313 | CTBC Financial Holding Co. Ltd. | 21,969 | ||||||
| 1,746 | Elite Material Co. Ltd. | 6,953 | ||||||
| 2,578 | FLEXium Interconnect, Inc. (a) | 9,886 | ||||||
| 11,551 | Fubon Financial Holding Co. Ltd. | 18,409 | ||||||
| 1,777 | General Interface Solution Holding Ltd. | 16,315 | ||||||
| 120 | Grape King Bio Ltd. | 691 | ||||||
| 7,257 | Hon Hai Precision Industry Co. Ltd. | 26,972 | ||||||
| 136 | Largan Precision Co. Ltd. | 25,780 | ||||||
| 2,627 | Merry Electronics Co. Ltd. | 20,096 | ||||||
| 3,177 | Pegatron Corp. | 8,232 | ||||||
| 368 | Phison Electronics Corp. | 4,381 | ||||||
| 3,225 | Powertech Technology, Inc. | 10,100 | ||||||
| 539 | Taiwan Semiconductor Manufacturing Co. Ltd., ADR | 22,801 | ||||||
| 20,484 | Yuanta Financial Holding Co. Ltd. | 9,110 | ||||||
|
| |||||||
| 233,809 | ||||||||
|
| |||||||
Thailand — 4.0% | ||||||||
| 3,188 | Kiatnakin Bank PCL | 7,267 | ||||||
| 30,960 | Krung Thai Bank PCL | 16,968 | ||||||
| 4,309 | PTT Global Chemical PCL | 10,380 | ||||||
| 1,617 | PTT PCL | 20,454 | ||||||
| 17,443 | Star Petroleum Refining PCL | 9,142 | ||||||
| 3,166 | Thai Oil PCL | 9,720 | ||||||
| 2,728 | Tisco Financial Group PCL | 7,207 | ||||||
|
| |||||||
| 81,138 | ||||||||
|
| |||||||
Turkey — 4.8% | ||||||||
| 5,340 | Akbank TAS | 14,127 | ||||||
| 3,357 | Eregli Demir ve Celik Fabrikalari TAS | 7,889 | ||||||
| 7,224 | Petkim Petrokimya Holding A/S | 12,666 | ||||||
SEE NOTES TO FINANCIAL STATEMENTS.
| OCTOBER 31, 2017 | J.P. MORGAN INTERNATIONAL EQUITY FUNDS | 31 | ||||||
Table of Contents
JPMorgan Emerging Economies Fund
SCHEDULE OF PORTFOLIO INVESTMENTS
AS OF OCTOBER 31, 2017 (continued)
(Amounts in thousands, except number of Futures contracts)
| SHARES | SECURITY DESCRIPTION | VALUE($) | ||||||
Common Stocks — continued | ||||||||
Turkey — continued | ||||||||
| 2,064 | Tekfen Holding A/S | 6,983 | ||||||
| 614 | Tupras Turkiye Petrol Rafinerileri A/S | 22,127 | ||||||
| 5,054 | Turkcell Iletisim Hizmetleri A/S | 18,937 | ||||||
| 5,160 | Turkiye Halk Bankasi A/S | 15,074 | ||||||
|
| |||||||
| 97,803 | ||||||||
|
| |||||||
United States — 0.5% | ||||||||
| 137 | Cognizant Technology Solutions Corp., Class A | 10,353 | ||||||
|
| |||||||
Vietnam — 0.4% | ||||||||
| 4,577 | Hoa Phat Group JSC (a) | 7,456 | ||||||
|
| |||||||
Total Common Stocks | 1,952,430 | |||||||
|
| |||||||
| NUMBER OF RIGHTS | ||||||||
Rights — 0.0% (g) | ||||||||
Taiwan — 0.0% (g) | ||||||||
| 470 | CTBC Financial Holding Co. Ltd., expiring 12/15/2017 (a) | — | (h) | |||||
|
| |||||||
| SHARES | ||||||||
Short-Term Investment — 4.1% | ||||||||
Investment Company — 4.1% | ||||||||
| 84,272 | JPMorgan U.S. Government Money Market Fund, Institutional Class Shares, 0.92% (b) (l) | 84,272 | ||||||
|
| |||||||
Total Investments — 100.0% | 2,036,702 | |||||||
Other Assets in Excess of | 993 | |||||||
|
| |||||||
NET ASSETS — 100.0% | $ | 2,037,695 | ||||||
|
| |||||||
Percentages indicated are based on net assets.
Summary of Investments by Industry, October 31, 2017
The following table represents the portfolio investments of the Fund by industry classifications as a percentage of total investments:
| INDUSTRY | PERCENTAGE | |||
Banks | 24.2 | % | ||
Oil, Gas & Consumable Fuels | 8.6 | |||
Metals & Mining | 8.3 | |||
Electronic Equipment, Instruments & Components | 7.6 | |||
Internet Software & Services | 6.9 | |||
Semiconductors & Semiconductor Equipment | 3.6 | |||
Technology Hardware, Storage & Peripherals | 3.6 | |||
Chemicals | 3.4 | |||
Insurance | 2.7 | |||
Airlines | 2.3 | |||
Electric Utilities | 2.2 | |||
Automobiles | 2.0 | |||
Wireless Telecommunication Services | 1.9 | |||
Household Durables | 1.6 | |||
Software | 1.6 | |||
IT Services | 1.4 | |||
Communications Equipment | 1.4 | |||
Paper & Forest Products | 1.4 | |||
Diversified Financial Services | 1.3 | |||
Food Products | 1.2 | |||
Tobacco | 1.2 | |||
Others (each less than 1.0%) | 7.5 | |||
Short-Term Investment | 4.1 | |||
| Futures contracts outstanding as of October 31, 2017: | ||||||||||||||||||||
| DESCRIPTION | NUMBER OF CONTRACTS | EXPIRATION DATE | TRADING CURRENCY | NOTIONAL AMOUNT ($) | VALUE AND UNREALIZED APPRECIATION (DEPRECIATION) ($) | |||||||||||||||
Long Contracts | ||||||||||||||||||||
MSCI Emerging Markets E-Mini Index | 633 | 12/2017 | USD | 35,581 | 564 | |||||||||||||||
|
| |||||||||||||||||||
| 564 | ||||||||||||||||||||
|
| |||||||||||||||||||
SEE NOTES TO FINANCIAL STATEMENTS.
| 32 | J.P. MORGAN INTERNATIONAL EQUITY FUNDS | OCTOBER 31, 2017 | ||||
Table of Contents
JPMorgan Emerging Markets Equity Fund
SCHEDULE OF PORTFOLIO INVESTMENTS
AS OF OCTOBER 31, 2017
(Amounts in thousands)
| SHARES | SECURITY DESCRIPTION | VALUE($) | ||||||
Common Stocks — 96.8% | ||||||||
Argentina — 1.4% | ||||||||
| 261 | MercadoLibre, Inc. | 62,699 | ||||||
|
| |||||||
Australia — 0.5% | ||||||||
| 4,107 | Oil Search Ltd. | 23,282 | ||||||
|
| |||||||
Brazil — 10.4% | ||||||||
| 8,231 | Ambev SA, ADR | 52,102 | ||||||
| 3,884 | BB Seguridade Participacoes SA | 32,782 | ||||||
| 5,580 | CCR SA | 30,978 | ||||||
| 3,264 | Cielo SA | 22,292 | ||||||
| 1,076 | Itau Unibanco Holding SA (Preference) | 13,885 | ||||||
| 4,059 | Itau Unibanco Holding SA, ADR | 52,000 | ||||||
| 14,662 | Kroton Educacional SA | 81,306 | ||||||
| 6,545 | Lojas Renner SA (a) | 68,830 | ||||||
| 846 | Marcopolo SA (a) | 861 | ||||||
| 6,582 | Marcopolo SA (Preference) (a) | 8,008 | ||||||
| 1,331 | Raia Drogasil SA (a) | 32,034 | ||||||
| 2,252 | Ultrapar Participacoes SA | 53,975 | ||||||
| 2,410 | WEG SA | 15,773 | ||||||
|
| |||||||
| 464,826 | ||||||||
|
| |||||||
China — 26.1% | ||||||||
| 2,320 | AAC Technologies Holdings, Inc. | 42,533 | ||||||
| 1,279 | Alibaba Group Holding Ltd., ADR (a) | 236,461 | ||||||
| 15,417 | Fuyao Glass Industry Group Co. Ltd., Class A | 63,123 | ||||||
| 8,995 | Hangzhou Robam Appliances Co. Ltd., Class A | 63,069 | ||||||
| 2,598 | JD.com, Inc., ADR (a) | 97,489 | ||||||
| 387 | Kweichow Moutai Co. Ltd., Class A | 36,098 | ||||||
| 9,401 | Midea Group Co. Ltd., Class A | 72,362 | ||||||
| 504 | New Oriental Education & Technology Group, Inc., ADR | 41,993 | ||||||
| 17,489 | Ping An Insurance Group Co. of China Ltd., Class H | 153,692 | ||||||
| 4,591 | Shenzhou International Group Holdings Ltd. | 39,231 | ||||||
| 693 | TAL Education Group, ADR | 19,056 | ||||||
| 6,561 | Tencent Holdings Ltd. | 294,889 | ||||||
|
| |||||||
| 1,159,996 | ||||||||
|
| |||||||
Egypt — 0.7% | ||||||||
| 6,541 | Commercial International Bank Egypt SAE (Registered), GDR | 29,860 | ||||||
|
| |||||||
Hong Kong — 6.3% | ||||||||
| 22,769 | AIA Group Ltd. | 171,572 | ||||||
| 516 | Jardine Matheson Holdings Ltd. | 33,037 | ||||||
| 6,128 | Sands China Ltd. | 28,908 | ||||||
| 8,038 | Techtronic Industries Co. Ltd. | 47,185 | ||||||
|
| |||||||
| 280,702 | ||||||||
|
| |||||||
| SHARES | SECURITY DESCRIPTION | VALUE($) | ||||||
India — 16.4% | ||||||||
| 1,781 | Asian Paints Ltd. | 32,524 | ||||||
| 3,414 | HDFC Bank Ltd. | 95,494 | ||||||
| 945 | HDFC Bank Ltd., ADR | 87,203 | ||||||
| 5,831 | Housing Development Finance Corp. Ltd. | 153,770 | ||||||
| 2,454 | IndusInd Bank Ltd. | 61,680 | ||||||
| 14,965 | ITC Ltd. | 61,442 | ||||||
| 2,674 | Kotak Mahindra Bank Ltd. | 42,343 | ||||||
| 2,518 | Tata Consultancy Services Ltd. | 102,075 | ||||||
| 1,135 | Tata Motors Ltd., ADR (a) | 37,193 | ||||||
| 799 | UltraTech Cement Ltd. | 54,323 | ||||||
|
| |||||||
| 728,047 | ||||||||
|
| |||||||
Indonesia — 2.8% | ||||||||
| 71,409 | Astra International Tbk. PT | 42,122 | ||||||
| 35,605 | Bank Central Asia Tbk. PT | 54,848 | ||||||
| 23,402 | Bank Rakyat Indonesia Persero Tbk. PT | 26,924 | ||||||
|
| |||||||
| 123,894 | ||||||||
|
| |||||||
Mexico — 2.2% | ||||||||
| 9,980 | Becle SAB de CV (a) | 15,939 | ||||||
| 8,736 | Grupo Financiero Banorte SAB de CV, Class O | 51,763 | ||||||
| 6,086 | Infraestructura Energetica Nova SAB de CV | 31,047 | ||||||
|
| |||||||
| 98,749 | ||||||||
|
| |||||||
Panama — 1.1% | ||||||||
| 405 | Copa Holdings SA, Class A | 49,888 | ||||||
|
| |||||||
Peru — 1.5% | ||||||||
| 310 | Credicorp Ltd. | 64,888 | ||||||
|
| |||||||
Russia — 4.1% | ||||||||
| 446 | Magnit PJSC | 58,601 | ||||||
| 146 | Magnit PJSC, Reg. S, GDR | 4,122 | ||||||
| 36,641 | Sberbank of Russia PJSC | 121,415 | ||||||
|
| |||||||
| 184,138 | ||||||||
|
| |||||||
South Africa — 6.2% | ||||||||
| 4,435 | Bid Corp. Ltd. | 97,555 | ||||||
| 3,896 | Bidvest Group Ltd. (The) | 47,298 | ||||||
| 336 | Capitec Bank Holdings Ltd. | 22,313 | ||||||
| 9,029 | FirstRand Ltd. | 32,773 | ||||||
| 1,734 | Mr Price Group Ltd. | 21,486 | ||||||
| 706 | Remgro Ltd. | 10,680 | ||||||
| 8,806 | Sanlam Ltd. | 44,077 | ||||||
|
| |||||||
| 276,182 | ||||||||
|
| |||||||
South Korea — 5.4% | ||||||||
| 182 | Netmarble Games Corp., Reg. S (a) (e) | 28,202 | ||||||
| 99 | Samsung Biologics Co. Ltd., Reg. S (a) (e) | 34,074 | ||||||
SEE NOTES TO FINANCIAL STATEMENTS.
| OCTOBER 31, 2017 | J.P. MORGAN INTERNATIONAL EQUITY FUNDS | 33 | ||||||
Table of Contents
JPMorgan Emerging Markets Equity Fund
SCHEDULE OF PORTFOLIO INVESTMENTS
AS OF OCTOBER 31, 2017 (continued)
(Amounts in thousands)
| SHARES | SECURITY DESCRIPTION | VALUE($) | ||||||
Common Stocks — continued | ||||||||
South Korea — continued | ||||||||
| 72 | Samsung Electronics Co. Ltd. | 177,155 | ||||||
|
| |||||||
| 239,431 | ||||||||
|
| |||||||
Spain — 0.6% | ||||||||
| 3,396 | Prosegur Cia de Seguridad SA | 25,917 | ||||||
|
| |||||||
Taiwan — 7.6% | ||||||||
| 3,928 | Delta Electronics, Inc. | 18,900 | ||||||
| 423 | Largan Precision Co. Ltd. | 80,184 | ||||||
| 5,867 | President Chain Store Corp. | 52,756 | ||||||
| 4,448 | Taiwan Semiconductor Manufacturing Co. Ltd., ADR | 188,279 | ||||||
|
| |||||||
| 340,119 | ||||||||
|
| |||||||
Thailand — 0.8% | ||||||||
| 5,132 | Kasikornbank PCL, NVDR | 33,988 | ||||||
|
| |||||||
Turkey — 0.3% | ||||||||
| 1,037 | Ford Otomotiv Sanayi A/S | 14,648 | ||||||
|
| |||||||
United States — 2.4% | ||||||||
| 627 | EPAM Systems, Inc. (a) | 57,136 | ||||||
| 187 | Luxoft Holding, Inc. (a) | 8,728 | ||||||
| 996 | Yum China Holdings, Inc. (a) | 40,197 | ||||||
|
| |||||||
| 106,061 | ||||||||
|
| |||||||
Total Common Stocks | 4,307,315 | |||||||
|
| |||||||
| NUMBER OF WARRANTS | ||||||||
Warrants — 0.6% | ||||||||
United States — 0.6% | ||||||||
Almarai Co. | ||||||||
| 1,597 | expiring 07/11/2019 | 23,268 | ||||||
| 90 | expiring 07/20/2020 | 1,314 | ||||||
|
| |||||||
Total Warrants | 24,582 | |||||||
|
| |||||||
| SHARES | SECURITY DESCRIPTION | VALUE($) | ||||||
Short-Term Investment — 2.9% | ||||||||
Investment Company — 2.9% | ||||||||
| 128,728 | JPMorgan U.S. Government Money Market Fund, Institutional Class Shares, 0.92%, (b) (l) | 128,728 | ||||||
|
| |||||||
Total Investments — 100.3% | 4,460,625 | |||||||
Liabilities in Excess of | (12,737 | ) | ||||||
|
| |||||||
NET ASSETS — 100.0% | $ | 4,447,888 | ||||||
|
| |||||||
Percentages indicated are based on net assets.
Summary of Investments by Industry, October 31, 2017
The following table represents the portfolio investments of the Fund by industry classifications as a percentage of total investments:
| INDUSTRY | PERCENTAGE | |||
Banks | 17.0 | % | ||
Internet Software & Services | 13.3 | |||
Insurance | 9.0 | |||
Food & Staples Retailing | 5.5 | |||
IT Services | 4.3 | |||
Semiconductors & Semiconductor Equipment | 4.2 | |||
Household Durables | 4.1 | |||
Technology Hardware, Storage & Peripherals | 4.0 | |||
Thrifts & Mortgage Finance | 3.4 | |||
Diversified Consumer Services | 3.2 | |||
Electronic Equipment, Instruments & Components | 3.2 | |||
Beverages | 2.3 | |||
Internet & Direct Marketing Retail | 2.2 | |||
Automobiles | 2.1 | |||
Industrial Conglomerates | 1.8 | |||
Oil, Gas & Consumable Fuels | 1.7 | |||
Hotels, Restaurants & Leisure | 1.6 | |||
Multiline Retail | 1.5 | |||
Auto Components | 1.4 | |||
Tobacco | 1.4 | |||
Construction Materials | 1.2 | |||
Airlines | 1.1 | |||
Diversified Financial Services | 1.0 | |||
Others (each less than 1.0%) | 6.6 | |||
Short-Term Investment | 2.9 | |||
SEE NOTES TO FINANCIAL STATEMENTS.
| 34 | J.P. MORGAN INTERNATIONAL EQUITY FUNDS | OCTOBER 31, 2017 | ||||
Table of Contents
JPMorgan Global Research Enhanced Index Fund
SCHEDULE OF PORTFOLIO INVESTMENTS
AS OF OCTOBER 31, 2017
(Amounts in thousands)
| SHARES | SECURITY DESCRIPTION | VALUE($) | ||||||
Common Stocks — 98.5% | ||||||||
Australia — 2.5% | ||||||||
| 114 | AGL Energy Ltd. | 2,213 | ||||||
| 1,184 | Alumina Ltd. | 2,124 | ||||||
| 332 | Amcor Ltd. | 4,032 | ||||||
| 531 | AMP Ltd. | 2,024 | ||||||
| 306 | APA Group | 2,009 | ||||||
| 74 | Aristocrat Leisure Ltd. | 1,334 | ||||||
| 24 | ASX Ltd. | 996 | ||||||
| 709 | Aurizon Holdings Ltd. | 2,814 | ||||||
| 693 | Australia & New Zealand Banking Group Ltd. | 15,899 | ||||||
| 86 | Bendigo & Adelaide Bank Ltd. | 747 | ||||||
| 703 | BHP Billiton Ltd. | 14,475 | ||||||
| 131 | BHP Billiton plc | 2,366 | ||||||
| 237 | Boral Ltd. | 1,302 | ||||||
| 337 | Brambles Ltd. | 2,446 | ||||||
| 82 | Caltex Australia Ltd. | 2,144 | ||||||
| 96 | Challenger Ltd. | 984 | ||||||
| 240 | Coca-Cola Amatil Ltd. | 1,498 | ||||||
| 19 | Cochlear Ltd. | 2,615 | ||||||
| 369 | Commonwealth Bank of Australia | 21,975 | ||||||
| 187 | Computershare Ltd. | 2,230 | ||||||
| 10 | Crown Resorts Ltd. | 90 | ||||||
| 99 | CSL Ltd. | 10,536 | ||||||
| 228 | Dexus | 1,708 | ||||||
| 165 | Fortescue Metals Group Ltd. | 587 | ||||||
| 449 | Goodman Group | 2,879 | ||||||
| 152 | GPT Group (The) | 595 | ||||||
| 274 | Incitec Pivot Ltd. | 805 | ||||||
| 405 | Insurance Australia Group Ltd. | 2,037 | ||||||
| 121 | LendLease Group | 1,502 | ||||||
| 75 | Macquarie Group Ltd. | 5,694 | ||||||
| 487 | Medibank Pvt Ltd. | 1,145 | ||||||
| 1,448 | Mirvac Group | 2,677 | ||||||
| 611 | National Australia Bank Ltd. | 15,297 | ||||||
| 157 | Newcrest Mining Ltd. | 2,680 | ||||||
| 357 | Oil Search Ltd. | 2,025 | ||||||
| 130 | Orica Ltd. | 2,080 | ||||||
| 333 | Origin Energy Ltd. (a) | 2,031 | ||||||
| 370 | Qantas Airways Ltd. | 1,748 | ||||||
| 391 | QBE Insurance Group Ltd. | 3,206 | ||||||
| 40 | Ramsay Health Care Ltd. | 2,072 | ||||||
| 25 | REA Group Ltd. | 1,366 | ||||||
| 317 | Santos Ltd. | 1,095 | ||||||
| 1,503 | Scentre Group | 4,633 | ||||||
| 6 | SEEK Ltd. | 87 | ||||||
| 54 | Sonic Healthcare Ltd. | 895 | ||||||
| SHARES | SECURITY DESCRIPTION | VALUE($) | ||||||
Australia — continued | ||||||||
| 1,438 | South32 Ltd. | 3,756 | ||||||
| 544 | Stockland | 1,884 | ||||||
| 377 | Suncorp Group Ltd. | 3,921 | ||||||
| 380 | Sydney Airport | 2,070 | ||||||
| 341 | Tabcorp Holdings Ltd. | 1,173 | ||||||
| 247 | Tatts Group Ltd. | 791 | ||||||
| 954 | Telstra Corp. Ltd. | 2,589 | ||||||
| 175 | TPG Telecom Ltd. | 724 | ||||||
| 545 | Transurban Group | 5,065 | ||||||
| 110 | Treasury Wine Estates Ltd. | 1,317 | ||||||
| 634 | Vicinity Centres | 1,289 | ||||||
| 237 | Wesfarmers Ltd. | 7,592 | ||||||
| 278 | Westfield Corp. | 1,657 | ||||||
| 711 | Westpac Banking Corp. | 18,005 | ||||||
| 156 | Woodside Petroleum Ltd. | 3,685 | ||||||
| 328 | Woolworths Ltd. | 6,509 | ||||||
|
| |||||||
| 217,724 | ||||||||
|
| |||||||
Austria — 0.1% | ||||||||
| 272 | Erste Group Bank AG (a) | 11,660 | ||||||
|
| |||||||
Belgium — 0.5% | ||||||||
| 136 | Anheuser-Busch InBev SA/NV | 16,626 | ||||||
| 166 | KBC Group NV | 13,785 | ||||||
| 80 | UCB SA | 5,843 | ||||||
| 147 | Umicore SA | 6,571 | ||||||
|
| |||||||
| 42,825 | ||||||||
|
| |||||||
Bermuda — 0.1% | ||||||||
| 93 | Marvell Technology Group Ltd. | 1,719 | ||||||
| 124 | XL Group Ltd. | 5,021 | ||||||
|
| |||||||
| 6,740 | ||||||||
|
| |||||||
Canada — 3.3% | ||||||||
| 52 | Agnico Eagle Mines Ltd. | 2,325 | ||||||
| 33 | Agrium, Inc. | 3,544 | ||||||
| 104 | Alimentation Couche-Tard, Inc., Class B | 4,886 | ||||||
| 85 | ARC Resources Ltd. | 1,031 | ||||||
| 155 | Bank of Montreal | 11,870 | ||||||
| 280 | Bank of Nova Scotia (The) | 18,096 | ||||||
| 275 | Barrick Gold Corp. | 3,980 | ||||||
| 36 | BCE, Inc. | 1,678 | ||||||
| 221 | Brookfield Asset Management, Inc., Class A | 9,263 | ||||||
| 98 | Canadian Imperial Bank of Commerce | 8,625 | ||||||
| 188 | Canadian National Railway Co. | 15,106 | ||||||
| 270 | Canadian Natural Resources Ltd. | 9,431 | ||||||
| 36 | Canadian Pacific Railway Ltd. | 6,230 | ||||||
| 17 | Canadian Tire Corp. Ltd., Class A | 2,108 | ||||||
SEE NOTES TO FINANCIAL STATEMENTS.
| OCTOBER 31, 2017 | J.P. MORGAN INTERNATIONAL EQUITY FUNDS | 35 | ||||||
Table of Contents
JPMorgan Global Research Enhanced Index Fund
SCHEDULE OF PORTFOLIO INVESTMENTS
AS OF OCTOBER 31, 2017 (continued)
(Amounts in thousands)
| SHARES | SECURITY DESCRIPTION | VALUE($) | ||||||
Common Stocks — continued | ||||||||
Canada — continued | ||||||||
| 209 | Cenovus Energy, Inc. | 2,027 | ||||||
| 55 | CGI Group, Inc., Class A (a) | 2,910 | ||||||
| 5 | Constellation Software, Inc. | 2,678 | ||||||
| 126 | Crescent Point Energy Corp. | 1,033 | ||||||
| 29 | Dollarama, Inc. | 3,197 | ||||||
| 194 | Enbridge, Inc. | 7,456 | ||||||
| 211 | Encana Corp. | 2,471 | ||||||
| 6 | Fairfax Financial Holdings Ltd. | 2,909 | ||||||
| 69 | Fortis, Inc. | 2,542 | ||||||
| 43 | Franco-Nevada Corp. | 3,384 | ||||||
| 57 | Gildan Activewear, Inc. | 1,740 | ||||||
| 198 | Goldcorp, Inc. | 2,583 | ||||||
| 73 | Great-West Lifeco, Inc. | 2,037 | ||||||
| 73 | Imperial Oil Ltd. | 2,377 | ||||||
| 32 | Intact Financial Corp. | 2,647 | ||||||
| 84 | Inter Pipeline Ltd. | 1,702 | ||||||
| 294 | Kinross Gold Corp. (a) | 1,162 | ||||||
| 56 | Loblaw Cos. Ltd. | 2,888 | ||||||
| 98 | Magna International, Inc. | 5,362 | ||||||
| 486 | Manulife Financial Corp. | 9,770 | ||||||
| 59 | Metro, Inc. | 1,868 | ||||||
| 82 | National Bank of Canada | 3,988 | ||||||
| 60 | Open Text Corp. | 2,089 | ||||||
| 93 | Pembina Pipeline Corp. | 3,083 | ||||||
| 207 | Potash Corp. of Saskatchewan, Inc. | 4,024 | ||||||
| 92 | Power Corp. of Canada | 2,370 | ||||||
| 62 | Power Financial Corp. | 1,726 | ||||||
| 54 | Restaurant Brands International, Inc. | 3,497 | ||||||
| 89 | Rogers Communications, Inc., Class B | 4,636 | ||||||
| 336 | Royal Bank of Canada | 26,252 | ||||||
| 63 | Saputo, Inc. | 2,281 | ||||||
| 101 | Shaw Communications, Inc., Class B | 2,297 | ||||||
| 37 | SNC-Lavalin Group, Inc. | 1,657 | ||||||
| 152 | Sun Life Financial, Inc. | 5,916 | ||||||
| 383 | Suncor Energy, Inc. | 12,994 | ||||||
| 133 | Teck Resources Ltd., Class B | 2,713 | ||||||
| 85 | Thomson Reuters Corp. | 3,968 | ||||||
| 423 | Toronto-Dominion Bank (The) | 24,063 | ||||||
| 175 | TransCanada Corp. | 8,299 | ||||||
| 62 | Waste Connections, Inc. | 4,354 | ||||||
| 103 | Wheaton Precious Metals Corp. | 2,140 | ||||||
|
| |||||||
| 285,263 | ||||||||
|
| |||||||
China — 0.1% | ||||||||
| 981 | BOC Hong Kong Holdings Ltd. | 4,674 | ||||||
| 412 | Yangzijiang Shipbuilding Holdings Ltd. | 476 | ||||||
|
| |||||||
| 5,150 | ||||||||
|
| |||||||
| SHARES | SECURITY DESCRIPTION | VALUE($) | ||||||
Denmark — 0.6% | ||||||||
| 41 | Chr Hansen Holding A/S | 3,551 | ||||||
| 241 | Danske Bank A/S | 9,213 | ||||||
| 546 | Novo Nordisk A/S, Class B | 27,189 | ||||||
| 94 | Pandora A/S | 8,882 | ||||||
| 942 | TDC A/S | 5,572 | ||||||
|
| |||||||
| 54,407 | ||||||||
|
| |||||||
Finland — 0.2% | ||||||||
| 106 | Cargotec OYJ, Class B | 6,273 | ||||||
| 474 | Outokumpu OYJ | 4,484 | ||||||
| 279 | Stora Enso OYJ, Class R | 4,363 | ||||||
| 199 | UPM-Kymmene OYJ | 5,975 | ||||||
|
| |||||||
| 21,095 | ||||||||
|
| |||||||
France — 4.3% | ||||||||
| 203 | Accor SA | 10,143 | ||||||
| 187 | Air Liquide SA | 23,844 | ||||||
| 211 | Airbus SE | 21,621 | ||||||
| 86 | Arkema SA | 10,811 | ||||||
| 946 | AXA SA | 28,549 | ||||||
| 395 | BNP Paribas SA | 30,865 | ||||||
| 82 | Capgemini SE | 9,936 | ||||||
| 28 | Cie Generale des Etablissements Michelin | 4,101 | ||||||
| 40 | Kering | 18,390 | ||||||
| 23 | L’Oreal SA | 5,039 | ||||||
| 47 | LVMH Moet Hennessy Louis Vuitton SE | 14,065 | ||||||
| 1,472 | Natixis SA | 11,547 | ||||||
| 105 | Pernod Ricard SA | 15,784 | ||||||
| 265 | Peugeot SA | 6,291 | ||||||
| 128 | Renault SA | 12,738 | ||||||
| 324 | Sanofi | 30,644 | ||||||
| 293 | Schneider Electric SE (a) | 25,786 | ||||||
| 110 | Sodexo SA | 13,958 | ||||||
| 129 | Thales SA | 13,393 | ||||||
| 724 | TOTAL SA | 40,355 | ||||||
| 6 | Unibail-Rodamco SE | 1,593 | ||||||
| 180 | Vinci SA | 17,657 | ||||||
| 162 | Vivendi SA | 4,017 | ||||||
|
| |||||||
| 371,127 | ||||||||
|
| |||||||
Germany — 3.5% | ||||||||
| 88 | adidas AG | 19,684 | ||||||
| 46 | Allianz SE (Registered) | 10,727 | ||||||
| 140 | BASF SE | 15,364 | ||||||
| 137 | Bayer AG (Registered) | 17,853 | ||||||
| 96 | Bayerische Motoren Werke AG | 9,818 | ||||||
| 97 | Brenntag AG | 5,480 | ||||||
SEE NOTES TO FINANCIAL STATEMENTS.
| 36 | J.P. MORGAN INTERNATIONAL EQUITY FUNDS | OCTOBER 31, 2017 | ||||
Table of Contents
| SHARES | SECURITY DESCRIPTION | VALUE($) | ||||||
Common Stocks — continued | ||||||||
Germany — continued | ||||||||
| 68 | Continental AG | 17,358 | ||||||
| 115 | Daimler AG (Registered) | 9,581 | ||||||
| 58 | Deutsche Post AG (Registered) | 2,650 | ||||||
| 691 | Deutsche Telekom AG (Registered) | 12,515 | ||||||
| 188 | Fresenius SE & Co. KGaA | 15,740 | ||||||
| 89 | Henkel AG & Co. KGaA (Preference) | 12,445 | ||||||
| 519 | Infineon Technologies AG | 14,346 | ||||||
| 32 | Linde AG (a) | 6,877 | ||||||
| 68 | Merck KGaA | 7,245 | ||||||
| 78 | Muenchener Rueckversicherungs-Gesellschaft AG in Muenchen (Registered) | 17,531 | ||||||
| 341 | SAP SE | 38,939 | ||||||
| 217 | Siemens AG (Registered) | 31,099 | ||||||
| 1,335 | Telefonica Deutschland Holding AG | 6,809 | ||||||
| 104 | Volkswagen AG (Preference) | 19,013 | ||||||
| 198 | Vonovia SE | 8,764 | ||||||
|
| |||||||
| 299,838 | ||||||||
|
| |||||||
Hong Kong — 1.2% | ||||||||
| 2,635 | AIA Group Ltd. | 19,858 | ||||||
| 67 | ASM Pacific Technology Ltd. | 982 | ||||||
| 41 | Bank of East Asia Ltd. (The) | 180 | ||||||
| 464 | CK Asset Holdings Ltd. | 3,817 | ||||||
| 703 | CK Hutchison Holdings Ltd. | 8,927 | ||||||
| 220 | CK Infrastructure Holdings Ltd. | 1,911 | ||||||
| 483 | CLP Holdings Ltd. | 4,916 | ||||||
| 586 | Galaxy Entertainment Group Ltd. | 3,996 | ||||||
| 59 | Hang Lung Properties Ltd. | 136 | ||||||
| 220 | Hang Seng Bank Ltd. | 5,205 | ||||||
| 385 | Henderson Land Development Co. Ltd. | 2,514 | ||||||
| 556 | HKT Trust & HKT Ltd. | 679 | ||||||
| 2,121 | Hong Kong & China Gas Co. Ltd. | 4,021 | ||||||
| 240 | Hong Kong Exchanges & Clearing Ltd. | 6,690 | ||||||
| 243 | Hongkong Land Holdings Ltd. | 1,763 | ||||||
| 2,431 | Hutchison Port Holdings Trust | 1,045 | ||||||
| 195 | I-CABLE Communications Ltd. (a) | 6 | ||||||
| 21 | Jardine Matheson Holdings Ltd. | 1,313 | ||||||
| 342 | Kerry Properties Ltd. | 1,539 | ||||||
| 1,756 | Li & Fung Ltd. | 885 | ||||||
| 394 | Link REIT | 3,313 | ||||||
| 220 | MTR Corp. Ltd. | 1,275 | ||||||
| 673 | New World Development Co. Ltd. | 1,003 | ||||||
| 410 | NWS Holdings Ltd. | 830 | ||||||
| 293 | Power Assets Holdings Ltd. | 2,536 | ||||||
| 691 | Sands China Ltd. | 3,259 | ||||||
| 1,172 | Sino Land Co. Ltd. | 2,020 | ||||||
| SHARES | SECURITY DESCRIPTION | VALUE($) | ||||||
Hong Kong — continued | ||||||||
| 381 | Sun Hung Kai Properties Ltd. | 6,233 | ||||||
| 204 | Swire Pacific Ltd., Class A | 2,011 | ||||||
| 99 | Techtronic Industries Co. Ltd. | 578 | ||||||
| 1,040 | WH Group Ltd., Reg. S (e) | 1,053 | ||||||
| 381 | Wharf Holdings Ltd. (The) | 3,470 | ||||||
| 352 | Wheelock & Co. Ltd. | 2,452 | ||||||
| 249 | Yue Yuen Industrial Holdings Ltd. | 954 | ||||||
|
| |||||||
| 101,370 | ||||||||
|
| |||||||
Ireland — 0.3% | ||||||||
| 258 | CRH plc | 9,728 | ||||||
| 141 | James Hardie Industries plc, CDI | 2,152 | ||||||
| 114 | Ryanair Holdings plc, ADR (a) | 12,814 | ||||||
|
| |||||||
| 24,694 | ||||||||
|
| |||||||
Israel — 0.0% (g) | ||||||||
| 155 | Teva Pharmaceutical Industries Ltd., ADR | 2,136 | ||||||
|
| |||||||
Italy — 0.8% | ||||||||
| 452 | Atlantia SpA | 14,723 | ||||||
| 3,826 | Enel SpA | 23,724 | ||||||
| 160 | Eni SpA | 2,619 | ||||||
| 644 | Intesa Sanpaolo SpA | 2,165 | ||||||
| 1,640 | Snam SpA | 8,376 | ||||||
| 740 | UniCredit SpA (a) | 14,136 | ||||||
|
| |||||||
| 65,743 | ||||||||
|
| |||||||
Japan — 8.8% | ||||||||
| 57 | AEON Financial Service Co. Ltd. | 1,229 | ||||||
| 80 | Aeon Mall Co. Ltd. | 1,432 | ||||||
| 227 | Ajinomoto Co., Inc. | 4,565 | ||||||
| 61 | Alfresa Holdings Corp. | 1,156 | ||||||
| 245 | Amada Holdings Co. Ltd. | 3,049 | ||||||
| 23 | ANA Holdings, Inc. | 880 | ||||||
| 166 | Asahi Group Holdings Ltd. | 7,575 | ||||||
| 347 | Asahi Kasei Corp. | 4,202 | ||||||
| 181 | Astellas Pharma, Inc. | 2,412 | ||||||
| 123 | Bandai Namco Holdings, Inc. | 4,212 | ||||||
| 217 | Bridgestone Corp. | 10,381 | ||||||
| 192 | Canon, Inc. | 7,198 | ||||||
| 11 | Central Japan Railway Co. | 1,944 | ||||||
| 29 | Chugai Pharmaceutical Co. Ltd. | 1,364 | ||||||
| 49 | Coca-Cola Bottlers Japan, Inc. | 1,704 | ||||||
| 765 | Concordia Financial Group Ltd. | 4,049 | ||||||
| 34 | Dai Nippon Printing Co. Ltd. | 803 | ||||||
| 338 | Daicel Corp. | 4,214 | ||||||
| 336 | Dai-ichi Life Holdings, Inc. | 6,425 | ||||||
| 292 | Daiichi Sankyo Co. Ltd. | 6,700 | ||||||
SEE NOTES TO FINANCIAL STATEMENTS.
| OCTOBER 31, 2017 | J.P. MORGAN INTERNATIONAL EQUITY FUNDS | 37 | ||||||
Table of Contents
JPMorgan Global Research Enhanced Index Fund
SCHEDULE OF PORTFOLIO INVESTMENTS
AS OF OCTOBER 31, 2017 (continued)
(Amounts in thousands)
| SHARES | SECURITY DESCRIPTION | VALUE($) | ||||||
Common Stocks — continued | ||||||||
Japan — continued | ||||||||
| 84 | Daikin Industries Ltd. | 9,272 | ||||||
| 20 | Daito Trust Construction Co. Ltd. | 3,514 | ||||||
| 223 | Daiwa House Industry Co. Ltd. | 8,177 | ||||||
| — | (h) | Daiwa House REIT Investment Corp. | 755 | |||||
| 120 | DeNA Co. Ltd. | 2,824 | ||||||
| 61 | Denso Corp. | 3,332 | ||||||
| 66 | East Japan Railway Co. | 6,381 | ||||||
| 173 | Electric Power Development Co. Ltd. | 4,365 | ||||||
| 32 | FANUC Corp. | 7,529 | ||||||
| 8 | Fast Retailing Co. Ltd. | 2,710 | ||||||
| 160 | Fuji Electric Co. Ltd. | 1,159 | ||||||
| 160 | FUJIFILM Holdings Corp. | 6,553 | ||||||
| 601 | Fujitsu Ltd. | 4,683 | ||||||
| 54 | Hakuhodo DY Holdings, Inc. | 751 | ||||||
| 49 | Hankyu Hanshin Holdings, Inc. | 1,899 | ||||||
| 25 | Hisamitsu Pharmaceutical Co., Inc. | 1,393 | ||||||
| 21 | Hitachi High-Technologies Corp. | 891 | ||||||
| 1,545 | Hitachi Ltd. | 12,303 | ||||||
| 492 | Honda Motor Co. Ltd. | 15,415 | ||||||
| 66 | Hoya Corp. | 3,575 | ||||||
| 318 | Hulic Co. Ltd. | 3,277 | ||||||
| 481 | ITOCHU Corp. | 8,417 | ||||||
| 280 | J Front Retailing Co. Ltd. | 4,151 | ||||||
| 123 | Japan Airlines Co. Ltd. | 4,200 | ||||||
| 40 | Japan Exchange Group, Inc. | 721 | ||||||
| 77 | Japan Post Bank Co. Ltd. | 978 | ||||||
| — | (h) | Japan Prime Realty Investment Corp. | 624 | |||||
| — | (h) | Japan Real Estate Investment Corp. | 1,491 | |||||
| 1 | Japan Retail Fund Investment Corp. | 1,184 | ||||||
| 339 | Japan Tobacco, Inc. | 11,221 | ||||||
| 92 | JFE Holdings, Inc. | 1,969 | ||||||
| 21 | JGC Corp. | 351 | ||||||
| 54 | JTEKT Corp. | 891 | ||||||
| 1,380 | JXTG Holdings, Inc. | 7,127 | ||||||
| 267 | Kansai Electric Power Co., Inc. (The) | 3,650 | ||||||
| 83 | Kao Corp. | 5,010 | ||||||
| 134 | Kawasaki Heavy Industries Ltd. | 4,689 | ||||||
| 323 | KDDI Corp. | 8,608 | ||||||
| 34 | Keikyu Corp. | 693 | ||||||
| 29 | Keyence Corp. | 15,879 | ||||||
| 21 | Kintetsu Group Holdings Co. Ltd. | 823 | ||||||
| 259 | Kirin Holdings Co. Ltd. | 6,205 | ||||||
| 192 | Komatsu Ltd. | 6,261 | ||||||
| 11 | Kose Corp. | 1,386 | ||||||
| 43 | Kubota Corp. | 805 | ||||||
| SHARES | SECURITY DESCRIPTION | VALUE($) | ||||||
Japan — continued | ||||||||
| 13 | Kyocera Corp. | 896 | ||||||
| 248 | Kyowa Hakko Kirin Co. Ltd. | 4,574 | ||||||
| 80 | Kyushu Electric Power Co., Inc. | 914 | ||||||
| 155 | M3, Inc. | 4,608 | ||||||
| 45 | Mabuchi Motor Co. Ltd. | 2,372 | ||||||
| 195 | Marubeni Corp. | 1,304 | ||||||
| 264 | Marui Group Co. Ltd. | 4,037 | ||||||
| 334 | Mazda Motor Corp. | 4,817 | ||||||
| 809 | Mebuki Financial Group, Inc. | 3,375 | ||||||
| 352 | Mitsubishi Chemical Holdings Corp. | 3,674 | ||||||
| 478 | Mitsubishi Corp. | 11,184 | ||||||
| 609 | Mitsubishi Electric Corp. | 10,417 | ||||||
| 88 | Mitsubishi Estate Co. Ltd. | 1,596 | ||||||
| 103 | Mitsubishi Tanabe Pharma Corp. | 2,267 | ||||||
| 3,152 | Mitsubishi UFJ Financial Group, Inc. | 21,379 | ||||||
| 253 | Mitsubishi UFJ Lease & Finance Co. Ltd. | 1,335 | ||||||
| 326 | Mitsui & Co. Ltd. | 4,869 | ||||||
| 166 | Mitsui Chemicals, Inc. | 5,116 | ||||||
| 32 | Mitsui Fudosan Co. Ltd. | 735 | ||||||
| 3,169 | Mizuho Financial Group, Inc. | 5,757 | ||||||
| 38 | MS&AD Insurance Group Holdings, Inc. | 1,284 | ||||||
| 45 | Murata Manufacturing Co. Ltd. | 7,119 | ||||||
| 192 | NGK Insulators Ltd. | 3,798 | ||||||
| 197 | NGK Spark Plug Co. Ltd. | 4,500 | ||||||
| 86 | NH Foods Ltd. | 2,474 | ||||||
| 83 | Nidec Corp. | 10,984 | ||||||
| 26 | Nintendo Co. Ltd. | 10,009 | ||||||
| — | (h) | Nippon Building Fund, Inc. | 1,547 | |||||
| — | (h) | Nippon Prologis REIT, Inc. | 540 | |||||
| 265 | Nippon Steel & Sumitomo Metal Corp. | 6,346 | ||||||
| 227 | Nippon Telegraph & Telephone Corp. | 10,951 | ||||||
| 140 | Nippon Yusen KK | 2,963 | ||||||
| 641 | Nissan Motor Co. Ltd. | 6,231 | ||||||
| 19 | Nisshin Seifun Group, Inc. | 330 | ||||||
| 26 | Nitori Holdings Co. Ltd. | 3,750 | ||||||
| 54 | Nitto Denko Corp. | 5,049 | ||||||
| 495 | Nomura Holdings, Inc. | 2,832 | ||||||
| 1 | Nomura Real Estate Master Fund, Inc. | 925 | ||||||
| 57 | Nomura Research Institute Ltd. | 2,425 | ||||||
| 118 | NSK Ltd. | 1,692 | ||||||
| 359 | NTT DOCOMO, Inc. | 8,682 | ||||||
| 134 | Obayashi Corp. | 1,760 | ||||||
| 92 | Olympus Corp. | 3,409 | ||||||
| 246 | Ono Pharmaceutical Co. Ltd. | 5,636 | ||||||
| 84 | Oriental Land Co. Ltd. | 6,687 | ||||||
SEE NOTES TO FINANCIAL STATEMENTS.
| 38 | J.P. MORGAN INTERNATIONAL EQUITY FUNDS | OCTOBER 31, 2017 | ||||
Table of Contents
| SHARES | SECURITY DESCRIPTION | VALUE($) | ||||||
Common Stocks — continued | ||||||||
Japan — continued | ||||||||
| 506 | ORIX Corp. | 8,703 | ||||||
| 64 | Otsuka Corp. | 4,363 | ||||||
| 163 | Otsuka Holdings Co. Ltd. | 6,788 | ||||||
| 561 | Panasonic Corp. | 8,463 | ||||||
| 215 | Rakuten, Inc. | 2,295 | ||||||
| 126 | Recruit Holdings Co. Ltd. | 3,084 | ||||||
| 215 | Resona Holdings, Inc. | 1,159 | ||||||
| 65 | Rohm Co. Ltd. | 6,013 | ||||||
| 6 | Ryohin Keikaku Co. Ltd. | 1,682 | ||||||
| 61 | Santen Pharmaceutical Co. Ltd. | 961 | ||||||
| 200 | Seibu Holdings, Inc. | 3,579 | ||||||
| 263 | Sekisui House Ltd. | 4,920 | ||||||
| 200 | Seven & i Holdings Co. Ltd. | 8,069 | ||||||
| 53 | Shimadzu Corp. | 1,110 | ||||||
| 11 | Shimano, Inc. | 1,464 | ||||||
| 346 | Shimizu Corp. | 4,073 | ||||||
| 77 | Shin-Etsu Chemical Co. Ltd. | 8,152 | ||||||
| 40 | Shionogi & Co. Ltd. | 2,159 | ||||||
| 32 | Shiseido Co. Ltd. | 1,299 | ||||||
| 343 | Shizuoka Bank Ltd. (The) | 3,338 | ||||||
| 14 | SMC Corp. | 5,471 | ||||||
| 209 | SoftBank Group Corp. | 18,504 | ||||||
| 60 | Sompo Holdings, Inc. | 2,416 | ||||||
| 349 | Sony Corp. | 14,600 | ||||||
| 27 | Stanley Electric Co. Ltd. | 993 | ||||||
| 72 | Start Today Co. Ltd. | 1,958 | ||||||
| 32 | Subaru Corp. | 1,088 | ||||||
| 533 | Sumitomo Chemical Co. Ltd. | 3,746 | ||||||
| 345 | Sumitomo Electric Industries Ltd. | 5,865 | ||||||
| 126 | Sumitomo Metal Mining Co. Ltd. | 4,963 | ||||||
| 386 | Sumitomo Mitsui Financial Group, Inc. | 15,468 | ||||||
| 143 | Sumitomo Mitsui Trust Holdings, Inc. | 5,644 | ||||||
| 172 | Sumitomo Realty & Development Co. Ltd. | 5,761 | ||||||
| 20 | Sundrug Co. Ltd. | 870 | ||||||
| 77 | Suntory Beverage & Food Ltd. | 3,557 | ||||||
| 11 | Suzuken Co. Ltd. | 386 | ||||||
| 144 | Suzuki Motor Corp. | 7,898 | ||||||
| 160 | T&D Holdings, Inc. | 2,498 | ||||||
| 120 | Takeda Pharmaceutical Co. Ltd. | 6,772 | ||||||
| 109 | THK Co. Ltd. | 3,965 | ||||||
| 61 | Tohoku Electric Power Co., Inc. | 794 | ||||||
| 195 | Tokio Marine Holdings, Inc. | 8,384 | ||||||
| 282 | Tokyo Electric Power Co. Holdings, Inc. (a) | 1,159 | ||||||
| 46 | Tokyo Electron Ltd. | 8,064 | ||||||
| 69 | Tokyo Gas Co. Ltd. | 1,711 | ||||||
| SHARES | SECURITY DESCRIPTION | VALUE($) | ||||||
Japan — continued | ||||||||
| 301 | Tokyo Tatemono Co. Ltd. | 4,224 | ||||||
| 347 | Tokyu Corp. | 5,242 | ||||||
| 134 | Toppan Printing Co. Ltd. | 1,363 | ||||||
| 523 | Toray Industries, Inc. | 5,297 | ||||||
| 49 | Toyota Industries Corp. | 2,998 | ||||||
| 573 | Toyota Motor Corp. | 35,535 | ||||||
| 27 | Toyota Tsusho Corp. | 978 | ||||||
| 7 | Trend Micro, Inc. | 349 | ||||||
| 1 | United Urban Investment Corp. | 774 | ||||||
| 49 | West Japan Railway Co. | 3,434 | ||||||
| 192 | Yahoo Japan Corp. | 859 | ||||||
| 217 | Yamada Denki Co. Ltd. | 1,154 | ||||||
| 77 | Yamato Holdings Co. Ltd. | 1,581 | ||||||
|
| |||||||
| 758,732 | ||||||||
|
| |||||||
Jersey — 0.0% (g) | ||||||||
| 49 | Randgold Resources Ltd. | 4,812 | ||||||
|
| |||||||
Luxembourg — 0.1% | ||||||||
| 367 | ArcelorMittal (a) | 10,523 | ||||||
|
| |||||||
Macau — 0.0% (g) | ||||||||
| 316 | Wynn Macau Ltd. | 812 | ||||||
|
| |||||||
Netherlands — 2.3% | ||||||||
| 150 | ASML Holding NV | 27,082 | ||||||
| 140 | ASR Nederland NV | 5,733 | ||||||
| 120 | Heineken Holding NV | 11,145 | ||||||
| 39 | Heineken NV | 3,784 | ||||||
| 1,537 | ING Groep NV | 28,398 | ||||||
| 894 | Koninklijke Ahold Delhaize NV | 16,820 | ||||||
| 2,580 | Koninklijke KPN NV | 8,879 | ||||||
| 100 | Koninklijke Philips NV | 4,060 | ||||||
| 260 | NN Group NV | 10,880 | ||||||
| 1,393 | Royal Dutch Shell plc, Class A | 43,865 | ||||||
| 918 | Royal Dutch Shell plc, Class B | 29,561 | ||||||
| 131 | Wolters Kluwer NV | 6,427 | ||||||
|
| |||||||
| 196,634 | ||||||||
|
| |||||||
New Zealand — 0.1% | ||||||||
| 346 | Auckland International Airport Ltd. | 1,475 | ||||||
| 239 | Contact Energy Ltd. | 942 | ||||||
| 262 | Fletcher Building Ltd. | 1,323 | ||||||
| 130 | Ryman Healthcare Ltd. | 827 | ||||||
| 662 | Spark New Zealand Ltd. | 1,669 | ||||||
|
| |||||||
| 6,236 | ||||||||
|
| |||||||
Norway — 0.1% | ||||||||
| 942 | Norsk Hydro ASA | 7,286 | ||||||
|
| |||||||
SEE NOTES TO FINANCIAL STATEMENTS.
| OCTOBER 31, 2017 | J.P. MORGAN INTERNATIONAL EQUITY FUNDS | 39 | ||||||
Table of Contents
JPMorgan Global Research Enhanced Index Fund
SCHEDULE OF PORTFOLIO INVESTMENTS
AS OF OCTOBER 31, 2017 (continued)
(Amounts in thousands)
| SHARES | SECURITY DESCRIPTION | VALUE($) | ||||||
Common Stocks — continued | ||||||||
Singapore — 0.4% | ||||||||
| 556 | Ascendas REIT | 1,119 | ||||||
| 911 | CapitaLand Ltd. | 2,452 | ||||||
| 379 | CapitaLand Mall Trust | 562 | ||||||
| 390 | ComfortDelGro Corp. Ltd. | 578 | ||||||
| 491 | DBS Group Holdings Ltd. | 8,201 | ||||||
| 771 | Genting Singapore plc | 690 | ||||||
| 17 | Jardine Cycle & Carriage Ltd. | 483 | ||||||
| 449 | Keppel Corp. Ltd. | 2,473 | ||||||
| 852 | Oversea-Chinese Banking Corp. Ltd. | 7,441 | ||||||
| 79 | Singapore Exchange Ltd. | 447 | ||||||
| 153 | Singapore Press Holdings Ltd. | 304 | ||||||
| 1,756 | Singapore Telecommunications Ltd. | 4,833 | ||||||
| 272 | United Overseas Bank Ltd. | 4,919 | ||||||
| 659 | Wilmar International Ltd. | 1,639 | ||||||
|
| |||||||
| 36,141 | ||||||||
|
| |||||||
Spain — 1.4% | ||||||||
| 23 | Aena SME SA, Reg. S (e) | 4,142 | ||||||
| 317 | Banco Bilbao Vizcaya Argentaria SA | 2,772 | ||||||
| 4,441 | Banco Santander SA | 30,107 | ||||||
| 3,059 | Iberdrola SA | 24,717 | ||||||
| 490 | Industria de Diseno Textil SA | 18,314 | ||||||
| 579 | Red Electrica Corp. SA | 12,813 | ||||||
| 688 | Repsol SA | 12,896 | ||||||
| 1,547 | Telefonica SA | 16,224 | ||||||
|
| |||||||
| 121,985 | ||||||||
|
| |||||||
Sweden — 0.6% | ||||||||
| 517 | Assa Abloy AB, Class B | 10,893 | ||||||
| 748 | Sandvik AB | 13,654 | ||||||
| 978 | Skandinaviska Enskilda Banken AB, Class A | 12,049 | ||||||
| 1,121 | Svenska Handelsbanken AB, Class A | 16,069 | ||||||
|
| |||||||
| 52,665 | ||||||||
|
| |||||||
Switzerland — 2.8% | ||||||||
| 410 | ABB Ltd. (Registered) | 10,709 | ||||||
| 125 | Adecco Group AG (Registered) (a) | 9,878 | ||||||
| 26 | Cie Financiere Richemont SA (Registered) | 2,412 | ||||||
| 1,010 | Credit Suisse Group AG (Registered) (a) | 15,914 | ||||||
| 183 | Ferguson plc | 12,782 | ||||||
| 657 | Glencore plc | 3,171 | ||||||
| 307 | LafargeHolcim Ltd. (Registered) (a) | 17,347 | ||||||
| 37 | Lonza Group AG (Registered) (a) | 9,961 | ||||||
| 749 | Nestle SA (Registered) | 63,062 | ||||||
| 507 | Novartis AG (Registered) | 41,843 | ||||||
| 183 | Roche Holding AG | 42,278 | ||||||
| 485 | UBS Group AG (Registered) (a) | 8,247 | ||||||
| SHARES | SECURITY DESCRIPTION | VALUE($) | ||||||
Switzerland — continued | ||||||||
| 27 | Zurich Insurance Group AG | 8,224 | ||||||
|
| |||||||
| 245,828 | ||||||||
|
| |||||||
United Kingdom — 5.7% | ||||||||
| 793 | 3i Group plc | 10,123 | ||||||
| 191 | AstraZeneca plc | 12,926 | ||||||
| 1,548 | Aviva plc | 10,386 | ||||||
| 515 | BAE Systems plc | 4,060 | ||||||
| 852 | Barratt Developments plc | 7,405 | ||||||
| 2,539 | BP plc | 17,224 | ||||||
| 590 | British American Tobacco plc | 38,103 | ||||||
| 1,912 | BT Group plc | 6,586 | ||||||
| 584 | Burberry Group plc | 14,754 | ||||||
| 563 | Compass Group plc | 12,369 | ||||||
| 903 | Diageo plc | 30,852 | ||||||
| 1,028 | GlaxoSmithKline plc | 18,450 | ||||||
| 4,011 | HSBC Holdings plc | 39,172 | ||||||
| 157 | Imperial Brands plc | 6,387 | ||||||
| 135 | InterContinental Hotels Group plc | 7,483 | ||||||
| 147 | Johnson Matthey plc | 6,591 | ||||||
| 1,159 | Legal & General Group plc | 4,109 | ||||||
| 89 | Liberty Global plc, Class C (a) | 2,667 | ||||||
| 14,558 | Lloyds Banking Group plc | 13,196 | ||||||
| 237 | London Stock Exchange Group plc | 11,843 | ||||||
| 1,277 | Prudential plc | 31,346 | ||||||
| 99 | Reckitt Benckiser Group plc | 8,847 | ||||||
| 402 | RELX plc | 9,241 | ||||||
| 110 | Rio Tinto Ltd. | 5,859 | ||||||
| 446 | Rio Tinto plc | 21,093 | ||||||
| 906 | Sage Group plc (The) | 8,964 | ||||||
| 1,517 | Standard Chartered plc | 15,105 | ||||||
| 4,085 | Taylor Wimpey plc | 10,826 | ||||||
| 678 | Unilever NV, CVA | 39,396 | ||||||
| 167 | Unilever plc | 9,482 | ||||||
| 11,442 | Vodafone Group plc | 32,728 | ||||||
| 273 | Whitbread plc | 13,393 | ||||||
| 797 | WPP plc | 14,082 | ||||||
|
| |||||||
| 495,048 | ||||||||
|
| |||||||
United States — 58.7% | ||||||||
| 31 | 3M Co. | 7,106 | ||||||
| 469 | Abbott Laboratories | 25,455 | ||||||
| 71 | AbbVie, Inc. | 6,374 | ||||||
| 312 | Accenture plc, Class A | 44,474 | ||||||
| 48 | Activision Blizzard, Inc. | 3,150 | ||||||
| 259 | Adobe Systems, Inc. (a) | 45,297 | ||||||
| 175 | Agilent Technologies, Inc. | 11,880 | ||||||
SEE NOTES TO FINANCIAL STATEMENTS.
| 40 | J.P. MORGAN INTERNATIONAL EQUITY FUNDS | OCTOBER 31, 2017 | ||||
Table of Contents
| SHARES | SECURITY DESCRIPTION | VALUE($) | ||||||
Common Stocks — continued | ||||||||
United States — continued | ||||||||
| 47 | Albemarle Corp. | 6,613 | ||||||
| 160 | Alcoa Corp. | 7,640 | ||||||
| 75 | Alexion Pharmaceuticals, Inc. (a) | 9,007 | ||||||
| 234 | Allegion plc | 19,537 | ||||||
| 140 | Allergan plc | 24,743 | ||||||
| 71 | Alphabet, Inc., Class A (a) | 73,789 | ||||||
| 88 | Alphabet, Inc., Class C (a) | 89,206 | ||||||
| 184 | Altria Group, Inc. | 11,804 | ||||||
| 106 | Amazon.com, Inc. (a) | 117,530 | ||||||
| 184 | American Electric Power Co., Inc. | 13,718 | ||||||
| 274 | American Express Co. | 26,190 | ||||||
| 406 | American International Group, Inc. | 26,230 | ||||||
| 62 | Ameriprise Financial, Inc. | 9,682 | ||||||
| 35 | AmerisourceBergen Corp. | 2,724 | ||||||
| 30 | Amgen, Inc. | 5,257 | ||||||
| 177 | Anadarko Petroleum Corp. | 8,717 | ||||||
| 352 | Analog Devices, Inc. | 32,094 | ||||||
| 33 | Antero Resources Corp. (a) | 641 | ||||||
| 58 | Anthem, Inc. | 12,030 | ||||||
| 1,232 | Apple, Inc. | 208,325 | ||||||
| 40 | Aramark | 1,728 | ||||||
| 21 | Arrow Electronics, Inc. (a) | 1,726 | ||||||
| 258 | Arthur J Gallagher & Co. | 16,342 | ||||||
| 907 | AT&T, Inc. | 30,516 | ||||||
| 23 | AutoZone, Inc. (a) | 13,276 | ||||||
| 85 | AvalonBay Communities, Inc. | 15,393 | ||||||
| 30 | Avery Dennison Corp. | 3,150 | ||||||
| 77 | Ball Corp. | 3,325 | ||||||
| 3,095 | Bank of America Corp. | 84,762 | ||||||
| 405 | Bank of New York Mellon Corp. (The) | 20,845 | ||||||
| 97 | Becton Dickinson and Co. | 20,153 | ||||||
| 272 | Berkshire Hathaway, Inc., Class B (a) | 50,862 | ||||||
| 89 | Best Buy Co., Inc. | 4,981 | ||||||
| 78 | Biogen, Inc. (a) | 24,251 | ||||||
| 35 | BioMarin Pharmaceutical, Inc. (a) | 2,899 | ||||||
| 38 | BlackRock, Inc. | 17,675 | ||||||
| 43 | Boeing Co. (The) | 11,191 | ||||||
| 933 | Boston Scientific Corp. (a) | 26,253 | ||||||
| 20 | Brighthouse Financial, Inc. (a) | 1,256 | ||||||
| 552 | Bristol-Myers Squibb Co. | 34,029 | ||||||
| 69 | Brixmor Property Group, Inc. | 1,202 | ||||||
| 185 | Broadcom Ltd. | 48,927 | ||||||
| 27 | Broadridge Financial Solutions, Inc. | 2,323 | ||||||
| 73 | CA, Inc. | 2,371 | ||||||
| 63 | Cadence Design Systems, Inc. (a) | 2,736 | ||||||
| SHARES | SECURITY DESCRIPTION | VALUE($) | ||||||
United States — continued | ||||||||
| 17 | Camden Property Trust | 1,538 | ||||||
| 292 | Capital One Financial Corp. | 26,907 | ||||||
| 44 | Caterpillar, Inc. | 5,966 | ||||||
| 69 | CBRE Group, Inc., Class A (a) | 2,719 | ||||||
| 30 | CDK Global, Inc. | 1,915 | ||||||
| 33 | CDW Corp. | 2,325 | ||||||
| 181 | Celanese Corp., Series A | 18,912 | ||||||
| 320 | Celgene Corp. (a) | 32,313 | ||||||
| 38 | Centene Corp. (a) | 3,600 | ||||||
| 726 | Charles Schwab Corp. (The) | 32,565 | ||||||
| 88 | Charter Communications, Inc., Class A (a) | 29,425 | ||||||
| 417 | Chevron Corp. | 48,345 | ||||||
| 180 | Chubb Ltd. | 27,177 | ||||||
| 154 | Cigna Corp. | 30,449 | ||||||
| 20 | Cintas Corp. | 2,991 | ||||||
| 586 | Cisco Systems, Inc. | 20,015 | ||||||
| 956 | Citigroup, Inc. | 70,282 | ||||||
| 380 | Citizens Financial Group, Inc. | 14,438 | ||||||
| 325 | CMS Energy Corp. | 15,710 | ||||||
| 453 | Coca-Cola Co. (The) | 20,831 | ||||||
| 133 | Cognizant Technology Solutions Corp., Class A | 10,045 | ||||||
| 64 | Colgate-Palmolive Co. | 4,506 | ||||||
| 1,534 | Comcast Corp., Class A | 55,265 | ||||||
| 103 | Comerica, Inc. | 8,059 | ||||||
| 184 | Concho Resources, Inc. (a) | 24,657 | ||||||
| 121 | Constellation Brands, Inc., Class A | 26,501 | ||||||
| 23 | Continental Resources, Inc. (a) | 924 | ||||||
| 11 | Cooper Cos., Inc. (The) | 2,552 | ||||||
| 8 | Core Laboratories NV | 771 | ||||||
| 213 | Corning, Inc. | 6,684 | ||||||
| 160 | Costco Wholesale Corp. | 25,768 | ||||||
| 173 | Crown Holdings, Inc. (a) | 10,422 | ||||||
| 139 | Danaher Corp. | 12,793 | ||||||
| 201 | Deere & Co. | 26,751 | ||||||
| 121 | Delphi Automotive plc | 12,036 | ||||||
| 278 | Delta Air Lines, Inc. | 13,906 | ||||||
| 185 | Diamondback Energy, Inc. (a) | 19,867 | ||||||
| 22 | Dick’s Sporting Goods, Inc. | 529 | ||||||
| 66 | Digital Realty Trust, Inc. | 7,805 | ||||||
| 246 | DISH Network Corp., Class A (a) | 11,951 | ||||||
| 194 | Dollar Tree, Inc. (a) | 17,711 | ||||||
| 866 | DowDuPont, Inc. | 62,620 | ||||||
| 309 | DR Horton, Inc. | 13,675 | ||||||
| 278 | Duke Energy Corp. | 24,532 | ||||||
| 88 | Duke Realty Corp. | 2,511 | ||||||
SEE NOTES TO FINANCIAL STATEMENTS.
| OCTOBER 31, 2017 | J.P. MORGAN INTERNATIONAL EQUITY FUNDS | 41 | ||||||
Table of Contents
JPMorgan Global Research Enhanced Index Fund
SCHEDULE OF PORTFOLIO INVESTMENTS
AS OF OCTOBER 31, 2017 (continued)
(Amounts in thousands)
| SHARES | SECURITY DESCRIPTION | VALUE($) | ||||||
Common Stocks — continued | ||||||||
United States — continued | ||||||||
| 66 | DXC Technology Co. | 6,002 | ||||||
| 62 | E*TRADE Financial Corp. (a) | 2,694 | ||||||
| 270 | Eastman Chemical Co. | 24,555 | ||||||
| 344 | Eaton Corp. plc | 27,546 | ||||||
| 152 | Edison International | 12,188 | ||||||
| 413 | Eli Lilly & Co. | 33,878 | ||||||
| 362 | EOG Resources, Inc. | 36,159 | ||||||
| 110 | EQT Corp. | 6,858 | ||||||
| 27 | Equinix, Inc. | 12,694 | ||||||
| 199 | Equity Residential | 13,373 | ||||||
| 16 | Essex Property Trust, Inc. | 4,086 | ||||||
| 20 | Everest Re Group Ltd. | 4,673 | ||||||
| 217 | Exelon Corp. | 8,721 | ||||||
| 88 | Extra Space Storage, Inc. | 7,180 | ||||||
| 698 | Exxon Mobil Corp. | 58,157 | ||||||
| 14 | F5 Networks, Inc. (a) | 1,701 | ||||||
| 643 | Facebook, Inc., Class A (a) | 115,789 | ||||||
| 55 | Federal Realty Investment Trust | 6,602 | ||||||
| 57 | FedEx Corp. | 12,759 | ||||||
| 176 | Fidelity National Information Services, Inc. | 16,353 | ||||||
| 62 | First Data Corp., Class A (a) | 1,104 | ||||||
| 25 | FLIR Systems, Inc. | 1,149 | ||||||
| 32 | Foot Locker, Inc. | 960 | ||||||
| 1,042 | Ford Motor Co. | 12,784 | ||||||
| 68 | Fortive Corp. | 4,884 | ||||||
| 142 | General Dynamics Corp. | 28,870 | ||||||
| 1,705 | General Electric Co. | 34,381 | ||||||
| 359 | Gilead Sciences, Inc. | 26,938 | ||||||
| 33 | Global Payments, Inc. | 3,391 | ||||||
| 56 | Goldman Sachs Group, Inc. (The) | 13,617 | ||||||
| 190 | Halliburton Co. | 8,129 | ||||||
| 392 | Hartford Financial Services Group, Inc. (The) | 21,584 | ||||||
| 323 | HCP, Inc. | 8,333 | ||||||
| 66 | HD Supply Holdings, Inc. (a) | 2,342 | ||||||
| 210 | Hilton Worldwide Holdings, Inc. | 15,170 | ||||||
| 41 | Hologic, Inc. (a) | 1,570 | ||||||
| 378 | Home Depot, Inc. (The) | 62,643 | ||||||
| 331 | Honeywell International, Inc. | 47,663 | ||||||
| 962 | HP, Inc. | 20,734 | ||||||
| 23 | Humana, Inc. | 5,822 | ||||||
| 10 | Huntington Ingalls Industries, Inc. | 2,249 | ||||||
| 10 | IDEXX Laboratories, Inc. (a) | 1,590 | ||||||
| 56 | Illumina, Inc. (a) | 11,526 | ||||||
| 21 | Incyte Corp. (a) | 2,327 | ||||||
| 330 | Ingersoll-Rand plc | 29,241 | ||||||
| SHARES | SECURITY DESCRIPTION | VALUE($) | ||||||
United States — continued | ||||||||
| 14 | Ingredion, Inc. | 1,815 | ||||||
| 426 | Intel Corp. | 19,386 | ||||||
| 396 | Intercontinental Exchange, Inc. | 26,171 | ||||||
| 196 | International Business Machines Corp. | 30,159 | ||||||
| 71 | Intuit, Inc. | 10,792 | ||||||
| 473 | Johnson & Johnson | 65,990 | ||||||
| 9 | Jones Lang LaSalle, Inc. | 1,125 | ||||||
| 823 | KeyCorp | 15,021 | ||||||
| 142 | Kimberly-Clark Corp. | 16,019 | ||||||
| 439 | Kinder Morgan, Inc. | 7,945 | ||||||
| 221 | Kraft Heinz Co. (The) | 17,074 | ||||||
| 24 | Laboratory Corp. of America Holdings (a) | 3,671 | ||||||
| 25 | Lear Corp. | 4,395 | ||||||
| 25 | Liberty Broadband Corp., Class C (a) | 2,157 | ||||||
| 25 | Liberty Media Corp.-Liberty SiriusXM, Class A (a) | 1,055 | ||||||
| 31 | Liberty Property Trust | 1,316 | ||||||
| 49 | Lincoln National Corp. | 3,725 | ||||||
| 428 | Lowe’s Cos., Inc. | 34,204 | ||||||
| 16 | ManpowerGroup, Inc. | 2,014 | ||||||
| 302 | Marathon Petroleum Corp. | 18,059 | ||||||
| 3 | Martin Marietta Materials, Inc. | 603 | ||||||
| 329 | Masco Corp. | 13,110 | ||||||
| 63 | Mastercard, Inc., Class A | 9,309 | ||||||
| 60 | Maxim Integrated Products, Inc. | 3,152 | ||||||
| 117 | McDonald’s Corp. | 19,494 | ||||||
| 82 | McKesson Corp. | 11,310 | ||||||
| 157 | Medtronic plc | 12,628 | ||||||
| 604 | Merck & Co., Inc. | 33,288 | ||||||
| 469 | MetLife, Inc. | 25,114 | ||||||
| 241 | Microchip Technology, Inc. | 22,824 | ||||||
| 122 | Micron Technology, Inc. (a) | 5,385 | ||||||
| 1,928 | Microsoft Corp. | 160,336 | ||||||
| 23 | Mid-America Apartment Communities, Inc. | 2,355 | ||||||
| 20 | Mohawk Industries, Inc. (a) | 5,227 | ||||||
| 273 | Molson Coors Brewing Co., Class B | 22,082 | ||||||
| 753 | Mondelez International, Inc., Class A | 31,214 | ||||||
| 786 | Morgan Stanley | 39,306 | ||||||
| 117 | Mylan NV (a) | 4,171 | ||||||
| 31 | National Retail Properties, Inc. | 1,242 | ||||||
| 148 | Newell Brands, Inc. | 6,046 | ||||||
| 47 | Newfield Exploration Co. (a) | 1,433 | ||||||
| 53 | Newmont Mining Corp. | 1,932 | ||||||
| 242 | NextEra Energy, Inc. | 37,464 | ||||||
| 241 | NIKE, Inc., Class B | 13,228 | ||||||
| 461 | NiSource, Inc. | 12,167 | ||||||
SEE NOTES TO FINANCIAL STATEMENTS.
| 42 | J.P. MORGAN INTERNATIONAL EQUITY FUNDS | OCTOBER 31, 2017 | ||||
Table of Contents
| SHARES | SECURITY DESCRIPTION | VALUE($) | ||||||
Common Stocks — continued | ||||||||
United States — continued | ||||||||
| 204 | Norfolk Southern Corp. | 26,751 | ||||||
| 107 | Northrop Grumman Corp. | 31,660 | ||||||
| 55 | Nuance Communications, Inc. (a) | 811 | ||||||
| 145 | NVIDIA Corp. | 29,905 | ||||||
| 372 | Occidental Petroleum Corp. | 24,017 | ||||||
| 553 | Oracle Corp. | 28,152 | ||||||
| 74 | O’Reilly Automotive, Inc. (a) | 15,631 | ||||||
| 131 | PACCAR, Inc. | 9,415 | ||||||
| 17 | Palo Alto Networks, Inc. (a) | 2,547 | ||||||
| 31 | Parker-Hannifin Corp. | 5,581 | ||||||
| 55 | Parsley Energy, Inc., Class A (a) | 1,452 | ||||||
| 151 | PayPal Holdings, Inc. (a) | 10,956 | ||||||
| 484 | PepsiCo, Inc. | 53,334 | ||||||
| 1,815 | Pfizer, Inc. | 63,641 | ||||||
| 180 | PG&E Corp. | 10,395 | ||||||
| 553 | Philip Morris International, Inc. | 57,845 | ||||||
| 171 | Pioneer Natural Resources Co. | 25,627 | ||||||
| 26 | Plains GP Holdings LP, Class A | 532 | ||||||
| 131 | PNC Financial Services Group, Inc. (The) | 17,911 | ||||||
| 16 | Priceline Group, Inc. (The) (a) | 29,960 | ||||||
| 335 | Procter & Gamble Co. (The) | 28,939 | ||||||
| 124 | Prologis, Inc. | 7,991 | ||||||
| 94 | Prudential Financial, Inc. | 10,433 | ||||||
| 71 | Public Storage | 14,638 | ||||||
| 174 | PulteGroup, Inc. | 5,255 | ||||||
| 36 | PVH Corp. | 4,549 | ||||||
| 30 | Raymond James Financial, Inc. | 2,537 | ||||||
| 55 | Realty Income Corp. | 2,962 | ||||||
| 20 | Red Hat, Inc. (a) | 2,409 | ||||||
| 14 | Reinsurance Group of America, Inc. | 2,135 | ||||||
| 28 | Robert Half International, Inc. | 1,458 | ||||||
| 30 | Rockwell Automation, Inc. | 5,974 | ||||||
| 7 | Rockwell Collins, Inc. | 935 | ||||||
| 221 | Ross Stores, Inc. | 14,044 | ||||||
| 156 | Royal Caribbean Cruises Ltd. | 19,300 | ||||||
| 35 | Sabre Corp. | 676 | ||||||
| 27 | SBA Communications Corp. (a) | 4,250 | ||||||
| 39 | ServiceNow, Inc. (a) | 4,869 | ||||||
| 6 | Sherwin-Williams Co. (The) | 2,177 | ||||||
| 330 | Shire plc | 16,261 | ||||||
| 1,333 | Sirius XM Holdings, Inc. | 7,253 | ||||||
| 73 | Snap-on, Inc. | 11,546 | ||||||
| 8 | Spectrum Brands Holdings, Inc. | 827 | ||||||
| 191 | Stanley Black & Decker, Inc. | 30,906 | ||||||
| 143 | Starbucks Corp. | 7,838 | ||||||
| SHARES | SECURITY DESCRIPTION | VALUE($) | ||||||
United States — continued | ||||||||
| 261 | State Street Corp. | 23,996 | ||||||
| 359 | SunTrust Banks, Inc. | 21,632 | ||||||
| 26 | SVB Financial Group (a) | 5,804 | ||||||
| 33 | Synopsys, Inc. (a) | 2,859 | ||||||
| 53 | TD Ameritrade Holding Corp. | 2,647 | ||||||
| 224 | TE Connectivity Ltd. | 20,410 | ||||||
| 8 | Teleflex, Inc. | 2,012 | ||||||
| 17 | Tesla, Inc. (a) | 5,785 | ||||||
| 496 | Texas Instruments, Inc. | 47,912 | ||||||
| 126 | Thermo Fisher Scientific, Inc. | 24,363 | ||||||
| 56 | Time Warner, Inc. | 5,527 | ||||||
| 368 | TJX Cos., Inc. (The) | 25,665 | ||||||
| 234 | T-Mobile US, Inc. (a) | 13,984 | ||||||
| 361 | Toll Brothers, Inc. | 16,617 | ||||||
| 581 | Twenty-First Century Fox, Inc., Class A | 15,192 | ||||||
| 93 | Twenty-First Century Fox, Inc., Class B | 2,379 | ||||||
| 375 | Union Pacific Corp. | 43,403 | ||||||
| 18 | United Rentals, Inc. (a) | 2,479 | ||||||
| 146 | United Technologies Corp. | 17,483 | ||||||
| 10 | United Therapeutics Corp. (a) | 1,189 | ||||||
| 342 | UnitedHealth Group, Inc. | 71,901 | ||||||
| 51 | Unum Group | 2,663 | ||||||
| 54 | US Bancorp | 2,920 | ||||||
| 131 | Valero Energy Corp. | 10,317 | ||||||
| 224 | Vantiv, Inc., Class A (a) | 15,670 | ||||||
| 269 | VEREIT, Inc. | 2,124 | ||||||
| 22 | VeriSign, Inc. (a) | 2,367 | ||||||
| 635 | Verizon Communications, Inc. | 30,389 | ||||||
| 121 | Vertex Pharmaceuticals, Inc. (a) | 17,664 | ||||||
| 71 | VF Corp. | 4,939 | ||||||
| 632 | Visa, Inc., Class A | 69,488 | ||||||
| 100 | Vornado Realty Trust | 7,452 | ||||||
| 36 | Voya Financial, Inc. | 1,439 | ||||||
| 29 | Vulcan Materials Co. | 3,512 | ||||||
| 401 | Walgreens Boots Alliance, Inc. | 26,573 | ||||||
| 115 | Wal-Mart Stores, Inc. | 10,001 | ||||||
| 472 | Walt Disney Co. (The) | 46,133 | ||||||
| 32 | Waste Management, Inc. | 2,594 | ||||||
| 1,075 | Wells Fargo & Co. | 60,367 | ||||||
| 206 | WestRock Co. | 12,649 | ||||||
| 71 | Weyerhaeuser Co. | 2,560 | ||||||
| 141 | Workday, Inc., Class A (a) | 15,612 | ||||||
| 533 | Xcel Energy, Inc. | 26,397 | ||||||
| 48 | Xerox Corp. | 1,469 | ||||||
| 72 | Yum Brands, Inc. | 5,366 | ||||||
SEE NOTES TO FINANCIAL STATEMENTS.
| OCTOBER 31, 2017 | J.P. MORGAN INTERNATIONAL EQUITY FUNDS | 43 | ||||||
Table of Contents
JPMorgan Global Research Enhanced Index Fund
SCHEDULE OF PORTFOLIO INVESTMENTS
AS OF OCTOBER 31, 2017 (continued)
(Amounts in thousands, except number of Futures contracts)
| SHARES | SECURITY DESCRIPTION | VALUE($) | ||||||
Common Stocks — continued | ||||||||
United States — continued | ||||||||
| 120 | Zimmer Biomet Holdings, Inc. | 14,575 | ||||||
|
| |||||||
| 5,084,895 | ||||||||
|
| |||||||
Total Common Stocks | 8,531,369 | |||||||
|
| |||||||
Short-Term Investment — 1.2% | ||||||||
Investment Company — 1.2% | ||||||||
| 105,120 | JPMorgan U.S. Government Money Market Fund, Institutional Class Shares, | 105,120 | ||||||
|
| |||||||
Total Investments — 99.7% | 8,636,489 | |||||||
Other Assets in Excess of | 26,971 | |||||||
|
| |||||||
NET ASSETS — 100.0% | $ | 8,663,460 | ||||||
|
| |||||||
Percentages indicated are based on net assets.
Summary of Investments by Industry, October 31, 2017
The following table represents the portfolio investments of the Fund by industry classifications as a percentage of total investments:
| INDUSTRY | PERCENTAGE | |||
Banks | 9.2 | % | ||
Oil, Gas & Consumable Fuels | 6.0 | |||
Pharmaceuticals | 5.9 | |||
Insurance | 4.1 | |||
Software | 4.0 | |||
Internet Software & Services | 3.3 | |||
Capital Markets | 3.2 | |||
Semiconductors & Semiconductor Equipment | 3.1 | |||
IT Services | 2.9 | |||
Technology Hardware, Storage & Peripherals | 2.8 | |||
Chemicals | 2.8 | |||
Beverages | 2.6 | |||
Electric Utilities | 2.5 | |||
Media | 2.3 | |||
Specialty Retail | 2.3 | |||
Machinery | 2.1 | |||
Health Care Providers & Services | 1.9 | |||
Equity Real Estate Investment Trusts (REITs) | 1.8 | |||
Biotechnology | 1.8 | |||
Internet & Direct Marketing Retail | 1.8 | |||
Hotels, Restaurants & Leisure | 1.7 | |||
Automobiles | 1.7 | |||
Diversified Telecommunication Services | 1.6 | |||
Industrial Conglomerates | 1.6 | |||
Health Care Equipment & Supplies | 1.5 | |||
Aerospace & Defense | 1.5 | |||
Food Products | 1.5 | |||
Tobacco | 1.5 | |||
Metals & Mining | 1.4 | |||
Road & Rail | 1.3 | |||
Food & Staples Retailing | 1.3 | |||
Textiles, Apparel & Luxury Goods | 1.2 | |||
Electrical Equipment | 1.1 | |||
Household Durables | 1.1 | |||
Wireless Telecommunication Services | 1.0 | |||
Others (each less than 1.0%) | 11.4 | |||
Short-Term Investment | 1.2 | |||
Futures contracts outstanding as of October 31, 2017: | ||||||||||||||||||
| DESCRIPTION | NUMBER OF CONTRACTS | EXPIRATION DATE | TRADING CURRENCY | NOTIONAL AMOUNT ($) | VALUE AND UNREALIZED APPRECIATION (DEPRECIATION) ($) | |||||||||||||
Long Contracts | ||||||||||||||||||
| EURO STOXX 50 Index | 1,450 | 12/2017 | EUR | 62,195 | 3,513 | |||||||||||||
|
| |||||||||||||||||
| 3,513 | ||||||||||||||||||
|
| |||||||||||||||||
SEE NOTES TO FINANCIAL STATEMENTS.
| 44 | J.P. MORGAN INTERNATIONAL EQUITY FUNDS | OCTOBER 31, 2017 | ||||
Table of Contents
JPMorgan Global Unconstrained Equity Fund
SCHEDULE OF PORTFOLIO INVESTMENTS
AS OF OCTOBER 31, 2017
(Amounts in thousands)
| SHARES | SECURITY DESCRIPTION | VALUE($) | ||||||
Common Stocks — 98.4% | ||||||||
Austria — 1.8% | ||||||||
| 1 | Erste Group Bank AG (a) | 63 | ||||||
|
| |||||||
Canada — 1.1% | ||||||||
| — | (h) | Canadian Pacific Railway Ltd. | 39 | |||||
|
| |||||||
China — 8.0% | ||||||||
| — | (h) | Baidu, Inc., ADR (a) | 35 | |||||
| 36 | China Unicom Hong Kong Ltd. (a) | 51 | ||||||
| — | (h) | CNOOC Ltd., ADR | 59 | |||||
| 1 | JD.com, Inc., ADR (a) | 55 | ||||||
| 10 | Ping An Insurance Group Co. of China Ltd., Class H | 84 | ||||||
|
| |||||||
| 284 | ||||||||
|
| |||||||
France — 5.9% | ||||||||
| 1 | Airbus SE | 62 | ||||||
| 2 | AXA SA | 55 | ||||||
| 1 | Schneider Electric SE (a) | 94 | ||||||
|
| |||||||
| 211 | ||||||||
|
| |||||||
Germany — 2.2% | ||||||||
| — | (h) | Linde AG (a) | 79 | |||||
|
| |||||||
Hong Kong — 2.2% | ||||||||
| 11 | AIA Group Ltd. | 80 | ||||||
|
| |||||||
India — 2.1% | ||||||||
| 1 | HDFC Bank Ltd., ADR | 74 | ||||||
|
| |||||||
Italy — 1.0% | ||||||||
| 2 | UniCredit SpA (a) | 35 | ||||||
|
| |||||||
Japan — 8.0% | ||||||||
| — | (h) | FANUC Corp. | 93 | |||||
| 4 | Inpex Corp. | 43 | ||||||
| 3 | Komatsu Ltd. | 82 | ||||||
| 5 | Renesas Electronics Corp. (a) | 65 | ||||||
|
| |||||||
| 283 | ||||||||
|
| |||||||
Luxembourg — 1.1% | ||||||||
| 1 | ArcelorMittal (a) | 39 | ||||||
|
| |||||||
Netherlands — 2.0% | ||||||||
| 4 | Altice NV, Class A (a) | 70 | ||||||
|
| |||||||
Singapore — 2.0% | ||||||||
| 4 | DBS Group Holdings Ltd. | 72 | ||||||
|
| |||||||
South Africa — 2.3% | ||||||||
| — | (h) | Naspers Ltd., Class N | 81 | |||||
|
| |||||||
Switzerland — 4.6% | ||||||||
| 1 | LafargeHolcim Ltd. (Registered) (a) | 71 | ||||||
| 1 | Novartis AG (Registered) | 92 | ||||||
|
| |||||||
| 163 | ||||||||
|
| |||||||
| SHARES | SECURITY DESCRIPTION | VALUE($) | ||||||
United Kingdom — 7.1% | ||||||||
| 1 | British American Tobacco plc | 74 | ||||||
| 19 | BT Group plc | 67 | ||||||
| 39 | Vodafone Group plc | 110 | ||||||
|
| |||||||
| 251 | ||||||||
|
| |||||||
United States — 47.0% | ||||||||
| 1 | Activision Blizzard, Inc. | 51 | ||||||
| — | (h) | Allergan plc | 42 | |||||
| — | (h) | Alphabet, Inc., Class C (a) | 178 | |||||
| — | (h) | Amazon.com, Inc. (a) | 82 | |||||
| 1 | Apple, Inc. | 101 | ||||||
| 1 | BioMarin Pharmaceutical, Inc. (a) | 53 | ||||||
| — | (h) | Broadcom Ltd. | 49 | |||||
| — | (h) | Celgene Corp. (a) | 36 | |||||
| 2 | Citigroup, Inc. | 119 | ||||||
| 3 | Comcast Corp., Class A | 107 | ||||||
| 1 | EQT Corp. | 48 | ||||||
| — | (h) | Facebook, Inc., Class A (a) | 88 | |||||
| — | (h) | First Republic Bank | 44 | |||||
| 1 | Globant SA (a) | 25 | ||||||
| 1 | Molson Coors Brewing Co., Class B | 57 | ||||||
| 1 | Occidental Petroleum Corp. | 82 | ||||||
| 1 | Oracle Corp. | 74 | ||||||
| 1 | Pioneer Natural Resources Co. | 110 | ||||||
| 1 | Shire plc, ADR | 87 | ||||||
| 2 | Synchrony Financial | 64 | ||||||
| 3 | Twenty-First Century Fox, Inc., Class A | 77 | ||||||
| — | (h) | UnitedHealth Group, Inc. | 94 | |||||
|
| |||||||
| 1,668 | ||||||||
|
| |||||||
Total Common Stocks | 3,492 | |||||||
|
| |||||||
Total Investments — 98.4% | 3,492 | |||||||
Other Assets in Excess of | 57 | |||||||
|
| |||||||
NET ASSETS — 100.0% | $ | 3,549 | ||||||
|
| |||||||
Percentages indicated are based on net assets.
SEE NOTES TO FINANCIAL STATEMENTS.
| OCTOBER 31, 2017 | J.P. MORGAN INTERNATIONAL EQUITY FUNDS | 45 | ||||||
Table of Contents
JPMorgan Global Unconstrained Equity Fund
SCHEDULE OF PORTFOLIO INVESTMENTS
AS OF OCTOBER 31, 2017 (continued)
(Amounts in thousands)
Summary of Investments by Industry, October 31, 2017
The following table represents the portfolio investments of the Fund by industry classifications as a percentage of total investments:
| INDUSTRY | PERCENTAGE | |||
Banks | 11.7 | % | ||
Oil, Gas & Consumable Fuels | 9.8 | |||
Media | 9.6 | |||
Internet Software & Services | 8.6 | |||
Insurance | 6.3 | |||
Biotechnology | 5.0 | |||
Machinery | 5.0 | |||
Software | 4.3 | |||
Internet & Direct Marketing Retail | 3.9 | |||
Pharmaceuticals | 3.8 | |||
Diversified Telecommunication Services | 3.4 | |||
Semiconductors & Semiconductor Equipment | 3.3 | |||
Wireless Telecommunication Services | 3.2 | |||
Technology Hardware, Storage & Peripherals | 2.9 | |||
Electrical Equipment | 2.7 | |||
Health Care Providers & Services | 2.7 | |||
Chemicals | 2.3 | |||
Tobacco | 2.1 | |||
Construction Materials | 2.0 | |||
Consumer Finance | 1.8 | |||
Aerospace & Defense | 1.8 | |||
Beverages | 1.6 | |||
Road & Rail | 1.1 | |||
Metals & Mining | 1.1 | |||
SEE NOTES TO FINANCIAL STATEMENTS.
| 46 | J.P. MORGAN INTERNATIONAL EQUITY FUNDS | OCTOBER 31, 2017 | ||||
Table of Contents
JPMorgan International Equity Fund
SCHEDULE OF PORTFOLIO INVESTMENTS
AS OF OCTOBER 31, 2017
(Amounts in thousands)
| SHARES | SECURITY DESCRIPTION | VALUE($) | ||||||
Common Stocks — 99.4% | ||||||||
Australia — 1.2% | ||||||||
| 1,574 | BHP Billiton Ltd. | 32,414 | ||||||
| 768 | BHP Billiton plc | 13,914 | ||||||
|
| |||||||
| 46,328 | ||||||||
|
| |||||||
Belgium — 1.2% | ||||||||
| 400 | Anheuser-Busch InBev SA/NV | 49,104 | ||||||
|
| |||||||
China — 3.5% | ||||||||
| 147 | Baidu, Inc., ADR (a) | 35,976 | ||||||
| 5,578 | China Overseas Land & Investment Ltd. | 18,112 | ||||||
| 30,300 | CNOOC Ltd. | 41,372 | ||||||
| 5,238 | Ping An Insurance Group Co. of China Ltd., Class H | 46,031 | ||||||
|
| |||||||
| 141,491 | ||||||||
|
| |||||||
Denmark — 1.2% | ||||||||
| 924 | Novo Nordisk A/S, Class B | 46,008 | ||||||
|
| |||||||
France — 13.3% | ||||||||
| 842 | Accor SA | 41,992 | ||||||
| 1,805 | AXA SA | 54,491 | ||||||
| 922 | BNP Paribas SA | 71,938 | ||||||
| 226 | Essilor International SA | 28,642 | ||||||
| 305 | Imerys SA | 27,732 | ||||||
| 175 | LVMH Moet Hennessy Louis Vuitton SE | 52,310 | ||||||
| 2,804 | Orange SA | 46,057 | ||||||
| 329 | Pernod Ricard SA | 49,390 | ||||||
| 543 | Safran SA | 57,145 | ||||||
| 535 | Sanofi | 50,645 | ||||||
| 602 | Schneider Electric SE (a) | 52,853 | ||||||
|
| |||||||
| 533,195 | ||||||||
|
| |||||||
Germany — 9.9% | ||||||||
| 298 | Allianz SE (Registered) | 69,570 | ||||||
| 446 | Bayer AG (Registered) | 58,027 | ||||||
| 246 | Continental AG | 62,482 | ||||||
| 374 | Fresenius Medical Care AG & Co. KGaA | 36,223 | ||||||
| 252 | Henkel AG & Co. KGaA (Preference) | 35,416 | ||||||
| 267 | Linde AG (a) | 57,453 | ||||||
| 689 | SAP SE | 78,720 | ||||||
|
| |||||||
| 397,891 | ||||||||
|
| |||||||
Hong Kong — 4.5% | ||||||||
| 8,359 | AIA Group Ltd. | 62,986 | ||||||
| 5,219 | CK Asset Holdings Ltd. | 42,952 | ||||||
| 3,967 | CK Hutchison Holdings Ltd. | 50,388 | ||||||
| 5,110 | Sands China Ltd. | 24,105 | ||||||
|
| |||||||
| 180,431 | ||||||||
|
| |||||||
| SHARES | SECURITY DESCRIPTION | VALUE($) | ||||||
India — 1.1% | ||||||||
| 489 | HDFC Bank Ltd., ADR | 45,171 | ||||||
|
| |||||||
Indonesia — 0.6% | ||||||||
| 40,823 | Astra International Tbk. PT | 24,080 | ||||||
|
| |||||||
Japan — 20.1% | ||||||||
| 358 | Daikin Industries Ltd. | 39,541 | ||||||
| 240 | FANUC Corp. | 56,141 | ||||||
| 1,838 | Honda Motor Co. Ltd. | 57,594 | ||||||
| 3,680 | Inpex Corp. | 39,397 | ||||||
| 1,224 | Japan Tobacco, Inc. | 40,508 | ||||||
| 1,490 | KDDI Corp. | 39,700 | ||||||
| 78 | Keyence Corp. | 43,530 | ||||||
| 1,674 | Komatsu Ltd. | 54,699 | ||||||
| 3,182 | Kubota Corp. | 59,869 | ||||||
| 999 | Makita Corp. | 41,846 | ||||||
| 1,362 | Mitsui Fudosan Co. Ltd. | 31,790 | ||||||
| 391 | Nidec Corp. | 52,036 | ||||||
| 301 | Nitto Denko Corp. | 27,999 | ||||||
| 572 | Shin-Etsu Chemical Co. Ltd. | 60,271 | ||||||
| 141 | SMC Corp. | 53,979 | ||||||
| 1,666 | Sumitomo Mitsui Financial Group, Inc. | 66,733 | ||||||
| 220 | Tokyo Electron Ltd. | 38,720 | ||||||
|
| |||||||
| 804,353 | ||||||||
|
| |||||||
Macau — 0.6% | ||||||||
| 10,009 | Wynn Macau Ltd. | 25,697 | ||||||
|
| |||||||
Netherlands — 6.3% | ||||||||
| 377 | Akzo Nobel NV | 34,048 | ||||||
| 326 | ASML Holding NV | 58,897 | ||||||
| 3,565 | ING Groep NV | 65,879 | ||||||
| 2,989 | Royal Dutch Shell plc, Class A | 94,093 | ||||||
|
| |||||||
| 252,917 | ||||||||
|
| |||||||
Singapore — 1.2% | ||||||||
| 2,921 | DBS Group Holdings Ltd. | 48,778 | ||||||
|
| |||||||
South Africa — 1.0% |
| |||||||
| 155 | Naspers Ltd., Class N | 37,840 | ||||||
|
| |||||||
South Korea — 2.7% | ||||||||
| 95 | Hyundai Mobis Co. Ltd. | 22,511 | ||||||
| 70 | Samsung Electronics Co. Ltd., GDR (e) | 85,791 | ||||||
|
| |||||||
| 108,302 | ||||||||
|
| |||||||
Spain — 1.5% | ||||||||
| 6,812 | Banco Bilbao Vizcaya Argentaria SA | 59,570 | ||||||
|
| |||||||
Sweden — 1.5% | ||||||||
| 1,349 | Atlas Copco AB, Class A | 59,141 | ||||||
|
| |||||||
SEE NOTES TO FINANCIAL STATEMENTS.
| OCTOBER 31, 2017 | J.P. MORGAN INTERNATIONAL EQUITY FUNDS | 47 | ||||||
Table of Contents
JPMorgan International Equity Fund
SCHEDULE OF PORTFOLIO INVESTMENTS
AS OF OCTOBER 31, 2017 (continued)
(Amounts in thousands)
| SHARES | SECURITY DESCRIPTION | VALUE($) | ||||||
Common Stocks — continued | ||||||||
Switzerland — 10.5% | ||||||||
| 1,260 | ABB Ltd. (Registered) | 32,902 | ||||||
| 595 | Cie Financiere Richemont SA (Registered) | 54,880 | ||||||
| 10,563 | Glencore plc (a) | 50,947 | ||||||
| 835 | LafargeHolcim Ltd. (Registered) (a) | 47,132 | ||||||
| 930 | Novartis AG (Registered) | 76,741 | ||||||
| 191 | Roche Holding AG | 44,170 | ||||||
| 3,755 | UBS Group AG (Registered) (a) | 63,879 | ||||||
| 167 | Zurich Insurance Group AG | 51,080 | ||||||
|
| |||||||
| 421,731 | ||||||||
|
| |||||||
Taiwan — 1.1% | ||||||||
| 1020 | Taiwan Semiconductor Manufacturing Co. Ltd., ADR | 43,194 | ||||||
|
| |||||||
United Kingdom — 15.7% | ||||||||
| 1,022 | British American Tobacco plc | 66,008 | ||||||
| 1,814 | Burberry Group plc | 45,806 | ||||||
| 4,681 | Meggitt plc | 32,224 | ||||||
| 862 | Persimmon plc | 32,080 | ||||||
| 3,411 | Prudential plc | 83,721 | ||||||
| 1,655 | RELX NV | 37,375 | ||||||
| 703 | Rio Tinto Ltd. | 37,435 | ||||||
| 543 | Rio Tinto plc | 25,655 | ||||||
| 4,669 | Standard Chartered plc (a) | 46,504 | ||||||
| 975 | TechnipFMC plc (a) | 26,518 | ||||||
| 865 | Travis Perkins plc | 17,470 | ||||||
| 1,551 | Unilever plc | 87,913 | ||||||
| 19,740 | Vodafone Group plc | 56,462 | ||||||
| 1,810 | WPP plc | 31,999 | ||||||
|
| |||||||
| 627,170 | ||||||||
|
| |||||||
United States — 0.7% | ||||||||
| 600 | Shire plc | 29,568 | ||||||
|
| |||||||
Total Common Stocks | 3,981,960 | |||||||
|
| |||||||
Short-Term Investment — 0.6% | ||||||||
Investment Company — 0.6% | ||||||||
| 24,698 | JPMorgan U.S. Government Money Market Fund, Institutional Class Shares, 0.92% (b) (l) | 24,698 | ||||||
|
| |||||||
Total Investments — 100.0% | 4,006,658 | |||||||
Other Assets in Excess of | 433 | |||||||
|
| |||||||
NET ASSETS — 100.0% | $ | 4,007,091 | ||||||
|
| |||||||
Percentages indicated are based on net assets.
Summary of Investments by Industry, October 31, 2017
The following table represents the portfolio investments of the Fund by industry classifications as a percentage of total investments:
| INDUSTRY | PERCENTAGE | |||
Banks | 10.1 | % | ||
Insurance | 9.2 | |||
Machinery | 8.1 | |||
Pharmaceuticals | 6.9 | |||
Chemicals | 4.5 | |||
Oil, Gas & Consumable Fuels | 4.4 | |||
Metals & Mining | 4.0 | |||
Textiles, Apparel & Luxury Goods | 3.8 | |||
Semiconductors & Semiconductor Equipment | 3.5 | |||
Electrical Equipment | 3.4 | |||
Tobacco | 2.7 | |||
Beverages | 2.5 | |||
Wireless Telecommunication Services | 2.4 | |||
Real Estate Management & Development | 2.3 | |||
Hotels, Restaurants & Leisure | 2.3 | |||
Aerospace & Defense | 2.2 | |||
Personal Products | 2.2 | |||
Technology Hardware, Storage & Peripherals | 2.1 | |||
Auto Components | 2.1 | |||
Automobiles | 2.0 | |||
Software | 2.0 | |||
Construction Materials | 1.9 | |||
Media | 1.7 | |||
Capital Markets | 1.6 | |||
Industrial Conglomerates | 1.3 | |||
Diversified Telecommunication Services | 1.1 | |||
Electronic Equipment, Instruments & Components | 1.1 | |||
Building Products | 1.0 | |||
Others (each less than 1.0%) | 7.0 | |||
Short-Term Investment | 0.6 | |||
SEE NOTES TO FINANCIAL STATEMENTS.
| 48 | J.P. MORGAN INTERNATIONAL EQUITY FUNDS | OCTOBER 31, 2017 | ||||
Table of Contents
JPMorgan International Equity Income Fund
SCHEDULE OF PORTFOLIO INVESTMENTS
AS OF OCTOBER 31, 2017
(Amounts in thousands)
| SHARES | SECURITY DESCRIPTION | VALUE($) | ||||||
Common Stocks — 98.7% | ||||||||
Australia — 0.9% | ||||||||
| 200 | Transurban Group | 1,862 | ||||||
|
| |||||||
Austria — 0.8% | ||||||||
| 29 | BAWAG Group AG, Reg. S (a) (e) | 1,518 | ||||||
|
| |||||||
Belgium — 0.9% | ||||||||
| 14 | Anheuser-Busch InBev SA/NV | 1,758 | ||||||
|
| |||||||
Canada — 1.0% | ||||||||
| 43 | TransCanada Corp. | 2,020 | ||||||
|
| |||||||
China — 1.6% | ||||||||
| 2,343 | CNOOC Ltd. | 3,199 | ||||||
|
| |||||||
Czech Republic — 0.6% | ||||||||
| 379 | Moneta Money Bank A/S, Reg. S (e) | 1,294 | ||||||
|
| |||||||
Denmark — 1.8% | ||||||||
| 95 | Danske Bank A/S | 3,627 | ||||||
|
| |||||||
Finland — 3.1% | ||||||||
| 35 | Cargotec OYJ, Class B | 2,088 | ||||||
| 139 | UPM-Kymmene OYJ | 4,172 | ||||||
|
| |||||||
| 6,260 | ||||||||
|
| |||||||
France — 9.7% | ||||||||
| 20 | Airbus SE | 2,089 | ||||||
| 26 | Amundi SA, Reg. S (e) | 2,186 | ||||||
| 26 | Cie Generale des Etablissements Michelin | 3,705 | ||||||
| 40 | Sanofi | 3,755 | ||||||
| 17 | Thales SA | 1,771 | ||||||
| 7 | Unibail-Rodamco SE | 1,780 | ||||||
| 43 | Vinci SA | 4,195 | ||||||
|
| |||||||
| 19,481 | ||||||||
|
| |||||||
Germany — 10.1% | ||||||||
| 18 | Allianz SE (Registered) | 4,117 | ||||||
| 23 | BASF SE | 2,539 | ||||||
| 11 | Continental AG | 2,924 | ||||||
| 48 | Daimler AG (Registered) | 3,980 | ||||||
| 22 | Deutsche Boerse AG | 2,281 | ||||||
| 45 | Deutsche Wohnen SE | 1,911 | ||||||
| 17 | Siemens AG (Registered) | 2,509 | ||||||
|
| |||||||
| 20,261 | ||||||||
|
| |||||||
Hong Kong — 1.0% | ||||||||
| 406 | Sands China Ltd. | 1,917 | ||||||
|
| |||||||
Ireland — 0.9% | ||||||||
| 313 | Allied Irish Banks plc | 1,863 | ||||||
|
| |||||||
Italy — 2.6% | ||||||||
| 61 | Atlantia SpA | 2,001 | ||||||
| SHARES | SECURITY DESCRIPTION | VALUE($) | ||||||
Italy — continued | ||||||||
| 527 | Enel SpA | 3,270 | ||||||
|
| |||||||
| 5,271 | ||||||||
|
| |||||||
Japan — 10.5% | ||||||||
| 90 | Bridgestone Corp. | 4,299 | ||||||
| 104 | Daiwa House Industry Co. Ltd. | 3,816 | ||||||
| 40 | Japan Airlines Co. Ltd. | 1,376 | ||||||
| 55 | Japan Tobacco, Inc. | 1,830 | ||||||
| 128 | Mitsubishi Corp. | 3,007 | ||||||
| 621 | Mitsubishi UFJ Financial Group, Inc., ADR | 4,214 | ||||||
| 52 | Nippon Telegraph & Telephone Corp. | 2,524 | ||||||
|
| |||||||
| 21,066 | ||||||||
|
| |||||||
Netherlands — 7.7% | ||||||||
| 21 | ASML Holding NV | 3,710 | ||||||
| 210 | ING Groep NV | 3,880 | ||||||
| 194 | Koninklijke Ahold Delhaize NV | 3,652 | ||||||
| 99 | NN Group NV | 4,160 | ||||||
|
| |||||||
| 15,402 | ||||||||
|
| |||||||
New Zealand — 1.1% | ||||||||
| 879 | Spark New Zealand Ltd. | 2,216 | ||||||
|
| |||||||
Norway — 2.8% | ||||||||
| 172 | DNB ASA | 3,329 | ||||||
| 283 | Norsk Hydro ASA | 2,190 | ||||||
|
| |||||||
| 5,519 | ||||||||
|
| |||||||
Russia — 3.2% | ||||||||
| 63 | LUKOIL PJSC, ADR | 3,349 | ||||||
| 195 | Severstal PJSC, Reg. S, GDR | 2,970 | ||||||
|
| |||||||
| 6,319 | ||||||||
|
| |||||||
Singapore — 1.0% | ||||||||
| 121 | DBS Group Holdings Ltd. | 2,016 | ||||||
|
| |||||||
South Korea — 2.2% | ||||||||
| 2 | Samsung Electronics Co. Ltd. | 4,316 | ||||||
|
| |||||||
Spain — 2.0% | ||||||||
| 509 | Iberdrola SA | 4,110 | ||||||
|
| |||||||
Switzerland — 8.9% | ||||||||
| 59 | Ferguson plc | 4,132 | ||||||
| 431 | Glencore plc (a) | 2,077 | ||||||
| 37 | LafargeHolcim Ltd. (Registered) (a) | 2,065 | ||||||
| 44 | Novartis AG (Registered) | 3,618 | ||||||
| 42 | Swiss Re AG | 3,929 | ||||||
| 6 | Zurich Insurance Group AG | 1,946 | ||||||
|
| |||||||
| 17,767 | ||||||||
|
| |||||||
SEE NOTES TO FINANCIAL STATEMENTS.
| OCTOBER 31, 2017 | J.P. MORGAN INTERNATIONAL EQUITY FUNDS | 49 | ||||||
Table of Contents
JPMorgan International Equity Income Fund
SCHEDULE OF PORTFOLIO INVESTMENTS
AS OF OCTOBER 31, 2017 (continued)
(Amounts in thousands)
| SHARES | SECURITY DESCRIPTION | VALUE($) | ||||||
Common Stocks — continued | ||||||||
Taiwan — 1.3% | ||||||||
| 63 | Taiwan Semiconductor Manufacturing Co. Ltd., ADR | 2,673 | ||||||
|
| |||||||
United Kingdom — 22.0% | ||||||||
| 156 | 3i Group plc | 1,986 | ||||||
| 69 | Berkeley Group Holdings plc | 3,406 | ||||||
| 79 | British American Tobacco plc | 5,135 | ||||||
| 58 | Diageo plc | 1,977 | ||||||
| 640 | Direct Line Insurance Group plc | 3,159 | ||||||
| 196 | GlaxoSmithKline plc | 3,524 | ||||||
| 118 | HSBC Holdings plc, ADR | 5,756 | ||||||
| 62 | Imperial Brands plc | 2,524 | ||||||
| 628 | ITV plc | 1,373 | ||||||
| 31 | Persimmon plc | 1,144 | ||||||
| 73 | Prudential plc | 1,803 | ||||||
| 84 | Rio Tinto plc | 3,951 | ||||||
| 219 | RSA Insurance Group plc | 1,833 | ||||||
| 181 | Sage Group plc (The) | 1,792 | ||||||
| 33 | Unilever NV, CVA | 1,910 | ||||||
| 964 | Vodafone Group plc | 2,759 | ||||||
|
| |||||||
| 44,032 | ||||||||
|
| |||||||
United States — 1.0% | ||||||||
| 31 | Carnival plc | 2,034 | ||||||
|
| |||||||
Total Common Stocks | 197,801 | |||||||
|
| |||||||
Short-Term Investment — 1.1% | ||||||||
Investment Company — 1.1% | ||||||||
| 2,218 | JPMorgan U.S. Government Money Market Fund, Institutional Class Shares, | 2,218 | ||||||
|
| |||||||
Total Investments — 99.8% | 200,019 | |||||||
Other Assets in Excess of | 437 | |||||||
|
| |||||||
NET ASSETS — 100.0% | $ | 200,456 | ||||||
|
| |||||||
Percentages indicated are based on net assets.
Summary of Investments by Industry, October 31, 2017
The following table represents the portfolio investments of the Fund by industry classifications as a percentage of total investments:
| INDUSTRY | PERCENTAGE | |||
Banks | 13.7 | % | ||
Insurance | 10.5 | |||
Metals & Mining | 5.6 | |||
Auto Components | 5.5 | |||
Pharmaceuticals | 5.4 | |||
Tobacco | 4.7 | |||
Oil, Gas & Consumable Fuels | 4.3 | |||
Electric Utilities | 3.7 | |||
Trading Companies & Distributors | 3.6 | |||
Capital Markets | 3.2 | |||
Semiconductors & Semiconductor Equipment | 3.2 | |||
Real Estate Management & Development | 2.9 | |||
Diversified Telecommunication Services | 2.4 | |||
Household Durables | 2.3 | |||
Technology Hardware, Storage & Peripherals | 2.2 | |||
Construction & Engineering | 2.1 | |||
Paper & Forest Products | 2.1 | |||
Automobiles | 2.0 | |||
Hotels, Restaurants & Leisure | 2.0 | |||
Transportation Infrastructure | 1.9 | |||
Aerospace & Defense | 1.9 | |||
Beverages | 1.9 | |||
Food & Staples Retailing | 1.8 | |||
Wireless Telecommunication Services | 1.4 | |||
Chemicals | 1.3 | |||
Industrial Conglomerates | 1.2 | |||
Machinery | 1.0 | |||
Construction Materials | 1.0 | |||
Personal Products | 0.9 | |||
Others (each less than 1.0%) | 3.2 | |||
Short-Term Investment | 1.1 | |||
SEE NOTES TO FINANCIAL STATEMENTS.
| 50 | J.P. MORGAN INTERNATIONAL EQUITY FUNDS | OCTOBER 31, 2017 | ||||
Table of Contents
| Forward foreign currency exchange contracts outstanding as of October 31, 2017: | ||||||||||||||||||||||
| CURRENCY PURCHASED | CURRENCY SOLD | COUNTERPARTY | SETTLEMENT DATE | UNREALIZED APPRECIATION (DEPRECIATION) ($) | ||||||||||||||||||
| GBP | 11 | USD | 14 | BNP Paribas | 11/20/2017 | — | (h) | |||||||||||||||
| GBP | 1,307 | USD | 1,736 | National Australia Bank Ltd. | 11/20/2017 | 1 | ||||||||||||||||
| USD | 823 | AUD | 1,051 | Deutsche Bank AG | 11/20/2017 | 19 | ||||||||||||||||
| USD | 484 | JPY | 54,306 | Credit Suisse International | 11/20/2017 | 6 | ||||||||||||||||
| Total unrealized appreciation | 26 | |||||||||||||||||||||
| AUD | 10,801 | USD | 8,482 | Australia & New Zealand Banking Group Ltd. | 11/20/2017 | (217 | ) | |||||||||||||||
| JPY | 908,874 | USD | 8,116 | National Australia Bank Ltd. | 11/20/2017 | (116 | ) | |||||||||||||||
| USD | 17,041 | GBP | 12,839 | Standard Chartered Bank | 11/20/2017 | (21 | ) | |||||||||||||||
| Total unrealized depreciation | (354 | ) | ||||||||||||||||||||
Net unrealized depreciation | (328 | ) | ||||||||||||||||||||
|
| |||||||||||||||||||||
SEE NOTES TO FINANCIAL STATEMENTS.
| OCTOBER 31, 2017 | J.P. MORGAN INTERNATIONAL EQUITY FUNDS | 51 | ||||||
Table of Contents
JPMorgan International Research Enhanced Equity Fund
SCHEDULE OF PORTFOLIO INVESTMENTS
AS OF OCTOBER 31, 2017
(Amounts in U.S. Dollars, unless otherwise noted)
(Amounts in thousands)
| SHARES | SECURITY DESCRIPTION | VALUE($) | ||||||
Common Stocks — 92.3% | ||||||||
Australia — 4.6% | ||||||||
| 381 | AMP Ltd. | 1,453 | ||||||
| 2,156 | Australia & New Zealand Banking Group Ltd. | 49,483 | ||||||
| 449 | BGP Holdings Beneficial (a) (bb) | — | (h) | |||||
| 1,776 | BHP Billiton Ltd. | 36,559 | ||||||
| 384 | Commonwealth Bank of Australia | 22,819 | ||||||
| 128 | CSL Ltd. | 13,656 | ||||||
| 2,778 | Dexus | 20,800 | ||||||
| 4,245 | Goodman Group | 27,220 | ||||||
| 364 | Macquarie Group Ltd. | 27,497 | ||||||
| 641 | Wesfarmers Ltd. | 20,541 | ||||||
| 423 | Westpac Banking Corp. | 10,714 | ||||||
|
| |||||||
| 230,742 | ||||||||
|
| |||||||
Austria — 0.6% | ||||||||
| 741 | Erste Group Bank AG (a) | 31,790 | ||||||
|
| |||||||
Belgium — 1.1% | ||||||||
| 470 | Anheuser-Busch InBev SA/NV | 57,688 | ||||||
|
| |||||||
Denmark — 1.3% | ||||||||
| 208 | Chr Hansen Holding A/S | 18,175 | ||||||
| 896 | Novo Nordisk A/S, Class B | 44,624 | ||||||
|
| |||||||
| 62,799 | ||||||||
|
| |||||||
Finland — 1.8% | ||||||||
| 314 | Cargotec OYJ, Class B | 18,549 | ||||||
| 5,132 | Nokia OYJ | 25,237 | ||||||
| 2,271 | Outokumpu OYJ | 21,464 | ||||||
| 374 | Wartsila OYJ Abp | 24,092 | ||||||
|
| |||||||
| 89,342 | ||||||||
|
| |||||||
France — 10.9% | ||||||||
| 477 | Air Liquide SA | 60,765 | ||||||
| 552 | Airbus SE | 56,659 | ||||||
| 1,687 | AXA SA | 50,935 | ||||||
| 711 | BNP Paribas SA | 55,488 | ||||||
| 189 | Capgemini SE | 22,955 | ||||||
| 261 | Pernod Ricard SA | 39,129 | ||||||
| 395 | Renault SA | 39,134 | ||||||
| 562 | Sanofi | 53,255 | ||||||
| 606 | Schneider Electric SE (a) | 53,223 | ||||||
| 189 | Sodexo SA | 24,069 | ||||||
| 1,149 | TOTAL SA | 64,053 | ||||||
| 1,255 | Vivendi SA | 31,165 | ||||||
|
| |||||||
| 550,830 | ||||||||
|
| |||||||
Germany — 10.0% | ||||||||
| 119 | adidas AG | 26,527 | ||||||
| 36 | Allianz SE (Registered) | 8,511 | ||||||
| SHARES | SECURITY DESCRIPTION | VALUE($) | ||||||
Germany — continued | ||||||||
| 63 | BASF SE | 6,926 | ||||||
| 435 | Bayer AG (Registered) | 56,523 | ||||||
| 579 | Brenntag AG | 32,863 | ||||||
| 658 | Daimler AG (Registered) | 54,938 | ||||||
| 284 | Deutsche Boerse AG | 29,439 | ||||||
| 876 | Deutsche Post AG (Registered) | 40,154 | ||||||
| 1,703 | Deutsche Telekom AG (Registered) | 30,839 | ||||||
| 108 | HeidelbergCement AG | 11,023 | ||||||
| 269 | Henkel AG & Co. KGaA (Preference) | 37,749 | ||||||
| 1,168 | Infineon Technologies AG | 32,309 | ||||||
| 108 | Linde AG (a) | 23,374 | ||||||
| 567 | SAP SE | 64,774 | ||||||
| 338 | Siemens AG (Registered) | 48,522 | ||||||
|
| |||||||
| 504,471 | ||||||||
|
| |||||||
Hong Kong — 2.1% | ||||||||
| 4,836 | AIA Group Ltd. | 36,445 | ||||||
| 1,745 | CK Asset Holdings Ltd. | 14,362 | ||||||
| 2,675 | CK Hutchison Holdings Ltd. | 33,973 | ||||||
| 99 | Hang Seng Bank Ltd. | 2,353 | ||||||
| 254 | I-CABLE Communications Ltd. (a) | 8 | ||||||
| 2,269 | Wharf Holdings Ltd. (The) | 20,669 | ||||||
|
| |||||||
| 107,810 | ||||||||
|
| |||||||
Ireland — 0.5% | ||||||||
| 224 | Ryanair Holdings plc, ADR (a) | 25,131 | ||||||
|
| |||||||
Israel — 0.2% | ||||||||
| 822 | Teva Pharmaceutical Industries Ltd., ADR | 11,340 | ||||||
|
| |||||||
Italy — 2.8% | ||||||||
| 1,576 | Assicurazioni Generali SpA | 28,676 | ||||||
| 717 | Atlantia SpA | 23,366 | ||||||
| 7,115 | Enel SpA | 44,126 | ||||||
| 20,045 | Telecom Italia SpA (a) | 17,344 | ||||||
| 1,401 | UniCredit SpA (a) | 26,783 | ||||||
|
| |||||||
| 140,295 | ||||||||
|
| |||||||
Japan — 21.0% | ||||||||
| 795 | Bridgestone Corp. | 37,973 | ||||||
| 154 | Central Japan Railway Co. | 27,937 | ||||||
| 302 | Daikin Industries Ltd. | 33,406 | ||||||
| 1,079 | DMG Mori Co. Ltd. | 21,767 | ||||||
| 360 | East Japan Railway Co. | 34,922 | ||||||
| 288 | Electric Power Development Co. Ltd. | 7,251 | ||||||
| 3,372 | Fujitsu Ltd. | 26,278 | ||||||
| 3,487 | Hitachi Ltd. | 27,768 | ||||||
| 1,057 | Honda Motor Co. Ltd. | 33,136 | ||||||
| 669 | Japan Airlines Co. Ltd. | 22,898 | ||||||
SEE NOTES TO FINANCIAL STATEMENTS.
| 52 | J.P. MORGAN INTERNATIONAL EQUITY FUNDS | OCTOBER 31, 2017 | ||||
Table of Contents
| SHARES | SECURITY DESCRIPTION | VALUE($) | ||||||
Common Stocks — continued | ||||||||
Japan — continued | ||||||||
| 941 | Japan Tobacco, Inc. | 31,134 | ||||||
| 4,588 | JXTG Holdings, Inc. | 23,691 | ||||||
| 548 | KDDI Corp. | 14,603 | ||||||
| 24 | Keyence Corp. | 13,103 | ||||||
| 1,048 | Kyowa Hakko Kirin Co. Ltd. | 19,341 | ||||||
| 817 | Kyushu Electric Power Co., Inc. | 9,313 | ||||||
| 597 | Mabuchi Motor Co. Ltd. | 31,322 | ||||||
| 1,637 | Marui Group Co. Ltd. | 25,060 | ||||||
| 858 | Mazda Motor Corp. | 12,379 | ||||||
| 777 | Medipal Holdings Corp. | 14,424 | ||||||
| 1,287 | Mitsubishi Corp. | 30,137 | ||||||
| 7,957 | Mitsubishi UFJ Financial Group, Inc. | 53,974 | ||||||
| 1,133 | Mitsui Fudosan Co. Ltd. | 26,444 | ||||||
| 524 | MS&AD Insurance Group Holdings, Inc. | 17,788 | ||||||
| 1,154 | NGK Spark Plug Co. Ltd. | 26,342 | ||||||
| 239 | Nidec Corp. | 31,823 | ||||||
| 889 | Nippon Telegraph & Telephone Corp. | 42,986 | ||||||
| — | (h) | Nitori Holdings Co. Ltd. | 12 | |||||
| 302 | Otsuka Corp. | 20,553 | ||||||
| 562 | Otsuka Holdings Co. Ltd. | 23,456 | ||||||
| 2,602 | Panasonic Corp. | 39,289 | ||||||
| 1,579 | Renesas Electronics Corp. (a) | 20,416 | ||||||
| 1,208 | Sekisui House Ltd. | 22,593 | ||||||
| 886 | Seven & i Holdings Co. Ltd. | 35,698 | ||||||
| 348 | Sony Corp. | 14,541 | ||||||
| 966 | Sumitomo Mitsui Financial Group, Inc. | 38,705 | ||||||
| 330 | Suntory Beverage & Food Ltd. | 15,170 | ||||||
| 495 | Tokyo Gas Co. Ltd. | 12,352 | ||||||
| 2,430 | Toray Industries, Inc. | 24,597 | ||||||
| 1,147 | Toyota Motor Corp. | 71,132 | ||||||
| 1,122 | Yamato Holdings Co. Ltd. | 22,932 | ||||||
|
| |||||||
| 1,058,646 | ||||||||
|
| |||||||
Luxembourg — 0.6% | ||||||||
| 1,026 | ArcelorMittal (a) | 29,394 | ||||||
|
| |||||||
Netherlands — 5.1% | ||||||||
| 184 | ASML Holding NV | 33,163 | ||||||
| 273 | Heineken NV | 26,578 | ||||||
| 2,723 | ING Groep NV | 50,322 | ||||||
| 653 | Koninklijke Philips NV | 26,613 | ||||||
| 304 | NN Group NV | 12,727 | ||||||
| 1,437 | Royal Dutch Shell plc, Class A | 45,225 | ||||||
| 1,955 | Royal Dutch Shell plc, Class B | 62,955 | ||||||
|
| |||||||
| 257,583 | ||||||||
|
| |||||||
| SHARES | SECURITY DESCRIPTION | VALUE($) | ||||||
Norway — 0.4% | ||||||||
| 2,450 | Norsk Hydro ASA | 18,955 | ||||||
|
| |||||||
Singapore — 0.9% | ||||||||
| 2,638 | DBS Group Holdings Ltd. | 44,055 | ||||||
|
| |||||||
Spain — 2.4% | ||||||||
| 3,793 | Banco Santander SA | 25,711 | ||||||
| 5,291 | Bankia SA | 25,251 | ||||||
| 4,333 | Iberdrola SA | 35,012 | ||||||
| 732 | Repsol SA | 13,709 | ||||||
| 1,817 | Telefonica SA | 19,050 | ||||||
|
| |||||||
| 118,733 | ||||||||
|
| |||||||
Sweden — 0.7% | ||||||||
| 2,446 | Svenska Handelsbanken AB, Class A | 35,064 | ||||||
|
| |||||||
Switzerland — 9.1% | ||||||||
| 378 | Cie Financiere Richemont SA (Registered) | 34,833 | ||||||
| 1,364 | Credit Suisse Group AG (Registered) (a) | 21,501 | ||||||
| 550 | Ferguson plc | 38,448 | ||||||
| 671 | LafargeHolcim Ltd. (Registered) (a) | 37,859 | ||||||
| 1,247 | Nestle SA (Registered) | 104,922 | ||||||
| 590 | Novartis AG (Registered) | 48,675 | ||||||
| 312 | Roche Holding AG | 72,191 | ||||||
| 298 | Swiss Re AG | 28,000 | ||||||
| 2,083 | UBS Group AG (Registered) (a) | 35,444 | ||||||
| 117 | Zurich Insurance Group AG | 35,656 | ||||||
|
| |||||||
| 457,529 | ||||||||
|
| |||||||
United Kingdom — 15.4% | ||||||||
| 1,926 | 3i Group plc | 24,583 | ||||||
| 327 | Associated British Foods plc | 14,465 | ||||||
| 565 | AstraZeneca plc | 38,228 | ||||||
| 3,837 | Aviva plc | 25,739 | ||||||
| 2,161 | Barratt Developments plc | 18,790 | ||||||
| 5,865 | BP plc | 39,783 | ||||||
| 1,129 | British American Tobacco plc | 72,964 | ||||||
| 1,245 | Burberry Group plc | 31,439 | ||||||
| 10,172 | Centrica plc | 22,941 | ||||||
| 3,340 | Dixons Carphone plc | 7,694 | ||||||
| 2,122 | GlaxoSmithKline plc | 38,083 | ||||||
| 7,505 | HSBC Holdings plc | 73,285 | ||||||
| 600 | InterContinental Hotels Group plc | 33,241 | ||||||
| 9,435 | ITV plc | 20,624 | ||||||
| 24,981 | Lloyds Banking Group plc | 22,644 | ||||||
| 1,956 | Prudential plc | 48,010 | ||||||
| 79 | Reckitt Benckiser Group plc | 7,070 | ||||||
| 864 | Rio Tinto Ltd. | 46,031 | ||||||
| 186 | Rio Tinto plc | 8,791 | ||||||
SEE NOTES TO FINANCIAL STATEMENTS.
| OCTOBER 31, 2017 | J.P. MORGAN INTERNATIONAL EQUITY FUNDS | 53 | ||||||
Table of Contents
JPMorgan International Research Enhanced Equity Fund
SCHEDULE OF PORTFOLIO INVESTMENTS
AS OF OCTOBER 31, 2017 (continued)
(Amounts in U.S. Dollars, unless otherwise noted)
(Amounts in thousands, except number of Futures contracts)
| SHARES | SECURITY DESCRIPTION | VALUE($) | ||||||
Common Stocks — continued | ||||||||
United Kingdom — continued | ||||||||
| 3,581 | Standard Chartered plc (a) | 35,670 | ||||||
| 6,609 | Taylor Wimpey plc | 17,515 | ||||||
| 539 | TechnipFMC plc (a) | 14,663 | ||||||
| 480 | Unilever NV, CVA | 27,898 | ||||||
| 18,789 | Vodafone Group plc | 53,744 | ||||||
| 200 | Whitbread plc | 9,816 | ||||||
| 1,218 | WPP plc | 21,533 | ||||||
|
| |||||||
| 775,244 | ||||||||
|
| |||||||
United States — 0.8% | ||||||||
| 843 | Shire plc | 41,536 | ||||||
|
| |||||||
Total Common Stocks | 4,648,977 | |||||||
|
| |||||||
| PRINCIPAL AMOUNT($) | ||||||||
Corporate Bond — 0.0% (g) | ||||||||
Materials — 0.0% (g) | ||||||||
Metals & Mining — 0.0% (g) | ||||||||
| BRL 11 | Vale SA, Series A6, 0.00% (d) (x) (y) (aa) (bb) (Cost $—) | — | (h) | |||||
|
| |||||||
| SHARES | ||||||||
Short-Term Investment — 4.8% | ||||||||
Investment Company — 4.8% | ||||||||
| 242,928 | JPMorgan U.S. Government Money Market Fund, Institutional Class Shares, 0.92% (b) (l) | 242,928 | ||||||
|
| |||||||
Total Investments — 97.1% | 4,891,905 | |||||||
Other Assets in Excess of | 146,797 | |||||||
|
| |||||||
NET ASSETS — 100.0% | $ | 5,038,702 | ||||||
|
| |||||||
Percentages indicated are based on net assets.
Summary of Investments by Industry, October 31, 2017
The following table represents the portfolio investments of the Fund by industry classifications as a percentage of total investments:
| INDUSTRY | PERCENTAGE | |||
Banks | 12.3 | % | ||
Pharmaceuticals | 8.3 | |||
Insurance | 6.0 | |||
Oil, Gas & Consumable Fuels | 5.1 | |||
Automobiles | 4.3 | |||
Metals & Mining | 3.3 | |||
Diversified Telecommunication Services | 2.9 | |||
Beverages | 2.8 | |||
Capital Markets | 2.8 | |||
Chemicals | 2.7 | |||
Food Products | 2.4 | |||
Electrical Equipment | 2.4 | |||
Household Durables | 2.3 | |||
Tobacco | 2.1 | |||
Trading Companies & Distributors | 2.1 | |||
Textiles, Apparel & Luxury Goods | 1.9 | |||
Electric Utilities | 1.8 | |||
Semiconductors & Semiconductor Equipment | 1.8 | |||
Industrial Conglomerates | 1.7 | |||
IT Services | 1.4 | |||
Wireless Telecommunication Services | 1.4 | |||
Hotels, Restaurants & Leisure | 1.4 | |||
Software | 1.3 | |||
Machinery | 1.3 | |||
Auto Components | 1.3 | |||
Air Freight & Logistics | 1.3 | |||
Road & Rail | 1.3 | |||
Real Estate Management & Development | 1.3 | |||
Aerospace & Defense | 1.2 | |||
Food & Staples Retailing | 1.1 | |||
Biotechnology | 1.1 | |||
Construction Materials | 1.0 | |||
Airlines | 1.0 | |||
Equity Real Estate Investment Trusts (REITs) | 1.0 | |||
Others (each less than 1.0%) | 7.6 | |||
Short-Term Investment | 5.0 | |||
SEE NOTES TO FINANCIAL STATEMENTS.
| 54 | J.P. MORGAN INTERNATIONAL EQUITY FUNDS | OCTOBER 31, 2017 | ||||
Table of Contents
| Futures contracts outstanding as of October 31, 2017: | ||||||||||||||||
| DESCRIPTION | NUMBER OF CONTRACTS | EXPIRATION DATE | TRADING CURRENCY | NOTIONAL AMOUNT ($) | VALUE AND UNREALIZED APPRECIATION (DEPRECIATION) ($) | |||||||||||
Long Contracts | ||||||||||||||||
| Hang Seng Index | 193 | 11/2017 | HKD | 34,904 | (425 | ) | ||||||||||
| EURO STOXX 50 Index | 2,756 | 12/2017 | EUR | 118,214 | 3,414 | |||||||||||
| FTSE 100 Index | 795 | 12/2017 | GBP | 78,872 | 426 | |||||||||||
| TOPIX Index | 769 | 12/2017 | JPY | 120,224 | 5,210 | |||||||||||
|
| |||||||||||||||
| 8,625 | ||||||||||||||||
|
| |||||||||||||||
SEE NOTES TO FINANCIAL STATEMENTS.
| OCTOBER 31, 2017 | J.P. MORGAN INTERNATIONAL EQUITY FUNDS | 55 | ||||||
Table of Contents
JPMorgan International Unconstrained Equity Fund
SCHEDULE OF PORTFOLIO INVESTMENTS
AS OF OCTOBER 31, 2017
(Amounts in thousands)
| SHARES | SECURITY DESCRIPTION | VALUE($) | ||||||
Common Stock — 95.3% | ||||||||
Canada — 2.8% | ||||||||
| 101 | Alimentation Couche-Tard, Inc., Class B | 4,736 | ||||||
| 67 | Canadian National Railway Co. | 5,392 | ||||||
|
| |||||||
| 10,128 | ||||||||
|
| |||||||
China — 10.4% | ||||||||
| 22 | Baidu, Inc., ADR (a) | 5,324 | ||||||
| 3,588 | China Unicom Hong Kong Ltd. (a) | 5,091 | ||||||
| 5,195 | CNOOC Ltd. | 7,092 | ||||||
| 127 | JD.com, Inc., ADR (a) | 4,757 | ||||||
| 1,680 | Ping An Insurance Group Co. of China Ltd., Class H | 14,764 | ||||||
|
| |||||||
| 37,028 | ||||||||
|
| |||||||
Denmark — 1.4% | ||||||||
| 100 | Novo Nordisk A/S, Class B | 4,964 | ||||||
|
| |||||||
Finland — 1.7% | ||||||||
| 92 | Wartsila OYJ Abp | 5,902 | ||||||
|
| |||||||
France — 2.0% | ||||||||
| 69 | Safran SA | 7,239 | ||||||
|
| |||||||
Germany — 10.7% | ||||||||
| 73 | Bayer AG (Registered) | 9,497 | ||||||
| 41 | Continental AG | 10,364 | ||||||
| 101 | Delivery Hero AG, Reg. S (a) (e) | 4,294 | ||||||
| 47 | Linde AG (a) | 10,163 | ||||||
| 79 | Zalando SE, Reg. S (a) (e) | 3,998 | ||||||
|
| |||||||
| 38,316 | ||||||||
|
| |||||||
Hong Kong — 6.7% | ||||||||
| 1,407 | AIA Group Ltd. | 10,602 | ||||||
| 790 | CK Asset Holdings Ltd. | 6,498 | ||||||
| 539 | CK Hutchison Holdings Ltd. | 6,846 | ||||||
|
| |||||||
| 23,946 | ||||||||
|
| |||||||
India — 2.6% | ||||||||
| 102 | HDFC Bank Ltd., ADR | 9,400 | ||||||
|
| |||||||
Indonesia — 2.0% | ||||||||
| 4,634 | Bank Central Asia Tbk. PT | 7,138 | ||||||
|
| |||||||
Italy — 1.9% | ||||||||
| 351 | UniCredit SpA (a) | 6,710 | ||||||
|
| |||||||
Japan — 11.7% | ||||||||
| 31 | FANUC Corp. | 7,225 | ||||||
| 237 | Komatsu Ltd. | 7,734 | ||||||
| 346 | Kubota Corp. | 6,516 | ||||||
| 433 | ORIX Corp. | 7,436 | ||||||
| 154 | Recruit Holdings Co. Ltd. | 3,776 | ||||||
| 88 | Shin-Etsu Chemical Co. Ltd. | 9,302 | ||||||
|
| |||||||
| 41,989 | ||||||||
|
| |||||||
| SHARES | SECURITY DESCRIPTION | VALUE($) | ||||||
Netherlands — 8.8% | ||||||||
| 426 | Altice NV, Class A (a) | 8,030 | ||||||
| 47 | ASML Holding NV | 8,490 | ||||||
| 392 | ING Groep NV | 7,252 | ||||||
| 182 | NN Group NV | 7,638 | ||||||
|
| |||||||
| 31,410 | ||||||||
|
| |||||||
South Africa — 2.0% | ||||||||
| 29 | Naspers Ltd., Class N | 7,058 | ||||||
|
| |||||||
South Korea — 4.8% | ||||||||
| 47 | Hyundai Motor Co. | 6,827 | ||||||
| 8 | Samsung Electronics Co. Ltd., GDR (e) | 10,449 | ||||||
|
| |||||||
| 17,276 | ||||||||
|
| |||||||
Spain — 2.2% | ||||||||
| 895 | Banco Bilbao Vizcaya Argentaria SA | 7,830 | ||||||
|
| |||||||
Switzerland — 8.0% | ||||||||
| 60 | Cie Financiere Richemont SA (Registered) | 5,499 | ||||||
| 1,572 | Glencore plc (a) | 7,582 | ||||||
| 147 | LafargeHolcim Ltd. (Registered) (a) | 8,277 | ||||||
| 433 | UBS Group AG (Registered) (a) | 7,364 | ||||||
|
| |||||||
| 28,722 | ||||||||
|
| |||||||
United Kingdom — 15.6% | ||||||||
| 140 | British American Tobacco plc | 9,029 | ||||||
| 2,933 | ITV plc | 6,412 | ||||||
| 724 | Meggitt plc | 4,986 | ||||||
| 237 | RELX NV | 5,361 | ||||||
| 147 | Rio Tinto plc | 6,926 | ||||||
| 359 | Smith & Nephew plc | 6,779 | ||||||
| 200 | TechnipFMC plc (a) | 5,431 | ||||||
| 188 | Unilever NV, CVA | 10,945 | ||||||
|
| |||||||
| 55,869 | ||||||||
|
| |||||||
Total Common Stocks | 340,925 | |||||||
|
| |||||||
Short-Term Investment — 4.1% | ||||||||
Investment Company — 4.1% | ||||||||
| 14,714 | JPMorgan U.S. Government Money Market Fund, Institutional Class Shares, 0.92% (b) (l) | 14,714 | ||||||
|
| |||||||
Total Investments — 99.4% | 355,639 | |||||||
Other Assets in Excess of | 1,990 | |||||||
|
| |||||||
NET ASSETS — 100.0% | $ | 357,629 | ||||||
|
| |||||||
Percentages indicated are based on net assets.
SEE NOTES TO FINANCIAL STATEMENTS.
| 56 | J.P. MORGAN INTERNATIONAL EQUITY FUNDS | OCTOBER 31, 2017 | ||||
Table of Contents
Summary of Investments by Industry, October 31, 2017
The following table represents the portfolio investments of the Fund by industry classifications as a percentage of total investments:
| INDUSTRY | PERCENTAGE | |||
Banks | 10.8 | % | ||
Insurance | 9.3 | |||
Machinery | 7.7 | |||
Media | 6.1 | |||
Chemicals | 5.5 | |||
Metals & Mining | 4.1 | |||
Pharmaceuticals | 4.1 | |||
Aerospace & Defense | 3.4 | |||
Personal Products | 3.1 | |||
Technology Hardware, Storage & Peripherals | 2.9 | |||
Auto Components | 2.9 | |||
Internet Software & Services | 2.7 | |||
Professional Services | 2.6 | |||
Tobacco | 2.5 | |||
Internet & Direct Marketing Retail | 2.5 | |||
Semiconductors & Semiconductor Equipment | 2.4 | |||
Construction Materials | 2.3 | |||
Diversified Financial Services | 2.1 | |||
Capital Markets | 2.1 | |||
Oil, Gas & Consumable Fuels | 2.0 | |||
Industrial Conglomerates | 1.9 | |||
Automobiles | 1.9 | |||
Health Care Equipment & Supplies | 1.9 | |||
Real Estate Management & Development | 1.8 | |||
Textiles, Apparel & Luxury Goods | 1.6 | |||
Energy Equipment & Services | 1.5 | |||
Road & Rail | 1.5 | |||
Diversified Telecommunication Services | 1.4 | |||
Food & Staples Retailing | 1.3 | |||
Short-Term Investment | 4.1 | |||
SEE NOTES TO FINANCIAL STATEMENTS.
| OCTOBER 31, 2017 | J.P. MORGAN INTERNATIONAL EQUITY FUNDS | 57 | ||||||
Table of Contents
JPMorgan International Value Fund
SCHEDULE OF PORTFOLIO INVESTMENTS
AS OF OCTOBER 31, 2017
(Amounts in thousands)
| SHARES | SECURITY DESCRIPTION | VALUE($) | ||||||
Common Stock — 98.5% | ||||||||
Australia — 3.3% |
| |||||||
| 835 | Australia & New Zealand Banking Group Ltd. | 19,153 | ||||||
| 1,135 | Goodman Group | 7,275 | ||||||
|
| |||||||
| 26,428 | ||||||||
|
| |||||||
Austria — 1.3% |
| |||||||
| 238 | Erste Group Bank AG (a) | 10,196 | ||||||
|
| |||||||
Belgium — 2.3% |
| |||||||
| 106 | Anheuser-Busch InBev SA/NV | 12,986 | ||||||
| 64 | KBC Group NV | 5,323 | ||||||
|
| |||||||
| 18,309 | ||||||||
|
| |||||||
Canada — 1.4% |
| |||||||
| 233 | TransCanada Corp. | 11,081 | ||||||
|
| |||||||
China — 0.9% |
| |||||||
| 5,170 | CNOOC Ltd. | 7,059 | ||||||
| �� |
|
| ||||||
Finland — 1.3% |
| |||||||
| 1,053 | Outokumpu OYJ | 9,957 | ||||||
|
| |||||||
France — 15.8% |
| |||||||
| 126 | Air Liquide SA | 16,001 | ||||||
| 109 | Airbus SE | 11,224 | ||||||
| 595 | AXA SA | 17,971 | ||||||
| 217 | BNP Paribas SA | 16,949 | ||||||
| 113 | Renault SA | 11,170 | ||||||
| 130 | Sanofi | 12,281 | ||||||
| 142 | Schneider Electric SE (a) | 12,508 | ||||||
| 487 | TOTAL SA | 27,123 | ||||||
|
| |||||||
| 125,227 | ||||||||
|
| |||||||
Germany — 7.6% |
| |||||||
| 52 | Bayer AG (Registered) | 6,804 | ||||||
| 107 | Brenntag AG | 6,095 | ||||||
| 164 | Daimler AG (Registered) | 13,728 | ||||||
| 77 | Deutsche Boerse AG | 7,963 | ||||||
| 32 | HeidelbergCement AG | 3,242 | ||||||
| 218 | Infineon Technologies AG | 6,043 | ||||||
| 117 | Siemens AG (Registered) | 16,764 | ||||||
|
| |||||||
| 60,639 | ||||||||
|
| |||||||
Ireland — 0.9% |
| |||||||
| 63 | Ryanair Holdings plc, ADR (a) | 7,036 | ||||||
|
| |||||||
Israel — 0.7% |
| |||||||
| 408 | Teva Pharmaceutical Industries Ltd., ADR | 5,631 | ||||||
|
| |||||||
Italy — 3.6% |
| |||||||
| 2,524 | Enel SpA | 15,656 | ||||||
| 2,229 | Intesa Sanpaolo SpA | 7,494 | ||||||
| SHARES | SECURITY DESCRIPTION | VALUE($) | ||||||
Italy — continued |
| |||||||
| 5,867 | Telecom Italia SpA (a) | 5,077 | ||||||
|
| |||||||
| 28,227 | ||||||||
|
| |||||||
Japan — 22.4% |
| |||||||
| 266 | Bridgestone Corp. | 12,721 | ||||||
| 88 | Daikin Industries Ltd. | 9,714 | ||||||
| 319 | DMG Mori Co. Ltd. | 6,431 | ||||||
| 508 | Honda Motor Co. Ltd. | 15,916 | ||||||
| 232 | Japan Airlines Co. Ltd. | 7,941 | ||||||
| 324 | Japan Tobacco, Inc. | 10,728 | ||||||
| 176 | Mabuchi Motor Co. Ltd. | 9,220 | ||||||
| 443 | Mitsubishi Corp. | 10,383 | ||||||
| 3,217 | Mitsubishi UFJ Financial Group, Inc. | 21,822 | ||||||
| 241 | Mitsui Fudosan Co. Ltd. | 5,630 | ||||||
| 409 | NGK Spark Plug Co. Ltd. | 9,329 | ||||||
| 291 | Nippon Telegraph & Telephone Corp. | 14,050 | ||||||
| 135 | Otsuka Corp. | 9,169 | ||||||
| 400 | Renesas Electronics Corp. (a) | 5,175 | ||||||
| 327 | Sumitomo Electric Industries Ltd. | 5,559 | ||||||
| 164 | Sumitomo Mitsui Financial Group, Inc. | 6,574 | ||||||
| 208 | Sumitomo Mitsui Trust Holdings, Inc. | 8,202 | ||||||
| 68 | Toyota Motor Corp. | 4,236 | ||||||
| 244 | Yamato Holdings Co. Ltd. | 4,983 | ||||||
|
| |||||||
| 177,783 | ||||||||
|
| |||||||
Luxembourg — 1.4% |
| |||||||
| 391 | ArcelorMittal (a) | 11,191 | ||||||
|
| |||||||
Netherlands — 7.5% |
| |||||||
| 814 | ING Groep NV | 15,038 | ||||||
| 227 | NN Group NV | 9,491 | ||||||
| 1,114 | Royal Dutch Shell plc, Class A | 35,057 | ||||||
|
| |||||||
| 59,586 | ||||||||
|
| |||||||
Norway — 1.0% |
| |||||||
| 1,001 | Norsk Hydro ASA | 7,744 | ||||||
|
| |||||||
Singapore — 1.4% |
| |||||||
| 662 | DBS Group Holdings Ltd. | 11,051 | ||||||
|
| |||||||
South Korea — 1.0% |
| |||||||
| 3 | Samsung Electronics Co. Ltd. | 7,703 | ||||||
|
| |||||||
Spain — 3.0% |
| |||||||
| 367 | Banco Santander SA | 2,488 | ||||||
| 1,845 | Bankia SA | 8,804 | ||||||
| 1,515 | Iberdrola SA | 12,245 | ||||||
|
| |||||||
| 23,537 | ||||||||
|
| |||||||
Sweden — 0.9% |
| |||||||
| 519 | Svenska Handelsbanken AB, Class A | 7,436 | ||||||
|
| |||||||
SEE NOTES TO FINANCIAL STATEMENTS.
| 58 | J.P. MORGAN INTERNATIONAL EQUITY FUNDS | OCTOBER 31, 2017 | ||||
Table of Contents
| SHARES | SECURITY DESCRIPTION | VALUE($) | ||||||
Common Stock — continued | ||||||||
Switzerland — 8.3% |
| |||||||
| 798 | Credit Suisse Group AG (Registered) (a) | 12,571 | ||||||
| 114 | Ferguson plc | 7,953 | ||||||
| 93 | LafargeHolcim Ltd. (Registered) (a) | 5,261 | ||||||
| 132 | Novartis AG (Registered) | 10,876 | ||||||
| 31 | Roche Holding AG | 7,232 | ||||||
| 90 | Swiss Re AG | 8,425 | ||||||
| 46 | Zurich Insurance Group AG | 13,893 | ||||||
|
| |||||||
| 66,211 | ||||||||
|
| |||||||
United Kingdom — 11.1% |
| |||||||
| 699 | Barratt Developments plc | 6,079 | ||||||
| 1,152 | HSBC Holdings plc | 11,254 | ||||||
| 87 | InterContinental Hotels Group plc | 4,823 | ||||||
| 3,232 | ITV plc | 7,066 | ||||||
| 541 | Prudential plc | 13,281 | ||||||
| 229 | Rio Tinto plc | 10,818 | ||||||
| 1,301 | Standard Chartered plc (a) | 12,958 | ||||||
| 231 | TechnipFMC plc (a) | 6,279 | ||||||
| 5,422 | Vodafone Group plc | 15,510 | ||||||
|
| |||||||
| 88,068 | ||||||||
|
| |||||||
United States — 1.4% |
| |||||||
| 227 | Shire plc | 11,188 | ||||||
|
| |||||||
Total Common Stocks | 781,288 | |||||||
|
| |||||||
Short-Term Investment — 1.0% | ||||||||
Investment Company — 1.0% |
| |||||||
| 8,228 | JPMorgan U.S. Government Money Market Fund, Institutional Class Shares, 0.92% (b) (l) | 8,228 | ||||||
|
| |||||||
Total Investments — 99.5% | 789,516 | |||||||
Other Assets in Excess of | 4,271 | |||||||
|
| |||||||
NET ASSETS — 100.0% | $ | 793,787 | ||||||
|
| |||||||
Percentages indicated are based on net assets.
Summary of Investments by Industry, October 31, 2017
The following table represents the portfolio investments of the Fund by industry classifications as a percentage of total investments:
| INDUSTRY | PERCENTAGE | |||
Banks | 20.9 | % | ||
Oil, Gas & Consumable Fuels | 10.2 | |||
Insurance | 8.0 | |||
Automobiles | 5.7 | |||
Pharmaceuticals | 5.4 | |||
Metals & Mining | 5.0 | |||
Electric Utilities | 3.5 | |||
Auto Components | 3.5 | |||
Trading Companies & Distributors | 3.1 | |||
Electrical Equipment | 2.8 | |||
Capital Markets | 2.6 | |||
Diversified Telecommunication Services | 2.4 | |||
Industrial Conglomerates | 2.1 | |||
Chemicals | 2.0 | |||
Wireless Telecommunication Services | 2.0 | |||
Airlines | 1.9 | |||
Beverages | 1.7 | |||
Aerospace & Defense | 1.4 | |||
Semiconductors & Semiconductor Equipment | 1.4 | |||
Biotechnology | 1.4 | |||
Tobacco | 1.4 | |||
Building Products | 1.2 | |||
IT Services | 1.2 | |||
Construction Materials | 1.1 | |||
Technology Hardware, Storage & Peripherals | 1.0 | |||
Others (each less than 1.0%) | 6.1 | |||
Short-Term Investment | 1.0 | |||
SEE NOTES TO FINANCIAL STATEMENTS.
| OCTOBER 31, 2017 | J.P. MORGAN INTERNATIONAL EQUITY FUNDS | 59 | ||||||
Table of Contents
JPMorgan International Value Fund
SCHEDULE OF PORTFOLIO INVESTMENTS
AS OF OCTOBER 31, 2017 (continued)
(Amounts in thousands)
| Forward foreign currency exchange contracts outstanding as of October 31, 2017: | ||||||||||||||||||||||
| CURRENCY PURCHASED | CURRENCY SOLD | COUNTERPARTY | SETTLEMENT DATE | UNREALIZED APPRECIATION (DEPRECIATION) ($) | ||||||||||||||||||
| GBP | 1,810 | CHF | 2,245 | Citibank, NA# | 11/22/2017 | 151 | ||||||||||||||||
| GBP | 10,489 | USD | 13,538 | Merrill Lynch International | 11/22/2017 | 401 | ||||||||||||||||
| GBP | 4,451 | USD | 5,740 | National Australia Bank Ltd. | 11/22/2017 | 175 | ||||||||||||||||
| GBP | 2,792 | USD | 3,706 | State Street Corp. | 11/22/2017 | 4 | ||||||||||||||||
| HKD | 159,139 | USD | 20,390 | HSBC Bank, NA | 11/22/2017 | 13 | ||||||||||||||||
| USD | 2,334 | AUD | 2,944 | Australia & New Zealand Banking Group Ltd. | 11/22/2017 | 81 | ||||||||||||||||
| USD | 12,142 | CAD | 15,286 | Union Bank of Switzerland AG | 11/22/2017 | 291 | ||||||||||||||||
| USD | 1,563 | CHF | 1,524 | Credit Suisse International | 11/22/2017 | 33 | ||||||||||||||||
| USD | 78 | CHF | 76 | Merrill Lynch International | 11/22/2017 | 1 | ||||||||||||||||
| USD | 14,300 | CHF | 13,750 | National Australia Bank Ltd. | 11/22/2017 | 499 | ||||||||||||||||
| USD | 1,649 | EUR | 1,395 | BNP Paribas | 11/22/2017 | 22 | ||||||||||||||||
| USD | 78,541 | EUR | 66,578 | Citibank, NA | 11/22/2017 | 904 | ||||||||||||||||
| USD | 11,802 | EUR | 10,018 | Credit Suisse International | 11/22/2017 | 119 | ||||||||||||||||
| USD | 10,890 | EUR | 9,174 | National Australia Bank Ltd. | 11/22/2017 | 193 | ||||||||||||||||
| USD | 5,487 | JPY | 618,910 | Merrill Lynch International | 11/22/2017 | 39 | ||||||||||||||||
| USD | 9,464 | JPY | 1,031,420 | National Australia Bank Ltd. | 11/22/2017 | 385 | ||||||||||||||||
| USD | 6,956 | NOK | 54,963 | Deutsche Bank AG | 11/22/2017 | 223 | ||||||||||||||||
| USD | 2,567 | SEK | 20,614 | Citibank, NA | 11/22/2017 | 102 | ||||||||||||||||
| USD | 2,351 | SEK | 19,094 | Credit Suisse International | 11/22/2017 | 68 | ||||||||||||||||
| Total unrealized appreciation | 3,704 | |||||||||||||||||||||
| AUD | 2,965 | USD | 2,344 | Australia & New Zealand Banking Group Ltd. | 11/22/2017 | (75 | ) | |||||||||||||||
| AUD | 2,107 | USD | 1,669 | National Australia Bank Ltd. | 11/22/2017 | (56 | ) | |||||||||||||||
| AUD | 30,192 | USD | 23,859 | Standard Chartered Bank | 11/22/2017 | (757 | ) | |||||||||||||||
| CAD | 1,368 | USD | 1,088 | National Australia Bank Ltd. | 11/22/2017 | (28 | ) | |||||||||||||||
| CHF | 1,937 | USD | 2,017 | Australia & New Zealand Banking Group Ltd. | 11/22/2017 | (73 | ) | |||||||||||||||
| CHF | 2,235 | USD | 2,294 | Deutsche Bank AG | 11/22/2017 | (50 | ) | |||||||||||||||
| CHF | 11,817 | USD | 12,291 | HSBC Bank, NA | 11/22/2017 | (431 | ) | |||||||||||||||
| CHF | 1,608 | USD | 1,653 | TD Bank Financial Group | 11/22/2017 | (40 | ) | |||||||||||||||
| DKK | 40,063 | USD | 6,357 | Merrill Lynch International | 11/22/2017 | (78 | ) | |||||||||||||||
| EUR | 7,303 | USD | 8,602 | Citibank, NA | 11/22/2017 | (86 | ) | |||||||||||||||
| EUR | 1,381 | USD | 1,634 | Deutsche Bank AG | 11/22/2017 | (23 | ) | |||||||||||||||
| EUR | 20,870 | USD | 24,740 | National Australia Bank Ltd. | 11/22/2017 | (402 | ) | |||||||||||||||
| EUR | 2,929 | USD | 3,446 | Union Bank of Switzerland AG | 11/22/2017 | (31 | ) | |||||||||||||||
| JPY | 941,260 | USD | 8,478 | National Australia Bank Ltd. | 11/22/2017 | (192 | ) | |||||||||||||||
| JPY | 107,300 | USD | 988 | Standard Chartered Bank | 11/22/2017 | (44 | ) | |||||||||||||||
| JPY | 838,521 | USD | 7,694 | State Street Corp. | 11/22/2017 | (313 | ) | |||||||||||||||
| NOK | 31,588 | EUR | 3,379 | HSBC Bank, NA# | 11/22/2017 | (71 | ) | |||||||||||||||
| NOK | 12,931 | USD | 1,632 | Union Bank of Switzerland AG | 11/22/2017 | (48 | ) | |||||||||||||||
| SEK | 141,823 | USD | 17,556 | Citibank, NA | 11/22/2017 | (597 | ) | |||||||||||||||
| USD | 3,095 | GBP | 2,353 | National Australia Bank Ltd. | 11/22/2017 | (32 | ) | |||||||||||||||
| USD | 3,889 | GBP | 3,006 | Royal Bank of Canada | 11/22/2017 | (106 | ) | |||||||||||||||
| USD | 3,114 | GBP | 2,344 | Standard Chartered Bank | 11/22/2017 | (1 | ) | |||||||||||||||
| Total unrealized depreciation | (3,534 | ) | ||||||||||||||||||||
Net unrealized appreciation | 170 | |||||||||||||||||||||
|
| |||||||||||||||||||||
| # | For cross-currency exchange contracts, the settlement value is the U.S. Dollar market value at October 31, 2017 of the currency being sold, and the value at October 31, 2017 is the U.S. Dollar market value of the currency being purchased. |
SEE NOTES TO FINANCIAL STATEMENTS.
| 60 | J.P. MORGAN INTERNATIONAL EQUITY FUNDS | OCTOBER 31, 2017 | ||||
Table of Contents
JPMorgan Intrepid International Fund
SCHEDULE OF PORTFOLIO INVESTMENTS
AS OF OCTOBER 31, 2017
(Amounts in thousands)
| SHARES | SECURITY DESCRIPTION | VALUE($) | ||||||
Common Stocks — 97.8% | ||||||||
Australia — 6.4% |
| |||||||
| 1,199 | AGL Energy Ltd. | 23,208 | ||||||
| 1,361 | Aristocrat Leisure Ltd. | 24,612 | ||||||
| 514 | BlueScope Steel Ltd. | 5,056 | ||||||
| 160 | CIMIC Group Ltd. | 5,926 | ||||||
| 1,148 | Computershare Ltd. | 13,722 | ||||||
| 99 | Flight Centre Travel Group Ltd. | 3,540 | ||||||
| 2,114 | Fortescue Metals Group Ltd. | 7,517 | ||||||
| 384 | Macquarie Group Ltd. | 28,971 | ||||||
| 2,675 | Metcash Ltd. | 5,526 | ||||||
| 263 | Monadelphous Group Ltd. | 3,417 | ||||||
| 865 | Orica Ltd. | 13,860 | ||||||
| 5,266 | Qantas Airways Ltd. | 24,852 | ||||||
| 1,665 | Regis Resources Ltd. | 4,947 | ||||||
| 9,113 | South32 Ltd. | 23,804 | ||||||
| 5,199 | Whitehaven Coal Ltd. (a) | 14,860 | ||||||
| �� | |||||||
| 203,818 | ||||||||
|
| |||||||
Austria — 1.2% |
| |||||||
| 249 | Erste Group Bank AG (a) | 10,681 | ||||||
| 433 | OMV AG | 25,986 | ||||||
|
| |||||||
| 36,667 | ||||||||
|
| |||||||
Belgium — 1.4% |
| |||||||
| 336 | KBC Group NV | 27,914 | ||||||
| 376 | Proximus SADP | 12,476 | ||||||
| 20 | Solvay SA | 3,013 | ||||||
|
| |||||||
| 43,403 | ||||||||
|
| |||||||
China — 0.9% |
| |||||||
| 5,740 | BOC Hong Kong Holdings Ltd. | 27,352 | ||||||
|
| |||||||
Denmark — 4.0% |
| |||||||
| 740 | Danske Bank A/S | 28,225 | ||||||
| 120 | Dfds A/S | 6,959 | ||||||
| 223 | Jyske Bank A/S (Registered) | 12,620 | ||||||
| 586 | Novo Nordisk A/S, Class B | 29,196 | ||||||
| 100 | Royal Unibrew A/S | 5,747 | ||||||
| 31 | Schouw & Co. AB | 3,274 | ||||||
| 254 | Sydbank A/S | 9,899 | ||||||
| 116 | Topdanmark A/S (a) | 4,774 | ||||||
| 283 | Vestas Wind Systems A/S | 24,996 | ||||||
|
| |||||||
| 125,690 | ||||||||
|
| |||||||
Finland — 0.4% |
| |||||||
| 421 | UPM-Kymmene OYJ | 12,636 | ||||||
|
| |||||||
France — 10.1% |
| |||||||
| 801 | Air France-KLM (a) | 12,540 | ||||||
| 103 | Arkema SA | 13,012 | ||||||
| SHARES | SECURITY DESCRIPTION | VALUE($) | ||||||
France — continued |
| |||||||
| 173 | Atos SE | 26,827 | ||||||
| 364 | BNP Paribas SA | 28,440 | ||||||
| 223 | Capgemini SE | 27,149 | ||||||
| 201 | Cie Generale des Etablissements Michelin | 29,145 | ||||||
| 638 | Credit Agricole SA | 11,138 | ||||||
| 99 | Eurazeo SA | 9,203 | ||||||
| 412 | Faurecia | 29,980 | ||||||
| 1,517 | Natixis SA | 11,899 | ||||||
| 971 | Peugeot SA | 23,049 | ||||||
| 458 | Sanofi | 43,370 | ||||||
| 238 | Schneider Electric SE (a) | 20,939 | ||||||
| 34 | Sopra Steria Group | 6,340 | ||||||
| 73 | TOTAL SA | 4,095 | ||||||
| 217 | Vinci SA | 21,270 | ||||||
|
| |||||||
| 318,396 | ||||||||
|
| |||||||
Germany — 6.6% |
| |||||||
| 201 | Allianz SE (Registered) | 46,839 | ||||||
| 214 | Aurubis AG | 17,535 | ||||||
| 310 | Covestro AG, Reg. S (e) | 29,787 | ||||||
| 595 | Deutsche Lufthansa AG (Registered) | 19,112 | ||||||
| 92 | HOCHTIEF AG | 16,237 | ||||||
| 522 | Infineon Technologies AG | 14,439 | ||||||
| 563 | Innogy SE, Reg. S (e) | 26,192 | ||||||
| 184 | Jenoptik AG | 6,207 | ||||||
| 218 | RWE AG (a) | 5,479 | ||||||
| 1,010 | Uniper SE | 28,380 | ||||||
|
| |||||||
| 210,207 | ||||||||
|
| |||||||
Hong Kong — 1.4% |
| |||||||
| 1,349 | CK Asset Holdings Ltd. | 11,102 | ||||||
| 482 | Hongkong Land Holdings Ltd. | 3,525 | ||||||
| 1,424 | Luk Fook Holdings International Ltd. | 6,024 | ||||||
| 12,957 | WH Group Ltd., Reg. S (e) | 13,130 | ||||||
| 10,958 | Xinyi Glass Holdings Ltd. | 10,619 | ||||||
|
| |||||||
| 44,400 | ||||||||
|
| |||||||
Israel — 0.7% |
| |||||||
| 199 | Check Point Software Technologies Ltd. (a) | 23,399 | ||||||
|
| |||||||
Italy — 1.1% |
| |||||||
| 5,448 | Enel SpA | 33,785 | ||||||
|
| |||||||
Japan — 23.1% |
| |||||||
| 306 | Aeon Mall Co. Ltd. | 5,475 | ||||||
| 269 | Aisin Seiki Co. Ltd. | 13,919 | ||||||
| 294 | Asahi Glass Co. Ltd. | 11,522 | ||||||
| 412 | Bridgestone Corp. | 19,658 | ||||||
| 567 | Brother Industries Ltd. | 13,792 | ||||||
SEE NOTES TO FINANCIAL STATEMENTS.
| OCTOBER 31, 2017 | J.P. MORGAN INTERNATIONAL EQUITY FUNDS | 61 | ||||||
Table of Contents
JPMorgan Intrepid International Fund
SCHEDULE OF PORTFOLIO INVESTMENTS
AS OF OCTOBER 31, 2017 (continued)
(Amounts in thousands)
| SHARES | SECURITY DESCRIPTION | VALUE($) | ||||||
Common Stocks — continued | ||||||||
Japan — continued |
| |||||||
| 91 | Central Japan Railway Co. | 16,457 | ||||||
| 1,876 | Fuji Electric Co. Ltd. | 13,592 | ||||||
| 2,699 | Hitachi Ltd. | 21,493 | ||||||
| 1,045 | ITOCHU Corp. | 18,310 | ||||||
| 1,431 | Kajima Corp. | 14,842 | ||||||
| 947 | Kansai Electric Power Co., Inc. (The) | 12,972 | ||||||
| 605 | KDDI Corp. | 16,129 | ||||||
| 730 | Kirin Holdings Co. Ltd. | 17,523 | ||||||
| 188 | Koito Manufacturing Co. Ltd. | 12,593 | ||||||
| 667 | Kuraray Co. Ltd. | 13,134 | ||||||
| 1,194 | Marubeni Corp. | 8,005 | ||||||
| 176 | Matsumotokiyoshi Holdings Co. Ltd. | 12,650 | ||||||
| 78 | Meitec Corp. | 3,805 | ||||||
| 1,230 | Mitsubishi Chemical Holdings Corp. | 12,844 | ||||||
| 636 | Mitsubishi Corp. | 14,901 | ||||||
| 872 | Mitsubishi Electric Corp. | 14,921 | ||||||
| 4,055 | Mitsubishi UFJ Financial Group, Inc. | 27,504 | ||||||
| 850 | Mitsubishi UFJ Lease & Finance Co. Ltd. | 4,483 | ||||||
| 496 | Mitsui Chemicals, Inc. | 15,295 | ||||||
| 426 | MS&AD Insurance Group Holdings, Inc. | 14,482 | ||||||
| 249 | Nichias Corp. | 3,242 | ||||||
| 1,031 | Nippon Light Metal Holdings Co. Ltd. | 3,034 | ||||||
| 506 | Nippon Suisan Kaisha Ltd. | 3,098 | ||||||
| 304 | Nippon Telegraph & Telephone Corp. | 14,717 | ||||||
| 179 | Nishimatsu Construction Co. Ltd. | 5,407 | ||||||
| 777 | NTT DOCOMO, Inc. | 18,806 | ||||||
| 1,218 | Obayashi Corp. | 15,941 | ||||||
| 174 | Open House Co. Ltd. | 6,719 | ||||||
| 1,011 | ORIX Corp. | 17,385 | ||||||
| 1,592 | Penta-Ocean Construction Co. Ltd. | 10,534 | ||||||
| 767 | Prima Meat Packers Ltd. | 5,012 | ||||||
| 157 | SCREEN Holdings Co. Ltd. | 12,290 | ||||||
| 596 | Sekisui Chemical Co. Ltd. | 12,032 | ||||||
| 1,221 | Shimizu Corp. | 14,371 | ||||||
| 205 | Shionogi & Co. Ltd. | 11,037 | ||||||
| 22 | SoftBank Group Corp. | 1,923 | ||||||
| 373 | Sompo Holdings, Inc. | 14,973 | ||||||
| 558 | Sony Corp. | 23,352 | ||||||
| 275 | Subaru Corp. | 9,508 | ||||||
| 502 | Sumitomo Bakelite Co. Ltd. | 4,082 | ||||||
| 2,012 | Sumitomo Chemical Co. Ltd. | 14,140 | ||||||
| 614 | Sumitomo Corp. | 8,884 | ||||||
| 468 | Sumitomo Mitsui Financial Group, Inc. | 18,737 | ||||||
| 708 | Sumitomo Rubber Industries Ltd. | 13,438 | ||||||
| 238 | Taiheiyo Cement Corp. | 9,497 | ||||||
| SHARES | SECURITY DESCRIPTION | VALUE($) | ||||||
Japan — continued |
| |||||||
| 319 | Taisei Corp. | 17,658 | ||||||
| 169 | Takasago Thermal Engineering Co. Ltd. | 2,983 | ||||||
| 107 | Tokyo Electron Ltd. | 18,753 | ||||||
| 805 | Tokyo Tatemono Co. Ltd. | 11,297 | ||||||
| 247 | Toyota Boshoku Corp. | 4,964 | ||||||
| 426 | Toyota Motor Corp. | 26,423 | ||||||
| 172 | TS Tech Co. Ltd. | 6,156 | ||||||
| 48 | Ulvac, Inc. | 3,386 | ||||||
| 469 | Yamaha Motor Co. Ltd. | 14,067 | ||||||
|
| |||||||
| 728,147 | ||||||||
|
| |||||||
Luxembourg — 0.9% |
| |||||||
| 960 | ArcelorMittal (a) | 27,489 | ||||||
|
| |||||||
Netherlands — 5.2% |
| |||||||
| 871 | ABN AMRO Group NV, Reg. S, CVA (e) | 26,896 | ||||||
| 537 | ASR Nederland NV | 22,012 | ||||||
| 174 | Euronext NV, Reg. S (e) | 10,349 | ||||||
| 260 | EXOR NV | 16,665 | ||||||
| 2,064 | ING Groep NV | 38,133 | ||||||
| 580 | Philips Lighting NV, Reg. S (e) | 21,971 | ||||||
| 901 | Royal Dutch Shell plc, Class B | 29,001 | ||||||
|
| |||||||
| 165,027 | ||||||||
|
| |||||||
Norway — 0.8% |
| |||||||
| 726 | DNB ASA | 14,016 | ||||||
| 609 | Marine Harvest ASA (a) | 11,895 | ||||||
|
| |||||||
| 25,911 | ||||||||
|
| |||||||
Singapore — 2.1% |
| |||||||
| 1,772 | DBS Group Holdings Ltd. | 29,588 | ||||||
| 3,420 | Oversea-Chinese Banking Corp. Ltd. | 29,866 | ||||||
| 556 | Venture Corp. Ltd. | 7,951 | ||||||
|
| |||||||
| 67,405 | ||||||||
|
| |||||||
South Africa — 0.7% |
| |||||||
| 889 | Mondi plc | 21,508 | ||||||
|
| |||||||
Spain — 2.0% |
| |||||||
| 304 | ACS Actividades de Construccion y Servicios SA | 11,981 | ||||||
| 126 | Aena SME SA, Reg. S (e) | 23,206 | ||||||
| 237 | Amadeus IT Group SA | 16,079 | ||||||
| 602 | Repsol SA | 11,277 | ||||||
|
| |||||||
| 62,543 | ||||||||
|
| |||||||
Sweden — 3.5% |
| |||||||
| 599 | Electrolux AB, Series B | 21,169 | ||||||
| 248 | Hemfosa Fastigheter AB | 3,010 | ||||||
| 641 | Peab AB | 6,225 | ||||||
| 1,132 | Sandvik AB | 20,655 | ||||||
SEE NOTES TO FINANCIAL STATEMENTS.
| 62 | J.P. MORGAN INTERNATIONAL EQUITY FUNDS | OCTOBER 31, 2017 | ||||
Table of Contents
| SHARES | SECURITY DESCRIPTION | VALUE($) | ||||||
Common Stocks — continued | ||||||||
Sweden – continued |
| |||||||
| 2,055 | Skandinaviska Enskilda Banken AB, Class A | 25,325 | ||||||
| 979 | Swedbank AB, Class A | 24,298 | ||||||
| 229 | Swedish Match AB | 8,618 | ||||||
|
| |||||||
| 109,300 | ||||||||
|
| |||||||
Switzerland — 10.5% |
| |||||||
| 1,250 | ABB Ltd. (Registered) | 32,640 | ||||||
| 326 | Adecco Group AG (Registered) (a) | 25,889 | ||||||
| 150 | Baloise Holding AG (Registered) | 23,657 | ||||||
| 482 | Coca-Cola HBC AG (a) | 16,278 | ||||||
| 18 | Flughafen Zurich AG (Registered) | 3,948 | ||||||
| 3 | Forbo Holding AG (Registered) | 4,161 | ||||||
| 10 | Georg Fischer AG (Registered) | 12,837 | ||||||
| 438 | Logitech International SA (Registered) | 15,655 | ||||||
| 626 | Nestle SA (Registered) | 52,704 | ||||||
| 739 | Novartis AG (Registered) | 60,964 | ||||||
| 190 | Roche Holding AG | 43,919 | ||||||
| 4 | Sika AG | 26,505 | ||||||
| 35 | Swiss Life Holding AG (Registered) (a) | �� | 12,181 | |||||
|
| |||||||
| 331,338 | ||||||||
|
| |||||||
United Kingdom — 14.0% |
| |||||||
| 1,949 | 3i Group plc | 24,874 | ||||||
| 2,927 | Barratt Developments plc | 25,446 | ||||||
| 1,183 | Beazley plc | 7,938 | ||||||
| 243 | Berkeley Group Holdings plc | 12,054 | ||||||
| 365 | BP plc | 2,479 | ||||||
| 121 | British American Tobacco plc | 7,826 | ||||||
| 482 | Burberry Group plc | 12,184 | ||||||
| 179 | Diageo plc | 6,116 | ||||||
| 229 | Dialog Semiconductor plc (a) | 11,430 | ||||||
| 500 | GlaxoSmithKline plc | 8,973 | ||||||
| 1,608 | HSBC Holdings plc | 15,704 | ||||||
| 957 | Ibstock plc, Reg. S (e) | 3,154 | ||||||
| 2,729 | International Consolidated Airlines Group SA | 23,047 | ||||||
| 7,486 | Legal & General Group plc | 26,544 | ||||||
| 40,634 | Lloyds Banking Group plc | 36,832 | ||||||
| 105 | Next plc | 6,882 | ||||||
| 1,184 | Pagegroup plc | 7,356 | ||||||
| 756 | Persimmon plc | 28,134 | ||||||
| 693 | Playtech plc | 9,058 | ||||||
| 654 | Polypipe Group plc | 3,585 | ||||||
| 959 | Prudential plc | 23,529 | ||||||
| 2,953 | Redrow plc | 25,528 | ||||||
| 607 | Rio Tinto plc | 28,691 | ||||||
| SHARES | SECURITY DESCRIPTION | VALUE($) | ||||||
United Kingdom — continued |
| |||||||
| 365 | Savills plc | 4,518 | ||||||
| 255 | Schroders plc | 11,828 | ||||||
| 787 | Subsea 7 SA | 13,270 | ||||||
| 963 | Unilever NV, CVA | 55,960 | ||||||
|
| |||||||
| 442,940 | ||||||||
|
| |||||||
United States — 0.8% |
| |||||||
| 372 | Carnival plc | 24,545 | ||||||
|
| |||||||
Total Common Stocks | 3,085,906 | |||||||
|
| |||||||
Short-Term Investment — 1.7% | ||||||||
Investment Company — 1.7% |
| |||||||
| 53,390 | JPMorgan U.S. Government Money Market Fund, Institutional Class Shares, 0.92% (b) (l) | 53,390 | ||||||
|
| |||||||
Total Investments — 99.5% | 3,139,296 | |||||||
Other Assets in Excess of | 16,313 | |||||||
|
| |||||||
NET ASSETS — 100.0% | $ | 3,155,609 | ||||||
|
| |||||||
Percentages indicated are based on net assets.
SEE NOTES TO FINANCIAL STATEMENTS.
| OCTOBER 31, 2017 | J.P. MORGAN INTERNATIONAL EQUITY FUNDS | 63 | ||||||
Table of Contents
JPMorgan Intrepid International Fund
SCHEDULE OF PORTFOLIO INVESTMENTS
AS OF OCTOBER 31, 2017 (continued)
(Amounts in thousands, except number of Futures contracts)
Summary of Investments by Industry, October 31, 2017
The following table represents the portfolio investments of the Fund by industry classifications as a percentage of total investments:
| INDUSTRY | PERCENTAGE | |||
Banks | 14.1 | % | ||
Pharmaceuticals | 6.3 | |||
Insurance | 6.3 | |||
Household Durables | 4.8 | |||
Chemicals | 4.6 | |||
Construction & Engineering | 4.6 | |||
Auto Components | 4.5 | |||
Electrical Equipment | 4.1 | |||
Metals & Mining | 3.8 | |||
IT Services | 2.9 | |||
Food Products | 2.8 | |||
Capital Markets | 2.8 | |||
Oil, Gas & Consumable Fuels | 2.8 | |||
Airlines | 2.5 | |||
Automobiles | 2.3 | |||
Semiconductors & Semiconductor Equipment | 1.9 | |||
| INDUSTRY | PERCENTAGE | |||
Personal Products | 1.8 | |||
Multi-Utilities | 1.7 | |||
Hotels, Restaurants & Leisure | 1.7 | |||
Trading Companies & Distributors | 1.6 | |||
Diversified Financial Services | 1.5 | |||
Electric Utilities | 1.5 | |||
Beverages | 1.5 | |||
Real Estate Management & Development | 1.5 | |||
Professional Services | 1.2 | |||
Wireless Telecommunication Services | 1.2 | |||
Electronic Equipment, Instruments & Components | 1.1 | |||
Paper & Forest Products | 1.1 | |||
Machinery | 1.1 | |||
Software | 1.0 | |||
Others (each less than 1.0%) | 7.7 | |||
Short-Term Investment | 1.7 | |||
| Futures contracts outstanding as of October 31, 2017: | ||||||||||||||||||||
| DESCRIPTION | NUMBER OF CONTRACTS | EXPIRATION DATE | TRADING CURRENCY | NOTIONAL AMOUNT ($) | VALUE AND UNREALIZED APPRECIATION (DEPRECIATION) ($) | |||||||||||||||
Long Contracts |
| |||||||||||||||||||
| EURO STOXX 50 Index | 281 | 12/2017 | EUR | 12,053 | 268 | |||||||||||||||
| FTSE 100 Index | 90 | 12/2017 | GBP | 8,929 | (48 | ) | ||||||||||||||
| TOPIX Index | 58 | 12/2017 | JPY | 9,068 | 320 | |||||||||||||||
|
| |||||||||||||||||||
| 540 | ||||||||||||||||||||
|
| |||||||||||||||||||
SEE NOTES TO FINANCIAL STATEMENTS.
| 64 | J.P. MORGAN INTERNATIONAL EQUITY FUNDS | OCTOBER 31, 2017 | ||||
Table of Contents
J.P. Morgan International Equity Funds
NOTES TO SCHEDULES OF PORTFOLIO INVESTMENTS
AS OF OCTOBER 31, 2017
| ADR | — American Depositary Receipt | |
| AUD | — Australian Dollar | |
| BRL | — Brazilian Real | |
| CAD | — Canadian Dollar | |
| CDI | — CHESS Depository Interest | |
| CHF | — Swiss Franc | |
| CVA | — Dutch Certification | |
| DKK | — Danish Krone | |
| EUR | — Euro | |
| FTSE | — Financial Times and the London Stock Exchange | |
| GBP | — British Pound | |
| GDR | — Global Depositary Receipt | |
| HKD | — Hong Kong Dollar | |
| JPY | — Japanese Yen | |
| MSCI | — Morgan Stanley Capital International | |
| NOK | — Norwegian Krone | |
| NVDR | — Non-Voting Depositary Receipt | |
| Reg. S | — Security was purchased pursuant to Regulation S under the Securities Act of 1933, as amended (the “Securities Act”), which exempts from registration securities offered and sold outside of the United States. Such a security cannot be sold in the United States without either an effective registration statement filed pursuant to the Securities Act, or pursuant to an exemption from registration. | |
| REIT | — Real Estate Investment Trust | |
| SEK | — Swedish Krona | |
| TOPIX | — Tokyo Stock Price Index | |
| USD | — United States Dollar |
| (a) | — Non-income producing security. | |
| (b) | — Investment in affiliate. Money market fund is registered under the Investment Company Act of 1940, as amended, and advised by J.P. Morgan Investment Management Inc. | |
(d) | — Defaulted Security. | |
| (e) | — Security is exempt from registration under Rule 144A of the Securities Act. Unless otherwise indicated, this security has been determined to be liquid under procedures established by the Board of Trustees and may be resold in transactions exempt from registration, normally to qualified institutional buyers. | |
| (g) | — Amount rounds to less than 0.05%. | |
| (h) | — Amount rounds to less than 500. | |
| (l) | — The rate shown is the current yield as of October 31, 2017. | |
| (x) | — Security is perpetual and thus, does not have a predetermined maturity date. The coupon rate for this security is fixed for a period of time and may be structured to adjust thereafter. The date shown, if applicable, reflects the next call date. The coupon rate shown is the rate in effect as of October 31, 2017. | |
| (y) | — Security is an interest bearing note with preferred security characteristics. | |
| (aa) | — Variable or floating rate security, linked to the referenced benchmark. The interest rate shown is the current rate as of October 31, 2017. | |
| (bb) | — Security has been valued using significant unobservable inputs. |
SEE NOTES TO FINANCIAL STATEMENTS.
| OCTOBER 31, 2017 | J.P. MORGAN INTERNATIONAL EQUITY FUNDS | 65 | ||||||
Table of Contents
STATEMENTS OF ASSETS AND LIABILITIES
AS OF OCTOBER 31, 2017
(Amounts in thousands, except per share amounts)
Emerging | Emerging Markets Equity Fund | Global Research Enhanced Index Fund | ||||||||||
ASSETS: | ||||||||||||
Investments in non-affiliates, at value | $ | 1,952,430 | $ | 4,331,897 | $ | 8,531,369 | ||||||
Investments in affiliates, at value | 84,272 | 128,728 | 105,120 | |||||||||
Cash | 2,017 | 196 | 50 | |||||||||
Foreign currency, at value | 2,880 | 2,784 | 3,950 | |||||||||
Deposits at broker for futures contracts | 1,463 | — | 4,690 | |||||||||
Due from custodian | — | 567 | — | |||||||||
Receivables: | ||||||||||||
Investment securities sold | 3,120 | — | 77,430 | |||||||||
Fund shares sold | 609 | 5,822 | 3,830 | |||||||||
Dividends from non-affiliates | 2,346 | 1,481 | 11,152 | |||||||||
Dividends from affiliates | 51 | 107 | 77 | |||||||||
Tax reclaims | 11 | — | 6,952 | |||||||||
Variation margin on futures contracts | 307 | — | 580 | |||||||||
|
|
|
|
|
| |||||||
Total Assets | 2,049,506 | 4,471,582 | 8,745,200 | |||||||||
|
|
|
|
|
| |||||||
LIABILITIES: | ||||||||||||
Payables: | ||||||||||||
Investment securities purchased | 8,026 | 7,257 | 77,554 | |||||||||
Fund shares redeemed | 616 | 12,801 | 1,670 | |||||||||
Accrued liabilities: | ||||||||||||
Investment advisory fees | 1,281 | 2,477 | 412 | |||||||||
Administration fees | 24 | — | 10 | |||||||||
Distribution fees | 39 | 142 | — | |||||||||
Service fees | 50 | 237 | 1,779 | |||||||||
Custodian and accounting fees | 347 | 605 | 167 | |||||||||
Trustees’ and Chief Compliance Officer’s fees | — | (a) | — | (a) | — | |||||||
Deferred India capital gains tax | 1,314 | — | — | |||||||||
Audit fees | 68 | 67 | 59 | |||||||||
Registration fees | 2 | — | — | |||||||||
Other | 44 | 108 | 89 | |||||||||
|
|
|
|
|
| |||||||
Total Liabilities | 11,811 | 23,694 | 81,740 | |||||||||
|
|
|
|
|
| |||||||
Net Assets | $ | 2,037,695 | $ | 4,447,888 | $ | 8,663,460 | ||||||
|
|
|
|
|
| |||||||
| (a) | Amount rounds to less than 500. |
SEE NOTES TO FINANCIAL STATEMENTS.
| 66 | J.P. MORGAN INTERNATIONAL EQUITY FUNDS | OCTOBER 31, 2017 | ||||
Table of Contents
| Emerging Economies Fund | Emerging Markets Equity Fund | Global Research Enhanced Index Fund | ||||||||||
NET ASSETS: |
| |||||||||||
Paid-in-Capital | $ | 1,679,231 | $ | 3,249,646 | $ | 6,867,114 | ||||||
Accumulated undistributed (distributions in excess of) net investment income | 34,533 | 21,775 | 120,190 | |||||||||
Accumulated net realized gains (losses) | (83,696 | ) | (123,509 | ) | (176,493 | ) | ||||||
Net unrealized appreciation (depreciation) | 407,627 | 1,299,976 | 1,852,649 | |||||||||
|
|
|
|
|
| |||||||
Total Net Assets | $ | 2,037,695 | $ | 4,447,888 | $ | 8,663,460 | ||||||
|
|
|
|
|
| |||||||
Net Assets: |
| |||||||||||
Class A | $ | 179,772 | $ | 525,451 | $ | — | ||||||
Class C | 2,782 | 48,497 | — | |||||||||
Class I (formerly Select Class) | 63,965 | 629,451 | 8,663,460 | |||||||||
Class L (formerly Institutional Class) | — | 430,860 | — | |||||||||
Class R2 | — | 21 | — | |||||||||
Class R3 | — | 21 | — | |||||||||
Class R4 | — | 21 | — | |||||||||
Class R5 | 417 | 217 | — | |||||||||
Class R6 | 1,790,759 | 2,813,349 | — | |||||||||
|
|
|
|
|
| |||||||
Total | $ | 2,037,695 | $ | 4,447,888 | $ | 8,663,460 | ||||||
|
|
|
|
|
| |||||||
Outstanding units of beneficial interest (shares) ($0.0001 par value; unlimited number of shares authorized): | ||||||||||||
Class A | 12,203 | 19,049 | — | |||||||||
Class C | 191 | 1,809 | — | |||||||||
Class I (formerly Select Class) | 4,283 | 22,253 | 391,019 | |||||||||
Class L (formerly Institutional Class) | — | 15,125 | — | |||||||||
Class R2 | — | 1 | — | |||||||||
Class R3 | — | 1 | — | |||||||||
Class R4 | — | 1 | — | |||||||||
Class R5 | 28 | 7 | — | |||||||||
Class R6 | 120,396 | 98,863 | — | |||||||||
Net Asset Value (a): | ||||||||||||
Class A — Redemption price per share | $ | 14.73 | $ | 27.58 | $ | — | ||||||
Class C — Offering price per share (b) | 14.60 | 26.80 | — | |||||||||
Class I (formerly Select Class) — Offering and redemption price per share | 14.93 | 28.29 | 22.16 | |||||||||
Class L (formerly Institutional Class) — Offering and redemption price per share | — | 28.49 | — | |||||||||
Class R2 — Offering and redemption price per share | — | 27.57 | — | |||||||||
Class R3 — Offering and redemption price per share | — | 27.59 | — | |||||||||
Class R4 — Offering and redemption price per share | — | 28.28 | — | |||||||||
Class R5 — Offering and redemption price per share | 15.07 | 28.47 | — | |||||||||
Class R6 — Offering and redemption price per share | 14.87 | 28.46 | — | |||||||||
Class A maximum sales charge | 5.25 | % | 5.25 | % | 5.25 | % | ||||||
Class A maximum public offering price per share | $ | 15.55 | $ | 29.11 | $ | — | ||||||
|
|
|
|
|
| |||||||
Cost of investments in non-affiliates | $ | 1,543,887 | $ | 3,031,915 | $ | 6,682,145 | ||||||
Cost of investments in affiliates | 84,272 | 128,728 | 105,120 | |||||||||
Cost of foreign currency | 2,901 | 2,775 | 3,970 | |||||||||
| (a) | Per share amounts may not recalculate due to rounding of net assets and/or shares outstanding. |
| (b) | Redemption price for Class C Shares varies based upon length of time the shares are held. |
SEE NOTES TO FINANCIAL STATEMENTS.
| OCTOBER 31, 2017 | J.P. MORGAN INTERNATIONAL EQUITY FUNDS | 67 | ||||||
Table of Contents
STATEMENTS OF ASSETS AND LIABILITIES
AS OF OCTOBER 31, 2017 (continued)
(Amounts in thousands, except per share amounts)
Global Unconstrained Equity Fund | International Equity Fund | International Equity Income Fund | ||||||||||
ASSETS: | ||||||||||||
Investments in non-affiliates, at value | $ | 3,492 | $ | 3,981,960 | $ | 197,801 | ||||||
Investments in affiliates, at value | — | 24,698 | 2,218 | |||||||||
Cash | 113 | 494 | 118 | |||||||||
Foreign currency, at value | — | 126 | 164 | |||||||||
Receivables: | ||||||||||||
Investment securities sold | 56 | 21,282 | — | |||||||||
Fund shares sold | 14 | 829 | 392 | |||||||||
Dividends from non-affiliates | 1 | 6,332 | 294 | |||||||||
Dividends from affiliates | — | (a) | 31 | 3 | ||||||||
Tax reclaims | 14 | 5,973 | 319 | |||||||||
Unrealized appreciation on forward foreign currency exchange contracts | — | — | 26 | |||||||||
|
|
|
|
|
| |||||||
Total Assets | 3,690 | 4,041,725 | 201,335 | |||||||||
|
|
|
|
|
| |||||||
LIABILITIES: | ||||||||||||
Payables: | ||||||||||||
Investment securities purchased | 33 | 11,614 | — | |||||||||
Fund shares redeemed | 3 | 20,175 | 229 | |||||||||
Unrealized depreciation on forward foreign currency exchange contracts | — | — | 354 | |||||||||
Accrued liabilities: | ||||||||||||
Investment advisory fees | 29 | 2,182 | 86 | |||||||||
Administration fees | — | 160 | — | |||||||||
Distribution fees | — | (a) | 78 | 27 | ||||||||
Service fees | 1 | 96 | 28 | |||||||||
Custodian and accounting fees | 14 | 153 | 23 | |||||||||
Trustees’ and Chief Compliance Officer’s fees | — | (a) | — | (a) | — | (a) | ||||||
Audit fees | 49 | 65 | 60 | |||||||||
Registration fees | — | (a) | — | 53 | ||||||||
Other | 12 | 111 | 19 | |||||||||
|
|
|
|
|
| |||||||
Total Liabilities | 141 | 34,634 | 879 | |||||||||
|
|
|
|
|
| |||||||
Net Assets | $ | 3,549 | $ | 4,007,091 | $ | 200,456 | ||||||
|
|
|
|
|
| |||||||
| (a) | Amount rounds to less than 500. |
SEE NOTES TO FINANCIAL STATEMENTS.
| 68 | J.P. MORGAN INTERNATIONAL EQUITY FUNDS | OCTOBER 31, 2017 | ||||
Table of Contents
Global Unconstrained Equity Fund | International Equity Fund | International Equity Income Fund | ||||||||||
NET ASSETS: | ||||||||||||
Paid-in-Capital | $ | 3,190 | $ | 3,032,761 | $ | 182,868 | ||||||
Accumulated undistributed (distributions in excess of) net investment income | 14 | 53,694 | (319 | ) | ||||||||
Accumulated net realized gains (losses) | 134 | (55,302 | ) | (10,580 | ) | |||||||
Net unrealized appreciation (depreciation) | 211 | 975,938 | 28,487 | |||||||||
|
|
|
|
|
| |||||||
Total Net Assets | $ | 3,549 | $ | 4,007,091 | $ | 200,456 | ||||||
|
|
|
|
|
| |||||||
Net Assets: | ||||||||||||
Class A | $ | 1,171 | $ | 302,130 | $ | 84,553 | ||||||
Class C | 386 | 24,281 | 13,679 | |||||||||
Class I (formerly Select Class) | 1,827 | 139,715 | 86,550 | |||||||||
Class R2 | 22 | 2,096 | 322 | |||||||||
Class R5 | 21 | 21,891 | 1,297 | |||||||||
Class R6 | 122 | 3,516,978 | 14,055 | |||||||||
|
|
|
|
|
| |||||||
Total | $ | 3,549 | $ | 4,007,091 | $ | 200,456 | ||||||
|
|
|
|
|
| |||||||
Outstanding units of beneficial interest (shares) ($0.0001 par value; unlimited number of shares authorized): | ||||||||||||
Class A | 68 | 16,966 | 5,123 | |||||||||
Class C | 23 | 1,443 | 835 | |||||||||
Class I (formerly Select Class) | 105 | 7,724 | 5,229 | |||||||||
Class R2 | 2 | 118 | 20 | |||||||||
Class R5 | 1 | 1,208 | 78 | |||||||||
Class R6 | 7 | 193,974 | 849 | |||||||||
Net Asset Value (a): | ||||||||||||
Class A — Redemption price per share | $ | 17.14 | $ | 17.81 | $ | 16.50 | ||||||
Class C — Offering price per share (b) | 16.93 | 16.83 | 16.38 | |||||||||
Class I (formerly Select Class) — Offering and redemption price per share | 17.30 | 18.09 | 16.55 | |||||||||
Class R2 — Offering and redemption price per share | 17.24 | 17.70 | 16.47 | |||||||||
Class R5 — Offering and redemption price per share | 17.25 | 18.13 | 16.57 | |||||||||
Class R6 — Offering and redemption price per share | 17.24 | 18.13 | 16.55 | |||||||||
Class A maximum sales charge | 5.25 | % | 5.25 | % | 5.25 | % | ||||||
Class A maximum public offering price per share | $ | 18.09 | $ | 18.80 | $ | 17.41 | ||||||
|
|
|
|
|
| |||||||
Cost of investments in non-affiliates | $ | 3,281 | $ | 3,006,098 | $ | 168,991 | ||||||
Cost of investments in affiliates | — | 24,698 | 2,218 | |||||||||
Cost of foreign currency | — | 132 | 167 | |||||||||
| (a) | Per share amounts may not recalculate due to rounding of net assets and/or shares outstanding. |
| (b) | Redemption price for Class C Shares varies based upon length of time the shares are held. |
SEE NOTES TO FINANCIAL STATEMENTS.
| OCTOBER 31, 2017 | J.P. MORGAN INTERNATIONAL EQUITY FUNDS | 69 | ||||||
Table of Contents
STATEMENTS OF ASSETS AND LIABILITIES
AS OF OCTOBER 31, 2017 (continued)
(Amounts in thousands, except per share amounts)
International Enhanced | International Unconstrained Equity Fund | International Value Fund | Intrepid International Fund | |||||||||||||
ASSETS: | ||||||||||||||||
Investments in non-affiliates, at value | $ | 4,648,977 | $ | 340,925 | $ | 781,288 | $ | 3,085,906 | ||||||||
Investments in affiliates, at value | 242,928 | 14,714 | 8,228 | 53,390 | ||||||||||||
Cash | 174,079 | 34 | 158 | 50 | ||||||||||||
Foreign currency, at value | 46,048 | 5 | 558 | 1,022 | ||||||||||||
Deposits at broker for futures contracts | 15,549 | — | — | 1,617 | ||||||||||||
Due from custodian | 20,173 | — | — | — | ||||||||||||
Receivables: | ||||||||||||||||
Investment securities sold | 15,341 | — | — | 16,279 | ||||||||||||
Fund shares sold | 14,251 | 1,890 | 1,028 | 6,393 | ||||||||||||
Dividends from non-affiliates | 6,911 | 342 | 1,954 | 7,533 | ||||||||||||
Dividends from affiliates | 167 | 10 | 3 | 26 | ||||||||||||
Tax reclaims | 3,487 | 112 | 3,161 | 4,825 | ||||||||||||
Variation margin on futures contracts | 3,110 | — | — | 206 | ||||||||||||
Unrealized appreciation on forward foreign currency exchange contracts | — | — | 3,704 | — | ||||||||||||
Other assets | 32 | — | — | — | ||||||||||||
|
|
|
|
|
|
|
| |||||||||
Total Assets | 5,191,053 | 358,032 | 800,082 | 3,177,247 | ||||||||||||
|
|
|
|
|
|
|
| |||||||||
LIABILITIES: | ||||||||||||||||
Payables: | ||||||||||||||||
Investment securities purchased | 150,397 | — | — | 17,720 | ||||||||||||
Fund shares redeemed | 457 | 57 | 1,349 | 1,741 | ||||||||||||
Unrealized depreciation on forward foreign currency exchange contracts | — | — | 3,534 | — | ||||||||||||
Accrued liabilities: | ||||||||||||||||
Investment advisory fees | 300 | 182 | 395 | 1,580 | ||||||||||||
Administration fees | 1 | 12 | 54 | 212 | ||||||||||||
Distribution fees | 62 | 21 | 81 | 53 | ||||||||||||
Service fees | 989 | 32 | 241 | 55 | ||||||||||||
Custodian and accounting fees | 50 | 18 | 46 | 152 | ||||||||||||
Trustees’ and Chief Compliance Officer’s fees | — | (a) | — | (a) | — | (a) | — | (a) | ||||||||
Audit fees | 67 | 59 | 59 | 61 | ||||||||||||
Registration fees | — | 8 | 48 | 13 | ||||||||||||
Other | 28 | 14 | 488 | 51 | ||||||||||||
|
|
|
|
|
|
|
| |||||||||
Total Liabilities | 152,351 | 403 | 6,295 | 21,638 | ||||||||||||
|
|
|
|
|
|
|
| |||||||||
Net Assets | $ | 5,038,702 | $ | 357,629 | $ | 793,787 | $ | 3,155,609 | ||||||||
|
|
|
|
|
|
|
| |||||||||
| (a) | Amount rounds to less than 500. |
SEE NOTES TO FINANCIAL STATEMENTS.
| 70 | J.P. MORGAN INTERNATIONAL EQUITY FUNDS | OCTOBER 31, 2017 | ||||
Table of Contents
International Enhanced Equity Fund | International Unconstrained Equity Fund | International Value Fund | Intrepid International Fund | |||||||||||||
NET ASSETS: |
| |||||||||||||||
Paid-in-Capital | $ | 4,650,273 | $ | 317,884 | $ | 777,736 | $ | 2,714,157 | ||||||||
Accumulated undistributed (distributions in excess of) net investment income | 34,860 | 2,551 | 14,279 | 54,925 | ||||||||||||
Accumulated net realized gains (losses) | 26,370 | (3,272 | ) | (70,627 | ) | (1,762 | ) | |||||||||
Net unrealized appreciation (depreciation) | 327,199 | 40,466 | 72,399 | 388,289 | ||||||||||||
|
|
|
|
|
|
|
| |||||||||
Total Net Assets | $ | 5,038,702 | $ | 357,629 | $ | 793,787 | $ | 3,155,609 | ||||||||
|
|
|
|
|
|
|
| |||||||||
Net Assets: |
| |||||||||||||||
Class A | $ | 298,112 | $ | 67,684 | $ | 316,510 | $ | 232,530 | ||||||||
Class C | — | 14,534 | 20,997 | 1,773 | ||||||||||||
Class I (formerly Select Class) | 4,740,590 | 131,356 | 144,875 | 52,871 | ||||||||||||
Class L (formerly Institutional Class) | — | — | 201,672 | — | ||||||||||||
Class R2 | — | 97 | 1,369 | 8,790 | ||||||||||||
Class R5 | — | 90 | 62 | — | ||||||||||||
Class R6 | — | 143,868 | 108,302 | 2,859,645 | ||||||||||||
|
|
|
|
|
|
|
| |||||||||
Total | $ | 5,038,702 | $ | 357,629 | $ | 793,787 | $ | 3,155,609 | ||||||||
|
|
|
|
|
|
|
| |||||||||
Outstanding units of beneficial interest (shares) ($0.0001 par value; unlimited number of shares authorized): | ||||||||||||||||
Class A | 15,894 | 3,202 | 22,193 | 10,467 | ||||||||||||
Class C | — | 695 | 1,524 | 79 | ||||||||||||
Class I (formerly Select Class) | 250,593 | 6,136 | 9,908 | 2,287 | ||||||||||||
Class L (formerly Institutional Class) | — | — | 13,861 | — | ||||||||||||
Class R2 | — | 5 | 98 | 399 | ||||||||||||
Class R5 | — | 4 | 4 | — | ||||||||||||
Class R6 | — | 6,723 | 7,453 | 125,526 | ||||||||||||
Net Asset Value (a): | ||||||||||||||||
Class A — Redemption price per share | $ | 18.76 | $ | 21.14 | $ | 14.26 | $ | 22.22 | ||||||||
Class C — Offering price per share (b) | — | 20.90 | 13.78 | 22.40 | ||||||||||||
Class I (formerly Select Class) — Offering and redemption price per share | 18.92 | 21.41 | 14.62 | 23.12 | ||||||||||||
Class L (formerly Institutional Class) — Offering and redemption price per share | — | — | 14.55 | — | ||||||||||||
Class R2 — Offering and redemption price per share | — | 21.11 | 14.01 | 22.01 | ||||||||||||
Class R5 — Offering and redemption price per share | — | 21.39 | 14.51 | — | ||||||||||||
Class R6 — Offering and redemption price per share | — | 21.40 | 14.53 | 22.78 | ||||||||||||
Class A maximum sales charge | 5.25 | % | 5.25 | % | 5.25 | % | 5.25 | % | ||||||||
Class A maximum public offering price per share | $ | 19.80 | $ | 22.31 | $ | 15.05 | $ | 23.45 | ||||||||
|
|
|
|
|
|
|
| |||||||||
Cost of investments in non-affiliates | $ | 4,330,440 | $ | 300,460 | $ | 708,994 | $ | 2,698,155 | ||||||||
Cost of investments in affiliates | 242,928 | 14,714 | 8,228 | 53,390 | ||||||||||||
Cost of foreign currency | 46,029 | 5 | 562 | 1,019 | ||||||||||||
| (a) | Per share amounts may not recalculate due to rounding of net assets and/or shares outstanding. |
| (b) | Redemption price for Class C Shares varies based upon length of time the shares are held. |
SEE NOTES TO FINANCIAL STATEMENTS.
| OCTOBER 31, 2017 | J.P. MORGAN INTERNATIONAL EQUITY FUNDS | 71 | ||||||
Table of Contents
STATEMENTS OF OPERATIONS
FOR THE YEAR ENDED OCTOBER 31, 2017
(Amounts in thousands)
| Emerging Economies Fund | Emerging Markets Equity Fund | Global Enhanced | ||||||||||
INVESTMENT INCOME: | ||||||||||||
Interest income from non-affiliates | $ | 1 | $ | 1 | $ | 10 | ||||||
Interest income from affiliates | 20 | 27 | 11 | |||||||||
Dividend income from non-affiliates | 63,358 | 65,794 | 182,706 | |||||||||
Dividend income from affiliates | 223 | 419 | 495 | |||||||||
Foreign taxes withheld | (5,357 | ) | (4,005 | ) | (7,959 | ) | ||||||
|
|
|
|
|
| |||||||
Total investment income | 58,245 | 62,236 | 175,263 | |||||||||
|
|
|
|
|
| |||||||
EXPENSES: | ||||||||||||
Investment advisory fees | 16,093 | 30,891 | 15,459 | |||||||||
Administration fees | 1,546 | 2,967 | 6,312 | |||||||||
Distribution fees: | ||||||||||||
Class A | 386 | 1,131 | — | (a) | ||||||||
Class C | 20 | 300 | — | (a) | ||||||||
Class R2 (b) | — | — | (a) | — | (a) | |||||||
Class R3 (b) | — | — | (a) | — | ||||||||
Service fees: | ||||||||||||
Class A | 386 | 1,131 | — | (a) | ||||||||
Class C | 7 | 100 | — | (a) | ||||||||
Class I (formerly Select Class) | 148 | 1,046 | 19,324 | |||||||||
Class L (formerly Institutional Class) | — | 497 | — | |||||||||
Class R2 (b) | — | — | (a) | — | (a) | |||||||
Class R3 (b) | — | — | (a) | — | ||||||||
Class R4 (b) | — | — | (a) | — | ||||||||
Class R5 | 1 | — | (a) | — | ||||||||
Custodian and accounting fees | 1,634 | 2,215 | 625 | |||||||||
Interest expense to affiliates | 20 | 5 | 20 | |||||||||
Professional fees | 178 | 159 | 197 | |||||||||
Trustees’ and Chief Compliance Officer’s fees | 31 | 35 | 11 | |||||||||
Printing and mailing costs | 63 | 301 | 227 | |||||||||
Registration and filing fees | 73 | 121 | 40 | |||||||||
Transfer agency fees (See Note 2.I.) | 28 | 125 | 56 | |||||||||
Sub-transfer agency fees (See Note 2.I.) | 61 | 562 | 158 | |||||||||
Other | 44 | 85 | 133 | |||||||||
|
|
|
|
|
| |||||||
Total expenses | 20,719 | 41,671 | 42,562 | |||||||||
|
|
|
|
|
| |||||||
Less fees waived | (3,705 | ) | (6,666 | ) | (16,357 | ) | ||||||
Less expense reimbursements | (11 | ) | (6 | ) | — | |||||||
|
|
|
|
|
| |||||||
Net expenses | 17,003 | 34,999 | 26,205 | |||||||||
|
|
|
|
|
| |||||||
Net investment income (loss) | 41,242 | 27,237 | 149,058 | |||||||||
|
|
|
|
|
| |||||||
REALIZED/UNREALIZED GAINS (LOSSES): | ||||||||||||
Net realized gain (loss) on transactions from: | ||||||||||||
Investments in non-affiliates | 158,591 | (c) | (15,954 | ) | 147,265 | |||||||
Futures | 56 | — | 686 | |||||||||
Foreign currency transactions | (328 | ) | (762 | ) | 252 | |||||||
Forward foreign currency exchange contracts | 166 | 204 | — | |||||||||
|
|
|
|
|
| |||||||
Net realized gain (loss) | 158,485 | (16,512 | ) | 148,203 | ||||||||
|
|
|
|
|
| |||||||
Change in net unrealized appreciation/depreciation on: | ||||||||||||
Investments in non-affiliates | 302,535 | (d) | 907,423 | (e) | 1,302,083 | |||||||
Futures | 846 | — | 3,513 | |||||||||
Foreign currency translations | (25 | ) | (16 | ) | 459 | |||||||
|
|
|
|
|
| |||||||
Change in net unrealized appreciation/depreciation | 303,356 | 907,407 | 1,306,055 | |||||||||
|
|
|
|
|
| |||||||
Net realized/unrealized gains (losses) | 461,841 | 890,895 | 1,454,258 | |||||||||
|
|
|
|
|
| |||||||
Change in net assets resulting from operations | $ | 503,083 | $ | 918,132 | $ | 1,603,316 | ||||||
|
|
|
|
|
| |||||||
| (a) | Amount rounds to less than 500. |
| (b) | Commencement of offering of class of shares effective July 31, 2017, for Emerging Markets Equity Fund. |
| (c) | Net of India capital gains tax of approximately $(1,038,000) for Emerging Economies Fund. |
| (d) | Net of change in India capital gains tax of approximately $(655,000) for Emerging Economies Fund. |
| (e) | Net of change in India capital gains tax of approximately $4,628,000 for Emerging Markets Equity Fund. |
SEE NOTES TO FINANCIAL STATEMENTS.
| 72 | J.P. MORGAN INTERNATIONAL EQUITY FUNDS | OCTOBER 31, 2017 | ||||
Table of Contents
Global Unconstrained Equity Fund | International Equity Fund | International Equity | ||||||||||
INVESTMENT INCOME: | ||||||||||||
Interest income from non-affiliates | $ | — | (a) | $ | — | (a) | $ | — | (a) | |||
Interest income from affiliates | — | (a) | 7 | 2 | ||||||||
Dividend income from non-affiliates | 40 | 102,608 | 7,429 | |||||||||
Dividend income from affiliates | — | (a) | 319 | 28 | ||||||||
Foreign taxes withheld | (2 | ) | (7,899 | ) | (593 | ) | ||||||
|
|
|
|
|
| |||||||
Total investment income | 38 | 95,035 | 6,866 | |||||||||
|
|
|
|
|
| |||||||
EXPENSES: | ||||||||||||
Investment advisory fees | 17 | 25,759 | 1,201 | |||||||||
Administration fees | 2 | 3,005 | 140 | |||||||||
Distribution fees: | ||||||||||||
Class A | 2 | 617 | 190 | |||||||||
Class C | 2 | 172 | 97 | |||||||||
Class R2 | — | (a) | 8 | 2 | ||||||||
Service fees: | ||||||||||||
Class A | 2 | 617 | 190 | |||||||||
Class C | 1 | 57 | 32 | |||||||||
Class I (formerly Select Class) | 3 | 286 | 197 | |||||||||
Class R2 | — | (a) | 4 | 1 | ||||||||
Class R5 | — | (a) | 19 | 1 | ||||||||
Custodian and accounting fees | 45 | 571 | 77 | |||||||||
Interest expense to affiliates | — | (a) | 11 | 1 | ||||||||
Professional fees | 75 | 153 | 95 | |||||||||
Trustees’ and Chief Compliance Officer’s fees | 26 | 29 | 26 | |||||||||
Printing and mailing costs | 23 | 105 | 9 | |||||||||
Registration and filing fees | 76 | 64 | 124 | |||||||||
Transfer agency fees (See Note 2.I.) | 1 | 69 | 22 | |||||||||
Sub-transfer agency fees (See Note 2.I.) | 1 | 136 | 53 | |||||||||
Other | 7 | 81 | 10 | |||||||||
|
|
|
|
|
| |||||||
Total expenses | 283 | 31,763 | 2,468 | |||||||||
|
|
|
|
|
| |||||||
Less fees waived | (22 | ) | (2,799 | ) | (551 | ) | ||||||
Less expense reimbursements | (246 | ) | (11 | ) | (6 | ) | ||||||
|
|
|
|
|
| |||||||
Net expenses | 15 | 28,953 | 1,911 | |||||||||
|
|
|
|
|
| |||||||
Net investment income (loss) | 23 | 66,082 | 4,955 | |||||||||
|
|
|
|
|
| |||||||
REALIZED/UNREALIZED GAINS (LOSSES): | ||||||||||||
Net realized gain (loss) on transactions from: | ||||||||||||
Investments in non-affiliates | 186 | (9,800 | ) | 144 | ||||||||
Foreign currency transactions | (1 | ) | 858 | 152 | ||||||||
Forward foreign currency exchange contracts | — | (a) | (354 | ) | (477 | ) | ||||||
|
|
|
|
|
| |||||||
Net realized gain (loss) | 185 | (9,296 | ) | (181 | ) | |||||||
|
|
|
|
|
| |||||||
Change in net unrealized appreciation/depreciation on: | ||||||||||||
Investments in non-affiliates | 212 | 803,534 | 24,501 | |||||||||
Foreign currency translations | — | (a) | 447 | 16 | ||||||||
Forward foreign currency exchange contracts | — | — | (215 | ) | ||||||||
|
|
|
|
|
| |||||||
Change in net unrealized appreciation/depreciation | 212 | 803,981 | 24,302 | |||||||||
|
|
|
|
|
| |||||||
Net realized/unrealized gains (losses) | 397 | 794,685 | 24,121 | |||||||||
|
|
|
|
|
| |||||||
Change in net assets resulting from operations | $ | 420 | $ | 860,767 | $ | 29,076 | ||||||
|
|
|
|
|
| |||||||
| (a) | Amount rounds to less than 500. |
SEE NOTES TO FINANCIAL STATEMENTS.
| OCTOBER 31, 2017 | J.P. MORGAN INTERNATIONAL EQUITY FUNDS | 73 | ||||||
Table of Contents
STATEMENTS OF OPERATIONS
FOR THE YEAR ENDED OCTOBER 31, 2017 (continued)
(Amounts in thousands)
International Enhanced Equity Fund | International Unconstrained Equity Fund | International Value Fund | Intrepid International Fund | |||||||||||||
INVESTMENT INCOME: | ||||||||||||||||
Interest income from non-affiliates | $ | 21 | $ | — | (a) | $ | 1 | $ | 4 | |||||||
Interest income from affiliates | 8 | 2 | 4 | 2 | ||||||||||||
Dividend income from non-affiliates | 55,150 | 4,294 | 30,449 | 89,235 | ||||||||||||
Dividend income from affiliates | 545 | 65 | 74 | 258 | ||||||||||||
Foreign taxes withheld | (3,913 | ) | (313 | ) | (3,151 | ) | (6,775 | ) | ||||||||
|
|
|
|
|
|
|
| |||||||||
Total investment income | 51,811 | 4,048 | 27,377 | 82,724 | ||||||||||||
|
|
|
|
|
|
|
| |||||||||
EXPENSES: | ||||||||||||||||
Investment advisory fees | 3,823 | 1,358 | 5,474 | 17,512 | ||||||||||||
Administration fees | 1,559 | 158 | 746 | 2,384 | ||||||||||||
Distribution fees: | ||||||||||||||||
Class A | 223 | 78 | 798 | 478 | ||||||||||||
Class C | 90 | 52 | 169 | 15 | ||||||||||||
Class R2 | 58 | — | (a) | 6 | 6 | |||||||||||
Service fees: | ||||||||||||||||
Class A | 223 | 78 | 798 | 478 | ||||||||||||
Class C | 30 | 18 | 56 | 5 | ||||||||||||
Class I (formerly Select Class) | 4,496 | 120 | 361 | 111 | ||||||||||||
Class L (formerly Institutional Class) | — | — | 388 | 2 | ||||||||||||
Class R2 | 29 | — | (a) | 3 | 3 | |||||||||||
Class R5 | — | — | (a) | — | (a) | — | ||||||||||
Custodian and accounting fees | 251 | 74 | 157 | 512 | ||||||||||||
Interest expense to affiliates | 8 | — | (a) | 13 | 16 | |||||||||||
Professional fees | 154 | 86 | 175 | 171 | ||||||||||||
Trustees’ and Chief Compliance Officer’s fees | 29 | 26 | 26 | 30 | ||||||||||||
Printing and mailing costs | 115 | 10 | 282 | 79 | ||||||||||||
Registration and filing fees | 132 | 98 | �� | 175 | 90 | |||||||||||
Transfer agency fees (See Note 2.I.) | 90 | 15 | 47 | 32 | ||||||||||||
Sub-transfer agency fees (See Note 2.I.) | 219 | 10 | 272 | 19 | ||||||||||||
Other | 39 | 9 | 36 | 60 | ||||||||||||
|
|
|
|
|
|
|
| |||||||||
Total expenses | 11,568 | 2,190 | 9,982 | 22,003 | ||||||||||||
|
|
|
|
|
|
|
| |||||||||
Less fees waived | (4,593 | ) | (449 | ) | (45 | ) | (133 | ) | ||||||||
Less expense reimbursements | (14 | ) | (1 | ) | (6 | ) | (1 | ) | ||||||||
|
|
|
|
|
|
|
| |||||||||
Net expenses | 6,961 | 1,740 | 9,931 | 21,869 | ||||||||||||
|
|
|
|
|
|
|
| |||||||||
Net investment income (loss) | 44,850 | 2,308 | 17,446 | 60,855 | ||||||||||||
|
|
|
|
|
|
|
| |||||||||
REALIZED/UNREALIZED GAINS (LOSSES): | ||||||||||||||||
Net realized gain (loss) on transactions from: | ||||||||||||||||
Investments in non-affiliates | 30,981 | 1,823 | 72,078 | 158,921 | ||||||||||||
Futures contracts | 10,841 | — | 890 | 1,906 | ||||||||||||
Foreign currency transactions | (6,521 | ) | 297 | 357 | (703 | ) | ||||||||||
Forward foreign currency exchange contracts | 71 | (41 | ) | (1,445 | ) | 548 | ||||||||||
|
|
|
|
|
|
|
| |||||||||
Net realized gain (loss) | 35,372 | 2,079 | 71,880 | 160,672 | ||||||||||||
|
|
|
|
|
|
|
| |||||||||
Change in net unrealized appreciation/depreciation on: | ||||||||||||||||
Investments in non-affiliates | 296,798 | 40,011 | 106,966 | 401,189 | ||||||||||||
Futures contracts | 7,927 | — | — | 540 | ||||||||||||
Foreign currency translations | 310 | 3 | 284 | 351 | ||||||||||||
Forward foreign currency exchange contracts | — | — | 609 | — | ||||||||||||
|
|
|
|
|
|
|
| |||||||||
Change in net unrealized appreciation/depreciation | 305,035 | 40,014 | 107,859 | 402,080 | ||||||||||||
|
|
|
|
|
|
|
| |||||||||
Net realized/unrealized gains (losses) | 340,407 | 42,093 | 179,739 | 562,752 | ||||||||||||
|
|
|
|
|
|
|
| |||||||||
Change in net assets resulting from operations | $ | 385,257 | $ | 44,401 | $ | 197,185 | $ | 623,607 | ||||||||
|
|
|
|
|
|
|
| |||||||||
| (a) | Amount rounds to less than 500. |
SEE NOTES TO FINANCIAL STATEMENTS.
| 74 | J.P. MORGAN INTERNATIONAL EQUITY FUNDS | OCTOBER 31, 2017 | ||||
Table of Contents
STATEMENTS OF CHANGES IN NET ASSETS
FOR THE PERIODS INDICATED
(Amounts in thousands)
| Emerging Economies Fund | Emerging Markets Equity Fund | |||||||||||||||
| Year Ended October 31, 2017 | Year Ended October 31, 2016 | Year Ended October 31, 2017 | Year Ended October 31, 2016 | |||||||||||||
CHANGE IN NET ASSETS RESULTING FROM OPERATIONS: | ||||||||||||||||
Net investment income (loss) | $ | 41,242 | $ | 24,658 | $ | 27,237 | $ | 20,045 | ||||||||
Net realized gain (loss) | 158,485 | (59,529 | ) | (16,512 | ) | (68,841 | ) | |||||||||
Change in net unrealized appreciation/depreciation | 303,356 | 133,106 | 907,407 | 346,979 | ||||||||||||
|
|
|
|
|
|
|
| |||||||||
Change in net assets resulting from operations | 503,083 | 98,235 | 918,132 | 298,183 | ||||||||||||
|
|
|
|
|
|
|
| |||||||||
DISTRIBUTIONS TO SHAREHOLDERS: | ||||||||||||||||
Class A | ||||||||||||||||
From net investment income | (1,900 | ) | (378 | ) | (1,930 | ) | (1,590 | ) | ||||||||
Class C | ||||||||||||||||
From net investment income | (14 | ) | (1 | ) | (12 | ) | — | |||||||||
Class I (formerly Select Class) | ||||||||||||||||
From net investment income | (709 | ) | (168 | ) | (1,895 | ) | (1,894 | ) | ||||||||
Class L (formerly Institutional Class) | ||||||||||||||||
From net investment income | — | — | (3,193 | ) | (2,796 | ) | ||||||||||
Class R5 (a) | ||||||||||||||||
From net investment income | (23 | ) | — | — | (b) | — | ||||||||||
Class R6 | ||||||||||||||||
From net investment income | (24,949 | ) | (12,736 | ) | (16,962 | ) | (13,982 | ) | ||||||||
|
|
|
|
|
|
|
| |||||||||
Total distributions to shareholders | (27,595 | ) | (13,283 | ) | (23,992 | ) | (20,262 | ) | ||||||||
|
|
|
|
|
|
|
| |||||||||
CAPITAL TRANSACTIONS: | ||||||||||||||||
Change in net assets resulting from capital transactions | (217,505 | ) | 593,917 | 429,170 | 580,806 | |||||||||||
|
|
|
|
|
|
|
| |||||||||
NET ASSETS: | ||||||||||||||||
Change in net assets | 257,983 | 678,869 | 1,323,310 | 858,727 | ||||||||||||
Beginning of period | 1,779,712 | 1,100,843 | 3,124,578 | 2,265,851 | ||||||||||||
|
|
|
|
|
|
|
| |||||||||
End of period | $ | 2,037,695 | $ | 1,779,712 | $ | 4,447,888 | $ | 3,124,578 | ||||||||
|
|
|
|
|
|
|
| |||||||||
Accumulated undistributed (distributions in | $ | 34,533 | $ | 21,844 | $ | 21,775 | $ | 19,088 | ||||||||
|
|
|
|
|
|
|
| |||||||||
| (a) | Commencement of offering of class of shares effective September 9, 2016, for Emerging Markets Equity Fund. |
| (b) | Amount rounds to less than 500. |
SEE NOTES TO FINANCIAL STATEMENTS.
| OCTOBER 31, 2017 | J.P. MORGAN INTERNATIONAL EQUITY FUNDS | 75 | ||||||
Table of Contents
STATEMENTS OF CHANGES IN NET ASSETS
FOR THE PERIODS INDICATED (continued)
(Amounts in thousands)
| Global Research Enhanced Index Fund | Global Unconstrained Equity Fund | |||||||||||||||
| Year Ended October 31, 2017 | Year Ended October 31, 2016 | Year Ended October 31, 2017 | Year Ended October 31, 2016 | |||||||||||||
CHANGE IN NET ASSETS RESULTING FROM OPERATIONS: | ||||||||||||||||
Net investment income (loss) | $ | 149,058 | $ | 152,165 | $ | 23 | $ | 334 | ||||||||
Net realized gain (loss) | 148,203 | (222,262 | ) | 185 | 5,782 | |||||||||||
Change in net unrealized appreciation/depreciation | 1,306,055 | 116,394 | 212 | (108 | ) | |||||||||||
|
|
|
|
|
|
|
| |||||||||
Change in net assets resulting from operations | 1,603,316 | 46,297 | 420 | 6,008 | ||||||||||||
|
|
|
|
|
|
|
| |||||||||
DISTRIBUTIONS TO SHAREHOLDERS: | ||||||||||||||||
Class A | ||||||||||||||||
From net investment income | (1 | ) | — | (a) | — | (443 | ) | |||||||||
From net realized gains | — | — | — | (5,070 | ) | |||||||||||
Return of capital | — | — | — | (841 | ) | |||||||||||
Class C | ||||||||||||||||
From net investment income | — | (a) | — | — | (4 | ) | ||||||||||
From net realized gains | — | — | — | (7 | ) | |||||||||||
Return of capital | — | — | — | (17 | ) | |||||||||||
Class I (formerly Select Class) | ||||||||||||||||
From net investment income | (155,975 | ) | (138,054 | ) | (3 | ) | (78 | ) | ||||||||
From net realized gains | — | — | — | (590 | ) | |||||||||||
Return of capital | — | — | — | (169 | ) | |||||||||||
Class R2 | ||||||||||||||||
From net investment income | — | (a) | — | (a) | — | — | (a) | |||||||||
From net realized gains | — | — | — | (1 | ) | |||||||||||
Return of capital | — | — | — | (1 | ) | |||||||||||
Class R5 | ||||||||||||||||
From net investment income | — | — | — | (a) | — | (a) | ||||||||||
From net realized gains | — | — | — | — | (a) | |||||||||||
Return of capital | — | — | — | (1 | ) | |||||||||||
Class R6 | ||||||||||||||||
From net investment income | — | — | — | (a) | — | (a) | ||||||||||
From net realized gains | — | — | — | — | (a) | |||||||||||
Return of capital | — | — | — | (1 | ) | |||||||||||
|
|
|
|
|
|
|
| |||||||||
Total distributions to shareholders | (155,976 | ) | (138,054 | ) | (3 | ) | (7,223 | ) | ||||||||
|
|
|
|
|
|
|
| |||||||||
CAPITAL TRANSACTIONS: | ||||||||||||||||
Change in net assets resulting from capital transactions | 308,814 | (416,215 | ) | 1,460 | 1,246 | |||||||||||
|
|
|
|
|
|
|
| |||||||||
NET ASSETS: | ||||||||||||||||
Change in net assets | 1,756,154 | (507,972 | ) | 1,877 | 31 | |||||||||||
Beginning of period | 6,907,306 | 7,415,278 | 1,672 | 1,641 | ||||||||||||
|
|
|
|
|
|
|
| |||||||||
End of period | $ | 8,663,460 | $ | 6,907,306 | $ | 3,549 | $ | 1,672 | ||||||||
|
|
|
|
|
|
|
| |||||||||
Accumulated undistributed (distributions in excess of) net investment income | $ | 120,190 | $ | 125,863 | $ | 14 | $ | (5 | ) | |||||||
|
|
|
|
|
|
|
| |||||||||
| (a) | Amount rounds to less than 500. |
SEE NOTES TO FINANCIAL STATEMENTS.
| 76 | J.P. MORGAN INTERNATIONAL EQUITY FUNDS | OCTOBER 31, 2017 | ||||
Table of Contents
| International Equity Fund | International Equity Income Fund | |||||||||||||||
| Year Ended October 31, 2017 | Year Ended October 31, 2016 | Year Ended October 31, 2017 | Year Ended October 31, 2016 | |||||||||||||
CHANGE IN NET ASSETS RESULTING FROM OPERATIONS: | ||||||||||||||||
Net investment income (loss) | $ | 66,082 | $ | 64,099 | $ | 4,955 | $ | 3,443 | ||||||||
Net realized gain (loss) | (9,296 | ) | (22,289 | ) | (181 | ) | (9,171 | ) | ||||||||
Change in net unrealized appreciation/depreciation | 803,981 | (25,645 | ) | 24,302 | 1,423 | |||||||||||
|
|
|
|
|
|
|
| |||||||||
Change in net assets resulting from operations | 860,767 | 16,165 | 29,076 | (4,305 | ) | |||||||||||
|
|
|
|
|
|
|
| |||||||||
DISTRIBUTIONS TO SHAREHOLDERS: | ||||||||||||||||
Class A | ||||||||||||||||
From net investment income | (611 | ) | (3,550 | ) | (2,272 | ) | (2,121 | ) | ||||||||
From net realized gains | — | — | — | (1,055 | ) | |||||||||||
Class C | ||||||||||||||||
From net investment income | (22 | ) | (328 | ) | (346 | ) | (297 | ) | ||||||||
From net realized gains | — | — | — | (151 | ) | |||||||||||
Class I (formerly Select Class) | ||||||||||||||||
From net investment income | (394 | ) | (2,129 | ) | (2,676 | ) | (1,237 | ) | ||||||||
From net realized gains | — | — | — | (534 | ) | |||||||||||
Class R2 | ||||||||||||||||
From net investment income | (2 | ) | (21 | ) | (11 | ) | (4 | ) | ||||||||
From net realized gains | — | — | — | (1 | ) | |||||||||||
Class R5 | ||||||||||||||||
From net investment income | (165 | ) | (1,103 | ) | (47 | ) | (14 | ) | ||||||||
From net realized gains | — | — | — | — | (a) | |||||||||||
Class R6 | ||||||||||||||||
From net investment income | (16,643 | ) | (57,230 | ) | (30 | ) | (1 | ) | ||||||||
From net realized gains | — | — | — | (1 | ) | |||||||||||
|
|
|
|
|
|
|
| |||||||||
Total distributions to shareholders | (17,837 | ) | (64,361 | ) | (5,382 | ) | (5,416 | ) | ||||||||
|
|
|
|
|
|
|
| |||||||||
CAPITAL TRANSACTIONS: | ||||||||||||||||
Change in net assets resulting from capital transactions | (260,305 | ) | 550,039 | 42,607 | 33,459 | |||||||||||
|
|
|
|
|
|
|
| |||||||||
NET ASSETS: | ||||||||||||||||
Change in net assets | 582,625 | 501,843 | 66,301 | 23,738 | ||||||||||||
Beginning of period | 3,424,466 | 2,922,623 | 134,155 | 110,417 | ||||||||||||
|
|
|
|
|
|
|
| |||||||||
End of period | $ | 4,007,091 | $ | 3,424,466 | $ | 200,456 | $ | 134,155 | ||||||||
|
|
|
|
|
|
|
| |||||||||
Accumulated undistributed (distributions in | $ | 53,694 | $ | 4,945 | $ | (319 | ) | $ | 248 | |||||||
|
|
|
|
|
|
|
| |||||||||
| (a) | Amount rounds to less than 500. |
SEE NOTES TO FINANCIAL STATEMENTS.
| OCTOBER 31, 2017 | J.P. MORGAN INTERNATIONAL EQUITY FUNDS | 77 | ||||||
Table of Contents
STATEMENTS OF CHANGES IN NET ASSETS
FOR THE PERIODS INDICATED (continued)
(Amounts in thousands)
| International Research Enhanced Equity Fund | International Unconstrained Equity Fund | |||||||||||||||
| Year Ended October 31, 2017 | Year Ended October 31, 2016 | Year Ended October 31, 2017 | Year Ended October 31, 2016 | |||||||||||||
CHANGE IN NET ASSETS RESULTING FROM OPERATIONS: | ||||||||||||||||
Net investment income (loss) | $ | 44,850 | $ | 31,541 | $ | 2,308 | $ | 1,438 | ||||||||
Net realized gain (loss) | 35,372 | (7,725 | ) | 2,079 | (3,109 | ) | ||||||||||
Change in net unrealized appreciation/depreciation | 305,035 | (35,894 | ) | 40,014 | 2,169 | |||||||||||
|
|
|
|
|
|
|
| |||||||||
Change in net assets resulting from operations | 385,257 | (12,078 | ) | 44,401 | 498 | |||||||||||
|
|
|
|
|
|
|
| |||||||||
DISTRIBUTIONS TO SHAREHOLDERS: | ||||||||||||||||
Class A | ||||||||||||||||
From net investment income | (1,511 | ) | (1,772 | ) | (259 | ) | (18 | ) | ||||||||
From net realized gains | — | (738 | ) | — | — | |||||||||||
Class C | ||||||||||||||||
From net investment income | (227 | ) | (316 | ) | (67 | ) | (3 | ) | ||||||||
From net realized gains | — | (169 | ) | — | — | |||||||||||
Class I (formerly Select Class) | ||||||||||||||||
From net investment income | (32,213 | ) | (19,237 | ) | (257 | ) | — | |||||||||
From net realized gains | — | (7,017 | ) | — | — | |||||||||||
Class R2 | ||||||||||||||||
From net investment income | (254 | ) | (80 | ) | — | (a) | — | |||||||||
From net realized gains | — | (35 | ) | — | — | |||||||||||
Class R5 | ||||||||||||||||
From net investment income | — | — | — | (a) | — | (a) | ||||||||||
Class R6 | ||||||||||||||||
From net investment income | — | — | (1,980 | ) | (253 | ) | ||||||||||
|
|
|
|
|
|
|
| |||||||||
Total distributions to shareholders | (34,205 | ) | (29,364 | ) | (2,563 | ) | (274 | ) | ||||||||
|
|
|
|
|
|
|
| |||||||||
CAPITAL TRANSACTIONS: | ||||||||||||||||
Change in net assets resulting from capital transactions | 3,352,439 | 492,324 | 206,016 | 35,055 | ||||||||||||
|
|
|
|
|
|
|
| |||||||||
NET ASSETS: | ||||||||||||||||
Change in net assets | 3,703,491 | 450,882 | 247,854 | 35,279 | ||||||||||||
Beginning of period | 1,335,211 | 884,329 | 109,775 | 74,496 | ||||||||||||
|
|
|
|
|
|
|
| |||||||||
End of period | $ | 5,038,702 | $ | 1,335,211 | $ | 357,629 | $ | 109,775 | ||||||||
|
|
|
|
|
|
|
| |||||||||
Accumulated undistributed (distributions in excess of) net investment income | $ | 34,860 | $ | 28,549 | $ | 2,551 | $ | 2,550 | ||||||||
|
|
|
|
|
|
|
| |||||||||
| (a) | Amount rounds to less than 500. |
SEE NOTES TO FINANCIAL STATEMENTS.
| 78 | J.P. MORGAN INTERNATIONAL EQUITY FUNDS | OCTOBER 31, 2017 | ||||
Table of Contents
| International Value Fund | Intrepid International Fund | |||||||||||||||
| Year Ended October 31, 2017 | Year Ended October 31, 2016 | Year Ended October 31, 2017 | Year Ended October 31, 2016 | |||||||||||||
CHANGE IN NET ASSETS RESULTING FROM OPERATIONS: | ||||||||||||||||
Net investment income (loss) | $ | 17,446 | $ | 42,906 | $ | 60,855 | $ | 63,699 | ||||||||
Net realized gain (loss) | 71,880 | (34,758 | ) | 160,672 | (12,289 | ) | ||||||||||
Change in net unrealized appreciation/depreciation | 107,859 | (142,738 | ) | 402,080 | (67,747 | ) | ||||||||||
|
|
|
|
|
|
|
| |||||||||
Change in net assets resulting from operations | 197,185 | (134,590 | ) | 623,607 | (16,337 | ) | ||||||||||
|
|
|
|
|
|
|
| |||||||||
DISTRIBUTIONS TO SHAREHOLDERS: | ||||||||||||||||
Class A | ||||||||||||||||
From net investment income | (18,922 | ) | (7,469 | ) | (3,117 | ) | (2,746 | ) | ||||||||
Class C | ||||||||||||||||
From net investment income | (1,312 | ) | (176 | ) | (28 | ) | (35 | ) | ||||||||
Class I (formerly Select Class) | ||||||||||||||||
From net investment income | (8,933 | ) | (2,865 | ) | (1,014 | ) | (365 | ) | ||||||||
Class L (formerly Institutional Class) | ||||||||||||||||
From net investment income | (30,468 | ) | (19,068 | ) | — | (210 | ) | |||||||||
Class R2 | ||||||||||||||||
From net investment income | (59 | ) | (18 | ) | (9 | ) | (3 | ) | ||||||||
Class R5 (a) | ||||||||||||||||
From net investment income | (1 | ) | — | — | — | |||||||||||
Class R6 | ||||||||||||||||
From net investment income | (1,834 | ) | (61 | ) | (66,113 | ) | (39,523 | ) | ||||||||
|
|
|
|
|
|
|
| |||||||||
Total distributions to shareholders | (61,529 | ) | (29,657 | ) | (70,281 | ) | (42,882 | ) | ||||||||
|
|
|
|
|
|
|
| |||||||||
CAPITAL TRANSACTIONS: | ||||||||||||||||
Change in net assets resulting from capital transactions | (650,089 | ) | (971,729 | ) | (92,031 | ) | 671,617 | |||||||||
|
|
|
|
|
|
|
| |||||||||
NET ASSETS: | ||||||||||||||||
Change in net assets | (514,433 | ) | (1,135,976 | ) | 461,295 | 612,398 | ||||||||||
Beginning of period | 1,308,220 | 2,444,196 | 2,694,314 | 2,081,916 | ||||||||||||
|
|
|
|
|
|
|
| |||||||||
End of period | $ | 793,787 | $ | 1,308,220 | $ | 3,155,609 | $ | 2,694,314 | ||||||||
|
|
|
|
|
|
|
| |||||||||
Accumulated undistributed (distributions in | $ | 14,279 | $ | 57,698 | $ | 54,925 | $ | 60,413 | ||||||||
|
|
|
|
|
|
|
| |||||||||
| (a) | Commencement of offering of class shares effective September 9, 2016, for International Value Fund. |
SEE NOTES TO FINANCIAL STATEMENTS.
| OCTOBER 31, 2017 | J.P. MORGAN INTERNATIONAL EQUITY FUNDS | 79 | ||||||
Table of Contents
STATEMENTS OF CHANGES IN NET ASSETS
FOR THE PERIODS INDICATED (continued)
(Amounts in thousands)
| Emerging Economies Fund | Emerging Markets Equity Fund | |||||||||||||||
| Year Ended October 31, 2017 | Year Ended October 31, 2016 | Year Ended October 31, 2017 | Year Ended October 31, 2016 | |||||||||||||
CAPITAL TRANSACTIONS: | ||||||||||||||||
Class A | ||||||||||||||||
Proceeds from shares issued | $ | 52,611 | $ | 124,070 | $ | 183,624 | $ | 206,821 | ||||||||
Distributions reinvested | 1,900 | 378 | 1,872 | 1,541 | ||||||||||||
Cost of shares redeemed | (60,941 | ) | (24,840 | ) | (181,184 | ) | (105,922 | ) | ||||||||
|
|
|
|
|
|
|
| |||||||||
Change in net assets resulting from Class A capital transactions | $ | (6,430 | ) | $ | 99,608 | $ | 4,312 | $ | 102,440 | |||||||
|
|
|
|
|
|
|
| |||||||||
Class C | ||||||||||||||||
Proceeds from shares issued | $ | 631 | $ | 283 | $ | 17,118 | $ | 7,659 | ||||||||
Distributions reinvested | 14 | 1 | 12 | — | ||||||||||||
Cost of shares redeemed | (984 | ) | (1,482 | ) | (17,463 | ) | (15,484 | ) | ||||||||
|
|
|
|
|
|
|
| |||||||||
Change in net assets resulting from Class C capital transactions | $ | (339 | ) | $ | (1,198 | ) | $ | (333 | ) | $ | (7,825 | ) | ||||
|
|
|
|
|
|
|
| |||||||||
Class I (formerly Select Class) | ||||||||||||||||
Proceeds from shares issued | $ | 17,416 | $ | 21,815 | $ | 331,493 | $ | 115,950 | ||||||||
Distributions reinvested | 360 | 86 | 1,623 | 1,651 | ||||||||||||
Cost of shares redeemed | (22,430 | ) | (216,425 | ) | (109,592 | ) | (350,209 | ) | ||||||||
|
|
|
|
|
|
|
| |||||||||
Change in net assets resulting from Class I capital transactions | $ | (4,654 | ) | $ | (194,524 | ) | $ | 223,524 | $ | (232,608 | ) | |||||
|
|
|
|
|
|
|
| |||||||||
Class L (formerly Institutional Class) | ||||||||||||||||
Proceeds from shares issued | $ | — | $ | — | $ | 402,572 | $ | 177,616 | ||||||||
Distributions reinvested | — | — | 2,482 | 1,936 | ||||||||||||
Cost of shares redeemed | — | — | (496,701 | ) | (138,231 | ) | ||||||||||
|
|
|
|
|
|
|
| |||||||||
Change in net assets resulting from Class L capital transactions | $ | — | $ | — | $ | (91,647 | ) | $ | 41,321 | |||||||
|
|
|
|
|
|
|
| |||||||||
Class R2 (a) | ||||||||||||||||
Proceeds from shares issued | $ | — | $ | — | $ | 20 | $ | — | ||||||||
|
|
|
|
|
|
|
| |||||||||
Change in net assets resulting from Class R2 capital transactions | $ | — | $ | — | $ | 20 | $ | — | ||||||||
|
|
|
|
|
|
|
| |||||||||
Class R3 (a) | ||||||||||||||||
Proceeds from shares issued | $ | — | $ | — | $ | 20 | $ | — | ||||||||
|
|
|
|
|
|
|
| |||||||||
Change in net assets resulting from Class R3 capital transactions | $ | — | $ | — | $ | 20 | $ | — | ||||||||
|
|
|
|
|
|
|
| |||||||||
Class R4 (a) | ||||||||||||||||
Proceeds from shares issued | $ | — | $ | — | $ | 20 | $ | — | ||||||||
|
|
|
|
|
|
|
| |||||||||
Change in net assets resulting from Class R4 capital transactions | $ | — | $ | — | $ | 20 | $ | — | ||||||||
|
|
|
|
|
|
|
| |||||||||
Class R5 (b) | ||||||||||||||||
Proceeds from shares issued | $ | 324 | $ | 79,836 | $ | 185 | $ | 20 | ||||||||
Distributions reinvested | 23 | — | — | (c) | — | |||||||||||
Cost of shares redeemed | (1,787 | ) | (158,991 | ) | — | (c) | — | |||||||||
|
|
|
|
|
|
|
| |||||||||
Change in net assets resulting from Class R5 capital transactions | $ | (1,440 | ) | $ | (79,155 | ) | $ | 185 | $ | 20 | ||||||
|
|
|
|
|
|
|
| |||||||||
Class R6 | ||||||||||||||||
Proceeds from shares issued | $ | 124,871 | $ | 962,670 | $ | 672,770 | $ | 895,741 | ||||||||
Distributions reinvested | 24,949 | 12,736 | 16,658 | 13,982 | ||||||||||||
Cost of shares redeemed | (354,462 | ) | (206,220 | ) | (396,359 | ) | (232,265 | ) | ||||||||
|
|
|
|
|
|
|
| |||||||||
Change in net assets resulting from Class R6 capital transactions | $ | (204,642 | ) | $ | 769,186 | $ | 293,069 | $ | 677,458 | |||||||
|
|
|
|
|
|
|
| |||||||||
Total change in net assets resulting from capital transactions | $ | (217,505 | ) | $ | 593,917 | $ | 429,170 | $ | 580,806 | |||||||
|
|
|
|
|
|
|
| |||||||||
| (a) | Commencement of offering of class of shares effective July 31, 2017, for Emerging Markets Equity Fund. |
| (b) | Commencement of offering of class of shares effective September 9, 2016, for Emerging Markets Equity Fund. |
| (c) | Amount rounds to less than 500. |
SEE NOTES TO FINANCIAL STATEMENTS.
| 80 | J.P. MORGAN INTERNATIONAL EQUITY FUNDS | OCTOBER 31, 2017 | ||||
Table of Contents
| Emerging Economies Fund | Emerging Markets Equity Fund | |||||||||||||||
| Year Ended October 31, 2017 | Year Ended October 31, 2016 | Year Ended October 31, 2017 | Year Ended October 31, 2016 | |||||||||||||
SHARE TRANSACTIONS: | ||||||||||||||||
Class A | ||||||||||||||||
Issued | 4,043 | 11,197 | 7,615 | 10,198 | ||||||||||||
Reinvested | 173 | 36 | 93 | 84 | ||||||||||||
Redeemed | (4,857 | ) | (2,309 | ) | (7,550 | ) | (5,454 | ) | ||||||||
|
|
|
|
|
|
|
| |||||||||
Change in Class A Shares | (641 | ) | 8,924 | 158 | 4,828 | |||||||||||
|
|
|
|
|
|
|
| |||||||||
Class C | ||||||||||||||||
Issued | 49 | 28 | 702 | 402 | ||||||||||||
Reinvested | 1 | — | (a) | 1 | — | |||||||||||
Redeemed | (74 | ) | (145 | ) | (762 | ) | (822 | ) | ||||||||
|
|
|
|
|
|
|
| |||||||||
Change in Class C Shares | (24 | ) | (117 | ) | (59 | ) | (420 | ) | ||||||||
|
|
|
|
|
|
|
| |||||||||
Class I (formerly Select Class) | ||||||||||||||||
Issued | 1,347 | 2,004 | 13,114 | 5,865 | ||||||||||||
Reinvested | 33 | 8 | 79 | 88 | ||||||||||||
Redeemed | (1,678 | ) | (19,109 | ) | (4,464 | ) | (17,594 | ) | ||||||||
|
|
|
|
|
|
|
| |||||||||
Change in Class I Shares | (298 | ) | (17,097 | ) | 8,729 | (11,641 | ) | |||||||||
|
|
|
|
|
|
|
| |||||||||
Class L (formerly Institutional Class) | ||||||||||||||||
Issued | — | — | 16,403 | 8,547 | ||||||||||||
Reinvested | — | — | 119 | 103 | ||||||||||||
Redeemed | — | — | (18,771 | ) | (6,992 | ) | ||||||||||
|
|
|
|
|
|
|
| |||||||||
Change in Class L Shares | — | — | (2,249 | ) | 1,658 | |||||||||||
|
|
|
|
|
|
|
| |||||||||
Class R2 (b) | ||||||||||||||||
Issued | — | — | 1 | — | ||||||||||||
|
|
|
|
|
|
|
| |||||||||
Change in Class R2 Shares | — | — | 1 | — | ||||||||||||
|
|
|
|
|
|
|
| |||||||||
Class R3 (b) | ||||||||||||||||
Issued | — | — | 1 | — | ||||||||||||
|
|
|
|
|
|
|
| |||||||||
Change in Class R3 Shares | — | — | 1 | — | ||||||||||||
|
|
|
|
|
|
|
| |||||||||
Class R4 (b) | ||||||||||||||||
Issued | — | — | 1 | — | ||||||||||||
|
|
|
|
|
|
|
| |||||||||
Change in Class R4 Shares | — | — | 1 | — | ||||||||||||
|
|
|
|
|
|
|
| |||||||||
Class R5 (c) | ||||||||||||||||
Issued | 26 | 7,225 | 6 | 1 | ||||||||||||
Reinvested | 2 | — | — | (a) | — | |||||||||||
Redeemed | (136 | ) | (14,428 | ) | — | (a) | — | |||||||||
|
|
|
|
|
|
|
| |||||||||
Change in Class R5 Shares | (108 | ) | (7,203 | ) | 6 | 1 | ||||||||||
|
|
|
|
|
|
|
| |||||||||
Class R6 | ||||||||||||||||
Issued | 9,667 | 87,032 | 25,331 | 42,972 | ||||||||||||
Reinvested | 2,258 | 1,219 | 804 | 745 | ||||||||||||
Redeemed | (26,789 | ) | (18,962 | ) | (15,462 | ) | (11,576 | ) | ||||||||
|
|
|
|
|
|
|
| |||||||||
Change in Class R6 Shares | (14,864 | ) | 69,289 | 10,673 | 32,141 | |||||||||||
|
|
|
|
|
|
|
| |||||||||
| (a) | Amount rounds to less than 500. |
| (b) | Commencement of offering of class of shares effective July 31, 2017, for Emerging Markets Equity Fund. |
| (c) | Commencement of offering of class of shares effective September 9, 2016, for Emerging Markets Equity Fund. |
SEE NOTES TO FINANCIAL STATEMENTS.
| OCTOBER 31, 2017 | J.P. MORGAN INTERNATIONAL EQUITY FUNDS | 81 | ||||||
Table of Contents
STATEMENTS OF CHANGES IN NET ASSETS
FOR THE PERIODS INDICATED (continued)
(Amounts in thousands)
| Global Research Enhanced Index Fund | Global Unconstrained Equity Fund | |||||||||||||||
| Year Ended October 31, 2017 | Year Ended October 31, 2016 | Year Ended October 31, 2017 | Year Ended October 31, 2016 | |||||||||||||
CAPITAL TRANSACTIONS: | ||||||||||||||||
Class A | ||||||||||||||||
Proceeds from shares issued | $ | — | $ | — | (a) | $ | 1,003 | $ | 121,461 | |||||||
Distributions reinvested | 1 | — | (a) | — | 6,351 | |||||||||||
Cost of shares redeemed | (24 | ) | — | (379 | ) | (126,936 | ) | |||||||||
|
|
|
|
|
|
|
| |||||||||
Change in net assets resulting from Class A capital transactions | $ | (23 | ) | $ | — | (a) | $ | 624 | $ | 876 | ||||||
|
|
|
|
|
|
|
| |||||||||
Class C | ||||||||||||||||
Proceeds from shares issued | $ | — | $ | — | $ | 230 | $ | 50 | ||||||||
Distributions reinvested | — | (a) | — | — | 26 | |||||||||||
Cost of shares redeemed | (23 | ) | — | (101 | ) | (146 | ) | |||||||||
|
|
|
|
|
|
|
| |||||||||
Change in net assets resulting from Class C capital transactions | $ | (23 | ) | $ | — | $ | 129 | $ | (70 | ) | ||||||
|
|
|
|
|
|
|
| |||||||||
Class I (formerly Select Class) | ||||||||||||||||
Proceeds from shares issued | $ | 1,447,613 | $ | 1,314,724 | $ | 1,004 | $ | 15,051 | ||||||||
Distributions reinvested | 19,299 | 9,477 | 3 | 803 | ||||||||||||
Cost of shares redeemed | (1,158,029 | ) | (1,740,416 | ) | (396 | ) | (15,414 | ) | ||||||||
|
|
|
|
|
|
|
| |||||||||
Change in net assets resulting from Class I capital transactions | $ | 308,883 | $ | (416,215 | ) | $ | 611 | $ | 440 | |||||||
|
|
|
|
|
|
|
| |||||||||
Class R2 | ||||||||||||||||
Proceeds from shares issued | $ | — | $ | — | $ | — | (a) | $ | — | (a) | ||||||
Distributions reinvested | — | (a) | — | (a) | — | — | ||||||||||
Cost of shares redeemed | (23 | ) | — | — | — | (a) | ||||||||||
|
|
|
|
|
|
|
| |||||||||
Change in net assets resulting from Class R2 capital transactions | $ | (23 | ) | $ | — | (a) | $ | — | (a) | $ | — | (a) | ||||
|
|
|
|
|
|
|
| |||||||||
Class R5 | ||||||||||||||||
Proceeds from shares issued | $ | — | $ | — | $ | — | (a) | $ | — | (a) | ||||||
Cost of shares redeemed | — | — | — | — | (a) | |||||||||||
|
|
|
|
|
|
|
| |||||||||
Change in net assets resulting from Class R5 capital transactions | $ | — | $ | — | $ | — | (a) | $ | — | (a) | ||||||
|
|
|
|
|
|
|
| |||||||||
Class R6 | ||||||||||||||||
Proceeds from shares issued | $ | — | $ | — | $ | 96 | $ | — | ||||||||
Cost of shares redeemed | — | — | — | (a) | — | (a) | ||||||||||
|
|
|
|
|
|
|
| |||||||||
Change in net assets resulting from Class R6 capital transactions | $ | — | $ | — | $ | 96 | $ | — | (a) | |||||||
|
|
|
|
|
|
|
| |||||||||
Total change in net assets resulting from capital transactions | $ | 308,814 | $ | (416,215 | ) | $ | 1,460 | $ | 1,246 | |||||||
|
|
|
|
|
|
|
| |||||||||
| (a) | Amount rounds to less than 500. |
SEE NOTES TO FINANCIAL STATEMENTS.
| 82 | J.P. MORGAN INTERNATIONAL EQUITY FUNDS | OCTOBER 31, 2017 | ||||
Table of Contents
| Global Research Enhanced Index Fund | Global Unconstrained Equity Fund | |||||||||||||||
| Year Ended October 31, 2017 | Year Ended October 31, 2016 | Year Ended October 31, 2017 | Year Ended October 31, 2016 | |||||||||||||
SHARE TRANSACTIONS: | ||||||||||||||||
Class A | ||||||||||||||||
Issued | — | — | 61 | 9,129 | ||||||||||||
Reinvested | — | (a) | — | (a) | — | 478 | ||||||||||
Redeemed | (1 | ) | — | (23 | ) | (9,592 | ) | |||||||||
|
|
|
|
|
|
|
| |||||||||
Change in Class A Shares | (1 | ) | — | (a) | 38 | 15 | ||||||||||
|
|
|
|
|
|
|
| |||||||||
Class C | ||||||||||||||||
Issued | — | — | 15 | 3 | ||||||||||||
Reinvested | — | (a) | — | — | 2 | |||||||||||
Redeemed | (1 | ) | — | (7 | ) | (10 | ) | |||||||||
|
|
|
|
|
|
|
| |||||||||
Change in Class C Shares | (1 | ) | — | 8 | (5 | ) | ||||||||||
|
|
|
|
|
|
|
| |||||||||
Class I (formerly Select Class) | ||||||||||||||||
Issued | 71,810 | 74,956 | 59 | 1,096 | ||||||||||||
Reinvested | 1,023 | 538 | — | (a) | 60 | |||||||||||
Redeemed | (57,817 | ) | (99,095 | ) | (24 | ) | (1,149 | ) | ||||||||
|
|
|
|
|
|
|
| |||||||||
Change in Class I Shares | 15,016 | (23,601 | ) | 35 | 7 | |||||||||||
|
|
|
|
|
|
|
| |||||||||
Class R2 | ||||||||||||||||
Issued | — | — | — | (a) | — | |||||||||||
Reinvested | — | (a) | — | (a) | — | — | ||||||||||
Redeemed | (1 | ) | — | — | — | |||||||||||
|
|
|
|
|
|
|
| |||||||||
Change in Class R2 Shares | (1 | ) | — | (a) | — | (a) | — | |||||||||
|
|
|
|
|
|
|
| |||||||||
Class R5 | ||||||||||||||||
Issued | — | — | — | (a) | — | |||||||||||
|
|
|
|
|
|
|
| |||||||||
Change in Class R5 Shares | — | — | — | (a) | — | |||||||||||
|
|
|
|
|
|
|
| |||||||||
Class R6 | ||||||||||||||||
Issued | — | — | 6 | — | ||||||||||||
Redeemed | — | — | — | (a) | — | |||||||||||
|
|
|
|
|
|
|
| |||||||||
Change in Class R6 Shares | — | — | 6 | — | ||||||||||||
|
|
|
|
|
|
|
| |||||||||
| (a) | Amount rounds to less than 500. |
SEE NOTES TO FINANCIAL STATEMENTS.
| OCTOBER 31, 2017 | J.P. MORGAN INTERNATIONAL EQUITY FUNDS | 83 | ||||||
Table of Contents
STATEMENTS OF CHANGES IN NET ASSETS
FOR THE PERIODS INDICATED (continued)
(Amounts in thousands)
| International Equity Fund | International Equity Income Fund | |||||||||||||||
| Year Ended October 31, 2017 | Year Ended October 31, 2016 | Year Ended October 31, 2017 | Year Ended October 31, 2016 | |||||||||||||
CAPITAL TRANSACTIONS: | ||||||||||||||||
Class A | ||||||||||||||||
Proceeds from shares issued | $ | 115,322 | $ | 110,321 | $ | 39,144 | $ | 47,652 | ||||||||
Distributions reinvested | 605 | 3,515 | 2,269 | 3,171 | ||||||||||||
Cost of shares redeemed | (86,838 | ) | (113,970 | ) | (33,881 | ) | (45,371 | ) | ||||||||
|
|
|
|
|
|
|
| |||||||||
Change in net assets resulting from Class A capital transactions | $ | 29,089 | $ | (134 | ) | $ | 7,532 | $ | 5,452 | |||||||
|
|
|
|
|
|
|
| |||||||||
Class C | ||||||||||||||||
Proceeds from shares issued | $ | 6,163 | $ | 2,485 | $ | 5,012 | $ | 7,012 | ||||||||
Distributions reinvested | 19 | 272 | 343 | 445 | ||||||||||||
Cost of shares redeemed | (9,245 | ) | (7,667 | ) | (5,201 | ) | (3,519 | ) | ||||||||
|
|
|
|
|
|
|
| |||||||||
Change in net assets resulting from Class C capital transactions | $ | (3,063 | ) | $ | (4,910 | ) | $ | 154 | $ | 3,938 | ||||||
|
|
|
|
|
|
|
| |||||||||
Class I (formerly Select Class) | ||||||||||||||||
Proceeds from shares issued | $ | 56,730 | $ | 32,905 | $ | 59,870 | $ | 54,317 | ||||||||
Distributions reinvested | 320 | 1,578 | 2,443 | 1,598 | ||||||||||||
Cost of shares redeemed | (37,900 | ) | (460,051 | ) | (41,426 | ) | (32,820 | ) | ||||||||
|
|
|
|
|
|
|
| |||||||||
Change in net assets resulting from Class I capital transactions | $ | 19,150 | $ | (425,568 | ) | $ | 20,887 | $ | 23,095 | |||||||
|
|
|
|
|
|
|
| |||||||||
Class R2 | ||||||||||||||||
Proceeds from shares issued | $ | 672 | $ | 883 | $ | 295 | $ | 282 | ||||||||
Distributions reinvested | 1 | 10 | 11 | 5 | ||||||||||||
Cost of shares redeemed | (396 | ) | (596 | ) | (356 | ) | (12 | ) | ||||||||
|
|
|
|
|
|
|
| |||||||||
Change in net assets resulting from Class R2 capital transactions | $ | 277 | $ | 297 | $ | (50 | ) | $ | 275 | |||||||
|
|
|
|
|
|
|
| |||||||||
Class R5 | ||||||||||||||||
Proceeds from shares issued | $ | 1,663 | $ | 6,787 | $ | 997 | $ | 696 | ||||||||
Distributions reinvested | 165 | 1,103 | 47 | 14 | ||||||||||||
Cost of shares redeemed | (43,919 | ) | (4,763 | ) | (635 | ) | (14 | ) | ||||||||
|
|
|
|
|
|
|
| |||||||||
Change in net assets resulting from Class R5 capital transactions | $ | (42,091 | ) | $ | 3,127 | $ | 409 | $ | 696 | |||||||
|
|
|
|
|
|
|
| |||||||||
Class R6 | ||||||||||||||||
Proceeds from shares issued | $ | 393,780 | $ | 1,159,108 | $ | 14,231 | $ | 1 | ||||||||
Distributions reinvested | 16,643 | 57,229 | 30 | 2 | ||||||||||||
Cost of shares redeemed | (674,090 | ) | (239,110 | ) | (586 | ) | — | (a) | ||||||||
|
|
|
|
|
|
|
| |||||||||
Change in net assets resulting from Class R6 capital transactions | $ | (263,667 | ) | $ | 977,227 | $ | 13,675 | $ | 3 | |||||||
|
|
|
|
|
|
|
| |||||||||
Total change in net assets resulting from capital transactions | $ | (260,305 | ) | $ | 550,039 | $ | 42,607 | $ | 33,459 | |||||||
|
|
|
|
|
|
|
| |||||||||
| (a) | Amount rounds to less than 500. |
SEE NOTES TO FINANCIAL STATEMENTS.
| 84 | J.P. MORGAN INTERNATIONAL EQUITY FUNDS | OCTOBER 31, 2017 | ||||
Table of Contents
| International Equity Fund | International Equity Income Fund | |||||||||||||||
| Year Ended October 31, 2017 | Year Ended October 31, 2016 | Year Ended October 31, 2017 | Year Ended October 31, 2016 | |||||||||||||
SHARE TRANSACTIONS: | ||||||||||||||||
Class A | ||||||||||||||||
Issued | 7,301 | 8,046 | 2,566 | 3,246 | ||||||||||||
Reinvested | 42 | 265 | 148 | 216 | ||||||||||||
Redeemed | (5,607 | ) | (8,294 | ) | (2,230 | ) | (3,069 | ) | ||||||||
|
|
|
|
|
|
|
| |||||||||
Change in Class A Shares | 1,736 | 17 | 484 | 393 | ||||||||||||
|
|
|
|
|
|
|
| |||||||||
Class C | ||||||||||||||||
Issued | 405 | 189 | 329 | 479 | ||||||||||||
Reinvested | 1 | 22 | 22 | 31 | ||||||||||||
Redeemed | (610 | ) | (584 | ) | (338 | ) | (243 | ) | ||||||||
|
|
|
|
|
|
|
| |||||||||
Change in Class C Shares | (204 | ) | (373 | ) | 13 | 267 | ||||||||||
|
|
|
|
|
|
|
| |||||||||
Class I (formerly Select Class) | ||||||||||||||||
Issued | 3,517 | 2,347 | 3,939 | 3,700 | ||||||||||||
Reinvested | 22 | 117 | 158 | 108 | ||||||||||||
Redeemed | (2,347 | ) | (30,864 | ) | (2,659 | ) | (2,258 | ) | ||||||||
|
|
|
|
|
|
|
| |||||||||
Change in Class I Shares | 1,192 | (28,400 | ) | 1,438 | 1,550 | |||||||||||
|
|
|
|
|
|
|
| |||||||||
Class R2 | ||||||||||||||||
Issued | 41 | 64 | 20 | 19 | ||||||||||||
Reinvested | — | (a) | 1 | 1 | — | (a) | ||||||||||
Redeemed | (26 | ) | (44 | ) | (23 | ) | (1 | ) | ||||||||
|
|
|
|
|
|
|
| |||||||||
Change in Class R2 Shares | 15 | 21 | (2 | ) | 18 | |||||||||||
|
|
|
|
|
|
|
| |||||||||
Class R5 | ||||||||||||||||
Issued | 111 | 483 | 66 | 48 | ||||||||||||
Reinvested | 11 | 81 | 3 | 1 | ||||||||||||
Redeemed | (2,981 | ) | (338 | ) | (40 | ) | (1 | ) | ||||||||
|
|
|
|
|
|
|
| |||||||||
Change in Class R5 Shares | (2,859 | ) | 226 | 29 | 48 | |||||||||||
|
|
|
|
|
|
|
| |||||||||
Class R6 | ||||||||||||||||
Issued | 25,401 | 82,405 | 882 | — | (a) | |||||||||||
Reinvested | 1,123 | 4,227 | 2 | — | (a) | |||||||||||
Redeemed | (42,082 | ) | (16,681 | ) | (36 | ) | — | (a) | ||||||||
|
|
|
|
|
|
|
| |||||||||
Change in Class R6 Shares | (15,558 | ) | 69,951 | 848 | — | (a) | ||||||||||
|
|
|
|
|
|
|
| |||||||||
| (a) | Amount rounds to less than 500. |
SEE NOTES TO FINANCIAL STATEMENTS.
| OCTOBER 31, 2017 | J.P. MORGAN INTERNATIONAL EQUITY FUNDS | 85 | ||||||
Table of Contents
STATEMENTS OF CHANGES IN NET ASSETS
FOR THE PERIODS INDICATED (continued)
(Amounts in thousands)
| International Research Enhanced Equity Fund | International Unconstrained Equity Fund | |||||||||||||||
| Year Ended October 31, 2017 | Year Ended October 31, 2016 | Year Ended October 31, 2017 | Year Ended October 31, 2016 | |||||||||||||
CAPITAL TRANSACTIONS: | ||||||||||||||||
Class A | ||||||||||||||||
Proceeds from shares issued | $ | 291,313 | $ | 9,158 | $ | 56,512 | $ | 11,592 | ||||||||
Distributions reinvested | 1,449 | 2,436 | 256 | 18 | ||||||||||||
Cost of shares redeemed | (80,384 | ) | (19,422 | ) | (9,624 | ) | (3,467 | ) | ||||||||
|
|
|
|
|
|
|
| |||||||||
Change in net assets resulting from Class A capital transactions | $ | 212,378 | $ | (7,828 | ) | $ | 47,144 | $ | 8,143 | |||||||
|
|
|
|
|
|
|
| |||||||||
Class C | ||||||||||||||||
Proceeds from shares issued | $ | 655 | $ | 998 | $ | 12,093 | $ | 2,759 | ||||||||
Distributions reinvested | 221 | 467 | 66 | 3 | ||||||||||||
Cost of shares redeemed | (16,621 | ) | (5,171 | ) | (3,674 | ) | (1,551 | ) | ||||||||
|
|
|
|
|
|
|
| |||||||||
Change in net assets resulting from Class C capital transactions | $ | (15,745 | ) | $ | (3,706 | ) | $ | 8,485 | $ | 1,211 | ||||||
|
|
|
|
|
|
|
| |||||||||
Class I (formerly Select Class) | ||||||||||||||||
Proceeds from shares issued | $ | 3,428,331 | $ | 568,584 | $ | 133,949 | $ | 7,331 | ||||||||
Distributions reinvested | 31,067 | 25,196 | 199 | — | ||||||||||||
Cost of shares redeemed | (291,221 | ) | (96,905 | ) | (23,313 | ) | (57,428 | ) | ||||||||
|
|
|
|
|
|
|
| |||||||||
Change in net assets resulting from Class I capital transactions | $ | 3,168,177 | $ | 496,875 | $ | 110,835 | $ | (50,097 | ) | |||||||
|
|
|
|
|
|
|
| |||||||||
Class R2 | ||||||||||||||||
Proceeds from shares issued | $ | 6,205 | $ | 8,693 | $ | 71 | $ | — | ||||||||
Distributions reinvested | 189 | 28 | — | (a) | — | |||||||||||
Cost of shares redeemed | (18,765 | ) | (1,738 | ) | — | (a) | — | (a) | ||||||||
|
|
|
|
|
|
|
| |||||||||
Change in net assets resulting from Class R2 capital transactions | $ | (12,371 | ) | $ | 6,983 | $ | 71 | $ | — | (a) | ||||||
|
|
|
|
|
|
|
| |||||||||
Class R5 | ||||||||||||||||
Proceeds from shares issued | $ | — | $ | — | $ | 69 | $ | — | ||||||||
Distributions reinvested | — | — | — | (a) | — | (a) | ||||||||||
Cost of shares redeemed | — | — | (6 | ) | — | (a) | ||||||||||
|
|
|
|
|
|
|
| |||||||||
Change in net assets resulting from Class R5 capital transactions | $ | — | $ | — | $ | 63 | $ | — | (a) | |||||||
|
|
|
|
|
|
|
| |||||||||
Class R6 | ||||||||||||||||
Proceeds from shares issued | $ | — | $ | — | $ | 38,555 | $ | 75,541 | ||||||||
Distributions reinvested | — | — | 1,980 | 253 | ||||||||||||
Cost of shares redeemed | — | — | (1,117 | ) | 4 | |||||||||||
|
|
|
|
|
|
|
| |||||||||
Change in net assets resulting from Class R6 capital transactions | $ | — | $ | — | $ | 39,418 | $ | 75,798 | ||||||||
|
|
|
|
|
|
|
| |||||||||
Total change in net assets resulting from capital transactions | $ | 3,352,439 | $ | 492,324 | $ | 206,016 | $ | 35,055 | ||||||||
|
|
|
|
|
|
|
| |||||||||
| (a) | Amount rounds to less than 500. |
SEE NOTES TO FINANCIAL STATEMENTS.
| 86 | J.P. MORGAN INTERNATIONAL EQUITY FUNDS | OCTOBER 31, 2017 | ||||
Table of Contents
| International Research Enhanced Equity Fund | International Unconstrained Equity Fund | |||||||||||||||
| Year Ended October 31, 2017 | Year Ended October 31, 2016 | Year Ended October 31, 2017 | Year Ended October 31, 2016 | |||||||||||||
SHARE TRANSACTIONS: | ||||||||||||||||
Class A | ||||||||||||||||
Issued | 15,780 | 600 | 2,894 | 688 | ||||||||||||
Reinvested | 93 | 157 | 15 | 1 | ||||||||||||
Redeemed | (4,458 | ) | (1,276 | ) | (521 | ) | (206 | ) | ||||||||
|
|
|
|
|
|
|
| |||||||||
Change in Class A Shares | 11,415 | (519 | ) | 2,388 | 483 | |||||||||||
|
|
|
|
|
|
|
| |||||||||
Class C | ||||||||||||||||
Issued | 40 | 67 | 610 | 167 | ||||||||||||
Reinvested | 15 | 32 | 4 | — | (a) | |||||||||||
Redeemed | (963 | ) | (353 | ) | (191 | ) | (92 | ) | ||||||||
|
|
|
|
|
|
|
| |||||||||
Change in Class C Shares | (908 | ) | (254 | ) | 423 | 75 | ||||||||||
|
|
|
|
|
|
|
| |||||||||
Class I (formerly Select Class) | ||||||||||||||||
Issued | 186,476 | 37,181 | 6,707 | 438 | ||||||||||||
Reinvested | 1,983 | 1,614 | 12 | — | ||||||||||||
Redeemed | (17,061 | ) | (6,312 | ) | (1,152 | ) | (3,248 | ) | ||||||||
|
|
|
|
|
|
|
| |||||||||
Change in Class I Shares | 171,398 | 32,483 | 5,567 | (2,810 | ) | |||||||||||
|
|
|
|
|
|
|
| |||||||||
Class R2 | ||||||||||||||||
Issued | 382 | 581 | 4 | — | ||||||||||||
Reinvested | 12 | 2 | — | (a) | — | |||||||||||
Redeemed | (1,067 | ) | (115 | ) | — | (a) | — | |||||||||
|
|
|
|
|
|
|
| |||||||||
Change in Class R2 Shares | (673 | ) | 468 | 4 | — | |||||||||||
|
|
|
|
|
|
|
| |||||||||
Class R5 | ||||||||||||||||
Issued | — | — | 3 | — | ||||||||||||
Reinvested | — | — | — | (a) | — | (a) | ||||||||||
Redeemed | — | — | — | (a) | — | |||||||||||
|
|
|
|
|
|
|
| |||||||||
Change in Class R5 Shares | — | — | 3 | — | (a) | |||||||||||
|
|
|
|
|
|
|
| |||||||||
Class R6 | ||||||||||||||||
Issued | — | — | 2,008 | 4,336 | ||||||||||||
Reinvested | — | — | 117 | 15 | ||||||||||||
Redeemed | — | — | (53 | ) | (1 | ) | ||||||||||
|
|
|
|
|
|
|
| |||||||||
Change in Class R6 Shares | — | — | 2,072 | 4,350 | ||||||||||||
|
|
|
|
|
|
|
| |||||||||
| (a) | Amount rounds to less than 500. |
SEE NOTES TO FINANCIAL STATEMENTS.
| OCTOBER 31, 2017 | J.P. MORGAN INTERNATIONAL EQUITY FUNDS | 87 | ||||||
Table of Contents
STATEMENTS OF CHANGES IN NET ASSETS
FOR THE PERIODS INDICATED (continued)
(Amounts in thousands)
| International Value Fund | Intrepid International Fund | |||||||||||||||
| Year Ended October 31, 2017 | Year Ended October 31, 2016 | Year Ended October 31, 2017 | Year Ended October 31, 2016 | |||||||||||||
CAPITAL TRANSACTIONS: | ||||||||||||||||
Class A | ||||||||||||||||
Proceeds from shares issued | $ | 82,228 | $ | 205,683 | $ | 90,711 | $ | 102,499 | ||||||||
Distributions reinvested | 18,745 | 7,392 | 3,114 | 2,734 | ||||||||||||
Cost of shares redeemed | (406,516 | ) | (291,409 | ) | (62,079 | ) | (87,263 | ) | ||||||||
|
|
|
|
|
|
|
| |||||||||
Change in net assets resulting from Class A capital transactions | $ | (305,543 | ) | $ | (78,334 | ) | $ | 31,746 | $ | 17,970 | ||||||
|
|
|
|
|
|
|
| |||||||||
Class C | ||||||||||||||||
Proceeds from shares issued | $ | 2,914 | $ | 5,220 | $ | 455 | $ | 651 | ||||||||
Distributions reinvested | 1,151 | 154 | 26 | 32 | ||||||||||||
Cost of shares redeemed | (10,863 | ) | (10,150 | ) | (1,359 | ) | (1,054 | ) | ||||||||
|
|
|
|
|
|
|
| |||||||||
Change in net assets resulting from Class C capital transactions | $ | (6,798 | ) | $ | (4,776 | ) | $ | (878 | ) | $ | (371 | ) | ||||
|
|
|
|
|
|
|
| |||||||||
Class I (formerly Select Class) | ||||||||||||||||
Proceeds from shares issued | $ | 29,799 | $ | 57,659 | $ | 39,085 | $ | 6,578 | ||||||||
Distributions reinvested | 4,900 | 1,701 | 451 | 221 | ||||||||||||
Cost of shares redeemed | (69,741 | ) | (119,752 | ) | (11,981 | ) | (8,803 | ) | ||||||||
|
|
|
|
|
|
|
| |||||||||
Change in net assets resulting from Class I capital transactions | $ | (35,042 | ) | $ | (60,392 | ) | $ | 27,555 | $ | (2,004 | ) | |||||
|
|
|
|
|
|
|
| |||||||||
Class L (formerly Institutional Class) | ||||||||||||||||
Proceeds from shares issued | $ | 193,382 | $ | 320,955 | $ | 39 | $ | 3,104 | ||||||||
Distributions reinvested | 20,403 | 13,888 | — | 50 | ||||||||||||
Cost of shares redeemed | (590,617 | ) | (1,188,471 | ) | (23,795 | ) | (27,450 | ) | ||||||||
|
|
|
|
|
|
|
| |||||||||
Change in net assets resulting from Class L capital transactions | $ | (376,832 | ) | $ | (853,628 | ) | $ | (23,756 | ) | $ | (24,296 | ) | ||||
|
|
|
|
|
|
|
| |||||||||
Class R2 | ||||||||||||||||
Proceeds from shares issued | $ | 368 | $ | 765 | $ | 8,299 | $ | 318 | ||||||||
Distributions reinvested | 24 | 8 | 4 | 3 | ||||||||||||
Cost of shares redeemed | (402 | ) | (1,410 | ) | (321 | ) | (41 | ) | ||||||||
|
|
|
|
|
|
|
| |||||||||
Change in net assets resulting from Class R2 capital transactions | $ | (10 | ) | $ | (637 | ) | $ | 7,982 | $ | 280 | ||||||
|
|
|
|
|
|
|
| |||||||||
Class R5 (a) | ||||||||||||||||
Proceeds from shares issued | $ | 36 | $ | 20 | $ | — | $ | — | ||||||||
Distributions reinvested | 1 | — | — | — | ||||||||||||
Cost of shares redeemed | (1 | ) | — | — | — | |||||||||||
|
|
|
|
|
|
|
| |||||||||
Change in net assets resulting from Class R5 capital transactions | $ | 36 | $ | 20 | $ | — | $ | — | ||||||||
|
|
|
|
|
|
|
| |||||||||
Class R6 | ||||||||||||||||
Proceeds from shares issued | $ | 106,682 | $ | 28,014 | $ | 257,105 | $ | 900,498 | ||||||||
Distributions reinvested | 1,834 | 61 | 66,113 | 39,523 | ||||||||||||
Cost of shares redeemed | (34,416 | ) | (2,057 | ) | (457,898 | ) | (259,983 | ) | ||||||||
|
|
|
|
|
|
|
| |||||||||
Change in net assets resulting from Class R6 capital transactions | $ | 74,100 | $ | 26,018 | $ | (134,680 | ) | $ | 680,038 | |||||||
|
|
|
|
|
|
|
| |||||||||
Total change in net assets resulting from capital transactions | $ | (650,089 | ) | $ | (971,729 | ) | $ | (92,031 | ) | $ | 671,617 | |||||
|
|
|
|
|
|
|
| |||||||||
| (a) | Commencement of offering of class shares effective September 9, 2016, for International Value Fund. |
SEE NOTES TO FINANCIAL STATEMENTS.
| 88 | J.P. MORGAN INTERNATIONAL EQUITY FUNDS | OCTOBER 31, 2017 | ||||
Table of Contents
| International Value Fund | Intrepid International Fund | |||||||||||||||
| Year Ended October 31, 2017 | Year Ended October 31, 2016 | Year Ended October 31, 2017 | Year Ended October 31, 2016 | |||||||||||||
SHARE TRANSACTIONS: | ||||||||||||||||
Class A | ||||||||||||||||
Issued | 6,323 | 17,288 | 4,549 | 5,754 | ||||||||||||
Reinvested | 1,558 | 600 | 171 | 148 | ||||||||||||
Redeemed | (32,574 | ) | (24,382 | ) | (3,165 | ) | (4,883 | ) | ||||||||
|
|
|
|
|
|
|
| |||||||||
Change in Class A Shares | (24,693 | ) | (6,494 | ) | 1,555 | 1,019 | ||||||||||
|
|
|
|
|
|
|
| |||||||||
Class C | ||||||||||||||||
Issued | 229 | 445 | 22 | 35 | ||||||||||||
Reinvested | 99 | 13 | 1 | 2 | ||||||||||||
Redeemed | (863 | ) | (874 | ) | (67 | ) | (57 | ) | ||||||||
|
|
|
|
|
|
|
| |||||||||
Change in Class C Shares | (535 | ) | (416 | ) | (44 | ) | (20 | ) | ||||||||
|
|
|
|
|
|
|
| |||||||||
Class I (formerly Select Class) | ||||||||||||||||
Issued | 2,244 | 4,708 | 1,985 | 354 | ||||||||||||
Reinvested | 399 | 135 | 24 | 12 | ||||||||||||
Redeemed | (5,291 | ) | (9,716 | ) | (574 | ) | (472 | ) | ||||||||
|
|
|
|
|
|
|
| |||||||||
Change in Class I Shares | (2,648 | ) | (4,873 | ) | 1,435 | (106 | ) | |||||||||
|
|
|
|
|
|
|
| |||||||||
Class L (formerly Institutional Class) | ||||||||||||||||
Issued | 14,882 | 26,460 | 2 | 170 | ||||||||||||
Reinvested | 1,668 | 1,108 | — | 3 | ||||||||||||
Redeemed | (44,537 | ) | (97,097 | ) | (1,238 | ) | (1,551 | ) | ||||||||
|
|
|
|
|
|
|
| |||||||||
Change in Class L Shares | (27,987 | ) | (69,529 | ) | (1,236 | ) | (1,378 | ) | ||||||||
|
|
|
|
|
|
|
| |||||||||
Class R2 | ||||||||||||||||
Issued | 30 | 65 | 386 | 18 | ||||||||||||
Reinvested | 2 | 1 | — | (a) | — | (a) | ||||||||||
Redeemed | (32 | ) | (118 | ) | (15 | ) | (2 | ) | ||||||||
|
|
|
|
|
|
|
| |||||||||
Change in Class R2 Shares | — | (a) | (52 | ) | 371 | 16 | ||||||||||
|
|
|
|
|
|
|
| |||||||||
Class R5 (b) | ||||||||||||||||
Issued | 2 | 2 | — | — | ||||||||||||
Reinvested | — | (a) | — | — | — | |||||||||||
Redeemed | — | (a) | — | — | — | |||||||||||
|
|
|
|
|
|
|
| |||||||||
Change in Class R5 Shares | 2 | 2 | — | — | ||||||||||||
|
|
|
|
|
|
|
| |||||||||
Class R6 | ||||||||||||||||
Issued | 7,566 | 2,230 | 13,047 | 49,855 | ||||||||||||
Reinvested | 150 | 5 | 3,555 | 2,101 | ||||||||||||
Redeemed | (2,501 | ) | (174 | ) | (22,597 | ) | (13,945 | ) | ||||||||
|
|
|
|
|
|
|
| |||||||||
Change in Class R6 Shares | 5,215 | 2,061 | (5,995 | ) | 38,011 | |||||||||||
|
|
|
|
|
|
|
| |||||||||
| (a) | Amount rounds to less than 500. |
| (b) | Commencement of offering of class shares effective September 9, 2016, for International Value Fund. |
SEE NOTES TO FINANCIAL STATEMENTS.
| OCTOBER 31, 2017 | J.P. MORGAN INTERNATIONAL EQUITY FUNDS | 89 | ||||||
Table of Contents
FOR THE PERIODS INDICATED
| Per share operating performance | ||||||||||||||||||||
| Investment operations | Distributions | |||||||||||||||||||
| Net asset value, beginning of period | Net investment income (loss) (b) | Net realized and unrealized gains (losses) on investments | Total from investment operations | Net investment income | ||||||||||||||||
Emerging Economies Fund |
| |||||||||||||||||||
Class A |
| |||||||||||||||||||
Year Ended October 31, 2017 | $ | 11.55 | $ | 0.22 | $ | 3.11 | $ | 3.33 | $ | (0.15 | ) | |||||||||
Year Ended October 31, 2016 | 11.03 | 0.15 | 0.46 | 0.61 | (0.09 | ) | ||||||||||||||
Year Ended October 31, 2015 | 13.13 | 0.13 | (f) | (2.03 | ) | (1.90 | ) | (0.20 | ) | |||||||||||
Year Ended October 31, 2014 | 13.63 | 0.22 | (0.57 | ) | (0.35 | ) | (0.15 | ) | ||||||||||||
Year Ended October 31, 2013 | 12.88 | 0.19 | 0.67 | 0.86 | (0.11 | ) | ||||||||||||||
Class C |
| |||||||||||||||||||
Year Ended October 31, 2017 | 11.41 | 0.16 | 3.09 | 3.25 | (0.06 | ) | ||||||||||||||
Year Ended October 31, 2016 | 10.86 | 0.09 | 0.46 | 0.55 | — | (g) | ||||||||||||||
Year Ended October 31, 2015 | 12.92 | 0.10 | (f) | (2.03 | ) | (1.93 | ) | (0.13 | ) | |||||||||||
Year Ended October 31, 2014 | 13.44 | 0.15 | (0.57 | ) | (0.42 | ) | (0.10 | ) | ||||||||||||
Year Ended October 31, 2013 | 12.72 | 0.13 | 0.66 | 0.79 | (0.07 | ) | ||||||||||||||
Class I (formerly Select Class) |
| |||||||||||||||||||
Year Ended October 31, 2017 | 11.68 | 0.26 | 3.15 | 3.41 | (0.16 | ) | ||||||||||||||
Year Ended October 31, 2016 | 11.06 | 0.18 | 0.47 | 0.65 | (0.03 | ) | ||||||||||||||
Year Ended October 31, 2015 | 13.17 | 0.18 | (f) | (2.06 | ) | (1.88 | ) | (0.23 | ) | |||||||||||
Year Ended October 31, 2014 | 13.67 | 0.26 | (0.58 | ) | (0.32 | ) | (0.18 | ) | ||||||||||||
Year Ended October 31, 2013 | 12.91 | 0.21 | 0.70 | 0.91 | (0.15 | ) | ||||||||||||||
Class R5 |
| |||||||||||||||||||
Year Ended October 31, 2017 | 11.78 | 0.26 | 3.20 | 3.46 | (0.17 | ) | ||||||||||||||
Year Ended October 31, 2016 | 11.11 | 0.05 | 0.62 | 0.67 | — | |||||||||||||||
Year Ended October 31, 2015 | 13.22 | 0.20 | (f) | (2.06 | ) | (1.86 | ) | (0.25 | ) | |||||||||||
Year Ended October 31, 2014 | 13.71 | 0.29 | (0.58 | ) | (0.29 | ) | (0.20 | ) | ||||||||||||
Year Ended October 31, 2013 | 12.94 | 0.25 | 0.68 | 0.93 | (0.16 | ) | ||||||||||||||
Class R6 |
| |||||||||||||||||||
Year Ended October 31, 2017 | 11.64 | 0.29 | 3.12 | 3.41 | (0.18 | ) | ||||||||||||||
Year Ended October 31, 2016 | 11.11 | 0.21 | 0.46 | 0.67 | (0.14 | ) | ||||||||||||||
September 1, 2015 (h) through October 31, 2015 | 10.46 | (0.02 | )(f) | 0.67 | 0.65 | — | ||||||||||||||
| (a) | Annualized for periods less than one year, unless otherwise noted. |
| (b) | Calculated based upon average shares outstanding. |
| (c) | Not annualized for periods less than one year. |
| (d) | Includes adjustments in accordance with accounting principles generally accepted in the United States of America and as such, the net asset values for financial reporting purposes and the returns based upon those net asset values may differ from the net asset values and returns for shareholder transactions. |
| (e) | Includes interest expense, if applicable, which is less than 0.005% unless otherwise noted. |
| (f) | Net investment income (loss) may appear disproportionate among the classes due to the timing of recognition of income and changes in the relative size of the classes. |
| (g) | Amount rounds to less than $0.005. |
| (h) | Commencement of offering of class of shares. |
SEE NOTES TO FINANCIAL STATEMENTS.
| 90 | J.P. MORGAN INTERNATIONAL EQUITY FUNDS | OCTOBER 31, 2017 | ||||
Table of Contents
| Ratios/Supplemental data | |||||||||||||||||||||||||
| Ratios to average net assets (a) | ||||||||||||||||||||||||||
| Net asset value, end of period | Total return (excludes sales charge) (c)(d) | Net assets, end of period (000’s) | Net expenses (e) | Net | Expenses without waivers and reimbursements | Portfolio turnover rate (c) | ||||||||||||||||||||
| $ | 14.73 | 29.28 | % | $ | 179,772 | 1.34 | % | 1.72 | % | 1.57 | % | 62 | % | |||||||||||||
| 11.55 | 5.62 | 148,331 | 1.42 | 1.42 | 1.70 | 72 | ||||||||||||||||||||
| 11.03 | (14.60 | ) | 43,220 | 1.58 | 1.06 | (f) | 1.99 | 118 | ||||||||||||||||||
| 13.13 | (2.56 | ) | 80,806 | 1.60 | 1.71 | 1.73 | 79 | |||||||||||||||||||
| 13.63 | 6.67 | 69,690 | 1.60 | 1.45 | 1.72 | 43 | ||||||||||||||||||||
| 14.60 | 28.71 | 2,782 | 1.85 | 1.23 | 2.17 | 62 | ||||||||||||||||||||
| 11.41 | 5.11 | 2,448 | 1.96 | 0.82 | 2.37 | 72 | ||||||||||||||||||||
| 10.86 | (15.02 | ) | 3,614 | 2.09 | 0.80 | (f) | 2.36 | 118 | ||||||||||||||||||
| 12.92 | (3.12 | ) | 5,331 | 2.10 | 1.13 | 2.23 | 79 | |||||||||||||||||||
| 13.44 | 6.25 | 5,089 | 2.10 | 1.02 | 2.22 | 43 | ||||||||||||||||||||
| 14.93 | 29.61 | 63,965 | 1.10 | 2.01 | 1.30 | 62 | ||||||||||||||||||||
| 11.68 | 5.93 | 53,509 | 1.21 | 1.67 | 1.40 | 72 | ||||||||||||||||||||
| 11.06 | (14.45 | ) | 239,866 | 1.34 | 1.51 | (f) | 1.46 | 118 | ||||||||||||||||||
| 13.17 | (2.35 | ) | 288,059 | 1.35 | 1.96 | 1.48 | 79 | |||||||||||||||||||
| 13.67 | 7.04 | 277,822 | 1.35 | 1.61 | 1.47 | 43 | ||||||||||||||||||||
| 15.07 | 29.89 | 417 | 0.93 | 2.06 | 1.16 | 62 | ||||||||||||||||||||
| 11.78 | 6.03 | 1,602 | 1.08 | 0.49 | 1.25 | 72 | ||||||||||||||||||||
| 11.11 | (14.20 | ) | 81,516 | 1.14 | 1.65 | (f) | 1.25 | 118 | ||||||||||||||||||
| 13.22 | (2.12 | ) | 852,477 | 1.15 | 2.19 | 1.28 | 79 | |||||||||||||||||||
| 13.71 | 7.21 | 676,985 | 1.15 | 1.84 | 1.27 | 43 | ||||||||||||||||||||
| 14.87 | 29.87 | 1,790,759 | 0.85 | 2.23 | 1.04 | 62 | ||||||||||||||||||||
| 11.64 | 6.16 | 1,573,822 | 0.94 | 1.99 | 1.09 | 72 | ||||||||||||||||||||
| 11.11 | 6.21 | 732,627 | 1.07 | (0.92 | )(f) | 1.17 | 118 | |||||||||||||||||||
SEE NOTES TO FINANCIAL STATEMENTS.
| OCTOBER 31, 2017 | J.P. MORGAN INTERNATIONAL EQUITY FUNDS | 91 | ||||||
Table of Contents
FINANCIAL HIGHLIGHTS
FOR THE PERIODS INDICATED (continued)
| Per share operating performance | ||||||||||||||||||||
| Investment operations | Distributions | |||||||||||||||||||
| Net asset value, beginning of period | Net investment income (loss) (b) | Net realized and unrealized gains (losses) on investments | Total from investment operations | Net investment income | ||||||||||||||||
Emerging Markets Equity Fund |
| |||||||||||||||||||
Class A |
| |||||||||||||||||||
Year Ended October 31, 2017 | $ | 21.79 | $ | 0.09 | $ | 5.80 | $ | 5.89 | $ | (0.10 | ) | |||||||||
Year Ended October 31, 2016 | 19.53 | 0.09 | 2.28 | 2.37 | (0.11 | ) | ||||||||||||||
Year Ended October 31, 2015 | 23.72 | 0.12 | (f) | (4.12 | ) | (4.00 | ) | (0.19 | ) | |||||||||||
Year Ended October 31, 2014 | 23.05 | 0.16 | (f) | 0.59 | 0.75 | (0.08 | ) | |||||||||||||
Year Ended October 31, 2013 | 22.01 | 0.10 | 1.02 | 1.12 | (0.08 | ) | ||||||||||||||
Class C |
| |||||||||||||||||||
Year Ended October 31, 2017 | 21.18 | (0.04 | ) | 5.67 | 5.63 | (0.01 | ) | |||||||||||||
Year Ended October 31, 2016 | 18.96 | (0.01 | ) | 2.23 | 2.22 | — | ||||||||||||||
Year Ended October 31, 2015 | 23.03 | 0.03 | (f) | (4.02 | ) | (3.99 | ) | (0.08 | ) | |||||||||||
Year Ended October 31, 2014 | 22.41 | 0.05 | (f) | 0.57 | 0.62 | — | ||||||||||||||
Year Ended October 31, 2013 | 21.44 | (0.01 | ) | 0.99 | 0.98 | (0.01 | ) | |||||||||||||
Class I (formerly Select Class) |
| |||||||||||||||||||
Year Ended October 31, 2017 | 22.33 | 0.16 | 5.94 | 6.10 | (0.14 | ) | ||||||||||||||
Year Ended October 31, 2016 | 19.98 | 0.13 | 2.35 | 2.48 | (0.13 | ) | ||||||||||||||
Year Ended October 31, 2015 | 24.24 | 0.19 | (f) | (4.21 | ) | (4.02 | ) | (0.24 | ) | |||||||||||
Year Ended October 31, 2014 | 23.47 | 0.18 | (f) | 0.64 | 0.82 | (0.05 | ) | |||||||||||||
Year Ended October 31, 2013 | 22.40 | 0.17 | 1.03 | 1.20 | (0.13 | ) | ||||||||||||||
Class L (formerly Institutional Class) |
| |||||||||||||||||||
Year Ended October 31, 2017 | 22.49 | 0.21 | 5.96 | 6.17 | (0.17 | ) | ||||||||||||||
Year Ended October 31, 2016 | 20.15 | 0.17 | 2.35 | 2.52 | (0.18 | ) | ||||||||||||||
Year Ended October 31, 2015 | 24.42 | 0.23 | (f) | (4.26 | ) | (4.03 | ) | (0.24 | ) | |||||||||||
Year Ended October 31, 2014 | 23.73 | 0.17 | (f) | 0.70 | 0.87 | (0.18 | ) | |||||||||||||
Year Ended October 31, 2013 | 22.65 | 0.20 | 1.04 | 1.24 | (0.16 | ) | ||||||||||||||
Class R2 |
| |||||||||||||||||||
July 31, 2017 (g) through October 31, 2017 | 26.40 | (0.01 | ) | 1.18 | 1.17 | — | ||||||||||||||
Class R3 |
| |||||||||||||||||||
July 31, 2017 (g) through October 31, 2017 | 26.40 | 0.01 | 1.18 | 1.19 | — | |||||||||||||||
Class R4 |
| |||||||||||||||||||
July 31, 2017 (g) through October 31, 2017 | 27.05 | 0.02 | 1.21 | 1.23 | — | |||||||||||||||
Class R5 |
| |||||||||||||||||||
Year Ended October 31, 2017 | 22.49 | 0.15 | 6.01 | 6.16 | (0.18 | ) | ||||||||||||||
September 9, 2016 (g) through October 31, 2016 | 22.40 | 0.01 | 0.08 | 0.09 | — | |||||||||||||||
Class R6 |
| |||||||||||||||||||
Year Ended October 31, 2017 | 22.46 | 0.21 | 5.98 | 6.19 | (0.19 | ) | ||||||||||||||
Year Ended October 31, 2016 | 20.13 | 0.19 | 2.35 | 2.54 | (0.21 | ) | ||||||||||||||
Year Ended October 31, 2015 | 24.44 | 0.22 | (f) | (4.23 | ) | (4.01 | ) | (0.30 | ) | |||||||||||
December 23, 2013 (g) through October 31, 2014 | 22.47 | 0.38 | (f) | 1.59 | 1.97 | — | ||||||||||||||
| (a) | Annualized for periods less than one year, unless otherwise noted. |
| (b) | Calculated based upon average shares outstanding. |
| (c) | Not annualized for periods less than one year. |
| (d) | Includes adjustments in accordance with accounting principles generally accepted in the United States of America and as such, the net asset values for financial reporting purposes and the returns based upon those net asset values may differ from the net asset values and returns for shareholder transactions. |
| (e) | Includes interest expense, if applicable, which is less than 0.005% unless otherwise noted. |
| (f) | Net investment income (loss) may appear disproportionate among the classes due to the timing of recognition of income and changes in the relative size of the classes. |
| (g) | Commencement of offering of class of shares. |
SEE NOTES TO FINANCIAL STATEMENTS.
| 92 | J.P. MORGAN INTERNATIONAL EQUITY FUNDS | OCTOBER 31, 2017 | ||||
Table of Contents
| Ratios/Supplemental data | |||||||||||||||||||||||||
| Ratios to average net assets (a) | ||||||||||||||||||||||||||
| Net asset value, end of period | Total return (excludes sales charge) (c)(d) | Net assets, end of period (000’s) | Net expenses (e) | Net | Expenses without waivers and reimbursements | Portfolio turnover rate (c) | ||||||||||||||||||||
| $ | 27.58 | 27.22 | % | $ | 525,451 | 1.35 | % | 0.36 | % | 1.58 | % | 22 | % | |||||||||||||
| 21.79 | 12.25 | 411,713 | 1.44 | 0.44 | 1.76 | 23 | ||||||||||||||||||||
| 19.53 | (16.95 | ) | 274,710 | 1.61 | 0.57 | (f) | 1.88 | 35 | ||||||||||||||||||
| 23.72 | 3.26 | 350,555 | 1.70 | 0.72 | (f) | 1.81 | 33 | |||||||||||||||||||
| 23.05 | 5.08 | 327,090 | 1.76 | 0.46 | 1.79 | 34 | ||||||||||||||||||||
| 26.80 | 26.58 | 48,497 | 1.85 | (0.15 | ) | 2.09 | 22 | |||||||||||||||||||
| 21.18 | 11.71 | 39,568 | 1.95 | (0.06 | ) | 2.26 | 23 | |||||||||||||||||||
| 18.96 | (17.38 | ) | 43,387 | 2.10 | 0.13 | (f) | 2.33 | 35 | ||||||||||||||||||
| 23.03 | 2.77 | 56,732 | 2.20 | 0.22 | (f) | 2.31 | 33 | |||||||||||||||||||
| 22.41 | 4.56 | 56,119 | 2.26 | (0.06 | ) | 2.29 | 34 | |||||||||||||||||||
| 28.29 | 27.54 | 629,451 | 1.10 | 0.62 | 1.30 | 22 | ||||||||||||||||||||
| 22.33 | 12.51 | 301,959 | 1.20 | 0.66 | 1.43 | 23 | ||||||||||||||||||||
| 19.98 | (16.70 | ) | 502,729 | 1.35 | 0.88 | (f) | 1.48 | 35 | ||||||||||||||||||
| 24.24 | 3.51 | 583,501 | 1.45 | 0.78 | (f) | 1.56 | 33 | |||||||||||||||||||
| 23.47 | 5.34 | 1,900,639 | 1.51 | 0.74 | 1.54 | 34 | ||||||||||||||||||||
| 28.49 | 27.72 | 430,860 | 0.95 | 0.84 | 1.14 | 22 | ||||||||||||||||||||
| 22.49 | 12.71 | 390,647 | 1.04 | 0.84 | 1.22 | 23 | ||||||||||||||||||||
| 20.15 | (16.60 | ) | 316,635 | 1.21 | 1.05 | (f) | 1.31 | 35 | ||||||||||||||||||
| 24.42 | 3.72 | 411,449 | 1.30 | 0.72 | (f) | 1.40 | 33 | |||||||||||||||||||
| 23.73 | 5.47 | 1,123,600 | 1.36 | 0.88 | 1.39 | 34 | ||||||||||||||||||||
| 27.57 | 4.43 | 21 | 1.60 | (0.17 | ) | 1.80 | 22 | |||||||||||||||||||
| 27.59 | 4.51 | 21 | 1.35 | 0.08 | 1.55 | 22 | ||||||||||||||||||||
| 28.28 | 4.55 | 21 | 1.10 | 0.33 | 1.30 | 22 | ||||||||||||||||||||
| 28.47 | 27.72 | 217 | 0.95 | 0.58 | 3.36 | 22 | ||||||||||||||||||||
| 22.49 | 0.40 | 20 | 0.90 | 0.28 | 1.08 | 23 | ||||||||||||||||||||
| 28.46 | 27.87 | 2,813,349 | 0.85 | 0.85 | 1.01 | 22 | ||||||||||||||||||||
| 22.46 | 12.83 | 1,980,671 | 0.94 | 0.96 | 1.08 | 23 | ||||||||||||||||||||
| 20.13 | (16.54 | ) | 1,128,390 | 1.10 | 0.99 | (f) | 1.16 | 35 | ||||||||||||||||||
| 24.44 | 8.77 | 1,130,050 | 1.20 | 1.85 | (f) | 1.33 | 33 | |||||||||||||||||||
SEE NOTES TO FINANCIAL STATEMENTS.
| OCTOBER 31, 2017 | J.P. MORGAN INTERNATIONAL EQUITY FUNDS | 93 | ||||||
Table of Contents
FINANCIAL HIGHLIGHTS
FOR THE PERIODS INDICATED (continued)
| Per share operating performance | ||||||||||||||||||||||||||||
| Investment operations | Distributions | |||||||||||||||||||||||||||
| Net asset value, beginning of period | Net investment income (loss) (b) | Net realized and unrealized gains (losses) on investments | Total from investment operations | Net investment income | Net realized gain | Total distributions | ||||||||||||||||||||||
Global Research Enhanced Index Fund |
| |||||||||||||||||||||||||||
Class I (formerly Select Class) | ||||||||||||||||||||||||||||
Year Ended October 31, 2017 | $ | 18.37 | $ | 0.39 | $ | 3.82 | $ | 4.21 | $ | (0.42 | ) | $ | — | $ | (0.42 | ) | ||||||||||||
Year Ended October 31, 2016 | 18.56 | 0.39 | (0.24 | ) | 0.15 | (0.34 | ) | — | (0.34 | ) | ||||||||||||||||||
Year Ended October 31, 2015 | 18.81 | 0.39 | (0.12 | ) | 0.27 | (0.27 | ) | (0.25 | ) | (0.52 | ) | |||||||||||||||||
Year Ended October 31, 2014 | 17.37 | 0.39 | 1.33 | 1.72 | (0.18 | ) | (0.10 | ) | (0.28 | ) | ||||||||||||||||||
February 28, 2013 (f) through October 31, 2013 | 15.00 | 0.19 | 2.18 | 2.37 | — | — | — | |||||||||||||||||||||
| (a) | Annualized for periods less than one year, unless otherwise noted. |
| (b) | Calculated based upon average shares outstanding. |
| (c) | Not annualized for periods less than one year. |
| (d) | Includes adjustments in accordance with accounting principles generally accepted in the United States of America and as such, the net asset values for financial reporting purposes and the returns based upon those net asset values may differ from the net asset values and returns for shareholder transactions. |
| (e) | Includes interest expense, if applicable, which is less than 0.005% unless otherwise noted. |
| (f) | Commencement of operations. |
| (g) | Certain non-recurring expenses incurred by the Fund were not annualized for the period ended October 31, 2013. |
| (h) | Ratios are disproportionate among classes due to the size of net assets and fixed expenses. |
SEE NOTES TO FINANCIAL STATEMENTS.
| 94 | J.P. MORGAN INTERNATIONAL EQUITY FUNDS | OCTOBER 31, 2017 | ||||
Table of Contents
| Ratios/Supplemental data | |||||||||||||||||||||||||
| Ratios to average net assets (a) | ||||||||||||||||||||||||||
| Net asset value, end of period | Total return (excludes sales charge) (c)(d) | Net assets, end of period (000’s) | Net expenses (e) | Net investment income (loss) | Expenses without waivers and reimbursements | Portfolio turnover rate (c) | ||||||||||||||||||||
| $ | 22.16 | 23.29 | % | $ | 8,663,460 | 0.34 | % | 1.93 | % | 0.55 | % | 33 | % | |||||||||||||
| 18.37 | 0.91 | 6,907,246 | 0.34 | 2.19 | 0.55 | 35 | ||||||||||||||||||||
| 18.56 | 1.51 | 7,415,218 | 0.33 | 2.06 | 0.56 | 44 | ||||||||||||||||||||
| 18.81 | 10.09 | 3,577,523 | 0.33 | 2.16 | 0.56 | 40 | ||||||||||||||||||||
| 17.37 | 15.80 | 1,895,025 | 0.33 | (g) | 1.73 | (g) | 0.60 | (g)(h) | 25 | |||||||||||||||||
SEE NOTES TO FINANCIAL STATEMENTS.
| OCTOBER 31, 2017 | J.P. MORGAN INTERNATIONAL EQUITY FUNDS | 95 | ||||||
Table of Contents
FINANCIAL HIGHLIGHTS
FOR THE PERIODS INDICATED (continued)
| Per share operating performance | ||||||||||||||||||||||||||||||||
| Investment operations | Distributions | |||||||||||||||||||||||||||||||
| Net asset value, beginning of period | Net investment income (loss) | Net realized gains (losses) on | Total from investment operations | Net investment income | Net realized gain | Return of capital | Total distributions | |||||||||||||||||||||||||
Global Unconstrained Equity Fund |
| |||||||||||||||||||||||||||||||
Class A | ||||||||||||||||||||||||||||||||
Year Ended October 31, 2017 | $ | 14.12 | $ | 0.15 | (c) | $ | 2.87 | $ | 3.02 | $ | — | $ | — | $ | — | $ | — | |||||||||||||||
Year Ended October 31, 2016 | 16.12 | 0.27 | (c) | (0.88 | ) | (0.61 | ) | (0.30 | ) | (0.27 | ) | (0.82 | ) | (1.39 | ) | |||||||||||||||||
Year Ended October 31, 2015 | 19.55 | 0.11 | (c) | 0.66 | 0.77 | (0.31 | ) | (3.89 | ) | — | (4.20 | ) | ||||||||||||||||||||
Year Ended October 31, 2014 | 20.11 | 0.23 | 1.17 | 1.40 | (0.17 | ) | (1.79 | ) | — | (1.96 | ) | |||||||||||||||||||||
Year Ended October 31, 2013 | 16.73 | 0.24 | 3.77 | 4.01 | (0.22 | ) | (0.41 | ) | — | (0.63 | ) | |||||||||||||||||||||
Class C | ||||||||||||||||||||||||||||||||
Year Ended October 31, 2017 | 14.02 | 0.07 | (c) | 2.84 | 2.91 | — | — | — | — | |||||||||||||||||||||||
Year Ended October 31, 2016 | 16.01 | 0.11 | (c) | (0.79 | ) | (0.68 | ) | (0.22 | ) | (0.27 | ) | (0.82 | ) | (1.31 | ) | |||||||||||||||||
Year Ended October 31, 2015 | 19.43 | 0.04 | (c) | 0.64 | 0.68 | (0.21 | ) | (3.89 | ) | — | (4.10 | ) | ||||||||||||||||||||
Year Ended October 31, 2014 | 20.01 | 0.14 | 1.16 | 1.30 | (0.09 | ) | (1.79 | ) | — | (1.88 | ) | |||||||||||||||||||||
Year Ended October 31, 2013 | 16.65 | 0.16 | 3.76 | 3.92 | (0.15 | ) | (0.41 | ) | — | (0.56 | ) | |||||||||||||||||||||
Class I (formerly Select Class) | ||||||||||||||||||||||||||||||||
Year Ended October 31, 2017 | 14.23 | 0.20 | (c) | 2.91 | 3.11 | (0.04 | ) | — | — | (0.04 | ) | |||||||||||||||||||||
Year Ended October 31, 2016 | 16.18 | 0.26 | (c) | (0.83 | ) | (0.57 | ) | (0.29 | ) | (0.27 | ) | (0.82 | ) | (1.38 | ) | |||||||||||||||||
Year Ended October 31, 2015 | 19.60 | 0.19 | (c) | 0.64 | 0.83 | (0.36 | ) | (3.89 | ) | — | (4.25 | ) | ||||||||||||||||||||
Year Ended October 31, 2014 | 20.15 | 0.27 | 1.19 | 1.46 | (0.22 | ) | (1.79 | ) | — | (2.01 | ) | |||||||||||||||||||||
Year Ended October 31, 2013 | 16.76 | 0.29 | 3.77 | 4.06 | (0.26 | ) | (0.41 | ) | — | (0.67 | ) | |||||||||||||||||||||
Class R2 | ||||||||||||||||||||||||||||||||
Year Ended October 31, 2017 | 14.24 | 0.11 | (c) | 2.89 | 3.00 | — | — | — | — | |||||||||||||||||||||||
Year Ended October 31, 2016 | 16.11 | 0.14 | (c) | (0.79 | ) | (0.65 | ) | (0.13 | ) | (0.27 | ) | (0.82 | ) | (1.22 | ) | |||||||||||||||||
Year Ended October 31, 2015 | 19.49 | 0.08 | (c) | 0.65 | 0.73 | (0.22 | ) | (3.89 | ) | — | (4.11 | ) | ||||||||||||||||||||
Year Ended October 31, 2014 | 20.06 | 0.18 | 1.17 | 1.35 | (0.13 | ) | (1.79 | ) | — | (1.92 | ) | |||||||||||||||||||||
Year Ended October 31, 2013 | 16.69 | 0.20 | 3.77 | 3.97 | (0.19 | ) | (0.41 | ) | — | (0.60 | ) | |||||||||||||||||||||
Class R5 | ||||||||||||||||||||||||||||||||
Year Ended October 31, 2017 | 14.24 | 0.22 | (c) | 2.89 | 3.11 | (0.10 | ) | — | — | (0.10 | ) | |||||||||||||||||||||
Year Ended October 31, 2016 | 16.21 | 0.24 | (c) | (0.80 | ) | (0.56 | ) | (0.32 | ) | (0.27 | ) | (0.82 | ) | (1.41 | ) | |||||||||||||||||
Year Ended October 31, 2015 | 19.65 | 0.21 | (c) | 0.64 | 0.85 | (0.40 | ) | (3.89 | ) | — | (4.29 | ) | ||||||||||||||||||||
Year Ended October 31, 2014 | 20.19 | 0.31 | 1.19 | 1.50 | (0.25 | ) | (1.79 | ) | — | (2.04 | ) | |||||||||||||||||||||
Year Ended October 31, 2013 | 16.79 | 0.32 | 3.79 | 4.11 | (0.30 | ) | (0.41 | ) | — | (0.71 | ) | |||||||||||||||||||||
Class R6 | ||||||||||||||||||||||||||||||||
Year Ended October 31, 2017 | 14.23 | 0.23 | (c) | 2.88 | 3.11 | (0.10 | ) | — | — | (0.10 | ) | |||||||||||||||||||||
Year Ended October 31, 2016 | 16.22 | 0.25 | (c) | (0.80 | ) | (0.55 | ) | (0.35 | ) | (0.27 | ) | (0.82 | ) | (1.44 | ) | |||||||||||||||||
Year Ended October 31, 2015 | 19.66 | 0.21 | (c) | 0.66 | 0.87 | (0.42 | ) | (3.89 | ) | — | (4.31 | ) | ||||||||||||||||||||
Year Ended October 31, 2014 | 20.20 | 0.32 | 1.19 | 1.51 | (0.26 | ) | (1.79 | ) | — | (2.05 | ) | |||||||||||||||||||||
Year Ended October 31, 2013 | 16.80 | 0.33 | 3.78 | 4.11 | (0.30 | ) | (0.41 | ) | — | (0.71 | ) | |||||||||||||||||||||
| (a) | Includes adjustments in accordance with accounting principles generally accepted in the United States of America and as such, the net asset values for financial reporting purposes and the returns based upon those net asset values may differ from the net asset values and returns for shareholder transactions. |
| (b) | Includes interest expense, if applicable, which is less than 0.005% unless otherwise noted. |
| (c) | Calculated based upon average shares outstanding. |
| (d) | Certain non-recurring expenses incurred by the Fund were not annualized for the period ended October 31, 2013. |
SEE NOTES TO FINANCIAL STATEMENTS.
| 96 | J.P. MORGAN INTERNATIONAL EQUITY FUNDS | OCTOBER 31, 2017 | ||||
Table of Contents
| Ratios/Supplemental data | |||||||||||||||||||||||||
| Ratios to average net assets | ||||||||||||||||||||||||||
| Net asset value, end of period | Total return (excludes sales charge) (a) | Net assets, end of period (000’s) | Net expenses (b) | Net investment income (loss) | Expenses without waivers and reimbursements | Portfolio turnover rate | ||||||||||||||||||||
| $ | 17.14 | 21.39 | % | $ | 1,171 | 0.74 | % | 0.93 | % | 11.79 | % | 105 | % | |||||||||||||
| 14.12 | (3.53 | ) | 417 | 0.74 | 1.95 | 1.90 | 1,256 | |||||||||||||||||||
| 16.12 | 4.76 | 244 | 1.00 | 0.67 | 7.57 | 132 | ||||||||||||||||||||
| 19.55 | 7.83 | 75 | 1.35 | 1.27 | 4.32 | 97 | ||||||||||||||||||||
| 20.11 | 24.74 | 70 | 1.35 | (d) | 1.37 | (d) | 5.36 | (d) | 71 | |||||||||||||||||
| 16.93 | 20.76 | 386 | 1.24 | 0.45 | 13.04 | 105 | ||||||||||||||||||||
| 14.02 | (4.02 | ) | 210 | 1.17 | 0.78 | 11.83 | 1,256 | |||||||||||||||||||
| 16.01 | 4.26 | 317 | 1.48 | 0.21 | 9.92 | 132 | ||||||||||||||||||||
| 19.43 | 7.28 | 74 | 1.85 | 0.77 | 4.82 | 97 | ||||||||||||||||||||
| 20.01 | 24.16 | 69 | 1.85 | (d) | 0.87 | (d) | 5.85 | (d) | 71 | |||||||||||||||||
| 17.30 | 21.88 | 1,827 | 0.40 | 1.25 | 11.90 | 105 | ||||||||||||||||||||
| 14.23 | (3.23 | ) | 991 | 0.36 | 1.86 | 5.37 | 1,256 | |||||||||||||||||||
| 16.18 | 5.13 | 1,020 | 0.88 | 1.06 | 7.34 | 132 | ||||||||||||||||||||
| 19.60 | 8.11 | 4,156 | 1.10 | 1.52 | 4.06 | 97 | ||||||||||||||||||||
| 20.15 | 25.04 | 3,844 | 1.10 | (d) | 1.62 | (d) | 5.10 | (d) | 71 | |||||||||||||||||
| 17.24 | 21.07 | 22 | 1.00 | 0.69 | 13.20 | 105 | ||||||||||||||||||||
| 14.24 | (3.79 | ) | 18 | 0.92 | 1.00 | 13.46 | 1,256 | |||||||||||||||||||
| 16.11 | 4.55 | 20 | 1.46 | 0.45 | 8.67 | 132 | ||||||||||||||||||||
| 19.49 | 7.55 | 75 | 1.60 | 1.02 | 4.56 | 97 | ||||||||||||||||||||
| 20.06 | 24.45 | 69 | 1.60 | (d) | 1.12 | (d) | 5.60 | (d) | 71 | |||||||||||||||||
| 17.25 | 21.91 | 21 | 0.30 | 1.39 | 12.47 | 105 | ||||||||||||||||||||
| 14.24 | (3.12 | ) | 18 | 0.22 | 1.70 | 12.77 | 1,256 | |||||||||||||||||||
| 16.21 | 5.26 | 20 | 0.76 | 1.15 | 7.97 | 132 | ||||||||||||||||||||
| 19.65 | 8.34 | 76 | 0.90 | 1.72 | 3.86 | 97 | ||||||||||||||||||||
| 20.19 | 25.29 | 70 | 0.90 | (d) | 1.82 | (d) | 4.89 | (d) | 71 | |||||||||||||||||
| 17.24 | 21.99 | 122 | 0.25 | 1.37 | 9.95 | 105 | ||||||||||||||||||||
| 14.23 | (3.10 | ) | 18 | 0.17 | 1.75 | 12.75 | 1,256 | |||||||||||||||||||
| 16.22 | 5.34 | 20 | 0.71 | 1.20 | 7.91 | 132 | ||||||||||||||||||||
| 19.66 | 8.39 | 76 | 0.85 | 1.77 | 3.81 | 97 | ||||||||||||||||||||
| 20.20 | 25.33 | 70 | 0.85 | (d) | 1.87 | (d) | 4.85 | (d) | 71 | |||||||||||||||||
SEE NOTES TO FINANCIAL STATEMENTS.
| OCTOBER 31, 2017 | J.P. MORGAN INTERNATIONAL EQUITY FUNDS | 97 | ||||||
Table of Contents
FINANCIAL HIGHLIGHTS
FOR THE PERIODS INDICATED (continued)
| Per share operating performance | ||||||||||||||||||||
| Investment operations | Distributions | |||||||||||||||||||
| Net asset value, beginning of period | Net investment income (loss) (a) | Net realized gains (losses) on | Total from investment operations | Net investment income | ||||||||||||||||
International Equity Fund |
| |||||||||||||||||||
Class A | ||||||||||||||||||||
Year Ended October 31, 2017 | $ | 14.24 | $ | 0.22 | $ | 3.39 | $ | 3.61 | $ | (0.04 | ) | |||||||||
Year Ended October 31, 2016 | 14.75 | 0.22 | (0.51 | ) | (0.29 | ) | (0.22 | ) | ||||||||||||
Year Ended October 31, 2015 | 15.25 | 0.23 | (0.50 | ) | (0.27 | ) | (0.23 | ) | ||||||||||||
Year Ended October 31, 2014 | 15.92 | 0.37 | (d) | (0.68 | ) | (0.31 | ) | (0.36 | ) | |||||||||||
Year Ended October 31, 2013 | 13.36 | 0.20 | 2.56 | 2.76 | (0.20 | ) | ||||||||||||||
Class C | ||||||||||||||||||||
Year Ended October 31, 2017 | 13.50 | 0.12 | 3.22 | 3.34 | (0.01 | ) | ||||||||||||||
Year Ended October 31, 2016 | 14.02 | 0.13 | (0.47 | ) | (0.34 | ) | (0.18 | ) | ||||||||||||
Year Ended October 31, 2015 | 14.52 | 0.15 | (0.48 | ) | (0.33 | ) | (0.17 | ) | ||||||||||||
Year Ended October 31, 2014 | 15.20 | 0.26 | (d) | (0.64 | ) | (0.38 | ) | (0.30 | ) | |||||||||||
Year Ended October 31, 2013 | 12.78 | 0.12 | 2.45 | 2.57 | (0.15 | ) | ||||||||||||||
Class I (formerly Select Class) | ||||||||||||||||||||
Year Ended October 31, 2017 | 14.45 | 0.26 | 3.44 | 3.70 | (0.06 | ) | ||||||||||||||
Year Ended October 31, 2016 | 14.95 | 0.24 | (0.48 | ) | (0.24 | ) | (0.26 | ) | ||||||||||||
Year Ended October 31, 2015 | 15.45 | 0.29 | (0.53 | ) | (0.24 | ) | (0.26 | ) | ||||||||||||
Year Ended October 31, 2014 | 16.13 | 0.39 | (d) | (0.67 | ) | (0.28 | ) | (0.40 | ) | |||||||||||
Year Ended October 31, 2013 | 13.52 | 0.23 | 2.61 | 2.84 | (0.23 | ) | ||||||||||||||
Class R2 | ||||||||||||||||||||
Year Ended October 31, 2017 | 14.17 | 0.17 | 3.38 | 3.55 | (0.02 | ) | ||||||||||||||
Year Ended October 31, 2016 | 14.69 | 0.18 | (0.50 | ) | (0.32 | ) | (0.20 | ) | ||||||||||||
Year Ended October 31, 2015 | 15.19 | 0.20 | (0.51 | ) | (0.31 | ) | (0.19 | ) | ||||||||||||
Year Ended October 31, 2014 | 15.87 | 0.30 | (d) | (0.65 | ) | (0.35 | ) | (0.33 | ) | |||||||||||
Year Ended October 31, 2013 | 13.31 | 0.11 | 2.61 | 2.72 | (0.16 | ) | ||||||||||||||
Class R5 | ||||||||||||||||||||
Year Ended October 31, 2017 | 14.47 | 0.21 | 3.52 | 3.73 | (0.07 | ) | ||||||||||||||
Year Ended October 31, 2016 | 14.97 | 0.27 | (0.49 | ) | (0.22 | ) | (0.28 | ) | ||||||||||||
Year Ended October 31, 2015 | 15.46 | 0.29 | (0.49 | ) | (0.20 | ) | (0.29 | ) | ||||||||||||
Year Ended October 31, 2014 | 16.13 | 0.44 | (d) | (0.69 | ) | (0.25 | ) | (0.42 | ) | |||||||||||
Year Ended October 31, 2013 | 13.52 | 0.27 | 2.60 | 2.87 | (0.26 | ) | ||||||||||||||
Class R6 | ||||||||||||||||||||
Year Ended October 31, 2017 | 14.46 | 0.29 | 3.46 | 3.75 | (0.08 | ) | ||||||||||||||
Year Ended October 31, 2016 | 14.97 | 0.29 | (0.51 | ) | (0.22 | ) | (0.29 | ) | ||||||||||||
Year Ended October 31, 2015 | 15.46 | 0.32 | (0.52 | ) | (0.20 | ) | (0.29 | ) | ||||||||||||
Year Ended October 31, 2014 | 16.13 | 0.45 | (d) | (0.69 | ) | (0.24 | ) | (0.43 | ) | |||||||||||
Year Ended October 31, 2013 | 13.52 | 0.28 | 2.59 | 2.87 | (0.26 | ) | ||||||||||||||
| (a) | Calculated based upon average shares outstanding. |
| (b) | Includes adjustments in accordance with accounting principles generally accepted in the United States of America and as such, the net asset values for financial reporting purposes and the returns based upon those net asset values may differ from the net asset values and returns for shareholder transactions. |
| (c) | Includes interest expense, if applicable, which is less than 0.005% unless otherwise noted. |
| (d) | Reflects special dividends paid out during the period by several of the Fund’s holdings. Had the Fund not received the special dividends, the net investment income (loss) per share would have been $0.32, $0.21, $0.34, $0.25, $0.39 and $0.40 for Class A, Class C, Class I, Class R2, Class R5 and Class R6, respectively, and the net investment income (loss) ratio would have been 2.01%, 1.40%, 2.08%, 1.59%, 2.40% and 2.48% for Class A, Class C, Class I, Class R2, Class R5 and Class R6, respectively. |
SEE NOTES TO FINANCIAL STATEMENTS.
| 98 | J.P. MORGAN INTERNATIONAL EQUITY FUNDS | OCTOBER 31, 2017 | ||||
Table of Contents
| Ratios/Supplemental data | |||||||||||||||||||||||||
| Ratios to average net assets | ||||||||||||||||||||||||||
| Net asset value, end of period | Total return (excludes sales charge) (b) | Net assets, end of period (000’s) | Net expenses (c) | Net investment income (loss) | Expenses without waivers and reimbursements | Portfolio turnover rate | ||||||||||||||||||||
| $ | 17.81 | 25.43 | % | $ | 302,130 | 1.23 | % | 1.39 | % | 1.35 | % | 17 | % | |||||||||||||
| 14.24 | (1.83 | ) | 216,932 | 1.31 | 1.62 | 1.49 | 11 | |||||||||||||||||||
| 14.75 | (1.89 | ) | 224,370 | 1.31 | 1.50 | 1.59 | 13 | |||||||||||||||||||
| 15.25 | (2.06 | ) | 186,242 | 1.31 | 2.34 | (d) | 1.45 | 6 | ||||||||||||||||||
| 15.92 | 20.85 | 188,590 | 1.30 | 1.33 | 1.47 | 8 | ||||||||||||||||||||
| 16.83 | 24.79 | 24,281 | 1.74 | 0.83 | 1.88 | 17 | ||||||||||||||||||||
| 13.50 | (2.31 | ) | 22,235 | 1.81 | 0.97 | 2.06 | 11 | |||||||||||||||||||
| 14.02 | (2.36 | ) | 28,313 | 1.81 | 1.02 | 2.05 | 13 | |||||||||||||||||||
| 14.52 | (2.59 | ) | 26,299 | 1.81 | 1.73 | (d) | 1.95 | 6 | ||||||||||||||||||
| 15.20 | 20.25 | 23,655 | 1.80 | 0.83 | 1.97 | 8 | ||||||||||||||||||||
| 18.09 | 25.69 | 139,715 | 0.99 | 1.59 | 1.10 | 17 | ||||||||||||||||||||
| 14.45 | (1.50 | ) | 94,362 | 1.06 | 1.69 | 1.24 | 11 | |||||||||||||||||||
| 14.95 | (1.66 | ) | 522,402 | 1.06 | 1.84 | 1.19 | 13 | |||||||||||||||||||
| 15.45 | (1.88 | ) | 494,344 | 1.06 | 2.41 | (d) | 1.20 | 6 | ||||||||||||||||||
| 16.13 | 21.23 | 434,316 | 1.05 | 1.51 | 1.22 | 8 | ||||||||||||||||||||
| 17.70 | 25.12 | 2,096 | 1.49 | 1.07 | 1.71 | 17 | ||||||||||||||||||||
| 14.17 | (2.08 | ) | 1,461 | 1.56 | 1.28 | 1.95 | 11 | |||||||||||||||||||
| 14.69 | (2.14 | ) | 1,203 | 1.56 | 1.28 | 1.92 | 13 | |||||||||||||||||||
| 15.19 | (2.33 | ) | 1,405 | 1.56 | 1.92 | (d) | 1.70 | 6 | ||||||||||||||||||
| 15.87 | 20.58 | 1,230 | 1.55 | 0.78 | 1.72 | 8 | ||||||||||||||||||||
| 18.13 | 25.88 | 21,891 | 0.84 | 1.36 | 0.93 | 17 | ||||||||||||||||||||
| 14.47 | (1.34 | ) | 58,836 | 0.86 | 1.93 | 1.02 | 11 | |||||||||||||||||||
| 14.97 | (1.42 | ) | 57,500 | 0.86 | 1.88 | 1.06 | 13 | |||||||||||||||||||
| 15.46 | (1.65 | ) | 95,749 | 0.86 | 2.73 | (d) | 1.00 | 6 | ||||||||||||||||||
| 16.13 | 21.42 | 106,963 | 0.85 | 1.79 | 1.02 | 8 | ||||||||||||||||||||
| 18.13 | 26.04 | 3,516,978 | 0.74 | 1.84 | 0.81 | 17 | ||||||||||||||||||||
| 14.46 | (1.36 | ) | 3,030,640 | 0.81 | 2.05 | 0.91 | 11 | |||||||||||||||||||
| 14.97 | (1.37 | ) | 2,088,835 | 0.80 | 2.03 | 0.91 | 13 | |||||||||||||||||||
| 15.46 | (1.60 | ) | 1,681,788 | 0.81 | 2.81 | (d) | 0.95 | 6 | ||||||||||||||||||
| 16.13 | 21.47 | 1,248,489 | 0.80 | 1.85 | 0.97 | 8 | ||||||||||||||||||||
SEE NOTES TO FINANCIAL STATEMENTS.
| OCTOBER 31, 2017 | J.P. MORGAN INTERNATIONAL EQUITY FUNDS | 99 | ||||||
Table of Contents
FINANCIAL HIGHLIGHTS
FOR THE PERIODS INDICATED (continued)
| Per share operating performance | |||||||||||||||||||||||||||
| Investment operations | Distributions | |||||||||||||||||||||||||||
| Net asset value, beginning of period | Net investment income (loss) (b) | Net realized gains (losses) on | Total from investment operations | Net investment income | Net realized gain | Total distributions | ||||||||||||||||||||||
International Equity Income Fund | ||||||||||||||||||||||||||||
Class A | ||||||||||||||||||||||||||||
Year Ended October 31, 2017 | $ | 14.38 | $ | 0.42 | $ | 2.16 | $ | 2.58 | $ | (0.46 | ) | $ | — | $ | (0.46 | ) | ||||||||||||
Year Ended October 31, 2016 | 15.66 | 0.45 | (f) | (1.01 | ) | (0.56 | ) | (0.46 | ) | (0.26 | ) | (0.72 | ) | |||||||||||||||
Year Ended October 31, 2015 | 16.41 | 0.39 | (f) | (0.33 | ) | 0.06 | (0.65 | ) | (0.16 | ) | (0.81 | ) | ||||||||||||||||
Year Ended October 31, 2014 | 16.67 | 0.91 | (g) | (0.38 | ) | 0.53 | (0.66 | ) | (0.13 | ) | (0.79 | ) | ||||||||||||||||
Year Ended October 31, 2013 | 14.12 | 0.43 | 2.55 | 2.98 | (0.41 | ) | (0.02 | ) | (0.43 | ) | ||||||||||||||||||
Class C | ||||||||||||||||||||||||||||
Year Ended October 31, 2017 | 14.30 | 0.34 | 2.15 | 2.49 | (0.41 | ) | — | (0.41 | ) | |||||||||||||||||||
Year Ended October 31, 2016 | 15.59 | 0.38 | (f) | (1.01 | ) | (0.63 | ) | (0.40 | ) | (0.26 | ) | (0.66 | ) | |||||||||||||||
Year Ended October 31, 2015 | 16.36 | 0.39 | (f) | (0.42 | ) | (0.03 | ) | (0.58 | ) | (0.16 | ) | (0.74 | ) | |||||||||||||||
Year Ended October 31, 2014 | 16.63 | 0.84 | (g) | (0.40 | ) | 0.44 | (0.58 | ) | (0.13 | ) | (0.71 | ) | ||||||||||||||||
Year Ended October 31, 2013 | 14.11 | 0.34 | 2.55 | 2.89 | (0.35 | ) | (0.02 | ) | (0.37 | ) | ||||||||||||||||||
Class I (formerly Select Class) | ||||||||||||||||||||||||||||
Year Ended October 31, 2017 | 14.41 | 0.50 | 2.14 | 2.64 | (0.50 | ) | — | (0.50 | ) | |||||||||||||||||||
Year Ended October 31, 2016 | 15.70 | 0.46 | (f) | (0.98 | ) | (0.52 | ) | (0.51 | ) | (0.26 | ) | (0.77 | ) | |||||||||||||||
Year Ended October 31, 2015 | 16.45 | 0.49 | (f) | (0.37 | ) | 0.12 | (0.71 | ) | (0.16 | ) | (0.87 | ) | ||||||||||||||||
Year Ended October 31, 2014 | 16.71 | 0.96 | (g) | (0.40 | ) | 0.56 | (0.69 | ) | (0.13 | ) | (0.82 | ) | ||||||||||||||||
Year Ended October 31, 2013 | 14.14 | 0.47 | 2.55 | 3.02 | (0.43 | ) | (0.02 | ) | (0.45 | ) | ||||||||||||||||||
Class R2 | ||||||||||||||||||||||||||||
Year Ended October 31, 2017 | 14.36 | 0.41 | 2.13 | 2.54 | (0.43 | ) | — | (0.43 | ) | |||||||||||||||||||
Year Ended October 31, 2016 | 15.65 | 0.39 | (f) | (0.98 | ) | (0.59 | ) | (0.44 | ) | (0.26 | ) | (0.70 | ) | |||||||||||||||
Year Ended October 31, 2015 | 16.41 | 0.61 | (f) | (0.60 | ) | 0.01 | (0.61 | ) | (0.16 | ) | (0.77 | ) | ||||||||||||||||
Year Ended October 31, 2014 | 16.67 | 0.87 | (g) | (0.39 | ) | 0.48 | (0.61 | ) | (0.13 | ) | (0.74 | ) | ||||||||||||||||
Year Ended October 31, 2013 | 14.12 | 0.40 | 2.54 | 2.94 | (0.37 | ) | (0.02 | ) | (0.39 | ) | ||||||||||||||||||
Class R5 | ||||||||||||||||||||||||||||
Year Ended October 31, 2017 | 14.42 | 0.55 | 2.12 | 2.67 | (0.52 | ) | — | (0.52 | ) | |||||||||||||||||||
Year Ended October 31, 2016 | 15.70 | 0.49 | (f) | (0.98 | ) | (0.49 | ) | (0.53 | ) | (0.26 | ) | (0.79 | ) | |||||||||||||||
Year Ended October 31, 2015 | 16.46 | 0.76 | (f) | (0.63 | ) | 0.13 | (0.73 | ) | (0.16 | ) | (0.89 | ) | ||||||||||||||||
Year Ended October 31, 2014 | 16.72 | 0.99 | (g) | (0.39 | ) | 0.60 | (0.73 | ) | (0.13 | ) | (0.86 | ) | ||||||||||||||||
Year Ended October 31, 2013 | 14.15 | 0.51 | 2.54 | 3.05 | (0.46 | ) | (0.02 | ) | (0.48 | ) | ||||||||||||||||||
Class R6 | ||||||||||||||||||||||||||||
Year Ended October 31, 2017 | 14.41 | 0.16 | 2.50 | 2.66 | (0.52 | ) | — | (0.52 | ) | |||||||||||||||||||
Year Ended October 31, 2016 | 15.69 | 0.51 | (f) | (0.99 | ) | (0.48 | ) | (0.54 | ) | (0.26 | ) | (0.80 | ) | |||||||||||||||
January 30, 2015(h) through October 31, 2015 | 15.82 | 0.69 | (f) | (0.41 | ) | 0.28 | (0.41 | ) | — | (0.41 | ) | |||||||||||||||||
| (a) | Annualized for periods less than one year, unless otherwise noted. |
| (b) | Calculated based upon average shares outstanding. |
| (c) | Not annualized for periods less than one year. |
| (d) | Includes adjustments in accordance with accounting principles generally accepted in the United States of America and as such, the net asset values for financial reporting purposes and the returns based upon those net asset values may differ from the net asset values and returns for shareholder transactions. |
| (e) | Includes interest expense, if applicable, which is less than 0.005% unless otherwise noted. |
| (f) | Net investment income (loss) may appear disproportionate among the classes due to the timing of recognition of income and changes in the relative size of the classes. |
| (g) | Reflects special dividends paid out during the period by several of the Fund’s holdings. Had the Fund not received the special dividends, the net investment income (loss) per share would have been $0.66, $0.59, $0.71, $0.62 and $0.74 for Class A, Class C, Class I, Class R2 and Class R5, respectively, and the net investment income (loss) ratio would have been 3.94%, 3.53%, 4.25%, 3.74% and 4.44% for Class A, Class C, Class I, Class R2 and Class R5, respectively |
| (h) | Commencement of offering of class of shares. |
SEE NOTES TO FINANCIAL STATEMENTS.
| 100 | J.P. MORGAN INTERNATIONAL EQUITY FUNDS | OCTOBER 31, 2017 | ||||
Table of Contents
| Ratios/Supplemental data | |||||||||||||||||||||||||
| Ratios to average net assets (a) | ||||||||||||||||||||||||||
Net asset value, end of period | Total return (excludes sales charge) (c)(d) | Net assets, end of period (000’s) | Net expenses (e) | Net income | Expenses and reimbursements | Portfolio turnover rate (c) | ||||||||||||||||||||
| $ | 16.50 | 18.24 | % | $ | 84,553 | 1.25 | % | 2.70 | % | 1.52 | % | 64 | % | |||||||||||||
| 14.38 | (3.60 | ) | 66,722 | 1.24 | 3.06 | (f) | 1.57 | 162 | ||||||||||||||||||
| 15.66 | 0.29 | 66,499 | 1.25 | 2.42 | (f) | 1.67 | 238 | |||||||||||||||||||
| 16.41 | 3.18 | 74,652 | 1.25 | 5.44 | (g) | 1.67 | 138 | |||||||||||||||||||
| 16.67 | 21.40 | 49,118 | 1.24 | 2.77 | 1.82 | 63 | ||||||||||||||||||||
| 16.38 | 17.64 | 13,679 | 1.74 | 2.24 | 2.04 | 64 | ||||||||||||||||||||
| 14.30 | (4.09 | ) | 11,754 | 1.75 | 2.59 | (f) | 2.12 | 162 | ||||||||||||||||||
| 15.59 | (0.23 | ) | 8,649 | 1.75 | 2.45 | (f) | 2.20 | 238 | ||||||||||||||||||
| 16.36 | 2.67 | 3,530 | 1.75 | 5.03 | (g) | 2.17 | 138 | |||||||||||||||||||
| 16.63 | 20.74 | 1,957 | 1.74 | 2.16 | 2.32 | 63 | ||||||||||||||||||||
| 16.55 | 18.65 | 86,550 | 0.90 | 3.21 | 1.27 | 64 | ||||||||||||||||||||
| 14.41 | (3.31 | ) | 54,642 | 0.89 | 3.13 | (f) | 1.31 | 162 | ||||||||||||||||||
| 15.70 | 0.66 | 35,177 | 0.91 | 3.00 | (f) | 1.41 | 238 | |||||||||||||||||||
| 16.45 | 3.39 | 34,719 | 1.00 | 5.75 | (g) | 1.42 | 138 | |||||||||||||||||||
| 16.71 | 21.73 | 55,485 | 0.99 | 3.04 | 1.59 | 63 | ||||||||||||||||||||
| 16.47 | 17.99 | 322 | 1.49 | 2.65 | 1.97 | 64 | ||||||||||||||||||||
| 14.36 | (3.84 | ) | 316 | 1.49 | 2.66 | (f) | 2.39 | 162 | ||||||||||||||||||
| 15.65 | (0.01 | ) | 52 | 1.50 | 3.74 | (f) | 1.89 | 238 | ||||||||||||||||||
| 16.41 | 2.90 | 574 | 1.50 | 5.24 | (g) | 1.92 | 138 | |||||||||||||||||||
| 16.67 | 21.12 | 558 | 1.49 | 2.60 | 2.11 | 63 | ||||||||||||||||||||
| 16.57 | 18.81 | 1,297 | 0.80 | 3.52 | 1.11 | 64 | ||||||||||||||||||||
| 14.42 | (3.14 | ) | 700 | 0.79 | 3.33 | (f) | 1.29 | 162 | ||||||||||||||||||
| 15.70 | 0.71 | 19 | 0.80 | 4.59 | (f) | 1.16 | 238 | |||||||||||||||||||
| 16.46 | 3.60 | 587 | 0.80 | 5.94 | (g) | 1.22 | 138 | |||||||||||||||||||
| 16.72 | 21.94 | 566 | 0.79 | 3.31 | 1.41 | 63 | ||||||||||||||||||||
| 16.55 | 18.81 | 14,055 | 0.74 | 0.99 | 1.22 | 64 | ||||||||||||||||||||
| 14.41 | (3.09 | ) | 21 | 0.75 | 3.48 | (f) | 3.06 | 162 | ||||||||||||||||||
| 15.69 | 1.66 | 21 | 0.75 | 5.70 | (f) | 1.15 | 238 | |||||||||||||||||||
SEE NOTES TO FINANCIAL STATEMENTS.
| OCTOBER 31, 2017 | J.P. MORGAN INTERNATIONAL EQUITY FUNDS | 101 | ||||||
Table of Contents
FINANCIAL HIGHLIGHTS
FOR THE PERIODS INDICATED (continued)
| Per share operating performance | |||||||||||||||||||||||||||
| Investment operations | Distributions | |||||||||||||||||||||||||||
| Net asset value, beginning of period | Net investment income (loss) (a) | Net realized gains (losses) on | Total from investment operations | Net investment income | Net realized gain | Total distributions | ||||||||||||||||||||||
International Research Enhanced Equity Fund | ||||||||||||||||||||||||||||
Class A | ||||||||||||||||||||||||||||
Year Ended October 31, 2017 | $ | 15.54 | $ | 0.34 | $ | 3.23 | $ | 3.57 | $ | (0.35 | ) | $ | — | $ | (0.35 | ) | ||||||||||||
Year Ended October 31, 2016 | 16.54 | 0.40 | (d) | (0.89 | ) | (0.49 | ) | (0.36 | ) | (0.15 | ) | (0.51 | ) | |||||||||||||||
Year Ended October 31, 2015 | 20.38 | 0.43 | (0.60 | ) | (0.17 | ) | (0.40 | ) | (3.27 | ) | (3.67 | ) | ||||||||||||||||
Year Ended October 31, 2014 | 21.20 | 0.47 | (0.56 | ) | (0.09 | ) | (0.39 | ) | (0.34 | ) | (0.73 | ) | ||||||||||||||||
Year Ended October 31, 2013 | 17.24 | 0.38 | 4.00 | 4.38 | (0.42 | ) | — | (0.42 | ) | |||||||||||||||||||
Class I (formerly Select Class) | ||||||||||||||||||||||||||||
Year Ended October 31, 2017 | 15.68 | 0.41 | 3.23 | 3.64 | (0.40 | ) | — | (0.40 | ) | |||||||||||||||||||
Year Ended October 31, 2016 | 16.70 | 0.46 | (d) | (0.92 | ) | (0.46 | ) | (0.41 | ) | (0.15 | ) | (0.56 | ) | |||||||||||||||
Year Ended October 31, 2015 | 20.54 | 0.48 | (0.60 | ) | (0.12 | ) | (0.45 | ) | (3.27 | ) | (3.72 | ) | ||||||||||||||||
Year Ended October 31, 2014 | 21.36 | 0.52 | (0.56 | ) | (0.04 | ) | (0.44 | ) | (0.34 | ) | (0.78 | ) | ||||||||||||||||
Year Ended October 31, 2013 | 17.36 | 0.40 | 4.06 | 4.46 | (0.46 | ) | — | (0.46 | ) | |||||||||||||||||||
| (a) | Calculated based upon average shares outstanding. |
| (b) | Includes adjustments in accordance with accounting principles generally accepted in the United States of America and as such, the net asset values for financial reporting purposes and the returns based upon those net asset values may differ from the net asset values and returns for shareholder transactions. |
| (c) | Includes interest expense, if applicable, which is less than 0.005% unless otherwise noted. |
| (d) | Net investment income (loss) may appear disproportionate among the classes due to the timing of recognition of income and changes in the relative size of the classes. |
| (e) | Amount rounds to less than 0.005%. |
SEE NOTES TO FINANCIAL STATEMENTS.
| 102 | J.P. MORGAN INTERNATIONAL EQUITY FUNDS | OCTOBER 31, 2017 | ||||
Table of Contents
| Ratios/Supplemental data | |||||||||||||||||||||||||
| Ratios to average net assets | ||||||||||||||||||||||||||
| Net asset value, end of period | Total return (excludes sales charge) (b) | Net assets, end of period (000’s) | Net expenses (c) | Net | Expenses without waivers and reimbursements | Portfolio turnover rate | ||||||||||||||||||||
| $ | 18.76 | 23.41 | % | $ | 298,112 | 0.59 | % | 1.98 | % | 0.90 | % | 33 | % | |||||||||||||
| 15.54 | (2.94 | ) | 69,626 | 0.60 | 2.60 | (d) | 1.02 | 24 | ||||||||||||||||||
| 16.54 | (0.29 | ) | 82,667 | 0.60 | 2.51 | 0.99 | 39 | |||||||||||||||||||
| 20.38 | (0.40 | ) | 96,325 | 0.59 | 2.23 | 1.10 | 63 | |||||||||||||||||||
| 21.20 | 25.84 | 108,193 | 0.75 | 2.04 | 1.35 | 51 | ||||||||||||||||||||
| 18.92 | 23.71 | 4,740,590 | 0.34 | 2.37 | 0.58 | 33 | ||||||||||||||||||||
| 15.68 | (2.72 | ) | 1,241,856 | 0.34 | 2.98 | (d) | 0.59 | 24 | ||||||||||||||||||
| 16.70 | 0.00 | (e) | 779,908 | 0.35 | 2.79 | 0.60 | 39 | |||||||||||||||||||
| 20.54 | (0.16 | ) | 562,180 | 0.34 | 2.45 | 0.84 | 63 | |||||||||||||||||||
| 21.36 | 26.18 | 464,273 | 0.53 | 2.10 | 1.09 | 51 | ||||||||||||||||||||
SEE NOTES TO FINANCIAL STATEMENTS.
| OCTOBER 31, 2017 | J.P. MORGAN INTERNATIONAL EQUITY FUNDS | 103 | ||||||
Table of Contents
FINANCIAL HIGHLIGHTS
FOR THE PERIODS INDICATED (continued)
| Per share operating performance | ||||||||||||||||||||||||||||
| Investment operations | Distributions | |||||||||||||||||||||||||||
| Net asset value, beginning of period | Net investment income (loss) | Net realized gains | Total from investment operations | Net investment income | Net realized gain | Total distributions | ||||||||||||||||||||||
International Unconstrained Equity Fund | ||||||||||||||||||||||||||||
Class A | ||||||||||||||||||||||||||||
Year Ended October 31, 2017 | $ | 17.24 | 0.16 | (c) | $ | 4.09 | $ | 4.25 | $ | (0.35 | ) | $ | — | $ | (0.35 | ) | ||||||||||||
Year Ended October 31, 2016 | 17.61 | 0.22 | (c)(d) | (0.55 | ) | (0.33 | ) | (0.04 | ) | — | (0.04 | ) | ||||||||||||||||
Year Ended October 31, 2015 | 18.59 | 0.09 | (c)(d) | 0.39 | 0.48 | (0.17 | ) | (1.29 | ) | (1.46 | ) | |||||||||||||||||
Year Ended October 31, 2014 | 20.59 | 0.13 | (e) | (0.65 | ) | (0.52 | ) | (0.17 | ) | (1.31 | ) | (1.48 | ) | |||||||||||||||
Year Ended October 31, 2013 | 17.28 | 0.15 | 3.62 | 3.77 | (0.11 | ) | (0.35 | ) | (0.46 | ) | ||||||||||||||||||
Class C | ||||||||||||||||||||||||||||
Year Ended October 31, 2017 | 17.04 | 0.05 | (c) | 4.06 | 4.11 | (0.25 | ) | — | (0.25 | ) | ||||||||||||||||||
Year Ended October 31, 2016 | 17.45 | 0.13 | (c)(d) | (0.53 | ) | (0.40 | ) | (0.01 | ) | — | (0.01 | ) | ||||||||||||||||
Year Ended October 31, 2015 | 18.44 | (0.02 | )(c)(d) | 0.39 | 0.37 | (0.07 | ) | (1.29 | ) | (1.36 | ) | |||||||||||||||||
Year Ended October 31, 2014 | 20.47 | 0.09 | (e) | (0.69 | ) | (0.60 | ) | (0.12 | ) | (1.31 | ) | (1.43 | ) | |||||||||||||||
Year Ended October 31, 2013 | 17.20 | 0.07 | 3.59 | 3.66 | (0.04 | ) | (0.35 | ) | (0.39 | ) | ||||||||||||||||||
Class I (formerly Select Class) | ||||||||||||||||||||||||||||
Year Ended October 31, 2017 | 17.45 | 0.23 | (c) | 4.13 | 4.36 | (0.40 | ) | — | (0.40 | ) | ||||||||||||||||||
Year Ended October 31, 2016 | 17.71 | 0.24 | (c)(d) | (0.50 | ) | (0.26 | ) | — | — | — | ||||||||||||||||||
Year Ended October 31, 2015 | 18.67 | 0.15 | (c)(d) | 0.38 | 0.53 | (0.20 | ) | (1.29 | ) | (1.49 | ) | |||||||||||||||||
Year Ended October 31, 2014 | 20.64 | 0.21 | (e) | (0.67 | ) | (0.46 | ) | (0.20 | ) | (1.31 | ) | (1.51 | ) | |||||||||||||||
Year Ended October 31, 2013 | 17.32 | 0.21 | 3.60 | 3.81 | (0.14 | ) | (0.35 | ) | (0.49 | ) | ||||||||||||||||||
Class R2 | ||||||||||||||||||||||||||||
Year Ended October 31, 2017 | 17.21 | 0.06 | (c) | 4.14 | 4.20 | (0.30 | ) | — | (0.30 | ) | ||||||||||||||||||
Year Ended October 31, 2016 | 17.57 | 0.15 | (c)(d) | (0.51 | ) | (0.36 | ) | — | — | — | ||||||||||||||||||
Year Ended October 31, 2015 | 18.55 | 0.03 | (c)(d) | 0.39 | 0.42 | (0.11 | ) | (1.29 | ) | (1.40 | ) | |||||||||||||||||
Year Ended October 31, 2014 | 20.53 | 0.12 | (e) | (0.68 | ) | (0.56 | ) | (0.11 | ) | (1.31 | ) | (1.42 | ) | |||||||||||||||
Year Ended October 31, 2013 | 17.24 | 0.12 | 3.59 | 3.71 | (0.07 | ) | (0.35 | ) | (0.42 | ) | ||||||||||||||||||
Class R5 | ||||||||||||||||||||||||||||
Year Ended October 31, 2017 | 17.44 | 0.20 | (c) | 4.17 | 4.37 | (0.42 | ) | — | (0.42 | ) | ||||||||||||||||||
Year Ended October 31, 2016 | 17.75 | 0.27 | (c)(d) | (0.52 | ) | (0.25 | ) | (0.06 | ) | — | (0.06 | ) | ||||||||||||||||
Year Ended October 31, 2015 | 18.72 | 0.16 | (c)(d) | 0.39 | 0.55 | (0.23 | ) | (1.29 | ) | (1.52 | ) | |||||||||||||||||
Year Ended October 31, 2014 | 20.69 | 0.24 | (e) | (0.67 | ) | (0.43 | ) | (0.23 | ) | (1.31 | ) | (1.54 | ) | |||||||||||||||
Year Ended October 31, 2013 | 17.35 | 0.25 | 3.61 | 3.86 | (0.17 | ) | (0.35 | ) | (0.52 | ) | ||||||||||||||||||
Class R6 | ||||||||||||||||||||||||||||
Year Ended October 31, 2017 | 17.45 | 0.26 | (c) | 4.12 | 4.38 | (0.43 | ) | — | (0.43 | ) | ||||||||||||||||||
Year Ended October 31, 2016 | 17.76 | 0.29 | (c)(d) | (0.52 | ) | (0.23 | ) | (0.08 | ) | — | (0.08 | ) | ||||||||||||||||
Year Ended October 31, 2015 | 18.73 | (0.01 | )(c)(d) | 0.57 | 0.56 | (0.24 | ) | (1.29 | ) | (1.53 | ) | |||||||||||||||||
Year Ended October 31, 2014 | 20.70 | 0.25 | (e) | (0.67 | ) | (0.42 | ) | (0.24 | ) | (1.31 | ) | (1.55 | ) | |||||||||||||||
Year Ended October 31, 2013 | 17.36 | 0.26 | 3.61 | 3.87 | (0.18 | ) | (0.35 | ) | (0.53 | ) | ||||||||||||||||||
| (a) | Includes adjustments in accordance with accounting principles generally accepted in the United States of America and as such, the net asset values for financial reporting purposes and the returns based upon those net asset values may differ from the net asset values and returns for shareholder transactions. |
| (b) | Includes interest expense, if applicable, which is less than 0.005% unless otherwise noted. |
| (c) | Calculated based upon average shares outstanding. |
| (d) | Net investment income (loss) may appear disproportionate among the classes due to the timing of recognition of income and changes in the relative size of the classes. |
| (e) | Reflects special dividends paid out during the period by one of the Fund’s holdings. Had the Fund not received the special dividend, the net investment income (loss) per share would have been $0.10, $0.06, $0.17, $0.08, $0.20 and $0.22 for Class A, Class C, Class I, Class R2, Class R5 and Class R6, respectively and the net investment income (loss) ratio would have been 0.80%, 0.37%, 0.99%, 0.48%, 1.18% and 1.23% for Class A, Class C, Class I, Class R2, Class R5 and Class R6, respectively. |
| (f) | Certain non-recurring expenses incurred by the Fund were not annualized for the year ended October 31, 2013. |
SEE NOTES TO FINANCIAL STATEMENTS.
| 104 | J.P. MORGAN INTERNATIONAL EQUITY FUNDS | OCTOBER 31, 2017 | ||||
Table of Contents
| Ratios/Supplemental data | |||||||||||||||||||||||||
| Ratios to average net assets | ||||||||||||||||||||||||||
| Net asset value, end of period | Total return (excludes sales charge) (a) | Net assets, end of period (000’s) | Net expenses (b) | Net investment income (loss) | Expenses without waivers and reimbursements | Portfolio turnover rate | ||||||||||||||||||||
| $ | 21.14 | 25.16 | % | $ | 67,684 | 1.24 | % | 0.83 | % | 1.46 | % | 38 | % | |||||||||||||
| 17.24 | (1.86 | ) | 14,034 | 1.24 | 1.28 | (d) | 1.61 | 51 | ||||||||||||||||||
| 17.61 | 3.04 | 5,824 | 1.24 | 0.49 | (d) | 2.31 | 42 | |||||||||||||||||||
| 18.59 | (2.47 | ) | 351 | 1.32 | 0.98 | (e) | 5.09 | 63 | ||||||||||||||||||
| 20.59 | 22.23 | 83 | 1.32 | (f) | 0.89 | (f) | 7.99 | (f) | 65 | |||||||||||||||||
| 20.90 | 24.51 | 14,534 | 1.74 | 0.27 | 2.00 | 38 | ||||||||||||||||||||
| 17.04 | (2.28 | ) | 4,626 | 1.74 | 0.75 | (d) | 2.14 | 51 | ||||||||||||||||||
| 17.45 | 2.39 | 3,439 | 1.74 | (0.12 | )(d) | 2.79 | 42 | |||||||||||||||||||
| 18.44 | (2.91 | ) | 137 | 1.82 | 0.55 | (e) | 6.19 | 63 | ||||||||||||||||||
| 20.47 | 21.61 | 76 | 1.82 | (f) | 0.40 | (f) | 8.35 | (f) | 65 | |||||||||||||||||
| 21.41 | 25.60 | 131,356 | 0.89 | 1.14 | 1.19 | 38 | ||||||||||||||||||||
| 17.45 | (1.47 | ) | 9,929 | 0.89 | 1.41 | (d) | 1.35 | 51 | ||||||||||||||||||
| 17.71 | 3.29 | 59,858 | 0.89 | 0.83 | (d) | 1.84 | 42 | |||||||||||||||||||
| 18.67 | (2.18 | ) | 3,868 | 1.07 | 1.17 | (e) | 5.55 | 63 | ||||||||||||||||||
| 20.64 | 22.49 | 3,925 | 1.07 | (f) | 1.17 | (f) | 7.52 | (f) | 65 | |||||||||||||||||
| 21.11 | 24.85 | 97 | 1.49 | 0.31 | 2.79 | 38 | ||||||||||||||||||||
| 17.21 | (2.05 | ) | 20 | 1.49 | 0.87 | (d) | 4.37 | 51 | ||||||||||||||||||
| 17.57 | 2.67 | 20 | 1.51 | 0.19 | (d) | 5.11 | 42 | |||||||||||||||||||
| 18.55 | (2.68 | ) | 68 | 1.57 | 0.66 | (e) | 6.05 | 63 | ||||||||||||||||||
| 20.53 | 21.92 | 70 | 1.57 | (f) | 0.67 | (f) | 8.01 | (f) | 65 | |||||||||||||||||
| 21.39 | 25.67 | 90 | 0.79 | 1.01 | 2.44 | 38 | ||||||||||||||||||||
| 17.44 | (1.38 | ) | 20 | 0.80 | 1.57 | (d) | 3.59 | 51 | ||||||||||||||||||
| 17.75 | 3.43 | 20 | 0.81 | 0.89 | (d) | 4.43 | 42 | |||||||||||||||||||
| 18.72 | (1.99 | ) | 70 | 0.87 | 1.36 | (e) | 5.34 | 63 | ||||||||||||||||||
| 20.69 | 22.76 | 71 | 0.87 | (f) | 1.37 | (f) | 7.31 | (f) | 65 | |||||||||||||||||
| 21.40 | 25.72 | 143,868 | 0.74 | 1.37 | 0.95 | 38 | ||||||||||||||||||||
| 17.45 | (1.29 | ) | 81,146 | 0.74 | 1.70 | (d) | 1.02 | 51 | ||||||||||||||||||
| 17.76 | 3.48 | 5,335 | 0.74 | (0.05 | )(d) | 2.87 | 42 | |||||||||||||||||||
| 18.73 | (1.95 | ) | 70 | 0.82 | 1.41 | (e) | 5.29 | 63 | ||||||||||||||||||
| 20.70 | 22.80 | 71 | 0.82 | (f) | 1.42 | (f) | 7.26 | (f) | 65 | |||||||||||||||||
SEE NOTES TO FINANCIAL STATEMENTS.
| OCTOBER 31, 2017 | J.P. MORGAN INTERNATIONAL EQUITY FUNDS | 105 | ||||||
Table of Contents
FINANCIAL HIGHLIGHTS
FOR THE PERIODS INDICATED (continued)
| Per share operating performance | |||||||||||||||||||
| Investment operations | Distributions | |||||||||||||||||||
| Net asset value, beginning of period | Net investment (loss) (b) | Net realized and unrealized gains (losses) on investments | Total from investment operations | Net investment income | ||||||||||||||||
International Value Fund | ||||||||||||||||||||
Class A | ||||||||||||||||||||
Year Ended October 31, 2017 | $ | 12.23 | $ | 0.22 | $ | 2.50 | $ | 2.72 | $ | (0.69 | ) | |||||||||
Year Ended October 31, 2016 | 13.02 | 0.23 | (0.88 | ) | (0.65 | ) | (0.14 | ) | ||||||||||||
Year Ended October 31, 2015 | 14.14 | 0.18 | (f) | (0.83 | ) | (0.65 | ) | (0.47 | ) | |||||||||||
Year Ended October 31, 2014 | 15.02 | 0.47 | (f)(g) | (1.07 | ) | (0.60 | ) | (0.28 | ) | |||||||||||
Year Ended October 31, 2013 | 12.18 | 0.22 | 2.91 | 3.13 | (0.29 | ) | ||||||||||||||
Class C | ||||||||||||||||||||
Year Ended October 31, 2017 | 11.88 | 0.15 | 2.42 | 2.57 | (0.67 | ) | ||||||||||||||
Year Ended October 31, 2016 | 12.65 | 0.17 | (0.87 | ) | (0.70 | ) | (0.07 | ) | ||||||||||||
Year Ended October 31, 2015 | 13.72 | 0.10 | (f) | (0.78 | ) | (0.68 | ) | (0.39 | ) | |||||||||||
Year Ended October 31, 2014 | 14.61 | 0.38 | (f)(g) | (1.05 | ) | (0.67 | ) | (0.22 | ) | |||||||||||
Year Ended October 31, 2013 | 11.84 | 0.16 | 2.83 | 2.99 | (0.22 | ) | ||||||||||||||
Class I (formerly Select Class) | ||||||||||||||||||||
Year Ended October 31, 2017 | 12.57 | 0.28 | 2.55 | 2.83 | (0.78 | ) | ||||||||||||||
Year Ended October 31, 2016 | 13.37 | 0.28 | (0.91 | ) | (0.63 | ) | (0.17 | ) | ||||||||||||
Year Ended October 31, 2015 | 14.48 | 0.23 | (f) | (0.84 | ) | (0.61 | ) | (0.50 | ) | |||||||||||
Year Ended October 31, 2014 | 15.19 | 0.45 | (f)(g) | (1.04 | ) | (0.59 | ) | (0.12 | ) | |||||||||||
Year Ended October 31, 2013 | 12.31 | 0.27 | 2.93 | 3.20 | (0.32 | ) | ||||||||||||||
Class L (formerly Institutional Class) | ||||||||||||||||||||
Year Ended October 31, 2017 | 12.50 | 0.27 | 2.57 | 2.84 | (0.79 | ) | ||||||||||||||
Year Ended October 31, 2016 | 13.29 | 0.31 | (0.93 | ) | (0.62 | ) | (0.17 | ) | ||||||||||||
Year Ended October 31, 2015 | 14.41 | 0.23 | (f) | (0.83 | ) | (0.60 | ) | (0.52 | ) | |||||||||||
Year Ended October 31, 2014 | 15.29 | 0.53 | (f)(g) | (1.09 | ) | (0.56 | ) | (0.32 | ) | |||||||||||
Year Ended October 31, 2013 | 12.38 | 0.29 | 2.95 | 3.24 | (0.33 | ) | ||||||||||||||
Class R2 | ||||||||||||||||||||
Year Ended October 31, 2017 | 12.04 | 0.19 | 2.46 | 2.65 | (0.68 | ) | ||||||||||||||
Year Ended October 31, 2016 | 12.83 | 0.19 | (0.87 | ) | (0.68 | ) | (0.11 | ) | ||||||||||||
Year Ended October 31, 2015 | 13.93 | 0.14 | (f) | (0.81 | ) | (0.67 | ) | (0.43 | ) | |||||||||||
Year Ended October 31, 2014 | 14.78 | 0.42 | (f)(g) | (1.05 | ) | (0.63 | ) | (0.22 | ) | |||||||||||
Year Ended October 31, 2013 | 11.99 | 0.18 | 2.88 | 3.06 | (0.27 | ) | ||||||||||||||
Class R5 | ||||||||||||||||||||
Year Ended October 31, 2017 | 12.51 | 0.23 | 2.59 | 2.82 | (0.82 | ) | ||||||||||||||
September 9, 2016 (h) through October 31, 2016 | 12.55 | 0.03 | (0.07 | ) | (0.04 | ) | — | |||||||||||||
Class R6 | ||||||||||||||||||||
Year Ended October 31, 2017 | 12.51 | 0.31 | 2.53 | 2.84 | (0.82 | ) | ||||||||||||||
Year Ended October 31, 2016 | 13.31 | 0.37 | (0.96 | ) | (0.59 | ) | (0.21 | ) | ||||||||||||
Year Ended October 31, 2015 | 14.42 | 0.18 | (f) | (0.76 | ) | (0.58 | ) | (0.53 | ) | |||||||||||
Year Ended October 31, 2014 | 15.29 | 0.54 | (f)(g) | (1.09 | ) | (0.55 | ) | (0.32 | ) | |||||||||||
Year Ended October 31, 2013 | 12.38 | 0.30 | 2.96 | 3.26 | (0.35 | ) | ||||||||||||||
| (a) | Annualized for periods less than one year, unless otherwise noted. |
| (b) | Calculated based upon average shares outstanding. |
| (c) | Not annualized for periods less than one year. |
| (d) | Includes adjustments in accordance with accounting principles generally accepted in the United States of America and as such, the net asset values for financial reporting purposes and the returns based upon those net asset values may differ from the net asset values and returns for shareholder transactions. |
| (e) | Includes interest expense, if applicable, which is less than 0.005% unless otherwise noted. |
| (f) | Net investment income (loss) may appear disproportionate among the classes due to the timing of recognition of income and changes in the relative size of the classes. |
| (g) | Reflects special dividends paid out during the period by several of the Fund’s holdings. Had the Fund not received the special dividends, the net investment income (loss) per share would have been $0.39, $0.30, $0.37, $0.45, $0.34 and $0.46 for Class A, Class C, Class I, Class L, Class R2 and Class R6, respectively and the net investment income (loss) ratio would have been 2.67%, 2.13%, 2.44%, 2.99%, 2.39% and 3.06% for Class A, Class C, Class I, Class L, Class R2 and Class R6, respectively. |
| (h) | Commencement of offering of class of shares. |
SEE NOTES TO FINANCIAL STATEMENTS.
| 106 | J.P. MORGAN INTERNATIONAL EQUITY FUNDS | OCTOBER 31, 2017 | ||||
Table of Contents
| Ratios/Supplemental data | |||||||||||||||||||||||||
| Ratios to average net assets (a) | ||||||||||||||||||||||||||
| Net asset value, end of period | Total return (excludes sales charge) (c)(d) | Net assets, end of period (000’s) | Net expenses (e) | Net investment income (loss) | Expenses without waivers and reimbursements | Portfolio turnover rate (c) | ||||||||||||||||||||
| $ | 14.26 | 23.30 | % | $ | 316,510 | 1.35 | % | 1.71 | % | 1.35 | % | 31 | % | |||||||||||||
| 12.23 | (5.01 | ) | 573,449 | 1.35 | 1.91 | 1.43 | 61 | |||||||||||||||||||
| 13.02 | (4.63 | ) | 695,251 | 1.35 | 1.31 | (f) | 1.45 | 74 | ||||||||||||||||||
| 14.14 | (4.09 | ) | 491,010 | 1.33 | 3.19 | (f)(g) | 1.36 | 59 | ||||||||||||||||||
| 15.02 | 26.13 | 221,077 | 1.33 | 1.66 | 1.35 | 66 | ||||||||||||||||||||
| 13.78 | 22.67 | 20,997 | 1.85 | 1.21 | 1.87 | 31 | ||||||||||||||||||||
| 11.88 | (5.54 | ) | 24,453 | 1.85 | 1.43 | 1.91 | 61 | |||||||||||||||||||
| 12.65 | (5.01 | ) | 31,296 | 1.85 | 0.79 | (f) | 1.90 | 74 | ||||||||||||||||||
| 13.72 | (4.64 | ) | 31,176 | 1.83 | 2.65 | (f)(g) | 1.86 | 59 | ||||||||||||||||||
| 14.61 | 25.58 | 22,682 | 1.83 | 1.19 | 1.85 | 66 | ||||||||||||||||||||
| 14.62 | 23.66 | 144,875 | 1.04 | 2.07 | 1.04 | 31 | ||||||||||||||||||||
| 12.57 | (4.74 | ) | 157,867 | 1.01 | 2.28 | 1.02 | 61 | |||||||||||||||||||
| 13.37 | (4.28 | ) | 233,045 | 1.03 | 1.62 | (f) | 1.03 | 74 | ||||||||||||||||||
| 14.48 | (3.90 | ) | 300,712 | 1.08 | 2.96 | (f)(g) | 1.10 | 59 | ||||||||||||||||||
| 15.19 | 26.46 | 1,634,392 | 1.09 | 1.99 | 1.10 | 66 | ||||||||||||||||||||
| 14.55 | 23.88 | 201,672 | 0.87 | 2.03 | 0.88 | 31 | ||||||||||||||||||||
| 12.50 | (4.63 | ) | 523,251 | 0.90 | 2.53 | 0.91 | 61 | |||||||||||||||||||
| 13.29 | (4.23 | ) | 1,480,321 | 0.95 | 1.63 | (f) | 0.99 | 74 | ||||||||||||||||||
| 14.41 | (3.75 | ) | 2,932,420 | 0.93 | 3.51 | (f)(g) | 0.96 | 59 | ||||||||||||||||||
| 15.29 | 26.72 | 1,087,334 | 0.94 | 2.08 | 0.95 | 66 | ||||||||||||||||||||
| 14.01 | 23.02 | 1,369 | 1.58 | 1.52 | 1.73 | 31 | ||||||||||||||||||||
| 12.04 | (5.28 | ) | 1,182 | 1.59 | 1.65 | 1.91 | 61 | |||||||||||||||||||
| 12.83 | (4.84 | ) | 1,929 | 1.60 | 1.01 | (f) | 2.01 | 74 | ||||||||||||||||||
| 13.93 | (4.33 | ) | 1,768 | 1.58 | 2.91 | (f)(g) | 1.61 | 59 | ||||||||||||||||||
| 14.78 | 25.91 | 1,249 | 1.59 | 1.39 | 1.60 | 66 | ||||||||||||||||||||
| 14.51 | 23.81 | 62 | 0.93 | 1.69 | 4.00 | 31 | ||||||||||||||||||||
| 12.51 | (0.32 | ) | 20 | 0.79 | 1.52 | 0.79 | 61 | |||||||||||||||||||
| 14.53 | 23.99 | 108,302 | 0.80 | 2.28 | 0.82 | 31 | ||||||||||||||||||||
| 12.51 | (4.45 | ) | 27,998 | 0.72 | 3.00 | 0.73 | 61 | |||||||||||||||||||
| 13.31 | (4.04 | ) | 2,354 | 0.73 | 1.32 | (f) | 0.73 | 74 | ||||||||||||||||||
| 14.42 | (3.64 | ) | 30,992 | 0.83 | 3.58 | (f)(g) | 0.84 | 59 | ||||||||||||||||||
| 15.29 | 26.84 | 107,313 | 0.84 | 2.12 | 0.85 | 66 | ||||||||||||||||||||
SEE NOTES TO FINANCIAL STATEMENTS.
| OCTOBER 31, 2017 | J.P. MORGAN INTERNATIONAL EQUITY FUNDS | 107 | ||||||
Table of Contents
FINANCIAL HIGHLIGHTS
FOR THE PERIODS INDICATED (continued)
| Per share operating performance | ||||||||||||||||||||
| Investment operations | Distributions | |||||||||||||||||||
| Net asset value, beginning of period | Net investment (loss) (b) | Net realized and unrealized gains (losses) on investments | Total from investment operations | Net investment income | ||||||||||||||||
Intrepid International Fund | ||||||||||||||||||||
Class A | ||||||||||||||||||||
Year Ended October 31, 2017 | $ | 18.44 | $ | 0.33 | $ | 3.83 | $ | 4.16 | $ | (0.38 | ) | |||||||||
Year Ended October 31, 2016 | 19.36 | 0.40 | (f) | (0.99 | ) | (0.59 | ) | (0.33 | ) | |||||||||||
Year Ended October 31, 2015 | 19.49 | 0.34 | (f) | (0.26 | ) | 0.08 | (0.21 | ) | ||||||||||||
Year Ended October 31, 2014 | 19.79 | 0.39 | (f) | (0.45 | ) | (0.06 | ) | (0.24 | ) | |||||||||||
Year Ended October 31, 2013 | 15.90 | 0.25 | 3.88 | 4.13 | (0.24 | ) | ||||||||||||||
Class C | ||||||||||||||||||||
Year Ended October 31, 2017 | 18.57 | 0.22 | 3.87 | 4.09 | (0.26 | ) | ||||||||||||||
Year Ended October 31, 2016 | 19.52 | 0.28 | (f) | (0.97 | ) | (0.69 | ) | (0.26 | ) | |||||||||||
Year Ended October 31, 2015 | 19.63 | 0.23 | (f) | (0.24 | ) | (0.01 | ) | (0.10 | ) | |||||||||||
Year Ended October 31, 2014 | 19.92 | 0.36 | (f) | (0.52 | ) | (0.16 | ) | (0.13 | ) | |||||||||||
Year Ended October 31, 2013 | 16.00 | 0.17 | 3.90 | 4.07 | (0.15 | ) | ||||||||||||||
Class I (formerly Select Class) | ||||||||||||||||||||
Year Ended October 31, 2017 | 19.20 | 0.42 | 3.97 | 4.39 | (0.47 | ) | ||||||||||||||
Year Ended October 31, 2016 | 20.13 | 0.46 | (f) | (1.01 | ) | (0.55 | ) | (0.38 | ) | |||||||||||
Year Ended October 31, 2015 | 20.22 | 0.42 | (f) | (0.26 | ) | 0.16 | (0.25 | ) | ||||||||||||
Year Ended October 31, 2014 | 20.51 | 0.51 | (f) | (0.53 | ) | (0.02 | ) | (0.27 | ) | |||||||||||
Year Ended October 31, 2013 | 16.46 | 0.31 | 4.01 | 4.32 | (0.27 | ) | ||||||||||||||
Class R2 | ||||||||||||||||||||
Year Ended October 31, 2017 | 18.29 | 0.01 | 4.07 | 4.08 | (0.36 | ) | ||||||||||||||
Year Ended October 31, 2016 | 19.21 | 0.36 | (f) | (1.01 | ) | (0.65 | ) | (0.27 | ) | |||||||||||
Year Ended October 31, 2015 | 19.31 | 0.38 | (f) | (0.34 | ) | 0.04 | (0.14 | ) | ||||||||||||
Year Ended October 31, 2014 | 19.61 | 0.40 | (f) | (0.53 | ) | (0.13 | ) | (0.17 | ) | |||||||||||
Year Ended October 31, 2013 | 15.74 | 0.20 | 3.86 | 4.06 | (0.19 | ) | ||||||||||||||
Class R6 | ||||||||||||||||||||
Year Ended October 31, 2017 | 18.91 | 0.43 | 3.92 | 4.35 | (0.48 | ) | ||||||||||||||
Year Ended October 31, 2016 | 19.84 | 0.49 | (f) | (1.01 | ) | (0.52 | ) | (0.41 | ) | |||||||||||
May 29, 2015(g) through October 31, 2015 | 21.08 | 0.12 | (f) | (1.36 | ) | (1.24 | ) | — | ||||||||||||
| (a) | Annualized for periods less than one year, unless otherwise noted. |
| (b) | Calculated based upon average shares outstanding. |
| (c) | Not annualized for periods less than one year. |
| (d) | Includes adjustments in accordance with accounting principles generally accepted in the United States of America and as such, the net asset values for financial reporting purposes and the returns based upon those net asset values may differ from the net asset values and returns for shareholder transactions. |
| (e) | Includes interest expense, if applicable, which is less than 0.005% unless otherwise noted. |
| (f) | Net investment income (loss) may appear disproportionate among the classes due to the timing of recognition of income and changes in the relative size of the classes. |
| (g) | Commencement of offering of class of shares. |
SEE NOTES TO FINANCIAL STATEMENTS.
| 108 | J.P. MORGAN INTERNATIONAL EQUITY FUNDS | OCTOBER 31, 2017 | ||||
Table of Contents
| Ratios/Supplemental data | |||||||||||||||||||||||||
| Ratios to average net assets (a) | ||||||||||||||||||||||||||
| Net asset value, end of period | Total return (excludes sales charge) (c)(d) | Net assets, end of period (000’s) | Net expenses (e) | Net investment income (loss) | Expenses without waivers and reimbursements | Portfolio turnover rate (c) | ||||||||||||||||||||
| $ | 22.22 | 22.98 | % | $ | 232,530 | 1.21 | % | 1.66 | % | 1.22 | % | 82 | % | |||||||||||||
| 18.44 | (3.07 | ) | 164,327 | 1.25 | 2.21 | (f) | 1.29 | 38 | ||||||||||||||||||
| 19.36 | 0.45 | 152,834 | 1.29 | 1.75 | (f) | 1.49 | 33 | |||||||||||||||||||
| 19.49 | (0.33 | ) | 101,114 | 1.39 | 1.96 | (f) | 1.46 | 48 | ||||||||||||||||||
| 19.79 | 26.25 | 60,135 | 1.47 | 1.42 | 1.54 | 49 | ||||||||||||||||||||
| 22.40 | 22.30 | 1,773 | 1.75 | 1.07 | 1.81 | 82 | ||||||||||||||||||||
| 18.57 | (3.56 | ) | 2,287 | 1.75 | 1.52 | (f) | 1.87 | 38 | ||||||||||||||||||
| 19.52 | (0.05 | ) | 2,789 | 1.78 | 1.17 | (f) | 1.91 | 33 | ||||||||||||||||||
| 19.63 | (0.84 | ) | 1,318 | 1.89 | 1.79 | (f) | 1.96 | 48 | ||||||||||||||||||
| 19.92 | 25.60 | 1,131 | 1.98 | 0.94 | 2.04 | 49 | ||||||||||||||||||||
| 23.12 | 23.39 | 52,871 | 0.90 | 1.99 | 0.99 | 82 | ||||||||||||||||||||
| 19.20 | (2.73 | ) | 16,363 | 0.90 | 2.44 | (f) | 1.08 | 38 | ||||||||||||||||||
| 20.13 | 0.80 | 19,292 | 0.97 | 2.04 | (f) | 1.12 | 33 | |||||||||||||||||||
| 20.22 | (0.13 | ) | 15,963 | 1.14 | 2.47 | (f) | 1.21 | 48 | ||||||||||||||||||
| 20.51 | 26.56 | 13,916 | 1.23 | 1.68 | 1.29 | 49 | ||||||||||||||||||||
| 22.01 | 22.70 | 8,790 | 1.49 | 0.07 | 1.54 | 82 | ||||||||||||||||||||
| 18.29 | (3.36 | ) | 503 | 1.50 | 2.02 | (f) | 1.75 | 38 | ||||||||||||||||||
| 19.21 | 0.24 | 227 | 1.52 | 1.91 | (f) | 1.69 | 33 | |||||||||||||||||||
| 19.31 | (0.66 | ) | 98 | 1.64 | 2.03 | (f) | 1.71 | 48 | ||||||||||||||||||
| 19.61 | 26.02 | 98 | 1.72 | 1.16 | 1.79 | 49 | ||||||||||||||||||||
| 22.78 | 23.59 | 2,859,645 | 0.71 | 2.12 | 0.71 | 82 | ||||||||||||||||||||
| 18.91 | (2.59 | ) | 2,487,086 | 0.71 | 2.65 | (f) | 0.72 | 38 | ||||||||||||||||||
| 19.84 | (5.88 | ) | 1,854,941 | 0.73 | 1.47 | (f) | 0.74 | 33 | ||||||||||||||||||
SEE NOTES TO FINANCIAL STATEMENTS.
| OCTOBER 31, 2017 | J.P. MORGAN INTERNATIONAL EQUITY FUNDS | 109 | ||||||
Table of Contents
AS OF OCTOBER 31, 2017
1. Organization
JPMorgan Trust I (“JPM I”) and JPMorgan Trust II (“JPM II”) (collectively, the “Trusts”) were formed on November 12, 2004, as Delaware statutory trusts, pursuant to Declarations of Trust dated November 5, 2004 and are registered under the Investment Company Act of 1940, as amended (the “1940 Act”), as open-end management investment companies.
The following are 10 separate funds of the Trusts (collectively, the “Funds”) covered by this report:
| Classes Offered | Trust | Diversified/Non-Diversified | ||||
| Emerging Economies Fund | Class A, Class C, Class I*, Class R5 and Class R6 | JPM I | Diversified | |||
| Emerging Markets Equity Fund | Class A, Class C, Class I*, Class L**, Class R2***, Class R3***, Class R4***, Class R5 and Class R6 | JPM I | Diversified | |||
| Global Research Enhanced Index Fund | Class A****, Class C****, Class I* and Class R2**** | JPM I | Diversified | |||
| Global Unconstrained Equity Fund | Class A, Class C, Class I*, Class R2, Class R5 and Class R6 | JPM I | Diversified | |||
| International Equity Fund | Class A, Class C, Class I*, Class R2, Class R5 and Class R6 | JPM I | Diversified | |||
| International Equity Income Fund | Class A, Class C, Class I*, Class R2, Class R5 and Class R6 | JPM I | Diversified | |||
| International Research Enhanced Equity Fund | Class A, Class C***** and Class I* and Class R2***** | JPM II | Diversified | |||
| International Unconstrained Equity Fund | Class A, Class C, Class I*, Class R2, Class R5 and Class R6 | JPM I | Diversified | |||
| International Value Fund | Class A, Class C, Class I*, Class L**, Class R2, Class R5 and Class R6 | JPM I | Diversified | |||
| Intrepid International Fund | Class A, Class C, Class I*, Class L******, Class R2 and Class R6 | JPM I | Diversified |
| * | Effective April 3, 2017, Select Class was renamed Class I. |
| ** | Effective December 1, 2016, Institutional Class was renamed Class L and is publicly offered on a limited basis. |
| *** | Class R2, Class R3 and Class R4 commenced operations on July 31, 2017. |
| **** | Effective August 11, 2017, Class A, Class C and Class R2 liquidated. |
| ***** | Effective October 9, 2017, Class C and Class R2 liquidated. |
| ****** | Effective December 1, 2016, Institutional Class was renamed Class L and subsequently liquidated on December 8, 2016. |
As of October 9, 2017, Class A shares of the International Research Enhanced Equity Fund were publicly offered on a limited basis.
As of October 31, 2017, Class R2 shares of the Global Unconstrained Equity Fund were not publicly offered for investment.
The investment objective of Emerging Economies Fund is to seek long-term capital growth.
The investment objective of Emerging Markets Equity Fund is to seek to provide high total return from a portfolio of equity securities from emerging markets issuers.
The investment objective of Global Research Enhanced Index Fund, Global Unconstrained Equity Fund, International Research Enhanced Equity Fund and International Unconstrained Equity Fund is to seek to provide long-term capital appreciation.
The investment objective of International Equity Fund is to seek total return from long-term capital growth and income. Total return consists of capital growth and current income.
The investment objective of International Equity Income Fund is to seek to provide both current income and long-term capital appreciation.
The investment objective of International Value Fund is to seek to provide high total return from a portfolio of foreign company equity securities.
The investment objective of Intrepid International Fund is to seek to maximize long-term capital growth by investing primarily in equity securities in developed markets outside the U.S.
Class A Shares generally provide for a front-end sales charge while Class C Shares provide for a contingent deferred sales charge (“CDSC”). No sales charges are assessed with respect to Class I, Class L, Class R2, Class R3, Class R4, Class R5 and Class R6 Shares. Certain Class A Shares, for which front-end sales charges have been waived, may be subject to a CDSC as described in the Funds’ prospectus. Beginning on November 14, 2017, Class C Shares automatically convert to Class A Shares after ten years. All classes of shares have equal rights as to earnings, assets and voting privileges, except that each class may bear different transfer agency, sub-transfer agency (through April 2, 2017), distribution and shareholder servicing fees and each class has exclusive voting rights with respect to its distribution plan and shareholder servicing agreements. Effective April 3, 2017 sub-transfer agency and shareholder servicing fees were consolidated into a single service fee.
J.P. Morgan Investment Management Inc. (“JPMIM”), an indirect, wholly owned subsidiary of JPMorgan Chase & Co. (“JPMorgan”), acts as Adviser (the “Adviser”) and Administrator (the “Administrator”) to the Funds.
2. Significant Accounting Policies
The following is a summary of significant accounting policies followed by the Funds in the preparation of their financial statements. The Funds are investment companies and, accordingly, follow the investment company accounting and reporting guidance of the Financial Accounting Standards Board Accounting Standards Codification Topic 946 — Investment Companies, which is part of U.S. generally accepted accounting principles
| 110 | J.P. MORGAN INTERNATIONAL EQUITY FUNDS | OCTOBER 31, 2017 | ||||
Table of Contents
(“GAAP”). The preparation of financial statements in conformity with GAAP requires management to make estimates and assumptions that affect the reported amounts of assets and liabilities and disclosure of contingent assets and liabilities at the date of the financial statements and the reported amounts of increases and decreases in net assets from operations during the reporting period. Actual results could differ from those estimates.
A. Valuation of Investments — The valuation of investments is in accordance with GAAP and the Funds’ valuation policies set forth by and under the supervision and responsibility of the Board of Trustees (the “Board”), which established the following approach to valuation, as described more fully below: (i) investments for which market quotations are readily available shall be valued at such unadjusted quoted prices and (ii) all other investments for which market quotations are not readily available shall be valued at their fair value as determined in good faith by the Board.
The Administrator has established the J.P. Morgan Asset Management Americas Valuation Committee (“AVC”) to assist the Board with the oversight and monitoring of the valuation of the Funds’ investments. The Administrator implements the valuation policies of the Funds’ investments, as directed by the Board. The AVC oversees and carries out the policies for the valuation of investments held in the Funds. This includes monitoring the appropriateness of fair values based on results of ongoing valuation oversight, including but not limited to consideration of macro or security specific events, market events and pricing vendor and broker due diligence. The Administrator is responsible for discussing and assessing the potential impacts to the fair values on an ongoing basis, and at least on a quarterly basis with the AVC and the Board.
A market-based approach is primarily used to value the Funds’ investments. Investments for which market quotations are not readily available are fair valued by approved affiliated and unaffiliated pricing vendors or third party broker-dealers (collectively referred to as “Pricing Services”) or may be internally fair valued using methods set forth by the valuation policies approved by the Board. This may include related or comparable assets or liabilities, recent transactions, market multiples, book values, and other relevant information for the investment to determine the fair value of the investment. An income-based valuation approach may be used in which the anticipated future cash flows of the investment are discounted to calculate the fair value. Discounts may also be applied due to the nature or duration of any restrictions on the disposition of the investments. Valuations may be based upon current market prices of securities that are comparable in coupon, rating, maturity and industry. It is possible that the estimated values may differ significantly from the values that would have been used, had a ready market for the investments existed, and such differences could be material.
Equities and other exchange-traded instruments are valued at the last sale price or official market closing price on the primary exchange on which the instrument is traded before the net asset values (“NAV”) of the Funds are calculated on a valuation date. Certain foreign equity instruments, as well as certain derivatives with equity reference obligations, are valued by applying international fair value factors provided by approved Pricing Services. The factors seek to adjust the local closing price for movements of local markets post closing, but prior to the time the NAVs are calculated. Investments in open-end investment companies (the “Underlying Funds”) are valued at each Underlying Fund’s NAV per share as of the report date.
Futures are generally valued on the basis of available market quotations. Forward foreign currency exchange contracts are valued utilizing market quotations from approved Pricing Services.
Valuations reflected in this report are as of the report date. As a result, changes in valuation due to market events and/or issuer related events after the report date and prior to issuance of the report are not reflected herein.
The various inputs that are used in determining the valuation of the Funds’ investments are summarized into the three broad levels listed below.
| • | Level 1 — Unadjusted inputs using quoted prices in active markets for identical investments. |
| • | Level 2 — Other significant observable inputs including, but not limited to, quoted prices for similar investments, inputs other than quoted prices that are observable for investments (such as interest rates, prepayment speeds, credit risk, etc.) or other market corroborated inputs. |
| • | Level 3 — Significant inputs based on the best information available in the circumstances, to the extent observable inputs are not available (including the Funds’ assumptions in determining the fair value of investments). |
A financial instrument’s level within the fair value hierarchy is based on the lowest level of any input, both individually and in the aggregate, that is significant to the fair value measurement. The inputs or methodology used for valuing instruments are not necessarily an indication of the risk associated with investing in those instruments.
| OCTOBER 31, 2017 | J.P. MORGAN INTERNATIONAL EQUITY FUNDS | 111 | ||||||
Table of Contents
NOTES TO FINANCIAL STATEMENTS
AS OF OCTOBER 31, 2017 (continued)
The following tables represent each valuation input as presented on the Schedules of Portfolio Investments (“SOIs”) (amounts in thousands):
Emerging Economies Fund
| Level 1 Quoted prices | Level 2 Other significant observable inputs | Level 3 Significant unobservable inputs | Total | |||||||||||||
Investments in Securities | ||||||||||||||||
Common Stocks | ||||||||||||||||
Argentina | $ | 13,796 | $ | — | $ | — | $ | 13,796 | ||||||||
Brazil | 180,892 | — | — | 180,892 | ||||||||||||
China | 90,737 | 373,712 | — | 464,449 | ||||||||||||
Hong Kong | — | 67,091 | — | 67,091 | ||||||||||||
Hungary | — | 30,590 | — | 30,590 | ||||||||||||
India | — | 51,783 | — | 51,783 | ||||||||||||
Indonesia | — | 24,992 | — | 24,992 | ||||||||||||
Luxembourg | 6,606 | — | — | 6,606 | ||||||||||||
Malaysia | — | 52,946 | — | 52,946 | ||||||||||||
Mexico | 6,302 | — | — | 6,302 | ||||||||||||
Panama | 25,459 | — | — | 25,459 | ||||||||||||
Poland | 3,926 | 37,703 | — | 41,629 | ||||||||||||
Qatar | — | 6,782 | — | 6,782 | ||||||||||||
Russia | 70,765 | 81,395 | — | 152,160 | ||||||||||||
Singapore | — | 11,895 | — | 11,895 | ||||||||||||
South Africa | — | 30,285 | — | 30,285 | ||||||||||||
South Korea | 24,343 | 329,871 | — | 354,214 | ||||||||||||
Taiwan | 22,801 | 211,008 | — | 233,809 | ||||||||||||
Thailand | 81,138 | — | — | 81,138 | ||||||||||||
Turkey | — | 97,803 | — | 97,803 | ||||||||||||
United States | 10,353 | — | — | 10,353 | ||||||||||||
Vietnam | 7,456 | — | — | 7,456 | ||||||||||||
|
|
|
|
|
|
|
| |||||||||
Total Common Stocks | 544,574 | 1,407,856 | — | 1,952,430 | ||||||||||||
|
|
|
|
|
|
|
| |||||||||
Rights | ||||||||||||||||
Taiwan | — | — | (a) | — | — | (a) | ||||||||||
Short-Term Investment | ||||||||||||||||
Investment Company | 84,272 | — | — | 84,272 | ||||||||||||
|
|
|
|
|
|
|
| |||||||||
Total Investments in Securities | $ | 628,846 | $ | 1,407,856 | $ | — | $ | 2,036,702 | ||||||||
|
|
|
|
|
|
|
| |||||||||
Appreciation in Other Financial Instruments | ||||||||||||||||
Futures Contracts | $ | 564 | $ | — | $ | — | $ | 564 | ||||||||
|
|
|
|
|
|
|
| |||||||||
| 112 | J.P. MORGAN INTERNATIONAL EQUITY FUNDS | OCTOBER 31, 2017 | ||||
Table of Contents
Emerging Markets Equity Fund
| Level 1 Quoted prices | Level 2 Other significant observable inputs | Level 3 Significant unobservable inputs | Total | |||||||||||||
Investments in Securities | ||||||||||||||||
Common Stocks | ||||||||||||||||
Argentina | $ | 62,699 | $ | — | $ | — | $ | 62,699 | ||||||||
Australia | — | 23,282 | — | 23,282 | ||||||||||||
Brazil | 464,826 | — | — | 464,826 | ||||||||||||
China | 458,068 | 701,928 | — | 1,159,996 | ||||||||||||
Egypt | 29,860 | — | — | 29,860 | ||||||||||||
Hong Kong | — | 280,702 | — | 280,702 | ||||||||||||
India | 124,396 | 603,651 | — | 728,047 | ||||||||||||
Indonesia | — | 123,894 | — | 123,894 | ||||||||||||
Mexico | 98,749 | — | — | 98,749 | ||||||||||||
Panama | 49,888 | — | — | 49,888 | ||||||||||||
Peru | 64,888 | — | — | 64,888 | ||||||||||||
Russia | — | 184,138 | — | 184,138 | ||||||||||||
South Africa | 119,868 | 156,314 | — | 276,182 | ||||||||||||
South Korea | 28,202 | 211,229 | — | 239,431 | ||||||||||||
Spain | — | 25,917 | — | 25,917 | ||||||||||||
Taiwan | 188,279 | 151,840 | — | 340,119 | ||||||||||||
Thailand | — | 33,988 | — | 33,988 | ||||||||||||
Turkey | — | 14,648 | — | 14,648 | ||||||||||||
United States | 106,061 | — | — | 106,061 | ||||||||||||
|
|
|
|
|
|
|
| |||||||||
Total Common Stocks | 1,795,784 | 2,511,531 | — | 4,307,315 | ||||||||||||
|
|
|
|
|
|
|
| |||||||||
Warrants | ||||||||||||||||
United States | — | 24,582 | — | 24,582 | ||||||||||||
Short-Term Investment | ||||||||||||||||
Investment Company | 128,728 | — | — | 128,728 | ||||||||||||
|
|
|
|
|
|
|
| |||||||||
Total Investments in Securities | $ | 1,924,512 | $ | 2,536,113 | $ | — | $ | 4,460,625 | ||||||||
|
|
|
|
|
|
|
| |||||||||
| OCTOBER 31, 2017 | J.P. MORGAN INTERNATIONAL EQUITY FUNDS | 113 | ||||||
Table of Contents
NOTES TO FINANCIAL STATEMENTS
AS OF OCTOBER 31, 2017 (continued)
Global Research Enhanced Index Fund
| Level 1 Quoted prices | Level 2 Other significant observable inputs | Level 3 Significant unobservable inputs | Total | |||||||||||||
Investments in Securities | ||||||||||||||||
Common Stocks | ||||||||||||||||
Australia | $ | — | $ | 217,724 | $ | — | $ | 217,724 | ||||||||
Austria | — | 11,660 | — | 11,660 | ||||||||||||
Belgium | — | 42,825 | — | 42,825 | ||||||||||||
Bermuda | 6,740 | — | — | 6,740 | ||||||||||||
Canada | 285,263 | — | — | 285,263 | ||||||||||||
China | — | 5,150 | — | 5,150 | ||||||||||||
Denmark | — | 54,407 | — | 54,407 | ||||||||||||
Finland | — | 21,095 | — | 21,095 | ||||||||||||
France | 12,738 | 358,389 | — | 371,127 | ||||||||||||
Germany | 6,877 | 292,961 | — | 299,838 | ||||||||||||
Hong Kong | 679 | 100,691 | — | 101,370 | ||||||||||||
Ireland | 12,814 | 11,880 | — | 24,694 | ||||||||||||
Israel | 2,136 | — | — | 2,136 | ||||||||||||
Italy | — | 65,743 | — | 65,743 | ||||||||||||
Japan | 12,960 | 745,772 | — | 758,732 | ||||||||||||
Jersey | — | 4,812 | — | 4,812 | ||||||||||||
Luxembourg | — | 10,523 | — | 10,523 | ||||||||||||
Macau | — | 812 | — | 812 | ||||||||||||
Netherlands | 16,820 | 179,814 | — | 196,634 | ||||||||||||
New Zealand | 827 | 5,409 | — | 6,236 | ||||||||||||
Norway | — | 7,286 | — | 7,286 | ||||||||||||
Singapore | — | 36,141 | — | 36,141 | ||||||||||||
Spain | — | 121,985 | — | 121,985 | ||||||||||||
Sweden | — | 52,665 | — | 52,665 | ||||||||||||
Switzerland | — | 245,828 | — | 245,828 | ||||||||||||
United Kingdom | 2,667 | 492,381 | — | 495,048 | ||||||||||||
United States | 5,068,634 | 16,261 | — | 5,084,895 | ||||||||||||
|
|
|
|
|
|
|
| |||||||||
Total Common Stocks | 5,429,155 | 3,102,214 | — | 8,531,369 | ||||||||||||
|
|
|
|
|
|
|
| |||||||||
Short-Term Investment | ||||||||||||||||
Investment Company | 105,120 | — | — | 105,120 | ||||||||||||
|
|
|
|
|
|
|
| |||||||||
Total Investments in Securities | $ | 5,534,275 | $ | 3,102,214 | $ | — | $ | 8,636,489 | ||||||||
|
|
|
|
|
|
|
| |||||||||
Appreciation in Other Financial Instruments | ||||||||||||||||
Futures Contracts | $ | — | $ | 3,513 | $ | — | $ | 3,513 | ||||||||
|
|
|
|
|
|
|
| |||||||||
| 114 | J.P. MORGAN INTERNATIONAL EQUITY FUNDS | OCTOBER 31, 2017 | ||||
Table of Contents
Global Unconstrained Equity Fund
| Level 1 Quoted prices | Level 2 Other significant observable inputs | Level 3 Significant unobservable inputs | Total | |||||||||||||
Investments in Securities | ||||||||||||||||
Common Stocks | ||||||||||||||||
Austria | $ | — | $ | 63 | $ | — | $ | 63 | ||||||||
Canada | 39 | — | — | 39 | ||||||||||||
China | 149 | 135 | — | 284 | ||||||||||||
France | — | 211 | — | 211 | ||||||||||||
Germany | 79 | — | — | 79 | ||||||||||||
Hong Kong | — | 80 | — | 80 | ||||||||||||
India | 74 | — | — | 74 | ||||||||||||
Italy | — | 35 | — | 35 | ||||||||||||
Japan | — | 283 | — | 283 | ||||||||||||
Luxembourg | — | 39 | — | 39 | ||||||||||||
Netherlands | — | 70 | — | 70 | ||||||||||||
Singapore | — | 72 | — | 72 | ||||||||||||
South Africa | — | 81 | — | 81 | ||||||||||||
Switzerland | — | 163 | — | 163 | ||||||||||||
United Kingdom | — | 251 | — | 251 | ||||||||||||
United States | 1,668 | — | — | 1,668 | ||||||||||||
|
|
|
|
|
|
|
| |||||||||
Total Investments in Securities | $ | 2,009 | $ | 1,483 | $ | — | $ | 3,492 | ||||||||
|
|
|
|
|
|
|
| |||||||||
International Equity Fund
| Level 1 Quoted prices | Level 2 Other significant observable inputs | Level 3 Significant unobservable inputs | Total | |||||||||||||
Investments in Securities | ||||||||||||||||
Common Stocks | ||||||||||||||||
Australia | $ | — | $ | 46,328 | $ | — | $ | 46,328 | ||||||||
Belgium | — | 49,104 | — | 49,104 | ||||||||||||
China | 35,976 | 105,515 | — | 141,491 | ||||||||||||
Denmark | — | 46,008 | — | 46,008 | ||||||||||||
France | — | 533,195 | — | 533,195 | ||||||||||||
Germany | 57,453 | 340,438 | — | 397,891 | ||||||||||||
Hong Kong | — | 180,431 | — | 180,431 | ||||||||||||
India | 45,171 | — | — | 45,171 | ||||||||||||
Indonesia | — | 24,080 | — | 24,080 | ||||||||||||
Japan | — | 804,353 | — | 804,353 | ||||||||||||
Macau | — | 25,697 | — | 25,697 | ||||||||||||
Netherlands | — | 252,917 | — | 252,917 | ||||||||||||
Singapore | — | 48,778 | — | 48,778 | ||||||||||||
South Africa | — | 37,840 | — | 37,840 | ||||||||||||
South Korea | 22,511 | 85,791 | — | 108,302 | ||||||||||||
Spain | — | 59,570 | — | 59,570 | ||||||||||||
Sweden | — | 59,141 | — | 59,141 | ||||||||||||
Switzerland | — | 421,731 | — | 421,731 | ||||||||||||
Taiwan | 43,194 | — | — | 43,194 | ||||||||||||
United Kingdom | 49,550 | 577,620 | — | 627,170 | ||||||||||||
United States | — | 29,568 | — | 29,568 | ||||||||||||
|
|
|
|
|
|
|
| |||||||||
Total Common Stocks | 253,855 | 3,728,105 | — | 3,981,960 | ||||||||||||
|
|
|
|
|
|
|
| |||||||||
Short-Term Investment | ||||||||||||||||
Investment Company | 24,698 | — | — | 24,698 | ||||||||||||
|
|
|
|
|
|
|
| |||||||||
Total Investments in Securities | $ | 278,553 | $ | 3,728,105 | $ | — | $ | 4,006,658 | ||||||||
|
|
|
|
|
|
|
| |||||||||
| OCTOBER 31, 2017 | J.P. MORGAN INTERNATIONAL EQUITY FUNDS | 115 | ||||||
Table of Contents
NOTES TO FINANCIAL STATEMENTS
AS OF OCTOBER 31, 2017 (continued)
International Equity Income Fund
| Level 1 Quoted prices | Level 2 Other significant observable inputs | Level 3 Significant unobservable inputs | Total | |||||||||||||
Investments in Securities | ||||||||||||||||
Common Stocks | ||||||||||||||||
Australia | $ | — | $ | 1,862 | $ | — | $ | 1,862 | ||||||||
Austria | 1,518 | — | — | 1,518 | ||||||||||||
Belgium | — | 1,758 | — | 1,758 | ||||||||||||
Canada | 2,020 | — | — | 2,020 | ||||||||||||
China | — | 3,199 | — | 3,199 | ||||||||||||
Czech Republic | 1,294 | — | — | 1,294 | ||||||||||||
Denmark | — | 3,627 | — | 3,627 | ||||||||||||
Finland | — | 6,260 | — | 6,260 | ||||||||||||
France | — | 19,481 | — | 19,481 | ||||||||||||
Germany | — | 20,261 | — | 20,261 | ||||||||||||
Hong Kong | — | 1,917 | — | 1,917 | ||||||||||||
Ireland | 1,863 | — | — | 1,863 | ||||||||||||
Italy | — | 5,271 | — | 5,271 | ||||||||||||
Japan | 4,214 | 16,852 | — | 21,066 | ||||||||||||
Netherlands | 3,652 | 11,750 | — | 15,402 | ||||||||||||
New Zealand | — | 2,216 | — | 2,216 | ||||||||||||
Norway | — | 5,519 | — | 5,519 | ||||||||||||
Russia | — | 6,319 | — | 6,319 | ||||||||||||
Singapore | — | 2,016 | — | 2,016 | ||||||||||||
South Korea | — | 4,316 | — | 4,316 | ||||||||||||
Spain | — | 4,110 | — | 4,110 | ||||||||||||
Switzerland | — | 17,767 | — | 17,767 | ||||||||||||
Taiwan | 2,673 | — | — | 2,673 | ||||||||||||
United Kingdom | 10,306 | 33,726 | — | 44,032 | ||||||||||||
United States | — | 2,034 | — | 2,034 | ||||||||||||
|
|
|
|
|
|
|
| |||||||||
Total Common Stocks | 27,540 | 170,261 | — | 197,801 | ||||||||||||
|
|
|
|
|
|
|
| |||||||||
Short-Term Investment | ||||||||||||||||
Investment Company | 2,218 | — | — | 2,218 | ||||||||||||
|
|
|
|
|
|
|
| |||||||||
Total Investments in Securities | $ | 29,758 | $ | 170,261 | $ | — | $ | 200,019 | ||||||||
|
|
|
|
|
|
|
| |||||||||
Appreciation in Other Financial Instruments | ||||||||||||||||
Forward Foreign Currency Exchange Contracts | $ | — | $ | 26 | $ | — | $ | 26 | ||||||||
|
|
|
|
|
|
|
| |||||||||
Depreciation in Other Financial Instruments | ||||||||||||||||
Forward Foreign Currency Exchange Contracts | $ | — | $ | (354 | ) | $ | — | $ | (354 | ) | ||||||
|
|
|
|
|
|
|
| |||||||||
| 116 | J.P. MORGAN INTERNATIONAL EQUITY FUNDS | OCTOBER 31, 2017 | ||||
Table of Contents
International Research Enhanced Equity Fund
| Level 1 Quoted prices | Level 2 Other significant observable inputs | Level 3 Significant unobservable inputs | Total | |||||||||||||
Investments in Securities | ||||||||||||||||
Common Stocks | ||||||||||||||||
Australia | $ | — | $ | 230,742 | $ | — | (b) | $ | 230,742 | |||||||
Austria | — | 31,790 | — | 31,790 | ||||||||||||
Belgium | — | 57,688 | — | 57,688 | ||||||||||||
Denmark | — | 62,799 | — | 62,799 | ||||||||||||
Finland | 24,092 | 65,250 | — | 89,342 | ||||||||||||
France | 39,134 | 511,696 | — | 550,830 | ||||||||||||
Germany | 23,374 | 481,097 | — | 504,471 | ||||||||||||
Hong Kong | — | 107,810 | — | 107,810 | ||||||||||||
Ireland | 25,131 | — | — | 25,131 | ||||||||||||
Israel | 11,340 | — | — | 11,340 | ||||||||||||
Italy | — | 140,295 | — | 140,295 | ||||||||||||
Japan | — | 1,058,646 | — | 1,058,646 | ||||||||||||
Luxembourg | — | 29,394 | — | 29,394 | ||||||||||||
Netherlands | — | 257,583 | — | 257,583 | ||||||||||||
Norway | — | 18,955 | — | 18,955 | ||||||||||||
Singapore | — | 44,055 | — | 44,055 | ||||||||||||
Spain | — | 118,733 | — | 118,733 | ||||||||||||
Sweden | — | 35,064 | — | 35,064 | ||||||||||||
Switzerland | — | 457,529 | — | 457,529 | ||||||||||||
United Kingdom | — | 775,244 | — | 775,244 | ||||||||||||
United States | — | 41,536 | — | 41,536 | ||||||||||||
|
|
|
|
|
|
|
| |||||||||
Total Common Stocks | 123,071 | 4,525,906 | — | (b) | 4,648,977 | |||||||||||
|
|
|
|
|
|
|
| |||||||||
Debt Securities | ||||||||||||||||
Corporate Bonds | ||||||||||||||||
Brazil | — | — | — | (b) | — | (b) | ||||||||||
Short-Term Investment | ||||||||||||||||
Investment Company | 242,928 | — | — | 242,928 | ||||||||||||
|
|
|
|
|
|
|
| |||||||||
Total Investments in Securities | $ | 365,999 | $ | 4,525,906 | $ | — | (b) | $ | 4,891,905 | |||||||
|
|
|
|
|
|
|
| |||||||||
Appreciation in Other Financial Instruments | ||||||||||||||||
Futures Contracts | $ | — | $ | 9,050 | $ | — | $ | 9,050 | ||||||||
|
|
|
|
|
|
|
| |||||||||
Depreciation in Other Financial Instruments | ||||||||||||||||
Futures Contracts | $ | — | $ | (425 | ) | $ | — | $ | (425 | ) | ||||||
|
|
|
|
|
|
|
| |||||||||
| OCTOBER 31, 2017 | J.P. MORGAN INTERNATIONAL EQUITY FUNDS | 117 | ||||||
Table of Contents
NOTES TO FINANCIAL STATEMENTS
AS OF OCTOBER 31, 2017 (continued)
International Unconstrained Equity Fund
| Level 1 Quoted prices | Level 2 Other significant observable inputs | Level 3 Significant unobservable inputs | Total | |||||||||||||
Investments in Securities | ||||||||||||||||
Common Stocks | ||||||||||||||||
Canada | $ | 10,128 | $ | — | $ | — | $ | 10,128 | ||||||||
China | 10,081 | 26,947 | — | 37,028 | ||||||||||||
Denmark | — | 4,964 | — | 4,964 | ||||||||||||
Finland | 5,902 | — | — | 5,902 | ||||||||||||
France | — | 7,239 | — | 7,239 | ||||||||||||
Germany | 14,457 | 23,859 | — | 38,316 | ||||||||||||
Hong Kong | — | 23,946 | — | 23,946 | ||||||||||||
India | 9,400 | — | — | 9,400 | ||||||||||||
Indonesia | — | 7,138 | — | 7,138 | ||||||||||||
Italy | — | 6,710 | — | 6,710 | ||||||||||||
Japan | — | 41,989 | — | 41,989 | ||||||||||||
Netherlands | — | 31,410 | — | 31,410 | ||||||||||||
South Africa | — | 7,058 | — | 7,058 | ||||||||||||
South Korea | — | 17,276 | — | 17,276 | ||||||||||||
Spain | — | 7,830 | — | 7,830 | ||||||||||||
Switzerland | — | 28,722 | — | 28,722 | ||||||||||||
United Kingdom | — | 55,869 | — | 55,869 | ||||||||||||
|
|
|
|
|
|
|
| |||||||||
Total Common Stocks | 49,968 | 290,957 | — | 340,925 | ||||||||||||
|
|
|
|
|
|
|
| |||||||||
Short-Term Investment | ||||||||||||||||
Investment Company | 14,714 | — | — | 14,714 | ||||||||||||
|
|
|
|
|
|
|
| |||||||||
Total Investments in Securities | $ | 64,682 | $ | 290,957 | $ | — | $ | 355,639 | ||||||||
|
|
|
|
|
|
|
| |||||||||
International Value Fund
| Level 1 Quoted prices | Level 2 Other significant observable inputs | Level 3 Significant unobservable inputs | Total | |||||||||||||
Investments in Securities | ||||||||||||||||
Common Stocks | ||||||||||||||||
Australia | $ | — | $ | 26,428 | $ | — | $ | 26,428 | ||||||||
Austria | — | 10,196 | — | 10,196 | ||||||||||||
Belgium | — | 18,309 | — | 18,309 | ||||||||||||
Canada | 11,081 | — | — | 11,081 | ||||||||||||
China | — | 7,059 | — | 7,059 | ||||||||||||
Finland | — | 9,957 | — | 9,957 | ||||||||||||
France | 11,170 | 114,057 | — | 125,227 | ||||||||||||
Germany | — | 60,639 | — | 60,639 | ||||||||||||
Ireland | 7,036 | — | — | 7,036 | ||||||||||||
Israel | 5,631 | — | — | 5,631 | ||||||||||||
Italy | — | 28,227 | — | 28,227 | ||||||||||||
Japan | — | 177,783 | — | 177,783 | ||||||||||||
Luxembourg | — | 11,191 | — | 11,191 | ||||||||||||
Netherlands | — | 59,586 | — | 59,586 | ||||||||||||
Norway | — | 7,744 | — | 7,744 | ||||||||||||
Singapore | — | 11,051 | — | 11,051 | ||||||||||||
South Korea | — | 7,703 | — | 7,703 | ||||||||||||
Spain | — | 23,537 | — | 23,537 | ||||||||||||
Sweden | — | 7,436 | — | 7,436 | ||||||||||||
Switzerland | — | 66,211 | — | 66,211 | ||||||||||||
United Kingdom | — | 88,068 | — | 88,068 | ||||||||||||
United States | — | 11,188 | — | 11,188 | ||||||||||||
|
|
|
|
|
|
|
| |||||||||
Total Common Stocks | 34,918 | 746,370 | — | 781,288 | ||||||||||||
|
|
|
|
|
|
|
| |||||||||
| 118 | J.P. MORGAN INTERNATIONAL EQUITY FUNDS | OCTOBER 31, 2017 | ||||
Table of Contents
International Value Fund (continued)
| Level 1 Quoted prices | Level 2 Other significant observable inputs | Level 3 Significant unobservable inputs | Total | |||||||||||||
Short-Term Investment | ||||||||||||||||
Investment Company | $ | 8,228 | $ | — | $ | — | $ | 8,228 | ||||||||
|
|
|
|
|
|
|
| |||||||||
Total Investments in Securities | $ | 43,146 | $ | 746,370 | $ | — | $ | 789,516 | ||||||||
|
|
|
|
|
|
|
| |||||||||
Appreciation in Other Financial Instruments | ||||||||||||||||
Forward Foreign Currency Exchange Contracts | $ | — | $ | 3,704 | $ | — | $ | 3,704 | ||||||||
|
|
|
|
|
|
|
| |||||||||
Depreciation in Other Financial Instruments | ||||||||||||||||
Forward Foreign Currency Exchange Contracts | $ | — | $ | (3,534 | ) | $ | — | $ | (3,534 | ) | ||||||
|
|
|
|
|
|
|
| |||||||||
Intrepid International Fund
| Level 1 Quoted prices | Level 2 Other significant observable inputs | Level 3 Significant unobservable inputs | Total | |||||||||||||
Investments in Securities | ||||||||||||||||
Common Stocks | ||||||||||||||||
Australia | $ | — | $ | 203,818 | $ | — | $ | 203,818 | ||||||||
Austria | — | 36,667 | — | 36,667 | ||||||||||||
Belgium | — | 43,403 | — | 43,403 | ||||||||||||
China | — | 27,352 | — | 27,352 | ||||||||||||
Denmark | 5,747 | 119,943 | — | 125,690 | ||||||||||||
Finland | — | 12,636 | — | 12,636 | ||||||||||||
France | 6,340 | 312,056 | — | 318,396 | ||||||||||||
Germany | — | 210,207 | — | 210,207 | ||||||||||||
Hong Kong | 9,549 | 34,851 | — | 44,400 | ||||||||||||
Israel | 23,399 | — | — | 23,399 | ||||||||||||
Italy | — | 33,785 | — | 33,785 | ||||||||||||
Japan | — | 728,147 | — | 728,147 | ||||||||||||
Luxembourg | — | 27,489 | — | 27,489 | ||||||||||||
Netherlands | — | 165,027 | — | 165,027 | ||||||||||||
Norway | 11,895 | 14,016 | — | 25,911 | ||||||||||||
Singapore | — | 67,405 | — | 67,405 | ||||||||||||
South Africa | — | 21,508 | — | 21,508 | ||||||||||||
Spain | — | 62,543 | — | 62,543 | ||||||||||||
Sweden | — | 109,300 | — | 109,300 | ||||||||||||
Switzerland | — | 331,338 | — | 331,338 | ||||||||||||
United Kingdom | 73,819 | 369,121 | — | 442,940 | ||||||||||||
United States | — | 24,545 | — | 24,545 | ||||||||||||
|
|
|
|
|
|
|
| |||||||||
Total Common Stocks | 130,749 | 2,955,157 | — | 3,085,906 | ||||||||||||
|
|
|
|
|
|
|
| |||||||||
Short-Term Investment | ||||||||||||||||
Investment Company | 53,390 | — | — | 53,390 | ||||||||||||
|
|
|
|
|
|
|
| |||||||||
Total Investments in Securities | $ | 184,139 | $ | 2,955,157 | $ | — | $ | 3,139,296 | ||||||||
|
|
|
|
|
|
|
| |||||||||
Appreciation in Other Financial Instruments | ||||||||||||||||
Futures Contracts | $ | — | $ | 588 | $ | — | $ | 588 | ||||||||
|
|
|
|
|
|
|
| |||||||||
Depreciation in Other Financial Instruments | ||||||||||||||||
Futures Contracts | $ | — | $ | (48 | ) | $ | — | $ | (48 | ) | ||||||
|
|
|
|
|
|
|
| |||||||||
| (a) | Value is zero. |
| (b) | Amount rounds to less than 500. |
For the Emerging Economies Fund, transfers from level 1 to level 2 in the amount of approximately $14,600,000 and from level 2 to level 1 in the amount of approximately $18,262,000 are due to the application and non-application of the fair value factors to certain securities during the year ended October 31, 2017.
| OCTOBER 31, 2017 | J.P. MORGAN INTERNATIONAL EQUITY FUNDS | 119 | ||||||
Table of Contents
NOTES TO FINANCIAL STATEMENTS
AS OF OCTOBER 31, 2017 (continued)
For the Emerging Markets Equity Fund, transfers from level 1 to level 2 in the amount of approximately $31,497,000 and from level 2 to level 1 in the amount of approximately $93,359,000 are due to the application and non-application of the fair value factors to certain securities during the year ended October 31, 2017.
For the International Equity Fund, transfers from level 1 to level 2 in the amount of approximately $60,798,000 and from level 2 to level 1 in the amount of approximately $55,082,000 are due to the application and non-application of the fair value factors to certain securities during the year ended October 31, 2017.
For the International Equity Income Fund, transfers from level 1 to level 2 in the amount of approximately $4,725,000 and from level 2 to level 1 in the amount of approximately $6,401,000 are due to the application and non-application of the fair value factors to certain securities during the year ended October 31, 2017.
For the International Value Fund, transfers from level 1 to level 2 in the amount of approximately $13,046,000 and from level 2 to level 1 in the amount of approximately $19,348,000 are due to the application and non-application of the fair value factors to certain securities during the year ended October 31, 2017.
For the Global Research Enhanced Index Fund, International Research Enhanced Equity Fund, International Unconstrained Equity Fund and Intrepid International Fund, there were no significant transfers among any levels during the year ended October 31, 2017.
For the Global Unconstrained Equity Fund there were no transfers among any levels during the year ended October 31, 2017.
B. Restricted Securities — Certain securities held by the Funds may be subject to legal or contractual restrictions on resale. Restricted securities generally are resold in transactions exempt from registration under the Securities Act of 1933 (the “Securities Act”). Disposal of these securities may involve time-consuming negotiations and expense. Prompt sale at the current valuation may be difficult and could adversely affect the net asset value of the Funds.
As of October 31, 2017, the Funds had no investments in restricted securities other than securities sold to the Funds under Rule 144A or Regulation S under the Securities Act.
C. Futures Contracts — Emerging Economies Fund, Global Research Enhanced Index Fund, International Research Enhanced Equity Fund, International Value Fund and Intrepid International Fund used index futures contracts to gain or reduce exposure to the stock market, maintain liquidity or minimize transaction costs. The Funds also bought futures contracts to invest incoming cash in the market or sold futures in response to cash outflows, thereby simulating an invested position in the underlying index.
Futures contracts provide for the delayed delivery of the underlying instrument at a fixed price or are settled for a cash amount based on the change in the value of the underlying instrument at a specific date in the future. Upon entering into a futures contract, the Funds are required to deposit with the broker, cash or securities in an amount equal to a certain percentage of the contract amount, which is referred to as the initial margin deposit. Subsequent payments, referred to as variation margin, are made or received by the Funds periodically and are based on changes in the market value of open futures contracts. Changes in the market value of open futures contracts are recorded as Change in net unrealized appreciation/depreciation on the Statements of Operations. Realized gains or losses, representing the difference between the value of the contract at the time it was opened and the value at the time it was closed, are reported on the Statements of Operations at the closing or expiration of the futures contract. Securities deposited as initial margin are designated on the SOIs and cash deposited is recorded on the Statements of Assets and Liabilities. A receivable from and/or a payable to brokers for the daily variation margin is also recorded on the Statements of Assets and Liabilities.
The Funds may be subject to the risk that the change in the value of the futures contract may not correlate perfectly with the underlying instrument. Use of long futures contracts subjects the Funds to risk of loss in excess of the amounts shown on the Statements of Assets and Liabilities, up to the notional amount of the futures contracts. Use of short futures contracts subjects the Funds to unlimited risk of loss. The Funds may enter into futures contracts only on exchanges or boards of trade. The exchange or board of trade acts as the counterparty to each futures transaction; therefore, the Funds’ credit risk is limited to failure of the exchange or board of trade. Under some circumstances, futures exchanges may establish daily limits on the amount that the price of a futures contract can vary from the previous day’s settlement price, which could effectively prevent liquidation of positions.
The Funds’ futures contracts are not subject to master netting arrangements (the right to close out all transactions traded with a counterparty and net amounts owed or due across transactions).
The table below discloses the volume of the Funds’ futures contracts activity during the year ended October 31, 2017 (amounts in thousands):
| Emerging Economies Fund | Global Research Enhanced Index Fund | International Research Enhanced Equity Fund | International Value Fund | Intrepid International Fund | ||||||||||||||||
Futures Contracts: | ||||||||||||||||||||
Average Notional Balance Long | $ | 10,876 | $ | 38,730 | (a) | $ | 72,726 | $ | 4,750 | $ | 13,417 | |||||||||
Ending Notional Balance Long | 35,581 | 62,195 | 352,214 | — | 30,050 | |||||||||||||||
| (a) | For the period from March 1, 2017 to October 31, 2017. |
| 120 | J.P. MORGAN INTERNATIONAL EQUITY FUNDS | OCTOBER 31, 2017 | ||||
Table of Contents
D. Forward Foreign Currency Exchange Contracts — Emerging Economies Fund, Emerging Markets Equity Fund, Global Unconstrained Equity Fund, International Equity Fund, International Equity Income Fund, International Research Enhanced Equity Fund, International Unconstrained Equity Fund, International Value Fund and Intrepid International Fund may be exposed to foreign currency risks associated with some or all of their portfolio investments and used forward foreign currency exchange contracts to hedge or manage certain of these exposures as part of an investment strategy. Emerging Economies Fund, Emerging Markets Equity Fund, Global Unconstrained Equity Fund, International Equity Fund, International Equity Income Fund, International Research Enhanced Equity Fund, International Unconstrained Equity Fund, International Value Fund and Intrepid International Fund also bought forward currency exchange contracts to gain exposure to currencies. Forward foreign currency exchange contracts represent obligations to purchase or sell foreign currency on a specified future date at a price fixed at the time the contracts are entered into. Non-deliverable forward foreign currency exchange contracts are settled with the counterparty in U.S. dollars without the delivery of foreign currency.
The values of the forward foreign currency exchange contracts are adjusted daily based on the applicable exchange rate of the underlying currency. Changes in the value of these contracts are recorded as unrealized appreciation or depreciation until the contract settlement date. When the forward foreign currency exchange contract is closed, the Funds record a realized gain or loss equal to the difference between the value at the time the contract was opened and the value at the time it was closed. The Funds also record a realized gain or loss when a forward foreign currency exchange contract offsets another forward foreign currency exchange contract with the same counterparty upon settlement.
The Funds may be required to post or receive collateral for non-deliverable forward foreign currency exchange contracts.
The table below discloses the volume of the Funds’ forward foreign currency exchange contracts activity during the year ended October 31, 2017 (amounts in thousands):
| Emerging Economies Fund | Emerging Equity Fund | Global Unconstrained Equity Fund | International Equity Fund | International Equity Income Fund | International Enhanced | International Unconstrained Equity Fund | International Value Fund | Intrepid International Fund | ||||||||||||||||||||||||||||
Forward Foreign Currency Exchange Contracts: |
| |||||||||||||||||||||||||||||||||||
Average Settlement Value Purchased | $ | 3,175 | (a) | $ | 4,501 | (b) | $ | 5 | (c) | $ | 15,947 | (d) | $ | 2,411 | $ | 1,370 | (d) | $ | 141 | (e) | $ | 228,704 | $ | 13,347 | (c) | |||||||||||
Average Settlement Value Sold | — | — | — | — | 2,319 | — | — | 200,813 | — | |||||||||||||||||||||||||||
Ending Settlement Value Purchased | — | — | — | — | 18,348 | — | — | 177,910 | — | |||||||||||||||||||||||||||
Ending Settlement Value Sold | — | — | — | — | 18,348 | — | — | 170,222 | — | |||||||||||||||||||||||||||
| (a) | For the period from January 1, 2017 to January 31, 2017. |
| (b) | For the period from October 3, 2017 to October 10, 2017. |
| (c) | For the period from May 3, 2017 to May 9, 2017. |
| (d) | For the period from April 1, 2017 to April 30, 2017. |
| (e) | For the period from October 2, 2017 to October 10, 2017. |
E. Summary of Derivatives Information
The following table presents the value of derivatives held as of October 31, 2017, by their primary underlying risk exposure and respective location on the Statements of Assets and Liabilities (amounts in thousands):
Emerging Economies Fund
| Derivative Contracts | Statements of Assets and Liabilities Location | |||||
| Gross Assets: | Futures Contracts (a) | |||||
Equity contracts | Receivables, Net Assets — Unrealized Appreciation | $ | 564 | |||
|
| |||||
| (a) | This amount represents the cumulative appreciation (depreciation) of futures contracts as reported on the SOIs. The Statements of Assets and Liabilities only reflect the current day variation margin receivable/payable from/to brokers. |
The following table presents the value of derivatives held as of October 31, 2017, by their primary underlying risk exposure and respective location on the Statements of Assets and Liabilities (amounts in thousands):
Global Research Enhanced Index Fund
| Derivative Contracts | Statements of Assets and Liabilities Location | |||||
| Gross Assets: | Futures Contracts (a) | |||||
Equity contracts | Receivables, Net Assets — Unrealized Appreciation | $ | 3,513 | |||
|
| |||||
| (a) | This amount represents the cumulative appreciation (depreciation) of futures contracts as reported on the SOIs. The Statements of Assets and Liabilities only reflect the current day variation margin receivable/payable from/to brokers. |
| OCTOBER 31, 2017 | J.P. MORGAN INTERNATIONAL EQUITY FUNDS | 121 | ||||||
Table of Contents
NOTES TO FINANCIAL STATEMENTS
AS OF OCTOBER 31, 2017 (continued)
The following table presents the value of derivatives held as of October 31, 2017, by their primary underlying risk exposure and respective location on the Statements of Assets and Liabilities (amounts in thousands):
International Equity Income Fund
| Derivative Contracts | Statements of Assets and Liabilities Location | |||||
| Gross Assets: | Forward Foreign Currency Exchange Contracts | |||||
Foreign exchange contracts | Receivables | $ | 26 | |||
|
| |||||
Gross Liabilities: | ||||||
Foreign exchange contracts | Payables | $ | (354 | ) | ||
|
| |||||
The following table presents the value of derivatives held as of October 31, 2017, by their primary underlying risk exposure and respective location on the Statements of Assets and Liabilities (amounts in thousands):
International Research Enhanced Equity Fund
| Derivative Contracts | Statements of Assets and Liabilities Location | |||||
| Gross Assets: | Futures Contracts (a) | |||||
Equity contracts | Receivables, Net Assets — Unrealized Appreciation | $ | 9,050 | |||
|
| |||||
Gross Liabilities: | ||||||
Equity contracts | Payables, Net Assets — Unrealized Depreciation | $ | (425 | ) | ||
|
| |||||
| (a) | This amount represents the cumulative appreciation (depreciation) of futures contracts as reported on the SOIs. The Statements of Assets and Liabilities only reflect the current day variation margin receivable/payable from/to brokers. |
The following table presents the value of derivatives held as of October 31, 2017, by their primary underlying risk exposure and respective location on the Statements of Assets and Liabilities (amounts in thousands):
International Value Fund
| Derivative Contracts | Statements of Assets and Liabilities Location | |||||
| Gross Assets: | Forward Foreign Currency Exchange Contracts | |||||
Foreign exchange contracts | Receivables | $ | 3,704 | |||
|
| |||||
Gross Liabilities: | ||||||
Foreign exchange contracts | Payables | $ | (3,534 | ) | ||
|
| |||||
The following table presents the value of derivatives held at October 31, 2017, by their primary underlying risk exposure and respective location on the Statements of Assets and Liabilities (amounts in thousands):
Intrepid International Fund
| Derivative Contracts | Statements of Assets and Liabilities Location | |||||
| Gross Assets: | Futures Contracts (a) | |||||
Equity contracts | Receivables, Net Assets — Unrealized Appreciation | $ | 588 | |||
|
| |||||
Gross Liabilities: | ||||||
Equity contracts | Payables, Net Assets — Unrealized Depreciation | $ | (48 | ) | ||
|
| |||||
| (a) | This amount represents the cumulative appreciation (depreciation) of futures contracts as reported on the SOIs. The Statements of Assets and Liabilities only reflect the current day variation margin receivable/payable from/to brokers. |
The Funds are party to various derivative contracts governed by International Swaps and Derivatives Association master agreements (“ISDA agreements”). The Funds’ ISDA agreements, which are separately negotiated with each dealer counterparty, may contain provisions allowing, absent other considerations, a counterparty to exercise rights, to the extent not otherwise waived, against the Funds in the event the Funds’ net assets decline over time by a pre-determined percentage or fall below a pre-determined floor. The ISDA agreements may also contain provisions allowing,
| 122 | J.P. MORGAN INTERNATIONAL EQUITY FUNDS | OCTOBER 31, 2017 | ||||
Table of Contents
absent other conditions, the Funds to exercise rights, to the extent not otherwise waived, against the counterparty (e.g., decline in a counterparty’s credit rating below a specified level). Such rights for both the counterparty and Funds often include the ability to terminate (i.e., close out) open contracts at prices which may favor the counterparty, which could have an adverse effect on the Funds. The ISDA agreements give the Funds and counterparty the right, upon an event of default, to close out all transactions traded under such agreements and to net amounts owed or due across all transactions and offset such net payable or receivable with collateral posted to a segregated account by one party to the other.
The following tables present the effect of derivatives on the Statements of Operations for the year ended October 31, 2017, by primary underlying risk exposure (amounts in thousands):
Emerging Economies Fund
| Amount of Realized Gain (Loss) on Derivatives Recognized on the Statements of Operations | ||||||||||||
| Derivative Contracts | Futures Contracts | Forward Foreign Currency Exchange Contracts | Total | |||||||||
Equity contracts | $ | 56 | $ | — | $ | 56 | ||||||
Foreign exchange contracts | — | 166 | 166 | |||||||||
|
|
|
|
|
| |||||||
| $ | 56 | $ | 166 | $ | 222 | |||||||
|
|
|
|
|
| |||||||
| Amount of Change in Unrealized Appreciation (Depreciation) on Derivatives Recognized on the Statements of Operations | ||||
| Derivative Contracts | Futures Contracts | |||
Equity contracts | $ | 846 | ||
|
| |||
Emerging Markets Equity Fund
| Amount of Realized Gain (Loss) on Derivatives Recognized on the Statements of Operations | ||||
| Derivative Contracts | Forward Foreign Currency Exchange Contracts | |||
Foreign exchange contracts | $ | 204 | ||
|
| |||
Global Research Enhanced Index Fund
| Amount of Realized Gain (Loss) on Derivatives Recognized on the Statements of Operations | ||||
| Derivative Contracts | Futures Contracts | |||
Equity contracts | $ | 686 | ||
|
| |||
| Amount of Change in Unrealized Appreciation (Depreciation) on Derivatives Recognized on the Statements of Operations | ||||
| Derivative Contracts | Futures Contracts | |||
Equity contracts | $ | 3,513 | ||
|
| |||
Global Unconstrained Equity Fund
| Amount of Realized Gain (Loss) on Derivatives Recognized on the Statements of Operations | ||||
| Derivative Contracts | Forward Foreign Currency Exchange Contracts | |||
Foreign exchange contracts | $ | — | (a) | |
|
| |||
International Equity Fund
| Amount of Realized Gain (Loss) on Derivatives Recognized on the Statements of Operations | ||||
| Derivative Contracts | Forward Foreign Currency Exchange Contracts | |||
Foreign exchange contracts | $ | (354 | ) | |
|
| |||
International Equity Income Fund
| Amount of Realized Gain (Loss) on Derivatives Recognized on the Statements of Operations | ||||
| Derivative Contracts | Forward Foreign Currency Exchange Contracts | |||
Foreign exchange contracts | $ | (477 | ) | |
|
| |||
| OCTOBER 31, 2017 | J.P. MORGAN INTERNATIONAL EQUITY FUNDS | 123 | ||||||
Table of Contents
NOTES TO FINANCIAL STATEMENTS
AS OF OCTOBER 31, 2017 (continued)
| Amount of Change in Unrealized Appreciation (Depreciation) on Derivatives Recognized on the Statements of Operations | ||||
| Derivative Contracts | Forward Foreign Currency Exchange Contracts | |||
Foreign exchange contracts | $ | (215 | ) | |
|
| |||
International Research Enhanced Equity Fund
| Amount of Realized Gain (Loss) on Derivatives Recognized on the Statements of Operations | ||||||||||||
| Derivative Contracts | Futures Contracts | Forward Foreign Currency Exchange Contracts | Total | |||||||||
Equity contracts | $ | 10,841 | $ | — | $ | 10,841 | ||||||
Foreign exchange contracts | — | 71 | 71 | |||||||||
|
|
|
|
|
| |||||||
| $ | 10,841 | $ | 71 | $ | 10,912 | |||||||
|
|
|
|
|
| |||||||
| Amount of Change in Unrealized Appreciation (Depreciation) on Derivatives Recognized on the Statements of Operations | ||||
| Derivative Contracts | Futures Contracts | |||
Equity contracts | $ | 7,927 | ||
|
| |||
International Unconstrained Equity Fund
| Amount of Realized Gain (Loss) on Derivatives Recognized on the Statements of Operations | ||||
| Derivative Contracts | Forward Foreign Currency Exchange Contracts | |||
Foreign exchange contracts | $ | (41 | ) | |
|
| |||
International Value Fund
| Amount of Realized Gain (Loss) on Derivatives Recognized on the Statements of Operations | ||||||||||||
| Derivative Contracts | Futures Contracts | Forward Foreign Currency Exchange Contracts | Total | |||||||||
Equity contracts | $ | 890 | $ | — | $ | 890 | ||||||
Foreign exchange contracts | — | (1,445 | ) | (1,445 | ) | |||||||
|
|
|
|
|
| |||||||
| $ | 890 | $ | (1,445 | ) | $ | (555 | ) | |||||
|
|
|
|
|
| |||||||
| Amount of Change in Unrealized Appreciation (Depreciation) on Derivatives Recognized on the Statements of Operations | ||||
| Derivative Contracts | Forward Foreign Currency Exchange Contracts | |||
Foreign exchange contracts | $ | 609 | ||
|
| |||
Intrepid International Fund
| Amount of Realized Gain (Loss) on Derivatives Recognized on the Statements of Operations | ||||||||||||
| Derivative Contracts | Futures Contracts | Forward Foreign Currency Exchange Contracts | Total | |||||||||
Equity contracts | $ | 1,906 | $ | — | $ | 1,906 | ||||||
Foreign exchange contracts | — | 548 | 548 | |||||||||
|
|
|
|
|
| |||||||
| $ | 1,906 | $ | 548 | $ | 2,454 | |||||||
|
|
|
|
|
| |||||||
| Amount of Change in Unrealized Appreciation (Depreciation) on Derivatives Recognized on the Statements of Operations | ||||
| Derivative Contracts | Futures Contracts | |||
Equity contracts | $ | 540 | ||
|
| |||
| (a) | Amount rounds to less than 500. |
| 124 | J.P. MORGAN INTERNATIONAL EQUITY FUNDS | OCTOBER 31, 2017 | ||||
Table of Contents
The Funds’ derivatives contracts held at October 31, 2017 are not accounted for as hedging instruments under GAAP.
F. Structured Instruments — Emerging Markets Equity Fund invested in structured instruments that have similar economic characteristics to equity securities. These instruments often seek to replicate the performance of an underlying reference asset such as an equity security or market (“reference asset”). The value of these instruments is generally derived from the price movements of the reference asset. If the Fund holds the structured instrument to maturity, the Fund will be entitled to receive payment from the instrument’s issuing entity based on the value of the reference asset with any necessary adjustments, and record a realized gain or loss. The instrument may receive dividends paid in connection with the reference asset, which are reported as Net realized gain (loss) on investment transactions on the Statements of Operations.
Structured instruments may be issued by banks, broker dealers or their affiliates or other entities and typically constitute unsecured contractual obligations of the issuing entity. In addition to credit risk, investments in structured instruments generally have the same risks associated with a direct investment in the reference asset. However, there can be no assurance that structured instruments will trade at the same price or have the same value as the reference asset. In addition, structured instruments may be subject to transfer restrictions and a liquid market may not exist for these instruments.
The lack of a liquid market may make it difficult to sell the structured instruments or accurately value them. Investments in structured instruments subject the Funds to counterparty risk.
G. Foreign Currency Translation — The books and records of the Funds are maintained in U.S. dollars. Foreign currency amounts are translated into U.S. dollars at the prevailing exchange rates of such currencies against the U.S. dollar. The market value of investment securities and other assets and liabilities are translated at the exchange rate as of the valuation date. Purchases and sales of investment securities, income and expenses are translated at the exchange rate prevailing on the respective dates of such transactions.
The Funds do not isolate the effect of changes in foreign exchange rates from changes in market prices on securities held. Accordingly, such changes are included within Change in net unrealized appreciation/depreciation on investments on the Statements of Operations.
Reported realized foreign currency gains and losses arise from the disposition of foreign currency, currency gains or losses realized between the trade and settlement dates on securities transactions, and the difference between the amounts of dividends, interest and foreign withholding taxes recorded on each Fund’s books on the transaction date and the U.S. dollar equivalent of the amounts actually received or paid. These reported realized foreign currency gains and losses are included in Net realized gain (loss) on foreign currency transactions on the Statements of Operations. Unrealized foreign currency gains and losses arise from changes (due to changes in exchange rates) in the value of foreign currency and other assets and liabilities denominated in foreign currencies, which are held at period end and are included in Change in net unrealized appreciation/depreciation on foreign currency translations on the Statements of Operations.
H. Security Transactions and Investment Income — Investment transactions are accounted for on the trade date (the date the order to buy or sell is executed). Securities gains and losses are calculated on a specifically identified cost basis. Interest income is determined on the basis of coupon interest accrued using the effective interest method which adjusts for amortization of premiums and accretion of discounts. Dividend income net of foreign taxes withheld, if any, is recorded on the ex-dividend date or when a fund first learns of the dividend. Certain Funds may receive other income from investments in loan assignments and/or unfunded commitments, including amendment fees, consent fees and commitment fees. These fees are recorded as income when received by the Fund. These amounts are included in Interest Income on the Statement of Operations.
I. Allocation of Income and Expenses — Expenses directly attributable to a fund are charged directly to that fund, while the expenses attributable to more than one fund of the Trusts are allocated among the respective funds. In calculating the NAV of each class, investment income, realized and unrealized gains and losses and expenses, other than class-specific expenses, are allocated daily to each class of shares based upon the proportion of net assets of each class at the beginning of each day.
Transfer agency fees are class-specific expenses and sub-transfer agency fees were class-specific expenses up through April 2, 2017. Effective April 3, 2017, the Funds ceased making direct payments to financial intermediaries for any applicable sub-transfer agency services. Payments to financial intermediaries for sub-transfer agency services are made by JPMorgan Distribution Services, Inc. from the Shareholder Servicing Fee, which has been renamed as the Service Fee.
The amount of the transfer agency fees and sub-transfer agency fees charged to each class of the Funds for the year ended October 31, 2017 are as follows (amounts in thousands):
| Class A | Class C | Class I | Class L | Class R2 | Class R3 | Class R4 | Class R5 | Class R6 | Total | |||||||||||||||||||||||||||||||
Emerging Economies Fund | ||||||||||||||||||||||||||||||||||||||||
Transfer agency fees | $ | 10 | $ | 2 | $ | 4 | n/a | n/a | n/a | n/a | $ | — | (a) | $ | 12 | $ | 28 | |||||||||||||||||||||||
Sub-transfer agency fees | 57 | 2 | 1 | n/a | n/a | n/a | n/a | 1 | — | 61 | ||||||||||||||||||||||||||||||
Emerging Markets Equity Fund |
| |||||||||||||||||||||||||||||||||||||||
Transfer agency fees | 62 | 9 | 18 | $ | 18 | $ | — | (a) | $ | — | (a) | $ | — | (a) | 1 | 17 | 125 | |||||||||||||||||||||||
Sub-transfer agency fees | 278 | 24 | 117 | 143 | — | — | — | — | — | 562 | ||||||||||||||||||||||||||||||
Global Research Enhanced Index Fund |
| |||||||||||||||||||||||||||||||||||||||
Transfer agency fees | — | (a) | — | (a) | 56 | n/a | — | (a) | n/a | n/a | n/a | n/a | 56 | |||||||||||||||||||||||||||
Sub-transfer agency fees | — | — | 158 | n/a | — | n/a | n/a | n/a | n/a | 158 | ||||||||||||||||||||||||||||||
| OCTOBER 31, 2017 | J.P. MORGAN INTERNATIONAL EQUITY FUNDS | 125 | ||||||
Table of Contents
NOTES TO FINANCIAL STATEMENTS
AS OF OCTOBER 31, 2017 (continued)
| Class A | Class C | Class I | Class L | Class R2 | Class R3 | Class R4 | Class R5 | Class R6 | Total | |||||||||||||||||||||||||||||||
Global Unconstrained Equity Fund |
| |||||||||||||||||||||||||||||||||||||||
Transfer agency fees | $ | — | (a) | $ | — | (a) | $ | 1 | n/a | $ | — | (a) | n/a | n/a | $ | — | (a) | $ | — | (a) | $ | 1 | ||||||||||||||||||
Sub-transfer agency fees | 1 | — | (a) | — | (a) | n/a | — | n/a | n/a | — | — | 1 | ||||||||||||||||||||||||||||
International Equity Fund |
| |||||||||||||||||||||||||||||||||||||||
Transfer agency fees | 32 | 7 | 5 | n/a | 1 | n/a | n/a | 1 | 23 | 69 | ||||||||||||||||||||||||||||||
Sub-transfer agency fees | 69 | 11 | 41 | n/a | 2 | n/a | n/a | 13 | — | 136 | ||||||||||||||||||||||||||||||
International Equity Income Fund |
| |||||||||||||||||||||||||||||||||||||||
Transfer agency fees | 4 | 4 | 8 | n/a | 1 | n/a | n/a | — | (a) | 5 | 22 | |||||||||||||||||||||||||||||
Sub-transfer agency fees | 23 | 5 | 25 | n/a | — | (a) | n/a | n/a | — | (a) | — | 53 | ||||||||||||||||||||||||||||
International Research Enhanced Equity Fund |
| |||||||||||||||||||||||||||||||||||||||
Transfer agency fees | 38 | 3 | 15 | n/a | 34 | n/a | n/a | n/a | n/a | 90 | ||||||||||||||||||||||||||||||
Sub-transfer agency fees | 37 | 8 | 167 | n/a | 7 | n/a | n/a | n/a | n/a | 219 | ||||||||||||||||||||||||||||||
International Unconstrained Equity Fund |
| |||||||||||||||||||||||||||||||||||||||
Transfer agency fees | 4 | 3 | 7 | n/a | — | (a) | n/a | n/a | 1 | — | 15 | |||||||||||||||||||||||||||||
Sub-transfer agency fees | 5 | 1 | 4 | n/a | — | n/a | n/a | — | — | 10 | ||||||||||||||||||||||||||||||
International Value Fund |
| |||||||||||||||||||||||||||||||||||||||
Transfer agency fees | 19 | 3 | 6 | $ | 5 | 1 | n/a | n/a | 1 | 12 | 47 | |||||||||||||||||||||||||||||
Sub-transfer agency fees | 235 | 17 | 18 | — | 2 | n/a | n/a | — | — | 272 | ||||||||||||||||||||||||||||||
Intrepid International Fund |
| |||||||||||||||||||||||||||||||||||||||
Transfer agency fees | 10 | 1 | 2 | — | 1 | n/a | n/a | n/a | 18 | 32 | ||||||||||||||||||||||||||||||
Sub-transfer agency fees | 10 | 1 | 8 | — | (a) | — | (a) | n/a | n/a | n/a | — | 19 | ||||||||||||||||||||||||||||
| (a) | Amount rounds to less than 500. |
J. Federal Income Taxes — Each Fund is treated as a separate taxable entity for Federal income tax purposes. Each Fund’s policy is to comply with the provisions of the Internal Revenue Code of 1986, as amended (the “Code”), applicable to regulated investment companies and to distribute to shareholders all of its distributable net investment income and net realized capital gains on investments. Accordingly, no provision for Federal income tax is necessary. Management has reviewed the Funds’ tax positions for all open tax years and has determined that as of October 31, 2017, no liability for income tax is required in the Funds’ financial statements for net unrecognized tax benefits. However, management’s conclusions may be subject to future review based on changes in, or the interpretation of, the accounting standards or tax laws and regulations. Each of the Funds’ Federal tax returns for the prior three fiscal years, or since inception if shorter, remains subject to examination by the Internal Revenue Service.
K. Foreign Taxes — The Funds may be subject to foreign taxes on income, gains on investments or currency purchases/repatriation, a portion of which may be recoverable. The Funds will accrue such taxes and recoveries as applicable, based upon their current interpretation of tax rules and regulations that exist in the markets in which they invest. Certain Funds are subject to a tax imposed on short-term capital gains on securities of issuers domiciled in India. The Funds record an estimated deferred tax liability for these securities that have been held for less than one year at the end of the reporting period, assuming those positions were disposed of at the end of the period. This amount, if any, is reported as Deferred India capital gains tax in the accompanying Statements of Assets and Liabilities. Short-term realized capital losses on the sale of securities of issuers domiciled in India can be carried forward for eight years to offset potential future short-term realized capital gains.
India has enacted rules imposing a tax on the indirect transfers of Indian shares. Based upon current guidance from the Indian tax authorities, management does not believe that such tax will be applicable to the Funds. However, management’s conclusion, regarding this and other foreign tax matters, may be subject to future review based on changes in, or the interpretation of, the accounting standards and the tax laws and regulations.
L. Distributions to Shareholders — Distributions from net investment income if any, are generally declared and paid annually, except for International Equity Income Fund, which are declared and paid monthly. Distributions are declared separately for each class. No class has preferential dividend rights; differences in per share rates are due to differences in separate class expenses. Net realized capital gains, if any, are distributed by each Fund at least annually. The amount of distributions from net investment income and net realized capital gains is determined in accordance with Federal income tax regulations, which may differ from GAAP. To the extent these “book/tax” differences are permanent in nature (i.e., that they result from other than timing of recognition — “temporary differences”), such amounts are reclassified within the capital accounts based on their Federal tax-basis treatment.
| 126 | J.P. MORGAN INTERNATIONAL EQUITY FUNDS | OCTOBER 31, 2017 | ||||
Table of Contents
The following amounts were reclassified within the capital accounts (amounts in thousands):
| Paid-in-Capital | Accumulated undistributed (distributions in excess of) net investment income | Accumulated net realized gains (losses) | ||||||||||
Emerging Economies Fund | $ | (1,890 | ) | $ | (958 | ) | $ | 2,848 | ||||
Emerging Markets Equity Fund | (4,903 | ) | (558 | ) | 5,461 | |||||||
Global Research Enhanced Index Fund | — | 1,245 | (1,245 | ) | ||||||||
Global Unconstrained Equity Fund | — | (1 | ) | 1 | ||||||||
International Equity Fund | — | 504 | (504 | ) | ||||||||
International Equity Income Fund | — | (140 | ) | 140 | ||||||||
International Research Enhanced Equity Fund | — | (4,334 | ) | 4,334 | ||||||||
International Unconstrained Equity Fund | — | 256 | (256 | ) | ||||||||
International Value Fund | (241,545 | ) | 664 | 240,881 | ||||||||
Intrepid International Fund | (144,377 | ) | 3,938 | 140,439 | ||||||||
The reclassifications for the Funds relate primarily to foreign currency gains or losses, expiration of capital loss carryforwards, India capital gains tax, return of capital distributions and investments in passive foreign investment companies (“PFICs”).
3. Fees and Other Transactions with Affiliates
A. Investment Advisory Fee — Pursuant to Investment Advisory Agreements, the Adviser supervises the investments of each Fund and for such services is paid a fee. The fee is accrued daily and paid monthly based on each Fund’s respective average daily net assets.
The annual rate for each Fund is as follows:
Emerging Economies Fund | 0.85 | % | ||
Emerging Markets Equity Fund | 0.85 | |||
Global Research Enhanced Index Fund | 0.20 | |||
Global Unconstrained Equity Fund | 0.70 | |||
International Equity Fund | 0.70 | |||
International Equity Income Fund | 0.70 | |||
International Research Enhanced Equity Fund | 0.20 | |||
International Unconstrained Equity Fund | 0.70 | |||
International Value Fund | 0.60 | |||
Intrepid International Fund | 0.60 |
The Adviser waived Investment Advisory fees and/or reimbursed expenses as outlined in Note 3.F.
B. Administration Fee — Pursuant to Administration Agreements, the Administrator provides certain administration services to the Funds. In consideration of these services, the Administrator receives a fee accrued daily and paid monthly at an annual rate of 0.15% of the first $25 billion of the average daily net assets of all funds in the J.P. Morgan Funds Complex covered by the Administration Agreement (excluding certain funds of funds and money market funds) and 0.075% of the average daily net assets in excess of $25 billion of all such funds. For the year ended October 31, 2017, the effective rate was 0.08% of each Fund’s average daily net assets, notwithstanding any fee waivers and/or expense reimbursements.
The Administrator waived Administration fees as outlined in Note 3.F.
JPMorgan Chase Bank, N.A. (“JPMCB”), a wholly-owned subsidiary of JPMorgan, serves as the Funds’ sub-administrator (the “Sub-administrator”). For its services as Sub-administrator, JPMCB receives a portion of the fees payable to the Administrator.
C. Distribution Fees — Pursuant to a Distribution Agreement, JPMorgan Distribution Services, Inc. (“JPMDS”), an indirect, wholly-owned subsidiary of JPMorgan, serves as the Trusts’ principal underwriter and promotes and arranges for the sale of each Fund’s shares. The Board has adopted a Distribution Plan (the “Distribution Plan”) for Class A, Class C, Class R2 and Class R3 Shares of the Funds, as applicable, in accordance with Rule 12b-1 under the 1940 Act. The Class R4, Class R5, Class R6, Class I and Class L Shares do not charge a distribution fee. The Distribution Plan provides that each Fund shall pay distribution fees, including payments to JPMDS, at annual rates of the average daily net assets as shown in the table below:
| Class A | Class C | Class R2 | Class R3 | |||||||||||||
Emerging Economies Fund | 0.25 | % | 0.75 | % | n/a | n/a | ||||||||||
Emerging Markets Equity Fund | 0.25 | 0.75 | 0.50 | % | 0.25 | % | ||||||||||
Global Unconstrained Equity Fund | 0.25 | 0.75 | 0.50 | n/a | ||||||||||||
International Equity Fund | 0.25 | 0.75 | 0.50 | n/a | ||||||||||||
| OCTOBER 31, 2017 | J.P. MORGAN INTERNATIONAL EQUITY FUNDS | 127 | ||||||
Table of Contents
NOTES TO FINANCIAL STATEMENTS
AS OF OCTOBER 31, 2017 (continued)
| Class A | Class C | Class R2 | Class R3 | |||||||||||||
International Equity Income Fund | 0.25 | % | 0.75 | % | 0.50 | % | n/a | |||||||||
International Research Enhanced Equity Fund | 0.25 | n/a | n/a | n/a | ||||||||||||
International Unconstrained Equity Fund | 0.25 | 0.75 | 0.50 | n/a | ||||||||||||
International Value Fund | 0.25 | 0.75 | 0.50 | n/a | ||||||||||||
Intrepid International Fund | 0.25 | 0.75 | 0.50 | n/a | ||||||||||||
In addition, JPMDS is entitled to receive the front-end sales charges from purchases of Class A Shares and the CDSC from redemptions of Class C Shares and certain Class A Shares for which front-end sales charges have been waived. For the year ended October 31, 2017, JPMDS retained the following amounts (in thousands):
| Front-End Sales Charge | CDSC | |||||||
Emerging Economies Fund | $ | 2 | $ | — | ||||
Emerging Markets Equity Fund | 95 | — | (a) | |||||
Global Unconstrained Equity Fund | 1 | — | ||||||
International Equity Fund | 22 | — | (a) | |||||
International Equity Income Fund | 26 | — | (a) | |||||
International Research Enhanced Equity Fund | 4 | — | ||||||
International Unconstrained Equity Fund | 45 | — | (a) | |||||
International Value Fund | 110 | — | (a) | |||||
Intrepid International Fund | 2 | — | (a) | |||||
| (a) | Amount rounds to less than 500. |
D. Service Fees — The Trusts, on behalf of the Funds, have entered into a Shareholder Servicing Agreement with JPMDS under which JPMDS provides certain support services to the shareholders. The Class R6 Shares do not charge service fees. For performing these services, JPMDS receives a fee that is accrued daily and paid monthly equal to a percentage of the average daily net assets as shown in the table below:
| Class A | Class C | Class I | Class L | Class R2 | Class R3 | Class R4 | Class R5 | |||||||||||||||||||||||||
Emerging Economies Fund | 0.25 | % | 0.25 | % | 0.25 | % | n/a | n/a | n/a | n/a | 0.10 | %* | ||||||||||||||||||||
Emerging Markets Equity Fund | 0.25 | 0.25 | 0.25 | 0.10 | % | 0.25 | % | 0.25 | % | 0.25 | % | 0.10 | * | |||||||||||||||||||
Global Research Enhanced Index Fund | 0.25 | ** | 0.25 | ** | 0.25 | n/a | 0.25 | ** | n/a | n/a | n/a | |||||||||||||||||||||
Global Unconstrained Equity Fund | 0.25 | 0.25 | 0.25 | n/a | 0.25 | n/a | n/a | 0.10 | * | |||||||||||||||||||||||
International Equity Fund | 0.25 | 0.25 | 0.25 | n/a | 0.25 | n/a | n/a | 0.10 | * | |||||||||||||||||||||||
International Equity Income Fund | 0.25 | 0.25 | 0.25 | n/a | 0.25 | n/a | n/a | 0.10 | * | |||||||||||||||||||||||
International Research Enhanced Equity Fund | 0.25 | 0.25 | *** | 0.25 | n/a | 0.25 | *** | n/a | n/a | n/a | ||||||||||||||||||||||
International Unconstrained Equity Fund | 0.25 | 0.25 | 0.25 | n/a | 0.25 | n/a | n/a | 0.10 | * | |||||||||||||||||||||||
International Value Fund | 0.25 | 0.25 | 0.25 | 0.10 | 0.25 | n/a | n/a | 0.10 | * | |||||||||||||||||||||||
Intrepid International Fund | 0.25 | 0.25 | 0.25 | 0.10 | **** | 0.25 | n/a | n/a | n/a | |||||||||||||||||||||||
| * | Prior to April 3, 2017, the service fee for Class R5 Shares was 0.05%. |
| ** | Liquidated on August 11, 2017. |
| *** | Liquidated on October 9, 2017. |
| **** | Liquidated on December 8, 2016. |
JPMDS has entered into shareholder services contracts with affiliated and unaffiliated financial intermediaries who provide shareholder services and other related services to their clients or customers who invest in the Funds under which JPMDS will pay all or a portion of such fees earned to financial intermediaries for performing such services.
JPMDS waived service fees as outlined in Note 3.F.
E. Custodian and Accounting Fees — JPMCB provides portfolio and accounting services to the Funds. For performing these services, the Funds pay JPMCB transaction and asset-based fees that vary according to the number of transactions and positions, plus out-of-pocket expenses. The amounts paid directly to JPMCB by the Funds for custody and accounting services are included in Custodian and accounting fees on the Statements of Operations.
Interest income earned on cash balances at the custodian, if any, is included as Interest income from affiliates on the Statements of Operations.
Interest expense paid to the custodian related to cash overdrafts, if any, is included in Interest expense to affiliates on the Statements of Operations.
F. Waivers and Reimbursements — The Adviser, Administrator and/or JPMDS have contractually agreed to waive fees and/or reimburse the Funds to the extent that total annual operating expenses (excluding acquired fund fees and expenses other than certain money market fund fees as
| 128 | J.P. MORGAN INTERNATIONAL EQUITY FUNDS | OCTOBER 31, 2017 | ||||
Table of Contents
described below, dividend and interest expenses related to short sales, interest, taxes, expenses related to litigation and potential litigation and extraordinary expenses) exceed the percentages of the Funds’ respective average daily net assets as shown in the table below:
| Class A | Class C | Class I | Class L | Class R2 | Class R3 | Class R4 | Class R5 | Class R6 | ||||||||||||||||||||||||||||
Emerging Economies Fund (1) | 1.35 | % | 1.85 | % | 1.10 | % | n/a | n/a | n/a | n/a | 0.95 | % | 0.85 | % | ||||||||||||||||||||||
Emerging Markets Equity Fund (2) | 1.35 | 1.85 | 1.10 | 0.95 | % | 1.60 | % | 1.35 | % | 1.10 | % | 0.95 | 0.85 | |||||||||||||||||||||||
Global Research Enhanced Index Fund | n/a | n/a | 0.34 | n/a | n/a | n/a | n/a | n/a | n/a | |||||||||||||||||||||||||||
Global Unconstrained Equity Fund (3), (4) | 1.25 | 1.75 | 0.90 | n/a | 1.50 | n/a | n/a | 0.80 | 0.75 | |||||||||||||||||||||||||||
International Equity Fund (5) | 1.24 | 1.74 | 0.99 | n/a | 1.49 | n/a | n/a | 0.84 | 0.74 | |||||||||||||||||||||||||||
International Equity Income Fund (6) | 1.25 | 1.75 | 0.90 | n/a | 1.50 | n/a | n/a | 0.80 | 0.75 | |||||||||||||||||||||||||||
International Research Enhanced Equity Fund | 0.60 | n/a | 0.35 | n/a | n/a | n/a | n/a | n/a | n/a | |||||||||||||||||||||||||||
International Unconstrained Equity Fund (7) | 1.25 | 1.75 | 0.90 | n/a | 1.50 | n/a | n/a | 0.80 | 0.75 | |||||||||||||||||||||||||||
International Value Fund (8) | 1.35 | 1.85 | 1.10 | 0.95 | 1.60 | n/a | n/a | 0.95 | 0.85 | |||||||||||||||||||||||||||
Intrepid International Fund (9) | 1.25 | 1.75 | 0.90 | n/a | 1.50 | n/a | n/a | n/a | 0.75 | |||||||||||||||||||||||||||
| (1) | Effective November 1, 2017, the contractual expense limitations for Emerging Economies Fund were lowered to 1.14%, 1.64%, 0.89%, 0.79% and 0.69% for Class A, Class C, Class I, Class R5 and Class R6, respectively, and are in effect until October 31, 2019. |
| (2) | Effective November 1, 2017, the contractual expense limitations for Emerging Markets Equity Fund were lowered to 1.24%, 1.74%, 0.99%, 1.54%, 1.29%, 1.04%, 0.89% and 0.79% for Class A, Class C, Class I, Class R2, Class R3, Class R4, Class R5 and Class R6, respectively, and are in effect until October 31, 2019. |
| (3) | Prior to May 31, 2017, the contractual expense limitations for Global Unconstrained Equity Fund were 0.75%, 1.25%, 0.40%, 1.00%, 0.30% and 0.25% for Class A, Class C, Class I, Class R2, Class R5 and Class R6, respectively. |
| (4) | Effective November 1, 2017, the contractual expense limitations for Global Unconstrained Equity Fund were lowered to 1.00%, 1.50%, 0.75%, 1.30%, 0.65% and 0.55% for Class A, Class C, Class I, Class R2, Class R5 and Class R6, respectively, and are in effect until October 31, 2019. |
| (5) | Effective November 1, 2017, the contractual expense limitations for International Equity Fund were lowered to 0.95%, 1.45%, 0.70%, 1.25%, 0.60% and 0.50% for Class A, Class C, Class I, Class R2, Class R5 and Class R6, respectively, and are in effect until October 31, 2019. |
| (6) | Effective November 1, 2017, the contractual expense limitations for International Equity Income Fund were lowered to 0.95%, 1.45%, 0.70%, 1.25%, 0.60% and 0.50% for Class A, Class C, Class I, Class R2, Class R5 and Class R6, respectively, and are in effect until October 31, 2019. |
| (7) | Effective November 1, 2017, the contractual expense limitations for International Unconstrained Equity Fund were lowered to 1.00%, 1.50%, 0.75%, 1.30%, 0.65% and 0.55% for Class A, Class C, Class I, Class R2, Class R5 and Class R6, respectively, and are in effect until October 31, 2019. |
| (8) | Effective November 1, 2017, the contractual expense limitations for International Value Fund were lowered to 1.00%, 1.50%, 0.75%, 1.30%, 0.65% and 0.55% for Class A, Class C, Class I, Class R2, Class R5 and Class R6, respectively, and are in effect until October 31, 2019. |
| (9) | Effective November 1, 2017, the contractual expense limitations for Intrepid International Fund were lowered to 1.00%, 1.50%, 0.75%, 1.30% and 0.55% for Class A, Class C, Class I, Class R2 and Class R6, respectively, and are in effect until October 31, 2019. |
Except as noted above, the expense limitation agreements were in effect for the year ended October 31, 2017 and are in place until February 28, 2018.
For the year ended October 31, 2017, the Funds’ service providers waived fees and/or reimbursed expenses for each of the Funds as follows (amounts in thousands). None of these parties expect the Funds to repay any such waived fees and/or reimbursed expenses in future years.
| Contractual Waivers | ||||||||||||||||||||
| Investment Advisory Fees | Administration Fees | Service Fees | Total | Contractual Reimbursements | ||||||||||||||||
Emerging Economies Fund | $ | 2,181 | $ | 1,387 | $ | 77 | $ | 3,645 | $ | 11 | ||||||||||
Emerging Markets Equity Fund | 3,640 | 2,264 | 649 | 6,553 | 6 | |||||||||||||||
Global Research Enhanced Index Fund | 9,802 | 6,302 | 133 | 16,237 | — | |||||||||||||||
Global Unconstrained Equity Fund | 5 | 2 | 3 | 10 | 246 | |||||||||||||||
International Equity Fund | 1,525 | 1,007 | 169 | 2,701 | 11 | |||||||||||||||
International Equity Income Fund | 301 | 131 | 111 | 543 | 6 | |||||||||||||||
International Research Enhanced Equity Fund | 2,761 | 1,558 | 161 | 4,480 | 14 | |||||||||||||||
International Unconstrained Equity Fund | 227 | 136 | 71 | 434 | 1 | |||||||||||||||
International Value Fund | — | — | 19 | 19 | 6 | |||||||||||||||
Intrepid International Fund | 3 | 2 | 41 | 46 | 1 | |||||||||||||||
| OCTOBER 31, 2017 | J.P. MORGAN INTERNATIONAL EQUITY FUNDS | 129 | ||||||
Table of Contents
NOTES TO FINANCIAL STATEMENTS
AS OF OCTOBER 31, 2017 (continued)
| Voluntary Waivers | ||||
| Investment Advisory fees | ||||
Global Unconstrained Equity Fund | $ | 12 | ||
Additionally, the Funds may invest in one or more money market funds advised by the Adviser or its affiliates (affiliated money market funds). The Adviser, Administrator and/or JPMDS, as shareholder servicing agent, have contractually agreed to waive fees and/or reimburse expenses in an amount sufficient to offset the respective net fees each collects from the affiliated money market fund on the applicable Funds’ investment in such affiliated money market fund.
The amounts of these waivers resulting from investments in these money market funds for the year ended October 31, 2017 were as follows (amounts in thousands):
Emerging Economies Fund | $ | 60 | ||
Emerging Markets Equity Fund | 113 | |||
Global Research Enhanced Index Fund | 120 | |||
Global Unconstrained Equity Fund | — | (a) | ||
International Equity Fund | 98 | |||
International Equity Income Fund | 8 | |||
International Research Enhanced Equity Fund | 113 | |||
International Unconstrained Equity Fund | 15 | |||
International Value Fund | 26 | |||
Intrepid International Fund | 87 |
| (a) | Amount rounds to less than 500. |
G. Other — Certain officers of the Trusts are affiliated with the Adviser, the Administrator and JPMDS. Such officers, with the exception of the Chief Compliance Officer, receive no compensation from the Funds for serving in their respective roles.
The Board appointed a Chief Compliance Officer to the Funds in accordance with Federal securities regulations. Each Fund, along with other affiliated funds, makes reimbursement payments, on a pro-rata basis, to the Administrator for a portion of the fees associated with the Office of the Chief Compliance Officer. Such fees are included in Trustees’ and Chief Compliance Officer’s fees on the Statements of Operations.
The Trusts adopted a Trustee Deferred Compensation Plan (the “Plan”) which allows the Independent Trustees to defer the receipt of all or a portion of compensation related to performance of their duties as Trustees. The deferred fees are invested in various J.P. Morgan Funds until distribution in accordance with the Plan.
During the year ended October 31, 2017, Emerging Markets Equity Fund, Global Unconstrained Equity Fund, International Equity Income Fund, International Research Enhanced Equity Fund, International Unconstrained Equity Fund and International Value Fund purchased securities from an underwriting syndicate in which the principal underwriter or members of the syndicate were affiliated with the Adviser.
The Funds may use related party broker-dealers. For the year ended October 31, 2017, the Funds incurred brokerage commissions with broker-dealers affiliated with the Adviser as follows (amounts in thousands):
Emerging Markets Equity Fund | $ | 1 | ||
Global Research Enhanced Index Fund | 1 | |||
Global Unconstrained Equity Fund | — | (a) |
| (a) | Amount rounds to less than 500. |
The Securities and Exchange Commission (“SEC”) has granted an exemptive order permitting the Funds to engage in principal transactions with J.P. Morgan Securities, Inc., an affiliated broker, involving taxable money market instruments, subject to certain conditions.
4. Investment Transactions
During the year ended October 31, 2017, purchases and sales of investments (excluding short-term investments) were as follows (amounts in thousands):
| Purchases (excluding U.S. Government) | Sales (excluding U.S. Government) | |||||||
Emerging Economies Fund | $ | 1,143,659 | $ | 1,383,206 | ||||
Emerging Markets Equity Fund | 1,228,555 | 786,166 | ||||||
Global Research Enhanced Index Fund | 2,742,996 | 2,529,931 | ||||||
| 130 | J.P. MORGAN INTERNATIONAL EQUITY FUNDS | OCTOBER 31, 2017 | ||||
Table of Contents
| Purchases (excluding U.S. Government) | Sales (excluding U.S. Government) | |||||||
Global Unconstrained Equity Fund | $ | 3,829 | $ | 2,382 | ||||
International Equity Fund | 609,088 | 795,772 | ||||||
International Equity Income Fund | 147,992 | 105,928 | ||||||
International Research Enhanced Equity Fund | 3,626,671 | 598,717 | ||||||
International Unconstrained Equity Fund | 263,896 | 72,634 | ||||||
International Value Fund | 274,921 | 971,554 | ||||||
Intrepid International Fund | 2,341,557 | 2,445,460 | ||||||
During the year ended October 31, 2017, there were no purchases or sales of U.S. Government securities.
5. Federal Income Tax Matters
For Federal income tax purposes, the estimated cost and unrealized appreciation (depreciation) in value of investments held at October 31, 2017 were as follows (amounts in thousands):
| Aggregate Cost | Gross Unrealized Appreciation | Gross Unrealized Depreciation | Net Unrealized Appreciation (Depreciation) | |||||||||||||
Emerging Economies Fund | $ | 1,631,645 | $ | 454,939 | $ | 49,318 | $ | 405,621 | ||||||||
Emerging Markets Equity Fund | 3,168,327 | 1,353,479 | 61,181 | 1,292,298 | ||||||||||||
Global Research Enhanced Index Fund | 6,880,883 | 1,891,302 | 132,183 | 1,759,119 | ||||||||||||
Global Unconstrained Equity Fund | 3,296 | 298 | 102 | 196 | ||||||||||||
International Equity Fund | 3,040,734 | 1,030,689 | 64,765 | 965,924 | ||||||||||||
International Equity Income Fund | 172,882 | 30,181 | 3,044 | 27,137 | ||||||||||||
International Research Enhanced Equity Fund | 4,607,087 | 353,643 | 60,200 | 293,443 | ||||||||||||
International Unconstrained Equity Fund | 316,105 | 40,588 | 1,054 | 39,534 | ||||||||||||
International Value Fund | 724,149 | 111,583 | 46,046 | 65,537 | ||||||||||||
Intrepid International Fund | 2,761,963 | 425,926 | 48,053 | 377,873 | ||||||||||||
The difference between book and tax basis appreciation (depreciation) on investments is primarily attributed to wash sale loss deferrals, mark-to-market of forward foreign currency contracts, mark-to-market of futures contracts and investments in PFICs.
The tax character of distributions paid during the year ended October 31, 2017 was as follows (amounts in thousands):
Ordinary Income* | Total Distributions Paid | |||||||
Emerging Economies Fund | $ | 27,595 | $ | 27,595 | ||||
Emerging Markets Equity Fund | 23,992 | 23,992 | ||||||
Global Research Enhanced Index Fund | 155,976 | 155,976 | ||||||
Global Unconstrained Equity Fund | 3 | 3 | ||||||
International Equity Fund | 17,837 | 17,837 | ||||||
International Equity Income Fund | 5,382 | 5,382 | ||||||
International Research Enhanced Equity Fund | 34,205 | 34,205 | ||||||
International Unconstrained Equity Fund | 2,563 | 2,563 | ||||||
International Value Fund | 61,529 | 61,529 | ||||||
Intrepid International Fund | 70,281 | 70,281 | ||||||
| * | Short-term gain distributions are treated as ordinary income for income tax purposes. |
The tax character of distributions paid during the year ended October 31, 2016 was as follows (amounts in thousands):
| Ordinary Income* | Net Long-Term Capital Gains | Return of Capital | Total Distributions Paid | |||||||||||||
Emerging Economies Fund | $ | 13,283 | $ | — | $ | — | $ | 13,283 | ||||||||
Emerging Markets Equity Fund | 20,262 | — | — | 20,262 | ||||||||||||
Global Research Enhanced Index Fund | 138,054 | — | — | 138,054 | ||||||||||||
Global Unconstrained Equity Fund | 5,669 | 524 | 1,030 | 7,223 | ||||||||||||
International Equity Fund | 64,361 | — | — | 64,361 | ||||||||||||
International Equity Income Fund | 3,670 | 1,746 | — | 5,416 | ||||||||||||
| OCTOBER 31, 2017 | J.P. MORGAN INTERNATIONAL EQUITY FUNDS | 131 | ||||||
Table of Contents
NOTES TO FINANCIAL STATEMENTS
AS OF OCTOBER 31, 2017 (continued)
| Ordinary Income* | Net Long-Term Capital Gains | Return of Capital | Total Distributions Paid | |||||||||||||
International Research Enhanced Equity Fund | $ | 21,405 | $ | 7,959 | $ | — | $ | 29,364 | ||||||||
International Unconstrained Equity Fund | 274 | — | — | 274 | ||||||||||||
International Value Fund | 29,657 | — | — | 29,657 | ||||||||||||
Intrepid International Fund | 42,882 | — | — | 42,882 | ||||||||||||
| * | Short-term gain distributions are treated as ordinary income for income tax purposes. |
At October 31, 2017, the estimated components of net assets (excluding paid-in-capital) on a tax basis were as follows (amounts in thousands):
Current Ordinary | Current Distributable Long-Term Capital Gain or (Tax Basis Capital Loss Carryover) | Unrealized Appreciation | ||||||||||
Emerging Economies Fund | $ | 34,661 | $ | (80,320 | ) | $ | 404,141 | |||||
Emerging Markets Equity Fund | 21,827 | 115,827 | 1,292,292 | |||||||||
Global Research Enhanced Index Fund | 135,233 | (97,823 | ) | 1,758,975 | ||||||||
Global Unconstrained Equity Fund | 142 | 31 | 196 | |||||||||
International Equity Fund | 60,072 | (51,652 | ) | 966,000 | ||||||||
International Equity Income Fund | 320 | (9,533 | ) | 26,814 | ||||||||
International Research Enhanced Equity Fund | 61,850 | 33,138 | 293,478 | |||||||||
International Unconstrained Equity Fund | 3,142 | (2,922 | ) | 39,535 | ||||||||
International Value Fund | 16,348 | (65,718 | ) | 65,472 | ||||||||
Intrepid International Fund | 63,609 | — | 377,870 | |||||||||
For the Funds the cumulative timing differences primarily consist of wash sale loss deferrals, capital Loss carryovers, trustee deferred compensation, mark-to-market of forward foreign currency contracts and investments in PFICs.
Under the Regulated Investment Company Modernization Act of 2010 (the “Act”), net capital losses recognized by the Funds after October 31, 2011, are carried forward indefinitely, and retain their character as short-term and/or long-term losses. Prior to the Act, net capital losses incurred by the Funds were carried forward for eight years and treated as short-term losses. The Act requires that post-enactment net capital losses be used before pre-enactment net capital losses.
At October 31, 2017, the Funds had the following pre-enactment net capital loss carryforwards, expiring during the years indicated, which are available to offset future realized gains as follows (amounts in thousands):
| 2018 | 2019 | Total | ||||||||||
Emerging Economies Fund | $ | — | $ | 16,730 | $ | 16,730 | ||||||
International Equity Fund | 4,532 | 3,312 | 7,844 | |||||||||
International Value Fund | 63,767 | — | 63,767 | |||||||||
At October 31, 2017, the following Funds had post-enactment net capital loss carryforwards as follows (amounts in thousands):
| Capital Loss Carryforward Character | ||||||||
| Short-Term | Long-Term | |||||||
Emerging Economies Fund | $ | 63,590 | — | |||||
Emerging Markets Equity Fund | — | 115,827 | ||||||
Global Research Enhanced Index Fund | 52,602 | 45,221 | ||||||
International Equity Fund | — | 43,808 | ||||||
International Equity Income Fund | 9,533 | — | ||||||
International Unconstrained Equity Fund | 1,615 | 1,307 | ||||||
International Value Fund | 1,951 | — | ||||||
| 132 | J.P. MORGAN INTERNATIONAL EQUITY FUNDS | OCTOBER 31, 2017 | ||||
Table of Contents
During the year ended October 31, 2017, the following Funds utilized capital loss carryforwards as follows (amounts in thousands):
Emerging Economies Fund | $ | 158,471 | ||
Emerging Markets Equity Fund | 10,629 | |||
Global Research Enhanced Index Fund | 138,657 | |||
International Equity Income Fund | 718 | |||
International Research Enhanced Equity Fund | 3,153 | |||
International Unconstrained Equity Fund | 2,024 | |||
International Value Fund | 69,190 | |||
Intrepid International Fund | 152,894 |
During the year ended October 31, 2017, the following Funds had expired capital loss carryforwards as follows (amounts in thousands):
Emerging Economies Fund | $ | 1,890 | ||
Emerging Markets Equity Fund | 4,903 | |||
International Value Fund | 241,545 | |||
Intrepid International Fund | 144,376 |
6. Borrowings
The Funds rely upon an exemptive order granted by the SEC (the “Order”) permitting the establishment and operation of an Interfund Lending Facility (the “Facility”). The Facility allows the Funds to directly lend and borrow money to or from any other fund relying upon the Order at rates beneficial to both the borrowing and lending funds. Advances under the Facility are taken primarily for temporary or emergency purposes, including the meeting of redemption requests that otherwise might require the untimely disposition of securities, and are subject to each Fund’s borrowing restrictions. The Interfund loan rate is determined, as specified in the Order, by averaging the current repurchase agreement rate and the current bank loan rate. The Order was granted to JPMorgan Trust II and may be relied upon by the Funds because the Funds and the series of JPMorgan Trust II are all investment companies in the same “group of investment companies” (as defined in Section 12(d)(1)(G) of the 1940 Act).
The Trusts and JPMCB have entered into a financing arrangement. Under this arrangement, JPMCB provides an unsecured, uncommitted credit facility in the aggregate amount of $100 million to certain of the J.P. Morgan Funds, including the Funds. Advances under the arrangement are taken primarily for temporary or emergency purposes, including the meeting of redemption requests that otherwise might require the untimely disposition of securities, and are subject to each Fund’s borrowing restrictions. Interest on borrowings is payable at a rate determined by JPMCB at the time of borrowing. This agreement has been extended until November 5, 2018.
The Funds had no borrowings outstanding from another fund or from the unsecured, uncommitted credit facility at October 31, 2017. Average borrowings from the Facility for the year ended October 31, 2017, were as follows (amounts in thousands, except number of days outstanding):
| Average Borrowings | Average Interest Rate Paid | Number of Days Outstanding | Interest Paid | |||||||||||||
Emerging Economies Fund | $ | 25,617 | 1.56 | % | 16 | $ | 18 | |||||||||
Emerging Markets Equity Fund | 13,143 | 1.65 | 6 | 4 | ||||||||||||
International Equity Fund | 21,828 | 1.47 | 11 | 9 | ||||||||||||
International Value Fund | 16,262 | 1.25 | 18 | 10 | ||||||||||||
Intrepid International Fund | 38,825 | 1.49 | 8 | 13 | ||||||||||||
In addition, effective August 16, 2016, the Trusts along with certain other trusts (“Borrowers”) entered into a joint syndicated senior unsecured revolving credit facility totaling $1.5 billion (“Credit Facility”) with various lenders and The Bank of New York Mellon, as administrative agent for the lenders. This Credit Facility provides a source of funds to the Borrowers for temporary and emergency purposes, including the meeting of redemption requests that otherwise might require the untimely disposition of securities. Under the terms of the Credit Facility, a borrowing fund must have a minimum of $25,000,000 in adjusted net asset value and not exceed certain adjusted net asset coverage ratios prior to and during the time in which any borrowings are outstanding. If a fund does not comply with the aforementioned requirements, the Fund must remediate within three business days with respect to the $25,000,000 minimum adjusted net asset value or within one business day with respect to certain asset coverage ratios or the administrative agent at the request of, or with the consent of, the lenders may terminate the Credit Facility and declare any outstanding borrowings to be due and payable immediately.
Interest associated with any borrowing under the Credit Facility is charged to the borrowing fund at a rate of interest equal to 1.00% plus the greater of the federal funds effective rate or one month LIBOR. The annual commitment fee to maintain the Credit Facility is 0.15% and is incurred on the unused portion of the Credit Facility and is allocated to all participating funds pro rata based on their respective net assets. Effective August 15, 2017, this agreement has been amended and restated for a term of 364 days, unless extended. The Funds had no borrowings outstanding from the Credit Facility at October 31, 2017.
| OCTOBER 31, 2017 | J.P. MORGAN INTERNATIONAL EQUITY FUNDS | 133 | ||||||
Table of Contents
NOTES TO FINANCIAL STATEMENTS
AS OF OCTOBER 31, 2017 (continued)
Average borrowings from the Credit Facility for, or at any time during the year ended October 31, 2017, were as follows (amounts in thousands, except number of days outstanding):
| Average Borrowings | Average Rate Paid | Number of Days Outstanding | Interest Paid | |||||||||||||
Intrepid International Fund | $ | 5,700 | 1.77 | % | 4 | $ | 1 | |||||||||
7. Risks, Concentrations and Indemnifications
In the normal course of business, the Funds enter into contracts that contain a variety of representations which provide general indemnifications. Each Fund’s maximum exposure under these arrangements is unknown. The amount of exposure would depend on future claims that may be made against each Fund that have not yet occurred. However, based on experience, the Funds expect the risk of loss to be remote.
Derivatives may be riskier than other types of investments because they may be more sensitive to changes in economic and market conditions and could result in losses that significantly exceed the Funds’ original investment. Many derivatives create leverage thereby causing the Funds to be more volatile than they would have been if they had not used derivatives. Derivatives also expose the Funds to counterparty risk (the risk that the derivative counterparty will not fulfill its contractual obligations), including credit risk of the derivative counterparty.
As of October 31, 2017, the J.P. Morgan Investor Funds and the JPMorgan SmartRetirement Funds, which are affiliated funds of funds, owned in the aggregate, shares representing more than 10% of the net assets of certain Funds as follows:
| J.P. Morgan Investor Funds | JPMorgan SmartRetirement Funds | |||||||
Emerging Economies Fund | 10.3 | % | 70.6 | % | ||||
Emerging Markets Equity Fund | — | 39.4 | ||||||
International Equity Fund | — | 70.3 | ||||||
International Research Enhanced Equity Fund | 15.1 | 54.4 | ||||||
International Unconstrained Equity Fund | 33.4 | — | ||||||
Intrepid International Fund | — | 89.7 | ||||||
As of October 31, 2017, the following Funds had individual shareholder accounts and/or omnibus accounts each owning more than 10% of the respective Fund’s outstanding shares as follows:
| Number of Individual Affiliated Shareholder Accounts and/or Affiliated Omnibus Accounts | % of the Fund | Number of Individual Non-affiliated Shareholder Accounts and/or Non-affiliated Omnibus Accounts | % of the Fund | |||||||||||||
Global Research Enhanced Index Fund | 2 | 92.5 | % | — | — | % | ||||||||||
Global Unconstrained Equity Fund | — | — | 6 | 37.4 | ||||||||||||
International Equity Income Fund | — | — | 8 | 52.2 | ||||||||||||
International Research Enhanced Equity Fund | 2 | 13.6 | — | — | ||||||||||||
International Value Fund | — | — | 7 | 58.3 | ||||||||||||
Significant shareholder transactions by these shareholders may impact the Funds’ performance.
The Funds may have elements of risk not typically associated with investments in the United States of America due to concentrated investments in a limited number of countries or regions, which may vary throughout the year depending on the Fund. Such concentrations may subject the Funds to additional risks resulting from political or economic conditions in such countries or regions and the possible imposition of adverse governmental laws or currency exchange restrictions could cause the securities and their markets to be less liquid and their prices to be more volatile than those of comparable U.S. securities.
As of October 31, 2017, the following Funds had non-U.S. country allocations representing greater than 10% of total investments as follows:
| Brazil | China | France | Germany | India | Japan | |||||||||||||||||||
Emerging Economies Fund | — | % | 22.8 | % | — | % | — | % | — | % | — | % | ||||||||||||
Emerging Markets Equity Fund | 10.4 | 26.0 | — | — | 16.3 | — | ||||||||||||||||||
International Equity Fund | — | — | 13.3 | — | — | 20.1 | ||||||||||||||||||
International Equity Income Fund | — | — | — | 10.1 | — | 10.5 | ||||||||||||||||||
International Research Enhanced Equity Fund | — | — | 11.3 | 10.3 | — | 21.6 | ||||||||||||||||||
International Unconstrained Equity Fund | — | 10.4 | — | 10.8 | — | 11.8 | ||||||||||||||||||
International Value Fund | — | — | 15.9 | — | — | 22.5 | ||||||||||||||||||
Intrepid International Fund | — | 10.1 | — | 23.2 | ||||||||||||||||||||
| 134 | J.P. MORGAN INTERNATIONAL EQUITY FUNDS | OCTOBER 31, 2017 | ||||
Table of Contents
| Netherlands | South Korea | Switzerland | Taiwan | United Kingdom | ||||||||||||||||
Emerging Economies Fund | — | % | 17.4 | % | — | % | 11.5 | % | — | % | ||||||||||
International Equity Fund | — | — | 10.5 | — | 15.7 | |||||||||||||||
International Equity Income Fund | — | — | — | — | 22.0 | |||||||||||||||
International Research Enhanced Equity Fund | — | — | — | — | 15.8 | |||||||||||||||
International Unconstrained Equity Fund | — | — | — | — | 15.7 | |||||||||||||||
International Value Fund | — | — | — | — | 11.2 | |||||||||||||||
Intrepid International Fund | — | — | 10.5 | — | 14.1 | |||||||||||||||
As of October 31, 2017, a significant portion of each Fund’s investments consisted of securities that were denominated in foreign currencies. Changes in currency exchange rates will affect the value of, and investment income from, such securities.
8. Investment Company Reporting Modernization
In October 2016, the U.S. Securities and Exchange Commission adopted new rules and forms, and amendments to certain current rules and forms, to modernize the reporting and disclosure of information by registered investment companies. In part, the final rules amend Regulation S-X and require standardized, enhanced disclosures about derivatives in investment company financial statements, as well as other amendments. The amendments to Regulation S-X were applied to the Funds’ financial statements as of October 31, 2017. The adoption had no effect on the Funds’ net assets or results of operations.
| OCTOBER 31, 2017 | J.P. MORGAN INTERNATIONAL EQUITY FUNDS | 135 | ||||||
Table of Contents
REPORT OF INDEPENDENT REGISTERED PUBLIC ACCOUNTING FIRM
To the Board of Trustees of JPMorgan Trust I and JPMorgan Trust II and Shareholders of JPMorgan Emerging Economies Fund, JPMorgan Emerging Markets Equity Fund, JPMorgan Global Research Enhanced Index Fund, JPMorgan Global Unconstrained Equity Fund, JPMorgan International Equity Fund, JPMorgan International Equity Income Fund, JPMorgan International Research Enhanced Equity Fund, JPMorgan International Unconstrained Equity Fund, JPMorgan International Value Fund and JPMorgan Intrepid International Fund
In our opinion, the accompanying statements of assets and liabilities, including the schedules of portfolio investments, and the related statements of operations and of changes in net assets and the financial highlights present fairly, in all material respects, the financial position of JPMorgan Emerging Economies Fund, JPMorgan Emerging Markets Equity Fund, JPMorgan Global Research Enhanced Index Fund, JPMorgan Global Unconstrained Equity Fund, JPMorgan International Equity Fund, JPMorgan International Equity Income Fund, JPMorgan International Unconstrained Equity Fund, JPMorgan International Value Fund and JPMorgan Intrepid International Fund (each a separate fund of JPMorgan Trust I), and JPMorgan International Research Enhanced Equity Fund (a separate series of JPMorgan Trust II) (hereafter collectively referred to as the “Funds”) as of October 31, 2017, the results of each of their operations for the year then ended, the changes in each of their net assets for each of the two years in the period then ended and the financial highlights for each of the periods indicated therein, in conformity with accounting principles generally accepted in the United States of America. These financial statements and financial highlights (hereafter referred to as “financial statements”) are the responsibility of the Funds’ management. Our responsibility is to express an opinion on these financial statements based on our audits. We conducted our audits of these financial statements in accordance with the standards of the Public Company Accounting Oversight Board (United States). Those standards require that we plan and perform the audit to obtain reasonable assurance about whether the financial statements are free of material misstatement. An audit includes examining, on a test basis, evidence supporting the amounts and disclosures in the financial statements, assessing the accounting principles used and significant estimates made by management, and evaluating the overall financial statement presentation. We believe that our audits, which included confirmation of securities as of October 31, 2017 by correspondence with the transfer agent, custodian and brokers, provide a reasonable basis for our opinions.
/s/ PricewaterhouseCoopers LLP
New York, New York
December 22, 2017
| 136 | J.P. MORGAN INTERNATIONAL EQUITY FUNDS | OCTOBER 31, 2017 | ||||
Table of Contents
(Unaudited)
The Funds’ Statement of Additional Information includes additional information about the Funds’ Trustees and is available, without charge, upon request by calling 1-800-480-4111 or on the J.P. Morgan Funds’ website at www.jpmorganfunds.com.
Name (Year of Birth); Positions With the Funds (1) | Principal Occupation During Past 5 Years | Number of Funds in Fund Complex Overseen by Trustee (2) | Other Directorships Held During the Past 5 Years | |||
Independent Trustees | ||||||
| John F. Finn (1947); Trustee of Trusts since 2005; Trustee of heritage One Group Mutual Funds since 1998. | Chairman (1985-present), Chief Executive Officer, Gardner, Inc. (supply chain management company serving industrial and consumer markets) (1974-present). | 143 | Director, Greif, Inc. (GEF) (industrial package products and services) (2007-present); Trustee, Columbus Association for the Performing Arts (1988-present); Director, Cardinal Health, Inc. (CAH) (1994-2014). | |||
| Dr. Matthew Goldstein (1941); Chairman since 2013; Trustee of Trusts since 2005; Trustee of heritage J.P. Morgan Funds since 2003. | Chancellor Emeritus, City University of New York (2015-present); Professor, City University of New York (2013-present); Chancellor, City University of New York (1999-2013); President, Adelphi University (New York) (1998-1999). | 143 | Trustee, Museum of Jewish Heritage (2011-present); Trustee, National Museum of Mathematics (present); Chair, Association of College and University Administrators (present). | |||
| Dennis P. Harrington* (1950); Trustee of Trusts since 2017. | Retired; Partner, Deloitte LLP (1984-2012). | 143 | None | |||
| Frankie D. Hughes (1952); Trustee of Trusts since 2008. | President, Ashland Hughes Properties (property management) (2014-present); President and Chief Investment Officer, Hughes Capital Management, Inc. (fixed income asset management) (1993-2014). | 143 | None | |||
Raymond Kanner** (1953); Trustee of the Trusts since 2017. | Retired; Managing Director & Chief Investment Officer, IBM Retirement Funds (2007-2016). | 143 | Director, Emerging Markets Growth Fund (1997-2016); Acting Executive Director, Committee on Investment of Employee Benefit Assets (CIEBA), 2016-17; Advisory Board Member, Betterment for Business (2016-present) (robo advisor); Advisory Board Member, Blue Star Indexes (2013-present) (index creator); Member, Russell Index Client Advisory Board (2001-2015). | |||
| Peter C. Marshall (1942); Trustee of Trusts since 2005; Trustee of heritage One Group Mutual Funds since 1985. | Self-employed business consultant (2002-present). | 143 | None | |||
| Mary E. Martinez (1960); Trustee of Trusts since 2013. | Associate, Special Properties, a Christie’s International Real Estate Affiliate (2010-present); Managing Director, Bank of America (Asset Management) (2007-2008); Chief Operating Officer, U.S. Trust Asset Management, U.S. Trust Company (asset management) (2003-2007); President, Excelsior Funds (registered investment companies) (2004-2005). | 143 | None | |||
| Marilyn McCoy*** (1948); Trustee of Trusts since 2005; Trustee of heritage One Group Mutual Funds since 1999. | Vice President of Administration and Planning, Northwestern University (1985-present). | 143 | None | |||
| OCTOBER 31, 2017 | J.P. MORGAN INTERNATIONAL EQUITY FUNDS | 137 | ||||||
Table of Contents
TRUSTEES
(Unaudited) (continued)
Name (Year of Birth); Positions With the Funds (1) | Principal Occupation During Past 5 Years | Number of Funds in Fund Complex Overseen by Trustee (2) | Other Directorships Held During the Past 5 Years | |||
Independent Trustees (continued) | ||||||
| Mitchell M. Merin (1953); Trustee of Trusts since 2013. | Retired; President and Chief Operating Officer, Morgan Stanley Investment Management, Member Morgan Stanley & Co. Management Committee (registered investment adviser) (1985-2005). | 143 | Director, Sun Life Financial (SLF) (2007-2013) (financial services and insurance). | |||
| Dr. Robert A. Oden, Jr. (1946); Trustee of Trusts since 2005; Trustee of heritage One Group Mutual Funds since 1997. | Retired; President, Carleton College (2002-2010); President, Kenyon College (1995-2002). | 143 | Chairman, Dartmouth-Hitchcock Medical Center (2011-present); Trustee, American Schools of Oriental Research (2011-present); Trustee, American University in Cairo (1999-2014); Trustee, American Museum of Fly Fishing (2013-present). | |||
| Marian U. Pardo**** (1946); Trustee of Trusts since 2013. | Managing Director and Founder, Virtual Capital Management LLC (Investment Consulting) (2007-present); Managing Director, Credit Suisse Asset Management (portfolio manager) (2003-2006). | 143 | Member, Board of Governors, Columbus Citizens Foundation (not-for-profit supporting philanthropic and cultural programs) (2006-present). | |||
| Frederick W. Ruebeck (1939); Trustee of Trusts since 2005; Trustee of heritage One Group Mutual Funds since 1994. | Consultant (2000-present); Advisor, JP Greene & Associates, LLC (broker-dealer) (2000-2009); Chief Investment Officer, Wabash College (2004-2015); Director of Investments, Eli Lilly and Company (pharmaceuticals) (1988-1999). | 143 | Trustee, Wabash College (2000-present). | |||
| James J. Schonbachler (1943); Trustee of Trusts since 2005; Trustee of heritage J.P. Morgan Funds since 2001. | Retired; Managing Director of Bankers Trust Company (financial services) (1968-1998). | 143 | None | |||
| (1) | The Trustees serve for an indefinite term, subject to the Trusts’ current retirement policy, which is age 78 for all Trustees. |
| (2) | A Fund Complex means two or more registered investment companies that hold themselves out to investors as related companies for purposes of investment and investor services or have a common investment adviser or have an investment adviser that is an affiliated person of the investment adviser of any of the other registered investment companies. The J.P. Morgan Funds Complex for which the Board of Trustees serves currently includes twelve registered investment companies (143 funds). |
| * | Two family members of Mr. Harrington are partner and managing director, respectively, of the Funds’ independent registered public accounting firm. Such firm has represented to the Board that those family members are not involved in the audit of the Funds’ financial statements and do not provide other services to the Funds. The Board has concluded that such association does not interfere with Mr. Harrington’s exercise of independent judgment as an Independent Trustee. |
| ** | A family member of Mr. Kanner is employed by JPMorgan Chase Bank, which is affiliated with JPMIM and JPMDS. In that capacity, this employee provides services to various JPMorgan affiliates including JPMIM and JPMDS and for which JPMIM and JPMDS bear some portion of the expense thereof. |
| *** | Two members of the Board of Trustees of Northwestern University are executive officers of registered investment advisers (not affiliated with JPMorgan) that are under common control with sub-advisers to certain J.P. Morgan Funds. |
| **** | In connection with prior employment with JPMorgan Chase, Ms. Pardo was the recipient of non-qualified pension plan payments from JPMorgan Chase in the amount of approximately $2,055 per month, which she irrevocably waived effective January 1, 2013, and deferred compensation payments from JPMorgan Chase in the amount of approximately $7,294 per year, which ended in January 2013. In addition, Ms. Pardo receives payments from a fully-funded qualified plan, which is not an obligation of JPMorgan Chase. |
The contact address for each of the Trustees is 270 Park Avenue, New York, NY 10017.
| 138 | J.P. MORGAN INTERNATIONAL EQUITY FUNDS | OCTOBER 31, 2017 | ||||
Table of Contents
(Unaudited)
Name (Year of Birth), Positions Held with the Trusts (Since) | Principal Occupations During Past 5 Years | |
| Brian S. Shlissel (1964), President and Principal Executive Officer (2016) | Managing Director and Chief Administrative Officer for J.P. Morgan pooled vehicles, J.P. Morgan Investment Management Inc. (formerly JPMorgan Funds Management, Inc.) (2014 – present); Managing Director and Head of Mutual Fund Services, Allianz Global Investors; President and Chief Executive Officer, Allianz Global Investors Mutual Funds and PIMCO Closed-End Funds (1999-2014) | |
| Frank J. Nasta (1964), Secretary (2008) | Managing Director and Associate General Counsel, JPMorgan Chase since 2008. | |
| Stephen M. Ungerman (1953), Chief Compliance Officer (2005) | Managing Director, JPMorgan Chase & Co.; Mr. Ungerman has been with JPMorgan Chase & Co. since 2000. | |
Elizabeth A. Davin (1964), Assistant Secretary (2005)* | Executive Director and Assistant General Counsel, JPMorgan Chase since February 2012; formerly Vice President and Assistant General Counsel, JPMorgan Chase from 2005 to February 2012; Senior Counsel, JPMorgan Chase (formerly Bank One Corporation) from 2004 to 2005. | |
| Jessica K. Ditullio (1962), Assistant Secretary (2005)* | Executive Director and Assistant General Counsel, JPMorgan Chase. Ms. Ditullio has been with JPMorgan Chase (formerly Bank One Corporation) since 1990. | |
| John T. Fitzgerald (1975), Assistant Secretary (2008) | Executive Director and Assistant General Counsel, JPMorgan Chase. Mr. Fitzgerald has been with JPMorgan Chase since 2005. | |
| Carmine Lekstutis (1980), Assistant Secretary (2011) | Executive Director and Assistant General Counsel, JPMorgan Chase since February 2015; formerly Vice President and Assistant General Counsel, JPMorgan Chase from 2011 to February 2015. | |
| Gregory S. Samuels (1980), Assistant Secretary (2010) | Executive Director and Assistant General Counsel, JPMorgan Chase since 2014; formerly Vice President and Assistant General Counsel, JPMorgan Chase since 2010. | |
| Pamela L. Woodley (1971), Assistant Secretary (2012) | Vice President and Assistant General Counsel, JPMorgan Chase since November 2004. | |
Zachary E. Vonnegut-Gabovitch (1986) Assistant Secretary (2017) | Vice President and Assistant General Counsel, JPMorgan Chase since September 2016; Associate, Morgan, Lewis & Bockius (law firm) from 2012 to 2016. | |
Michael M. D’Ambrosio (1969), Assistant Treasurer (2012) | Managing Director, J.P. Morgan Investment Management Inc. (formerly JPMorgan Funds Management, Inc.) since May 2014; formerly Executive Director, JPMorgan Funds Management, Inc. from 2012 to May 2014; prior to joining JPMorgan Chase, Mr. D’Ambrosio was a Tax Director at PricewaterhouseCoopers LLP from 2006 to 2012. | |
Jeffrey D. House (1972), Assistant Treasurer (2017)* | Vice President, J.P. Morgan Investment Management Inc. (formerly JPMorgan Funds Management, Inc.) since July 2006. | |
Lauren A. Paino (1973), Assistant Treasurer (2014)** | Executive Director, J.P. Morgan Investment Management Inc. (formerly JPMorgan Funds Management, Inc.) since August 2013; formerly Director, Credit Suisse Asset Management from 2000-2013. | |
| Joseph Parascondola (1963), Assistant Treasurer (2011)** | Vice President, J.P. Morgan Investment Management Inc. (formerly JPMorgan Funds Management, Inc.) since August 2006. | |
Matthew J. Plastina (1970), Acting Treasurer and Principal Financial Officer (2017), formerly Assistant Treasurer (2011-2017)** | Executive Director, J.P. Morgan Investment Management Inc. (formerly JPMorgan Funds Management, Inc.) since February 2016; Vice President, JPMorgan Funds Management, Inc. from 2010 to January 2016. | |
Gillian I. Sands (1969), Assistant Treasurer (2012)** | Vice President, J.P. Morgan Investment Management Inc. (formerly JPMorgan Funds Management, Inc.) since September 2012. | |
The contact address for each of the officers, unless otherwise noted, is 270 Park Avenue, New York, NY 10017.
| * | The contact address for the officer is 1111 Polaris Parkway, Columbus, OH 43240. |
| ** | The contact address for the officer is 4 New York Plaza, New York, NY 10004. |
| OCTOBER 31, 2017 | J.P. MORGAN INTERNATIONAL EQUITY FUNDS | 139 | ||||||
Table of Contents
SCHEDULE OF SHAREHOLDER EXPENSES
(Unaudited)
Hypothetical $1,000 Investment
As a shareholder of the Funds, you incur two types of costs: (1) transaction costs, including sales charges (loads) on purchase payments and redemption fees and (2) ongoing costs, including investment advisory fees, administration fees, distribution fees and other Fund expenses. The examples below are intended to help you understand your ongoing costs (in dollars) of investing in the Funds and to compare these ongoing costs with the ongoing costs of investing in other mutual funds. The examples assume that you had a $1,000 investment in each Class at the beginning of the reporting period, May 1, 2017, and continued to hold your shares at the end of the reporting period, October 31, 2017.
Actual Expenses
For each Class of each Fund in the table below, the first line provides information about actual account values and actual expenses. You may use the information in this line, together with the amount you invested, to estimate the expenses that you paid over the period. Simply divide your account value by $1,000 (for example, an $8,600 account value divided by $1,000 = 8.6), then multiply the result by the number in the first line of each Class under the heading entitled “Expenses Paid During the Period” to estimate the expenses you paid on your account during this period.
Hypothetical Example for Comparison Purposes
The second line of each Class in the table below provides information about hypothetical account values and hypothetical expenses based on the Class’ actual expense ratio and an assumed rate of return of 5% per year before expenses, which is not the Class’ actual return. The hypothetical account values and expenses may not be used to estimate the actual ending account balance or expenses you paid for the period. You may use this information to compare the ongoing costs of investing in the Class of the Funds and other funds. To do so, compare this 5% hypothetical example with the 5% hypothetical examples that appear in the shareholder reports of the other funds. Please note that the expenses shown in the table are meant to highlight your ongoing costs only and do not reflect any transaction costs, such as sales charges (loads) or redemption fees. Therefore, the second line for each Class in the table is useful in comparing ongoing costs only, and will not help you determine the relative total costs of owning different funds. In addition, if these transaction costs were included, your costs would have been higher. The examples also assume all dividends and distributions have been reinvested.
Beginning Account Value May 1, 2017 | Ending Account Value October 31, 2017 | Expenses Paid During the Period | Annualized Expense Ratio | |||||||||||||
Emerging Economies Fund | ||||||||||||||||
Class A | ||||||||||||||||
Actual* | $ | 1,000.00 | $ | 1,166.30 | $ | 7.26 | 1.33 | % | ||||||||
Hypothetical* | 1,000.00 | 1,018.50 | 6.77 | 1.33 | ||||||||||||
Class C | ||||||||||||||||
Actual* | 1,000.00 | 1,163.30 | 10.09 | 1.85 | ||||||||||||
Hypothetical* | 1,000.00 | 1,015.88 | 9.40 | 1.85 | ||||||||||||
Class I (formerly Select Class) | ||||||||||||||||
Actual* | 1,000.00 | 1,167.30 | 6.01 | 1.10 | ||||||||||||
Hypothetical* | 1,000.00 | 1,019.66 | 5.60 | 1.10 | ||||||||||||
Class R5 | ||||||||||||||||
Actual* | 1,000.00 | 1,168.20 | 5.19 | 0.95 | ||||||||||||
Hypothetical* | 1,000.00 | 1,020.42 | 4.84 | 0.95 | ||||||||||||
Class R6 | ||||||||||||||||
Actual* | 1,000.00 | 1,169.00 | 4.65 | 0.85 | ||||||||||||
Hypothetical* | 1,000.00 | 1,020.92 | 4.33 | 0.85 | ||||||||||||
Emerging Markets Equity Fund | ||||||||||||||||
Class A | ||||||||||||||||
Actual* | 1,000.00 | 1,157.90 | 7.34 | 1.35 | ||||||||||||
Hypothetical* | 1,000.00 | 1,018.40 | 6.87 | 1.35 | ||||||||||||
Class C | ||||||||||||||||
Actual* | 1,000.00 | 1,155.20 | 10.05 | 1.85 | ||||||||||||
Hypothetical* | 1,000.00 | 1,015.88 | 9.40 | 1.85 | ||||||||||||
Class I (formerly Select Class) | ||||||||||||||||
Actual* | 1,000.00 | 1,159.30 | 5.99 | 1.10 | ||||||||||||
Hypothetical* | 1,000.00 | 1,019.66 | 5.60 | 1.10 | ||||||||||||
Class L (formerly Institutional Class) | ||||||||||||||||
Actual* | 1,000.00 | 1,160.50 | 5.17 | 0.95 | ||||||||||||
Hypothetical* | 1,000.00 | 1,020.42 | 4.84 | 0.95 | ||||||||||||
| 140 | J.P. MORGAN INTERNATIONAL EQUITY FUNDS | OCTOBER 31, 2017 | ||||
Table of Contents
Beginning Account Value May 1, 2017 | Ending Account Value October 31, 2017 | Expenses Paid During the Period | Annualized Expense Ratio | |||||||||||||
Emerging Markets Equity Fund (continued) | ||||||||||||||||
Class R2 | ||||||||||||||||
Actual** | $ | 1,000.00 | $ | 1,044.30 | $ | 8.24 | 3.20 | % | ||||||||
Hypothetical* | 1,000.00 | 1,009.07 | 16.20 | 3.20 | ||||||||||||
Class R3 | ||||||||||||||||
Actual** | 1,000.00 | 1,045.10 | 6.96 | 2.70 | ||||||||||||
Hypothetical* | 1,000.00 | 1,011.59 | 13.69 | 2.70 | ||||||||||||
Class R4 | ||||||||||||||||
Actual** | 1,000.00 | 1,045.50 | 5.67 | 2.20 | ||||||||||||
Hypothetical* | 1,000.00 | 1,014.12 | 11.17 | 2.20 | ||||||||||||
Class R5 | ||||||||||||||||
Actual* | 1,000.00 | 1,160.10 | 5.17 | 0.95 | ||||||||||||
Hypothetical* | 1,000.00 | 1,020.42 | 4.84 | 0.95 | ||||||||||||
Class R6 | ||||||||||||||||
Actual* | 1,000.00 | 1,161.20 | 4.63 | 0.85 | ||||||||||||
Hypothetical* | 1,000.00 | 1,020.92 | 4.33 | 0.85 | ||||||||||||
Global Research Enhanced Index Fund | ||||||||||||||||
Class I (formerly Select Class) | ||||||||||||||||
Actual* | 1,000.00 | 1,093.20 | 1.79 | 0.34 | ||||||||||||
Hypothetical* | 1,000.00 | 1,023.49 | 1.73 | 0.34 | ||||||||||||
Global Unconstrained Equity Fund | ||||||||||||||||
Class A | ||||||||||||||||
Actual* | 1,000.00 | 1,063.30 | 3.85 | 0.74 | ||||||||||||
Hypothetical* | 1,000.00 | 1,021.48 | 3.77 | 0.74 | ||||||||||||
Class C | ||||||||||||||||
Actual* | 1,000.00 | 1,060.80 | 6.44 | 1.24 | ||||||||||||
Hypothetical* | 1,000.00 | 1,018.95 | 6.31 | 1.24 | ||||||||||||
Class I (formerly Select Class) | ||||||||||||||||
Actual* | 1,000.00 | 1,065.30 | 2.08 | 0.40 | ||||||||||||
Hypothetical* | 1,000.00 | 1,023.19 | 2.04 | 0.40 | ||||||||||||
Class R2 | ||||||||||||||||
Actual* | 1,000.00 | 1,062.20 | 5.20 | 1.00 | ||||||||||||
Hypothetical* | 1,000.00 | 1,020.16 | 5.09 | 1.00 | ||||||||||||
Class R5 | ||||||||||||||||
Actual* | 1,000.00 | 1,066.10 | 1.56 | 0.30 | ||||||||||||
Hypothetical* | 1,000.00 | 1,023.69 | 1.53 | 0.30 | ||||||||||||
Class R6 | ||||||||||||||||
Actual* | 1,000.00 | 1,066.20 | 1.30 | 0.25 | ||||||||||||
Hypothetical* | 1,000.00 | 1,023.95 | 1.28 | 0.25 | ||||||||||||
International Equity Fund | ||||||||||||||||
Class A | ||||||||||||||||
Actual* | 1,000.00 | 1,130.80 | 6.61 | 1.23 | ||||||||||||
Hypothetical* | 1,000.00 | 1,019.00 | 6.26 | 1.23 | ||||||||||||
Class C | ||||||||||||||||
Actual* | 1,000.00 | 1,127.30 | 9.33 | 1.74 | ||||||||||||
Hypothetical* | 1,000.00 | 1,016.43 | 8.84 | 1.74 | ||||||||||||
Class I (formerly Select Class) | ||||||||||||||||
Actual* | 1,000.00 | 1,132.00 | 5.32 | 0.99 | ||||||||||||
Hypothetical* | 1,000.00 | 1,020.21 | 5.04 | 0.99 | ||||||||||||
Class R2 | ||||||||||||||||
Actual* | 1,000.00 | 1,128.80 | 7.99 | 1.49 | ||||||||||||
Hypothetical* | 1,000.00 | 1,017.69 | 7.58 | 1.49 | ||||||||||||
Class R5 | ||||||||||||||||
Actual* | 1,000.00 | 1,133.10 | 4.52 | 0.84 | ||||||||||||
Hypothetical* | 1,000.00 | 1,020.97 | 4.28 | 0.84 | ||||||||||||
| OCTOBER 31, 2017 | J.P. MORGAN INTERNATIONAL EQUITY FUNDS | 141 | ||||||
Table of Contents
SCHEDULE OF SHAREHOLDER EXPENSES
(Unaudited) (continued)
Hypothetical $1,000 Investment
Beginning Account Value May 1, 2017 | Ending Account Value October 31, 2017 | Expenses Paid During the Period | Annualized Expense Ratio | |||||||||||||
International Equity Fund (continued) | ||||||||||||||||
Class R6 | ||||||||||||||||
Actual* | $ | 1,000.00 | $ | 1,133.10 | $ | 3.98 | 0.74 | % | ||||||||
Hypothetical* | 1,000.00 | 1,021.48 | 3.77 | 0.74 | ||||||||||||
International Equity Income Fund | ||||||||||||||||
Class A | ||||||||||||||||
Actual* | 1,000.00 | 1,087.90 | 6.58 | 1.25 | ||||||||||||
Hypothetical* | 1,000.00 | 1,018.90 | 6.36 | 1.25 | ||||||||||||
Class C | ||||||||||||||||
Actual* | 1,000.00 | 1,085.10 | 9.20 | 1.75 | ||||||||||||
Hypothetical* | 1,000.00 | 1,016.38 | 8.89 | 1.75 | ||||||||||||
Class I (formerly Select Class) | ||||||||||||||||
Actual* | 1,000.00 | 1,089.90 | 4.74 | 0.90 | ||||||||||||
Hypothetical* | 1,000.00 | 1,020.67 | 4.58 | 0.90 | ||||||||||||
Class R2 | ||||||||||||||||
Actual* | 1,000.00 | 1,086.90 | 7.89 | 1.50 | ||||||||||||
Hypothetical* | 1,000.00 | 1,017.64 | 7.63 | 1.50 | ||||||||||||
Class R5 | ||||||||||||||||
Actual* | 1,000.00 | 1,090.90 | 4.22 | 0.80 | ||||||||||||
Hypothetical* | 1,000.00 | 1,021.17 | 4.08 | 0.80 | ||||||||||||
Class R6 | ||||||||||||||||
Actual* | 1,000.00 | 1,090.60 | 3.90 | 0.74 | ||||||||||||
Hypothetical* | 1,000.00 | 1,021.48 | 3.77 | 0.74 | ||||||||||||
International Research Enhanced Equity Fund | ||||||||||||||||
Class A | ||||||||||||||||
Actual* | 1,000.00 | 1,097.10 | 3.12 | 0.59 | ||||||||||||
Hypothetical* | 1,000.00 | 1,022.23 | 3.01 | 0.59 | ||||||||||||
Class I (formerly Select Class) | ||||||||||||||||
Actual* | 1,000.00 | 1,098.10 | 1.80 | 0.34 | ||||||||||||
Hypothetical* | 1,000.00 | 1,023.49 | 1.73 | 0.34 | ||||||||||||
International Unconstrained Equity Fund | ||||||||||||||||
Class A | ||||||||||||||||
Actual* | 1,000.00 | 1,122.10 | 6.63 | 1.24 | ||||||||||||
Hypothetical* | 1,000.00 | 1,018.95 | 6.31 | 1.24 | ||||||||||||
Class C | ||||||||||||||||
Actual* | 1,000.00 | 1,118.80 | 9.29 | 1.74 | ||||||||||||
Hypothetical* | 1,000.00 | 1,016.43 | 8.84 | 1.74 | ||||||||||||
Class I (formerly Select Class) | ||||||||||||||||
Actual* | 1,000.00 | 1,123.90 | 4.76 | 0.89 | ||||||||||||
Hypothetical* | 1,000.00 | 1,020.72 | 4.53 | 0.89 | ||||||||||||
Class R2 | ||||||||||||||||
Actual* | 1,000.00 | 1,120.50 | 7.96 | 1.49 | ||||||||||||
Hypothetical* | 1,000.00 | 1,017.69 | 7.58 | 1.49 | ||||||||||||
Class R5 | ||||||||||||||||
Actual* | 1,000.00 | 1,124.00 | 4.23 | 0.79 | ||||||||||||
Hypothetical* | 1,000.00 | 1,021.22 | 4.02 | 0.79 | ||||||||||||
Class R6 | ||||||||||||||||
Actual* | 1,000.00 | 1,124.50 | 3.96 | 0.74 | ||||||||||||
Hypothetical* | 1,000.00 | 1,021.48 | 3.77 | 0.74 | ||||||||||||
International Value Fund | ||||||||||||||||
Class A | ||||||||||||||||
Actual* | 1,000.00 | 1,094.40 | 7.18 | 1.36 | ||||||||||||
Hypothetical* | 1,000.00 | 1,018.35 | 6.92 | 1.36 | ||||||||||||
| 142 | J.P. MORGAN INTERNATIONAL EQUITY FUNDS | OCTOBER 31, 2017 | ||||
Table of Contents
Beginning Account Value May 1, 2017 | Ending Account Value October 31, 2017 | Expenses Paid During the Period | Annualized Expense Ratio | |||||||||||||
International Value Fund (continued) | ||||||||||||||||
Class C | ||||||||||||||||
Actual* | $ | 1,000.00 | $ | 1,091.90 | $ | 9.81 | 1.86 | % | ||||||||
Hypothetical* | 1,000.00 | 1,015.83 | 9.45 | 1.86 | ||||||||||||
Class I (formerly Select Class) | ||||||||||||||||
Actual* | 1,000.00 | 1,096.80 | 5.50 | 1.04 | ||||||||||||
Hypothetical* | 1,000.00 | 1,019.96 | 5.30 | 1.04 | ||||||||||||
Class L (formerly Institutional Class) | ||||||||||||||||
Actual* | 1,000.00 | 1,097.30 | 4.65 | 0.88 | ||||||||||||
Hypothetical* | 1,000.00 | 1,020.77 | 4.48 | 0.88 | ||||||||||||
Class R2 | ||||||||||||||||
Actual* | 1,000.00 | 1,093.70 | 8.34 | 1.58 | ||||||||||||
Hypothetical* | 1,000.00 | 1,017.24 | 8.03 | 1.58 | ||||||||||||
Class R5 | ||||||||||||||||
Actual* | 1,000.00 | 1,097.60 | 4.97 | 0.94 | ||||||||||||
Hypothetical* | 1,000.00 | 1,020.47 | 4.79 | 0.94 | ||||||||||||
Class R6 | ||||||||||||||||
Actual* | 1,000.00 | 1,098.30 | 4.39 | 0.83 | ||||||||||||
Hypothetical* | 1,000.00 | 1,021.02 | 4.23 | 0.83 | ||||||||||||
Intrepid International Fund | ||||||||||||||||
Class A | ||||||||||||||||
Actual* | 1,000.00 | 1,106.60 | 6.48 | 1.22 | ||||||||||||
Hypothetical* | 1,000.00 | 1,019.06 | 6.21 | 1.22 | ||||||||||||
Class C | ||||||||||||||||
Actual* | 1,000.00 | 1,103.40 | 9.28 | 1.75 | ||||||||||||
Hypothetical* | 1,000.00 | 1,016.38 | 8.89 | 1.75 | ||||||||||||
Class I (formerly Select Class) | ||||||||||||||||
Actual* | 1,000.00 | 1,108.30 | 4.78 | 0.90 | ||||||||||||
Hypothetical* | 1,000.00 | 1,020.67 | 4.58 | 0.90 | ||||||||||||
Class R2 | ||||||||||||||||
Actual* | 1,000.00 | 1,105.50 | 7.96 | 1.50 | ||||||||||||
Hypothetical* | 1,000.00 | 1,017.64 | 7.63 | 1.50 | ||||||||||||
Class R6 | ||||||||||||||||
Actual* | 1,000.00 | 1,109.10 | 3.77 | 0.71 | ||||||||||||
Hypothetical* | 1,000.00 | 1,021.63 | 3.62 | 0.71 | ||||||||||||
| * | Expenses are equal to each Class’ respective annualized expense ratio, multiplied by the average account value over the period, multiplied by 181/365 (to reflect the one-half year period). |
| ** | Expenses are equal to each Class’ respective annualized expense ratio, multiplied by the average account value over the period, multiplied by 92/365 (to reflect the actual period). Commencement of operations was July 31, 2017. |
| OCTOBER 31, 2017 | J.P. MORGAN INTERNATIONAL EQUITY FUNDS | 143 | ||||||
Table of Contents
BOARD APPROVAL OF INVESTMENT ADVISORY AGREEMENTS
(Unaudited)
The Board of Trustees has established various standing committees composed of Trustees with diverse backgrounds, to which the Board of Trustees has assigned specific subject matter responsibilities to further enhance the effectiveness of the Board’s oversight and decision making. The Board of Trustees and its investment committees (money market and alternative products, equity, and fixed income) meet regularly throughout the year and consider factors that are relevant to their annual consideration of investment advisory agreements at each meeting. They also meet for the specific purpose of considering investment advisory agreement annual renewals. The Board of Trustees held meetings in person in June and August 2017, at which the Trustees considered the continuation of the investment advisory agreements for each of the Funds whose annual report is contained herein (each an “Advisory Agreement” and collectively, the “Advisory Agreements”). At the June meeting, the Board’s investment committees met to review and consider performance, expense and related information for the J.P. Morgan Funds. Each investment committee reported to the full Board, which then considered the investment committee’s preliminary findings. At the August meeting, the Trustees continued their review and consideration. The Trustees, including a majority of the Trustees who are not “interested persons” (as defined in the 1940 Act) of any party to the Advisory Agreements or any of their affiliates, approved the continuation of each Advisory Agreement on August 16, 2017.
As part of their review of the Advisory Agreements, the Trustees considered and reviewed performance and other information about the Funds received from the Adviser. This information includes the Funds’ performance as compared to the performance of their peers and benchmarks and analyses by the Adviser of the Funds’ performance. In addition, the Trustees have engaged an independent management consulting firm (“independent consultant”) to report on the performance of certain J.P. Morgan Funds at each of the Trustees’ regular meetings. In addition, in preparation for the June and August meetings, the Trustees requested, received and evaluated extensive materials from the Adviser, including performance and expense analyses compiled by Broadridge, using data from Lipper Inc., independent providers of investment company data (together, “Broadridge/Lipper”). The Trustees’ independent consultant also provided additional analyses of the performance of the Funds in connection with the Trustees’ review of the Advisory Agreements. Before voting on the proposed Advisory Agreements, the Trustees reviewed the proposed Advisory Agreements with representatives of the Adviser, counsel to the Trusts and independent legal counsel and received a memorandum from independent legal counsel to the Trustees discussing the legal standards for their consideration of the proposed Advisory Agreements. The Trustees also discussed the proposed Advisory Agreements in executive sessions with independent legal
counsel at which no representatives of the Adviser were
present. Set forth below is a summary of the material factors evaluated by the Trustees in determining whether to approve each Advisory Agreement.
The Trustees considered information provided with respect to the Funds over the course of the year. Each Trustee attributed different weights to the various factors and no factor alone was considered determinative. From year to year, the Trustees consider and place emphasis on relevant information in light of changing circumstances in market and economic conditions. The Trustees determined that the compensation to be received by the Adviser from each Fund under the applicable Advisory Agreement was fair and reasonable and that the continuance of each Advisory Agreement was in the best interests of each Fund and its shareholders.
The factors summarized below were considered and discussed by the Trustees in reaching their conclusions:
Nature, Extent and Quality of Services Provided by the Adviser
The Trustees received and considered information regarding the nature, extent and quality of the services provided to each Fund under the Advisory Agreement. The Trustees took into account information furnished throughout the year at Trustee meetings, as well as the materials furnished specifically in connection with this annual review process. The Trustees considered the background and experience of the Adviser’s senior management and the expertise of, and the amount of attention given to each Fund by, investment personnel of the Adviser. In addition, the Trustees reviewed the qualifications, backgrounds and responsibilities of the portfolio management team primarily responsible for the day-to-day management of each Fund and the infrastructure supporting the team. The Trustees also considered information provided by the Adviser and JPMorgan Distribution Services, Inc. (“JPMDS”) about the structure and distribution strategy of each Fund. The Trustees reviewed information relating to the Adviser’s risk governance model and reports showing the Adviser’s compliance structure and ongoing compliance processes. The Trustees also considered the quality of the administrative services provided by J.P. Morgan Investment Management Inc. in its role as administrator (“JPMIM”).
The Trustees also considered their knowledge of the nature and quality of the services provided by the Adviser and its affiliates to the Funds gained from their experience as Trustees of the J.P. Morgan Funds. In addition, they considered the overall reputation and capabilities of the Adviser and its affiliates, the commitment of the Adviser to provide high quality service to the Funds, their overall confidence in the Adviser’s integrity and the Adviser’s responsiveness to questions or concerns raised by them, including the Adviser’s willingness to consider and implement organizational and operational changes designed to improve investment results and the services provided to each Fund.
| 144 | J.P. MORGAN INTERNATIONAL EQUITY FUNDS | OCTOBER 31, 2017 | ||||
Table of Contents
Based upon these considerations and other factors, the Trustees concluded that they were satisfied with the nature, extent and quality of the investment advisory services provided to the Funds by the Adviser.
Costs of Services Provided and Profitability to the Adviser and its Affiliates
The Trustees received and considered information regarding the profitability to the Adviser and its affiliates in providing services to each Fund. The Trustees reviewed and discussed this data. The Trustees recognized that this data is not audited and represents the Adviser’s determination of its and its affiliates’ revenues from the contractual services provided to the Funds, less expenses of providing such services. Expenses include direct and indirect costs and are calculated using an allocation methodology developed by the Adviser. The Trustees also recognized that it is difficult to make comparisons of profitability from fund investment advisory contracts because comparative information is not generally publicly available and is affected by numerous factors, including the structure of the particular adviser, the types of funds it manages, its business mix, numerous assumptions regarding allocations and the fact that publicly-traded fund managers’ operating profits and net income are net of distribution and marketing expenses. Based upon their review, the Trustees concluded that the profitability to the Adviser under each of the Advisory Agreements was not unreasonable in light of the services and benefits provided to each Fund.
Fall-Out Benefits
The Trustees reviewed information regarding potential “fallout” or ancillary benefits received by the Adviser and its affiliates as a result of their relationship with the Funds. The Trustees also reviewed the Adviser’s allocation of fund brokerage for the J.P. Morgan Funds complex, including allocations to brokers who provide research to the Adviser.
The Trustees also considered that JPMDS, an affiliate of the Adviser, and JPMIM earn fees from the Funds for providing shareholder and administrative services, respectively. These fees were shown separately in the profitability analysis presented to the Trustees. The Trustees also considered the payments of Rule 12b-1 fees to JPMDS, which also acts as the Funds’ distributor and that these fees are in turn generally paid to financial intermediaries that sell the Funds, including financial intermediaries that are affiliates of the Adviser. The Trustees also considered the fees paid to JPMorgan Chase Bank, N.A. (“JPMCB”) for custody and fund accounting, and other related services.
Economies of Scale
The Trustees considered the extent to which the Funds may benefit from economies of scale. The Trustees considered that
there may not be a direct relationship between economies of scale realized by the Funds and those realized by the Adviser as assets increase. The Trustees considered whether it would be appropriate to add advisory fee breakpoints, but noted that the fund has implemented fee waivers and expense limitations (“Fee Caps”) which allow each Fund’s shareholders to share potential economies of scale from a Fund’s inception and that the fees remain competitive with peer funds. The Trustees also considered that the Adviser has shared economies of scale by adding or enhancing services to the Funds over time, noting the Adviser’s substantial investments in its business in support of the Funds, including investments in trading systems and technology (including cybersecurity improvements), retention of key talent, additions to analyst and portfolio management teams, and regulatory support enhancements. The Trustees concluded that the current fee structure was reasonable in light of the contractual Fee Caps that the Adviser has in place that serve to limit the overall net expense ratios of each Fund at competitive levels. The Trustees concluded that the Funds’ shareholders received the benefits of potential economies of scale through the contractual Fee Caps and the Adviser’s reinvestment in its operations to serve the Funds and their shareholders.
Independent Written Evaluation of the Funds’ Senior Officer/ Chief Compliance Officer
The Trustees noted that, upon their direction, the Senior Officer for the International Equity Fund and International Research Enhanced Equity Fund had prepared an independent written evaluation in order to assist the Trustees in determining the reasonableness of the proposed management fees. The Trustees considered the Senior Officer’s report in determining whether to continue the Advisory Agreements.
The Trustees noted that, upon their direction, the Chief Compliance Officer for the Emerging Economies Fund, Emerging Markets Equity Fund, Global Research Enhanced Index Fund, Global Unconstrained Equity Fund, International Equity Income Fund, International Unconstrained Equity Fund, International Value Fund and Intrepid International Fund had prepared an independent written evaluation in order to assist the Trustees in determining the reasonableness of the proposed management fees. The Trustees considered the written evaluation in determining whether to continue the Advisory Agreements.
Fees Relative to Adviser’s Other Clients
The Trustees received and considered information about the nature and extent of investment advisory services and fee rates offered to other clients of the Adviser, including institutional separate accounts and/or funds sub-advised by the Adviser, and for investment management styles substantially similar to that of each Fund. The Trustees considered the complexity of investment management for registered mutual funds relative
| OCTOBER 31, 2017 | J.P. MORGAN INTERNATIONAL EQUITY FUNDS | 145 | ||||||
Table of Contents
BOARD APPROVAL OF INVESTMENT ADVISORY AGREEMENTS
(Unaudited) (continued)
to the Adviser’s other clients and noted differences in the regulatory, legal and other risks and responsibilities of providing services to the different clients. The Trustees considered that serving as an adviser to a registered mutual fund involves greater responsibilities and risks than acting as a sub-adviser and observed that sub-advisory fees may be lower than those charged by the Adviser to each Fund. The Trustees also noted that the adviser, not the mutual fund, pays the sub-advisory fee and that many responsibilities related to the advisory function are retained by the primary adviser. The Trustees concluded that the fee rates charged to each Fund in comparison to those charged to the Adviser’s other clients were reasonable.
Investment Performance
The Trustees received and considered absolute and/or relative performance information for the Funds in a report prepared by Broadridge/Lipper. The Trustees considered the total return performance information, which included the ranking of the Funds within a performance universe made up of funds with the same Broadridge/Lipper investment classification and objective (the “Universe”), as well as a sub-set of funds within the Universe (the “Peer Group”), by total return for applicable one-, three-, and five-year periods. The Trustees reviewed a description of Broadridge/Lipper’s methodology for selecting mutual funds in each Fund’s Peer Group and Universe. The Broadridge/Lipper materials provided to the Trustees highlighted information with respect to certain representative classes to assist the Trustees in their review. As part of this review, the Trustees also reviewed each Fund’s performance against its benchmark and considered the performance information provided for the Funds at regular Board meetings by the Adviser and the Trustees’ independent consultant and also considered the special analysis prepared by the Trustees’ independent consultant. The Broadridge/Lipper performance data noted by the Trustees as part of their review and the determinations made by the Trustees with respect to each Fund’s performance for certain representative classes are summarized below:
The Trustees noted that the Emerging Economies Fund’s performance for Class A shares was in the fourth, fifth and fifth quintiles based upon the Peer Group, and in the third, fourth and fourth quintiles based upon the Universe, for the one-, three-, and five-year periods ended December 31, 2016, respectively. The Trustees noted that the performance for the Class I shares was in the third, fifth and fifth quintiles based upon the Peer Group, and in the third, fourth, and fourth quintiles based upon the Universe, for the one-, three-, and five-year periods ended December 31, 2016, respectively. The Trustees discussed the performance and investment strategy of the Fund with the Adviser and reviewed the performance analysis and evaluation prepared by the independent consultant. Based upon these discussions, and various other
factors, the Trustees concluded that the Fund’s performance was reasonable. They requested, however, that the Fund’s Adviser provide additional Fund performance information to be reviewed with members of the Equity Committee at each of their regular meetings over the course of the next year.
The Trustees noted that the Emerging Markets Equity Fund’s performance for Class A shares was in the second, first and fourth quintiles based upon the Peer Group, and in the first, second and third quintiles based upon the Universe, for the one-, three- and five-year periods ended December 31, 2016, respectively. The Trustees noted that the performance for Class I shares was in the first, first and fourth quintiles based upon the Peer Group, and in the first, second, and third quintiles based upon the Universe, for the one-, three- and five-year periods ended December 31, 2016, respectively. The Trustees discussed the performance and investment strategy of the Fund with the Adviser and reviewed the performance analysis and evaluation prepared by the independent consultant. Based upon these discussions and various other factors, the Trustees concluded that the Fund’s performance was reasonable.
The Trustees noted that based upon the Universe, the Global Research Enhanced Index Fund’s performance for Class A shares was in the second and first quintiles for the one- and three-year periods ended December 31, 2016, respectively, and in the first quintile for Class I shares for both the one- and three-year periods ended December 31, 2016. The Trustees discussed the performance and investment strategy of the Fund with the Adviser and reviewed the performance analyses and evaluation prepared by the independent consultant. Based upon these discussions and various other factors, the Trustees concluded that the performance was reasonable.
The Trustees noted that the Global Unconstrained Equity Fund’s performance for Class A shares was in the fourth quintile based upon the Peer Group for the one-year period ended December 31, 2016, and in the fourth, third and third quintiles based upon the Universe, for the one-, three-, and five-year periods ended December 31, 2016 , respectively. The Trustees noted that the performance for Class I shares was in fourth, second, and second quintiles based upon the Universe for the one-, three- and five- year periods ended December 31, 2016, respectively. The Trustees discussed the performance and investment strategy of the Fund with the Adviser and reviewed the performance analyses and evaluation prepared by the independent consultant. Based upon these discussions and various other factors, the Trustees concluded that the Fund’s performance was reasonable.
The Trustees noted that the International Equity Fund’s performance for Class A shares was in the second, second, and third quintiles based upon the Peer group, and in the third, third and third quintiles, based upon the Universe, for the one-, three- and five-year periods ended December 31, 2016, respectively. The Trustees noted that the performance for the
| 146 | J.P. MORGAN INTERNATIONAL EQUITY FUNDS | OCTOBER 31, 2017 | ||||
Table of Contents
Class I shares was in the third quintile based upon the Universe for each of the one-, three- and five-year periods ended December 31, 2016. The Trustees discussed the performance and investment strategy of the Fund with the Adviser and reviewed the performance analysis and evaluation prepared by the independent consultant. Based upon these discussions and various other factors, the Trustees concluded that the Fund’s performance was reasonable.
The Trustees noted that the International Equity Income Fund’s performance for Class A shares was in the fifth and first quintiles based upon the Peer Group for the one- and three-year periods ended December 31, 2016, respectively, and in the fifth, first and first quintiles based upon the Universe, for the one-, three-, and five-year periods ended December 31, 2016, respectively. The Trustees noted that performance for Class I shares was in the fifth, first and first quintiles based upon the Universe for the one-, three- and five-year periods ended December 31, 2016, respectively. The Trustees discussed the performance and investment strategy of the Fund with the Adviser and reviewed the performance analysis and evaluation prepared by the independent consultant. Based upon these discussions and various other factors, the Trustees concluded that the Fund’s performance was reasonable.
The Trustees noted that, based upon the Universe, the International Research Enhanced Equity Fund’s performance for Class A shares was in the third, first, and first quintiles, and in the second, first, and first quintiles for Class I shares, for the one- three- and five- year periods ended December 31, 2016, respectively. The Trustees discussed the performance and investment strategy of the Fund with the Adviser and reviewed the performance analysis and evaluation prepared by the independent consultant. Based upon these discussions, and various other factors, the Trustees concluded that the Fund’s performance was reasonable.
The Trustees noted that, based upon the Universe, the International Unconstrained Equity Fund’s performance for Class A shares was in the second, third and first quintiles, and in the second, second, and first quintiles for Class I shares, for the one-, three- and five-year periods ended December 31, 2016, respectively. The Trustees discussed the performance and investment strategy of the Fund with the Adviser and reviewed the performance analysis and evaluation prepared by the independent consultant. Based upon these discussions, and various other factors, the Trustees concluded that the Fund’s performance was reasonable.
The Trustees noted that, based upon the Universe, the International Value Fund’s performance for Class A shares was in the third, fifth and fifth quintiles, and in the second, fourth and fourth quintiles for Class I shares, for the one-, three- and five-year periods ended December 31, 2016, respectively. The Trustees discussed the performance and investment strategy of the Fund with the Adviser and reviewed the performance
analysis and evaluation prepared by the independent consultant. Based upon these discussions, and various other factors, the Trustees concluded that the Fund’s performance was reasonable. They requested, however, that the Fund’s Adviser provide additional Fund performance information to be reviewed with members of the Equity Committee at each of their regular meetings over the course of the next year.
The Trustees noted that the Intrepid International Fund’s performance for Class A shares was in the third quintile based upon the Peer Group, and in the fourth, third, and second quintiles based upon the Universe, for the one-, three- and five- year periods ended December 31, 2016, respectively. The Trustees noted that the performance for the Class I shares was in the second quintile based upon the Peer Group, and in the fourth, third and second quintiles based upon the Universe, for the one-, three,- and five- year periods ended December 31, 2016, respectively. The Trustees discussed the performance and investment strategy of the Fund with the Adviser and reviewed the performance analysis and evaluation prepared by the independent consultant. Based upon these discussions, and various other factors, the Trustees concluded that the performance was reasonable.
Advisory Fees and Expense Ratios
The Trustees considered the contractual advisory fee rate paid by each Fund to the Adviser and compared that rate to the information prepared by Broadridge/Lipper concerning management fee rates paid by other funds in the same Broadridge/Lipper category as each Fund. The Trustees recognized that Broadridge/Lipper reported each Fund’s management fee rate as the combined contractual advisory fee and administration fee rates. The Trustees also reviewed information about other expenses and the expense ratios for each Fund. The Trustees considered the fee waiver and/or expense reimbursement arrangements currently in place for each Fund and considered the net advisory fee rate after taking into account any waivers and/or reimbursements. The Trustees recognized that it is difficult to make comparisons of advisory fees because there are variations in the services that are included in the fees paid by other funds. The Trustees’ determination as a result of the review of each Fund’s advisory fees and expense ratios for certain representative classes are summarized below:
The Trustees noted that the Emerging Economies Fund’s net advisory fee for Class A shares was in the first and second quintiles based upon the Peer Group and Universe, respectively, and that the actual total expenses for Class A shares were in the first quintile based upon both the Peer Group and Universe. The Trustees noted that the net advisory fee for Class I shares was in the first and second quintiles based upon the Peer Group and Universe, respectively, and that the actual total expenses for Class I shares were in the second quintile based upon both the Peer Group and Universe. The Trustees also noted that the
| OCTOBER 31, 2017 | J.P. MORGAN INTERNATIONAL EQUITY FUNDS | 147 | ||||||
Table of Contents
BOARD APPROVAL OF INVESTMENT ADVISORY AGREEMENTS
(Unaudited) (continued)
Fund’s contractual Fee Caps were lowered effective November 1, 2017. After considering all of the factors identified above, the Trustees concluded that the advisory fees were satisfactory in light of the services provided to the Fund.
The Trustees noted that the Emerging Markets Equity Fund’s net advisory fee for Class A shares was in the first and second quintiles based upon the Peer Group and Universe, respectively, and that the actual total expenses for Class A shares were in the first quintile based upon both the Peer Group and Universe. The Trustees noted that the net advisory fee and actual total expenses for Class I shares were in the second quintile based upon both the Peer Group and Universe. The Trustees also noted that the Fund’s contractual Fee Caps were lowered effective November 1, 2017. After considering all of the factors identified above, the Trustees concluded that the advisory fees were satisfactory in light of the services provided to the Fund.
The Trustees noted that the Global Research Enhanced Index Fund’s net advisory fee and actual total expenses for both Class A and Class I shares were in the first quintile based upon the Universe. After considering the factors identified above, the Trustees concluded that the advisory fee was satisfactory in light of the services provided to the Fund.
The Trustees noted that the Global Unconstrained Equity Fund’s net advisory fee and actual total expenses for Class A shares were in the first and second quintiles, respectively, based upon both the Peer Group and Universe. The Trustees noted that the net advisory fee for Class I shares was in the first quintile based upon both the Peer Group and Universe, and that the actual total expenses for Class I shares were in the third and second quintiles based upon the Peer Group and Universe, respectively. The Trustees also noted that the Fund’s contractual Fee Caps were lowered effective November 1, 2017. After considering all of the factors identified above, the Trustees concluded that the advisory fees were satisfactory in light of the services provided to the Fund.
The Trustees noted that the International Equity Fund’s net advisory fee for Class A shares was in the first and second quintiles based upon the Peer Group and Universe, respectively, and that the actual total expenses for Class A shares were in the second quintile based upon both the Peer Group and Universe. The Trustees noted that the net advisory fee and actual total expenses for Class I shares were in the second and third quintiles based upon the Universe, respectively. The Trustees also noted that the Fund’s contractual Fee Caps were lowered effective November 1, 2017. After considering all of the factors identified above, the Trustees concluded that the advisory fees were satisfactory in light of the services provided to the Fund.
The Trustees noted that the International Equity Income Fund’s net advisory fee and actual total expenses for Class A shares were in the first and second quintiles, respectively, based upon both the Peer Group and the Universe. The Trustees noted that
the net advisory fee and actual total expenses for Class I shares were in the first and second quintiles based upon the Universe, respectively. The Trustees also noted that the Fund’s contractual Fee Caps were lowered effective November 1, 2017. After considering all of the factors identified above, the Trustees concluded that the advisory fee was satisfactory in light of the services provided to the Fund.
The Trustees noted that the International Research Enhanced Equity Fund’s net advisory fee and actual total expenses for both Class A and Class I shares were in the first quintile based upon both the Peer Group and Universe. After considering all of the factors identified above, the Trustees concluded that the advisory fee was satisfactory in light of the services provided to the Fund.
The Trustees noted that the International Unconstrained Equity Fund’s net advisory fee and total actual expenses for Class A shares were in the first quintile based upon both the Peer Group and Universe. The Trustees noted that the net advisory fee for the Class I shares was in the first quintile based upon both the Peer Group and Universe, and that the actual total expenses for Class I shares were in the first and second quintiles based upon the Peer Group and Universe, respectively. The Trustees also noted that the Fund’s contractual Fee Caps were lowered effective November 1, 2017. After considering all of the factors identified above, the Trustees concluded that the advisory fee was satisfactory in light of the services provided to the Fund.
The Trustees noted that the International Value Fund’s net advisory fee for Class A shares was in the first and second quintiles based upon the Peer Group and Universe, respectively, and that the actual total expenses for Class A shares were in the fifth and third quintiles based upon the Peer Group and Universe, respectively. The Trustees noted that the net advisory fee for Class I shares was in the first and second quintiles based upon the Peer Group and Universe, respectively, and that the actual total expenses for Class I shares were in the first and third quintiles based upon the Peer Group and Universe, respectively. The Trustees also noted that the Fund’s contractual Fee Caps were lowered effective November 1, 2017. After considering all of the factors identified above, the Trustees concluded that the advisory fees were satisfactory in light of the services provided to the Fund.
The Trustees noted that the Intrepid International Fund’s net advisory fee for Class A shares was in the second quintile based upon both the Peer Group and Universe, and that the actual total expenses for Class A shares were in the fourth and third quintiles based upon the Peer Group and Universe, respectively. The Trustees noted that the net advisory fee and actual total expenses for the Class I shares were in the second quintile based upon both the Peer Group and Universe. The Trustees also noted that the Fund’s contractual Fee Caps were lowered effective November 1, 2017. The Trustees also noted that the
| 148 | J.P. MORGAN INTERNATIONAL EQUITY FUNDS | OCTOBER 31, 2017 | ||||
Table of Contents
Fund’s contractual Fee Caps were lowered effective November 1, 2017. After considering all of the factors identified above, the Trustees concluded that the advisory fee was satisfactory in light of the services provided to the Fund.
| OCTOBER 31, 2017 | J.P. MORGAN INTERNATIONAL EQUITY FUNDS | 149 | ||||||
Table of Contents
(Unaudited)
Certain tax information for the J.P. Morgan Funds is required to be provided to shareholders based upon the Funds’ income and distributions for the taxable year ended October 31, 2017. The information and distributions reported in this letter may differ from the information and taxable distributions reported to the shareholders for the calendar year ending December 31, 2017. The information necessary to complete your income tax returns for the calendar year ending December 31, 2017 will be provided under separate cover.
Dividends Received Deductions (DRD)
Each fund listed below had the following percentage, or maximum allowable percentage, of ordinary income distributions eligible for the 70% dividends received deductions for corporate shareholders for the fiscal year ended October 31, 2017:
| Dividends Received Deduction | ||||
Global Research Enhanced Index Fund | 50.82 | % | ||
Global Unconstrained Equity Fund | 7.41 | |||
Qualified Dividend Income (QDI)
Each fund listed below had the following amount, or maximum allowable amount, of ordinary income distributions treated as qualified dividends for the fiscal year ended October 31, 2017 (amounts in thousands):
| Qualified Dividend Income | ||||
Emerging Economies Fund | $ | 32,892 | ||
Emerging Markets Equity Fund | 29,196 | |||
Global Research Enhanced Index Fund | 155,976 | |||
Global Unconstrained Equity Fund | 3 | |||
International Equity Fund | 25,808 | |||
International Equity Income Fund | 6,084 | |||
International Research Enhanced Equity Fund | 38,026 | |||
International Unconstrained Equity Fund | 2,882 | |||
International Value Fund | 30,449 | |||
Intrepid International Fund | 77,253 | |||
Foreign Source Income and Foreign Tax Credit Pass Through
For the fiscal year ended October 31, 2017, the following Funds intend to elect to pass through to shareholders taxes paid to foreign countries. Gross income and foreign tax expenses are as follows or amounts as finally determined (amounts in thousands):
| Gross Income | Foreign Tax Pass Through | |||||||
Emerging Economies Fund | $ | 63,581 | $ | 5,297 | ||||
Emerging Markets Equity Fund | 66,994 | 5,204 | ||||||
International Equity Fund | 103,374 | 7,971 | ||||||
International Equity Income Fund | 7,561 | 702 | ||||||
International Research Enhanced Equity Fund | 55,178 | 3,821 | ||||||
International Unconstrained Equity Fund | 4,303 | 319 | ||||||
International Value Fund | 30,664 | 2,954 | ||||||
Intrepid International Fund | 89,455 | 6,972 | ||||||
| 150 | J.P. MORGAN INTERNATIONAL EQUITY FUNDS | OCTOBER 31, 2017 | ||||
Table of Contents

Rev. January 2011
| FACTS | WHAT DOES J.P. MORGAN FUNDS DO WITH YOUR PERSONAL INFORMATION? |
| Why? | Financial companies choose how they share your personal information. Federal law gives consumers the right to limit some but not all sharing. Federal law also requires us to tell you how we collect, share, and protect your personal information. Please read this notice carefully to understand what we do. |
| What? | The types of personal information we collect and share depend on the product or service you have with us. This information can include:
◾ Social Security number and account balances
◾ transaction history and account transactions
◾ checking account information and wire transfer instructions
When you are no longer our customer, we continue to share your information as described in this notice. |
| How? | All financial companies need to share customers’ personal information to run their everyday business. In the section below, we list the reasons financial companies can share their customers’ personal information; the reasons J.P. Morgan Funds chooses to share; and whether you can limit this sharing. |
| Reasons we can share your personal information | Does J.P. Morgan Funds share? | Can you limit this sharing? | ||
For our everyday business purposes — such as to process your transactions, maintain your account(s), respond to court orders and legal investigations, or report to credit bureaus | Yes | No | ||
For marketing purposes — to offer our products and services to you | Yes | No | ||
| For joint marketing with other financial companies | No | We don’t share | ||
For our affiliates’ everyday business purposes — information about your transactions and experiences | No | We don’t share | ||
For our affiliates’ everyday business purposes — information about your creditworthiness | No | We don’t share | ||
| For nonaffiliates to market to you | No | We don’t share |
| Questions? | Call 1-800-480-4111 or go to www.jpmorganfunds.com | |

Table of Contents
Page 2 |
| Who we are | ||
| Who is providing this notice? | J.P. Morgan Funds | |
| What we do | ||
| How does J.P. Morgan Funds protect my personal information? | To protect your personal information from unauthorized access and use, we use security measures that comply with federal law. These measures include computer safeguards and secured files and buildings. We authorize our employees to access your information only when they need it to do their work and we require companies that work for us to protect your information. | |
How does J.P. Morgan Funds collect my personal information? | We collect your personal information, for example, when you:
◾ open an account or provide contact information
◾ give us your account information or pay us by check
◾ make a wire transfer
We also collect your personal information from others, such as credit bureaus, affiliates and other companies. | |
| Why can’t I limit all sharing? | Federal law gives you the right to limit only
◾ sharing for affiliates’ everyday business purposes – information about your creditworthiness
◾ affiliates from using your information to market to you
◾ sharing for nonaffiliates to market to you
State laws and individual companies may give you additional rights to limit sharing. | |
| Definitions | ||
| Affiliates | Companies related by common ownership or control. They can be financial and nonfinancial companies.
◾ J.P. Morgan Funds does not share with our affiliates. | |
| Nonaffiliates | Companies not related by common ownership or control. They can be financial and nonfinancial companies.
◾ J.P. Morgan Funds does not share with nonaffiliates so they can market to you. | |
| Joint Marketing | A formal agreement between nonaffiliated financial companies that together market financial products or services to you.
◾ J.P. Morgan Funds doesn’t jointly market. | |
Table of Contents
J.P. Morgan Funds are distributed by JPMorgan Distribution Services, Inc., which is an affiliate of JPMorgan Chase & Co. Affiliates of JPMorgan Chase & Co. receive fees for providing various services to the funds.
Contact JPMorgan Distribution Services, Inc. at 1-800-480-4111 for a fund prospectus. You can also visit us at www.jpmorganfunds.com. Investors should carefully consider the investment objectives and risk as well as charges and expenses of the mutual fund before investing. The prospectus contains this and other information about the mutual fund. Read the prospectus carefully before investing.
Investors may obtain information about the Securities Investor Protection Corporation (SIPC), including the SIPC brochure by visiting www.sipc.org or by calling SIPC at 202-371-8300.
Each Fund files a complete schedule of its fund holdings for the first and third quarters of its fiscal year with the SEC on Form N-Q. The Funds’ Forms N-Q are available on the SEC’s website at http://www.sec.gov and may be reviewed and copied at the SEC’s Public Reference Room in Washington, DC. Information on the operation of the SEC’s Public Reference Room may be obtained by calling 1-800-SEC-0330. Shareholders may request the Form N-Q without charge by calling 1-800-480-4111 or by visiting the J.P. Morgan Funds’ website at www.jpmorganfunds.com.
A description of each Fund’s policies and procedures with respect to the disclosure of each Fund’s holdings is available in the prospectus and Statement of Additional Information.
A copy of proxy policies and procedures is available without charge upon request by calling 1-800-480-4111 and on the Funds’ website at www.jpmorganfunds.com. A description of such policies and procedures is on the SEC’s website at www.sec.gov. The Trustees have delegated the authority to vote proxies for securities owned by the Funds to the Adviser. A copy of the Funds’ voting record for the most recent 12-month period ended June 30 is available on the SEC’s website at www.sec.gov or at the Funds’ website at www.jpmorganfunds.com no later than August 31 of each year. The Funds’ proxy voting record will include, among other things, a brief description of the matter voted on for each fund security, and will state how each vote was cast, for example, for or against the proposal.

Table of Contents

J.P. Morgan Asset Management is the marketing name for the asset management businesses of JPMorgan Chase & Co. Those businesses include, but are not limited to, J.P. Morgan Investment Management Inc., Security Capital Research & Management Incorporated and J.P. Morgan Alternative Asset Management, Inc.
| © JPMorgan Chase & Co., 2017. All rights reserved. October 2017. | AN-INTEQ-1017 |
Table of Contents
| ITEM 2. | CODE OF ETHICS. |
Disclose whether, as of the end of the period covered by the report, the registrant has adopted a code of ethics that applies to the registrant’s principal executive officer, principal financial officer, principal accounting officer or controller, or persons performing similar functions, regardless of whether these individuals are employed by the registrant or a third party. If the registrant has not adopted such a code of ethics, explain why it has not done so.
The registrant must briefly describe the nature of any amendment, during the period covered by the report, to a provision of its code of ethics that applies to the registrant’s principal executive officer, principal financial officer, principal accounting officer or controller, or persons performing similar functions, regardless of whether these individuals are employed by the registrant or a third party, and that relates to any element of the code of ethics definition enumerated in paragraph (b) of this Item. The registrant must file a copy of any such amendment as an exhibit pursuant to Item 12(a)(1), unless the registrant has elected to satisfy paragraph (f) of this Item by positing its code of ethics on its website pursuant to paragraph (f)(2) of this Item, or by undertaking to provide its code of ethics to any person without charge, upon request, pursuant to paragraph (f)(3) of this Item.
If the registrant has, during the period covered by the report, granted a waiver, including an implicit waiver, from a provision of the code of ethics that applies to the registrant’s principal executive officer, principal financial officer, principal accounting officer or controller, or persons performing similar functions, regardless of whether these individuals are employed by the registrant or third party, that relates to one or more items set forth in paragraph (b) of this Item, the registrant must briefly describe the nature of the waiver, the name of the person to whom the waiver was granted, and the date of the waiver.
The Registrant has adopted a code of ethics that applies to the Registrant’s principal executive officer and principal financial officer. There were no amendments to the code of ethics or waivers granted with respect to the code of ethics in the period covered by the report.
| ITEM 3. | AUDIT COMMITTEE FINANCIAL EXPERT. |
(a) (1) Disclose that the registrant’s board of directors has determined that the registrant either:
(i) Has at least one audit committee financial expert serving on its audit committee; or
(ii) Does not have an audit committee financial expert serving on its audit committee.
The Registrant’s Board of Trustees has determined that the Registrant has at least one audit committee financial expert serving on its audit committee. The Securities and Exchange Commission has stated that the designation or identification of a person as an audit committee financial expert pursuant to this Item 3 of Form N-CSR does not impose on such person any duties, obligations or liabilities that are greater than the duties, obligations and liabilities imposed on such person as a member of the Audit Committee and the Board of Trustees in the absence of such designation or identification.
(2) If the registrant provides the disclosure required by paragraph (a)(1)(i) of this Item, it must disclose the name of the audit committee financial expert and whether that person is “independent.” In order to be considered “independent” for purposes of this Item, a member of an audit committee may not, other than in his or her capacity as a member of the audit committee, the board of directors, or any other board committee:
(i) Accept directly or indirectly any consulting, advisory, or other compensatory fee from the issuer; or
(ii) Be an “interested person” of the investment company as defined in Section 2(a)(19) of the Act (15 U.S.C. 80a-2(a)(19)).
Effective October 31, 2017, Dennis P. Harrington replaced James Schonbachler as the audit committee financial expert. He is not an “interested person” of the Registrant and is also “independent” as defined by the U.S. Securities and Exchange Commission for purposes of audit committee financial expert determinations.
(3) If the registrant provides the disclosure required by paragraph (a)(1)(ii) of this Item, it must explain why it does not have an audit committee financial expert.
Not applicable.
Table of Contents
| ITEM 4. | PRINCIPAL ACCOUNTANT FEES AND SERVICES. |
(a) Disclose, under the caption Audit Fees, the aggregate fees billed for each of the last two fiscal years for professional
services rendered by the principal accountant for the audit of the registrant’s annual financial statements or services that are normally provided by the accountant in connection with statutory and regulatory filings or engagements for those fiscal years.
AUDIT FEES
2017 – $46,543
2016 – $46,470
(b) Disclose, under the caption Audit-Related Fees, the aggregate fees billed in each of the last two fiscal years for assurance and related services by the principal accountant that are reasonably related to the performance of the audit of the registrant’s financial statements and are not reported under paragraph (a) of this Item. Registrants shall describe the nature of the services comprising the fees disclosed under this category.
AUDIT-RELATED FEES
2017 – $12,740
2016 – $12,610
Audit-related fees consists of semi-annual financial statement reviews and security count procedures performed as required under Rule 17f-2 of the Investment Company Act of 1940 during the Registrant’s fiscal year.
(c) Disclose, under the caption Tax Fees, the aggregate fees billed in each of the last two fiscal years for professional services rendered by the principal accountant for tax compliance, tax advice, and tax planning. Registrants shall describe the nature of the services comprising the fees disclosed under this category.
TAX FEES
2017 – $11,915
2016 – $11,745
The tax fees consist of fees billed in connection with preparing the federal regulated investment company income tax returns for the Registrant for the tax years ended October 31, 2017 and 2016, respectively.
For the last fiscal year, no tax fees were required to be approved pursuant to paragraph (c)(7)(ii) of Rule 2-01 of Regulation S-X.
(d) Disclose, under the caption All Other Fees, the aggregate fees billed in each of the last two fiscal years for products and services provided by the principal accountant, other than the services reported in paragraphs (a) through (c) of this Item. Registrants shall describe the nature of the services comprising the fees disclosed under this category.
ALL OTHER FEES
2017 – Not applicable
2016 – Not applicable
(e) (1) Disclose the audit committee’s pre-approval policies and procedures described in paragraph (c)(7) of Rule 2-01 of Regulation S-X.
Pursuant to the Registrant’s Audit Committee Charter and written policies and procedures for the pre-approval of audit and non-audit services (the “Pre-approval Policy”), the Audit Committee pre-approves all audit and non-audit services performed by the Registrant’s independent public registered accounting firm for the Registrant. In addition, the Audit Committee pre-approves the auditor’s engagement for non-audit services with the Registrant’s investment adviser (not including a sub-adviser whose role is primarily portfolio management and is sub-contracted or overseen by another investment adviser) and any Service Affiliate in accordance with paragraph (c)(7)(ii) of Rule 2-01 of Regulation S-X, if the engagement relates directly to the operations and financial reporting of the Registrant. Proposed services may be pre-approved either 1) without consideration of specific case-by-case services or 2) require the specific pre-approval of the Audit Committee. Therefore, initially the Pre-approval Policy listed a number of audit and non-audit services that have been approved by the Audit Committee, or which were not subject to pre-approval under the transition provisions of Sarbanes-Oxley Act of 2002 (the “Pre-approval List”). The Audit Committee annually reviews and pre-approves the
Table of Contents
services included on the Pre-approval List that may be provided by the independent public registered accounting firm without obtaining additional specific pre-approval of individual services from the Audit Committee. The Audit Committee adds to, or subtracts from, the list of general pre-approved services from time to time, based on subsequent determinations. All other audit and non-audit services not on the Pre-approval List must be specifically pre-approved by the Audit Committee.
One or more members of the Audit Committee may be appointed as the Committee’s delegate for the purposes of considering whether to approve such services. Any pre-approvals granted by the delegate will be reported, for informational purposes only, to the Audit Committee at its next scheduled meeting. The Audit Committee’s responsibilities to pre-approve services performed by the independent public registered accounting firm are not delegated to management.
(2) Disclose the percentage of services described in each of paragraphs (b) through (d) of this Item that were approved by the audit committee pursuant to paragraph (c)(7)(i)(C) of Rule 2-01 of Regulation S-X.
2017 – 0.0%
2016 – 0.0%
(f) If greater than 50 percent, disclose the percentage of hours expended on the principal accountant’s engagement to audit the registrant’s financial statements for the most recent fiscal year that were attributed to work performed by persons other than the principal accountant’s full-time, permanent employees.
Not applicable - Less than 50%.
(g) Disclose the aggregate non-audit fees billed by the registrant’s accountant for services rendered to the registrant, and rendered to the registrant’s investment adviser (not including any sub-adviser whose role is primarily portfolio management and is subcontracted with or overseen by another investment adviser), and any entity controlling, controlled by, or under common control with the adviser that provides ongoing services to the registrant for each of the last two fiscal years of the registrant.
The aggregate non-audit fees billed by the independent registered public accounting firm for services rendered to the Registrant, and rendered to Service Affiliates, for the last two calendar year ends were:
2017 - $28.3 million
2016 - $29.2 million
(h) Disclose whether the registrant’s audit committee of the board of directors has considered whether the provision of non-audit services that were rendered to the registrant’s investment adviser (not including any subadviser whose role is primarily portfolio management and is subcontracted with or overseen by another investment adviser), and any entity controlling, controlled by, or under common control with the investment adviser that provides ongoing services to the registrant that were not pre-approved pursuant to paragraph (c)(7)(ii) of Rule 2-01 of Regulation S-X is compatible with maintaining the principal accountant’s independence.
The Registrant’s Audit Committee has considered whether the provision of the non-audit services that were rendered to Service Affiliates that were not pre-approved (not requiring pre-approval) is compatible with maintaining the independent public registered accounting firm’s independence. All services provided by the independent public registered accounting firm to the Registrant or to Service Affiliates that were required to be pre-approved were pre-approved as required.
| ITEM 5. | AUDIT COMMITTEE OF LISTED REGISTRANTS. |
(a) If the registrant is a listed issuer as defined in Rule 10A-3 under the Exchange Act (17CFR 240.10A-3), state whether or not the registrant has a separately-designated standing audit committee established in accordance with Section 3(a)(58)(A) of the Exchange Act (15 U.S.C. 78c(a)(58)(A)). If the registrant has such a committee, however designated, identify each committee member. If the entire board of directors is acting as the registrant’s audit committee as specified in Section 3(a)(58)(B) of the Exchange Act (15 U.S.C. 78c(a)(58)(B)), so state.
(b) If applicable, provide the disclosure required by Rule 10A-3(d) under the Exchange Act (17CFR 240.10A-3(d)) regarding an exemption from the listing standards for all audit committees.
Not applicable.
Table of Contents
| ITEM 6. | SCHEDULE OF INVESTMENTS. |
File Schedule I – Investments in securities of unaffiliated issuers as of the close of the reporting period as set forth in Section 210.12-12 of Regulation S-X, unless the schedule is included as part of the report to shareholders filed under Item 1 of this Form.
Included in Item 1.
ITEM 7. DISCLOSURE OF PROXY VOTING POLICIES AND PROCEDURES FOR CLOSED-END MANAGEMENT INVESTMENT COMPANIES.
A closed-end management investment company that is filing an annual report on this Form N-CSR must, unless it invests exclusively in non-voting securities, describe the policies and procedures that it uses to determine how to vote proxies relating to portfolio securities, including the procedures that the company uses when a vote presents a conflict between the interests of its shareholders, on the one hand, and those of the company’s investment adviser; principal underwriter; or any affiliated person (as defined in Section 2(a)(3) of the Investment Company Act of 1940 (15 U.S.C. 80a-2(a)(3)) and the rules thereunder) of the company, its investment adviser, or its principal underwriter, on the other. Include any policies and procedures of the company’s investment adviser, or any other third party, that the company uses, or that are used on the company’s behalf, to determine how to vote proxies relating to portfolio securities.
Not applicable.
| ITEM 8. | PORTFOLIO MANAGERS OF CLOSED-END MANAGEMENT INVESTMENT COMPANIES. |
Not applicable.
ITEM 9. PURCHASE OF EQUITY SECURITIES BY CLOSED-END MANAGEMENT INVESTMENT COMPANY AND AFFILIATED PURCHASERS.
(a) If the registrant is a closed-end management investment company, provide the information specified in paragraph (b) of this Item with respect to any purchase made by or on behalf of the registrant or any “affiliated purchaser,” as defined in Rule 10b-18(a)(3) under the Exchange Act (17 CFR 240.10b-18(a)(3)), of shares or other units of any class of the registrant’s equity securities that is registered by the registrant pursuant to Section 12 of the Exchange Act (15 U.S.C. 781).
Not applicable.
| ITEM 10. | SUBMISSION OF MATTERS TO A VOTE OF SECURITY HOLDERS. |
Describe any material changes to the procedures by which shareholders may recommend nominees to the registrant’s board of directors, where those changes were implemented after the registrant last provided disclosure in response to the requirements of Item 7(d)(2)(ii)(G) of Schedule 14A (17 CFR 240.14a-101), or this Item.
No material changes to report.
| ITEM 11. | CONTROLS AND PROCEDURES. |
(a) Disclose the conclusions of the registrant’s principal executive and principal financial officers, or persons performing similar functions, regarding the effectiveness of the registrant’s disclosure controls and procedures (as defined in Rule 30a-3(c) under the Act (17 CFR 270.30a-3(c))) as of a date within 90 days of the filing date of the report that includes the disclosure required by this paragraph, based on the evaluation of these controls and procedures required by Rule 30a-3(b) under the Act (17 CFR 270.30a-3(b)) and Rules 13a-15(b) or 15d-15(b) under the Exchange Act (17 CFR 240.13a-15(b) or 240.15d-15(b)).
The Registrant’s principal executive and principal financial officers have concluded, based on their evaluation of the Registrant’s disclosure controls and procedures as of a date within 90 days of the filing date of this report, that the Registrant’s disclosure controls and procedures are reasonably designed to ensure that information required to be disclosed by the Registrant on Form N-CSR is recorded, processed, summarized and reported within the required time
Table of Contents
periods and that information required to be disclosed by the Registrant in the reports that it files or submits on Form N-CSR is accumulated and communicated to the Registrant’s management, including its principal executive and principal financial officers, as appropriate to allow timely decisions regarding required disclosure.
(b) Disclose any change in the registrant’s internal control over financial reporting (as defined in Rule 30a-3(d) under the Act (17 CFR 270.30a-3(d)) that occurred during the registrant’s second fiscal quarter of the period covered by this report that has materially affected, or is reasonably likely to materially affect, the registrant’s internal control over financial reporting.
There were no changes in the Registrant’s internal control over financial reporting that occurred during the last fiscal quarter covered by this report that have materially affected, or are reasonably likely to materially affect, the Registrant’s internal control over financial reporting.
| ITEM 12. | EXHIBITS. |
(a) File the exhibits listed below as part of this Form. Letter or number the exhibits in the sequence indicated.
(a)(1) Any code of ethics, or amendment thereto, that is the subject of the disclosure required by Item 2, to the extent that the registrant intends to satisfy the Item 2 requirements through filing of an exhibit.
Code of Ethics applicable to its Principal Executive and Principal Financial Officers pursuant to Section 406 of the Sarbanes-Oxley Act of 2002 attached hereto.
(a)(2) A separate certification for each principal executive officer and principal financial officer of the registrant as required by Rule 30a-2(a) under the Act (17 CFR 270.30a-2).
Certifications pursuant to Rule 30a-2(a) under the Investment Company Act of 1940 are attached hereto.
(a)(3) Any written solicitation to purchase securities under Rule 23c-1 under the Act (17 CFR 270.23c-1) sent or given during the period covered by the report by or on behalf of the registrant to 10 or more persons.
Not applicable.
(b) A separate or combined certification for each principal executive officer and principal officer of the registrant as required by Rule 30a-2(b) under the Act of 1940.
Certifications pursuant to Rule 30a-2(b) under the Investment Company Act of 1940 are attached hereto.
Table of Contents
SIGNATURES
Pursuant to the requirements of the Securities Exchange Act of 1934 and the Investment Company Act of 1940, the registrant has duly caused this report to be signed on its behalf by the undersigned, thereunto duly authorized.
JPMorgan Trust II
| By: | /s/ Brian S. Shlissel | |
| Brian S. Shlissel | ||
| President and Principal Executive Officer | ||
| December 29, 2017 |
Pursuant to the requirements of the Securities Exchange Act of 1934 and the Investment Company Act of 1940, this report has been signed below by the following persons on behalf of the registrant and in the capacities and on the dates indicated.
| By: | /s/ Brian S. Shlissel | |
| Brian S. Shlissel | ||
| President and Principal Executive Officer | ||
| December 29, 2017 |
| By: | /s/ Matthew J. Plastina | |
| Matthew J. Plastina | ||
| Acting Treasurer and Principal Financial Officer | ||
| December 29, 2017 |