Table of Contents
UNITED STATES
SECURITIES AND EXCHANGE COMMISSION
Washington, D.C. 20549
FORMN-CSR
CERTIFIED SHAREHOLDER REPORT OF REGISTERED
MANAGEMENT INVESTMENT COMPANIES
Investment Company Act file number:811-04236
JPMorgan Trust II
(Exact name of registrant as specified in charter)
277 Park Avenue
New York, NY 10172
(Address of principal executive offices) (Zip code)
Gregory S. Samuels 277 Park Avenue
New York, NY 10172
(Name and Address of Agent for Service)
Registrant’s telephone number, including area code: (800)480-4111
Date of fiscal year end: October 31
Date of reporting period: November 1, 2019 through April 30, 2020
FormN-CSR is to be used by management investment companies to file reports with the Commission not later than 10 days after the transmission to stockholders of any report that is required to be transmitted to stockholders under Rule30e-1 under the Investment Company Act of 1940 (17 CFR270.30e-1). The Commission may use the information provided on FormN-CSR in its regulatory, disclosure review, inspection, and policymaking roles.
A registrant is required to disclose the information specified by FormN-CSR, and the Commission will make this information public. A registrant is not required to respond to the collection of information contained in FormN-CSR unless the Form displays a currently valid Office of Management and Budget (“OMB”) control number. Please direct comments concerning the accuracy of the information collection burden estimate and any suggestions for reducing the burden to Secretary, Securities and Exchange Commission, 450 Fifth Street, NW, Washington, DC 20549-0609. The OMB has reviewed this collection of information under the clearance requirements of 44 U.S.C. Section 3507.
Table of Contents
ITEM 1. REPORTS TO STOCKHOLDERS.
The following is a copy of the report transmitted to shareholders pursuant to Rule30e-1 under the Investment Company Act of 1940 (17 CFR270.30e-1).
Table of Contents
Semi-Annual Report
J.P. Morgan International Equity Funds
April 30, 2020 (Unaudited)
JPMorgan Emerging Markets Equity Fund
JPMorgan Emerging Markets Research Enhanced Equity Fund
JPMorgan Europe Dynamic Fund
JPMorgan International Advantage Fund
JPMorgan International Equity Fund
JPMorgan International Focus Fund
(formerly known as JPMorgan International Unconstrained Equity Fund)
JPMorgan International Hedged Equity Fund
JPMorgan International Research Enhanced Equity Fund
JPMorgan International Value Fund
Beginning on January 1, 2021, as permitted by regulations adopted by the Securities and Exchange Commission, paper copies of the Funds’ annual and semi-annual shareholder reports will no longer be sent by mail, unless you specifically request paper copies of the reports. Instead, the reports will be made available on the Funds’ websitewww.jpmorganfunds.com and you will be notified by mail each time a report is posted and provided with a website to access the report. If you already elected to receive shareholder reports electronically, you will not be affected by this change and you need not take any action.
You may elect to receive shareholder reports and other communications from the Funds electronically anytime by contacting your financial intermediary (such as a broker dealer, bank, or retirement plan) or, if you are a direct investor, by going towww.jpmorganfunds.com/edelivery.
You may elect to receive paper copies of all future reports free of charge. Contact your financial intermediary or, if you invest directly with the Funds, email us atfunds.website.support@jpmorganfunds.com or call 1-800-480-4111. Your election to receive paper reports will apply to all funds held within your account(s).

Table of Contents
| Letter to Shareholders | 1 | |||
| Market Overview | 2 | |||
| 3 | ||||
| 7 | ||||
| 9 | ||||
| 12 | ||||
| 14 | ||||
| 16 | ||||
| 19 | ||||
| 21 | ||||
| 23 | ||||
| Schedules of Portfolio Investments | 26 | |||
| Financial Statements | 60 | |||
| Financial Highlights | 84 | |||
| Notes to Financial Statements | 102 | |||
| Schedule of Shareholder Expenses | 127 | |||
| Liquidity Risk Management Program | 131 | |||
Investments in a Fund are not deposits or obligations of, or guaranteed or endorsed by, any bank and are not insured or guaranteed by the FDIC, the Federal Reserve Board or any other government agency. You could lose money if you sell when a Fund’s share price is lower than when you invested.
Past performance is no guarantee of future performance. The general market views expressed in this report are opinions based on market and other conditions through the end of the reporting period and are subject to change without notice. These views are not intended to predict the future performance of a Fund or the securities markets. References to specific securities and their issuers are for illustrative purposes only and are not intended to be, and should not be interpreted as, recommendations to purchase or sell such securities. Such views are not meant as investment advice and may not be relied on as an indication of trading intent on behalf of any Fund.
Prospective investors should refer to the Funds’ prospectuses for a discussion of the Funds’ investment objectives, strategies and risks. Call J.P. Morgan Funds Service Center at1-800-480-4111 for a prospectus containing more complete information about a Fund, including management fees and other expenses. Please read it carefully before investing.
Table of Contents
June 11, 2020 (Unaudited)
Dear Shareholders,
Many have faced significant challenges since my last letter, whether related to the COVID-19 pandemic or the recent acts of racism and discrimination around the world. While many have endured uncertainty and abrupt changes in their personal and professional lives related to these challenges, you can be confident that J.P. Morgan Asset Management is well-prepared for adverse events and is taking action to ensure that our clients and mutual fund shareholders continue to receive the service that is the foundation of our enterprise.
 |
“Our extensive planning and testing of resiliency protocols enabled us to provide uninterrupted and expanded assistance to our clients and fund shareholders even as the COVID-19 crisis dramatically increased the volume of client questions and the demand for investment solutions.” — Andrea L. Lisher |
Our extensive planning and testing of resiliency protocols enabled us to provide uninterrupted and expanded assistance to our clients and fund shareholders even as the COVID-19 crisis dramatically increased the volume of client questions and the demand for investment solutions. While our own employees transitioned to working from home, they worked tirelessly to
guide our clients and shareholders through this unprecedented time. We are here for you — our clients and fund shareholders — regardless of the economic, market or social and civic environment. That’s how we have always operated and we will not waiver in that commitment.
JPMorgan Chase & Co. has also recommitted its firm stance against any form of racism, discrimination, or social injustice. As Brian Lamb, Global Head of Diversity & Inclusion, recently said, “We are working across the entire firm — being intentional to strengthen our inclusive environment where our employees, customers and partners feel welcomed and valued in the communities where we do business.” To learn more, please visit JPMorgan Chase & Co.’s Diversity & Inclusion website.
On behalf of J.P. Morgan Asset Management, thank you for entrusting us to manage your assets. Should you have any questions, please visit www.jpmorganfunds.com or contact the J.P. Morgan Funds Service Center at 1-800-480-4111.
Sincerely yours,

Andrea L. Lisher
Head of Americas, Client
J.P. Morgan Asset Management
| APRIL 30, 2020 | J.P. MORGAN INTERNATIONAL EQUITY FUNDS | 1 | ||||||
Table of Contents
J.P. Morgan International Equity Funds
SIX MONTHS ENDED APRIL 30, 2020 (Unaudited)
While developed equity markets generally rallied in the final months of 2019, the global response to the COVID-19 pandemic led to a dramatic increase in financial market volatility and drove asset prices sharply lower in February and March of 2020 before equity prices posted a small rebound in April.
Global equity markets, led by the U.S. and Europe, largely recorded gains for the final two months of 2019 on the back of accommodative policies from leading central banks and investor expectations of a reduction in trade tensions. Even as economic data showed slowing or flat growth in China, Europe and the U.S. in the final quarter of 2019, there were no indicators that the longest recorded economic expansion in the U.S. would necessarily end. In the second half of December 2019, the U.S. and China reached a “Phase One” agreement that reduced trade tariffs and headed off the implementation of new tariffs. Combined with less aggressive U.S. trade rhetoric toward Mexico and toward European and Japanese auto industries, the U.S.-China trade agreement fueled price gains in developed equity markets.
In the U.K., the Conservative Party won a large majority in national elections in December, which appeared to remove investor concerns about the possibility of a non-negotiated “hard Brexit” departure from the EU. Equity prices in the U.K. and the British pound briefly rallied on the election result.
Early January 2020 saw continued investor support for global equities that weathered a brief flare up of military tension between the U.S. and Iran. However, investor sentiment began to turn as the outbreak of COVID-19 began to impact large parts of China’s economy. Emerging markets equities led a slump in global equity markets and U.S. and European government bonds largely gained. Notably, prices for benchmark Brent crude oil plummeted 11.9% in January amid shrinking demand from China and other economies hit by the pandemic.
U.S. equity prices found support in early February as companies began to report better-than-expected earnings from the final quarter of 2019. By the end of the month, global equity prices had fallen significantly and global demand for petroleum had declined for the first time since the 2009 financial crisis. China’s central bank responded to the impact of COVID-19 by cutting the prime lending rate and regional authorities across China enacted a range of actions to counter the sharp drop in economic activity. By the end of February, yields on benchmark 10-year U.S. Treasury bonds had fallen to a record low 1.1% as investors sought the perceived safety of government-backed bonds.
The month of March proved to be worse for global equities and a range of other asset classes as COVID-19 was declared a pandemic and national, regional and municipal governments implemented at-home quarantines and a range of other actions designed to prevent hospitals and health care systems from being overwhelmed. The U.S. Federal Reserve slashed interest rates, restarted its quantitative easing or asset purchasing program, and unleashed an array of programs to maintain liquidity and functioning in short-term commercial debt markets. The European Central Bank also stepped in to shore up economic activity via negative interest rates and a commitment to continue purchasing assets until no longer necessary. Statements of broad support from both central banks, along with fiscal stimulus and/or wage protection policies from national governments across the globe, helped to reduce record high volatility in financial markets. However, leading equity indexes lost 20% or more of their value during the first quarter of 2020. Corporate bond prices generally fell and the prices of Brent crude oil ended the first quarter down by 60%. Only developed market sovereign bonds and commodity gold experienced price appreciation in March 2020.
Global equity markets rebounded slightly in April and fixed income markets rallied somewhat as investors reacted positively to the actions of central banks and national governments to mitigate the economic impact of the pandemic. Price gains were seen in large cap technology stocks and pharmaceutical sector stocks. Fixed income investments benefitted from accommodative central bank policies and high quality corporate credit outperformed government bonds for the month. However, a glut in global petroleum markets sent futures prices for benchmark West Texas Intermediate crude oil into negative territory.
For the six months ended April 30, 2020, the S&P 500 Index returned -3.16%, the MSCI EAFE Index returned -14.00% and the MSCI Emerging Markets Index returned 10.39%. Among bond market indexes, the Bloomberg Barclays U.S. Aggregate Index returned 4.86% and the Bloomberg Barclays Emerging Markets Index returned -5.69%.
| 2 | J.P. MORGAN INTERNATIONAL EQUITY FUNDS | APRIL 30, 2020 | ||||
Table of Contents
JPMorgan Emerging Markets Equity Fund
FUND COMMENTARY
SIX MONTHS ENDED APRIL 30, 2020 (Unaudited)
| REPORTING PERIOD RETURN: | ||||
| Fund (Class L Shares)* | (10.07)% | |||
| MSCI Emerging Markets Index (net of foreign withholding taxes) | (10.50)% | |||
| Net Assets as of 4/30/2020 (In Thousands) | $ | 7,785,761 | ||
INVESTMENT OBJECTIVE**
The JPMorgan Emerging Markets Equity Fund (the “Fund”) seeks to provide high total return.
WHAT WERE THE MAIN DRIVERS OF THE FUND’S PERFORMANCE?
The Fund’s Class L Shares outperformed the MSCI Emerging Markets Index (net of foreign withholding taxes) (the “Benchmark”) for the six months ended April 30, 2020.
By sector, the Fund’s underweight allocation to the energy sector and its security selection in the communication services sector were leading contributors to performance relative to the Benchmark, while the Fund’s overweight allocation and security selection in the financials sector and its overweight allocation to the consumer staples sector were leading detractors from relative performance.
By country, the Fund’s overweight allocations to China and Belarus were leading contributors to performance relative to the Benchmark, while the Fund’s overweight allocation and security selection in India and its underweight allocation to Taiwan were leading detractors from relative performance.
Leading individual contributors to relative performance included the Fund’s out-of-Benchmark position in EPAM Systems Inc., its overweight position in Wuxi Biologics (Cayman) Inc., and its underweight position in Petroleo Brasiliero SA. Shares of EPAM Systems, a U.S.-based global provider of software development and platform engineering services, rose after the company raised its forecast for first quarter 2020 results. Shares of Wuxi Biologics (Cayman), a Chinese developer of biological testing and drug research, rose amid investor expectations of increased demand for its products and services
in response to the COVID-19 pandemic. Shares of Petroleo Brasiliero, a Brazilian oil & natural gas producer, fell amid a global decline in demand for petroleum and a sharp drop in oil prices in 2020.
Leading individual detractors from relative performance included the Fund’s out-of-Benchmark positions in IndusInd Bank Ltd. and HDFC Bank Ltd., and its overweight position in Grupo Financiero Banorte SA de CV. Shares of IndusInd Bank and HDFC Bank, both Indian banking and financial services providers, fell amid investor expectations at-home quarantine orders issued by the Indian government in response to the COVID-19 pandemic would lead to a sharp contraction in the India’s economy. Shares of Grupo Financiero Banorte, a Mexican banking and financial services company, fell amid investor expectations for a sharp contraction in Mexico’s economy in response to the COVID-19 pandemic.
HOW WAS THE FUND POSITIONED?
The Fund’s portfolio managers employed an active strategy in which portfolio construction was focused on the highest-conviction ideas found at the security level. The Fund’s portfolio managers used bottom-up fundamental research to determine the Fund’s security weightings, researching companies in an attempt to determine their underlying value and potential for future earnings growth.
As a result of this process, the Fund’s largest sector overweight allocations relative to the Benchmark were in the financials and consumer staples sectors and its largest relative underweight allocations were in the energy and materials sectors. The Fund’s largest country overweight allocations relative to the Benchmark were in India and China and its largest relative underweight allocations were in South Korea and Taiwan.
| APRIL 30, 2020 | J.P. MORGAN INTERNATIONAL EQUITY FUNDS | 3 | ||||||
Table of Contents
JPMorgan Emerging Markets Equity Fund
FUND COMMENTARY
SIX MONTHS ENDED APRIL 30, 2020 (Unaudited) (continued)
| TOP TEN EQUITY HOLDINGS OF THE PORTFOLIO*** | ||||||||
| 1. | Alibaba Group Holding Ltd., ADR (China) | 5.8 | % | |||||
| 2. | Taiwan Semiconductor Manufacturing Co. Ltd., ADR (Taiwan) | 5.3 | ||||||
| 3. | Tencent Holdings Ltd. (China) | 4.9 | ||||||
| 4. | Samsung Electronics Co. Ltd. (South Korea) | 4.1 | ||||||
| 5. | Housing Development Finance Corp. Ltd. (India) | 3.1 | ||||||
| 6. | EPAM Systems, Inc. (United States) | 3.1 | ||||||
| 7. | AIA Group Ltd. (Hong Kong) | 3.0 | ||||||
| 8. | Ping An Insurance Group Co. of China Ltd., Class H (China) | 2.5 | ||||||
| 9. | Tata Consultancy Services Ltd. (India) | 2.4 | ||||||
| 10. | NetEase, Inc., ADR (China) | 2.4 | ||||||
PORTFOLIO COMPOSITION BY COUNTRY*** | ||||
| China | 34.9 | % | ||
| India | 16.3 | |||
| Taiwan | 8.9 | |||
| Hong Kong | 6.4 | |||
| South Korea | 5.5 | |||
| Brazil | 4.8 | |||
| United States | 3.1 | |||
| Mexico | 2.4 | |||
| Argentina | 2.2 | |||
| Indonesia | 2.1 | |||
| South Africa | 1.7 | |||
| Portugal | 1.6 | |||
| Hungary | 1.5 | |||
| Macau | 1.3 | |||
| Turkey | 1.2 | |||
| Others (each less than 1.0%) | 2.9 | |||
| Short-Term Investments | 3.2 | |||
| * | The return shown is based on net asset values calculated for shareholder transactions and may differ from the return shown in the financial highlights, which reflects adjustments made to the net asset values in accordance with accounting principles generally accepted in the United States of America. |
| ** | The adviser seeks to achieve the Fund’s objective. There can be no guarantee it will be achieved. |
| *** | Percentages indicated are based on total investments as of April 30, 2020. The Fund’s portfolio composition is subject to change. |
| 4 | J.P. MORGAN INTERNATIONAL EQUITY FUNDS | APRIL 30, 2020 | ||||
Table of Contents
AVERAGE ANNUAL TOTAL RETURNSAS OF APRIL 30, 2020 | ||||||||||||||||||
| INCEPTION DATE OF CLASS | 6 MONTH* | 1 YEAR | 5 YEAR | 10 YEAR | ||||||||||||||
CLASS A SHARES | September 28, 2001 | |||||||||||||||||
With Sales Charge** | (14.98 | )% | (12.50 | )% | 2.71 | % | 2.21 | % | ||||||||||
Without Sales Charge | (10.26 | ) | (7.65 | ) | 3.82 | 2.77 | ||||||||||||
CLASS C SHARES | February 28, 2006 | |||||||||||||||||
With CDSC*** | (11.48 | ) | (9.14 | ) | 3.30 | 2.25 | ||||||||||||
Without CDSC | (10.48 | ) | (8.14 | ) | 3.30 | 2.25 | ||||||||||||
CLASS I SHARES | September 10, 2001 | (10.14 | ) | (7.43 | ) | 4.07 | 3.02 | |||||||||||
CLASS L SHARES | November 15, 1993 | (10.07 | ) | (7.33 | ) | 4.21 | 3.17 | |||||||||||
CLASS R2 SHARES | July 31, 2017 | (10.37 | ) | (7.93 | ) | 3.59 | 2.65 | |||||||||||
CLASS R3 SHARES | July 31, 2017 | (10.25 | ) | (7.70 | ) | 3.80 | 2.76 | |||||||||||
CLASS R4 SHARES | July 31, 2017 | (10.17 | ) | (7.49 | ) | 4.04 | 3.00 | |||||||||||
CLASS R5 SHARES | September 9, 2016 | (10.08 | ) | (7.32 | ) | 4.22 | 3.17 | |||||||||||
CLASS R6 SHARES | December 23, 2013 | (10.05 | ) | (7.24 | ) | 4.32 | 3.23 | |||||||||||
| * | Not annualized. |
| ** | Sales Charge for Class A Shares is 5.25%. |
| *** | Assumes a 1% CDSC (contingent deferred sales charge) for the 6 month and one year periods and 0% CDSC thereafter. |
TEN YEAR PERFORMANCE(4/30/10 TO 4/30/20)
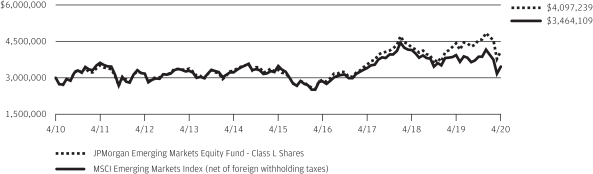
The performance quoted is past performance and is not a guarantee of future results. Mutual funds are subject to certain market risks. Investment returns and principal value of an investment will fluctuate so that an investor’s shares, when redeemed, may be worth more or less than their original cost. Current performance may be higher or lower than the performance data shown. Forup-to-datemonth-end performance information pleasecall 1-800-480-4111.
Returns for Class R5 Shares and Class R6 Shares prior to their inception dates are based on the performance of Class L Shares. The actual returns of Class R5 Shares and Class R6 Shares would have been different than those shown because Class R5 Shares and Class R6 Shares have different expenses than Class L Shares.
Returns shown for Class R2 Shares and Class R3 Shares prior to their inception dates are based on the performance of Class A Shares. The actual returns of Class R2 Shares and Class R3 Shares would have been lower than those shown because Class R2 Shares and Class R3 Shares have higher expenses than Class A Shares.
Returns for Class R4 Shares prior to its inception date are based on the performance of Class I Shares. The actual returns of Class R4 Shares would have been lower than those shown because Class R4 Shares have higher expenses than Class I Shares.
The graph illustrates comparative performance for $3,000,000 invested in Class L Shares of the JPMorgan Emerging Markets Equity Fund and the MSCI Emerging Markets Index (net of foreign withholding taxes) from April 30, 2010 to April 30, 2020. The performance of the Fund assumes reinvestment of all dividends and capital gain distributions, if any, and does not include a sales charge. The performance of the MSCI Emerging Markets Index (net of foreign withholding taxes) does not reflect the deduction of expenses or a sales charge associated with a mutual fund and approximates the minimum possible dividend reinvestment of the securities included in the benchmark, if applicable. The dividend is reinvested after deduction of withholding tax, applying the maximum rate to non-resident individual investors who do not benefit from double taxation treaties. The MSCI Emerging Markets Index (net of foreign withholding taxes) is a free float-adjusted market capitalization weighted index that is designed to measure the equity market performance of emerging markets. Investors cannot invest directly in an index.
Class L Shares have a $3,000,000 minimum initial investment.
Fund performance may reflect the waiver of the Fund’s fees and reimbursement of expenses for certain periods since the applicable inception date. Without these waivers and reimbursements, performance would have been lower. Also, performance shown in this section does not reflect the deduction of taxes that a shareholder would pay on Fund distributions or on gains resulting from redemptions of Fund shares.
| APRIL 30, 2020 | J.P. MORGAN INTERNATIONAL EQUITY FUNDS | 5 | ||||||
Table of Contents
JPMorgan Emerging Markets Equity Fund
FUND COMMENTARY
SIX MONTHS ENDED APRIL 30, 2020 (Unaudited) (continued)
International investing involves a greater degree of risk and increased volatility. Changes in currency exchange rates and differences in accounting and taxation policies outside the U.S. can raise or lower returns. Also, some overseas markets may not be as politically and economically stable as the United States and other nations.
The returns shown are based on net asset values calculated for shareholder transactions and may differ from the returns shown in the financial highlights, which reflect adjustments made to the net asset values in accordance with accounting principles generally accepted in the United States of America.
| 6 | J.P. MORGAN INTERNATIONAL EQUITY FUNDS | APRIL 30, 2020 | ||||
Table of Contents
JPMorgan Emerging Markets Research Enhanced Equity Fund
FUND COMMENTARY
SIX MONTHS ENDED APRIL 30, 2020 (Unaudited)
| REPORTING PERIOD RETURN: | ||||
| Fund (Class R6 Shares)* | (11.73)% | |||
| MSCI Emerging Markets Index (net of foreign withholding taxes) | (10.50)% | |||
Net Assets as of 4/30/2020 (In Thousands) | $ | 2,382,905 | ||
INVESTMENT OBJECTIVE**
The JPMorgan Emerging Markets Research Enhanced Equity Fund (the “Fund”) seeks to provide long-term capital appreciation.
WHAT WERE THE MAIN DRIVERS OF THE FUND’S PERFORMANCE?
The Fund’s Class R6 Shares underperformed the MSCI Emerging Markets Index (net of foreign withholding taxes) (the “Benchmark”) for the six months ended April 30, 2020.
By sector, the Fund’s security selection in the financials and industrials sectors was a leading contributor to relative performance, while the Fund’s security selection in the energy and consumer discretionary sectors was a leading detractor from relative performance.
By country, the Fund’s security selection in South Korea and Taiwan was a leading detractor from performance relative to the Benchmark, while the Fund’s security selection in Saudi Arabia and Poland was a leading contributor relative performance.
Leading individual detractors from relative performance included the Fund’s overweight positions in Itau Unibanco Holding SA, CVC Brasil Operadora SA and China Oilfield Services Ltd. Shares of Itau Unibanco Holding, a Brazilian banking and financial services company, fell amid investor expectations for a sharp contraction in Brazil’s economy in response to the COVID-19 pandemic. Shares of CVC Brasil Operadora, a Brazilian travel agency, fell amid investor expectations that its leisure travel would be severely curtailed in response to the COVID-19 pandemic. Shares of China Oilfield Services Ltd., a Chinese offshore oilfield services provider, fell amid a sharp decline in global prices for petroleum and natural gas in 2020.
Leading individual contributors to relative performance included the Fund’s underweight positions in HDFC Ltd. and Axis Bank Ltd. and its overweight position in Yonyou Network Technology Co. Shares of HDFC, and Indian banking and financial services company, fell amid investor expectations that at-home quarantine orders issued by the Indian government in response to the COVID-19 pandemic would lead to a sharp contraction in the India’s economy. Shares of Axis Bank, an Indian financial services company, fell after it reported a loss for the quarter ended March 31, 2020. Shares of Yonyou Network Technology, a Chinese provider of cloud computing, software and services to businesses, rose amid investor expectation that cloud computing services would experience greater demand during at-home quarantines in response to the COVID-19 pandemic.
HOW WAS THE FUND POSITIONED?
The Fund’s portfolio managers employed a combination of disciplined portfolio construction with in-depth fundamental research conducted
by a global network of research analysts to identify what they believed to be overvalued and undervalued stocks.
As a result of this process, the Fund’s smallest underweight allocations relative to the Benchmark were in the consumer discretionary and real estate sectors and its largest relative underweight allocations were in the financials and materials sectors. By country, the Fund’s largest overweight allocations relative to the Benchmark were in Mexico and Russia and its largest relative underweight allocations were in Taiwan and Malaysia.
| TOP TEN EQUITY HOLDINGS OF THE PORTFOLIO*** | ||||||||
| 1. | Alibaba Group Holding Ltd., ADR (China) | 7.1 | % | |||||
| 2. | Tencent Holdings Ltd. (China) | 6.1 | ||||||
| 3. | Taiwan Semiconductor Manufacturing Co. Ltd., ADR (Taiwan) | 5.1 | ||||||
| 4. | Samsung Electronics Co. Ltd. (South Korea) | 4.6 | ||||||
| 5. | China Construction Bank Corp., Class H (China) | 1.8 | ||||||
| 6. | Ping An Insurance Group Co. of China Ltd., Class H (China) | 1.5 | ||||||
| 7. | Reliance Industries Ltd. (India) | 1.2 | ||||||
| 8. | Housing Development Finance Corp. Ltd. (India) | 1.1 | ||||||
| 9. | Naspers Ltd., Class N (South Africa) | 1.0 | ||||||
| 10. | SK Hynix, Inc. (South Korea) | 0.9 | ||||||
PORTFOLIO COMPOSITION BY COUNTRY*** | ||||
| China | 39.3 | % | ||
| South Korea | 12.3 | |||
| Taiwan | 12.0 | |||
| India | 8.7 | |||
| Brazil | 4.6 | |||
| Russia | 4.1 | |||
| South Africa | 3.5 | |||
| Mexico | 2.4 | |||
| Saudi Arabia | 2.4 | |||
| Thailand | 1.6 | |||
| Indonesia | 1.6 | |||
| Turkey | 1.1 | |||
| Malaysia | 1.1 | |||
| Others (each less than 1.0%) | 4.0 | |||
| Short-Term Investments | 1.3 | |||
| * | The return shown is based on net asset values calculated for shareholder transactions and may differ from the return shown in the financial highlights, which reflects adjustments made to the net asset values in accordance with accounting principles generally accepted in the United States of America. |
| ** | The adviser seeks to achieve the Fund’s objective. There can be no guarantee it will be achieved. |
| *** | Percentages indicated are based on total investments as of April 30, 2020. The Fund’s portfolio composition is subject to change. |
| APRIL 30, 2020 | J.P. MORGAN INTERNATIONAL EQUITY FUNDS | 7 | ||||||
Table of Contents
JPMorgan Emerging Markets Research Enhanced Equity Fund
FUND COMMENTARY
SIX MONTHS ENDED APRIL 30, 2020 (Unaudited) (continued)
AVERAGE ANNUAL TOTAL RETURNSAS OF APRIL 30, 2020 | ||||||||||||||
| INCEPTION DATE OF CLASS | 6 MONTH* | 1 YEAR | SINCE INCEPTION | |||||||||||
CLASS I SHARES | January 30, 2019 | (11.79 | )% | (12.63 | )% | (0.58 | )% | |||||||
CLASS R6 SHARES | December 11, 2018 | (11.73 | ) | (12.51 | ) | (0.44 | ) | |||||||
| * | Not annualized. |
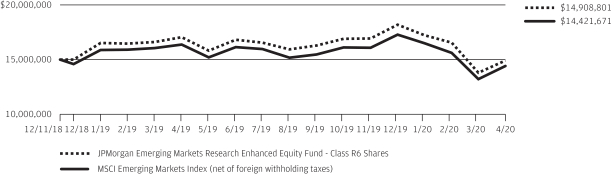
LIFE OF FUND PERFORMANCE(12/11/18 TO 4/30/20)
The performance quoted is past performance and is not a guarantee of future results. Mutual funds are subject to certain market risks. Investment returns and principal value of an investment will fluctuate so that an investor’s shares, when redeemed, may be worth more or less than their original cost. Current performance may be higher or lower than the performance data shown. For up-to-date month-end performance information pleasecall 1-800-480-4111.
The Fund commenced operations on December 11, 2018.
Returns for Class I Shares prior to its inception date are based on the performance of Class R6 Shares. The actual returns of Class I Shares would have been lower than those shown because Class I Shares have higher expenses than Class R6 Shares.
The graph illustrates comparative performance for $15,000,000 invested in Class R6 Shares of the JPMorgan Emerging Markets Research Enhanced Equity Fund and the MSCI Emerging Markets Index (net of foreign withholding taxes) from December 11, 2018 to April 30, 2020. The performance of the Fund assumes reinvestment of all dividends and capital gain distributions, if any, and does not include a sales charge. The performance of the MSCI Emerging Markets Index (net of foreign withholding taxes) does not reflect the deduction of expenses or a sales charge associated with a mutual fund and approximates the minimum possible dividend reinvestment of the securities included in the benchmark, if applicable. The dividend is reinvested after deduction of
withholding tax, applying the maximum rate to non-resident individual investors who do not benefit from double taxation treaties. The MSCI Emerging Markets Index (net of foreign withholding taxes) is a free float-adjusted market capitalization weighted index that is designed to measure the equity market performance of emerging markets. Investors cannot invest directly in an index.
Class R6 Shares have a $15,000,000 minimum initial investment.
Fund performance may reflect the waiver of the Fund’s fees and reimbursement of expenses for certain periods since the applicable inception date. Without these waivers and reimbursements, performance would have been lower. Also, performance shown in this section does not reflect the deduction of taxes that a shareholder would pay on Fund distributions or on gains resulting from redemptions of Fund shares.
International investing involves a greater degree of risk and increased volatility. Changes in currency exchange rates and differences in accounting and taxation policies outside the U.S. can raise or lower returns. Also, some overseas markets may not be as politically and economically stable as the U.S. and other nations.
The returns shown are based on net asset values calculated for shareholder transactions and may differ from the returns shown in the financial highlights, which reflect adjustments made to the net asset values in accordance with accounting principles generally accepted in the United States of America.
| 8 | J.P. MORGAN INTERNATIONAL EQUITY FUNDS | APRIL 30, 2020 | ||||
Table of Contents
FUND COMMENTARY
SIX MONTHS ENDED APRIL 30, 2020 (Unaudited)
| REPORTING PERIOD RETURN: | ||||
| Fund (Class A Shares, without a sales charge)* | (16.65)% | |||
| MSCI Europe Index (net of foreign withholding taxes) | (15.47)% | |||
| Net Assets as of 4/30/2020 (In Thousands) | $ | 417,455 | ||
INVESTMENT OBJECTIVE**
The JPMorgan Europe Dynamic Fund (the “Fund”) seeks total return from long-term capital growth. Total return consists of capital growth and current income.
WHAT WERE THE MAIN DRIVERS OF THE FUND’S PERFORMANCE?
The Fund’s Class A Shares, without a sales charge, underperformed the MSCI Europe Index (net of foreign withholding taxes) (the “Benchmark”) for the six months ended April 30, 2020.
By sector, the Fund’s underweight allocation and security selection in the food, beverages & tobacco sector and its security selection in the transportation sector were leading detractors from performance relative to the Benchmark. The Fund’s security selection in the consumer services sector and its underweight allocation in the banks sector were leading contributors to relative performance.
Leading individual detractors from relative performance included the Fund’sout-of-Benchmark positions in Nestle SA and Dart Group PLC and its overweight position in Peugeot SA. Shares of Nestle, a Swiss maker of prepared foods and consumer goods, fell after the company reported a decline in sales for the first quarter of 2020. Shares of Dart Group, a U.K. provider of leisure airline travel, distribution and logistics, fell amid a halt to most airline traffic in response to theCOVID-19
pandemic. Shares of Peugeot, a French automaker, fell amid a sharp decline in new car sales in early 2020.
Leading individual contributors to relative performance included the Fund’s overweight positions in Roche Holding SA, Evolution Gaming Group AB and Polymetal International PLC. Shares of Roche Holding, a Swiss pharmaceutical company, rose amid investor expectations that it would benefit from a potential vaccine, treatment or test for theCOVID-19 virus. Shares of Evolution Gaming Group, a Swedish online casino and gaming provider not held in the Benchmark, rose as investors sought companies they believed were well positioned to weather financial market volatility in 2020. Shares of Polymetal International, a gold and silver mining company not held in the Benchmark, rose amid investor expectations for rising demand for precious metals in the face of financial market volatility in 2020.
HOW WAS THE FUND POSITIONED?
The Fund’s portfolio managers believe that attractively valued, high quality securities with positive momentum have the potential to outperform the market. During the reporting period, the Fund’s portfolio managers invested in securities that they believed had these style characteristics. Portfolio positions were based onbottom-up security selection rather thantop-down asset allocation decisions.
| APRIL 30, 2020 | J.P. MORGAN INTERNATIONAL EQUITY FUNDS | 9 | ||||||
Table of Contents
JPMorgan Europe Dynamic Fund
FUND COMMENTARY
SIX MONTHS ENDED APRIL 30, 2020 (Unaudited) (continued)
| TOP TEN EQUITY HOLDINGS OF THE PORTFOLIO*** | ||||||||
| 1. | Roche Holding AG (Switzerland) | 4.7 | % | |||||
| 2. | Novartis AG (Registered) (Switzerland) | 3.9 | ||||||
| 3. | Nestle SA (Registered) (Switzerland) | 3.4 | ||||||
| 4. | Sanofi (France) | 3.2 | ||||||
| 5. | Allianz SE (Registered) (Germany) | 2.2 | ||||||
| 6. | Linde plc (United Kingdom) | 2.1 | ||||||
| 7. | Enel SpA (Italy) | 2.1 | ||||||
| 8. | Koninklijke Ahold Delhaize NV (Netherlands) | 2.1 | ||||||
| 9. | Kering SA (France) | 1.9 | ||||||
| 10. | Swisscom AG (Registered) (Switzerland) | 1.8 | ||||||
PORTFOLIO COMPOSITION BY COUNTRY*** | ||||
| Switzerland | 19.0 | % | ||
| United Kingdom | 15.9 | |||
| France | 13.6 | |||
| Germany | 11.9 | |||
| Netherlands | 7.4 | |||
| Italy | 4.5 | |||
| Sweden | 3.6 | |||
| Belgium | 2.2 | |||
| Australia | 2.1 | |||
| Austria | 2.0 | |||
| Finland | 1.8 | |||
| Russia | 1.8 | |||
| Ireland | 1.7 | |||
| Spain | 1.3 | |||
| Others (each less than 1.0%) | 1.3 | |||
| Short-Term Investments | 9.9 | |||
| * | The return shown is based on net asset values calculated for shareholder transactions and may differ from the return shown in the financial highlights, which reflects adjustments made to the net asset values in accordance with accounting principles generally accepted in the United States of America. |
| ** | The adviser seeks to achieve the Fund’s objective. There can be no guarantee it will be achieved. |
| *** | Percentages indicated are based on total investments as of April 30, 2020. The Fund’s portfolio composition is subject to change. |
| 10 | J.P. MORGAN INTERNATIONAL EQUITY FUNDS | APRIL 30, 2020 | ||||
Table of Contents
AVERAGE ANNUAL TOTAL RETURNSAS OF APRIL 30, 2020 | ||||||||||||||||
| INCEPTION DATE OF CLASS | 6 MONTH* | 1 YEAR | 5 YEAR | 10 YEAR | ||||||||||||
CLASS A SHARES | November 2, 1995 | |||||||||||||||
With Sales Charge** | (21.02)% | (19.45 | )% | (3.87 | )% | 2.83 | % | |||||||||
Without Sales Charge | (16.65) | (14.97 | ) | (2.83 | ) | 3.39 | ||||||||||
CLASS C SHARES | November 1, 1998 | |||||||||||||||
With CDSC*** | (17.82) | (16.36 | ) | (3.31 | ) | 2.87 | ||||||||||
Without CDSC | (16.82) | (15.36 | ) | (3.31 | ) | 2.87 | ||||||||||
CLASS I SHARES | September 10, 2001 | (16.56) | (14.73 | ) | (2.56 | ) | 3.67 | |||||||||
CLASS L SHARES | September 10, 2001 | (16.47) | (14.63 | ) | (2.41 | ) | 3.86 | |||||||||
CLASS R6 SHARES | October 1, 2018 | (16.44) | (14.56 | ) | (2.39 | ) | 3.87 | |||||||||
| * | Not annualized. |
| ** | Sales Charge for Class A Shares is 5.25%. |
| *** | Assumes a 1% CDSC (contingent deferred sales charge) for the 6 month and one year periods and 0% CDSC thereafter. |
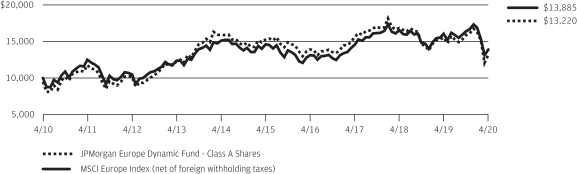
TEN YEAR PERFORMANCE(4/30/10 TO 4/30/20)
The performance quoted is past performance and is not a guarantee of future results. Mutual funds are subject to certain market risks. Investment returns and principal value of an investment will fluctuate so that an investor’s shares, when redeemed, may be worth more or less than their original cost. Current performance may be higher or lower than the performance data shown. For up-to-date month-end performance information please call 1-800-480-4111.
Returns for Class R6 Shares prior to its inception date are based on the performance of Class L Shares. The actual returns of Class R6 Shares would have been different than those shown because Class R6 Shares have different expenses than Class L Shares.
The graph illustrates comparative performance for $10,000 invested in Class A Shares of the JPMorgan Europe Dynamic Fund and the MSCI Europe Index (net of foreign withholding taxes) from April 30, 2010 to April 30, 2020. The performance of the Fund assumes reinvestment of all dividends and capital gain distributions, if any, and includes a sales charge. The performance of the MSCI Europe Index (net of foreign withholding taxes) does not reflect the deduction of expenses or a sales charge associated with a mutual fund and approximates the minimum possible dividend reinvestment of the securities included in the benchmark, if applicable. The dividend is reinvested after deduction of withholding tax, applying the maximum rate to non-resident individual investors who
do not benefit from double taxation treaties. The MSCI Europe Index (net of foreign withholding taxes) is a free float-adjusted market capitalization weighted index that is designed to measure the equity market performance of the developed markets in Europe. Investors cannot invest directly in an index.
Class A Shares have a $1,000 minimum initial investment and carry a 5.25% sales charge.
Fund performance may reflect the waiver of the Fund’s fees and reimbursement of expenses for certain periods since the applicable inception date. Without these waivers and reimbursements, performance would have been lower. Also, performance shown in this section does not reflect the deduction of taxes that a shareholder would pay on Fund distributions or on gains resulting from redemptions of Fund shares.
International investing involves a greater degree of risk and increased volatility. Changes in currency exchange rates and differences in accounting and taxation policies outside the U.S. can raise or lower returns. Also, some overseas markets may not be as politically and economically stable as the U.S. and other nations.
The returns shown are based on net asset values calculated for shareholder transactions and may differ from the returns shown in the financial highlights, which reflect adjustments made to the net asset values in accordance with accounting principles generally accepted in the United States of America.
| APRIL 30, 2020 | J.P. MORGAN INTERNATIONAL EQUITY FUNDS | 11 | ||||||
Table of Contents
JPMorgan International Advantage Fund
FUND COMMENTARY
SIX MONTHS ENDED APRIL 30, 2020 (Unaudited)
| REPORTING PERIOD RETURN: | ||||
| Fund (Class A Shares, without a sales charge)* | (16.19)% | |||
| MSCI EAFE Index (net of foreign withholding taxes) | (14.21)% | |||
| Net Assets as of 4/30/2020 (In Thousands) | $ | 1,494,850 | ||
INVESTMENT OBJECTIVE**
The JPMorgan International Advantage Fund (the “Fund”) seeks to maximize long-term capital growth by investing primarily in equity securities in developed markets outside the U.S.
WHAT WERE THE MAIN DRIVERS OF THE FUND’S PERFORMANCE?
The Fund’s Class A Shares, without a sales charge, underperformed the MSCI EAFE Index (net of foreign withholding taxes) (the “Benchmark”) for the six months ended April 30, 2020.
By sector, the Fund’s security selection in the industrials sector and its underweight allocation and security selection in the consumer staples sector were leading detractors from performance relative to the Benchmark, while the Fund’s overweight allocation in the information technology sector and its security selection in the communication services sector were leading contributors to relative performance.
By country, the Fund’s security selection in Germany and Japan was a leading detractor from relative performance, while the Fund’s security selection in the U.K. and its underweight allocation to France were leading contributors to relative performance.
The Fund targeted investments in companies that exhibited specific growth, value and quality characteristics during the period. Due to the relatively large number of securities held in the Fund during the reporting period, the impact of individual holdings on the Fund’s relative performance tended to be small.
HOW WAS THE FUND POSITIONED?
The Fund’s portfolio managers believe that attractively valued, high quality securities with positive momentum have the potential to outperform the market. During the reporting period, the Fund’s portfolio managers invested in securities that they believed were attractive based on their proprietary multifactor model.
| TOP TEN EQUITY HOLDINGS OF THE PORTFOLIO*** | ||||||||
| 1. | Nestle SA (Registered) (Switzerland) | 2.8 | % | |||||
| 2. | Roche Holding AG (Switzerland) | 2.7 | ||||||
| 3. | Novartis AG (Registered) (Switzerland) | 2.2 | ||||||
| 4. | Sanofi (France) | 1.9 | ||||||
| 5. | BHP Group Ltd. (Australia) | 1.6 | ||||||
| 6. | Novo Nordisk A/S, Class B (Denmark) | 1.5 | ||||||
| 7. | Toyota Motor Corp. (Japan) | 1.5 | ||||||
| 8. | Allianz SE (Registered) (Germany) | 1.5 | ||||||
| 9. | Rio Tinto plc (Australia) | 1.3 | ||||||
| 10. | Schneider Electric SE (France) | 1.3 | ||||||
PORTFOLIO COMPOSITION BY COUNTRY*** | ||||
| Japan | 24.5 | % | ||
| Switzerland | 11.3 | |||
| United Kingdom | 10.5 | |||
| Australia | 8.9 | |||
| France | 6.7 | |||
| Netherlands | 6.2 | |||
| Germany | 6.0 | |||
| Sweden | 2.6 | |||
| Denmark | 2.4 | |||
| Hong Kong | 2.4 | |||
| Singapore | 2.4 | |||
| Spain | 1.8 | |||
| Belgium | 1.2 | |||
| Italy | 1.1 | |||
| Norway | 1.0 | |||
| Others (each less than 1.0%) | 4.2 | |||
| Short-Term Investments | 6.8 | |||
| * | The return shown is based on net asset values calculated for shareholder transactions and may differ from the return shown in the financial highlights, which reflects adjustments made to the net asset values in accordance with accounting principles generally accepted in the United States of America. |
| ** | The adviser seeks to achieve the Fund’s objective. There can be no guarantee it will be achieved. |
| *** | Percentages indicated are based on total investments as of April 30, 2020. The Fund’s portfolio composition is subject to change. |
| 12 | J.P. MORGAN INTERNATIONAL EQUITY FUNDS | APRIL 30, 2020 | ||||
Table of Contents
AVERAGE ANNUAL TOTAL RETURNSAS OF APRIL 30, 2020 | ||||||||||||||||||
| INCEPTION DATE OF CLASS | 6 MONTH* | 1 YEAR | 5 YEAR | 10 YEAR | ||||||||||||||
CLASS A SHARES | April 30, 2001 | |||||||||||||||||
With Sales Charge** | (20.58 | )% | (19.93 | )% | (3.55 | )% | 1.79 | % | ||||||||||
Without Sales Charge | (16.19 | ) | (15.51 | ) | (2.50 | ) | 2.34 | |||||||||||
CLASS C SHARES | February 28, 2006 | |||||||||||||||||
With CDSC*** | (17.34 | ) | (16.92 | ) | (2.98 | ) | 1.83 | |||||||||||
Without CDSC | (16.34 | ) | (15.92 | ) | (2.98 | ) | 1.83 | |||||||||||
CLASS I SHARES | February 28, 2006 | (16.01 | ) | (15.27 | ) | (2.19 | ) | 2.62 | ||||||||||
CLASS R2 SHARES | November 3, 2008 | (16.29 | ) | (15.77 | ) | (2.76 | ) | 2.07 | ||||||||||
CLASS R6 SHARES | May 29, 2015 | (15.95 | ) | (15.12 | ) | (2.02 | ) | 2.85 | ||||||||||
| * | Not annualized. |
| ** | Sales Charge for Class A Shares is 5.25%. |
| *** | Assumes a 1% CDSC (contingent deferred sales charge) for the 6 month and one year periods and 0% CDSC thereafter. |
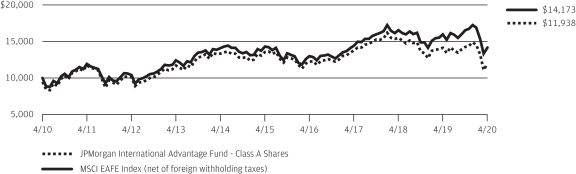
TEN YEAR PERFORMANCE(4/30/10 TO 4/30/20)
The performance quoted is past performance and is not a guarantee of future results. Mutual funds are subject to certain market risks. Investment returns and principal value of an investment will fluctuate so that an investor’s shares, when redeemed, may be worth more or less than their original cost. Current performance may be higher or lower than the performance data shown. Forup-to-datemonth-end performance information please call1-800-480-4111.
Returns for Class R6 Shares prior to its inception date are based on the performance of the now liquidated Institutional Class Shares. The actual returns of Class R6 Shares would have been different than those shown because Class R6 Shares have different expenses than Institutional Class Shares.
The graph illustrates comparative performance for $10,000 invested in Class A Shares of the JPMorgan International Advantage Fund and the MSCI EAFE Index (net of foreign withholding taxes) from April 30, 2010 to April 30, 2020. The performance of the Fund assumes reinvestment of all dividends and capital gain distributions, if any, and does not include a sales charge. The performance of the MSCI EAFE Index (net of foreign withholding taxes) does not reflect the deduction of expenses or a sales charge associated with a mutual fund and approximates the minimum possible dividend reinvestment of the securities included in the benchmark, if applicable. The dividend is reinvested after deduction of withholding tax, applying the maximum rate to non-resident institutional investors who do not benefit from double taxation treaties. The MSCI EAFE Index (net of foreign withholding taxes) is a free
float-adjusted market capitalization weighted index that is designed to measure the equity market performance of developed markets, excluding the U.S. and Canada. Investors cannot invest directly in an index.
Class A Shares have a $1,000 minimum initial investment and carry a 5.25% sales charge.
Fund performance may reflect the waiver of the Fund’s fees and reimbursement of expenses for certain periods since the applicable inception date. Without these waivers and reimbursements, performance would have been lower. Also, performance shown in this section does not reflect the deduction of taxes that a shareholder would pay on Fund distributions or on gains resulting from redemptions of Fund shares.
International investing involves a greater degree of risk and increased volatility. Changes in currency exchange rates and differences in accounting and taxation policies outside the U.S. can raise or lower returns. Also, some overseas markets may not be as politically and economically stable as the U.S. and other nations.
The returns shown are based on net asset values calculated for shareholder transactions and may differ from the returns shown in the financial highlights, which reflect adjustments made to the net asset values in accordance with accounting principles generally accepted in the United States of America.
| APRIL 30, 2020 | J.P. MORGAN INTERNATIONAL EQUITY FUNDS | 13 | ||||||
Table of Contents
JPMorgan International Equity Fund
FUND COMMENTARY
SIX MONTHS ENDED APRIL 30, 2020 (Unaudited)
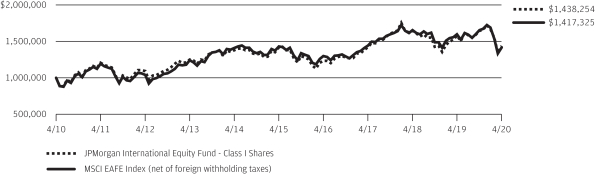
| REPORTING PERIOD RETURN: | ||||
| Fund (Class I Shares)* | (12.50)% | |||
| MSCI EAFE Index (net of foreign withholding taxes) | (14.21)% | |||
| Net Assets as of 4/30/2020 (In Thousands) | $ | 2,667,454 | ||
INVESTMENT OBJECTIVE**
The JPMorgan International Equity Fund (the “Fund”) seeks total return from long-term capital growth and income. Total return consists of capital growth and current income.
WHAT WERE THE MAIN DRIVERS OF THE FUND’S PERFORMANCE?
The Fund’s Class I Shares outperformed the MSCI EAFE Index (net of foreign withholding taxes) (the “Benchmark”) for the six months ended April 30, 2020.
By sector, the Fund’s security selection in the financials sector and its security selection and overweight allocation to the information technology sector were leading contributors to performance relative to the Benchmark, while the Fund’s underweight position in the health care sector and its security selection in the consumer staples sector were leading detractors from relative performance.
By region, the Fund’s security selection in Europe, excluding the U.K., and in the Pacific, excluding Japan, was a leading contributor to performance relative to the Benchmark, while the Fund’s underweight allocation to Japan was the sole regional detractor from relative performance.
Leading individual contributors to the Fund’s relative performance included the Fund’s overweight positions in Roche Holding SA, Tencent Holdings Ltd. and Novo Nordisk A/S. Shares of Roche Holding, a Swiss pharmaceutical company, rose amid investor expectations that it would benefit from a potential vaccine, treatment or test for theCOVID-19 virus. Shares of Tencent Holdings, a Hong Kong online gaming, advertising and services company, rose amid growth in earnings and revenue and investor expectations for increased traffic to its services duringat-home quarantines as a result of theCOVID-19 pandemic. Shares of Novo Nordisk, a Danish pharmaceuticals company, rose after the company reported better-than-expected results for the fourth quarter of 2019.
Leading individual detractors from the Fund’s relative performance included its overweight positions in Itau Unibanco Holding SA, ING Groep NV and Royal Dutch Shell PLC. Shares of Itau Unibanco Holding, a Brazilian banking and financial services company, fell amid investor expectations for a sharp contraction in Brazil’s economy in response to theCOVID-19 pandemic. Shares of ING Groep, a Dutch banking, financial services and insurance provider, fell after the company reported lower-than-expected earnings for the fourth quarter of 2019. Shares of Royal Dutch Shell, a British/Dutch oil and natural gas producer and retailer, fell as global energy demand contracted and global oil prices fell sharply in 2020.
HOW WAS THE FUND POSITIONED?
The Fund’s portfolio managers continued to focus on security selection to build a portfolio of international equities. They usedbottom-up fundamental research to identify what they believed were attractively priced securities of companies with solid financial positions that possessed the potential to increase their earnings faster than their industry peers.
| TOP TEN EQUITY HOLDINGS OF THE PORTFOLIO*** | ||||||||
| 1. | Nestle SA (Registered) (Switzerland) | 4.0 | % | |||||
| 2. | Roche Holding AG (Switzerland) | 3.5 | ||||||
| 3. | Novartis AG (Registered) (Switzerland) | 2.6 | ||||||
| 4. | AIA Group Ltd. (Hong Kong) | 2.3 | ||||||
| 5. | GlaxoSmithKline plc (United Kingdom) | 2.3 | ||||||
| 6. | Novo Nordisk A/S, Class B (Denmark) | 2.2 | ||||||
| 7. | ASML Holding NV (Netherlands) | 2.1 | ||||||
| 8. | Diageo plc (United Kingdom) | 2.0 | ||||||
| 9. | SAP SE (Germany) | 2.0 | ||||||
| 10. | Sony Corp. (Japan) | 1.9 | ||||||
PORTFOLIO COMPOSITION BY COUNTRY*** | ||||
| Japan | 14.8 | % | ||
| United Kingdom | 14.2 | |||
| Switzerland | 13.3 | |||
| France | 12.8 | |||
| Germany | 7.8 | |||
| Netherlands | 4.1 | |||
| Denmark | 4.0 | |||
| Hong Kong | 4.0 | |||
| China | 3.6 | |||
| Australia | 3.4 | |||
| Sweden | 2.3 | |||
| Taiwan | 1.6 | |||
| South Korea | 1.4 | |||
| Finland | 1.2 | |||
| India | 1.2 | |||
| United States | 1.2 | |||
| Spain | 1.0 | |||
| Singapore | 1.0 | |||
| Others (each less than 1.0%) | 2.0 | |||
| Short-Term Investments | 5.1 | |||
| * | The return shown is based on net asset values calculated for shareholder transactions and may differ from the return shown in the financial highlights, which reflects adjustments made to the net asset values in accordance with accounting principles generally accepted in the United States of America. |
| ** | The adviser seeks to achieve the Fund’s objective. There can be no guarantee it will be achieved. |
| *** | Percentages indicated are based on total investments as of April 30, 2020. The Fund’s portfolio composition is subject to change. |
| 14 | J.P. MORGAN INTERNATIONAL EQUITY FUNDS | APRIL 30, 2020 | ||||
Table of Contents
AVERAGE ANNUAL TOTAL RETURNSAS OF APRIL 30, 2020 | ||||||||||||||||||
| INCEPTION DATE OF CLASS | 6 MONTH* | 1 YEAR | 5 YEAR | 10 YEAR | ||||||||||||||
CLASS A SHARES | February 28, 2002 | |||||||||||||||||
With Sales Charge** | (17.21 | )% | (14.00 | )% | (1.02 | )% | 2.89 | % | ||||||||||
Without Sales Charge | (12.60 | ) | (9.25 | ) | 0.05 | 3.45 | ||||||||||||
CLASS C SHARES | January 31, 2003 | |||||||||||||||||
With CDSC*** | (13.88 | ) | (10.79 | ) | (0.46 | ) | 2.92 | |||||||||||
Without CDSC | (12.88 | ) | (9.79 | ) | (0.46 | ) | 2.92 | |||||||||||
CLASS I SHARES | January 1, 1997 | (12.50 | ) | (9.03 | ) | 0.30 | 3.70 | |||||||||||
CLASS R2 SHARES | November 3, 2008 | (12.77 | ) | (9.55 | ) | (0.23 | ) | 3.17 | ||||||||||
CLASS R5 SHARES | May 15, 2006 | (12.45 | ) | (8.94 | ) | 0.44 | 3.88 | |||||||||||
CLASS R6 SHARES | November 30, 2010 | (12.43 | ) | (8.86 | ) | 0.52 | 3.95 | |||||||||||
| * | Not annualized. |
| ** | Sales Charge for Class A Shares is 5.25%. |
| *** | Assumes a 1% CDSC (contingent deferred sales charge) for the 6 month and one year periods and 0% CDSC thereafter. |
TEN YEAR PERFORMANCE(4/30/10 TO 4/30/20)
The performance quoted is past performance and is not a guarantee of future results. Mutual funds are subject to certain market risks. Investment returns and principal value of an investment will fluctuate so that an investor’s shares, when redeemed, may be worth more or less than their original cost. Current performance may be higher or lower than the performance data shown. Forup-to-datemonth-end performance information please call1-800-480-4111.
Returns for Class R6 Shares prior to its inception date are based on the performance of Class R5 Shares. The actual returns of Class R6 Shares would have been different than those shown because Class R6 Shares have different expenses than Class R5 Shares.
The graph illustrates comparative performance for $1,000,000 invested in Class I Shares of the JPMorgan International Equity Fund and the MSCI EAFE Index (net of foreign withholding taxes) from April 30, 2010 to April 30, 2020. The performance of the Fund assumes reinvestment of all dividends and capital gain distributions, if any, and does not include a sales charge. The performance of the MSCI EAFE Index (net of foreign withholding taxes) does not reflect the deduction of expenses or a sales charge associated with a mutual fund and approximates the minimum possible dividend reinvestment of the securities included in the benchmark, if applicable. The dividend is reinvested after deduction of withholding tax, applying the maximum rate to non-resident institutional investors who do not benefit from double taxation treaties. The
MSCI EAFE Index (net of foreign withholding taxes) is a free float-adjusted market capitalization weighted index that is designed to measure the equity market performance of developed markets, excluding the U.S. and Canada. Investors cannot invest directly in an index.
Class I Shares have a $1,000,000 minimum initial investment.
Fund performance may reflect the waiver of the Fund’s fees and reimbursement of expenses for certain periods since the applicable inception date. Without these waivers and reimbursements, performance would have been lower. Also, performance shown in this section does not reflect the deduction of taxes that a shareholder would pay on Fund distributions or on gains resulting from redemptions of Fund shares.
International investing involves a greater degree of risk and increased volatility. Changes in currency exchange rates and differences in accounting and taxation policies outside the U.S. can raise or lower returns. Also, some overseas markets may not be as politically and economically stable as the United States and other nations.
The returns shown are based on net asset values calculated for shareholder transactions and may differ from the returns shown in the financial highlights, which reflect adjustments made to the net asset values in accordance with accounting principles generally accepted in the United States of America.
| APRIL 30, 2020 | J.P. MORGAN INTERNATIONAL EQUITY FUNDS | 15 | ||||||
Table of Contents
JPMorgan International Focus Fund
(formerly known as JPMorgan International Unconstrained Equity Fund)
FUND COMMENTARY
SIX MONTHS ENDED APRIL 30, 2020 (Unaudited)
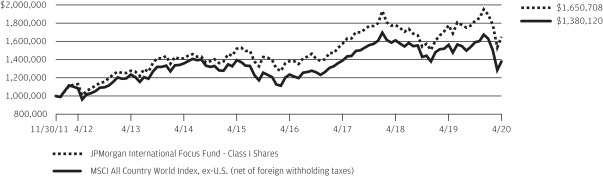
| REPORTING PERIOD RETURN: | ||||
| Fund (Class I Shares)* | (9.60)% | |||
| MSCI All Country World Index,Ex-U.S. (net of foreign withholding taxes) | (13.22)% | |||
| Net Assets as of 4/30/2020 (In Thousands) | $ | 2,535,256 | ||
INVESTMENT OBJECTIVE**
The JPMorgan International Focus Fund (the “Fund”) seeks to provide long-term capital appreciation.
WHAT WERE THE MAIN DRIVERS OF THE FUND’S PERFORMANCE?
The Fund’s Class I Shares outperformed the MSCI All Country World Index,Ex-U.S. (net of foreign withholding taxes) (the “Benchmark”) for the six months ended April 30, 2020.
By sector, the Fund’s security selection in the consumer discretionary and financials sectors was a leading contributor to performance relative to the Benchmark. The Fund’s security selection in the health care and materials sectors was a leading detractor from relative performance.
By region, the Fund’s security selection in continental Europe and the U.K. was a leading contributor to relative performance, while the Fund’s underweight position in Japan was the sole regional detractor from relative performance.
Leading individual contributors to the Fund’s relative performance included its overweight positions in Delivery Hero AG, Tencent Holdings Ltd. and Novo Nordisk A/S. Shares of Delivery Hero, a German online food delivery service, rose amid investor expectations for increased demand duringat-home quarantines as a result of theCOVID-19 pandemic. Shares of Tencent Holdings, a Hong Kong online gaming, advertising and services
company, rose amid growth in earnings and revenue and investor expectations for increased traffic to its services duringat-home quarantines as a result of theCOVID-19 pandemic. Shares of Novo Nordisk, a Danish pharmaceuticals company, rose after the company reported better-than-expected results for the fourth quarter of 2019.
Leading individual detractors from the Fund’s relative performance included its overweight positions in Airbus SE, Continental AG and HDFC Bank Ltd. Shares of Airbus, a French airplanes and aerospace company, fell after the company slashed production due to decreased demand amid theCOVID-19 pandemic. Shares of Continental, a German rubber tire manufacturer, fell amid a sharp decline in automobile sales in 2020. Shares of HDFC Bank, an Indian banking and financial services provider, fell amid investor expectations thatat-home quarantine orders issued by the Indian government in response to theCOVID-19 pandemic would lead to a sharp contraction in India’s economy.
HOW WAS THE FUND POSITIONED?
By harnessing their team’s global sector specialists, the Fund’s portfolio managers sought to build a high-conviction, benchmark-agnostic portfolio of growth, value and unique companies, whose future prospects, the managers believed, were under-appreciated by the market and thus possessed the potential to deliver higher-than-expected earnings that could have a positive effect on the share price.
| 16 | J.P. MORGAN INTERNATIONAL EQUITY FUNDS | APRIL 30, 2020 | ||||
Table of Contents
| TOP TEN EQUITY HOLDINGS OF THE PORTFOLIO*** | ||||||||
| 1. | Nestle SA (Registered) (Switzerland) | 4.7 | % | |||||
| 2. | Tencent Holdings Ltd. (China) | 3.6 | ||||||
| 3. | AIA Group Ltd. (Hong Kong) | 3.3 | ||||||
| 4. | HDFC Bank Ltd., ADR (India) | 3.1 | ||||||
| 5. | Alibaba Group Holding Ltd., ADR (China) | 3.0 | ||||||
| 6. | Ping An Insurance Group Co. of China Ltd., Class H (China) | 2.9 | ||||||
| 7. | Roche Holding AG (Switzerland) | 2.7 | ||||||
| 8. | GlaxoSmithKline plc (United Kingdom) | 2.7 | ||||||
| 9. | Novo Nordisk A/S, Class B (Denmark) | 2.6 | ||||||
| 10. | Taiwan Semiconductor Manufacturing Co. Ltd., ADR (Taiwan) | 2.6 | ||||||
PORTFOLIO COMPOSITION BY COUNTRY*** | ||||
| United Kingdom | 18.9 | % | ||
| Switzerland | 10.5 | |||
| Germany | 9.5 | |||
| China | 9.4 | |||
| Canada | 6.4 | |||
| France | 6.3 | |||
| Japan | 5.3 | |||
| Hong Kong | 3.3 | |||
| India | 3.1 | |||
| Sweden | 2.9 | |||
| Denmark | 2.6 | |||
| Taiwan | 2.6 | |||
| Netherlands | 2.5 | |||
| South Korea | 2.3 | |||
| Australia | 1.9 | |||
| Belgium | 1.5 | |||
| United States | 1.5 | |||
| Indonesia | 1.4 | |||
| Finland | 1.3 | |||
| Short-Term Investments | 6.8 | |||
| * | The return shown is based on net asset values calculated for shareholder transactions and may differ from the return shown in the financial highlights, which reflects adjustments made to the net asset values in accordance with accounting principles generally accepted in the United States of America. |
| ** | The adviser seeks to achieve the Fund’s objective. There can be no guarantee it will be achieved. |
| *** | Percentages indicated are based on total investments as of April 30, 2020. The Fund’s portfolio composition is subject to change. |
| APRIL 30, 2020 | J.P. MORGAN INTERNATIONAL EQUITY FUNDS | 17 | ||||||
Table of Contents
JPMorgan International Focus Fund
(formerly known as JPMorgan International Unconstrained Equity Fund)
FUND COMMENTARY
SIX MONTHS ENDED APRIL 30, 2020 (Unaudited) (continued)
AVERAGE ANNUAL TOTAL RETURNSAS OF APRIL 30, 2020 | ||||||||
| INCEPTION DATE OF CLASS | 6 MONTH* | 1 YEAR | 5 YEAR | SINCE INCEPTION | ||||||||||||||
CLASS A SHARES | November 30, 2011 | |||||||||||||||||
With Sales Charge** | (14.49 | )% | (12.08 | )% | 0.30 | % | 5.16 | % | ||||||||||
Without Sales Charge | (9.75 | ) | (7.21 | ) | 1.39 | 5.84 | ||||||||||||
CLASS C SHARES | November 30, 2011 | |||||||||||||||||
With CDSC*** | (10.92 | ) | (8.67 | ) | 0.89 | 5.31 | ||||||||||||
Without CDSC | (9.92 | ) | (7.67 | ) | 0.89 | 5.31 | ||||||||||||
CLASS I SHARES | November 30, 2011 | (9.60 | ) | (6.96 | ) | 1.69 | 6.14 | |||||||||||
CLASS R2 SHARES | November 30, 2011 | (9.86 | ) | (7.48 | ) | 1.11 | 5.55 | |||||||||||
CLASS R5 SHARES | November 30, 2011 | (9.54 | ) | (6.84 | ) | 1.80 | 6.29 | |||||||||||
CLASS R6 SHARES | November 30, 2011 | (9.53 | ) | (6.79 | ) | 1.87 | 6.35 | |||||||||||
| * | Not annualized. |
| ** | Sales Charge for Class A Shares is 5.25%. |
| *** | Assumes a 1% CDSC (contingent deferred sales charge) for the 6 month and one year periods and 0% CDSC thereafter. |
LIFE OF FUND PERFORMANCE(11/30/11 TO 4/30/20)
The performance quoted is past performance and is not a guarantee of future results. Mutual funds are subject to certain market risks. Investment returns and principal value of an investment will fluctuate so that an investor’s shares, when redeemed, may be worth more or less than their original cost. Current performance may be higher or lower than the performance data shown. For up-to-date, month-end performance information please call 1-800-480-4111.
The Fund commenced operations on November 30, 2011.
The graph illustrates comparative performance for $1,000,000 invested in Class I Shares of the JPMorgan International Focus Fund and the MSCI All Country World Index, ex-U.S. (net of foreign withholding taxes) from November 30, 2011 to April 30, 2020. The performance of the Fund assumes reinvestment of all dividends and capital gain distributions, if any, and does not include a sales charge. The performance of the MSCI All Country World Index, ex-U.S. (net of foreign withholding taxes) does not reflect the deduction of expenses or a sales charge associated with a mutual fund and approximates the minimum possible dividend reinvestment of the securities included in the benchmark, if applicable. The dividend is reinvested after deduction of withholding tax, applying the maximum rate to non-resident institutional investors who do not benefit from double taxation treaties. The MSCI All Country World Index, ex-U.S. (net of foreign withholding taxes) is a free float-adjusted market capitalization weighted index that is designed to measure the equity market performance of developed and emerging markets, excluding the United States. Investors cannot invest directly in an index.
Class I Shares have a $1,000,000 minimum initial investment.
Subsequent to the inception date of the Fund and through May 30, 2013, the Fund did not experience any shareholder activity. If such shareholder activity had occurred, the Fund’s performance may have been impacted.
Fund performance may reflect the waiver of the Fund’s fees and reimbursement of expenses for certain periods since the applicable inception date. Without these waivers and reimbursements, performance would have been lower. Also, performance shown in this section does not reflect the deduction of taxes that a shareholder would pay on Fund distributions or on gains resulting from redemptions of Fund shares.
International investing involves a greater degree of risk and increased volatility. Changes in currency exchange rates and differences in accounting and taxation policies outside of the U.S. can raise or lower returns. Also, some overseas markets may not be as politically and economically stable as the United States and other nations.
The returns shown are based on net asset values calculated for shareholder transactions and may differ from the returns shown in the financial highlights, which reflect adjustments made to the net asset values in accordance with accounting principles generally accepted in the United States of America.
| 18 | J.P. MORGAN INTERNATIONAL EQUITY FUNDS | APRIL 30, 2020 | ||||
Table of Contents
JPMorgan International Hedged Equity Fund
FUND COMMENTARY
SIX MONTHS ENDED APRIL 30, 2020 (Unaudited)
| REPORTING PERIOD RETURN: | ||||
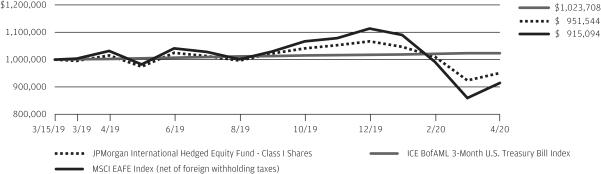
| Fund (Class I Shares)* | (8.56)% | |||
| MSCI EAFE Index (net of foreign withholding taxes) | (14.21)% | |||
| ICE BofAML 3-Month U.S. Treasury Bill Index | 0.85% | |||
| Net Assets as of 4/30/2020 (In Thousands) | $ | 95,467 | ||
INVESTMENT OBJECTIVE**
The JPMorgan International Hedged Equity Fund (the “Fund”) seeks to provide capital appreciation.
WHAT WERE THE MAIN DRIVERS OF THE FUND’S PERFORMANCE?
The Fund’s Class I Shares outperformed the MSCI EAFE Index (net of foreign withholding taxes) (the “Benchmark”) and underperformed the ICE BofAML 3-Month U.S. Treasury Bill Index for the six months ended April 30, 2020.
By sector, the Fund’s security selection in the utilities and basic industries sectors was a leading contributor to performance relative to the Benchmark, while the Fund’s security selection in the retail and consumer staples sectors was a leading detractor from relative performance.
By country, the Fund’s overweight position and security selection in Australia and its security selection in Italy were leading contributors to performance relative to the Benchmark, while the Fund’s security selection and underweight position in Japan and its security selection in France were leading detractors from relative performance.
Leading individual contributors to the Fund’s relative performance included the Fund’s overweight positions in Roche Holding SA, Novo Nordisk A/S and Nintendo Ltd. Shares of Roche Holding, a Swiss pharmaceutical company, rose amid investor expectations that it would benefit from a potential vaccine, treatment or test for the COVID-19. Shares of Novo Nordisk, a Danish pharmaceuticals company, rose after the company reported better-than-expected results for the fourth quarter of 2019. Shares of Nintendo, a Japanese developer of home entertainment products, rose amid increased demand for its products by households under quarantine as a result of the COVID-19 pandemic.
Leading individual detractors from relative performance included the Fund’s overweight positions in Airbus SE, Anheuser-Busch InBev SA and Standard Chartered PLC. Shares of Airbus, a French airplanes and aerospace company, fell after the company slashed production due to decreased demand amid the COVID-19 pandemic. Shares of Anheuser-Busch, a Belgian beer and beverages company, fell after it reported a sharp decline in fourth quarter 2019 profit as sales in China declined sharply amid COVID-19 quarantines and U.S. sales were hurt by increased demand for alcoholic seltzer products. Shares of Standard Chartered, a U.K. banking and financial services company, fell after the company cancelled dividend payments to shareholders under pressure from regulators to free up capital for lending during the COVID-19 pandemic.
HOW WAS THE FUND POSITIONED?
The Fund’s portfolio managers continued to focus on security selection to build a portfolio of international equities. They used bottom-up fundamental research to identify what they believed were attractively priced securities of companies with solid financial positions that possessed the potential to increase their earnings faster than their industry peers.
| TOP TEN EQUITY HOLDINGS OF THE PORTFOLIO*** | ||||||||
| 1. | Nestle SA (Registered) (Switzerland) | 3.9 | % | |||||
| 2. | Roche Holding AG (Switzerland) | 3.0 | ||||||
| 3. | Novartis AG (Registered) (Switzerland) | 2.4 | ||||||
| 4. | Toyota Motor Corp. (Japan) | 2.2 | ||||||
| 5. | ASML Holding NV (Netherlands) | 2.1 | ||||||
| 6. | SAP SE (Germany) | 2.0 | ||||||
| 7. | Sanofi (France) | 2.0 | ||||||
| 8. | Novo Nordisk A/S, Class B (Denmark) | 2.0 | ||||||
| 9. | Air Liquide SA (France) | 1.6 | ||||||
| 10. | Diageo plc (United Kingdom) | 1.5 | ||||||
PORTFOLIO COMPOSITION BY COUNTRY*** | ||||
| Japan | 23.7 | % | ||
| United Kingdom | 15.9 | |||
| France | 12.6 | |||
| Switzerland | 11.7 | |||
| Germany | 9.7 | |||
| Netherlands | 4.7 | |||
| Australia | 4.7 | |||
| Denmark | 3.3 | |||
| Spain | 3.2 | |||
| Hong Kong | 2.1 | |||
| Italy | 2.1 | |||
| Sweden | 1.3 | |||
| Ireland | 1.0 | |||
| Others (each less than 1.0%) | 3.1 | |||
| Short-Term Investments | 0.9 | |||
| * | The return shown is based on net asset values calculated for shareholder transactions and may differ from the return shown in the financial highlights, which reflects adjustments made to the net asset values in accordance with accounting principles generally accepted in the United States of America. |
| ** | The adviser seeks to achieve the Fund’s objective. There can be no guarantee it will be achieved. |
| *** | Percentages indicated are based on total investments as of April 30, 2020. The Fund’s portfolio composition is subject to change. |
| APRIL 30, 2020 | J.P. MORGAN INTERNATIONAL EQUITY FUNDS | 19 | ||||||
Table of Contents
JPMorgan International Hedged Equity Fund
FUND COMMENTARY
SIX MONTHS ENDED APRIL 30, 2020 (Unaudited) (continued)
AVERAGE ANNUAL TOTAL RETURNSAS OF APRIL 30, 2020 | ||||||||||||||||
| INCEPTION DATE OF CLASS | 6 MONTH* | 1 YEAR | SINCE INCEPTION | |||||||||||||
CLASS A SHARES | March 15, 2019 | |||||||||||||||
With Sales Charge** | (13.44 | )% | (11.40 | )% | (9.03 | )% | ||||||||||
Without Sales Charge | (8.67 | ) | (6.51 | ) | (4.57 | ) | ||||||||||
CLASS C SHARES | March 15, 2019 | |||||||||||||||
With CDSC*** | (9.86 | ) | (7.94 | ) | (5.02 | ) | ||||||||||
Without CDSC | (8.86 | ) | (6.94 | ) | (5.02 | ) | ||||||||||
CLASS I SHARES | March 15, 2019 | (8.56 | ) | (6.28 | ) | (4.32 | ) | |||||||||
CLASS R5 SHARES | March 15, 2019 | (8.46 | ) | (6.11 | ) | (4.16 | ) | |||||||||
CLASS R6 SHARES | March 15, 2019 | (8.44 | ) | (6.04 | ) | (4.09 | ) | |||||||||
| * | Not annualized. |
| ** | Sales Charge for Class A Shares is 5.25%. |
| *** | Assumes a 1% CDSC (contingent deferred sales charge) for the 6 month and one year periods and 0% CDSC thereafter. |
LIFE OF FUND PERFORMANCE(3/15/19 TO 4/30/20)
The performance quoted is past performance and is not a guarantee of future results. Mutual funds are subject to certain market risks. Investment returns and principal value of an investment will fluctuate so that an investor’s shares, when redeemed, may be worth more or less than their original cost. Current performance may be higher or lower than the performance data shown. Forup-to-datemonth-end performance information please call1-800-480-4111.
The Fund commenced operations on March 15, 2019.
The graph illustrates comparative performance for $1,000,000 invested in Class I Shares of the JPMorgan International Hedged Equity Fund, the MSCI EAFE Index (net of foreign withholding taxes) and the ICE BofAML3-Month U.S. Treasury Bill Index from March 15, 2019 to April 30, 2020. The performance of the Fund assumes reinvestment of all dividends and capital gain distributions, if any, and does not include a sales charge. The performance of the MSCI EAFE Index (net of foreign withholding taxes) does not reflect the deduction of expenses or a sales charge associated with a mutual fund and approximates the minimum possible dividend reinvestment of the securities included in the benchmark, if applicable. The dividend is reinvested after deduction of withholding tax, applying the maximum rate tonon-resident institutional investors who do not benefit from double taxation treaties. The performance of the ICE BofAML3-Month U.S. Treasury Bill Index does not reflect the deduction of expenses or a sales charge associated with a mutual fund and has been adjusted to reflect reinvestment of all dividends and capital gain distributions of securities included in the benchmarks, if applicable. The MSCI EAFE Index (net of foreign withholding taxes) is a free float-adjusted market capitalization
weighted index that is designed to measure the equity market performance of developed markets, excluding the U.S. and Canada. The ICE BofAML3-Month U.S. Treasury Bill Index is comprised of a single issue purchased at the beginning of the month and held for a full month. Each month the index is rebalanced and the issue selected is the outstanding Treasury Bill that matures closest to, but not beyond, 3 months from the rebalancing date. Investors cannot invest directly in an index.
Class I Shares have a $1,000,000 minimum initial investment.
Fund performance may reflect the waiver of the Fund’s fees and reimbursement of expenses for certain periods since the applicable inception date. Without these waivers and reimbursements, performance would have been lower. Also, performance shown in this section does not reflect the deduction of taxes that a shareholder would pay on Fund distributions or on gains resulting from redemptions of Fund shares.
International investing involves a greater degree of risk and increased volatility. Changes in currency exchange rates and differences in accounting and taxation policies outside the U.S. can raise or lower returns. Also, some overseas markets may not be as politically and economically stable as the U.S. and other nations.
The returns shown are based on net asset values calculated for shareholder transactions and may differ from the returns shown in the financial highlights, which reflect adjustments made to the net asset values in accordance with accounting principles generally accepted in the United States of America.
| 20 | J.P. MORGAN INTERNATIONAL EQUITY FUNDS | APRIL 30, 2020 | ||||
Table of Contents
JPMorgan International Research Enhanced Equity Fund
FUND COMMENTARY
SIX MONTHS ENDED APRIL 30, 2020 (Unaudited)
| REPORTING PERIOD RETURN: | ||||
| Fund (Class I Shares)* | (15.11)% | |||
| MSCI EAFE Index (net of foreign withholding taxes) | (14.21)% | |||
| Net Assets as of 4/30/2020 (In Thousands) | $ | 4,303,710 | ||
INVESTMENT OBJECTIVE**
The JPMorgan International Research Enhanced Equity Fund (the “Fund”) seeks to provide long-term capital appreciation.
WHAT WERE THE MAIN DRIVERS OF THE FUND’S PERFORMANCE?
The Fund’s Class I Shares underperformed the MSCI EAFE Index (net of foreign withholding taxes) (the “Benchmark”) for the six months ended April 30, 2020.
By sector, the Fund’s security selection in the retail and consumer staples sectors was a leading detractor from performance relative to the Benchmark, while the Fund’s security selection in the utilities and basic industries sectors was a leading contributor to relative performance.
By region, the Fund’s security selection in Japan and Europe was a leading detractor from performance relative to the Benchmark, while the Fund’s security selection in the Pacific, excluding Japan, was the sole regional contributor to relative performance.
Due to the Fund holding a relatively large number of securities during the reporting period, the impact of individual holdings on the Fund’s relative performance tended to be small.
HOW WAS THE FUND POSITIONED?
The Fund sought to outperform the Benchmark over time, while seeking to achieve sector, geographic and risk characteristics similar to that of the Benchmark. Using the fundamental equity insights generated by analysts, the Fund’s portfolio managers took a marginally overweight position in securities included within the universe of the Benchmark that they considered undervalued, while marginally underweighting or not holding securities in the Benchmark that they considered overvalued.
| TOP TEN EQUITY HOLDINGS OF THE PORTFOLIO*** | ||||||||
| 1. | Nestle SA (Registered) (Switzerland) | 3.6 | % | |||||
| 2. | Roche Holding AG (Switzerland) | 2.8 | ||||||
| 3. | Novartis AG (Registered) (Switzerland) | 2.2 | ||||||
| 4. | Toyota Motor Corp. (Japan) | 1.9 | ||||||
| 5. | ASML Holding NV (Netherlands) | 1.9 | ||||||
| 6. | SAP SE (Germany) | 1.8 | ||||||
| 7. | Sanofi (France) | 1.8 | ||||||
| 8. | Novo Nordisk A/S, Class B (Denmark) | 1.8 | ||||||
| 9. | Air Liquide SA (France) | 1.5 | ||||||
| 10. | Diageo plc (United Kingdom) | 1.4 | ||||||
PORTFOLIO COMPOSITION BY COUNTRY*** | ||||
| Japan | 21.4 | % | ||
| United Kingdom | 14.5 | |||
| France | 11.5 | |||
| Switzerland | 10.6 | |||
| Germany | 8.8 | |||
| Australia | 4.3 | |||
| Netherlands | 4.3 | |||
| Denmark | 3.0 | |||
| Spain | 2.9 | |||
| Italy | 1.9 | |||
| Hong Kong | 1.9 | |||
| Sweden | 1.2 | |||
| Others (each less than 1.0%) | 3.9 | |||
| Short-Term Investments | 9.8 | |||
| * | The return shown is based on net asset values calculated for shareholder transactions and may differ from the return shown in the financial highlights, which reflects adjustments made to the net asset values in accordance with accounting principles generally accepted in the United States of America. |
| ** | The adviser seeks to achieve the Fund’s objective. There can be no guarantee it will be achieved. |
| *** | Percentages indicated are based on total investments as of April 30, 2020. The Fund’s portfolio composition is subject to change. |
| APRIL 30, 2020 | J.P. MORGAN INTERNATIONAL EQUITY FUNDS | 21 | ||||||
Table of Contents
JPMorgan International Research Enhanced Equity Fund
FUND COMMENTARY
SIX MONTHS ENDED APRIL 30, 2020 (Unaudited) (continued)
AVERAGE ANNUAL TOTAL RETURNSAS OF APRIL 30, 2020 | ||||||||||||||||||
| INCEPTION DATE OF CLASS | 6 MONTH* | 1 YEAR | 5 YEAR | 10 YEAR | ||||||||||||||
CLASS A SHARES | April 23, 1993 | |||||||||||||||||
With Sales Charge** | (19.65 | )% | (17.56 | )% | (1.84 | )% | 2.11 | % | ||||||||||
Without Sales Charge | (15.21 | ) | (12.98 | ) | (0.77 | ) | 2.66 | |||||||||||
CLASS I SHARES | October 28, 1992 | (15.11 | ) | (12.76 | ) | (0.52 | ) | 2.92 | ||||||||||
CLASS R6 SHARES | November 1, 2017 | (15.10 | ) | (12.69 | ) | (0.47 | ) | 2.95 | ||||||||||
| * | Not annualized. |
| ** | Sales Charge for Class A Shares is 5.25%. |
TEN YEAR PERFORMANCE(4/30/10 TO 4/30/20)
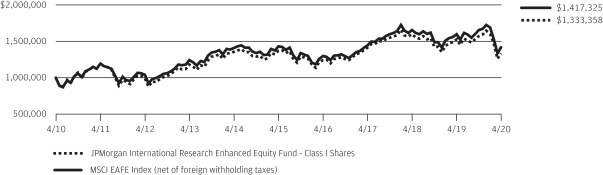
The performance quoted is past performance and is not a guarantee of future results. Mutual funds are subject to certain market risks. Investment returns and principal value of an investment will fluctuate so that an investor’s shares, when redeemed, may be worth more or less than their original cost. Current performance may be higher or lower than the performance data shown. Forup-to-datemonth-end performance information please call1-800-480-4111.
Returns for Class R6 Shares prior to its inception date are based on the performance of Class I Shares. The actual returns of Class R6 Shares would have been different than those shown because Class R6 Shares have different expenses than Class I Shares.
The graph illustrates comparative performance for $1,000,000 invested in Class I Shares of the JPMorgan International Research Enhanced Equity Fund and the MSCI EAFE Index (net of foreign withholding taxes) from April 30, 2010 to April 30, 2020. The performance of the Fund assumes reinvestment of all dividends and capital gain distributions, if any, and does not include a sales charge. The performance of the MSCI EAFE Index (net of foreign withholding taxes) does not reflect the deduction of expenses or a sales charge associated with a mutual fund and approximates the minimum possible dividend reinvestment of the securities included in the benchmark, if applicable. The dividend is reinvested after deduction of withholding tax, applying the maximum rate to non-resident institutional investors who do not benefit from double taxation treaties. The MSCI EAFE Index (net of foreign withholding taxes) is a free float-adjusted market capitalization weighted index that is designed to measure the equity market performance of developed markets, excluding the U.S. and Canada. Investors cannot invest directly in an index.
Class I Shares have a $1,000,000 minimum initial investment.
Fund performance may reflect the waiver of the Fund’s fees and reimbursement of expenses for certain periods since the applicable inception date. Without these waivers and reimbursements, performance would have been lower. Also, performance shown in this section does not reflect the deduction of taxes that a shareholder would pay on Fund distributions or on gains resulting from redemptions of Fund shares.
International investing involves a greater degree of risk and increased volatility. Changes in currency exchange rates and differences in accounting and taxation policies outside of the U.S. can raise or lower returns. Also, some overseas markets may not be as politically and economically stable as the United States and other nations.
The returns shown are based on net asset values calculated for shareholder transactions and may differ from the returns shown in the financial highlights, which reflect adjustments made to the net asset values in accordance with accounting principles generally accepted in the United States of America.
The MSCI information may only be used for your internal use, may not be reproduced or redisseminated in any form and may not be used as a basis for or a component of any financial instruments or products or indices. None of the MSCI information is intended to constitute investment advice or a recommendation to make (or refrain from making) any kind of investment decision and may not be relied on as such. Historical data and analysis should not be taken as an indication or guarantee of any future performance analysis, forecast or prediction. The MSCI information is provided on an “as is” basis and the user of this information assumes the entire risk of any use made of this information. MSCI, each of its affiliates and each other person involved in or related to compiling, computing or creating any MSCI information (collectively, the “MSCI Parties”) expressly disclaims all warranties (including, without limitation, any warranties of originality, accuracy, completeness, timeliness, non-infringement, merchantability and fitness for a particular purpose) with respect to this information. Without limiting any of the foregoing, in no event shall any MSCI Party have any liability for any direct, indirect, special, incidental, punitive, consequential (including, without limitation, lost profits) or any other damages. (www.msci.com)
| 22 | J.P. MORGAN INTERNATIONAL EQUITY FUNDS | APRIL 30, 2020 | ||||
Table of Contents
JPMorgan International Value Fund
FUND COMMENTARY
SIX MONTHS ENDED APRIL 30, 2020 (Unaudited)
| REPORTING PERIOD RETURN: | ||||
| Fund (Class L Shares)* | (23.10)% | |||
| MSCI EAFE Value Index (net of foreign withholding taxes) | (21.28)% | |||
| Net Assets as of 4/30/2020 (In Thousands) | $ | 274,690 | ||
INVESTMENT OBJECTIVE**
The JPMorgan International Value Fund (the “Fund”) seeks to provide long-term capital appreciation.
WHAT WERE THE MAIN DRIVERS OF THE FUND’S PERFORMANCE?
The Fund’s Class L Shares underperformed the MSCI EAFE Value Index (net of foreign withholding taxes) (the “Benchmark”) for the six months ended April 30, 2020.
By sector, the Fund’s underweight allocations to the utilities sector and the pharmaceuticals, biotechnology and life sciences sector were leading detractors from performance relative to the Benchmark. The Fund’s security selection in the materials and real estate sectors was a leading contributor to relative performance.
By region, the Fund’s security selection in continental Europe and the U.K. was a leading detractor from relative performance, while the Fund’s security selection in the Pacific, excluding Japan, was the sole regional contributor to relative performance.
Leading individual detractors from relative performance included the Fund’s underweight positions in Sanofi SA, Softbank Group Corp. and Takeda Pharmaceutical Co. Shares of Sanofi, a French pharmaceuticals company not held in the Fund, rose after the company reported growth in earnings and sales for the first quarter of 2020. Shares of Softbank, a Japanese investment company not held by the Fund, rose after the
company announced it would sell an estimated $41 billion in assets and repurchase $18 billion of its shares. Shares of Takeda Pharmaceutical, a Japanese drug maker not held in the Fund, rose amid investor expectations that the company could benefit from the development of tests, treatments or a vaccine for COVID-19.
Leading individual contributors to relative performance included the Fund’s underweight positions in BP PLC, Banco Santander SA and HSBC Holdings PLC. Shares of BP, a U.K. oil and natural gas producer and retailer, fell amid declining global demand for petroleum and a sharp drop in global oil prices in 2020. Shares of Banco Santander, a Spanish banking and financial services company not held in the Fund, fell after the company reported a sharp drop in earnings as it set aside funds for anticipated loan losses amid the COVID-19 pandemic. Shares of HSBC Holdings, a U.K. banking and financial services company, fell after the company reported a sharp drop in earnings in the face of the COVID-19 pandemic.
HOW WAS THE FUND POSITIONED?
The Fund’s portfolio managers employed behavioral-based and quantitative screens in addition to conducting fundamental analysis to seek out companies that they believed had attractive valuations. As a result of this process, the Fund’s largest overweight sector positions relative to the Benchmark were in the media & entertainment and materials sectors, while the largest underweight sector positions were in the utilities and capital goods sectors.
| APRIL 30, 2020 | J.P. MORGAN INTERNATIONAL EQUITY FUNDS | 23 | ||||||
Table of Contents
JPMorgan International Value Fund
FUND COMMENTARY
SIX MONTHS ENDED APRIL 30, 2020 (Unaudited) (continued)
| TOP TEN EQUITY HOLDINGS OF THE PORTFOLIO*** | ||||||||
| 1. | Toyota Motor Corp. (Japan) | 2.6 | % | |||||
| 2. | Royal Dutch Shell plc, Class A (Netherlands) | 2.5 | ||||||
| 3. | BHP Group Ltd. (Australia) | 1.9 | ||||||
| 4. | British American Tobacco plc (United Kingdom) | 1.9 | ||||||
| 5. | Novartis AG (Registered) (Switzerland) | 1.8 | ||||||
| 6. | TOTAL SA (France) | 1.7 | ||||||
| 7. | BP plc (United Kingdom) | 1.6 | ||||||
| 8. | Rio Tinto plc (Australia) | 1.4 | ||||||
| 9. | Bayer AG (Registered) (Germany) | 1.3 | ||||||
| 10. | Allianz SE (Registered) (Germany) | 1.1 | ||||||
PORTFOLIO COMPOSITION BY COUNTRY*** | ||||
| Japan | 25.5 | % | ||
| United Kingdom | 13.8 | |||
| Germany | 8.2 | |||
| France | 7.9 | |||
| Australia | 7.6 | |||
| Switzerland | 7.4 | |||
| Netherlands | 5.1 | |||
| Sweden | 3.1 | |||
| Spain | 2.7 | |||
| Norway | 2.5 | |||
| Hong Kong | 2.1 | |||
| Italy | 1.9 | |||
| Finland | 1.7 | |||
| Belgium | 1.3 | |||
| Singapore | 1.2 | |||
| Denmark | 1.1 | |||
| Others (each less than 1.0%) | 3.9 | |||
| Short-Term Investments | 3.0 | |||
| * | The return shown is based on net asset values calculated for shareholder transactions and may differ from the return shown in the financial highlights, which reflects adjustments made to the net asset values in accordance with accounting principles generally accepted in the United States of America. |
| ** | The adviser seeks to achieve the Fund’s objective. There can be no guarantee it will be achieved. |
| *** | Percentages indicated are based on total investments as of April 30, 2020. The Fund’s portfolio composition is subject to change. |
| 24 | J.P. MORGAN INTERNATIONAL EQUITY FUNDS | APRIL 30, 2020 | ||||
Table of Contents
AVERAGE ANNUAL TOTAL RETURNSAS OF APRIL 30, 2020 | ||||||||||||||||||
| INCEPTION DATE OF CLASS | 6 MONTH* | 1 YEAR | 5 YEAR | 10 YEAR | ||||||||||||||
CLASS A SHARES | September 28, 2001 | |||||||||||||||||
With Sales Charge** | (27.30 | )% | (27.86 | )% | (6.47 | )% | (0.63 | )% | ||||||||||
Without Sales Charge | (23.25 | ) | (23.88 | ) | (5.46 | ) | (0.09 | ) | ||||||||||
CLASS C SHARES | July 11, 2006 | |||||||||||||||||
With CDSC*** | (24.44 | ) | (25.28 | ) | (5.93 | ) | (0.60 | ) | ||||||||||
Without CDSC | (23.44 | ) | (24.28 | ) | (5.93 | ) | (0.60 | ) | ||||||||||
CLASS I SHARES | September 10, 2001 | (23.13 | ) | (23.68 | ) | (5.18 | ) | 0.18 | ||||||||||
CLASS L SHARES | November 4, 1993 | (23.10 | ) | (23.59 | ) | (5.08 | ) | 0.31 | ||||||||||
CLASS R2 SHARES | November 3, 2008 | (23.35 | ) | (24.05 | ) | (5.70 | ) | (0.35 | ) | |||||||||
CLASS R5 SHARES | September 9, 2016 | (23.04 | ) | (23.53 | ) | (5.07 | ) | 0.31 | ||||||||||
CLASS R6 SHARES | November 30, 2010 | (23.08 | ) | (23.51 | ) | (4.96 | ) | 0.42 | ||||||||||
| * | Not annualized. |
| ** | Sales Charge for Class A Shares is 5.25%. |
| *** | Assumes a 1% CDSC (contingent deferred sales charge) for the 6 month and one year periods and 0% CDSC thereafter. |
TEN YEAR PERFORMANCE(4/30/10 TO 4/30/20)
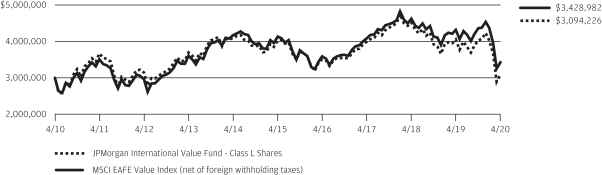
The performance quoted is past performance and is not a guarantee of future results. Mutual funds are subject to certain market risks. Investment returns and principal value of an investment will fluctuate so that an investor’s shares, when redeemed, may be worth more or less than their original cost. Current performance may be higher or lower than the performance data shown. Forup-to-datemonth-end performance information please call1-800-480-4111. Effective May 2018, some of the Fund’s investment strategies changed. The Fund’s past performance would have been different if the Fund was managed under the current strategies.
Returns for Class R5 Shares and Class R6 Shares prior to their inception dates are based on the performance of Class L Shares. The actual returns of Class R5 Shares and Class R6 Shares would have been different than those shown because Class R5 Shares and Class R6 Shares have different expenses than Class L Shares.
The graph illustrates comparative performance for $3,000,000 invested in Class L Shares of the JPMorgan International Value Fund and the MSCI EAFE Value Index (net of foreign withholding taxes) from April 30, 2010 to April 30, 2020. The performance of the Fund assumes reinvestment of all dividends and capital gain distributions, if any, and does not include a sales charge. The performance of the MSCI EAFE Value Index (net of foreign withholding taxes) does not reflect the deduction of expenses or a sales charge associated with a mutual fund and approximates the minimum possible dividend reinvestment of the securities included in the benchmark, if applicable. The dividend is reinvested after deduction of withholding
tax, applying the maximum rate to non-resident institutional investors who do not benefit from double taxation treaties. The MSCI EAFE Value Index (net of foreign withholding taxes) is a free float-adjusted market capitalization weighted index that is designed to measure the performance of value-oriented stocks in the world’s equity markets, excluding the U.S. and Canada. Investors cannot invest directly in an index.
Class L Shares have a $3,000,000 minimum initial investment.
Fund performance may reflect the waiver of the Fund’s fees and reimbursement of expenses for certain periods since the applicable inception date. Without these waivers and reimbursements, performance would have been lower. Also, performance shown in this section does not reflect the deduction of taxes that a shareholder would pay on Fund distributions or on gains resulting from redemptions of Fund shares.
International investing involves a greater degree of risk and increased volatility. Changes in currency exchange rates and differences in accounting and taxation policies outside the U.S. can raise or lower returns. Also, some overseas markets may not be as politically and economically stable as the United States and other nations.
The returns shown are based on net asset values calculated for shareholder transactions and may differ from the returns shown in the financial highlights, which reflect adjustments made to the net asset values in accordance with accounting principles generally accepted in the United States of America.
| APRIL 30, 2020 | J.P. MORGAN INTERNATIONAL EQUITY FUNDS | 25 | ||||||
Table of Contents
JPMorgan Emerging Markets Equity Fund
SCHEDULE OF PORTFOLIO INVESTMENTS
AS OF APRIL 30, 2020 (Unaudited)
| INVESTMENTS | SHARES (000) | VALUE ($000) | ||||||
Common Stocks — 98.2% |
| |||||||
Argentina — 2.2% |
| |||||||
MercadoLibre, Inc. * | 298 | 174,076 | ||||||
|
| |||||||
Brazil — 4.9% |
| |||||||
B3 SA — Brasil Bolsa Balcao | 11,978 | 84,254 | ||||||
Itau Unibanco Holding SA, ADR | 18,778 | 79,056 | ||||||
Lojas Renner SA | 11,073 | 78,379 | ||||||
Pagseguro Digital Ltd., Class A * | 963 | 24,393 | ||||||
Raia Drogasil SA | 2,013 | 38,999 | ||||||
XP, Inc., Class A * (a) | 2,949 | 74,187 | ||||||
|
| |||||||
| 379,268 | ||||||||
|
| |||||||
China — 35.4% |
| |||||||
Alibaba Group Holding Ltd., ADR * | 2,267 | 459,399 | ||||||
Budweiser Brewing Co. APAC Ltd. * (a) (b) | 47,491 | 129,053 | ||||||
China Gas Holdings Ltd. | 29,783 | 108,371 | ||||||
Foshan Haitian Flavouring & Food Co. Ltd., Class A | 6,237 | 107,290 | ||||||
Huazhu Group Ltd., ADR(a) | 933 | 33,583 | ||||||
Inner Mongolia Yili Industrial Group Co. Ltd., Class A * | 6,631 | 27,088 | ||||||
Kweichow Moutai Co. Ltd., Class A | 406 | 72,003 | ||||||
Meituan Dianping, Class B * (b) | 12,712 | 170,201 | ||||||
Midea Group Co. Ltd., Class A | 11,045 | 82,463 | ||||||
NetEase, Inc., ADR | 544 | 187,589 | ||||||
New Oriental Education & Technology Group, Inc., ADR * | 1,069 | 136,413 | ||||||
Ping An Bank Co. Ltd., Class A | 64,681 | 125,739 | ||||||
Ping An Insurance Group Co. of China Ltd., Class H | 19,123 | 194,596 | ||||||
Shenzhen MindrayBio-Medical Electronics Co. Ltd., Class A | 1,384 | 49,394 | ||||||
Shenzhou International Group Holdings Ltd. | 8,409 | 97,055 | ||||||
Sunny Optical Technology Group Co. Ltd. | 5,876 | 81,829 | ||||||
Tencent Holdings Ltd. | 7,307 | 384,120 | ||||||
Wuxi Biologics Cayman, Inc. * (a) (b) | 12,029 | 187,248 | ||||||
Yum China Holdings, Inc. | 2,589 | 125,445 | ||||||
|
| |||||||
| 2,758,879 | ||||||||
|
| |||||||
Egypt — 0.6% |
| |||||||
Commercial International Bank Egypt SAE (Registered), GDR (b) | 11,635 | 44,613 | ||||||
|
| |||||||
Hong Kong — 6.5% |
| |||||||
AIA Group Ltd. | 25,884 | 237,559 | ||||||
AIA Group Ltd. | 795 | 7,385 | ||||||
Hong Kong Exchanges & Clearing Ltd. | 3,338 | 107,017 | ||||||
Techtronic Industries Co. Ltd. | 20,673 | 156,749 | ||||||
|
| |||||||
| 508,710 | ||||||||
|
| |||||||
Hungary — 1.5% |
| |||||||
OTP Bank Nyrt. | 3,991 | 118,202 | ||||||
|
| |||||||
| INVESTMENTS | SHARES (000) | VALUE ($000) | ||||||
India — 16.5% |
| |||||||
Asian Paints Ltd. | 1,773 | 41,370 | ||||||
Britannia Industries Ltd. | 1,686 | 70,544 | ||||||
HDFC Bank Ltd. | 11,598 | 152,297 | ||||||
HDFC Bank Ltd., ADR | 2,412 | 104,541 | ||||||
HDFC Life Insurance Co. Ltd. * (b) | 13,421 | 88,880 | ||||||
Hindustan Unilever Ltd. | 3,253 | 94,190 | ||||||
Housing Development Finance Corp. Ltd. | 9,651 | 244,117 | ||||||
IndusInd Bank Ltd. | 5,379 | 32,816 | ||||||
ITC Ltd. | 39,908 | 96,146 | ||||||
Kotak Mahindra Bank Ltd. | 5,689 | 102,162 | ||||||
Maruti Suzuki India Ltd. | 986 | 69,993 | ||||||
Tata Consultancy Services Ltd. | 7,107 | 188,139 | ||||||
|
| |||||||
| 1,285,195 | ||||||||
|
| |||||||
Indonesia — 2.1% |
| |||||||
Bank Central Asia Tbk. PT | 53,178 | 92,114 | ||||||
Bank Rakyat Indonesia Persero Tbk. PT | 401,578 | 73,042 | ||||||
|
| |||||||
| 165,156 | ||||||||
|
| |||||||
Macau — 1.4% |
| |||||||
Sands China Ltd. | 26,224 | 106,169 | ||||||
|
| |||||||
Mexico — 2.4% |
| |||||||
Grupo Financiero Banorte SAB de CV, Class O (a) | 24,159 | 66,140 | ||||||
Infraestructura Energetica Nova SAB de CV | 8,509 | 28,239 | ||||||
Wal-Mart de Mexico SAB de CV | 38,929 | 93,959 | ||||||
|
| |||||||
| 188,338 | ||||||||
|
| |||||||
Panama — 0.5% |
| |||||||
Copa Holdings SA, Class A | 910 | 40,244 | ||||||
|
| |||||||
Peru — 0.8% |
| |||||||
Credicorp Ltd. | 412 | 61,377 | ||||||
|
| |||||||
Portugal — 1.7% |
| |||||||
Jeronimo Martins SGPS SA | 7,531 | 127,669 | ||||||
|
| |||||||
Russia — 0.8% |
| |||||||
Sberbank of Russia PJSC | 23,235 | 61,229 | ||||||
Sberbank of Russia PJSC | 292 | 770 | ||||||
|
| |||||||
| 61,999 | ||||||||
|
| |||||||
South Africa — 1.8% |
| |||||||
Bid Corp. Ltd. | 4,381 | 57,100 | ||||||
Capitec Bank Holdings Ltd. (a) | 1,310 | 63,883 | ||||||
Mr Price Group Ltd. | 2,200 | 15,675 | ||||||
|
| |||||||
| 136,658 | ||||||||
|
| |||||||
South Korea — 5.6% |
| |||||||
NCSoft Corp. | 204 | 107,950 | ||||||
SEE NOTES TO FINANCIAL STATEMENTS.
| 26 | J.P. MORGAN INTERNATIONAL EQUITY FUNDS | APRIL 30, 2020 | ||||
Table of Contents
| INVESTMENTS | SHARES (000) | VALUE ($000) | ||||||
Common Stocks — continued | ||||||||
South Korea — continued |
| |||||||
Samsung Electronics Co. Ltd. | 7,901 | 324,865 | ||||||
|
| |||||||
| 432,815 | ||||||||
|
| |||||||
Spain — 0.1% |
| |||||||
Prosegur Cia de Seguridad SA | 4,049 | 8,929 | ||||||
|
| |||||||
Taiwan — 9.1% |
| |||||||
Largan Precision Co. Ltd. | 595 | 81,106 | ||||||
President Chain Store Corp. | 4,522 | 46,761 | ||||||
Sea Ltd., ADR* (a) | 2,798 | 155,486 | ||||||
Taiwan Semiconductor Manufacturing Co. Ltd., ADR | 7,941 | 421,912 | ||||||
|
| |||||||
| 705,265 | ||||||||
|
| |||||||
Turkey — 1.2% |
| |||||||
BIM Birlesik Magazalar A/S | 10,764 | 85,471 | ||||||
Ford Otomotiv Sanayi A/S | 1,087 | 9,846 | ||||||
|
| |||||||
| 95,317 | ||||||||
|
| |||||||
United States — 3.1% |
| |||||||
EPAM Systems, Inc. * | 1,105 | 244,037 | ||||||
|
| |||||||
Total Common Stocks | 7,642,916 | |||||||
|
| |||||||
Short-Term Investments — 3.2% |
| |||||||
Investment Companies — 1.6% |
| |||||||
JPMorgan Prime Money Market Fund Class Institutional Shares, 0.63% (c) (d) | 124,472 | 124,572 | ||||||
|
| |||||||
Investment of Cash Collateral from Securities Loaned — 1.6% |
| |||||||
JPMorgan Securities Lending Money Market Fund Agency SL Class Shares, 0.77% (c) (d) | 81,033 | 81,049 | ||||||
JPMorgan U.S. Government Money Market Fund Class IM Shares, 0.23% (c) (d) | 48,254 | 48,254 | ||||||
|
| |||||||
Total Investment of Cash Collateral from Securities Loaned | 129,303 | |||||||
|
| |||||||
Total Short-Term Investments | 253,875 | |||||||
|
| |||||||
Total Investments — 101.4% | 7,896,791 | |||||||
Liabilities in Excess of | (111,030 | ) | ||||||
|
| |||||||
NET ASSETS — 100.0% | 7,785,761 | |||||||
|
| |||||||
Percentages indicated are based on net assets.
Summary of Investments by Industry, April 30, 2020
The following table represents the portfolio investments of the Fund by industry classifications as a percentage of total investments:
| INDUSTRY | PERCENTAGE | |||
Banks | 14.9 | % | ||
Internet & Direct Marketing Retail | 10.2 | |||
Insurance | 6.7 | |||
IT Services | 5.8 | |||
Entertainment | 5.7 | |||
Food & Staples Retailing | 5.7 | |||
Semiconductors & Semiconductor Equipment | 5.3 | |||
Interactive Media & Services | 4.9 | |||
Technology Hardware, Storage & Peripherals | 4.1 | |||
Capital Markets | 3.4 | |||
Hotels, Restaurants & Leisure | 3.4 | |||
Thrifts & Mortgage Finance | 3.1 | |||
Food Products | 2.6 | |||
Beverages | 2.6 | |||
Life Sciences Tools & Services | 2.4 | |||
Electronic Equipment, Instruments & Components | 2.1 | |||
Machinery | 2.0 | |||
Gas Utilities | 1.7 | |||
Diversified Consumer Services | 1.7 | |||
Textiles, Apparel & Luxury Goods | 1.2 | |||
Tobacco | 1.2 | |||
Household Products | 1.2 | |||
Household Durables | 1.0 | |||
Automobiles | 1.0 | |||
Multiline Retail | 1.0 | |||
Others (each less than 1.0%) | 1.9 | |||
Short-Term Investments | 3.2 | |||
Abbreviations
| ADR | American Depositary Receipt | |
| GDR | Global Depositary Receipt | |
| PJSC | Public Joint Stock Company | |
| PT | Limited liability company | |
| SGPS | Holding company | |
| (a) | The security or a portion of this security is on loan at April 30, 2020. The total value of securities on loan at April 30, 2020 is approximately $126,114,000. | |
| (b) | Security exempt from registration pursuant to Regulation S under the Securities Act of 1933, as amended. Regulation S applies to securities offerings that are made outside of the United States and do not involve direct selling efforts in the United States and as such may have restrictions on resale. | |
| (c) | Investment in an affiliated fund, which is registered under the Investment Company Act of 1940, as amended, and is advised by J.P. Morgan Investment Management Inc. | |
| (d) | The rate shown is the current yield as of April 30, 2020. | |
| * | Non-income producing security. | |
SEE NOTES TO FINANCIAL STATEMENTS.
| APRIL 30, 2020 | J.P. MORGAN INTERNATIONAL EQUITY FUNDS | 27 | ||||||
Table of Contents
JPMorgan Emerging Markets Research Enhanced Equity Fund
SCHEDULE OF PORTFOLIO INVESTMENTS
AS OF APRIL 30, 2020 (Unaudited)
| INVESTMENTS | SHARES (000) | VALUE ($000) | ||||||
Common Stocks — 96.7% |
| |||||||
Argentina — 0.1% |
| |||||||
MercadoLibre, Inc. * | 5 | 2,855 | ||||||
|
| |||||||
Brazil — 4.5% |
| |||||||
Ambev SA * | 2,785 | 5,823 | ||||||
B3 SA — Brasil Bolsa Balcao | 980 | 6,894 | ||||||
Banco Bradesco SA (Preference) | 3,493 | 12,339 | ||||||
Banco do Brasil SA * | 859 | 4,474 | ||||||
Cogna Educacao | 1,407 | 1,428 | ||||||
CVC Brasil Operadora e Agencia de Viagens SA * | 274 | 705 | ||||||
Equatorial Energia SA | 455 | 1,542 | ||||||
Gerdau SA (Preference) | 2,732 | 5,902 | ||||||
Itau Unibanco Holding SA (Preference) | 3,309 | 13,954 | ||||||
Itausa — Investimentos Itau SA (Preference) | 2,792 | 4,626 | ||||||
Localiza Rent a Car SA * | 644 | 4,070 | ||||||
Lojas Renner SA | 877 | 6,206 | ||||||
Petroleo Brasileiro SA (Preference) | 3,723 | 12,364 | ||||||
Raia Drogasil SA | 255 | 4,940 | ||||||
Telefonica Brasil SA (Preference) | 311 | 2,630 | ||||||
TIM Participacoes SA, ADR * | 446 | 5,179 | ||||||
Vale SA, ADR * | 1,684 | 13,890 | ||||||
|
| |||||||
| 106,966 | ||||||||
|
| |||||||
Chile — 0.2% |
| |||||||
Banco Santander Chile, ADR (a) | 174 | 2,929 | ||||||
Cencosud SA | 1,383 | 1,673 | ||||||
Cia Cervecerias Unidas SA, ADR | 113 | 1,608 | ||||||
|
| |||||||
| 6,210 | ||||||||
|
| |||||||
China — 38.5% |
| |||||||
51job, Inc., ADR * (a) | 69 | 4,164 | ||||||
Aier Eye Hospital Group Co. Ltd., Class A | 389 | 2,404 | ||||||
Alibaba Group Holding Ltd., ADR * | 822 | 166,566 | ||||||
ANTA Sports Products Ltd. | 283 | 2,410 | ||||||
Baidu, Inc., ADR * | 115 | 11,559 | ||||||
Bank of China Ltd., Class H | 49,027 | 18,665 | ||||||
Baoshan Iron & Steel Co. Ltd., Class A | 9,459 | 6,460 | ||||||
BeiGene Ltd., ADR * (a) | 13 | 1,965 | ||||||
Beijing Enterprises Holdings Ltd. | 558 | 1,977 | ||||||
Beijing Shiji Information Technology Co. Ltd., Class A | 563 | 2,407 | ||||||
BOE Technology Group Co. Ltd., Class A | 8,025 | 4,195 | ||||||
CGN Power Co. Ltd., Class H * (b) | 20,326 | 5,113 | ||||||
China Conch Venture Holdings Ltd. | 1,452 | 6,943 | ||||||
China Construction Bank Corp., Class H | 51,452 | 41,299 | ||||||
China Gas Holdings Ltd. | 2,652 | 9,649 | ||||||
China Lesso Group Holdings Ltd. | 2,928 | 4,196 | ||||||
China Life Insurance Co. Ltd., Class H | 5,920 | 12,626 | ||||||
| INVESTMENTS | SHARES (000) | VALUE ($000) | ||||||
China — continued |
| |||||||
China Merchants Bank Co. Ltd., Class H | 4,005 | 18,953 | ||||||
China Merchants Shekou Industrial Zone Holdings Co. Ltd., Class A | 2,686 | 6,415 | ||||||
China Mobile Ltd. | 2,339 | 18,803 | ||||||
China Molybdenum Co. Ltd., Class H | 11,691 | 3,527 | ||||||
China Oilfield Services Ltd., Class H | 5,470 | 4,261 | ||||||
China Overseas Land & Investment Ltd. | 3,572 | 13,195 | ||||||
China Pacific Insurance Group Co. Ltd., Class H | 2,055 | 6,798 | ||||||
China Petroleum & Chemical Corp., Class H | 10,358 | 5,162 | ||||||
China Resources Land Ltd. | 2,478 | 10,240 | ||||||
China Shenhua Energy Co. Ltd., Class H | 4,356 | 7,716 | ||||||
China State Construction International Holdings Ltd. | 5,300 | 4,109 | ||||||
China Unicom Hong Kong Ltd. | 9,158 | 5,923 | ||||||
China Vanke Co. Ltd., Class H | 2,742 | 9,213 | ||||||
CNOOC Ltd. | 12,794 | 14,145 | ||||||
Country Garden Holdings Co. Ltd. | 4,357 | 5,644 | ||||||
Country Garden Services Holdings Co. Ltd. | 1,320 | 6,099 | ||||||
CSPC Pharmaceutical Group Ltd. | 3,910 | 7,741 | ||||||
ENN Energy Holdings Ltd. | 649 | 7,311 | ||||||
Far East Horizon Ltd. | 2,895 | 2,344 | ||||||
Fosun International Ltd. | 2,569 | 3,225 | ||||||
GDS Holdings Ltd., ADR * (a) | 70 | 4,003 | ||||||
Geely Automobile Holdings Ltd. | 4,295 | 6,681 | ||||||
Haier Electronics Group Co. Ltd. | 37 | 102 | ||||||
Hangzhou Robam Appliances Co. Ltd., Class A | 1,226 | 5,451 | ||||||
Industrial & Commercial Bank of China Ltd., Class H | 30,390 | 20,377 | ||||||
Inner Mongolia Yili Industrial Group Co. Ltd., Class A * | 692 | 2,829 | ||||||
Innovent Biologics, Inc. * (b) | 1,122 | 5,526 | ||||||
JD.com, Inc., ADR * | 316 | 13,617 | ||||||
Jiangsu Hengrui Medicine Co. Ltd., Class A * | 518 | 6,709 | ||||||
Jiangsu Yanghe Brewery Joint-Stock Co. Ltd., Class A | 391 | 5,398 | ||||||
Jointown Pharmaceutical Group Co. Ltd., Class A | 1,186 | 2,979 | ||||||
JonjeeHi-Tech Industrial And Commercial Holding Co. Ltd., Class A | 515 | 3,398 | ||||||
Kingdee International Software Group Co. Ltd. | 4,746 | 6,788 | ||||||
Kunlun Energy Co. Ltd. | 5,808 | 3,784 | ||||||
Kweichow Moutai Co. Ltd., Class A | 31 | 5,427 | ||||||
Laobaixing Pharmacy Chain JSC, Class A | 443 | 4,713 | ||||||
Longfor Group Holdings Ltd. (b) | 1,993 | 10,130 | ||||||
Midea Group Co. Ltd., Class A | 435 | 3,246 | ||||||
NARI Technology Co. Ltd., Class A | 1,575 | 4,428 | ||||||
NetEase, Inc., ADR | 51 | 17,720 | ||||||
SEE NOTES TO FINANCIAL STATEMENTS.
| 28 | J.P. MORGAN INTERNATIONAL EQUITY FUNDS | APRIL 30, 2020 | ||||
Table of Contents
| INVESTMENTS | SHARES (000) | VALUE ($000) | ||||||
Common Stocks — continued | ||||||||
China — continued | ||||||||
New Oriental Education & Technology Group, Inc., ADR * | 81 | 10,361 | ||||||
Nexteer Automotive Group Ltd. | 1,507 | 774 | ||||||
PetroChina Co. Ltd., Class H | 11,278 | 4,051 | ||||||
PICC Property & Casualty Co. Ltd., Class H | 7,370 | 7,053 | ||||||
Ping An Bank Co. Ltd., Class A | 3,658 | 7,112 | ||||||
Ping An Insurance Group Co. of China Ltd., Class H | 3,462 | 35,230 | ||||||
Poly Developments and Holdings Group Co. Ltd., Class A | 2,317 | 5,240 | ||||||
Postal Savings Bank of China Co. Ltd., Class H (b) | 13,198 | 7,886 | ||||||
Prosus NV * | 63 | 4,800 | ||||||
SAIC Motor Corp. Ltd., Class A | 2,011 | 5,306 | ||||||
Shenzhou International Group Holdings Ltd. | 715 | 8,248 | ||||||
Sinopharm Group Co. Ltd., Class H | 1,293 | 3,487 | ||||||
Sunny Optical Technology Group Co. Ltd. | 659 | 9,175 | ||||||
Suofeiya Home Collection Co. Ltd., Class A | 2,772 | 7,274 | ||||||
Tencent Holdings Ltd. | 2,728 | 143,420 | ||||||
Trip.com Group Ltd., ADR * | 255 | 6,578 | ||||||
Vipshop Holdings Ltd., ADR * | 193 | 3,073 | ||||||
Weifu High-Technology Group Co. Ltd., Class A | 1,963 | 5,568 | ||||||
WuXi AppTec Co. Ltd., Class H (b) | 177 | 2,500 | ||||||
Wuxi Biologics Cayman, Inc. * (b) | 698 | 10,865 | ||||||
Xinyangfeng Agricultural Technology Co. Ltd., Class A | 3,054 | 3,602 | ||||||
Yonyou Network Technology Co. Ltd., Class A | 690 | 4,462 | ||||||
Yum China Holdings, Inc. | 280 | 13,578 | ||||||
Zhejiang Chint Electrics Co. Ltd., Class A | 1,204 | 4,200 | ||||||
Zhejiang Supor Co. Ltd., Class A | 512 | 4,733 | ||||||
Zhejiang Weixing New Building Materials Co. Ltd., Class A | 1,410 | 2,411 | ||||||
|
| |||||||
| 917,715 | ||||||||
|
| |||||||
Colombia — 0.1% |
| |||||||
Bancolombia SA | 336 | 2,153 | ||||||
Ecopetrol SA, ADR (a) | 146 | 1,523 | ||||||
|
| |||||||
| 3,676 | ||||||||
|
| |||||||
Czech Republic — 0.2% |
| |||||||
Komercni banka A/S * | 155 | 3,278 | ||||||
Moneta Money Bank A/S (b) | 1,179 | 2,450 | ||||||
|
| |||||||
| 5,728 | ||||||||
|
| |||||||
Greece — 0.2% |
| |||||||
OPAP SA | 444 | 3,977 | ||||||
|
| |||||||
Hong Kong — 0.3% |
| |||||||
Hutchison China MediTech Ltd., ADR * (a) | 123 | 2,652 | ||||||
| INVESTMENTS | SHARES (000) | VALUE ($000) | ||||||
Hong Kong — continued |
| |||||||
Sino Biopharmaceutical Ltd. | 1,539 | 2,243 | ||||||
Techtronic Industries Co. Ltd. | 475 | 3,598 | ||||||
|
| |||||||
| 8,493 | ||||||||
|
| |||||||
Hungary — 0.6% |
| |||||||
OTP Bank Nyrt. | 256 | 7,570 | ||||||
Richter Gedeon Nyrt. | 282 | 6,031 | ||||||
|
| |||||||
| 13,601 | ||||||||
|
| |||||||
India — 8.5% |
| |||||||
Axis Bank Ltd. | 1,567 | 9,157 | ||||||
Bajaj Auto Ltd. | 79 | 2,757 | ||||||
Bosch Ltd. | 14 | 1,926 | ||||||
Container Corp. of India Ltd. | 543 | 2,684 | ||||||
HCL Technologies Ltd. | 867 | 6,220 | ||||||
HDFC Bank Ltd., ADR | 84 | 3,654 | ||||||
Hindalco Industries Ltd. | 1,518 | 2,576 | ||||||
Hindustan Unilever Ltd. | 479 | 13,860 | ||||||
Housing Development Finance Corp. Ltd. | 987 | 24,958 | ||||||
ICICI Bank Ltd., ADR | 436 | 4,256 | ||||||
IndusInd Bank Ltd. | 337 | 2,055 | ||||||
Infosys Ltd., ADR | 2,145 | 19,800 | ||||||
ITC Ltd. | 3,235 | 7,794 | ||||||
Larsen & Toubro Ltd. | 527 | 6,251 | ||||||
Maruti Suzuki India Ltd. | 143 | 10,130 | ||||||
NTPC Ltd. | 4,552 | 5,703 | ||||||
Oil & Natural Gas Corp. Ltd. | 3,741 | 3,959 | ||||||
Petronet LNG Ltd. | 1,205 | 3,881 | ||||||
Power Grid Corp. of India Ltd. | 3,181 | 6,819 | ||||||
Reliance Industries Ltd. | 1,400 | 27,218 | ||||||
Shriram Transport Finance Co. Ltd. | 354 | 3,627 | ||||||
Tata Consultancy Services Ltd. | 618 | 16,372 | ||||||
UltraTech Cement Ltd. | 167 | 7,776 | ||||||
United Spirits Ltd. * | 675 | 4,808 | ||||||
UPL Ltd. | 1,026 | 5,677 | ||||||
|
| |||||||
| 203,918 | ||||||||
|
| |||||||
Indonesia — 1.6% |
| |||||||
Astra International Tbk. PT | 14,174 | 3,625 | ||||||
Bank Central Asia Tbk. PT | 7,672 | 13,289 | ||||||
Bank Rakyat Indonesia Persero Tbk. PT | 43,424 | 7,898 | ||||||
Telekomunikasi Indonesia Persero Tbk. PT | 49,570 | 11,399 | ||||||
United Tractors Tbk. PT | 1,087 | 1,186 | ||||||
|
| |||||||
| 37,397 | ||||||||
|
| |||||||
SEE NOTES TO FINANCIAL STATEMENTS.
| APRIL 30, 2020 | J.P. MORGAN INTERNATIONAL EQUITY FUNDS | 29 | ||||||
Table of Contents
JPMorgan Emerging Markets Research Enhanced Equity Fund
SCHEDULE OF PORTFOLIO INVESTMENTS
AS OF APRIL 30, 2020 (Unaudited) (continued)
| INVESTMENTS | SHARES (000) | VALUE ($000) | ||||||
Common Stocks — continued | ||||||||
Malaysia — 1.0% |
| |||||||
CIMB Group Holdings Bhd. | 3,654 | 2,921 | ||||||
IHH Healthcare Bhd. | 2,936 | 3,573 | ||||||
Petronas Chemicals Group Bhd. | 3,822 | 4,947 | ||||||
Public Bank Bhd. | 1,919 | 7,294 | ||||||
Tenaga Nasional Bhd. | 2,110 | 5,974 | ||||||
|
| |||||||
| 24,709 | ||||||||
|
| |||||||
Mexico — 2.4% |
| |||||||
Alfa SAB de CV, Class A | 3,579 | 1,466 | ||||||
America Movil SAB de CV, Series L | 21,024 | 12,701 | ||||||
Banco Santander Mexico SA Institucion de Banca Multiple Grupo Financiero Santand (a) | 3,086 | 1,708 | ||||||
Fomento Economico Mexicano SAB de CV, ADR | 136 | 8,726 | ||||||
Grupo Aeroportuario del Pacifico SAB de CV, Class B | 538 | 3,343 | ||||||
Grupo Aeroportuario del Sureste SAB de CV, Class B (a) | 407 | 4,066 | ||||||
Grupo Financiero Banorte SAB de CV, Class O | 2,284 | 6,254 | ||||||
Grupo Mexico SAB de CV, Series B (a) | 3,998 | 8,502 | ||||||
Wal-Mart de Mexico SAB de CV | 4,236 | 10,224 | ||||||
|
| |||||||
| 56,990 | ||||||||
|
| |||||||
Peru — 0.4% |
| |||||||
Credicorp Ltd. | 65 | 9,717 | ||||||
|
| |||||||
Philippines — 0.4% |
| |||||||
Ayala Corp. | 241 | 2,746 | ||||||
Ayala Land, Inc. | 5,662 | 3,534 | ||||||
International Container Terminal Services, Inc. | 1,434 | 2,508 | ||||||
|
| |||||||
| 8,788 | ||||||||
|
| |||||||
Poland — 0.5% |
| |||||||
CD Projekt SA | 84 | 7,383 | ||||||
Dino Polska SA * (b) | 96 | 4,042 | ||||||
|
| |||||||
| 11,425 | ||||||||
|
| |||||||
Qatar — 0.4% |
| |||||||
Qatar National Bank QPSC | 1,865 | 8,796 | ||||||
|
| |||||||
Russia — 4.0% |
| |||||||
Alrosa PJSC | 6,268 | 5,191 | ||||||
Gazprom PJSC, ADR | 2,179 | 11,033 | ||||||
LUKOIL PJSC, ADR | 291 | 18,992 | ||||||
Magnitogorsk Iron & Steel Works PJSC | 6,441 | 3,465 | ||||||
MMC Norilsk Nickel PJSC, ADR | 148 | 4,102 | ||||||
Mobile TeleSystems PJSC, ADR | 446 | 3,819 | ||||||
Moscow ExchangeMICEX-RTS PJSC | 4,402 | 7,115 | ||||||
Novatek PJSC, GDR (b) | 20 | 2,814 | ||||||
Sberbank of Russia PJSC, ADR | 1,701 | 17,872 | ||||||
| INVESTMENTS | SHARES (000) | VALUE ($000) | ||||||
Russia — continued |
| |||||||
Severstal PJSC, GDR (b) | 426 | 5,073 | ||||||
Tatneft PJSC, ADR | 220 | 9,772 | ||||||
X5 Retail Group NV, GDR (b) | 225 | 6,637 | ||||||
|
| |||||||
| 95,885 | ||||||||
|
| |||||||
Saudi Arabia — 2.4% |
| |||||||
Al Rajhi Bank | 971 | 14,761 | ||||||
Alinma Bank * | 1,540 | 6,510 | ||||||
Almarai Co. JSC | 363 | 4,733 | ||||||
Bupa Arabia for Cooperative Insurance Co. | 106 | 3,015 | ||||||
Mouwasat Medical Services Co. | 163 | 3,685 | ||||||
National Commercial Bank | 785 | 7,745 | ||||||
Saudi Basic Industries Corp. | 371 | 7,366 | ||||||
Saudi Telecom Co. | 219 | 5,274 | ||||||
Savola Group (The) | 301 | 3,244 | ||||||
|
| |||||||
| 56,333 | ||||||||
|
| |||||||
Singapore — 0.1% |
| |||||||
BOC Aviation Ltd. (b) | 331 | 2,263 | ||||||
|
| |||||||
South Africa — 3.4% |
| |||||||
Absa Group Ltd. | 1,052 | 5,194 | ||||||
Bid Corp. Ltd. | 410 | 5,337 | ||||||
Bidvest Group Ltd. (The) | 615 | 4,993 | ||||||
Capitec Bank Holdings Ltd. | 112 | 5,474 | ||||||
Clicks Group Ltd. | 479 | 5,956 | ||||||
FirstRand Ltd. (a) | 4,101 | 8,950 | ||||||
Mr Price Group Ltd. | 560 | 3,988 | ||||||
MTN Group Ltd. | 1,278 | 3,359 | ||||||
Naspers Ltd., Class N | 148 | 23,065 | ||||||
Pick n Pay Stores Ltd. | 983 | 3,077 | ||||||
Shoprite Holdings Ltd. | 313 | 1,810 | ||||||
SPAR Group Ltd. (The) | 593 | 5,652 | ||||||
Vodacom Group Ltd. | 616 | 4,094 | ||||||
|
| |||||||
| 80,949 | ||||||||
|
| |||||||
South Korea — 12.1% |
| |||||||
BGF retail Co. Ltd. | 17 | 2,166 | ||||||
Hana Financial Group, Inc. | 346 | 7,906 | ||||||
Hanon Systems | 394 | 2,970 | ||||||
Hyundai Glovis Co. Ltd. | 30 | 2,536 | ||||||
Hyundai Mobis Co. Ltd. | 61 | 8,609 | ||||||
Hyundai Motor Co. | 123 | 9,543 | ||||||
KB Financial Group, Inc. | 350 | 10,023 | ||||||
Kia Motors Corp. | 319 | 7,789 | ||||||
KIWOOM Securities Co. Ltd. | 39 | 2,403 | ||||||
KT&G Corp. | 118 | 7,903 | ||||||
SEE NOTES TO FINANCIAL STATEMENTS.
| 30 | J.P. MORGAN INTERNATIONAL EQUITY FUNDS | APRIL 30, 2020 | ||||
Table of Contents
| INVESTMENTS | SHARES (000) | VALUE ($000) | ||||||
Common Stocks — continued | ||||||||
South Korea — continued |
| |||||||
LG Chem Ltd. | 39 | 12,248 | ||||||
LG Household & Health Care Ltd. | 9 | 10,680 | ||||||
Lotte Chemical Corp. | 34 | 5,961 | ||||||
Mando Corp. | 136 | 2,663 | ||||||
NAVER Corp. | 77 | 12,538 | ||||||
NCSoft Corp. | 20 | 10,803 | ||||||
POSCO | 69 | 10,456 | ||||||
Samsung Electronics Co. Ltd. | 2,602 | 106,985 | ||||||
Samsung SDI Co. Ltd. | 37 | 8,846 | ||||||
Shinhan Financial Group Co. Ltd. | 356 | 9,038 | ||||||
SK Holdings Co. Ltd. | 21 | 3,205 | ||||||
SK Hynix, Inc. | 318 | 21,869 | ||||||
SK Innovation Co. Ltd. | 59 | 4,781 | ||||||
S-Oil Corp. | 99 | 5,681 | ||||||
|
| |||||||
| 287,602 | ||||||||
|
| |||||||
Taiwan — 11.7% |
| |||||||
Advantech Co. Ltd. | 544 | 5,145 | ||||||
ASE Technology Holding Co. Ltd. | 1,600 | 3,564 | ||||||
Catcher Technology Co. Ltd. | 1,034 | 7,832 | ||||||
Chailease Holding Co. Ltd. | 2,067 | 7,852 | ||||||
China Life Insurance Co. Ltd. | 7,735 | 5,282 | ||||||
CTBC Financial Holding Co. Ltd. | 18,159 | 12,101 | ||||||
Delta Electronics, Inc. | 2,283 | 10,648 | ||||||
E.Sun Financial Holding Co. Ltd. | 12,076 | 10,972 | ||||||
Formosa Chemicals & Fibre Corp. | 1,361 | 3,447 | ||||||
Formosa Plastics Corp. | 4,186 | 12,287 | ||||||
Fubon Financial Holding Co. Ltd. | 5,107 | 7,221 | ||||||
Global Unichip Corp. | 349 | 2,804 | ||||||
Globalwafers Co. Ltd. | 381 | 4,849 | ||||||
Hiwin Technologies Corp. | 918 | 8,756 | ||||||
Hon Hai Precision Industry Co. Ltd. | 3,154 | 8,106 | ||||||
Inventec Corp. | 2,978 | 2,340 | ||||||
Largan Precision Co. Ltd. | 91 | 12,405 | ||||||
MediaTek, Inc. * | 545 | 7,526 | ||||||
Nanya Technology Corp. | 1,755 | 3,767 | ||||||
Quanta Computer, Inc. | 1,584 | 3,423 | ||||||
Taiwan Semiconductor Manufacturing Co. Ltd., ADR | 2,229 | 118,437 | ||||||
Uni-President Enterprises Corp. | 4,350 | 10,129 | ||||||
Vanguard International Semiconductor Corp. | 2,069 | 4,800 | ||||||
Yuanta Financial Holding Co. Ltd. | 11,254 | 6,415 | ||||||
|
| |||||||
| 280,108 | ||||||||
|
| |||||||
Thailand — 1.6% |
| |||||||
Kasikornbank PCL | 1,665 | 4,342 | ||||||
Minor International PCL | 5,361 | 3,464 | ||||||
| INVESTMENTS | SHARES (000) | VALUE ($000) | ||||||
Thailand — continued |
| |||||||
PTT Exploration & Production PCL | 2,202 | 5,683 | ||||||
PTT Global Chemical PCL | 1,294 | 1,490 | ||||||
PTT PCL | 9,237 | 10,086 | ||||||
Siam Cement PCL (The) (Registered) | 821 | 8,722 | ||||||
Thai Oil PCL | 3,126 | 3,911 | ||||||
|
| |||||||
| 37,698 | ||||||||
|
| |||||||
Turkey — 1.1% |
| |||||||
BIM Birlesik Magazalar A/S | 655 | 5,204 | ||||||
Eregli Demir ve Celik Fabrikalari TAS | 2,324 | 2,679 | ||||||
Ford Otomotiv Sanayi A/S | 274 | 2,482 | ||||||
KOC Holding A/S | 1,257 | 2,759 | ||||||
Tofas Turk Otomobil Fabrikasi A/S | 884 | 2,826 | ||||||
Tupras Turkiye Petrol Rafinerileri A/S * | 307 | 3,993 | ||||||
Turkcell Iletisim Hizmetleri A/S | 2,936 | 5,848 | ||||||
|
| |||||||
| 25,791 | ||||||||
|
| |||||||
United Arab Emirates — 0.3% |
| |||||||
DP World plc | 200 | 3,193 | ||||||
Emaar Properties PJSC | 4,120 | 3,022 | ||||||
|
| |||||||
| 6,215 | ||||||||
|
| |||||||
United Kingdom — 0.1% |
| |||||||
Mondi plc | 102 | 1,824 | ||||||
|
| |||||||
Total Common Stocks | 2,305,629 | |||||||
|
| |||||||
Short-Term Investments — 1.3% |
| |||||||
Investment Companies — 1.0% |
| |||||||
JPMorgan Prime Money Market Fund Class Institutional Shares, 0.63% (c) (d) (Cost $24,060) | 24,064 | 24,084 | ||||||
|
| |||||||
Investment of Cash Collateral From Securities Loaned — 0.3% |
| |||||||
JPMorgan Securities Lending Money Market Fund Agency SL Class Shares, 0.77% (c) (d) | 2,991 | 2,991 | ||||||
JPMorgan U.S. Government Money Market Fund Class IM Shares, 0.23% (c) (d) | 3,246 | 3,246 | ||||||
|
| |||||||
Total Investment of Cash Collateral From Securities Loaned | 6,237 | |||||||
|
| |||||||
Total Short-term Investments | 30,321 | |||||||
|
| |||||||
Total Investments — 98.0% | 2,335,950 | |||||||
Other Assets Less Liabilities — 2.0% | 46,955 | |||||||
|
| |||||||
NET ASSETS — 100.0% | 2,382,905 | |||||||
|
| |||||||
Percentages indicated are based on net assets.
SEE NOTES TO FINANCIAL STATEMENTS.
| APRIL 30, 2020 | J.P. MORGAN INTERNATIONAL EQUITY FUNDS | 31 | ||||||
Table of Contents
JPMorgan Emerging Markets Research Enhanced Equity Fund
SCHEDULE OF PORTFOLIO INVESTMENTS
AS OF APRIL 30, 2020 (Unaudited) (continued)
Summary of Investments by Industry, April 30, 2020
The following table represents the portfolio investments of the Fund by industry classifications as a percentage of total investments:
| INDUSTRY | PERCENTAGE | |||
Banks | 15.3 | % | ||
Internet & Direct Marketing Retail | 9.4 | |||
Semiconductors & Semiconductor Equipment | 7.2 | |||
Interactive Media & Services | 7.2 | |||
Oil, Gas & Consumable Fuels | 6.8 | |||
Technology Hardware, Storage & Peripherals | 5.4 | |||
Insurance | 3.3 | |||
Metals & Mining | 3.1 | |||
Real Estate Management & Development | 2.8 | |||
Food & Staples Retailing | 2.6 | |||
Chemicals | 2.4 | |||
Wireless Telecommunication Services | 2.3 | |||
Electronic Equipment, Instruments & Components | 2.3 | |||
Automobiles | 2.2 | |||
IT Services | 2.0 | |||
Entertainment | 1.5 | |||
Beverages | 1.3 | |||
Diversified Financial Services | 1.1 | |||
Pharmaceuticals | 1.1 | |||
Diversified Telecommunication Services | 1.1 | |||
Thrifts & Mortgage Finance | 1.1 | |||
Food Products | 1.0 | |||
Gas Utilities | 1.0 | |||
Auto Components | 1.0 | |||
Others (each less than 1.0%) | 14.2 | |||
Short-Term Investments | 1.3 | |||
Abbreviations
| ADR | American Depositary Receipt | |
| GDR | Global Depositary Receipt | |
| JSC | Joint Stock Company | |
| PJSC | Public Joint Stock Company | |
| Preference | A special type of equity investment that shares in the earnings of the company, has limited voting rights, and may have a dividend preference. Preference shares may also have liquidation preference. | |
| PT | Limited liability company | |
| RTS | Russian Trading System | |
| (a) | The security or a portion of this security is on loan at April 30, 2020. The total value of securities on loan at April 30, 2020 is approximately $5,853,000. | |
| (b) | Security exempt from registration pursuant to Regulation S under the Securities Act of 1933, as amended. Regulation S applies to securities offerings that are made outside of the United States and do not involve direct selling efforts in the United States and as such may have restrictions on resale. | |
| (c) | Investment in an affiliated fund, which is registered under the Investment Company Act of 1940, as amended, and is advised by J.P. Morgan Investment Management Inc. | |
| (d) | The rate shown is the current yield as of April 30, 2020. | |
| * | Non-income producing security. | |
| Futures contracts outstanding as of April 30, 2020 (amounts in thousands, except number of contracts): | ||||||||||||||||||||
| DESCRIPTION | NUMBER OF CONTRACTS | EXPIRATION DATE | TRADING CURRENCY | NOTIONAL AMOUNT ($) | VALUE AND UNREALIZED APPRECIATION (DEPRECIATION) ($) | |||||||||||||||
Long Contracts | ||||||||||||||||||||
MSCI Emerging MarketsE-Mini Index | 697 | 06/2020 | USD | 31,574 | 2,062 | |||||||||||||||
|
| |||||||||||||||||||
Abbreviations
| MSCI | Morgan Stanley Capital International | |
| USD | United States Dollar |
SEE NOTES TO FINANCIAL STATEMENTS.
| 32 | J.P. MORGAN INTERNATIONAL EQUITY FUNDS | APRIL 30, 2020 | ||||
Table of Contents
JPMorgan Europe Dynamic Fund
SCHEDULE OF PORTFOLIO INVESTMENTS
AS OF APRIL 30, 2020 (Unaudited)
| INVESTMENTS | SHARES (000) | VALUE ($000) | ||||||
Common Stocks — 99.0% |
| |||||||
Australia — 2.3% |
| |||||||
BHP Group plc | 262 | 4,404 | ||||||
Rio Tinto plc | 111 | 5,142 | ||||||
|
| |||||||
| 9,546 | ||||||||
|
| |||||||
Austria — 2.2% |
| |||||||
ams AG * | 151 | 1,981 | ||||||
Erste Group Bank AG | 211 | 4,565 | ||||||
Wienerberger AG | 134 | 2,513 | ||||||
|
| |||||||
| 9,059 | ||||||||
|
| |||||||
Belgium — 2.4% |
| |||||||
KBC Group NV | 82 | 4,441 | ||||||
UCB SA * | 60 | 5,485 | ||||||
|
| |||||||
| 9,926 | ||||||||
|
| |||||||
Finland — 2.0% |
| |||||||
Neste OYJ | 231 | 8,173 | ||||||
|
| |||||||
France — 14.9% |
| |||||||
Atos SE * | 52 | 3,721 | ||||||
BNP Paribas SA | 147 | 4,620 | ||||||
Credit Agricole SA | 338 | 2,717 | ||||||
Eiffage SA | 45 | 3,715 | ||||||
Kering SA (a) | 17 | 8,619 | ||||||
Peugeot SA | 278 | 3,941 | ||||||
Safran SA | 69 | 6,433 | ||||||
Sanofi (a) | 153 | 14,904 | ||||||
Schneider Electric SE * (a) | 68 | 6,241 | ||||||
TOTAL SA | 205 | 7,270 | ||||||
|
| |||||||
| 62,181 | ||||||||
|
| |||||||
Germany — 13.1% |
| |||||||
Allianz SE (Registered) | 55 | 10,189 | ||||||
Bayer AG (Registered) | 87 | 5,718 | ||||||
Deutsche Post AG (Registered) | 141 | 4,176 | ||||||
Deutsche Telekom AG (Registered) | 536 | 7,839 | ||||||
DWS Group GmbH & Co. KGaA (b) | 100 | 3,171 | ||||||
HelloFresh SE * | 196 | 6,972 | ||||||
LEG Immobilien AG | 36 | 4,142 | ||||||
Schaeffler AG (Preference) | 800 | 5,399 | ||||||
TeamViewer AG * | 72 | 3,142 | ||||||
Volkswagen AG (Preference) | 28 | 3,958 | ||||||
|
| |||||||
| 54,706 | ||||||||
|
| |||||||
Ireland — 1.8% |
| |||||||
AIB Group plc * | 1,884 | 2,564 | ||||||
Bank of Ireland Group plc | 1,358 | 2,735 | ||||||
| INVESTMENTS | SHARES (000) | VALUE ($000) | ||||||
Ireland — continued |
| |||||||
Ryanair Holdings plc, ADR * | 37 | 2,356 | ||||||
|
| |||||||
| 7,655 | ||||||||
|
| |||||||
Italy — 4.9% |
| |||||||
Enel SpA | 1,413 | 9,655 | ||||||
Falck Renewables SpA | 556 | 2,731 | ||||||
Nexi SpA * (b) | 369 | 5,593 | ||||||
Poste Italiane SpA (b) | 304 | 2,588 | ||||||
|
| |||||||
| 20,567 | ||||||||
|
| |||||||
Netherlands — 8.1% |
| |||||||
ASM International NV | 73 | 8,009 | ||||||
ASR Nederland NV | 153 | 4,121 | ||||||
BE Semiconductor Industries NV * (a) | 85 | 3,526 | ||||||
Euronext NV (b) | 31 | 2,638 | ||||||
Koninklijke Ahold Delhaize NV (a) | 395 | 9,581 | ||||||
Wolters Kluwer NV (a) | 83 | 6,077 | ||||||
|
| |||||||
| 33,952 | ||||||||
|
| |||||||
Norway — 0.7% |
| |||||||
Scatec Solar ASA (b) | 210 | 3,052 | ||||||
|
| |||||||
Russia — 2.0% |
| |||||||
Polymetal International plc | 398 | 8,141 | ||||||
|
| |||||||
South Africa — 0.8% |
| |||||||
Anglo American plc | 182 | 3,241 | ||||||
|
| |||||||
Spain — 1.5% |
| |||||||
Endesa SA | 276 | 6,131 | ||||||
|
| |||||||
Sweden — 3.9% |
| |||||||
Embracer Group AB * | 110 | 1,166 | ||||||
Evolution Gaming Group AB (b) | 76 | 3,460 | ||||||
Hennes & Mauritz AB, Class B (a) | 215 | 2,942 | ||||||
Sinch AB * (b) | 78 | 4,036 | ||||||
SKF AB, Class B | 307 | 4,846 | ||||||
|
| |||||||
| 16,450 | ||||||||
|
| |||||||
Switzerland — 20.9% |
| |||||||
ALSO Holding AG (Registered) * | 6 | 1,194 | ||||||
LafargeHolcim Ltd. (Registered) * | 158 | 6,581 | ||||||
Nestle SA (Registered) | 146 | 15,483 | ||||||
Novartis AG (Registered) | 210 | 17,949 | ||||||
Roche Holding AG | 62 | 21,405 | ||||||
SIG Combibloc Group AG * | 257 | 4,170 | ||||||
STMicroelectronics NV | 200 | 5,152 | ||||||
Swisscom AG (Registered) | 16 | 8,434 | ||||||
SEE NOTES TO FINANCIAL STATEMENTS.
| APRIL 30, 2020 | J.P. MORGAN INTERNATIONAL EQUITY FUNDS | 33 | ||||||
Table of Contents
JPMorgan Europe Dynamic Fund
SCHEDULE OF PORTFOLIO INVESTMENTS
AS OF APRIL 30, 2020 (Unaudited) (continued)
| INVESTMENTS | SHARES (000) | VALUE ($000) | ||||||
Common Stocks — continued |
| |||||||
Switzerland — continued |
| |||||||
Zurich Insurance Group AG | 22 | 6,970 | ||||||
|
| |||||||
| 87,338 | ||||||||
|
| |||||||
United Kingdom — 17.5% |
| |||||||
AstraZeneca plc | 44 | 4,606 | ||||||
Barratt Developments plc | 676 | 4,408 | ||||||
Berkeley Group Holdings plc | 51 | 2,688 | ||||||
British American Tobacco plc | 109 | 4,195 | ||||||
Calisen plc * | 1,313 | 3,059 | ||||||
Centrica plc | 2,449 | 1,225 | ||||||
Dialog Semiconductor plc * | 111 | 3,491 | ||||||
Dunelm Group plc | 240 | 2,768 | ||||||
Games Workshop Group plc | 23 | 1,710 | ||||||
Intermediate Capital Group plc | 374 | 5,293 | ||||||
Linde plc | 53 | 9,795 | ||||||
National Express Group plc | 611 | 2,104 | ||||||
Next plc | 83 | 4,942 | ||||||
Prudential plc | 220 | 3,102 | ||||||
Reckitt Benckiser Group plc | 45 | 3,728 | ||||||
Segro plc, REIT | 558 | 5,849 | ||||||
Spirent Communications plc | 1,401 | 4,237 | ||||||
Taylor Wimpey plc | 3,193 | 5,896 | ||||||
|
| |||||||
| 73,096 | ||||||||
|
| |||||||
Total Common Stocks |
| 413,214 | ||||||
|
| |||||||
Short-Term Investments — 10.9% | ||||||||
Investment Companies — 1.0% | ||||||||
JPMorgan Prime Money Market Fund Class Institutional Shares, 0.63% (c) (d) | 4,181 | 4,185 | ||||||
|
| |||||||
Investment of Cash Collateral from Securities Loaned — 9.9% |
| |||||||
JPMorgan Securities Lending Money Market Fund Agency SL Class Shares, 0.77% (c) (d) | 30,000 | 30,006 | ||||||
JPMorgan U.S. Government Money Market Fund Class IM Shares, 0.23% (c) (d) | 11,283 | 11,283 | ||||||
|
| |||||||
Total Investment of Cash Collateral from Securities Loaned | 41,289 | |||||||
|
| |||||||
Total Short-Term Investments | 45,474 | |||||||
|
| |||||||
Total Investments — 109.9% | 458,688 | |||||||
Liabilities in Excess of | (41,233 | ) | ||||||
|
| |||||||
NET ASSETS — 100.0% | 417,455 | |||||||
|
| |||||||
Percentages indicated are based on net assets.
Summary of Investments by Industry, April 30, 2020
The following table represents the portfolio investments of the Fund by industry classifications as a percentage of total investments:
| INDUSTRY | PERCENTAGE | |||
Pharmaceuticals | 15.3 | % | ||
Insurance | 5.9 | |||
Semiconductors & Semiconductor Equipment | 4.8 | |||
Banks | 4.7 | |||
Metals & Mining | 4.6 | |||
Diversified Telecommunication Services | 3.5 | |||
Electric Utilities | 3.4 | |||
Food Products | 3.4 | |||
Oil, Gas & Consumable Fuels | 3.4 | |||
Household Durables | 2.8 | |||
Capital Markets | 2.4 | |||
Chemicals | 2.1 | |||
Food & Staples Retailing | 2.1 | |||
IT Services | 2.0 | |||
Construction Materials | 2.0 | |||
Textiles, Apparel & Luxury Goods | 1.9 | |||
Automobiles | 1.7 | |||
Software | 1.6 | |||
Internet & Direct Marketing Retail | 1.5 | |||
Aerospace & Defense | 1.4 | |||
Electrical Equipment | 1.4 | |||
Professional Services | 1.3 | |||
Equity Real Estate Investment Trusts (REITs) | 1.3 | |||
Independent Power and Renewable Electricity Producers | 1.3 | |||
Specialty Retail | 1.2 | |||
Auto Components | 1.2 | |||
Multiline Retail | 1.1 | |||
Machinery | 1.1 | |||
Others (each less than 1.0%) | 9.7 | |||
Short-Term Investments | 9.9 | |||
SEE NOTES TO FINANCIAL STATEMENTS.
| 34 | J.P. MORGAN INTERNATIONAL EQUITY FUNDS | APRIL 30, 2020 | ||||
Table of Contents
Abbreviations
| ADR | American Depositary Receipt | |
| OYJ | Public Limited Company | |
| Preference | A special type of equity investment that shares in the earnings of the company, has limited voting rights, and may have a dividend preference. Preference shares may also have liquidation preference. | |
| REIT | Real Estate Investment Trust | |
| (a) | The security or a portion of this security is on loan at April 30, 2020. The total value of securities on loan at April 30, 2020 is approximately $35,227,000. | |
| (b) | Security exempt from registration pursuant to Regulation S under the Securities Act of 1933, as amended. Regulation S applies to securities offerings that are made outside of the United States and do not involve direct selling efforts in the United States and as such may have restrictions on resale. | |
| (c) | Investment in an affiliated fund, which is registered under the Investment Company Act of 1940, as amended, and is advised by J.P. Morgan Investment Management Inc. | |
| (d) | The rate shown is the current yield as of April 30, 2020. | |
| * | Non-income producing security. |
| Futures contracts outstanding as of April 30, 2020 (amounts in thousands, except number of contracts): | ||||||||||||||||||||
| DESCRIPTION | NUMBER OF CONTRACTS | EXPIRATION DATE | TRADING CURRENCY | NOTIONAL AMOUNT ($) | VALUE AND UNREALIZED APPRECIATION (DEPRECIATION) ($) | |||||||||||||||
Long Contracts | ||||||||||||||||||||
EURO STOXX 50 Index | 32 | 06/2020 | EUR | 1,011 | 215 | |||||||||||||||
FTSE 100 Index | 7 | 06/2020 | GBP | 517 | 74 | |||||||||||||||
|
| |||||||||||||||||||
| 289 | ||||||||||||||||||||
|
| |||||||||||||||||||
Abbreviations
| EUR | Euro | |
| FTSE | Financial Times and the London Stock Exchange | |
| GBP | British Pound |
SEE NOTES TO FINANCIAL STATEMENTS.
| APRIL 30, 2020 | J.P. MORGAN INTERNATIONAL EQUITY FUNDS | 35 | ||||||
Table of Contents
JPMorgan International Advantage Fund
SCHEDULE OF PORTFOLIO INVESTMENTS
AS OF APRIL 30, 2020 (Unaudited)
| INVESTMENTS | SHARES (000) | VALUE ($000) | ||||||
Common Stocks — 97.0% |
| |||||||
Australia — 9.3% |
| |||||||
AGL Energy Ltd. | 414 | 4,549 | ||||||
Ansell Ltd. | 354 | 6,529 | ||||||
Aurizon Holdings Ltd. | 3,801 | 11,548 | ||||||
Austal Ltd. | 975 | 2,115 | ||||||
Beach Energy Ltd. | 4,653 | 4,535 | ||||||
BHP Group Ltd. | 1,213 | 24,772 | ||||||
Caltex Australia Ltd. | 185 | 2,982 | ||||||
Coca-Cola Amatil Ltd. | 881 | 4,905 | ||||||
Coles Group Ltd. | 1,070 | 10,734 | ||||||
CSL Ltd. | 53 | 10,487 | ||||||
CSR Ltd. | 2,498 | 6,004 | ||||||
Fortescue Metals Group Ltd. | 948 | 7,246 | ||||||
IGO Ltd. | 1,327 | 4,025 | ||||||
IOOF Holdings Ltd. | 470 | 1,312 | ||||||
JBHi-Fi Ltd. (a) | 281 | 6,344 | ||||||
Lendlease Group * | 570 | 4,538 | ||||||
Metcash Ltd. | 1,883 | 3,037 | ||||||
Orica Ltd. | 228 | 2,641 | ||||||
Rio Tinto plc | 444 | 20,603 | ||||||
|
| |||||||
| 138,906 | ||||||||
|
| |||||||
Austria — 0.4% |
| |||||||
BAWAG Group AG * (b) | 58 | 1,961 | ||||||
Wienerberger AG | 256 | 4,788 | ||||||
|
| |||||||
| 6,749 | ||||||||
|
| |||||||
Belgium — 1.3% |
| |||||||
Ageas | 337 | 12,131 | ||||||
bpost SA | 245 | 1,712 | ||||||
D’ieteren SA/NV | 38 | 1,925 | ||||||
KBC Group NV | 66 | 3,563 | ||||||
|
| |||||||
| 19,331 | ||||||||
|
| |||||||
China — 0.8% |
| |||||||
BOC Hong Kong Holdings Ltd. | 3,687 | 11,316 | ||||||
|
| |||||||
Denmark — 2.5% |
| |||||||
Carlsberg A/S, Class B | 95 | 11,953 | ||||||
Novo Nordisk A/S, Class B | 378 | 24,096 | ||||||
Scandinavian Tobacco Group A/S, Class A (b) | 147 | 1,687 | ||||||
|
| |||||||
| 37,736 | ||||||||
|
| |||||||
France — 7.0% |
| |||||||
Capgemini SE | 57 | 5,343 | ||||||
Cie de Saint-Gobain | 204 | 5,427 | ||||||
Eiffage SA | 152 | 12,433 | ||||||
LVMH Moet Hennessy Louis Vuitton SE | 17 | 6,499 | ||||||
Peugeot SA | 757 | 10,737 | ||||||
| INVESTMENTS | SHARES (000) | VALUE ($000) | ||||||
France — continued |
| |||||||
Sanofi (a) | 295 | 28,808 | ||||||
Schneider Electric SE * (a) | 220 | 20,306 | ||||||
Sopra Steria Group | 30 | 3,518 | ||||||
SPIE SA | 350 | 5,278 | ||||||
TOTAL SA | 103 | 3,640 | ||||||
Veolia Environnement SA | 105 | 2,234 | ||||||
|
| |||||||
| 104,223 | ||||||||
|
| |||||||
Germany — 6.2% |
| |||||||
Allianz SE (Registered) | 126 | 23,259 | ||||||
Bayer AG (Registered) | 71 | 4,653 | ||||||
Deutsche Pfandbriefbank AG (b) | 540 | 3,971 | ||||||
Freenet AG | 531 | 10,079 | ||||||
Hannover Rueck SE | 68 | 10,853 | ||||||
Muenchener Rueckversicherungs-Gesellschaft AG (Registered) | 77 | 16,923 | ||||||
RWE AG | 150 | 4,322 | ||||||
SAP SE | 85 | 10,075 | ||||||
Schaeffler AG (Preference) | 1,310 | 8,845 | ||||||
|
| |||||||
| 92,980 | ||||||||
|
| |||||||
Hong Kong — 2.5% |
| |||||||
AIA Group Ltd. | 852 | 7,817 | ||||||
Power Assets Holdings Ltd. | 1,705 | 11,424 | ||||||
VTech Holdings Ltd. | 558 | 4,204 | ||||||
WH Group Ltd. (b) | 7,227 | 6,893 | ||||||
Xinyi Glass Holdings Ltd. | 5,866 | 6,794 | ||||||
|
| |||||||
| 37,132 | ||||||||
|
| |||||||
Ireland — 0.3% |
| |||||||
Greencore Group plc | 1,151 | 2,635 | ||||||
Ryanair Holdings plc, ADR * | 31 | 1,951 | ||||||
|
| |||||||
| 4,586 | ||||||||
|
| |||||||
Israel — 0.3% |
| |||||||
Israel Discount Bank Ltd., Class A | 1,560 | 5,060 | ||||||
|
| |||||||
Italy — 1.2% |
| |||||||
Enel SpA | 566 | 3,869 | ||||||
Snam SpA | 3,013 | 13,516 | ||||||
|
| |||||||
| 17,385 | ||||||||
|
| |||||||
Japan — 25.4% |
| |||||||
Advantest Corp. | 182 | 8,826 | ||||||
Alfresa Holdings Corp. | 106 | 2,112 | ||||||
Amano Corp. | 111 | 2,271 | ||||||
Asahi Group Holdings Ltd. | 84 | 2,895 | ||||||
Astellas Pharma, Inc. | 664 | 10,985 | ||||||
Brother Industries Ltd. | 391 | 6,629 | ||||||
SEE NOTES TO FINANCIAL STATEMENTS.
| 36 | J.P. MORGAN INTERNATIONAL EQUITY FUNDS | APRIL 30, 2020 | ||||
Table of Contents
| INVESTMENTS | SHARES (000) | VALUE ($000) | ||||||
Common Stocks — continued |
| |||||||
Japan — continued |
| |||||||
Capcom Co. Ltd. | 214 | 6,544 | ||||||
Chugai Pharmaceutical Co. Ltd. | 33 | 3,958 | ||||||
Dai-ichi Life Holdings, Inc. | 353 | 4,420 | ||||||
Digital Garage, Inc. | 78 | 2,780 | ||||||
Fujitsu Ltd. | 84 | 8,170 | ||||||
GMO internet, Inc. | 100 | 2,174 | ||||||
Hikari Tsushin, Inc. | 11 | 2,109 | ||||||
Hitachi Ltd. | 365 | 10,845 | ||||||
Internet Initiative Japan, Inc. | 95 | 3,261 | ||||||
ITOCHU Corp. | 485 | 9,510 | ||||||
Iwatani Corp. (a) | 119 | 4,055 | ||||||
Japan Aviation Electronics Industry Ltd. | 123 | 1,600 | ||||||
Japan Petroleum Exploration Co. Ltd. | 60 | 1,031 | ||||||
Kaken Pharmaceutical Co. Ltd. | 31 | 1,728 | ||||||
KDDI Corp. | 432 | 12,518 | ||||||
Keyence Corp. | 6 | 2,035 | ||||||
K’s Holdings Corp. | 210 | 2,291 | ||||||
Kyudenko Corp. | 86 | 2,408 | ||||||
Marubeni Corp. | 1,159 | 5,581 | ||||||
Medipal Holdings Corp. | 158 | 3,048 | ||||||
Meitec Corp. | 49 | 2,150 | ||||||
Mitsubishi UFJ Financial Group, Inc. | 3,319 | 13,407 | ||||||
Mitsubishi UFJ Lease & Finance Co. Ltd. | 1,011 | 4,828 | ||||||
Mitsui Fudosan Co. Ltd. | 454 | 8,344 | ||||||
Morinaga & Co. Ltd. | 95 | 3,896 | ||||||
MS&AD Insurance Group Holdings, Inc. | 126 | 3,627 | ||||||
Nihon Unisys Ltd. | 224 | 6,470 | ||||||
Nippon Telegraph & Telephone Corp. | 424 | 9,658 | ||||||
Nomura Holdings, Inc. | 1,924 | 7,986 | ||||||
Nomura Real Estate Holdings, Inc. | 398 | 6,463 | ||||||
NTT DOCOMO, Inc. | 358 | 10,536 | ||||||
Obayashi Corp. | 323 | 2,827 | ||||||
Ono Pharmaceutical Co. Ltd. | 173 | 4,166 | ||||||
Open House Co. Ltd. | 163 | 3,547 | ||||||
ORIX Corp. | 652 | 7,668 | ||||||
Otsuka Corp. | 101 | 4,582 | ||||||
Rohto Pharmaceutical Co. Ltd. | 137 | 3,986 | ||||||
Saizeriya Co. Ltd. | 76 | 1,509 | ||||||
Sankyu, Inc. | 107 | 4,112 | ||||||
Sawai Pharmaceutical Co. Ltd. | 48 | 2,605 | ||||||
SCSK Corp. | 55 | 2,485 | ||||||
Sekisui House Ltd. | 480 | 8,231 | ||||||
Shinsei Bank Ltd. | 508 | 6,126 | ||||||
Shionogi & Co. Ltd. | 167 | 9,195 | ||||||
Ship Healthcare Holdings, Inc. | 37 | 1,678 | ||||||
| INVESTMENTS | SHARES (000) | VALUE ($000) | ||||||
Japan — continued |
| |||||||
Softbank Corp. | 648 | 8,822 | ||||||
Sony Corp. | 267 | 17,176 | ||||||
Sumitomo Mitsui Financial Group, Inc. | 429 | 11,289 | ||||||
Sumitomo Mitsui Trust Holdings, Inc. | 283 | 8,225 | ||||||
Teijin Ltd. | 176 | 2,813 | ||||||
TIS, Inc. | 377 | 7,191 | ||||||
Tokuyama Corp. | 143 | 3,026 | ||||||
Tokyo Electron Ltd. | 54 | 11,544 | ||||||
Tokyo Tatemono Co. Ltd. | 511 | 5,746 | ||||||
Tokyu Fudosan Holdings Corp. | 1,281 | 6,268 | ||||||
Toyota Motor Corp. | 380 | 23,469 | ||||||
Toyota Tsusho Corp. | 180 | 4,280 | ||||||
TS Tech Co. Ltd. | 119 | 3,238 | ||||||
Zeon Corp. | 397 | 3,477 | ||||||
|
| |||||||
| 380,430 | ||||||||
|
| |||||||
Netherlands — 6.5% |
| |||||||
ASM International NV | 120 | 13,241 | ||||||
ASML Holding NV (a) | 34 | 9,910 | ||||||
BE Semiconductor Industries NV *(a) | 137 | 5,658 | ||||||
Euronext NV (b) | 135 | 11,339 | ||||||
EXOR NV | 154 | 8,415 | ||||||
Koninklijke Ahold Delhaize NV | 557 | 13,519 | ||||||
Randstad NV * | 145 | 5,831 | ||||||
Royal Dutch Shell plc, Class B | 518 | 8,293 | ||||||
Signify NV (b) | 256 | 5,217 | ||||||
Wolters Kluwer NV (a) | 214 | 15,712 | ||||||
|
| |||||||
| 97,135 | ||||||||
|
| |||||||
New Zealand — 0.3% |
| |||||||
Spark New Zealand Ltd. | 1,408 | 3,811 | ||||||
|
| |||||||
Norway — 1.0% |
| |||||||
DNB ASA | 657 | 7,955 | ||||||
Norwegian Finans Holding ASA * | 552 | 2,947 | ||||||
Scatec Solar ASA (b) | 291 | 4,238 | ||||||
|
| |||||||
| 15,140 | ||||||||
|
| |||||||
Portugal — 0.7% |
| |||||||
Jeronimo Martins SGPS SA | 587 | 9,955 | ||||||
|
| |||||||
Singapore — 2.5% |
| |||||||
DBS Group Holdings Ltd. | 1,100 | 15,481 | ||||||
Singapore Telecommunications Ltd. | 5,677 | 11,344 | ||||||
United Overseas Bank Ltd. | 691 | 9,874 | ||||||
|
| |||||||
| 36,699 | ||||||||
|
| |||||||
South Africa — 0.9% |
| |||||||
Anglo American plc | 784 | 13,948 | ||||||
|
| |||||||
SEE NOTES TO FINANCIAL STATEMENTS.
| APRIL 30, 2020 | J.P. MORGAN INTERNATIONAL EQUITY FUNDS | 37 | ||||||
Table of Contents
JPMorgan International Advantage Fund
SCHEDULE OF PORTFOLIO INVESTMENTS
AS OF APRIL 30, 2020 (Unaudited) (continued)
| INVESTMENTS | SHARES (000) | VALUE ($000) | ||||||
Common Stocks — continued |
| |||||||
Spain — 1.8% |
| |||||||
Enagas SA | 467 | 10,905 | ||||||
Endesa SA | 661 | 14,666 | ||||||
Mediaset Espana Comunicacion SA * (a) | 574 | 2,057 | ||||||
|
| |||||||
| 27,628 | ||||||||
|
| |||||||
Sweden — 2.7% |
| |||||||
Skandinaviska Enskilda Banken AB, Class A | 952 | 7,835 | ||||||
Skanska AB, Class B * | 578 | 10,995 | ||||||
SKF AB, Class B | 578 | 9,118 | ||||||
Swedish Match AB | 194 | 12,018 | ||||||
|
| |||||||
| 39,966 | ||||||||
|
| |||||||
Switzerland — 11.7% |
| |||||||
Adecco Group AG (Registered) | 204 | 8,922 | ||||||
Galenica AG * (b) | 79 | 5,651 | ||||||
Julius Baer Group Ltd. * | 163 | 6,420 | ||||||
Landis+Gyr Group AG * | 109 | 7,358 | ||||||
Nestle SA (Registered) | 404 | 42,831 | ||||||
Novartis AG (Registered) | 409 | 34,869 | ||||||
Roche Holding AG | 122 | 42,171 | ||||||
Swiss Life Holding AG (Registered) | 32 | 11,278 | ||||||
Swisscom AG (Registered) | 23 | 12,038 | ||||||
Zurich Insurance Group AG | 11 | 3,584 | ||||||
|
| |||||||
| 175,122 | ||||||||
|
| |||||||
United Kingdom — 11.0% |
| |||||||
3i Group plc | 1,098 | 10,782 | ||||||
Ashtead Group plc | 571 | 15,605 | ||||||
AstraZeneca plc | 91 | 9,522 | ||||||
Avast plc (b) | 2,379 | 13,702 | ||||||
Barratt Developments plc | 899 | 5,861 | ||||||
Berkeley Group Holdings plc | 168 | 8,797 | ||||||
Computacenter plc | 107 | 1,948 | ||||||
Dialog Semiconductor plc * | 300 | 9,410 | ||||||
Dunelm Group plc | 547 | 6,322 | ||||||
GlaxoSmithKline plc | 818 | 17,059 | ||||||
Howden Joinery Group plc | 291 | 1,921 | ||||||
HSBC Holdings plc | 337 | 1,730 | ||||||
Inchcape plc | 774 | 4,873 | ||||||
| INVESTMENTS | SHARES (000) | VALUE ($000) | ||||||
United Kingdom — continued |
| |||||||
Legal & General Group plc | 4,012 | 10,315 | ||||||
Next plc | 113 | 6,701 | ||||||
Pets at Home Group plc | 445 | 1,424 | ||||||
Redrow plc | 709 | 4,120 | ||||||
Savills plc | 83 | 1,010 | ||||||
Tate & Lyle plc | 497 | 4,457 | ||||||
Taylor Wimpey plc | 3,329 | 6,148 | ||||||
Ultra Electronics Holdings plc | 185 | 4,587 | ||||||
Unilever plc | 313 | 16,120 | ||||||
Vistry Group plc | 137 | 1,394 | ||||||
|
| |||||||
| 163,808 | ||||||||
|
| |||||||
United States — 0.7% |
| |||||||
Ferguson plc | 150 | 10,815 | ||||||
|
| |||||||
Total Common Stocks | 1,449,861 | |||||||
|
| |||||||
Short-Term Investments — 7.0% |
| |||||||
Investment Companies — 1.9% |
| |||||||
JPMorgan Prime Money Market Fund Class Institutional Shares, 0.63% (c) (d) | 28,750 | 28,772 | ||||||
|
| |||||||
Investment of Cash Collateral from Securities Loaned — 5.1% |
| |||||||
JPMorgan Securities Lending Money Market Fund Agency SL Class Shares, 0.77% (c) (d) | 32,997 | 33,005 | ||||||
JPMorgan U.S. Government Money Market Fund Class IM Shares, 0.23% (c) (d) | 43,374 | 43,374 | ||||||
|
| |||||||
Total Investment of Cash Collateral from Securities Loaned | 76,379 | |||||||
|
| |||||||
Total Short-Term Investments | 105,151 | |||||||
|
| |||||||
Total Investments — 104.0% | 1,555,012 | |||||||
Liabilities in Excess of | (60,162 | ) | ||||||
|
| |||||||
NET ASSETS — 100.0% | 1,494,850 | |||||||
|
| |||||||
Percentages indicated are based on net assets.
SEE NOTES TO FINANCIAL STATEMENTS.
| 38 | J.P. MORGAN INTERNATIONAL EQUITY FUNDS | APRIL 30, 2020 | ||||
Table of Contents
Summary of Investments by Industry, April 30, 2020
The following table represents the portfolio investments of the Fund by industry classifications as a percentage of total investments:
| INDUSTRY | PERCENTAGE | |||
Pharmaceuticals | 12.5 | % | ||
Banks | 6.9 | |||
Insurance | 6.7 | |||
Metals & Mining | 4.5 | |||
Food Products | 3.9 | |||
Semiconductors & Semiconductor Equipment | 3.8 | |||
Household Durables | 3.3 | |||
Trading Companies & Distributors | 3.1 | |||
IT Services | 2.9 | |||
Wireless Telecommunication Services | 2.7 | |||
Diversified Telecommunication Services | 2.6 | |||
Capital Markets | 2.4 | |||
Food & Staples Retailing | 2.4 | |||
Real Estate Management & Development | 2.3 | |||
Automobiles | 2.2 | |||
Professional Services | 2.1 | |||
Electric Utilities | 1.9 | |||
Construction & Engineering | 1.8 | |||
Electrical Equipment | 1.6 | |||
Oil, Gas & Consumable Fuels | 1.6 | |||
Gas Utilities | 1.6 | |||
Electronic Equipment, Instruments & Components | 1.6 | |||
Software | 1.5 | |||
Diversified Financial Services | 1.4 | |||
Personal Products | 1.3 | |||
Beverages | 1.3 | |||
Auto Components | 1.2 | |||
Specialty Retail | 1.2 | |||
Road & Rail | 1.0 | |||
Others (each less than 1.0%) | 10.0 | |||
Short-Term Investments | 6.7 | |||
| Abbreviations | ||
| ADR | American Depositary Receipt | |
| Preference | A special type of equity investment that shares in the earnings of the company, has limited voting rights, and may have a dividend preference. Preference shares may also have liquidation preference. | |
| SGPS | Holding company | |
| (a) | The security or a portion of this security is on loan at April 30, 2020. The total value of securities on loan at April 30, 2020 is approximately $72,637,000. | |
| (b) | Security exempt from registration pursuant to Regulation S under the Securities Act of 1933, as amended. Regulation S applies to securities offerings that are made outside of the United States and do not involve direct selling efforts in the United States and as such may have restrictions on resale. | |
| (c) | Investment in an affiliated fund, which is registered under the Investment Company Act of 1940, as amended, and is advised by J.P. Morgan Investment Management Inc. | |
| (d) | The rate shown is the current yield as of April 30, 2020. | |
| * | Non-income producing security. | |
SEE NOTES TO FINANCIAL STATEMENTS.
| APRIL 30, 2020 | J.P. MORGAN INTERNATIONAL EQUITY FUNDS | 39 | ||||||
Table of Contents
JPMorgan International Advantage Fund
SCHEDULE OF PORTFOLIO INVESTMENTS
AS OF APRIL 30, 2020 (Unaudited) (continued)
| Futures contracts outstanding as of April 30, 2020 (amounts in thousands, except number of contracts): | ||||||||||||||||||||
| DESCRIPTION | NUMBER OF CONTRACTS | EXPIRATION DATE | TRADING CURRENCY | NOTIONAL AMOUNT ($) | VALUE AND UNREALIZED APPRECIATION (DEPRECIATION) ($) | |||||||||||||||
Long Contracts | ||||||||||||||||||||
EURO STOXX 50 Index | 337 | 06/2020 | EUR | 10,643 | 218 | |||||||||||||||
FTSE 100 Index | 81 | 06/2020 | GBP | 5,983 | 192 | |||||||||||||||
TOPIX Index | 53 | 06/2020 | JPY | 7,178 | 181 | |||||||||||||||
|
| |||||||||||||||||||
| 591 | ||||||||||||||||||||
|
| |||||||||||||||||||
Abbreviations
| EUR | Euro | |
| FTSE | Financial Times and the London Stock Exchange | |
| GBP | British Pound | |
| JPY | Japanese Yen | |
| TOPIX | Tokyo Stock Price Index |
SEE NOTES TO FINANCIAL STATEMENTS.
| 40 | J.P. MORGAN INTERNATIONAL EQUITY FUNDS | APRIL 30, 2020 | ||||
Table of Contents
JPMorgan International Equity Fund
SCHEDULE OF PORTFOLIO INVESTMENTS
AS OF APRIL 30, 2020 (Unaudited)
| INVESTMENTS | SHARES (000) | VALUE ($000) | ||||||
Common Stocks — 98.4% | ||||||||
Australia — 3.5% | ||||||||
BHP Group Ltd. | 1,421 | 29,018 | ||||||
BHP Group plc | 1,074 | 18,024 | ||||||
Commonwealth Bank of Australia | 508 | 20,531 | ||||||
Rio Tinto plc | 560 | 25,986 | ||||||
|
| |||||||
| 93,559 | ||||||||
|
| |||||||
Austria — 0.4% | ||||||||
Erste Group Bank AG | 563 | 12,211 | ||||||
|
| |||||||
Belgium — 0.8% | ||||||||
KBC Group NV | 397 | 21,535 | ||||||
|
| |||||||
China — 3.7% | ||||||||
Alibaba Group Holding Ltd., ADR * | 128 | 25,854 | ||||||
Ping An Insurance Group Co. of China Ltd., Class H | 3,092 | 31,465 | ||||||
Prosus NV * (a) | 174 | 13,189 | ||||||
Tencent Holdings Ltd. | 544 | 28,587 | ||||||
|
| |||||||
| 99,095 | ||||||||
|
| |||||||
Denmark — 4.2% | ||||||||
Carlsberg A/S, Class B | 239 | 30,145 | ||||||
Novo Nordisk A/S, Class B | 948 | 60,472 | ||||||
Orsted A/S (b) | 206 | 20,772 | ||||||
|
| |||||||
| 111,389 | ||||||||
|
| |||||||
Finland — 1.3% | ||||||||
Kone OYJ, Class B | 557 | 33,755 | ||||||
|
| |||||||
France — 13.2% | ||||||||
Accor SA (a) | 628 | 17,483 | ||||||
Airbus SE * | 253 | 16,046 | ||||||
AXA SA | 976 | 17,352 | ||||||
Capgemini SE | 281 | 26,376 | ||||||
EssilorLuxottica SA | 174 | 21,578 | ||||||
Legrand SA | 383 | 25,670 | ||||||
L’Oreal SA | 131 | 38,002 | ||||||
LVMH Moet Hennessy Louis Vuitton SE | 120 | 46,491 | ||||||
Orange SA | 2,029 | 24,653 | ||||||
Pernod Ricard SA | 190 | 28,952 | ||||||
Safran SA | 208 | 19,302 | ||||||
Schneider Electric SE * (a) | 435 | 40,244 | ||||||
TOTAL SA | 855 | 30,361 | ||||||
|
| |||||||
| 352,510 | ||||||||
|
| |||||||
Germany — 8.1% | ||||||||
adidas AG | 119 | 27,153 | ||||||
Allianz SE (Registered) | 215 | 39,489 | ||||||
Deutsche Boerse AG | 189 | 29,319 | ||||||
Muenchener Rueckversicherungs-Gesellschaft AG (Registered) | 127 | 27,800 | ||||||
| INVESTMENTS | SHARES (000) | VALUE ($000) | ||||||
Germany — continued | ||||||||
SAP SE | 464 | 55,267 | ||||||
Symrise AG | 192 | 19,406 | ||||||
Vonovia SE | 368 | 18,209 | ||||||
|
| |||||||
| 216,643 | ||||||||
|
| |||||||
Hong Kong — 4.1% | ||||||||
AIA Group Ltd. | 6,919 | 63,503 | ||||||
CK Asset Holdings Ltd. | 3,195 | 20,185 | ||||||
Hong Kong Exchanges & Clearing Ltd. | 796 | 25,509 | ||||||
|
| |||||||
| 109,197 | ||||||||
|
| |||||||
India — 1.2% | ||||||||
HDFC Bank Ltd., ADR | 768 | 33,304 | ||||||
|
| |||||||
Japan — 15.4% | ||||||||
Daikin Industries Ltd. | 257 | 32,917 | ||||||
FANUC Corp. | 125 | 20,418 | ||||||
Hoya Corp. | 297 | 27,094 | ||||||
Kao Corp. | 532 | 41,041 | ||||||
Keyence Corp. | 141 | 50,446 | ||||||
Komatsu Ltd. | 1,408 | 26,641 | ||||||
Kubota Corp. | 2,208 | 27,418 | ||||||
Makita Corp. | 715 | 23,292 | ||||||
Mitsui Fudosan Co. Ltd. | 771 | 14,184 | ||||||
Nidec Corp. | 452 | 26,289 | ||||||
Shin-Etsu Chemical Co. Ltd. | 348 | 38,374 | ||||||
SMC Corp. | 65 | 29,336 | ||||||
Sony Corp. | 817 | 52,603 | ||||||
|
| |||||||
| 410,053 | ||||||||
|
| |||||||
Macau — 0.9% | ||||||||
Sands China Ltd. | 5,658 | 22,908 | ||||||
|
| |||||||
Netherlands — 4.3% | ||||||||
ASML Holding NV (a) | 200 | 58,513 | ||||||
ING Groep NV | 3,183 | 17,832 | ||||||
Royal Dutch Shell plc, Class A | 2,300 | 37,863 | ||||||
|
| |||||||
| 114,208 | ||||||||
|
| |||||||
Singapore — 1.0% | ||||||||
DBS Group Holdings Ltd. | 1,937 | 27,271 | ||||||
|
| |||||||
South Korea — 1.5% | ||||||||
Samsung Electronics Co. Ltd., GDR (b) | 37 | 38,094 | ||||||
Samsung Electronics Co. Ltd., GDR (b) | 1 | 1,236 | ||||||
|
| |||||||
| 39,330 | ||||||||
|
| |||||||
Spain — 1.0% | ||||||||
Industria de Diseno Textil SA | 1,083 | 27,747 | ||||||
|
| |||||||
SEE NOTES TO FINANCIAL STATEMENTS.
| APRIL 30, 2020 | J.P. MORGAN INTERNATIONAL EQUITY FUNDS | 41 | ||||||
Table of Contents
JPMorgan International Equity Fund
SCHEDULE OF PORTFOLIO INVESTMENTS
AS OF APRIL 30, 2020 (Unaudited) (continued)
| INVESTMENTS | SHARES (000) | VALUE ($000) | ||||||
Common Stocks — continued | ||||||||
Sweden — 2.4% | ||||||||
Atlas Copco AB, Class A | 969 | 33,407 | ||||||
Svenska Handelsbanken AB, Class A * | 3,376 | 30,817 | ||||||
|
| |||||||
| 64,224 | ||||||||
|
| |||||||
Switzerland — 13.8% | ||||||||
Cie Financiere Richemont SA (Registered) | 373 | 21,175 | ||||||
LafargeHolcim Ltd. (Registered) * | 819 | 34,010 | ||||||
Lonza Group AG (Registered) * | 30 | 13,235 | ||||||
Nestle SA (Registered) | 1,053 | 111,503 | ||||||
Novartis AG (Registered) | 849 | 72,426 | ||||||
Roche Holding AG | 280 | 97,104 | ||||||
SGS SA (Registered) | 8 | 18,339 | ||||||
|
| |||||||
| 367,792 | ||||||||
|
| |||||||
Taiwan — 1.6% | ||||||||
Taiwan Semiconductor Manufacturing Co. | 818 | 43,455 | ||||||
|
| |||||||
United Kingdom — 14.8% | ||||||||
Burberry Group plc | 1,362 | 23,657 | ||||||
Diageo plc | 1,615 | 55,587 | ||||||
GlaxoSmithKline plc | 3,004 | 62,661 | ||||||
Legal & General Group plc | 11,556 | 29,711 | ||||||
Linde plc (a) | 188 | 34,722 | ||||||
London Stock Exchange Group plc | 270 | 25,277 | ||||||
Persimmon plc | 964 | 26,716 | ||||||
Prudential plc | 2,073 | 29,239 | ||||||
RELX plc | 1,435 | 32,655 | ||||||
Smith & Nephew plc | 1,370 | 26,805 | ||||||
Unilever plc | 907 | 46,710 | ||||||
|
| |||||||
| 393,740 | ||||||||
|
| |||||||
United States — 1.2% | ||||||||
Ferguson plc | 445 | 32,095 | ||||||
|
| |||||||
Total Common Stocks | 2,626,021 | |||||||
|
| |||||||
Short-Term Investments — 5.3% | ||||||||
Investment Companies — 1.1% | ||||||||
JPMorgan Prime Money Market Fund Class Institutional Shares, 0.63% (c) (d) | 28,670 | 28,692 | ||||||
|
| |||||||
| INVESTMENTS | SHARES (000) | VALUE ($000) | ||||||
Investment of Cash Collateral from Securities Loaned — 4.2% |
| |||||||
JPMorgan Securities Lending Money Market Fund Agency SL Class Shares, 0.77% (c) (d) | 69,011 | 69,025 | ||||||
JPMorgan U.S. Government Money Market Fund Class IM Shares, 0.23% (c) (d) | 42,530 | 42,530 | ||||||
|
| |||||||
Total Investment of Cash Collateral from Securities Loaned | 111,555 | |||||||
|
| |||||||
Total Short-Term Investments | 140,247 | |||||||
|
| |||||||
Total Investments — 103.7% | 2,766,268 | |||||||
Liabilities in Excess of | (98,814 | ) | ||||||
|
| |||||||
NET ASSETS — 100.0% | 2,667,454 | |||||||
|
| |||||||
Percentages indicated are based on net assets.
SEE NOTES TO FINANCIAL STATEMENTS.
| 42 | J.P. MORGAN INTERNATIONAL EQUITY FUNDS | APRIL 30, 2020 | ||||
Table of Contents
Summary of Investments by Industry, April 30, 2020
The following table represents the portfolio investments of the Fund by industry classifications as a percentage of total investments:
| INDUSTRY | PERCENTAGE | |||
Pharmaceuticals | 10.6 | % | ||
Insurance | 8.6 | |||
Machinery | 7.0 | |||
Banks | 5.9 | |||
Textiles, Apparel & Luxury Goods | 5.1 | |||
Personal Products | 4.6 | |||
Beverages | 4.1 | |||
Food Products | 4.0 | |||
Semiconductors & Semiconductor Equipment | 3.7 | |||
Chemicals | 3.3 | |||
Electrical Equipment | 3.3 | |||
Capital Markets | 2.9 | |||
Household Durables | 2.9 | |||
Metals & Mining | 2.6 | |||
Oil, Gas & Consumable Fuels | 2.5 | |||
Software | 2.0 | |||
Health Care Equipment & Supplies | 2.0 | |||
Real Estate Management & Development | 1.9 | |||
Professional Services | 1.8 | |||
Electronic Equipment, Instruments & Components | 1.8 | |||
Hotels, Restaurants & Leisure | 1.5 | |||
Technology Hardware, Storage & Peripherals | 1.4 | |||
Internet & Direct Marketing Retail | 1.4 | |||
Aerospace & Defense | 1.3 | |||
Construction Materials | 1.2 | |||
Building Products | 1.2 | |||
Trading Companies & Distributors | 1.2 | |||
Interactive Media & Services | 1.0 | |||
Specialty Retail | 1.0 | |||
IT Services | 1.0 | |||
Others (each less than 1.0%) | 2.2 | |||
Short-Term Investments | 5.0 | |||
Abbreviations
| ADR | American Depositary Receipt | |
| GDR | Global Depositary Receipt | |
| OYJ | Public Limited Company | |
| (a) | The security or a portion of this security is on loan at April 30, 2020. The total value of securities on loan at April 30, 2020 is approximately $104,180,000. | |
| (b) | Security exempt from registration pursuant to Regulation S under the Securities Act of 1933, as amended. Regulation S applies to securities offerings that are made outside of the United States and do not involve direct selling efforts in the United States and as such may have restrictions on resale. | |
| (c) | Investment in an affiliated fund, which is registered under the Investment Company Act of 1940, as amended, and is advised by J.P. Morgan Investment Management Inc. | |
| (d) | The rate shown is the current yield as of April 30, 2020. | |
| * | Non-income producing security. | |
SEE NOTES TO FINANCIAL STATEMENTS.
| APRIL 30, 2020 | J.P. MORGAN INTERNATIONAL EQUITY FUNDS | 43 | ||||||
Table of Contents
JPMorgan International Focus Fund
(formerly known as JPMorgan International Unconstrained Equity Fund)
SCHEDULE OF PORTFOLIO INVESTMENTS
AS OF APRIL 30, 2020 (Unaudited)
| INVESTMENTS | SHARES (000) | VALUE ($000) | ||||||
Common Stocks — 97.8% |
| |||||||
Australia — 2.0% |
| |||||||
BHP Group plc | 3,016 | 50,620 | ||||||
|
| |||||||
Belgium — 1.5% |
| |||||||
KBC Group NV | 718 | 38,927 | ||||||
|
| |||||||
Canada — 6.7% |
| |||||||
Alimentation Couche-Tard, Inc., Class B | 1,483 | 41,372 | ||||||
Canadian National Railway Co. | 571 | 47,220 | ||||||
Canadian Pacific Railway Ltd. | 208 | 47,210 | ||||||
Toronto-Dominion Bank (The) | 828 | 34,610 | ||||||
|
| |||||||
| 170,412 | ||||||||
|
| |||||||
China — 9.9% |
| |||||||
Alibaba Group Holding Ltd., ADR * | 391 | 79,313 | ||||||
Ping An Insurance Group Co. of China Ltd., Class H | 7,605 | 77,385 | ||||||
Tencent Holdings Ltd. | 1,804 | 94,830 | ||||||
|
| |||||||
| 251,528 | ||||||||
|
| |||||||
Denmark — 2.7% |
| |||||||
Novo Nordisk A/S, Class B | 1,085 | 69,229 | ||||||
|
| |||||||
Finland — 1.3% |
| |||||||
Kone OYJ, Class B | 542 | 32,832 | ||||||
|
| |||||||
France — 6.6% |
| |||||||
LVMH Moet Hennessy Louis Vuitton SE | 157 | 60,546 | ||||||
Safran SA | 560 | 52,021 | ||||||
Schneider Electric SE * (a) | 601 | 55,561 | ||||||
|
| |||||||
| 168,128 | ||||||||
|
| |||||||
Germany — 10.0% |
| |||||||
Allianz SE (Registered) | 266 | 48,975 | ||||||
Delivery Hero SE * (a) (b) | 736 | 62,413 | ||||||
Deutsche Boerse AG | 326 | 50,466 | ||||||
SAP SE | 505 | 60,160 | ||||||
Vonovia SE | 625 | 30,927 | ||||||
|
| |||||||
| 252,941 | ||||||||
|
| |||||||
Hong Kong — 3.5% |
| |||||||
AIA Group Ltd. | 9,546 | 87,611 | ||||||
|
| |||||||
India — 3.3% |
| |||||||
HDFC Bank Ltd., ADR | 1,925 | 83,453 | ||||||
|
| |||||||
Indonesia — 1.5% |
| |||||||
Bank Central Asia Tbk. PT | 21,608 | 37,428 | ||||||
|
| |||||||
Japan — 5.6% |
| |||||||
Keyence Corp. | 130 | 46,340 | ||||||
SMC Corp. | 92 | 41,767 | ||||||
Sony Corp. | 832 | 53,523 | ||||||
|
| |||||||
| 141,630 | ||||||||
|
| |||||||
| INVESTMENTS | SHARES (000) | VALUE ($000) | ||||||
Netherlands — 2.7% |
| |||||||
ASML Holding NV (a) | 233 | 68,076 | ||||||
|
| |||||||
South Korea — 2.5% |
| |||||||
Samsung Electronics Co. Ltd. | 1,520 | 62,511 | ||||||
|
| |||||||
Sweden — 3.0% |
| |||||||
Atlas Copco AB, Class A (a) | 928 | 31,989 | ||||||
Svenska Handelsbanken AB, Class A * | 4,842 | 44,199 | ||||||
|
| |||||||
| 76,188 | ||||||||
|
| |||||||
Switzerland — 11.0% |
| |||||||
LafargeHolcim Ltd. (Registered) * | 1,258 | 52,244 | ||||||
Nestle SA (Registered) | 1,179 | 124,820 | ||||||
Roche Holding AG | 209 | 72,501 | ||||||
SGS SA (Registered) | 13 | 29,272 | ||||||
|
| |||||||
| 278,837 | ||||||||
|
| |||||||
Taiwan — 2.7% |
| |||||||
Taiwan Semiconductor Manufacturing Co. Ltd., ADR | 1,296 | 68,847 | ||||||
|
| |||||||
United Kingdom — 19.8% |
| |||||||
Burberry Group plc | 1,558 | 27,052 | ||||||
Diageo plc | 1,544 | 53,170 | ||||||
GlaxoSmithKline plc | 3,393 | 70,794 | ||||||
InterContinental Hotels Group plc | 721 | 32,833 | ||||||
Legal & General Group plc | 18,370 | 47,229 | ||||||
Linde plc (a) | 248 | 45,769 | ||||||
London Stock Exchange Group plc | 430 | 40,217 | ||||||
Persimmon plc | 1,490 | 41,283 | ||||||
RELX plc | 1,874 | 42,655 | ||||||
Smith & Nephew plc | 2,365 | 46,275 | ||||||
Unilever NV | 1,119 | 55,727 | ||||||
|
| |||||||
| 503,004 | ||||||||
|
| |||||||
United States — 1.5% |
| |||||||
Ferguson plc | 539 | 38,881 | ||||||
|
| |||||||
Total Common Stocks | 2,481,083 | |||||||
|
| |||||||
Short-Term Investments — 7.2% |
| |||||||
Investment Companies — 1.3% |
| |||||||
JPMorgan Prime Money Market Fund Class Institutional Shares, 0.63% (c) (d) (Cost $32,695) | 32,698 | 32,724 | ||||||
|
| |||||||
SEE NOTES TO FINANCIAL STATEMENTS.
| 44 | J.P. MORGAN INTERNATIONAL EQUITY FUNDS | APRIL 30, 2020 | ||||
Table of Contents
| INVESTMENTS | SHARES (000) | VALUE ($000) | ||||||
Investment of Cash Collateral from Securities Loaned — 5.9% |
| |||||||
JPMorgan Securities Lending Money Market Fund Agency SL Class Shares, 0.77% (c) (d) | 123,991 | 124,016 | ||||||
JPMorgan U.S. Government Money Market Fund Class IM Shares, 0.23% (c) (d) | 25,034 | 25,034 | ||||||
|
| |||||||
Total Investment of Cash Collateral from Securities Loaned | 149,050 | |||||||
|
| |||||||
Total Short-term Investments | 181,774 | |||||||
|
| |||||||
Total Investments — 105.0% | 2,662,857 | |||||||
Liabilities in Excess of | (127,601 | ) | ||||||
|
| |||||||
NET ASSETS — 100.0% | 2,535,256 | |||||||
|
| |||||||
Percentages indicated are based on net assets.
Summary of Investments by Industry, April 30, 2020
The following table represents the portfolio investments of the Fund by industry classifications as a percentage of total investments:
| INDUSTRY | PERCENTAGE | |||
Insurance | 9.8 | % | ||
Banks | 9.0 | |||
Pharmaceuticals | 8.0 | |||
Internet & Direct Marketing Retail | 5.3 | |||
Semiconductors & Semiconductor Equipment | 5.1 | |||
Food Products | 4.7 | |||
Machinery | 4.0 | |||
Interactive Media & Services | 3.6 | |||
Household Durables | 3.6 | |||
Road & Rail | 3.5 | |||
Capital Markets | 3.4 | |||
| INDUSTRY | PERCENTAGE | |||
Textiles, Apparel & Luxury Goods | 3.3 | % | ||
Professional Services | 2.7 | |||
Technology Hardware, Storage & Peripherals | 2.3 | |||
Software | 2.3 | |||
Personal Products | 2.1 | |||
Electrical Equipment | 2.1 | |||
Beverages | 2.0 | |||
Construction Materials | 2.0 | |||
Aerospace & Defense | 1.9 | |||
Metals & Mining | 1.9 | |||
Electronic Equipment, Instruments & Components | 1.7 | |||
Health Care Equipment & Supplies | 1.7 | |||
Chemicals | 1.7 | |||
Food & Staples Retailing | 1.5 | |||
Trading Companies & Distributors | 1.5 | |||
Hotels, Restaurants & Leisure | 1.2 | |||
Real Estate Management & Development | 1.2 | |||
Short-Term Investments | 6.9 | |||
Abbreviations
| ADR | American Depositary Receipt | |
| OYJ | Public Limited Company | |
| PT | Limited liability company | |
| (a) | The security or a portion of this security is on loan at April 30, 2020. The total value of securities on loan at April 30, 2020 is approximately $139,159,000. | |
| (b) | Security exempt from registration pursuant to Regulation S under the Securities Act of 1933, as amended. Regulation S applies to securities offerings that are made outside of the United States and do not involve direct selling efforts in the United States and as such may have restrictions on resale. | |
| (c) | Investment in an affiliated fund, which is registered under the Investment Company Act of 1940, as amended, and is advised by J.P. Morgan Investment Management Inc. | |
| (d) | The rate shown is the current yield as of April 30, 2020. | |
| * | Non-income producing security. | |
SEE NOTES TO FINANCIAL STATEMENTS.
| APRIL 30, 2020 | J.P. MORGAN INTERNATIONAL EQUITY FUNDS | 45 | ||||||
Table of Contents
JPMorgan International Hedged Equity Fund
SCHEDULE OF PORTFOLIO INVESTMENTS
AS OF APRIL 30, 2020 (Unaudited)
| INVESTMENTS | SHARES (000) | VALUE ($000) | ||||||
Common Stocks — 104.2% |
| |||||||
Australia — 4.9% |
| |||||||
Australia & New Zealand Banking Group Ltd. | 59 | 643 | ||||||
BHP Group Ltd. | 39 | 796 | ||||||
Commonwealth Bank of Australia | 5 | 187 | ||||||
CSL Ltd. | 4 | 782 | ||||||
Dexus, REIT | 51 | 303 | ||||||
Goodman Group, REIT | 68 | 581 | ||||||
Macquarie Group Ltd. | 1 | 85 | ||||||
National Australia Bank Ltd. | 8 | 82 | ||||||
Rio Tinto Ltd. | 15 | 851 | ||||||
Rio Tinto plc | 5 | 245 | ||||||
Westpac Banking Corp. | 12 | 125 | ||||||
|
| |||||||
| 4,680 | ||||||||
|
| |||||||
Austria — 0.5% |
| |||||||
Erste Group Bank AG | 21 | 445 | ||||||
|
| |||||||
Denmark — 3.4% |
| |||||||
Carlsberg A/S, Class B | 3 | 334 | ||||||
Chr Hansen Holding A/S | 4 | 305 | ||||||
Novo Nordisk A/S, Class B | 31 | 1,961 | ||||||
Orsted A/S (a) | 7 | 677 | ||||||
|
| |||||||
| 3,277 | ||||||||
|
| |||||||
Finland — 0.6% |
| |||||||
Nokia OYJ | 54 | 195 | ||||||
UPM-Kymmene OYJ | 14 | 391 | ||||||
|
| |||||||
| 586 | ||||||||
|
| |||||||
France — 13.2% |
| |||||||
Accor SA | 9 | 241 | ||||||
Air Liquide SA | 13 | 1,647 | ||||||
Airbus SE * | 9 | 578 | ||||||
Alstom SA | 20 | 820 | ||||||
AXA SA | 15 | 261 | ||||||
BNP Paribas SA | 22 | 699 | ||||||
Capgemini SE | 6 | 585 | ||||||
L’Oreal SA | 1 | 265 | ||||||
LVMH Moet Hennessy Louis Vuitton SE | 3 | 1,254 | ||||||
Natixis SA | 6 | 15 | ||||||
Orange SA | 42 | 508 | ||||||
Safran SA | 7 | 624 | ||||||
Sanofi | 20 | 1,994 | ||||||
Schneider Electric SE * | 13 | 1,162 | ||||||
Sodexo SA | 1 | 91 | ||||||
Thales SA | 2 | 182 | ||||||
TOTAL SA | 26 | 936 | ||||||
Unibail-Rodamco-Westfield, REIT | 1 | 40 | ||||||
| INVESTMENTS | SHARES (000) | VALUE ($000) | ||||||
France — continued |
| |||||||
Vinci SA | 9 | 747 | ||||||
|
| |||||||
| 12,649 | ||||||||
|
| |||||||
Germany — 10.2% |
| |||||||
adidas AG | 5 | 1,070 | ||||||
Allianz SE (Registered) | 1 | 209 | ||||||
BASF SE | 4 | 186 | ||||||
Bayer AG (Registered) | 9 | 617 | ||||||
Brenntag AG | 15 | 698 | ||||||
Daimler AG (Registered) | — | (b) | 9 | |||||
Deutsche Boerse AG | 5 | 734 | ||||||
Deutsche Post AG (Registered) | 26 | 761 | ||||||
Deutsche Telekom AG (Registered) | 78 | 1,141 | ||||||
Deutsche Wohnen SE | 6 | 226 | ||||||
Henkel AG & Co. KGaA (Preference) | 3 | 288 | ||||||
Infineon Technologies AG | 48 | 896 | ||||||
SAP SE | 17 | 2,008 | ||||||
Siemens AG (Registered) | 3 | 272 | ||||||
Volkswagen AG (Preference) | 4 | 581 | ||||||
|
| |||||||
| 9,696 | ||||||||
|
| |||||||
Hong Kong — 2.2% |
| |||||||
AIA Group Ltd. | 134 | 1,226 | ||||||
CK Asset Holdings Ltd. | 63 | 398 | ||||||
Hong Kong Exchanges & Clearing Ltd. | 16 | 526 | ||||||
|
| |||||||
| 2,150 | ||||||||
|
| |||||||
Ireland — 1.0% |
| |||||||
CRH plc | 10 | 318 | ||||||
Ryanair Holdings plc, ADR * | 10 | 642 | ||||||
|
| |||||||
| 960 | ||||||||
|
| |||||||
Italy — 2.2% |
| |||||||
Assicurazioni Generali SpA | 5 | 72 | ||||||
Enel SpA | 204 | 1,393 | ||||||
FinecoBank Banca Fineco SpA * | 53 | 593 | ||||||
UniCredit SpA * | 8 | 61 | ||||||
|
| |||||||
| 2,119 | ||||||||
|
| |||||||
Japan — 24.9% |
| |||||||
Asahi Group Holdings Ltd. | 3 | 100 | ||||||
Bridgestone Corp. | 17 | 542 | ||||||
Central Japan Railway Co. | 4 | 629 | ||||||
Daicel Corp. | 37 | 300 | ||||||
Daikin Industries Ltd. | 8 | 1,001 | ||||||
Electric Power Development Co. Ltd. | 9 | 184 | ||||||
Hitachi Ltd. | 12 | 368 | ||||||
SEE NOTES TO FINANCIAL STATEMENTS.
| 46 | J.P. MORGAN INTERNATIONAL EQUITY FUNDS | APRIL 30, 2020 | ||||
Table of Contents
| INVESTMENTS | SHARES (000) | VALUE ($000) | ||||||
Common Stocks — continued | ||||||||
Japan — continued |
| |||||||
Honda Motor Co. Ltd. | 46 | 1,122 | ||||||
Japan Airlines Co. Ltd. | 6 | 98 | ||||||
Japan Tobacco, Inc. | 10 | 181 | ||||||
Kao Corp. | 18 | 1,350 | ||||||
Keyence Corp. | 4 | 1,321 | ||||||
Mabuchi Motor Co. Ltd. | 16 | 492 | ||||||
Marui Group Co. Ltd. | 22 | 357 | ||||||
Mitsubishi Corp. | 35 | 740 | ||||||
Mitsubishi UFJ Financial Group, Inc. | 206 | 833 | ||||||
Mitsui Fudosan Co. Ltd. | 37 | 680 | ||||||
Nichirei Corp. | 9 | 228 | ||||||
Nintendo Co. Ltd. | 4 | 1,445 | ||||||
Nippon Telegraph & Telephone Corp. | 54 | 1,230 | ||||||
Nitori Holdings Co. Ltd. | 3 | 521 | ||||||
Nomura Research Institute Ltd. | 9 | 220 | ||||||
Olympus Corp. | 19 | 294 | ||||||
Otsuka Corp. | 13 | 602 | ||||||
Otsuka Holdings Co. Ltd. | 21 | 818 | ||||||
Panasonic Corp. | 43 | 329 | ||||||
Persol Holdings Co. Ltd. | 14 | 166 | ||||||
Renesas Electronics Corp. * | 20 | 103 | ||||||
Seven & i Holdings Co. Ltd. | 15 | 490 | ||||||
SoftBank Group Corp. | 5 | 223 | ||||||
Sony Corp. | 11 | 695 | ||||||
Sumitomo Electric Industries Ltd. | 29 | 294 | ||||||
Sumitomo Mitsui Financial Group, Inc. | 27 | 697 | ||||||
T&D Holdings, Inc. | 28 | 242 | ||||||
Tokio Marine Holdings, Inc. | 17 | 798 | ||||||
Tokyo Gas Co. Ltd. | 10 | 226 | ||||||
Tokyu Corp. | 60 | 899 | ||||||
Toray Industries, Inc. | 57 | 262 | ||||||
Toyota Motor Corp. | 35 | 2,164 | ||||||
West Japan Railway Co. | 6 | 395 | ||||||
Yamato Holdings Co. Ltd. | 9 | 154 | ||||||
|
| |||||||
| 23,793 | ||||||||
|
| |||||||
Luxembourg — 0.2% | ||||||||
ArcelorMittal SA | 14 | 150 | ||||||
|
| |||||||
Netherlands — 4.9% | ||||||||
Akzo Nobel NV | 11 | 851 | ||||||
ASML Holding NV | 7 | 2,126 | ||||||
Heineken NV | 4 | 342 | ||||||
ING Groep NV | 71 | 399 | ||||||
Koninklijke Philips NV | 4 | 191 | ||||||
Royal Dutch Shell plc, Class A | 34 | 564 | ||||||
| INVESTMENTS | SHARES (000) | VALUE ($000) | ||||||
Netherlands — continued | ||||||||
Royal Dutch Shell plc, Class B | 15 | 234 | ||||||
|
| |||||||
| 4,707 | ||||||||
|
| |||||||
Norway — 0.9% | ||||||||
Telenor ASA | 54 | 835 | ||||||
|
| |||||||
Singapore — 0.9% | ||||||||
DBS Group Holdings Ltd. | 53 | 739 | ||||||
United Overseas Bank Ltd. | 6 | 92 | ||||||
|
| |||||||
| 831 | ||||||||
|
| |||||||
Spain — 3.4% | ||||||||
Banco Santander SA | 125 | 279 | ||||||
Bankia SA | 158 | 161 | ||||||
Iberdrola SA | 151 | 1,503 | ||||||
Industria de Diseno Textil SA | 45 | 1,141 | ||||||
Telefonica SA | 33 | 150 | ||||||
|
| |||||||
| 3,234 | ||||||||
|
| |||||||
Sweden — 1.4% | ||||||||
Lundin Energy AB | 24 | 606 | ||||||
Svenska Handelsbanken AB, Class A * | 79 | 725 | ||||||
|
| |||||||
| 1,331 | ||||||||
|
| |||||||
Switzerland — 12.3% | ||||||||
Adecco Group AG (Registered) | 4 | 187 | ||||||
Cie Financiere Richemont SA (Registered) | 9 | 533 | ||||||
Credit Suisse Group AG (Registered) * | 37 | 339 | ||||||
LafargeHolcim Ltd. (Registered) * | 19 | 787 | ||||||
Nestle SA (Registered) | 37 | 3,931 | ||||||
Novartis AG (Registered) | 29 | 2,438 | ||||||
Roche Holding AG | 9 | 3,045 | ||||||
Swiss Re AG | 7 | 487 | ||||||
|
| |||||||
| 11,747 | ||||||||
|
| |||||||
United Kingdom — 16.7% | ||||||||
3i Group plc | 85 | 831 | ||||||
AstraZeneca plc | 8 | 846 | ||||||
Aviva plc | 22 | 66 | ||||||
Barratt Developments plc | 69 | 450 | ||||||
Beazley plc | 39 | 191 | ||||||
BP plc | 317 | 1,248 | ||||||
British American Tobacco plc | 37 | 1,445 | ||||||
Burberry Group plc | 14 | 248 | ||||||
CK Hutchison Holdings Ltd. | 50 | 371 | ||||||
Diageo plc | 44 | 1,524 | ||||||
GlaxoSmithKline plc | 70 | 1,452 | ||||||
HSBC Holdings plc | 103 | 527 | ||||||
SEE NOTES TO FINANCIAL STATEMENTS.
| APRIL 30, 2020 | J.P. MORGAN INTERNATIONAL EQUITY FUNDS | 47 | ||||||
Table of Contents
JPMorgan International Hedged Equity Fund
SCHEDULE OF PORTFOLIO INVESTMENTS
AS OF APRIL 30, 2020 (Unaudited) (continued)
| INVESTMENTS | SHARES (000) | VALUE ($000) | ||||||
Common Stocks — continued | ||||||||
United Kingdom — continued | ||||||||
InterContinental Hotels Group plc | 21 | 944 | ||||||
ITV plc | 41 | 39 | ||||||
Lloyds Banking Group plc | 1,444 | 584 | ||||||
M&G plc | 237 | 393 | ||||||
Prudential plc | 57 | 803 | ||||||
RELX plc | 36 | 812 | ||||||
Standard Chartered plc | 100 | 512 | ||||||
Taylor Wimpey plc | 244 | 450 | ||||||
Tesco plc | 218 | 645 | ||||||
Unilever NV | 29 | 1,446 | ||||||
Whitbread plc | 3 | 121 | ||||||
|
| |||||||
| 15,948 | ||||||||
|
| |||||||
United States — 0.4% | ||||||||
Ferguson plc | 5 | 353 | ||||||
|
| |||||||
Total Common Stocks | 99,491 | |||||||
|
| |||||||
| NO. OF CONTRACTS | ||||||||
Options Purchased — 0.7% |
| |||||||
Put Options Purchased — 0.7% |
| |||||||
United States — 0.7% |
| |||||||
MSCI EAFE Index 6/19/2020 at USD 1,350.00, European Style Notional Amount: USD 104,600 Exchange-Traded * | 631 | 637 | ||||||
|
| |||||||
| SHARES (000) | ||||||||
Short-Term Investments — 0.9% |
| |||||||
Investment Companies — 0.9% |
| |||||||
JPMorgan U.S. Government Money Market Fund Class Institutional Shares, 0.17% (c) (d) | 854 | 854 | ||||||
|
| |||||||
Total Investments — 105.8% | 100,982 | |||||||
Liabilities in Excess of | (5,515 | ) | ||||||
|
| |||||||
NET ASSETS — 100.0% | 95,467 | |||||||
|
| |||||||
Percentages indicated are based on net assets.
Summary of Investments by Industry, April 30, 2020
The following table represents the portfolio investments of the Fund by industry classifications as a percentage of total investments:
| INDUSTRY | PERCENTAGE | |||
Pharmaceuticals | 13.1 | % | ||
Banks | 8.3 | |||
Insurance | 4.3 | |||
Food Products | 4.1 | |||
Automobiles | 3.8 | |||
Diversified Telecommunication Services | 3.8 | |||
Oil, Gas & Consumable Fuels | 3.6 | |||
Electric Utilities | 3.5 | |||
Chemicals | 3.5 | |||
Semiconductors & Semiconductor Equipment | 3.1 | |||
Textiles, Apparel & Luxury Goods | 3.1 | |||
Personal Products | 3.0 | |||
Capital Markets | 2.5 | |||
Beverages | 2.3 | |||
Metals & Mining | 2.0 | |||
Software | 2.0 | |||
Household Durables | 1.9 | |||
Road & Rail | 1.9 | |||
Trading Companies & Distributors | 1.8 | |||
Electronic Equipment, Instruments & Components | 1.7 | |||
Specialty Retail | 1.7 | |||
Electrical Equipment | 1.6 | |||
Tobacco | 1.6 | |||
Entertainment | 1.4 | |||
IT Services | 1.4 | |||
Hotels, Restaurants & Leisure | 1.4 | |||
Aerospace & Defense | 1.4 | |||
Real Estate Management & Development | 1.3 | |||
Professional Services | 1.2 | |||
Food & Staples Retailing | 1.1 | |||
Construction Materials | 1.1 | |||
Building Products | 1.0 | |||
Others (each less than 1.0%) | 9.7 | |||
Short-Term Investments | 0.8 | |||
SEE NOTES TO FINANCIAL STATEMENTS.
| 48 | J.P. MORGAN INTERNATIONAL EQUITY FUNDS | APRIL 30, 2020 | ||||
Table of Contents
Abbreviations
| ADR | American Depositary Receipt | |
| EAFE | Europe, Australasia and Far East | |
| MSCI | Morgan Stanley Capital International | |
| OYJ | Public Limited Company | |
| Preference | A special type of equity investment that shares in the earnings of the company, has limited voting rights, and may have a dividend preference. Preference shares may also have liquidation preference. | |
| REIT | Real Estate Investment Trust | |
| USD | United States Dollar |
| (a) | Security exempt from registration pursuant to Regulation S under the Securities Act of 1933, as amended. Regulation S applies to securities offerings that are made outside of the United States and do not involve direct selling efforts in the United States and as such may have restrictions on resale. | |
| (b) | Amount rounds to less than one thousand. | |
| (c) | Investment in an affiliated fund, which is registered under the Investment Company Act of 1940, as amended, and is advised by J.P. Morgan Investment Management Inc. | |
| (d) | The rate shown is the current yield as of April 30, 2020. | |
| * | Non-income producing security. |
| Futures contracts outstanding as of April 30, 2020 (amounts in thousands, except number of contracts): | ||||||||||||||||||||
| DESCRIPTION | NUMBER OF CONTRACTS | EXPIRATION DATE | TRADING CURRENCY | NOTIONAL AMOUNT ($) | VALUE AND UNREALIZED APPRECIATION (DEPRECIATION) ($) | |||||||||||||||
Long Contracts |
| |||||||||||||||||||
| EURO STOXX 50 Index | 13 | 06/2020 | EUR | 410 | 13 | |||||||||||||||
| FTSE 100 Index | 2 | 06/2020 | GBP | 148 | 5 | |||||||||||||||
| SPI 200 Index | 20 | 06/2020 | AUD | 1,767 | 126 | |||||||||||||||
| TOPIX Index | 9 | 06/2020 | JPY | 1,219 | 104 | |||||||||||||||
|
| |||||||||||||||||||
| 248 | ||||||||||||||||||||
|
| |||||||||||||||||||
| Abbreviations | ||
| AUD | Australian Dollar | |
| EUR | Euro | |
| FTSE | Financial Times and the London Stock Exchange | |
| GBP | British Pound | |
| JPY | Japanese Yen | |
| SPI | Australian Securities Exchange | |
| TOPIX | Tokyo Stock Price Index | |
| Written Call Options Contracts as of April 30, 2020 (amounts in thousands, except number of contracts): | ||||||||||||||||||||||
| DESCRIPTION | COUNTERPARTY | NUMBER OF CONTRACTS | NOTIONAL AMOUNT | EXERCISE PRICE | EXPIRATION DATE | VALUE ($) | ||||||||||||||||
| MSCI EAFE Index | Exchange-Traded | 631 | USD 104,600 | USD 1,510.00 | 6/19/2020 | (9,771 | ) | |||||||||||||||
|
| |||||||||||||||||||||
| Written Put Options Contracts as of April 30, 2020 (amounts in thousands, except number of contracts): | ||||||||||||||||||||||
| DESCRIPTION | COUNTERPARTY | NUMBER OF CONTRACTS | NOTIONAL AMOUNT | EXERCISE PRICE | EXPIRATION DATE | VALUE ($) | ||||||||||||||||
| MSCI EAFE Index | Exchange-Traded | 631 | USD 104,600 | USD 1,125.00 | 6/19/2020 | (110 | ) | |||||||||||||||
|
| |||||||||||||||||||||
Total Written Options Contracts (Premiums Received $7,118) |
| (9,881 | ) | |||||||||||||||||||
|
| |||||||||||||||||||||
| Abbreviations | ||
| EAFE | Europe, Australasia, and Far East | |
| MSCI | Morgan Stanley Capital International | |
| USD | United States Dollar | |
SEE NOTES TO FINANCIAL STATEMENTS.
| APRIL 30, 2020 | J.P. MORGAN INTERNATIONAL EQUITY FUNDS | 49 | ||||||
Table of Contents
JPMorgan International Research Enhanced Equity Fund
SCHEDULE OF PORTFOLIO INVESTMENTS
AS OF APRIL 30, 2020 (Unaudited)
| INVESTMENTS | SHARES (000) | VALUE ($000) | ||||||
Common Stocks — 95.1% |
| |||||||
Australia — 4.5% |
| |||||||
Australia & New Zealand Banking Group Ltd. | 2,448 | 26,592 | ||||||
BHP Group Ltd. | 1,612 | 32,916 | ||||||
Commonwealth Bank of Australia | 194 | 7,822 | ||||||
CSL Ltd. | 162 | 32,265 | ||||||
Dexus, REIT | 2,108 | 12,514 | ||||||
Goodman Group, REIT | 2,817 | 23,994 | ||||||
Macquarie Group Ltd. | 55 | 3,675 | ||||||
National Australia Bank Ltd. | 325 | 3,566 | ||||||
Rio Tinto Ltd. | 623 | 35,130 | ||||||
Rio Tinto plc | 222 | 10,301 | ||||||
Westpac Banking Corp. | 504 | 5,249 | ||||||
|
| |||||||
| 194,024 | ||||||||
|
| |||||||
Austria — 0.4% |
| |||||||
Erste Group Bank AG | 849 | 18,394 | ||||||
IMMOFINANZ AG * | 1 | 26 | ||||||
|
| |||||||
| 18,420 | ||||||||
| �� | |||||||
Denmark — 3.1% |
| |||||||
Carlsberg A/S, Class B | 109 | 13,727 | ||||||
Chr Hansen Holding A/S (a) | 136 | 11,707 | ||||||
Novo Nordisk A/S, Class B | 1,267 | 80,841 | ||||||
Orsted A/S (b) | 277 | 28,002 | ||||||
|
| |||||||
| 134,277 | ||||||||
|
| |||||||
Finland — 0.6% |
| |||||||
Nokia OYJ | 2,225 | 8,022 | ||||||
UPM-Kymmene OYJ | 591 | 16,199 | ||||||
|
| |||||||
| 24,221 | ||||||||
|
| |||||||
France — 12.2% |
| |||||||
Accor SA | 357 | 9,926 | ||||||
Air Liquide SA (a) | 533 | 67,740 | ||||||
Airbus SE * | 378 | 23,909 | ||||||
Alstom SA | 827 | 33,926 | ||||||
AXA SA | 606 | 10,769 | ||||||
BNP Paribas SA | 920 | 28,903 | ||||||
Capgemini SE | 257 | 24,186 | ||||||
L’Oreal SA | 37 | 10,881 | ||||||
LVMH Moet Hennessy Louis Vuitton SE | 135 | 52,307 | ||||||
Natixis SA | 278 | 656 | ||||||
Orange SA | 1,731 | 21,029 | ||||||
Safran SA | 277 | 25,756 | ||||||
Sanofi (a) | 845 | 82,492 | ||||||
Schneider Electric SE * (a) | 520 | 48,072 | ||||||
Sodexo SA (a) | 47 | 3,719 | ||||||
Thales SA | 99 | 7,531 | ||||||
| INVESTMENTS | SHARES (000) | VALUE ($000) | ||||||
France — continued |
| |||||||
TOTAL SA | 1,089 | 38,650 | ||||||
Unibail-Rodamco-Westfield, REIT | 28 | 1,658 | ||||||
Vinci SA | 375 | 30,742 | ||||||
|
| |||||||
| 522,852 | ||||||||
|
| |||||||
Germany — 9.3% |
| |||||||
adidas AG | 194 | 44,319 | ||||||
Allianz SE (Registered) | 48 | 8,755 | ||||||
BASF SE | 153 | 7,827 | ||||||
Bayer AG (Registered) | 388 | 25,532 | ||||||
Brenntag AG | 638 | 28,874 | ||||||
Daimler AG (Registered) (a) | 17 | 594 | ||||||
Deutsche Boerse AG | 195 | 30,281 | ||||||
Deutsche Post AG (Registered) | 1,060 | 31,490 | ||||||
Deutsche Telekom AG (Registered) | 3,203 | 46,829 | ||||||
Deutsche Wohnen SE | 230 | 9,310 | ||||||
Henkel AG & Co. KGaA (Preference) | 124 | 11,049 | ||||||
Infineon Technologies AG | 1,990 | 36,991 | ||||||
SAP SE | 697 | 82,987 | ||||||
Siemens AG (Registered) | 124 | 11,476 | ||||||
Volkswagen AG (Preference) | 172 | 23,954 | ||||||
|
| |||||||
| 400,268 | ||||||||
|
| |||||||
Hong Kong — 2.0% |
| |||||||
AIA Group Ltd. | 5,476 | 50,254 | ||||||
CK Asset Holdings Ltd. | 2,506 | 15,835 | ||||||
Hong Kong Exchanges & Clearing Ltd. | 657 | 21,065 | ||||||
I-CABLE Communications Ltd. * | 254 | 2 | ||||||
|
| |||||||
| 87,156 | ||||||||
|
| |||||||
Ireland — 0.9% |
| |||||||
CRH plc | 439 | 13,321 | ||||||
Ryanair Holdings plc, ADR * | 418 | 26,550 | ||||||
|
| |||||||
| 39,871 | ||||||||
|
| |||||||
Italy — 2.0% |
| |||||||
Assicurazioni Generali SpA | 208 | 2,964 | ||||||
Enel SpA | 8,450 | 57,719 | ||||||
FinecoBank Banca Fineco SpA * (a) | 2,198 | 24,492 | ||||||
UniCredit SpA * | 341 | 2,634 | ||||||
|
| |||||||
| 87,809 | ||||||||
|
| |||||||
Japan — 22.6% |
| |||||||
Asahi Group Holdings Ltd. | 107 | 3,665 | ||||||
Bridgestone Corp. | 696 | 21,658 | ||||||
Central Japan Railway Co. | 147 | 23,131 | ||||||
Daicel Corp. | 1,533 | 12,441 | ||||||
SEE NOTES TO FINANCIAL STATEMENTS.
| 50 | J.P. MORGAN INTERNATIONAL EQUITY FUNDS | APRIL 30, 2020 | ||||
Table of Contents
| INVESTMENTS | SHARES (000) | VALUE ($000) | ||||||
Common Stocks — continued | ||||||||
Japan — continued |
| |||||||
Daikin Industries Ltd. | 310 | 39,820 | ||||||
Electric Power Development Co. Ltd. | 376 | 7,516 | ||||||
Hitachi Ltd. | 486 | 14,418 | ||||||
Honda Motor Co. Ltd. | 1,888 | 45,851 | ||||||
Japan Airlines Co. Ltd. | 226 | 4,030 | ||||||
Japan Tobacco, Inc. | 363 | 6,764 | ||||||
Kao Corp. | 722 | 55,647 | ||||||
Keyence Corp. | 157 | 56,158 | ||||||
Mabuchi Motor Co. Ltd. | 655 | 20,276 | ||||||
Marui Group Co. Ltd. | 880 | 14,408 | ||||||
Mitsubishi Corp. | 1,426 | 30,251 | ||||||
Mitsubishi UFJ Financial Group, Inc. | 8,429 | 34,055 | ||||||
Mitsui Fudosan Co. Ltd. | 1,509 | 27,750 | ||||||
Nichirei Corp. | 359 | 8,968 | ||||||
Nintendo Co. Ltd. | 141 | 58,305 | ||||||
Nippon Telegraph & Telephone Corp. | 2,222 | 50,592 | ||||||
Nitori Holdings Co. Ltd. | 146 | 22,409 | ||||||
Nomura Research Institute Ltd. | 370 | 9,053 | ||||||
Olympus Corp. | 748 | 11,875 | ||||||
Otsuka Corp. | 584 | 26,433 | ||||||
Otsuka Holdings Co. Ltd. | 937 | 36,840 | ||||||
Panasonic Corp. | 1,736 | 13,233 | ||||||
Persol Holdings Co. Ltd. | 584 | 6,715 | ||||||
Renesas Electronics Corp. * | 792 | 4,179 | ||||||
Seven & i Holdings Co. Ltd. | 611 | 20,218 | ||||||
SoftBank Group Corp. | 207 | 8,873 | ||||||
Sony Corp. | 441 | 28,385 | ||||||
Sumitomo Electric Industries Ltd. | 1,176 | 12,095 | ||||||
Sumitomo Mitsui Financial Group, Inc. | 1,075 | 28,256 | ||||||
T&D Holdings, Inc. | 1,139 | 9,843 | ||||||
Tokio Marine Holdings, Inc. | 693 | 32,527 | ||||||
Tokyo Gas Co. Ltd. | 435 | 9,535 | ||||||
Tokyu Corp. | 2,424 | 36,486 | ||||||
Toray Industries, Inc. | 2,314 | 10,609 | ||||||
Toyota Motor Corp. | 1,413 | 87,350 | ||||||
West Japan Railway Co. | 245 | 15,140 | ||||||
Yamato Holdings Co. Ltd. | 353 | 6,165 | ||||||
|
| |||||||
| 971,923 | ||||||||
|
| |||||||
Luxembourg — 0.2% |
| |||||||
ArcelorMittal SA | 569 | 6,219 | ||||||
|
| |||||||
Malta — 0.0%(c) |
| |||||||
BGP Holdings plc * ‡ | 449 | 1 | ||||||
|
| |||||||
Netherlands — 4.5% |
| |||||||
Akzo Nobel NV | 463 | 35,163 | ||||||
| INVESTMENTS | SHARES (000) | VALUE ($000) | ||||||
Netherlands — continued |
| |||||||
ASML Holding NV (a) | 295 | 86,171 | ||||||
Heineken NV (a) | 166 | 14,086 | ||||||
ING Groep NV | 2,946 | 16,505 | ||||||
Koninklijke Philips NV | 182 | 7,938 | ||||||
Royal Dutch Shell plc, Class A | 1,414 | 23,274 | ||||||
Royal Dutch Shell plc, Class B | 609 | 9,745 | ||||||
|
| |||||||
| 192,882 | ||||||||
|
| |||||||
Norway — 0.8% |
| |||||||
Telenor ASA | 2,338 | 35,863 | ||||||
|
| |||||||
Singapore — 0.8% |
| |||||||
DBS Group Holdings Ltd. | 2,149 | 30,255 | ||||||
United Overseas Bank Ltd. | 256 | 3,658 | ||||||
|
| |||||||
| 33,913 | ||||||||
|
| |||||||
Spain — 3.1% |
| |||||||
Banco Santander SA | 5,174 | 11,560 | ||||||
Bankia SA | 6,546 | 6,661 | ||||||
Iberdrola SA | 6,245 | 62,124 | ||||||
Industria de Diseno Textil SA | 1,843 | 47,209 | ||||||
Telefonica SA | 1,378 | 6,302 | ||||||
|
| |||||||
| 133,856 | ||||||||
|
| |||||||
Sweden — 1.3% |
| |||||||
Lundin Energy AB (a) | 974 | 25,065 | ||||||
Svenska Handelsbanken AB, Class A * | 3,285 | 29,982 | ||||||
|
| |||||||
| 55,047 | ||||||||
|
| |||||||
Switzerland — 11.2% |
| |||||||
Adecco Group AG (Registered) | 175 | 7,679 | ||||||
Cie Financiere Richemont SA (Registered) | 388 | 22,010 | ||||||
Credit Suisse Group AG (Registered) * | 1,532 | 13,987 | ||||||
LafargeHolcim Ltd. (Registered) * | 782 | 32,480 | ||||||
Nestle SA (Registered) | 1,525 | 161,503 | ||||||
Novartis AG (Registered) | 1,163 | 99,290 | ||||||
Roche Holding AG | 362 | 125,394 | ||||||
Swiss Re AG (a) | 277 | 20,138 | ||||||
|
| |||||||
| 482,481 | ||||||||
|
| |||||||
United Kingdom — 15.3% |
| |||||||
3i Group plc | 3,504 | 34,420 | ||||||
AstraZeneca plc | 334 | 34,948 | ||||||
Aviva plc | 901 | 2,725 | ||||||
Barratt Developments plc | 2,853 | 18,603 | ||||||
Beazley plc | 1,479 | 7,315 | ||||||
BP plc | 13,097 | 51,608 | ||||||
British American Tobacco plc | 1,562 | 60,223 | ||||||
SEE NOTES TO FINANCIAL STATEMENTS.
| APRIL 30, 2020 | J.P. MORGAN INTERNATIONAL EQUITY FUNDS | 51 | ||||||
Table of Contents
JPMorgan International Research Enhanced Equity Fund
SCHEDULE OF PORTFOLIO INVESTMENTS
AS OF APRIL 30, 2020 (Unaudited) (continued)
| INVESTMENTS | SHARES (000) | VALUE ($000) | ||||||
Common Stocks — continued | ||||||||
United Kingdom — continued |
| |||||||
Burberry Group plc | 591 | 10,266 | ||||||
CK Hutchison Holdings Ltd. | 2,038 | 15,103 | ||||||
Diageo plc | 1,837 | 63,243 | ||||||
GlaxoSmithKline plc | 2,881 | 60,098 | ||||||
HSBC Holdings plc | 4,196 | 21,569 | ||||||
InterContinental Hotels Group plc | 851 | 38,786 | ||||||
ITV plc | 1,707 | 1,639 | ||||||
Lloyds Banking Group plc | 59,548 | 24,094 | ||||||
M&G plc | 9,790 | 16,230 | ||||||
Prudential plc | 2,358 | 33,265 | ||||||
RELX plc | 1,488 | 33,573 | ||||||
Standard Chartered plc | 4,130 | 21,101 | ||||||
Taylor Wimpey plc | 10,048 | 18,558 | ||||||
Tesco plc | 8,973 | 26,540 | ||||||
Unilever NV | 1,202 | 59,836 | ||||||
Whitbread plc | 138 | 5,165 | ||||||
|
| |||||||
| 658,908 | ||||||||
|
| |||||||
United States — 0.3% |
| |||||||
Ferguson plc | 202 | 14,574 | ||||||
|
| |||||||
Total Common Stocks | 4,094,565 | |||||||
|
| |||||||
Short-term Investments — 10.3% |
| |||||||
Investment Companies — 3.2% |
| |||||||
JPMorgan Prime Money Market Fund Class Institutional Shares, 0.63% (d) (e) | 138,222 | 138,332 | ||||||
|
| |||||||
Investment of Cash Collateral from Securities Loaned — 7.1% |
| |||||||
JPMorgan Securities Lending Money Market Fund Agency SL Class Shares, 0.77% (d) (e) | 132,004 | 132,031 | ||||||
JPMorgan U.S. Government Money Market Fund Class IM Shares, 0.23% (d) (e) | 173,313 | 173,313 | ||||||
|
| |||||||
Total Investment of Cash Collateral from Securities Loaned | 305,344 | |||||||
|
| |||||||
Total Short-Term Investments | 443,676 | |||||||
|
| |||||||
Total Investments — 105.4% | 4,538,241 | |||||||
Liabilities in Excess of | (234,531 | ) | ||||||
|
| |||||||
NET ASSETS — 100.0% | 4,303,710 | |||||||
|
| |||||||
Percentages indicated are based on net assets.
Summary of Investments by Industry, April 30, 2020
The following table represents the portfolio investments of the Fund by industry classifications as a percentage of total investments:
| INDUSTRY | PERCENTAGE | |||
Pharmaceuticals | 12.0 | % | ||
Banks | 7.6 | |||
Insurance | 3.9 | |||
Food Products | 3.8 | |||
Diversified Telecommunication Services | 3.5 | |||
Automobiles | 3.5 | |||
Oil, Gas & Consumable Fuels | 3.3 | |||
Electric Utilities | 3.3 | |||
Chemicals | 3.2 | |||
Textiles, Apparel & Luxury Goods | 2.8 | |||
Semiconductors & Semiconductor Equipment | 2.8 | |||
Personal Products | 2.8 | |||
Capital Markets | 2.3 | |||
Beverages | 2.1 | |||
Metals & Mining | 1.9 | |||
Software | 1.8 | |||
Household Durables | 1.7 | |||
Road & Rail | 1.6 | |||
Trading Companies & Distributors | 1.6 | |||
Electronic Equipment, Instruments & Components | 1.6 | |||
Specialty Retail | 1.5 | |||
Electrical Equipment | 1.5 | |||
Tobacco | 1.5 | |||
IT Services | 1.3 | |||
Entertainment | 1.3 | |||
Hotels, Restaurants & Leisure | 1.3 | |||
Aerospace & Defense | 1.3 | |||
Real Estate Management & Development | 1.2 | |||
Professional Services | 1.1 | |||
Food & Staples Retailing | 1.0 | |||
Construction Materials | 1.0 | |||
Others (each less than 1.0%) | 9.1 | |||
Short-Term Investments | 9.8 | |||
SEE NOTES TO FINANCIAL STATEMENTS.
| 52 | J.P. MORGAN INTERNATIONAL EQUITY FUNDS | APRIL 30, 2020 | ||||
Table of Contents
Abbreviations
| ADR | American Depositary Receipt | |
| OYJ | Public Limited Company | |
| Preference | A special type of equity investment that shares in the earnings of the company, has limited voting rights, and may have a dividend preference. Preference shares may also have liquidation preference. | |
| REIT | Real Estate Investment Trust | |
| (a) | The security or a portion of this security is on loan at April 30, 2020. The total value of securities on loan at April 30, 2020 is approximately $282,127,000. | |
| (b) | Security exempt from registration pursuant to Regulation S under the Securities Act of 1933, as amended. Regulation S applies to securities offerings that are made outside of the United States and do not involve direct selling efforts in the United States and as such may have restrictions on resale. | |
| (c) | Amount rounds to less than 0.1% of net assets. | |
| (d) | Investment in an affiliated fund, which is registered under the Investment Company Act of 1940, as amended, and is advised by J.P. Morgan Investment Management Inc. | |
| (e) | The rate shown is the current yield as of April 30, 2020. | |
| * | Non-income producing security. | |
| ‡ | Value determined using significant unobservable inputs. |
| Futures contracts outstanding as of April 30, 2020 (amounts in thousands, except number of contracts): | ||||||||||||||||||
| DESCRIPTION | NUMBER OF CONTRACTS | EXPIRATION DATE | TRADING CURRENCY | NOTIONAL AMOUNT ($) | VALUE AND UNREALIZED APPRECIATION (DEPRECIATION) ($) | |||||||||||||
Long Contracts |
| |||||||||||||||||
| SPI 200 Index | 1,011 | 06/2020 | AUD | 89,303 | 6,793 | |||||||||||||
| TOPIX Index | 373 | 06/2020 | JPY | 50,520 | 4,704 | |||||||||||||
|
| |||||||||||||||||
| 11,497 | ||||||||||||||||||
|
| |||||||||||||||||
| Abbreviations | ||
| AUD | Australian Dollar | |
| JPY | Japanese Yen | |
| SPI | Australian Securities Exchange | |
| TOPIX | Tokyo Stock Price Index | |
SEE NOTES TO FINANCIAL STATEMENTS.
| APRIL 30, 2020 | J.P. MORGAN INTERNATIONAL EQUITY FUNDS | 53 | ||||||
Table of Contents
JPMorgan International Value Fund
SCHEDULE OF PORTFOLIO INVESTMENTS
AS OF APRIL 30, 2020 (Unaudited)
| INVESTMENTS | SHARES (000) | VALUE ($000) | ||||||
Common Stocks — 96.5% | ||||||||
Australia — 7.6% | ||||||||
AGL Energy Ltd. | 65 | 709 | ||||||
Alumina Ltd. | 319 | 353 | ||||||
Australia & New Zealand Banking Group Ltd. | 168 | 1,820 | ||||||
Beach Energy Ltd. | 324 | 316 | ||||||
BHP Group Ltd. | 252 | 5,147 | ||||||
BlueScope Steel Ltd. | 76 | 496 | ||||||
Caltex Australia Ltd. | 22 | 361 | ||||||
Challenger Ltd. | 163 | 518 | ||||||
CSR Ltd. | 137 | 330 | ||||||
Fortescue Metals Group Ltd. | 152 | 1,159 | ||||||
Harvey Norman Holdings Ltd. | 166 | 298 | ||||||
IOOF Holdings Ltd. | 111 | 309 | ||||||
JBHi-Fi Ltd. | 27 | 601 | ||||||
Macquarie Group Ltd. | 6 | 407 | ||||||
Metcash Ltd. | 263 | 425 | ||||||
National Australia Bank Ltd. | 173 | 1,896 | ||||||
Origin Energy Ltd. | 165 | 595 | ||||||
Qantas Airways Ltd. | 163 | 405 | ||||||
QBE Insurance Group Ltd. | 58 | 314 | ||||||
Rio Tinto plc | 82 | 3,809 | ||||||
South32 Ltd. | 507 | 638 | ||||||
|
| |||||||
| 20,906 | ||||||||
|
| |||||||
Austria — 0.8% | ||||||||
AT&S Austria Technologie & Systemtechnik AG | 17 | 294 | ||||||
BAWAG Group AG * (a) | 15 | 511 | ||||||
Erste Group Bank AG | 29 | 625 | ||||||
Raiffeisen Bank International AG | 25 | 434 | ||||||
Telekom Austria AG | 62 | 434 | ||||||
|
| |||||||
| 2,298 | ||||||||
|
| |||||||
Belgium — 1.2% | ||||||||
Ageas | 21 | 770 | ||||||
Bekaert SA | 16 | 333 | ||||||
bpost SA | 44 | 306 | ||||||
KBC Group NV | 22 | 1,219 | ||||||
Orange Belgium SA | 23 | 380 | ||||||
Telenet Group Holding NV | 9 | 392 | ||||||
|
| |||||||
| 3,400 | ||||||||
|
| |||||||
China — 0.5% | ||||||||
BOC Hong Kong Holdings Ltd. | 331 | 1,016 | ||||||
CITIC Telecom International Holdings Ltd. | 1,206 | 446 | ||||||
|
| |||||||
| 1,462 | ||||||||
|
| |||||||
Denmark — 1.1% | ||||||||
Jyske Bank A/S (Registered) * | 13 | 348 | ||||||
| INVESTMENTS | SHARES (000) | VALUE ($000) | ||||||
Denmark — continued | ||||||||
Matas A/S | 58 | 393 | ||||||
Pandora A/S | 13 | 467 | ||||||
Scandinavian Tobacco Group A/S, Class A (a) | 55 | 636 | ||||||
Solar A/S, Class B | 6 | 218 | ||||||
Spar Nord Bank A/S * | 46 | 318 | ||||||
Sydbank A/S | 24 | 396 | ||||||
TCM Group A/S * (a) | 24 | 346 | ||||||
|
| |||||||
| 3,122 | ||||||||
|
| |||||||
Finland — 1.7% | ||||||||
Fortum OYJ (b) | 28 | 467 | ||||||
Kemira OYJ | 30 | 361 | ||||||
Konecranes OYJ | 14 | 303 | ||||||
Nordea Bank Abp | 222 | 1,422 | ||||||
Sanoma OYJ | 34 | 310 | ||||||
TietoEVRY OYJ | 13 | 314 | ||||||
UPM-Kymmene OYJ | 39 | 1,082 | ||||||
Valmet OYJ | 19 | 436 | ||||||
|
| |||||||
| 4,695 | ||||||||
|
| |||||||
France — 7.9% | ||||||||
Arkema SA | 5 | 427 | ||||||
Atos SE * | 10 | 738 | ||||||
AXA SA | 110 | 1,953 | ||||||
BNP Paribas SA | 69 | 2,174 | ||||||
Cie de Saint-Gobain | 36 | 959 | ||||||
Cie Generale des Etablissements Michelin SCA | 12 | 1,163 | ||||||
Credit Agricole SA | 96 | 770 | ||||||
Derichebourg SA | 117 | 330 | ||||||
Eutelsat Communications SA | 32 | 356 | ||||||
Faurecia SE | 12 | 442 | ||||||
Gecina SA, REIT | 5 | 592 | ||||||
Groupe Crit | 9 | 480 | ||||||
IPSOS | 19 | 365 | ||||||
Kaufman & Broad SA | 17 | 601 | ||||||
Metropole Television SA | 25 | 281 | ||||||
Natixis SA | 123 | 291 | ||||||
Peugeot SA | 38 | 539 | ||||||
Publicis Groupe SA (b) | 20 | 601 | ||||||
Quadient | 22 | 308 | ||||||
Rexel SA | 34 | 314 | ||||||
Rothschild & Co. | 17 | 328 | ||||||
Societe Generale SA | 58 | 907 | ||||||
Sopra Steria Group | 3 | 348 | ||||||
SPIE SA | 27 | 400 | ||||||
Television Francaise 1 * | 47 | 230 | ||||||
SEE NOTES TO FINANCIAL STATEMENTS.
| 54 | J.P. MORGAN INTERNATIONAL EQUITY FUNDS | APRIL 30, 2020 | ||||
Table of Contents
| INVESTMENTS | SHARES (000) | VALUE ($000) | ||||||
Common Stocks — continued | ||||||||
France — continued | ||||||||
TOTAL SA | 134 | 4,746 | ||||||
Veolia Environnement SA | 43 | 914 | ||||||
|
| |||||||
| 21,557 | ||||||||
|
| |||||||
Georgia — 0.3% | ||||||||
Bank of Georgia Group plc | 27 | 340 | ||||||
TBC Bank Group plc | 33 | 337 | ||||||
|
| |||||||
| 677 | ||||||||
|
| |||||||
Germany — 8.2% | ||||||||
1&1 Drillisch AG | 16 | 369 | ||||||
Aareal Bank AG | 15 | 237 | ||||||
Allianz SE (Registered) | 17 | 3,099 | ||||||
Aurubis AG | 8 | 392 | ||||||
Bayer AG (Registered) | 56 | 3,682 | ||||||
Bayerische Motoren Werke AG | 22 | 1,287 | ||||||
Deutsche Pfandbriefbank AG (a) | 29 | 215 | ||||||
Deutsche Post AG (Registered) | 12 | 356 | ||||||
Deutsche Telekom AG (Registered) | 210 | 3,075 | ||||||
DWS Group GmbH & Co. KGaA (a) | 10 | 326 | ||||||
Evonik Industries AG | 24 | 602 | ||||||
Freenet AG | 22 | 417 | ||||||
Fresenius SE & Co. KGaA | 29 | 1,267 | ||||||
HeidelbergCement AG | 13 | 602 | ||||||
HOCHTIEF AG | 5 | 362 | ||||||
JOST Werke AG (a) | 18 | 494 | ||||||
Jungheinrich AG (Preference) | 17 | 309 | ||||||
KION Group AG | 8 | 377 | ||||||
Muenchener Rueckversicherungs-Gesellschaft AG (Registered) | 5 | 1,116 | ||||||
Porsche Automobil Holding SE (Preference) | 13 | 669 | ||||||
Schaeffler AG (Preference) | 51 | 344 | ||||||
Software AG | 12 | 416 | ||||||
Volkswagen AG (Preference) | 13 | 1,818 | ||||||
Wuestenrot & Wuerttembergische AG | 35 | 611 | ||||||
|
| |||||||
| 22,442 | ||||||||
|
| |||||||
Hong Kong — 2.1% | ||||||||
CK Asset Holdings Ltd. | 199 | 1,254 | ||||||
CK Infrastructure Holdings Ltd. | 90 | 532 | ||||||
Haitong International Securities Group Ltd. | 1,246 | 292 | ||||||
Hang Lung Properties Ltd. | 253 | 541 | ||||||
Shun Tak Holdings Ltd. | 976 | 341 | ||||||
Sun Hung Kai Properties Ltd. | 100 | 1,361 | ||||||
VTech Holdings Ltd. | 45 | 338 | ||||||
Wheelock & Co. Ltd. | 113 | 828 | ||||||
| INVESTMENTS | SHARES (000) | VALUE ($000) | ||||||
Hong Kong — continued | ||||||||
Xinyi Glass Holdings Ltd. | 298 | 345 | ||||||
|
| |||||||
| 5,832 | ||||||||
|
| |||||||
India — 0.1% | ||||||||
Rhi Magnesita NV | 9 | 285 | ||||||
|
| |||||||
Ireland — 0.2% | ||||||||
Smurfit Kappa Group plc | 17 | 536 | ||||||
|
| |||||||
Israel — 0.4% | ||||||||
Bank LeumiLe-Israel BM | 133 | 718 | ||||||
Israel Discount Bank Ltd., Class A | 135 | 437 | ||||||
|
| |||||||
| 1,155 | ||||||||
|
| |||||||
Italy — 1.9% | ||||||||
Anima Holding SpA (a) | 109 | 387 | ||||||
Banca Farmafactoring SpA * (a) | 80 | 413 | ||||||
Intesa Sanpaolo SpA | 981 | 1,531 | ||||||
Mediobanca Banca di Credito Finanziario SpA | 93 | 539 | ||||||
Poste Italiane SpA (a) | 52 | 445 | ||||||
Rizzoli Corriere Della Sera Mediagroup SpA | 570 | 445 | ||||||
UniCredit SpA * | 131 | 1,013 | ||||||
Unipol Gruppo SpA | 97 | 334 | ||||||
|
| |||||||
| 5,107 | ||||||||
|
| |||||||
Japan — 25.4% | ||||||||
77 Bank Ltd. (The) | 28 | 376 | ||||||
Acom Co. Ltd. | 70 | 282 | ||||||
AEON Financial Service Co. Ltd. | 34 | 349 | ||||||
Aeon Mall Co. Ltd. | 32 | 399 | ||||||
Aiful Corp. * | 198 | 436 | ||||||
Alfresa Holdings Corp. | 20 | 403 | ||||||
Aozora Bank Ltd. | 24 | 420 | ||||||
Bridgestone Corp. | 37 | 1,161 | ||||||
Brother Industries Ltd. | 42 | 707 | ||||||
Chiba Bank Ltd. (The) | 103 | 479 | ||||||
Concordia Financial Group Ltd. | 155 | 474 | ||||||
Credit Saison Co. Ltd. | 35 | 393 | ||||||
Dai-ichi Life Holdings, Inc. | 92 | 1,149 | ||||||
DIC Corp. | 13 | 309 | ||||||
DMG Mori Co. Ltd. | 45 | 458 | ||||||
Dowa Holdings Co. Ltd. | 14 | 384 | ||||||
Electric Power Development Co. Ltd. | 25 | 498 | ||||||
Exedy Corp. | 22 | 350 | ||||||
Fuji Electric Co. Ltd. | 13 | 301 | ||||||
FUJIFILM Holdings Corp. | 7 | 310 | ||||||
Fuyo General Lease Co. Ltd. | 8 | 385 | ||||||
GS Yuasa Corp. | 21 | 294 | ||||||
SEE NOTES TO FINANCIAL STATEMENTS.
| APRIL 30, 2020 | J.P. MORGAN INTERNATIONAL EQUITY FUNDS | 55 | ||||||
Table of Contents
JPMorgan International Value Fund
SCHEDULE OF PORTFOLIO INVESTMENTS
AS OF APRIL 30, 2020 (Unaudited) (continued)
| INVESTMENTS | SHARES (000) | VALUE ($000) | ||||||
Common Stocks — continued | ||||||||
Japan — continued | ||||||||
Hachijuni Bank Ltd. (The) | 121 | 430 | ||||||
Hitachi Ltd. | 33 | 976 | ||||||
Hokuhoku Financial Group, Inc. | 45 | 369 | ||||||
Honda Motor Co. Ltd. | 94 | 2,271 | ||||||
ITOCHU Corp. | 55 | 1,086 | ||||||
Iwatani Corp. | 13 | 441 | ||||||
Izumi Co. Ltd. | 11 | 310 | ||||||
Japan Post Insurance Co. Ltd. | 38 | 482 | ||||||
Japan Tobacco, Inc. | 74 | 1,369 | ||||||
JXTG Holdings, Inc. | 227 | 804 | ||||||
Kaken Pharmaceutical Co. Ltd. | 6 | 352 | ||||||
Kamigumi Co. Ltd. | 24 | 423 | ||||||
Kandenko Co. Ltd. | 43 | 362 | ||||||
KDDI Corp. | 101 | 2,917 | ||||||
Kintetsu World Express, Inc. | 24 | 352 | ||||||
K’s Holdings Corp. | 43 | 473 | ||||||
Kyudenko Corp. | 15 | 409 | ||||||
Kyushu Financial Group, Inc. | 106 | 446 | ||||||
Makino Milling Machine Co. Ltd. | 12 | 342 | ||||||
Marubeni Corp. | 161 | 773 | ||||||
Mebuki Financial Group, Inc. | 252 | 530 | ||||||
Mitsubishi Gas Chemical Co., Inc. | 35 | 431 | ||||||
Mitsubishi UFJ Financial Group, Inc. | 708 | 2,861 | ||||||
Mitsubishi UFJ Lease & Finance Co. Ltd. | 111 | 532 | ||||||
Mitsui & Co. Ltd. | 99 | 1,385 | ||||||
Mitsui Fudosan Co. Ltd. | 16 | 300 | ||||||
Mixi, Inc. | 20 | 342 | ||||||
MS&AD Insurance Group Holdings, Inc. | 34 | 988 | ||||||
Nexon Co. Ltd. | 18 | 297 | ||||||
Nichias Corp. | 15 | 294 | ||||||
Nichiha Corp. | 19 | 347 | ||||||
Nippon Light Metal Holdings Co. Ltd. | 223 | 351 | ||||||
Nippon Telegraph & Telephone Corp. | 82 | 1,858 | ||||||
Nomura Holdings, Inc. | 244 | 1,013 | ||||||
Nomura Real Estate Holdings, Inc. | 28 | 460 | ||||||
NTT DOCOMO, Inc. | 77 | 2,275 | ||||||
Open House Co. Ltd. | 14 | 307 | ||||||
ORIX Corp. | 100 | 1,171 | ||||||
Prima Meat Packers Ltd. | 18 | 404 | ||||||
Rengo Co. Ltd. | 38 | 295 | ||||||
Saizeriya Co. Ltd. | 21 | 424 | ||||||
Sankyu, Inc. | 9 | 334 | ||||||
Sanwa Holdings Corp. | 38 | 297 | ||||||
Sawai Pharmaceutical Co. Ltd. | 6 | 311 | ||||||
SBI Holdings, Inc. | 34 | 626 | ||||||
| INVESTMENTS | SHARES (000) | VALUE ($000) | ||||||
Japan — continued | ||||||||
Sekisui House Ltd. | 47 | 813 | ||||||
Shimamura Co. Ltd. | 3 | 208 | ||||||
Shinsei Bank Ltd. | 45 | 548 | ||||||
Shizuoka Bank Ltd. (The) | 95 | 579 | ||||||
Softbank Corp. | 30 | 411 | ||||||
Sompo Holdings, Inc. | 13 | 425 | ||||||
Sony Corp. | 28 | 1,776 | ||||||
Sumitomo Bakelite Co. Ltd. | 11 | 289 | ||||||
Sumitomo Forestry Co. Ltd. | 31 | 383 | ||||||
Sumitomo Mitsui Financial Group, Inc. | 81 | 2,125 | ||||||
Sumitomo Mitsui Trust Holdings, Inc. | 31 | 908 | ||||||
Sumitomo Rubber Industries Ltd. | 43 | 420 | ||||||
Suzuken Co. Ltd. | 9 | 351 | ||||||
T&D Holdings, Inc. | 68 | 585 | ||||||
Teijin Ltd. | 37 | 582 | ||||||
Toho Holdings Co. Ltd. | 22 | 445 | ||||||
Tokai Rika Co. Ltd. | 27 | 340 | ||||||
Tokuyama Corp. | 26 | 549 | ||||||
Tokyo Steel Manufacturing Co. Ltd. | 56 | 355 | ||||||
Tokyo Tatemono Co. Ltd. | 38 | 432 | ||||||
Tokyu Fudosan Holdings Corp. | 115 | 560 | ||||||
Tosoh Corp. | 39 | 482 | ||||||
Towa Pharmaceutical Co. Ltd. | 20 | 414 | ||||||
Toyoda Gosei Co. Ltd. | 20 | 363 | ||||||
Toyota Motor Corp. | 117 | 7,221 | ||||||
Toyota Tsusho Corp. | 30 | 709 | ||||||
TS Tech Co. Ltd. | 20 | 550 | ||||||
Tsubakimoto Chain Co. | 15 | 351 | ||||||
Ube Industries Ltd. | 22 | 374 | ||||||
Ulvac, Inc. | 12 | 334 | ||||||
Yamaha Motor Co. Ltd. | 39 | 503 | ||||||
Yamato Kogyo Co. Ltd. | 18 | 351 | ||||||
Yokohama Rubber Co. Ltd. (The) | 30 | 382 | ||||||
Zeon Corp. | 45 | 397 | ||||||
|
| |||||||
| 69,652 | ||||||||
|
| |||||||
Luxembourg — 0.4% | ||||||||
ArcelorMittal SA | 66 | 719 | ||||||
RTL Group SA | 15 | 486 | ||||||
|
| |||||||
| 1,205 | ||||||||
|
| |||||||
Malta — 0.1% | ||||||||
Kindred Group plc, SDR | 68 | 323 | ||||||
|
| |||||||
Netherlands — 5.1% |
| |||||||
Arcadis NV * | 17 | 257 | ||||||
SEE NOTES TO FINANCIAL STATEMENTS.
| 56 | J.P. MORGAN INTERNATIONAL EQUITY FUNDS | APRIL 30, 2020 | ||||
Table of Contents
| INVESTMENTS | SHARES (000) | VALUE ($000) | ||||||
Common Stocks — continued | ||||||||
Netherlands — continued |
| |||||||
ASR Nederland NV | 19 | 517 | ||||||
ING Groep NV | 236 | 1,321 | ||||||
Intertrust NV (a) | 24 | 372 | ||||||
Koninklijke Ahold Delhaize NV (b) | 76 | 1,847 | ||||||
NIBC Holding NV (a) (b) | 60 | 456 | ||||||
NN Group NV | 28 | 798 | ||||||
Randstad NV * | 17 | 693 | ||||||
Royal Dutch Shell plc, Class A | 422 | 6,943 | ||||||
Signify NV (a) | 22 | 440 | ||||||
Van Lanschot Kempen NV, CVA | 21 | 322 | ||||||
|
| |||||||
| 13,966 | ||||||||
|
| |||||||
New Zealand — 0.1% | ||||||||
Air New Zealand Ltd. | 242 | 197 | ||||||
|
| |||||||
Norway — 2.5% |
| |||||||
Austevoll Seafood ASA | 47 | 366 | ||||||
DNB ASA | 88 | 1,068 | ||||||
Equinor ASA | 72 | 1,004 | ||||||
Europris ASA (a) | 128 | 468 | ||||||
Fjordkraft Holding ASA (a) | 47 | 317 | ||||||
Komplett Bank ASA * | 388 | 156 | ||||||
Norwegian Finans Holding ASA * | 71 | 379 | ||||||
Olav Thon Eiendomsselskap ASA | 26 | 329 | ||||||
Selvaag Bolig ASA | 100 | 415 | ||||||
SpareBank 1 Nord Norge | 84 | 504 | ||||||
SpareBank 1 SMN | 64 | 468 | ||||||
SpareBank 1SR-Bank ASA | 66 | 416 | ||||||
Storebrand ASA | 51 | 255 | ||||||
Telenor ASA | 44 | 672 | ||||||
|
| |||||||
| 6,817 | ||||||||
|
| |||||||
Russia — 0.2% | ||||||||
Evraz plc | 132 | 436 | ||||||
|
| |||||||
Singapore — 1.2% |
| |||||||
DBS Group Holdings Ltd. | 80 | 1,132 | ||||||
Jardine Cycle & Carriage Ltd. | 19 | 263 | ||||||
Oversea-Chinese Banking Corp. Ltd. | 217 | 1,385 | ||||||
United Overseas Bank Ltd. | 37 | 527 | ||||||
|
| |||||||
| 3,307 | ||||||||
|
| |||||||
South Africa — 0.5% | ||||||||
Anglo American plc | 80 | 1,415 | ||||||
|
| |||||||
Spain — 2.7% |
| |||||||
ACS Actividades de Construccion y Servicios SA | 33 | 814 | ||||||
Banco Bilbao Vizcaya Argentaria SA | 459 | 1,500 | ||||||
Banco de Sabadell SA | 725 | 301 | ||||||
| INVESTMENTS | SHARES (000) | VALUE ($000) | ||||||
Spain — continued |
| |||||||
CaixaBank SA | 330 | 593 | ||||||
ContourGlobal plc (a) | 175 | 357 | ||||||
Enagas SA | 28 | 648 | ||||||
Grupo Catalana Occidente SA | 25 | 492 | ||||||
Mediaset Espana Comunicacion SA * | 73 | 262 | ||||||
Repsol SA | 110 | 997 | ||||||
Telefonica SA | 331 | 1,515 | ||||||
|
| |||||||
| 7,479 | ||||||||
|
| |||||||
Sweden — 3.0% | ||||||||
AcadeMedia AB (a) | 73 | 376 | ||||||
Betsson AB * | 91 | 514 | ||||||
Bilia AB, Class A | 29 | 197 | ||||||
Bravida Holding AB * (a) | 48 | 386 | ||||||
Clas Ohlson AB, Class B | 44 | 387 | ||||||
Dometic Group AB * (c) | 47 | 313 | ||||||
Hoist Finance AB * (a) (b) | 129 | 356 | ||||||
Intrum AB (b) | 25 | 380 | ||||||
Inwido AB | 80 | 459 | ||||||
LeoVegas AB (a) | 136 | 477 | ||||||
Lindab International AB | 54 | 498 | ||||||
Resurs Holding AB (a) | 74 | 271 | ||||||
Skandinaviska Enskilda Banken AB, Class A | 151 | 1,241 | ||||||
SKF AB, Class B | 41 | 648 | ||||||
Svenska Handelsbanken AB, Class A * | 110 | 1,008 | ||||||
Tethys Oil AB | 88 | 448 | ||||||
Volvo AB, Class B | 31 | 403 | ||||||
|
| |||||||
| 8,362 | ||||||||
|
| |||||||
Switzerland — 7.4% | ||||||||
Adecco Group AG (Registered) | 18 | 806 | ||||||
BKW AG | 4 | 307 | ||||||
Credit Suisse Group AG (Registered) * | 117 | 1,065 | ||||||
Dufry AG (Registered) | 11 | 349 | ||||||
Glencore plc * | 729 | 1,365 | ||||||
Julius Baer Group Ltd. * | 10 | 375 | ||||||
LafargeHolcim Ltd. (Registered) * | 23 | 975 | ||||||
Novartis AG (Registered) | 59 | 5,020 | ||||||
Roche Holding AG | 2 | 707 | ||||||
Sulzer AG (Registered) | 5 | 349 | ||||||
Swiss Life Holding AG (Registered) | 3 | 1,111 | ||||||
Swiss Re AG (b) | 22 | 1,565 | ||||||
Swisscom AG (Registered) | 2 | 1,063 | ||||||
UBS Group AG (Registered) * | 237 | 2,540 | ||||||
Zurich Insurance Group AG | 9 | 2,736 | ||||||
|
| |||||||
| 20,333 | ||||||||
|
| |||||||
SEE NOTES TO FINANCIAL STATEMENTS.
| APRIL 30, 2020 | J.P. MORGAN INTERNATIONAL EQUITY FUNDS | 57 | ||||||
Table of Contents
JPMorgan International Value Fund
SCHEDULE OF PORTFOLIO INVESTMENTS
AS OF APRIL 30, 2020 (Unaudited) (continued)
| INVESTMENTS | SHARES (000) | VALUE ($000) | ||||||
Common Stocks — continued | ||||||||
United Kingdom — 13.7% | ||||||||
Aggreko plc | 32 | 185 | ||||||
Aviva plc | 290 | 876 | ||||||
Babcock International Group plc | 81 | 428 | ||||||
Barclays plc | 1,148 | 1,533 | ||||||
Barratt Developments plc | 93 | 606 | ||||||
Bellway plc | 14 | 460 | ||||||
Berkeley Group Holdings plc | 6 | 320 | ||||||
BP plc | 1,118 | 4,404 | ||||||
British American Tobacco plc | 132 | 5,098 | ||||||
British Land Co. plc (The), REIT | 110 | 563 | ||||||
BT Group plc | 683 | 995 | ||||||
Capital & Counties Properties plc, REIT | 138 | 287 | ||||||
CK Hutchison Holdings Ltd. | 181 | 1,342 | ||||||
Close Brothers Group plc | 21 | 292 | ||||||
Crest Nicholson Holdings plc | 110 | 355 | ||||||
Dialog Semiconductor plc * | 8 | 243 | ||||||
Dixons Carphone plc | 249 | 242 | ||||||
Drax Group plc | 155 | 406 | ||||||
easyJet plc | 39 | 297 | ||||||
Fiat Chrysler Automobiles NV | 94 | 819 | ||||||
Forterra plc (a) | 91 | 277 | ||||||
Gamesys Group plc * | 44 | 481 | ||||||
Great Portland Estates plc, REIT | 35 | 297 | ||||||
Imperial Brands plc | 78 | 1,643 | ||||||
Inchcape plc | 89 | 559 | ||||||
International Consolidated Airlines Group SA | 87 | 243 | ||||||
ITV plc | 600 | 576 | ||||||
J Sainsbury plc | 248 | 617 | ||||||
Just Group plc * | 380 | 266 | ||||||
Land Securities Group plc, REIT | 68 | 570 | ||||||
Legal & General Group plc | 478 | 1,229 | ||||||
Lloyds Banking Group plc | 4,342 | 1,757 | ||||||
M&G plc | 277 | 460 | ||||||
Mitchells & Butlers plc * | 24 | 54 | ||||||
Morgan Sindall Group plc | 21 | 333 | ||||||
Ninety One plc * | 36 | 77 | ||||||
OneSavings Bank plc | 99 | 303 | ||||||
Paragon Banking Group plc | 78 | 328 | ||||||
Premier Foods plc * | 489 | 280 | ||||||
Prudential plc | 165 | 2,334 | ||||||
Reach plc | 206 | 204 | ||||||
Redrow plc | 70 | 405 | ||||||
ScS Group plc | 125 | 257 | ||||||
St Modwen Properties plc | 65 | 300 | ||||||
Taylor Wimpey plc | 360 | 665 | ||||||
| INVESTMENTS | SHARES (000) | VALUE ($000) | ||||||
United Kingdom — continued | ||||||||
Vesuvius plc | 81 | 407 | ||||||
Virgin Money UK plc * | 399 | 381 | ||||||
Vistry Group plc | 43 | 432 | ||||||
Vodafone Group plc | 889 | 1,254 | ||||||
WPP plc | 124 | 959 | ||||||
|
| |||||||
| 37,699 | ||||||||
|
| |||||||
United States — 0.2% | ||||||||
Samsonite International SA (a) | 197 | 167 | ||||||
TI Fluid Systems plc (a) | 180 | 362 | ||||||
|
| |||||||
| 529 | ||||||||
|
| |||||||
Total Common Stocks | 265,194 | |||||||
|
| |||||||
Short-Term Investments — 3.0% | ||||||||
Investment Companies — 1.8% | ||||||||
JPMorgan Prime Money Market Fund Class Institutional Shares, 0.63% (d) (e) | 4,972 | 4,976 | ||||||
|
| |||||||
Investment of Cash Collateral from Securities Loaned — 1.2% |
| |||||||
JPMorgan Securities Lending Money Market Fund Agency SL Class Shares, 0.77% (d) (e) | — | (f) | — | (f) | ||||
JPMorgan U.S. Government Money Market Fund Class IM Shares, 0.23% (d) (e) | 3,129 | 3,129 | ||||||
|
| |||||||
Total Investment of Cash Collateral from |
| 3,129 | ||||||
|
| |||||||
Total Short-Term Investments | 8,105 | |||||||
|
| |||||||
Total Investments — 99.5% |
| 273,299 | ||||||
Other Assets Less Liabilities — 0.5% |
| 1,391 | ||||||
|
| |||||||
NET ASSETS — 100.0% |
| 274,690 | ||||||
|
| |||||||
Percentages indicated are based on net assets.
SEE NOTES TO FINANCIAL STATEMENTS.
| 58 | J.P. MORGAN INTERNATIONAL EQUITY FUNDS | APRIL 30, 2020 | ||||
Table of Contents
Summary of Investments by Industry, April 30, 2020
The following table represents the portfolio investments of the Fund by industry classifications as a percentage of total investments:
| INDUSTRY | PERCENTAGE | |||
Banks | 16.9 | % | ||
Insurance | 9.0 | |||
Oil, Gas & Consumable Fuels | 7.7 | |||
Metals & Mining | 6.5 | |||
Automobiles | 5.5 | |||
Pharmaceuticals | 3.8 | |||
Diversified Telecommunication Services | 3.7 | |||
Tobacco | 3.2 | |||
Capital Markets | 2.9 | |||
Wireless Telecommunication Services | 2.9 | |||
Real Estate Management & Development | 2.7 | |||
Household Durables | 2.6 | |||
Auto Components | 2.4 | |||
Media | 2.0 | |||
Machinery | 1.8 | |||
Chemicals | 1.8 | |||
Trading Companies & Distributors | 1.6 | |||
Diversified Financial Services | 1.3 | |||
Specialty Retail | 1.1 | |||
Food & Staples Retailing | 1.1 | |||
Building Products | 1.0 | |||
Others (each less than 1.0%) | 15.5 | |||
Short-Term Investments | 3.0 | |||
| Abbreviations | ||
| CVA | Dutch Certification | |
| OYJ | Public Limited Company | |
| Preference | A special type of equity investment that shares in the earnings of the company, has limited voting rights, and may have a dividend preference. Preference shares may also have liquidation preference. | |
| REIT | Real Estate Investment Trust | |
| SCA | Limited partnership with share capital | |
| SDR | Swedish Depositary Receipt | |
| (a) | Security exempt from registration pursuant to Regulation S under the Securities Act of 1933, as amended. Regulation S applies to securities offerings that are made outside of the United States and do not involve direct selling efforts in the United States and as such may have restrictions on resale. | |
| (b) | The security or a portion of this security is on loan at April 30, 2020. The total value of securities on loan at April 30, 2020 is approximately $2,936,000. | |
| (c) | Securities exempt from registration under Rule 144A or section 4(a)(2), of the Securities Act of 1933, as amended. | |
| (d) | Investment in an affiliated fund, which is registered under the Investment Company Act of 1940, as amended, and is advised by J.P. Morgan Investment Management Inc. | |
| (e) | The rate shown is the current yield as of April 30, 2020. | |
| (f) | Amount rounds to less than one thousand. | |
| * | Non-income producing security. | |
| Futures contracts outstanding as of April 30, 2020 (amounts in thousands, except number of contracts): | ||||||||||||||||||
| DESCRIPTION | NUMBER OF CONTRACTS | EXPIRATION DATE | TRADING CURRENCY | NOTIONAL AMOUNT ($) | VALUE AND UNREALIZED APPRECIATION (DEPRECIATION) ($) | |||||||||||||
Long Contracts |
| |||||||||||||||||
| EURO STOXX 50 Index | 57 | 06/2020 | EUR | 1,800 | 184 | |||||||||||||
| FTSE 100 Index | 25 | 06/2020 | GBP | 1,847 | 179 | |||||||||||||
| TOPIX Index | 11 | 06/2020 | JPY | 1,490 | 133 | |||||||||||||
|
| |||||||||||||||||
| 496 | ||||||||||||||||||
|
| |||||||||||||||||
Abbreviations
| EUR | Euro | |
| FTSE | Financial Times and the London Stock Exchange | |
| GBP | British Pound | |
| JPY | Japanese Yen | |
| TOPIX | Tokyo Stock Price Index |
SEE NOTES TO FINANCIAL STATEMENTS.
| APRIL 30, 2020 | J.P. MORGAN INTERNATIONAL EQUITY FUNDS | 59 | ||||||
Table of Contents
STATEMENTS OF ASSETS AND LIABILITIES
AS OF APRIL 30, 2020 (Unaudited)
(Amounts in thousands, except per share amounts)
| JPMorgan Emerging Markets Equity Fund | JPMorgan Emerging Markets Research Enhanced Equity Fund | JPMorgan Europe Dynamic Fund | ||||||||||
ASSETS: | ||||||||||||
Investments innon-affiliates, at value | $ | 7,642,916 | $ | 2,305,629 | $ | 413,214 | ||||||
Investments in affiliates, at value | 124,572 | 24,084 | 4,185 | |||||||||
Investment of cash collateral received from securities loaned, at value (See Note 2.C.) | 129,303 | 6,237 | 41,289 | |||||||||
Cash | 2,985 | 3,109 | 100 | |||||||||
Foreign currency, at value | 3,842 | 3,331 | 138 | |||||||||
Deposits at broker for futures contracts | — | 4,223 | 267 | |||||||||
Receivables: | ||||||||||||
Due from custodian | — | 2,946 | — | |||||||||
Investment securities sold | — | 3,552 | 5,184 | |||||||||
Fund shares sold | 64,504 | 36,982 | 6 | |||||||||
Dividends fromnon-affiliates | 8,688 | 2,895 | 646 | |||||||||
Dividends from affiliates | 78 | 14 | 8 | |||||||||
Tax reclaims | 136 | 47 | 3,336 | |||||||||
Securities lending income (See Note 2.C.) | 76 | 49 | 13 | |||||||||
Other assets | — | 196 | — | |||||||||
|
|
|
|
|
| |||||||
Total Assets | 7,977,100 | 2,393,294 | 468,386 | |||||||||
|
|
|
|
|
| |||||||
LIABILITIES: | ||||||||||||
Payables: | ||||||||||||
Investment securities purchased | 35,735 | 2,946 | 8,999 | |||||||||
Collateral received on securities loaned (See Note 2.C.) | 129,303 | 6,237 | 41,289 | |||||||||
Fund shares redeemed | 18,391 | — | 218 | |||||||||
Variation margin on futures contracts | — | 673 | 10 | |||||||||
Accrued liabilities: | ||||||||||||
Investment advisory fees | 3,954 | 357 | 194 | |||||||||
Administration fees | 427 | 70 | 25 | |||||||||
Distribution fees | 137 | — | 21 | |||||||||
Service fees | 549 | — | (a) | 30 | ||||||||
Custodian and accounting fees | 1,819 | 61 | 52 | |||||||||
Trustees’ and Chief Compliance Officer’s fees | 2 | — | (a) | — | ||||||||
Deferred foreign capital gains tax | 999 | — | — | |||||||||
Other | 23 | 45 | 93 | |||||||||
|
|
|
|
|
| |||||||
Total Liabilities | 191,339 | 10,389 | 50,931 | |||||||||
|
|
|
|
|
| |||||||
Net Assets | $ | 7,785,761 | $ | 2,382,905 | $ | 417,455 | ||||||
|
|
|
|
|
| |||||||
| (a) | Amount rounds to less than one thousand. |
SEE NOTES TO FINANCIAL STATEMENTS.
| 60 | J.P. MORGAN INTERNATIONAL EQUITY FUNDS | APRIL 30, 2020 | ||||
Table of Contents
| JPMorgan Emerging Markets Equity Fund | JPMorgan Emerging Markets Research Enhanced Equity Fund | JPMorgan Europe Dynamic Fund | ||||||||||
NET ASSETS: | ||||||||||||
Paid-in-Capital | $ | 7,060,131 | $ | 2,696,140 | $ | 574,080 | ||||||
Total distributable earnings (loss) | 725,630 | (313,235 | ) | (156,625 | ) | |||||||
|
|
|
|
|
| |||||||
Total Net Assets | $ | 7,785,761 | $ | 2,382,905 | $ | 417,455 | ||||||
|
|
|
|
|
| |||||||
Net Assets: | ||||||||||||
Class A | $ | 535,839 | $ | — | $ | 69,580 | ||||||
Class C | 54,761 | — | 12,752 | |||||||||
Class I | 2,453,732 | 8 | 56,453 | |||||||||
Class L | 1,146,624 | — | 50,754 | |||||||||
Class R2 | 210 | — | — | |||||||||
Class R3 | 3,361 | — | — | |||||||||
Class R4 | 1,928 | — | — | |||||||||
Class R5 | 40,652 | — | — | |||||||||
Class R6 | 3,548,654 | 2,382,897 | 227,916 | |||||||||
|
|
|
|
|
| |||||||
Total | $ | 7,785,761 | $ | 2,382,905 | $ | 417,455 | ||||||
|
|
|
|
|
| |||||||
Outstanding units of beneficial interest (shares) ($0.0001 par value; unlimited number of shares authorized): | ||||||||||||
Class A | 19,962 | — | 3,542 | |||||||||
Class C | 2,107 | — | 734 | |||||||||
Class I | 89,344 | 1 | 2,818 | |||||||||
Class L | 41,431 | — | 2,502 | |||||||||
Class R2 | 8 | — | — | |||||||||
Class R3 | 126 | — | — | |||||||||
Class R4 | 70 | — | — | |||||||||
Class R5 | 1,472 | — | — | |||||||||
Class R6 | 128,395 | 162,263 | 11,289 | |||||||||
Net Asset Value (a): | ||||||||||||
Class A — Redemption price per share | $ | 26.84 | $ | — | $ | 19.65 | ||||||
Class C — Offering price per share (b) | 25.99 | — | 17.38 | |||||||||
Class I — Offering and redemption price per share | 27.46 | 14.77 | 20.04 | |||||||||
Class L — Offering and redemption price per share | 27.68 | — | 20.28 | |||||||||
Class R2 — Offering and redemption price per share | 26.60 | — | — | |||||||||
Class R3 — Offering and redemption price per share | 26.71 | — | — | |||||||||
Class R4 — Offering and redemption price per share | 27.37 | — | — | |||||||||
Class R5 — Offering and redemption price per share | 27.62 | — | — | |||||||||
Class R6 — Offering and redemption price per share | 27.64 | 14.69 | 20.19 | |||||||||
Class A maximum sales charge | 5.25 | % | — | % | 5.25 | % | ||||||
Class A maximum public offering price per share | $ | 28.33 | $ | — | $ | 20.74 | ||||||
|
|
|
|
|
| |||||||
Cost of investments innon-affiliates | $ | 6,727,034 | $ | 2,532,594 | $ | 427,263 | ||||||
Cost of investments in affiliates | 124,454 | 24,060 | 4,178 | |||||||||
Cost of foreign currency | 3,826 | 3,341 | 137 | |||||||||
Investment securities on loan, at value (See Note 2.C.) | 126,114 | 5,853 | 35,227 | |||||||||
Cost of investment of cash collateral (See Note 2.C.) | 129,267 | 6,236 | 41,284 | |||||||||
| (a) | Per share amounts may not recalculate due to rounding of net assets and/or shares outstanding. |
| (b) | Redemption price for Class C Shares varies based upon length of time the shares are held. |
SEE NOTES TO FINANCIAL STATEMENTS.
| APRIL 30, 2020 | J.P. MORGAN INTERNATIONAL EQUITY FUNDS | 61 | ||||||
Table of Contents
STATEMENTS OF ASSETS AND LIABILITIES
AS OF APRIL 30, 2020 (Unaudited) (continued)
(Amounts in thousands, except per share amounts)
| JPMorgan International Advantage Fund | JPMorgan International Equity Fund | JPMorgan International Focus Fund (formerly known as JPMorgan International Unconstrained Equity Fund) | ||||||||||
ASSETS: | ||||||||||||
Investments innon-affiliates, at value | $ | 1,449,861 | $ | 2,626,021 | $ | 2,481,083 | ||||||
Investments in affiliates, at value | 28,772 | 28,692 | 32,724 | |||||||||
Investment of cash collateral received from securities loaned, at value (See Note 2.C.) | 76,379 | 111,555 | 149,050 | |||||||||
Cash | 50 | 35 | 429 | |||||||||
Foreign currency, at value | 1,249 | 238 | — | |||||||||
Deposits at broker for futures contracts | 3,516 | — | — | |||||||||
Receivables: | ||||||||||||
Investment securities sold | 11,896 | 3 | 17,590 | |||||||||
Fund shares sold | 13 | 3,056 | 27,893 | |||||||||
Dividends fromnon-affiliates | 8,087 | 7,671 | 5,833 | |||||||||
Dividends from affiliates | 16 | 13 | 19 | |||||||||
Tax reclaims | 8,408 | 7,811 | 1,701 | |||||||||
Securities lending income (See Note 2.C.) | 37 | 27 | 35 | |||||||||
|
|
|
|
|
| |||||||
Total Assets | 1,588,284 | 2,785,122 | 2,716,357 | |||||||||
|
|
|
|
|
| |||||||
LIABILITIES: | ||||||||||||
Payables: | ||||||||||||
Foreign currency due to custodian, at value | — | — | 12 | |||||||||
Investment securities purchased | 15,995 | 1,766 | 30,243 | |||||||||
Collateral received on securities loaned (See Note 2.C.) | 76,379 | 111,555 | 149,050 | |||||||||
Fund shares redeemed | 151 | 2,898 | 649 | |||||||||
Variation margin on futures contracts | 66 | 1 | 4 | |||||||||
Accrued liabilities: | ||||||||||||
Investment advisory fees | 505 | 914 | 966 | |||||||||
Administration fees | 37 | 74 | 12 | |||||||||
Distribution fees | 11 | 66 | 32 | |||||||||
Service fees | 7 | 76 | 51 | |||||||||
Custodian and accounting fees | 180 | 230 | 32 | |||||||||
Trustees’ and Chief Compliance Officer’s fees | — | (a) | 1 | 1 | ||||||||
Other | 103 | 87 | 49 | |||||||||
|
|
|
|
|
| |||||||
Total Liabilities | 93,434 | 117,668 | 181,101 | |||||||||
|
|
|
|
|
| |||||||
Net Assets | $ | 1,494,850 | $ | 2,667,454 | $ | 2,535,256 | ||||||
|
|
|
|
|
| |||||||
| (a) | Amount rounds to less than one thousand. |
SEE NOTES TO FINANCIAL STATEMENTS.
| 62 | J.P. MORGAN INTERNATIONAL EQUITY FUNDS | APRIL 30, 2020 | ||||
Table of Contents
| JPMorgan International Advantage Fund | JPMorgan International Equity Fund | JPMorgan International Focus Fund (formerly known as JPMorgan International Unconstrained Equity Fund) | ||||||||||
NET ASSETS: |
| |||||||||||
Paid-in-Capital | $ | 1,938,781 | $ | 2,359,232 | $ | 2,731,375 | ||||||
Total distributable earnings (loss) | (443,931 | ) | 308,222 | (196,119 | ) | |||||||
|
|
|
|
|
| |||||||
Total Net Assets | $ | 1,494,850 | $ | 2,667,454 | $ | 2,535,256 | ||||||
|
|
|
|
|
| |||||||
Net Assets: | ||||||||||||
Class A | $ | 6,150 | $ | 302,646 | $ | 115,420 | ||||||
Class C | 923 | 11,229 | 14,513 | |||||||||
Class I | 21,165 | 179,476 | 194,013 | |||||||||
Class R2 | 23,550 | 2,074 | 1,420 | |||||||||
Class R5 | — | 4,022 | 2,437 | |||||||||
Class R6 | 1,443,062 | 2,168,007 | 2,207,453 | |||||||||
|
|
|
|
|
| |||||||
Total | $ | 1,494,850 | $ | 2,667,454 | $ | 2,535,256 | ||||||
|
|
|
|
|
| |||||||
Outstanding units of beneficial interest (shares) ($0.0001 par value; unlimited number of shares authorized): | ||||||||||||
Class A | 388 | 20,636 | 6,049 | |||||||||
Class C | 57 | 810 | 773 | |||||||||
Class I | 1,281 | 12,039 | 10,038 | |||||||||
Class R2 | 1,508 | 143 | 75 | |||||||||
Class R5 | — | 269 | 126 | |||||||||
Class R6 | 88,761 | 145,136 | 114,275 | |||||||||
Net Asset Value (a): | ||||||||||||
Class A — Redemption price per share | $ | 15.86 | $ | 14.67 | $ | 19.08 | ||||||
Class C — Offering price per share (b) | 16.13 | 13.86 | 18.79 | |||||||||
Class I — Offering and redemption price per share | 16.52 | 14.91 | 19.33 | |||||||||
Class R2 — Offering and redemption price per share | 15.62 | 14.55 | 18.92 | |||||||||
Class R5 — Offering and redemption price per share | — | 14.98 | 19.31 | |||||||||
Class R6 — Offering and redemption price per share | 16.26 | 14.94 | 19.32 | |||||||||
Class A maximum sales charge | 5.25 | % | 5.25 | % | 5.25 | % | ||||||
Class A maximum public offering price per share | $ | 16.74 | $ | 15.48 | $ | 20.14 | ||||||
|
|
|
|
|
| |||||||
Cost of investments innon-affiliates | $ | 1,518,438 | $ | 2,202,688 | $ | 2,469,881 | ||||||
Cost of investments in affiliates | 28,749 | 28,678 | 32,695 | |||||||||
Cost of foreign currency | 1,250 | 240 | — | |||||||||
Investment securities on loan, at value (See Note 2.C.) | 72,637 | 104,180 | 139,159 | |||||||||
Cost of investment of cash collateral (See Note 2.C.) | 76,371 | 111,540 | 149,023 | |||||||||
| (a) | Per share amounts may not recalculate due to rounding of net assets and/or shares outstanding. |
| (b) | Redemption price for Class C Shares varies based upon length of time the shares are held. |
SEE NOTES TO FINANCIAL STATEMENTS.
| APRIL 30, 2020 | J.P. MORGAN INTERNATIONAL EQUITY FUNDS | 63 | ||||||
Table of Contents
STATEMENTS OF ASSETS AND LIABILITIES
AS OF APRIL 30, 2020 (Unaudited) (continued)
(Amounts in thousands, except per share amounts)
| JPMorgan International Hedged Equity Fund | JPMorgan | JPMorgan International Value Fund | ||||||||||
ASSETS: |
| |||||||||||
Investments innon-affiliates, at value | $ | 99,491 | $ | 4,094,565 | $ | 265,194 | ||||||
Investments in affiliates, at value | 854 | 138,332 | 4,976 | |||||||||
Investment of cash collateral received from securities loaned, at value (See Note 2.C.) | — | 305,344 | 3,129 | |||||||||
Options purchased, at value | 637 | — | — | |||||||||
Cash | 528 | 50 | 50 | |||||||||
Foreign currency, at value | 56 | 4,837 | 197 | |||||||||
Deposits at broker for futures contracts | 467 | 11,949 | 735 | |||||||||
Deposits at broker for options contracts | 236 | — | — | |||||||||
Receivables: | ||||||||||||
Due from custodian | — | — | 286 | |||||||||
Investment securities sold | 5,170 | 132,979 | 27 | |||||||||
Fund shares sold | 104 | 4,880 | 404 | |||||||||
Dividends fromnon-affiliates | 408 | 16,964 | 1,875 | |||||||||
Dividends from affiliates | 1 | 76 | 4 | |||||||||
Tax reclaims | 177 | 11,735 | 2,566 | |||||||||
Securities lending income (See Note 2.C.) | — | 52 | 6 | |||||||||
Variation margin on futures contracts | 38 | 2,257 | — | |||||||||
Due from adviser | 10 | — | — | |||||||||
|
|
|
|
|
| |||||||
Total Assets | 108,177 | 4,724,020 | 279,449 | |||||||||
|
|
|
|
|
| |||||||
LIABILITIES: | ||||||||||||
Payables: | ||||||||||||
Investment securities purchased | 2,751 | 112,060 | 676 | |||||||||
Collateral received on securities loaned (See Note 2.C.) | — | 305,344 | 3,129 | |||||||||
Fund shares redeemed | 7 | 1,540 | 394 | |||||||||
Variation margin on futures contracts | — | — | 20 | |||||||||
Outstanding options written, at fair value | 9,881 | — | — | |||||||||
Accrued liabilities: | ||||||||||||
Investment advisory fees | — | 548 | 91 | |||||||||
Administration fees | — | 184 | — | |||||||||
Distribution fees | — | (a) | 38 | 29 | ||||||||
Service fees | 20 | 28 | 27 | |||||||||
Custodian and accounting fees | 40 | 278 | 57 | |||||||||
Trustees’ and Chief Compliance Officer’s fees | — | — | — | (a) | ||||||||
Other | 11 | 290 | 336 | |||||||||
|
|
|
|
|
| |||||||
Total Liabilities | 12,710 | 420,310 | 4,759 | |||||||||
|
|
|
|
|
| |||||||
Net Assets | $ | 95,467 | $ | 4,303,710 | $ | 274,690 | ||||||
|
|
|
|
|
| |||||||
| (a) | Amount rounds to less than one thousand. |
SEE NOTES TO FINANCIAL STATEMENTS.
| 64 | J.P. MORGAN INTERNATIONAL EQUITY FUNDS | APRIL 30, 2020 | ||||
Table of Contents
| JPMorgan International Hedged Equity Fund | JPMorgan | JPMorgan International Value Fund | ||||||||||
NET ASSETS: |
| |||||||||||
Paid-in-Capital | $ | 103,536 | $ | 5,086,460 | $ | 413,510 | ||||||
Total distributable earnings (loss) | (8,069 | ) | (782,750 | ) | (138,820 | ) | ||||||
|
|
|
|
|
| |||||||
Total Net Assets | $ | 95,467 | $ | 4,303,710 | $ | 274,690 | ||||||
|
|
|
|
|
| |||||||
Net Assets: | ||||||||||||
Class A | $ | 794 | $ | 192,355 | $ | 130,147 | ||||||
Class C | 116 | — | 5,446 | |||||||||
Class I | 94,519 | 208,853 | 28,328 | |||||||||
Class L | — | — | 17,257 | |||||||||
Class R2 | — | — | 390 | |||||||||
Class R5 | 19 | — | 75 | |||||||||
Class R6 | 19 | 3,902,502 | 93,047 | |||||||||
|
|
|
|
|
| |||||||
Total | $ | 95,467 | $ | 4,303,710 | $ | 274,690 | ||||||
|
|
|
|
|
| |||||||
Outstanding units of beneficial interest (shares) ($0.0001 par value; unlimited number of shares authorized): | ||||||||||||
Class A | 57 | 12,995 | 14,424 | |||||||||
Class C | 8 | — | 623 | |||||||||
Class I | 6,724 | 13,940 | 3,060 | |||||||||
Class L | — | — | 1,876 | |||||||||
Class R2 | — | — | 44 | |||||||||
Class R5 | 1 | — | 8 | |||||||||
Class R6 | 1 | 261,479 | 10,159 | |||||||||
Net Asset Value (a): | ||||||||||||
Class A — Redemption price per share | $ | 14.02 | $ | 14.80 | $ | 9.02 | ||||||
Class C — Offering price per share (b) | 13.99 | — | 8.74 | |||||||||
Class I — Offering and redemption price per share | 14.06 | �� | 14.98 | 9.26 | ||||||||
Class L — Offering and redemption price per share | — | — | 9.20 | |||||||||
Class R2 — Offering and redemption price per share | — | — | 8.88 | |||||||||
Class R5 — Offering and redemption price per share | 14.08 | — | 9.14 | |||||||||
Class R6 — Offering and redemption price per share | 14.08 | 14.92 | 9.16 | |||||||||
Class A maximum sales charge | 5.25 | % | 5.25 | % | 5.25 | % | ||||||
Class A maximum public offering price per share | $ | 14.80 | $ | 15.62 | $ | 9.52 | ||||||
|
|
|
|
|
| |||||||
Cost of investments innon-affiliates | $ | 104,403 | $ | 4,399,744 | $ | 343,026 | ||||||
Cost of investments in affiliates | 854 | 138,217 | 4,972 | |||||||||
Cost of options purchased | 5,959 | — | — | |||||||||
Cost of foreign currency | 56 | 4,822 | 197 | |||||||||
Investment securities on loan, at value (See Note 2.C.) | — | 282,127 | 2,936 | |||||||||
Cost of investment of cash collateral (See Note 2.C.) | — | 305,319 | 3,129 | |||||||||
Premiums received from options written | 7,118 | — | — | |||||||||
| (a) | Per share amounts may not recalculate due to rounding of net assets and/or shares outstanding. |
| (b) | Redemption price for Class C Shares varies based upon length of time the shares are held. |
SEE NOTES TO FINANCIAL STATEMENTS.
| APRIL 30, 2020 | J.P. MORGAN INTERNATIONAL EQUITY FUNDS | 65 | ||||||
Table of Contents
STATEMENTS OF OPERATIONS
FOR THE SIX MONTHS ENDED APRIL 30, 2020 (Unaudited)
(Amounts in thousands)
| JPMorgan Emerging Markets Equity Fund | JPMorgan Emerging Markets Research Enhanced Equity Fund | JPMorgan Europe Dynamic Fund | ||||||||||
INVESTMENT INCOME: |
| |||||||||||
Interest income fromnon-affiliates | $ | 6 | $ | 17 | $ | 4 | ||||||
Interest income from affiliates | 3 | 4 | — | |||||||||
Dividend income fromnon-affiliates | 43,444 | 21,417 | 5,980 | |||||||||
Dividend income from affiliates | 1,173 | 390 | 106 | |||||||||
Non-cash dividend income fromnon-affiliates | — | — | 278 | |||||||||
Income from securities lending (net) (See Note 2.C.) | 90 | 104 | 18 | |||||||||
Foreign taxes withheld (net) | (3,265 | ) | (1,792 | ) | (881 | ) | ||||||
|
|
|
|
|
| |||||||
Total investment income | 41,451 | 20,140 | 5,505 | |||||||||
|
|
|
|
|
| |||||||
EXPENSES: | ||||||||||||
Investment advisory fees | 24,467 | 3,038 | 1,501 | |||||||||
Administration fees | 2,699 | 911 | 188 | |||||||||
Distribution fees: | ||||||||||||
Class A | 715 | — | 111 | |||||||||
Class C | 226 | — | 63 | |||||||||
Class R2 | — | (a) | — | — | ||||||||
Class R3 | 4 | — | — | |||||||||
Service fees: | ||||||||||||
Class A | 715 | — | 111 | |||||||||
Class C | 75 | — | 21 | |||||||||
Class I | 2,662 | — | (a) | 95 | ||||||||
Class L | 530 | — | 30 | |||||||||
Class R2 | — | (a) | — | — | ||||||||
Class R3 | 4 | — | — | |||||||||
Class R4 | 2 | — | — | |||||||||
Class R5 | 21 | — | — | |||||||||
Custodian and accounting fees | 2,188 | 287 | 48 | |||||||||
Interest expense to affiliates | 6 | 8 | 2 | |||||||||
Professional fees | 84 | 46 | 56 | |||||||||
Trustees’ and Chief Compliance Officer’s fees | 27 | 16 | 13 | |||||||||
Printing and mailing costs | 193 | 7 | 15 | |||||||||
Registration and filing fees | 154 | 118 | 43 | |||||||||
Transfer agency fees (See Note 2.J.) | 166 | 3 | 15 | |||||||||
Offering costs (See Note 2.H.) | — | 5 | — | |||||||||
Other | 41 | 17 | 10 | |||||||||
|
|
|
|
|
| |||||||
Total expenses | 34,979 | 4,456 | 2,322 | |||||||||
|
|
|
|
|
| |||||||
Less fees waived | (2,338 | ) | (261 | ) | (34 | ) | ||||||
Less expense reimbursements | (93 | ) | (5 | ) | — | |||||||
|
|
|
|
|
| |||||||
Net expenses | 32,548 | 4,190 | 2,288 | |||||||||
|
|
|
|
|
| |||||||
Net investment income (loss) | 8,903 | 15,950 | 3,217 | |||||||||
|
|
|
|
|
| |||||||
REALIZED/UNREALIZED GAINS (LOSSES): | ||||||||||||
Net realized gain (loss) on transactions from: | ||||||||||||
Investments innon-affiliates | (58,837 | )(b) | (95,298 | ) | (32,466 | ) | ||||||
Investments in affiliates | (59 | ) | (3 | ) | 15 | |||||||
Futures contracts | — | 2,657 | 2,810 | |||||||||
Foreign currency transactions | 594 | (1,159 | ) | 122 | ||||||||
|
|
|
|
|
| |||||||
Net realized gain (loss) | (58,302 | ) | (93,803 | ) | (29,519 | ) | ||||||
|
|
|
|
|
| |||||||
Change in net unrealized appreciation/depreciation on: | ||||||||||||
Investments innon-affiliates | (806,995 | )(c) | (267,850 | ) | (59,429 | ) | ||||||
Investments in affiliates | 137 | 21 | 12 | |||||||||
Futures contracts | — | 2,062 | 301 | |||||||||
Foreign currency translations | (261 | ) | (88 | ) | (8 | ) | ||||||
|
|
|
|
|
| |||||||
Change in net unrealized appreciation/depreciation | (807,119 | ) | (265,855 | ) | (59,124 | ) | ||||||
|
|
|
|
|
| |||||||
Net realized/unrealized gains (losses) | (865,421 | ) | (359,658 | ) | (88,643 | ) | ||||||
|
|
|
|
|
| |||||||
Change in net assets resulting from operations | $ | (856,518 | ) | $ | (343,708 | ) | $ | (85,426 | ) | |||
|
|
|
|
|
| |||||||
| (a) | Amount rounds to less than one thousand. |
| (b) | Net of foreign capital gains tax of approximately $(145,000) for JPMorgan Emerging Markets Equity Fund. |
| (c) | Net of change in foreign capital gains tax of approximately $19,418,000 for JPMorgan Emerging Markets Equity Fund. |
SEE NOTES TO FINANCIAL STATEMENTS.
| 66 | J.P. MORGAN INTERNATIONAL EQUITY FUNDS | APRIL 30, 2020 | ||||
Table of Contents
| JPMorgan International Advantage Fund | JPMorgan International Equity Fund | JPMorgan International Focus Fund (formerly known as JPMorgan International Unconstrained Equity Fund) | ||||||||||
INVESTMENT INCOME: | ||||||||||||
Interest income fromnon-affiliates | $ | 21 | $ | 3 | $ | — | (a) | |||||
Interest income from affiliates | — | — | 5 | |||||||||
Dividend income fromnon-affiliates | 26,357 | 34,007 | 24,951 | |||||||||
Dividend income from affiliates | 311 | 370 | 343 | |||||||||
Income from securities lending (net) (See Note 2.C.) | 75 | 96 | 87 | |||||||||
Foreign taxes withheld (net) | (2,203 | ) | (2,825 | ) | (1,762 | ) | ||||||
|
|
|
|
|
| |||||||
Total investment income | 24,561 | 31,651 | 23,624 | |||||||||
|
|
|
|
|
| |||||||
EXPENSES: | ||||||||||||
Investment advisory fees | 4,613 | 7,251 | 8,080 | |||||||||
Administration fees | 692 | 1,088 | 1,010 | |||||||||
Distribution fees: | ||||||||||||
Class A | 155 | 400 | 150 | |||||||||
Class C | 5 | 49 | 66 | |||||||||
Class R2 | 70 | 5 | 3 | |||||||||
Service fees: | ||||||||||||
Class A | 155 | 400 | 150 | |||||||||
Class C | 2 | 16 | 22 | |||||||||
Class I | 93 | 243 | 249 | |||||||||
Class R2 | 35 | 3 | 2 | |||||||||
Class R5 | — | 2 | 1 | |||||||||
Custodian and accounting fees | 222 | 262 | 100 | |||||||||
Interest expense to affiliates | 23 | 13 | 29 | |||||||||
Professional fees | 70 | 69 | 50 | |||||||||
Trustees’ and Chief Compliance Officer’s fees | 17 | 20 | 17 | |||||||||
Printing and mailing costs | 8 | 29 | 21 | |||||||||
Registration and filing fees | 45 | 54 | 72 | |||||||||
Transfer agency fees (See Note 2.J.) | 45 | 38 | 22 | |||||||||
Other | 30 | 29 | 20 | |||||||||
|
|
|
|
|
| |||||||
Total expenses | 6,280 | 9,971 | 10,064 | |||||||||
|
|
|
|
|
| |||||||
Less fees waived | (1,214 | ) | (1,769 | ) | (2,113 | ) | ||||||
Less expense reimbursements | — | (a) | (1 | ) | (7 | ) | ||||||
|
|
|
|
|
| |||||||
Net expenses | 5,066 | 8,201 | 7,944 | |||||||||
|
|
|
|
|
| |||||||
Net investment income (loss) | 19,495 | 23,450 | 15,680 | |||||||||
|
|
|
|
|
| |||||||
REALIZED/UNREALIZED GAINS (LOSSES): | ||||||||||||
Net realized gain (loss) on transactions from: | ||||||||||||
Investments innon-affiliates | (91,235 | ) | (70,225 | ) | (167,850 | ) | ||||||
Investments in affiliates | (48 | ) | (29 | ) | 18 | |||||||
Futures contracts | (5,042 | ) | — | — | ||||||||
Foreign currency transactions | 471 | (42 | ) | (1,503 | ) | |||||||
|
|
|
|
|
| |||||||
Net realized gain (loss) | (95,854 | ) | (70,296 | ) | (169,335 | ) | ||||||
|
|
|
|
|
| |||||||
Change in net unrealized appreciation/depreciation on: | ||||||||||||
Investments innon-affiliates | (253,979 | ) | (337,081 | ) | (121,074 | ) | ||||||
Investments in affiliates | 24 | 20 | 47 | |||||||||
Futures contracts | (1,426 | ) | — | — | ||||||||
Foreign currency translations | 66 | 168 | 119 | |||||||||
|
|
|
|
|
| |||||||
Change in net unrealized appreciation/depreciation | (255,315 | ) | (336,893 | ) | (120,908 | ) | ||||||
|
|
|
|
|
| |||||||
Net realized/unrealized gains (losses) | (351,169 | ) | (407,189 | ) | (290,243 | ) | ||||||
|
|
|
|
|
| |||||||
Change in net assets resulting from operations | $ | (331,674 | ) | $ | (383,739 | ) | $ | (274,563 | ) | |||
|
|
|
|
|
| |||||||
| (a) | Amount rounds to less than one thousand. |
SEE NOTES TO FINANCIAL STATEMENTS.
| APRIL 30, 2020 | J.P. MORGAN INTERNATIONAL EQUITY FUNDS | 67 | ||||||
Table of Contents
STATEMENTS OF OPERATIONS
FOR THE SIX MONTHS ENDED APRIL 30, 2020 (Unaudited) (continued)
(Amounts in thousands)
| JPMorgan International Hedged Equity Fund | JPMorgan | JPMorgan International Value Fund | ||||||||||
INVESTMENT INCOME: |
| |||||||||||
Interest income fromnon-affiliates | $ | 1 | $ | 39 | $ | 3 | ||||||
Interest income from affiliates | — | (a) | — | (a) | — | |||||||
Dividend income fromnon-affiliates | 1,397 | 68,634 | 6,519 | |||||||||
Dividend income from affiliates | 20 | 1,357 | 63 | |||||||||
Income from securities lending (net) (See Note 2.C.) | — | 136 | 35 | |||||||||
Foreign taxes withheld (net) | (131 | ) | (7,045 | ) | (725 | ) | ||||||
|
|
|
|
|
| |||||||
Total investment income | 1,287 | 63,121 | 5,895 | |||||||||
|
|
|
|
|
| |||||||
EXPENSES: | ||||||||||||
Investment advisory fees | 109 | 4,807 | 956 | |||||||||
Administration fees | 33 | 1,803 | 130 | |||||||||
Distribution fees: | ||||||||||||
Class A | 1 | 248 | 203 | |||||||||
Class C | — | (a) | — | 29 | ||||||||
Class R2 | — | — | 1 | |||||||||
Service fees: | ||||||||||||
Class A | 1 | 248 | 203 | |||||||||
Class C | — | (a) | — | 9 | ||||||||
Class I | 108 | 277 | 51 | |||||||||
Class L | — | — | 13 | |||||||||
Class R2 | — | — | 1 | |||||||||
Class R5 | — | (a) | — | — | (a) | |||||||
Custodian and accounting fees | 47 | 344 | 57 | |||||||||
Interest expense to affiliates | 3 | 13 | 2 | |||||||||
Professional fees | 55 | 96 | 54 | |||||||||
Trustees’ and Chief Compliance Officer’s fees | 12 | 21 | 13 | |||||||||
Printing and mailing costs | 1 | 123 | 17 | |||||||||
Registration and filing fees | 35 | 7 | 48 | |||||||||
Transfer agency fees (See Note 2.J.) | 1 | 47 | 10 | |||||||||
Offering costs (See Note 2.H.) | 39 | — | — | |||||||||
Other | 6 | 75 | 5 | |||||||||
|
|
|
|
|
| |||||||
Total expenses | 451 | 8,109 | 1,802 | |||||||||
|
|
|
|
|
| |||||||
Less fees waived | (131 | ) | (1,788 | ) | (393 | ) | ||||||
Less expense reimbursements | (56 | ) | — | — | (a) | |||||||
|
|
|
|
|
| |||||||
Net expenses | 264 | 6,321 | 1,409 | |||||||||
|
|
|
|
|
| |||||||
Net investment income (loss) | 1,023 | 56,800 | 4,486 | |||||||||
|
|
|
|
|
| |||||||
REALIZED/UNREALIZED GAINS (LOSSES): | ||||||||||||
Net realized gain (loss) on transactions from: | ||||||||||||
Investments innon-affiliates | (6,903 | ) | (264,291 | ) | (16,043 | ) | ||||||
Investments in affiliates | — | (55 | ) | 2 | ||||||||
Options purchased | 23,651 | — | — | |||||||||
Futures contracts | (760 | ) | (32,296 | ) | (1,685 | ) | ||||||
Foreign currency transactions | (21 | ) | (1,379 | ) | (83 | ) | ||||||
Options written | (12,085 | ) | — | — | ||||||||
|
|
|
|
|
| |||||||
Net realized gain (loss) | 3,882 | (298,021 | ) | (17,809 | ) | |||||||
|
|
|
|
|
| |||||||
Change in net unrealized appreciation/depreciation on: | ||||||||||||
Investments innon-affiliates | (6,452 | ) | (525,910 | ) | (72,619 | ) | ||||||
Investments in affiliates | — | 122 | 3 | |||||||||
Options purchased | (4,937 | ) | — | — | ||||||||
Futures contracts | 252 | 9,940 | 453 | |||||||||
Foreign currency translations | 10 | 559 | 16 | |||||||||
Options written | (2,683 | ) | — | — | ||||||||
|
|
|
|
|
| |||||||
Change in net unrealized appreciation/depreciation | (13,810 | ) | (515,289 | ) | (72,147 | ) | ||||||
|
|
|
|
|
| |||||||
Net realized/unrealized gains (losses) | (9,928 | ) | (813,310 | ) | (89,956 | ) | ||||||
|
|
|
|
|
| |||||||
Change in net assets resulting from operations | $ | (8,905 | ) | $ | (756,510 | ) | $ | (85,470 | ) | |||
|
|
|
|
|
| |||||||
| (a) | Amount rounds to less than one thousand. |
SEE NOTES TO FINANCIAL STATEMENTS.
| 68 | J.P. MORGAN INTERNATIONAL EQUITY FUNDS | APRIL 30, 2020 | ||||
Table of Contents
STATEMENTS OF CHANGES IN NET ASSETS
FOR THE PERIODS INDICATED
(Amounts in thousands)
| JPMorgan Emerging Markets Equity Fund | JPMorgan Emerging Markets Research Enhanced Equity Fund | |||||||||||||||
| Six Months Ended April 30, 2020 (Unaudited) | Year Ended October 31, 2019 | Six Months Ended April 30, 2020 (Unaudited) | Period Ended October 31, 2019 (a) | |||||||||||||
CHANGE IN NET ASSETS RESULTING FROM OPERATIONS: | ||||||||||||||||
Net investment income (loss) | $ | 8,903 | $ | 55,860 | $ | 15,950 | $ | 11,213 | ||||||||
Net realized gain (loss) | (58,302 | ) | (2,141 | ) | (93,803 | ) | 2,423 | |||||||||
Change in net unrealized appreciation/depreciation | (807,119 | ) | 1,186,420 | (265,855 | ) | 40,909 | ||||||||||
|
|
|
|
|
|
|
| |||||||||
Change in net assets resulting from operations | (856,518 | ) | 1,240,139 | (343,708 | ) | 54,545 | ||||||||||
|
|
|
|
|
|
|
| |||||||||
DISTRIBUTIONS TO SHAREHOLDERS: | ||||||||||||||||
Class A | (3,084 | ) | (1,554 | ) | — | — | ||||||||||
Class C | (79 | ) | (59 | ) | — | — | ||||||||||
Class I (b) | (15,303 | ) | (6,646 | ) | — | (c) | — | |||||||||
Class L | (8,491 | ) | (4,471 | ) | — | — | ||||||||||
Class R2 | (1 | ) | (1 | ) | — | — | ||||||||||
Class R3 | (21 | ) | (1 | ) | — | — | ||||||||||
Class R4 | (11 | ) | (11 | ) | — | — | ||||||||||
Class R5 | (349 | ) | (296 | ) | — | — | ||||||||||
Class R6 | (29,101 | ) | (30,900 | ) | (24,046 | ) | (26 | ) | ||||||||
|
|
|
|
|
|
|
| |||||||||
Total distributions to shareholders | (56,440 | ) | (43,939 | ) | (24,046 | ) | (26 | ) | ||||||||
|
|
|
|
|
|
|
| |||||||||
CAPITAL TRANSACTIONS: | ||||||||||||||||
Change in net assets resulting from capital transactions | 2,385,042 | 516,272 | 660,085 | 2,036,055 | ||||||||||||
|
|
|
|
|
|
|
| |||||||||
NET ASSETS: | ||||||||||||||||
Change in net assets | 1,472,084 | 1,712,472 | 292,331 | 2,090,574 | ||||||||||||
Beginning of period | 6,313,677 | 4,601,205 | 2,090,574 | — | ||||||||||||
|
|
|
|
|
|
|
| |||||||||
End of period | $ | 7,785,761 | $ | 6,313,677 | $ | 2,382,905 | $ | 2,090,574 | ||||||||
|
|
|
|
|
|
|
| |||||||||
| (a) | Commencement of operations was December 11, 2018. |
| (b) | Commencement of offering of class of shares effective January 30, 2019 for JPMorgan Emerging Markets Research Enhanced Equity Fund. |
| (c) | Amount rounds to less than one thousand. |
SEE NOTES TO FINANCIAL STATEMENTS.
| APRIL 30, 2020 | J.P. MORGAN INTERNATIONAL EQUITY FUNDS | 69 | ||||||
Table of Contents
STATEMENTS OF CHANGES IN NET ASSETS
FOR THE PERIODS INDICATED (continued)
(Amounts in thousands)
| JPMorgan Europe Dynamic Fund | JPMorgan International Advantage Fund | |||||||||||||||
| Six Months Ended April 30, 2020 (Unaudited) | Year Ended October 31, 2019 | Six Months Ended April 30, 2020 (Unaudited) | Year Ended October 31, 2019 | |||||||||||||
CHANGE IN NET ASSETS RESULTING FROM OPERATIONS: | ||||||||||||||||
Net investment income (loss) | $ | 3,217 | $ | 16,941 | $ | 19,495 | $ | 104,540 | ||||||||
Net realized gain (loss) | (29,519 | ) | (56,539 | ) | (95,854 | ) | (246,836 | ) | ||||||||
Change in net unrealized appreciation/depreciation | (59,124 | ) | 83,325 | (255,315 | ) | 254,655 | ||||||||||
|
|
|
|
|
|
|
| |||||||||
Change in net assets resulting from operations | (85,426 | ) | 43,727 | (331,674 | ) | 112,359 | ||||||||||
|
|
|
|
|
|
|
| |||||||||
DISTRIBUTIONS TO SHAREHOLDERS: | ||||||||||||||||
Class A | (2,780 | ) | (2,841 | ) | (8,620 | ) | (3,427 | ) | ||||||||
Class C | (497 | ) | (583 | ) | (54 | ) | (25 | ) | ||||||||
Class I | (2,605 | ) | (3,245 | ) | (5,381 | ) | (1,458 | ) | ||||||||
Class L | (2,069 | ) | (2,456 | ) | — | — | ||||||||||
Class R2 | — | — | (1,467 | ) | (638 | ) | ||||||||||
Class R6 | (8,878 | ) | (7,813 | ) | (92,520 | ) | (82,457 | ) | ||||||||
|
|
|
|
|
|
|
| |||||||||
Total distributions to shareholders | (16,829 | ) | (16,938 | ) | (108,042 | ) | (88,005 | ) | ||||||||
|
|
|
|
|
|
|
| |||||||||
CAPITAL TRANSACTIONS: | ||||||||||||||||
Change in net assets resulting from capital transactions | (22,535 | ) | (169,891 | ) | 123,217 | (1,616,261 | ) | |||||||||
|
|
|
|
|
|
|
| |||||||||
NET ASSETS: | ||||||||||||||||
Change in net assets | (124,790 | ) | (143,102 | ) | (316,499 | ) | (1,591,907 | ) | ||||||||
Beginning of period | 542,245 | 685,347 | 1,811,349 | 3,403,256 | ||||||||||||
|
|
|
|
|
|
|
| |||||||||
End of period | $ | 417,455 | $ | 542,245 | $ | 1,494,850 | $ | 1,811,349 | ||||||||
|
|
|
|
|
|
|
| |||||||||
SEE NOTES TO FINANCIAL STATEMENTS.
| 70 | J.P. MORGAN INTERNATIONAL EQUITY FUNDS | APRIL 30, 2020 | ||||
Table of Contents
| JPMorgan International Equity Fund | JPMorgan International Focus Fund (formerly known as JPMorgan International Unconstrained Equity Fund) | |||||||||||||||
| Six Months Ended April 30, 2020 (Unaudited) | Year Ended October 31, 2019 | Six Months Ended April 30, 2020 (Unaudited) | Year Ended October 31, 2019 | |||||||||||||
CHANGE IN NET ASSETS RESULTING FROM OPERATIONS: | ||||||||||||||||
Net investment income (loss) | $ | 23,450 | $ | 101,506 | $ | 15,680 | $ | 8,884 | ||||||||
Net realized gain (loss) | (70,296 | ) | (46,740 | ) | (169,335 | ) | (22,506 | ) | ||||||||
Change in net unrealized appreciation/depreciation | (336,893 | ) | 522,611 | (120,908 | ) | 157,799 | ||||||||||
|
|
|
|
|
|
|
| |||||||||
Change in net assets resulting from operations | (383,739 | ) | 577,377 | (274,563 | ) | 144,177 | ||||||||||
|
|
|
|
|
|
|
| |||||||||
DISTRIBUTIONS TO SHAREHOLDERS: | ||||||||||||||||
Class A | (9,505 | ) | (8,158 | ) | (46 | ) | (1,618 | ) | ||||||||
Class C | (344 | ) | (520 | ) | — | (296 | ) | |||||||||
Class I | (6,207 | ) | (5,904 | ) | (431 | ) | (3,745 | ) | ||||||||
Class R2 | (65 | ) | (56 | ) | — | (15 | ) | |||||||||
Class R5 | (124 | ) | (691 | ) | (9 | ) | (72 | ) | ||||||||
Class R6 | (80,146 | ) | (140,365 | ) | (10,047 | ) | (4,394 | ) | ||||||||
|
|
|
|
|
|
|
| |||||||||
Total distributions to shareholders | (96,391 | ) | (155,694 | ) | (10,533 | ) | (10,140 | ) | ||||||||
|
|
|
|
|
|
|
| |||||||||
CAPITAL TRANSACTIONS: | ||||||||||||||||
Change in net assets resulting from capital transactions | 150,578 | (1,693,771 | ) | 220,711 | 1,990,374 | |||||||||||
|
|
|
|
|
|
|
| |||||||||
NET ASSETS: | ||||||||||||||||
Change in net assets | (329,552 | ) | (1,272,088 | ) | (64,385 | ) | 2,124,411 | |||||||||
Beginning of period | 2,997,006 | 4,269,094 | 2,599,641 | 475,230 | ||||||||||||
|
|
|
|
|
|
|
| |||||||||
End of period | $ | 2,667,454 | $ | 2,997,006 | $ | 2,535,256 | $ | 2,599,641 | ||||||||
|
|
|
|
|
|
|
| |||||||||
SEE NOTES TO FINANCIAL STATEMENTS.
| APRIL 30, 2020 | J.P. MORGAN INTERNATIONAL EQUITY FUNDS | 71 | ||||||
Table of Contents
STATEMENTS OF CHANGES IN NET ASSETS
FOR THE PERIODS INDICATED (continued)
(Amounts in thousands)
| JPMorgan International Hedged Equity Fund | JPMorgan International Research Enhanced Equity Fund | |||||||||||||||
| Six Months Ended April 30, 2020 (Unaudited) | Period Ended October 31, 2019 (a) | Six Months Ended April 30, 2020 (Unaudited) | Year Ended October 31, 2019 | |||||||||||||
CHANGE IN NET ASSETS RESULTING FROM OPERATIONS: | ||||||||||||||||
Net investment income (loss) | $ | 1,023 | $ | 1,122 | $ | 56,800 | $ | 151,040 | ||||||||
Net realized gain (loss) | 3,882 | 10 | (298,021 | ) | (161,154 | ) | ||||||||||
Change in net unrealized appreciation/depreciation | (13,810 | ) | 1,073 | (515,289 | ) | 483,831 | ||||||||||
|
|
|
|
|
|
|
| |||||||||
Change in net assets resulting from operations | (8,905 | ) | 2,205 | (756,510 | ) | 473,717 | ||||||||||
|
|
|
|
|
|
|
| |||||||||
DISTRIBUTIONS TO SHAREHOLDERS: | ||||||||||||||||
Class A | (5 | ) | — | (5,482 | ) | (6,271 | ) | |||||||||
Class C | (1 | ) | — | — | — | |||||||||||
Class I | (1,362 | ) | — | (6,829 | ) | (5,060 | ) | |||||||||
Class R5 | — | (b) | — | — | — | |||||||||||
Class R6 | (1 | ) | — | (143,050 | ) | (149,729 | ) | |||||||||
|
|
|
|
|
|
|
| |||||||||
Total distributions to shareholders | (1,369 | ) | — | (155,361 | ) | (161,060 | ) | |||||||||
|
|
|
|
|
|
|
| |||||||||
CAPITAL TRANSACTIONS: | ||||||||||||||||
Change in net assets resulting from capital transactions | 45,499 | 58,037 | 381,107 | (178,801 | ) | |||||||||||
|
|
|
|
|
|
|
| |||||||||
NET ASSETS: | ||||||||||||||||
Change in net assets | 35,225 | 60,242 | (530,764 | ) | 133,856 | |||||||||||
Beginning of period | 60,242 | — | 4,834,474 | 4,700,618 | ||||||||||||
|
|
|
|
|
|
|
| |||||||||
End of period | $ | 95,467 | $ | 60,242 | $ | 4,303,710 | $ | 4,834,474 | ||||||||
|
|
|
|
|
|
|
| |||||||||
| (a) | Commencement of operations was March 15, 2019. |
| (b) | Amount rounds to less than one thousand. |
SEE NOTES TO FINANCIAL STATEMENTS.
| 72 | J.P. MORGAN INTERNATIONAL EQUITY FUNDS | APRIL 30, 2020 | ||||
Table of Contents
| JPMorgan International Value Fund | ||||||||
| Six Months Ended April 30, 2020 (Unaudited) | Year Ended October 31, 2019 | |||||||
CHANGE IN NET ASSETS RESULTING FROM OPERATIONS: | ||||||||
Net investment income (loss) | $ | 4,486 | $ | 16,269 | ||||
Net realized gain (loss) | (17,809 | ) | (46,232 | ) | ||||
Change in net unrealized appreciation/depreciation | (72,147 | ) | 36,164 | |||||
|
|
|
| |||||
Change in net assets resulting from operations | (85,470 | ) | 6,201 | |||||
|
|
|
| |||||
DISTRIBUTIONS TO SHAREHOLDERS: | ||||||||
Class A | (7,133 | ) | (7,451 | ) | ||||
Class C | (299 | ) | (419 | ) | ||||
Class I | (1,823 | ) | (2,481 | ) | ||||
Class L | (1,237 | ) | (2,611 | ) | ||||
Class R2 | (21 | ) | (40 | ) | ||||
Class R5 | (4 | ) | (3 | ) | ||||
Class R6 | (5,532 | ) | (5,309 | ) | ||||
|
|
|
| |||||
Total distributions to shareholders | (16,049 | ) | (18,314 | ) | ||||
|
|
|
| |||||
CAPITAL TRANSACTIONS: | ||||||||
Change in net assets resulting from capital transactions | (17,063 | ) | (116,184 | ) | ||||
|
|
|
| |||||
NET ASSETS: | ||||||||
Change in net assets | (118,582 | ) | (128,297 | ) | ||||
Beginning of period | 393,272 | 521,569 | ||||||
|
|
|
| |||||
End of period | $ | 274,690 | $ | 393,272 | ||||
|
|
|
| |||||
SEE NOTES TO FINANCIAL STATEMENTS.
| APRIL 30, 2020 | J.P. MORGAN INTERNATIONAL EQUITY FUNDS | 73 | ||||||
Table of Contents
STATEMENTS OF CHANGES IN NET ASSETS
FOR THE PERIODS INDICATED (continued)
(Amounts in thousands)
| JPMorgan Emerging Markets Equity Fund | JPMorgan Emerging Markets Research Enhanced Equity Fund | |||||||||||||||
| Six Months Ended April 30, 2020 (Unaudited) | Year Ended October 31, 2019 | Six Months Ended April 30, 2020 (Unaudited) | Period Ended October 31, 2019 (a) | |||||||||||||
CAPITAL TRANSACTIONS: | ||||||||||||||||
Class A | ||||||||||||||||
Proceeds from shares issued | $ | 237,869 | $ | 312,341 | $ | — | $ | — | ||||||||
Distributions reinvested | 3,026 | 1,529 | — | — | ||||||||||||
Cost of shares redeemed | (153,385 | ) | (252,175 | ) | — | — | ||||||||||
|
|
|
|
|
|
|
| |||||||||
Change in net assets resulting from Class A capital transactions | $ | 87,510 | $ | 61,695 | $ | — | $ | — | ||||||||
|
|
|
|
|
|
|
| |||||||||
Class C | ||||||||||||||||
Proceeds from shares issued | $ | 16,153 | $ | 19,144 | $ | — | $ | — | ||||||||
Distributions reinvested | 76 | 58 | — | — | ||||||||||||
Cost of shares redeemed | (10,577 | ) | (17,205 | ) | — | — | ||||||||||
|
|
|
|
|
|
|
| |||||||||
Change in net assets resulting from Class C capital transactions | $ | 5,652 | $ | 1,997 | $ | — | $ | — | ||||||||
|
|
|
|
|
|
|
| |||||||||
Class I(b) | ||||||||||||||||
Proceeds from shares issued | $ | 1,606,660 | $ | 1,177,539 | $ | 8 | $ | 12,188 | ||||||||
Distributions reinvested | 13,741 | 5,945 | — | (c) | — | |||||||||||
Cost of shares redeemed | (614,642 | ) | (465,628 | ) | (3 | ) | (11,910 | ) | ||||||||
|
|
|
|
|
|
|
| |||||||||
Change in net assets resulting from Class I capital transactions | $ | 1,005,759 | $ | 717,856 | $ | 5 | $ | 278 | ||||||||
|
|
|
|
|
|
|
| |||||||||
Class L | ||||||||||||||||
Proceeds from shares issued | $ | 571,163 | $ | 534,452 | $ | — | $ | — | ||||||||
Distributions reinvested | 8,347 | 3,845 | — | — | ||||||||||||
Cost of shares redeemed | (226,907 | ) | (228,859 | ) | — | — | ||||||||||
|
|
|
|
|
|
|
| |||||||||
Change in net assets resulting from Class L capital transactions | $ | 352,603 | $ | 309,438 | $ | — | $ | — | ||||||||
|
|
|
|
|
|
|
| |||||||||
Class R2 | ||||||||||||||||
Proceeds from shares issued | $ | 117 | $ | 51 | $ | — | $ | — | ||||||||
Distributions reinvested | 1 | 1 | — | — | ||||||||||||
Cost of shares redeemed | (26 | ) | (26 | ) | — | — | ||||||||||
|
|
|
|
|
|
|
| |||||||||
Change in net assets resulting from Class R2 capital transactions | $ | 92 | $ | 26 | $ | — | $ | — | ||||||||
|
|
|
|
|
|
|
| |||||||||
Class R3 | ||||||||||||||||
Proceeds from shares issued | $ | 2,020 | $ | 2,108 | $ | — | $ | — | ||||||||
Distributions reinvested | 21 | 1 | — | — | ||||||||||||
Cost of shares redeemed | (521 | ) | (478 | ) | — | — | ||||||||||
|
|
|
|
|
|
|
| |||||||||
Change in net assets resulting from Class R3 capital transactions | $ | 1,520 | $ | 1,631 | $ | — | $ | — | ||||||||
|
|
|
|
|
|
|
| |||||||||
Class R4 | ||||||||||||||||
Proceeds from shares issued | $ | 1,087 | $ | 1,602 | $ | — | $ | — | ||||||||
Distributions reinvested | 11 | 11 | — | — | ||||||||||||
Cost of shares redeemed | (243 | ) | (608 | ) | — | — | ||||||||||
|
|
|
|
|
|
|
| |||||||||
Change in net assets resulting from Class R4 capital transactions | $ | 855 | $ | 1,005 | $ | — | $ | — | ||||||||
|
|
|
|
|
|
|
| |||||||||
Class R5 | ||||||||||||||||
Proceeds from shares issued | $ | 10,691 | $ | 42,685 | $ | — | $ | — | ||||||||
Distributions reinvested | 349 | 296 | — | — | ||||||||||||
Cost of shares redeemed | (7,875 | ) | (9,680 | ) | — | — | ||||||||||
|
|
|
|
|
|
|
| |||||||||
Change in net assets resulting from Class R5 capital transactions | $ | 3,165 | $ | 33,301 | $ | — | $ | — | ||||||||
|
|
|
|
|
|
|
| |||||||||
Class R6 | ||||||||||||||||
Proceeds from shares issued | $ | 1,233,624 | $ | 1,266,740 | $ | 821,949 | $ | 2,052,510 | ||||||||
Distributions reinvested | 28,461 | 30,363 | 24,046 | 26 | ||||||||||||
Cost of shares redeemed | (334,199 | ) | (1,907,780 | ) | (185,915 | ) | (16,759 | ) | ||||||||
|
|
|
|
|
|
|
| |||||||||
Change in net assets resulting from Class R6 capital transactions | $ | 927,886 | $ | (610,677 | ) | $ | 660,080 | $ | 2,035,777 | |||||||
|
|
|
|
|
|
|
| |||||||||
Total change in net assets resulting from capital transactions | $ | 2,385,042 | $ | 516,272 | $ | 660,085 | $ | 2,036,055 | ||||||||
|
|
|
|
|
|
|
| |||||||||
| (a) | Commencement of operations was December 11, 2018. |
| (b) | Commencement of offering of class of shares effective January 30, 2019 for JPMorgan Emerging Markets Research Enhanced Equity Fund. |
| (c) | Amount rounds to less than one thousand. |
SEE NOTES TO FINANCIAL STATEMENTS.
| 74 | J.P. MORGAN INTERNATIONAL EQUITY FUNDS | APRIL 30, 2020 | ||||
Table of Contents
| JPMorgan Emerging Markets Equity Fund | JPMorgan Emerging Markets Research Enhanced Equity Fund | |||||||||||||||
| Six Months Ended April 30, 2020 (Unaudited) | Year Ended October 31, 2019 | Six Months Ended April 30, 2020 (Unaudited) | Period Ended October 31, 2019 (a) | |||||||||||||
SHARE TRANSACTIONS: | ||||||||||||||||
Class A | ||||||||||||||||
Issued | 7,867 | 11,352 | — | — | ||||||||||||
Reinvested | 95 | 64 | — | — | ||||||||||||
Redeemed | (5,439 | ) | (9,475 | ) | — | — | ||||||||||
|
|
|
|
|
|
|
| |||||||||
Change in Class A Shares | 2,523 | 1,941 | — | — | ||||||||||||
|
|
|
|
|
|
|
| |||||||||
Class C | ||||||||||||||||
Issued | 544 | 712 | — | — | ||||||||||||
Reinvested | 2 | 3 | — | — | ||||||||||||
Redeemed | (394 | ) | (650 | ) | — | — | ||||||||||
|
|
|
|
|
|
|
| |||||||||
Change in Class C Shares | 152 | 65 | — | — | ||||||||||||
|
|
|
|
|
|
|
| |||||||||
Class I(b) | ||||||||||||||||
Issued | 54,439 | 41,001 | 1 | 744 | ||||||||||||
Reinvested | 423 | 243 | — | (c) | — | |||||||||||
Redeemed | (21,567 | ) | (16,821 | ) | — | (c) | (744 | ) | ||||||||
|
|
|
|
|
|
|
| |||||||||
Change in Class I Shares | 33,295 | 24,423 | 1 | — | (c) | |||||||||||
|
|
|
|
|
|
|
| |||||||||
Class L | ||||||||||||||||
Issued | 19,333 | 18,682 | — | — | ||||||||||||
Reinvested | 255 | 156 | — | — | ||||||||||||
Redeemed | (8,024 | ) | (8,295 | ) | — | — | ||||||||||
|
|
|
|
|
|
|
| |||||||||
Change in Class L Shares | 11,564 | 10,543 | — | — | ||||||||||||
|
|
|
|
|
|
|
| |||||||||
Class R2 | ||||||||||||||||
Issued | 4 | 2 | — | — | ||||||||||||
Reinvested | — | (c) | — | (c) | — | — | ||||||||||
Redeemed | (1 | ) | (1 | ) | — | — | ||||||||||
|
|
|
|
|
|
|
| |||||||||
Change in Class R2 Shares | 3 | 1 | — | — | ||||||||||||
|
|
|
|
|
|
|
| |||||||||
Class R3 | ||||||||||||||||
Issued | 71 | 75 | — | — | ||||||||||||
Reinvested | 1 | — | (c) | — | — | |||||||||||
Redeemed | (18 | ) | (17 | ) | — | — | ||||||||||
|
|
|
|
|
|
|
| |||||||||
Change in Class R3 Shares | 54 | 58 | — | — | ||||||||||||
|
|
|
|
|
|
|
| |||||||||
Class R4 | ||||||||||||||||
Issued | 36 | 62 | — | — | ||||||||||||
Reinvested | — | (c) | — | (c) | — | — | ||||||||||
Redeemed | (8 | ) | (21 | ) | — | — | ||||||||||
|
|
|
|
|
|
|
| |||||||||
Change in Class R4 Shares | 28 | 41 | — | — | ||||||||||||
|
|
|
|
|
|
|
| |||||||||
Class R5 | ||||||||||||||||
Issued | 366 | 1,616 | — | — | ||||||||||||
Reinvested | 11 | 12 | — | — | ||||||||||||
Redeemed | (257 | ) | (344 | ) | — | — | ||||||||||
|
|
|
|
|
|
|
| |||||||||
Change in Class R5 Shares | 120 | 1,284 | — | — | ||||||||||||
|
|
|
|
|
|
|
| |||||||||
Class R6 | ||||||||||||||||
Issued | 40,965 | 43,818 | 47,861 | 125,486 | ||||||||||||
Reinvested | 871 | 1,233 | 1,356 | 2 | ||||||||||||
Redeemed | (11,337 | ) | (66,518 | ) | (11,415 | ) | (1,027 | ) | ||||||||
|
|
|
|
|
|
|
| |||||||||
Change in Class R6 Shares | 30,499 | (21,467 | ) | 37,802 | 124,461 | |||||||||||
|
|
|
|
|
|
|
| |||||||||
| (a) | Commencement of operations was December 11, 2018. |
| (b) | Commencement of offering of class of shares effective January 30, 2019 for JPMorgan Emerging Markets Research Enhanced Equity Fund. |
| (c) | Amount rounds to less than one thousand. |
SEE NOTES TO FINANCIAL STATEMENTS.
| APRIL 30, 2020 | J.P. MORGAN INTERNATIONAL EQUITY FUNDS | 75 | ||||||
Table of Contents
STATEMENTS OF CHANGES IN NET ASSETS
FOR THE PERIODS INDICATED (continued)
(Amounts in thousands)
| JPMorgan Europe Dynamic Fund | JPMorgan International Advantage Fund | |||||||||||||||
| Six Months Ended April 30, 2020 (Unaudited) | Year Ended October 31, 2019 | Six Months Ended April 30, 2020 (Unaudited) | Year Ended October 31, 2019 | |||||||||||||
CAPITAL TRANSACTIONS: | ||||||||||||||||
Class A | ||||||||||||||||
Proceeds from shares issued | $ | 1,788 | $ | 5,583 | $ | 54,404 | $ | 38,451 | ||||||||
Distributions reinvested | 2,695 | 2,751 | 8,609 | 3,422 | ||||||||||||
Cost of shares redeemed | (14,953 | ) | (39,739 | ) | (174,742 | ) | (45,280 | ) | ||||||||
|
|
|
|
|
|
|
| |||||||||
Change in net assets resulting from Class A capital transactions | $ | (10,470 | ) | $ | (31,405 | ) | $ | (111,729 | ) | $ | (3,407 | ) | ||||
|
|
|
|
|
|
|
| |||||||||
Class C | ||||||||||||||||
Proceeds from shares issued | $ | 126 | $ | 246 | $ | 114 | $ | 175 | ||||||||
Distributions reinvested | 476 | 552 | 54 | 25 | ||||||||||||
Cost of shares redeemed | (4,283 | ) | (12,991 | ) | (193 | ) | (662 | ) | ||||||||
|
|
|
|
|
|
|
| |||||||||
Change in net assets resulting from Class C capital transactions | $ | (3,681 | ) | $ | (12,193 | ) | $ | (25 | ) | $ | (462 | ) | ||||
|
|
|
|
|
|
|
| |||||||||
Class I | ||||||||||||||||
Proceeds from shares issued | $ | 3,354 | $ | 10,005 | $ | 45,514 | $ | 19,041 | ||||||||
Distributions reinvested | 2,443 | 3,023 | 5,375 | 1,457 | ||||||||||||
Cost of shares redeemed | (20,510 | ) | (69,458 | ) | (71,431 | ) | (15,652 | ) | ||||||||
|
|
|
|
|
|
|
| |||||||||
Change in net assets resulting from Class I capital transactions | $ | (14,713 | ) | $ | (56,430 | ) | $ | (20,542 | ) | $ | 4,846 | |||||
|
|
|
|
|
|
|
| |||||||||
Class L | ||||||||||||||||
Proceeds from shares issued | $ | 6,671 | $ | 13,398 | $ | — | $ | — | ||||||||
Distributions reinvested | 2,057 | 2,405 | — | — | ||||||||||||
Cost of shares redeemed | (11,049 | ) | (346,212 | ) | — | — | ||||||||||
|
|
|
|
|
|
|
| |||||||||
Change in net assets resulting from Class L capital transactions | $ | (2,321 | ) | $ | (330,409 | ) | $ | — | $ | — | ||||||
|
|
|
|
|
|
|
| |||||||||
Class R2 | ||||||||||||||||
Proceeds from shares issued | $ | — | $ | — | $ | 3,208 | $ | 6,565 | ||||||||
Distributions reinvested | — | — | 1,448 | 631 | ||||||||||||
Cost of shares redeemed | — | — | (5,799 | ) | (8,605 | ) | ||||||||||
|
|
|
|
|
|
|
| |||||||||
Change in net assets resulting from Class R2 capital transactions | $ | — | $ | — | $ | (1,143 | ) | $ | (1,409 | ) | ||||||
|
|
|
|
|
|
|
| |||||||||
Class R6 | ||||||||||||||||
Proceeds from shares issued | $ | 4,849 | $ | 294,863 | $ | 213,209 | $ | 108,992 | ||||||||
Distributions reinvested | 8,878 | 7,813 | 92,498 | 82,457 | ||||||||||||
Cost of shares redeemed | (5,077 | ) | (42,130 | ) | (49,051 | ) | (1,807,278 | ) | ||||||||
|
|
|
|
|
|
|
| |||||||||
Change in net assets resulting from Class R6 capital transactions | $ | 8,650 | $ | 260,546 | $ | 256,656 | $ | (1,615,829 | ) | |||||||
|
|
|
|
|
|
|
| |||||||||
Total change in net assets resulting from capital transactions | $ | (22,535 | ) | $ | (169,891 | ) | $ | 123,217 | $ | (1,616,261 | ) | |||||
|
|
|
|
|
|
|
| |||||||||
SEE NOTES TO FINANCIAL STATEMENTS.
| 76 | J.P. MORGAN INTERNATIONAL EQUITY FUNDS | APRIL 30, 2020 | ||||
Table of Contents
| JPMorgan Europe Dynamic Fund | JPMorgan International Advantage Fund | |||||||||||||||
| Six Months Ended April 30, 2020 (Unaudited) | Year Ended October 31, 2019 | Six Months Ended April 30, 2020 (Unaudited) | Year Ended October 31, 2019 | |||||||||||||
SHARE TRANSACTIONS: | ||||||||||||||||
Class A | ||||||||||||||||
Issued | 76 | 248 | 2,723 | 2,015 | ||||||||||||
Reinvested | 110 | 131 | 438 | 193 | ||||||||||||
Redeemed | (697 | ) | (1,745 | ) | (10,625 | ) | (2,379 | ) | ||||||||
|
|
|
|
|
|
|
| |||||||||
Change in Class A Shares | (511 | ) | (1,366 | ) | (7,464 | ) | (171 | ) | ||||||||
|
|
|
|
|
|
|
| |||||||||
Class C | ||||||||||||||||
Issued | 7 | 12 | 6 | 8 | ||||||||||||
Reinvested | 22 | 30 | 3 | 2 | ||||||||||||
Redeemed | (217 | ) | (646 | ) | (12 | ) | (34 | ) | ||||||||
|
|
|
|
|
|
|
| |||||||||
Change in Class C Shares | (188 | ) | (604 | ) | (3 | ) | (24 | ) | ||||||||
|
|
|
|
|
|
|
| |||||||||
Class I | ||||||||||||||||
Issued | 142 | 440 | 2,179 | 962 | ||||||||||||
Reinvested | 97 | 141 | 262 | 79 | ||||||||||||
Redeemed | (920 | ) | (3,038 | ) | (4,402 | ) | (792 | ) | ||||||||
|
|
|
|
|
|
|
| |||||||||
Change in Class I Shares | (681 | ) | (2,457 | ) | (1,961 | ) | 249 | |||||||||
|
|
|
|
|
|
|
| |||||||||
Class L | ||||||||||||||||
Issued | 315 | 577 | — | — | ||||||||||||
Reinvested | 81 | 111 | — | — | ||||||||||||
Redeemed | (516 | ) | (14,510 | ) | — | — | ||||||||||
|
|
|
|
|
|
|
| |||||||||
Change in Class L Shares | (120 | ) | (13,822 | ) | — | — | ||||||||||
|
|
|
|
|
|
|
| |||||||||
Class R2 | ||||||||||||||||
Issued | — | — | 181 | 348 | ||||||||||||
Reinvested | — | — | 75 | 36 | ||||||||||||
Redeemed | — | — | (323 | ) | (455 | ) | ||||||||||
|
|
|
|
|
|
|
| |||||||||
Change in Class R2 Shares | — | — | (67 | ) | (71 | ) | ||||||||||
|
|
|
|
|
|
|
| |||||||||
Class R6 | ||||||||||||||||
Issued | 263 | 12,295 | 10,435 | 5,671 | ||||||||||||
Reinvested | 352 | 363 | 4,595 | 4,558 | ||||||||||||
Redeemed | (221 | ) | (1,764 | ) | (2,541 | ) | (91,586 | ) | ||||||||
|
|
|
|
|
|
|
| |||||||||
Change in Class R6 Shares | 394 | 10,894 | 12,489 | (81,357 | ) | |||||||||||
|
|
|
|
|
|
|
| |||||||||
SEE NOTES TO FINANCIAL STATEMENTS.
| APRIL 30, 2020 | J.P. MORGAN INTERNATIONAL EQUITY FUNDS | 77 | ||||||
Table of Contents
STATEMENTS OF CHANGES IN NET ASSETS
FOR THE PERIODS INDICATED (continued)
(Amounts in thousands)
| JPMorgan International Equity Fund | JPMorgan International Focus Fund (formerly known as JPMorgan International Unconstrained Equity Fund) | |||||||||||||||
| Six Months Ended April 30, 2020 (Unaudited) | Year Ended October 31, 2019 | Six Months Ended April 30, 2020 (Unaudited) | Year Ended October 31, 2019 | |||||||||||||
CAPITAL TRANSACTIONS: | ||||||||||||||||
Class A | ||||||||||||||||
Proceeds from shares issued | $ | 97,651 | $ | 125,560 | $ | 27,186 | $ | 47,607 | ||||||||
Distributions reinvested | 9,447 | 8,068 | 45 | 1,609 | ||||||||||||
Cost of shares redeemed | (78,545 | ) | (76,633 | ) | (13,197 | ) | (32,948 | ) | ||||||||
|
|
|
|
|
|
|
| |||||||||
Change in net assets resulting from Class A capital transactions | $ | 28,553 | $ | 56,995 | $ | 14,034 | $ | 16,268 | ||||||||
|
|
|
|
|
|
|
| |||||||||
Class C | ||||||||||||||||
Proceeds from shares issued | $ | 813 | $ | 2,176 | $ | 1,451 | $ | 2,738 | ||||||||
Distributions reinvested | 324 | 495 | — | 294 | ||||||||||||
Cost of shares redeemed | (2,392 | ) | (8,733 | ) | (3,465 | ) | (10,067 | ) | ||||||||
|
|
|
|
|
|
|
| |||||||||
Change in net assets resulting from Class C capital transactions | $ | (1,255 | ) | $ | (6,062 | ) | $ | (2,014 | ) | $ | (7,035 | ) | ||||
|
|
|
|
|
|
|
| |||||||||
Class I | ||||||||||||||||
Proceeds from shares issued | $ | 79,743 | $ | 77,428 | $ | 86,854 | $ | 86,285 | ||||||||
Distributions reinvested | 6,146 | 5,819 | 416 | 3,656 | ||||||||||||
Cost of shares redeemed | (64,032 | ) | (90,398 | ) | (46,662 | ) | (125,224 | ) | ||||||||
|
|
|
|
|
|
|
| |||||||||
Change in net assets resulting from Class I capital transactions | $ | 21,857 | $ | (7,151 | ) | $ | 40,608 | $ | (35,283 | ) | ||||||
|
|
|
|
|
|
|
| |||||||||
Class R2 | ||||||||||||||||
Proceeds from shares issued | $ | 1,156 | $ | 1,194 | $ | 743 | $ | 494 | ||||||||
Distributions reinvested | 59 | 29 | — | 15 | ||||||||||||
Cost of shares redeemed | (838 | ) | (1,136 | ) | (212 | ) | (377 | ) | ||||||||
|
|
|
|
|
|
|
| |||||||||
Change in net assets resulting from Class R2 capital transactions | $ | 377 | $ | 87 | $ | 531 | $ | 132 | ||||||||
|
|
|
|
|
|
|
| |||||||||
Class R5 | ||||||||||||||||
Proceeds from shares issued | $ | 1,096 | $ | 744 | $ | 350 | $ | 603 | ||||||||
Distributions reinvested | 123 | 691 | 9 | 72 | ||||||||||||
Cost of shares redeemed | (274 | ) | (18,958 | ) | (750 | ) | (1,414 | ) | ||||||||
|
|
|
|
|
|
|
| |||||||||
Change in net assets resulting from Class R5 capital transactions | $ | 945 | $ | (17,523 | ) | $ | (391 | ) | $ | (739 | ) | |||||
|
|
|
|
|
|
|
| |||||||||
Class R6 | ||||||||||||||||
Proceeds from shares issued | $ | 230,222 | $ | 458,174 | $ | 254,951 | $ | 2,126,631 | ||||||||
Distributions reinvested | 80,145 | 140,364 | 10,047 | 4,394 | ||||||||||||
Cost of shares redeemed | (210,266 | ) | (2,318,655 | ) | (97,055 | ) | (113,994 | ) | ||||||||
|
|
|
|
|
|
|
| |||||||||
Change in net assets resulting from Class R6 capital transactions | $ | 100,101 | $ | (1,720,117 | ) | $ | 167,943 | $ | 2,017,031 | |||||||
|
|
|
|
|
|
|
| |||||||||
Total change in net assets resulting from capital transactions | $ | 150,578 | $ | (1,693,771 | ) | $ | 220,711 | $ | 1,990,374 | |||||||
|
|
|
|
|
|
|
| |||||||||
SEE NOTES TO FINANCIAL STATEMENTS.
| 78 | J.P. MORGAN INTERNATIONAL EQUITY FUNDS | APRIL 30, 2020 | ||||
Table of Contents
| JPMorgan International Equity Fund | JPMorgan International Focus Fund (formerly known as JPMorgan International Unconstrained Equity Fund) | |||||||||||||||
| Six Months Ended April 30, 2020 (Unaudited) | Year Ended October 31, 2019 | Six Months Ended April 30, 2020 (Unaudited) | Year Ended October 31, 2019 | |||||||||||||
SHARE TRANSACTIONS: | ||||||||||||||||
Class A | ||||||||||||||||
Issued | 6,055 | 7,833 | 1,299 | 2,430 | ||||||||||||
Reinvested | 541 | �� | 554 | 2 | 93 | |||||||||||
Redeemed | (4,967 | ) | (4,832 | ) | (673 | ) | (1,724 | ) | ||||||||
|
|
|
|
|
|
|
| |||||||||
Change in Class A Shares | 1,629 | 3,555 | 628 | 799 | ||||||||||||
|
|
|
|
|
|
|
| |||||||||
Class C | ||||||||||||||||
Issued | 56 | 147 | 70 | 141 | ||||||||||||
Reinvested | 20 | 36 | — | 17 | ||||||||||||
Redeemed | (159 | ) | (577 | ) | (181 | ) | (527 | ) | ||||||||
|
|
|
|
|
|
|
| |||||||||
Change in Class C Shares | (83 | ) | (394 | ) | (111 | ) | (369 | ) | ||||||||
|
|
|
|
|
|
|
| |||||||||
Class I | ||||||||||||||||
Issued | 4,845 | 4,793 | 4,107 | 4,374 | ||||||||||||
Reinvested | 346 | 394 | 18 | 209 | ||||||||||||
Redeemed | (4,019 | ) | (5,690 | ) | (2,381 | ) | (6,516 | ) | ||||||||
|
|
|
|
|
|
|
| |||||||||
Change in Class I Shares | 1,172 | (503 | ) | 1,744 | (1,933 | ) | ||||||||||
|
|
|
|
|
|
|
| |||||||||
Class R2 | ||||||||||||||||
Issued | 69 | 74 | 36 | 25 | ||||||||||||
Reinvested | 3 | 2 | — | 1 | ||||||||||||
Redeemed | (51 | ) | (73 | ) | (11 | ) | (19 | ) | ||||||||
|
|
|
|
|
|
|
| |||||||||
Change in Class R2 Shares | 21 | 3 | 25 | 7 | ||||||||||||
|
|
|
|
|
|
|
| |||||||||
Class R5 | ||||||||||||||||
Issued | 64 | 45 | 16 | 30 | ||||||||||||
Reinvested | 7 | 47 | 1 | 4 | ||||||||||||
Redeemed | (17 | ) | (1,108 | ) | (35 | ) | (71 | ) | ||||||||
|
|
|
|
|
|
|
| |||||||||
Change in Class R5 Shares | 54 | (1,016 | ) | (18 | ) | (37 | ) | |||||||||
|
|
|
|
|
|
|
| |||||||||
Class R6 | ||||||||||||||||
Issued | 14,062 | 27,715 | 11,919 | 102,465 | ||||||||||||
Reinvested | 4,510 | 9,522 | 444 | 252 | ||||||||||||
Redeemed | (12,969 | ) | (137,801 | ) | (4,663 | ) | (5,610 | ) | ||||||||
|
|
|
|
|
|
|
| |||||||||
Change in Class R6 Shares | 5,603 | (100,564 | ) | 7,700 | 97,107 | |||||||||||
|
|
|
|
|
|
|
| |||||||||
SEE NOTES TO FINANCIAL STATEMENTS.
| APRIL 30, 2020 | J.P. MORGAN INTERNATIONAL EQUITY FUNDS | 79 | ||||||
Table of Contents
STATEMENTS OF CHANGES IN NET ASSETS
FOR THE PERIODS INDICATED (continued)
(Amounts in thousands)
| JPMorgan International Hedged Equity Fund | JPMorgan International Research Enhanced Equity Fund | |||||||||||||||
| Six Months Ended April 30, 2020 (Unaudited) | Period Ended October 31, 2019 (a) | Six Months Ended April 30, 2020 (Unaudited) | Year Ended October 31, 2019 | |||||||||||||
CAPITAL TRANSACTIONS: | ||||||||||||||||
Class A | ||||||||||||||||
Proceeds from shares issued | $ | 605 | $ | 321 | $ | 77,723 | $ | 51,799 | ||||||||
Distributions reinvested | 5 | — | 5,420 | 6,196 | ||||||||||||
Cost of shares redeemed | (90 | ) | — | (70,651 | ) | (62,547 | ) | |||||||||
|
|
|
|
|
|
|
| |||||||||
Change in net assets resulting from Class A capital transactions | $ | 520 | $ | 321 | $ | 12,492 | $ | (4,552 | ) | |||||||
|
|
|
|
|
|
|
| |||||||||
Class C | ||||||||||||||||
Proceeds from shares issued | $ | 7 | $ | 118 | $ | — | $ | — | ||||||||
Distributions reinvested | 1 | — | — | — | ||||||||||||
Cost of shares redeemed | — | — | — | — | ||||||||||||
|
|
|
|
|
|
|
| |||||||||
Change in net assets resulting from Class C capital transactions | $ | 8 | $ | 118 | $ | — | $ | — | ||||||||
|
|
|
|
|
|
|
| |||||||||
Class I | ||||||||||||||||
Proceeds from shares issued | $ | 62,691 | $ | 57,561 | $ | 125,017 | $ | 82,525 | ||||||||
Distributions reinvested | 1,362 | — | 6,822 | 5,050 | ||||||||||||
Cost of shares redeemed | (19,083 | ) | (3 | ) | (64,919 | ) | (66,489 | ) | ||||||||
|
|
|
|
|
|
|
| |||||||||
Change in net assets resulting from Class I capital transactions | $ | 44,970 | $ | 57,558 | $ | 66,920 | $ | 21,086 | ||||||||
|
|
|
|
|
|
|
| |||||||||
Class R5 | ||||||||||||||||
Proceeds from shares issued | $ | — | $ | 20 | $ | — | $ | — | ||||||||
Distributions reinvested | — | (b) | — | — | — | |||||||||||
Cost of shares redeemed | — | — | — | — | ||||||||||||
|
|
|
|
|
|
|
| |||||||||
Change in net assets resulting from Class R5 capital transactions | $ | — | (b) | $ | 20 | $ | — | $ | — | |||||||
|
|
|
|
|
|
|
| |||||||||
Class R6 | ||||||||||||||||
Proceeds from shares issued | $ | — | $ | 20 | $ | 496,013 | $ | 567,656 | ||||||||
Distributions reinvested | 1 | — | 143,050 | 149,727 | ||||||||||||
Cost of shares redeemed | — | — | (337,368 | ) | (912,718 | ) | ||||||||||
|
|
|
|
|
|
|
| |||||||||
Change in net assets resulting from Class R6 capital transactions | $ | 1 | $ | 20 | $ | 301,695 | $ | (195,335 | ) | |||||||
|
|
|
|
|
|
|
| |||||||||
Total change in net assets resulting from capital transactions | $ | 45,499 | $ | 58,037 | $ | 381,107 | $ | (178,801 | ) | |||||||
|
|
|
|
|
|
|
| |||||||||
| (a) | Commencement of operations was March 15, 2019. |
| (b) | Amount rounds to less than one thousand. |
SEE NOTES TO FINANCIAL STATEMENTS.
| 80 | J.P. MORGAN INTERNATIONAL EQUITY FUNDS | APRIL 30, 2020 | ||||
Table of Contents
| JPMorgan International Hedged Equity Fund | JPMorgan International Research Enhanced Equity Fund | |||||||||||||||
| Six Months Ended April 30, 2020 (Unaudited) | Period Ended October 31, 2019 (a) | Six Months Ended April 30, 2020 (Unaudited) | Year Ended October 31, 2019 | |||||||||||||
SHARE TRANSACTIONS: | ||||||||||||||||
Class A | ||||||||||||||||
Issued | 42 | 21 | 5,057 | 3,097 | ||||||||||||
Reinvested | — | (b) | — | 298 | 402 | |||||||||||
Redeemed | (6 | ) | — | (4,254 | ) | (3,722 | ) | |||||||||
|
|
|
|
|
|
|
| |||||||||
Change in Class A Shares | 36 | 21 | 1,101 | (223 | ) | |||||||||||
|
|
|
|
|
|
|
| |||||||||
Class C | ||||||||||||||||
Issued | — | (b) | 8 | — | — | |||||||||||
Reinvested | — | (b) | — | — | — | |||||||||||
Redeemed | — | — | — | — | ||||||||||||
|
|
|
|
|
|
|
| |||||||||
Change in Class C Shares | — | (b) | 8 | — | — | |||||||||||
|
|
|
|
|
|
|
| |||||||||
Class I | ||||||||||||||||
Issued | 4,184 | 3,829 | 7,579 | 4,837 | ||||||||||||
Reinvested | 87 | — | 371 | 324 | ||||||||||||
Redeemed | (1,376 | ) | — | (b) | (4,230 | ) | (3,915 | ) | ||||||||
|
|
|
|
|
|
|
| |||||||||
Change in Class I Shares | 2,895 | 3,829 | 3,720 | 1,246 | ||||||||||||
|
|
|
|
|
|
|
| |||||||||
Class R5 | ||||||||||||||||
Issued | — | 1 | — | — | ||||||||||||
Reinvested | — | (b) | — | — | — | |||||||||||
Redeemed | — | — | — | — | ||||||||||||
|
|
|
|
|
|
|
| |||||||||
Change in Class R5 Shares | — | (b) | 1 | — | — | |||||||||||
|
|
|
|
|
|
|
| |||||||||
Class R6 | ||||||||||||||||
Issued | — | 1 | 28,737 | 32,819 | ||||||||||||
Reinvested | — | (b) | — | 7,817 | 9,647 | |||||||||||
Redeemed | — | — | (20,055 | ) | (53,561 | ) | ||||||||||
|
|
|
|
|
|
|
| |||||||||
Change in Class R6 Shares | — | (b) | 1 | 16,499 | (11,095 | ) | ||||||||||
|
|
|
|
|
|
|
| |||||||||
| (a) | Commencement of operations was March 15, 2019. |
| (b) | Amount rounds to less than one thousand. |
SEE NOTES TO FINANCIAL STATEMENTS.
| APRIL 30, 2020 | J.P. MORGAN INTERNATIONAL EQUITY FUNDS | 81 | ||||||
Table of Contents
STATEMENTS OF CHANGES IN NET ASSETS
FOR THE PERIODS INDICATED (continued)
(Amounts in thousands)
| JPMorgan International Value Fund | ||||||||
| Six Months Ended April 30, 2020 (Unaudited) | Year Ended October 31, 2019 | |||||||
CAPITAL TRANSACTIONS: | ||||||||
Class A | ||||||||
Proceeds from shares issued | $ | 14,333 | $ | 27,178 | ||||
Distributions reinvested | 7,043 | 7,349 | ||||||
Cost of shares redeemed | (25,014 | ) | (90,605 | ) | ||||
|
|
|
| |||||
Change in net assets resulting from Class A capital transactions | $ | (3,638 | ) | $ | (56,078 | ) | ||
|
|
|
| |||||
Class C | ||||||||
Proceeds from shares issued | $ | 143 | $ | 419 | ||||
Distributions reinvested | 270 | 378 | ||||||
Cost of shares redeemed | (2,233 | ) | (5,138 | ) | ||||
|
|
|
| |||||
Change in net assets resulting from Class C capital transactions | $ | (1,820 | ) | $ | (4,341 | ) | ||
|
|
|
| |||||
Class I | ||||||||
Proceeds from shares issued | $ | 4,179 | $ | 8,440 | ||||
Distributions reinvested | 1,679 | 2,109 | ||||||
Cost of shares redeemed | (10,546 | ) | (29,305 | ) | ||||
|
|
|
| |||||
Change in net assets resulting from Class I capital transactions | $ | (4,688 | ) | $ | (18,756 | ) | ||
|
|
|
| |||||
Class L | ||||||||
Proceeds from shares issued | $ | 1,004 | $ | 2,046 | ||||
Distributions reinvested | 569 | 762 | ||||||
Cost of shares redeemed | (7,149 | ) | (42,881 | ) | ||||
|
|
|
| |||||
Change in net assets resulting from Class L capital transactions | $ | (5,576 | ) | $ | (40,073 | ) | ||
|
|
|
| |||||
Class R2 | ||||||||
Proceeds from shares issued | $ | 74 | $ | 312 | ||||
Distributions reinvested | 17 | 15 | ||||||
Cost of shares redeemed | (242 | ) | (590 | ) | ||||
|
|
|
| |||||
Change in net assets resulting from Class R2 capital transactions | $ | (151 | ) | $ | (263 | ) | ||
|
|
|
| |||||
Class R5 | ||||||||
Proceeds from shares issued | $ | 17 | $ | 16 | ||||
Distributions reinvested | 4 | 3 | ||||||
Cost of shares redeemed | (8 | ) | — | (a) | ||||
|
|
|
| |||||
Change in net assets resulting from Class R5 capital transactions | $ | 13 | $ | 19 | ||||
|
|
|
| |||||
Class R6 | ||||||||
Proceeds from shares issued | $ | 20,767 | $ | 40,286 | ||||
Distributions reinvested | 5,075 | 4,629 | ||||||
Cost of shares redeemed | (27,045 | ) | (41,607 | ) | ||||
|
|
|
| |||||
Change in net assets resulting from Class R6 capital transactions | $ | (1,203 | ) | $ | 3,308 | |||
|
|
|
| |||||
Total change in net assets resulting from capital transactions | $ | (17,063 | ) | $ | (116,184 | ) | ||
|
|
|
| |||||
| (a) | Amount rounds to less than one thousand. |
SEE NOTES TO FINANCIAL STATEMENTS.
| 82 | J.P. MORGAN INTERNATIONAL EQUITY FUNDS | APRIL 30, 2020 | ||||
Table of Contents
| JPMorgan International Value Fund | ||||||||
| Six Months Ended April 30, 2020 (Unaudited) | Year Ended October 31, 2019 | |||||||
SHARE TRANSACTIONS: | ||||||||
Class A | ||||||||
Issued | 1,326 | 2,279 | ||||||
Reinvested | 572 | 663 | ||||||
Redeemed | (2,320 | ) | (7,568 | ) | ||||
|
|
|
| |||||
Change in Class A Shares | (422 | ) | (4,626 | ) | ||||
|
|
|
| |||||
Class C | ||||||||
Issued | 12 | 37 | ||||||
Reinvested | 23 | 35 | ||||||
Redeemed | (204 | ) | (449 | ) | ||||
|
|
|
| |||||
Change in Class C Shares | (169 | ) | (377 | ) | ||||
|
|
|
| |||||
Class I | ||||||||
Issued | 353 | 695 | ||||||
Reinvested | 133 | 186 | ||||||
Redeemed | (1,055 | ) | (2,449 | ) | ||||
|
|
|
| |||||
Change in Class I Shares | (569 | ) | (1,568 | ) | ||||
|
|
|
| |||||
Class L | ||||||||
Issued | 90 | 184 | ||||||
Reinvested | 45 | 67 | ||||||
Redeemed | (686 | ) | (3,624 | ) | ||||
|
|
|
| |||||
Change in Class L Shares | (551 | ) | (3,373 | ) | ||||
|
|
|
| |||||
Class R2 | ||||||||
Issued | 8 | 27 | ||||||
Reinvested | 1 | 1 | ||||||
Redeemed | (25 | ) | (52 | ) | ||||
|
|
|
| |||||
Change in Class R2 Shares | (16 | ) | (24 | ) | ||||
|
|
|
| |||||
Class R5 | ||||||||
Issued | 2 | 2 | ||||||
Reinvested | — | (a) | — | (a) | ||||
Redeemed | (1 | ) | — | (a) | ||||
|
|
|
| |||||
Change in Class R5 Shares | 1 | 2 | ||||||
|
|
|
| |||||
Class R6 | ||||||||
Issued | 1,975 | 3,351 | ||||||
Reinvested | 407 | 412 | ||||||
Redeemed | (2,353 | ) | (3,438 | ) | ||||
|
|
|
| |||||
Change in Class R6 Shares | 29 | 325 | ||||||
|
|
|
| |||||
| (a) | Amount rounds to less than one thousand. |
SEE NOTES TO FINANCIAL STATEMENTS.
| APRIL 30, 2020 | J.P. MORGAN INTERNATIONAL EQUITY FUNDS | 83 | ||||||
Table of Contents
FOR THE PERIODS INDICATED
| Per share operating performance | ||||||||||||||||||||
| Investment operations | Distributions | |||||||||||||||||||
| Net asset value, beginning of period | Net investment income (loss) (b) | Net realized and unrealized gains (losses) on investments | Total from investment operations | Net investment income | ||||||||||||||||
JPMorgan Emerging Markets Equity Fund | ||||||||||||||||||||
Class A | ||||||||||||||||||||
Six Months Ended April 30, 2020 (Unaudited) | $ | 30.07 | $ | (0.01 | ) | $ | (3.05 | ) | $ | (3.06 | ) | $ | (0.17 | ) | ||||||
Year Ended October 31, 2019 | 23.84 | 0.19 | 6.16 | 6.35 | (0.12 | ) | ||||||||||||||
Year Ended October 31, 2018 | 27.58 | 0.14 | (3.84 | ) | (3.70 | ) | (0.04 | ) | ||||||||||||
Year Ended October 31, 2017 | 21.79 | 0.09 | 5.80 | 5.89 | (0.10 | ) | ||||||||||||||
Year Ended October 31, 2016 | 19.53 | 0.09 | 2.28 | 2.37 | (0.11 | ) | ||||||||||||||
Year Ended October 31, 2015 | 23.72 | 0.12 | (f) | (4.12 | ) | (4.00 | ) | (0.19 | ) | |||||||||||
Class C | ||||||||||||||||||||
Six Months Ended April 30, 2020 (Unaudited) | 29.07 | (0.08 | ) | (2.96 | ) | (3.04 | ) | (0.04 | ) | |||||||||||
Year Ended October 31, 2019 | 23.08 | 0.04 | 5.98 | 6.02 | (0.03 | ) | ||||||||||||||
Year Ended October 31, 2018 | 26.80 | 0.02 | (3.74 | ) | (3.72 | ) | — | (g) | ||||||||||||
Year Ended October 31, 2017 | 21.18 | (0.04 | ) | 5.67 | 5.63 | (0.01 | ) | |||||||||||||
Year Ended October 31, 2016 | 18.96 | (0.01 | ) | 2.23 | 2.22 | — | ||||||||||||||
Year Ended October 31, 2015 | 23.03 | 0.03 | (f) | (4.02 | ) | (3.99 | ) | (0.08 | ) | |||||||||||
Class I | ||||||||||||||||||||
Six Months Ended April 30, 2020 (Unaudited) | 30.79 | 0.03 | (3.11 | ) | (3.08 | ) | (0.25 | ) | ||||||||||||
Year Ended October 31, 2019 | 24.45 | 0.27 | 6.29 | 6.56 | (0.22 | ) | ||||||||||||||
Year Ended October 31, 2018 | 28.29 | 0.24 | (3.96 | ) | (3.72 | ) | (0.12 | ) | ||||||||||||
Year Ended October 31, 2017 | 22.33 | 0.16 | 5.94 | 6.10 | (0.14 | ) | ||||||||||||||
Year Ended October 31, 2016 | 19.98 | 0.13 | 2.35 | 2.48 | (0.13 | ) | ||||||||||||||
Year Ended October 31, 2015 | 24.24 | 0.19 | (f) | (4.21 | ) | (4.02 | ) | (0.24 | ) | |||||||||||
Class L | ||||||||||||||||||||
Six Months Ended April 30, 2020 (Unaudited) | 31.03 | 0.04 | (3.12 | ) | (3.08 | ) | (0.27 | ) | ||||||||||||
Year Ended October 31, 2019 | 24.63 | 0.29 | 6.35 | 6.64 | (0.24 | ) | ||||||||||||||
Year Ended October 31, 2018 | 28.49 | 0.26 | (3.99 | ) | (3.73 | ) | (0.13 | ) | ||||||||||||
Year Ended October 31, 2017 | 22.49 | 0.21 | 5.96 | 6.17 | (0.17 | ) | ||||||||||||||
Year Ended October 31, 2016 | 20.15 | 0.17 | 2.35 | 2.52 | (0.18 | ) | ||||||||||||||
Year Ended October 31, 2015 | 24.42 | 0.23 | (f) | (4.26 | ) | (4.03 | ) | (0.24 | ) | |||||||||||
Class R2 | ||||||||||||||||||||
Six Months Ended April 30, 2020 (Unaudited) | 29.78 | (0.05 | ) | (3.02 | ) | (3.07 | ) | (0.11 | ) | |||||||||||
Year Ended October 31, 2019 | 23.73 | 0.08 | 6.13 | 6.21 | (0.16 | ) | ||||||||||||||
Year Ended October 31, 2018 | 27.57 | 0.07 | (3.83 | ) | (3.76 | ) | (0.08 | ) | ||||||||||||
July 31, 2017 (h) through October 31, 2017 | 26.40 | (0.01 | ) | 1.18 | 1.17 | — | ||||||||||||||
Class R3 | ||||||||||||||||||||
Six Months Ended April 30, 2020 (Unaudited) | 29.96 | (0.02 | ) | (3.02 | ) | (3.04 | ) | (0.21 | ) | |||||||||||
Year Ended October 31, 2019 | 23.78 | 0.25 | 6.06 | 6.31 | (0.13 | ) | ||||||||||||||
Year Ended October 31, 2018 | 27.59 | 0.22 | (3.92 | ) | (3.70 | ) | (0.11 | ) | ||||||||||||
July 31, 2017 (h) through October 31, 2017 | 26.40 | 0.01 | 1.18 | 1.19 | — | |||||||||||||||
Class R4 | ||||||||||||||||||||
Six Months Ended April 30, 2020 (Unaudited) | 30.68 | 0.02 | (3.11 | ) | (3.09 | ) | (0.22 | ) | ||||||||||||
Year Ended October 31, 2019 | 24.42 | 0.27 | 6.25 | 6.52 | (0.26 | ) | ||||||||||||||
Year Ended October 31, 2018 | 28.28 | 0.18 | (3.91 | ) | (3.73 | ) | (0.13 | ) | ||||||||||||
July 31, 2017 (h) through October 31, 2017 | 27.05 | 0.02 | 1.21 | 1.23 | — | |||||||||||||||
Class R5 | ||||||||||||||||||||
Six Months Ended April 30, 2020 (Unaudited) | 30.96 | 0.04 | (3.12 | ) | (3.08 | ) | (0.26 | ) | ||||||||||||
Year Ended October 31, 2019 | 24.60 | 0.31 | 6.31 | 6.62 | (0.26 | ) | ||||||||||||||
Year Ended October 31, 2018 | 28.47 | 0.39 | (4.11 | ) | (3.72 | ) | (0.15 | ) | ||||||||||||
Year Ended October 31, 2017 | 22.49 | 0.15 | 6.01 | 6.16 | (0.18 | ) | ||||||||||||||
September 9, 2016 (h) through October 31, 2016 | 22.40 | 0.01 | 0.08 | 0.09 | — | |||||||||||||||
Class R6 | ||||||||||||||||||||
Six Months Ended April 30, 2020 (Unaudited) | 31.00 | 0.06 | (3.13 | ) | (3.07 | ) | (0.29 | ) | ||||||||||||
Year Ended October 31, 2019 | 24.60 | 0.31 | 6.35 | 6.66 | (0.26 | ) | ||||||||||||||
Year Ended October 31, 2018 | 28.46 | 0.29 | (3.99 | ) | (3.70 | ) | (0.16 | ) | ||||||||||||
Year Ended October 31, 2017 | 22.46 | 0.21 | 5.98 | 6.19 | (0.19 | ) | ||||||||||||||
Year Ended October 31, 2016 | 20.13 | 0.19 | 2.35 | 2.54 | (0.21 | ) | ||||||||||||||
Year Ended October 31, 2015 | 24.44 | 0.22 | (f) | (4.23 | ) | (4.01 | ) | (0.30 | ) | |||||||||||
| (a) | Annualized for periods less than one year, unless otherwise noted. |
| (b) | Calculated based upon average shares outstanding. |
| (c) | Not annualized for periods less than one year. |
| (d) | Includes adjustments in accordance with accounting principles generally accepted in the United States of America and as such, the net asset values for financial reporting purposes and the returns based upon those net asset values may differ from the net asset values and returns for shareholder transactions. |
| (e) | Includes interest expense, if applicable, which is less than 0.005% unless otherwise noted. |
| (f) | Net investment income (loss) may appear disproportionate among the classes due to the timing of recognition of income and changes in the relative size of the classes. |
| (g) | Amount rounds to less than $0.005. |
| (h) | Commencement of offering of class of shares. |
SEE NOTES TO FINANCIAL STATEMENTS.
| 84 | J.P. MORGAN INTERNATIONAL EQUITY FUNDS | APRIL 30, 2020 | ||||
Table of Contents
| Ratios/Supplemental data | |||||||||||||||||||||||||
| Ratios to average net assets(a) | ||||||||||||||||||||||||||
| Net asset value, end of period | Total return (excludes sales charge) (c)(d) | Net assets, end of period (000’s) | Net expenses (e) | Net investment income (loss) | Expenses without waivers and reimbursements | Portfolio turnover rate (c) | ||||||||||||||||||||
| $ | 26.84 | (10.26 | )% | $ | 535,839 | 1.24 | % | (0.10 | )% | 1.34 | % | 7 | % | |||||||||||||
| 30.07 | 26.77 | 524,357 | 1.24 | 0.69 | 1.47 | 34 | ||||||||||||||||||||
| 23.84 | (13.44 | ) | 369,490 | 1.24 | 0.51 | 1.52 | 13 | |||||||||||||||||||
| 27.58 | 27.22 | 525,451 | 1.35 | 0.36 | 1.58 | 22 | ||||||||||||||||||||
| 21.79 | 12.25 | 411,713 | 1.44 | 0.44 | 1.76 | 23 | ||||||||||||||||||||
| 19.53 | (16.95 | ) | 274,710 | 1.61 | 0.57 | (f) | 1.88 | 35 | ||||||||||||||||||
| 25.99 | (10.48 | ) | 54,761 | 1.74 | (0.60 | ) | 1.85 | 7 | ||||||||||||||||||
| 29.07 | 26.12 | 56,830 | 1.74 | 0.15 | 1.98 | 34 | ||||||||||||||||||||
| 23.08 | (13.87 | ) | 43,612 | 1.74 | 0.06 | 2.02 | 13 | |||||||||||||||||||
| 26.80 | 26.58 | 48,497 | 1.85 | (0.15 | ) | 2.09 | 22 | |||||||||||||||||||
| 21.18 | 11.71 | 39,568 | 1.95 | (0.06 | ) | 2.26 | 23 | |||||||||||||||||||
| 18.96 | (17.38 | ) | 43,387 | 2.10 | 0.13 | (f) | 2.33 | 35 | ||||||||||||||||||
| 27.46 | (10.14 | ) | 2,453,732 | 0.99 | 0.17 | 1.08 | 7 | |||||||||||||||||||
| 30.79 | 27.04 | 1,725,882 | 0.99 | 0.94 | 1.21 | 34 | ||||||||||||||||||||
| 24.45 | (13.23 | ) | 773,142 | 0.99 | 0.84 | 1.26 | 13 | |||||||||||||||||||
| 28.29 | 27.54 | 629,451 | 1.10 | 0.62 | 1.30 | 22 | ||||||||||||||||||||
| 22.33 | 12.51 | 301,959 | 1.20 | 0.66 | 1.43 | 23 | ||||||||||||||||||||
| 19.98 | (16.70 | ) | 502,729 | 1.35 | 0.88 | (f) | 1.48 | 35 | ||||||||||||||||||
| 27.68 | (10.07 | ) | 1,146,624 | 0.89 | 0.27 | 0.93 | 7 | |||||||||||||||||||
| 31.03 | 27.20 | 926,781 | 0.89 | 1.00 | 1.06 | 34 | ||||||||||||||||||||
| 24.63 | (13.16 | ) | 475,997 | 0.89 | 0.91 | 1.11 | 13 | |||||||||||||||||||
| 28.49 | 27.72 | 430,860 | 0.95 | 0.84 | 1.14 | 22 | ||||||||||||||||||||
| 22.49 | 12.71 | 390,647 | 1.04 | 0.84 | 1.22 | 23 | ||||||||||||||||||||
| 20.15 | (16.60 | ) | 316,635 | 1.21 | 1.05 | (f) | 1.31 | 35 | ||||||||||||||||||
| 26.60 | (10.37 | ) | 210 | 1.54 | (0.37 | ) | 1.99 | 7 | ||||||||||||||||||
| 29.78 | 26.35 | 145 | 1.54 | 0.31 | 2.26 | 34 | ||||||||||||||||||||
| 23.73 | (13.69 | ) | 95 | 1.54 | 0.26 | 2.04 | 13 | |||||||||||||||||||
| 27.57 | 4.43 | 21 | 1.60 | (0.17 | ) | 1.80 | 22 | |||||||||||||||||||
| 26.71 | (10.25 | ) | 3,361 | 1.29 | (0.14 | ) | 1.35 | 7 | ||||||||||||||||||
| 29.96 | 26.67 | 2,151 | 1.29 | 0.90 | 1.49 | 34 | ||||||||||||||||||||
| 23.78 | (13.49 | ) | 341 | 1.29 | 0.81 | 1.59 | 13 | |||||||||||||||||||
| 27.59 | 4.51 | 21 | 1.35 | 0.08 | 1.55 | 22 | ||||||||||||||||||||
| 27.37 | (10.17 | ) | 1,928 | 1.04 | 0.15 | 1.10 | 7 | |||||||||||||||||||
| 30.68 | 26.98 | 1,300 | 1.04 | 0.94 | 1.23 | 34 | ||||||||||||||||||||
| 24.42 | (13.25 | ) | 26 | 1.04 | 0.63 | 1.62 | 13 | |||||||||||||||||||
| 28.28 | 4.55 | 21 | 1.10 | 0.33 | 1.30 | 22 | ||||||||||||||||||||
| 27.62 | (10.08 | ) | 40,652 | 0.89 | 0.25 | 0.95 | 7 | |||||||||||||||||||
| 30.96 | 27.19 | 41,872 | 0.89 | 1.08 | 1.08 | 34 | ||||||||||||||||||||
| 24.60 | (13.14 | ) | 1,672 | 0.89 | 1.37 | 1.11 | 13 | |||||||||||||||||||
| 28.47 | 27.72 | 217 | 0.95 | 0.58 | 3.36 | 22 | ||||||||||||||||||||
| 22.49 | 0.40 | 20 | 0.90 | 0.28 | 1.08 | 23 | ||||||||||||||||||||
| 27.64 | (10.05 | ) | 3,548,654 | 0.79 | 0.37 | 0.84 | 7 | |||||||||||||||||||
| 31.00 | 27.36 | 3,034,359 | 0.79 | 1.09 | 0.96 | 34 | ||||||||||||||||||||
| 24.60 | (13.08 | ) | 2,936,830 | 0.79 | 1.00 | 1.01 | 13 | |||||||||||||||||||
| 28.46 | 27.87 | 2,813,349 | 0.85 | 0.85 | 1.01 | 22 | ||||||||||||||||||||
| 22.46 | 12.83 | 1,980,671 | 0.94 | 0.96 | 1.08 | 23 | ||||||||||||||||||||
| 20.13 | (16.54 | ) | 1,128,390 | 1.10 | 0.99 | (f) | 1.16 | 35 | ||||||||||||||||||
SEE NOTES TO FINANCIAL STATEMENTS.
| APRIL 30, 2020 | J.P. MORGAN INTERNATIONAL EQUITY FUNDS | 85 | ||||||
Table of Contents
FINANCIAL HIGHLIGHTS
FOR THE PERIODS INDICATED (continued)
| Per share operating performance | ||||||||||||||||||||||||||||
| Investment operations | Distributions | |||||||||||||||||||||||||||
| Net asset value, beginning of period | Net investment income (loss) (b) | Net realized and unrealized gains (losses) on investments | Total from investment operations | Net investment income | Net realized gain | Total distributions | ||||||||||||||||||||||
JPMorgan Emerging Markets Research Enhanced Equity Fund |
| |||||||||||||||||||||||||||
Class I |
| |||||||||||||||||||||||||||
Six Months Ended April 30, 2020 (Unaudited) | $ | 16.78 | $ | 0.09 | $ | (2.06 | ) | $ | (1.97 | ) | $ | — | $ | (0.04 | ) | $ | (0.04 | ) | ||||||||||
January 30, 2019 (g) through October 31, 2019 | 16.22 | 0.31 | 0.25 | 0.56 | — | — | — | |||||||||||||||||||||
Class R6 |
| |||||||||||||||||||||||||||
Six Months Ended April 30, 2020 (Unaudited) | 16.80 | 0.11 | (2.05 | ) | (1.94 | ) | (0.13 | ) | (0.04 | ) | (0.17 | ) | ||||||||||||||||
December 11, 2018 (h) through October 31, 2019 | 15.00 | 0.42 | 1.46 | 1.88 | (0.08 | ) | — | (0.08 | ) | |||||||||||||||||||
| (a) | Annualized for periods less than one year, unless otherwise noted. |
| (b) | Calculated based upon average shares outstanding. |
| (c) | Not annualized for periods less than one year. |
| (d) | Includes adjustments in accordance with accounting principles generally accepted in the United States of America and as such, the net asset values for financial reporting purposes and the returns based upon those net asset values may differ from the net asset values and returns for shareholder transactions. |
| (e) | Includes interest expense, if applicable, which is less than 0.005% unless otherwise noted. |
| (f) | Certainnon-recurring expenses incurred by the Fund were not annualized for the period indicated. |
| (g) | Commencement of offering of class of shares. |
| (h) | Commencement of operations. |
SEE NOTES TO FINANCIAL STATEMENTS.
| 86 | J.P. MORGAN INTERNATIONAL EQUITY FUNDS | APRIL 30, 2020 | ||||
Table of Contents
| Ratios/Supplemental data | |||||||||||||||||||||||||
| Ratios to average net assets(a) | ||||||||||||||||||||||||||
| Net asset value, end of period | Total return (excludes sales charge) (c)(d) | Net assets, end of period (000’s) | Net expenses (e)(f) | Net investment income (loss) (f) | Expenses without waivers and reimbursements (f) | Portfolio turnover rate (c) | ||||||||||||||||||||
| $ | 14.77 | (11.79 | )% | $ | 8 | 0.43 | % | 1.17 | % | 3.50 | % | 22 | % | |||||||||||||
| 16.78 | 3.45 | 5 | 0.44 | 2.52 | 0.70 | 28 | ||||||||||||||||||||
| 14.69 | (11.73 | ) | 2,382,897 | 0.35 | 1.31 | 0.37 | 22 | |||||||||||||||||||
| 16.80 | 12.60 | 2,090,569 | 0.34 | 2.90 | 0.46 | 28 | ||||||||||||||||||||
SEE NOTES TO FINANCIAL STATEMENTS.
| APRIL 30, 2020 | J.P. MORGAN INTERNATIONAL EQUITY FUNDS | 87 | ||||||
Table of Contents
FINANCIAL HIGHLIGHTS
FOR THE PERIODS INDICATED (continued)
| Per share operating performance | ||||||||||||||||||||
| Investment operations | Distributions | |||||||||||||||||||
| Net asset value, beginning of period | Net investment income (loss) (b) | Net realized and unrealized gains (losses) on investments | Total from investment operations | Net investment income | ||||||||||||||||
JPMorgan Europe Dynamic Fund |
| |||||||||||||||||||
Class A |
| |||||||||||||||||||
Six Months Ended April 30, 2020 (Unaudited) | $ | 24.25 | $ | 0.11 | $ | (4.01 | ) | $ | (3.90 | ) | $ | (0.70 | ) | |||||||
Year Ended October 31, 2019 | 23.01 | 0.61 | 1.18 | 1.79 | (0.55 | ) | ||||||||||||||
Year Ended October 31, 2018 | 27.04 | 0.42 | (4.08 | ) | (3.66 | ) | (0.37 | ) | ||||||||||||
Year Ended October 31, 2017 | 21.94 | 0.37 | 5.15 | 5.52 | (0.42 | ) | ||||||||||||||
Year Ended October 31, 2016 | 24.41 | 0.37 | (2.55 | ) | (2.18 | ) | (0.29 | ) | ||||||||||||
Year Ended October 31, 2015 | 24.54 | 0.36 | 0.32 | 0.68 | (0.81 | ) | ||||||||||||||
Class C |
| |||||||||||||||||||
Six Months Ended April 30, 2020 (Unaudited) | 21.47 | 0.04 | (3.55 | ) | (3.51 | ) | (0.58 | ) | ||||||||||||
Year Ended October 31, 2019 | 20.39 | 0.44 | 1.06 | 1.50 | (0.42 | ) | ||||||||||||||
Year Ended October 31, 2018 | 24.00 | 0.25 | (3.62 | ) | (3.37 | ) | (0.24 | ) | ||||||||||||
Year Ended October 31, 2017 | 19.52 | 0.23 | 4.58 | 4.81 | (0.33 | ) | ||||||||||||||
Year Ended October 31, 2016 | 21.77 | 0.23 | (2.27 | ) | (2.04 | ) | (0.21 | ) | ||||||||||||
Year Ended October 31, 2015 | 21.99 | 0.21 | 0.29 | 0.50 | (0.72 | ) | ||||||||||||||
Class I |
| |||||||||||||||||||
Six Months Ended April 30, 2020 (Unaudited) | 24.75 | 0.13 | (4.07 | ) | (3.94 | ) | (0.77 | ) | ||||||||||||
Year Ended October 31, 2019 | 23.48 | 0.67 | 1.21 | 1.88 | (0.61 | ) | ||||||||||||||
Year Ended October 31, 2018 | 27.60 | 0.49 | (4.17 | ) | (3.68 | ) | (0.44 | ) | ||||||||||||
Year Ended October 31, 2017 | 22.37 | 0.46 | 5.25 | 5.71 | (0.48 | ) | ||||||||||||||
Year Ended October 31, 2016 | 24.83 | 0.44 | (2.59 | ) | (2.15 | ) | (0.31 | ) | ||||||||||||
Year Ended October 31, 2015 | 24.95 | 0.45 | 0.32 | 0.77 | (0.89 | ) | ||||||||||||||
Class L |
| |||||||||||||||||||
Six Months Ended April 30, 2020 (Unaudited) | 25.05 | 0.16 | (4.14 | ) | (3.98 | ) | (0.79 | ) | ||||||||||||
Year Ended October 31, 2019 | 23.70 | 0.65 | 1.27 | 1.92 | (0.57 | ) | ||||||||||||||
Year Ended October 31, 2018 | 27.85 | 0.51 | (4.18 | ) | (3.67 | ) | (0.48 | ) | ||||||||||||
Year Ended October 31, 2017 | 22.61 | 0.52 | 5.27 | 5.79 | (0.55 | ) | ||||||||||||||
Year Ended October 31, 2016 | 25.13 | 0.49 | (2.60 | ) | (2.11 | ) | (0.41 | ) | ||||||||||||
Year Ended October 31, 2015 | 25.23 | 0.54 | 0.28 | 0.82 | (0.92 | ) | ||||||||||||||
Class R6 |
| |||||||||||||||||||
Six Months Ended April 30, 2020 (Unaudited) | 24.96 | 0.17 | (4.12 | ) | (3.95 | ) | (0.82 | ) | ||||||||||||
Year Ended October 31, 2019 | 23.70 | 0.75 | 1.19 | 1.94 | (0.68 | ) | ||||||||||||||
October 1, 2018 (f) through October 31, 2018 | 26.32 | 0.01 | (2.63 | ) | (2.62 | ) | — | |||||||||||||
| (a) | Annualized for periods less than one year, unless otherwise noted. |
| (b) | Calculated based upon average shares outstanding. |
| (c) | Not annualized for periods less than one year. |
| (d) | Includes adjustments in accordance with accounting principles generally accepted in the United States of America and as such, the net asset values for financial reporting purposes and the returns based upon those net asset values may differ from the net asset values and returns for shareholder transactions. |
| (e) | Includes interest expense, if applicable, which is less than 0.005% unless otherwise noted. |
| (f) | Commencement of offering of class of shares. |
SEE NOTES TO FINANCIAL STATEMENTS.
| 88 | J.P. MORGAN INTERNATIONAL EQUITY FUNDS | APRIL 30, 2020 | ||||
Table of Contents
| Ratios/Supplemental data | |||||||||||||||||||||||||
| Ratios to average net assets (a) | ||||||||||||||||||||||||||
| Net asset value, end of period | Total return (excludes sales charge) (c)(d) | Net assets, end of period (000’s) | Net expenses (e) | Net investment income (loss) | Expenses without waivers and reimbursements | Portfolio turnover rate (c) | ||||||||||||||||||||
| $ | 19.65 | (16.65 | )% | $ | 69,580 | 1.24 | % | 0.93 | % | 1.27 | % | 73 | % | |||||||||||||
| 24.25 | 8.14 | 98,294 | 1.24 | 2.67 | 1.31 | 83 | ||||||||||||||||||||
| 23.01 | (13.72 | ) | 124,681 | 1.24 | 1.58 | 1.29 | 149 | |||||||||||||||||||
| 27.04 | 25.65 | 165,020 | 1.36 | 1.52 | 1.36 | 189 | ||||||||||||||||||||
| 21.94 | (8.98 | ) | 162,767 | 1.42 | 1.66 | 1.43 | 142 | |||||||||||||||||||
| 24.41 | 2.86 | 219,548 | 1.41 | 1.48 | 1.41 | 167 | ||||||||||||||||||||
| 17.38 | (16.91 | ) | 12,752 | 1.74 | 0.40 | 1.77 | 73 | |||||||||||||||||||
| 21.47 | 7.64 | 19,798 | 1.74 | 2.15 | 1.80 | 83 | ||||||||||||||||||||
| 20.39 | (14.18 | ) | 31,125 | 1.74 | 1.08 | 1.79 | 149 | |||||||||||||||||||
| 24.00 | 25.02 | 46,615 | 1.85 | 1.07 | 1.86 | 189 | ||||||||||||||||||||
| 19.52 | (9.42 | ) | 50,152 | 1.91 | 1.16 | 1.92 | 142 | |||||||||||||||||||
| 21.77 | 2.37 | 75,145 | 1.91 | 0.98 | 1.91 | 167 | ||||||||||||||||||||
| 20.04 | (16.56 | ) | 56,453 | 0.99 | 1.15 | 1.01 | 73 | |||||||||||||||||||
| 24.75 | 8.44 | 86,582 | 0.99 | 2.86 | 1.05 | 83 | ||||||||||||||||||||
| 23.48 | (13.53 | ) | 139,858 | 0.99 | 1.84 | 1.04 | 149 | |||||||||||||||||||
| 27.60 | 26.06 | 187,678 | 1.06 | 1.85 | 1.07 | 189 | ||||||||||||||||||||
| 22.37 | (8.73 | ) | 145,080 | 1.10 | 1.95 | 1.10 | 142 | |||||||||||||||||||
| 24.83 | 3.22 | 579,389 | 1.07 | 1.81 | 1.07 | 167 | ||||||||||||||||||||
| 20.28 | (16.51 | ) | 50,754 | 0.85 | 1.37 | 0.85 | 73 | |||||||||||||||||||
| 25.05 | 8.49 | 65,686 | 0.89 | 2.77 | 0.90 | 83 | ||||||||||||||||||||
| 23.70 | (13.41 | ) | 389,665 | 0.88 | 1.88 | 0.89 | 149 | |||||||||||||||||||
| 27.85 | 26.22 | 578,183 | 0.90 | 2.07 | 0.91 | 189 | ||||||||||||||||||||
| 22.61 | (8.48 | ) | 424,388 | 0.90 | 2.16 | 0.90 | 142 | |||||||||||||||||||
| 25.13 | 3.36 | 194,930 | 0.90 | 2.16 | 0.91 | 167 | ||||||||||||||||||||
| 20.19 | (16.48 | ) | 227,916 | 0.75 | 1.49 | 0.75 | 73 | |||||||||||||||||||
| 24.96 | 8.65 | 271,885 | 0.79 | 3.17 | 0.79 | 83 | ||||||||||||||||||||
| 23.70 | (9.95 | ) | 18 | 0.82 | 0.67 | 0.83 | 149 | |||||||||||||||||||
SEE NOTES TO FINANCIAL STATEMENTS.
| APRIL 30, 2020 | J.P. MORGAN INTERNATIONAL EQUITY FUNDS | 89 | ||||||
Table of Contents
FINANCIAL HIGHLIGHTS
FOR THE PERIODS INDICATED (continued)
| Per share operating performance | |||||||||||||||||||
| Investment operations | Distributions | |||||||||||||||||||
| Net asset value, beginning of period | Net investment income (loss) (b) | Net realized and unrealized gains (losses) on investments | Total from investment operations | Net investment income | ||||||||||||||||
JPMorgan International Advantage Fund |
| |||||||||||||||||||
Class A |
| |||||||||||||||||||
Six Months Ended April 30, 2020 (Unaudited) | $ | 19.90 | $ | 0.06 | $ | (3.09 | ) | $ | (3.03 | ) | $ | (1.01 | ) | |||||||
Year Ended October 31, 2019 | 19.49 | 0.52 | 0.31 | 0.83 | (0.42 | ) | ||||||||||||||
Year Ended October 31, 2018 | 22.22 | 0.44 | (2.77 | ) | (2.33 | ) | (0.40 | ) | ||||||||||||
Year Ended October 31, 2017 | 18.44 | 0.33 | 3.83 | 4.16 | (0.38 | ) | ||||||||||||||
Year Ended October 31, 2016 | 19.36 | 0.40 | (f) | (0.99 | ) | (0.59 | ) | (0.33 | ) | |||||||||||
Year Ended October 31, 2015 | 19.49 | 0.34 | (f) | (0.26 | ) | 0.08 | (0.21 | ) | ||||||||||||
Class C |
| |||||||||||||||||||
Six Months Ended April 30, 2020 (Unaudited) | 20.13 | 0.11 | (3.23 | ) | (3.12 | ) | (0.88 | ) | ||||||||||||
Year Ended October 31, 2019 | 19.70 | 0.43 | 0.31 | 0.74 | (0.31 | ) | ||||||||||||||
Year Ended October 31, 2018 | 22.40 | 0.37 | (2.83 | ) | (2.46 | ) | (0.24 | ) | ||||||||||||
Year Ended October 31, 2017 | 18.57 | 0.22 | 3.87 | 4.09 | (0.26 | ) | ||||||||||||||
Year Ended October 31, 2016 | 19.52 | 0.28 | (f) | (0.97 | ) | (0.69 | ) | (0.26 | ) | |||||||||||
Year Ended October 31, 2015 | 19.63 | 0.23 | (f) | (0.24 | ) | (0.01 | ) | (0.10 | ) | |||||||||||
Class I |
| |||||||||||||||||||
Six Months Ended April 30, 2020 (Unaudited) | 20.71 | 0.13 | (3.25 | ) | (3.12 | ) | (1.07 | ) | ||||||||||||
Year Ended October 31, 2019 | 20.30 | 0.60 | 0.29 | 0.89 | (0.48 | ) | ||||||||||||||
Year Ended October 31, 2018 | 23.12 | 0.54 | (2.90 | ) | (2.36 | ) | (0.46 | ) | ||||||||||||
Year Ended October 31, 2017 | 19.20 | 0.42 | 3.97 | 4.39 | (0.47 | ) | ||||||||||||||
Year Ended October 31, 2016 | 20.13 | 0.46 | (f) | (1.01 | ) | (0.55 | ) | (0.38 | ) | |||||||||||
Year Ended October 31, 2015 | 20.22 | 0.42 | (f) | (0.26 | ) | 0.16 | (0.25 | ) | ||||||||||||
Class R2 |
| |||||||||||||||||||
Six Months Ended April 30, 2020 (Unaudited) | 19.57 | 0.13 | (3.13 | ) | (3.00 | ) | (0.95 | ) | ||||||||||||
Year Ended October 31, 2019 | 19.21 | 0.46 | 0.29 | 0.75 | (0.39 | ) | ||||||||||||||
Year Ended October 31, 2018 | 22.01 | 0.52 | (2.88 | ) | (2.36 | ) | (0.44 | ) | ||||||||||||
Year Ended October 31, 2017 | 18.29 | 0.01 | 4.07 | 4.08 | (0.36 | ) | ||||||||||||||
Year Ended October 31, 2016 | 19.21 | 0.36 | (f) | (1.01 | ) | (0.65 | ) | (0.27 | ) | |||||||||||
Year Ended October 31, 2015 | 19.31 | 0.38 | (f) | (0.34 | ) | 0.04 | (0.14 | ) | ||||||||||||
Class R6 |
| |||||||||||||||||||
Six Months Ended April 30, 2020 (Unaudited) | 20.40 | 0.21 | (3.25 | ) | (3.04 | ) | (1.10 | ) | ||||||||||||
Year Ended October 31, 2019 | 20.00 | 0.64 | 0.28 | 0.92 | (0.52 | ) | ||||||||||||||
Year Ended October 31, 2018 | 22.78 | 0.58 | (2.87 | ) | (2.29 | ) | (0.49 | ) | ||||||||||||
Year Ended October 31, 2017 | 18.91 | 0.43 | 3.92 | 4.35 | (0.48 | ) | ||||||||||||||
Year Ended October 31, 2016 | 19.84 | 0.49 | (f) | (1.01 | ) | (0.52 | ) | (0.41 | ) | |||||||||||
May 29, 2015 (g) through October 31, 2015 | 21.08 | 0.12 | (f) | (1.36 | ) | (1.24 | ) | — | ||||||||||||
| (a) | Annualized for periods less than one year, unless otherwise noted. |
| (b) | Calculated based upon average shares outstanding. |
| (c) | Not annualized for periods less than one year. |
| (d) | Includes adjustments in accordance with accounting principles generally accepted in the United States of America and as such, the net asset values for financial reporting purposes and the returns based upon those net asset values may differ from the net asset values and returns for shareholder transactions. |
| (e) | Includes interest expense, if applicable, which is less than 0.005% unless otherwise noted. |
| (f) | Net investment income (loss) may appear disproportionate among the classes due to the timing of recognition of income and changes in the relative size of the classes. |
| (g) | Commencement of offering of class of shares. |
SEE NOTES TO FINANCIAL STATEMENTS.
| 90 | J.P. MORGAN INTERNATIONAL EQUITY FUNDS | APRIL 30, 2020 | ||||
Table of Contents
| Ratios/Supplemental data | |||||||||||||||||||||||||
| Ratios to average net assets (a) | ||||||||||||||||||||||||||
| Net asset value, end of period | Total return (excludes sales charge) (c)(d) | Net assets, end of period (000’s) | Net expenses (e) | Net investment income (loss) | Expenses without waivers and reimbursements | Portfolio turnover rate (c) | ||||||||||||||||||||
|
|
|
|
|
|
|
|
|
|
|
|
|
| |||||||||||||
| $ | 15.86 | (16.19 | )% | $ | 6,150 | 0.95 | % | 0.63 | % | 1.14 | % | 42 | % | |||||||||||||
| 19.90 | 4.51 | 156,230 | 0.96 | 2.72 | 1.20 | 74 | ||||||||||||||||||||
| 19.49 | (10.69 | ) | 156,382 | 1.00 | 2.02 | 1.22 | 51 | |||||||||||||||||||
| 22.22 | 22.98 | 232,530 | 1.21 | 1.66 | 1.22 | 82 | ||||||||||||||||||||
| 18.44 | (3.07 | ) | 164,327 | 1.25 | 2.21 | (f) | 1.29 | 38 | ||||||||||||||||||
| 19.36 | 0.45 | 152,834 | 1.29 | 1.75 | (f) | 1.49 | 33 | |||||||||||||||||||
| 16.13 | (16.34 | ) | 923 | 1.45 | 1.22 | 1.74 | 42 | |||||||||||||||||||
| 20.13 | 3.92 | 1,210 | 1.47 | 2.19 | 1.72 | 74 | ||||||||||||||||||||
| 19.70 | (11.08 | ) | 1,652 | 1.50 | 1.69 | 1.74 | 51 | |||||||||||||||||||
| 22.40 | 22.30 | 1,773 | 1.75 | 1.07 | 1.81 | 82 | ||||||||||||||||||||
| 18.57 | (3.56 | ) | 2,287 | 1.75 | 1.52 | (f) | 1.87 | 38 | ||||||||||||||||||
| 19.52 | (0.05 | ) | 2,789 | 1.78 | 1.17 | (f) | 1.91 | 33 | ||||||||||||||||||
| 16.52 | (16.06 | ) | 21,165 | 0.70 | 1.30 | 0.88 | 42 | |||||||||||||||||||
| 20.71 | 4.70 | 67,146 | 0.71 | 3.02 | 0.94 | 74 | ||||||||||||||||||||
| 20.30 | (10.43 | ) | 60,739 | 0.75 | 2.37 | 0.96 | 51 | |||||||||||||||||||
| 23.12 | 23.39 | 52,871 | 0.90 | 1.99 | 0.99 | 82 | ||||||||||||||||||||
| 19.20 | (2.73 | ) | 16,363 | 0.90 | 2.44 | (f) | 1.08 | 38 | ||||||||||||||||||
| 20.13 | 0.80 | 19,292 | 0.97 | 2.04 | (f) | 1.12 | 33 | |||||||||||||||||||
| 15.62 | (16.29 | ) | 23,550 | 1.25 | 1.43 | 1.57 | 42 | |||||||||||||||||||
| 19.57 | 4.15 | 30,819 | 1.26 | 2.44 | 1.66 | 74 | ||||||||||||||||||||
| 19.21 | (10.93 | ) | 31,619 | 1.30 | 2.45 | 1.69 | 51 | |||||||||||||||||||
| 22.01 | 22.70 | 8,790 | 1.49 | 0.07 | 1.54 | 82 | ||||||||||||||||||||
| 18.29 | (3.36 | ) | 503 | 1.50 | 2.02 | (f) | 1.75 | 38 | ||||||||||||||||||
| 19.21 | 0.24 | 227 | 1.52 | 1.91 | (f) | 1.69 | 33 | |||||||||||||||||||
| 16.26 | (15.95 | ) | 1,443,062 | 0.50 | 2.28 | 0.62 | 42 | |||||||||||||||||||
| 20.40 | 4.94 | 1,555,944 | 0.52 | 3.27 | 0.69 | 74 | ||||||||||||||||||||
| 20.00 | (10.26 | ) | 3,152,864 | 0.55 | 2.59 | 0.71 | 51 | |||||||||||||||||||
| 22.78 | 23.59 | 2,859,645 | 0.71 | 2.12 | 0.71 | 82 | ||||||||||||||||||||
| 18.91 | (2.59 | ) | 2,487,086 | 0.71 | 2.65 | (f) | 0.72 | 38 | ||||||||||||||||||
| 19.84 | (5.88 | ) | 1,854,941 | 0.73 | 1.47 | (f) | 0.74 | 33 | ||||||||||||||||||
SEE NOTES TO FINANCIAL STATEMENTS.
| APRIL 30, 2020 | J.P. MORGAN INTERNATIONAL EQUITY FUNDS | 91 | ||||||
Table of Contents
FINANCIAL HIGHLIGHTS
FOR THE PERIODS INDICATED (continued)
| Per share operating performance | |||||||||||||||||||||||||||
| Investment operations | Distributions | |||||||||||||||||||||||||||
| Net asset value, beginning of period | Net investment income (loss) (b) | Net realized and unrealized gains (losses) on investments | Total from investment operations | Net investment income | Net realized gain | Total distributions | ||||||||||||||||||||||
JPMorgan International Equity Fund |
| |||||||||||||||||||||||||||
Class A |
| |||||||||||||||||||||||||||
Six Months Ended April 30, 2020 (Unaudited) | $ | 17.27 | $ | 0.10 | $ | (2.20 | ) | $ | (2.10 | ) | $ | (0.50 | ) | $ | — | $ | (0.50 | ) | ||||||||||
Year Ended October 31, 2019 | 15.56 | 0.33 | 1.89 | 2.22 | (0.33 | ) | (0.18 | ) | (0.51 | ) | ||||||||||||||||||
Year Ended October 31, 2018 | 17.81 | 0.33 | (2.33 | ) | (2.00 | ) | (0.25 | ) | — | (0.25 | ) | |||||||||||||||||
Year Ended October 31, 2017 | 14.24 | 0.22 | 3.39 | 3.61 | (0.04 | ) | — | (0.04 | ) | |||||||||||||||||||
Year Ended October 31, 2016 | 14.75 | 0.22 | (0.51 | ) | (0.29 | ) | (0.22 | ) | — | (0.22 | ) | |||||||||||||||||
Year Ended October 31, 2015 | 15.25 | 0.23 | (0.50 | ) | (0.27 | ) | (0.23 | ) | — | (0.23 | ) | |||||||||||||||||
Class C |
| |||||||||||||||||||||||||||
Six Months Ended April 30, 2020 (Unaudited) | 16.29 | 0.05 | (2.08 | ) | (2.03 | ) | (0.40 | ) | — | (0.40 | ) | |||||||||||||||||
Year Ended October 31, 2019 | 14.68 | 0.23 | 1.80 | 2.03 | (0.24 | ) | (0.18 | ) | (0.42 | ) | ||||||||||||||||||
Year Ended October 31, 2018 | 16.83 | 0.25 | (2.23 | ) | (1.98 | ) | (0.17 | ) | — | (0.17 | ) | |||||||||||||||||
Year Ended October 31, 2017 | 13.50 | 0.12 | 3.22 | 3.34 | (0.01 | ) | — | (0.01 | ) | |||||||||||||||||||
Year Ended October 31, 2016 | 14.02 | 0.13 | (0.47 | ) | (0.34 | ) | (0.18 | ) | — | (0.18 | ) | |||||||||||||||||
Year Ended October 31, 2015 | 14.52 | 0.15 | (0.48 | ) | (0.33 | ) | (0.17 | ) | — | (0.17 | ) | |||||||||||||||||
Class I |
| |||||||||||||||||||||||||||
Six Months Ended April 30, 2020 (Unaudited) | 17.56 | 0.12 | (2.23 | ) | (2.11 | ) | (0.54 | ) | — | (0.54 | ) | |||||||||||||||||
Year Ended October 31, 2019 | 15.82 | 0.36 | 1.93 | 2.29 | (0.37 | ) | (0.18 | ) | (0.55 | ) | ||||||||||||||||||
Year Ended October 31, 2018 | 18.09 | 0.41 | (2.40 | ) | (1.99 | ) | (0.28 | ) | — | (0.28 | ) | |||||||||||||||||
Year Ended October 31, 2017 | 14.45 | 0.26 | 3.44 | 3.70 | (0.06 | ) | — | (0.06 | ) | |||||||||||||||||||
Year Ended October 31, 2016 | 14.95 | 0.24 | (0.48 | ) | (0.24 | ) | (0.26 | ) | — | (0.26 | ) | |||||||||||||||||
Year Ended October 31, 2015 | 15.45 | 0.29 | (0.53 | ) | (0.24 | ) | (0.26 | ) | — | (0.26 | ) | |||||||||||||||||
Class R2 |
| |||||||||||||||||||||||||||
Six Months Ended April 30, 2020 (Unaudited) | 17.14 | 0.08 | (2.19 | ) | (2.11 | ) | (0.48 | ) | — | (0.48 | ) | |||||||||||||||||
Year Ended October 31, 2019 | 15.44 | 0.28 | 1.88 | 2.16 | (0.28 | ) | (0.18 | ) | (0.46 | ) | ||||||||||||||||||
Year Ended October 31, 2018 | 17.70 | 0.29 | (2.33 | ) | (2.04 | ) | (0.22 | ) | — | (0.22 | ) | |||||||||||||||||
Year Ended October 31, 2017 | 14.17 | 0.17 | 3.38 | 3.55 | (0.02 | ) | — | (0.02 | ) | |||||||||||||||||||
Year Ended October 31, 2016 | 14.69 | 0.18 | (0.50 | ) | (0.32 | ) | (0.20 | ) | — | (0.20 | ) | |||||||||||||||||
Year Ended October 31, 2015 | 15.19 | 0.20 | (0.51 | ) | (0.31 | ) | (0.19 | ) | — | (0.19 | ) | |||||||||||||||||
Class R5 |
| |||||||||||||||||||||||||||
Six Months Ended April 30, 2020 (Unaudited) | 17.60 | 0.13 | (2.24 | ) | (2.11 | ) | (0.51 | ) | — | (0.51 | ) | |||||||||||||||||
Year Ended October 31, 2019 | 15.85 | 0.38 | 1.94 | 2.32 | (0.39 | ) | (0.18 | ) | (0.57 | ) | ||||||||||||||||||
Year Ended October 31, 2018 | 18.13 | 0.41 | (2.40 | ) | (1.99 | ) | (0.29 | ) | — | (0.29 | ) | |||||||||||||||||
Year Ended October 31, 2017 | 14.47 | 0.21 | 3.52 | 3.73 | (0.07 | ) | — | (0.07 | ) | |||||||||||||||||||
Year Ended October 31, 2016 | 14.97 | 0.27 | (0.49 | ) | (0.22 | ) | (0.28 | ) | — | (0.28 | ) | |||||||||||||||||
Year Ended October 31, 2015 | 15.46 | 0.29 | (0.49 | ) | (0.20 | ) | (0.29 | ) | — | (0.29 | ) | |||||||||||||||||
Class R6 |
| |||||||||||||||||||||||||||
Six Months Ended April 30, 2020 (Unaudited) | 17.61 | 0.14 | (2.24 | ) | (2.10 | ) | (0.57 | ) | — | (0.57 | ) | |||||||||||||||||
Year Ended October 31, 2019 | 15.86 | 0.40 | 1.93 | 2.33 | (0.40 | ) | (0.18 | ) | (0.58 | ) | ||||||||||||||||||
Year Ended October 31, 2018 | 18.13 | 0.43 | (2.39 | ) | (1.96 | ) | (0.31 | ) | — | (0.31 | ) | |||||||||||||||||
Year Ended October 31, 2017 | 14.46 | 0.29 | 3.46 | 3.75 | (0.08 | ) | — | (0.08 | ) | |||||||||||||||||||
Year Ended October 31, 2016 | 14.97 | 0.29 | (0.51 | ) | (0.22 | ) | (0.29 | ) | — | (0.29 | ) | |||||||||||||||||
Year Ended October 31, 2015 | 15.46 | 0.32 | (0.52 | ) | (0.20 | ) | (0.29 | ) | — | (0.29 | ) | |||||||||||||||||
| (a) | Annualized for periods less than one year, unless otherwise noted. |
| (b) | Calculated based upon average shares outstanding. |
| (c) | Not annualized for periods less than one year. |
| (d) | Includes adjustments in accordance with accounting principles generally accepted in the United States of America and as such, the net asset values for financial reporting purposes and the returns based upon those net asset values may differ from the net asset values and returns for shareholder transactions. |
| (e) | Includes interest expense, if applicable, which is less than 0.005% unless otherwise noted. |
SEE NOTES TO FINANCIAL STATEMENTS.
| 92 | J.P. MORGAN INTERNATIONAL EQUITY FUNDS | APRIL 30, 2020 | ||||
Table of Contents
| Ratios/Supplemental data | |||||||||||||||||||||||||
| Ratios to average net assets (a) | ||||||||||||||||||||||||||
| Net asset value, end of period | Total return (excludes sales charge) (c)(d) | Net assets, end of period (000’s) | Net expenses (e) | Net investment income (loss) | Expenses without waivers and reimbursements | Portfolio turnover rate (c) | ||||||||||||||||||||
| $ | 14.67 | (12.60 | )% | $ | 302,646 | 0.95 | % | 1.26 | % | 1.12 | % | 14 | % | |||||||||||||
| 17.27 | 14.93 | 328,312 | 0.95 | 2.03 | 1.22 | 25 | ||||||||||||||||||||
| 15.56 | (11.42 | ) | 240,394 | 0.95 | 1.88 | 1.32 | 33 | |||||||||||||||||||
| 17.81 | 25.43 | 302,130 | 1.23 | 1.39 | 1.35 | 17 | ||||||||||||||||||||
| 14.24 | (1.83 | ) | 216,932 | 1.31 | 1.62 | 1.49 | 11 | |||||||||||||||||||
| 14.75 | (1.89 | ) | 224,370 | 1.31 | 1.50 | 1.59 | 13 | |||||||||||||||||||
| 13.86 | (12.88 | ) | 11,229 | 1.45 | 0.67 | 1.63 | 14 | |||||||||||||||||||
| 16.29 | 14.39 | 14,549 | 1.45 | 1.51 | 1.74 | 25 | ||||||||||||||||||||
| 14.68 | (11.89 | ) | 18,899 | 1.45 | 1.48 | 1.83 | 33 | |||||||||||||||||||
| 16.83 | 24.79 | 24,281 | 1.74 | 0.83 | 1.88 | 17 | ||||||||||||||||||||
| 13.50 | (2.31 | ) | 22,235 | 1.81 | 0.97 | 2.06 | 11 | |||||||||||||||||||
| 14.02 | (2.36 | ) | 28,313 | 1.81 | 1.02 | 2.05 | 13 | |||||||||||||||||||
| 14.91 | (12.50 | ) | 179,476 | 0.70 | 1.49 | 0.86 | 14 | |||||||||||||||||||
| 17.56 | 15.20 | 190,885 | 0.70 | 2.22 | 0.96 | 25 | ||||||||||||||||||||
| 15.82 | (11.20 | ) | 179,831 | 0.70 | 2.30 | 1.06 | 33 | |||||||||||||||||||
| 18.09 | 25.69 | 139,715 | 0.99 | 1.59 | 1.10 | 17 | ||||||||||||||||||||
| 14.45 | (1.50 | ) | 94,362 | 1.06 | 1.69 | 1.24 | 11 | |||||||||||||||||||
| 14.95 | (1.66 | ) | 522,402 | 1.06 | 1.84 | 1.19 | 13 | |||||||||||||||||||
| 14.55 | (12.77 | ) | 2,074 | 1.25 | 0.99 | 1.40 | 14 | |||||||||||||||||||
| 17.14 | 14.58 | 2,099 | 1.25 | 1.75 | 1.57 | 25 | ||||||||||||||||||||
| 15.44 | (11.68 | ) | 1,833 | 1.25 | 1.64 | 1.60 | 33 | |||||||||||||||||||
| 17.70 | 25.12 | 2,096 | 1.49 | 1.07 | 1.71 | 17 | ||||||||||||||||||||
| 14.17 | (2.08 | ) | 1,461 | 1.56 | 1.28 | 1.95 | 11 | |||||||||||||||||||
| 14.69 | (2.14 | ) | 1,203 | 1.56 | 1.28 | 1.92 | 13 | |||||||||||||||||||
| 14.98 | (12.45 | ) | 4,022 | 0.60 | 1.61 | 0.72 | 14 | |||||||||||||||||||
| 17.60 | 15.38 | 3,778 | 0.60 | 2.31 | 0.83 | 25 | ||||||||||||||||||||
| 15.85 | (11.16 | ) | 19,516 | 0.60 | 2.31 | 0.91 | 33 | |||||||||||||||||||
| 18.13 | 25.88 | 21,891 | 0.84 | 1.36 | 0.93 | 17 | ||||||||||||||||||||
| 14.47 | (1.34 | ) | 58,836 | 0.86 | 1.93 | 1.02 | 11 | |||||||||||||||||||
| 14.97 | (1.42 | ) | 57,500 | 0.86 | 1.88 | 1.06 | 13 | |||||||||||||||||||
| 14.94 | (12.43 | ) | 2,168,007 | 0.50 | 1.68 | 0.61 | 14 | |||||||||||||||||||
| 17.61 | 15.50 | 2,457,383 | 0.50 | 2.46 | 0.72 | 25 | ||||||||||||||||||||
| 15.86 | (11.04 | ) | 3,808,621 | 0.50 | 2.42 | 0.81 | 33 | |||||||||||||||||||
| 18.13 | 26.04 | 3,516,978 | 0.74 | 1.84 | 0.81 | 17 | ||||||||||||||||||||
| 14.46 | (1.36 | ) | 3,030,640 | 0.81 | 2.05 | 0.91 | 11 | |||||||||||||||||||
| 14.97 | (1.37 | ) | 2,088,835 | 0.80 | 2.03 | 0.91 | 13 | |||||||||||||||||||
SEE NOTES TO FINANCIAL STATEMENTS.
| APRIL 30, 2020 | J.P. MORGAN INTERNATIONAL EQUITY FUNDS | 93 | ||||||
Table of Contents
FINANCIAL HIGHLIGHTS
FOR THE PERIODS INDICATED (continued)
| Per share operating performance | |||||||||||||||||||||||||||
| Investment operations | Distributions | |||||||||||||||||||||||||||
| Net asset value, beginning of period | Net investment income (loss) (b) | Net realized and unrealized gains (losses) on investments | Total from investment operations | Net investment income | Net realized gain | Total distributions | ||||||||||||||||||||||
JPMorgan International Focus Fund (formerly known as JPMorgan International Unconstrained Equity Fund) |
| |||||||||||||||||||||||||||
Class A |
| |||||||||||||||||||||||||||
Six Months Ended April 30, 2020 (Unaudited) | $ | 21.15 | $ | 0.08 | $ | (2.14 | ) | $ | (2.06 | ) | $ | (0.01 | ) | $ | — | $ | (0.01 | ) | ||||||||||
Year Ended October 31, 2019 | 18.24 | 0.26 | 3.02 | 3.28 | (0.37 | ) | — | (0.37 | ) | |||||||||||||||||||
Year Ended October 31, 2018 | 21.14 | 0.36 | (3.13 | ) | (2.77 | ) | (0.13 | ) | — | (0.13 | ) | |||||||||||||||||
Year Ended October 31, 2017 | 17.24 | 0.16 | 4.09 | 4.25 | (0.35 | ) | — | (0.35 | ) | |||||||||||||||||||
Year Ended October 31, 2016 | 17.61 | 0.22 | (f) | (0.55 | ) | (0.33 | ) | (0.04 | ) | — | (0.04 | ) | ||||||||||||||||
Year Ended October 31, 2015 | 18.59 | 0.09 | (f) | 0.39 | 0.48 | (0.17 | ) | (1.29 | ) | (1.46 | ) | |||||||||||||||||
Class C |
| |||||||||||||||||||||||||||
Six Months Ended April 30, 2020 (Unaudited) | 20.86 | 0.02 | (2.09 | ) | (2.07 | ) | — | — | — | |||||||||||||||||||
Year Ended October 31, 2019 | 17.98 | 0.16 | 2.97 | 3.13 | (0.25 | ) | — | (0.25 | ) | |||||||||||||||||||
Year Ended October 31, 2018 | 20.90 | 0.26 | (3.09 | ) | (2.83 | ) | (0.09 | ) | — | (0.09 | ) | |||||||||||||||||
Year Ended October 31, 2017 | 17.04 | 0.05 | 4.06 | 4.11 | (0.25 | ) | — | (0.25 | ) | |||||||||||||||||||
Year Ended October 31, 2016 | 17.45 | 0.13 | (f) | (0.53 | ) | (0.40 | ) | (0.01 | ) | — | (0.01 | ) | ||||||||||||||||
Year Ended October 31, 2015 | 18.44 | (0.02 | )(f) | 0.39 | 0.37 | (0.07 | ) | (1.29 | ) | (1.36 | ) | |||||||||||||||||
Class I |
| |||||||||||||||||||||||||||
Six Months Ended April 30, 2020 (Unaudited) | 21.43 | 0.11 | (2.16 | ) | (2.05 | ) | (0.05 | ) | — | (0.05 | ) | |||||||||||||||||
Year Ended October 31, 2019 | 18.49 | 0.31 | 3.04 | 3.35 | (0.41 | ) | — | (0.41 | ) | |||||||||||||||||||
Year Ended October 31, 2018 | 21.41 | 0.44 | (3.19 | ) | (2.75 | ) | (0.17 | ) | — | (0.17 | ) | |||||||||||||||||
Year Ended October 31, 2017 | 17.45 | 0.23 | 4.13 | 4.36 | (0.40 | ) | — | (0.40 | ) | |||||||||||||||||||
Year Ended October 31, 2016 | 17.71 | 0.24 | (f) | (0.50 | ) | (0.26 | ) | — | — | — | ||||||||||||||||||
Year Ended October 31, 2015 | 18.67 | 0.15 | (f) | 0.38 | 0.53 | (0.20 | ) | (1.29 | ) | (1.49 | ) | |||||||||||||||||
Class R2 |
| |||||||||||||||||||||||||||
Six Months Ended April 30, 2020 (Unaudited) | 20.99 | 0.06 | (2.13 | ) | (2.07 | ) | — | — | — | |||||||||||||||||||
Year Ended October 31, 2019 | 18.14 | 0.21 | 2.98 | 3.19 | (0.34 | ) | — | (0.34 | ) | |||||||||||||||||||
Year Ended October 31, 2018 | 21.11 | 0.35 | (3.17 | ) | (2.82 | ) | (0.15 | ) | — | (0.15 | ) | |||||||||||||||||
Year Ended October 31, 2017 | 17.21 | 0.06 | 4.14 | 4.20 | (0.30 | ) | — | (0.30 | ) | |||||||||||||||||||
Year Ended October 31, 2016 | 17.57 | 0.15 | (f) | (0.51 | ) | (0.36 | ) | — | — | — | ||||||||||||||||||
Year Ended October 31, 2015 | 18.55 | 0.03 | (f) | 0.39 | 0.42 | (0.11 | ) | (1.29 | ) | (1.40 | ) | |||||||||||||||||
Class R5 |
| |||||||||||||||||||||||||||
Six Months Ended April 30, 2020 (Unaudited) | 21.42 | 0.11 | (2.15 | ) | (2.04 | ) | (0.07 | ) | — | (0.07 | ) | |||||||||||||||||
Year Ended October 31, 2019 | 18.49 | 0.34 | 3.03 | 3.37 | (0.44 | ) | — | (0.44 | ) | |||||||||||||||||||
Year Ended October 31, 2018 | 21.39 | 0.53 | (3.25 | ) | (2.72 | ) | (0.18 | ) | — | (0.18 | ) | |||||||||||||||||
Year Ended October 31, 2017 | 17.44 | 0.20 | 4.17 | 4.37 | (0.42 | ) | — | (0.42 | ) | |||||||||||||||||||
Year Ended October 31, 2016 | 17.75 | 0.27 | (f) | (0.52 | ) | (0.25 | ) | (0.06 | ) | — | (0.06 | ) | ||||||||||||||||
Year Ended October 31, 2015 | 18.72 | 0.16 | (f) | 0.39 | 0.55 | (0.23 | ) | (1.29 | ) | (1.52 | ) | |||||||||||||||||
Class R6 |
| |||||||||||||||||||||||||||
Six Months Ended April 30, 2020 (Unaudited) | 21.44 | 0.13 | (2.16 | ) | (2.03 | ) | (0.09 | ) | — | (0.09 | ) | |||||||||||||||||
Year Ended October 31, 2019 | 18.50 | 0.27 | 3.13 | 3.40 | (0.46 | ) | — | (0.46 | ) | |||||||||||||||||||
Year Ended October 31, 2018 | 21.40 | 0.44 | (3.16 | ) | (2.72 | ) | (0.18 | ) | — | (0.18 | ) | |||||||||||||||||
Year Ended October 31, 2017 | 17.45 | 0.26 | 4.12 | 4.38 | (0.43 | ) | — | (0.43 | ) | |||||||||||||||||||
Year Ended October 31, 2016 | 17.76 | 0.29 | (f) | (0.52 | ) | (0.23 | ) | (0.08 | ) | — | (0.08 | ) | ||||||||||||||||
Year Ended October 31, 2015 | 18.73 | (0.01 | )(f) | 0.57 | 0.56 | (0.24 | ) | (1.29 | ) | (1.53 | ) | |||||||||||||||||
| (a) | Annualized for periods less than one year, unless otherwise noted. |
| (b) | Calculated based upon average shares outstanding. |
| (c) | Not annualized for periods less than one year. |
| (d) | Includes adjustments in accordance with accounting principles generally accepted in the United States of America and as such, the net asset values for financial reporting purposes and the returns based upon those net asset values may differ from the net asset values and returns for shareholder transactions. |
| (e) | Includes interest expense, if applicable, which is less than 0.005% unless otherwise noted. |
| (f) | Net investment income (loss) may appear disproportionate among the classes due to the timing of recognition of income and changes in the relative size of the classes. |
SEE NOTES TO FINANCIAL STATEMENTS.
| 94 | J.P. MORGAN INTERNATIONAL EQUITY FUNDS | APRIL 30, 2020 | ||||
Table of Contents
| Ratios/Supplemental data | |||||||||||||||||||||||||
| Ratios to average net assets (a) | ||||||||||||||||||||||||||
| Net asset value, end of period | Total return (excludes sales charge) (c)(d) | Net assets, end of period (000’s) | Net expenses (e) | Net investment income (loss) | Expenses without waivers and reimbursements | Portfolio turnover rate (c) | ||||||||||||||||||||
| $ | 19.08 | (9.75 | )% | $ | 115,420 | 1.00 | % | 0.78 | % | 1.21 | % | 18 | % | |||||||||||||
| 21.15 | 18.41 | 114,629 | 1.00 | 1.33 | 1.32 | 34 | ||||||||||||||||||||
| 18.24 | (13.20 | ) | 84,325 | 1.00 | 1.75 | 1.38 | 63 | |||||||||||||||||||
| 21.14 | 25.16 | 67,684 | 1.24 | 0.83 | 1.46 | 38 | ||||||||||||||||||||
| 17.24 | (1.86 | ) | 14,034 | 1.24 | 1.28 | (f) | 1.61 | 51 | ||||||||||||||||||
| 17.61 | 3.04 | 5,824 | 1.24 | 0.49 | (f) | 2.31 | 42 | |||||||||||||||||||
| 18.79 | (9.92 | ) | 14,513 | 1.50 | 0.19 | 1.72 | 18 | |||||||||||||||||||
| 20.86 | 17.73 | 18,447 | 1.50 | 0.83 | 1.84 | 34 | ||||||||||||||||||||
| 17.98 | (13.60 | ) | 22,532 | 1.50 | 1.29 | 1.89 | 63 | |||||||||||||||||||
| 20.90 | 24.51 | 14,534 | 1.74 | 0.27 | 2.00 | 38 | ||||||||||||||||||||
| 17.04 | (2.28 | ) | 4,626 | 1.74 | 0.75 | (f) | 2.14 | 51 | ||||||||||||||||||
| 17.45 | 2.39 | 3,439 | 1.74 | (0.12 | )(f) | 2.79 | 42 | |||||||||||||||||||
| 19.33 | (9.60 | ) | 194,013 | 0.75 | 1.06 | 0.95 | 18 | |||||||||||||||||||
| 21.43 | 18.62 | 177,764 | 0.75 | 1.57 | 1.08 | 34 | ||||||||||||||||||||
| 18.49 | (12.96 | ) | 189,061 | 0.75 | 2.09 | 1.13 | 63 | |||||||||||||||||||
| 21.41 | 25.60 | 131,356 | 0.89 | 1.14 | 1.19 | 38 | ||||||||||||||||||||
| 17.45 | (1.47 | ) | 9,929 | 0.89 | 1.41 | (f) | 1.35 | 51 | ||||||||||||||||||
| 17.71 | 3.29 | 59,858 | 0.89 | 0.83 | (f) | 1.84 | 42 | |||||||||||||||||||
| 18.92 | (9.86 | ) | 1,420 | 1.30 | 0.55 | 1.57 | 18 | |||||||||||||||||||
| 20.99 | 18.01 | 1,049 | 1.30 | 1.05 | 1.74 | 34 | ||||||||||||||||||||
| 18.14 | (13.46 | ) | 773 | 1.30 | 1.70 | 1.72 | 63 | |||||||||||||||||||
| 21.11 | 24.85 | 97 | 1.49 | 0.31 | 2.79 | 38 | ||||||||||||||||||||
| 17.21 | (2.05 | ) | 20 | 1.49 | 0.87 | (f) | 4.37 | 51 | ||||||||||||||||||
| 17.57 | 2.67 | 20 | 1.51 | 0.19 | (f) | 5.11 | 42 | |||||||||||||||||||
| 19.31 | (9.59 | ) | 2,437 | 0.65 | 1.03 | 0.89 | 18 | |||||||||||||||||||
| 21.42 | 18.76 | 3,082 | 0.65 | 1.71 | 1.04 | 34 | ||||||||||||||||||||
| 18.49 | (12.84 | ) | 3,341 | 0.65 | 2.56 | 1.07 | 63 | |||||||||||||||||||
| 21.39 | 25.67 | 90 | 0.79 | 1.01 | 2.44 | 38 | ||||||||||||||||||||
| 17.44 | (1.38 | ) | 20 | 0.80 | 1.57 | (f) | 3.59 | 51 | ||||||||||||||||||
| 17.75 | 3.43 | 20 | 0.81 | 0.89 | (f) | 4.43 | 42 | |||||||||||||||||||
| 19.32 | (9.53 | ) | 2,207,453 | 0.55 | 1.20 | 0.70 | 18 | |||||||||||||||||||
| 21.44 | 18.95 | 2,284,670 | 0.55 | 1.32 | 0.77 | 34 | ||||||||||||||||||||
| 18.50 | (12.81 | ) | 175,198 | 0.55 | 2.12 | 0.87 | 63 | |||||||||||||||||||
| 21.40 | 25.72 | 143,868 | 0.74 | 1.37 | 0.95 | 38 | ||||||||||||||||||||
| 17.45 | (1.29 | ) | 81,146 | 0.74 | 1.70 | (f) | 1.02 | 51 | ||||||||||||||||||
| 17.76 | 3.48 | 5,335 | 0.74 | (0.05 | )(f) | 2.87 | 42 | |||||||||||||||||||
SEE NOTES TO FINANCIAL STATEMENTS.
| APRIL 30, 2020 | J.P. MORGAN INTERNATIONAL EQUITY FUNDS | 95 | ||||||
Table of Contents
FINANCIAL HIGHLIGHTS
FOR THE PERIODS INDICATED (continued)
| Per share operating performance | |||||||||||||||||||
| Investment operations | Distributions | |||||||||||||||||||
| Net asset value, beginning of period | Net investment income (loss) (b) | Net realized and unrealized gains (losses) on investments | Total from investment operations | Net investment income | ||||||||||||||||
JPMorgan International Hedged Equity Fund |
| |||||||||||||||||||
Class A |
| |||||||||||||||||||
Six Months Ended April 30, 2020 (Unaudited) | $ | 15.58 | $ | 0.18 | $ | (1.50 | ) | $ | (1.32 | ) | $ | (0.24 | ) | |||||||
March 15, 2019 (g) through October 31, 2019 | 15.00 | 0.19 | 0.39 | 0.58 | — | |||||||||||||||
Class C |
| |||||||||||||||||||
Six Months Ended April 30, 2020 (Unaudited) | 15.53 | 0.11 | (1.48 | ) | (1.37 | ) | (0.17 | ) | ||||||||||||
March 15, 2019 (g) through October 31, 2019 | 15.00 | 0.16 | 0.37 | 0.53 | — | |||||||||||||||
Class I |
| |||||||||||||||||||
Six Months Ended April 30, 2020 (Unaudited) | 15.61 | 0.18 | (1.49 | ) | (1.31 | ) | (0.24 | ) | ||||||||||||
March 15, 2019 (g) through October 31, 2019 | 15.00 | 0.32 | 0.29 | 0.61 | — | |||||||||||||||
Class R5 |
| |||||||||||||||||||
Six Months Ended April 30, 2020 (Unaudited) | 15.62 | 0.18 | (1.47 | ) | (1.29 | ) | (0.25 | ) | ||||||||||||
March 15, 2019 (g) through October 31, 2019 | 15.00 | 0.34 | 0.28 | 0.62 | — | |||||||||||||||
Class R6 |
| |||||||||||||||||||
Six Months Ended April 30, 2020 (Unaudited) | 15.63 | 0.18 | (1.47 | ) | (1.29 | ) | (0.26 | ) | ||||||||||||
March 15, 2019 (g) through October 31, 2019 | 15.00 | 0.35 | 0.28 | 0.63 | — | |||||||||||||||
| (a) | Annualized for periods less than one year, unless otherwise noted. |
| (b) | Calculated based upon average shares outstanding. |
| (c) | Not annualized for periods less than one year. |
| (d) | Includes adjustments in accordance with accounting principles generally accepted in the United States of America and as such, the net asset values for financial reporting purposes and the returns based upon those net asset values may differ from the net asset values and returns for shareholder transactions. |
| (e) | Includes interest expense, if applicable, which is less than 0.005% unless otherwise noted. |
| (f) | Certainnon-recurring expenses incurred by the Fund were not annualized for the period indicated. |
| (g) | Commencement of operations. |
SEE NOTES TO FINANCIAL STATEMENTS.
| 96 | J.P. MORGAN INTERNATIONAL EQUITY FUNDS | APRIL 30, 2020 | ||||
Table of Contents
| Ratios/Supplemental data | |||||||||||||||||||||||||
| Ratios to average net assets (a) | ||||||||||||||||||||||||||
| Net asset value, end of period | Total return (excludes sales charge) (c)(d) | Net assets, end of period (000’s) | Net expenses (e)(f) | Net investment income (loss) (f) | Expenses without waivers and reimbursements (f) | Portfolio turnover rate (c) | ||||||||||||||||||||
|
|
|
|
|
|
|
|
|
|
|
|
|
| |||||||||||||
| $ | 14.02 | (8.67 | )% | $ | 794 | 0.85 | % | 2.46 | % | 1.26 | % | 38 | % | |||||||||||||
| 15.58 | 3.87 | 330 | 0.85 | 1.95 | 1.31 | 9 | ||||||||||||||||||||
| 13.99 | (8.92 | ) | 116 | 1.35 | 1.46 | 1.78 | 38 | |||||||||||||||||||
| 15.53 | 3.53 | 119 | 1.35 | 1.73 | 1.92 | 9 | ||||||||||||||||||||
| 14.06 | (8.56 | ) | 94,519 | 0.60 | 2.37 | 0.99 | 38 | |||||||||||||||||||
| 15.61 | 4.07 | 59,751 | 0.60 | 3.38 | 1.19 | 9 | ||||||||||||||||||||
| 14.08 | (8.46 | ) | 19 | 0.45 | 2.33 | 0.97 | 38 | |||||||||||||||||||
| 15.62 | 4.13 | 21 | 0.45 | 3.59 | 1.03 | 9 | ||||||||||||||||||||
| 14.08 | (8.44 | ) | 19 | 0.35 | 2.43 | 0.88 | 38 | |||||||||||||||||||
| 15.63 | 4.20 | 21 | 0.35 | 3.69 | 0.93 | 9 | ||||||||||||||||||||
SEE NOTES TO FINANCIAL STATEMENTS.
| APRIL 30, 2020 | J.P. MORGAN INTERNATIONAL EQUITY FUNDS | 97 | ||||||
Table of Contents
FINANCIAL HIGHLIGHTS
FOR THE PERIODS INDICATED (continued)
| Per share operating performance | |||||||||||||||||||||||||||
| Investment operations | Distributions | |||||||||||||||||||||||||||
| Net asset value, beginning of period | Net investment income (loss) (b) | Net realized and unrealized gains (losses) on investments | Total from investment operations | Net investment income | Net realized gain | Total distributions | ||||||||||||||||||||||
JPMorgan International Research Enhanced Equity Fund |
| |||||||||||||||||||||||||||
Class A |
| |||||||||||||||||||||||||||
Six Months Ended April 30, 2020 (Unaudited) | $ | 17.93 | $ | 0.18 | $ | (2.82 | ) | $ | (2.64 | ) | $ | (0.49 | ) | $ | — | $ | (0.49 | ) | ||||||||||
Year Ended October 31, 2019 | 16.79 | 0.51 | 1.15 | 1.66 | (0.52 | ) | — | (0.52 | ) | |||||||||||||||||||
Year Ended October 31, 2018 | 18.76 | 0.45 | (2.04 | ) | (1.59 | ) | (0.19 | ) | (0.19 | ) | (0.38 | ) | ||||||||||||||||
Year Ended October 31, 2017 | 15.54 | 0.34 | 3.23 | 3.57 | (0.35 | ) | — | (0.35 | ) | |||||||||||||||||||
Year Ended October 31, 2016 | 16.54 | 0.40 | (f) | (0.89 | ) | (0.49 | ) | (0.36 | ) | (0.15 | ) | (0.51 | ) | |||||||||||||||
Year Ended October 31, 2015 | 20.38 | 0.43 | (0.60 | ) | (0.17 | ) | (0.40 | ) | (3.27 | ) | (3.67 | ) | ||||||||||||||||
Class I |
| |||||||||||||||||||||||||||
Six Months Ended April 30, 2020 (Unaudited) | 18.17 | 0.20 | (2.85 | ) | (2.65 | ) | (0.54 | ) | — | (0.54 | ) | |||||||||||||||||
Year Ended October 31, 2019 | 17.01 | 0.56 | 1.16 | 1.72 | (0.56 | ) | — | (0.56 | ) | |||||||||||||||||||
Year Ended October 31, 2018 | 18.92 | 0.35 | (1.91 | ) | (1.56 | ) | (0.16 | ) | (0.19 | ) | (0.35 | ) | ||||||||||||||||
Year Ended October 31, 2017 | 15.68 | 0.41 | 3.23 | 3.64 | (0.40 | ) | — | (0.40 | ) | |||||||||||||||||||
Year Ended October 31, 2016 | 16.70 | 0.46 | (f) | (0.92 | ) | (0.46 | ) | (0.41 | ) | (0.15 | ) | (0.56 | ) | |||||||||||||||
Year Ended October 31, 2015 | 20.54 | 0.48 | (0.60 | ) | (0.12 | ) | (0.45 | ) | (3.27 | ) | (3.72 | ) | ||||||||||||||||
Class R6 |
| |||||||||||||||||||||||||||
Six Months Ended April 30, 2020 (Unaudited) | 18.11 | 0.20 | (2.83 | ) | (2.63 | ) | (0.56 | ) | — | (0.56 | ) | |||||||||||||||||
Year Ended October 31, 2019 | 16.97 | 0.57 | 1.16 | 1.73 | (0.59 | ) | — | (0.59 | ) | |||||||||||||||||||
November 1, 2017 (h) through October 31, 2018 | 18.98 | 0.56 | (2.16 | ) | (1.60 | ) | (0.22 | ) | (0.19 | ) | (0.41 | ) | ||||||||||||||||
| (a) | Annualized for periods less than one year, unless otherwise noted. |
| (b) | Calculated based upon average shares outstanding. |
| (c) | Not annualized for periods less than one year. |
| (d) | Includes adjustments in accordance with accounting principles generally accepted in the United States of America and as such, the net asset values for financial reporting purposes and the returns based upon those net asset values may differ from the net asset values and returns for shareholder transactions. |
| (e) | Includes interest expense, if applicable, which is less than 0.005% unless otherwise noted. |
| (f) | Net investment income (loss) may appear disproportionate among the classes due to the timing of recognition of income and changes in the relative size of the classes. |
| (g) | Amount rounds to less than 0.005%. |
| (h) | Commencement of offering of class of shares. |
SEE NOTES TO FINANCIAL STATEMENTS.
| 98 | J.P. MORGAN INTERNATIONAL EQUITY FUNDS | APRIL 30, 2020 | ||||
Table of Contents
| Ratios/Supplemental data | |||||||||||||||||||||||||
| Ratios to average net assets (a) | ||||||||||||||||||||||||||
| Net asset value, end of period | Total return (excludes sales charge) (c)(d) | Net assets, end of period (000’s) | Net expenses (e) | Net investment income (loss) | Expenses without waivers and reimbursements | Portfolio turnover rate (c) | ||||||||||||||||||||
| $ | 14.80 | (15.21 | )% | $ | 192,355 | 0.60 | % | 2.11 | % | 0.83 | % | 22 | % | |||||||||||||
| 17.93 | 10.39 | 213,256 | 0.60 | 3.00 | 0.83 | 22 | ||||||||||||||||||||
| 16.79 | (8.66 | ) | 203,437 | 0.60 | 2.40 | 0.84 | 42 | |||||||||||||||||||
| 18.76 | 23.41 | 298,112 | 0.59 | 1.98 | 0.90 | 33 | ||||||||||||||||||||
| 15.54 | (2.94 | ) | 69,626 | 0.60 | 2.60 | (f) | 1.02 | 24 | ||||||||||||||||||
| 16.54 | (0.29 | ) | 82,667 | 0.60 | 2.51 | 0.99 | 39 | |||||||||||||||||||
| 14.98 | (15.11 | ) | 208,853 | 0.34 | 2.36 | 0.56 | 22 | |||||||||||||||||||
| 18.17 | 10.65 | 185,680 | 0.35 | 3.28 | 0.56 | 22 | ||||||||||||||||||||
| 17.01 | (8.42 | ) | 152,610 | 0.35 | 1.85 | 0.56 | 42 | |||||||||||||||||||
| 18.92 | 23.71 | 4,740,590 | 0.34 | 2.37 | 0.58 | 33 | ||||||||||||||||||||
| 15.68 | (2.72 | ) | 1,241,856 | 0.34 | �� | 2.98 | (f) | 0.59 | 24 | |||||||||||||||||
| 16.70 | 0.00 | (g) | 779,908 | 0.35 | 2.79 | 0.60 | 39 | |||||||||||||||||||
| 14.92 | (15.10 | ) | 3,902,502 | 0.24 | 2.38 | 0.30 | 22 | |||||||||||||||||||
| 18.11 | 10.78 | 4,435,538 | 0.25 | 3.37 | 0.31 | 22 | ||||||||||||||||||||
| 16.97 | (8.60 | ) | 4,344,571 | 0.25 | 3.00 | 0.32 | 42 | |||||||||||||||||||
SEE NOTES TO FINANCIAL STATEMENTS.
| APRIL 30, 2020 | J.P. MORGAN INTERNATIONAL EQUITY FUNDS | 99 | ||||||
Table of Contents
FINANCIAL HIGHLIGHTS
FOR THE PERIODS INDICATED (continued)
| Per share operating performance | ||||||||||||||||||||
| Investment operations | Distributions | |||||||||||||||||||
| Net asset value, beginning of period | Net investment income (loss) (b) | Net realized and unrealized gains (losses) on investments | Total from investment operations | Net investment income | ||||||||||||||||
JPMorgan International Value Fund |
| |||||||||||||||||||
Class A |
| |||||||||||||||||||
Six Months Ended April 30, 2020 (Unaudited) | $ | 12.22 | $ | 0.13 | $ | (2.84 | ) | $ | (2.71 | ) | $ | (0.49 | ) | |||||||
Year Ended October 31, 2019 | 12.44 | 0.44 | (0.20 | ) | 0.24 | (0.46 | ) | |||||||||||||
Year Ended October 31, 2018 | 14.26 | 0.36 | (1.87 | ) | (1.51 | ) | (0.31 | ) | ||||||||||||
Year Ended October 31, 2017 | 12.23 | 0.22 | 2.50 | 2.72 | (0.69 | ) | ||||||||||||||
Year Ended October 31, 2016 | 13.02 | 0.23 | (0.88 | ) | (0.65 | ) | (0.14 | ) | ||||||||||||
Year Ended October 31, 2015 | 14.14 | 0.18 | (f) | (0.83 | ) | (0.65 | ) | (0.47 | ) | |||||||||||
Class C |
| |||||||||||||||||||
Six Months Ended April 30, 2020 (Unaudited) | 11.81 | 0.10 | (2.76 | ) | (2.66 | ) | (0.41 | ) | ||||||||||||
Year Ended October 31, 2019 | 12.02 | 0.36 | (0.18 | ) | 0.18 | (0.39 | ) | |||||||||||||
Year Ended October 31, 2018 | 13.78 | 0.28 | (1.82 | ) | (1.54 | ) | (0.22 | ) | ||||||||||||
Year Ended October 31, 2017 | 11.88 | 0.15 | 2.42 | 2.57 | (0.67 | ) | ||||||||||||||
Year Ended October 31, 2016 | 12.65 | 0.17 | (0.87 | ) | (0.70 | ) | (0.07 | ) | ||||||||||||
Year Ended October 31, 2015 | 13.72 | 0.10 | (f) | (0.78 | ) | (0.68 | ) | (0.39 | ) | |||||||||||
Class I |
| |||||||||||||||||||
Six Months Ended April 30, 2020 (Unaudited) | 12.54 | 0.15 | (2.91 | ) | (2.76 | ) | (0.52 | ) | ||||||||||||
Year Ended October 31, 2019 | 12.76 | 0.48 | (0.20 | ) | 0.28 | (0.50 | ) | |||||||||||||
Year Ended October 31, 2018 | 14.62 | 0.41 | (1.92 | ) | (1.51 | ) | (0.35 | ) | ||||||||||||
Year Ended October 31, 2017 | 12.57 | 0.28 | 2.55 | 2.83 | (0.78 | ) | ||||||||||||||
Year Ended October 31, 2016 | 13.37 | 0.28 | (0.91 | ) | (0.63 | ) | (0.17 | ) | ||||||||||||
Year Ended October 31, 2015 | 14.48 | 0.23 | (f) | (0.84 | ) | (0.61 | ) | (0.50 | ) | |||||||||||
Class L |
| |||||||||||||||||||
Six Months Ended April 30, 2020 (Unaudited) | 12.47 | 0.15 | (2.89 | ) | (2.74 | ) | (0.53 | ) | ||||||||||||
Year Ended October 31, 2019 | 12.70 | 0.46 | (0.17 | ) | 0.29 | (0.52 | ) | |||||||||||||
Year Ended October 31, 2018 | 14.55 | 0.41 | (1.90 | ) | (1.49 | ) | (0.36 | ) | ||||||||||||
Year Ended October 31, 2017 | 12.50 | 0.27 | 2.57 | 2.84 | (0.79 | ) | ||||||||||||||
Year Ended October 31, 2016 | 13.29 | 0.31 | (0.93 | ) | (0.62 | ) | (0.17 | ) | ||||||||||||
Year Ended October 31, 2015 | 14.41 | 0.23 | (f) | (0.83 | ) | (0.60 | ) | (0.52 | ) | |||||||||||
Class R2 |
| |||||||||||||||||||
Six Months Ended April 30, 2020 (Unaudited) | 11.96 | 0.11 | (2.79 | ) | (2.68 | ) | (0.40 | ) | ||||||||||||
Year Ended October 31, 2019 | 12.20 | 0.40 | (0.20 | ) | 0.20 | (0.44 | ) | |||||||||||||
Year Ended October 31, 2018 | 14.01 | 0.31 | (1.84 | ) | (1.53 | ) | (0.28 | ) | ||||||||||||
Year Ended October 31, 2017 | 12.04 | 0.19 | 2.46 | 2.65 | (0.68 | ) | ||||||||||||||
Year Ended October 31, 2016 | 12.83 | 0.19 | (0.87 | ) | (0.68 | ) | (0.11 | ) | ||||||||||||
Year Ended October 31, 2015 | 13.93 | 0.14 | (f) | (0.81 | ) | (0.67 | ) | (0.43 | ) | |||||||||||
Class R5 |
| |||||||||||||||||||
Six Months Ended April 30, 2020 (Unaudited) | 12.40 | 0.16 | (2.88 | ) | (2.72 | ) | (0.54 | ) | ||||||||||||
Year Ended October 31, 2019 | 12.65 | 0.49 | (0.21 | ) | 0.28 | (0.53 | ) | |||||||||||||
Year Ended October 31, 2018 | 14.51 | 0.42 | (1.91 | ) | (1.49 | ) | (0.37 | ) | ||||||||||||
Year Ended October 31, 2017 | 12.51 | 0.23 | 2.59 | 2.82 | (0.82 | ) | ||||||||||||||
September 9, 2016 (g) through October 31, 2016 | 12.55 | 0.03 | (0.07 | ) | (0.04 | ) | — | |||||||||||||
Class R6 |
| |||||||||||||||||||
Six Months Ended April 30, 2020 (Unaudited) | 12.43 | 0.16 | (2.88 | ) | (2.72 | ) | (0.55 | ) | ||||||||||||
Year Ended October 31, 2019 | 12.67 | 0.51 | (0.21 | ) | 0.30 | (0.54 | ) | |||||||||||||
Year Ended October 31, 2018 | 14.53 | 0.43 | (1.91 | ) | (1.48 | ) | (0.38 | ) | ||||||||||||
Year Ended October 31, 2017 | 12.51 | 0.31 | 2.53 | 2.84 | (0.82 | ) | ||||||||||||||
Year Ended October 31, 2016 | 13.31 | 0.37 | (0.96 | ) | (0.59 | ) | (0.21 | ) | ||||||||||||
Year Ended October 31, 2015 | 14.42 | 0.18 | (f) | (0.76 | ) | (0.58 | ) | (0.53 | ) | |||||||||||
| (a) | Annualized for periods less than one year, unless otherwise noted. |
| (b) | Calculated based upon average shares outstanding. |
| (c) | Not annualized for periods less than one year. |
| (d) | Includes adjustments in accordance with accounting principles generally accepted in the United States of America and as such, the net asset values for financial reporting purposes and the returns based upon those net asset values may differ from the net asset values and returns for shareholder transactions. |
| (e) | Includes interest expense, if applicable, which is less than 0.005% unless otherwise noted. |
| (f) | Net investment income (loss) may appear disproportionate among the classes due to the timing of recognition of income and changes in the relative size of the classes. |
| (g) | Commencement of offering of class of shares. |
SEE NOTES TO FINANCIAL STATEMENTS.
| 100 | J.P. MORGAN INTERNATIONAL EQUITY FUNDS | APRIL 30, 2020 | ||||
Table of Contents
| Ratios/Supplemental data | |||||||||||||||||||||||||
| Ratios to average net assets (a) | ||||||||||||||||||||||||||
| Net asset value, end of period | Total return (excludes sales charge) (c)(d) | Net assets, end of period (000’s) | Net expenses (e) | Net investment income (loss) | Expenses without waivers and reimbursements | Portfolio turnover rate (c) | ||||||||||||||||||||
|
|
|
|
|
|
|
|
|
|
|
|
|
| |||||||||||||
| $ | 9.02 | (23.25 | )% | $ | 130,147 | 1.00 | % | 2.40 | % | 1.25 | % | 29 | % | |||||||||||||
| 12.22 | 2.30 | 181,458 | 1.00 | 3.69 | 1.28 | 61 | ||||||||||||||||||||
| 12.44 | (10.88 | ) | 242,231 | 1.00 | 2.59 | 1.27 | 90 | |||||||||||||||||||
| 14.26 | 23.30 | 316,510 | 1.35 | 1.71 | 1.35 | 31 | ||||||||||||||||||||
| 12.23 | (5.01 | ) | 573,449 | 1.35 | 1.91 | 1.43 | 61 | |||||||||||||||||||
| 13.02 | (4.63 | ) | 695,251 | 1.35 | 1.31 | (f) | 1.45 | 74 | ||||||||||||||||||
| 8.74 | (23.44 | ) | 5,446 | 1.50 | 1.83 | 1.76 | 29 | |||||||||||||||||||
| 11.81 | 1.82 | 9,358 | 1.50 | 3.15 | 1.80 | 61 | ||||||||||||||||||||
| 12.02 | (11.37 | ) | 14,055 | 1.50 | 2.06 | 1.78 | 90 | |||||||||||||||||||
| 13.78 | 22.67 | 20,997 | 1.85 | 1.21 | 1.87 | 31 | ||||||||||||||||||||
| 11.88 | (5.54 | ) | 24,453 | 1.85 | 1.43 | 1.91 | 61 | |||||||||||||||||||
| 12.65 | (5.01 | ) | 31,296 | 1.85 | 0.79 | (f) | 1.90 | 74 | ||||||||||||||||||
| 9.26 | (23.13 | ) | 28,328 | 0.75 | 2.64 | 1.00 | 29 | |||||||||||||||||||
| 12.54 | 2.56 | 45,503 | 0.75 | 3.91 | 1.03 | 61 | ||||||||||||||||||||
| 12.76 | (10.62 | ) | 66,291 | 0.75 | 2.84 | 1.02 | 90 | |||||||||||||||||||
| 14.62 | 23.66 | 144,875 | 1.04 | 2.07 | 1.04 | 31 | ||||||||||||||||||||
| 12.57 | (4.74 | ) | 157,867 | 1.01 | 2.28 | 1.02 | 61 | |||||||||||||||||||
| 13.37 | (4.28 | ) | 233,045 | 1.03 | 1.62 | (f) | 1.03 | 74 | ||||||||||||||||||
| 9.20 | (23.10 | ) | 17,257 | 0.65 | 2.65 | 0.84 | 29 | |||||||||||||||||||
| 12.47 | 2.69 | 30,256 | 0.65 | 3.81 | 0.87 | 61 | ||||||||||||||||||||
| 12.70 | (10.57 | ) | 73,651 | 0.65 | 2.84 | 0.87 | 90 | |||||||||||||||||||
| 14.55 | 23.88 | 201,672 | 0.87 | 2.03 | 0.88 | 31 | ||||||||||||||||||||
| 12.50 | (4.63 | ) | 523,251 | 0.90 | 2.53 | 0.91 | 61 | |||||||||||||||||||
| 13.29 | (4.23 | ) | 1,480,321 | 0.95 | 1.63 | (f) | 0.99 | 74 | ||||||||||||||||||
| 8.88 | (23.29 | ) | 390 | 1.30 | 2.03 | 1.65 | 29 | |||||||||||||||||||
| 11.96 | 2.00 | 722 | 1.30 | 3.47 | 1.69 | 61 | ||||||||||||||||||||
| 12.20 | (11.19 | ) | 1,025 | 1.30 | 2.27 | 1.59 | 90 | |||||||||||||||||||
| 14.01 | 23.02 | 1,369 | 1.58 | 1.52 | 1.73 | 31 | ||||||||||||||||||||
| 12.04 | (5.28 | ) | 1,182 | 1.59 | 1.65 | 1.91 | 61 | |||||||||||||||||||
| 12.83 | (4.84 | ) | 1,929 | 1.60 | 1.01 | (f) | 2.01 | 74 | ||||||||||||||||||
| 9.14 | (23.12 | ) | 75 | 0.65 | 2.89 | 0.85 | 29 | |||||||||||||||||||
| 12.40 | 2.64 | 88 | 0.65 | 4.08 | 0.87 | 61 | ||||||||||||||||||||
| 12.65 | (10.58 | ) | 70 | 0.65 | 2.97 | 0.91 | 90 | |||||||||||||||||||
| 14.51 | 23.81 | 62 | 0.93 | 1.69 | 4.00 | 31 | ||||||||||||||||||||
| 12.51 | (0.32 | ) | 20 | 0.79 | 1.52 | 0.79 | 61 | |||||||||||||||||||
| 9.16 | (23.08 | ) | 93,047 | 0.55 | 2.88 | 0.74 | 29 | |||||||||||||||||||
| 12.43 | 2.83 | 125,887 | 0.55 | 4.22 | 0.77 | 61 | ||||||||||||||||||||
| 12.67 | (10.49 | ) | 124,246 | 0.55 | 3.06 | 0.77 | 90 | |||||||||||||||||||
| 14.53 | 23.99 | 108,302 | 0.80 | 2.28 | 0.82 | 31 | ||||||||||||||||||||
| 12.51 | (4.45 | ) | 27,998 | 0.72 | 3.00 | 0.73 | 61 | |||||||||||||||||||
| 13.31 | (4.04 | ) | 2,354 | 0.73 | 1.32 | (f) | 0.73 | 74 | ||||||||||||||||||
SEE NOTES TO FINANCIAL STATEMENTS.
| APRIL 30, 2020 | J.P. MORGAN INTERNATIONAL EQUITY FUNDS | 101 | ||||||
Table of Contents
AS OF APRIL 30, 2020 (Unaudited)
1. Organization
JPMorgan Trust I (“JPM I”), JPMorgan Trust II (“JPM II”) and JPMorgan Trust IV (“JPM IV”) (collectively, the “Trusts”) were formed on November 12, 2004, November 12, 2004 and November 11, 2015, respectively, as Delaware statutory trusts, pursuant to Declarations of Trust dated November 5, 2004, November 5, 2004 and November 11, 2015, respectively, and are registered under the Investment Company Act of 1940, as amended (the “1940 Act”), asopen-end management investment companies.
The following are 9 separate funds of the Trusts (each, a “Fund” and collectively, the “Funds”) covered by this report:
| Classes Offered | Trust | Diversification Classification | ||||
| JPMorgan Emerging Markets Equity Fund | Class A, Class C, Class I, Class L, Class R2, Class R3, Class R4, Class R5 and Class R6 | JPM I | Diversified | |||
| JPMorgan Emerging Markets Research Enhanced Equity Fund(1) | Class I(2) and Class R6 | JPM IV | Diversified | |||
| JPMorgan Europe Dynamic Fund | Class A, Class C, Class I, Class L and Class R6 | JPM I | Diversified | |||
| JPMorgan International Advantage Fund | Class A, Class C, Class I, Class R2 and Class R6 | JPM I | Diversified | |||
| JPMorgan International Equity Fund | Class A, Class C, Class I, Class R2, Class R5 and Class R6 | JPM I | Diversified | |||
| JPMorgan International Focus Fund(3) | Class A, Class C, Class I, Class R2, Class R5 and Class R6 | JPM I | Diversified | |||
| JPMorgan International Hedged Equity Fund(4) | Class A, Class C, Class I, Class R5 and Class R6 | JPM IV | Diversified | |||
| JPMorgan International Research Enhanced Equity Fund | Class A, Class I and Class R6 | JPM II | Diversified | |||
| JPMorgan International Value Fund | Class A, Class C, Class I, Class L, Class R2, Class R5 and Class R6 | JPM I | Diversified |
| (1) | The JPMorgan Emerging Markets Research Enhanced Equity Fund commenced operations on December 11, 2018. |
| (2) | Class I commenced operations on January 30, 2019. |
| (3) | Effective April 20, 2020, JPMorgan International Unconstrained Equity Fund changed its name to JPMorgan International Focus Fund. |
| (4) | The JPMorgan International Hedged Equity Fund commenced operations on March 15, 2019. |
Class L Shares of the JPMorgan Emerging Markets Equity Fund (“Emerging Markets Equity Fund”), JPMorgan Europe Dynamic Fund (“Europe Dynamic Fund”) and JPMorgan International Value Fund (“International Value Fund”) are publicly offered on a limited basis. As of October 9, 2017, Class A Shares of the JPMorgan International Research Enhanced Equity Fund (“International Research Enhanced Equity Fund”) were publicly offered on a limited basis. Investors are not eligible to purchase Class L Shares of Emerging Markets Equity Fund, Europe Dynamic Fund and International Value Fund and Class A Shares of International Research Enhanced Equity Fund unless they meet certain requirements as described in the Funds’ prospectus.
The investment objective of Emerging Markets Equity Fund is to seek to provide high total return.
The investment objective of JPMorgan Emerging Markets Research Enhanced Equity Fund (“Emerging Markets Research Enhanced Equity Fund”), JPMorgan International Focus Fund (“International Focus Fund”), International Research Enhanced Equity Fund and International Value Fund is to seek to provide long-term capital appreciation.
The investment objective of Europe Dynamic Fund is to seek total return from long-term capital growth. Total return consists of capital growth and current income.
The investment objective of JPMorgan International Advantage Fund (“International Advantage Fund”) is to seek to maximize long-term capital growth by investing primarily in equity securities in developed markets outside the U.S.
The investment objective of JPMorgan International Equity Fund (“International Equity Fund”) is to seek total return from long-term capital growth and income. Total return consists of capital growth and current income.
The investment objective of JPMorgan International Hedged Equity Fund (“International Hedged Equity Fund”) is to seek to provide capital appreciation.
Class A Shares generally provide for afront-end sales charge while Class C Shares provide for a contingent deferred sales charge (“CDSC”). No sales charges are assessed with respect to Class I, Class L, Class R2, Class R3, Class R4, Class R5 and Class R6 Shares. Certain Class A Shares, for whichfront-end sales charges have been waived, may be subject to a CDSC as described in the Funds’ prospectus. Class C Shares automatically convert to Class A Shares after ten years. All classes of shares have equal rights as to earnings, assets and voting privileges, except that each class may bear different transfer agency, distribution and service fees and each class has exclusive voting rights with respect to its distribution plan and shareholder servicing agreements.
J.P. Morgan Investment Management Inc. (“JPMIM”), an indirect, wholly owned subsidiary of JPMorgan Chase & Co. (“JPMorgan”), acts as Adviser (the “Adviser”) and Administrator (the “Administrator”) to the Funds.
| 102 | J.P. MORGAN INTERNATIONAL EQUITY FUNDS | APRIL 30, 2020 | ||||
Table of Contents
2. Significant Accounting Policies
The following is a summary of significant accounting policies followed by the Funds in the preparation of their financial statements. The Funds are investment companies and, accordingly, follow the investment company accounting and reporting guidance of the Financial Accounting Standards Board (“FASB”) Accounting Standards Codification Topic 946 — Investment Companies, which is part of U.S. generally accepted accounting principles (“GAAP”). The preparation of financial statements in conformity with GAAP requires management to make estimates and assumptions that affect (i) the reported amounts of assets and liabilities, (ii) disclosure of contingent assets and liabilities at the date of the financial statements, and (iii) the reported amounts of increases and decreases in net assets from operations during the reporting period. Actual results could differ from those estimates.
A. Valuation of Investments — Investments are valued in accordance with GAAP and the Funds’ valuation policies set forth by, and under the supervision and responsibility of, the Boards of Trustees of the Trusts (the “Boards”), which established the following approach to valuation, as described more fully below: (i) investments for which market quotations are readily available shall be valued at their market value and (ii) all other investments for which market quotations are not readily available shall be valued at their fair value as determined in good faith by the Boards.
The Administrator has established the J.P. Morgan Asset Management Americas Valuation Committee (“AVC”) to assist the Boards with the oversight and monitoring of the valuation of the Funds’ investments. The Administrator implements the valuation policies of the Funds’ investments, as directed by the Boards. The AVC oversees and carries out the policies for the valuation of investments held in the Funds. This includes monitoring the appropriateness of fair values based on results of ongoing valuation oversight including, but not limited to, consideration of macro or security specific events, market events, and pricing vendor and broker due diligence. The Administrator is responsible for discussing and assessing the potential impacts to the fair values on an ongoing basis, and, at least on a quarterly basis, with the AVC and the Boards.
A market-based approach is primarily used to value the Funds’ investments. Investments for which market quotations are not readily available are fair valued by approved affiliated and/or unaffiliated pricing vendors or third party broker-dealers (collectively referred to as “Pricing Services”) or may be internally fair valued using methods set forth by the valuation policies approved by the Boards. This may include the use of related or comparable assets or liabilities, recent transactions, market multiples, book values and other relevant information for the investment. An income-based valuation approach may be used in which the anticipated future cash flows of the investment are discounted to calculate the fair value. Discounts may also be applied due to the nature or duration of any restrictions on the disposition of the investments. Valuations may be based upon current market prices of securities that are comparable in coupon, rating, maturity and industry. It is possible that the estimated values may differ significantly from the values that would have been used had a ready market for the investments existed, and such differences could be material.
Equities and other exchange-traded instruments are valued at the last sale price or official market closing price on the primary exchange on which the instrument is traded before the net asset values (“NAV”) of the Funds are calculated on a valuation date. Certain foreign equity instruments, as well as certain derivatives with foreign equity reference obligations, are valued by applying international fair value factors provided by approved Pricing Services. The factors seek to adjust the local closing price for movements of local markets post-closing, but prior to the time the NAVs are calculated.
Investments inopen-end investment companies (“Underlying Funds”) are valued at each Underlying Fund’s NAV per share as of the report date.
Futures contracts and options are generally valued on the basis of available market quotations.
Valuations reflected in this report are as of the report date. As a result, changes in valuation due to market events and/or issuer-related events after the report date and prior to issuance of the report are not reflected herein.
The various inputs that are used in determining the valuation of the Funds’ investments are summarized into the three broad levels listed below.
| • | Level 1 — Unadjusted inputs using quoted prices in active markets for identical investments. |
| • | Level 2 — Other significant observable inputs including, but not limited to, quoted prices for similar investments, inputs other than quoted prices that are observable for investments (such as interest rates, prepayment speeds, credit risk, etc.) or other market corroborated inputs. |
| • | Level 3 — Significant inputs based on the best information available in the circumstances, to the extent observable inputs are not available (including the Funds’ assumptions in determining the fair value of investments). |
A financial instrument’s level within the fair value hierarchy is based on the lowest level of any input, both individually and in the aggregate, that is significant to the fair value measurement. The inputs or methodology used for valuing instruments are not necessarily an indication of the risk associated with investing in those instruments.
| APRIL 30, 2020 | J.P. MORGAN INTERNATIONAL EQUITY FUNDS | 103 | ||||||
Table of Contents
NOTES TO FINANCIAL STATEMENTS
AS OF APRIL 30, 2020 (Unaudited) (continued)
The following tables represent each valuation input as presented on the Schedules of Portfolio Investments (“SOIs”) (amounts in thousands):
Emerging Markets Equity Fund
| Level 1 Quoted prices | Level 2 Other significant observable inputs | Level 3 Significant unobservable inputs | Total | |||||||||||||
Investments in Securities | ||||||||||||||||
Common Stocks | ||||||||||||||||
Argentina | $ | 174,076 | $ | — | $ | — | $ | 174,076 | ||||||||
Brazil | 379,268 | — | — | 379,268 | ||||||||||||
China | 942,429 | 1,816,450 | — | 2,758,879 | ||||||||||||
Egypt | — | 44,613 | — | 44,613 | ||||||||||||
Hong Kong | — | 508,710 | — | 508,710 | ||||||||||||
Hungary | — | 118,202 | — | 118,202 | ||||||||||||
India | 104,541 | 1,180,654 | — | 1,285,195 | ||||||||||||
Indonesia | — | 165,156 | — | 165,156 | ||||||||||||
Macau | — | 106,169 | — | 106,169 | ||||||||||||
Mexico | 188,338 | — | — | 188,338 | ||||||||||||
Panama | 40,244 | — | — | 40,244 | ||||||||||||
Peru | 61,377 | — | — | 61,377 | ||||||||||||
Portugal | — | 127,669 | — | 127,669 | ||||||||||||
Russia | 770 | 61,229 | — | 61,999 | ||||||||||||
South Africa | — | 136,658 | — | 136,658 | ||||||||||||
South Korea | — | 432,815 | — | 432,815 | ||||||||||||
Spain | — | 8,929 | — | 8,929 | ||||||||||||
Taiwan | 577,398 | 127,867 | — | 705,265 | ||||||||||||
Turkey | 9,846 | 85,471 | — | 95,317 | ||||||||||||
United States | 244,037 | — | — | 244,037 | ||||||||||||
|
|
|
|
|
|
|
| |||||||||
Total Common Stocks | 2,722,324 | 4,920,592 | — | 7,642,916 | ||||||||||||
|
|
|
|
|
|
|
| |||||||||
Short-Term Investments | ||||||||||||||||
Investment Companies | 124,572 | — | — | 124,572 | ||||||||||||
Investment of cash collateral from securities loaned | 129,303 | — | — | 129,303 | ||||||||||||
|
|
|
|
|
|
|
| |||||||||
Total Short-Term Investments | 253,875 | — | — | 253,875 | ||||||||||||
|
|
|
|
|
|
|
| |||||||||
Total Investments in Securities | $ | 2,976,199 | $ | 4,920,592 | $ | — | $ | 7,896,791 | ||||||||
|
|
|
|
|
|
|
| |||||||||
| 104 | J.P. MORGAN INTERNATIONAL EQUITY FUNDS | APRIL 30, 2020 | ||||
Table of Contents
Emerging Markets Research Enhanced Equity Fund
| Level 1 Quoted prices | Level 2 Other significant observable inputs | Level 3 Significant unobservable inputs | Total | |||||||||||||
Investments in Securities | ||||||||||||||||
Common Stocks | ||||||||||||||||
Argentina | $ | 2,855 | $ | — | $ | — | $ | 2,855 | ||||||||
Brazil | 106,966 | — | — | 106,966 | ||||||||||||
Chile | 6,210 | — | — | 6,210 | ||||||||||||
China | 257,984 | 659,731 | — | 917,715 | ||||||||||||
Colombia | 3,676 | — | — | 3,676 | ||||||||||||
Czech Republic | — | 5,728 | — | 5,728 | ||||||||||||
Greece | — | 3,977 | — | 3,977 | ||||||||||||
Hong Kong | 2,652 | 5,841 | — | 8,493 | ||||||||||||
Hungary | — | 13,601 | — | 13,601 | ||||||||||||
India | 27,710 | 176,208 | — | 203,918 | ||||||||||||
Indonesia | — | 37,397 | — | 37,397 | ||||||||||||
Malaysia | — | 24,709 | — | 24,709 | ||||||||||||
Mexico | 56,990 | — | — | 56,990 | ||||||||||||
Peru | 9,717 | — | — | 9,717 | ||||||||||||
Philippines | — | 8,788 | — | 8,788 | ||||||||||||
Poland | — | 11,425 | — | 11,425 | ||||||||||||
Qatar | — | 8,796 | — | 8,796 | ||||||||||||
Russia | 19,590 | 76,295 | — | 95,885 | ||||||||||||
Saudi Arabia | — | 56,333 | — | 56,333 | ||||||||||||
Singapore | — | 2,263 | — | 2,263 | ||||||||||||
South Africa | 14,937 | 66,012 | — | 80,949 | ||||||||||||
South Korea | — | 287,602 | — | 287,602 | ||||||||||||
Taiwan | 118,437 | 161,671 | — | 280,108 | ||||||||||||
Thailand | 8,865 | 28,833 | — | 37,698 | ||||||||||||
Turkey | 2,482 | 23,309 | — | 25,791 | ||||||||||||
United Arab Emirates | — | 6,215 | — | 6,215 | ||||||||||||
United Kingdom | — | 1,824 | — | 1,824 | ||||||||||||
|
|
|
|
|
|
|
| |||||||||
Total Common Stocks | 639,071 | 1,666,558 | — | 2,305,629 | ||||||||||||
|
|
|
|
|
|
|
| |||||||||
Short-Term Investments | ||||||||||||||||
Investment Companies | 24,084 | — | — | 24,084 | ||||||||||||
Investment of cash collateral from securities loaned | 6,237 | — | — | 6,237 | ||||||||||||
|
|
|
|
|
|
|
| |||||||||
Total Short-Term Investments | 30,321 | — | — | 30,321 | ||||||||||||
|
|
|
|
|
|
|
| |||||||||
Total Investments in Securities | $ | 669,392 | $ | 1,666,558 | $ | — | $ | 2,335,950 | ||||||||
|
|
|
|
|
|
|
| |||||||||
Appreciation in Other Financial Instruments |
| |||||||||||||||
Futures Contracts | $ | 2,062 | $ | — | $ | — | $ | 2,062 | ||||||||
|
|
|
|
|
|
|
| |||||||||
| APRIL 30, 2020 | J.P. MORGAN INTERNATIONAL EQUITY FUNDS | 105 | ||||||
Table of Contents
NOTES TO FINANCIAL STATEMENTS
AS OF APRIL 30, 2020 (Unaudited) (continued)
Europe Dynamic Fund
| Level 1 Quoted prices | Level 2 Other significant observable inputs | Level 3 Significant unobservable inputs | Total | |||||||||||||
Investments in Securities | ||||||||||||||||
Common Stocks | ||||||||||||||||
Australia | $ | — | $ | 9,546 | $ | — | $ | 9,546 | ||||||||
Austria | — | 9,059 | — | 9,059 | ||||||||||||
Belgium | — | 9,926 | — | 9,926 | ||||||||||||
Finland | — | 8,173 | — | 8,173 | ||||||||||||
France | — | 62,181 | — | 62,181 | ||||||||||||
Germany | 3,142 | 51,564 | — | 54,706 | ||||||||||||
Ireland | 2,356 | 5,299 | — | 7,655 | ||||||||||||
Italy | — | 20,567 | — | 20,567 | ||||||||||||
Netherlands | 18,207 | 15,745 | — | 33,952 | ||||||||||||
Norway | — | 3,052 | — | 3,052 | ||||||||||||
Russia | — | 8,141 | — | 8,141 | ||||||||||||
South Africa | — | 3,241 | — | 3,241 | ||||||||||||
Spain | — | 6,131 | — | 6,131 | ||||||||||||
Sweden | — | 16,450 | — | 16,450 | ||||||||||||
Switzerland | — | 87,338 | — | 87,338 | ||||||||||||
United Kingdom | 3,059 | 70,037 | — | 73,096 | ||||||||||||
|
|
|
|
|
|
|
| |||||||||
Total Common Stocks | 26,764 | 386,450 | — | 413,214 | ||||||||||||
|
|
|
|
|
|
|
| |||||||||
Short-Term Investments | ||||||||||||||||
Investment Companies | 4,185 | — | — | 4,185 | ||||||||||||
Investment of cash collateral from securities loaned | 41,289 | — | — | 41,289 | ||||||||||||
|
|
|
|
|
|
|
| |||||||||
Total Short-Term Investments | 45,474 | — | — | 45,474 | ||||||||||||
|
|
|
|
|
|
|
| |||||||||
Total Investments in Securities | $ | 72,238 | $ | 386,450 | $ | — | $ | 458,688 | ||||||||
|
|
|
|
|
|
|
| |||||||||
Appreciation in Other Financial Instruments |
| |||||||||||||||
Futures Contracts | $ | — | $ | 289 | $ | — | $ | 289 | ||||||||
|
|
|
|
|
|
|
| |||||||||
| 106 | J.P. MORGAN INTERNATIONAL EQUITY FUNDS | APRIL 30, 2020 | ||||
Table of Contents
International Advantage Fund
Level 1 Quoted prices | Level 2 Other significant | Level 3 Significant | Total | |||||||||||||
Investments in Securities | ||||||||||||||||
Common Stocks | ||||||||||||||||
Australia | $ | 4,538 | $ | 134,368 | $ | — | $ | 138,906 | ||||||||
Austria | — | 6,749 | — | 6,749 | ||||||||||||
Belgium | — | 19,331 | — | 19,331 | ||||||||||||
China | — | 11,316 | — | 11,316 | ||||||||||||
Denmark | — | 37,736 | — | 37,736 | ||||||||||||
France | — | 104,223 | — | 104,223 | ||||||||||||
Germany | — | 92,980 | — | 92,980 | ||||||||||||
Hong Kong | — | 37,132 | — | 37,132 | ||||||||||||
Ireland | 1,951 | 2,635 | — | 4,586 | ||||||||||||
Israel | — | 5,060 | — | 5,060 | ||||||||||||
Italy | — | 17,385 | — | 17,385 | ||||||||||||
Japan | — | 380,430 | — | 380,430 | ||||||||||||
Netherlands | 28,953 | 68,182 | — | 97,135 | ||||||||||||
New Zealand | — | 3,811 | — | 3,811 | ||||||||||||
Norway | — | 15,140 | — | 15,140 | ||||||||||||
Portugal | — | 9,955 | — | 9,955 | ||||||||||||
Singapore | — | 36,699 | — | 36,699 | ||||||||||||
South Africa | — | 13,948 | — | 13,948 | ||||||||||||
Spain | — | 27,628 | — | 27,628 | ||||||||||||
Sweden | — | 39,966 | — | 39,966 | ||||||||||||
Switzerland | — | 175,122 | — | 175,122 | ||||||||||||
United Kingdom | — | 163,808 | — | 163,808 | ||||||||||||
United States | — | 10,815 | — | 10,815 | ||||||||||||
|
|
|
|
|
|
|
| |||||||||
Total Common Stocks | 35,442 | 1,414,419 | — | 1,449,861 | ||||||||||||
|
|
|
|
|
|
|
| |||||||||
Short-Term Investments | ||||||||||||||||
Investment Companies | 28,772 | — | — | 28,772 | ||||||||||||
Investment of cash collateral from securities loaned | 76,379 | — | — | 76,379 | ||||||||||||
|
|
|
|
|
|
|
| |||||||||
Total Short-Term Investments | 105,151 | — | — | 105,151 | ||||||||||||
|
|
|
|
|
|
|
| |||||||||
Total Investments in Securities | $ | 140,593 | $ | 1,414,419 | $ | — | $ | 1,555,012 | ||||||||
|
|
|
|
|
|
|
| |||||||||
Appreciation in Other Financial Instruments | ||||||||||||||||
Futures Contracts | $ | 181 | $ | 410 | $ | — | $ | 591 | ||||||||
|
|
|
|
|
|
|
| |||||||||
| APRIL 30, 2020 | J.P. MORGAN INTERNATIONAL EQUITY FUNDS | 107 | ||||||
Table of Contents
NOTES TO FINANCIAL STATEMENTS
AS OF APRIL 30, 2020 (Unaudited) (continued)
International Equity Fund
Level 1 Quoted prices | Level 2 Other significant | Level 3 Significant | Total | |||||||||||||
Investments in Securities | ||||||||||||||||
Common Stocks | ||||||||||||||||
Australia | $ | — | $ | 93,559 | $ | — | $ | 93,559 | ||||||||
Austria | — | 12,211 | — | 12,211 | ||||||||||||
Belgium | — | 21,535 | — | 21,535 | ||||||||||||
China | 39,043 | 60,052 | — | 99,095 | ||||||||||||
Denmark | — | 111,389 | — | 111,389 | ||||||||||||
Finland | — | 33,755 | — | 33,755 | ||||||||||||
France | — | 352,510 | — | 352,510 | ||||||||||||
Germany | — | 216,643 | — | 216,643 | ||||||||||||
Hong Kong | — | 109,197 | — | 109,197 | ||||||||||||
India | 33,304 | — | — | 33,304 | ||||||||||||
Japan | — | 410,053 | — | 410,053 | ||||||||||||
Macau | — | 22,908 | — | 22,908 | ||||||||||||
Netherlands | — | 114,208 | — | 114,208 | ||||||||||||
Singapore | — | 27,271 | — | 27,271 | ||||||||||||
South Korea | — | 39,330 | — | 39,330 | ||||||||||||
Spain | — | 27,747 | — | 27,747 | ||||||||||||
Sweden | — | 64,224 | — | 64,224 | ||||||||||||
Switzerland | — | 367,792 | — | 367,792 | ||||||||||||
Taiwan | 43,455 | — | — | 43,455 | ||||||||||||
United Kingdom | — | 393,740 | — | 393,740 | ||||||||||||
United States | — | 32,095 | — | 32,095 | ||||||||||||
|
|
|
|
|
|
|
| |||||||||
Total Common Stocks | 115,802 | 2,510,219 | — | 2,626,021 | ||||||||||||
|
|
|
|
|
|
|
| |||||||||
Short-Term Investments | ||||||||||||||||
Investment Companies | 28,692 | — | — | 28,692 | ||||||||||||
Investment of cash collateral from securities loaned | 111,555 | — | — | 111,555 | ||||||||||||
|
|
|
|
|
|
|
| |||||||||
Total Short-Term Investments | 140,247 | — | — | 140,247 | ||||||||||||
|
|
|
|
|
|
|
| |||||||||
Total Investments in Securities | $ | 256,049 | $ | 2,510,219 | $ | — | $ | 2,766,268 | ||||||||
|
|
|
|
|
|
|
| |||||||||
| 108 | J.P. MORGAN INTERNATIONAL EQUITY FUNDS | APRIL 30, 2020 | ||||
Table of Contents
International Focus Fund
Level 1 Quoted prices | Level 2 Other significant | Level 3 Significant | Total | |||||||||||||
Investments in Securities | ||||||||||||||||
Common Stocks | ||||||||||||||||
Australia | $ | — | $ | 50,620 | $ | — | $ | 50,620 | ||||||||
Belgium | — | 38,927 | — | 38,927 | ||||||||||||
Canada | 170,412 | — | — | 170,412 | ||||||||||||
China | 79,313 | 172,215 | — | 251,528 | ||||||||||||
Denmark | — | 69,229 | — | 69,229 | ||||||||||||
Finland | — | 32,832 | — | 32,832 | ||||||||||||
France | — | 168,128 | — | 168,128 | ||||||||||||
Germany | — | 252,941 | — | 252,941 | ||||||||||||
Hong Kong | — | 87,611 | — | 87,611 | ||||||||||||
India | 83,453 | — | — | 83,453 | ||||||||||||
Indonesia | — | 37,428 | — | 37,428 | ||||||||||||
Japan | — | 141,630 | — | 141,630 | ||||||||||||
Netherlands | — | 68,076 | — | 68,076 | ||||||||||||
South Korea | — | 62,511 | — | 62,511 | ||||||||||||
Sweden | — | 76,188 | — | 76,188 | ||||||||||||
Switzerland | — | 278,837 | — | 278,837 | ||||||||||||
Taiwan | 68,847 | — | — | 68,847 | ||||||||||||
United Kingdom | — | 503,004 | — | 503,004 | ||||||||||||
United States | — | 38,881 | — | 38,881 | ||||||||||||
|
|
|
|
|
|
|
| |||||||||
Total Common Stocks | 402,025 | 2,079,058 | — | 2,481,083 | ||||||||||||
|
|
|
|
|
|
|
| |||||||||
Short-Term Investments | ||||||||||||||||
Investment Companies | 32,724 | — | — | 32,724 | ||||||||||||
Investment of cash collateral from securities loaned | 149,050 | — | — | 149,050 | ||||||||||||
|
|
|
|
|
|
|
| |||||||||
Total Short-Term Investments | 181,774 | — | — | 181,774 | ||||||||||||
|
|
|
|
|
|
|
| |||||||||
Total Investments in Securities | $ | 583,799 | $ | 2,079,058 | $ | — | $ | 2,662,857 | ||||||||
|
|
|
|
|
|
|
| |||||||||
| APRIL 30, 2020 | J.P. MORGAN INTERNATIONAL EQUITY FUNDS | 109 | ||||||
Table of Contents
NOTES TO FINANCIAL STATEMENTS
AS OF APRIL 30, 2020 (Unaudited) (continued)
International Hedged Equity Fund
Level 1 Quoted prices | Level 2 Other significant | Level 3 Significant | Total | |||||||||||||
Investments in Securities | ||||||||||||||||
Common Stocks | ||||||||||||||||
Australia | $ | — | $ | 4,680 | $ | — | $ | 4,680 | ||||||||
Austria | — | 445 | — | 445 | ||||||||||||
Denmark | — | 3,277 | — | 3,277 | ||||||||||||
Finland | — | 586 | — | 586 | ||||||||||||
France | — | 12,649 | — | 12,649 | ||||||||||||
Germany | — | 9,696 | — | 9,696 | ||||||||||||
Hong Kong | — | 2,150 | — | 2,150 | ||||||||||||
Ireland | 642 | 318 | — | 960 | ||||||||||||
Italy | — | 2,119 | — | 2,119 | ||||||||||||
Japan | — | 23,793 | — | 23,793 | ||||||||||||
Luxembourg | — | 150 | — | 150 | ||||||||||||
Netherlands | 342 | 4,365 | — | 4,707 | ||||||||||||
Norway | — | 835 | — | 835 | ||||||||||||
Singapore | — | 831 | — | 831 | ||||||||||||
Spain | — | 3,234 | — | 3,234 | ||||||||||||
Sweden | — | 1,331 | — | 1,331 | ||||||||||||
Switzerland | — | 11,747 | — | 11,747 | ||||||||||||
United Kingdom | — | 15,948 | — | 15,948 | ||||||||||||
United States | — | 353 | — | 353 | ||||||||||||
|
|
|
|
|
|
|
| |||||||||
Total Common Stocks | 984 | 98,507 | — | 99,491 | ||||||||||||
|
|
|
|
|
|
|
| |||||||||
Options Purchased | ||||||||||||||||
Put Options Purchased | 637 | — | — | 637 | ||||||||||||
Short-Term Investments | ||||||||||||||||
Investment Companies | 854 | — | — | 854 | ||||||||||||
|
|
|
|
|
|
|
| |||||||||
Total Investments in Securities | $ | 2,475 | $ | 98,507 | $ | — | $ | 100,982 | ||||||||
|
|
|
|
|
|
|
| |||||||||
Appreciation in Other Financial Instruments | ||||||||||||||||
Futures Contracts | $ | 230 | $ | 18 | $ | — | $ | 248 | ||||||||
|
|
|
|
|
|
|
| |||||||||
Depreciation in Other Financial Instruments | ||||||||||||||||
Options Written | ||||||||||||||||
Call Options Written | $ | (9,771 | ) | $ | — | $ | — | $ | (9,771 | ) | ||||||
Put Options Written | (110 | ) | — | — | (110 | ) | ||||||||||
|
|
|
|
|
|
|
| |||||||||
Total Depreciation in Other Financial Instruments | $ | (9,881 | ) | $ | — | $ | — | $ | (9,881 | ) | ||||||
|
|
|
|
|
|
|
| |||||||||
| 110 | J.P. MORGAN INTERNATIONAL EQUITY FUNDS | APRIL 30, 2020 | ||||
Table of Contents
International Research Enhanced Equity Fund
Level 1 Quoted prices | Level 2 Other significant | Level 3 Significant | Total | |||||||||||||
Investments in Securities | ||||||||||||||||
Common Stocks | ||||||||||||||||
Australia | $ | — | $ | 194,024 | $ | — | $ | 194,024 | ||||||||
Austria | — | 18,420 | — | 18,420 | ||||||||||||
Denmark | — | 134,277 | — | 134,277 | ||||||||||||
Finland | — | 24,221 | — | 24,221 | ||||||||||||
France | — | 522,852 | — | 522,852 | ||||||||||||
Germany | — | 400,268 | — | 400,268 | ||||||||||||
Hong Kong | 2 | 87,154 | — | 87,156 | ||||||||||||
Ireland | 26,550 | 13,321 | — | 39,871 | ||||||||||||
Italy | — | 87,809 | — | 87,809 | ||||||||||||
Japan | — | 971,923 | — | 971,923 | ||||||||||||
Luxembourg | — | 6,219 | — | 6,219 | ||||||||||||
Malta | — | — | 1 | 1 | ||||||||||||
Netherlands | 14,086 | 178,796 | — | 192,882 | ||||||||||||
Norway | — | 35,863 | — | 35,863 | ||||||||||||
Singapore | — | 33,913 | — | 33,913 | ||||||||||||
Spain | — | 133,856 | — | 133,856 | ||||||||||||
Sweden | — | 55,047 | — | 55,047 | ||||||||||||
Switzerland | — | 482,481 | — | 482,481 | ||||||||||||
United Kingdom | — | 658,908 | — | 658,908 | ||||||||||||
United States | — | 14,574 | — | 14,574 | ||||||||||||
|
|
|
|
|
|
|
| |||||||||
Total Common Stocks | 40,638 | 4,053,926 | 1 | 4,094,565 | ||||||||||||
|
|
|
|
|
|
|
| |||||||||
Short-Term Investments | ||||||||||||||||
Investment Companies | 138,332 | — | — | 138,332 | ||||||||||||
Investment of cash collateral from securities loaned | 305,344 | — | — | 305,344 | ||||||||||||
|
|
|
|
|
|
|
| |||||||||
Total Short-Term Investments | 443,676 | — | — | 443,676 | ||||||||||||
|
|
|
|
|
|
|
| |||||||||
Total Investments in Securities | $ | 484,314 | $ | 4,053,926 | $ | 1 | $ | 4,538,241 | ||||||||
|
|
|
|
|
|
|
| |||||||||
Appreciation in Other Financial Instruments | ||||||||||||||||
Futures Contracts | $ | 11,497 | $ | — | $ | — | $ | 11,497 | ||||||||
|
|
|
|
|
|
|
| |||||||||
| APRIL 30, 2020 | J.P. MORGAN INTERNATIONAL EQUITY FUNDS | 111 | ||||||
Table of Contents
NOTES TO FINANCIAL STATEMENTS
AS OF APRIL 30, 2020 (Unaudited) (continued)
International Value Fund
Level 1 Quoted prices | Level 2 Other significant | Level 3 Significant | Total | |||||||||||||
Investments in Securities | ||||||||||||||||
Common Stocks | ||||||||||||||||
Australia | $ | — | $ | 20,906 | $ | — | $ | 20,906 | ||||||||
Austria | 434 | 1,864 | — | 2,298 | ||||||||||||
Belgium | — | 3,400 | — | 3,400 | ||||||||||||
China | — | 1,462 | — | 1,462 | ||||||||||||
Denmark | — | 3,122 | — | 3,122 | ||||||||||||
Finland | — | 4,695 | — | 4,695 | ||||||||||||
France | — | 21,557 | — | 21,557 | ||||||||||||
Georgia | — | 677 | — | 677 | ||||||||||||
Germany | 494 | 21,948 | — | 22,442 | ||||||||||||
Hong Kong | — | 5,832 | — | 5,832 | ||||||||||||
India | — | 285 | — | 285 | ||||||||||||
Ireland | — | 536 | — | 536 | ||||||||||||
Israel | — | 1,155 | — | 1,155 | ||||||||||||
Italy | — | 5,107 | — | 5,107 | ||||||||||||
Japan | — | 69,652 | — | 69,652 | ||||||||||||
Luxembourg | — | 1,205 | — | 1,205 | ||||||||||||
Malta | — | 323 | — | 323 | ||||||||||||
Netherlands | 1,146 | 12,820 | — | 13,966 | ||||||||||||
New Zealand | — | 197 | �� | 197 | ||||||||||||
Norway | — | 6,817 | — | 6,817 | ||||||||||||
Russia | — | 436 | — | 436 | ||||||||||||
Singapore | — | 3,307 | — | 3,307 | ||||||||||||
South Africa | — | 1,415 | — | 1,415 | ||||||||||||
Spain | — | 7,479 | — | 7,479 | ||||||||||||
Sweden | — | 8,362 | — | 8,362 | ||||||||||||
Switzerland | — | 20,333 | — | 20,333 | ||||||||||||
United Kingdom | 795 | 36,904 | — | 37,699 | ||||||||||||
United States | 362 | 167 | — | 529 | ||||||||||||
|
|
|
|
|
|
|
| |||||||||
Total Common Stocks | 3,231 | 261,963 | — | 265,194 | ||||||||||||
|
|
|
|
|
|
|
| |||||||||
Short-Term Investments | ||||||||||||||||
Investment Companies | 4,976 | — | — | 4,976 | ||||||||||||
Investment of cash collateral from securities loaned | 3,129 | — | — | 3,129 | ||||||||||||
|
|
|
|
|
|
|
| |||||||||
Total Short-Term Investments | 8,105 | — | — | 8,105 | ||||||||||||
|
|
|
|
|
|
|
| |||||||||
Total Investments in Securities | $ | 11,336 | $ | 261,963 | $ | — | $ | 273,299 | ||||||||
|
|
|
|
|
|
|
| |||||||||
Appreciation in Other Financial Instruments | ||||||||||||||||
Futures Contracts | $ | 133 | $ | 363 | $ | — | $ | 496 | ||||||||
|
|
|
|
|
|
|
| |||||||||
B. Restricted Securities — Certain securities held by the Funds may be subject to legal or contractual restrictions on resale. Restricted securities generally are resold in transactions exempt from registration under the Securities Act of 1933, as amended (the “Securities Act”). Disposal of these securities may involve time-consuming negotiations and expense. Prompt sale at the current valuation may be difficult and could adversely affect the net asset value of the Funds.
As of April 30, 2020, the Funds had no investments in restricted securities other than securities sold to the Funds under Rule 144A or Regulation S under the Securities Act.
C. Securities Lending — The Funds are authorized to engage in securities lending in order to generate additional income. The Funds are able to lend to approved borrowers. Citibank N.A. (“Citibank”) serves as lending agent for the Funds, pursuant to a Securities Lending Agency Agreement (the “Securities Lending Agency Agreement”). Securities loaned are collateralized by cash equal to at least 100% of the market value plus accrued interest on the securities lent, which is invested in the Class IM Shares of the JPMorgan U.S. Government Money Market Fund and/or the Agency SL Class Shares of the JPMorgan Securities Lending Money Market Fund. The Funds retain loan fees and the interest on cash collateral investments but are required to pay the borrower a rebate for the use of cash collateral. In cases where the lent security is of high value to borrowers, there may be
| 112 | J.P. MORGAN INTERNATIONAL EQUITY FUNDS | APRIL 30, 2020 | ||||
Table of Contents
a negative rebate (i.e., a net payment from the borrower to the Funds). Upon termination of a loan, the Funds are required to return to the borrower an amount equal to the cash collateral, plus any rebate owed to the borrowers. The remaining maturities of the securities lending transactions are considered overnight and continuous. Loans are subject to termination by the Funds or the borrower at any time.
The net income earned on the securities lending (after payment of rebates and Citibank’s fee) is included on the Statements of Operations as Income from securities lending (net). The Funds also receive payments from the borrower during the period of the loan, equivalent to dividends and interest earned on the securities loaned, which are recorded as Dividend or Interest income, respectively, on the Statements of Operations.
Under the Securities Lending Agency Agreement, Citibank marks to market the loaned securities on a daily basis. In the event the cash received from the borrower is less than 102% of the value of the loaned securities (105% for loans ofnon-U.S. securities), Citibank requests additional cash from the borrower so as to maintain a collateralization level of at least 102% of the value of the loaned securities plus accrued interest (105% for loans ofnon-U.S. securities), subject to certainde minimis amounts.
The value of securities out on loan is recorded as an asset on the Statements of Assets and Liabilities. The value of the cash collateral received is recorded as a liability on the Statements of Assets and Liabilities and details of collateral investments are disclosed on the SOIs.
The Funds bear the risk of loss associated with the collateral investments and are not entitled to additional collateral from the borrower to cover any such losses. To the extent that the value of the collateral investments declines below the amount owed to a borrower, the Funds may incur losses that exceed the amount they earned on lending the security. Upon termination of a loan, the Funds may use leverage (borrow money) to repay the borrower for cash collateral posted if the Adviser does not believe that it is prudent to sell the collateral investments to fund the payment of this liability.
The following table presents for each lending Fund, the value of the securities on loan with Citibank, net of amounts available for offset under the master netting arrangements and any related collateral received or posted by the Funds as of April 30, 2020 (amounts in thousands).
Investment Securities on Loan, at value, Presented on the Statements of Assets and Liabilities | Cash Collateral Posted by Borrower* | Net Amount Due to Counterparty (not less than zero) | ||||||||||
Emerging Markets Equity Fund | $ | 126,114 | $ | (126,114 | ) | $ | — | |||||
Emerging Markets Research Enhanced Equity Fund | 5,853 | (5,853 | ) | — | ||||||||
Europe Dynamic Fund | 35,227 | (35,227 | ) | — | ||||||||
International Advantage Fund | 72,637 | (72,637 | ) | — | ||||||||
International Equity Fund | 104,180 | (104,180 | ) | — | ||||||||
International Focus Fund | 139,159 | (139,159 | ) | — | ||||||||
International Research Enhanced Equity Fund | 282,127 | (282,127 | ) | — | ||||||||
International Value Fund | 2,936 | (2,936 | ) | — | ||||||||
| * | Collateral posted reflects the value of securities on loan and does not include any additional amounts received from the borrower. |
Securities lending also involves counterparty risks, including the risk that the loaned securities may not be returned in a timely manner or at all. Subject to certain conditions, Citibank has agreed to indemnify the Funds from losses resulting from a borrower’s failure to return a loaned security.
JPMIM voluntarily waived investment advisory fees charged to the Funds to reduce the impact of the cash collateral investment in the JPMorgan U.S. Government Money Market Fund from 0.15% to 0.06%. For the six months ended April 30, 2020, JPMIM waived fees associated with the Funds’ investment in the JPMorgan U.S. Government Money Market Fund as follows (amounts in thousands):
Emerging Markets Equity Fund | $ | 3 | ||
Emerging Markets Research Enhanced Equity Fund | 2 | |||
Europe Dynamic Fund | 1 | |||
International Advantage Fund | 2 | |||
International Equity Fund | 2 | |||
International Focus Fund | 4 | |||
International Research Enhanced Equity Fund | 4 | |||
| International Value Fund | 1 |
The above waiver is included in the determination of earnings on cash collateral investment and in the calculation of Citibank’s compensation and is included on the Statements of Operations as Income from securities lending (net).
International Hedged Equity Fund did not have any securities out on loan at April 30, 2020.
| APRIL 30, 2020 | J.P. MORGAN INTERNATIONAL EQUITY FUNDS | 113 | ||||||
Table of Contents
NOTES TO FINANCIAL STATEMENTS
AS OF APRIL 30, 2020 (Unaudited) (continued)
D. Investment Transactions with Affiliates — The Funds invested in Underlying Funds which are advised by the Adviser. An issuer which is under common control with the Funds may be considered an affiliate. For the purposes of the financial statements, the Funds assume the issuers listed in the table below to be affiliated issuers. Underlying Funds’ distributions may be reinvested into the Underlying Funds. Reinvestment amounts are included in the purchase cost amounts in the table below. Amounts in the table below are in thousands.
| Emerging Markets Equity Fund |
| |||||||||||||||||||||||||||||||||||
| For the six months ended April 30, 2020 | ||||||||||||||||||||||||||||||||||||
| Security Description | Value at October 31, 2019 | Purchases at Cost | Proceeds from Sales | Net Realized Gain (Loss) | Change in Unrealized Appreciation/ (Depreciation) | Value at April 30, 2020 | Shares at April 30, 2020 | Dividend Income | Capital Gain Distributions | |||||||||||||||||||||||||||
JPMorgan Prime Money Market Fund Class Institutional Shares, 0.63% (a)(b) | $ | 168,369 | $ | 1,329,842 | $ | 1,373,681 | $ | (59 | ) | $ | 101 | $ | 124,572 | 124,472 | $ | 1,173 | $ | — | ||||||||||||||||||
JPMorgan Securities Lending Money Market Fund Agency SL Class Shares, 0.77% (a)(b) | 8,001 | 200,000 | 127,000 | 12 | * | 36 | 81,049 | 81,033 | 159 | * | — | |||||||||||||||||||||||||
JPMorgan U.S. Government Money Market Fund Class IM Shares, 0.23% (a)(b) | 5,485 | 192,085 | 149,316 | — | — | 48,254 | 48,254 | 36 | * | — | ||||||||||||||||||||||||||
|
|
|
|
|
|
|
|
|
|
|
|
|
|
|
| |||||||||||||||||||||
Total | $ | 181,855 | $ | 1,721,927 | $ | 1,649,997 | $ | (47 | ) | $ | 137 | $ | 253,875 | $ | 1,368 | $ | — | |||||||||||||||||||
|
|
|
|
|
|
|
|
|
|
|
|
|
|
|
| |||||||||||||||||||||
| Emerging Markets Research Enhanced Equity Fund |
| |||||||||||||||||||||||||||||||||||
| For the six months ended April 30, 2020 | ||||||||||||||||||||||||||||||||||||
| Security Description | Value at October 31, 2019 | Purchases at Cost | Proceeds from Sales | Net Realized Gain (Loss) | Change in Unrealized Appreciation/ (Depreciation) | Value at April 30, 2020 | Shares at April 30, 2020 | Dividend Income | Capital Gain Distributions | |||||||||||||||||||||||||||
JPMorgan Prime Money Market Fund Class Institutional Shares, 0.63% (a)(b) | $ | 22,226 | $ | 780,662 | $ | 778,821 | $ | (3 | ) | $ | 20 | $ | 24,084 | 24,064 | $ | 390 | $ | — | ||||||||||||||||||
JPMorgan Securities Lending Money Market Fund Agency SL Class Shares, 0.77% (a)(b) | — | 215,000 | 212,001 | (9 | )* | 1 | 2,991 | 2,991 | 96 | * | — | |||||||||||||||||||||||||
JPMorgan U.S. Government Money Market Fund Class IM Shares, 0.23% (a)(b) | 2,216 | 182,716 | 181,686 | — | — | 3,246 | 3,246 | 28 | * | — | ||||||||||||||||||||||||||
|
|
|
|
|
|
|
|
|
|
|
|
|
|
|
| |||||||||||||||||||||
Total | $ | 24,442 | $ | 1,178,378 | $ | 1,172,508 | $ | (12 | ) | $ | 21 | $ | 30,321 | $ | 514 | $ | — | |||||||||||||||||||
|
|
|
|
|
|
|
|
|
|
|
|
|
|
|
| |||||||||||||||||||||
| Europe Dynamic Fund |
| |||||||||||||||||||||||||||||||||||
| For the six months ended April 30, 2020 | ||||||||||||||||||||||||||||||||||||
| Security Description | Value at October 31, 2019 | Purchases at Cost | Proceeds from Sales | Net Realized Gain (Loss) | Change in Unrealized Appreciation/ (Depreciation) | Value at April 30, 2020 | Shares at April 30, 2020 | Dividend Income | Capital Gain Distributions | |||||||||||||||||||||||||||
JPMorgan Prime Money Market Fund Class Institutional Shares, 0.63% (a)(b) | $ | 130 | $ | 154,102 | $ | 150,069 | $ | 15 | $ | 7 | $ | 4,185 | 4,181 | $ | 106 | $ | — | |||||||||||||||||||
JPMorgan Securities Lending Money Market Fund Agency SL Class Shares, 0.77% (a)(b) | — | 35,000 | 5,000 | 1 | * | 5 | 30,006 | 30,000 | 8 | * | — | |||||||||||||||||||||||||
JPMorgan U.S. Government Money Market Fund Class IM Shares, 0.23% (a)(b) | 286 | 47,504 | 36,507 | — | — | 11,283 | 11,283 | 12 | * | — | ||||||||||||||||||||||||||
|
|
|
|
|
|
|
|
|
|
|
|
|
|
|
| |||||||||||||||||||||
Total | $ | 416 | $ | 236,606 | $ | 191,576 | $ | 16 | $ | 12 | $ | 45,474 | $ | 126 | $ | — | ||||||||||||||||||||
|
|
|
|
|
|
|
|
|
|
|
|
|
|
|
| |||||||||||||||||||||
| 114 | J.P. MORGAN INTERNATIONAL EQUITY FUNDS | APRIL 30, 2020 | ||||
Table of Contents
| International Advantage Fund |
| |||||||||||||||||||||||||||||||||||
| For the six months ended April 30, 2020 | ||||||||||||||||||||||||||||||||||||
| Security Description | Value at October 31, 2019 | Purchases at Cost | Proceeds from Sales | Net Realized Gain (Loss) | Change in Unrealized Appreciation/ (Depreciation) | Value at April 30, 2020 | Shares at April 30, 2020 | Dividend Income | Capital Gain Distributions | |||||||||||||||||||||||||||
JPMorgan Prime Money Market Fund Class Institutional Shares, 0.63% (a)(b) | $ | 42,366 | $ | 464,489 | $ | 478,051 | $ | (48 | ) | $ | 16 | $ | 28,772 | 28,750 | $ | 311 | $ | — | ||||||||||||||||||
JPMorgan Securities Lending Money Market Fund Agency SL Class Shares, 0.77% (a)(b) | 1,005 | 110,000 | 77,999 | (9 | )* | 8 | 33,005 | 32,997 | 61 | * | — | |||||||||||||||||||||||||
JPMorgan U.S. Government Money Market Fund Class IM Shares, 0.23% (a)(b) | 966 | 138,064 | 95,656 | — | — | 43,374 | 43,374 | 33 | * | — | ||||||||||||||||||||||||||
|
|
|
|
|
|
|
|
|
|
|
|
|
|
|
| |||||||||||||||||||||
Total | $ | 44,337 | $ | 712,553 | $ | 651,706 | $ | (57 | ) | $ | 24 | $ | 105,151 | $ | 405 | $ | — | |||||||||||||||||||
|
|
|
|
|
|
|
|
|
|
|
|
|
|
|
| |||||||||||||||||||||
| International Equity Fund |
| |||||||||||||||||||||||||||||||||||
| For the six months ended April 30, 2020 | ||||||||||||||||||||||||||||||||||||
| Security Description | Value at October 31, 2019 | Purchases at Cost | Proceeds from Sales | Net Realized Gain (Loss) | Change in Unrealized Appreciation/ (Depreciation) | Value at April 30, 2020 | Shares at April 30, 2020 | Dividend Income | Capital Gain Distributions | |||||||||||||||||||||||||||
JPMorgan Prime Money Market Fund Class Institutional Shares, 0.63% (a)(b) | $ | 49,197 | $ | 392,707 | $ | 413,188 | $ | (29 | ) | $ | 5 | $ | 28,692 | 28,670 | $ | 370 | $ | — | ||||||||||||||||||
JPMorgan Securities Lending Money Market Fund Agency SL Class Shares, 0.77% (a)(b) | 40,003 | 200,000 | 171,001 | 8 | * | 15 | 69,025 | 69,011 | 176 | * | — | |||||||||||||||||||||||||
JPMorgan U.S. Government Money Market Fund Class IM Shares, 0.23% (a)(b) | 12,516 | 161,986 | 131,972 | — | — | 42,530 | 42,530 | 43 | * | — | ||||||||||||||||||||||||||
|
|
|
|
|
|
|
|
|
|
|
|
|
|
|
| |||||||||||||||||||||
Total | $ | 101,716 | $ | 754,693 | $ | 716,161 | $ | (21 | ) | $ | 20 | $ | 140,247 | $ | 589 | $ | — | |||||||||||||||||||
|
|
|
|
|
|
|
|
|
|
|
|
|
|
|
| |||||||||||||||||||||
| International Focus Fund |
| |||||||||||||||||||||||||||||||||||
| For the six months ended April 30, 2020 | ||||||||||||||||||||||||||||||||||||
| Security Description | Value at October 31, 2019 | Purchases at Cost | Proceeds from Sales | Net Realized Gain (Loss) | Change in Unrealized Appreciation/ (Depreciation) | Value at April 30, 2020 | Shares at April 30, 2020 | Dividend Income | Capital Gain Distributions | |||||||||||||||||||||||||||
JPMorgan Prime Money Market Fund Class Institutional Shares, 0.63% (a)(b) | $ | 48,921 | $ | 415,838 | $ | 432,073 | $ | 18 | $ | 20 | $ | 32,724 | 32,698 | $ | 343 | $ | — | |||||||||||||||||||
JPMorgan Securities Lending Money Market Fund Agency SL Class Shares, 0.77% (a)(b) | 55,000 | 320,000 | 251,000 | (11 | )* | 27 | 124,016 | 123,991 | 223 | * | — | |||||||||||||||||||||||||
JPMorgan U.S. Government Money Market Fund Class IM Shares, 0.23% (a)(b) | 20,853 | 261,394 | 257,213 | — | — | 25,034 | 25,034 | 63 | * | — | ||||||||||||||||||||||||||
|
|
|
|
|
|
|
|
|
|
|
|
|
|
|
| |||||||||||||||||||||
Total | $ | 124,774 | $ | 997,232 | $ | 940,286 | $ | 7 | $ | 47 | $ | 181,774 | $ | 629 | $ | — | ||||||||||||||||||||
|
|
|
|
|
|
|
|
|
|
|
|
|
|
|
| |||||||||||||||||||||
| APRIL 30, 2020 | J.P. MORGAN INTERNATIONAL EQUITY FUNDS | 115 | ||||||
Table of Contents
NOTES TO FINANCIAL STATEMENTS
AS OF APRIL 30, 2020 (Unaudited) (continued)
| International Hedged Equity Fund |
| |||||||||||||||||||||||||||||||||||
| For the six months ended April 30, 2020 | ||||||||||||||||||||||||||||||||||||
| Security Description | Value at October 31, 2019 | Purchases at Cost | Proceeds from Sales | Net Realized Gain (Loss) | Change in Unrealized Appreciation/ (Depreciation) | Value at April 30, 2020 | Shares at April 30, 2020 | Dividend Income | Capital Gain Distributions | |||||||||||||||||||||||||||
JPMorgan U.S. Government Money Market Fund Class Institutional Shares, 0.17% (a)(b) | $ | 850 | $ | 79,421 | $ | 79,417 | $ | — | $ | — | $ | 854 | 854 | $ | 20 | $ | — | |||||||||||||||||||
|
|
|
|
|
|
|
|
|
|
|
|
|
|
|
| |||||||||||||||||||||
| International Research Enhanced Equity Fund |
| |||||||||||||||||||||||||||||||||||
| For the six months ended April 30, 2020 | ||||||||||||||||||||||||||||||||||||
| Security Description | Value at October 31, 2019 | Purchases at Cost | Proceeds from Sales | Net Realized Gain (Loss) | Change in Unrealized Appreciation/ (Depreciation) | Value at April 30, 2020 | Shares at April 30, 2020 | Dividend Income | Capital Gain Distributions | |||||||||||||||||||||||||||
JPMorgan Prime Money Market Fund Class Institutional Shares, 0.63% (a)(b) | $ | 154,151 | $ | 718,672 | $ | 734,533 | $ | (55 | ) | $ | 97 | $ | 138,332 | 138,222 | $ | 1,357 | $ | — | ||||||||||||||||||
JPMorgan Securities Lending Money Market Fund Agency SL Class Shares, 0.77% (a)(b) | 76,005 | 296,000 | 240,000 | 1 | * | 25 | 132,031 | 132,004 | 187 | * | — | |||||||||||||||||||||||||
JPMorgan U.S. Government Money Market Fund Class IM Shares, 0.23% (a)(b) | 30,261 | 342,584 | 199,532 | — | — | 173,313 | 173,313 | 72 | * | — | ||||||||||||||||||||||||||
|
|
|
|
|
|
|
|
|
|
|
|
|
|
|
| |||||||||||||||||||||
Total | $ | 260,417 | $ | 1,357,256 | $ | 1,174,065 | $ | (54 | ) | $ | 122 | $ | 443,676 | $ | 1,616 | $ | — | |||||||||||||||||||
|
|
|
|
|
|
|
|
|
|
|
|
|
|
|
| |||||||||||||||||||||
| International Value Fund |
| |||||||||||||||||||||||||||||||||||
| For the six months ended April 30, 2020 | ||||||||||||||||||||||||||||||||||||
| Security Description | Value at October 31, 2019 | Purchases at Cost | Proceeds from Sales | Net Realized Gain (Loss) | Change in Unrealized Appreciation/ (Depreciation) | Value at April 30, 2020 | Shares at April 30, 2020 | Dividend Income | Capital Gain Distributions | |||||||||||||||||||||||||||
JPMorgan Prime Money Market Fund Class Institutional Shares, 0.63% (a)(b) | $ | 3,487 | $ | 46,394 | $ | 44,910 | $ | 2 | $ | 3 | $ | 4,976 | 4,972 | $ | 63 | $ | — | |||||||||||||||||||
JPMorgan Securities Lending Money Market Fund Agency SL Class Shares, 0.77% (a)(b) | 2,000 | 11,000 | 13,000 | — | (c)* | — | — | (c) | — | (c) | 13 | * | — | |||||||||||||||||||||||
JPMorgan U.S. Government Money Market Fund Class IM Shares, 0.23% (a)(b) | 2,026 | 26,388 | 25,285 | — | — | 3,129 | 3,129 | 13 | * | — | ||||||||||||||||||||||||||
|
|
|
|
|
|
|
|
|
|
|
|
|
|
|
| |||||||||||||||||||||
Total | $ | 7,513 | $ | 83,782 | $ | 83,195 | $ | 2 | $ | 3 | $ | 8,105 | $ | 89 | $ | — | ||||||||||||||||||||
|
|
|
|
|
|
|
|
|
|
|
|
|
|
|
| |||||||||||||||||||||
| (a) | Investment in an affiliated fund, which is registered under the Investment Company Act of 1940, as amended, and is advised by J.P. Morgan Investment Management Inc. |
| (b) | The rate shown is the current yield as of April 30, 2020. |
| (c) | Amount rounds to less than one thousand. |
| * | Amount is included on the Statements of Operations as Income from securities lending (net) (after payments of rebates and Citibank’s fee). |
E. Foreign Currency Translation — The books and records of the Funds are maintained in U.S. dollars. Foreign currency amounts are translated into U.S. dollars at the prevailing exchange rates of such currencies against the U.S. dollar. The market value of investment securities and other assets and liabilities are translated at the exchange rate as of the valuation date. Purchases and sales of investment securities, income and expenses are translated at the exchange rate prevailing on the respective dates of such transactions.
The Funds do not isolate the effect of changes in foreign exchange rates from changes in market prices on securities held. Accordingly, such changes are included within Change in net unrealized appreciation/depreciation on investments on the Statements of Operations.
| 116 | J.P. MORGAN INTERNATIONAL EQUITY FUNDS | APRIL 30, 2020 | ||||
Table of Contents
Reported realized foreign currency gains and losses arise from the disposition of foreign currency, currency gains or losses realized between the trade and settlement dates on securities transactions, and the difference between the amounts of dividends, interest and foreign withholding taxes recorded on each Fund’s books on the transaction date and the U.S. dollar equivalent of the amounts actually received or paid. These reported realized foreign currency gains and losses are included in Net realized gain (loss) on foreign currency transactions on the Statements of Operations. Unrealized foreign currency gains and losses arise from changes (due to changes in exchange rates) in the value of foreign currency and other assets and liabilities denominated in foreign currencies, which are held at period end and are included in Change in net unrealized appreciation/depreciation on foreign currency translations on the Statements of Operations.
F. Options — International Hedged Equity Fund purchased and sold (“wrote”) put and call options on indices to manage and hedge equity risk within its portfolio. A purchaser of a put option has the right, but not the obligation, to sell the underlying instrument at an agreed upon price (“strike price”) to the option seller. A purchaser of a call option has the right, but not the obligation, to purchase the underlying instrument at the strike price from the option seller.
Options Purchased —Premiums paid by the Fund for options purchased are included on the Statements of Assets and Liabilities as Options purchased. The option is adjusted daily to reflect the current market value of the option and the change is recorded as Change in net unrealized appreciation/depreciation on options purchased on the Statements of Operations. If the option is allowed to expire, the Fund will lose the entire premium it paid and record a loss for the premium amount. Premiums paid for options purchased which are exercised or closed are added to the amounts paid or will offset against the proceeds on the underlying investment transaction to determine the realized gain (loss) or cost basis of the underlying investment.
Options Written —Premiums received by the Fund for options written are included on the Statements of Assets and Liabilities as a liability. The amount of the liability is adjusted daily to reflect the current market value of the option written and the change in market value is recorded as Change in net unrealized appreciation/depreciation on options written on the Statements of Operations. Premiums received from options written that expire are treated as realized gains. If a written option is closed, the Fund records a realized gain or loss on options written based on whether the cost of the closing transaction exceeds the premium received. If a call option is exercised by the option buyer, the premium received by the Fund is added to the proceeds from the sale of the underlying security to the option buyer and compared to the cost of the closing transaction to determine whether there has been a realized gain or loss. If a put option is exercised by an option buyer, the premium received by the option seller reduces the cost basis of the purchased security.
Written uncovered call options subject the Fund to unlimited risk of loss. Written covered call options limit the upside potential of a security above the strike price. Written put options subject the Fund to risk of loss if the value of the security declines below the exercise price minus the put premium.
The Fund is not subject to credit risk on options written as the counterparty has already performed its obligation by paying the premium at the inception of the contract.
The Fund’s exchange-traded option contracts are not subject to master netting arrangements (the right to close out all transactions traded with a counterparty and net amounts owed or due across transactions). The Fund’sover-the-counter (“OTC”) options are subject to master netting agreements.
The Fund may be required to post or receive collateral for OTC options. Cash collateral posted by the Fund is considered restricted.
The table below discloses the volume of the Fund’s options contracts activity during the six months ended April 30, 2020 (amounts in thousands, except number of contracts):
| International Hedged Equity Fund | ||||
Exchange-Traded Options: | ||||
Average Number of Contracts Purchased | 473 | |||
Average Number of Contracts Written | 946 | |||
Ending Number of Contracts Purchased | 631 | |||
Ending Number of Contracts Written | 1262 | |||
G. Futures Contracts — The Funds used index futures contracts to gain or reduce exposure to the stock market, or maintain liquidity or minimize transaction costs. The Funds also purchased futures contracts to invest incoming cash in the market or sold futures in response to cash outflows, thereby simulating an invested position in the underlying index while maintaining a cash balance for liquidity.
Futures contracts provide for the delayed delivery of the underlying instrument at a fixed price or are settled for a cash amount based on the change in the value of the underlying instrument at a specific date in the future. Upon entering into a futures contract, the Funds are required to deposit with the broker, cash or securities in an amount equal to a certain percentage of the contract amount, which is referred to as the initial margin deposit. Subsequent payments, referred to as variation margin, are made or received by the Funds periodically and are based on changes in the market value of open futures contracts. Changes in the market value of open futures contracts are recorded as Change in net unrealized appreciation/depreciation on the Statements of Operations. Realized gains or losses, representing the difference between the value of the contract
| APRIL 30, 2020 | J.P. MORGAN INTERNATIONAL EQUITY FUNDS | 117 | ||||||
Table of Contents
NOTES TO FINANCIAL STATEMENTS
AS OF APRIL 30, 2020 (Unaudited) (continued)
at the time it was opened and the value at the time it was closed, are reported on the Statements of Operations at the closing or expiration of the futures contract. Securities deposited as initial margin are designated in the SOIs, while cash deposited, which is considered restricted, is recorded on the Statements of Assets and Liabilities. A receivable from and/or a payable to brokers for the daily variation margin is also recorded on the Statements of Assets and Liabilities.
The use of futures contracts exposes the Funds to equity price risk. The Funds may be subject to the risk that the change in the value of the futures contract may not correlate perfectly with the underlying instrument. Use of long futures contracts subjects the Funds to risk of loss in excess of the amounts shown on the Statements of Assets and Liabilities, up to the notional amount of the futures contracts. Use of short futures contracts subjects the Funds to unlimited risk of loss. The Funds may enter into futures contracts only on exchanges or boards of trade. The exchange or board of trade acts as the counterparty to each futures transaction; therefore, the Funds’ credit risk is limited to failure of the exchange or board of trade. Under some circumstances, futures exchanges may establish daily limits on the amount that the price of a futures contract can vary from the previous day’s settlement price, which could effectively prevent liquidation of positions.
The table below discloses the volume of the Funds’ futures contracts activity during the six months ended April 30, 2020 (amounts in thousands):
| Emerging Markets Research Enhanced Equity Fund | Europe Dynamic Fund | International Advantage Fund | International Hedged Equity Fund | International Research Enhanced Equity Fund | International Value Fund | |||||||||||||||||||
Futures Contracts — Equity: | ||||||||||||||||||||||||
Average Notional Balance Long | $ | 46,103 | (a) | $ | 10,036 | $ | 32,282 | $ | 2,954 | $ | 151,128 | $ | 9,549 | |||||||||||
Average Notional Balance Short | — | 7,291 | (b) | — | — | — | — | |||||||||||||||||
Ending Notional Balance Long | 31,574 | 1,528 | 23,804 | 3,544 | 139,823 | 5,137 | ||||||||||||||||||
| (a) | For the period December 1, 2019 through April 30, 2020. |
| (b) | For the period November 1, 2019 through November 30, 2019. |
The Funds’ futures contracts are not subject to master netting arrangements (the right to close out all transactions traded with a counterparty and net amounts owed or due across transactions).
H. Offering and Organization Costs — Total offering costs of approximately $48,000 and $103,000 paid in connection with the offering of shares of Emerging Markets Research Enhanced Equity Fund and International Hedged Equity Fund, respectively, are amortized on a straight line basis over 12 months from the date the Funds commenced operations. Costs paid in connection with the organization of Emerging Markets Research Enhanced Equity Fund and International Hedged Equity Fund, if any, were recorded as an expense at the time it commenced operations. For the six months ended April 30, 2020, total offering costs amortized were approximately $5,000 and $39,000 for the Emerging Markets Research Enhanced Equity Fund and International Hedged Equity Fund, respectively.
I. Security Transactions and Investment Income — Investment transactions are accounted for on the trade date (the date the order to buy or sell is executed). Securities gains and losses are calculated on a specifically identified cost basis. Interest income is determined on the basis of coupon interest accrued using the effective interest method, which adjusts for amortization of premiums and accretion of discounts. Dividend income net of foreign taxes withheld, if any, is recorded on theex-dividend date or when a Fund first learns of the dividend. Certain Funds may receive other income from investments in loan assignments and/or unfunded commitments, including amendment fees, consent fees and commitment fees. These fees are recorded as income when received by the Funds. These amounts are included in Interest income fromnon-affiliates on the Statements of Operations.
J. Allocation of Income and Expenses — Expenses directly attributable to a Fund are charged directly to that Fund, while the expenses attributable to more than one fund of the Trusts are allocated among the applicable funds. Investment income, realized and unrealized gains and losses and expenses, other than class-specific expenses, are allocated daily to each class of shares based upon the proportion of net assets of each class at the beginning of each day.
| 118 | J.P. MORGAN INTERNATIONAL EQUITY FUNDS | APRIL 30, 2020 | ||||
Table of Contents
Transfer agency fees are class-specific expenses. The amount of the transfer agency fees charged to each class of the Funds for the six months ended April 30, 2020 are as follows (amounts in thousands):
| Class A | Class C | Class I | Class L | Class R2 | Class R3 | Class R4 | Class R5 | Class R6 | Total | |||||||||||||||||||||||||||||||
Emerging Markets Equity Fund | ||||||||||||||||||||||||||||||||||||||||
Transfer agency fees | $ | 28 | $ | 4 | $ | 29 | $ | 8 | $ | 1 | $ | — | (a) | $ | — | (a) | $ | 3 | $ | 93 | $ | 166 | ||||||||||||||||||
Emerging Markets Research Enhanced Equity Fund | ||||||||||||||||||||||||||||||||||||||||
Transfer agency fees | n/a | n/a | — | (a) | n/a | n/a | n/a | n/a | n/a | 3 | 3 | |||||||||||||||||||||||||||||
Europe Dynamic Fund | ||||||||||||||||||||||||||||||||||||||||
Transfer agency fees | 9 | 2 | 3 | — | (a) | n/a | n/a | n/a | n/a | 1 | 15 | |||||||||||||||||||||||||||||
International Advantage Fund | ||||||||||||||||||||||||||||||||||||||||
Transfer agency fees | 9 | 1 | 1 | n/a | 27 | n/a | n/a | n/a | 7 | 45 | ||||||||||||||||||||||||||||||
International Equity Fund | ||||||||||||||||||||||||||||||||||||||||
Transfer agency fees | 22 | 2 | 3 | n/a | — | (a) | n/a | n/a | — | (a) | 11 | 38 | ||||||||||||||||||||||||||||
International Focus Fund | ||||||||||||||||||||||||||||||||||||||||
Transfer agency fees | 5 | 2 | 5 | n/a | 1 | n/a | n/a | 1 | 8 | 22 | ||||||||||||||||||||||||||||||
International Hedged Equity Fund | ||||||||||||||||||||||||||||||||||||||||
Transfer agency fees | — | (a) | — | (a) | 1 | n/a | n/a | n/a | n/a | — | (a) | — | (a) | 1 | ||||||||||||||||||||||||||
International Research Enhanced Equity Fund | ||||||||||||||||||||||||||||||||||||||||
Transfer agency fees | 27 | n/a | 2 | n/a | n/a | n/a | n/a | n/a | 18 | 47 | ||||||||||||||||||||||||||||||
International Value Fund | ||||||||||||||||||||||||||||||||||||||||
Transfer agency fees | 6 | 1 | 2 | — | (a) | 1 | n/a | n/a | — | (a) | — | (a) | 10 | |||||||||||||||||||||||||||
| (a) | Amount rounds to less than one thousand. |
K. Federal Income Taxes — Each Fund is treated as a separate taxable entity for Federal income tax purposes. Each Fund’s policy is to comply with the provisions of the Internal Revenue Code (the “Code”) applicable to regulated investment companies and to distribute to shareholders all of its distributable net investment income and net realized capital gains on investments. Accordingly, no provision for Federal income tax is necessary. Management has reviewed the Funds’ tax positions for all open tax years and has determined that as of April 30, 2020, no liability for Federal income tax is required in the Funds’ financial statements for net unrecognized tax benefits. However, management’s conclusions may be subject to future review based on changes in, or the interpretation of, the accounting standards or tax laws and regulations. Each Funds’ Federal tax returns for the prior three fiscal years, or since inception if shorter, remains subject to examination by the Internal Revenue Service.
L. Foreign Taxes — The Funds may be subject to foreign taxes on income, gains on investments or currency purchases/repatriation, a portion of which may be recoverable. The Funds will accrue such taxes and recoveries as applicable, based upon their current interpretation of tax rules and regulations that exist in the markets in which they invest. When a capital gain tax is determined to apply, the Funds record an estimated deferred tax liability in an amount that would be payable if the securities were disposed of on the valuation date.
M. Distributions to Shareholders — Distributions from net investment income, if any, are generally declared and paid annually. Distributions are declared separately for each class. No class has preferential dividend rights; differences in per share rates are due to differences in separate class expenses. Net realized capital gains, if any, are distributed by each Fund at least annually. The amount of distributions from net investment income and net realized capital gains is determined in accordance with Federal income tax regulations, which may differ from GAAP. To the extent these “book/tax” differences are permanent in nature (i.e., that they result from other than timing of recognition — “temporary differences”), such amounts are reclassified within the capital accounts based on their Federal tax basis treatment.
3. Fees and Other Transactions with Affiliates
A. Investment Advisory Fee — Pursuant to Investment Advisory Agreements, the Adviser manages the investments of each Fund and for such services is paid a fee. The investment advisory fee is accrued daily and paid monthly based on each Fund’s respective average daily net assets.
The annual rate for each Fund is as follows:
Emerging Markets Equity Fund | 0.68 | % | ||
Emerging Markets Research Enhanced Equity Fund | 0.25 | |||
Europe Dynamic Fund | 0.60 | |||
International Advantage Fund | 0.50 | |||
International Equity Fund | 0.50 | |||
International Focus Fund | 0.60 | |||
International Hedged Equity Fund | 0.25 | |||
International Research Enhanced Equity Fund | 0.20 | |||
International Value Fund | 0.55 |
The Adviser waived investment advisory fees and/or reimbursed expenses as outlined in Note 3.F.
| APRIL 30, 2020 | J.P. MORGAN INTERNATIONAL EQUITY FUNDS | 119 | ||||||
Table of Contents
NOTES TO FINANCIAL STATEMENTS
AS OF APRIL 30, 2020 (Unaudited) (continued)
B. Administration Fee — Pursuant to Administration Agreements, the Administrator provides certain administration services to each Fund. In consideration of these services, the Administrator receives a fee accrued daily and paid monthly at an annual rate of 0.075% of the first $10 billion of each Fund’s respective average daily net assets, plus 0.050% of each Fund’s respective average daily net assets between $10 billion and $20 billion, plus 0.025% of each Fund’s respective average daily net assets between $20 billion and $25 billion, plus 0.01% of each Fund’s respective average daily net assets in excess of $25 billion. For the six months ended April 30, 2020, the effective annualized rate was 0.08% of each Fund’s average daily net assets, notwithstanding any fee waivers and/or expense reimbursements, with the exception of Class R5 Shares and Class R6 Shares of International Hedged Equity Fund which had an effective annualized rate of 0.07%.
The Administrator waived administration fees as outlined in Note 3.F.
JPMorgan Chase Bank, N.A. (“JPMCB”), a wholly-owned subsidiary of JPMorgan, serves as the Funds’sub-administrator (the“Sub-administrator”). For its services asSub-administrator, JPMCB receives a portion of the fees payable to the Administrator.
C. Distribution Fees — Pursuant to a Distribution Agreement, JPMorgan Distribution Services, Inc. (“JPMDS”), an indirect, wholly-owned subsidiary of JPMorgan, serves as each Fund’s principal underwriter and promotes and arranges for the sale of each Fund’s shares.
The Boards have adopted a Distribution Plan (the “Distribution Plan”) for Class A, Class C, Class R2 and Class R3 Shares of the Funds, as applicable, pursuant to Rule12b-1 under the 1940 Act. Class I, Class L, Class R4, Class R5 and Class R6 Shares of the Funds do not charge a distribution fee. The Distribution Plan provides that each Fund shall pay, with respect to the applicable share classes, distribution fees, including payments to JPMDS, at annual rates of the average daily net assets as shown in the table below:
| Class A | Class C | Class R2 | Class R3 | |||||||||||||
Emerging Markets Equity Fund | 0.25 | % | 0.75 | % | 0.50 | % | 0.25 | % | ||||||||
Europe Dynamic Fund | 0.25 | 0.75 | n/a | n/a | ||||||||||||
International Advantage Fund | 0.25 | 0.75 | 0.50 | n/a | ||||||||||||
International Equity Fund | 0.25 | 0.75 | 0.50 | n/a | ||||||||||||
International Focus Fund | 0.25 | 0.75 | 0.50 | n/a | ||||||||||||
International Hedged Equity Fund | 0.25 | 0.75 | n/a | n/a | ||||||||||||
International Research Enhanced Equity Fund | 0.25 | n/a | n/a | n/a | ||||||||||||
International Value Fund | 0.25 | 0.75 | 0.50 | n/a | ||||||||||||
In addition, JPMDS is entitled to receive thefront-end sales charges from purchases of Class A Shares and the CDSC from redemptions of Class C Shares and certain Class A Shares for whichfront-end sales charges have been waived. For the six months ended April 30, 2020, JPMDS retained the following (amounts in thousands):
| Front-End Sales Charge | CDSC | |||||||
Emerging Markets Equity Fund | $ | 65 | $ | — | (a) | |||
Europe Dynamic Fund | 2 | — | ||||||
International Advantage Fund | 1 | — | ||||||
International Equity Fund | 55 | 1 | ||||||
International Focus Fund | 19 | — | (a) | |||||
International Hedged Equity Fund | 1 | — | ||||||
International Research Enhanced Equity Fund | — | (a) | — | |||||
International Value Fund | 18 | — | ||||||
| (a) | Amount rounds to less than one thousand. |
D. Service Fees — The Trusts, on behalf of the Funds, have entered into a Shareholder Servicing Agreement with JPMDS under which JPMDS provides certain support services to fund shareholders. For performing these services, JPMDS receives a fee with respect to all share classes, except Class R6 Shares which do not charge a service fee, that is accrued daily and paid monthly equal to a percentage of the average daily net assets as shown in the table below:
| Class A | Class C | Class I | Class L | Class R2 | Class R3 | Class R4 | Class R5 | |||||||||||||||||||||||||
Emerging Markets Equity Fund | 0.25 | % | 0.25 | % | 0.25 | % | 0.10 | % | 0.25 | % | 0.25 | % | 0.25 | % | 0.10 | % | ||||||||||||||||
Emerging Markets Research Enhanced Equity Fund | n/a | n/a | 0.25 | n/a | n/a | n/a | n/a | n/a | ||||||||||||||||||||||||
Europe Dynamic Fund | 0.25 | 0.25 | 0.25 | 0.10 | n/a | n/a | n/a | n/a | ||||||||||||||||||||||||
International Advantage Fund | 0.25 | 0.25 | 0.25 | n/a | 0.25 | n/a | n/a | n/a | ||||||||||||||||||||||||
International Equity Fund | 0.25 | 0.25 | 0.25 | n/a | 0.25 | n/a | n/a | 0.10 | ||||||||||||||||||||||||
International Focus Fund | 0.25 | 0.25 | 0.25 | n/a | 0.25 | n/a | n/a | 0.10 | ||||||||||||||||||||||||
International Hedged Equity Fund | 0.25 | 0.25 | 0.25 | n/a | n/a | n/a | n/a | 0.10 | ||||||||||||||||||||||||
International Research Enhanced Equity Fund | 0.25 | n/a | 0.25 | n/a | n/a | n/a | n/a | n/a | ||||||||||||||||||||||||
International Value Fund | 0.25 | 0.25 | 0.25 | 0.10 | 0.25 | n/a | n/a | 0.10 | ||||||||||||||||||||||||
| 120 | J.P. MORGAN INTERNATIONAL EQUITY FUNDS | APRIL 30, 2020 | ||||
Table of Contents
JPMDS has entered into shareholder services contracts with affiliated and unaffiliated financial intermediaries who provide shareholder services and other related services to their clients or customers who invest in the Funds. Pursuant to such contracts, JPMDS will pay all or a portion of such fees earned to financial intermediaries for performing such services.
JPMDS waived service fees as outlined in Note 3.F.
E. Custodian and Accounting Fees — JPMCB provides portfolio custody and accounting services to the Funds. For performing these services, the Funds pay JPMCB transaction and asset-based fees that vary according to the number of transactions and positions, plusout-of-pocket expenses. The amounts paid directly to JPMCB by the Funds for custody and accounting services are included in Custodian and accounting fees on the Statements of Operations.
Interest income earned on cash balances at the custodian, if any, is included as Interest income from affiliates on the Statements of Operations.
Interest expense paid to the custodian related to cash overdrafts, if any, is included in Interest expense to affiliates on the Statements of Operations.
F. Waivers and Reimbursements — The Adviser, Administrator and/or JPMDS have contractually agreed to waive fees and/or reimburse the Funds to the extent that total annual operating expenses (excluding acquired fund fees and expenses other than certain money market fund fees as described below, dividend and interest expenses related to short sales, interest, taxes, expenses related to litigation and potential litigation, expenses related to trustee elections and extraordinary expenses) exceed the percentages of the Funds’ respective average daily net assets as shown in the table below:
| Class A | Class C | Class I | Class L | Class R2 | Class R3 | Class R4 | Class R5 | Class R6 | ||||||||||||||||||||||||||||
Emerging Markets Equity Fund | 1.24 | % | 1.74 | % | 0.99 | % | n/a | (1) | 1.54 | % | 1.29 | % | 1.04 | % | 0.89 | % | 0.79 | % | ||||||||||||||||||
Emerging Markets Research Enhanced Equity Fund | n/a | n/a | 0.45 | n/a | n/a | n/a | n/a | n/a | 0.35 | |||||||||||||||||||||||||||
Europe Dynamic Fund | 1.24 | 1.74 | 0.99 | n/a | n/a | n/a | n/a | n/a | n/a | |||||||||||||||||||||||||||
International Advantage Fund | 0.95 | 1.45 | 0.70 | n/a | 1.25 | n/a | n/a | n/a | 0.50 | |||||||||||||||||||||||||||
International Equity Fund | 0.95 | 1.45 | 0.70 | n/a | 1.25 | n/a | n/a | 0.60 | 0.50 | |||||||||||||||||||||||||||
International Focus Fund | 1.00 | 1.50 | 0.75 | n/a | 1.30 | n/a | n/a | 0.65 | 0.55 | |||||||||||||||||||||||||||
International Hedged Equity Fund | 0.85 | 1.35 | 0.60 | n/a | n/a | n/a | n/a | 0.45 | 0.35 | |||||||||||||||||||||||||||
International Research Enhanced Equity Fund | 0.60 | n/a | 0.35 | n/a | n/a | n/a | n/a | n/a | 0.25 | |||||||||||||||||||||||||||
International Value Fund | 1.00 | 1.50 | 0.75 | n/a | 1.30 | n/a | n/a | 0.65 | 0.55 | |||||||||||||||||||||||||||
| (1) | Effective March 1, 2020, the contractual expense limitation for Class L Shares expired. Prior to March 1, 2020, the contractual expense limitation was 0.95% for Class L Shares. |
Except as noted above, the expense limitation agreements were in effect for the six months ended April 30, 2020 and are in place until February 28, 2021.
For the six months ended April 30, 2020, the Funds’ service providers waived fees and/or reimbursed expenses for each of the Funds as follows (amounts in thousands). None of these parties expect the Funds to repay any such waived fees and/or reimbursed expenses in future years.
| Contractual Waivers | ||||||||||||||||||||
| Investment Advisory Fees | Administration Fees | Service Fees | Total | Contractual Reimbursements | ||||||||||||||||
Emerging Markets Equity Fund | $ | 858 | $ | 570 | $ | 755 | $ | 2,183 | $ | 93 | ||||||||||
Emerging Markets Research Enhanced Equity Fund | 115 | 77 | — | (a) | 192 | 5 | ||||||||||||||
Europe Dynamic Fund | — | — | 21 | 21 | — | |||||||||||||||
International Advantage Fund | 651 | 435 | 86 | 1,172 | — | (a) | ||||||||||||||
International Equity Fund | 938 | 624 | 156 | 1,718 | 1 | |||||||||||||||
International Focus Fund | 1,177 | 785 | 98 | 2,060 | 7 | |||||||||||||||
International Hedged Equity Fund | 95 | 32 | 1 | 128 | 56 | |||||||||||||||
International Research Enhanced Equity Fund | 758 | 505 | 343 | 1,606 | — | |||||||||||||||
International Value Fund | 201 | 121 | 63 | 385 | — | (a) | ||||||||||||||
| (a) | Amount rounds to less than one thousand. |
Additionally, the Funds may invest in one or more money market funds advised by the Adviser (affiliated money market funds). The Adviser, Administrator and/or JPMDS, as shareholder servicing agent, have contractually agreed to waive fees and/or reimburse expenses in an amount sufficient to offset the respective net fees each collects from the affiliated money market fund on the applicable Fund’s investment in such affiliated money market fund, except for investments of securities lending cash collateral.
| APRIL 30, 2020 | J.P. MORGAN INTERNATIONAL EQUITY FUNDS | 121 | ||||||
Table of Contents
NOTES TO FINANCIAL STATEMENTS
AS OF APRIL 30, 2020 (Unaudited) (continued)
The amounts of these waivers resulting from investments in these money market funds for the six months ended April 30, 2020 were as follows (amounts in thousands):
Emerging Markets Equity Fund | $ | 155 | ||
Emerging Markets Research Enhanced Equity Fund | 69 | |||
Europe Dynamic Fund | 13 | |||
International Advantage Fund | 42 | |||
International Equity Fund | 51 | |||
International Focus Fund | 53 | |||
International Hedged Equity Fund | 3 | |||
International Research Enhanced Equity Fund | 182 | |||
International Value Fund | 8 |
G. Other — Certain officers of the Trusts are affiliated with the Adviser, the Administrator and JPMDS. Such officers, with the exception of the Chief Compliance Officer, receive no compensation from the Funds for serving in their respective roles.
The Boards designated and appointed a Chief Compliance Officer to the Funds pursuant to Rule38a-1 under the 1940 Act. Each Fund, along with affiliated funds, makes reimbursement payments, on apro-rata basis, to the Administrator for a portion of the fees associated with the office of the Chief Compliance Officer. Such fees are included in Trustees’ and Chief Compliance Officer’s fees on the Statements of Operations.
The Trusts adopted a Trustee Deferred Compensation Plan (the “Plan”) which allows the independent Trustees to defer the receipt of all or a portion of compensation related to performance of their duties as Trustees. The deferred fees are invested in various J.P. Morgan Funds until distribution in accordance with the Plan.
During the six months ended April 30, 2020, Emerging Markets Equity Fund purchased securities from an underwriting syndicate in which the principal underwriter or members of the syndicate were affiliated with the Adviser.
The Securities and Exchange Commission (“SEC”) has granted an exemptive order permitting the Funds to engage in principal transactions with J.P. Morgan Securities, Inc., an affiliated broker, involving taxable money market instruments, subject to certain conditions.
4. Investment Transactions
During the six months ended April 30, 2020, purchases and sales of investments (excluding short-term investments) were as follows (amounts in thousands):
Purchases (excluding U.S. Government) | Sales (excluding U.S. Government) | |||||||
Emerging Markets Equity Fund | $ | 2,813,915 | $ | 460,593 | ||||
Emerging Markets Research Enhanced Equity Fund | 1,126,545 | 521,333 | ||||||
Europe Dynamic Fund | 349,625 | 384,501 | ||||||
International Advantage Fund | 789,329 | 735,124 | ||||||
International Equity Fund | 492,514 | 387,276 | ||||||
International Focus Fund | 691,918 | 482,225 | ||||||
International Hedged Equity Fund | 85,280 | 31,484 | ||||||
International Research Enhanced Equity Fund | 1,267,069 | 1,021,570 | ||||||
International Value Fund | 97,764 | 130,638 | ||||||
During the six months ended April 30, 2020, there were no purchases or sales of U.S. Government securities.
| 122 | J.P. MORGAN INTERNATIONAL EQUITY FUNDS | APRIL 30, 2020 | ||||
Table of Contents
5. Federal Income Tax Matters
For Federal income tax purposes, the estimated cost and unrealized appreciation (depreciation) in value of investments held at April 30, 2020 were as follows (amounts in thousands):
Aggregate Cost | Gross Unrealized Appreciation | Gross Unrealized Depreciation | Net Appreciation (Depreciation) | |||||||||||||
Emerging Markets Equity Fund | $ | 6,980,755 | $ | 1,477,626 | $ | 561,590 | $ | 916,036 | ||||||||
Emerging Markets Research Enhanced Equity Fund | 2,562,890 | 123,728 | 348,606 | (224,878 | ) | |||||||||||
Europe Dynamic Fund | 472,725 | 31,262 | 45,010 | (13,748 | ) | |||||||||||
International Advantage Fund | 1,623,558 | 103,894 | 171,849 | (67,955 | ) | |||||||||||
International Equity Fund | 2,342,906 | 593,638 | 170,276 | 423,362 | ||||||||||||
International Focus Fund | 2,651,599 | 149,601 | 138,343 | 11,258 | ||||||||||||
International Hedged Equity Fund | 104,098 | 6,216 | 18,965 | (12,749 | ) | |||||||||||
International Research Enhanced Equity Fund | 4,843,280 | 371,478 | 665,020 | (293,542 | ) | |||||||||||
International Value Fund | 351,127 | 6,647 | 83,979 | (77,332 | ) | |||||||||||
At October 31, 2019, the following Funds had net capital loss carryforwards as follows (amounts in thousands):
| Capital Loss Carryforward Character | ||||||||
| Short-Term | Long-Term | |||||||
Emerging Markets Equity Fund | $ | 7,673 | $ | 116,595 | ||||
Europe Dynamic Fund | 111,146 | 2,935 | ||||||
International Advantage Fund | 222,918 | 54,545 | ||||||
International Equity Fund | 38,501 | 19,256 | ||||||
International Focus Fund | 42,042 | * | 6,985 | * | ||||
International Hedged Equity Fund | 153 | 297 | ||||||
International Research Enhanced Equity Fund | 16,878 | 145,754 | ||||||
International Value Fund | 38,435 | 7,625 | ||||||
At October 31, 2019, the following Funds utilized capital loss carryforwards as follows (amounts in thousands):
| Capital Loss Utilized | ||||||||
| Short-Term | Long-Term | |||||||
Emerging Markets Equity Fund | $ | — | $ | 10,702 | ||||
| * | Amount includes capital loss carryforwards which are limited in future years under Internal Revenue Code sections 381—384. |
6. Borrowings
The Funds rely upon an exemptive order granted by the SEC (the “Order”) permitting the establishment and operation of an Interfund Lending Facility (the “Facility”). The Facility allows the Funds to directly lend and borrow money to or from any other fund relying upon the Order at rates beneficial to both the borrowing and lending funds. Advances under the Facility are taken primarily for temporary or emergency purposes, including the meeting of redemption requests that otherwise might require the untimely disposition of securities, and are subject to each Fund’s borrowing restrictions. The Interfund loan rate is determined, as specified in the Order, by averaging the current repurchase agreement rate and the current bank loan rate. The Order was granted to JPM II and may be relied upon by the Funds because the Funds and the series of JPM II are all investment companies in the same “group of investment companies” (as defined in Section 12(d)(1)(G) of the 1940 Act).
The Funds had no borrowings outstanding from another fund at April 30, 2020. Average borrowings from the Facility during the six months ended April 30, 2020, were as follows (amounts in thousands, except number of days outstanding):
Average Borrowings | Average Rate Paid | Number of Days | Interest Paid | |||||||||||||
Emerging Markets Research Enhanced Equity Fund | $ | 20,330 | 1.67 | % | 4 | $ | 3 | |||||||||
Europe Dynamic Fund | 2,326 | 1.85 | 3 | — | (a) | |||||||||||
International Advantage Fund | 20,534 | 1.87 | 3 | 4 | ||||||||||||
International Hedged Equity Fund | 3,784 | 0.79 | 2 | — | (a) | |||||||||||
| (a) | Amount rounds to less than one thousand. |
| APRIL 30, 2020 | J.P. MORGAN INTERNATIONAL EQUITY FUNDS | 123 | ||||||
Table of Contents
NOTES TO FINANCIAL STATEMENTS
AS OF APRIL 30, 2020 (Unaudited) (continued)
The Trusts and JPMCB have entered into a financing arrangement. Under this arrangement, JPMCB provides an unsecured, uncommitted credit facility in the aggregate amount of $100 million to certain of the J.P. Morgan Funds, including the Funds. Advances under the arrangement are taken primarily for temporary or emergency purposes, including the meeting of redemption requests that otherwise might require the untimely disposition of securities, and are subject to each Fund’s borrowing restrictions. Interest on borrowings is payable at a rate determined by JPMCB at the time of borrowing. This agreement has been extended until November 2, 2020.
The Funds had no borrowings outstanding from the unsecured, uncommitted facility during the six months ended April 30, 2020.
The Trusts, along with certain other trusts for J.P. Morgan Funds (“Borrowers”), have entered into a joint syndicated senior unsecured revolving credit facility totaling $1.5 billion (“Credit Facility”) with various lenders and The Bank of New York Mellon, as administrative agent for the lenders. This Credit Facility provides a source of funds to the Borrowers for temporary and emergency purposes, including the meeting of redemption requests that otherwise might require the untimely disposition of securities. Under the terms of the Credit Facility, a borrowing fund must have a minimum of $25,000,000 in adjusted net asset value and not exceed certain adjusted net asset coverage ratios prior to and during the time in which any borrowings are outstanding. If a fund does not comply with the aforementioned requirements, the fund must remediate within three business days with respect to the $25,000,000 minimum adjusted net asset value or within one business day with respect to certain asset coverage ratios or the administrative agent at the request of, or with the consent of, the lenders may terminate the Credit Facility and declare any outstanding borrowings to be due and payable immediately.
Interest associated with any borrowing under the Credit Facility is charged to the borrowing fund at a rate of interest equal to 1.00% plus the greater of the federal funds effective rate or one month London InterBank Offered Rate (“LIBOR”). The annual commitment fee to maintain the Credit Facility is 0.15% and is incurred on the unused portion of the Credit Facility and is allocated to all participating funds pro rata based on their respective net assets. Effective August 13, 2019, this agreement has been amended and restated for a term of 364 days, unless extended.
The Funds did not utilize the Credit Facility during the six months ended April 30, 2020.
7. Risks, Concentrations and Indemnifications
In the normal course of business, the Funds enter into contracts that contain a variety of representations which provide general indemnifications. Each Fund’s maximum exposure under these arrangements is unknown. The amount of exposure would depend on future claims that may be brought against each Fund. However, based on experience, the Funds expect the risk of loss to be remote.
As of April 30, 2020, the following Funds had individual shareholder and/or omnibus accounts each owning more than 10% of the respective Fund’s outstanding shares as follows:
Number of or Affiliated | % of the Fund | Number of or Non-Affiliated | % of the Fund | |||||||||||||
Emerging Markets Equity Fund | — | — | % | 2 | 26.1 | % | ||||||||||
Emerging Markets Research Enhanced Equity Fund | 4 | 58.5 | — | — | ||||||||||||
Europe Dynamic Fund | 4 | 60.2 | 1 | 12.0 | ||||||||||||
International Advantage Fund | 5 | 72.9 | — | — | ||||||||||||
International Equity Fund | 2 | 41.0 | 1 | 12.4 | ||||||||||||
International Focus Fund | 4 | 68.5 | — | — | ||||||||||||
International Hedged Equity Fund | 1 | 49.8 | 1 | 19.1 | ||||||||||||
International Research Enhanced Equity Fund | 3 | 31.0 | — | — | ||||||||||||
International Value Fund | — | — | 1 | 72.8 | ||||||||||||
Significant shareholder transactions by these shareholders may impact the Funds’ performance.
As of April 30, 2020, the J.P. Morgan Investor Funds, the JPMorgan SmartRetirement Funds and the SmartRetirement Blend Funds, which are affiliated funds of funds, owned in the aggregate, shares representing more than 10% of the net assets of the Funds as follows:
J.P. Morgan Investor Funds | JPMorgan SmartRetirement Funds | JPMorgan SmartRetirement Blend Funds | ||||||||||
Emerging Markets Equity Fund | — | % | 12.5 | % | — | % | ||||||
Emerging Markets Research Enhanced Equity Fund | — | 65.0 | 19.1 | |||||||||
Europe Dynamic Fund | 51.8 | — | — | |||||||||
International Advantage Fund | — | 95.8 | — | |||||||||
International Equity Fund | — | 54.6 | — | |||||||||
International Focus Fund | — | 76.1 | — | |||||||||
International Research Enhanced Equity Fund | 15.6 | 64.2 | — | |||||||||
| 124 | J.P. MORGAN INTERNATIONAL EQUITY FUNDS | APRIL 30, 2020 | ||||
Table of Contents
The Funds may have elements of risk not typically associated with investments in the United States of America due to concentrated investments in a limited number of countries or regions, which may vary throughout the period depending on the Fund. Such concentrations may subject the Funds to additional risks resulting from political or economic conditions in such countries or regions and the possible imposition of adverse governmental laws or currency exchange restrictions could cause the securities and their markets to be less liquid and their prices to be more volatile than those of comparable U.S. securities.
As of April 30, 2020, the following Funds hadnon-U.S. country allocations representing greater than 10% of total investments (excluding investment of cash collateral from securities loaned) as follows:
| China | France | Germany | India | Japan | ||||||||||||||||
Emerging Markets Equity Fund | 35.5 | % | — | % | — | % | 16.5 | % | — | % | ||||||||||
Emerging Markets Research Enhanced Equity Fund | 39.4 | — | — | — | — | |||||||||||||||
Europe Dynamic Fund | — | 14.9 | 13.1 | — | — | |||||||||||||||
International Advantage Fund | — | — | — | — | 25.7 | |||||||||||||||
International Equity Fund | — | 13.3 | — | — | 15.4 | |||||||||||||||
International Focus Fund | 10.0 | — | 10.1 | — | — | |||||||||||||||
International Hedged Equity Fund | — | 12.5 | — | — | 23.6 | |||||||||||||||
International Research Enhanced Equity Fund | — | 12.4 | — | — | 23.0 | |||||||||||||||
International Value Fund | — | — | — | — | 25.8 | |||||||||||||||
South Korea | Switzerland | Taiwan | United Kingdom | |||||||||||||
Emerging Markets Research Enhanced Equity Fund | 12.3 | % | — | % | 12.0 | % | — | % | ||||||||
Europe Dynamic Fund | — | 20.9 | — | 17.5 | ||||||||||||
International Advantage Fund | — | 11.8 | — | 11.1 | ||||||||||||
International Equity Fund | — | 13.9 | — | 14.8 | ||||||||||||
International Focus Fund | — | 11.1 | — | 20.0 | ||||||||||||
International Hedged Equity Fund | — | 11.6 | — | 15.8 | ||||||||||||
International Research Enhanced Equity Fund | — | 11.4 | — | 15.6 | ||||||||||||
International Value Fund | — | — | — | 14.0 | ||||||||||||
As of April 30, 2020, a significant portion of each Fund’s investments consisted of securities that were denominated in foreign currencies. Changes in currency exchange rates will affect the value of, and investment income from, such securities.
Derivatives may be riskier than other types of investments because they may be more sensitive to changes in economic and market conditions and could result in losses that significantly exceed the Funds’ original investment. Many derivatives create leverage thereby causing the Funds to be more volatile than they would have been if they had not used derivatives. Derivatives also expose the Funds to counterparty risk (the risk that the derivative counterparty will not fulfill its contractual obligations), including credit risk of the derivative counterparty. The possible lack of a liquid secondary market for derivatives and the resulting inability of the Funds to sell or otherwise close a derivatives position could expose the Funds to losses.
LIBOR is intended to represent the rate at which contributing banks may obtain short-term borrowings from each other in the London interbank market. The regulatory authority that oversees financial services firms and financial markets in the U.K. has announced that, after the end of 2021, it would no longer persuade or compel contributing banks to make rate submissions for purposes of determining the LIBOR rate. As a result, it is possible that commencing in 2022, LIBOR may no longer be available or no longer deemed an appropriate reference rate upon which to determine the interest rate on or impacting certain loans, notes, derivatives and other instruments or investments comprising some or all of a Fund’s portfolio. In light of this eventuality, public and private sector industry initiatives are currently underway to identify new or alternative reference rates to be used in place of LIBOR. There is no assurance that the composition or characteristics of any such alternative reference rate will be similar to or produce the same value or economic equivalence as LIBOR or that it will have the same volume or liquidity as did LIBOR prior to its discontinuance or unavailability, which may affect the value or liquidity or return on certain investments of a Fund and result in costs incurred in connection with closing out positions and entering into new trades. These risks may also apply with respect to changes in connection with other interbank offering rates (e.g., Euribor) and a wide range of other index levels, rates and values that are treated as “benchmarks” and are the subject of recent regulatory reform.
| APRIL 30, 2020 | J.P. MORGAN INTERNATIONAL EQUITY FUNDS | 125 | ||||||
Table of Contents
NOTES TO FINANCIAL STATEMENTS
AS OF APRIL 30, 2020 (Unaudited) (continued)
The Funds are subject to infectious disease epidemics/pandemics risk. Recently, the worldwide outbreak ofCOVID-19, a novel coronavirus disease, has negatively affected economies, markets and individual companies throughout the world. The effects of thisCOVID-19 pandemic to public health, and business and market conditions, including exchange trading suspensions and closures may continue to have a significant negative impact on the performance of a Fund’s investments, increase a Fund’s volatility, exacerbate otherpre-existing political, social and economic risks to the Funds and negatively impact broad segments of businesses and populations. The Funds’ operations may be interrupted as a result, which may have a significant negative impact on investment performance. In addition, governments, their regulatory agencies, or self-regulatory organizations may take actions in response to the pandemic that affect the instruments in which the Funds invest, or the issuers of such instruments, in ways that could also have a significant negative impact on a Fund’s investment performance. The full impact of thisCOVID-19 pandemic, or other future epidemics/pandemics, is currently unknown.
| 126 | J.P. MORGAN INTERNATIONAL EQUITY FUNDS | APRIL 30, 2020 | ||||
Table of Contents
SCHEDULE OF SHAREHOLDER EXPENSES
(Unaudited)
Hypothetical $1,000 Investment
As a shareholder of the Funds, you incur two types of costs: (1) transaction costs, including sales charges (loads) on purchase payments and (2) ongoing costs, including investment advisory fees, administration fees, distribution fees and other Fund expenses. The examples below are intended to help you understand your ongoing costs (in dollars) of investing in the Funds and to compare these ongoing costs with the ongoing costs of investing in other mutual funds. The examples assume that you had a $1,000 investment in each Class at the beginning of the reporting period, November 1, 2019, and continued to hold your shares at the end of the reporting period, April 30, 2020.
Actual Expenses
For each Class of each Fund in the table below, the first line provides information about actual account values and actual expenses. You may use the information in this line, together with the amount you invested, to estimate the expenses that you paid over the period. Simply divide your account value by $1,000 (for example, an $8,600 account value divided by $1,000 = 8.6), then multiply the result by the number in the first line of each Class under the heading titled “Expenses Paid During the Period” to estimate the expenses you paid on your account during this period.
Hypothetical Example for Comparison Purposes
The second line of each Class in the table below provides information about hypothetical account values and hypothetical expenses based on the Class’ actual expense ratio and an assumed rate of return of 5% per year before expenses, which is not the Class’ actual return. The hypothetical account values and expenses may not be used to estimate the actual ending account balance or expenses you paid for the period. You may use this information to compare the ongoing costs of investing in the Class of the Funds and other funds. To do so, compare this 5% hypothetical example with the 5% hypothetical examples that appear in the shareholder reports of the other funds. Please note that the expenses shown in the table are meant to highlight your ongoing costs only and do not reflect any transaction costs, such as sales charges (loads) or redemption fees. Therefore, the second line for each Class in the table is useful in comparing ongoing costs only, and will not help you determine the relative total costs of owning different funds. In addition, if these transaction costs were included, your costs would have been higher. The examples also assume all dividends and distributions have been reinvested.
| Beginning Account Value November 1, 2019 | Ending Account Value April 30, 2020 | Expenses Paid During the Period* | Annualized Expense Ratio | |||||||||||||
JPMorgan Emerging Markets Equity Fund | ||||||||||||||||
Class A | ||||||||||||||||
Actual | $ | 1,000.00 | $ | 897.40 | $ | 5.85 | 1.24 | % | ||||||||
Hypothetical | 1,000.00 | 1,018.70 | 6.22 | 1.24 | ||||||||||||
Class C | ||||||||||||||||
Actual | 1,000.00 | 895.20 | 8.20 | 1.74 | ||||||||||||
Hypothetical | 1,000.00 | 1,016.21 | 8.72 | 1.74 | ||||||||||||
Class I | ||||||||||||||||
Actual | 1,000.00 | 898.60 | 4.67 | 0.99 | ||||||||||||
Hypothetical | 1,000.00 | 1,019.94 | 4.97 | 0.99 | ||||||||||||
Class L | ||||||||||||||||
Actual | 1,000.00 | 899.30 | 4.20 | 0.89 | ||||||||||||
Hypothetical | 1,000.00 | 1,020.44 | 4.47 | 0.89 | ||||||||||||
Class R2 | ||||||||||||||||
Actual | 1,000.00 | 896.30 | 7.26 | 1.54 | ||||||||||||
Hypothetical | 1,000.00 | 1,017.21 | 7.72 | 1.54 | ||||||||||||
Class R3 | ||||||||||||||||
Actual | 1,000.00 | 897.50 | 6.09 | 1.29 | ||||||||||||
Hypothetical | 1,000.00 | 1,018.45 | 6.47 | 1.29 | ||||||||||||
Class R4 | ||||||||||||||||
Actual | 1,000.00 | 898.30 | 4.91 | 1.04 | ||||||||||||
Hypothetical | 1,000.00 | 1,019.69 | 5.22 | 1.04 | ||||||||||||
Class R5 | ||||||||||||||||
Actual | 1,000.00 | 899.20 | 4.20 | 0.89 | ||||||||||||
Hypothetical | 1,000.00 | 1,020.44 | 4.47 | 0.89 | ||||||||||||
Class R6 | ||||||||||||||||
Actual | 1,000.00 | 899.50 | 3.73 | 0.79 | ||||||||||||
Hypothetical | 1,000.00 | 1,020.93 | 3.97 | 0.79 | ||||||||||||
| APRIL 30, 2020 | J.P. MORGAN INTERNATIONAL EQUITY FUNDS | 127 | ||||||
Table of Contents
SCHEDULE OF SHAREHOLDER EXPENSES
(Unaudited) (continued)
Hypothetical $1,000 Investment
| Beginning Account Value November 1, 2019 | Ending Account Value April 30, 2020 | Expenses Paid During the Period* | Annualized Expense Ratio | |||||||||||||
JPMorgan Emerging Markets Research Enhanced Equity Fund | ||||||||||||||||
Class I | ||||||||||||||||
Actual | $ | 1,000.00 | $ | 882.10 | $ | 2.01 | 0.43 | % | ||||||||
Hypothetical | 1,000.00 | 1,022.73 | 2.16 | 0.43 | ||||||||||||
Class R6 | ||||||||||||||||
Actual | 1,000.00 | 882.70 | 1.64 | 0.35 | ||||||||||||
Hypothetical | 1,000.00 | 1,023.12 | 1.76 | 0.35 | ||||||||||||
JPMorgan Europe Dynamic Fund | ||||||||||||||||
Class A | 1,000.00 | 833.50 | 5.65 | 1.24 | ||||||||||||
Actual | 1,000.00 | 1,018.70 | 6.22 | 1.24 | ||||||||||||
Hypothetical | ||||||||||||||||
Class C | 1,000.00 | 830.90 | 7.92 | 1.74 | ||||||||||||
Actual | 1,000.00 | 1,016.21 | 8.72 | 1.74 | ||||||||||||
Hypothetical | ||||||||||||||||
Class I | 1,000.00 | 834.40 | 4.52 | 0.99 | ||||||||||||
Actual | 1,000.00 | 1,019.94 | 4.97 | 0.99 | ||||||||||||
Hypothetical | ||||||||||||||||
Class L | 1,000.00 | 834.90 | 3.88 | 0.85 | ||||||||||||
Actual | 1,000.00 | 1,020.64 | 4.27 | 0.85 | ||||||||||||
Hypothetical | ||||||||||||||||
Class R6 | 1,000.00 | 835.20 | 3.42 | 0.75 | ||||||||||||
Actual | 1,000.00 | 1,021.13 | 3.77 | 0.75 | ||||||||||||
Hypothetical | ||||||||||||||||
JPMorgan International Advantage Fund | ||||||||||||||||
Class A | 1,000.00 | 838.10 | 4.34 | 0.95 | ||||||||||||
Actual | 1,000.00 | 1,020.14 | 4.77 | 0.95 | ||||||||||||
Hypothetical | ||||||||||||||||
Class C | 1,000.00 | 836.60 | 6.62 | 1.45 | ||||||||||||
Actual | 1,000.00 | 1,017.65 | 7.27 | 1.45 | ||||||||||||
Hypothetical | ||||||||||||||||
Class I | 1,000.00 | 839.40 | 3.20 | 0.70 | ||||||||||||
Actual | 1,000.00 | 1,021.38 | 3.52 | 0.70 | ||||||||||||
Hypothetical | ||||||||||||||||
Class R2 | 1,000.00 | 837.10 | 5.71 | 1.25 | ||||||||||||
Actual | 1,000.00 | 1,018.65 | 6.27 | 1.25 | ||||||||||||
Hypothetical | ||||||||||||||||
Class R6 | 1,000.00 | 840.50 | 2.29 | 0.50 | ||||||||||||
Actual | 1,000.00 | 1,022.38 | 2.51 | 0.50 | ||||||||||||
Hypothetical | ||||||||||||||||
JPMorgan International Equity Fund | ||||||||||||||||
Class A | 1,000.00 | 874.00 | 4.43 | 0.95 | ||||||||||||
Actual | 1,000.00 | 1,020.14 | 4.77 | 0.95 | ||||||||||||
Hypothetical | ||||||||||||||||
Class C | 1,000.00 | 871.20 | 6.75 | 1.45 | ||||||||||||
Actual | 1,000.00 | 1,017.65 | 7.27 | 1.45 | ||||||||||||
Hypothetical | ||||||||||||||||
Class I | 1,000.00 | 875.00 | 3.26 | 0.70 | ||||||||||||
Actual | 1,000.00 | 1,021.38 | 3.52 | 0.70 | ||||||||||||
Hypothetical | ||||||||||||||||
Class R2 | 1,000.00 | 872.30 | 5.82 | 1.25 | ||||||||||||
Actual | 1,000.00 | 1,018.65 | 6.27 | 1.25 | ||||||||||||
Hypothetical | ||||||||||||||||
Class R5 | 1,000.00 | 875.50 | 2.80 | 0.60 | ||||||||||||
Actual | 1,000.00 | 1,021.88 | 3.02 | 0.60 | ||||||||||||
Hypothetical | ||||||||||||||||
| 128 | J.P. MORGAN INTERNATIONAL EQUITY FUNDS | APRIL 30, 2020 | ||||
Table of Contents
| Beginning Account Value November 1, 2019 | Ending Account Value April 30, 2020 | Expenses Paid During the Period* | Annualized Expense Ratio | |||||||||||||
JPMorgan International Equity Fund (continued) | ||||||||||||||||
Class R6 | $ | 1,000.00 | $ | 875.70 | $ | 2.33 | 0.50 | % | ||||||||
Actual | 1,000.00 | 1,022.38 | 2.51 | 0.50 | ||||||||||||
Hypothetical | ||||||||||||||||
JPMorgan International Focus Fund (formerly known as JPMorgan International Unconstrained Equity Fund) | ||||||||||||||||
Class A | 1,000.00 | 902.50 | 4.73 | 1.00 | ||||||||||||
Actual | 1,000.00 | 1,019.89 | 5.02 | 1.00 | ||||||||||||
Hypothetical | ||||||||||||||||
Class C | 1,000.00 | 900.80 | 7.09 | 1.50 | ||||||||||||
Actual | 1,000.00 | 1,017.40 | 7.52 | 1.50 | ||||||||||||
Hypothetical | ||||||||||||||||
Class I | 1,000.00 | 904.00 | 3.55 | 0.75 | ||||||||||||
Actual | 1,000.00 | 1,021.13 | 3.77 | 0.75 | ||||||||||||
Hypothetical | ||||||||||||||||
Class R2 | 1,000.00 | 901.40 | 6.15 | 1.30 | ||||||||||||
Actual | 1,000.00 | 1,018.40 | 6.52 | 1.30 | ||||||||||||
Hypothetical | ||||||||||||||||
Class R5 | 1,000.00 | 904.10 | 3.08 | 0.65 | ||||||||||||
Actual | 1,000.00 | 1,021.63 | 3.27 | 0.65 | ||||||||||||
Hypothetical | ||||||||||||||||
Class R6 | 1,000.00 | 904.70 | 2.60 | 0.55 | ||||||||||||
Actual | 1,000.00 | 1,022.13 | 2.77 | 0.55 | ||||||||||||
Hypothetical | ||||||||||||||||
JPMorgan International Hedged Equity Fund | ||||||||||||||||
Class A | 1,000.00 | 913.30 | 4.04 | 0.85 | ||||||||||||
Actual | 1,000.00 | 1,020.64 | 4.27 | 0.85 | ||||||||||||
Hypothetical | ||||||||||||||||
Class C | 1,000.00 | 910.80 | 6.41 | 1.35 | ||||||||||||
Actual | 1,000.00 | 1,018.15 | 6.77 | 1.35 | ||||||||||||
Hypothetical | ||||||||||||||||
Class I | 1,000.00 | 914.40 | 2.86 | 0.60 | ||||||||||||
Actual | 1,000.00 | 1,021.88 | 3.02 | 0.60 | ||||||||||||
Hypothetical | ||||||||||||||||
Class R5 | 1,000.00 | 915.40 | 2.14 | 0.45 | ||||||||||||
Actual | 1,000.00 | 1,022.63 | 2.26 | 0.45 | ||||||||||||
Hypothetical | ||||||||||||||||
Class R6 | 1,000.00 | 915.60 | 1.67 | 0.35 | ||||||||||||
Actual | 1,000.00 | 1,023.12 | 1.76 | 0.35 | ||||||||||||
Hypothetical | ||||||||||||||||
JPMorgan International Research Enhanced Equity Fund | ||||||||||||||||
Class A | 1,000.00 | 847.90 | 2.76 | 0.60 | ||||||||||||
Actual | 1,000.00 | 1,021.88 | 3.02 | 0.60 | ||||||||||||
Hypothetical | ||||||||||||||||
Class I | 1,000.00 | 848.90 | 1.56 | 0.34 | ||||||||||||
Actual | 1,000.00 | 1,023.17 | 1.71 | 0.34 | ||||||||||||
Hypothetical | ||||||||||||||||
Class R6 | 1,000.00 | 849.00 | 1.10 | 0.24 | ||||||||||||
Actual | 1,000.00 | 1,023.67 | 1.21 | 0.24 | ||||||||||||
Hypothetical | ||||||||||||||||
JPMorgan International Value Fund | ||||||||||||||||
Class A | 1,000.00 | 767.50 | 4.39 | 1.00 | ||||||||||||
Actual | 1,000.00 | 1,019.89 | 5.02 | 1.00 | ||||||||||||
Hypothetical | ||||||||||||||||
| APRIL 30, 2020 | J.P. MORGAN INTERNATIONAL EQUITY FUNDS | 129 | ||||||
Table of Contents
SCHEDULE OF SHAREHOLDER EXPENSES
(Unaudited) (continued)
Hypothetical $1,000 Investment
| Beginning Account Value November 1, 2019 | Ending Account Value April 30, 2020 | Expenses Paid During the Period* | Annualized Expense Ratio | |||||||||||||
JPMorgan International Value Fund (continued) | ||||||||||||||||
Class C | $ | 1,000.00 | $ | 765.60 | $ | 6.58 | 1.50 | % | ||||||||
Actual | 1,000.00 | 1,017.40 | 7.52 | 1.50 | ||||||||||||
Hypothetical | ||||||||||||||||
Class I | 1,000.00 | 768.70 | 3.30 | 0.75 | ||||||||||||
Actual | 1,000.00 | 1,021.13 | 3.77 | 0.75 | ||||||||||||
Hypothetical | ||||||||||||||||
Class L | 1,000.00 | 769.00 | 2.86 | 0.65 | ||||||||||||
Actual | 1,000.00 | 1,021.63 | 3.27 | 0.65 | ||||||||||||
Hypothetical | ||||||||||||||||
Class R2 | 1,000.00 | 767.10 | 5.71 | 1.30 | ||||||||||||
Actual | 1,000.00 | 1,018.40 | 6.52 | 1.30 | ||||||||||||
Hypothetical | ||||||||||||||||
Class R5 | 1,000.00 | 768.80 | 2.86 | 0.65 | ||||||||||||
Actual | 1,000.00 | 1,021.63 | 3.27 | 0.65 | ||||||||||||
Hypothetical | ||||||||||||||||
Class R6 | 1,000.00 | 769.20 | 2.42 | 0.55 | ||||||||||||
Actual | 1,000.00 | 1,022.13 | 2.77 | 0.55 | ||||||||||||
Hypothetical | ||||||||||||||||
| * | Expenses are equal to each Class’ respective annualized expense ratio, multiplied by the average account value over the period, multiplied by 182/366 (to reflect the one-half year period). |
| 130 | J.P. MORGAN INTERNATIONAL EQUITY FUNDS | APRIL 30, 2020 | ||||
Table of Contents
LIQUIDITY RISK MANAGEMENT PROGRAM
(Unaudited)
Each of the Funds has adopted the J.P. Morgan Funds Liquidity Risk Management Program (the “Program”) under Rule22e-4 under the 1940 Act (the “Liquidity Rule”). The Program seeks to assess, manage and review each Fund’s Liquidity Risk. “Liquidity Risk” is defined as the risk that a fund could not meet requests to redeem shares issued by the fund without significant dilution of remaining investors’ interests in the fund. Among other things, the Liquidity Rule requires that a written report be provided to the Boards of Trustees (the “Board”) on an annual basis that addresses the operation of the Program and assesses the adequacy and effectiveness of its implementation, including the operation of any Highly Liquidity Investment Minimum (“HLIM”) established for a Fund and any material changes to the Program.
The Board has appointed J.P. Morgan Asset Management’s Liquidity Risk Forum to be the program administrator for the Program (the “Program Administrator”). On February 11, 2020, the Board of Trustees reviewed the Program Administrator’s initial written report (the “Report”) concerning the operation of the Program for the period from December 1, 2018 through December 31, 2019 (the “Program Reporting Period”). The Report addressed the operation of the Program and assessed its adequacy and effectiveness of implementation, including, where applicable, the operation of a Fund’s HLIM. There were no material changes to the Program during the Program Reporting Period.
The Report summarized the operation of the Program and the information and factors considered by the Program Administrator in assessing whether the Program has been adequately and effectively implemented with respect to each Fund. Such information and factors included, among other things: (1) the liquidity risk framework used to assess, manage, and periodically review each Fund’s Liquidity Risk and the results of this assessment; (2) the methodology and inputs for classifying each of the Fund’s investments into one of four liquidity categories that reflect an estimate of their liquidity under current market conditions; (3) whether a Fund invested primarily in “Highly Liquid Investments” (as defined under the Liquidity Rule), whether an HLIM should be established for a Fund (and, for Funds that have adopted an HLIM, whether the HLIM continues to be appropriate or whether a Fund has invested below its HLIM) and the procedures for monitoring for this limit; (4) whether a Fund invested more than 15% of its assets in “Illiquid Investments” (as defined under the Liquidity Rule) and the procedures for monitoring for this limit; and (5) specific liquidity events arising during the Program Reporting Period, including the impact on Fund liquidity caused by extendednon-U.S. market closures.
Based on this review, the Report concluded that: (1) the Program continues to be reasonably designed to effectively assess and manage each Fund’s Liquidity Risk; and (2) the Program has been adequately and effectively implemented with respect to each Fund during the Program Reporting Period.
| APRIL 30, 2020 | J.P. MORGAN INTERNATIONAL EQUITY FUNDS | 131 | ||||||
Table of Contents
J.P. Morgan Funds are distributed by JPMorgan Distribution Services, Inc., which is an affiliate of JPMorgan Chase & Co. Affiliates of JPMorgan Chase & Co. receive fees for providing various services to the funds.
Contact JPMorgan Distribution Services, Inc. at1-800-480-4111 for a fund prospectus. You can also visit us at www.jpmorganfunds.com. Investors should carefully consider the investment objectives and risk as well as charges and expenses of the mutual fund before investing. The prospectus contains this and other information about the mutual fund. Read the prospectus carefully before investing.
Investors may obtain information about the Securities Investor Protection Corporation (SIPC), including the SIPC brochure, by visiting www.sipc.org or by calling SIPC at202-371-8300.
Each Fund files a complete schedule of its fund holdings for the first and third quarters of its fiscal year with the SEC onForm N-PORT. Prior to March 31, 2019, each Fund filed a complete schedule of its fund holdings for the first and third quarters of its fiscal year with the SEC on Form N-Q. The Funds’ Form N-PORT and Form N-Q are available on the SEC’s website at http://www.sec.gov. Each Fund’s quarterly holdings can be found by visiting the J.P. Morgan Funds’ website at www.jpmorganfunds.com.
A description of each Fund’s policies and procedures with respect to the disclosure of each Fund’s holdings is available in the prospectuses and Statement of Additional Information.
A copy of proxy policies and procedures is available without charge upon request by calling1-800-480-4111 and on the Funds’ website at www.jpmorganfunds.com. A description of such policies and procedures is on the SEC’s website at www.sec.gov. The Trustees have delegated the authority to vote proxies for securities owned by the Funds to the Adviser. A copy of the Funds’ voting record for the most recent12-month period ended June 30 is available on the SEC’s website at www.sec.gov or at the Funds’ website at www.jpmorganfunds.com no later than August 31 of each year. The Funds’ proxy voting record will include, among other things, a brief description of the matter voted on for each fund security, and will state how each vote was cast, for example, for or against the proposal.

Table of Contents

J.P. Morgan Asset Management is the brand name for the asset management business of JPMorgan Chase & Co. and its affiliates worldwide.
| © JPMorgan Chase & Co., 2020. All rights reserved. April 2020. | SAN-INTEQ-420 |
Table of Contents
ITEM 2. CODE OF ETHICS.
Disclose whether, as of the end of the period covered by the report, the registrant has adopted a code of ethics that applies to the registrant’s principal executive officer, principal financial officer, principal accounting officer or controller, or persons performing similar functions, regardless of whether these individuals are employed by the registrant or a third party. If the registrant has not adopted such a code of ethics, explain why it has not done so.
The registrant must briefly describe the nature of any amendment, during the period covered by the report, to a provision of its code of ethics that applies to the registrant’s principal executive officer, principal financial officer, principal accounting officer or controller, or persons performing similar functions, regardless of whether these individuals are employed by the registrant or a third party, and that relates to any element of the code of ethics definition enumerated in paragraph (b) of this Item. The registrant must file a copy of any such amendment as an exhibit pursuant to Item 13(a)(1), unless the registrant has elected to satisfy paragraph (f) of this Item by positing its code of ethics on its website pursuant to paragraph (f)(2) of this Item, or by undertaking to provide its code of ethics to any person without charge, upon request, pursuant to paragraph (f)(3) of this Item.
If the registrant has, during the period covered by the report, granted a waiver, including an implicit waiver, from a provision of the code of ethics that applies to the registrant’s principal executive officer, principal financial officer, principal accounting officer or controller, or persons performing similar functions, regardless of whether these individuals are employed by the registrant or third party, that relates to one or more items set forth in paragraph (b) of this Item, the registrant must briefly describe the nature of the waiver, the name of the person to whom the waiver was granted, and the date of the waiver.
Not applicable to a semi-annual report.
ITEM 3. AUDIT COMMITTEE FINANCIAL EXPERT.
(a) (1) Disclose that the registrant’s board of directors has determined that the registrant either:
(i) Has at least one audit committee financial expert serving on its audit committee; or
(ii) Does not have an audit committee financial expert serving on its audit committee.
(2) If the registrant provides the disclosure required by paragraph (a)(1)(i) of this Item, it must disclose the name of the audit committee financial expert and whether that person is “independent.” In order to be considered “independent” for purposes of this Item, a member of an audit committee may not, other than in his or her capacity as a member of the audit committee, the board of directors, or any other board committee:
(i) Accept directly or indirectly any consulting, advisory, or other compensatory fee from the issuer; or
(ii) Be an “interested person” of the investment company as defined in Section 2(a)(19) of the Act (15 U.S.C.80a-2(a)(19)).
(3) If the registrant provides the disclosure required by paragraph (a)(1)(ii) of this Item, it must explain why it does not have an audit committee financial expert.
Not applicable to a semi-annual report.
Table of Contents
ITEM 4. PRINCIPAL ACCOUNTANT FEES AND SERVICES.
(a) Disclose, under the caption Audit Fees, the aggregate fees billed for each of the last two fiscal years for professional
services rendered by the principal accountant for the audit of the registrant’s annual financial statements or services that are normally provided by the accountant in connection with statutory and regulatory filings or engagements for those fiscal years.
(b) Disclose, under the caption Audit-Related Fees, the aggregate fees billed in each of the last two fiscal years for assurance and related services by the principal accountant that are reasonably related to the performance of the audit of the registrant’s financial statements and are not reported under paragraph (a) of this Item. Registrants shall describe the nature of the services comprising the fees disclosed under this category.
(c) Disclose, under the caption Tax Fees, the aggregate fees billed in each of the last two fiscal years for professional services rendered by the principal accountant for tax compliance, tax advice, and tax planning. Registrants shall describe the nature of the services comprising the fees disclosed under this category.
(d) Disclose, under the caption All Other Fees, the aggregate fees billed in each of the last two fiscal years for products and services provided by the principal accountant, other than the services reported in paragraphs (a) through (c) of this Item. Registrants shall describe the nature of the services comprising the fees disclosed under this category.
(e) (1) Disclose the audit committee’spre-approval policies and procedures described in paragraph (c)(7) of Rule2-01 of RegulationS-X.
(2) Disclose the percentage of services described in each of paragraphs (b) through (d) of this Item that were approved by the audit committee pursuant to paragraph (c)(7)(i)(C) of Rule2-01 of RegulationS-X.
(f) If greater than 50 percent, disclose the percentage of hours expended on the principal accountant’s engagement to audit the registrant’s financial statements for the most recent fiscal year that were attributed to work performed by persons other than the principal accountant’s full-time, permanent employees.
(g) Disclose the aggregatenon-audit fees billed by the registrant’s accountant for services rendered to the registrant, and rendered to the registrant’s investment adviser (not including anysub-adviser whose role is primarily portfolio management and is subcontracted with or overseen by another investment adviser), and any entity controlling, controlled by, or under common control with the adviser that provides ongoing services to the registrant for each of the last two fiscal years of the registrant.
(h) Disclose whether the registrant’s audit committee of the board of directors has considered whether the provision ofnon-audit services that were rendered to the registrant’s investment adviser (not including any subadviser whose role is primarily portfolio management and is subcontracted with or overseen by another investment adviser), and any entity controlling, controlled by, or under common control with the investment adviser that provides ongoing services to the registrant that were notpre-approved pursuant to paragraph (c)(7)(ii) of Rule2-01 of RegulationS-X is compatible with maintaining the principal accountant’s independence.
Not applicable to a semi-annual report.
ITEM 5. AUDIT COMMITTEE OF LISTED REGISTRANTS.
(a) If the registrant is a listed issuer as defined in Rule10A-3 under the Exchange Act (17CFR240.10A-3), state whether or not the registrant has a separately-designated standing audit committee established in accordance with Section 3(a)(58)(A) of the Exchange Act (15 U.S.C. 78c(a)(58)(A)). If the registrant has such a committee, however designated, identify each committee member. If the entire board of directors is acting as the registrant’s audit committee as specified in Section 3(a)(58)(B) of the Exchange Act (15 U.S.C. 78c(a)(58)(B)), so state.
(b) If applicable, provide the disclosure required by Rule10A-3(d) under the Exchange Act (17CFR240.10A-3(d)) regarding an exemption from the listing standards for all audit committees.
Not applicable to a semi-annual report.
Table of Contents
ITEM 6. INVESTMENTS.
File Schedule I – Investments in securities of unaffiliated issuers as of the close of the reporting period as set forth inSection 210.12-12 of RegulationS-X, unless the schedule is included as part of the report to shareholders filed under Item 1 of this Form.
Included in Item 1.
ITEM 7. DISCLOSURE OF PROXY VOTING POLICIES AND PROCEDURES FORCLOSED-END MANAGEMENT INVESTMENT COMPANIES.
Not applicable.
ITEM 8. PORTFOLIO MANAGERS OFCLOSED-END MANAGEMENT INVESTMENT COMPANIES.
Not applicable.
ITEM 9. PURCHASE OF EQUITY SECURITIES BYCLOSED-END MANAGEMENT INVESTMENT COMPANY AND AFFILIATED PURCHASERS.
Not applicable.
ITEM 10. SUBMISSION OF MATTERS TO A VOTE OF SECURITY HOLDERS.
Describe any material changes to the procedures by which shareholders may recommend nominees to the registrant’s board of directors, where those changes were implemented after the registrant last provided disclosure in response to the requirements of Item 7(d)(2)(ii)(G) of Schedule 14A (17 CFR240.14a-101), or this Item.
No material changes to report.
ITEM 11. CONTROLS AND PROCEDURES.
(a) Disclose the conclusions of the registrant’s principal executive and principal financial officers, or persons performing similar functions, regarding the effectiveness of the registrant’s disclosure controls and procedures (as defined in Rule30a-3(c) under the Act (17 CFR270.30a-3(c))) as of a date within 90 days of the filing date of the report that includes the disclosure required by this paragraph, based on the evaluation of these controls and procedures required by Rule30a-3(b) under the Act (17 CFR270.30a-3(b)) and Rules13a-15(b) or15d-15(b) under the Exchange Act (17 CFR240.13a-15(b) or240.15d-15(b)).
The Registrant’s principal executive and principal financial officers have concluded, based on their evaluation of the Registrant’s disclosure controls and procedures as of a date within 90 days of the filing date of this report, that the Registrant’s disclosure controls and procedures are reasonably designed to ensure that information required to be disclosed by the Registrant on FormN-CSR is recorded, processed, summarized and reported within the required time periods and that information required to be disclosed by the Registrant in the reports that it files or submits on FormN-CSR is accumulated and communicated to the Registrant’s management, including its principal executive and principal financial officers, as appropriate to allow timely decisions regarding required disclosure.
(b) Disclose any change in the registrant’s internal control over financial reporting (as defined in Rule30a-3(d) under the Act (17 CFR270.30a-3(d)) that occurred during the registrant’s second fiscal quarter of the period covered by this report that has materially affected, or is reasonably likely to materially affect, the registrant’s internal control over financial reporting.
There were no changes in the Registrant’s internal control over financial reporting that occurred during the last fiscal quarter covered by this report that have materially affected, or are reasonably likely to materially affect, the Registrant’s internal control over financial reporting.
Table of Contents
ITEM 12. DISCLOSURE OF SECURITIES LENDING ACTIVITIES FORCLOSED-END MANAGEMENT INVESTMENT COMPANIES.
Not applicable.
ITEM 13. EXHIBITS.
(a) File the exhibits listed below as part of this Form. Letter or number the exhibits in the sequence indicated.
(1) Any code of ethics, or amendment thereto, that is the subject of the disclosure required by Item 2, to the extent that the registrant intends to satisfy the Item 2 requirements through filing of an exhibit.
Not applicable.
(2) A separate certification for each principal executive officer and principal financial officer of the registrant as required by Rule30a-2(a) under the Act (17 CFR270.30a-2).
(3) Any written solicitation to purchase securities under Rule23c-1 under the Act (17 CFR270.23c-1) sent or given during the period covered by the report by or on behalf of the registrant to 10 or more persons.
Not applicable.
(b) A separate or combined certification for each principal executive officer and principal officer of the registrant as required by Rule30a-2(b) under the Act of 1940.
Table of Contents
SIGNATURES
Pursuant to the requirements of the Securities Exchange Act of 1934 and the Investment Company Act of 1940, the registrant has duly caused this report to be signed on its behalf by the undersigned, thereunto duly authorized.
JPMorgan Trust II
| ||
| By: | /s/ Brian S. Shlissel | |
| Brian S. Shlissel | ||
| President and Principal Executive Officer | ||
| July 1, 2020 | ||
Pursuant to the requirements of the Securities Exchange Act of 1934 and the Investment Company Act of 1940, this report has been signed below by the following persons on behalf of the registrant and in the capacities and on the dates indicated.
| By: | /s/ Brian S. Shlissel | |
| Brian S. Shlissel | ||
| President and Principal Executive Officer | ||
| July 1, 2020 | ||
| By: | /s/ Timothy J. Clemens | |
| Timothy J. Clemens | ||
| Treasurer and Principal Financial Officer | ||
| July 1, 2020 | ||