Exhibit 99.1

MyBank.com INVESTOR PRESENTATION First Quarter 2023
2 Forward looking statements This presentation contains forward - looking statements as defined by the Private Securities Litigation Reform Act of 1995 . Forward - looking statements do not represent historical facts, but are statements about management's beliefs, plans and objectives about the future, as well as its assumptions and judgments concerning such beliefs, plans and objectives . These statements are evidenced by terms such as "anticipate," "estimate," "should," "expect," "believe," "intend," and similar expressions . Although these statements reflect management's good faith beliefs and projections, they are not guarantees of future performance and they may not prove true . The beliefs, plans and objectives on which forward - looking statements are based involve risks and uncertainties that could cause actual results to differ materially from those addressed in the forward - looking statements . For a discussion of these risks and uncertainties, see the section of the periodic reports that First United Corporation files with the Securities and Exchange Commission entitled "Risk Factors . Whether actual results will conform to expectations and predictions is subject to known and unknown risks and uncertainties . Actual results could be materially different from management’s expectations . This presentation should be read in conjunction with our Annual Report on Form 10 - K, as amended, for the year ended December 31 , 2022 , including the sections of the report entitled “Risk Factors”, as well as the reports and other documents that we subsequently file with the Securities and Exchange Commission (“SEC”), which are available on the SEC’s website at www . sec . gov or at our website at www . mybank . com . Except as required by law, we do not intend to publish updates or revisions of any forward - looking statements we make to reflect new information, future events or otherwise .

3 I. II. II. Corporate Overview Financial Performance Appendices Pg. 4 Pg. 9 Pg. 28 Table of Contents

Our Mission To enrich the lives of our associates, customers, communities and shareholders through uncommon commitment to service and customized financial solutions. Corporate Overview Founded: 1900 Headquarters: Oakland, MD Locations: 26 branches Business Lines: ▪ Commercial & Retail Banking ▪ Trust Services ▪ Wealth Management Ticker: FUNC (Nasdaq) Website: www.MyBank.com Overview West Virginia Maryland • Pittsburgh, PA • Washington, DC • Columbus, OH • Baltimore, MD • Richmond, VA Morgantown, WV භ • Philadelphia, PA • Harrisburg, PA Winchester, VA භ Star denotes Oakland, Maryland Headquarters 4

5 West Region Central Region East Region Loans (000s) $294,236 $383,701 $503,138 Deposits (000s) $125,148 $814,295 $490,652 Deposit Market Share (1) (at June 30, 2022) 2% 42% 4% Branches 5 10 11 Note: Out of market loans represent $106 million and are not reflected in this table (1) Source: FDIC Market Share Data, most current. Deposit market share for each region includes the following counties: West : Harrison, WV; Monongalia, WV Central: Garrett, MD; Allegany, MD; Mineral, WV East: Washington, MD; Frederick, MD; Berkeley, WV Core Markets

6 Core Strengths ▪ Diversified revenue stream driven by trust and brokerage fee income provides protection during times of low interest rates Diversified Revenue Stream ▪ Stable legacy markets produce steady low - cost funding ▪ Technology and business relationships drive growth Core Deposit Franchise ▪ Diverse and experienced Board with the skills to oversee risks, strategic initiatives and governance best practices ▪ Ongoing Board succession strategy Engaged & Diverse Leadership ▪ Supporting local causes with financial education, consultation and robust products and services ▪ Knowledgeable associates committed to helping clients & the communities we serve Culture of Engagement ▪ Well - established operational infrastructure will support future growth ▪ Expense management focus, hybrid work environment and technology drive cost savings Expense Structure ▪ Strong underwriting guidelines and risk management framework ▪ Focus on risk mitigation, loan concentration management and information security Robust Enterprise Risk Management ▪ Innovative and dynamic approach to attracting and retaining clients ▪ Investment in FinTech funds provides early exposure to new technology Forward - Thinking Approach ▪ Regulatory capital ratios significantly above regulatory requirements ▪ Significant access to liquidity sources Financial Strength

7 Risk Management, Monitoring & Mitigation Underlies all Strategic Priorities ▪ Low net charge - offs and strong asset quality as a result of conservative and proactive credit culture ▪ ACL level of 1.31%; future provisioning based on loan growth, economic environment and asset quality changes ▪ Diversified commercial loan portfolio and geographic footprint ▪ Disciplined loan growth strategy, concentration management, stress testing and exception tracking and monitoring ▪ Well - defined loan approval levels ▪ Centralized risk rating and monitoring of risk rating migration and delinquency trends ▪ Robust annual third - party loan review ▪ Maintaining a slightly asset sensitive balance sheet, poised to take advantage of further increases in interest rates ▪ Limiting longer - term investment exposure and actively managing loan terms ▪ Focused on capturing core, low - cost deposits ▪ Monitoring dynamic and static rate ramp scenarios ▪ Board regularly briefed on cyber - security matters ▪ Robust information security training programs for associates and Board ▪ Regular third - party review and testing of information security, compliance processes and cybersecurity controls ▪ No security breaches to - date ▪ Adaptive fraud detection and management ▪ Strong capital levels well above regulatory “well - capitalized” definition ▪ Conservative dividend payout policy to improve TCE and maintain capital during this turbulent economic environment ▪ Capital stress tests indicate Bank is well positioned to absorb potential losses ▪ Loan to deposit ratio of 81% ▪ Liquidity contingency plan in place and implemented in March 2023 given current market stress ▪ Liquidity stress testing performed quarterly with strong liquidity under various scenarios ▪ Available borrowing capacity of $231.6 million through correspondent lines of credit and FHLB ▪ Strong, stable low - cost core deposit franchise of 90% of total deposit portfolio Cyber - Security & Fraud Monitoring Asset Quality Capital Liquidity Management Interest Rate Sensitivity

Strategic Pillars & Key Objectives Culture & Human Capital ▪ Employ more robust recruitment methods to capitalize on talent in new and existing markets ▪ Attract and hire passionate, diverse talent to engage with clients and prospects across broader geographics ▪ Promote associate retention and career development through mentoring programs, leadership, and educational opportunities ▪ Build on succession plan by fostering innovative, longer - term strategic thinking Digital & Data Analytics ▪ Provide holistic, seamless client experience across all business lines using integrated relationship teams, customized financial solutions, and personal service ▪ Prioritize and implement line of business profitability models ▪ Monitor asset quality to protect capital during period of economic uncertainty ▪ Improve efficiency through execution of technology plan ▪ Increase education , internally and externally, on sophisticated cyber and fraud scams and methods to prevent financial loss Market Awareness, Expansion & Opportunities ▪ Deepen customer engagement to expand our market penetration and increase customer profitability ▪ Seek opportunistic acquisitions in banking and wealth management ▪ Optimize retail network and utilization of real estate ▪ Expand investor relations and attract new investors to diversify shareholder mix Effective use of technology, marketing and communications, and an environmental focus underlies all strategic priorities. 8

Financial Highlights $4.4 Million Net Income (1) $0.65 Diluted EPS (1) 0.94% * ROAA (1) 12.95 * ROATCE (1) 3.53% NIM ▪ Total assets increased $89.3 million compared to December 31, 2022 ▪ Consolidated net income (1) of $4.4 million in 1Q23 compared to $5.7 million in 1Q22 and $7.0 million in linked quarter; pre - provision net revenue of $6.3 million compared to $7.2 million, respectively ▪ Net interest income, on a non - GAAP, FTE basis* increased by 8.6% in 1Q23 compared to 1Q22, driven by a 25.5% increase in interest income; offset by an increase in interest expense driven by the competitive deposit landscape and the recent market disruption ▪ The ratio of the allowance for credit losses (“ACL”) to loans outstanding was 1.31% in 1Q23 compared to 1.14% in linked quarter ▪ Efficiency ratio of 66.03% (1) ; year to date, the efficiency ratio has been impacted by increased health insurance costs, pension costs and increased interest expense; expense savings and efficiencies continue to be primary focus; Bank is poised for upside earnings in a rising interest rate environment (1) See Appendix for a reconciliation of these non - GAAP financial measure * 1Q2023 Annualized 9

10 Long - Term Growth Pre - Provision Net Revenue ($ in millions) (1) $17.8 $23.2 $30.8 $32.5 $6.3 2019 2020 2021 2022 1Q2023 +5.5% YoY (1) See Appendix for a reconciliation of these non - GAAP financial measures $1.85 $1.97 $3.54 $3.76 $0.65 2019 2020 2021 2022 1Q2023 +6.2% YoY Diluted Earnings per Share (1) Total Deposits ($ in millions) $1,142 $1,422 $1,469 $1,571 $1,591 2019 2020 2021 2022 1Q2023 +6.9% YoY Total Gross Loans, including PPP ($ in millions) $1,039 $1,168 $1,154 $1,279 $1,289 2019 2020 2021 2022 1Q2023 +10.8% YoY $114 PPP $8 PPP

11 Solid Profitability (1) See Appendix for a reconciliation of these non - GAAP financial measures 11.44% 11.92% 19.78% 19.94% 12.95% 2019 2020 2021 2022 1Q2023 Strategic Target 13% - 15% 0.93% 0.86% 1.35% 1.39% 0.94% 2019 2020 2021 2022 1Q2023 Strategic Target 1.35% - 1.65% Core ROAA (non - GAAP (1) ) Core ROATCE (non - GAAP (1) )

12 Total 1 - 4 Family 35% CRE - NOO 21% C&I 19% CRE - OO 11% C&D 6% Consumer 5% Multi - family 3% Loan Diversification Commercial Loan Mix (3/31/2023) Loan Portfolio Mix (3/31/2023) RE/Rental/Leasing NOO 24% RE/Rental/ Leasing OO, C&I 20% All Other 11% Accommodations 11% Services 8% RE/Rental/Leasing Multifamily 6% Trade 6% Construction - Developers 1% Health Care / Social Assistance 5% RE/Rental/Leasing - Developers 4% Construction - All Other 4%

13 Commercial Real Estate Focus on risk mitigation and managing of concentrations ▪ CRE / Total Capital: 227% ▪ ADC / Total Capital: 39% OFFICE Geography Note Book Balance Number of loans Avg Loan Balance Note Book Balance Number of loans Avg Loan Balance Note Book Balance Number of loans Avg Loan Balance Central 6,766,974$ 26 260,268$ 8,375,197$ 10 837,520$ 15,142,171$ 36 420,616$ East 10,779,367$ 17 634,080$ 10,465,577$ 7 1,495,082$ 21,244,943$ 24 885,206$ OOM 95,451$ 1 95,451$ 779,423$ 1 779,423$ 874,875$ 2 437,437$ West 11,550,362$ 16 721,898$ 42,701,161$ 15 2,846,744$ 54,251,522$ 31 1,750,049$ Grand Total 29,192,153$ 60 486,536$ 62,321,357$ 33 1,888,526$ 91,513,511$ 93 984,016$ % of Gross Loans 2.26% 4.83% 7.10% % of CRE 6.44% 13.75% 20.19% RETAIL Geography Note Book Balance Number of loans Avg Loan Balance Note Book Balance Number of loans Avg Loan Balance Note Book Balance Number of loans Avg Loan Balance Central 3,013,856$ 18 167,436$ 705,222$ 7 100,746$ 3,719,078$ 25 148,763$ East 5,938,851$ 11 539,896$ 41,782,047$ 8 5,222,756$ 47,720,898$ 19 2,511,626$ OOM 2,927,946$ 2 1,463,973$ 15,328,834$ 3 5,109,611$ 18,256,780$ 5 3,651,356$ West 2,546,619$ 5 509,324$ 13,487,001$ 9 1,498,556$ 16,033,619$ 14 1,145,259$ Grand Total 14,427,272$ 36 400,758$ 71,303,104$ 27 2,640,856$ 85,730,375$ 63 1,360,800$ % of Gross Loans 1.12% 5.53% 6.65% % of CRE 3.18% 15.73% 18.91% CRE - Owner Occupied CRE - Non-Owner Occupied Total CRE - Owner Occupied CRE - Non-Owner Occupied Total

14 Credit Quality ALL / ACL Trends (Net Charge - Offs)/Average Loans - 0.02% 0.13% - 0.02% - 0.02% - 0.08% 2019 2020 2021 2022 1Q2023 Nonaccrual Loans / Total Loans 1.40% 0.35% 0.21% 0.27% 0.25% 2019 2020 2021 2022 1Q 2023 NPAs / Total Assets 1.30% 0.99% 0.60% 0.46% 0.41% 2019 2020 2021 2022 1Q 2023 1.19% 1.41% 1.38% 1.14% 1.31% 2019 2020 2021 2022 1Q2023

15 Investment Portfolio Sector Par (000s) Portfolio % Book Yield Duration Treasury/Agency 119,888 32% 1.79% 5.51 Fixed MBS 70,140 19% 1.95% 5.47 CMO 84,965 23% 1.82% 6.56 Municipal 33,791 9% 4.94% 8.55 Corporate 1,000 0.3% 5.33% 3.46 Other 59,617 16% 1.99% 4.78 TOTAL 369,400 100.0 2.16% 5.94 Ratings: 100% of municipal holdings are rated A or better* * Excluding $20 million locally held TIF Bonds which are not rated $369.4 Million Year 2023 2024 2025 2026 2027 Thereafter Annual Cashflow ($000’s) $23,180 $68,461 $24,824 $29,025 $36,911 $148,320 Base Case Portfolio Total Cashflow Treasury/ Agency CMO Fixed MBS Other Municipal Corporate

16 Shocked Investment Portfolio Unrealized Gains / Losses Capital Impact Intent Dn200 Dn100 BaseCase Up100 Up200 Up300 Up400 AFS - 8,640 - 14,119 - 19,711 - 25,240 - 30,793 - 36,014 - 40,572 HTM 370 - 13,421 - 28,542 - 39,646 - 51,589 - 62,595 - 72,082 Total - 8,270 - 27,540 - 48,253 - 64,885 - 82,383 - 98,609 - 112,654 Corp As Reported Corp Pro - Forma AFS + HTM Sale Corp Difference Bank As Reported Bank Pro - Forma AFS + HTM Sale Bank Difference Federal Reserve Minimum RBC Thresholds Regulatory Well - Capitalized Thresholds Corp Excess Above Well - Capitalized (After Proforma Sale) Tier 1 Capital 211,675 164,564 (47,111) 182,388 139,560 (42,828) Total Risk Based Capital (RBC) 229,442 181,677 (47,765) 199,770 156,364 (43,406 CET 1 Ratio 12.82% 10.18% (2.64%) 13.12% 10.39% (2.73%) 4.50% 6.50% 3.68% Tier 1 Ratio 14.90% 12.03% (2.87%) 13.12% 10.39% (2.73%) 6.00% 8.00% 4.03% Total RBC Ratio 16.15% 13.28% (2.87%) 14.37% 11.64% (2.73%) 8.00% 10.00% 3.28% Leverage Ratio 11.47% 8.93% (2.54%) 10.00% 7.65% (2.35%) 4.00% 5.00% 3.93% Locally held TIF bonds of $23 million and Trust Preferred securities of $19 million have been excluded from the sale impact

17 Deposits 26% 30% 34% 32% 30% 14% 14% 16% 23% 21% 38% 40% 39% 36% 39% 21% 16% 11% 8% 7% 1% 0% 0% 0% 4% 2019 2020 2021 2022 1Q 2023 NIB Demand IB Demand MMA & Savings CDs - Retail CDs - Brokered $1.57 $1.14 $1.59 $1.42 $1.57 Deposit Composition ($ in billions as of 3/31/2023) 92% 82% 79% 81% 81% Loan to Deposit Ratio 2019 2020 2021 2022 2023 Deposit outflows experienced in latter half of 2022 and in January 2023 due to competitive pricing landscape and inflationary spending. No changed deposit levels directly related to recent market disruption. Deposit Type Balance % Insured/Collateralized Deposits $1,125,896,228 71% Uninsured Deposits $465,388,667 29% Deposit Type Balance (MMs) % Retail Deposits $820,062,508 51% Business Deposits $771,222,387 49%

18 Funding $40 $40 $31 $30 18 Months 12 Months 9 Months 6 Months Dollars (in millions) Brokered CD Brokered CD FHLB Advance FHLB Advance 45% 48% 7% Commercial Deposits Retail Deposits Borrowings Funding Mix Brokered/Wholesale Maturities As part of our liquidity contingency funding plan, management conservatively raised on - balance sheet cash levels through wholesale funding due to the market disruption.

19 Net Interest Margin (1) See Appendix for a reconciliation of these non - GAAP financial measures 4.57% 3.99% 3.63% 3.85% 4.33% 1.18% 0.91% 0.51% 0.44% 1.15% 3.68% 3.34% 3.28% 3.56% 3.53% 0.70% 0.49% 0.24% 0.21% 0.67% -0.5% 0.5% 1.5% 2.5% 3.5% 4.5% 2019 2020 2021 2022 2023 Yield on Earning Assets Cost of Interest-bearing Liabilities Net Interest Margin Cost of Deposits

20 Diversified Fee Income (1) See Appendix for a reconciliation of these non - GAAP financial measures Composition Trust and Brokerage 52% Service Charges 16% Net Gain on Loan Sales 0% Debit Card Income 22% Bank - owned Life Insurance 7% Other Noninterest Income 3% Non - Interest Income Mix 1Q 2023 $1,212 $1,377 $1,482 $1,359 $1,435 2019 2020 2021 2022 1Q2023 Trust & Brokerage Assets Under Management (MMs) ▪ First United’s non - interest income (1) comprised 23% of operating revenue for 1Q2023 ▪ Fee - based business provides stable growth and a diversified revenue stream not directly tied to interest rates, as well as opportunities to build client relationships ▪ First United’s diverse array of products provides opportunities to fully engage with customers and produce stable increases to earnings
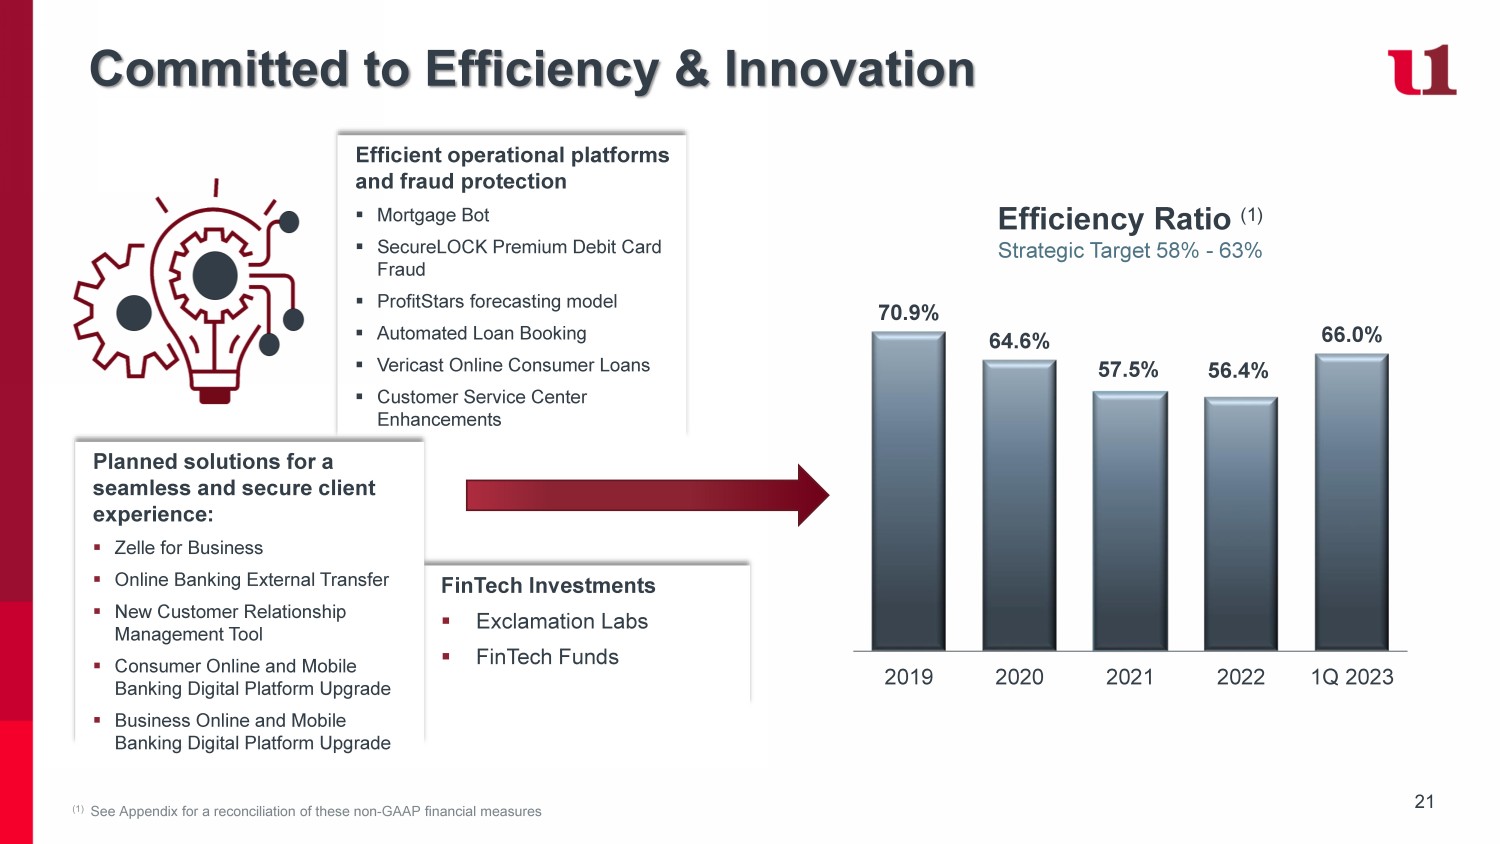
21 Committed to Efficiency & Innovation 70.9% 64.6% 57.5% 56.4% 66.0% 2019 2020 2021 2022 1Q 2023 (1) See Appendix for a reconciliation of these non - GAAP financial measures Efficient operational platforms and fraud protection ▪ Mortgage Bot ▪ SecureLOCK Premium Debit Card Fraud ▪ ProfitStars forecasting model ▪ Automated Loan Booking ▪ Vericast Online Consumer Loans ▪ Customer Service Center Enhancements Efficiency Ratio (1) Strategic Target 58% - 63% FinTech Investments ▪ Exclamation Labs ▪ FinTech Funds Planned solutions for a seamless and secure client experience: ▪ Zelle for Business ▪ Online Banking External Transfer ▪ New Customer Relationship Management Tool ▪ Consumer Online and Mobile Banking Digital Platform Upgrade ▪ Business Online and Mobile Banking Digital Platform Upgrade
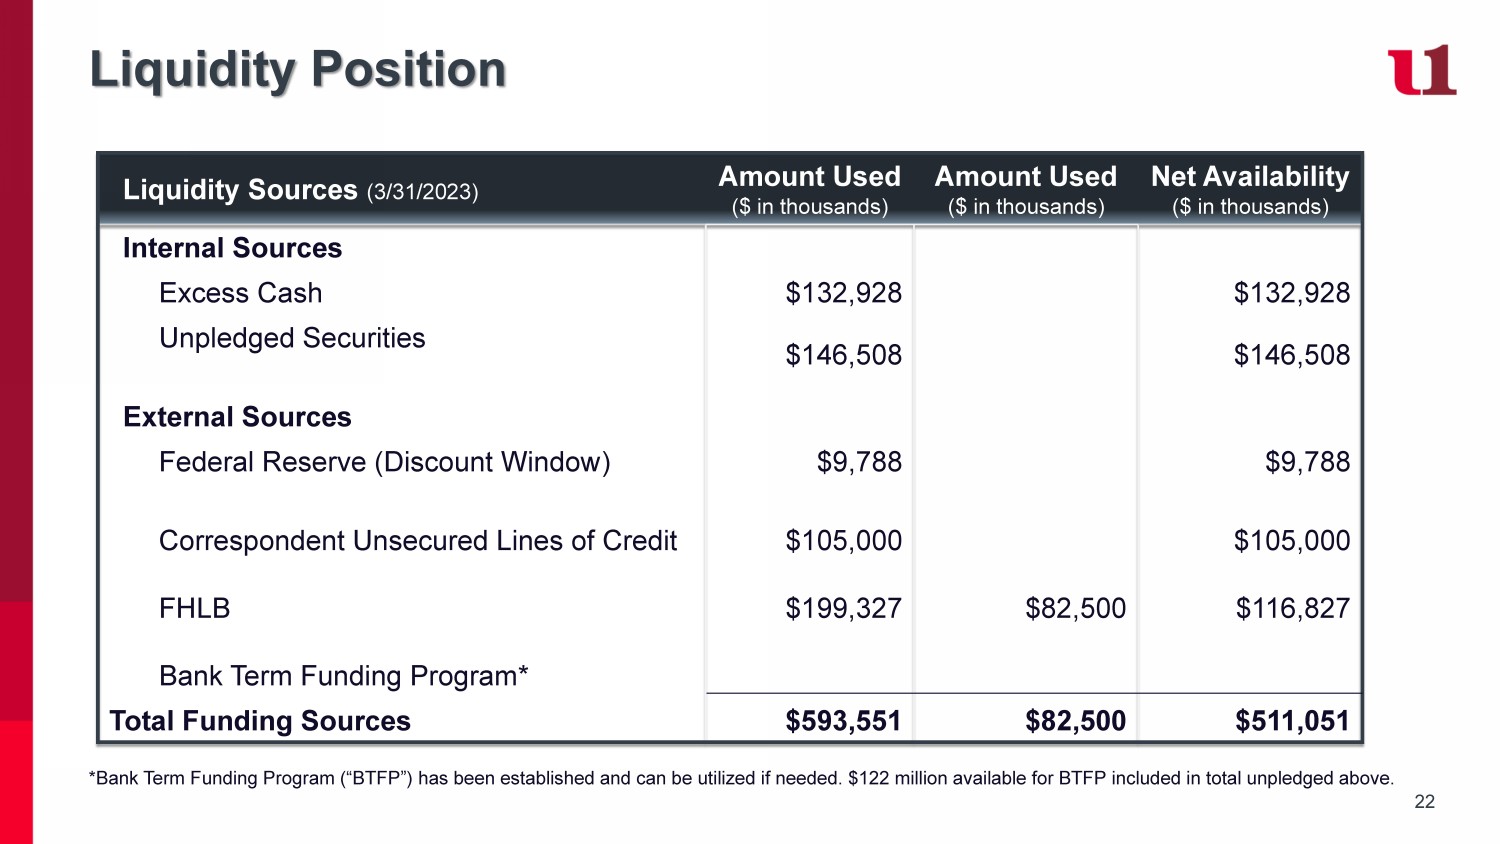
22 Liquidity Position Liquidity Sources (3/31/2023) Amount Used ($ in thousands) Amount Used ($ in thousands) Net Availability ($ in thousands) Internal Sources Excess Cash $132,928 $132,928 Unpledged Securities $146,508 $146,508 External Sources Federal Reserve (Discount Window) $9,788 $9,788 Correspondent Unsecured Lines of Credit FHLB Bank Term Funding Program* $105,000 $199,327 $82,500 $105,000 $116,827 Total Funding Sources $593,551 $82,500 $511,051 *Bank Term Funding Program (“BTFP”) has been established and can be utilized if needed. $122 million available for BTFP inclu ded in total unpledged above.

23 Interest Rate Risk (1) Standard Model Assumptions Interest Rate Risk Sensitivity ▪ The Bank’s interest rate risk position is stress tested under three interest rate ramp scenarios to determine the impact on net interest income, net income and capital under dynamic and static balance sheet conditions. ▪ The Bank’s net interest income position moved toward a more asset sensitive position due to the additional cash liquidity. ▪ If cash were reduced significantly, the Bank is relatively neutral to rising rate scenarios. ▪ The Bank’s largest risk from an interest rate risk perspective is falling rate scenarios. ▪ Assumptions regarding offering rates, loan and investment prepayment speeds, beta and decay rates are reviewed and adjusted on a quarterly basis. Management Outlook & Strategy ▪ Disciplined loan pricing ▪ Manage deposit pricing on an exception - basis ▪ Deposit acquisition through short - term CD promotions and adjustable - rate money market products for businesses and consumers ▪ Initiated $141 million of brokered CDs and FHLB advances as part of an 18 - month laddered contingency funding plan - 300 - 200 - 100 Flat +100 +200 +300 +400 Net Interest Income (3/31/23) (15.0%) (8.5%) (3.7%) 3.3% 6.5% 9.8% 14.7% Net Interest Income (12/31/22) (11.5%) (4.9%) (1.2%) 0.2% 0.3% 0.3% 1.7% EVE (12/31/22) (0.6%) 4.8% 3.9% (3.9%) (8.7%) (12.4%) (15.8%) 12 Month Sensitivity Shock (1) Standard Model Assumptions

24 Capital Management 16.29% 16.08% 15.89% 16.12% 16.15% 2019 2020 2021 2022 1Q 2023 11.77% 10.36% 10.80% 11.46% 11.47% 2019 2020 2021 2022 1Q 2023 12.79% 12.61% 12.50% 12.96% 12.82% 2019 2020 2021 2022 1Q 2023 15.17% 14.83% 14.64% 15.06% 14.90% 2019 2020 2021 2022 1Q 2023 CET1 Ratio Leverage Ratio Tier 1 Ratio Total Risk - Based Capital Ratio Regulatory Well - Capitalized 10% 5% 8% 6.5%

25 Capital Management $16.17 $17.17 $19.61 $20.90 $21.01 2019 2020 2021 2022 1Q 2023 8.03% 6.97% 7.56% 7.59% 7.30% 2019 2020 2021 2022 1Q 2023 Tangible Book Value / Share TCE Ratio

26 Strategic Targets Metric Actual 12/31/2021 Non - GAAP 12/31/2021 Actual 12/31/2022 Long Term Strategic Target Range (*) Strong Shareholder Return EPS Growth (YoY) 49% 79% (1) 27% 8% - 12% Dividend Payout Ratio 19.7% 16.3% 15.9% 20% - 25% ROAA 1.12% 1.35% (1) 1.39% 1.35% - 1.60% ROATCE 16.27% 19.61% (1) 19.94% 13% - 15% TCE Ratio 7.56% 7.56% 7.59% 8% - 10% High Quality, Diversified Revenue Stream Revenue Growth (YoY) 42.8% 72.2% (1) 3.3% 6% - 12% Non - Int Inc / Revenue 28.3% 26.9% (1) 23.7% 21% - 23% N IM 3.28% 3.28% 3.56% 3.5% - 3.8% Balance Sheet Growth % Loan Growth - 1.2% incl PPP - 1.2% incl PPP 10.9% 7% - 10% Loans / Assets 67% 67% 69% 71% - 76% Loans / Deposits 79% 79% 81% 85% - 90% Highly Efficient Operations Efficiency Ratio (adjusted for non - core items) 64.7% 56.4% (1) 56.4% 52% - 57% Robust Risk Enterprise Management NPLs / Loans 0.21% 0.21% .30% 0.50% - 1.00% (NCOs) Recoveries / Avg. Total Loans - 0.02% - 0.02% - .06% 0.10% - 0.50% (*) Targets reviewed on an annual basis (1) See Appendix for a reconciliation of these non - GAAP financial measures

Strong Investor Relations & Shareholder Engagement Members of the Board and senior management routinely engage with shareholders and other stakeholders, and management regularly updates the Board in the context of ongoing investor discussions. These engagements help the Board and management gather feedback on a variety of topics, including strategic and financial performance, ESG disclosure, executive compensation, Board composition, and leadership structure. Clear long - term strategic plan with performance targets x Dedicated Investor Relations contact x Investor conferences and prospective investor engagement x Investor presentations and periodic outreach to institutional and retail shareholders x 27 How to contact your Board: Shareholders and interested parties wishing to contact our Board may send a letter to First United Co rporation Board of Directors, c/o Tonya K. Sturm, Secretary, First United Corporation, 19 South Second Street, Oakland, Maryland, 21550 - 00 09 or by e - mail at tsturm@mybank.com. The Secretary will deliver all shareholder communications directly to the Board for consideratio n.

28 I. II. III. IV. Management Team Board of Directors ESG Journey & Statistics Non - GAAP Reconciliation Pg. 29 Pg. 30 Pg. 33 Pg. 35 Appendices

29 Our Dedicated Management Team Carissa L. Rodeheaver Chairman of the Board, President & CEO 30+ year career with First United with in - depth industry, wealth management, financial and operational experience Jason B. Rush SVP & Chief Operating Officer 29 years with in - depth industry, retail, risk and compliance and operations experience Tonya K. Sturm SVP & Chief Financial Officer, Corp. Secretary & Treasurer 35+ years of banking, audit, credit, retail, risk and compliance and financial experience R.L. Fisher SVP & Chief Revenue Officer 25+years with in - depth industry, retail, commercial and mortgage banking experience Keith R. Sanders SVP & Chief Wealth Officer 30+ years specializing in wealth management, estate planning, trust administration and financial planning Our leadership team reflects the diversity of thought from the communities we serve, executes on our strategy and drives shareholder returns.

30 30 John F. Barr Independent Director Owner, Ellsworth Electric, Inc. Brian Boal Independent Director , Audit Chair Boal & Associates, PC Sanu Chadha Independent Director Managing Partner, M&S Consulting Christy DiPietro Independent Director Chartered Financial Analyst, Hidden Cove Advisory Patricia Milon Independent Director Principal, Milford Advisory Group, LLC I. Robert Rudy Independent Director President, I.R. Rudy’s, Inc. Marisa Shockley Independent Director , Compensation Chair Owner, Shockley, Inc. H. Andrew Walls, III Independent Director President, MPB Print & Sign Superstore Member, MEGBA, LLC Beth E. Moran Independent Director, The Law Offices of Beth E. Moran John W. McCullough Lead Director, Nomination & Governance Chair Retired, Partner of Ernst & Young, LLP Carissa L. Rodeheaver Chairman of the Board, President & CEO First United Corporation and First United Bank & Trust Board of Directors

31 Board of Directors Thoughtful Evaluation and Evolution Our Board is comprised of a diverse group of directors who bring a variety of perspectives, experience, and characteristics to First United. Director Diversity 50% 90% of our directors are gender and/or racially diverse of our directors are independent 0 - 5 5 - 10 10+ TENURE >60 50 - 60 <50 AGE Our Nominating and Governance Committee is responsible for determining directorship criteria, identifying and evaluating candidates for the Board, and regularly assessing the Board’s governance practices. x Annual Committee and Self - Evaluations x Balanced Tenure, with four directors added in the past four years x Retirement policy, at the age of 72 x Routine shareholder & stakeholder engagement x Policy to interview a diverse slate of candidates x 100% Independent Board Committees x Majority Voting Standard for Director Elections

32 Board of Directors The First United board of directors brings a diverse range of skills, experiences, and backgrounds to the work of overseeing ris k and strategy. With experience in fields such as banking, government, accounting, investing, project management, technology, and a ra nge of local entrepreneurial businesses, they apply these diverse backgrounds to their work on behalf of our shareholders. Director Skills Matrix Barr Boal 1 Chadha DiPietro 1 Milon Moran Rodeheaver Rudy Shockley 1 Walls Executive Leadership x x x x x x x Public Company Board Experience x x x Information Technology x x Financial Services/ Banking x x x x x Asset Management x x x Brokerage/ Investment Banking x x x Strategic Planning x x x x x x x x x x Accounting/Finance x x x x Regulatory x x x Risk Management x x x x x x x x Legal Expertise x Governance x x x x x x Board Tenure and Age Tenure 9 9 2 2 3 0 10 30 9 17 Age 69 50 46 62 60 61 57 70 58 62 1 Qualifies as a Financial Expert for proxy purposes.

33 Continuous Progress We continue to advance our ESG profile over time, recognizing the importance of our key stakeholders – including our customers and our communities – to our business. Over the past few years, we have implemented several important enhancements to align our ESG profile with our long - term investors’ expectations for best - in - class corporate governance. x Enhanced structure to more strongly align pay and performance Compensation x Enhanced Board oversight of Environment & Social issues x Enhanced Disclosure on Environment & Social issues x Continued progress on FUNC ESG strategy ESG Governance x Revised stock ownership guidelines for Directors and Executives x Declassified the Board of Directors (phased - in by 2024) x Adopted Proxy Access x Shareholder access to change By - laws x Management majority vote proposal received strong shareholder support (albeit short of super - majority threshold needed) x Ongoing Board refreshment x Adopted right to call a special meeting. x Adopted mandatory director retirement policy x Adopted plurality voting standard for contested director elections x Enhanced shareholder engagement program x Modernized NGC Charter x Adopted a diversity policy for director refreshment x Formalized LID role & responsibilities

34 ESG at First United ▪ LED lighting installed throughout branch network and operations center ▪ Recycling, focus on reduced printing (65% reduction since pre - COVID) ▪ Leveraging virtual meeting opportunities to reduce travel footprint ▪ 46% of deposit customers and 11% of loan customers enrolled in electronic statements ▪ 15 tons of paper securely shredded and recycled, 1,800 pounds of electronics and computers and 500 pounds of toner cartridges recycled Environmental ▪ Created Diversity Engagement team, led by our newly appointed Director of Diversity and Engagement ▪ Developed a formal workforce Diversity and Inclusion Policy ▪ Formalized a policy requiring a diverse slate of candidates for each future open board seat ▪ First United Community Dreams Foundation supporting financial literacy, education, affordable housing and neighborhoods ▪ Formed a Veteran Employee Resource Group and hold an annual Veterans Day Celebration ▪ Formalized a paid time off policy for community volunteerism Social ▪ Adopting best - in - class governance practices and shareholder rights ▪ Recent Enhancements – Board refreshment, Board declassification, Proxy access and Shareholder access to change By - laws ▪ Future Enhancements under consideration - Majority Voting Standard Governance

35 This presentation includes certain non - GAAP financial measures, including pre - provision net revenue, net income, earnings per share (basic and diluted), return on average assets, return on average tangible common equity, tangible common equity, tangible assets, the ratio of tangible common equity to tangible assets, tangible book value per share, net interest margin, and efficiency ratio . These non - GAAP financial measures and any other non - GAAP financial measures that are discussed in this presentation should not be considered in isolation, and should be considered as additions to, and not substitutes for or superior to, measures of financial performance prepared in accordance with GAAP . There are a number of limitations related to the use of these non - GAAP financial measures versus their nearest GAAP equivalents . For example, other companies may calculate non - GAAP financial measures differently or may use other measures to evaluate their performance, all of which could reduce the usefulness of the Company’s non - GAAP financial measures as tools for comparison . The following is a reconciliation of the non - GAAP financial measures used in (or conveyed orally during) this presentation to their most directly comparable GAAP financial measures . Non - GAAP Reconciliation ($000s, except where otherwise noted) YTD 2019 2020 2021 2022 Q1 2022 Q2 2022 Q3 2022 Q4 2022 Q1 2023 3/31/2023 Pre-Provision Net Revenue ("PPNR") Pre-tax income, as reported 16,465$ 17,788$ 26,309$ 33,181$ 7,616$ 7,136$ 9,613$ 8,816$ 5,730$ 5,730$ Add back: Provision expense 1,320 5,401 (817) (643) (419) 624 (108) (740) 543 543 Add back: FHLB penalty, gross - - 2,368 - - - - - - Add back: Contribution 1,000 - - - - - - Add back: Insurance reimbursement (1,375) - - - - - - Add back: Settlement expense, gross - - 3,300 - - - - - - Pre-Provision Net Revenue, as adjusted 17,785$ 23,189$ 30,785$ 32,538$ 7,197$ 7,760$ 9,505$ 8,076$ 6,273$ 6,273$ Net Income Net income, as reported 13,129$ 13,841$ 19,770$ 25,048$ 5,715$ 5,428$ 6,936$ 6,969$ 4,375$ 4,375$ Less: Preferred stock dividends - - - - - - - Net income, available to common shareholders,as reported (a) 13,129$ 13,841$ 19,770$ 25,048$ 5,715$ 5,428$ 6,936$ 6,969$ 4,375$ 4,375$ Add Back: Impact of Tax Reform Act Add back: FHLB penalty, net of tax - - 1,790 - - - - - - Add back: Contribution, net of tax 770 - - - - - - Add back: Insurance reimbursement, net of tax (1,059) - - - - - - Add back: Settlement expense, net of tax - - 2,565 - - - - - - Net income, as adjusted (b) 13,129$ 13,841$ 23,836$ 25,048$ 5,715$ 5,428$ 6,936$ 6,969$ 4,375$ 4,375$

36 Non - GAAP Reconciliation , continued ($000s, except where otherwise noted) YTD 2019 2020 2021 2022 Q1 2022 Q2 2022 Q3 2022 Q4 2022 Q1 2023 3/31/2023 Weighted Average Common shares - basic (actual) (d) 7,110,022 7,003,955 6,710,463 6,649,740 6,627,564 6,650,256 6,658,392 6,662,751 6,675,181 6,675,181 Weighted Average Common shares - diluted (actual) (e) 7,110,022 7,013,164 6,716,587 6,661,055 6,636,156 6,661,061 6,668,787 6,678,218 6,697,102 6,697,102 Earnings Per Share - Basic Earnings Per Share - Basic, as reported (a)/(d) 1.85$ 1.98$ 2.95$ 3.77$ 0.86$ 0.82$ 1.04$ 1.05$ 0.66$ 0.66$ Add Back: Impact of Tax Reform Act Add back: FHLB penalty, net of tax - - 0.27 - - - - - - - Add back: Contribution, net of tax 0.12 - - - - - - - Add back: Insurance reimbursement, net of tax (0.16) - - - - - - - Add back: Settlement expense, net of tax - - 0.37 - - - - - - - Earnings Per Share - Basic, as adjusted (b)/(d) 1.85$ 1.98$ 3.54$ 3.77$ 0.86$ 0.82$ 1.04$ 1.05$ 0.66$ 0.66$ Earnings Per Share - Diluted Earnings Per Share - Diluted, as reported (a)/(e) 1.85$ 1.97$ 2.95$ 3.76$ 0.86$ 0.82$ 1.04$ 1.04$ 0.65$ 0.65$ Add Back: Impact of Tax Reform Act Add back: FHLB penalty, net of tax - - 0.27 - - - - - - - Add back: Contribution, net of tax 0.12 - - - - - - - Add back: Insurance reimbursement, net of tax (0.16) - - - - - - - Add back: Settlement expense, net of tax - - 0.37 - - - - - - - Earnings Per Share - Diluted, as adjusted (b)/(e) 1.85$ 1.97$ 3.54$ 3.76$ 0.86$ 0.82$ 1.04$ 1.04$ 0.65$ 0.65$

37 Non - GAAP Reconciliation , continued ($000s, except where otherwise noted) YTD 2019 2020 2021 2022 Q1 2022 Q2 2022 Q3 2022 Q4 2022 Q1 2023 3/31/2023 Return on Average Assets (quarter and YTD annualized) Average Assets ( c) 1,418,928$ 1,613,669$ 1,765,148$ 1,801,711$ 1,769,234$ 1,770,601$ 1,819,732$ 1,845,275$ 1,892,111$ 1,892,111$ Return on Average Assets, as reported (a)/(c) 0.93% 0.86% 1.12% 1.39% 1.31% 1.23% 1.51% 1.50% 0.94% 0.94% Add Back: Impact of Tax Reform Act Add back: FHLB penalty, net of tax - - 0.10% 0.00% - - - - - - Add back: Contribution, net of tax 0.04% 0.00% - - - - - - Add back: Insurance reimbursement, net of tax -0.06% 0.00% - - - - - - Add back: Settlement expense, net of tax - - 0.15% 0.00% - - - - - - Return on Average Assets, as adjusted (b)/(c) 0.93% 0.86% 1.35% 1.39% 1.31% 1.23% 1.51% 1.50% 0.94% 0.94% Return on Average Common Stockholders' Equity Return on Average Tangible Common Stockholders' Equity Average common stockholders' equity (f) 125,774$ 127,101$ 132,550$ 137,685$ 140,517$ 136,039$ 135,186$ 140,224$ 149,416$ 149,416$ Average common stockholders' equity, as adjusted 125,774 127,101 132,550 137,685 140,517 136,039 135,186 140,224 149,416 149,416 Less: Average goodwill and intangibles 11,004 11,004 11,004 12,043 12,034 11,965 11,913 12,225 12,405 12,405 Average tangible common equity (g) 114,770$ 116,097$ 121,546$ 125,642$ 128,483$ 124,074$ 123,273$ 127,999$ 137,011$ 137,011$ Return on average common stockholders' equity, as reported (a)/(f) 10.44% 10.89% 14.92% 18.19% 16.27% 15.96% 20.52% 19.88% 11.87% 11.87% Add back: FHLB penalty, net of tax - - 1.47% 0.00% - - - - - - Add back: Contribution 0.63% 0.00% - - - - - Add back: Insurance reimbursement -1.15% 0.00% - - - - - Add back: Settlement expense, net of tax 2.11% 0.00% - - - - - Return on average common stockholders' equity, as adjusted (b)/(f) 10.44% 10.89% 17.98% 18.19% 16.27% 15.96% 20.52% 19.88% 11.87% 11.87% Return on average tangible common equity, as reported (a)/(g) 11.44% 11.92% 16.27% 19.94% 17.79% 17.55% 22.32% 21.60% 12.95% 12.95% Add Back: Impact of Tax Reform Act 0.00% - - - - - - Add back: FHLB penalty, net of tax - - 1.47% 0.00% - - - - - - Add back: Contribution 0.63% 0.00% - - - - - - Add back: Insurance reimbursement -0.87% 0.00% - - - - - - Add back: Settlement expense, net of tax - - 2.11% 0.00% - - - - - - Return on average tangible common equity, as adj (b)/(g) 11.44% 11.92% 19.61% 19.94% 17.79% 17.55% 22.32% 21.60% 12.95% 12.95%

38 Non - GAAP Reconciliation , continued ($000s, except where otherwise noted) YTD 2019 2020 2021 2022 Q1 2022 Q2 2022 Q3 2022 Q4 2022 Q1 2023 3/31/2023 Tangible Book Value per Common Share Total common equity, as reported (h) 125,940$ 131,047$ 141,900$ 151,793$ 137,078$ 132,892$ 132,044$ 151,793$ 152,868$ 152,868$ Less: Goodwill and intangibles 11,004 11,004 12,052 12,433 12,000 11,947 11,895 12,433 12,350 12,350 Total tangible common equity (i) 114,936$ 120,043$ 129,848$ 139,360$ 125,078$ 120,945$ 120,149$ 139,360$ 140,518$ 140,518$ Common shares outstanding - basic (actual) (j) 7,110,022 6,992,911 6,620,955 6,666,428 6,637,979 6,656,395 6,659,390 6,666,428 6,688,710 6,688,710 Tangible book value per basic common share (i)/(j) 16.17$ 17.17$ 19.61$ 20.90$ 18.84$ 18.17$ 18.04$ 20.90$ 21.01$ 21.01$ Tangible common equity to tangible assets ("TCE Ratio") Total assets, as reported (k) 1,442,966 1,733,414 1,729,838 1,848,169 1,760,325 1,752,455 1,803,642 1,848,169 1,937,442 1,937,442 Less: Goodwill 11,004 11,004 12,052 12,433 12,000 11,947 11,895 12,433 12,350 12,350 Total tangible assets (l) 1,431,962$ 1,722,410$ 1,717,786$ 1,835,736$ 1,748,325$ 1,740,508$ 1,791,747$ 1,835,736$ 1,925,092$ 1,925,092$ Tangible common equity to tangible assets (k)/(l) 8.03% 6.97% 7.56% 7.59% 7.15% 6.95% 6.71% 7.59% 7.30% 7.30% Net interest margin (tax equivalent) Net interest income 46,391$ 48,546$ 52,542$ 57,631$ 13,341$ 13,971$ 15,139$ 15,180$ 14,516$ 14,516$ Tax equivalent adjustment 868 917 939 940 241 236 232 231 227 227 Tax equivalent net interest income (m) 47,259$ 49,463$ 53,481$ 58,571$ 13,582$ 14,207$ 15,371$ 15,411$ 14,743$ 14,743$ Average earning assets (n) 1,285,019$ 1,480,165$ 1,629,299$ 1,647,151$ 1,619,585$ 1,619,037$ 1,665,355$ 1,683,139$ 1,692,998$ 1,692,998$ Net interest margin (tax equivalent) (m)/(n) 3.68% 3.34% 3.28% 3.56% 3.40% 3.52% 3.66% 3.63% 3.53% 3.53% Efficiency Ratio Noninterest expense, as reported 45,389$ 43,934$ 47,764$ 43,145$ 10,578$ 10,637$ 10,336$ 11,594$ 12,638$ 12,638$ Less: FHLB penalty, gross (2,368) - - - - - - - Less: Contribution (1,000) - - - - - - - Less: Settlement expense - - (3,300) - - - - - - - Noninterest expense, adjusted (o) 45,389$ 43,934$ 41,096$ 43,145$ 10,578$ 10,637$ 10,336$ 11,594$ 12,638$ 12,638$ Net interest income 46,391$ 48,546$ 52,542$ 57,631$ 13,341$ 13,971$ 15,139$ 15,180$ 14,516$ 14,516$ Noninterest income 16,783 18,577 20,714 17,906 4,403 4,420 4,604 4,479 4,394 4,394 Less: Insurance reimbursement - - (1,375) - - - - Tax equivalent adjustment 868 917 939 940 241 236 232 231 227 227 Total tax equivalent revenue (p) 64,042$ 68,040$ 72,820$ 76,477$ 17,985$ 18,627$ 19,975$ 19,890$ 19,137$ 19,137$ Efficiency ratio, as adjusted (o)/(p) 70.87% 64.57% 56.44% 56.41% 58.81% 57.10% 51.73% 58.28% 66.03% 66.03%